UNITED STATES SECURITIES AND EXCHANGE COMMISSION
Washington, D.C. 20549
Form 10-K
(Mark One) | | | | | |
| ☒ | ANNUAL REPORT PURSUANT TO SECTION 13 OR 15(d) OF THE SECURITIES EXCHANGE ACT OF 1934 |
For the Fiscal Year Ended December 31, 2024
Or | | | | | |
| ☐ | TRANSITION REPORT PURSUANT TO SECTION 13 OR 15(d) OF THE SECURITIES EXCHANGE ACT OF 1934 |
For the Transition Period from to
Commission file number 001-32504
TreeHouse Foods, Inc.
(Exact name of the registrant as specified in its charter)
| | | | | |
| Delaware | 20-2311383 |
| (State or other jurisdiction of incorporation or organization) | (I.R.S. employer identification no.) |
| | |
| 2021 Spring Road, Suite 600 |
| Oak Brook, IL 60523 |
| (Address of principal executive offices) (Zip Code) |
Registrant’s telephone number, including area code (708) 483-1300
Securities registered pursuant to Section 12(b) of the Act: | | | | | | | | |
| Title of each class | Trading Symbol(s) | Name of each exchange on which registered |
| Common Stock, $.01 par value | THS | New York Stock Exchange |
Securities registered pursuant to section 12(g) of the Act: None
Indicate by check mark if the registrant is a well-known seasoned issuer, as defined in Rule 405 of the Securities Act. Yes ☒ No ☐
Indicate by check mark if the registrant is not required to file reports pursuant to Section 13 or Section 15(d) of the Act. Yes ☐ No ☒
Indicate by check mark whether the registrant (1) has filed all reports required to be filed by Section 13 or 15(d) of the Securities Exchange Act of 1934 during the preceding 12 months (or for such shorter period that the registrant was required to file such reports), and (2) has been subject to such filing requirements for the past 90 days. Yes ☒ No ☐
Indicate by check mark whether the registrant has submitted electronically every Interactive Data File required to be submitted pursuant to Rule 405 of Regulation S-T (§ 232.405 of this chapter) during the preceding 12 months (or for such shorter period that the registrant was required to submit such files). Yes ☒ No ☐
Indicate by check mark whether the registrant is a large accelerated filer, an accelerated filer, a non-accelerated filer, a smaller reporting company, or an emerging growth company. See the definitions of "large accelerated filer," "accelerated filer," "smaller reporting company," and "emerging growth company" in Rule 12b-2 of the Exchange Act. | | | | | | | | | | | |
| Large accelerated filer | ☒ | Accelerated filer | ☐ |
| Non-accelerated filer | ☐ | Smaller reporting company | ☐ |
| | Emerging growth company | ☐ |
If an emerging growth company, indicate by check mark if the registrant has elected not to use the extended transition period for complying with any new of revised financial accounting standards provided pursuant to Section 13(a) of the Exchange Act. ☐
Indicate by check mark whether the registrant has filed a report on and attestation to its management’s assessment of the effectiveness of its internal control over financial reporting under Section 404(b) of the Sarbanes-Oxley Act (15 U.S.C. 7262(b)) by the registered public accounting firm that prepared or issued its audit report. ☒
If securities are registered pursuant to Section 12(b) of the Act, indicate by check mark whether the financial statements of the registrant included in the filing reflect the correction of an error to previously issued financial statements. ☐
Indicate by check mark whether any of those error corrections are restatements that required a recovery analysis of incentive-based compensation received by any of the registrant’s executive officer during the relevant recovery period pursuant to §240.10D-1(b). ☐
Indicate by check mark whether the registrant is a shell company (as defined in Rule 12b-2 of the Act). Yes ☐ No ☒
The aggregate market value of the registrant’s common stock held by non-affiliates as of June 28, 2024, based on the $36.64 per share closing price on the New York Stock Exchange on such date, was approximately $1,884.6 million. Shares of common stock held by executive officers and directors of the registrant have been excluded from this calculation because such persons may be deemed to be affiliates.
The number of shares of the registrant’s common stock outstanding as of January 31, 2025 was 50.2 million.
DOCUMENTS INCORPORATED BY REFERENCE
Portions of the registrant’s definitive Proxy Statement for its 2025 Annual Meeting of Stockholders are incorporated by reference into Part III of this Form 10-K. The registrant’s definitive Proxy Statement will be filed with the Securities and Exchange Commission ("SEC") within 120 days after the end of the fiscal year to which this report relates pursuant to Regulation 14A.
TABLE OF CONTENTS | | | | | | | | |
| | Page |
| | | |
| |
| | | |
| | | |
| Item 1 | | |
| Item 1A | | |
| Item 1B | | |
| Item 1C | | |
| Item 2 | | |
| Item 3 | | |
| Item 4 | | |
| | | |
| | | |
| Item 5 | | |
| Item 6 | | |
| Item 7 | | |
| Item 7A | | |
| Item 8 | | |
| Item 9 | | |
| Item 9A | | |
| Item 9B | | |
| Item 9C | | |
| | |
| | | |
| Item 10 | | |
| Item 11 | | |
| Item 12 | | |
| Item 13 | | |
| Item 14 | | |
| | | |
| | | |
| Item 15 | | |
| Item 16 | | |
| | |
| | |
CAUTIONARY STATEMENT REGARDING FORWARD-LOOKING INFORMATION
Certain statements and information in this Form 10-K may constitute "forward-looking statements" within the meaning of the Private Securities Litigation Reform Act of 1995, Section 27A of the Securities Act of 1933, as amended (the "1933 Act") and Section 21E of the Securities Exchange Act of 1934, as amended (the "Exchange Act"). The words "believe," "estimate," "project," "expect," "anticipate," "plan," "intend," "foresee," "should," "would," "could," or other similar expressions are intended to identify forward-looking statements, which are generally not historical in nature. These forward-looking statements are based on our current expectations and beliefs concerning future developments and their potential effect on us. These forward-looking statements and other information are based on our beliefs as well as assumptions made by us using information currently available. Such statements reflect our current views with respect to future events and are subject to certain risks, uncertainties, and assumptions. Should one or more of these risks or uncertainties materialize, or should underlying assumptions prove incorrect, actual results may vary materially from those described herein as anticipated, believed, estimated, expected, or intended. We are making investors aware that such forward-looking statements, because they relate to future events, are by their very nature subject to many important factors that could cause actual results to differ materially from those contemplated. Such factors include, but are not limited to: risks related to quality issues, disruptions, or inefficiencies in our supply chain and/or operations; product recalls; loss or consolidation of key suppliers; raw material and commodity costs due to inflation; labor strikes or work stoppages; multiemployer pension plans; labor shortages and increased competition for labor; success of our growth, reinvestment, and restructuring programs; our level of indebtedness and related obligations; disruptions in the financial markets; interest rates; changes in foreign currency exchange rates; customer concentration and consolidation; competition; our ability to execute on our business strategy; our ability to continue to make acquisitions and execute on divestitures or effectively manage the growth from acquisitions; impairment of goodwill or long lived assets; changes and developments affecting our industry, including customer preferences and the prevalence of weight loss drugs; the outcome of litigation and regulatory proceedings to which we and/or our customers may be a party; changes in laws and regulations applicable to us; shareholder activism; disruptions in or failures of our information technology systems; geopolitical events; changes in weather conditions, climate changes, and natural disasters; and other risks that are described in Part I, Item 1A – Risk Factors and our other reports filed from time to time with the Securities and Exchange Commission (the "SEC").
Readers are cautioned not to place undue reliance on forward-looking statements, which speak only as of the date that such statements are made. We undertake no obligation to publicly update or revise any forward-looking statements after the date they are made, whether as a result of new information, future events or otherwise.
PART I
Item 1. Business
Overview
References herein to "we," "us," "our," "Company," and "TreeHouse" refer to TreeHouse Foods, Inc. and its consolidated subsidiaries unless the context specifically states or implies otherwise.
TreeHouse is a leading private brands snacking and beverage manufacturer in North America. Our purpose is to engage and delight - one customer at a time. Through our customer focus and category experience, we strive to deliver excellent service, build capabilities and provide insights to drive mutually profitable growth for both TreeHouse and our customers. Our purpose is supported by investments in depth, capabilities and operational efficiencies which are aimed to capitalize on the long-term growth prospects within the categories where we operate.
TreeHouse was incorporated on January 25, 2005 by Dean Foods Company to accomplish a spin-off of certain specialty businesses to its shareholders. The spin-off was completed on June 27, 2005, after which TreeHouse operated largely as a private brands aggregator, acquiring new businesses and categories in order to expand its product offerings. In 2016, TreeHouse purchased the Private Brands business from ConAgra Foods (currently known as Conagra Brands), representing the largest acquisition in its history and nearly doubling the size of the Company. The acquisition required that TreeHouse focus on becoming an integrated, more efficient and effective operating company. Following the acquisition, the Company consolidated its manufacturing, distribution and IT systems, built and launched a new commercial organization, centralized its operations, and better optimized the portfolio through a number of divestitures. More recently, the Company has refined its strategic priorities to become a more focused category leader. In 2022, TreeHouse completed the divestiture of a significant portion of its Meal Preparation business to better focus the portfolio on higher-growth, higher-margin snacking and beverage categories. Going forward, the Company will continuously review its portfolio and filter strategic growth investment opportunities based on evaluating risk adjusted returns.
TreeHouse believes it is well positioned across attractive snacking and beverage growth categories fueled by historically positive underlying consumer demand trends. Our portfolio includes snacking offerings (crackers, pretzels, in-store bakery items, frozen griddle items, cookies, and unique candy offerings), beverages & drink mix offerings (non-dairy creamer, coffee, broths/stocks, powdered beverages and other blends, and tea), as well as other grocery offerings (pickles, refrigerated dough, hot cereal, and cheese & pudding). The Company sells its products across various channels including retail grocery, co-manufacturing, and food-away-from-home customers in shelf stable, refrigerated, and frozen formats. TreeHouse also offers its customer partners a range of value and nutritional solutions, including natural, organic and gluten free offerings, providing each the capability to meet the unique needs of their consumers.
Recent Acquisitions, Divestitures, and Business Exits
On January 2, 2025, the Company completed the acquisition of certain subsidiaries that operate the private brand tea business of Harris Freeman & Co, Inc. ("Harris Tea"), a leading private brand tea manufacturer in the United States. The acquisition aligns with our long-term strategy to build capabilities in our higher-growth, higher-margin categories.
During the second quarter of 2024, the Company made the decision to exit the Ready-to-drink ("RTD") business as part of the Company's portfolio optimization strategy to focus on higher-growth, higher margin categories. Production for the RTD business ceased during the first quarter of 2025. Net sales for the RTD business for the years ended December 31, 2024, 2023, and 2022 were $32.6 million, $34.3 million, and $42.0 million, respectively.
On January 2, 2024, the Company completed the acquisition of pickle branded assets, including Bick’s pickles, Habitant pickled beets, Woodman’s horseradish, and McLarens pickled onions brands (the "Pickle Branded Assets"), from The J.M. Smucker Co., a North American producer of coffee, consumer foods, dog snacks, and cat food. The acquisition is consistent with our strategy and builds depth in our Pickles category by expanding into Canada. The purchase of the Pickle Branded Assets was accounted for as an Asset Acquisition.
On September 29, 2023, the Company completed the sale of its Snack Bars business (the "Snack Bars Transaction" or the "Snack Bars Business"). The Snack Bars Business consists of manufacturing, packaging, and selling snack bars and operated in the Lakeville, Minnesota plant. The Snack Bars Transaction represents a component of the single plan of disposal from the Company’s strategic review process, which also resulted in the divestiture of a significant portion of the Meal Preparation business during the fourth quarter of 2022. The Snack Bars Business has been classified as a discontinued operation.
On June 30, 2023, the Company completed the acquisition of the Direct Ship coffee business and its Northlake, Texas coffee facility (the "Coffee Roasting Capability") from Farmer Brothers Company, a national coffee roaster, wholesaler, equipment servicer and distributor of coffee, tea, and culinary products. The acquisition brings roasting, grinding, flavoring and blending capabilities to the Company's portfolio to complement the Company's existing single-serve pod and ready-to-drink coffee businesses. The Coffee Roasting Capability enables us to deliver greater category depth in a world-class, end-to-end private label coffee offering for our customers.
On April 1, 2023, the Company completed the acquisition of a seasoned pretzel capability. The acquisition is in line with our strategy to build category leadership, depth and capabilities to drive profitable growth. The seasoned pretzel acquisition expands our current portfolio of traditional, filled and enrobed pretzels and extends our capabilities into this growing sub-sector of the Pretzels category.
On October 3, 2022, the Company completed the sale of a significant portion of the Company’s Meal Preparation business (the "Meal Preparation Business"), including pasta, pourable and spoonable dressing, preserves, red sauces, syrup, dry blends and baking, dry dinners, pie filling, pita chips and other sauces. The Meal Preparation Business consisted of consumer packaged food manufacturers operating 14 manufacturing facilities in the United States, Canada, and Italy servicing primarily retail grocery customers. The Meal Preparation Business has been classified as a discontinued operation.
Refer to Note 3 and Note 7 to our Consolidated Financial Statements for additional information.
Our Strategy
Our strategic ambition is platform leadership in consumer trending categories, which is anchored on four strategic growth pillars:
•World Class Supply Chain. We strive to have an agile, resilient supply chain that seamlessly integrates customer demand, materials availability, manufacturing capacity and cost efficiency. We are making investments to support both our suppliers in delivering key inputs and our manufacturing capacity to not only fulfill the growing demand for private brands, but the flexibility to meet our customers' and consumers' needs as they change. Delivering the best quality, cost, and service to our customers are critical to achieving our strategic ambition.
•Platform Depth. We are making investments throughout our business to build and further develop capabilities such as innovation pipelines, additional manufacturing capacity, and/or category and consumer insights, in order to drive growth and category leadership. By supplementing our capabilities in attractive growth categories, we believe we are better positioned to drive growth, not only for TreeHouse, but also for our customers.
•Strategic Customer Partnerships. We serve as the supply chain for our customers' brands. It is of the utmost importance that we proactively engage with those customers with whom our goals are aligned - to drive both growth and profitability through a focused private brands strategy. We strive to do this by:
•maintaining an unrelenting focus on the customer at the heart of everything that we do, recognizing our customers' needs and challenges;
•understanding how we can collaborate to better grow together;
•continuing to produce products that meet quality and safety standards and are competitively priced;
•providing timely, relevant category and consumer insights; and
•executing on each of our commitments with the highest level of service.
•Talent Leader. Our people and talent are critical to achieving our strategic ambition. Our focus on being the employer of choice, by developing our talent and engaging employees, demonstrates our commitment and understanding of the importance of having a strong workforce. In addition, we seek to develop a higher performance culture by aligning our employee incentive plans to our four strategic growth pillars.
We continue to focus on advancing our sustainability initiatives and have integrated those efforts across our strategic growth pillars. We recognize the importance of measurement and accountability, and we will continue to provide transparent disclosure of our progress along our sustainability journey.
Sales, Distribution, and Customers
We sell our products through various distribution channels, including retailers, foodservice distributors, co-manufacturers, and industrial and export channels. Retailers include grocery, supermarkets, mass merchandisers, club stores, e-commerce grocers, non-traditional grocers, and other small outlets. The Company's primary sales channel is through the retail grocery channel, with approximately 80% of net sales sold through this channel. Foodservice distributors are included in our food-away-from-home sales channel, which primarily includes restaurants and other public venues. We have an internal sales force that manages customer relationships and a broker network for sales to retail, food-away-from-home, and export accounts. Industrial food products are generally sold directly to customers without the use of a broker. Co-manufacturing agreements are entered into with certain customers to add volume capacity by manufacturing and packaging our customers' product. Industrial and export channels include food manufacturers and repackagers of foodservice products. Most of our customers purchase products from us either by purchase order or pursuant to contracts that generally are terminable at will.
Products are generally shipped from our production facilities directly to customers, or from warehouse distribution centers where products are consolidated for shipment to customers if an order includes products manufactured in more than one production facility or product category. We believe this consolidation of products enables us to improve customer service by offering our customers a single order, invoice, and shipment. Some customers also pick up their orders at our production facilities or distribution centers.
A relatively limited number of customers account for a large percentage of our consolidated net sales from continuing operations. For the year ended December 31, 2024, our ten largest customers accounted for approximately 57.1% of our consolidated net sales from continuing operations. For the years ended December 31, 2024, 2023 and 2022, our largest customer, Walmart Inc. and its affiliates, accounted for approximately 23.9%, 22.4%, and 21.1%, respectively, of our consolidated net sales from continuing operations. No other customer accounted for 10% or more of the Company’s consolidated net sales from continuing operations.
Markets and Competition
The private brands food and beverage market has maintained its longer-term growth trajectory. Over the last several decades, private brands have shown a history of consistently gaining market share, with share gains more prominent during recessionary periods when consumers seek value. Key factors driving longer-term private brands growth include growing consumer adoption, improved quality, broadening of product offerings, and greater retailer emphasis and strategic focus on building shopper loyalty and experiences through private brands.
Over the last several years, consumers have faced significant inflationary pressure, which has strengthened the private brands value proposition and supported private brands unit share gains in our categories across the retail channel. However, recent macroeconomic challenges have softened the overall market and private brands consumption within the food and beverage category. We will continue to emphasize collaboration with our customers to drive the private brand value proposition for consumers and enhance end-to-end supply chain efficiency to maximize profitable growth.
We have several competitors in each of our channels. As it relates to the sales of private brands products to our customers, the principal competitive factors are product quality, reliability of service, and price. In addition, while we primarily manufacture private brands products, we do manufacture some branded products. The principal competitive factors for sales of our branded products to consumers are brand recognition and loyalty, product quality, promotion, and price. Some of our branded competitors have significantly greater resources and brand recognition than we do.
We believe our strategies for competing in private brands, which include providing superior product quality, effective cost control, an efficient supply chain, successful innovation programs, and strategic customer partnerships, allow us to compete effectively.
Resources
Raw Materials and Supplies: Our raw materials consist of ingredients and packaging materials. Principal ingredients used in our operations include casein, cheese, cocoa, coconut oil, coffee, corn and corn syrup, cucumbers, eggs, fruit, non-fat dry milk, oats, palm oil, peppers, soybean oil, sugar, tea, and wheat. The cost of raw materials used in our products fluctuate due to weather conditions, climate change, regulations, fuel prices, energy costs, labor shortages, labor disputes, freight transportation delays or availability, disruption in logistics, political unrest, industry, general U.S. and global economic conditions, or other unforeseen circumstances. The most important packaging materials and supplies used in our operations are cartons, composite cans, corrugated containers, glass, metal cans, metal closures, and plastics. Ingredients and most packaging materials are generally purchased under long-term supply contracts. We believe these ingredients and packaging materials are generally available from a number of suppliers. However, global supply chain disruptions could put sourcing availability at risk, and in the past have challenged and delayed timing of availability from our suppliers. Volatility in the cost of our raw materials and packaging supplies can adversely affect our performance, as price changes often lag behind changes in costs, and we are not always able to adjust our pricing to reflect changes in raw material and supply costs.
For additional discussion of the risks associated with the raw materials used in our operations, see Part I, Item 1A – Risk Factors and Part II, Item 7 - Macroeconomic Trends and Conditions.
Trademarks: We own a number of registered trademarks. While we consider our trademarks to be valuable assets, we do not consider any trademark to be of such material importance that its absence would cause a material disruption of our business.
Seasonality
In the aggregate, our sales are generally weighted slightly toward the second half of the year, particularly the fourth quarter, with a more pronounced impact on profitability. Products that show a higher level of seasonality include non-dairy creamer, coffee, tea, hot cereal, in-store bakery items, and refrigerated dough products, all of which generally have higher sales in the first and fourth quarters. Additionally, sales of broth are generally higher in the fourth quarter, and sales of candy, cookies, crackers, pretzels, and cheese & pudding are generally higher in the third and fourth quarters. Frozen griddle items are generally less seasonal with consistency across each quarter. Warmer weather products such as pickles typically have higher sales in the second quarter, while ready-to-drink beverages, powdered beverages, other blends generally show higher sales in the second and third quarters. The higher sales during seasonal periods impact our profitability as our manufacturing plants run at higher capacities and have more favorable fixed cost overhead absorption due to the higher volumes.
Our short-term financing needs are primarily for financing working capital and are generally highest in the first half of the year as inventory levels increase relative to the second half of the year, due to the cyclical nature of our business. As a result of our product portfolio and the related seasonality, our financing needs are generally highest in the first half of the year, while cash flow is highest in the second half of the year.
In recent years, the impact on profitability from our seasonality was disrupted by commodity inflation, supply chain disruption, and labor shortages. For additional discussion on product consumption patterns due to commodity inflation and supply chain disruption, see Part II, Item 7 - Macroeconomic Trends and Conditions.
Government Regulation
The conduct of our businesses, and the production, distribution, sale, labeling, safety, transportation, and use of our products, are subject to various laws and regulations administered by federal, state, and local governmental agencies in the United States, as well as to foreign laws and regulations administered by government entities and agencies in markets where we operate.
We are subject to national and local environmental laws in the United States and in foreign countries in which we do business including laws relating to water consumption and treatment, air quality, waste handling and disposal, and other regulations intended to protect public health and the environment. We are committed to meeting all applicable environmental compliance requirements.
Changes in these laws or regulations, or the introduction of new laws or regulations, could increase the costs of doing business for the Company, our customers, or suppliers, or restrict our actions, causing our results of operations to be adversely affected.
Human Capital
We believe creating a values-led, high performance workforce and becoming a talent leader is key to achieving success in our growth strategy. Our human capital initiatives are grounded in our set of values called The TreeHouse Way, which includes: Own It, Commit to Excellence, Be Agile, Speak Up, and Better Together. Aligning to these values enables our people to more effectively collaborate, execute, and take advantage of the growth opportunities for our business. We drive our culture and human capital strategies by embedding these values across the employee management process by operationalizing these values in our hiring practices, performance management processes, and our approach to leadership development and training.
As of December 31, 2024, our work force consisted of approximately 7,400 full-time employees, with 6,000 in the United States and 1,400 in Canada. Approximately 1,800 were salaried, and 5,600 were hourly employees. Approximately 2,100 were unionized, and 5,300 were non-union employees. We have not experienced any material interruptions of operations due to disputes with our employees and consider our relations with our employees to be satisfactory.
Key areas of focus for the Company include:
Health and Safety: The safety of our employees is a top priority. Our business could not operate without our team members, and our plant employees are essential to the success of our company. TreeHouse is committed to creating a culture of Environmental, Health, Safety ("EHS") excellence through personal responsibility and risk prevention. Safety is incorporated into our TreeHouse Management Operating System ("TMOS") and under TMOS, our plants are accountable to EHS Improvement Plans, Environmental Compliance Plans and standardized Incident Investigation and Communication processes. We have established a common plant structure for our EHS organization at our facilities, which allows us to proactively identify improvement opportunities by leveraging best practices and better focus our resources on safety risk identification and mitigation. We continue to focus on empowerment by proactively identifying improvement opportunities through external benchmarking. Additionally, our focus on engagement and internal successes creates an environment where everyone can thrive.
Culture: We are committed to promoting equal opportunity across our organization. We believe building a team diverse in ideas, experiences, and backgrounds enables us to be more successful in our jobs and better address the needs of customers and consumers. Our Board oversees our ESG strategy, including through its Nominating and Corporate Governance Committee, which regularly reviews the Company’s ESG activities, developments, goals and objectives, including the Company’s ESG programs and disclosures. The Compensation Committee of our Board meets with the Company’s ESG Steering Committee to review human capital activities, developments, goals and objectives incorporated into the Company’s ESG initiatives. Our ESG Steering Committee drives our activities in this space, and is composed of our Executive Leadership Team, including our Chairman, CEO, and President. This committee is supported by four subcommittees and our ESG team, which is led by our EVP, Chief Human Resources Officer & General Counsel.
Learning and Development: We place a strong emphasis on Learning and Development, particularly on leadership development. Each year, we conduct an Employee Engagement Survey and use the insights gained to enhance the employee experience and value proposition. One of our most significant initiatives, informed by feedback from the survey and other channels, is the creation of an educational platform known internally as DevelopU. Recognizing the critical role development plays in building skills, knowledge and capabilities that drive performance, engagement and success, DevelopU is designed with advanced learning automation, a robust library of over 10,000 courses, and flexible learning solutions. Additionally, DevelopU enables us to structure production line training in a more contemporary and consistent manner, ensuring alignment and efficiency across operations. Beyond DevelopU, we take a comprehensive approach to career development and continuous learning, offering a well-structured onboarding program, formal training, career development tools, and targeted leadership development, with a strong focus on enhancing leadership capabilities.
Compensation and Benefits: TreeHouse offers competitive pay and benefit packages, designed to drive our performance-based culture and celebrate our collective organizational success. We are committed to and invest heavily in providing employees with comprehensive, market-competitive benefits that support our employees’ health, wealth, and balance. For US employees, we offer a variety of medical plans (including prescription drug coverage) with a range of coverage levels and costs that allows our employees to select the plan that best meets their individual needs. In addition, we offer employees dental and vision coverage, health savings and flexible spending accounts, paid time off, leave, care benefits, a tuition reimbursement program, a 401(k) retirement plan with matching company contributions, life insurance, and voluntary short-term and long-term disability insurance. For Canadian employees, we provide group benefits including health and dental, life, family life, accidental death and dismemberment insurance and disability coverage, and group retirement savings plans with matching company contributions. Canadian employees are also eligible for paid time off, employee assistance, virtual healthcare, and a tuition reimbursement program.
Available Information
We make available, free of charge, through the "Investors" link then "Financials" then "SEC Filings" on our Internet website at www.treehousefoods.com, our annual report on Form 10-K, quarterly reports on Form 10-Q, current reports on Form 8-K, and amendments to those reports filed or furnished pursuant to Section 13(a) or 15(d) of the Exchange Act, as soon as reasonably practicable after such material is electronically filed with or furnished to the SEC. We use our Internet website, through the "Investors" link, as a channel for routine distribution of important information, including news releases, analyst presentations, and financial information. We are not, however, including the information contained on our website, or information that may be accessed through links to our website, as part of, or incorporating such information by reference into, this Form 10-K. Copies of any materials the Company files with the SEC can be obtained free of charge through the SEC’s website at http://www.sec.gov.
Item 1A. Risk Factors
Our business, financial condition, and results of operations are and will remain subject to numerous risks and uncertainties. In addition to the factors discussed elsewhere in this Report, investors should carefully consider the following risk factors, which may have materially affected or could materially affect us, including impacting our business, financial condition, results of operations, cash flows, stock price, credit rating, or reputation. These are not the only risks we face. Additional risks and uncertainties not presently known to the Company or other unknown events or factors or risks that we do not currently consider to be material may also impair the Company’s business, financial condition, results of operations, cash flows, stock price, credit rating, or reputation.
Business and Operating Risks
Disruption of our supply chain or distribution capabilities could have an adverse effect on our business, financial condition, and results of operations.
Our ability to manufacture, move, and sell products is critical to our success. We are subject to damage or disruption to raw material supplies or our manufacturing or distribution capabilities (in particular, to the extent that our raw materials are sourced globally) due to weather, including any potential effects of climate change, natural disaster, fire, terrorism, war, adverse geopolitical events and regional conflicts such as the Russia-Ukraine war and conflicts in the Middle East, pandemics and public health crises, strikes, labor shortages, freight transportation availability and transport capacity constraints, disruption in logistics, import restrictions, or other factors that impair our ability to manufacture, move, or sell our products. Failure to take adequate steps to mitigate the likelihood or potential impact of such events, or to effectively manage such events if they occur, could adversely affect our business, financial condition, and results of operations, as well as require additional resources to restore our supply chain.
We are dependent upon third party suppliers and manufacturers for the manufacturing and packaging of our products. Our operating results are adversely affected if we do not manage our supply chain effectively.
The success of our business depends, in part, on maintaining a strong sourcing and manufacturing platform. The inability of any supplier of raw materials or packaging, independent co-packer, or third-party distributor to deliver or perform for us in a timely or cost-effective manner, while also meeting quality standards, could cause our operating costs to increase and our profit margins to decrease, especially as it relates to our products that have a short shelf life. We must continuously monitor our inventory and product mix against forecasted demand or risk having inadequate supplies to meet consumer demand as well as having too much inventory on hand that may reach its expiration date and become unsaleable. Additionally, the potential for the consolidation of our suppliers increases the risk that adverse changes in their business operations or financial performance will have a corresponding material adverse effect on our operating results.
We are subject to product liability claims for misbranded, adulterated, contaminated, or spoiled food products.
We sell food products for human consumption, which involves risks such as product contamination or spoilage, misbranding, product tampering, and other adulteration of food products. Consumption of a misbranded, adulterated, contaminated, or spoiled product may result in personal illness or injury. We could be subject to claims or lawsuits relating to an actual or alleged contamination, illness, or injury, and we could incur liabilities that are not insured or that exceed our insurance coverage. Even if product liability claims against us are not successful or fully pursued, these claims could be costly and time consuming, and may require management to divert time and resources from business operations to defending such claims. A product that has been actually or allegedly misbranded or becomes adulterated could result in product withdrawals, product recalls, product rework, destruction of product inventory, negative publicity, temporary plant closings, and substantial costs of compliance or remediation. Any of these events, including a significant product liability judgment against us, could result in a loss of confidence in our food products, which could have an adverse effect on our financial condition, results of operations, or cash flows.
If we are unable to attract, hire or retain key employees or a highly skilled and diverse global workforce, it could have an adverse impact on our business, financial condition, and results of operations.
The competitive environment requires us to attract, hire, retain and develop key employees, including our executive officers and senior management team, and maintain a highly skilled and diverse global workforce. We compete to attract and hire highly skilled employees and our own employees are highly sought after by our competitors and other companies in part as a result of the ongoing labor shortages occurring in the U.S. economy. Competition could cause us to lose talented employees, and unplanned turnover could deplete our institutional knowledge and result in increased costs such as our recent implementation of retention programs due to increased competition for employees.
Our results of operations are adversely affected by labor shortages, turnover, and labor cost increases.
Inflationary pressures, shortages in the labor market, and increased competition within and outside our industry for talented employees have increased our labor costs, which have negatively impacted our profitability. Labor shortages or lack of skilled labor have led to increases in costs to meet demand as we pay overtime and roll out incremental programs to attract and retain talent. Labor shortages may also negatively impact us from servicing all demand or operating our manufacturing and distribution facilities efficiently. Pandemics or public health crises may cause illness as well as travel and government restrictions that can negatively impact our operations by causing labor shortages and shutdowns of manufacturing facilities. Further, we distribute our products and receive materials through the freight transportation market, and reduced trucking capacity due to shortages of drivers can increase costs and reduce service levels due to lack of freight transportation availability. Additionally, an inability to enhance robotic technology to automate processes in our manufacturing and distribution facilities could make us dependent on a labor force in tighter markets. Any substantial increase in these costs negatively impact our profitability.
As we are dependent upon a limited number of customers, the loss of a significant customer or consolidation of our customer base could adversely affect our operating results.
A limited number of customers represent a large percentage of our consolidated net sales. Our operating results are contingent on our ability to maintain our sales to these customers. The competition to supply products to these high-volume customers is very strong. We expect that a significant portion of our net sales will continue to arise from a small number of customers, consisting primarily of traditional grocery retailers, mass merchandisers, and foodservice operators. For the year ended December 31, 2024, our ten largest customers accounted for approximately 57.1% of our consolidated net sales from continuing operations, and our largest customer, Walmart Inc. and its affiliates, accounted for approximately 23.9% of our consolidated net sales from continuing operations. No other customer accounted for 10% or more of the Company’s consolidated net sales. These customers typically do not enter into written contracts with fixed purchase commitments, and the contracts that they do enter into generally are terminable at will. Our customers make purchase decisions based on a combination of price, product quality, and customer service performance. Our customers may also consider opportunities for dual sourcing, resulting in additional competition and a potential decline in sales. If our product sales to one or more of these customers decline, this reduction may have a material adverse effect on our business, results of operations, and financial condition.
Further, over the past several years, the retail grocery and foodservice industries have experienced a consolidation trend, which has resulted in mass merchandisers and non-traditional grocers, such as e-commerce grocers with direct-to-consumer channels, gaining market share. As our customer base continues to consolidate, we expect competition to intensify as we compete for the business of the remaining consolidated customers. As this consolidation trend continues and such customers grow larger, they may seek to leverage their growth and position to improve their profitability through improved efficiency, lower pricing, or increased promotional programs. If we are unable to use our scale, product innovation, and category leadership positions to respond to these demands, our profitability or volume growth could be negatively impacted. Additionally, if the surviving entity of a consolidation or similar transaction is not a current customer of the Company, we may lose significant business once held with the acquired retailer.
Consolidation also increases the risk that adverse changes in our customers' business operations or financial performance will have a corresponding material adverse effect on us. For example, if our customers cannot access sufficient funds or financing, then they may delay, decrease, or cancel purchases of our products, or delay or fail to pay us for previous purchases.
Our business operations could be disrupted if our information technology systems fail to perform adequately or are breached.
The efficient operation of our business depends on our information technology systems. We rely on our information technology systems, including the internet, to effectively manage our business data, communications, supply chain, order entry and fulfillment, and other business processes. These information technology systems, some of which are dependent on services provided by third parties, are susceptible to damage, invasions, disruptions, or shutdowns due to hardware failures, computer viruses, hacker attacks, and other cybersecurity risks, telecommunication failures, user errors, employee error or malfeasance, catastrophic events, natural disasters, fire or other factors. Also, the rapid evolution and increased adoption of artificial intelligence technologies may intensify our cybersecurity risks. Additionally, as a result of state-sponsored cyber threats including those stemming from the Russia-Ukraine war, we may face increased cybersecurity risks as companies based in the United States and its allied countries have become targets of malicious cyber activity. If we are unable to prevent, anticipate or adequately respond to and resolve these breaches, disruptions or failures, our business may be materially disrupted, and we may suffer other adverse consequences such as significant data loss, financial or reputational damage or penalties, legal claims or proceedings, remediation costs, or the loss of sales or customers.
Moreover, if our data management systems, including our SAP enterprise resource planning system, do not effectively collect, store, process, and report relevant data for the operation of our business (whether due to equipment malfunction or constraints, software deficiencies, cybersecurity attack, and/or human error), our ability to effectively plan, forecast, and execute our business plan and comply with applicable laws and regulations will be impaired, perhaps materially. Any such impairment could materially and adversely affect our financial condition, results of operations, cash flows, and the timeliness with which we report our internal and external operating results.
We have invested and expect to continue to invest in technology security initiatives, information technology risk management, and disaster recovery plans. The cost and operational consequences of implementing, maintaining, and enhancing further data or system protection measures could increase significantly to overcome increasingly frequent, complex, and sophisticated cyber threats. Despite our best efforts, we are at risk from data breaches and system disruptions. Although to date we are unaware of any material data breach or system disruption, including a cyber-attack, we cannot provide any assurances that such events and impacts will not be material in the future. Our efforts to deter, identify, mitigate, and/or eliminate future breaches may require significant additional effort and expense and may not be successful.
Potential liabilities and costs from litigation could adversely affect our business.
There is no guarantee that we will be successful in defending ourselves in civil, criminal, or regulatory actions, including under general, commercial, employment, environmental, data privacy or security, intellectual property, food quality and safety, anti-trust and trade, advertising and claims, and environmental laws and regulations, or in asserting our rights under various laws. For example, our Company could face allegations of false or deceptive advertising or other criticisms which could end up in litigation and result in potential liabilities or costs. In addition, we could incur substantial costs and fees in defending ourselves and our customers or in asserting our rights in these actions or meeting new legal requirements. The costs and other effects of potential and pending litigation and administrative actions against us, and new legal requirements, cannot be determined with certainty and may differ from expectations.
The recognition of impairment charges on goodwill or long-lived assets could adversely impact our financial reporting and results of operations.
As of December 31, 2024, we have $1,819.3 million of goodwill and $212.9 million of other intangible assets. Additionally, we have $748.6 million of property, plant, and equipment and $154.4 million of operating lease right-of-use assets as of December 31, 2024.
We perform an annual impairment assessment for goodwill and our indefinite-lived intangible assets, and as necessary, for other long-lived assets. If the results of such assessments were to show that the fair value of these assets were less than the carrying values, we could be required to recognize a charge for impairment of goodwill or long-lived assets, and the amount of the impairment charge could be material. Factors which could result in an impairment include, but are not limited to, (i) reduced demand for our products, (ii) higher commodity prices, (iii) lower prices for our products or increased marketing as a result of increased competition, and (iv) significant disruptions to our operations as a result of both internal and external events.
For the year ended December 31, 2024, we recognized impairments of $19.3 million of property, plant, and equipment in our Ready-to-drink beverages asset group and $0.9 million of Operating lease right-of-use assets in our Grand Prairie asset group. For the year ended December 31, 2023, we recognized an impairment of $4.7 million of property, plant, and equipment in our Dallas facility asset group.
This impairment and future impairments on goodwill or long-lived assets could impact our future financial position and results of operations.
Multiemployer pension plans could adversely affect our business.
We participate in various multiemployer pension plans administered by labor unions representing some of our employees. We make periodic contributions to these plans to allow them to meet their pension benefit obligations to their participants. Our required contributions to these funds could increase because of a shrinking contribution base as a result of the insolvency or withdrawal of other companies that currently contribute to these funds, inability or failure of withdrawing companies to pay their withdrawal liability, lower than expected returns on pension fund assets or other funding deficiencies. In the event that we withdraw from participation in one of these plans, then applicable law could require us to make an additional lump-sum contribution ("withdrawal liability") to the plan, and we would have to reflect that as an expense in our results of operations. Our withdrawal liability for any multiemployer plan would depend on the extent of the plan’s funding of vested benefits. In the ordinary course of our renegotiation of collective bargaining agreements with labor unions that maintain these plans, we may decide to discontinue participation in a plan, and in that event, we could face a withdrawal liability.
Our business could be harmed by strikes or work stoppages by our employees.
Currently, collective bargaining agreements cover a significant number of our full-time distribution, production, and maintenance employees. A dispute with a union or employees represented by a union could result in production interruptions caused by work stoppages. If a strike or work stoppage were to occur, our results of operations could be adversely affected.
Market and Other External Risks
We operate in the highly competitive and rapidly changing food industry.
The food industry is highly competitive, and faces increased competition as a result of consolidation, channel proliferation, the growth of online food retailers and new market participants, and technological advancements (including advancements in artificial intelligence technologies). We face competition across our product lines from other companies that have varying abilities to withstand changes in market conditions. Some of our competitors have substantial financial, marketing, technological, and other resources, and competition with them in our various categories and product lines could cause us to reduce prices, increase capital, marketing or other expenditures, or lose sales, which could have a material adverse effect on our business and financial results. Category sales and growth could also be adversely impacted if we are not successful in monitoring trends and introducing new products.
Some customer buying decisions are based on a periodic bidding process in which the successful bidder is reasonably assured of the sale of its selected product to the food retailer, super center, mass merchandiser, or food-away-from-home distributors, until the next bidding process. Our sales volume may decrease significantly if our offer is too high and we lose the ability to sell products through these channels, even temporarily. Alternatively, we risk reducing our margins if our offer is successful but below our desired price point. Either of these outcomes may adversely affect our results of operations. Additionally, competition can impact our ability to pass on increased costs or otherwise increase prices.
As new and evolving distribution channels acquire greater attention with consumers, we will need to evaluate whether our business methods and processes can be utilized or adopted in a manner that permits us to successfully serve these distribution channels. Our inability to offer competitive and innovative products to these customer segments could have an adverse impact on our results of operations.
Increases in input costs, such as ingredients, packaging materials, and fuel costs, could adversely affect earnings.
In recent years, the overall global economy has experienced significant inflation in packaging materials, fuel, energy, and across several agricultural commodities, and future changes in such costs may meaningfully impact our results of operations and cause our operating margins to fluctuate significantly.
While we have seen some commodities move lower relative to recent all-time highs, many of our ingredients and packaging inputs still remain elevated compared to historical levels. We manage the impact of increases in the costs of raw materials, wherever possible, by locking in prices on quantities required to meet our production requirements. However, there can be no assurance that our hedging activities will result in the optimal price. When feasible, we attempt to offset the effect of such increases by raising prices to our customers. However, competitive pressures may limit our ability to quickly raise prices in response to increased raw materials, packaging, and fuel costs. In addition, in instances of declining input costs, customers may look for price reductions in situations where we have locked into purchases at higher costs, as changes in the prices of our products may lag behind changes in the costs of our materials. Accordingly, if we are unable to increase our prices to offset increasing raw material, packaging, and fuel costs, our operating profits and margins could be materially affected. Additionally, in conditions of increasing input cost inflation, the ability to produce realistic, relevant and reliable forecast information could be materially affected, which may result in misleading guidance leading to reputational damage.
We are also subject to delays caused by interruptions in production of raw materials based on conditions not within our control. Such conditions include job actions, labor shortages or strikes by employees of suppliers, weather, crop conditions, transportation shortages and interruptions, natural disasters, sustainability issues, pandemics and public health crises, geopolitical events, or other catastrophic events. As a result, input costs could continue to be volatile due to external events such as the Russia-Ukraine war, conflicts in the Middle East, or any other geopolitical conflicts. Although we have no direct exposure to Russia, Ukraine, or the Middle East, our supply chain may be adversely impacted by the Russia-Ukraine war and conflicts in the Middle East. We continue to face other challenges and risks arising from the war including added costs to existing inflationary pressures through increased fuel and raw material prices and labor costs.
Our private label and regionally branded products may not be able to compete successfully with nationally branded products.
For sales of private label products to retailers, the principal competitive factors are price, product quality, and quality of service. For sales of private label products to consumers, the principal competitive factors are price and product quality. In many cases, competitors with nationally branded products have a competitive advantage over private label products due to name recognition. In addition, when branded competitors focus on price and promotion, the environment for private label producers becomes more challenging because the price differential between private label products and branded products may become less significant.
Competition to obtain shelf space for our branded products with retailers is primarily based on the expected or historical performance of our product sales relative to our competitors. The principal competitive factors for sales of our branded products to consumers are brand recognition and loyalty, product quality, promotion, and price. Some of our branded competitors have significantly greater resources and brand recognition than we do. There can be no assurance that retailers will provide sufficient, or any, shelf space for our products. Even if we obtain shelf space or preferable shelf placement, our new and existing products may fail to achieve the sales expectations set by our retailers, potentially causing these retailers to remove our products from their shelves.
Competitive pressures or other factors could cause us to lose sales, which may require us to lower prices, increase the use of discounting or promotional programs, or increase marketing expenditures, each of which would adversely affect our margins and could result in a decrease in our operating results and profitability.
We may be unable to anticipate changes in consumer preferences, which may result in decreased demand for our products.
Our success depends in part on our ability to anticipate the tastes, quality demands, eating habits, and overall purchasing trends of consumers and to offer products that appeal to their preferences. Purchasing trends are influenced by macro environment factors. These include, but are not limited to, at-home vs. food-away-from home consumption, consumer income and government stimulus, inflation, and unemployment. Consumer preferences change from time to time, and our failure to timely anticipate, identify, or react to these changes could result in reduced demand for our products, which would adversely affect our operating results and profitability. Additionally, the increased use and/or prevalence of certain weight loss drugs, which may suppress a person’s appetite and/or impact a person's preferences, may impact the demand or consumption patterns for certain of our products.
New laws or regulations or changes in existing laws or regulations could adversely affect our business.
The food industry is subject to a variety of federal, state, local, and foreign laws and regulations, including, but not limited to, those related to food safety, food labeling, food ingredients, and environmental matters. Governmental regulations also affect taxes and levies, healthcare costs, energy usage, international trade, immigration, and other labor issues, all of which may have a direct or indirect effect on our business or those of our customers or suppliers. Changes in these laws or regulations, or the introduction of new laws or regulations, could increase the costs of doing business for the Company, our customers, or suppliers, or restrict our actions, causing our results of operations to be adversely affected. Additionally, the change in administration following the 2024 United States presidential election could further impact trade and tariff policies, and could also result in substantial changes to fiscal, tax, or regulatory policies that may impact our business.
Our indebtedness and our ability to service our debt adversely affect our business and financial condition.
As of December 31, 2024, we had $1,409.1 million of outstanding indebtedness, including a $588.6 million term loan ("Term Loan A-1") maturing on March 26, 2026, a $316.4 million term loan ("Term Loan A" and, together with Term Loan A-1, the "Term Loans") maturing on March 26, 2028, $500.0 million of 4.0% notes due September 1, 2028 (the "2028 Notes"), and $4.1 million of finance lease obligations. The Revolving Credit Facility (as defined in Note 12) and the Term Loans are known collectively as the "Credit Agreement." The degree to which we are leveraged could have adverse consequences to us, limiting management's choices in responding to business, economic, regulatory, and other competitive conditions. In addition, our ability to make scheduled payments on or refinance our debt obligations depends on our financial condition and operating performance, which are subject to prevailing economic and competitive conditions and to certain financial, business, legislative, regulatory, and other factors beyond our control. We may be unable to maintain a level of cash flows from operating activities sufficient to permit us to pay the principal, premium, if any, and interest on our indebtedness. If our cash flows and capital resources are insufficient to fund our debt service obligations, we could face substantial liquidity problems and could be forced to reduce or delay investments and capital expenditures, dispose of material assets or operations, seek additional debt or equity capital, or restructure or refinance our indebtedness. We may not be able to affect any such alternative measures, if necessary, on commercially reasonable terms or at all and, even if successful, those alternative actions may not allow us to meet our scheduled debt service obligations. In addition, we and our subsidiaries may incur significant additional indebtedness in the future. Although the agreements governing our indebtedness contain restrictions on the incurrence of additional indebtedness, these restrictions are subject to a number of qualifications and exceptions, and the additional indebtedness incurred in compliance with these restrictions could be substantial. These restrictions also will not prevent us from incurring obligations that do not constitute indebtedness. If new debt is added to our current debt levels, the risks described herein would increase.
The terms of the agreements governing our indebtedness restrict our current and future operations.
The agreements governing our indebtedness contain a number of restrictive covenants that impose significant operating and financial restrictions on us and may limit our ability to engage in acts that may be in our long-term best interest, including restrictions on our ability to: incur additional indebtedness and guarantee indebtedness; pay dividends or make other distributions or repurchase or redeem our capital stock; prepay, redeem, or repurchase certain subordinated debt; issue certain preferred stock or similar equity securities; make loans and investments; sell assets; incur liens; enter into transactions with affiliates; enter into agreements restricting our subsidiaries’ ability to pay dividends; and consolidate, merge, sell, or otherwise dispose of all or substantially all of our assets.
In addition, our Credit Agreement requires us to maintain a certain consolidated net leverage ratio tested on a quarterly basis. Our ability to meet these financial covenants can be affected by events beyond our control, and we may be unable to meet the required ratio.
A breach of the covenants or restrictions under the agreements governing our indebtedness could result in an event of default under the applicable indebtedness. Such default may allow the creditors to accelerate the related debt and may result in the acceleration of any other debt to which a cross acceleration or cross default provision applies. In addition, an event of default under the Credit Agreement may permit our lenders to terminate all commitments to extend further credit under those facilities. In the event our lenders or noteholders accelerate the repayment of our borrowings, we and our subsidiaries may not have sufficient assets to repay that indebtedness. As a result of these restrictions, we may be:
•limited in how we conduct our business;
•unable to raise additional debt or equity financing to operate during general economic or business downturns; or
•unable to compete effectively or to take advantage of new business opportunities.
These restrictions may affect our ability to grow in accordance with our strategy. In addition, our financial results, substantial indebtedness and credit ratings could materially adversely affect the availability and terms of our financing.
Increases in interest rates may negatively affect earnings.
As of December 31, 2024, the aggregate principal amount of our debt instruments with exposure to interest rate risk was approximately $905.0 million, based on the outstanding debt balance of our Credit Agreement. As a result, higher interest rates will increase the cost of servicing our financial instruments with exposure to interest rate risk, and could reduce our profitability and cash flows. As of December 31, 2024, the Company had entered into long-term interest rate swap agreements to mitigate its variable debt exposures. The notional amount of these agreements is $1,750.0 million as of December 31, 2024. Under the terms of the agreements, $875.0 million of interest rate swaps mature on February 28, 2025, and the remaining $875.0 million of interest rate swaps, which are effective February 28, 2025, mature on February 29, 2028. Our variable-rate debt is nearly fully hedged through 2028 with our fixed rate interest rate swaps, but rising interest rates can impact other areas of the business, including, but not limited to, our pension plans or our suppliers. Each one percentage point change in SOFR rates would result in an approximate $0.3 million change in the annual cash interest expense, before any principal payment, on our financial instruments with exposure to interest rate risk, including the impact of the interest rate swap agreements that were effective in 2024.
Fluctuations in foreign currencies may adversely affect earnings.
The Company is exposed to fluctuations in foreign currency exchange rates. The Company’s Canadian subsidiaries purchase and sell various inputs that are based in U.S. dollars; accordingly, the profitability of the Canadian subsidiaries is subject to foreign currency transaction gains and losses that affect earnings. We may manage the impact of foreign currency fluctuations, including the Canadian dollar and other foreign currencies, related to raw material purchases and sales of finished goods using foreign currency contracts. We are also exposed to fluctuations in the value of our foreign currency investment in our Canadian subsidiaries, which includes Canadian dollar denominated intercompany notes. We translate the Canadian assets, liabilities, revenues, and expenses into U.S. dollars at applicable exchange rates. Accordingly, we are exposed to volatility in the translation of foreign currency denominated earnings due to fluctuations in the values of the Canadian dollar, which may negatively impact the Company’s results of operations and financial position.
Changes in weather conditions, natural disasters, geopolitical events, and other catastrophic events beyond our control could adversely affect our results of operations.
Changes in weather conditions or climate changes, natural disasters such as floods, droughts, frosts, earthquakes, hurricanes, tornados, fires, or pestilence, geopolitical events such as the Russia-Ukraine war and conflicts in the Middle East, and other catastrophic events may affect the cost and supply of commodities and raw materials. Additionally, these events could result in reduced supplies of raw materials or availability of critical utilities, such as power. Our competitors may be affected differently by weather conditions and natural disasters depending on the location of their suppliers and operations. Further, changes in weather could impact consumer demand and our earnings may be affected by seasonal factors including the seasonality of our supplies and such changes in consumer demand. Damage or disruption to our production or distribution capabilities due to weather, natural disaster, fire, terrorism, war, pandemics, strikes, or other reasons could impair our ability to manufacture or sell our products. Failure to take adequate steps to reduce the likelihood or mitigate the potential impact of such events, or to effectively manage such events if they occur, particularly when a product is sourced from a single location, could adversely affect our business and results of operations, as well as require additional resources to restore our supply chain.
Climate change presents challenges to our business and could materially adversely affect our businesses, reputation, operations and supply chain.
The effects of climate change expose us to both physical and transition risk and create financial and operational risks to our business, both directly and indirectly. In addition, increased public awareness and concern regarding global climate change may result in more regulations designed to reduce greenhouse gas ("GHG") emissions. Similarly, we may incur substantial costs if such regulations are subsequently reversed or modified.
These climate changes have a negative effect on agricultural productivity, and we may be subject to decreased availability or less favorable pricing for certain raw materials that are necessary for our products, including, but not limited to, coconut oil, coffee, corn and corn syrup, cucumbers, fruit, oats, palm oil, peppers, rice, soybean oil, sugar, tea, and wheat. In addition, increases in the frequency and severity of extreme weather and natural disasters may result in material damage and disruptions to our manufacturing operations and distribution channels or our third party manufacturers’ operations, particularly where a product is primarily sourced from a single location. This may require us to make additional unplanned capital expenditures, increase the prices of our raw materials due to sourcing from other locations, increase our cost of transporting and storing raw materials, or disrupt our production schedules.
Also, the impacts of these climate events may cause unpredictable water availability or exacerbate water scarcity. Water is critical to our businesses, including the businesses of the suppliers on whom we depend upon, and the lack of available water of acceptable quality may lead to, among other things, adverse effects on our operations. The increasing concern over climate change and related environmental sustainability matters also has and may continue to result in more federal, state, local and foreign legal requirements, including requirements to reduce or mitigate the effects of greenhouse gases or conserve and replenish water. Depending on the nature of such laws, we may experience significant increases in our compliance costs, capital expenditures, and other financial obligations to adapt our business and operations to meet new regulations and standards, and we may incur substantial costs if such regulations and standards are subsequently reversed or modified. We depend upon natural gas, diesel fuel, and electricity in the manufacturing and distribution of our products. Legislation or regulation affecting these inputs could materially affect our profitability.
Further, our businesses could be adversely affected if we are unable to effectively address increased concerns from the media, shareholders and other stakeholders on climate change and related environmental sustainability and governance matters. At the same time, stakeholders and regulators have increasingly expressed or pursued opposing views, legislation, and investment expectations with respect to sustainability initiatives, including the enactment or proposal of "anti-ESG" legislation or policies.
In addition, over the years we have made public commitments regarding our intended reduction of carbon emissions and other near- and mid-term environmental sustainability goals. Although we intend to meet these goals, we may be required to expend significant resources to do so, which could significantly increase our operational costs. Further, there can be no assurance of the extent to which any of our goals or ambitions will be achieved, or that any future investments we make in furtherance of achieving such goals will meet investor expectations or any binding or non-binding legal standards regarding sustainability performance. Moreover, we may determine that it is in the best interest of our Company and our shareholders to prioritize other business, social, governance or sustainable investments over the achievement of our current commitments based on economic, regulatory and social factors, business strategy or pressure from investors, activist groups or other stakeholders. Any failure, or perceived failure, to achieve the goals and commitments we have and may in the future set with respect to reducing our impact on the environment or perception of a failure to act responsibly with respect to the environment, could, in addition to regulatory and legal risks related to compliance, lead to adverse publicity, which could damage our reputation, which in turn could adversely impact our results of operations. As a result, climate change, including legal and market pressures to address climate change, could have a material adverse effect to our businesses, financial condition, capital expenditures, results of operations, cash flows, and supply chain.
Shareholder activism has caused us to incur significant expense, caused disruption to our business, and impacted our stock price.
We may be subject to shareholder activism in the future, which could result in substantial costs and divert management's and our Board's attention and resources from our business. Additionally, such shareholder activism could give rise to perceived uncertainties as to our future, adversely affect our relationships with our employees, customers or service providers, and make it more difficult to attract and retain qualified personnel. Also, we may be required to incur significant fees and other expenses related to activist shareholder matters, including for third-party advisors. Our stock price could be subject to significant fluctuation or otherwise be adversely affected by the events, risks and uncertainties of any shareholder activism.
Strategic Risks
Our inability to execute our business strategy could adversely affect our business.
We structured our operating model to deliver our growth objectives. We expect that the execution of our strategy, which includes disciplined capital allocation strategy in deploying proceeds to enhance depth and capabilities in growing categories, as well as supply chain initiatives and margin management opportunities, will require change management activities to align our operating model with our portfolio. Our strategic ambition to be a leader in consumer trending food and beverage categories may divert the organization’s attention from other business issues. Our success is partly dependent upon properly executing, and realizing cost savings or other benefits from, these often-complex initiatives. Any failure to implement our initiatives could adversely affect our ability to grow margins. If we are unsuccessful in implementing or executing one or more of our business strategies, our business could be adversely affected.
Our operations are subject to the general risks associated with acquisitions, divestitures, and other strategic transactions.
We have made several acquisitions and divestitures in recent years that align with our strategic initiative of delivering long-term value to shareholders. See Note 7 of the Consolidated Financial Statements for additional information.
Potential risks associated with these transactions include the inability to consummate a transaction on favorable terms, the diversion of management’s attention from other business concerns, the potential loss of key employees and customers of current or acquired companies, the inability to integrate or divest operations successfully, potential stranded costs following a Transition Services Agreement ("TSA"), the possible assumptions of unknown liabilities, potential disputes with buyers or sellers, potential impairment charges or losses if purchase assumptions are not achieved or if a business is expected to be divested at a loss, restructuring and other disposal charges, and the inherent risks in entering markets or lines of business in which the Company has limited or no prior experience. Any or all of these risks could impact the Company’s financial results and business reputation.
We may not realize some or all of the anticipated benefits of our growth, reinvestment, and restructuring programs in the anticipated time frame or at all.
We depend on our ability to evolve and grow, and as changes in our business environments occur, we may adjust our business plans by introducing new growth, reinvestment, and restructuring programs, from time to time, to meet these changes. During 2024, the Company incurred approximately $28.6 million in growth, reinvestment, and restructuring program costs from continuing operations. See Note 3 of the Consolidated Financial Statements for additional information. Growth, reinvestment, and restructuring programs often require a substantial amount of management and operational resources, which may divert the Company’s attention from existing core businesses, potentially disrupting our operations and adversely affecting our relationships with suppliers and customers. In addition, events and circumstances, such as financial or strategic difficulties, delays and unexpected costs may occur that could result in our not realizing all or any of the anticipated benefits on our expected timetable or at all, and there can be no assurance that any benefits we realize from these efforts will be sufficient to offset the expenses and costs that we expect to incur from these programs.
Item 1B. Unresolved Staff Comments
None.
Item 1C. Cybersecurity
Risk Management and Strategy
Our cybersecurity program and controls are designed to assess, identify, and manage material risks from cybersecurity threats, and protect and preserve the confidentiality, integrity, and continued availability of all information owned by, or in the care of, the Company. Cybersecurity risk is incorporated into the Company’s broader Enterprise Risk Management program, and is managed in alignment with our business objectives and operational needs.
Our information systems are continuously monitored for security threats and anomalies, and our incident response plan and processes are built to enable us to identify, contain, eradicate, and recover from security incidents in a coordinated fashion, helping maintain the function and security of our IT assets, information resources, and business operations. We have formed relationships with various third-party experts and advisors to provide support in the event of a cybersecurity incident. Additionally, we have established various elements of risk management to mitigate costs associated with cybersecurity incidents.
We strive to maintain a strong culture of cybersecurity awareness across the organization by conducting regular information security awareness training, and simulation exercises, for employees, and providing access to related educational materials.
We oversee and identify material risks from cybersecurity threats associated with our use of third-party service providers, perform third party security assessments of select third party service providers, and employ techniques to protect our organization in the event our third parties experience a cybersecurity incident.
We employ controls to continuously monitor and assess the information gathered by our security tools, services to identify gaps, exposures, or weaknesses in our overall security posture, and engage reputable external specialists to provide independent assessments of our cybersecurity program, and response preparedness. Further, the Company’s enterprise level IT general controls are audited annually.
Impact of Cybersecurity Risks and Threats
We are not aware of having experienced any risks from cybersecurity threats or incidents through the date of this Report that have materially affected the Company, its business strategy, results of operation or financial condition or are reasonably likely to have such an effect over the long term. This does not guarantee that future incidents or threats will not have a material impact or that we are not currently the subject of an undetected incident or threat that may have such an impact.
Additional information on cybersecurity risks we face is discussed in Part I, Item 1A – Risk Factors, which should be read in conjunction with the foregoing information.
Governance
Board of Directors
Our Board of Directors oversees our Enterprise Risk Management program, and cybersecurity risks are monitored as a part of the broader program. Our Board has delegated the primary responsibility to oversee risks from cybersecurity threats to the Audit Committee.
Our Audit Committee receives quarterly updates from the Chief Information Officer ("CIO") on significant risks, cyber incidents, key performance indicators measuring the effectiveness of our cybersecurity risk program, and other relevant matters, and regularly reviews the measures implemented by the Company to identify, treat, mitigate, and transfer cybersecurity risk. The Audit Committee regularly briefs the Board on these updates, and the Board also receives periodic briefings on cybersecurity risk through our broader Enterprise Risk Management program. These risks, including current and emerging risks, are regularly evaluated by the Audit Committee and the Board. In addition to the regular updates to the Audit Committee, we have protocols by which certain cybersecurity incidents and threats are escalated within the Company and, where appropriate, reported in a timely manner to the Board and Audit Committee.
Management
Our CIO is responsible for our information security program and controls, which includes cybersecurity risk management. Our Head of Cybersecurity reports to our CIO, and leads our cybersecurity program and team that assesses, manages and monitors cybersecurity risks, associated risks of emerging technologies, and the corresponding controls. The CIO and Head of Cybersecurity have extensive cybersecurity knowledge and expertise, skills gained from each having over 20 years of relevant industry experience.
Item 2. Properties
We operate the following production facilities, the majority of which we own, as shown below. We lease our principal executive offices in Oak Brook, Illinois and other office space in Green Bay, Wisconsin. We also maintain a network of leased distribution facilities. We believe our owned and leased facilities are suitable for our operations and provide sufficient capacity to meet our requirements for the foreseeable future. The following chart lists the locations of our production facilities as of December 31, 2024:
| | | | | | | | | | | | | | | | | | | | |
| United States: |
| Forest Park, Georgia | | Chicago, Illinois | | Dixon, Illinois | | Pecatonica, Illinois |
| South Beloit, Illinois | | Cedar Rapids, Iowa | | New Hampton, Iowa | | Princeton, Kentucky |
| Cambridge, Maryland | | Wayland, Michigan | | Tonawanda, New York | | Faison, North Carolina |
| Hanover, Pennsylvania | | Lancaster, Pennsylvania | | Womelsdorf, Pennsylvania | | Carrollton, Texas |
| Northlake, Texas | | Ogden, Utah* | | Green Bay, Wisconsin | | Manawa, Wisconsin |
| | | | | | |
| Canada: |
| Delta, British Columbia* | | Brantford, Ontario | | Georgetown, Ontario | | Kitchener, Ontario |
| Richmond Hill, Ontario* | | | | | | |
| | | | | | |
| *The Company leases these facilities. |
|
Item 3. Legal Proceedings
Information regarding legal proceedings is available in Note 19 to the Consolidated Financial Statements in this report.
Item 4. Mine Safety Disclosures
Not applicable.
PART II
Item 5. Market for Registrant’s Common Equity, Related Stockholder Matters, and Issuer Purchases of Equity Securities
The Company’s common stock is traded on the New York Stock Exchange ("NYSE") under the symbol "THS."
On January 31, 2025, there were 1,530 shareholders of record of our common stock.
We have not paid any cash dividends on the common stock and currently anticipate that, for the foreseeable future, we will retain any earnings for the development of our business. Accordingly, no dividends are expected to be declared or paid on the common stock. The declaration of dividends is at the discretion of our Board of Directors.
Purchases of Equity Securities by the Issuer and Affiliated Purchasers
On November 13, 2024, the Company announced that the Board of Directors (the "Board") authorized a $400 million stock repurchase program. This authorization is open ended and replaced the Company's previous stock repurchase authorization of $400 million, which was approved by the Board on November 2, 2017 (the "Prior Authorization"). The Company had repurchased approximately $376.5 million of shares of the Company’s common stock under the Prior Authorization. Any repurchases under the program may be made by means of open market transactions, negotiated block transactions, or otherwise, including pursuant to a repurchase plan administered in accordance with Rules 10b5-1 and 10b-18 under the Securities Exchange Act of 1934, as amended (the "Exchange Act"). The size and timing of any repurchases will depend on price, market and business conditions, and other factors. The Company has the ability to make discretionary repurchases up to an annual cap of $150 million under the $400 million total authorization, of which $393.5 million remained available under the stock repurchase program. Any shares repurchased will be held as treasury stock. There were 4.1 million shares of common stock repurchased for a total of $149.7 million during the year ended December 31, 2024.
The following table presents the total number of shares of common stock purchased during the quarter ended December 31, 2024, the average price paid per share, the number of shares that were purchased as part of a publicly announced repurchase program, and the approximate dollar value of the maximum number of shares that may yet be purchased under the share repurchase program:
| | | | | | | | | | | | | | | | | | | | | | | | | | |
| Period | | Weighted Average Price Paid per Share | | Total Number of Shares Purchased | | Total Number of Shares Purchased as Part of Publicly Announced Plans or Programs | | Approximate Dollar Value of Maximum Number of Shares that may not yet be Purchased under the Programs |
| | | | (In millions) |
| October 1 through October 31, 2024 | | $ | 37.80 | | | 0.7 | | | 0.7 | | | $ | 51.9 | |
| November 1 through November 30, 2024 (1) | | 35.41 | | 1.0 | | | 1.0 | | | 393.5 |
| December 1 through December 31, 2024 | | — | | | — | | | — | | | 393.5 |
| For the Quarter Ended December 31, 2024 | | $ | 36.39 | | | 1.7 | | | 1.7 | | | $ | 393.5 | |
| | | | | | | | |
(1)For the period from November 1, 2024 through November 12, 2024, the Company repurchased 0.8 million shares under the Prior Authorization for a total of $28.4 million. For the period from November 13, 2024 through November 30, 2024, the Company repurchased 0.2 million shares for a total of $6.5 million under the new authorization, which was effective November 13, 2024.
For the quarter ended December 31, 2024, the Company repurchased approximately 1.7 million shares of common stock for a total of $61.0 million, excluding excise tax. Weighted average price per share excludes any excise tax imposed on stock repurchases as part of the Inflation Reduction Act of 2022.
Performance Graph
The price information reflected for our common stock in the following performance graph and accompanying table represents the closing sales prices of the common stock for the period from December 31, 2019 through December 31, 2024. The graph and accompanying table compare the cumulative total stockholders’ return on our common stock with the cumulative total return of the S&P SmallCap 600 Index and the S&P Food & Beverage Select Index.
The graph assumes an investment of $100 on December 31, 2019 in each of TreeHouse Foods’ common stock, the stocks comprising the S&P SmallCap 600 Index, and the S&P Food & Beverage Select Index.
Comparison of Cumulative Total Return of $100 among TreeHouse Foods, Inc., S&P SmallCap 600 Index, and the S&P Food & Beverage Select Index
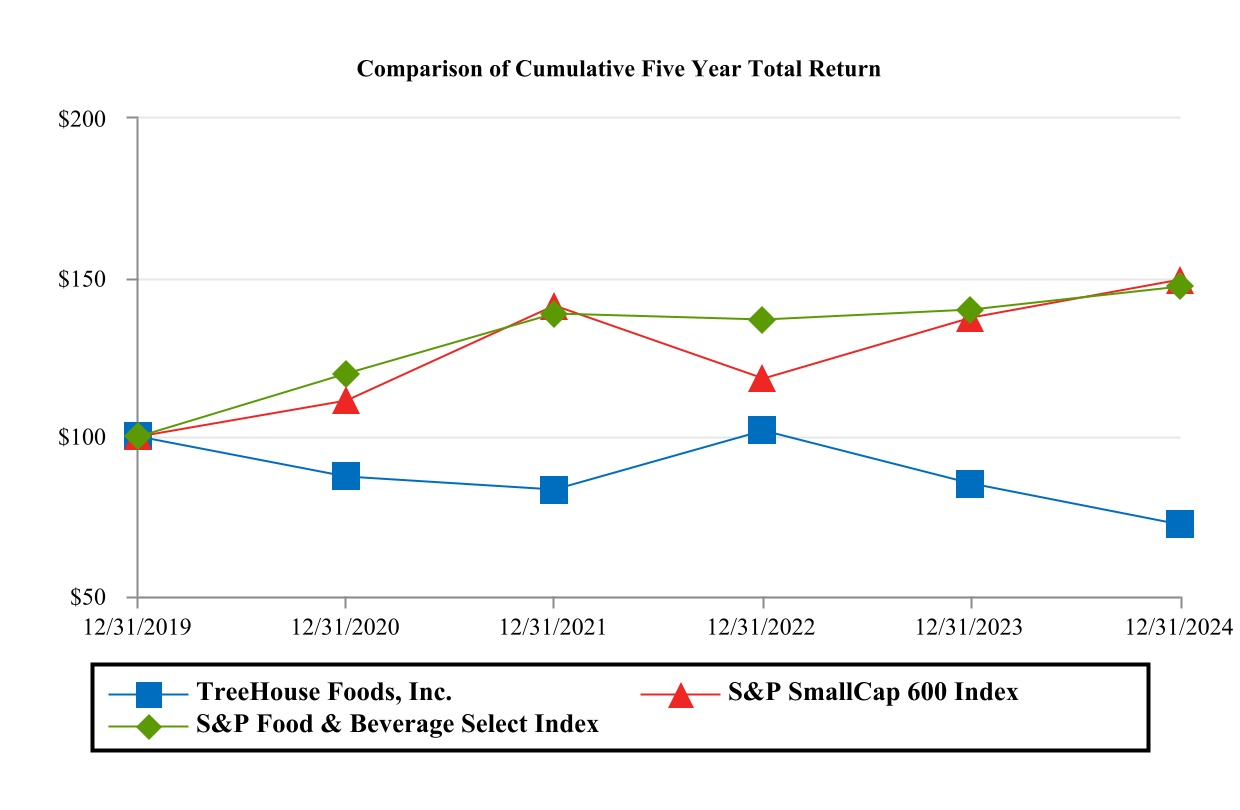
| | | | | | | | | | | | | | | | | | | | | | | | | | | | | | | | | | | | | | |
| | Base
Period | | INDEXED RETURNS
Years Ending |
| Company Name/Index | | 12/31/2019 | | 12/31/2020 | | 12/31/2021 | | 12/31/2022 | | 12/31/2023 | | 12/31/2024 |
| TreeHouse Foods, Inc. | | 100 | | $ | 87.61 | | | $ | 83.57 | | | $ | 101.81 | | | $ | 85.46 | | | $ | 72.43 | |
| S&P SmallCap 600 Index | | 100 | | 111.29 | | | 141.13 | | | 118.41 | | | 137.42 | | | 149.37 | |
| S&P Food & Beverage Select Index | | 100 | | 119.76 | | | 138.63 | | | 136.87 | | | 139.82 | | | 147.23 | |
The performance graph and related table above is furnished and not filed for purposes of Section 18 of the Exchange Act and will not be incorporated by reference into any registration statement filed under the 1933 Act unless specifically identified therein as being incorporated therein by reference. The performance graph is not soliciting material subject to Regulation 14A.
Item 6. [Reserved]
Item 7. Management’s Discussion and Analysis of Financial Condition and Results of Operations
Executive Overview
The following discussion provides an analysis of our financial condition, results of operations, and cash flows from management's perspective and should be read in conjunction with the consolidated financial statements and related notes included in Item 8, Financial Statements and Supplementary Data, of this Annual Report on Form 10-K. Our objective is to also provide discussion of material events and uncertainties known to management that are reasonably likely to cause reported financial information not to be indicative of future operating results or of future financial condition and to offer information that provides an understanding of our financial condition, results of operations, and cash flows.
See below for discussion and analysis of our financial condition and results of operations for 2024 compared to 2023. See Item 7, Management’s Discussions and Analysis of Financial Condition and Results of Operations, in our Annual Report on Form 10-K for the year ended December 31, 2023 for a detailed discussion of our financial condition, results of operations, and cash flows for 2023 compared to 2022.
This Management’s Discussion and Analysis of Financial Condition and Results of Operations contains forward-looking statements. See Cautionary Statement Regarding Forward-Looking Information for a discussion of the uncertainties, risks, and assumptions associated with these statements.
Recent Developments
Debt Refinancing
On January 17, 2025, the Company entered into the Third Amended and Restated Credit Agreement, dated as of January 17, 2025 (the "New Credit Agreement"), among the Company, the lenders from time to time party thereto and Bank of America, N.A., as Administrative Agent, Swing Line Lender and L/C Issuer.
The New Credit Agreement amends, restates and replaces the Company’s existing Credit Agreement, dated as of December 1, 2017 (as amended from time to time prior to January 17, 2025), pursuant to which the Company obtained a $500.0 million revolving credit facility (the "Revolving Facility"), a $500.0 million term A loan (the "Term A Loan") and a $900.0 million tranche A-1 term loan (the "Tranche A-1 Term Loan" and, together with the Term A Loan, the "Term Loans"). Pursuant to the New Credit Agreement, the Company (i) continued and extended the maturity of the Revolving Facility and the Term Loans, (ii) decreased the aggregate size of the Term A Loan to $480.0 million and (iii) decreased the aggregate size of the Tranche A-1 Term Loan to $425.0 million. Refer to Note 12 to our Consolidated Financial Statements for additional information.
Acquisition of Private Brand Tea Business
On January 2, 2025, the Company completed the acquisition of certain subsidiaries that operate the private brand tea business of Harris Freeman & Co, Inc. ("Harris Tea"), a leading private brand tea manufacturer in the U.S., for approximately $205.0 million, subject to customary purchase price adjustments. In addition to private brand tea, Harris Tea manufactures specialty retail tea brands and foodservice tea products for restaurant and hospitality industries. The acquisition aligns with our long-term strategy to build capabilities in our higher-growth, higher-margin categories. Refer to Note 7 to our Consolidated Financial Statements for additional information.
Impact of Griddle Voluntary Recall
In the third quarter of 2024, our results of operations were impacted by a voluntary recall of frozen griddle products produced at our Brantford, Ontario, Canada facility that were still within their shelf-life. During the fourth quarter of 2024, we incurred plant restoration costs. As of the first quarter of 2025, we have resumed production of frozen griddle products at the Brantford facility. As we continue to restore the facility to its full production capacity and capability, we expect to have impacts to our sales volumes. Refer to Note 19 to our Consolidated Financial Statements for additional information.
The Company is seeking to recover the recall-related costs through its insurance coverage, and such recoveries are recorded in the period in which the recoveries are determined to be probable of realization.
Long-Lived Asset Impairment and Related Business Exit
We evaluate property, plant, and equipment, operating lease right-of-use assets, and finite lived intangible assets for impairment when circumstances indicate that their carrying values may not be recoverable. Indicators of impairment include deteriorations in operating cash flows, the anticipated sale or disposal of an asset group, and other significant changes in business conditions.
During the second quarter of 2024, as a result of forecasted cash flow losses, the Company made the decision to exit the RTD business. As a result, the Company performed a recoverability assessment over the RTD asset group in the second quarter of 2024, which indicated that the asset group was not recoverable, and we were required to determine the fair value of the business. Our fair value assessment indicated that the carrying value was in excess of the fair value, and an impairment of $19.3 million of property, plant, and equipment was recognized in our RTD beverages asset group. The impairment charge is included in Asset impairment in the Consolidated Statements of Operations. Refer to Note 8 to our Consolidated Financial Statements for additional information.
The production for the RTD business ceased during the first quarter of 2025. Refer to Note 3 to our Consolidated Financial Statements for additional information.
Restoration of One of our Broth Facilities
Since the end of 2023, our results of operations have been impacted by a voluntary recall of certain broth products produced at our Cambridge, Maryland broth facility and the subsequent restoration of this facility. The restoration impacted our results of operations throughout 2024, as we incurred costs to restore and upgrade our broth facility to full production capacity. During the first half of 2024, the Company successfully restored the key broth production lines and substantially completed upgrades to the facility. The Company continues to progress in advancing production capacity to historical levels at the facility.
During the fourth quarter of 2024, the Company recognized a $10.0 million insurance recovery in Cost of sales in the Consolidated Statements of Operations. The Company is seeking to recover additional recall-related costs through its insurance coverage, and such recoveries are recorded in the period in which the recoveries are determined to be probable of realization. Refer to Note 19 to our Consolidated Financial Statements for additional information.
Acquisition of Pickle Branded Assets
On January 2, 2024, the Company completed the acquisition of pickle branded assets, including Bick’s pickles, Habitant pickled beets, Woodman’s horseradish, and McLarens pickled onions brands, from The J.M. Smucker Co., a North American producer of coffee, consumer foods, dog snacks, and cat food, for a total purchase price of $25.9 million in cash. The allocation of the purchase price consists primarily of inventory. The acquisition is consistent with our strategy and builds depth in our Pickles category by expanding into Canada. Refer to Note 7 to our Consolidated Financial Statements for additional information.
Macroeconomic Conditions and Trends
Significant inflationary pressure on U.S. households, which persisted in recent years, contributed to sluggish overall food and beverage consumption trends. However, in the categories where TreeHouse operates, private brands have consistently gained unit market share compared to national brands, which we believe demonstrates the continued strength of the private brands market. We continue to monitor consumption trends including the increased use and/or prevalence of certain weight loss drugs, which may or may not impact consumer preferences and consumption patterns.
Industry-wide supply chain disruption over the last several years, which had previously constrained our ability to service all of the customer orders received and depressed service levels, has meaningfully improved. Additionally, TreeHouse has made considerable progress toward its long-term supply chain cost savings initiative goals throughout its business, resulting in margin improvement. TreeHouse continues to make strong progress in enhancing our service levels and capturing demand for private brand food and beverage.
Many of our ingredients and packaging input costs still remain elevated compared to historical levels, such as the prices of coffee and cocoa. In response, we from time to time will implement pricing actions to recover inflationary costs. We will continue to monitor the inflationary environment to determine if additional pricing actions will be necessary.
We manage the impact of cost increases, wherever possible, on commercially reasonable terms, by locking in prices on the quantities we expect are required to meet our production requirements. In addition, as input costs rise, we seek to recover inflation by implementing higher pricing. However, our pricing actions often lag commodity cost changes temporarily, or we may not be able to pass along the full effect of increases in raw materials and other input costs as we incur them.
Results of Operations
Year Ended December 31, 2024 Compared to Year Ended December 31, 2023
The following table presents certain information concerning our financial results, including information presented as a percentage of consolidated net sales: | | | | | | | | | | | | | | | | | | | | | | | | | | | | | | | | | | | |
| | Year Ended December 31, | | | | |
| | 2024 | | 2023 | | Increase / (Decrease) |
| (Dollars in millions, except per share amounts) | Dollars | | Percent | | Dollars | | Percent | | $ Change | | % Change |
| | | | | | | | | | | |
| Net sales | $ | 3,354.0 | | | 100.0 | % | | $ | 3,431.6 | | | 100.0 | % | | $ | (77.6) | | | (2.3) | % |
| Cost of sales | 2,805.6 | | | 83.6 | | | 2,855.5 | | | 83.2 | | | (49.9) | | | (1.7) | |
| Gross profit | 548.4 | | | 16.4 | | | 576.1 | | | 16.8 | | | (27.7) | | | (4.8) | |
| Operating expenses: | | | | | | | | | | | |
| Selling and distribution | 153.3 | | | 4.6 | | | 171.6 | | | 5.0 | | | (18.3) | | | (10.7) | |
| General and administrative | 198.0 | | | 5.9 | | | 204.1 | | | 5.9 | | | (6.1) | | | (3.0) | |
| Amortization expense | 48.6 | | | 1.4 | | | 48.2 | | | 1.4 | | | 0.4 | | | 0.8 | |
| Asset impairment | 19.3 | | | 0.6 | | | — | | | — | | | 19.3 | | | 100.0 | |
| Other operating expense, net | 26.1 | | | 0.8 | | | 5.3 | | | 0.2 | | | 20.8 | | | 392.5 | |
| Total operating expenses | 445.3 | | | 13.3 | | | 429.2 | | | 12.5 | | | 16.1 | | | 3.8 | |
| Operating income | 103.1 | | | 3.1 | | | 146.9 | | | 4.3 | | | (43.8) | | | (29.8) | |
| Other expense: | | | | | | | | | | | |
| Interest expense | 63.4 | | | 1.9 | | | 74.8 | | | 2.2 | | | (11.4) | | | (15.2) | |
| Interest income | (4.2) | | | (0.1) | | | (40.1) | | | (1.2) | | | 35.9 | | | 89.5 | |
| | | | | | | | | | | |
| Loss (gain) on foreign currency exchange | 9.4 | | | 0.3 | | | (1.4) | | | — | | | 10.8 | | | 771.4 | |
| Other expense, net | 1.4 | | | — | | | 30.2 | | | 0.9 | | | (28.8) | | | (95.4) | |
| Total other expense | 70.0 | | | 2.1 | | | 63.5 | | | 1.9 | | | 6.5 | | | 10.2 | |
| Income before income taxes | 33.1 | | | 1.0 | | | 83.4 | | | 2.4 | | | (50.3) | | | (60.3) | |
| Income tax expense | 6.2 | | | 0.2 | | | 24.4 | | | 0.7 | | | (18.2) | | | (74.6) | |
| Net income from continuing operations | 26.9 | | | 0.8 | | | 59.0 | | | 1.7 | | | (32.1) | | | (54.4) | |
| Net loss from discontinued operations | — | | | — | | | (5.9) | | | (0.2) | | | 5.9 | | | 100.0 | |
| Net income | $ | 26.9 | | | 0.8 | % | | $ | 53.1 | | | 1.5 | % | | $ | (26.2) | | | (49.3) | % |
| | | | | | | | | | | |
| Earnings (loss) per common share - diluted: | | | | | | | | | | | |
| Continuing operations | $ | 0.51 | | | | | $ | 1.05 | | | | | $ | (0.53) | | | (51.1) | % |
| Discontinued operations | — | | | | | (0.10) | | | | | 0.10 | | | 100.0 | |
Net earnings per share diluted(1) | $ | 0.51 | | | | | $ | 0.94 | | | | | $ | (0.43) | | | (45.7) | % |
(1) The sum of the individual per share amounts may not add due to rounding.
| | | | | | | | | | | | | | | | | | | | | | | |
| | Year Ended December 31, | | | | |
| | 2024 | | 2023 | | Increase / (Decrease) |
| (Dollars in millions, except per share amounts) | Dollars | | Dollars | | $ Change | | % Change |
| | | | | | | |
Other financial data:(1) | | | | | | | |
| EBITDA from continuing operations | $ | 239.4 | | | $ | 260.0 | | | $ | (20.6) | | | (7.9) | % |
| Adjusted EBITDA from continuing operations | 337.4 | | | 365.9 | | | (28.5) | | | (7.8) | |
| Adjusted net sales | 3,377.3 | | | 3,432.9 | | | (55.6) | | | (1.6) | |
| Adjusted cost of sales | 2,783.9 | | | 2,826.8 | | | (42.9) | | | (1.5) | |
| Adjusted gross profit | 593.4 | | | 606.1 | | | (12.7) | | | (2.1) | |
| Adjusted total operating expenses | 392.4 | | | 366.9 | | | 25.5 | | | 7.0 | |
| Adjusted operating income | 201.0 | | | 239.2 | | | (38.2) | | | (16.0) | |
| Adjusted total other expense | 69.7 | | | 49.9 | | | 19.8 | | | 39.7 | |
| Adjusted income tax expense | 30.8 | | | 50.1 | | | (19.3) | | | (38.5) | |
| Adjusted net income from continuing operations | 100.5 | | | 139.2 | | | (38.7) | | | (27.8) | |
| Adjusted diluted earnings per share from continuing operations | $ | 1.91 | | | $ | 2.47 | | | $ | (0.56) | | | (22.6) | % |
(1) Other financial data includes Non-GAAP financial metrics. See "Non-GAAP Measures" for definitions and reconciliations of our Net income (loss) from continuing operations to EBITDA from continuing operations and Adjusted EBITDA from continuing operations, Net sales to Adjusted net sales, Cost of sales to Adjusted cost of sales, Gross profit to Adjusted gross profit, Total operating expenses to Adjusted total operating expenses, Operating income to Adjusted operating income, Total other expense (income) to Adjusted total other expense, Income tax expense to Adjusted income tax expense, Net income (loss) from continuing operations to Adjusted net income from continuing operations, and Diluted earnings per share from continuing operations to Adjusted diluted earnings per share from continuing operations.
Continuing Operations
Net Sales — Net sales for the year ended December 31, 2024 totaled $3,354.0 million compared to $3,431.6 million for the year ended December 31, 2023, a decrease of $77.6 million, or 2.3%. The change in net sales from 2023 to 2024 was due to the following: | | | | | | | | | | | | | | |
| | | Dollars | | Percent |
| | | | | |
| Volume/mix | | $ | (5.0) | | | (0.1) | % |
| Facilities restoration impact | | (50.3) | | | (1.5) | |
| Product recall returns | | (22.0) | | | (0.6) | |
| Pricing | | (56.8) | | | (1.7) | |
| Foreign currency | | (1.4) | | | (0.1) | |
| Business acquisitions | | 57.9 | | | 1.7 | |
| Total change in net sales | | $ | (77.6) | | | (2.3) | % |
| Product recall returns | | 22.0 | | | 0.6 | |
| Total change in adjusted net sales (1) | | $ | (55.6) | | | (1.7) | % |
(1)Adjusted net sales is a Non-GAAP financial measure. Refer to the "Non-GAAP Measures" section for additional information.
The net sales decrease of 2.3% was primarily due to targeted commodity-driven pricing adjustments in select categories. Additionally, the decrease was due to the restoration of one of our broth facilities and the voluntary recall of frozen griddle products, as well as unfavorable volume/mix related to planned distribution exits. These items were partially offset by volume/mix from the acquisition of the Coffee Roasting Capability, as well as new business wins.
Gross Profit — Gross profit as a percentage of net sales was 16.4% for the year ended December 31, 2024 compared to 16.8% for the year ended December 31, 2023, a decrease of 0.4 percentage points. The decrease is primarily due to a voluntary recall of frozen griddle products, which impacted Gross profit by 1.1 percentage points, as well as costs incurred from the restoration of one of our broth facilities related to the broth recall. This was partially offset by the execution of supply chain savings initiatives as well as a $10.0 million insurance recovery related to the broth recall received during the fourth quarter of 2024.
Total Operating Expenses — Total operating expenses were $445.3 million for the year ended December 31, 2024 compared to $429.2 million for the year ended December 31, 2023, an increase of $16.1 million. The increase in expense was primarily due to a decrease in TSA income of $41.1 million and non-cash impairment charge of $19.3 million related to the RTD beverages asset group recorded in the second quarter of 2024. Refer to Note 8 of our Consolidated Financial Statements for additional details. This was partially offset by lower employee incentive compensation expense, lower freight costs, and TSA-related expense reductions.
Total Other Expense — Total other expense was $70.0 million for the year ended December 31, 2024 compared to $63.5 million for the year ended December 31, 2023, an increase in expense of $6.5 million. The increase in expense was primarily due to a decrease in interest income of $34.5 million from the Seller Promissory Note, which was repaid in the fourth quarter of 2023. Additionally, unfavorable currency exchange rate impacts of $10.8 million between the U.S. and Canada contributed to the increase in expense. This was partially offset by a favorable change of $21.8 million in non-cash mark-to-market impacts from hedging activities, largely driven by interest rate swaps, a decrease of $11.4 million in interest expense, primarily due to a decrease in borrowings on our Revolving Credit Facility, and a decrease of $4.4 million in costs related to the Receivables Sales Program due to decreased usage.
Income Taxes — Income taxes were recognized at an effective rate of 18.7% in 2024 compared to 29.3% in 2023. The change in the Company's effective tax rate is primarily driven by changes in the amount of the effect of cross-border tax laws, income tax credits, unrecognized tax benefits, and the impact of the jurisdictional mix of earnings on state income taxes. These items are partially offset by a change in the amount of tax deductible stock-based compensation.
Discontinued Operations
Discontinued Operations — Net loss from discontinued operations decreased by $5.9 million for the year ended December 31, 2024 compared to the year ended December 31, 2023. The decrease is primarily a result of a non-recurring net loss from the Snack Bars Business due to its divestiture on September 29, 2023. Additionally, during the year ended December 31, 2023, the Company recognized an expected loss on disposal adjustment of $2.2 million related to the divestiture of a significant portion of the Meal Preparation business on October 3, 2022. Refer to Note 7 of our Consolidated Financial Statements for additional details.
Liquidity and Capital Resources
Management assesses the Company's liquidity in terms of its ability to generate cash to fund its operating, investing, and financing activities. The Company remains in a strong financial position, with resources available for reinvesting in existing businesses, conducting acquisitions, and managing its capital structure on a short and long-term basis.
Receivables Sales Program
The Company achieves a more efficient cash conversion cycle while strategically managing customer payment terms and counterparty risk through its Receivables Sales Program. Our Receivables Sales Program provides us timely and lower cost access to liquidity that is more effective than other working capital tools, including offering early payment discounts, negotiating shorter payment terms, or drawing on our Revolving Credit Facility. Due to the seasonal nature of our business, we generally increase use of the Receivables Sales Program in the fourth quarter in preparation for our relatively high cash needs in the first half of the year as inventory levels are replenished in anticipation of accelerating sales in the second half of the year.
Approximately $22.5 million was available under the Receivables Sales Program operating limit as of December 31, 2024. See Note 5 to our Consolidated Financial Statements for additional information regarding our Receivables Sales Program.
Revolving Credit Facility
If additional borrowings are needed, approximately $467.7 million of the aggregate commitment of $500.0 million was available under the Revolving Credit Facility as of December 31, 2024. See Note 12 to our Consolidated Financial Statements for additional information regarding our Revolving Credit Facility. We are in compliance with the terms of the Revolving Credit Facility and expect to meet foreseeable financial requirements.
Share Repurchases
During the year ended December 31, 2024, the Company repurchased approximately 4.1 million shares of common stock at a weighted average share price of $36.28 for a total of $149.7 million. See Note 13 to our Consolidated Financial Statements for additional information regarding our stock repurchase program.
Cash Flow
The following table is derived from our Consolidated Statements of Cash Flows: | | | | | | | | | | | | | |
| | Year Ended December 31, |
| | 2024 | | 2023 | | |
| | (In millions) |
| Net Cash Flows Provided By (Used In): | | | | | |
| Operating activities of continuing operations | $ | 265.8 | | | $ | 157.3 | | | |
| Investing activities of continuing operations | (138.3) | | | (241.4) | | | |
| Financing activities of continuing operations | (159.3) | | | (107.5) | | | |
| Cash flows from discontinued operations | — | | | 468.1 | | | |
Year Ended December 31, 2024 Compared to Year Ended December 31, 2023
Operating Activities From Continuing Operations
Net cash provided by operating activities from continuing operations was $265.8 million in 2024 compared to $157.3 million in 2023, an increase of $108.5 million in cash provided. The increase in net cash provided by operating activities was driven by improved working capital management, resulting in an increase in cash flows from accounts payable and from the Receivables Sales Program. Refer to Note 5 to our Consolidated Financial Statements for additional information regarding the Receivables Sales Program.
Investing Activities From Continuing Operations
Net cash used in investing activities from continuing operations was $138.3 million in 2024 compared to $241.4 million in 2023, a decrease in cash used of $103.1 million. The decrease in net cash used was primarily driven by $100.6 million of cash used in the second quarter of 2023 for the acquisitions of the seasoned pretzel and coffee roasting capabilities and the exercise of a purchase option on the lease of our Cambridge, Maryland facility for $8.1 million during the first quarter of 2023. This activity was partially offset by an increase in remaining capital expenditures during 2024 related to growth initiatives and integration activities from recent acquisitions.
Financing Activities From Continuing Operations
Net cash used in financing activities from continuing operations was $159.3 million in 2024 compared to $107.5 million in 2023, an increase in cash used of $51.8 million. The increase in cash used is primarily due to incremental common stock repurchases of $49.7 million in 2024 compared to 2023. Refer to Note 13 to our Consolidated Financial Statements for additional information.
Cash Flows From Discontinued Operations
There was no cash provided by discontinued operations in 2024 compared to $468.1 million in 2023, a decrease in cash provided of $468.1 million. The decrease in cash provided by discontinued operations is primarily due to the $425.2 million repayment of principal on its Seller Note Credit Agreement on October 19, 2023 and the completion of the sale of the Snack Bars Business on September 29, 2023, which resulted in a non-recurring cash inflow of $58.7 million from the buyer. Refer to Note 7 to our Consolidated Financial Statements for additional information.
Debt Obligations
As of December 31, 2024, $467.7 million of the aggregate commitment of $500.0 million of the Revolving Credit Facility was available. Under the Second Amended and Restated Credit Agreement (the "Credit Agreement"), the Revolving Credit Facility matured on March 26, 2026. In addition, as of December 31, 2024, there were $32.3 million in letters of credit under the Revolving Credit Facility that were issued but undrawn. On January 17, 2025, the Company entered into the Third Amended and Restated Credit Agreement, dated as of January 17, 2025, among the Company, the lenders from time to time party thereto and Bank of America, N.A., as Administrative Agent, Swing Line Lender and L/C Issuer (the “New Credit Agreement”) The New Credit Agreement amends, restates and replaces the Credit Agreement. Pursuant to the New Credit Agreement, the Company (i) continued and extended the maturity of the Revolving Facility and the Term Loans, (ii) decreased the aggregate size of the Term A Loan to $480.0 million and (iii) decreased the aggregate size of the Tranche A-1 Term Loan to $425.0 million. Refer to Note 12 to our Consolidated Financial Statements for additional information.
Our long-term debt outstanding, including the current portion, was $1,409.1 million at December 31, 2024 and $1,405.6 million at December 31, 2023, an increase of $3.5 million. This increase was primarily due to an increase of finance lease obligations by $3.5 million during the year ended December 31, 2024.
At December 31, 2024, we had $316.4 million outstanding under Term Loan A, $588.6 million outstanding under Term Loan A-1, $500.0 million of the 2028 Notes outstanding, and $4.1 million of finance lease obligations.
The Company has long-term interest rate swap agreements to fix the interest rate base in order to mitigate the Company's exposure to interest rate risk. As of December 31, 2024, we have an outstanding variable-rate debt balance of $905.0 million, and our interest rate swap agreements have a notional value of $1,750.0 million. Under the terms of the agreements, $875.0 million of interest rate swaps mature on February 28, 2025. Following the maturity of those interest rate swaps, the remaining $875.0 million of interest rate swaps become effective February 28, 2025 and mature on February 29, 2028. As a result, our variable-rate debt is nearly fully hedged with our fixed rate interest rate swaps through 2028.
The Credit Agreement contained various financial and restrictive covenants and required that the Company maintain a consolidated net leverage ratio of no greater than 4.50 to 1.0, and our debt obligations contain customary representations and events of default. We are in compliance with all applicable debt covenants as of December 31, 2024.
See Note 12 to our Consolidated Financial Statements for information on our debt obligations.
Guarantor Summarized Financial Information
The 2028 Notes issued by TreeHouse Foods, Inc. are fully and unconditionally, as well as jointly and severally, guaranteed by our directly and indirectly owned domestic subsidiaries, which are collectively known as the "Guarantor Subsidiaries." The guarantees of the Guarantor Subsidiaries are subject to release in limited circumstances, only upon the occurrence of certain customary conditions. There are no significant restrictions on the ability of the parent company or any guarantor to obtain funds from its subsidiaries by dividend or loan.
The following tables present summarized financial information of TreeHouse Foods, Inc. and the Guarantor Subsidiaries on a combined basis. The combined summarized financial information eliminates intercompany balances and transactions among TreeHouse Foods, Inc. and the Guarantor Subsidiaries and equity in earnings and investments in any Guarantor Subsidiaries or Non-Guarantor Subsidiaries. The summarized financial information is provided in accordance with the reporting requirements of Rule 13-01 under SEC Regulation S-X for the issuer and Guarantor Subsidiaries.
| | | | | |
| | TreeHouse Foods, Inc. and Guarantor Subsidiaries |
| Summarized Statement of Operations | Year Ended December 31, 2024 |
| | (In millions) |
| Net sales | $ | 3,274.7 | |
| Gross profit (1) | 522.7 | |
| |
| |
| Net income | 32.5 | |
| | | | | | |
| | TreeHouse Foods, Inc. and Guarantor Subsidiaries | |
| Summarized Balance Sheet | December 31, 2024 | |
| | (In millions) | |
| Current assets | $ | 926.8 | | |
| Noncurrent assets | 2,782.9 | | |
| Current liabilities | 676.5 | | |
| Noncurrent liabilities (2) | 1,629.9 | | |
(1)During the year ended December 31, 2024, TreeHouse Foods, Inc. and Guarantor Subsidiaries recorded $94.1 million of net sales to the Non-Guarantor Subsidiaries and $288.7 million of purchases from the Non-Guarantor Subsidiaries.
(2)Includes an amount due from Non-Guarantor Subsidiaries of $20.3 million as of December 31, 2024.
Cash Requirements
Our cash requirements within the next twelve months include working capital requirements, interest payments, and capital expenditures. We believe our current cash balances, strong cash flows, and our available sources of liquidity and capital, including a $500.0 million Revolving Credit Facility, as well as possible future sources of liquidity and capital will be sufficient to meet these twelve month and long-term cash requirements and capital expenditures.
Our cash requirements under our various contractual obligations and commitments include:
•Debt obligations and interest payments – See Note 12 to our Consolidated Financial Statements for information on our debt obligations and the timing of future principal. Estimated future interest payments on the Company’s debt are expected to be $180.3 million (with $73.8 million expected in 2025) based on the interest rates at December 31, 2024. Additionally, the Company has entered into interest rate swap agreements to lock into a fixed Term SOFR interest rate base. See Note 20 to our Consolidated Financial Statements for information on our interest rate swap agreements and the future obligations.
•Operating and finance lease obligations – See Note 4 to our Consolidated Financial Statements for information on our operating and finance lease obligations and the amount and timing of future payments.
•Purchase obligations – Purchase obligations primarily represent commitments to purchase minimum quantities of raw materials used in our production processes. We enter into these contracts from time to time in an effort to ensure a sufficient supply of raw ingredients. In addition, we have contractual obligations to purchase various services that are a part of our production process. Minimum amounts committed to as of December 31, 2024 were $462.5 million (with $450.1 million due in 2025).
•Pension and other postretirement benefit obligations – Future payments related to pension and postretirement benefits are estimated by an actuarial valuation. See Note 17 to our Consolidated Financial Statements for information on our pension and postretirement benefit obligations and the amount and timing of future payments.
•Exit or disposal cost obligations – See Note 3 to our Consolidated Financial Statements for information on our exit or disposal cost obligations and the amount and timing of future payments. Our exit or disposal cost obligations primarily consist of severance obligations.
•Unrecognized tax benefits – See Note 11 to our Consolidated Financial Statements for information on our unrecognized tax benefits and the amount and timing of future payments.
•Acquisition – See Note 7 to our Consolidated Financial Statements for information on our acquisition of certain subsidiaries that operate the private brand tea business of Harris Freeman & Co, Inc. ("Harris Tea").
•Other liabilities – Other liabilities include obligations associated with certain employee benefit programs, employee health care, workers' compensation claims, other casualty losses, in addition to contingent liabilities related to the ordinary course of litigation and investigation, and various other long-term liabilities, all of which have some inherent uncertainty as to the amount and timing of payments and were reflected on our Consolidated Balance Sheet as of December 31, 2024. See Note 19 to our Consolidated Financial Statements for more information about the Company’s commitments and contingent obligations.
Capital Expenditures
We continue to make investments in property, plant, and equipment and software for our business offices, manufacturing, and distribution facilities. This includes planned capital expenditure commitments at our Princeton, Kentucky cracker manufacturing facility for capacity expansion and safety advancements. Our preliminary estimate of capital expenditures for 2025 is approximately $125 million. Our capital expenditures were $139.7 million and $140.8 million for the years ended December 31, 2024 and 2023, respectively.
Our capital plan includes investment in climate-related projects in order to achieve our broader environmental goals. These climate-related projects are for investments in energy and water efficiency as well as waste reduction initiatives. Our investments are expected to be approximately $7 million in 2025.
Critical Accounting Estimates
Critical accounting estimates are defined as those most important to the portrayal of a company’s financial condition and results, and require the most difficult, subjective, or complex judgments. In many cases, the accounting treatment of a particular transaction is specifically dictated by GAAP with no need for the application of our judgment. In certain circumstances, however, the preparation of the Consolidated Financial Statements in conformity with GAAP requires us to use our judgment to make certain estimates and assumptions. These estimates affect the reported amounts of assets and liabilities and disclosures of contingent assets and liabilities at the date of the Consolidated Financial Statements and the reported amounts of net sales and expenses during the reporting period. We have identified the estimates described below as our critical accounting estimates. See Note 1 to the Consolidated Financial Statements for a detailed discussion of significant accounting policies.
Trade Allowances — We maintain an allowance for customer promotional programs, marketing co-op programs, and other sales and marketing expenses. These customer promotional programs are generally more significant for branded products compared to the majority of our private label products. This allowance is based on a combination of historical average program activity and specific customer program accruals, and can fluctuate due to the level of sales and marketing programs, and timing of deductions. The recognition of these costs therefore requires management judgment regarding the volume of promotional offers that will be redeemed by the customer. These estimates are made using various techniques including historical data on performance of similar promotional programs. Differences between estimated expense and actual redemptions are immaterial and recognized as a change in management estimate in a subsequent period. This allowance was $17.3 million and $20.2 million at December 31, 2024 and 2023, respectively.
Long-Lived Assets — We evaluate property, plant, and equipment, operating lease right-of-use assets, and finite lived intangible assets for impairment when circumstances indicate that their carrying values may not be recoverable (a "triggering event"). Indicators of impairment include deteriorations in operating cash flows, the anticipated sale or disposal of an asset group, and other significant changes in business conditions. Undiscounted cash flow analyses are used to determine if impairment exists. We utilize current cash flow information and expected growth rates related to the asset group from our internal projections and operating plans. If the carrying values of asset groups are determined not to be recoverable, the impairment loss is calculated based on estimated fair value. Impairment charges are measured by comparing the carrying values of the asset groups to their estimated fair values. The fair value of these assets is based on expected future discounted cash flows using Level 3 inputs. Long-lived assets held for sale are reported at the lower of the carrying amount or fair value less the cost to sell.
During the second quarter of 2024, as a result of forecasted cash flow losses, the Company made the decision to exit the RTD business. As a result, the Company performed a recoverability assessment over the RTD asset group in the second quarter of 2024, which indicated that the asset group was not recoverable, and we were required to determine the fair value of the business. Our fair value assessment indicated that the carrying value was in excess of the fair value, and an impairment of $19.3 million of Property, plant, and equipment, net was recognized in our RTD beverages asset group.
Additionally, as the Company continued to execute upon integration activities associated with the Coffee Roasting Capability acquisition, the Company exited a distribution center in Grand Prairie, Texas during the third quarter of 2024. As a result of this distribution center exit, an impairment of $0.9 million of Operating lease right-of-use assets was recognized in our Grand Prairie asset group in the third quarter of 2024.
Further, as a result of the Dallas plant closure in the fourth quarter of 2023, the Company performed a recoverability assessment on the Dallas facility asset group, which indicated that the asset group was not recoverable. Our fair value assessment indicated that the carrying value was in excess of the fair value, and an impairment of $4.7 million within Property, plant, and equipment, net was recognized.
Gain or Loss on Disposal of a Business — On September 29, 2023, the Company completed the sale of its Snack Bars business to John B. Sanfilippo & Son, Inc. for approximately $58.7 million in cash. The Company classified the proceeds within Net cash provided by investing activities - discontinued operations. The Company recognized a gain on disposal of $1.1 million during the year ended December 31, 2023. The gain on disposal is recognized within Net loss from discontinued operations in the Company's Consolidated Statements of Operations. The gain on disposal was calculated as the difference between the fair value of the disposal group and the carrying value of the associated assets. The fair value was determined based on the consideration transferred less costs to sell.
Purchase Price Allocation — We record acquisitions using the acquisition method of accounting. All of the assets acquired and liabilities assumed are recorded at fair value as of the acquisition date. In a business combination, the difference between the purchase price and the estimated fair values of the identifiable net assets acquired is either recorded as goodwill or as a bargain purchase gain. The application of the purchase method of accounting for business combinations requires management to make significant estimates and assumptions in the determination of the fair value of assets acquired and liabilities assumed, in order to properly allocate purchase price consideration between assets that are depreciated and amortized from goodwill. The fair value assigned to tangible and intangible assets acquired and liabilities assumed are based on management’s estimates and assumptions, as well as other information compiled by management, including valuations that utilize customary valuation procedures and techniques. Significant assumptions and estimates include, but are not limited to, the cash flows that an asset is expected to generate in the future, the appropriate weighted-average cost of capital, and the cost savings expected to be derived from acquiring an asset. If the actual results differ from the estimates and judgments used in these estimates, the amounts recorded in the financial statements may be exposed to potential impairment of the intangible assets and goodwill, as discussed in the Goodwill and Indefinite Lived Intangible Assets critical accounting estimates section.
Goodwill and Indefinite Lived Intangible Assets — Goodwill and indefinite lived intangible assets totaled $1,825.3 million and $1,830.7 million as of December 31, 2024 and 2023, respectively, resulting primarily from acquisitions. Upon acquisition, the purchase price is first allocated to identifiable assets and liabilities, including but not limited to inventory, accounts payable, trademarks, and customer-related intangible assets, with any remaining purchase price recorded as goodwill. Goodwill and indefinite lived trademarks are not amortized.
The Company has one reporting unit within its single reportable and operating segment. The Company completed its annual goodwill and indefinite lived intangible asset impairment analysis as of December 31, 2024. Our assessment did not result in an impairment. Our analysis employed the use of an income approach, corroborated by the market approach. The Company believes the income approach is the most reliable indicator of the fair value of the reporting unit. Significant assumptions used in the income approach include growth and discount rates, margins, and the Company’s weighted average cost of capital. We used historical performance and management estimates of future performance to determine margins and growth rates. The income approach utilizes projected cash flow estimates developed by the Company to determine fair value, which are unobservable, Level 3 inputs. Unobservable inputs are used to measure fair value to the extent that relevant observable inputs are not available. The Company developed our estimates using the best information available at the time. Discount rates selected for the reporting unit approximated the total Company discount rate. Our weighted average cost of capital included a review and assessment of market and capital structure assumptions. The Company's single reporting unit has a fair value that the Company considers to be substantially in excess of its carrying values. Therefore, we believe that only significant changes in the assumptions would result in an impairment of goodwill. Considerable management judgment is necessary to evaluate the impact of operating changes and to estimate future cash flows. Assumptions used, such as forecasted growth rates and our cost of capital, are consistent with our internal projections and operating plans. Changes in our estimates or any of our other assumptions used in our analysis could result in a different conclusion.
We reviewed our indefinite lived intangible assets, which consist of trademarks totaling $6.0 million as of December 31, 2024, using the relief from royalty method. Significant assumptions include the royalty rates, growth, margins, and discount rates. Our assumptions were based on historical performance and management estimates of future performance, as well as available data on licenses of similar products. The Company’s policy is that indefinite lived assets must have a history of strong sales and cash flow performance that we expect to continue for the foreseeable future. When these criteria are no longer met, the Company changes the classification. Considerable management judgment is necessary to evaluate the impact of operating changes and to estimate future cash flows. Changes in our estimates or any of our other assumptions used in our analysis could result in a different conclusion. Our testing of our trademarks indicated that the implied fair value was significantly in excess of the carrying values. The fair values of our trademarks exceed book value by a minimum of 82% as of December 31, 2024. Therefore, we believe that only significant changes in the assumptions would result in an impairment of any trademark.
Income Taxes — Deferred taxes are recognized for future tax effects of temporary differences between financial and income tax reporting using tax rates in effect for the years in which the differences are expected to reverse. We periodically estimate our probable tax obligations using historical experience in tax jurisdictions and informed judgments. There are inherent uncertainties related to the interpretations of tax regulations in the jurisdictions in which we operate. These judgments and estimates made at a point in time may change based on the outcome of tax audits and changes to, or further interpretations of, regulations. If such changes take place, there is a risk that our tax rate may increase or decrease in any period, which would impact our earnings. Future business results may affect deferred tax liabilities or the valuation of deferred tax assets over time.
Employee Benefit Plan Costs — We provide a range of benefits to our employees, including pension and postretirement benefits to our eligible employees and retirees. We record annual amounts relating to these plans based on calculations specified by GAAP, which include various actuarial assumptions, such as discount rates, assumed investment rates of return, compensation increases, employee turnover rates, and health care cost trend rates. We review our actuarial assumptions on an annual basis and make modifications to the assumptions based on current rates and trends when appropriate. As required by GAAP, the effect of such modifications is generally deferred and subsequently amortized over future periods. Different assumptions that we make could result in the recognition of different amounts of expense over different periods.
While a number of the key assumptions related to our qualified pension plans are long-term in nature, including assumed investment rates of return, compensation increases, employee turnover rates, and mortality rates, GAAP requires that our discount rate assumption be more heavily weighted to current market conditions. As such, our discount rates will likely change frequently. We used a discount rate for each plan to determine our estimated future benefit obligations, and our weighted average discount rate was 5.61% at December 31, 2024. If the discount rate of each plan were one percent higher, the pension plan liability would have been approximately 8.0%, or $15.9 million, lower as of December 31, 2024. If the discount rate of each plan were one percent lower, the pension plan liability would have been approximately 9.3%, or $18.6 million, higher as of December 31, 2024. The projected benefit obligation was $199.5 million and $216.9 million at December 31, 2024 and 2023, respectively, for our pension benefit plans. The projected benefit obligation was $14.4 million and $15.1 million at December 31, 2024 and 2023, respectively, for our postretirement benefit plans.
See Note 17 to our Consolidated Financial Statements for more information regarding our employee pension and retirement benefit plans.
Recent Accounting Pronouncements
Information regarding recent accounting pronouncements is provided in Note 2 to the Consolidated Financial Statements.
Non-GAAP Measures
We have included in this report measures of financial performance that are not defined by GAAP ("Non-GAAP”). A Non-GAAP financial measure is a numerical measure of financial performance that excludes or includes amounts so as to be different than the most directly comparable measure calculated and presented in accordance with GAAP in the Company’s Consolidated Financial Statements. We believe these measures provide useful information to the users of the financial statements as we also have included these measures in other communications and publications.
For each of these Non-GAAP financial measures, we provide a reconciliation between the Non-GAAP measure and the most directly comparable GAAP measure, an explanation of why management believes the Non-GAAP measure provides useful information to financial statement users, and any additional purposes for which management uses the Non-GAAP measure. This Non-GAAP financial information is provided as additional information for the financial statement users and is not in accordance with, or an alternative to, GAAP. These Non-GAAP measures may be different from similar measures used by other companies.
Organic Net Sales
Organic net sales is defined as net sales excluding the impacts of business acquisitions, divestitures, and foreign currency. This information is provided in order to allow investors to make meaningful comparisons of the Company's sales between periods and to view the Company's business from the same perspective as Company management. The following table reconciles the Company's 2024 net sales as presented in the Consolidated Statements of Operations to organic net sales.
| | | | | | | | |
| | Dollars |
| | (In millions) |
| 2024 Net sales | | $ | 3,354.0 | |
| Business acquisitions | | (57.9) | |
| Foreign currency | | 1.4 | |
| 2024 Organic net sales | | $ | 3,297.5 | |
EBITDA from Continuing Operations, EBITDA from Continuing Operations Margin, Adjusted EBITDA from Continuing Operations, and Adjusted EBITDA from Continuing Operations Margin, Adjusting for Certain Items Affecting Comparability
EBITDA from continuing operations margin is defined as EBITDA from continuing operations as a percentage of net sales. Adjusted EBITDA from continuing operations margin is defined as adjusted EBITDA from continuing operations as a percentage of adjusted net sales. EBITDA from continuing operations represents net income from continuing operations before interest expense, interest income, income tax expense, and depreciation and amortization expense. Adjusted EBITDA from continuing operations reflects adjustments to EBITDA from continuing operations to identify items that, in management’s judgment, significantly affect the assessment of earnings results between periods. This information is provided in order to allow investors to make meaningful comparisons of the Company’s earnings performance between periods and to view the Company’s business from the same perspective as Company management. As the Company cannot predict the timing and amount of charges that include, but are not limited to, items such as product recalls and related costs, growth, reinvestment, and restructuring programs, acquisition, integration, divestiture, and related costs, impairment of assets, foreign currency exchange impact on the re-measurement of intercompany notes, mark-to-market adjustments on derivative contracts, and other items that may arise from time to time that would impact comparability, management does not consider these costs when evaluating the Company’s performance, when making decisions regarding the allocation of resources, in determining incentive compensation, or in determining earnings estimates. EBITDA from continuing operations, and adjusted EBITDA from continuing operations are performance measures commonly used by management to assess operating performance and incentive compensation, and the Company believes they are commonly reported and widely used by investors and other interested parties as a measure of a company’s operating performance between periods and as a component of our debt covenant calculations.
Adjusted Net Sales, Adjusted Cost of Sales, Adjusted Gross Profit, Adjusted Total Operating Expenses, Adjusted Operating Income, Adjusted Total Other Expense, Adjusted Income Tax Expense, Adjusted Net Income from Continuing Operations, and Adjusted Diluted Earnings Per Share from Continuing Operations, Adjusting for Certain Items Affecting Comparability
Adjusted net sales, adjusted cost of sales, adjusted gross profit, adjusted total operating expenses, adjusted operating income, adjusted total other expense, adjusted income tax expense, and adjusted net income from continuing operations represent their respective GAAP presentation line item adjusted for items such as product recalls and related costs, growth, reinvestment, and restructuring programs, acquisition, integration, divestiture, and related costs, impairment of assets, foreign currency exchange impact on the re-measurement of intercompany notes, mark-to-market adjustments on derivative contracts, and other items that may arise from time to time that would impact comparability. Management does not consider these costs when evaluating the Company’s performance, when making decisions regarding the allocation of resources, in determining incentive compensation, or in determining earnings estimates. This information is provided in order to allow investors to make meaningful comparisons of the Company’s earnings performance between periods and to view the Company’s business from the same perspective as Company management. The Company has presented each of these adjusted Non-GAAP measures as a percentage of adjusted net sales compared to its respective reported GAAP presentation line item as a percentage of net sales. Adjusted diluted earnings per share from continuing operations ("Adjusted diluted EPS") is determined by dividing adjusted net income from continuing operations by the weighted average diluted common shares outstanding. Adjusted diluted EPS reflects adjustments to GAAP earnings (loss) per diluted share to identify items that, in management's judgment, significantly affect the assessment of earnings results between periods.
The following table reconciles the Company's net income from continuing operations as presented in the Consolidated Statements of Operations, the relevant GAAP measure, to EBITDA from continuing operations and Adjusted EBITDA from continuing operations for the years ended December 31, 2024 and 2023:
| | | | | | | | | | | | | | | | | | | | |
| | Year Ended December 31, |
| | 2024 | | | | 2023 | | | | |
| | (unaudited, in millions) |
| Net income from continuing operations (GAAP) | | $ | 26.9 | | | | | $ | 59.0 | | | | | |
| Interest expense | | 63.4 | | | | | 74.8 | | | | | |
| Interest income | | (4.2) | | | | | (40.1) | | | | | |
| Income tax expense | | 6.2 | | | | | 24.4 | | | | | |
| Depreciation and amortization | | 147.1 | | | | | 141.9 | | | | | |
| EBITDA from continuing operations (Non-GAAP) | | 239.4 | | | | | 260.0 | | | | | |
Product recalls and related costs(1) | | 41.1 | | | | | 29.2 | | | | | |
Growth, reinvestment, restructuring programs & other, excluding accelerated depreciation(2) | | 28.4 | | | | | 46.1 | | | | | |
Impairment(3) | | 19.3 | | | | | — | | | | | |
Acquisition, integration, divestiture, and related costs(4) | | 8.9 | | | | | 16.7 | | | | | |
Foreign currency loss (gain) on remeasurement of intercompany notes(5) | | 7.0 | | | | | (1.7) | | | | | |
Mark-to-market adjustments(6) | | (6.7) | | | | | 15.1 | | | | | |
Shareholder activism(7) | | — | | | | | 0.3 | | | | | |
Tax indemnification(8) | | — | | | | | 0.2 | | | | | |
| | | | | | | | | | |
| | | | | | | | | | |
| | | | | | | | | | |
| | | | | | | | | | |
| Adjusted EBITDA from continuing operations (Non-GAAP) | | $ | 337.4 | | | | | $ | 365.9 | | | | | |
| | | | | | | | | | |
| % of net sales | | | | | | | | | | |
| Net income from continuing operations margin | | 0.8 | % | | | | 1.7 | % | | | | |
| EBITDA from continuing operations margin | | 7.1 | % | | | | 7.6 | % | | | | |
| | | | | | | | | | |
| % of adjusted net sales | | | | | | | | | | |
| Adjusted EBITDA from continuing operations margin | | 10.0 | % | | | | 10.7 | % | | | | |
| | | | | |
| (1) | Griddle Recall and Related Costs
On October 18, 2024, the Company initiated a voluntary recall of certain frozen waffle products produced at its Brantford, Ontario, Canada facility, and on October 22, 2024, the Company expanded its voluntary recall to include all products manufactured at the Brantford facility that are still within their shelf-life. For the year ended December 31, 2024, the Company recognized incremental charges of $36.6 million, which includes $21.0 million for product returns, non-cash inventory write-offs of $7.4 million, plant shutdown charges of $6.5 million, and other costs, including logistics, of $1.7 million.
Broth Recall and Related Costs
On September 22, 2023, the Company initiated a voluntary recall of certain broth products produced at its Cambridge, Maryland facility. Since the voluntary recall, the Company executed a turnaround plan to restore the facility operations. As a result of these restoration activities, for the year ended December 31, 2024, the Company incurred incremental costs (benefits) of $4.5 million, which included plant shutdown charges of $8.9 million, other costs, including product returns and logistics of $4.2 million, non-cash inventory write-offs of $1.4 million, and an insurance recovery of $(10.0) million. For the year ended December 31, 2023, the Company incurred incremental costs related to the product recall of $27.0 million, which include plant shutdown charges of $12.5 million, non-cash inventory write-offs of $10.4 million, and other costs, including product returns and logistics, of $4.1 million. Additionally, the Company recognized a non-cash inventory write-off of $2.2 million for a packaging quality matter for the year ended December 31, 2023. |
| |
| Refer to Note 19 of the Consolidated Financial Statements for additional information. |
| |
| | | | | |
| (2) | The Company’s growth, reinvestment, and restructuring activities are part of an enterprise-wide transformation to improve long-term growth and profitability for the Company. During 2024, the Company recognized $0.2 million of accelerated depreciation within the Company's growth, reinvestment, and restructuring activities as depreciation expense. |
| |
| Refer to Note 3 of the Consolidated Financial Statements for additional information. |
| |
| (3) | During the second quarter of 2024, the Company incurred $19.3 million of non-cash impairment charges related to property, plant, and equipment. The impairment is due to forecasted cash flow losses in the Ready-to-drink beverages business resulting in a decision to exit this business. |
| |
| Refer to Note 8 of the Consolidated Financial Statements for additional information. |
| |
| (4) | Acquisition, integration, divestiture, and related costs represent costs associated with completed and potential acquisitions, the related integration of the acquisitions, completed and potential divestitures, and gains or losses on the divestiture of a business. During the year ended December 31, 2024, $6.7 million were classified in General and administrative, $2.0 million were classified in Cost of sales, and $0.2 million were classified in Other operating expense, net. During the year ended December 31, 2023, $15.0 million were classified in General and administrative, $0.8 million were classified in Cost of sales, and $0.9 million were classified in Other operating expense, net. |
| |
| Refer to Note 7 to our Consolidated Financial Statements for additional information. |
| |
| (5) | The Company has foreign currency denominated intercompany loans and incurred foreign currency gains/losses to re-measure the loans at quarter end. These amounts are non-cash and the loans are eliminated in consolidation. |
| |
| (6) | The Company's derivative contracts are marked-to-market each period. The non-cash unrealized changes in fair value recognized in Other expense (income), net, within the Consolidated Statements of Operations are treated as Non-GAAP adjustments. As the contracts are settled, realized gains and losses are recognized, and only the mark-to-market impacts are treated as Non-GAAP adjustments. |
| |
| Refer to Note 20 to our Consolidated Financial Statements for additional information. |
| |
| (7) | The Company incurred fees related to shareholder activism which include directly applicable third-party advisory and professional service fees. |
| |
| (8) | Tax indemnification represents the non-cash write off of indemnification assets that were recorded in connection with acquisitions from prior years. These write-offs arose as a result of the related uncertain tax position being released due to the statute of limitation lapse or settlement with taxing authorities. |
| |
| |
| |
| |
| |
| |
| |
| |
| |
| |
| |
| |
| |
The following tables provide a reconciliation of Adjusted net sales, Adjusted cost of sales, Adjusted gross profit, Adjusted total operating expenses, Adjusted operating income (loss), Adjusted total other expense (income), Adjusted income tax expense (benefit), and Adjusted net income from continuing operations to their most directly comparable GAAP measure, for each of the periods presented:
| | | | | | | | | | | | | | | | | | | | | | | | | | | | | | | | | | | | | | | | | | | | | | | |
| Year Ended December 31, 2024 |
| (Unaudited, in millions, except per share amounts) | Net sales | | Cost of sales | | Gross profit | | Total operating expenses | | Operating income | | Total other expense | | Income tax expense | | Net income from continuing operations |
| As reported (GAAP) | $ | 3,354.0 | | | $ | 2,805.6 | | | $ | 548.4 | | | $ | 445.3 | | | $ | 103.1 | | | $ | 70.0 | | | $ | 6.2 | | | $ | 26.9 | |
| Adjustments: | | | | | | | | | | | | | | | |
Product recalls and related costs(1) | 23.3 | | | (17.8) | | | 41.1 | | | — | | | 41.1 | | | — | | | — | | | 41.1 | |
Growth, reinvestment, restructuring programs & other, including accelerated depreciation(2) | — | | | (1.9) | | | 1.9 | | | (26.7) | | | 28.6 | | | — | | | — | | | 28.6 | |
Impairment(3) | — | | | — | | | — | | | (19.3) | | | 19.3 | | | — | | | — | | | 19.3 | |
Acquisition, integration, divestiture, and related costs(4) | — | | | (2.0) | | | 2.0 | | | (6.9) | | | 8.9 | | | — | | | — | | | 8.9 | |
Foreign currency loss on remeasurement of intercompany notes(5) | — | | | — | | | — | | | — | | | — | | | (7.0) | | | — | | | 7.0 | |
Mark-to-market adjustments(6) | — | | | — | | | — | | | — | | | — | | | 6.7 | | | — | | | (6.7) | |
| | | | | | | | | | | | | | | |
| | | | | | | | | | | | | | | |
| | | | | | | | | | | | | | | |
| | | | | | | | | | | | | | | |
| | | | | | | | | | | | | | | |
| | | | | | | | | | | | | | | |
| | | | | | | | | | | | | | | |
| Taxes on adjusting items | — | | | — | | | — | | | — | | | — | | | — | | | 24.6 | | | (24.6) | |
| As adjusted (Non-GAAP) | $ | 3,377.3 | | | $ | 2,783.9 | | | $ | 593.4 | | | $ | 392.4 | | | $ | 201.0 | | | $ | 69.7 | | | $ | 30.8 | | | $ | 100.5 | |
| | | | | | | | | | | | | | | |
| As reported (% of net sales) | | | | | 16.4 | % | | 13.3 | % | | 3.1 | % | | 2.1 | % | | 0.2 | % | | 0.8 | % |
| As adjusted (% of adjusted net sales) | | | | | 17.6 | % | | 11.6 | % | | 6.0 | % | | 2.1 | % | | 0.9 | % | | 3.0 | % |
| | | | | | | | | | | | | | | |
| Earnings per share from continuing operations: | | | | | | | | | | | | | | | |
| Diluted | | | | | | | | | | | | | | | $ | 0.51 | |
| Adjusted diluted | | | | | | | | | | | | | | | $ | 1.91 | |
| | | | | | | | | | | | | | | |
| Weighted average common shares: | | | | | | | | | | | | | | | |
| Diluted for net income from continuing operations | | | | | | | | | | | | | | | 52.6 |
| Diluted for adjusted net income from continuing operations | | | | | | | | | | | | | | | 52.6 |
| | | | | | | | | | | | | | | | | | | | | | | | | | | | | | | | | | | | | | | | | | | | | | | |
| Year Ended December 31, 2023 |
| (Unaudited, in millions, except per share amounts) | Net sales | | Cost of sales | | Gross profit | | Total operating expenses | | Operating income | | Total other expense | | Income tax expense | | Net income from continuing operations |
| As reported (GAAP) | $ | 3,431.6 | | | $ | 2,855.5 | | | $ | 576.1 | | | $ | 429.2 | | | $ | 146.9 | | | $ | 63.5 | | | $ | 24.4 | | | $ | 59.0 | |
| Adjustments: | | | | | | | | | | | | | | | |
Product recalls and related costs(1) | 1.3 | | | (27.9) | | | 29.2 | | | — | | | 29.2 | | | — | | | — | | | 29.2 | |
Growth, reinvestment, restructuring programs & other(2) | — | | | — | | | — | | | (46.1) | | | 46.1 | | | — | | | — | | | 46.1 | |
Acquisition, integration, divestiture, and related costs(4) | — | | | (0.8) | | | 0.8 | | | (15.9) | | | 16.7 | | | — | | | — | | | 16.7 | |
Foreign currency gain on remeasurement of intercompany notes(5) | — | | | — | | | — | | | — | | | — | | | 1.7 | | | — | | | (1.7) | |
Mark-to-market adjustments(6) | — | | | — | | | — | | | — | | | — | | | (15.1) | | | — | | | 15.1 | |
Shareholder activism(7) | — | | | — | | | — | | | (0.3) | | | 0.3 | | | — | | | — | | | 0.3 | |
Tax indemnification(8) | — | | | — | | | — | | | — | | | — | | | (0.2) | | | — | | | 0.2 | |
| | | | | | | | | | | | | | | |
| | | | | | | | | | | | | | | |
| | | | | | | | | | | | | | | |
| | | | | | | | | | | | | | | |
| | | | | | | | | | | | | | | |
| Taxes on adjusting items | — | | | — | | | — | | | — | | | — | | | — | | | 25.7 | | | (25.7) | |
| As adjusted (Non-GAAP) | $ | 3,432.9 | | | $ | 2,826.8 | | | $ | 606.1 | | | $ | 366.9 | | | $ | 239.2 | | | $ | 49.9 | | | $ | 50.1 | | | $ | 139.2 | |
| | | | | | | | | | | | | | | |
| As reported (% of net sales) | | | | | 16.8 | % | | 12.5 | % | | 4.3 | % | | 1.9 | % | | 0.7 | % | | 1.7 | % |
| As adjusted (% of adjusted net sales) | | | | | 17.7 | % | | 10.7 | % | | 7.0 | % | | 1.5 | % | | 1.5 | % | | 4.1 | % |
| | | | | | | | | | | | | | | |
| Earnings per share from continuing operations: | | | | | | | | | | | | | | | |
| Diluted | | | | | | | | | | | | | | | $ | 1.05 | |
| Adjusted diluted | | | | | | | | | | | | | | | $ | 2.47 | |
| | | | | | | | | | | | | | | |
| Weighted average common shares: | | | | | | | | | | | | | | | |
| Diluted for net income from continuing operations | | | | | | | | | | | | | | | 56.4 |
| Diluted for adjusted net income from continuing operations | | | | | | | | | | | | | | | 56.4 |
Free Cash Flow From Continuing Operations
In addition to measuring our cash flow generation and usage based upon the operating, investing, and financing classifications included in the Consolidated Statements of Cash Flows, we also measure free cash flow from continuing operations (a Non-GAAP measure) which represents net cash provided by operating activities from continuing operations less capital expenditures. We believe free cash flow is an important measure of operating performance because it provides management and investors a measure of cash generated from operations that is available for mandatory payment obligations and investment opportunities such as funding acquisitions, repaying debt, repurchasing public debt, and repurchasing our common stock.
The following table reconciles cash flow provided by operating activities from continuing operations (a GAAP measure) to our free cash flow from continuing operations (a Non-GAAP measure): | | | | | | | | | | | | | |
| | Year Ended December 31, |
| | 2024 | | 2023 | | |
| | (In millions) |
| Cash flow provided by operating activities from continuing operations | $ | 265.8 | | | $ | 157.3 | | | |
| Less: Capital expenditures | (139.7) | | | (140.8) | | | |
| Free cash flow from continuing operations | $ | 126.1 | | | $ | 16.5 | | | |
Item 7A. Quantitative and Qualitative Disclosures About Market Risk
Interest Rate Risk
Our exposure to market risk for changes in interest rates relates primarily to the amount of interest expense we expect to pay with respect to our Credit Agreement, which is tied to variable market rates including SOFR and prime interest rates.
The Company has entered into long-term interest rate swap agreements to mitigate its variable rate debt exposures that have a notional amount of $1,750.0 million as of December 31, 2024 and $1,175.0 million as of December 31, 2023. Under the terms of the agreements, the weighted average fixed interest rate base for the $875.0 million of interest rate swaps maturing on February 28, 2025 is approximately 2.91%, and for the $875.0 million of interest rate swaps effective February 28, 2025 through February 29, 2028, is approximately 3.69%. Based on the weighted average rates, when using the one month SOFR rate as of December 31, 2024 and potential changes to credit spreads due to changes in our covenant leverage ratio, the cost of borrowings under the credit facility with the interest rate swaps would range from 4.32% to 4.82% during the life of the swap agreements.
Our variable-rate debt is nearly fully hedged by our fixed rate interest rate swaps as of December 31, 2024. Based on our outstanding variable-rate debt balance of $905.0 million under the Credit Agreement at December 31, 2024, and by including the impact of $875.0 million in effective interest rate swap agreements, each 1% rise in interest rates would increase our annual interest expense by approximately $0.3 million ($9.1 million excluding the $875.0 million in interest rate swap agreements).
Commodity Price Risk
Certain commodities we use in the production and distribution of our products are exposed to market price risk. To manage that risk, we utilize derivative contracts, the majority of which qualify for the normal purchases and normal sales scope exception and are not recorded on the Consolidated Balance Sheets. There can be no assurance that our forward purchasing programs will result in the optimal price. To evaluate the market price risk of these contracts, we prepare a sensitivity analysis to quantify the Company’s potential exposure to commodity price risk with respect to our derivative portfolio. Based on our analysis, a 10% change in commodity prices would impact the fair value of the portfolio by $40.7 million. We do not utilize financial instruments for trading purposes.
The costs of raw materials, packaging materials, fuel, and energy have varied widely in recent years, and future changes in such
costs may cause our results of operations and our operating margins to fluctuate significantly. When comparing 2024 to 2023, raw materials prices were mixed in terms of inflation and deflation. Raw materials with price decreases included, but were but not limited to, wheat, soybean oil, palm oil, and corn. However, raw materials with price increases included, but were not limited to, sugar, cocoa, and cucumbers.
Our raw materials consist of ingredients and packaging materials. Principal ingredients used in our operations include casein, cheese, cocoa, coconut oil, coffee, corn and corn syrup, cucumbers, eggs, fruit, non-fat dry milk, oats, palm oil, peppers, soybean oil, sugar, tea, and wheat. The cost of raw materials used in our products fluctuate due to weather conditions, climate change, regulations, fuel prices, energy costs, labor shortages, labor disputes, freight transportation delays or availability, disruption in logistics, political unrest, industry, general U.S. and global economic conditions, or other unforeseen circumstances. The most important packaging materials and supplies used in our operations are cartons, composite cans, corrugated containers, glass, metal cans, metal closures, and plastics. Ingredients and most packaging materials are generally purchased under long-term supply contracts. We believe these ingredients and packaging materials are generally available from a number of suppliers, although supply chain disruptions experienced in recent years challenged and delayed timing of availability from our suppliers. However, our service has improved in part as a result of supply chains stabilizing. Volatility in the cost of our raw materials and packaging supplies can adversely affect our performance, as price changes often lag behind changes in costs, and we are not always able to adjust our pricing to reflect changes in raw material and supply costs.
Competitive pressures also may limit our ability to quickly raise prices in response to increased raw materials, packaging, fuel, and energy costs. Accordingly, if we are unable to increase our prices to offset increasing costs, our operating profits and margins could be materially affected. In addition, in instances of declining input costs, customers may seek price reductions in situations where we are locked into pricing at higher costs.
Foreign Currency Exchange Rate Risk
The Company is exposed to foreign currency exchange rate risk as a result of our Canadian subsidiaries, where the functional currency is the Canadian dollar. The Company periodically enters into foreign currency contracts to manage the risk associated with foreign currency cash flows. This includes, but is not limited to, using foreign currency contracts to establish a fixed foreign currency exchange rate for the net cash flow requirements for purchases of inventory, sales of finished goods, and future settlement of foreign-denominated assets and liabilities. As of December 31, 2024, the Company had no foreign currency contracts outstanding. At December 31, 2024, the impact of a 10% movement in foreign exchange rates would not have a material impact on the Company's consolidated results of operations.
Item 8. Financial Statements and Supplementary Data
The Consolidated Financial Statements for 2024 are included in this report on the following pages:
REPORT OF INDEPENDENT REGISTERED PUBLIC ACCOUNTING FIRM
To the Stockholders and the Board of Directors of TreeHouse Foods, Inc.
Opinion on the Financial Statements
We have audited the accompanying consolidated balance sheets of TreeHouse Foods, Inc. and subsidiaries (the "Company") as of December 31, 2024 and 2023, the related consolidated statements of operations, comprehensive income (loss), stockholders' equity, and cash flows, for each of the three years in the period ended December 31, 2024, and the related notes and the schedule listed in the Index at Item 15 (collectively referred to as the "financial statements"). In our opinion, the financial statements present fairly, in all material respects, the financial position of the Company as of December 31, 2024 and 2023, and the results of its operations and its cash flows for each of the three years in the period ended December 31, 2024, in conformity with accounting principles generally accepted in the United States of America.
We have also audited, in accordance with the standards of the Public Company Accounting Oversight Board (United States) (PCAOB), the Company's internal control over financial reporting as of December 31, 2024, based on criteria established in Internal Control - Integrated Framework (2013) issued by the Committee of Sponsoring Organizations of the Treadway Commission and our report dated February 14, 2025, expressed an unqualified opinion on the Company's internal control over financial reporting.
Basis for Opinion
These financial statements are the responsibility of the Company's management. Our responsibility is to express an opinion on the Company's financial statements based on our audits. We are a public accounting firm registered with the PCAOB and are required to be independent with respect to the Company in accordance with the U.S. federal securities laws and the applicable rules and regulations of the Securities and Exchange Commission and the PCAOB.
We conducted our audits in accordance with the standards of the PCAOB. Those standards require that we plan and perform the audit to obtain reasonable assurance about whether the financial statements are free of material misstatement, whether due to error or fraud. Our audits included performing procedures to assess the risks of material misstatement of the financial statements, whether due to error or fraud, and performing procedures that respond to those risks. Such procedures included examining, on a test basis, evidence regarding the amounts and disclosures in the financial statements. Our audits also included evaluating the accounting principles used and significant estimates made by management, as well as evaluating the overall presentation of the financial statements. We believe that our audits provide a reasonable basis for our opinion.
Critical Audit Matter
The critical audit matter communicated below is a matter arising from the current-period audit of the financial statements that was communicated or required to be communicated to the audit committee and that (1) relates to accounts or disclosures that are material to the financial statements and (2) involved our especially challenging, subjective, or complex judgments. The communication of critical audit matters does not alter in any way our opinion on the financial statements, taken as a whole, and we are not, by communicating the critical audit matter below, providing a separate opinion on the critical audit matter or on the accounts or disclosures to which it relates.
Asset Impairment — Ready-to-drink — Refer to Note 8 to the financial statements
Critical Audit Matter Description
As discussed in Note 8 to the financial statements, the Company performs impairment tests when circumstances indicate that the carrying value of an asset may not be recoverable. During the second quarter of 2024, the Company determined that a recoverability test of the Ready-to-drink ("RTD") asset group was required after its decision to exit the business. The recoverability assessment revealed that the carrying value of the RTD asset group was not recoverable, so the Company was required to determine the fair value of the asset group. The Company’s fair value assessment indicated that the carrying value exceeded the fair value of the RTD asset group and an impairment of $19.3 million was recognized that was allocated to property, plant, and equipment. The impairment charge is included in asset impairment in the consolidated statements of operations.
We identified the valuation of these impaired assets as a critical audit matter because of the significant estimates and assumptions management made to determine the fair value of the personal property assets comprising the RTD asset group. A high degree of auditor judgment was applied in evaluating certain inputs to the fair value measurement of the personal property assets, including the involvement of our fair value specialists and deploying more experienced audit professionals.
How the Critical Audit Matter Was Addressed in the Audit
Our audit procedures related to the valuation of the personal property included the following, among others:
•We tested the effectiveness of the control over management’s review of the recoverability of long-lived assets and the impairment loss measurement.
•With the assistance of our fair value specialists, we evaluated the Company’s methodology for determining the fair value of the personal property assets and the source information and assumptions used by management in the valuation analysis.
•We evaluated the mathematical accuracy of the Company's fair value analysis.
/s/ DELOITTE & TOUCHE LLP
Chicago, Illinois
February 14, 2025
We have served as the Company's auditor since 2005.
TREEHOUSE FOODS, INC.
CONSOLIDATED BALANCE SHEETS
(In millions, except per share data)
| | | | | | | | | | | |
| December 31, 2024 | | December 31, 2023 |
| ASSETS |
| Current assets: | | | |
| Cash and cash equivalents | $ | 289.6 | | | $ | 320.3 | |
| Receivables, net of allowance for credit losses of $0.5 in 2024 and $0.4 in 2023 | 146.8 | | | 175.6 | |
| Inventories | 539.3 | | | 534.0 | |
| Prepaid expenses and other current assets | 34.0 | | | 24.9 | |
| | | |
| | | |
| Total current assets | 1,009.7 | | | 1,054.8 | |
| Property, plant, and equipment, net | 748.6 | | | 737.6 | |
| Operating lease right-of-use assets | 154.4 | | | 193.0 | |
| Goodwill | 1,819.3 | | | 1,824.7 | |
| Intangible assets, net | 212.9 | | | 257.4 | |
| | | |
| Other assets, net | 35.1 | | | 39.1 | |
| Total assets | $ | 3,980.0 | | | $ | 4,106.6 | |
| LIABILITIES AND STOCKHOLDERS' EQUITY |
| Current liabilities: | | | |
| Accounts payable | $ | 602.5 | | | $ | 534.9 | |
| Accrued expenses | 141.3 | | | 169.0 | |
| Current portion of long-term debt | 1.1 | | | 0.4 | |
| | | |
| Total current liabilities | 744.9 | | | 704.3 | |
| Long-term debt | 1,401.3 | | | 1,396.0 | |
| Operating lease liabilities | 125.4 | | | 165.0 | |
| Deferred income taxes | 105.8 | | | 111.4 | |
| Other long-term liabilities | 53.7 | | | 65.1 | |
| Total liabilities | 2,431.1 | | | 2,441.8 | |
| Commitments and contingencies (Note 19) | | | |
| Stockholders’ equity: | | | |
| Preferred stock, par value $0.01 per share, 10.0 shares authorized, none issued | — | | | — | |
| Common stock, par value $0.01 per share, 90.0 shares authorized, 50.2 and 54.1 shares outstanding as of December 31, 2024 and 2023, respectively | 0.6 | | | 0.6 | |
| Treasury stock | (385.4) | | | (234.2) | |
| Additional paid-in capital | 2,238.4 | | | 2,223.4 | |
| Accumulated deficit | (222.0) | | | (248.9) | |
| Accumulated other comprehensive loss | (82.7) | | | (76.1) | |
| Total stockholders’ equity | 1,548.9 | | | 1,664.8 | |
| Total liabilities and stockholders’ equity | $ | 3,980.0 | | | $ | 4,106.6 | |
See Notes to Consolidated Financial Statements.
TREEHOUSE FOODS, INC.
CONSOLIDATED STATEMENTS OF OPERATIONS
(In millions, except per share data)
| | | | | | | | | | | | | | | | | |
| | Year Ended December 31, |
| | 2024 | | 2023 | | 2022 |
| Net sales | $ | 3,354.0 | | | $ | 3,431.6 | | | $ | 3,297.1 | |
| Cost of sales | 2,805.6 | | | 2,855.5 | | | 2,774.7 | |
| Gross profit | 548.4 | | | 576.1 | | | 522.4 | |
| Operating expenses: | | | | | |
| Selling and distribution | 153.3 | | | 171.6 | | | 217.8 | |
| General and administrative | 198.0 | | | 204.1 | | | 206.5 | |
| Amortization expense | 48.6 | | | 48.2 | | | 47.9 | |
| Asset impairment | 19.3 | | | — | | | — | |
| Other operating expense, net | 26.1 | | | 5.3 | | | 62.8 | |
| Total operating expenses | 445.3 | | | 429.2 | | | 535.0 | |
| Operating income (loss) | 103.1 | | | 146.9 | | | (12.6) | |
| Other expense (income): | | | | | |
| Interest expense | 63.4 | | | 74.8 | | | 69.9 | |
| Interest income | (4.2) | | | (40.1) | | | (15.5) | |
| Loss on extinguishment of debt | — | | | — | | | 4.5 | |
| Loss (gain) on foreign currency exchange | 9.4 | | | (1.4) | | | 1.7 | |
| Other expense (income), net | 1.4 | | | 30.2 | | | (74.3) | |
| Total other expense (income) | 70.0 | | | 63.5 | | | (13.7) | |
| Income before income taxes | 33.1 | | | 83.4 | | | 1.1 | |
| Income tax expense | 6.2 | | | 24.4 | | | 10.3 | |
| Net income (loss) from continuing operations | 26.9 | | | 59.0 | | | (9.2) | |
| Net loss from discontinued operations | — | | | (5.9) | | | (137.1) | |
| Net income (loss) | $ | 26.9 | | | $ | 53.1 | | | $ | (146.3) | |
| | | | | |
| Earnings (loss) per common share - basic: | | | | | |
| Continuing operations | $ | 0.52 | | | $ | 1.06 | | | $ | (0.16) | |
| Discontinued operations | — | | | (0.11) | | | (2.45) | |
Earnings (loss) per share basic (1) | $ | 0.52 | | | $ | 0.95 | | | $ | (2.61) | |
| | | | | |
| Earnings (loss) per common share - diluted: | | | | | |
| Continuing operations | $ | 0.51 | | | $ | 1.05 | | | $ | (0.16) | |
| Discontinued operations | — | | | (0.10) | | | (2.45) | |
Earnings (loss) per share diluted (1) | $ | 0.51 | | | $ | 0.94 | | | $ | (2.61) | |
| | | | | |
| Weighted average common shares: | | | | | |
| Basic | 52.2 | | | 55.8 | | | 56.0 | |
| Diluted | 52.6 | | | 56.4 | | | 56.0 | |
(1) The sum of the individual per share amounts may not add due to rounding.
See Notes to Consolidated Financial Statements.
TREEHOUSE FOODS, INC.
CONSOLIDATED STATEMENTS OF COMPREHENSIVE INCOME (LOSS)
(In millions)
| | | | | | | | | | | | | | | | | |
| | Year Ended December 31, |
| | 2024 | | 2023 | | 2022 |
| Net income (loss) | $ | 26.9 | | | $ | 53.1 | | | $ | (146.3) | |
| | | | | |
| Other comprehensive income (loss), net of tax: | | | | | |
| Foreign currency translation adjustments | (8.7) | | | 2.8 | | | (16.1) | |
| Pension and postretirement benefits adjustments | 2.1 | | | 4.8 | | | (14.0) | |
| | | | | |
| Other comprehensive (loss) income | (6.6) | | | 7.6 | | | (30.1) | |
| | | | | |
| Comprehensive income (loss) | $ | 20.3 | | | $ | 60.7 | | | $ | (176.4) | |
See Notes to Consolidated Financial Statements.
TREEHOUSE FOODS, INC.
CONSOLIDATED STATEMENTS OF STOCKHOLDERS’ EQUITY
(In millions)
| | | | | | | | | | | | | | | | | | | | | | | | | | | | | | | | | | | | | | | | | | | | | | | |
| | | | | | | | | | | | | Accumulated | | |
| | | | | | | | | Additional | | | | Other | | |
| | Common Stock | | Treasury Stock | | Paid-In | | Accumulated | | Comprehensive | | |
| | Shares | | Amount | | Shares | | Amount | | Capital | | Deficit | | Loss | | Equity |
| Balance, January 1, 2022 | 58.7 | | | $ | 0.6 | | | (2.9) | | | $ | (133.3) | | | $ | 2,187.4 | | | $ | (155.7) | | | $ | (53.6) | | | $ | 1,845.4 | |
| Net loss | — | | | — | | | — | | | — | | | — | | | (146.3) | | | — | | | (146.3) | |
| Other comprehensive loss | — | | | — | | | — | | | — | | | — | | | — | | | (30.1) | | | (30.1) | |
| | | | | | | | | | | | | | | |
| Exercise of stock options and issuance of other stock awards | 0.3 | | | — | | | — | | | — | | | (4.3) | | | — | | | — | | | (4.3) | |
| Stock-based compensation | — | | | — | | | — | | | — | | | 22.3 | | | — | | | — | | | 22.3 | |
| | | | | | | | | | | | | | | |
| Balance, December 31, 2022 | 59.0 | | | $ | 0.6 | | | (2.9) | | | $ | (133.3) | | | $ | 2,205.4 | | | $ | (302.0) | | | $ | (83.7) | | | $ | 1,687.0 | |
| Net income | — | | | — | | | — | | | — | | | — | | | 53.1 | | | — | | | 53.1 | |
| Other comprehensive income | — | | | — | | | — | | | — | | | — | | | — | | | 7.6 | | | 7.6 | |
| Treasury stock repurchases | — | | | — | | | (2.3) | | | (100.9) | | | — | | | — | | | — | | | (100.9) | |
| Exercise of stock options and issuance of other stock awards | 0.3 | | | — | | | — | | | — | | | (6.8) | | | — | | | — | | | (6.8) | |
| Stock-based compensation | — | | | — | | | — | | | — | | | 24.8 | | | — | | | — | | | 24.8 | |
| | | | | | | | | | | | | | | |
| Balance, December 31, 2023 | 59.3 | | | $ | 0.6 | | | (5.2) | | | $ | (234.2) | | | $ | 2,223.4 | | | $ | (248.9) | | | $ | (76.1) | | | $ | 1,664.8 | |
| Net income | — | | | — | | | — | | | — | | | — | | | 26.9 | | | — | | | 26.9 | |
| Other comprehensive loss | — | | | — | | | — | | | — | | | — | | | — | | | (6.6) | | | (6.6) | |
| Treasury stock repurchases | — | | | — | | | (4.1) | | | (151.2) | | | — | | | — | | | — | | | (151.2) | |
| Exercise of stock options and issuance of other stock awards | 0.2 | | | — | | | — | | | — | | | (4.1) | | | — | | | — | | | (4.1) | |
| Stock-based compensation | — | | | — | | | — | | | — | | | 19.1 | | | — | | | — | | | 19.1 | |
| Balance, December 31, 2024 | 59.5 | | | $ | 0.6 | | | (9.3) | | | $ | (385.4) | | | $ | 2,238.4 | | | $ | (222.0) | | | $ | (82.7) | | | $ | 1,548.9 | |
See Notes to Consolidated Financial Statements.
TREEHOUSE FOODS, INC.
CONSOLIDATED STATEMENTS OF CASH FLOWS
(In millions) | | | | | | | | | | | | | | | | | |
| | Year Ended December 31, |
| | 2024 | | 2023 | | 2022 |
| Cash flows from operating activities: | | | | | |
| Net income (loss) | $ | 26.9 | | | $ | 53.1 | | | $ | (146.3) | |
| Net loss from discontinued operations | — | | | (5.9) | | | (137.1) | |
| Net income (loss) from continuing operations | 26.9 | | | 59.0 | | | (9.2) | |
| Adjustments to reconcile net income (loss) to net cash provided by (used in) operating activities: | | | | | |
| Depreciation and amortization | 147.1 | | | 141.9 | | | 139.6 | |
| Asset impairment | 19.3 | | | — | | | — | |
| Stock-based compensation | 19.1 | | | 24.8 | | | 19.8 | |
| Loss on extinguishment of debt | — | | | — | | | 4.5 | |
| | | | | |
| Unrealized (gain) loss on derivative contracts | (6.7) | | | 15.1 | | | (75.1) | |
| Deferred income taxes | (7.5) | | | 3.5 | | | 9.1 | |
| Deferred TSA income | — | | | (12.3) | | | (22.7) | |
| Other, net | 14.2 | | | 8.9 | | | 6.4 | |
| Changes in operating assets and liabilities, net of acquisitions and divestitures: | | | | | |
| Receivables | 28.1 | | | (15.2) | | | (8.9) | |
| Inventories | (10.5) | | | 51.6 | | | (128.3) | |
| Prepaid expenses and other assets | (7.4) | | | 5.3 | | | 43.6 | |
| Accounts payable | 66.0 | | | (82.4) | | | (14.8) | |
| Accrued expenses and other liabilities | (22.8) | | | (42.9) | | | (31.7) | |
| Net cash provided by (used in) operating activities - continuing operations | 265.8 | | | 157.3 | | | (67.7) | |
| Net cash used in operating activities - discontinued operations | — | | | — | | | (83.0) | |
| Net cash provided by (used in) operating activities | 265.8 | | | 157.3 | | | (150.7) | |
| Cash flows from investing activities: | | | | | |
| Capital expenditures | (139.7) | | | (140.8) | | | (93.5) | |
| | | | | |
| | | | | |
| | | | | |
| Proceeds from sale of fixed assets | 1.4 | | | — | | | 4.8 | |
| Acquisitions, net of cash acquired | — | | | (100.6) | | | — | |
| | | | | |
| | | | | |
| | | | | |
| Net cash used in investing activities - continuing operations | (138.3) | | | (241.4) | | | (88.7) | |
| Net cash provided by investing activities - discontinued operations | — | | | 468.1 | | | 500.7 | |
| Net cash (used in) provided by investing activities | (138.3) | | | 226.7 | | | 412.0 | |
| Cash flows from financing activities: | | | | | |
| Borrowings under Revolving Credit Facility | 360.3 | | | 2,935.3 | | | 855.9 | |
| Payments under Revolving Credit Facility | (360.3) | | | (2,935.3) | | | (855.9) | |
| | | | | |
| | | | | |
| | | | | |
| | | | | |
| Payments on finance lease obligations | (0.9) | | | (0.6) | | | (1.1) | |
| Payment of deferred financing costs | (0.6) | | | — | | | (2.7) | |
| Deferred payment from acquisition of seasoned pretzel capability | (4.0) | | | — | | | — | |
| Payments on Term Loans | — | | | — | | | (514.3) | |
| | | | | |
| | | | | |
| | | | | |
| Repurchases of common stock | (149.7) | | | (100.0) | | | — | |
| Receipts related to stock-based award activities | — | | | — | | | 0.4 | |
| Payments related to stock-based award activities | (4.1) | | | (6.9) | | | (4.7) | |
| | | | | |
| Net cash used in financing activities - continuing operations | (159.3) | | | (107.5) | | | (522.4) | |
| Net cash used in financing activities - discontinued operations | — | | | — | | | (0.3) | |
| Net cash used in financing activities | (159.3) | | | (107.5) | | | (522.7) | |
| Effect of exchange rate changes on cash and cash equivalents | 1.1 | | | 0.8 | | | (4.2) | |
| Net (decrease) increase in cash and cash equivalents | (30.7) | | | 277.3 | | | (265.6) | |
| Add: Cash and cash equivalents of discontinued operations, beginning of period | — | | | — | | | 4.1 | |
| Less: Cash and cash equivalents of discontinued operations, end of period | — | | | — | | | — | |
| Cash and cash equivalents, beginning of year | 320.3 | | | 43.0 | | | 304.5 | |
| Cash and cash equivalents, end of year | $ | 289.6 | | | $ | 320.3 | | | $ | 43.0 | |
| | | | | | | | | | | | | | | | | |
| Year Ended December 31, |
| 2024 | | 2023 | | 2022 |
| Supplemental cash flow disclosures: | | | | | |
| Interest paid | $ | 85.2 | | | $ | 93.7 | | | $ | 68.1 | |
| Net income taxes paid (refunded) | 10.2 | | | 19.3 | | | (3.0) | |
| | | | | |
| Non-cash investing and financing activities: | | | | | |
| | | | | |
| | | | | |
| Capital expenditures incurred but not yet paid | $ | 17.5 | | | $ | 17.4 | | | $ | 21.4 | |
| Right-of-use assets obtained in exchange for lease obligations | 4.5 | | | 45.1 | | | 86.8 | |
| Accrued deferred financing costs | 0.1 | | | — | | | — | |
| Note receivable issued in exchange for the sale of business net assets | — | | | — | | | 425.9 | |
| Note receivable increase from paid in kind interest | — | | | 3.2 | | | 1.1 | |
| Note receivable purchase price adjustment reduction | — | | | (5.1) | | | — | |
| Deferred payment from acquisition of seasoned pretzel capability | — | | | 4.0 | | | — | |
See Notes to Consolidated Financial Statements.
TREEHOUSE FOODS, INC.
NOTES TO CONSOLIDATED FINANCIAL STATEMENTS
Years ended December 31, 2024, 2023, and 2022
1. SUMMARY OF SIGNIFICANT ACCOUNTING POLICIES
Basis of Presentation — The Consolidated Financial Statements include the accounts of TreeHouse Foods, Inc. and its 100% owned direct and indirect subsidiaries (the "Company," "TreeHouse," "we," "us," or "our"). All intercompany balances and transactions are eliminated in consolidation.
Discontinued Operations — The Company completed the sales of its Snack Bars business on September 29, 2023, and a significant portion of its Meal Preparation business on October 3, 2022, both as components of its single plan of disposal from the Company’s strategic review process. These divestitures are presented as discontinued operations and have been excluded from continuing operations for all periods presented. Refer to Note 7 for additional information.
Use of Estimates — The preparation of our Consolidated Financial Statements in conformity with accounting principles generally accepted in the United States of America ("GAAP") requires management to use judgment to make estimates and assumptions that affect the reported amounts of assets and liabilities and disclosures of contingent assets and liabilities at the date of the Consolidated Financial Statements, and the reported amounts of net sales and expenses during the reporting period. Actual results could differ from these estimates.
Cash and Cash Equivalents — We consider temporary cash investments with an original maturity of three months or less to be cash equivalents. As of December 31, 2024, there were no cash and cash equivalents held in foreign jurisdictions, in local currencies. As of December 31, 2023, $27.5 million represents the cash and cash equivalents held in foreign jurisdictions, in local currencies. The Company is exposed to potential risks associated with its cash and cash equivalents. The Company places its cash and cash equivalents with high credit quality financial institutions. Deposits with these financial institutions may exceed the amount of insurance provided; however, these deposits typically are redeemable upon demand and, therefore, the Company believes the financial risks associated with these financial instruments are minimal.
Accounts Receivable — We provide credit terms to customers in-line with industry standards, perform ongoing credit evaluations of our customers, and maintain allowances for potential credit losses based on historical experience. Customer balances are written off after all collection efforts are exhausted. Estimated product returns, which have not been material, are deducted from sales at the time of shipment.
Inventories — Inventories are stated at the lower of cost or net realizable value. We value inventories using standard costs which approximates costs determined on the first-in first-out basis. The costs of finished goods inventories include raw materials, labor, and overhead costs.
Leases — Right-of-use assets and their corresponding lease liabilities are measured and recognized based on the present value of the future minimum lease payments over the lease term at the commencement date. The Company does not record leases with an initial term of 12 months or less on the balance sheet. Expense for these short-term leases is recognized on a straight-line basis over the lease term.
The majority of the Company's leases do not provide an implicit rate; therefore, the Company uses its incremental borrowing rate based on the information available at the commencement date in determining the present value of future payments for those leases. The Company has elected the practical expedient to apply discount rates to its lease portfolio based on the portfolio approach. The Company grouped the leases into portfolios by remaining lease term.
When determining the lease term, we include renewal or termination options based on whether or not we are reasonably certain to exercise. For operating leases, lease expense for minimum lease payments is recognized on a straight-line basis over the lease term. Finance leases are amortized over the shorter of their lease term or their estimated useful lives, and amortization expense is included in depreciation expense. Fixed lease costs represent the explicitly quantified lease payments prescribed by the lease agreement and are included in the measurement of the right-of-use asset and corresponding lease liability. Variable lease payments that depend on an index or a rate are included in the calculation of the right-of-use asset and lease liability based on the index or rate at lease commencement. Other variable lease payments such as those that depend on the usage or performance of an underlying asset are not included in the measurement of the right-of-use asset or lease liability. The Company has elected the practical expedient to combine lease and nonlease components into a single component for all of its leases.
TREEHOUSE FOODS, INC.
NOTES TO CONSOLIDATED FINANCIAL STATEMENTS – (Continued)
Property, Plant, and Equipment — Property, plant, and equipment are stated at acquisition cost, plus capitalized interest on borrowings during the actual construction period of major capital projects. Depreciation and amortization are calculated using the straight-line method over the estimated useful lives of the assets as follows: | | | | | | | | |
| Asset | | Useful Life |
| Buildings and improvements | | 12-40 years |
| Machinery and equipment | | 3-15 years |
| Office furniture and equipment | | 3-12 years |
Building and leasehold improvements are depreciated over the shorter of the estimated useful life of the assets or the remaining useful life of the associated building or lease.
We perform impairment tests when circumstances indicate that the carrying value of an asset may not be recoverable. Refer to Note 3 and Note 8 for additional information. Expenditures for repairs and maintenance, which do not improve or extend the life of the assets, are expensed as incurred.
Goodwill — Goodwill is calculated as the excess of the purchase price of acquired businesses over the fair market value of their identifiable net assets. Goodwill represents the value the Company expects to achieve through the implementation of operational synergies, the expansion of the business into new or growing segments of the industry, and the addition of new employees. Goodwill is evaluated annually in the fourth quarter or more frequently, if events or changes in circumstances require an interim assessment. We assess goodwill for impairment (as of December 31) at the reporting unit level using income and market approaches, employing significant assumptions regarding growth, discount rates, and profitability for our single reporting unit. Our estimates under the income approach are determined based on a discounted cash flow model. The market approach uses a market multiple methodology employing earnings before interest, taxes, depreciation, and amortization ("EBITDA") and applies a range of multiples to those amounts in determining the indicated fair value. In determining the multiples used in this approach, we obtain the multiples for selected peer companies using the most recent publicly available information. In determining the indicated fair value of our reporting unit, the Company concludes based on the income approach, and uses the market approach to corroborate, as the Company believes the income approach is the most reliable indicator of the fair value of its reporting unit. The resulting value is then compared to the carrying value for its reporting unit to determine if impairment is necessary.
Intangible Assets — Identifiable intangible assets with finite lives are amortized over their estimated useful lives as follows: | | | | | | | | |
| Asset | | Useful Life |
| Customer-related | | 5 to 20 years |
| Trademarks | | 10 to 20 years |
| | |
| Formulas/recipes | | 5 to 7 years |
| Computer software | | 3 to 10 years |
All amortization expense related to intangible assets is recorded in Amortization expense in the Consolidated Statements of Operations.
Indefinite lived trademarks are evaluated for impairment annually in the fourth quarter or more frequently, if events or changes in circumstances indicate that the asset might be impaired. Impairment is indicated when their book value exceeds fair value. If the fair value of an evaluated asset is less than its book value, the asset is written down to fair value, which is generally based on its discounted future cash flows.
Amortizable intangible assets are evaluated for impairment whenever events or changes in circumstances indicate that the carrying amount may not be recoverable. If an evaluation of the undiscounted cash flows indicates impairment, the asset group is impaired to its estimated fair value, which is generally based on discounted future cash flows, and the impairment is allocated to the individual assets within the asset group.
Revenue Recognition — We manufacture and sell food and beverage products to retailers, foodservice distributors, co-manufacturers, and industrial and export channels. Revenue recognition is completed on a point in time basis when product control is transferred to the customer. In general, control transfers to the customer when the product is shipped or delivered to the customer based upon applicable shipping terms. For each contract, the Company considers the transfer of products, each of which is distinct, to be the identified performance obligation generally satisfied within one year. No payment terms beyond one year are granted at contract inception.
TREEHOUSE FOODS, INC.
NOTES TO CONSOLIDATED FINANCIAL STATEMENTS – (Continued)
Most contracts also include some form of variable consideration. The most common forms of variable consideration include discounts, rebates, and sales returns and allowances. Variable consideration is treated as a reduction in revenue when product revenue is recognized. Depending on the specific type of variable consideration, we use either the expected value or most likely amount method to determine the variable consideration. The Company reviews and updates its estimates and related accruals of variable consideration each period based on the terms of the agreements, historical experience, and any recent changes in the market.
The Company does not have significant deferred revenue or unbilled receivable balances arising from transactions with customers. We do not capitalize contract inception costs, as contracts are one year or less. The Company does not incur significant fulfillment costs requiring capitalization. Shipping and handling costs associated with outbound freight are included within Selling and distribution expenses and are accounted for as a fulfillment cost as incurred, including shipping and handling costs after control over a product has transferred to a customer. Shipping and handling costs recorded as a component of Selling and distribution expense were approximately $97.7 million, $112.5 million, and $140.4 million for the years ended December 31, 2024, 2023, and 2022, respectively. In addition, any taxes collected on behalf of government authorities are excluded from net sales.
Cost of Sales — Cost of sales represents costs directly related to the manufacture and distribution of our products. Such costs include raw materials, packaging, direct and indirect labor, shipping and handling costs, and overhead which includes depreciation of manufacturing and distribution facilities. Shipping and handling costs included in cost of sales reflect inbound freight, inventory warehouse costs, product loading and handling costs, and costs associated with transporting finished products from our manufacturing facilities to distribution warehouses.
Stock-Based Compensation — We measure compensation expense for our equity awards at their grant date fair value. The resulting expense is recognized over the relevant service period.
Employment-Related Benefits — We provide a range of benefits to our employees, including pension and postretirement benefits to our eligible employees and retirees. We record annual amounts relating to these plans based on calculations specified by GAAP, which include various actuarial assumptions, such as discount rates, assumed investment rates of return, compensation increases, employee turnover rates, and health care cost trend rates. We make modifications to the actuarial assumptions based on plan changes, current rates, and trends when appropriate.
Workers' Compensation — The measurement of the liability for our cost of providing these benefits is largely based upon loss development factors that contemplate a number of variables, including claims history and expected trends. These loss development factors are based on industry factors and, along with the estimated liabilities, are developed by us in consultation with external insurance brokers and actuaries. Changes in loss development factors, claims history, and cost trends could result in substantially different results in the future.
Income Taxes — The provision for income taxes includes federal, foreign, state, and local income taxes currently payable, and those deferred because of temporary differences between the financial statement and tax bases of assets and liabilities. Deferred tax assets or liabilities are computed based on the difference between the financial statement and income tax bases of assets and liabilities using enacted tax rates. Valuation allowances are recorded to reduce deferred tax assets when it is more likely than not that a tax benefit will not be realized. Deferred income tax expenses or credits are based on the changes in the asset or liability from period to period. We account for uncertain tax positions using a "more-likely-than-not" threshold. A tax benefit from an uncertain tax position is recognized if it is more-likely-than-not that the tax position will be sustained on examination by the taxing authorities, based on the technical merits of the position, or the statute of limitations concerning such issues lapses.
Derivative Instruments — The Company is exposed to certain risks relating to its ongoing business operations. The primary risks managed by derivative instruments include interest rate risk, commodity price risk, and market risk associated with the unfunded portion of the Company's deferred compensation liability. Derivative contracts are entered into for periods consistent with the related underlying exposure and do not constitute positions independent of those exposures. The Company does not enter into derivative instruments for trading or speculative purposes. All derivatives are recorded on a gross basis and carried at fair value in our Consolidated Balance Sheets. None of the Company's derivative instruments are accounted for under hedge accounting and the changes in their fair value are recorded in the Consolidated Statements of Operations. The cash flows associated with derivative instruments and their related gains and losses are presented in the cash flows from operating activities section of the Consolidated Statements of Cash Flows.
TREEHOUSE FOODS, INC.
NOTES TO CONSOLIDATED FINANCIAL STATEMENTS – (Continued)
Foreign Currency Translation and Transactions — The functional currency of the Company’s foreign operations is the applicable local currency. The functional currency is translated into U.S. dollars for balance sheet accounts using currency exchange rates in effect as of the balance sheet date, and for revenue and expense accounts using a weighted-average exchange rate during the fiscal year. The translation adjustments are deferred as a separate component of Stockholders’ equity in Accumulated other comprehensive loss. Gains or losses resulting from transactions denominated in foreign currencies and intercompany debt that is not of a long-term investment nature are included in Loss (gain) on foreign currency exchange in the Consolidated Statements of Operations. Gains or losses resulting from intercompany debt that is designated a long-term investment are recorded as a separate component of Stockholders' equity in Accumulated other comprehensive loss.
Restructuring Expenses — Restructuring charges principally consist of retention, severance, and other employee separation costs, contract termination costs, accelerated depreciation, professional fees, and certain long-lived asset impairments. The Company recognizes restructuring obligations and liabilities for exit and disposal activities at fair value in the period the liability is incurred. One-time employee termination benefits for employee severance costs are expensed evenly starting at the communication date over the period during which the employee is required to render service to receive the severance. Ongoing benefit arrangements for employee severance costs are expensed when they become probable and reasonably estimable. Depreciation expense related to assets that will be disposed of or idled as a part of the restructuring activity is accelerated through the expected date of the asset shut down. Restructuring charges are incurred as a component of Operating income (loss).
Research and Development Costs — We record research and development charges to expense as they are incurred and report them in General and administrative expense in our Consolidated Statements of Operations. Expenditures totaled $13.9 million, $13.0 million, and $12.4 million for the years ended December 31, 2024, 2023, and 2022, respectively.
Advertising Costs — Advertising costs are expensed as incurred and reported in Selling and distribution expense of our Consolidated Statements of Operations. Expenditures totaled $1.2 million, $1.7 million, and $1.2 million for the years ended December 31, 2024, 2023, and 2022, respectively.
Earnings (Loss) Per Share from Continuing Operations — Basic earnings per share is computed by dividing Net income (loss) by the number of weighted average common shares outstanding during the reporting period. The weighted average number of common shares used in the diluted earnings per share calculation is determined using the treasury stock method and includes the incremental effect related to the Company’s outstanding stock-based compensation awards.
TREEHOUSE FOODS, INC.
NOTES TO CONSOLIDATED FINANCIAL STATEMENTS – (Continued)
2. RECENTLY ISSUED ACCOUNTING PRONOUNCEMENTS
Not yet adopted
In November 2024, the Financial Accounting Standards Board ("FASB") issued Accounting Standards Update ("ASU") 2024-03, Income Statement - Reporting Comprehensive Income - Expense Disaggregation Disclosures (Subtopic 220-40): Disaggregation of Income Statement Expenses. The ASU requires additional information about specific expenses in certain notes to the Consolidated Financial Statements. The new guidance will be effective for annual periods beginning after December 15, 2026, and interim reporting periods beginning after December 15, 2027. Early adoption is permitted. Upon adoption, the impact of ASU 2024-03 will be limited to certain notes to the Consolidated Financial Statements.
In December 2023, the FASB issued ASU 2023-09, Income Taxes (Topic 740): Improvements to Income Tax Disclosures, to enhance the transparency and decision usefulness of income tax disclosures. The amendments are effective for annual periods beginning after December 15, 2024 on a prospective basis. Early adoption is permitted. Upon adoption, the impact of ASU 2023-09 will be limited to certain notes to the Consolidated Financial Statements.
Adopted
In November 2023, the FASB issued ASU 2023-07, Segment Reporting (Topic 280): Improvements to Reportable Segment Disclosures, to update reportable segment disclosure requirements, primarily through enhanced disclosures about significant segment expenses and information used to assess segment performance. The amendments are effective for fiscal years beginning after December 15, 2023, and for interim periods within fiscal years beginning after December 15, 2024, with early adoption permitted. The Company adopted this guidance during the fourth quarter of 2024. The adoption did not have a material impact on the Company's financial statements. Refer to Note 21 for further details regarding segment reporting.
3. GROWTH, REINVESTMENT, AND RESTRUCTURING PROGRAMS
The Company’s Growth, Reinvestment, and Restructuring activities are part of an enterprise-wide transformation to build long-term sustainable growth and improve profitability for the Company. As part of our Growth, Reinvestment, and Restructuring Programs, we generally incur expenses that qualify as exit and disposal costs under U.S. GAAP. These include severance, employee separation costs, and other exit costs. Severance and employee separation costs primarily relate to cash severance, non-cash severance, including accelerated equity award compensation expense, and other termination benefits. Other exit costs typically relate to lease and contract terminations. We also incur expenses that are an integral component of, and directly attributable to, our Growth, Reinvestment, and Restructuring activities, which do not qualify as exit and disposal costs under U.S. GAAP. These include asset-related costs and other costs. Asset-related costs primarily relate to inventory write-downs, accelerated depreciation, and certain long-lived asset impairments. Other costs primarily relate to start-up costs of new facilities, consulting and professional fees, retention costs, organizational redesign, information technology system implementation, asset relocation costs, and costs to exit facilities or production.
Strategic Growth Initiatives
The Company began executing on its Strategic Growth Initiatives in 2021 and completed the program in 2023. These initiatives were designed to invest in our commercial organization, adapt the supply chain to better support long-term growth opportunities, and further enable the Company to build greater depth in growth categories. The total costs within this program were $115.5 million, comprised of consulting and professional fees, employee-related costs, and investment in information technology. The costs incurred for the years ended December 31, 2023 and 2022 were $15.1 million and $40.4 million, respectively.
Ready-to-drink Business Exit
During the second quarter of 2024, the Company made the decision to exit the Ready-to-drink ("RTD") business. The production for the RTD business ceased during the first quarter of 2025. The Company expects the total costs for the decommissioning and disposal of related assets and inventory, as well as other transitioning costs, to be approximately $4.0 million. The costs incurred for the year ended December 31, 2024 were $1.9 million and are recognized in Cost of sales and Other operating expense, net of the Consolidated Statements of Operations. Refer to Note 8 for additional information regarding the impairment of the RTD asset group in the second quarter of 2024.
TREEHOUSE FOODS, INC.
NOTES TO CONSOLIDATED FINANCIAL STATEMENTS – (Continued)
Facility Closures
During the fourth quarter of 2023, the Company completed the closure of its Dallas, Texas Coffee facility in connection with the integration of the Coffee Roasting Capability and transitioned production from Dallas to its Northlake, Texas facility during the first half of 2024. As a result of the Dallas plant closure, an impairment of $4.7 million of property, plant, and equipment was recognized in our Dallas facility asset group in the fourth quarter of 2023. As the Company continued to execute upon integration activities associated with the Coffee Roasting Capability acquisition, the Company exited a distribution center in Grand Prairie, Texas during the third quarter of 2024. As a result of this distribution center exit, an impairment of $0.9 million of Operating lease right-of-use assets was recognized in our Grand Prairie asset group in the third quarter of 2024. These impairment charges are included in Other operating expense, net in the Consolidated Statements of Operations. Impairment charges are measured by comparing the carrying values of the asset groups to their estimated fair values. The fair value of these assets was based on expected future cash flows using Level 3 inputs under ASC 820.
Additionally, during the first quarter of 2024, the Company announced the closure of its Sioux Falls, South Dakota facility in connection with the integration of the Seasoned Pretzel Capability and transitioned production from Sioux Falls to its Hanover, Pennsylvania facility.
The Company expects the total costs related to these facility closures and associated distribution network optimization to be approximately $14.0 million, and the cumulative costs incurred to date are $12.2 million. The costs incurred for the years ended December 31, 2024 and 2023 were $7.2 million and $5.0 million, respectively.
Expenses associated with these activities are recorded in Cost of sales and Other operating expense, net in the Consolidated Statements of Operations.
Below is a summary of costs by line item for the Growth, Reinvestment, and Restructuring Programs: | | | | | | | | | | | | | | | | | | | | |
| | Year Ended December 31, |
| | 2024 | | 2023 | | 2022 |
| | (In millions) |
| Cost of sales | | $ | 1.9 | | | $ | — | | | $ | 0.5 | |
| | | | | | |
| Other operating expense, net | | 26.7 | | | 46.1 | | | 84.6 | |
| Total | | $ | 28.6 | | | $ | 46.1 | | | $ | 85.1 | |
Below is a summary of costs by type associated with the Growth, Reinvestment, and Restructuring Programs: | | | | | | | | | | | | | | | | | | | | |
| | Year Ended December 31, |
| | | 2024 | | 2023 | | 2022 |
| | (In millions) |
| Asset-related | | $ | 3.0 | | | $ | 4.7 | | | $ | 0.6 | |
| Employee-related | | 8.2 | | | 15.5 | | | 37.0 | |
| Other costs | | 17.4 | | | 25.9 | | | 47.5 | |
| Total | | $ | 28.6 | | | $ | 46.1 | | | $ | 85.1 | |
For the years ended December 31, 2024, 2023, and 2022, asset-related costs primarily consisted of inventory write-downs, certain long-lived asset impairments, and accelerated depreciation; employee-related costs primarily consisted of severance, retention, and dedicated project employee cost; and other costs primarily consisted of consulting services and third party costs related to facility plant closures. Asset-related costs are recognized in Cost of sales and Other operating expense, net in the Consolidated Statements of Operations, and employee-related and other costs are primarily recognized in Other operating expense, net in the Consolidated Statements of Operations.
TREEHOUSE FOODS, INC.
NOTES TO CONSOLIDATED FINANCIAL STATEMENTS – (Continued)
The table below presents the exit cost liability related to severance activity for the Growth, Reinvestment, and Restructuring Programs as of December 31, 2024:
| | | | | | | | | | | | |
| | Severance | | | | |
| | (In millions) |
| Balance as of December 31, 2023 | | $ | 5.4 | | | | | |
| Expenses recognized | | 4.7 | | | | | |
| Cash payments | | (8.3) | | | | | |
| Balance as of December 31, 2024 | | $ | 1.8 | | | | | |
The severance liabilities are included in Accrued expenses in the Consolidated Balance Sheets.
4. LEASES
The Company has operating and finance leases for manufacturing facilities, warehouses and distribution centers, office space, and certain equipment. Remaining lease terms for these leases range from 1 year to 9 years. Some of the Company’s leases include options to extend the leases for up to 16 years, and some include options to terminate the leases within 1 year.
Supplemental balance sheet information related to leases are as follows: | | | | | | | | | | | | | | | | | | | | |
| | | | December 31, |
| | Balance Sheet Classification | | 2024 | | 2023 |
| | | | (In millions) |
| Assets | | | | | | |
| Operating | | Operating lease right-of-use assets | | $ | 154.4 | | | $ | 193.0 | |
| Finance | | Property, plant, and equipment, net | | 4.1 | | | 0.6 | |
| Total assets | | | | $ | 158.5 | | | $ | 193.6 | |
| | | | | | |
| Liabilities | | | | | | |
| Current liabilities | | | | | | |
| Operating | | Accrued expenses | | $ | 40.5 | | | $ | 40.2 | |
| Finance | | Current portion of long-term debt | | 1.1 | | | 0.4 | |
| Total current liabilities | | | | 41.6 | | | 40.6 | |
| Noncurrent liabilities | | | | | | |
| Operating | | Operating lease liabilities | | 125.4 | | | 165.0 | |
| Finance | | Long-term debt | | 3.0 | | | 0.2 | |
| Total noncurrent liabilities | | | | 128.4 | | | 165.2 | |
| Total lease liabilities | | | | $ | 170.0 | | | $ | 205.8 | |
The weighted-average discount rates for the Company's operating and finance leases are as follows:
| | | | | | | | | | | |
| December 31, |
| Weighted-average discount rate | 2024 | | 2023 |
| Operating leases | 4.9 | % | | 4.7 | % |
| Finance leases | 5.6 | % | | 2.7 | % |
The weighted-average remaining lease term of the Company's operating and finance leases are as follows:
| | | | | | | | | | | |
| December 31, |
| Weighted-average remaining lease term | 2024 | | 2023 |
| Operating leases | 4.7 years | | 5.5 years |
| Finance leases | 4.1 years | | 1.4 years |
TREEHOUSE FOODS, INC.
NOTES TO CONSOLIDATED FINANCIAL STATEMENTS – (Continued)
The components of lease expense are as follows: | | | | | | | | | | | | | | | | | | | | | | | | | | |
| | | | Year Ended December 31, |
| | Statement of Operations Classification | | 2024 | | 2023 | | 2022 |
| | | | (In millions) |
| Operating lease cost | | Cost of sales and General and administrative | | $ | 46.3 | | | $ | 48.7 | | | $ | 44.0 | |
| Finance lease cost: | | | | | | | | |
| Amortization of right-of-use assets | | Cost of sales and General and administrative | | 1.0 | | | 0.7 | | | 1.0 | |
| Interest on lease liabilities | | Interest expense | | 0.1 | | | — | | | 0.1 | |
| Total finance lease cost | | | | 1.1 | | | 0.7 | | | 1.1 | |
| Variable lease cost (1) | | Cost of sales and General and administrative | | 12.4 | | | 14.8 | | | 15.9 | |
| Sublease income | | Cost of sales, General and administrative, and Other operating expense, net | | (8.1) | | | (4.3) | | | (4.1) | |
| Net lease cost | | | | $ | 51.7 | | | $ | 59.9 | | | $ | 56.9 | |
(1) Includes short-term leases, which are immaterial.
As of December 31, 2024, future maturities of lease liabilities are as follows: | | | | | | | | | | | | | | |
| | Operating Leases | | Finance Leases |
| | (In millions) |
| 2025 | | $ | 47.6 | | | $ | 1.3 | |
| 2026 | | 46.8 | | | 1.1 | |
| 2027 | | 40.3 | | | 1.0 | |
| 2028 | | 17.6 | | | 0.9 | |
| 2029 | | 11.1 | | | 0.3 | |
| Thereafter | | 23.7 | | | — | |
| Total lease payments | | 187.1 | | | 4.6 | |
| Less: Interest | | (21.2) | | | (0.5) | |
| Present value of lease liabilities | | $ | 165.9 | | | $ | 4.1 | |
Other information related to leases were as follows: | | | | | | | | | | | | | | | | | | | | |
| | Year Ended December 31, |
| | 2024 | | 2023 | | 2022 |
| | (In millions) |
| Cash paid for amounts included in the measurement of lease liabilities: | | | | | | |
| Operating cash flows from operating leases | | $ | 48.0 | | | $ | 47.1 | | | $ | 42.1 | |
| Operating cash flows from finance leases | | 0.1 | | | — | | | 0.1 | |
| Financing cash flows from finance leases | | 0.9 | | | 0.6 | | | 1.1 | |
| | | | | | |
| | | | | | |
TREEHOUSE FOODS, INC.
NOTES TO CONSOLIDATED FINANCIAL STATEMENTS – (Continued)
5. RECEIVABLES SALES PROGRAM
The Company has entered into an agreement to sell certain trade accounts receivable to an unrelated, third-party financial institution at a discount (the "Receivables Sales Program"). The agreement can be terminated by either party with 60 days' notice. The Receivables Sales Program is used by the Company to manage liquidity in a cost-effective manner. The Company has no retained interest in the receivables sold under the Receivables Sales Program; however, under the agreement, the Company does have collection and administrative responsibilities for the sold receivables. Under the Receivables Sales Program, the current operating limit of outstanding accounts receivables to be sold at any time is $397.5 million.
The following table includes the outstanding amount of accounts receivable sold under the Receivables Sales Program and the receivables collected from customers and not remitted to the financial institutions:
| | | | | | | | | | | |
| December 31, |
| 2024 | | 2023 |
| (In millions) |
| Outstanding accounts receivable sold | $ | 375.0 | | | $ | 343.8 | |
| Receivables collected and not remitted to financial institutions | 237.7 | | | 200.2 | |
Receivables sold under the Receivables Sales Program are derecognized from the Company's Consolidated Balance Sheet at the time of the sale and the proceeds from such sales are reflected as a component of the change in receivables in the operating activities section of the Consolidated Statements of Cash Flows. The receivables collected and not remitted to financial institutions are included in Accounts payable in the Consolidated Balance Sheets.
The following table summarizes the cash flows of the Company's accounts receivables associated with the Receivables Sales Program. All amounts in the table below include continuing and discontinued operations:
| | | | | | | | | | | | | | | | | | | | |
| | Year Ended December 31, |
| | 2024 | | 2023 | | 2022 |
| | | (In millions) |
| Receivables sold | | $ | 1,354.1 | | | $ | 1,850.3 | | | $ | 2,320.4 | |
| Receivables collected and remitted to financial institutions | | (1,322.9) | | | (1,853.6) | | | (2,330.6) | |
The loss on sale of receivables from continuing operations represents the discount taken by third-party financial institutions and was $9.5 million, $13.9 million, and $6.5 million for the years ended December 31, 2024, 2023, and 2022, respectively, and is included in Other expense (income), net in the Consolidated Statements of Operations. The Company has not recognized any servicing assets or liabilities as of December 31, 2024 or December 31, 2023, as the fair value of the servicing arrangement as well as the fees earned were not material to the financial statements.
6. INVENTORIES
| | | | | | | | | | | |
| | December 31, |
| | 2024 | | 2023 |
| | (In millions) |
| Raw materials and supplies | $ | 217.4 | | | $ | 245.4 | |
| Finished goods | 321.9 | | | 288.6 | |
| Total inventories | $ | 539.3 | | | $ | 534.0 | |
TREEHOUSE FOODS, INC.
NOTES TO CONSOLIDATED FINANCIAL STATEMENTS – (Continued)
7. ACQUISITIONS AND DIVESTITURES
Acquisitions
Acquisition of Private Brand Tea Business
On January 2, 2025, the Company completed the acquisition of certain subsidiaries that operate the private brand tea business of Harris Freeman & Co, Inc. ("Harris Tea"), a leading private brand tea manufacturer in the U.S., for approximately $205.0 million in cash, subject to customary purchase price adjustments. In addition to private brand tea, Harris Tea manufactures specialty retail tea brands and foodservice tea products for restaurant and hospitality industries. The acquisition aligns with our long-term strategy to build capabilities in our higher-growth, higher-margin categories. The acquisition will be accounted for under the acquisition method of accounting. The required disclosures have not been provided as the initial accounting for the business combination was not complete prior to the issuance of these financial statements.
Acquisition of Pickle Branded Assets
On January 2, 2024, the Company completed the acquisition of pickle branded assets, including Bick’s pickles, Habitant pickled beets, Woodman’s horseradish, and McLarens pickled onions brands (the "Pickle Branded Assets"), from The J.M. Smucker Co., a North American producer of coffee, consumer foods, dog snacks, and cat food. The acquisition is consistent with our strategy and builds depth in our Pickles category by expanding into Canada. The total purchase consideration transferred was approximately $25.9 million in cash. The purchase of the Pickle Branded Assets was accounted for as an Asset Acquisition.
The following table summarizes the purchase price allocation of the fair value of net tangible and intangible assets acquired:
| | | | | |
| (In millions) |
| Cash transferred at close | $ | 20.0 | |
| Purchase price adjustment | 5.9 | |
| Total consideration transferred | $ | 25.9 | |
| |
| Allocation of consideration to assets acquired: | |
| Inventories | $ | 25.2 | |
| |
| Trademarks | 0.7 | |
| |
| |
| |
| |
| |
| |
| Total purchase price | $ | 25.9 | |
Intangible assets acquired included trademarks with an estimated life of 10 years.
TREEHOUSE FOODS, INC.
NOTES TO CONSOLIDATED FINANCIAL STATEMENTS – (Continued)
Acquisition of Coffee Roasting Capability
On June 30, 2023, the Company completed the acquisition of the Direct Ship coffee business and its Northlake, Texas coffee facility (the "Coffee Roasting Capability") from Farmer Brothers Company, a national coffee roaster, wholesaler, equipment servicer and distributor of coffee, tea, and culinary products. The acquisition brings roasting, grinding, flavoring and blending capabilities to the Company's portfolio to complement the Company's existing single-serve pod and ready-to-drink coffee businesses. The total purchase consideration consisted of approximately $90.6 million in cash. The acquisition was funded by borrowings from the Company’s $500.0 million Revolving Credit Facility.
The Coffee Roasting Capability was accounted for under the acquisition method of accounting. The Company incurred acquisition-related costs of $2.4 million during the year ended December 31, 2023. These costs are included in General and administrative expense in the Consolidated Statements of Operations.
The following table summarizes the final purchase price allocation of the fair value of net tangible assets acquired:
| | | | | |
| (In millions) |
| Cash transferred at close | $ | 92.2 | |
| Purchase price adjustment | (1.6) | |
| Total consideration transferred | $ | 90.6 | |
| |
| Allocation of consideration to assets acquired: | |
| Inventories | $ | 29.8 | |
| Property, plant, and equipment, net | 60.8 | |
| |
| |
| |
| |
| |
| |
| |
| Total purchase price | $ | 90.6 | |
Real property and personal property fair values were determined using the cost and market approaches.
The results of operations of the Coffee Roasting Capability were included in our Consolidated Financial Statements from the date of acquisition. Included in the Company’s Consolidated Statements of Operations are the Coffee Roasting Capability’s net sales of approximately $64.1 million and net loss before income taxes of $3.1 million from the date of acquisition through December 31, 2023. During the fourth quarter of 2023, the Company recorded a purchase price adjustment which reduced the amount of consideration transferred by $1.6 million, decreased inventory by $1.7 million, and increased property, plant, and equipment, net by $0.1 million.
Acquisition of Seasoned Pretzel Capability
On April 1, 2023, the Company completed the acquisition of a seasoned pretzel capability for a total purchase price of $14.0 million, which included the recognition of $5.4 million within Goodwill in the Consolidated Balance Sheets based on the final purchase price allocation. The purchase price consisted of approximately $10.0 million in cash and a deferred payment of $4.0 million, which was paid in the third quarter of 2024. The deferred payment was recognized in Net cash used in financing activities - continuing operations in the Consolidated Statements of Cash Flows for the year ended December 31, 2024. The acquisition is in line with our strategy to build category leadership, depth and capabilities to drive profitable growth.
TREEHOUSE FOODS, INC.
NOTES TO CONSOLIDATED FINANCIAL STATEMENTS – (Continued)
Discontinued Operations
Sale of the Snack Bars Business
On September 29, 2023, the Company completed the sale of its Snack Bars business (the "Snack Bars Transaction" or the "Snack Bars Business") to John B. Sanfilippo & Son, Inc. (the "Snack Bars Business Buyer") for approximately $58.7 million in cash. The Snack Bars Business consisted of manufacturing, packaging, and selling snack bars and operated in the Lakeville, Minnesota plant. The Company classified the proceeds within Net cash provided by investing activities - discontinued operations. The Company recognized a gain on disposal of $1.1 million during the year ended December 31, 2023. The gain on disposal is recognized within Net loss from discontinued operations in the Company's Consolidated Statements of Operations. This transaction represented a component of the single plan of disposal from the Company’s strategic review process, which also resulted in the divestiture of a significant portion of the Meal Preparation business during the fourth quarter of 2022. The Snack Bars Transaction further advanced the Company's enterprise-wide transformation to simplify its business and build depth around a focused group of high-growth categories.
The Company entered into a Transition Services Agreement ("TSA") with John B. Sanfilippo & Son, Inc., which was designed to ensure and facilitate an orderly transfer of business operations. The TSA ended in the first quarter of 2024. TSA income is recognized as services are performed, and the income received under the TSA was $0.1 million and $0.6 million for the years ended December 31, 2024 and 2023, respectively.
Sale of a Significant Portion of the Meal Preparation Business
On October 3, 2022, the Company completed the sale of a significant portion of the Company’s Meal Preparation business (the "Meal Preparation Business") to two entities affiliated with Investindustrial: Rushmore Investment III LLC, a Delaware limited liability company ("US Buyer") and 1373978 B.C., ULC, a British Columbia unlimited liability company ("CA Buyer" and together with US Buyer, the "Buyer"). The closing purchase price was $963.8 million, and during the second quarter of 2023, a $20.3 million adjustment to the purchase price was finalized, resulting in a final purchase price of $943.5 million.
The final purchase price consisted of approximately $522.6 million in cash and approximately $420.9 million in a five-year secured Seller Promissory Note (the "Seller Promissory Note"). On October 19, 2023, the Company received the repayment of its Seller Promissory Note Credit Agreement, which was reflected in Net cash provided by investing activities - discontinued operations in the Consolidated Statements of Cash Flows for the year ended December 31, 2023. During the years ended December 31, 2023 and 2022, the Company recognized $34.5 million and $10.6 million, respectively, within Interest income in the Consolidated Statements of Operations related to the Seller Promissory Note.
The Company recognized expected loss on disposal adjustments of $2.2 million and $128.5 million during the years ended December 31, 2023 and 2022, respectively. The expected loss on disposal is recognized within Net loss from discontinued operations in the Consolidated Statements of Operations.
The Meal Preparation Business consisted of consumer packaged food manufacturers that operated 14 manufacturing facilities in the United States, Canada, and Italy servicing primarily retail grocery customers. The Meal Preparation Business included 11 categories and sold center of the store grocery and main course meal items, such as pasta, pourable dressings, sauces, red sauces (salsas and pasta sauces), spoonables (mayos and dips), syrups, preserves, dry dinners (macaroni and cheese), dry blends and baking goods, and pie filling as well as pita chips.
The Company entered into a TSA with the Buyer, which was designed to ensure and facilitate an orderly transfer of business operations. The services provided under the TSA included, but were not limited to, IT systems implementation, IT and financial shared services, procurement and order processing, customer service, distribution network separation, and a supply agreement. All TSA services were exited during the second quarter of 2024. Additionally, a $35.0 million credit was provided to the Buyer by TreeHouse to cover initial TSA set-up costs that otherwise would have been incurred by the Buyer ("TSA Credit"). The TSA Credit was included in the fair value of consideration transferred, and it represented deferred income for TreeHouse until the Company incurred the related TSA costs, at which point the deferred income was reduced and TSA income recognized. TSA income is recognized as services are performed, and the income received under the TSA was $0.5 million, $41.1 million, and $22.7 million for the years ended December 31, 2024, 2023, and 2022, respectively. The TSA income is classified within Other operating expense, net in the Company's Consolidated Statements of Operations.
The Company has reflected these two transactions as discontinued operations. Unless otherwise noted, amounts and disclosures throughout these Notes to Consolidated Financial Statements relate to the Company's continuing operations.
TREEHOUSE FOODS, INC.
NOTES TO CONSOLIDATED FINANCIAL STATEMENTS – (Continued)
Results of discontinued operations are as follows:
| | | | | | | | | | | | | | | | |
| | Year Ended December 31, |
| | 2023 | | 2022 | | |
| | (In millions) |
| Net sales | | $ | 121.3 | | | $ | 1,338.9 | | | |
| Cost of sales | | 127.6 | | | 1,186.4 | | | |
| Selling, general, administrative and other operating expense | | 0.9 | | | 123.0 | | | |
| Amortization expense | | — | | | 14.5 | | | |
| | | | | | |
| Loss on sale of business | | 1.1 | | | 128.5 | | | |
| Operating loss from discontinued operations | | (8.3) | | | (113.5) | | | |
| Interest expense and other (income) expense | | (1.1) | | | 20.8 | | | |
| Income tax (benefit) expense | | (1.3) | | | 2.8 | | | |
| Loss from discontinued operations, net of tax | | $ | (5.9) | | | $ | (137.1) | | | |
8. PROPERTY, PLANT, AND EQUIPMENT | | | | | | | | | | | |
| | December 31, |
| | 2024 | | 2023 |
| | (In millions) |
| Land | $ | 35.0 | | | $ | 35.2 | |
| Buildings and improvements | 378.1 | | | 367.2 | |
| Machinery and equipment | 1,063.3 | | | 1,042.5 | |
| Construction in progress | 120.6 | | | 97.4 | |
| Total | 1,597.0 | | | 1,542.3 | |
| Less accumulated depreciation | (848.4) | | | (804.7) | |
| Property, plant, and equipment, net | $ | 748.6 | | | $ | 737.6 | |
Depreciation expense was $98.5 million, $93.7 million, and $91.7 million in 2024, 2023, and 2022, respectively.
Asset Impairment
We evaluate property, plant, and equipment, operating lease right-of-use assets, and finite lived intangible assets for impairment when circumstances indicate that their carrying values may not be recoverable. Indicators of impairment include deteriorations in operating cash flows, the anticipated sale or disposal of an asset group, and other significant changes in business conditions.
During the second quarter of 2024, as a result of forecasted cash flow losses, the Company made the decision to exit the RTD business. As a result, the Company performed a recoverability assessment over the RTD asset group in the second quarter of 2024, which indicated that the asset group was not recoverable, and we were required to determine the fair value of the business. Our fair value assessment indicated that the carrying value was in excess of the fair value, and an impairment of $19.3 million of property, plant, and equipment was recognized in our RTD beverages asset group. The impairment charge is included in Asset impairment in the Consolidated Statements of Operations.
Impairment charges are measured by comparing the carrying value of the asset group to its estimated fair value. The fair value of the asset group was based on expected future cash flows using Level 3 inputs under ASC 820. We can provide no assurance regarding the prospect of additional impairment charges in future periods.
TREEHOUSE FOODS, INC.
NOTES TO CONSOLIDATED FINANCIAL STATEMENTS – (Continued)
9. GOODWILL AND INTANGIBLE ASSETS
Goodwill
Changes in the carrying amount of goodwill, which include no accumulated impairment losses, for the years ended December 31, 2024 and 2023 are as follows: | | | | | | | | |
| | Goodwill |
| | (In millions) |
| | |
| | |
| Balance at January 1, 2023 | | $ | 1,817.6 | |
| | |
| Acquisitions | | 5.4 | |
| Foreign currency exchange adjustments | | 1.7 | |
| Balance at December 31, 2023 | | 1,824.7 | |
| | |
| | |
| | |
| Foreign currency exchange adjustments | | (5.4) | |
| Balance at December 31, 2024 | | $ | 1,819.3 | |
The Company performed the annual impairment assessment on goodwill as of December 31, 2024 and 2023, noting no impairment losses.
Intangible Assets
The gross carrying amounts and accumulated amortization of intangible assets as of December 31, 2024 and 2023 are as follows: | | | | | | | | | | | | | | | | | | | | | | | | | | | | | | | | | | | | | | | | | | | |
| | | | December 31, |
| | | | 2024 | | 2023 |
| | | Gross
Carrying
Amount | | Accumulated
Amortization | | | | Net
Carrying
Amount | | Gross
Carrying
Amount | | Accumulated
Amortization | | | | Net
Carrying
Amount |
| | | | (In millions) |
| Intangible assets with finite lives: | | | | | | | | | | | | | | | | | |
| Customer-related | | | $ | 546.0 | | | $ | (395.6) | | | | | $ | 150.4 | | | $ | 549.3 | | | $ | (364.1) | | | | | $ | 185.2 | |
| | | | | | | | | | | | | | | | | |
| Trademarks | | | 19.2 | | | (17.0) | | | | | 2.2 | | | 18.7 | | | (15.9) | | | | | 2.8 | |
| Formulas/recipes | | | 15.4 | | | (15.0) | | | | | 0.4 | | | 15.5 | | | (14.9) | | | | | 0.6 | |
| Computer software | | | 212.6 | | | (158.7) | | | | | 53.9 | | | 209.0 | | | (146.2) | | | | | 62.8 | |
| Total finite lived intangibles | | | 793.2 | | | (586.3) | | | | | 206.9 | | | 792.5 | | | (541.1) | | | | | 251.4 | |
| | | | | | | | | | | | | | | | | |
| Intangible assets with indefinite lives: | | | | | | | | | | | | | | | | | |
| Trademarks | | | 6.0 | | | — | | | | | 6.0 | | | 6.0 | | | — | | | | | 6.0 | |
| Total intangible assets | | | $ | 799.2 | | | $ | (586.3) | | | | | $ | 212.9 | | | $ | 798.5 | | | $ | (541.1) | | | | | $ | 257.4 | |
The Company performed the annual impairment assessment on indefinite-lived intangibles as of December 31, 2024 and 2023, resulting in no impairment losses.
Estimated amortization expense on intangible assets for the next five years is as follows: | | | | | |
| | (In millions) |
| 2025 | $ | 47.3 | |
| 2026 | 44.6 | |
| 2027 | 42.4 | |
| 2028 | 39.7 | |
| 2029 | 19.2 | |
TREEHOUSE FOODS, INC.
NOTES TO CONSOLIDATED FINANCIAL STATEMENTS – (Continued)
10. ACCRUED EXPENSES
Accrued expenses consist of: | | | | | | | | | | | |
| December 31, |
| 2024 | | 2023 |
| (In millions) |
| Operating lease liabilities | $ | 40.5 | | | $ | 40.2 | |
| Payroll and benefits | 21.0 | | | 50.3 | |
| Health insurance, workers' compensation, and other insurance costs | 17.3 | | | 16.1 | |
| Trade promotion liabilities | 17.3 | | | 20.2 | |
| Taxes | 16.3 | | | 9.8 | |
| Interest | 6.8 | | | 7.3 | |
| Marketing liabilities | 4.0 | | | 5.0 | |
| Derivative contracts | 0.5 | | | 8.0 | |
| Other accrued liabilities | 17.6 | | | 12.1 | |
| Total | $ | 141.3 | | | $ | 169.0 | |
11. INCOME TAXES
The components of Income before income taxes are as follows: | | | | | | | | | | | | | | | | | |
| | Year Ended December 31, |
| | 2024 | | 2023 | | 2022 |
| | (In millions) |
| Domestic | $ | 41.5 | | | $ | 75.5 | | | $ | 13.6 | |
| Foreign | (8.4) | | | 7.9 | | | (12.5) | |
| Income before income taxes | $ | 33.1 | | | $ | 83.4 | | | $ | 1.1 | |
The following table presents the components of the 2024, 2023, and 2022 provision for income taxes: | | | | | | | | | | | | | | | | | |
| | Year Ended December 31, |
| | 2024 | | 2023 | | 2022 |
| | (In millions) |
| Current: | | | | | |
| Federal | $ | 12.9 | | | $ | 15.3 | | | $ | 0.1 | |
| State | 0.6 | | | 4.3 | | | (0.3) | |
| Foreign | 0.2 | | | 1.3 | | | 1.4 | |
| Total current | 13.7 | | | 20.9 | | | 1.2 | |
| Deferred: | | | | | |
| Federal | (2.4) | | | 4.1 | | | 3.1 | |
| State | (1.2) | | | (1.2) | | | 8.7 | |
| Foreign | (3.9) | | | 0.6 | | | (2.7) | |
| Total deferred | (7.5) | | | 3.5 | | | 9.1 | |
| Total income tax expense | $ | 6.2 | | | $ | 24.4 | | | $ | 10.3 | |
TREEHOUSE FOODS, INC.
NOTES TO CONSOLIDATED FINANCIAL STATEMENTS – (Continued)
The following is a reconciliation of income tax expense computed at the U.S. federal statutory tax rate to the income tax expense reported in the Consolidated Statements of Operations: | | | | | | | | | | | | | | | | | |
| | Year Ended December 31, |
| | 2024 | | 2023 | | 2022 |
| | (In millions) |
| Tax at statutory rate | $ | 7.0 | | | $ | 17.5 | | | $ | 0.2 | |
| State income taxes (1) | (0.5) | | | 2.4 | | | 6.6 | |
| Effect of rates different than statutory | (0.5) | | | 0.4 | | | (0.5) | |
| Excess tax expense related to stock-based compensation | 1.8 | | | 0.9 | | | 3.0 | |
| Return-to-provision | (1.6) | | | (0.4) | | | 0.1 | |
| Nondeductible officers' compensation | 1.3 | | | 3.2 | | | 1.3 | |
| Uncertain tax positions | (1.0) | | | (0.5) | | | (2.5) | |
| Tax credits | (0.9) | | | (0.5) | | | (0.7) | |
| Valuation allowance | 0.9 | | | — | | | — | |
| Effect of cross-border tax laws | (0.2) | | | 1.3 | | | — | |
| Canadian restructuring (2) | — | | | — | | | 1.6 | |
| Nondeductible transaction costs | — | | | — | | | 1.4 | |
| | | | | |
| | | | | |
| | | | | |
| | | | | |
| | | | | |
| | | | | |
| | | | | |
| | | | | |
| | | | | |
| Other, net | (0.1) | | | 0.1 | | | (0.2) | |
| Total provision for income taxes | $ | 6.2 | | | $ | 24.4 | | | $ | 10.3 | |
(1) 2024, 2023, and 2022 State income taxes are inclusive of a change in the valuation allowance of $(0.2) million, $0.1 million, and $5.0 million, respectively, recorded against certain deferred tax assets.
(2) In anticipation of the sale of a significant portion of the Meal Preparation business, the Company completed a Canadian restructuring resulting in a $1.6 million tax impact during 2022.
The tax effects of temporary differences giving rise to deferred income tax assets and liabilities were: | | | | | | | | | | | |
| | December 31, |
| | 2024 | | 2023 |
| | (In millions) |
| Deferred tax assets: | | | |
| Loss and credit carryovers | $ | 48.2 | | | $ | 197.4 | |
| Lease liabilities | 41.9 | | | 51.0 | |
| Interest limitation carryover | 23.3 | | | 16.9 | |
| Accrued liabilities | 10.0 | | | 14.4 | |
| Inventory reserves | 10.0 | | | 13.0 | |
| Pension and postretirement benefits | 7.0 | | | 8.3 | |
| Stock compensation | 3.6 | | | 4.4 | |
| | | |
| Other | 6.7 | | | 5.2 | |
| Total deferred tax assets | 150.7 | | | 310.6 | |
| Valuation allowance | (31.1) | | | (178.2) | |
| Total deferred tax assets, net of valuation allowance | 119.6 | | | 132.4 | |
| | | |
| Deferred tax liabilities: | | | |
| Fixed assets and intangible assets | (180.3) | | | (191.2) | |
| Lease assets | (39.8) | | | (49.2) | |
| Other | (2.4) | | | (2.4) | |
| Total deferred tax liabilities | (222.5) | | | (242.8) | |
| Net deferred income tax liability | $ | (102.9) | | | $ | (110.4) | |
TREEHOUSE FOODS, INC.
NOTES TO CONSOLIDATED FINANCIAL STATEMENTS – (Continued)
The following table details the Company's tax attributes primarily related to net operating losses, tax credits, and capital losses for which it has recorded deferred tax assets: | | | | | | | | | | | | | | | | | | | | |
| Tax Attributes | | Gross Attribute Amount | | Net Attribute Amount | | Expiration Years |
| | (In millions) | | |
| | | | | | |
| Foreign net operating losses | | $ | 12.5 | | | $ | 3.2 | | | 2029 – 2044 |
| State net operating losses | | 265.8 | | | 10.3 | | | 2025 – 2044 |
| Federal credits | | — | | | 4.9 | | | 2027 |
| State credits | | — | | | 7.4 | | | 2025 – 2039 |
| Federal capital loss | | 35.7 | | | 7.5 | | | 2027 |
| State capital loss | | 226.1 | | | 7.5 | | | 2027 – 2037 |
| Foreign capital loss | | 45.4 | | | 6.0 | | | N/A |
| Other | | — | | | 1.4 | | | 2025 |
| Total | | | | $ | 48.2 | | | |
| | | | | | |
The Company assessed the realizability of its deferred tax assets and has recorded a valuation allowance of $31.1 million against certain tax attributes that will more likely than not expire unused. The decrease in the valuation allowance is primarily related to certain domestic and state capital loss carryforwards that have expired unused.
The Company or one of its subsidiaries files income tax returns in the U.S., Canada, and various U.S. states. In the U.S. federal jurisdiction, the statute of limitations is open for new examinations for the tax years ended December 31, 2021 and forward; for Canadian purposes, the statute of limitations is generally open for new examinations for the tax years ended December 31, 2017 and forward; and for the various U.S. states the statute of limitations is generally open for new examinations for the tax years ended December 31, 2020 and forward.
Our Canadian operations are under exam by the Canadian Revenue Agency ("CRA") for tax years 2012 through 2020. These examinations are expected to extend beyond 2025. The Company has examinations in process with various state taxing authorities, which are expected to be completed in 2025.
During the year, the Company recorded adjustments to its unrecognized tax benefits. A reconciliation of the beginning and ending amount of unrecognized tax benefits is as follows: | | | | | | | | | | | | | | | | | |
| | Year Ended December 31, |
| | 2024 | | 2023 | | 2022 |
| | (In millions) |
| Unrecognized tax benefits beginning balance | $ | 1.1 | | | $ | 1.5 | | | $ | 7.1 | |
| | | | | |
| | | | | |
| Reductions due to statute lapses | (0.6) | | | (0.4) | | | (0.4) | |
| Foreign currency translation | (0.1) | | | — | | | (0.1) | |
| Reductions resulting from dispositions | — | | | — | | | (2.2) | |
| | | | | |
| Reductions related to settlements with taxing authorities | — | | | — | | | (2.9) | |
| | | | | |
| Unrecognized tax benefits ending balance | $ | 0.4 | | | $ | 1.1 | | | $ | 1.5 | |
Unrecognized tax benefits are included in Other long-term liabilities of the Consolidated Balance Sheets. Of the amount accrued at December 31, 2024 and 2023, $0.5 million and $1.0 million, respectively, would impact Net income (loss) from continuing operations when settled. Of the amounts accrued at December 31, 2024 and 2023, none relates to unrecognized tax benefits assumed in prior acquisitions, which have been indemnified by the previous owners.
Management estimates that it is reasonably possible that the total amount of unrecognized tax benefits could decrease by as much as $0.4 million within the next 12 months, primarily as a result of the resolution of audits currently in progress and the lapsing of statutes of limitations. Approximately all of the $0.4 million would affect net income when settled. The timing of cash settlement, if any, cannot be reasonably estimated for uncertain tax benefits.
TREEHOUSE FOODS, INC.
NOTES TO CONSOLIDATED FINANCIAL STATEMENTS – (Continued)
The Company recognizes interest (income) expense and penalties related to unrecognized tax benefits in income tax expense. During the years ended December 31, 2024, 2023, and 2022, the Company recognized net interest and penalties of $(0.3) million, $(0.1) million, and $(0.1) million, respectively. These amounts are primarily the result of statute lapses and are recognized in income tax expense from continuing operations. The Company has accrued approximately $0.1 million and $0.4 million for the payment of interest and penalties at December 31, 2024 and 2023, respectively, of which none are indemnified as of December 31, 2024 and 2023.
12. LONG-TERM DEBT
| | | | | | | | | | | |
| | December 31, |
| | 2024 | | 2023 |
| | (In millions) |
| | | |
| | | |
| Term Loan A | $ | 316.4 | | | $ | 316.4 | |
| | | |
| Term Loan A-1 | 588.6 | | | 588.6 | |
| | | |
| | | |
| | | |
| 2028 Notes | 500.0 | | | 500.0 | |
| Finance leases | 4.1 | | | 0.6 | |
| Total outstanding debt | 1,409.1 | | | 1,405.6 | |
| Deferred financing costs | (6.7) | | | (9.2) | |
| Less current portion | (1.1) | | | (0.4) | |
| Total long-term debt | $ | 1,401.3 | | | $ | 1,396.0 | |
The scheduled maturities of outstanding debt, excluding deferred financing costs, at December 31, 2024 are as follows (in millions): | | | | | |
| |
| 2025 | $ | 1.1 | |
| 2026 | 589.5 | |
| 2027 | 0.9 | |
| 2028 | 817.3 | |
| 2029 | 0.3 | |
| Thereafter | — | |
| Total outstanding debt | $ | 1,409.1 | |
Credit Agreement — On December 1, 2017, the Company entered into the Second Amended and Restated Credit Agreement (the "Credit Agreement"). The senior unsecured credit facility includes a revolving credit facility (the "Revolving Credit Facility" or the "Revolver") and two term loans. The Company has executed six amendments to the Credit Agreement as of December 31, 2024.
Loss on Extinguishment of Debt — During the year ended December 31, 2022, the Company paid down debt of $500.0 million which consisted of $174.8 million on Term Loan A and $325.2 million on Term Loan A-1 and reduced the revolving credit commitment from $750.0 million to an aggregate amount of $500.0 million. The Company incurred a loss on extinguishment of debt totaling $4.5 million representing the write-off of deferred financing costs in connection with the debt prepayment and revolving credit commitment reduction in October 2022.
Revolving Credit Facility — As of December 31, 2024, the Company had remaining availability of $467.7 million under its $500.0 million Revolving Credit Facility, and there were $32.3 million in letters of credit under the Revolving Credit Facility that were issued but undrawn, which have been included as a reduction to the calculation of available credit. Under the Credit Agreement, the Revolving Credit Facility matures on March 26, 2026.
Interest is payable quarterly or, if earlier, at the end of the applicable interest period in arrears on any outstanding borrowings under the Revolving Credit Facility. The interest rates applicable to the Revolving Credit Facility are based upon the Company’s consolidated net leverage ratio or the Company’s Corporate Credit Rating, whichever results in lower pricing, and are determined by either (i) Term SOFR, plus a credit spread adjustment of 0.10%, plus a margin ranging from 1.20% to 1.70%, or (ii) a Base Rate (as defined in the Credit Agreement), plus a margin ranging from 0.20% to 0.70%. The unused fee on the Revolving Credit Facility is also based on the Company’s consolidated net leverage ratio or the Company’s Corporate Credit Rating, whichever results in lower pricing, and accrues at a rate ranging from 0.20% to 0.35%.
TREEHOUSE FOODS, INC.
NOTES TO CONSOLIDATED FINANCIAL STATEMENTS – (Continued)
The Credit Agreement is fully and unconditionally, as well as jointly and severally, guaranteed by our 100% owned direct and indirect domestic subsidiaries: Bay Valley Foods, LLC; Cottage Bakery, Inc.; Linette Quality Chocolates, Inc.; Pickles Manufacturing LLC; Protenergy Holdings, Inc.; Protenergy Natural Foods, Inc.; Ralcorp Frozen Bakery Products, Inc.; Refrigerated Dough, Inc.; Sturm Foods, Inc.; TreeHouse Foods Services, LLC; TreeHouse Private Brands, Inc.; and certain other domestic subsidiaries that may become guarantors in the future, which are collectively known as the "Guarantor Subsidiaries." The Credit Agreement contains various financial and restrictive covenants and requires that the Company maintain a consolidated net leverage ratio of no greater than 4.50 to 1.0. The Credit Agreement also contains cross-default provisions which could result in the acceleration of payments in the event TreeHouse or the Guarantor Subsidiaries (i) fails to make a payment when due in respect of any indebtedness or guarantee having an aggregate principal amount greater than $75.0 million or (ii) fails to observe or perform any other agreement or condition related to such indebtedness or guarantee as a result of which the holder(s) of such debt are permitted to accelerate the payment of such debt.
Term Loan A — On December 1, 2017, the Company entered into a $500 million term loan and amended the loan to extend the maturity date to March 26, 2028. The interest rates applicable to Term Loan A are based upon the Company’s consolidated net leverage ratio or the Company’s Corporate Credit Rating, whichever results in lower pricing, and are determined by either (i) Term SOFR, plus a credit spread adjustment of 0.10%, plus a margin ranging from 1.675% to 2.175%, or (ii) a Base Rate (as defined in the Credit Agreement), plus a margin ranging from 0.675% to 1.175%. As a result of the principal prepayment of $174.8 million on Term Loan A in October 2022, principal amortization payments are no longer due on a quarterly basis, and the remaining principal balance is due at maturity. Interest is payable quarterly or, if earlier, at the end of the applicable interest period in arrears on any outstanding borrowings under Term Loan A. Term Loan A is subject to substantially the same covenants as the Revolving Credit Facility, and also has the same Guarantor Subsidiaries.
Term Loan A-1 — On December 1, 2017, the Company entered into a term loan and amended the loan amount to $930 million and extended the maturity date to March 26, 2026. The interest rates applicable to Term Loan A-1 are the same as those applicable to the Revolving Credit Facility (other than, for the avoidance of doubt, the unused fee). As a result of the principal prepayment of $325.2 million on Term Loan A-1 in October 2022, principal amortization payments are no longer due on a quarterly basis, and the remaining principal balance is due at maturity. Interest is payable quarterly or, if earlier, at the end of the applicable interest period in arrears on any outstanding borrowing under Term Loan A-1. Term Loan A-1 is subject to substantially the same covenants as the Revolving Credit Facility, and has the same Guarantor Subsidiaries.
2028 Notes — On September 9, 2020, the Company completed its public offering of $500 million aggregate principal amount of the 2028 Notes. The 2028 Notes pay interest at the rate of 4.000% per annum and mature on September 1, 2028. Interest is payable on the 2028 Notes on March 1 and September 1 of each year.
The Company may redeem some or all of the 2028 Notes at redemption prices set forth in the Indenture, plus accrued and unpaid interest to the redemption date. Subject to certain limitations, in the event of a change of control of the Company, the Company will be required to make an offer to purchase the 2028 Notes at a purchase price equal to 101% of the principal amount of the 2028 Notes, plus accrued and unpaid interest to the date of purchase.
The Company issued the 2028 Notes pursuant to a single base Indenture among the Company, the Guarantor Subsidiaries, and the Trustee. The Indenture provides, among other things, that the 2028 Notes will be senior unsecured obligations of the Company. The Company’s payment obligations under the 2028 Notes are fully and unconditionally, as well as joint and severally, guaranteed on a senior unsecured basis by the Guarantor Subsidiaries, in addition to any future domestic subsidiaries that guarantee or become borrowers under its credit facility or guarantee certain other indebtedness incurred by the Company or its restricted subsidiaries.
The Indenture governing the 2028 Notes contains customary event of default provisions (including, without limitation, defaults relating to the failure to pay at final maturity or the acceleration of certain other indebtedness). If an event of default occurs and is continuing, the trustee under the Indenture or holders of at least 25% in principal amount of such notes may declare the principal amount and accrued and unpaid interest, if any, on all such notes to be due and payable. The Indenture also contains restrictive covenants that, among other things, limit the ability of the Company and the Guarantor Subsidiaries to: (i) incur additional indebtedness and issue certain preferred shares, (ii) make certain distributions, investments and other restricted payments, (iii) sell certain assets, (iv) agree to restrictions on the ability of restricted subsidiaries to make payments to the Company, (v) create liens, (vi) merge, consolidate or sell substantially all of the Company’s assets (vii) enter into certain transactions with affiliates, and (viii) engage in certain sale and leaseback transactions. The foregoing limitations are subject to exceptions as set forth in the Indenture. In addition, if in the future, the 2028 Notes have an investment grade credit rating by both Moody’s Investors Services, Inc. and Standard & Poor’s Ratings Services, certain of these covenants will, thereafter, no longer apply to the 2028 Notes for so long as the 2028 Notes are rated investment grade by the two rating agencies.
TREEHOUSE FOODS, INC.
NOTES TO CONSOLIDATED FINANCIAL STATEMENTS – (Continued)
Interest Rate Swap Agreements — As of December 31, 2024, the Company had entered into long-term interest rate swap agreements to mitigate its variable rate debt exposures. The notional amount of these agreements is $1,750.0 million as of December 31, 2024 and $1,175.0 million as of December 31, 2023. Refer to Note 20 for additional information regarding the Company's interest rate swap agreements.
Fair Value — At December 31, 2024, the aggregate fair value of the Company's total debt was $1,359.8 million and its carrying value was $1,405.0 million. At December 31, 2023, the aggregate fair value of the Company's total debt was $1,350.5 million and its carrying value was $1,405.0 million. The fair values of Term Loan A and Term Loan A-1 were estimated using present value techniques and market-based interest rates and credit spreads. The fair value of the Company's 2028 Notes was estimated based on quoted market prices for similar instruments due to their infrequent trading volume. Accordingly, the fair value of the Company's debt is classified as Level 2 within the valuation hierarchy.
Finance Lease Obligations and Other — The Company owes $4.1 million related to finance leases. Finance lease obligations represent machinery and equipment financing obligations, which are payable in monthly installments of principal and interest, and are collateralized by the related assets financed. Refer to Note 4 for additional information regarding the Company's finance leases.
Deferred Financing Costs — As of December 31, 2024 and December 31, 2023, deferred financing costs of $6.7 million and $9.2 million were included as a direct deduction from outstanding long-term debt. Fees associated with the Revolving Credit Facility are presented in Other assets, net. Deferred financing costs are amortized over their estimated useful lives based on the terms of their respective agreements.
Subsequent Event — On January 17, 2025, the Company entered into the Third Amended and Restated Credit Agreement, dated as of January 17, 2025 (the "New Credit Agreement"), among the Company, the lenders from time to time party thereto and Bank of America, N.A., as Administrative Agent, Swing Line Lender and L/C Issuer.
The New Credit Agreement amends, restates and replaces the Company’s existing Credit Agreement, dated as of December 1, 2017 (as amended from time to time prior to January 17, 2025), pursuant to which the Company obtained a $500.0 million revolving credit facility (the "Revolving Facility"), a $500.0 million term A loan (the "Term A Loan") and a $900.0 million tranche A-1 term loan (the "Tranche A-1 Term Loan" and, together with the Term A Loan, the "Term Loans"). Pursuant to the New Credit Agreement, the Company (i) continued and extended the maturity of the Revolving Facility and the Term Loans, (ii) decreased the aggregate size of the Term A Loan to $480.0 million and (iii) decreased the aggregate size of the Tranche A-1 Term Loan to $425.0 million.
Both the Revolving Facility and the Term Loans mature on January 17, 2030. The initial pricing for the Revolving Facility and the Tranche A-1 Term Loan is determined by Term SOFR plus a margin of 2.00%. Thereafter, the Revolving Facility and the Tranche A-1 Term Loan will bear interest at a rate per annum equal to (i) Term SOFR plus a margin ranging from 1.25% to 2.50% based on the Company’s consolidated net leverage ratio or (ii) a Base Rate (as defined in the New Credit Agreement) plus a margin ranging from 0.25% to 1.50% based on the Company’s consolidated net leverage ratio. The Company will also pay an unused fee on the Revolving Facility at a rate ranging from 0.20% to 0.40% based on the Company’s consolidated net leverage ratio, with the initial unused fee set at 0.30%. The Revolving Facility includes sub-facilities for swing line loans and letters of credit.
The initial pricing for the Term A Loan is determined by Term SOFR plus a margin of 2.275%. Thereafter, the Term A Loan will bear interest at a rate per annum equal to (i) Term SOFR plus a margin ranging from 1.525% to 2.775% based on the Company’s consolidated net leverage ratio or (ii) a Base Rate (as defined in the New Credit Agreement) plus a margin ranging from 0.525% to 1.775% based on the Company’s consolidated net leverage ratio; provided that the Company and Term A Loan lenders may agree to a quoted fixed rate for the Term A Loan at a future date.
The New Credit Agreement contains substantially the same covenants as the prior Credit Agreement other than upsizing of the non-Loan Party (as defined in the New Credit Agreement) investment basket and addition or modification of covenants relating to certain regulatory requirements (including farm credit act). The covenants include a financial covenant requiring that the Company maintains a certain consolidated net leverage ratio and other covenants, including with respect to limitations on liens, investments, indebtedness, mergers, consolidations and acquisitions, dispositions of assets, restricted payments, changes in the nature of the Company’s business, transactions with affiliates, burdensome agreements, use of proceeds, sale and leaseback transactions and amendments to organizational documents. The New Credit Agreement also contains customary representations, warranties and events of default.
TREEHOUSE FOODS, INC.
NOTES TO CONSOLIDATED FINANCIAL STATEMENTS – (Continued)
The Company’s obligations under the New Credit Agreement are guaranteed by substantially all of its wholly-owned domestic subsidiaries.
13. STOCKHOLDERS' EQUITY
Common Stock — The Company has authorized 90.0 million shares of common stock with a par value of $0.01 per share. No dividends have been declared or paid.
Share Repurchase Authorization — On November 13, 2024, the Company announced that the Board of Directors (the "Board") authorized a $400 million stock repurchase program. This authorization is open ended and replaced the Company's previous stock repurchase authorization of $400 million, which was approved by the Board on November 2, 2017 (the "Prior Authorization"). The Company had repurchased approximately $376.5 million of shares of the Company’s common stock under the Prior Authorization. Any repurchases under the program may be made by means of open market transactions, negotiated block transactions, or otherwise, including pursuant to a repurchase plan administered in accordance with Rules 10b5-1 and 10b-18 under the Securities Exchange Act of 1934, as amended (the "Exchange Act"). The size and timing of any repurchases will depend on price, market and business conditions, and other factors. The Company has the ability to make discretionary repurchases up to an annual cap of $150 million, and $393.5 million remained available under the $400 million total authorization as of December 31, 2024. Any shares repurchased will be held as treasury stock.
The following table summarizes the Company's repurchases of its common stock: | | | | | | | | | | | | | | | | | |
| | Year Ended December 31, |
| | 2024 | | 2023 | | 2022 |
| | (In millions, except per share data) |
| Shares repurchased | 4.1 | | 2.3 | | | — | |
| Weighted average price per share | $ | 36.28 | | | $ | 43.38 | | | $ | — | |
| Total cost, excluding excise tax | $ | 149.7 | | | $ | 100.0 | | | $ | — | |
| Excise tax (1) | $ | 1.5 | | | $ | 0.9 | | | $ | — | |
(1)The excise tax accrued in connection with the share repurchases was recorded as an adjustment to the cost basis of repurchased shares in treasury stock and within Accrued expenses on the Company’s Consolidated Balance Sheets.
Preferred Stock — The Company has authorized 10.0 million shares of preferred stock with a par value of $0.01 per share. No preferred stock has been issued.
14. EARNINGS PER SHARE
The following table summarizes the effect of the share-based compensation awards on the weighted average number of shares outstanding used in calculating diluted earnings (loss) per share: | | | | | | | | | | | | | | | | | |
| | Year Ended December 31, |
| | 2024 | | 2023 | | 2022 |
| | (In millions) |
| Weighted average common shares outstanding | 52.2 | | | 55.8 | | | 56.0 | |
| Assumed exercise/vesting of equity awards (1) | 0.4 | | | 0.6 | | | — | |
| Weighted average diluted common shares outstanding | 52.6 | | | 56.4 | | | 56.0 | |
(1)Incremental shares from equity awards are computed by the treasury stock method. For the year ended December 31, 2022, the weighted average common shares outstanding is the same for the computations of both basic and diluted shares outstanding because the Company had a net loss from continuing operations for the period. Equity awards, excluded from our computation of diluted earnings per share because they were anti-dilutive, were 0.6 million, 1.1 million, and 1.4 million for the years ended December 31, 2024, 2023, and 2022, respectively.
TREEHOUSE FOODS, INC.
NOTES TO CONSOLIDATED FINANCIAL STATEMENTS – (Continued)
15. STOCK-BASED COMPENSATION
The Board of Directors adopted, and the Company’s Stockholders approved, the "TreeHouse Foods, Inc. Equity and Incentive Plan" (the "Plan"). Under the Plan, the Compensation Committee may grant awards of various types of compensation, including stock options, restricted stock, restricted stock units, performance shares, performance units, other types of stock-based awards, and other cash-based compensation. The maximum number of shares authorized to be awarded under the Plan is approximately 22.5 million, of which approximately 7.8 million remained available at December 31, 2024.
Total compensation expense related to stock-based payments and the related income tax benefit recognized in Net income (loss) from continuing operations are as follows: | | | | | | | | | | | | | | | | | | | | |
| | Year Ended December 31, |
| | 2024 | | 2023 | | 2022 |
| | (In millions) |
| Compensation expense related to stock-based payments | | $ | 19.1 | | | $ | 24.8 | | | $ | 19.8 | |
| Related income tax benefit | | 4.5 | | | 5.9 | | | 4.7 | |
The Company estimates that certain key executives and all directors will complete the required service conditions associated with their awards. For all other employees, the Company estimates its forfeiture rate based on historical experience.
All amounts below include continuing and discontinued operations.
Stock Options — Stock options granted under the plan during 2022 have a three year vesting schedule, vest one-third on the second anniversary of the grant date and two-thirds on the third anniversary of the grant date, and expire ten years from the grant date. Stock options are generally only granted to employees and non-employee directors.
The following table summarizes stock option activity during 2024: | | | | | | | | | | | | | | | | | | | | | | | | | |
| Employee
Options | | | | Weighted
Average
Exercise
Price | | Weighted
Average
Remaining
Contractual
Term (yrs.) | | Aggregate
Intrinsic
Value |
| | (In thousands) | | | | | | (In millions) |
| Outstanding, at January 1, 2024 | 578 | | | | | $ | 64.20 | | | 5.1 | | $ | — | |
| | | | | | | | | |
| Forfeited | (18) | | | | | 42.69 | | | | | |
| | | | | | | | | |
| Expired | (87) | | | | | 83.24 | | | | | |
| Outstanding, at December 31, 2024 | 473 | | | | | 61.46 | | | 4.7 | | — | |
| Vested/expected to vest, at December 31, 2024 | 468 | | | | | 61.67 | | | 4.7 | | — | |
| Exercisable, at December 31, 2024 | 297 | | | | | 72.57 | | | 3.1 | | — | |
| | | | | | | | | | | | | | | | | |
| | Year Ended December 31, |
| | 2024 | | 2023 | | 2022 |
| | (In millions) |
| Intrinsic value of stock options exercised | $ | — | | | $ | — | | | $ | 0.1 | |
| | | | | |
Unrecognized compensation costs related to nonvested options totaled $0.5 million at December 31, 2024 and are expected to be recognized over a weighted average period of 0.4 years. There was no tax benefit recognized from stock option exercises for the years ended December 31, 2024, 2023, and 2022.
TREEHOUSE FOODS, INC.
NOTES TO CONSOLIDATED FINANCIAL STATEMENTS – (Continued)
Stock options are valued using the Black-Scholes option pricing model. Expected volatility is based on the historical volatility of the Company’s stock price. The risk-free rate for periods within the contractual life of the stock options is based on the U.S. Treasury yield curve in effect at the time of the grant. We based our expected term on the simplified method as described under the SEC Staff Accounting Bulletin No. 107. The weighted average assumptions used to calculate the value of the stock option awards granted are presented as follows (no stock options were granted in 2024 and 2023):
| | | | | |
| Year Ended December 31, |
| 2022 |
| Dividend yield | 0 | % |
| Risk-free rate | 2.93 | % |
| Expected volatility | 38.54 | % |
| Expected term (in years) | 6.33 |
Restricted Stock Units — Employee restricted stock unit awards generally vest based on the passage of time in approximately three equal installments on each of the first three anniversaries of the grant date.
Non-employee director restricted stock units generally vest on the first anniversary of the grant date. Certain non-employee directors have elected to defer receipt of their awards until either their departure from the Board of Directors or a specified date beyond the first anniversary of the grant date.
The following table summarizes the restricted stock unit activity during the year ended December 31, 2024: | | | | | | | | | | | | | | | | | | | | | | | |
| Employee
Restricted
Stock Units | | Weighted
Average
Grant Date
Fair Value | | Director
Restricted
Stock Units | | Weighted
Average
Grant Date
Fair Value |
| | (In thousands) | | | | (In thousands) | | |
| Nonvested, at January 1, 2024 | 573 | | | $ | 41.57 | | | 45 | | | $ | 50.14 | |
| Granted | 511 | | | 37.12 | | | 35 | | | 36.10 | |
| Vested | (255) | | | 41.30 | | | (18) | | | 51.87 | |
| Forfeited | (133) | | | 39.42 | | | — | | | — | |
| Nonvested, at December 31, 2024 | 696 | | | 38.82 | | | 62 | | | 41.73 | |
| Earned and deferred, at December 31, 2024 | | | | | 28 | | | 48.62 | |
| | | | | | | | | | | | | | | | | |
| | Year Ended December 31, |
| | 2024 | | 2023 | | 2022 |
| | (In millions) |
| Fair value of vested restricted stock units | $ | 10.3 | | | $ | 17.2 | | | $ | 13.1 | |
| Tax benefit recognized from vested restricted stock units | 1.7 | | | 2.9 | | | 2.5 | |
Unrecognized compensation costs related to nonvested restricted stock units are approximately $17.9 million as of December 31, 2024 and will be recognized over a weighted average period of 1.7 years. The grant date fair value of the awards is equal to the Company's closing stock price on the grant date.
Performance Units — Performance unit awards are granted to certain members of management. These awards contain both service and performance conditions, and for certain executive members of management, a market condition, in each case as described below.
•For awards granted in years prior to 2020, for each year of the three-year performance period, one-third of the units will accrue, multiplied by a predefined percentage generally between 0% and 200%, depending on the achievement of certain operating performance measures. Accrued shares are not earned until the end of the full three-year performance period.
TREEHOUSE FOODS, INC.
NOTES TO CONSOLIDATED FINANCIAL STATEMENTS – (Continued)
•For performance unit awards granted in 2020 through 2023, performance goals are set and measured annually with one-quarter of the units eligible to accrue for each year in the three-year performance period. Accrued shares are earned at the end of each performance period but remain subject to forfeiture until the third anniversary of the grant date. Additionally, for the cumulative three-year performance period, one-quarter of the units will accrue. For both the annual and cumulative shares, the earned shares are equal to the number of units granted multiplied by a predefined percentage generally between 0% and 200%, depending on the achievement of certain operating performance measures.
•For performance unit awards granted in 2024, performance goals were established upfront and will be measured over a cumulative three-year performance period. The units will accrue each month, multiplied by a predefined percentage between 0% and 200%, depending on the achievement of certain operating performance measures. Accrued shares are not earned until the end of the full three-year performance period and remain subject to forfeiture until the third anniversary of the grant date.
•For performance unit awards granted in 2021 through 2024, certain executive members of management received awards that were measured using a relative total shareholder return ("TSR") market condition over a three-year performance goal. The units will accrue, multiplied by a predefined percentage between 0% and 150% for years 2021 through 2023 and between 0% and 200% for 2024, for the relative TSR measure, depending on the achievement attainment over the three-year performance period based on the Company’s absolute annualized TSR relative to the annualized TSR of a Peer Group. The fair value of the portion of the awards based on relative TSR was valued using a Monte Carlo simulation model with a grant date fair value of $37.56 on approximately 35,800 units granted in 2024.
•During the second quarter of 2022, the Company made grants to certain of the Company’s named executive officers and certain other executive officers of performance-based restricted stock units (the "PBRSU Awards"). The PBRSU Awards included a relative TSR market condition over a two-year performance period beginning on the date of grant. The units accrued over the two-year performance period and were multiplied by a predefined percentage between 0% to 450% for the relative TSR measure, depending on the achievement attainment over the two-year performance period based on Company’s absolute annualized TSR relative to the annualized TSR of the S&P Food & Beverage Select Industry Index (the "Index"). The fair value of the awards was valued using a Monte Carlo simulation model with a weighted average grant-date fair value of $58.36 on approximately 239,300 units granted in 2022. The PBRSU Awards vested in the second quarter of 2024. Over the two-year performance period, the achievement attainment percentage was 0%, resulting in no payout of the awards.
These awards will be converted to stock or cash, at the discretion of the Compensation Committee, generally, on the third anniversary of the grant date with the exception of the PBRSU Awards on the second anniversary. The Company intends to settle these awards in stock and has the shares available to do so.
Performance unit awards with market conditions are valued using a Monte Carlo simulation model. Expected volatility is based on the historical volatility of the Company’s stock price, average Peer Group stock price, or the total return value of the Index. The risk-free rate is based on the U.S. Treasury yield curve in effect at the time of the grant with a term equivalent to the expected term of the award. The expected term is the time period from the grant date to the end of the performance period. The weighted average assumptions used in the Monte Carlo simulations were as follows:
| | | | | | | | | | | | | | | | | | | | |
| | Year Ended December 31, |
| | 2024 | | 2023 | | 2022 |
| Dividend yield | | 0 | % | | 0 | % | | 0 | % |
| Risk-free rate | | 4.50 | % | | 3.87 | % | | 2.36 | % |
| Expected volatility (TreeHouse Foods, Inc.) | | 34.34 | % | | 35.17 | % | | 36.84 | % |
| Expected volatility (Peer Group) | | 33.56 | % | | 35.04 | % | | 36.64 | % |
| Expected volatility (Index) | | N/A | | N/A | | 16.30 | % |
| Expected term (in years) | | 2.79 | | 2.80 | | 2.14 |
TREEHOUSE FOODS, INC.
NOTES TO CONSOLIDATED FINANCIAL STATEMENTS – (Continued)
The following table summarizes the performance unit activity during the year ended December 31, 2024: | | | | | | | | | | | |
| | Performance
Units | | Weighted
Average
Grant Date
Fair Value |
| | (In thousands) | | |
| Nonvested, at January 1, 2024 | 534 | | | $ | 47.44 | |
| Granted | 143 | | | 36.95 | |
| Vested | (45) | | | 43.45 | |
| Forfeited | (254) | | | 56.17 | |
| Nonvested, at December 31, 2024 | 378 | | | 38.04 | |
| | | | | | | | | | | | | | | | | |
| | Year Ended December 31, |
| | 2024 | | 2023 | | 2022 |
| | (In millions) |
| Fair value of vested performance units | $ | 1.8 | | | $ | 5.0 | | | $ | 2.4 | |
| Tax benefit recognized from performance units vested | 0.1 | | | 0.4 | | | 0.3 | |
Unrecognized compensation costs related to nonvested performance units are estimated to be approximately $4.6 million as of December 31, 2024 and are expected to be recognized over a weighted average period of 1.2 years. The fair value of the portion of the awards earned based on market conditions were valued using a Monte Carlo simulation model. For other awards, the grant date fair value is equal to the Company's closing stock price on the date of grant.
16. ACCUMULATED OTHER COMPREHENSIVE LOSS
Accumulated other comprehensive loss consists of the following components, all of which are net of tax: | | | | | | | | | | | | | | | | | |
| | Foreign
Currency
Translation (1) | | Unrecognized
Pension and
Postretirement
Benefits (2) | | Accumulated
Other
Comprehensive
Loss |
| | (In millions) |
| Balance at January 1, 2022 | $ | (70.9) | | | $ | 17.3 | | | $ | (53.6) | |
| Other comprehensive loss before reclassifications | (11.5) | | | (14.3) | | | (25.8) | |
| Reclassifications from accumulated other comprehensive loss (3) (4) | (4.6) | | | 0.3 | | | (4.3) | |
| | | | | |
| Other comprehensive loss | (16.1) | | | (14.0) | | | (30.1) | |
| Balance at December 31, 2022 | (87.0) | | | 3.3 | | | (83.7) | |
| | | | | |
| | | | | |
| | | | | |
| Other comprehensive income | 2.8 | | | 4.8 | | | 7.6 | |
| Balance at December 31, 2023 | (84.2) | | | 8.1 | | | (76.1) | |
| | | | | |
| | | | | |
| | | | | |
| Other comprehensive (loss) income | (8.7) | | | 2.1 | | | (6.6) | |
| Balance at December 31, 2024 | $ | (92.9) | | | $ | 10.2 | | | $ | (82.7) | |
(1)The tax impact of the foreign currency translation adjustment was insignificant for the years ended December 31, 2024, 2023, and 2022.
(2)The unrecognized pension and postretirement benefits are presented net of tax of $0.7 million, $1.6 million, and $(4.5) million for the years ended December 31, 2024, 2023, and 2022 respectively.
(3)Refer to Note 17 for additional information regarding reclassifications of unrecognized pension and postretirement benefits.
(4)In connection with the completion of the sale of a significant portion of the Company’s Meal Preparation business on October 3, 2022, the Company completed the liquidation of its investment in its Italian subsidiary. Accordingly, $4.6 million of accumulated foreign currency translation adjustments were reclassified from accumulated other comprehensive loss and into earnings. This amount was recognized within Net loss from discontinued operations in the Consolidated Statements of Operations for the year ended December 31, 2022.
TREEHOUSE FOODS, INC.
NOTES TO CONSOLIDATED FINANCIAL STATEMENTS – (Continued)
17. EMPLOYEE PENSION AND POSTRETIREMENT BENEFIT PLANS
Defined Contribution Plans — Certain of our union and non-union employees participate in savings and profit sharing plans. These plans generally provide for salary reduction contributions to the plans on behalf of the participants of between 1% and 80% of a participant’s annual compensation and provide for employer matching and non-matching contributions. The Company established tax-qualified defined contribution plans and group registered savings plans to manage the assets. On a continuing operations basis, for the years ended December 31, 2024, 2023, and 2022, the Company made matching and non-matching contributions to the plans of $16.0 million, $14.0 million, and $14.3 million, respectively.
Pension and Postretirement Benefits — Certain employees and retirees participate in pension and other postretirement benefit plans. Employee benefit plan obligations and expenses included in the Consolidated Financial Statements are determined based on plan assumptions, employee demographic data, including years of service and compensation, benefits and claims paid, and employer contributions. The information below includes the activities of the Company's continuing and discontinued operations.
Pension benefits for eligible salaried and non-union employees were frozen in 2002 for years of creditable service. For these employees, incremental pension benefits are only earned for changes in compensation affecting final average pay. Pension benefits earned by union employees covered by collective bargaining agreements, but not participating in multiemployer pension plans, are earned based on creditable years of service and the specified benefit amounts negotiated as part of the collective bargaining agreements. The Company’s funding policy provides that annual contributions to the pension plan master trust will be at least equal to the minimum amounts required by Employee Retirement Income Security Act of 1974, as amended. The Company estimates that its 2025 contributions to its pension plans will be $1.9 million. The measurement date for the defined benefit pension plans is December 31.
Certain employees participate in benefit programs that provide certain health care and life insurance benefits for retired employees and their eligible dependents. The plans are unfunded. The Company estimates that its 2025 contributions to its postretirement benefit plans will be $1.2 million. The measurement date for the other postretirement benefit plans is December 31.
The Company established a tax-qualified pension plan and master trust to manage the portion of the pension plan assets related to eligible salaried, non-union, and union employees not covered by a multiemployer pension plan. We also retain investment consultants to assist our Benefit Plans Committee with formulating a long-term investment policy for the master trust. The expected long-term rate of return on assets is based on projecting long-term market returns for the various asset classes in which the plan’s assets are invested, weighted by the target asset allocations. The estimated ranges are primarily based on observations of historical asset returns and their historical volatility. In determining the expected returns, we also consider consensus forecasts of certain market and economic factors that influence returns, such as inflation, gross domestic product trends, and dividend yields. Active management of the plan assets may result in adjustments to the historical returns. We review the rate of return assumption annually.
Our investment objectives are to minimize the volatility of the value of our pension assets relative to our pension liabilities and to ensure assets are sufficient to pay plan benefits. We have a broad pension de-risking strategy intended to align the characteristics of our assets relative to our liabilities. The strategy targets investments depending on the funded status of the obligation. We anticipate this strategy will continue in future years and will be dependent upon market conditions and plan characteristics.
In October 2023, the pension plans completed an annuity lift-out, a transaction that provided for the purchase of an annuity contract to fund pension plan annuities of retirees, as part of our de-risking strategy. This annuity lift-out impacted approximately 1,300 retirees, as well as reduced $33.5 million in pension obligations and $33.5 million in plan assets which were transferred to an insurance company. The transfer of plan assets is considered to be a lump sum settlement payment that reduced the pension plan’s projected benefit obligation in 2023.
At December 31, 2024, our master trust was invested as follows: investments in fixed income were at 61%; investments in equity securities were at 27%; investments in hedge funds were at 4%; investments in real estate were at 2%; and cash and cash equivalents were 6%. The allocation of our master trust investments as of December 31, 2024 is generally consistent with the targets set forth by our Benefit Plans Committee.
TREEHOUSE FOODS, INC.
NOTES TO CONSOLIDATED FINANCIAL STATEMENTS – (Continued)
Pension plan assets are categorized based on the following fair value hierarchy:
•Level 1: Observable inputs that reflect quoted prices (unadjusted) for identical assets or liabilities in active markets.
•Level 2: Inputs other than quoted priced included in Level 1 that are observable for the asset or liability through corroboration with observable market data.
•Level 3: Unobservable inputs, which valued based on our estimates of assumptions that market participants would use in pricing the assets or liability.
Investments that are valued using net asset value (NAV) (or its equivalent) practical expedient have not been categorized in the fair value hierarchy but are included to reconcile to the amounts presented in our Obligations and Funded Status table.
The fair value of the Company’s pension plan assets at December 31, 2024 and 2023 is as follows: | | | | | | | | | | | | | | | | | | | | | | | | | | | |
| December 31, 2024 | | December 31, 2023 |
| Total | | Level 1 | | | | Total | | Level 1 | | |
| (in millions) |
| Cash and cash equivalents | $ | 2.7 | | | $ | 2.7 | | | | | $ | 1.3 | | | $ | 1.3 | | | |
| Equity funds | 50.3 | | | 50.3 | | | | | 53.6 | | | 53.6 | | | |
| Fixed income funds | 7.1 | | | 7.1 | | | | | 7.5 | | | 7.5 | | | |
| Real estate funds | 4.3 | | | 4.3 | | | | | 4.5 | | | 4.5 | | | |
| | | | | | | | | | | |
| | | | | | | | | | | |
| Fair value of plan assets in the fair value hierarchy | 64.4 | | | 64.4 | | | | | 66.9 | | | 66.9 | | | |
| | | | | | | | | | | |
| Cash and cash equivalents | 7.5 | | | | | | | 30.7 | | | | | |
| | | | | | | | | | | |
| Fixed income funds | 105.5 | | | | | | | 92.4 | | | | | |
| Hedge funds | 7.8 | | | | | | | 6.9 | | | | | |
| Investments measured at NAV | 120.8 | | | | | | | 130.0 | | | | | |
| Total | $ | 185.2 | | | | | | | $ | 196.9 | | | | | |
Cash and cash equivalents - Includes cash and cash equivalents such as short-term marketable securities. Cash and cash equivalents include money market funds traded in active markets that were categorized as level 1. Other cash and cash equivalents valued based upon NAV are included as a reconciling item to the fair value table.
Equity funds - Includes domestic and international equity funds traded in active markets and are categorized as level 1 investments.
Fixed income funds - Includes fixed income funds that are primarily made up of various fixed income securities traded in active markets and are categorized as level 1 investments. Other fixed income funds valued based upon NAV are included as a reconciling item to the fair value table.
Real estate funds - Includes investments in real estate funds traded in active markets and are categorized as level 1 investments.
Hedge funds - Includes hedge funds that are not traded in active markets and are valued based upon NAV and included as a reconciling item to the fair value table.
TREEHOUSE FOODS, INC.
NOTES TO CONSOLIDATED FINANCIAL STATEMENTS – (Continued)
The following table summarizes information about our pension and postretirement benefit plans for the years ended December 31, 2024 and 2023: | | | | | | | | | | | | | | | | | | | | | | | |
| | Pension Benefits | | Postretirement
Benefits |
| | 2024 | | 2023 | | 2024 | | 2023 |
| | (in millions) |
| Change in projected benefit obligation: | | | | | | | |
| Projected benefit obligation, at beginning of year | $ | 216.9 | | | $ | 254.8 | | | $ | 15.1 | | | $ | 17.8 | |
| Service cost | 0.3 | | | 0.3 | | | — | | | — | |
| Interest cost | 10.2 | | | 12.3 | | | 0.7 | | | 0.8 | |
| | | | | | | |
| | | | | | | |
| Actuarial (gain) loss (1) | (12.1) | | | 2.8 | | | (0.4) | | | (2.2) | |
| Annuity lift-out (2) | — | | | (33.5) | | | — | | | — | |
| Benefits paid | (15.8) | | | (19.8) | | | (1.0) | | | (1.3) | |
| Projected benefit obligation, at end of year | $ | 199.5 | | | $ | 216.9 | | | $ | 14.4 | | | $ | 15.1 | |
| Change in plan assets: | | | | | | | |
| Fair value of plan assets, at beginning of year | $ | 196.9 | | | $ | 229.9 | | | $ | — | | | $ | — | |
| Actual gain on plan assets | 1.2 | | | 19.6 | | | — | | | — | |
| Company contributions | 2.9 | | | 0.7 | | | 1.1 | | | 1.2 | |
| Annuity lift-out (2) | — | | | (33.5) | | | — | | | — | |
| Benefits paid | (15.8) | | | (19.8) | | | (1.1) | | | (1.2) | |
| Fair value of plan assets, at end of year | $ | 185.2 | | | $ | 196.9 | | | $ | — | | | $ | — | |
| Funded status of the plan | $ | (14.3) | | | $ | (20.0) | | | $ | (14.4) | | | $ | (15.1) | |
| Amounts recognized in the Consolidated Balance Sheets: | | | | | | | |
| | | | | | | |
| Current liability | $ | (0.7) | | | $ | (0.7) | | | $ | (1.2) | | | $ | (1.2) | |
| Noncurrent liability | (13.6) | | | (19.3) | | | (13.2) | | | (13.9) | |
| Net amount recognized | $ | (14.3) | | | $ | (20.0) | | | $ | (14.4) | | | $ | (15.1) | |
Amounts recognized in Accumulated other
comprehensive loss: | | | | | | | |
| Net actuarial gain | $ | (4.8) | | | $ | (1.9) | | | $ | (8.8) | | | $ | (8.9) | |
| Prior service cost | — | | | — | | | — | | | — | |
| Total, before tax effect | $ | (4.8) | | | $ | (1.9) | | | $ | (8.8) | | | $ | (8.9) | |
|
(1)The actuarial gains and losses for the pension plans in 2024 and 2023 were primarily related to a change in the discount rate used to measure the benefit obligations of those plans. For the postretirement benefits plan, the 2024 actuarial gain was primarily due to the change in discount rate used to measure the benefit obligation, while the 2023 actuarial gain was primarily due to the change in the assumed health care costs for the plan.
(2)Annuity lift-out was a 2023 transaction that provided for the purchase of an annuity contract to fund pension plan annuities of retirees.
| | | | | | | | | | | |
| | Pension Benefits |
| | 2024 | | 2023 |
| | (In millions) |
| Accumulated benefit obligation | $ | 199.4 | | | $ | 216.7 | |
| | | | | | | | | | | | | | | | | | | | | | | |
| | Pension Benefits | | Postretirement Benefits |
| | 2024 | | 2023 | | 2024 | | 2023 |
| Weighted average assumptions used to determine the pension benefit obligations: | | | | | | | |
| Discount rate (1) | 5.61 | % | | 4.96 | % | | 5.60 | % | | 4.95 | % |
| Rate of compensation increases | 3.10 | % | | 3.10 | % | | — | | | — | |
(1)For the year ended December 31, 2023, the Company recognized a settlement charge related to the pension plan annuity lift-out. The discount rate for the settlement charge had a weighted average of 5.81%.
TREEHOUSE FOODS, INC.
NOTES TO CONSOLIDATED FINANCIAL STATEMENTS – (Continued)
The key actuarial assumptions used to determine the postretirement benefit obligations as of December 31, 2024 and 2023 are as follows: | | | | | | | | | | | | | | | | | | | | | | | |
| | 2024 | | 2023 |
| | Pre-65 | | Post-65 | | Pre-65 | | Post-65 |
| Health care cost trend rates: | | | | | | | |
| Health care cost trend rate for next year | 8.63 | % | | 9.73 | % | | 7.16 | % | | 7.93 | % |
| Ultimate rate | 4.50 | % | | 4.50 | % | | 4.50 | % | | 4.50 | % |
| Year ultimate rate achieved | 2034 | | 2034 | | 2032 | | 2032 |
The following table summarizes the net periodic cost of our pension and postretirement benefit plans for the years ended December 31, 2024, 2023, and 2022: | | | | | | | | | | | | | | | | | | | | | | | | | | | | | | | | | | | |
| | Pension Benefits | | Postretirement Benefits |
| | 2024 | | 2023 | | 2022 | | 2024 | | 2023 | | 2022 |
| | (In millions) | | (In millions) |
| Components of net periodic costs: | | | | | | | | | | | |
| Service cost | $ | 0.3 | | | $ | 0.3 | | | $ | 0.5 | | | $ | — | | | $ | — | | | $ | — | |
| Interest cost | 10.2 | | | 12.3 | | | 9.2 | | | 0.7 | | | 0.8 | | | 0.6 | |
| Expected return on plan assets | (10.8) | | | (13.0) | | | (15.1) | | | — | | | — | | | — | |
| Amortization of unrecognized prior service cost | — | | | 0.1 | | | 0.1 | | | — | | | — | | | — | |
| Amortization of unrecognized net loss (gain) | 0.4 | | | 0.4 | | | 0.3 | | | (0.4) | | | (0.5) | | | — | |
| Annuity lift-out (1) | — | | | 0.3 | | | — | | | — | | | — | | | — | |
| | | | | | | | | | | |
| Net periodic cost (benefit) | $ | 0.1 | | | $ | 0.4 | | | $ | (5.0) | | | $ | 0.3 | | | $ | 0.3 | | | $ | 0.6 | |
(1)For the year ended December 31, 2023, the Company recognized a settlement charge related to the annuity lift-out within Other expense (income), net in the Consolidated Statements of Operations.
| | | | | | | | | | | | | | | | | | | | | | | | | | | | | | | | | | | |
| | Pension Benefits | | Postretirement Benefits |
| | 2024 | | 2023 | | 2022 | | 2024 | | 2023 | | 2022 |
| Weighted average assumptions used to determine the periodic benefit costs: | | | | | | | | | | | |
| Discount rate (1) | 4.96 | % | | 5.16 | % | | 2.86 | % | | 4.95 | % | | 5.15 | % | | 2.80 | % |
| Rate of compensation increases | 3.10 | % | | 3.10 | % | | 3.00 | % | | — | | — | | — |
| Expected return on plan assets | 5.75 | % | | 6.25 | % | | 4.85 | % | | — | | — | | — |
(1)For the year ended December 31, 2023, the Company recognized a settlement charge related to the pension plan annuity lift-out. The discount rate for the settlement charge had a weighted average of 5.81%.
Estimated future pension and postretirement benefit payments from the plans are as follows: | | | | | | | | |
| | Pension
Benefits | Postretirement
Benefits |
| | (In millions) |
| 2025 | $ | 17.1 | | $ | 1.2 | |
| 2026 | 16.6 | | 1.2 | |
| 2027 | 16.6 | | 1.2 | |
| 2028 | 16.3 | | 1.2 | |
| 2029 | 16.1 | | 1.3 | |
| 2030-2034 | 75.3 | | 6.1 | |
TREEHOUSE FOODS, INC.
NOTES TO CONSOLIDATED FINANCIAL STATEMENTS – (Continued)
Multiemployer Pension Plans - The Company contributes to several multiemployer pension plans on behalf of employees covered by collective bargaining agreements. These plans are administered jointly by management and union representatives and cover substantially all full-time and certain part-time union employees who are not covered by other plans. The risks of participating in multiemployer plans are different from single-employer plans in the following aspects: (1) assets contributed to the multiemployer plan by one employer may be used to provide benefits to employees of other participating employers, (2) if a participating employer stops contributing to the plan, the unfunded obligations of the plan may be borne by the remaining participating employers, and (3) if the Company chooses to stop participating in a multiemployer plan, we could, under certain circumstances, be liable for unfunded vested benefits or other expenses of jointly administered union/management plans.
The Company’s participation in multiemployer pension plans is outlined in the table below. The EIN column provides the Employer Identification Number ("EIN") of each plan. Unless otherwise noted, the most recent Pension Protection Act zone status available in December 31, 2024 and 2023 is for the plan’s years ended December 31, 2023, and 2022, respectively. The zone status is based on information that the Company received from the plan, and is certified by the plan’s actuary. Among other factors, plans in the red zone are considered to be in "critical status" and are generally less than 65% funded, plans in the yellow zone are 65% to 80% funded, and plans in the green zone are at least 80% funded. The FIP column indicates plans for which a financial improvement plan ("FIP") is either pending or has been implemented. The Surcharge Imposed column indicates whether the Company contribution rate for its fiscal year that ended on December 31, 2024 included an amount in addition to the contribution rate specified in the applicable collective bargaining agreement, as imposed by a plan in "critical status," in accordance with the requirements of the Internal Revenue Code. The last column lists the expiration dates of the collective bargaining agreements to which the plans are subject. There have been no other significant changes in the number of Company employees covered by the multiemployer plans or other significant events that would affect the comparability of contributions to the plans.
The following table lists information about the Company's individually significant multiemployer pension plans: | | | | | | | | | | | | | | | | | | | | | | | | | | | | | | | | | | | | | | | | | | | | | | | | | | | | | |
| | | | Pension
Protection
Act
Zone Status | | | | TreeHouse Foods | | | | Expiration
Date |
| | EIN / Pension | | Plan Year Ended
December 31, | | FIP
Implemented | | Contributions
(in millions) | | Surcharge
Imposed | | Of Collective
Bargaining |
| Plan Name | Plan Number | | 2023 | | 2022 | | (yes or no) | | 2024 | | 2023 | | 2022 | | (yes or no) | | Agreement(s) |
| Bakery and Confectionery | | | | | | | | | | | | | | | | | |
| Union and Industry | | | | | | | | | | | | | | | | | 7/17/2027 |
| International Pension Fund | 52-6118572 / 001 | | Red | | Red | | Yes | | $ | 2.0 | | | $ | 1.7 | | | $ | 1.8 | | | No | | 6/5/2027 |
| Central States Southeast and | | | | | | | | | | | | | | | | | |
| Southwest Areas Pension | | | | | | | | | | | | | | | | | |
| Fund | 36-6044243 / 001 | | Red | | Red | | Yes | | 1.0 | | | 1.3 | | | 1.1 | | | No | | 12/31/2025 |
| Rockford Area Dairy | | | | | | | | | | | | | | | | | |
| Industry Local 754, Intl. | | | | | | | | | | | | | | | | | |
| Brotherhood of Teamsters | | | | | | | | | | | | | | | | | |
| Retirement Pension Plan (1) | 36-6067654 / 001 | | Green | | Green | | No | | 0.7 | | | 0.6 | | | 0.6 | | | No | | 4/30/2026 |
(1)A subsidiary of the Company was listed in the plan’s Form 5500 as providing more than 5.0% of the total contributions for the plan's year ended December 31, 2023 and 2022.
At the date these financial statements were issued, Forms 5500 were not available for the multiemployer pension plans for the plan year ended December 31, 2024. No withdrawal liabilities were established related to multiemployer pension plans, as withdrawal from the remaining plans is not probable as of December 31, 2024.
Multiemployer Plans Other Than Pensions - The Company contributes to certain multiemployer postretirement benefit plans other than pensions on behalf of employees covered by collective bargaining agreements. These plans are administered jointly by management and union representatives and cover all eligible retirees. These plans are primarily health and welfare funds and carry the same multiemployer risks as identified at the beginning of this Note. Total contributions to these plans were $3.0 million, $2.4 million, and $2.5 million for the years ended December 31, 2024, 2023, and 2022, respectively.
TREEHOUSE FOODS, INC.
NOTES TO CONSOLIDATED FINANCIAL STATEMENTS – (Continued)
18. OTHER OPERATING EXPENSE, NET
The Company incurred other operating expense for the years ended December 31, 2024, 2023, and 2022, which consisted of the following: | | | | | | | | | | | | | | | | | |
| | Year Ended December 31, |
| | 2024 | | 2023 | | 2022 |
| | (In millions) |
| Growth, reinvestment, and restructuring programs (1) | $ | 26.7 | | | $ | 46.1 | | | $ | 84.6 | |
| TSA income (2) | (0.6) | | | (41.7) | | | (22.7) | |
| | | | | |
| Other | — | | | 0.9 | | | 0.9 | |
| Total other operating expense, net | $ | 26.1 | | | $ | 5.3 | | | $ | 62.8 | |
(1)Refer to Note 3 for additional information.
(2)Refer to Note 7 for additional information.
19. COMMITMENTS AND CONTINGENCIES
Griddle Product Recall and Related Costs
On October 18, 2024, the Company initiated a voluntary recall of certain frozen waffle products produced at its Brantford, Ontario, Canada facility, and on October 22, 2024, the Company expanded its voluntary recall to include all products manufactured at the Brantford facility that are still within their shelf-life. These frozen griddle products may have had the potential to be contaminated with Listeria monocytogenes. For the year ended December 31, 2024, the Company recognized incremental charges of $36.6 million related to the product recall. These charges were comprised of product returns as a reduction in Net sales of $21.0 million, and inventory write-offs, plant shutdown charges, and other costs, including logistics resulting in an impact of $15.6 million in Cost of sales within the Consolidated Statements of Operations. As of December 31, 2024, a $9.6 million product recall liability is included within Accrued expenses in the Consolidated Balance Sheets.
The Company is seeking to recover the recall-related costs through its insurance coverage, and such recoveries are recorded in the period in which the recoveries are determined to be probable of realization. The amount of the product recall liability represents the probable and reasonably estimable costs directly associated with the recall. However, the total actual costs could differ materially due to uncertainties related to customer return rates, additional recall expenses, litigation, or other unforeseen events.
Broth Product Recall and Related Costs
On September 22, 2023, the Company initiated a voluntary recall of certain broth products produced at its Cambridge, Maryland facility. These broth products may have had the potential for non-pathogenic microbial contamination due to lack of sterility assurance. During the fourth quarter of 2024, the Company recognized a $10.0 million insurance recovery in Cost of sales in the Consolidated Statements of Operations. The Company is seeking to recover additional recall-related costs through its insurance coverage, and such recoveries are recorded in the period in which the recoveries are determined to be probable of realization.
Shareholder Derivative Actions
The Company, as nominal defendant, and certain of its former officers are parties to a consolidated shareholder derivative suit captioned Wells and the City of Ann Arbor Employees’ Retirement System v. Reed, et al., Case Nos. 2016-CH-16359 and 2019-CH-06753 (Circuit Court of Cook County, Illinois).
The consolidated lawsuit alleges that TreeHouse, under the authority and control of the individual defendants: (i) made certain false and misleading statements regarding the Company's business, operations, and future prospects; and (ii) failed to disclose that (a) the Company's private label business was underperforming; (b) the Company's Flagstone Foods business was underperforming; (c) the Company's acquisition strategy was underperforming; (d) the Company had overstated its full-year 2016 guidance; and (e) TreeHouse's statements lacked reasonable basis. The complaints allege, among other things, that these actions artificially inflated the market price of TreeHouse common stock and resulted in harm to the Company.
TREEHOUSE FOODS, INC.
NOTES TO CONSOLIDATED FINANCIAL STATEMENTS – (Continued)
On August 26, 2022, plaintiffs in the consolidated Wells case filed a second consolidated amended complaint, which was dismissed in its entirety with prejudice on March 15, 2023. The plaintiffs filed a notice of appeal on March 16, 2023. On March 22, 2024, the Appellate Court reversed the state trial court’s dismissal of the consolidated amended complaint and remanded to the state trial court for further proceedings. On October 1, 2024, the parties advised the state trial court of their agreement in principle to settle the action, and on the same day, the court entered an order staying all proceedings pending the submission of a motion for preliminary settlement approval. On December 18, 2024, the court entered an order preliminarily approving the settlement, and set a final settlement approval hearing on March 10, 2025.
Other Claims
In February 2014, TreeHouse, along with its 100% owned subsidiaries, Bay Valley Foods, LLC and Sturm Foods, Inc., filed suit against Keurig Dr. Pepper Inc.'s wholly-owned subsidiary, Keurig Green Mountain ("KGM"), in the U.S. District Court for the Southern District of New York captioned TreeHouse Foods, Inc. et al. v. Green Mountain Coffee Roasters, Inc. et al. asserting claims under the federal antitrust laws, various state antitrust laws and unfair competition statutes, contending that KGM had monopolized alleged markets for single serve coffee brewers and single serve coffee pods. The Company is seeking monetary damages, declaratory relief, injunctive relief, and attorneys' fees, which monetary damages, in August 2020, were estimated by the Company's economic expert to be in the range of $719.4 million to $1.5 billion for the Company's antitrust claims, before trebling, and $358.0 million for a subset of the Company's false advertising claims, without accounting for discretionary trebling by the Court. The matter remains pending, with summary judgment motions fully briefed. On March 28, 2022, the Magistrate Judge issued an Opinion and Order granting in part and denying in part the TreeHouse sanctions motion against KGM and denying the KGM sanctions motion against TreeHouse. KGM has appealed a portion of the Opinion and Order awarding sanctions to the Company. On January 3, 2025, the Court denied KGM's motions to exclude the opinions of the Company's experts and granted Plaintiffs' motion to exclude the opinion of KGM's sham litigation expert. KGM is denying the allegations made by the Company in the litigation. The Company has not recorded any recovery amount in its Consolidated Financial Statements as of December 31, 2024.
In addition, the Company is party in the ordinary course of business to certain claims, litigation, audits, and investigations. The Company will record an accrual for a loss contingency when it is probable that a loss has been incurred and the amount of the loss can be reasonably estimated. The Company believes it has established adequate accruals for liabilities that are probable and reasonably estimable that may be incurred in connection with any such currently pending or threatened matter. In the Company's opinion, the eventual resolution of such matters, either individually or in the aggregate, is not expected to have a material impact on the Company's financial position, results of operations, or cash flows. However, litigation is inherently unpredictable and resolutions or dispositions of claims or lawsuits by settlement or otherwise could have an adverse impact on our financial position, results of operations or cash flows for the reporting period in which any such resolution or disposition occurs.
20. DERIVATIVE INSTRUMENTS
Interest Rate Swap Agreements — The Company manages its exposure to changes in interest rates by optimizing the use of variable-rate and fixed-rate debt and by utilizing interest rate swaps to hedge our exposure to changes in interest rates, to reduce the volatility of our financing costs, and to achieve a desired proportion of fixed versus floating-rate debt, based on current and projected market conditions.
The Company has entered into long-term interest rate swap agreements to lock into a fixed interest rate base that have a notional value of $1,750.0 million as of December 31, 2024 and $1,175.0 million as of December 31, 2023. Under the terms of the agreements, the weighted average fixed interest rate base for the $875.0 million of interest rate swaps maturing on February 28, 2025 is approximately 2.91%, and for the $875.0 million of interest rate swaps effective February 28, 2025 through February 29, 2028, is approximately 3.69%.
Commodity Contracts — Certain commodities the Company uses in the production and distribution of its products are exposed to market price risk. The Company utilizes derivative contracts to manage this risk. The majority of commodity forward contracts are not derivatives, and those that are generally qualify for the normal purchases and normal sales scope exception under the guidance for derivative instruments and hedging activities and, therefore, are not subject to its provisions. For derivative commodity contracts that do not qualify for the normal purchases and normal sales scope exception, the Company accounts for the contracts as derivatives.
TREEHOUSE FOODS, INC.
NOTES TO CONSOLIDATED FINANCIAL STATEMENTS – (Continued)
The Company’s derivative commodity contracts may include contracts for diesel, oil, plastics, resin, and other commodity contracts that do not meet the requirements for the normal purchases and normal sales scope exception. Diesel contracts are used to manage the Company’s risk associated with the underlying cost of diesel fuel used to deliver products. Contracts for oil, plastics, and resin are used to manage the Company’s risk associated with the underlying commodity cost of a significant component used in packaging materials. Other commodity contracts that are derivatives that do not meet the normal purchases and normal sales scope exception are used to manage the price risk associated with raw material costs. As of December 31, 2024 and 2023, the notional value of the commodity contracts outstanding was $61.5 million and $24.4 million, respectively. These commodity contracts have maturities expiring throughout 2025 as of December 31, 2024.
Total Return Swap Contract — The Company had an economic hedge program that used a total return swap contract to hedge the market risk associated with the unfunded portion of the Company's deferred compensation liability. The total return swap contract trades generally had a duration of one month and were rebalanced and re-hedged at the end of each monthly term. The total return swap contract was measured at fair value and recognized in the Consolidated Balance Sheets, with changes in value being recognized in the Consolidated Statements of Operations. At December 31, 2024 and 2023, the Company had no outstanding and unsettled total return swap contracts.
The following table identifies the fair value of each derivative instrument: | | | | | | | | | | | | | | | | | | | | |
| | | | | December 31, |
| | | Balance Sheet Location | | 2024 | | 2023 |
| | | | | (In millions) |
| Asset derivatives | | | | | | |
| Commodity contracts | | Prepaid expenses and other current assets | | $ | 9.1 | | | $ | 1.9 | |
| | | | | | |
| Interest rate swap agreements | | Prepaid expenses and other current assets | | 2.2 | | | — | |
| Interest rate swap agreements | | Other assets, net | | 7.6 | | | 17.9 | |
| | | | | | |
| | | | | $ | 18.9 | | | $ | 19.8 | |
| Liability derivatives | | | | | | |
| Commodity contracts | | Accrued expenses | | $ | — | | | $ | 0.8 | |
| | | | | | |
| Interest rate swap agreements | | Accrued expenses | | 0.4 | | | 7.2 | |
| | | | | | |
| | | | | $ | 0.4 | | | $ | 8.0 | |
The fair values of the commodity contracts and interest rate swap agreements are determined using Level 2 inputs. Level 2 inputs are inputs other than quoted market prices that are observable for an asset or liability, either directly or indirectly. The fair values of the commodity contracts and interest rate swap agreements are based on an analysis comparing the contract rates to the market rates at the balance sheet date.
We recognized the following gains and losses on our derivative contracts in the Consolidated Statements of Operations: | | | | | | | | | | | | | | | | | | | | | | | |
| | Location of Gain (Loss) | | Year Ended
December 31, |
| | Recognized in Net Income (Loss) | | 2024 | | 2023 | | 2022 |
| | | | (In millions) |
| Mark-to-market unrealized gain (loss): | | | | | | | |
| Commodity contracts | Other expense (income), net | | $ | 8.0 | | | $ | 1.4 | | | $ | (3.3) | |
| | | | | | | |
| Interest rate swap agreements | Other expense (income), net | | (1.3) | | | (16.5) | | | 78.4 | |
| | | | | | | |
| Total unrealized gain (loss) | | | $ | 6.7 | | | $ | (15.1) | | | $ | 75.1 | |
| Realized gain: | | | | | | | |
| Commodity contracts | Manufacturing-related to Cost of sales and transportation-related to Selling and distribution | | $ | 8.7 | | | $ | — | | | $ | 17.8 | |
| | | | | | | |
| Interest rate swap agreements | Interest expense | | 21.3 | | | 19.3 | | | (10.7) | |
| Total return swap contract | General and administrative | | — | | | — | | | (1.2) | |
| Total realized gain | | | $ | 30.0 | | | $ | 19.3 | | | $ | 5.9 | |
| Total gain | | | $ | 36.7 | | | $ | 4.2 | | | $ | 81.0 | |
TREEHOUSE FOODS, INC.
NOTES TO CONSOLIDATED FINANCIAL STATEMENTS – (Continued)
21. SEGMENT, GEOGRAPHIC, AND CUSTOMER INFORMATION
Segment Information —The Company has one reportable segment, which manufactures and distributes private brands food and beverages. Our products are primarily shelf stable and share similar customers and distribution. The Company derives revenue primarily in North America and manages the business activities on a consolidated basis. Those business activities include selling snacking offerings, beverages and drink mix offerings, and other grocery offerings across various channels including retail grocery, co-manufacturing, and food-away-from-home customers in shelf stable, refrigerated, and frozen formats. The majority of our manufacturing plants each produce one food or beverage category. We operate our business with a centralized financial systems infrastructure, and we share centralized resources for procurement and general and administrative activities. The accounting policies of the segment are the same as those described in the Summary of Significant Accounting Policies for the Company. Refer to Note 1 for additional information.
The Chief Executive Officer ("CEO") has been identified as our Chief Operating Decision Maker ("CODM"). We have one segment manager who reports directly to the CODM, with their incentive compensation based on the consolidated results of the Company. The Company manages operations on a company-wide basis, thereby making determinations as to the allocation of resources as one segment. The annual operating plan is prepared and approved by the CODM based on consolidated results of the Company. The CODM uses discrete financial information at the consolidated level to assess performance for the segment and decides how to allocate resources based on the Company's consolidated Net income (loss) from continuing operations, which is reported on the Consolidated Statement of Operations. The measure of segment assets is reported on the Consolidated Balance Sheet as Total assets.
Reported segment revenue, segment profit or loss, and significant segment expenses are as follows:
| | | | | | | | | | | | | | | | | | | | | | | |
| | | Year Ended December 31, |
| | | 2024 | | 2023 | | 2022 |
| Net sales | | | $ | 3,354.0 | | | $ | 3,431.6 | | | $ | 3,297.1 | |
| Cost of sales | | | 2,805.6 | | | 2,855.5 | | | 2,774.7 | |
| Selling, distribution, general, and administrative: | | | | | | | |
| Freight out and commissions | | | 116.2 | | 129 | | 161.4 |
| Direct selling, general, and administrative | | | 36.5 | | 31.9 | | 25.5 |
| Corporate selling, general, and administrative | | | 198.6 | | 214.8 | | 237.4 |
| Amortization expense | | | 48.6 | | | 48.2 | | | 47.9 | |
| Asset impairment | | | 19.3 | | | — | | | — | |
| Other operating expense, net | (1) | | 26.1 | | | 5.3 | | | 62.8 | |
| Total other expense (income) | (2) | | 70.0 | | | 63.5 | | | (13.7) | |
| | | | | | | |
| Income tax expense | | | 6.2 | | | 24.4 | | | 10.3 | |
| Net income (loss) from continuing operations | | | $ | 26.9 | | | $ | 59.0 | | | $ | (9.2) | |
| | | | | | | |
| | | | | | | |
(1)Refer to Note 18 for additional information on other segment items included within Other operating expense, net.
(2)Total other expense (income) includes other segment items primarily including interest expense, interest income, loss on extinguishment of debt, foreign currency exchange, and mark-to-market adjustments on derivatives.
Disaggregation of Revenue — The principal products that comprise our different product category groups are as follows:
| | | | | | | | |
| Product Category Group | | Principal Products |
| Snacking | | Candy; cookies; crackers; in-store bakery items; pretzels; and frozen griddle items |
| Beverages & drink mixes | | Broths/stocks; non-dairy creamer; powdered beverages and other blends; ready-to-drink beverages; coffee; and tea |
| Grocery | | Cheese & pudding; hot cereal; pickles; and refrigerated dough |
TREEHOUSE FOODS, INC.
NOTES TO CONSOLIDATED FINANCIAL STATEMENTS – (Continued)
Revenue disaggregated by product category groups is as follows:
| | | | | | | | | | | | | | | | | |
| | Year Ended December 31, |
| | 2024 | | 2023 | | 2022 |
| | (In millions) |
| Snacking | $ | 1,270.2 | | | $ | 1,295.2 | | | $ | 1,229.3 | |
| Beverages & drink mixes | 1,109.0 | | | 1,158.1 | | | 1,136.2 | |
| Grocery | 974.8 | | 978.3 | | | 931.6 | |
| Total net sales | $ | 3,354.0 | | | $ | 3,431.6 | | | $ | 3,297.1 | |
Revenue disaggregated by sales channel is as follows: | | | | | | | | | | | | | | | | | |
| | Year Ended December 31, |
| | 2024 | | 2023 | | 2022 |
| | (In millions) |
| Retail grocery | $ | 2,676.6 | | | $ | 2,727.3 | | | $ | 2,573.6 | |
| Co-manufacturing | 389.2 | | | 425.8 | | | 477.1 | |
| Food-away-from-home and other | 288.2 | | | 278.5 | | | 246.4 | |
| Total net sales | $ | 3,354.0 | | | $ | 3,431.6 | | | $ | 3,297.1 | |
Geographic Information — The Company had net sales from customers outside of the United States of approximately 4.9%, 5.1%, and 5.1% of total consolidated net sales from continuing operations in 2024, 2023, and 2022, respectively, with 4.0%, 4.0%, and 3.8% of total consolidated net sales from continuing operations going to Canada in 2024, 2023, and 2022, respectively. Net sales are determined based on the customer destination where the products are shipped.
Long-lived assets consist of net property, plant, and equipment. The geographic location of long-lived assets is as follows: | | | | | | | | | | | |
| | December 31, |
| | 2024 | | 2023 |
| | (In millions) |
| Long-lived assets: | | | |
| United States | $ | 670.9 | | | $ | 645.0 | |
| Canada | 77.7 | | | 92.6 | |
| Total | $ | 748.6 | | | $ | 737.6 | |
Major Customers — Walmart Inc. and affiliates accounted for approximately 23.9%, 22.4%, and 21.1% of consolidated net sales from continuing operations in December 31, 2024, 2023, and 2022, respectively. No other customer accounted for more than 10% of our consolidated net sales from continuing operations.
When taking into account those receivables sold under our Receivables Sales Program (refer to Note 5 for more information), as of December 31, 2024 and December 31, 2023, no customers accounted for more than 10% of our total trade receivables.
Item 9. Changes in and Disagreements with Accountants on Accounting and Financial Disclosure
None.
Item 9A. Controls and Procedures
Disclosure Controls and Procedures
The Company’s management, with the participation of our Chief Executive Officer ("CEO") and Chief Financial Officer ("CFO"), has evaluated the effectiveness of the design and operation of our disclosure controls and procedures (as defined in Rule 13a-15(e) under the Exchange Act). Based on that evaluation, our CEO and CFO have concluded that as of December 31, 2024, our disclosure controls and procedures were effective to ensure that information required to be disclosed by us in reports that we file or submit under the Exchange Act is (1) recorded, processed, summarized, and reported within the time periods specified in applicable rules and forms, and (2) accumulated and communicated to our management, including our CEO and CFO, in a manner that allows timely decisions regarding required disclosure.
There have been no changes in the Company’s internal control over financial reporting that occurred during the quarter ended December 31, 2024 that have materially affected or are reasonably likely to materially affect the Company’s internal control over financial reporting.
Management’s Report on Internal Control over Financial Reporting
The Company’s management is responsible for establishing and maintaining adequate internal control over financial reporting, as such term is defined in Rule 13a-15(f) under the Exchange Act. The Company’s management, with the participation of the Company’s CEO and CFO, has evaluated the effectiveness of the Company’s internal control over financial reporting based on the criteria set forth in the Internal Control-Integrated Framework (2013) issued by the Committee of Sponsoring Organizations of the Treadway Commission. The scope of management’s assessment of the effectiveness of internal control over financial reporting as of December 31, 2024 includes all of the Company’s subsidiaries.
Based on this evaluation, the Company’s management has concluded that, as of December 31, 2024, the Company’s internal control over financial reporting was effective.
The Company’s independent registered public accounting firm, Deloitte & Touche LLP, has issued an attestation report on the Company’s internal control over financial reporting as of December 31, 2024. This report is included with this Form 10-K.
Because of its inherent limitations, internal control over financial reporting may not prevent or detect misstatements. Also, projections of any evaluation of the effectiveness to future periods are subject to risk that controls may become inadequate because of changes in conditions, or that the degree of compliance with the policies or procedures may deteriorate.
Item 9B. Other Information
(c) Trading Plans
During the quarter ended December 31, 2024, no director or officer adopted or terminated any Rule 10b5-1 trading arrangement or non-Rule 10b5-1 trading arrangement.
Item 9C. Disclosure Regarding Foreign Jurisdictions that Prevent Inspections
Not applicable.
REPORT OF INDEPENDENT REGISTERED PUBLIC ACCOUNTING FIRM
To the Stockholders and the Board of Directors of TreeHouse Foods, Inc.
Opinion on Internal Control over Financial Reporting
We have audited the internal control over financial reporting of TreeHouse Foods, Inc. and subsidiaries (the "Company") as of December 31, 2024, based on criteria established in Internal Control - Integrated Framework (2013) issued by the Committee of Sponsoring Organizations of the Treadway Commission (COSO). In our opinion, the Company maintained, in all material respects, effective internal control over financial reporting as of December 31, 2024, based on criteria established in Internal Control - Integrated Framework (2013) issued by COSO.
We have also audited, in accordance with the standards of the Public Company Accounting Oversight Board (United States) (PCAOB), the consolidated financial statements as of and for the year ended December 31, 2024, of the Company and our report dated February 14, 2025, expressed an unqualified opinion on those financial statements.
Basis for Opinion
The Company’s management is responsible for maintaining effective internal control over financial reporting and for its assessment of the effectiveness of internal control over financial reporting, included in the accompanying Management's Report on Internal Control over Financial Reporting. Our responsibility is to express an opinion on the Company’s internal control over financial reporting based on our audit. We are a public accounting firm registered with the PCAOB and are required to be independent with respect to the Company in accordance with the U.S. federal securities laws and the applicable rules and regulations of the Securities and Exchange Commission and the PCAOB.
We conducted our audit in accordance with the standards of the PCAOB. Those standards require that we plan and perform the audit to obtain reasonable assurance about whether effective internal control over financial reporting was maintained in all material respects. Our audit included obtaining an understanding of internal control over financial reporting, assessing the risk that a material weakness exists, testing and evaluating the design and operating effectiveness of internal control based on the assessed risk, and performing such other procedures as we considered necessary in the circumstances. We believe that our audit provides a reasonable basis for our opinion.
Definition and Limitations of Internal Control over Financial Reporting
A company’s internal control over financial reporting is a process designed to provide reasonable assurance regarding the reliability of financial reporting and the preparation of financial statements for external purposes in accordance with generally accepted accounting principles. A company’s internal control over financial reporting includes those policies and procedures that (1) pertain to the maintenance of records that, in reasonable detail, accurately and fairly reflect the transactions and dispositions of the assets of the company; (2) provide reasonable assurance that transactions are recorded as necessary to permit preparation of financial statements in accordance with generally accepted accounting principles, and that receipts and expenditures of the company are being made only in accordance with authorizations of management and directors of the company; and (3) provide reasonable assurance regarding prevention or timely detection of unauthorized acquisition, use, or disposition of the company’s assets that could have a material effect on the financial statements.
Because of its inherent limitations, internal control over financial reporting may not prevent or detect misstatements. Also, projections of any evaluation of effectiveness to future periods are subject to the risk that controls may become inadequate because of changes in conditions, or that the degree of compliance with the policies or procedures may deteriorate.
/s/ DELOITTE & TOUCHE LLP
Chicago, Illinois
February 14, 2025
PART III
Item 10. Directors, Executive Officers and Corporate Governance
Information required by this item about our directors and executive officers is included in our Proxy Statement ("2025 Proxy Statement") to be filed with the SEC in connection with our 2025 annual meeting of the stockholders under the headings, Executive Officers, Biographical Information of Director Nominees and Continuing Directors, and Election of Directors (Proposal 1) and is incorporated herein by reference.
Information about compliance with the reporting requirements of Section 16(a) of the 1934 Act, by our executive officers and directors, persons who own more than ten percent of our common stock, and their affiliates who are required to comply with such reporting requirements, is included in our 2025 Proxy Statement under the headings, Stock Ownership — Security Ownership of Management and Directors and Delinquent Section 16(a) Reports and is incorporated herein by reference. Information about the Audit Committee, Audit Committee members and the Audit Committee Financial Expert is included in our 2025 Proxy Statement under the heading, Board Structure, and is incorporated herein by reference.
Our Code of Ethics, which is applicable to all of our employees and directors, is available on our corporate website at http://www.treehousefoods.com, along with the Corporate Governance Guidelines of our Board of Directors and the charters of the Committees of our Board of Directors. Any waivers that we may grant to our executive officers or directors under the Code of Ethics, and any amendments to our Code of Ethics, will be posted on our corporate website within four business days following the date of the amendment or waiver. Any of these items or any of our filings with the Securities and Exchange Commission are available in print to any shareowner who requests them. Requests should be sent to Investor Relations, TreeHouse Foods, Inc., 2021 Spring Road, Suite 600, Oak Brook, IL 60523.
Our Insider Trading Policy, which is applicable to all directors, officers, associates, employees, agents and consultants of the Company and any subsidiaries and affiliated companies, is available on our corporate website at http://www.treehousefoods.com. Additionally, a copy of our Insider Trading Policy is filed as Exhibit 19 to this Form 10-K.
Item 11. Executive Compensation
The information required by this item is included in the 2025 Proxy Statement under the headings, Stock Ownership, Compensation Discussion & Analysis, Executive Compensation, and Report of the Compensation Committee and is incorporated herein by reference. Notwithstanding anything to the contrary set forth in this report, the Report of the Compensation Committee section of the 2025 Proxy Statement shall be deemed to be "furnished" and not "filed" for purposes of the Exchange Act.
Item 12. Security Ownership of Certain Beneficial Owners and Management and Related Stockholder Matters
Equity Compensation Plan Information
The following table provides information about our common stock that may be issued upon the exercise of options under all of our equity compensation plans as of December 31, 2024: | | | | | | | | | | | | | | | | | |
| Plan Category | (a)
Number of Securities
to be Issued Upon
Exercise of
Outstanding Options,
Warrants and Rights | | (b)
Weighted-average
Exercise Price of
Outstanding Options,
Warrants and Rights | | (c)
Number of Securities
Remaining Available for
Future Issuance under
Equity Compensation
Plans (excluding
securities reflected in
Column (a)) |
| | (in millions) | | | | (in millions) |
| Equity compensation plans approved by security holders: | | | | | |
| TreeHouse Foods, Inc. Equity and Incentive Plan | 1.6 | | (1) | $ | 61.46 | | (2) | 7.8 | |
| Equity compensation plans not approved by security holders: | | | | | |
| None | — | | | — | | | — | |
| Total | 1.6 | | | $ | 61.46 | | | 7.8 | |
(1)Includes 0.8 million restricted stock units and 0.4 million performance unit awards outstanding under the TreeHouse Foods, Inc. Equity and Incentive Plan.
(2)Restricted stock units and performance units do not have an exercise price because their value is dependent upon continued employment over a period of time or the achievement of performance conditions. Accordingly, we have disregarded the restricted stock units and performance units for purposes of computing the weighted-average exercise price.
The information related to the security ownership of certain beneficial owners and management required by this item is included in the 2025 Proxy Statement under the heading, Stock Ownership — Security Ownership of Management and Directors and is incorporated herein by reference.
Item 13. Certain Relationships and Related Transactions, and Director Independence
The information required by this item is included in the 2025 Proxy Statement under the heading, Corporate Governance and is incorporated herein by reference.
Item 14. Principal Accountant Fees and Services
The information required by this item is included in the 2025 Proxy Statement under the heading, Fees Billed by Independent Registered Public Accounting Firm and is incorporated herein by reference.
PART IV
Item 15. Exhibits and Financial Statement Schedules
The following documents are filed as part of this Form 10-K.
| | | | | |
| | Page |
| 1. Financial Statements filed as a part of this document under Item 8. | |
| | |
| |
| |
| |
| |
| |
| |
| |
| |
| 2. Financial Statement Schedule | |
| |
| |
| Schedules other than those listed above have been omitted because such schedules are not applicable or the related amounts are immaterial for all periods presented. | |
| |
| 3. Exhibits | |
Item 16. Form 10-K Summary
None.
INDEX TO EXHIBITS | | | | | | | | |
| Exhibit No. | | Exhibit Description |
| 3.1 | | | |
| 3.2 | | | |
| 4.1 | | | |
| 4.2 | | | |
| 4.3 | | | |
| 4.4 | | | |
| 4.5 | | | |
| 4.6 | | | |
| 4.7* | | |
| 4.8* | | |
| 4.9 | | | |
| 10.1** | | |
| 10.2** | | |
| 10.3** | | |
| 10.4*,** | | |
| 10.5 | | | |
| 10.6** | | |
| 10.7** | | |
| 10.8** | | |
| 10.9** | | |
| 10.10** | | |
| 10.11 | | | |
| 10.12** | | |
| 10.13** | | |
| | | | | | | | |
| 10.14** | | |
| 10.15** | | |
| 10.16** | | |
| 10.17** | | |
| 10.18*,** | | |
| 19* | | |
| 21.1* | | |
| 22* | | |
| 23.1* | | |
| 31.1* | | |
| 31.2* | | |
| 32.1* | | |
| 32.2* | | |
| 97 | | | |
| 101.INS* | | Inline XBRL Instance Document. |
| 101.SCH* | | Inline XBRL Taxonomy Extension Schema Document. |
| 101.CAL* | | Inline XBRL Taxonomy Extension Calculation Linkbase Document. |
| 101.DEF* | | Inline XBRL Taxonomy Extension Definition Linkbase Document. |
| 101.LAB* | | Inline XBRL Taxonomy Extension Label Linkbase Document. |
| 101.PRE* | | Inline XBRL Taxonomy Extension Presentation Linkbase Document. |
| 104* | | The cover page from TreeHouse Foods, Inc.'s Annual Report on Form 10-K for the year ended December 31, 2024, formatted in Inline XBRL (included as Exhibit 101). |
| | |
| *Filed herewith. |
| **Management contract or compensatory plan or arrangement. |
SIGNATURES
Pursuant to the requirements of Section 13 or 15(d) of the 1934 Act, the registrant has duly caused this report to be signed on its behalf by the undersigned, thereunto duly authorized. | | | | | |
| | TREEHOUSE FOODS, INC. |
| | |
| | /s/ Patrick M. O'Donnell |
| | Patrick M. O'Donnell |
| | Executive Vice President and Chief Financial Officer |
February 14, 2025
Pursuant to the requirements of the 1934 Act, this report has been signed below by the following persons on behalf of the registrant and in the capacities and on the dates indicated. | | | | | | | | | | | | | | |
| Name | | Title | | Date |
| | | | | |
| /s/ Steven Oakland | | Chairman of the Board, President and Chief Executive Officer | | February 14, 2025 |
| Steven Oakland | | (Principal Executive Officer) | | |
| | | | | |
| /s/ Patrick M. O'Donnell | | Executive Vice President and Chief Financial Officer | | February 14, 2025 |
| Patrick M. O'Donnell | | (Principal Financial Officer and Principal Accounting Officer) | | |
| | | | |
| /s/ Adam J. DeWitt | | Director | | February 14, 2025 |
| Adam J. DeWitt | | | | |
| | | | |
| /s/ Linda K. Massman | | Director | | February 14, 2025 |
| Linda K. Massman | | | | |
| | | | |
| /s/ Scott D. Ostfeld | | Director | | February 14, 2025 |
| Scott D. Ostfeld | | | | |
| | | | | |
| /s/ Jill A. Rahman | | Director | | February 14, 2025 |
| Jill A. Rahman | | | | |
| | | | | |
| /s/ Joseph E. Scalzo | | Director | | February 14, 2025 |
| Joseph E. Scalzo | | | | |
| | | | |
| /s/ Jean E. Spence | | Director | | February 14, 2025 |
| Jean E. Spence | | | | |
| | | | |
| /s/ Jason J. Tyler | | Director | | February 14, 2025 |
| Jason J. Tyler | | | | |
| | | | | |
TREEHOUSE FOODS, INC.
VALUATION AND QUALIFYING ACCOUNTS
December 31, 2024, 2023 and 2022 | | | | | | | | | | | | | | |
| Deferred Tax Valuation Allowance | Balance
Beginning
of Year | Additions | Reductions | Balance End
of Year |
| (In millions) |
| 2022 | $ | (161.8) | | $ | (27.4) | | $ | 2.8 | | $ | (186.4) | |
| 2023 | (186.4) | | (2.5) | | 10.7 | | (178.2) | |
| 2024 | (178.2) | | (1.3) | | 148.4 | | (31.1) | |