 Davenport & Company Metals & Mining Symposium September 13, 2006 Exhibit 99.1 |
 1 Forward-Looking Statements Statements that are not historical fact are forward-looking statements and may involve a number of risks and uncertainties. We have used the words “believe,” “could,” “estimate,” “expect,” “intend,” “may,” “plan,” “predict,” “project” and similar terms and phrases, including references to assumptions, in this presentation to identify forward- looking statements. These forward-looking statements are made based on expectations and beliefs concerning future events affecting us and are subject to uncertainties and factors relating to our operations and business environment, all of which are difficult to predict and many of which are beyond our control, that could cause our actual results to differ materially from those matters expressed in or implied by these forward-looking statements. The following factors are among those that may cause actual results to differ materially from our forward-looking statements: market demand for coal, electricity and steel; availability of qualified workers; future economic or capital market conditions; weather conditions or catastrophic weather-related damage; our production capabilities; the ongoing integration of Anker and CoalQuest into our business; the consummation of financing, acquisition or disposition transactions and the effect thereof on our business; our plans and objectives for future operations and expansion or consolidation; our relationships with, and other conditions affecting, our customers; the availability and costs of key supplies or commodities such as diesel fuel, steel, explosives and tires; prices of fuels which compete with or impact coal usage, such as oil and natural gas; timing of reductions or increases in customer coal inventories; long-term coal supply arrangements; risks in coal mining; unexpected maintenance and equipment failure; environmental, safety and other laws and regulations, including those directly affecting our coal mining and production, and those affecting our customers’ coal usage; competition; railroad, barge, trucking and other transportation availability, performance and costs; employee benefits costs and labor relations issues; replacement of our reserves; our assumptions concerning economically recoverable coal reserve estimates; availability and costs of credit, surety bonds and letters of credit; title defects or loss of leasehold interests in our properties which could result in unanticipated costs or inability to mine these properties; future legislation and changes in regulations or governmental policies or changes in interpretations thereof, including with respect to safety enhancements; the impairment of the value of our goodwill; the ongoing investigations into the Sago mine explosion; and our liquidity, results of operations and financial condition; the adequacy and sufficiency of our internal controls and legal and administrative proceedings, settlements, investigations and claim. You should keep in mind that any forward-looking statement made by us in this presentation speaks only as of the date on which we make it. New risks and uncertainties arise from time to time, and it is impossible for us to predict these events or how they may affect us. We have no duty to, and do not intend to, update or revise the forward-looking statements in this presentation except as may be required by law. In light of these risks and uncertainties, you should keep in mind that any forward-looking statement made in this presentation might not occur. |
 2 Ben Hatfield President and Chief Executive Officer Management Presenter |
 3 Prominent position in 3 of the 4 largest coal producing regions in the U.S. Strong operating assets and large undeveloped reserve base provide attractive internal expansion opportunities Growing production levels and significant committed tonnage Highly productive workforce that is 100% union free Strong balance sheet with minimal long–term legacy liabilities Investment grade customer base extends across diverse market regions Experienced management team Favorable coal industry fundamentals Key Investment Considerations |
 4 Leading Appalachian coal producer formed in May 2004 by an investor group led by Wilbur Ross October 1, 2004 – acquired 5 major mining complexes and substantial coal reserves through the bankruptcy sale of Horizon assets November 18, 2005 – completed stock acquisition of Anker and CoalQuest which added 5 mining complexes and boosted reserves by nearly 75% November 21, 2005 – began trading on NYSE under symbol ICO December 12, 2005 – completed $231 million equity offering ICG Overview Summary Statistics as of June 30, 2006 Revenue: $435.5 mm EBITDA: $30.90 mm Market capitalization¹ $902.5 mm Senior Notes Offering: $175mm @ 10¼% Coal reserves²: 1.06 billion tons (proven and probable) Coal production: 9.6 mm tons Reserve life²: Approximately 72 years Notes: 1 Market capitalization is based on 152.7 million shares outstanding and a stock price of $5.91 as of September 7, 2006 2 ICG reserve data as of 3/31/2006 |
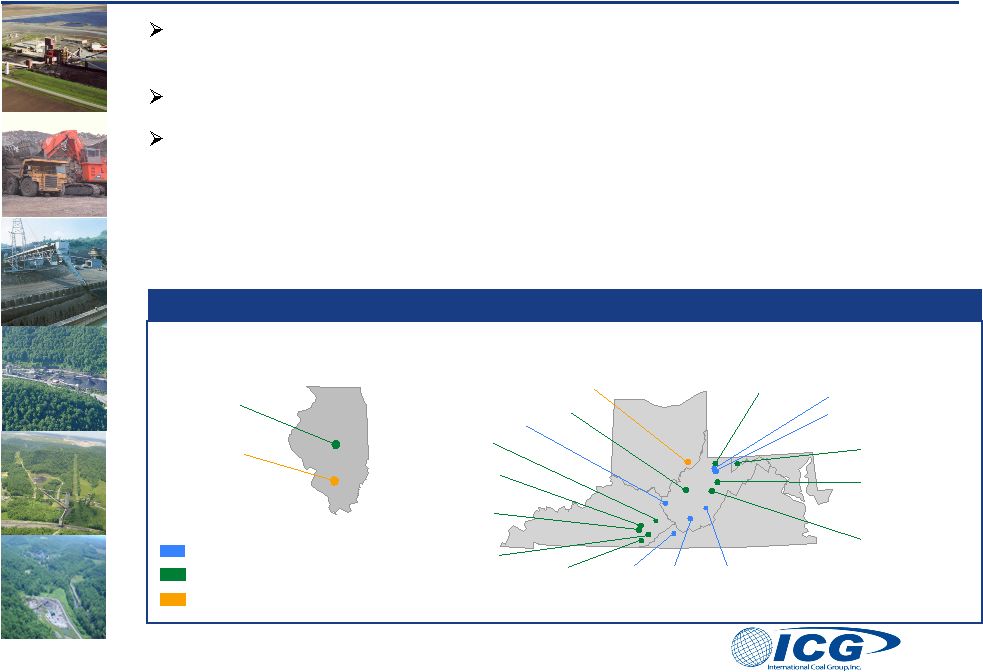 5 11 active mining complexes—6 in Central Appalachia, 4 in Northern Appalachia and 1 in Illinois Basin 6 new mining complexes planned for future development Flagship development will be the Tygart projects in Northern WV – 200 million ton reserve developed with 2 major deep mine complexes – Favorable coal quality is marketable as low sulfur steam or hi-vol met KY VA WV ICG Eastern ICG East Kentucky ICG Hazard ICG Knott County Current and Future Operations Vindex Energy Patriot Mining Buckhannon / Spruce Philippi Development Tygart #1 Big Creek Beckley Juliana MD ICG Illinois IL Future Operations Current Operations Jennie Creek Denmark Property Flint Ridge Complex Other Strategic Properties Paw Paw Creek Property OH Raven Complex Tygart #2 Current and Future Operations |
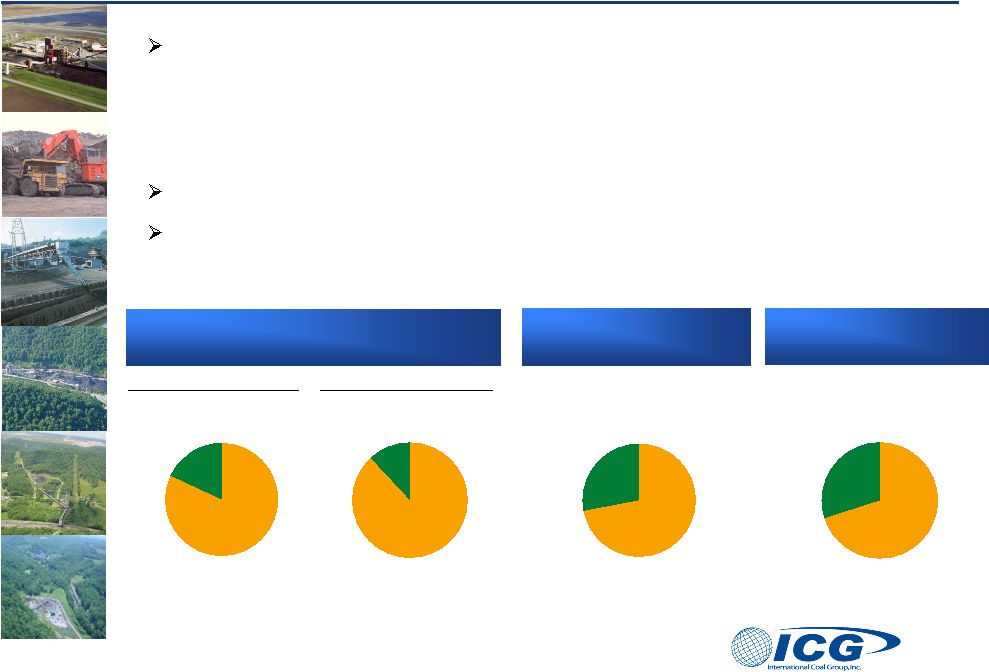 6 1.06 billion tons of coal reserves controlled - primarily high Btu, low sulfur steam and metallurgical quality coal - 564 million tons in Appalachian Region - 496 million tons in Illinois Basin All mine developments currently planned are in the Appalachian Region IL developments are expected to be facilitated by increased deployment of utility scrubbers and growing demand for coal conversion projects Appalachian Reserve Profile Total Reserve Profile Owned vs. Leased Heat Content (Btu) Sulfur Content (%) 564 million tons Total Reserve Profile Met. vs. Steam 1.06 billion tons High Caliber Reserve Base 18% 82% > 12,500 < 12,500 88% 12% < 1.5% > 1.5% 72% 28% Owned Leased 70% 30% Steam Metallurgical Note: 1 ICG reserve data as of 3/31/2006 1 |
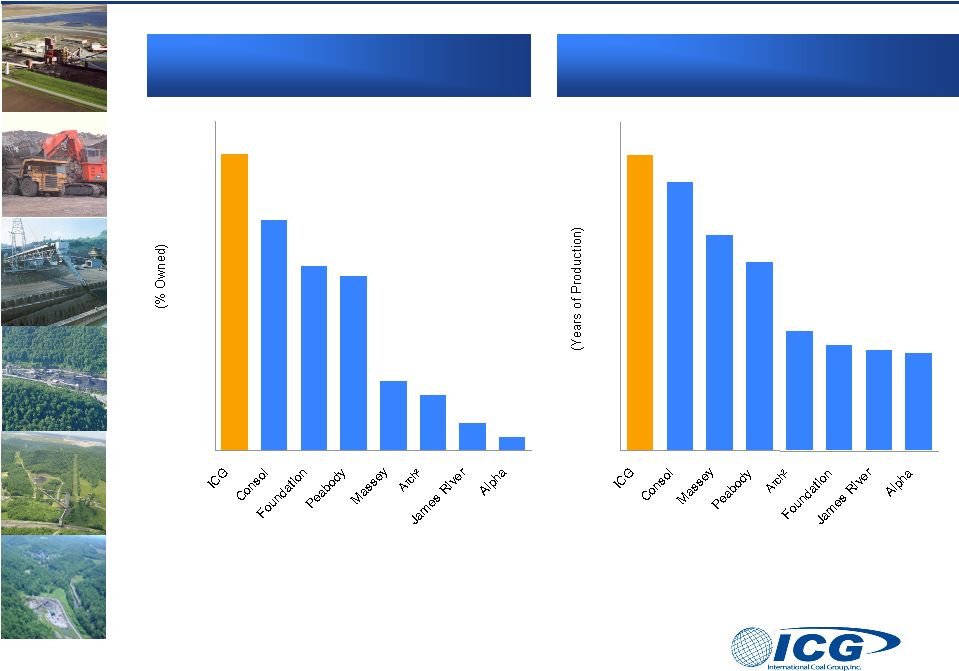 7 Total Reserves— % Owned vs. Leased Years of Production Based on Total Reserves Source: Company Reports Notes: 1 Reserve data for peers as of 12/31/05; ICG reserve data as of 3/31/06 (Years based on total reserves divided by 2005 production.) 2 Arch reserve data is as of 12/31/05 as reported by Arch management and is not pro forma for the Magnum Coal transaction Strong Reserve Position 1 1 72 56 45 42 17 13 7 3 0 10 20 30 40 50 60 70 80 72 65 52 46 29 26 24 19 0 10 20 30 40 50 60 70 80 |
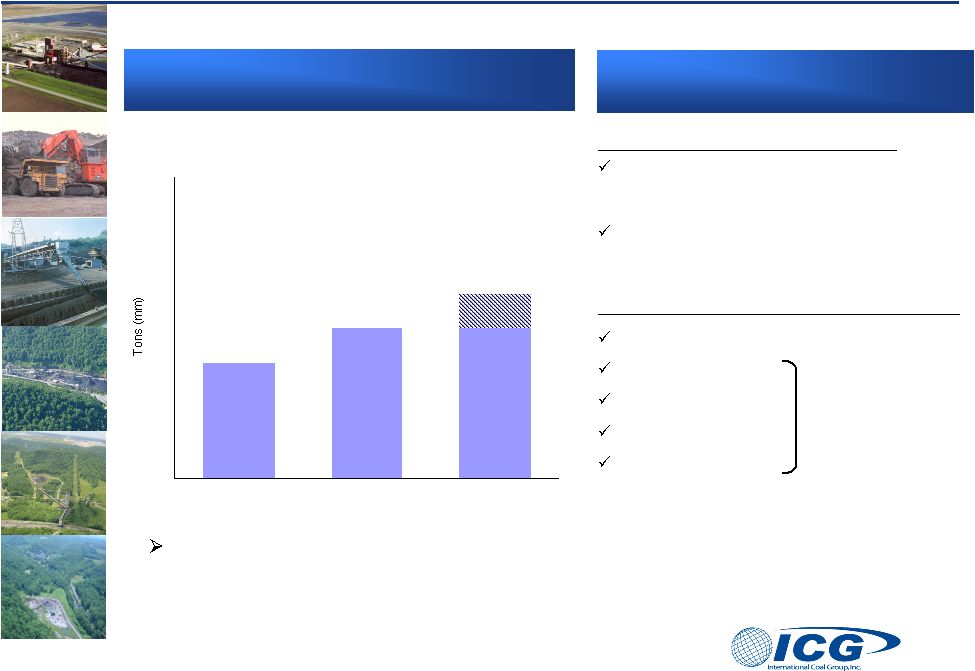 8 Other expansion opportunities available: — Denmark Property – 150 million tons in Southern Illinois — Paw Paw Creek Property – 100 million tons in Southeastern Ohio Projected Production Production Outlook Summary New Mine Developments Note: 1 2005 pro forma for acquisition of Anker / CoalQuest Projects Now Under Construction Raven Complex – Startup Q3 2006 – 1.2 mm tons/yr Beckley Complex – Startup mid 2007 – 1.4 mm tons/yr Other Future Mine Development Projects Tygart #1 Complex - Planned Startup Mid 2008 Jennie Creek Juliana Complex Big Creek Complex Tygart #2 Complex Currently in Evaluation & Planning Stages 14.9 17.0 17-19 8 10 12 14 16 18 20 22 24 26 2005 2006 2007 1 |
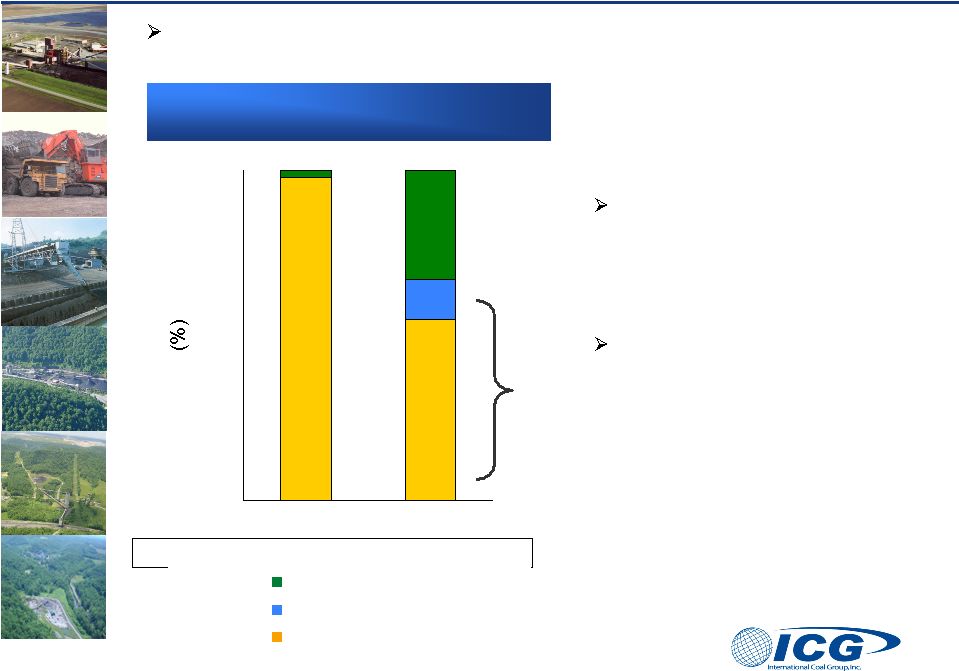 9 Typically 50% contracted by middle of previous year with another 35% contracted by end of the previous year Some committed tons are subject to price reopeners Committed Tonnage Strong committed sales levels provide stable and predictable revenue stream Significant Committed Tonnage 67% Committed Projected Sales 20 mm tons 18-20 mm tons Note: As of September 11, 2006 98 55 12 33 2 0 25 50 75 100 2006 2007 Uncommitted Committed and Not Priced Committed and Priced |
 10 Strong Customer Base Primarily investment grade utilities in the South-Southeast regions ICG’s 3 largest customers are serviced by Central Appalachian operations Georgia Power Duke Energy Carolina Power & Light Northern Appalachian operations focus on Ohio Valley and Northeast utility sector Larger customers include AEP, PP&L, and Allegheny IL complex has long-term contract with (Springfield) City Water Light & Power, and also services broad truck-delivery industrial market Efforts to expand metallurgical customer base now underway Expect to resume Vindex met shipments to export traders in September Active negotiations w/domestic buyers on Beckley low vol met |
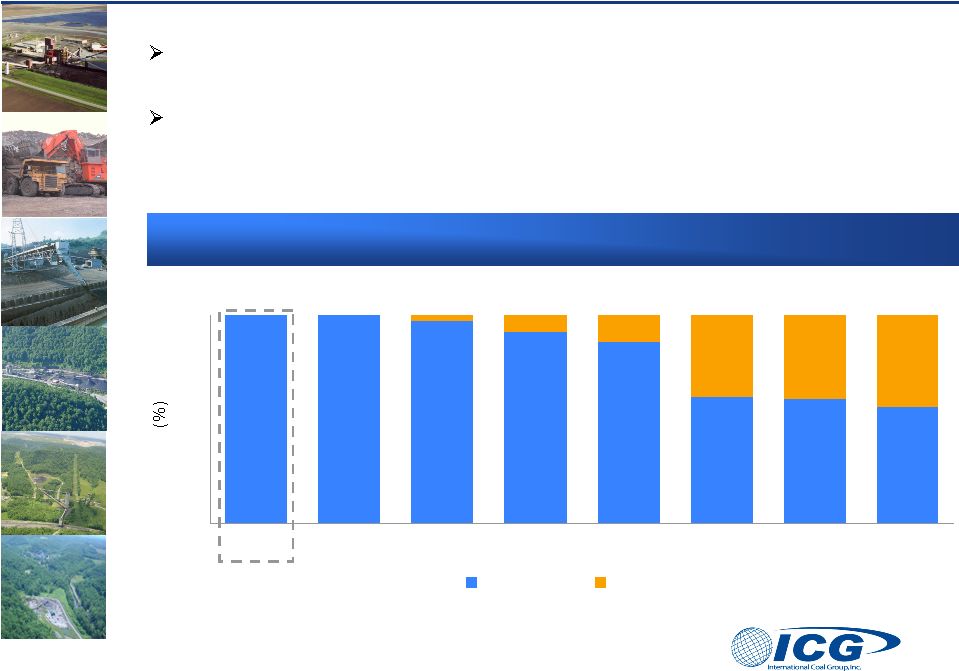 11 100 100 97 92 87 61 60 56 3 8 13 39 40 44 0 20 40 60 80 100 ICG James River Massey Alpha Arch Peabody Foundation Consol Non-Union Union Largest completely non-union coal company in the U.S. Most peers are vulnerable to workplace disruption during 2006 United Mine Workers of America (UMWA) contract renewals Workforce Composition Highly Productive, Non-Union Workforce |
 12 Reclamation 71% Rockefeller 5% Workers Comp 2% FAS 106 8% Black lung 14% Source: Company Reports as of 12/31/05 Total Legacy Liabilities Notes: 1 Legacy liabilities include Post Retirement Benefits, Black Lung liabilities, Reclamation liabilities, Workers Compensation and Coal Act Liabilities 2 As of 12/31/05 as reported by Arch management and is pro forma for Magnum Coal transaction Low Legacy Liabilities ICG Legacy Liabilities Total: $119mm 2 ($ in millions) 1 3,553 2,298 772 409 320 120 119 110 Consol Peabody Foundation Massey Arch James River ICG Alpha |
 13 Experienced Management Team The members of ICG’s senior management team have, on average, 25 years of industry work experience Position Years in Industry Prior Employer Ben Hatfield President and CEO 27 Arch Scott Perkins Senior Vice President, KY and Illinois Operations 27 Horizon Sam Kitts Senior Vice President, WV and MD Operations 19 Alpha Natural Resources Roger Nicholson Senior Vice President, General Counsel & Secretary 20 Jackson Kelly Michael Hardesty Senior Vice President, Sales & Marketing 23 Arch Gene Kitts Senior Vice President, Mining Services 29 Arch William Campbell Vice President & Treasurer 31 Horizon Charles Snavely Vice President, Planning and Acquisitions 28 James River |
 14 Experienced Management Team Brad Harris named CFO on September 6, 2006 CPA with 25 years of corporate and public accounting experience 15 years with Ernst & Young Background in manufacturing and real estate sectors Brings outstanding technical skills and financial expertise |
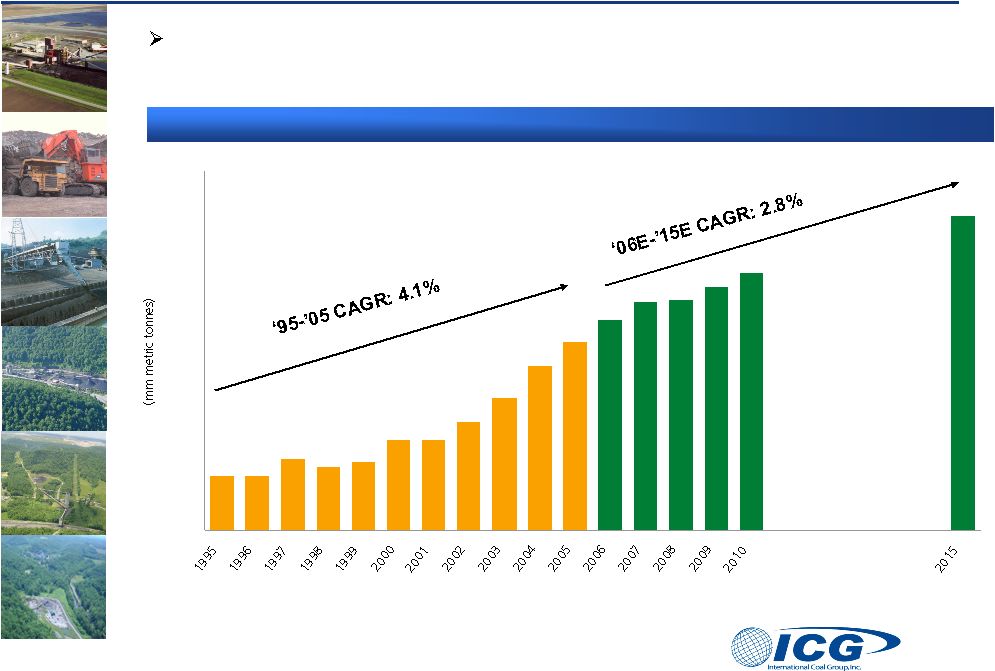
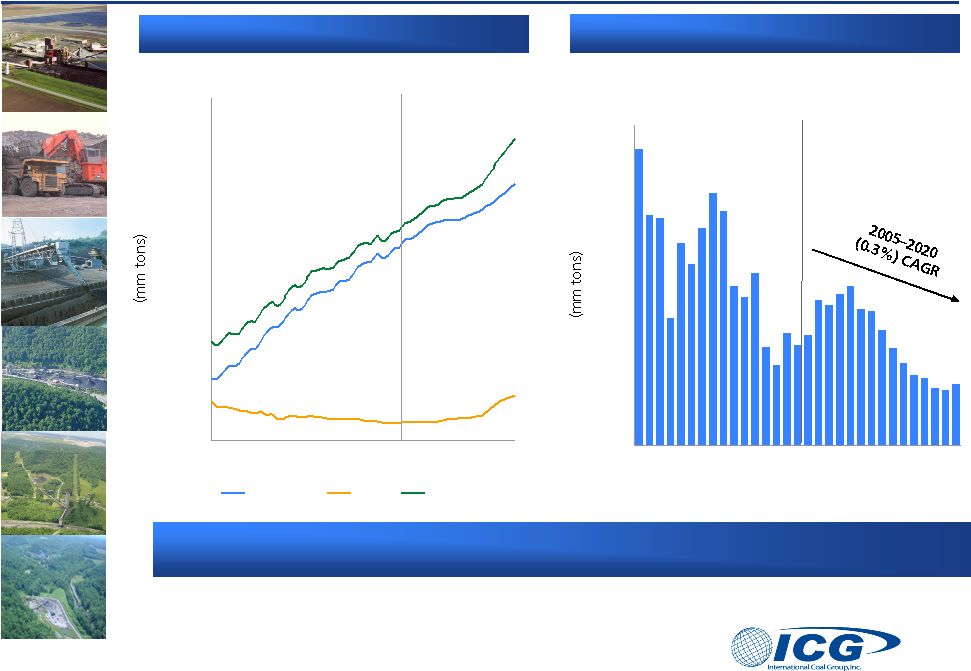 15 350 375 400 425 450 475 500 1990 1995 2000 2005 2010 2015 2020 Demand Grows… …Eastern Production Falls U.S. Annual Coal Consumption by Sector Appalachia Annual Production Sources: EIA; Energy Ventures Analysis …as Eastern utility stockpiles remain at the low end of historic ranges Favorable Steam Coal Market Fundamentals 0 200 400 600 800 1,000 1,200 1,400 1,600 1,800 1970 1979 1988 1998 2007 2016 2025 Electricity Other Total |
 16 600 800 1,000 1,200 1,400 1,600 Global Crude Steel Production Sources: World Steel Dynamics Projected increase in global steel capacity in China, Brazil and India will support export demand for metallurgical coal Favorable Outlook for Met Coal |
 17 Update on Sago Mine Accident Mine explosion on January 2, 2006 resulted in 12 fatalities and critical injuries to a 13 employee ICG announced its initial findings from its independent investigation on March 15, but verification and further testing are ongoing. Preliminary conclusions: – Explosion was likely triggered by lightning strike conducted into a sealed area through mine infrastructure or roof strata – Explosive pressure significantly exceeded 20 psi design criteria for mine seals Preliminary findings announced jointly by MSHA & WV OMHST on May 4 generally concur with most ICG findings; final reports not yet issued - WV OMHST Director has confirmed that NIOSH-MSHA seal tests indicate an explosive force well above the design criteria Estimated impact of accident to 2006 EBITDA is $15.2 million, of which $11.7 million was incurred in the first quarter ICG maintains substantial insurance policies to provide protection against potential employer-negligence (or “Mandolidis”) liability th |
 18 Maintain a conservative capital structure and flexible balance sheet to support multiple internal growth initiatives Pursue measured growth initiatives through the development of owned and controlled reserves Maintain financial flexibility for the possible acquisition of reserves and/or operations Financial and Investment Strategy |
 19 Historical Financial Summary Notes: 1 Excludes freight and handling revenue 2 EBITDA is a non-GAAP measure. A reconciliation to net income is provided in the Appendix to this presentation 3 Includes capex and accounts payable (not included in GAAP reports) Twelve months ended December 31, Six months ended June 30, LTM period ended June 30, ($ in millions) 2005 2005 2006 2006 Tons sold 14.8 7.0 9.6 17.4 Revenue $647.7 307.3 435.5 $775.9 % growth 27.0% – 41.7% 19.8% Average coal revenue / ton sold $41.95 $41.23 $43.44 $43.07 EBITDA $106.1 $56.1 $30.9 $80.9 % margin 16.4% 18.3% 7.1% 10.4% Net income (loss) $31.8 $19.9 ($6.8) $5.1 Capex 116.0 43.2 108.7 181.5 Cash $9.2 $12.7 $65.8 $65.8 Total debt 49.6 175.5 197.7 197.7 1 2 3 |
 20 Revised Financial Guidance for 2006 Lowered outlook due to idling Sycamore 2 mining complex and poor cost performance at specific mining operations. Sycamore 2 mine permanently downsized; net production drop of 1.5 million tons annually Eliminating 1.7 million annual tons of high cost production at other North/Central App operations Currently projected 2006 coal production of approximately 17 MM tons, with sales of approximately 20 MM tons, versus previous guidance of 18 MM tons produced and approximately 22 MM tons sold. Currently projected 2006 total revenues of approximately $0.9 billion versus approximately $1.0 billion previously projected. Projected Q3 EBITDA in the range of $8 MM-$10 MM. Projected Q4 EBITDA in the range of $25 MM-$30 MM. Projected 2006 EBITDA now in the range of $65 MM-$70 MM, down from $130 MM-$150 MM range. Projected 2006 earnings now net loss of $10 MM-$15 MM, or ($0.07)- ($0.10) per fully diluted share, versus earlier guidance of net earnings of $23 MM-$33 MM, or $0.15-$0.21 per fully diluted share. |
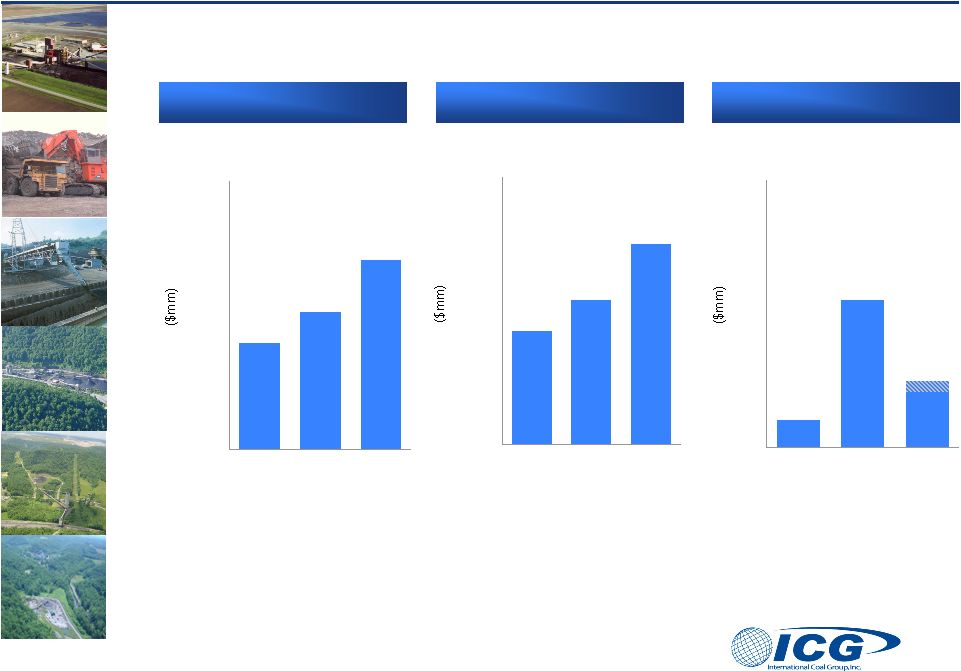 21 Total Revenue Total EBITDA 1, 2 Financial Performance Summary Notes: 1 EBITDA is a non-GAAP measure. A reconciliation to net income is provided in the Appendix to this presentation 2 2005 performance includes only the portion of Anker and CoalQuest activity post the November 18, 2005 merger date Total Coal Revenue 0 200 400 600 800 1,000 1,200 2004 2005 2006 477 619 850 0 200 400 600 800 1,000 1,200 2004 2005 2006 510 648 900 40 60 80 100 120 140 160 2004 2005 2006 52 106 65-70 2 2 |
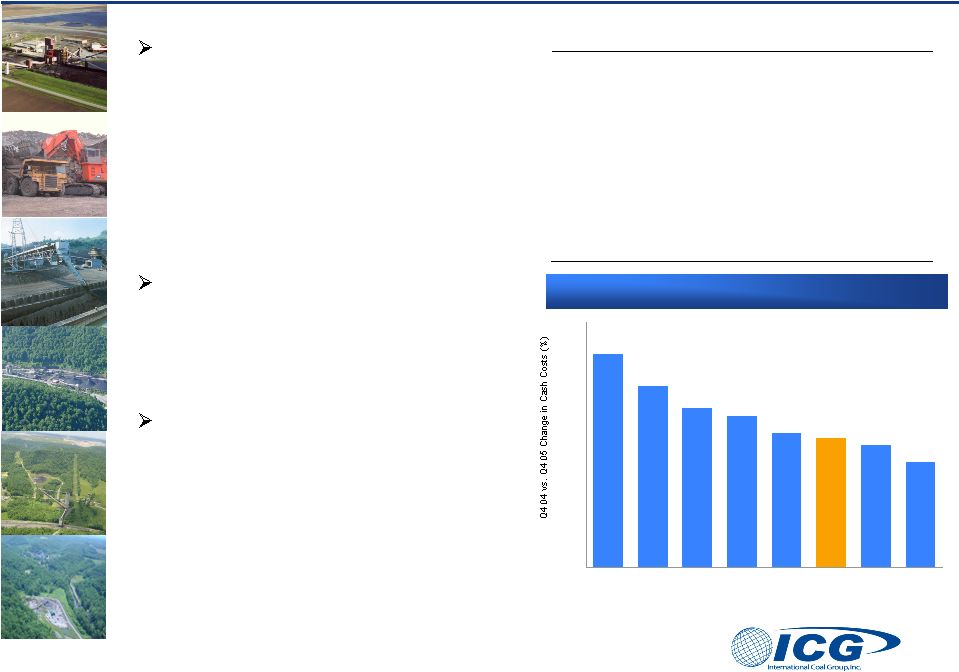 22 1 All industry players have experienced higher costs: – Diesel fuel and energy – Steel and roof bolts – Tires – ANFO and other explosives – Labor and healthcare costs In addition, other factors such as thinning coal seams in the Appalachian region have made expansion and growth more challenging ICG believes that its reserve base will support low-cost production growth relative to peers and that its balanced production profile will support financial stability Sector Cost Increases Estimated Price Increase 2005 over 2004 (%) Diesel Fuel (per gallon) ~28% Tires (per tire) ~22%–63% ANFO (per ton) ~25% Labor Costs ~8% Cost increases experienced by peers 1 Calculation includes only ICG operations in Q4 2004 21.8% 18.5% 16.2% 15.4% 13.7% 13.2% 12.5% 10.7% 0.0% 5.0% 10.0% 15.0% 20.0% 25.0% Arch CAPP Region James River CAPP Region Massey Consol Alpha Company Mines ICG Alpha Contract Mines Foundation |
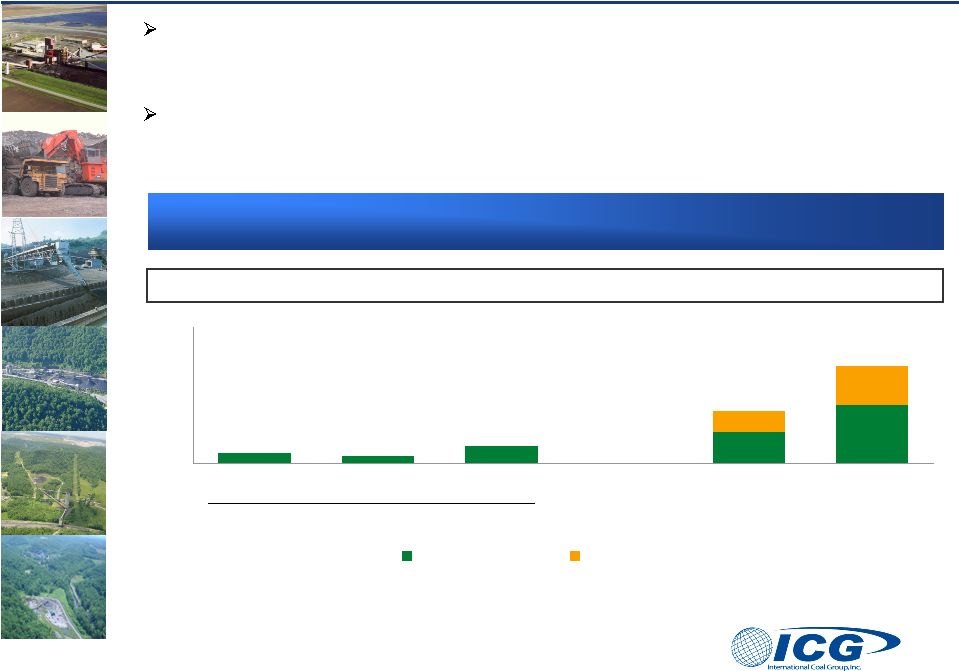 23 60% 60% 40% 40% 0 100 200 300 2002 2003 2004 2005 2006E Predecessors Capital Expenditures ($mm) In 2005-2006, majority of capital dedicated to upgrading aged equipment fleet. Development projects included Flint Ridge and Raven. In 2007-2009, $855 million in planned capex expected to be scaled back to focus growth capital on projects that offer greatest return – Priority development projects Sentinel-Clarion, Beckley and Tygart #1 Total 29 23 39 116 Capital Expenditures 214 Maintenance Growth |
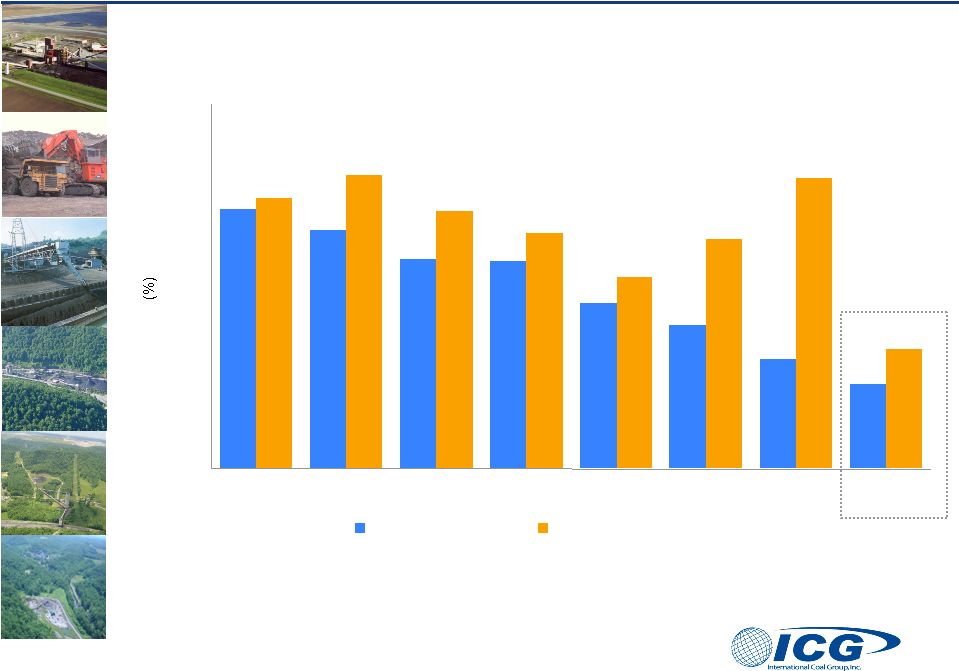 24 71.2 65.2 57.4 57.0 45.4 39.2 30.2 23.0 74.3 80.6 70.8 64.5 52.4 63.0 79.6 32.7 0 25 50 75 100 Alpha Foundation James River Massey Arch Peabody Consol ICG 6/30/06 Debt / Capitalization Legacy-Adjusted Debt / Capitalization Total Debt / Capitalization Comparison ICG maintains the lowest debt / capitalization ratio in the sector Note: 1 Legacy liability adjustments include post retirement benefits, black lung liabilities, reclamation liabilities, workers compensation and Coal Act liabilities 1 |
 25 Prominent position in 3 of the 4 largest coal producing regions in the U.S. Strong operating assets and large undeveloped reserve base provide attractive internal expansion opportunities Growing production levels and significant committed tonnage Highly productive workforce that is 100% union free Strong balance sheet with minimal long–term legacy liabilities Investment grade customer base extends across diverse market regions Experienced management team Favorable coal industry fundamentals Key Investment Considerations |
 26 Questions & Answers |
 27 Appendix EBITDA represents income from continuing operations before deducting net interest expense, income taxes, depreciation, depletion, amortization, and minority interest. We present EBITDA because we consider it an important supplemental measures of our performance and believe it is frequently used by securities analysts, investors and other interested parties in the evaluation of companies in our industry, substantially all of which present EBITDA when reporting their results. We also use EBITDA for the following purposes: Our executive compensation plan bases incentive compensation payments on our EBITDA performance measured against budgets and a peer group. Our amended and restated credit facility uses EBITDA (with additional adjustments) to measure our compliance with covenants, such as interest coverage and debt incurrence. EBITDA is also widely used by us and others in our industry to evaluate and price potential acquisition candidates. EBITDA has limitations as an analytical tool, and you should not consider it in isolation, or as a substitute for analysis of our results as reported under GAAP. Some of these limitations are: EBITDA does not reflect our cash expenditures, or future requirements, for capital expenditures or contractual commitments; EBITDA does not reflect changes in, or cash requirements for, our working capital needs; EBITDA does not reflect the significant interest expense, or the cash requirements necessary to service interest or principal payments, on our debts; Although depreciation and amortization are non-cash charges, the assets being depreciated and amortized will often have to be replaced in the future, and EBITDA does not reflect any cash requirements for such replacements; and Other companies in our industry may calculate EBITDA differently than we do, limiting its usefulness as comparative measures. EBITDA is a measure of our performance that is not required by, or presented in accordance with, GAAP and we also believe it is a useful indicator of our ability to meet debt service and capital expenditure requirements. EBITDA is not a measurement of our financial performance under GAAP and should not be considered as an alternative to net income, operating income or any other performance measures derived in accordance with GAAP or as an alternative to cash flow from operating activities as a measure of our liquidity. The following table reconciles net income, which we believe to be the closest GAAP performance measure, to EBITDA. Year ended December 31, 2005 Six months ended June 30, 2005 Six months ended June 30, 2006 Net income (loss) 31,825 19,949 (6,790) Interest expense, net (14,394) 18,307 33,692 Income tax expense 16,676 6,610 (6,383) Depreciation, depletion and amortization expense 43,195 11,220 87 EBITDA 106,075 56,086 30,863 |