 Bear Stearns Commodities and Capital Goods Conference November 29, 2006 Exhibit 99.1 |
 1 Forward-Looking Statements Statements that are not historical fact are forward-looking statements and may involve a number of risks and uncertainties. We have used the words “believe,” “could,” “estimate,” “expect,” “intend,” “may,” “plan,” “predict,” “project” and similar terms and phrases, including references to assumptions, in this presentation to identify forward- looking statements. These forward-looking statements are made based on expectations and beliefs concerning future events affecting us and are subject to uncertainties and factors relating to our operations and business environment, all of which are difficult to predict and many of which are beyond our control, that could cause our actual results to differ materially from those matters expressed in or implied by these forward-looking statements. The following factors are among those that may cause actual results to differ materially from our forward-looking statements: market demand for coal, electricity and steel; availability of qualified workers; future economic or capital market conditions; weather conditions or catastrophic weather-related damage; our production capabilities; the ongoing integration of Anker and CoalQuest into our business; the consummation of financing, acquisition or disposition transactions and the effect thereof on our business; our plans and objectives for future operations and expansion or consolidation; our relationships with, and other conditions affecting, our customers; the availability and costs of key supplies or commodities such as diesel fuel, steel, explosives and tires; prices of fuels which compete with or impact coal usage, such as oil and natural gas; timing of reductions or increases in customer coal inventories; long-term coal supply arrangements; risks in coal mining; unexpected maintenance and equipment failure; environmental, safety and other laws and regulations, including those directly affecting our coal mining and production, and those affecting our customers’ coal usage; competition; railroad, barge, trucking and other transportation availability, performance and costs; employee benefits costs and labor relations issues; replacement of our reserves; our assumptions concerning economically recoverable coal reserve estimates; availability and costs of credit, surety bonds and letters of credit; title defects or loss of leasehold interests in our properties which could result in unanticipated costs or inability to mine these properties; future legislation and changes in regulations or governmental policies or changes in interpretations thereof, including with respect to safety enhancements; the impairment of the value of our goodwill; the ongoing investigations into the Sago mine explosion; and our liquidity, results of operations and financial condition; the adequacy and sufficiency of our internal controls and legal and administrative proceedings, settlements, investigations and claim. You should keep in mind that any forward-looking statement made by us in this presentation speaks only as of the date on which we make it. New risks and uncertainties arise from time to time, and it is impossible for us to predict these events or how they may affect us. We have no duty to, and do not intend to, update or revise the forward-looking statements in this presentation except as may be required by law. In light of these risks and uncertainties, you should keep in mind that any forward-looking statement made in this presentation might not occur. |
 2 Ben Hatfield President and Chief Executive Officer Management Presenter |
 3 Prominent position in 3 of the 4 largest coal producing regions in the U.S. Strong operating assets and large undeveloped reserve base provide attractive internal expansion opportunities Highly productive workforce that is 100% union free Strong balance sheet with minimal long–term legacy liabilities Investment grade customer base extends across diverse market regions Experienced management team Favorable long-term coal industry fundamentals Key ICG Highlights |
 4 Leading Appalachian coal producer formed in May 2004 by an investor group led by Wilbur Ross October 1, 2004 – acquired 5 major mining complexes and substantial coal reserves through the bankruptcy sale of Horizon assets November 18, 2005 – completed stock acquisition of Anker and CoalQuest which added 5 mining complexes and boosted reserves by nearly 75% November 21, 2005 – began trading on NYSE under symbol ICO December 12, 2005 – completed $231 million equity offering ICG Overview Summary Statistics 2006E Revenue: $900 mm 2006E EBITDA: $65–$70 mm Market capitalization : $804 mm Senior Notes: $175mm @ 10¼% Coal reserves: 1.06 billion tons (proven and probable) 2006E production: 17 mm tons 2007E production: 17–19 mm tons Reserve life: Approximately 62 years Notes: 1 Per management guidance 2 Market capitalization is based on 152.9 million shares outstanding and a stock price of $5.26 as of November 6, 2006 1 1 1 1 2 |
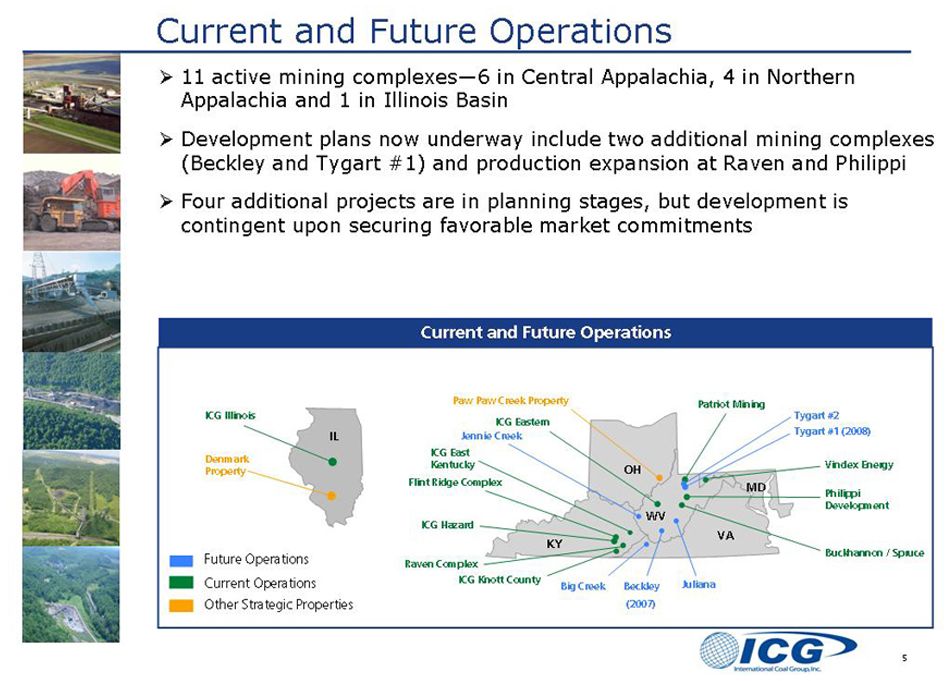 |
 6 Q4 2006 Ramp up at new Raven Complex: First shipments loaded in October; Expected to produce 1.2 million tons of high quality steam coal annually Start-up Philippi’s Sentinel Clarion Mine: Initial production in December; Expected to produce +1.0 million tons of high quality steam coal annually 2007 New Beckley Complex: Construction now underway; commercial production projected for August 2007. Expected to produce 1.3 million tons of low- volatile metallurgical coal at full production 2008 New Tygart No. 1 Complex: Construction to begin in Q1 2007 with initial coal production expected by mid-2008. Expected to produce 3.8 million tons of high quality steam and high-volatile metallurgical coal at full production New Production Coming On Line 2006-2008 |
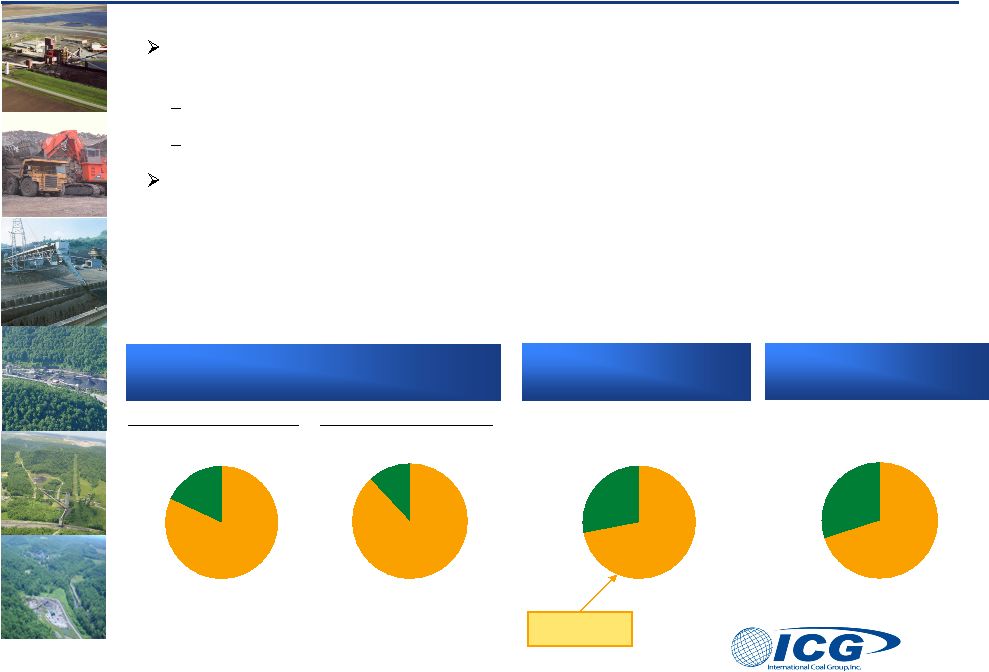 7 88% 12% < 1.5% > 1.5% 1.06 billion tons of coal reserves controlled - primarily high Btu, low sulfur steam and metallurgical quality coal 564 million tons in Appalachian Region – 57% NAPP/43% CAPP 496 million tons in Illinois Basin Although all currently planned mine developments are in the Appalachian Region, ICG’s Illinois Basin reserves are well positioned to benefit from the expected growth in regional demand arising from utility scrubbers and coal conversion projects Appalachian Reserve Profile Total Reserve Profile Owned vs. Leased Heat Content (Btu) Sulfur Content (%) 564 million tons Total Reserve Profile Met. vs. Steam 1.06 billion tons High Caliber Reserve Base 18% 82% > 12,500 < 12,500 72% 28% Owned Leased 70% 30% Steam Metallurgical Largest % of peer group |
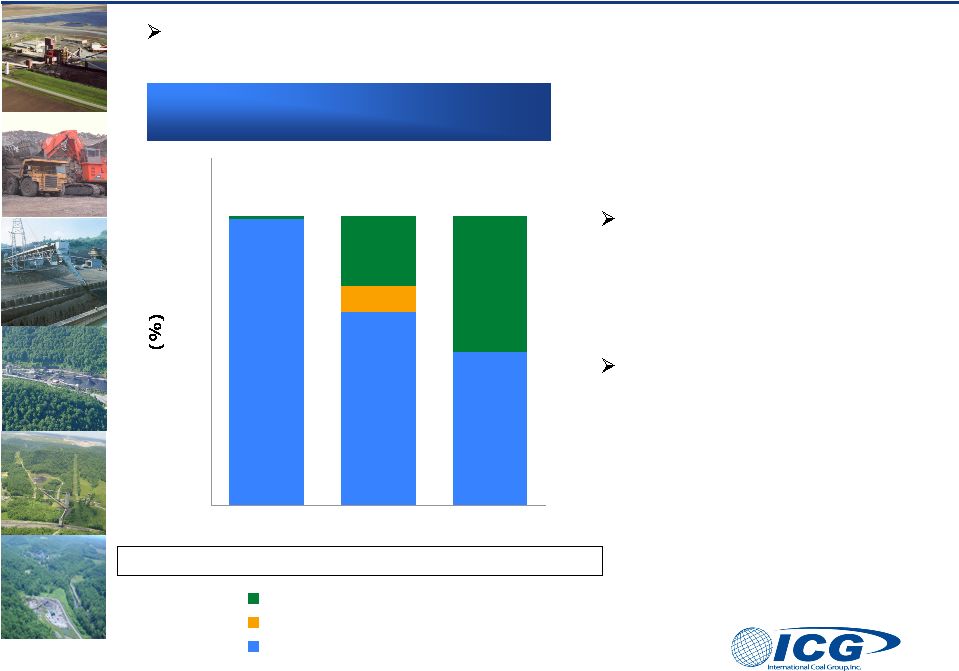 8 99 67 53 9 24 47 1 0 20 40 60 80 100 2006 2007 2008 Uncommitted Committed and Not Priced Committed and Priced Typically 50% contracted by middle of previous year with another 35% contracted by end of the previous year Some committed tons are subject to price reopeners Strong committed sales levels provide stable and predictable revenue stream Significant Committed Tonnage Note: Per October 26, 2006 earnings call Projected Sales 20 mm tons 18-20 mm tons 19-21 mm tons Committed Tonnage |
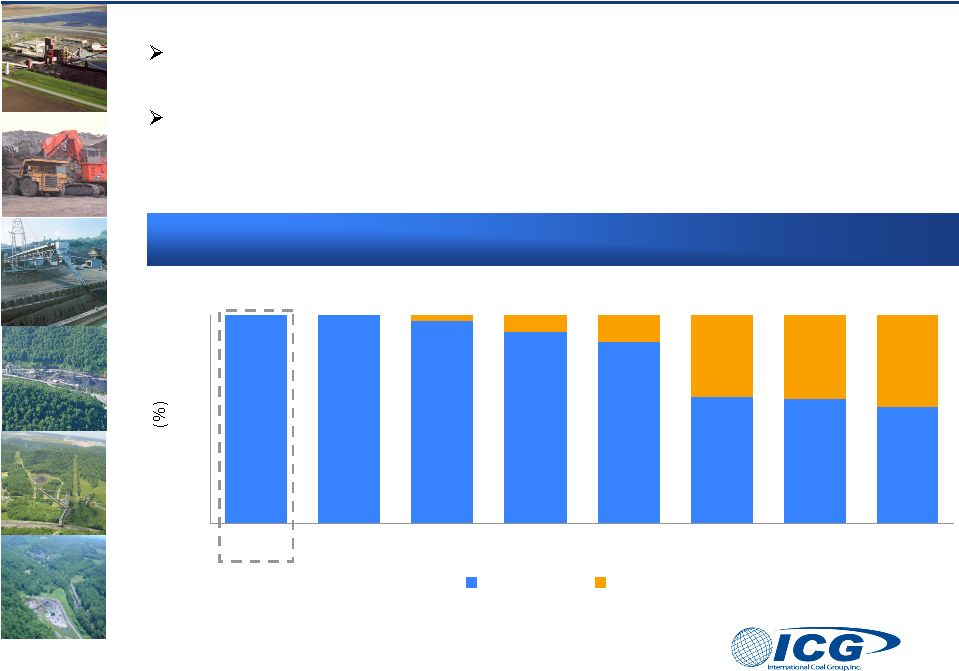 9 100 100 97 92 87 61 60 56 3 8 13 39 40 44 0 20 40 60 80 100 ICG James River Massey Alpha Arch Peabody Foundation Consol Non-Union Union Largest completely non-union coal company in the U.S. Many peers are vulnerable to workplace disruption during 2006 United Mine Workers of America (UMWA) contract renewals Workforce Composition Highly Productive, Non-Union Workforce |
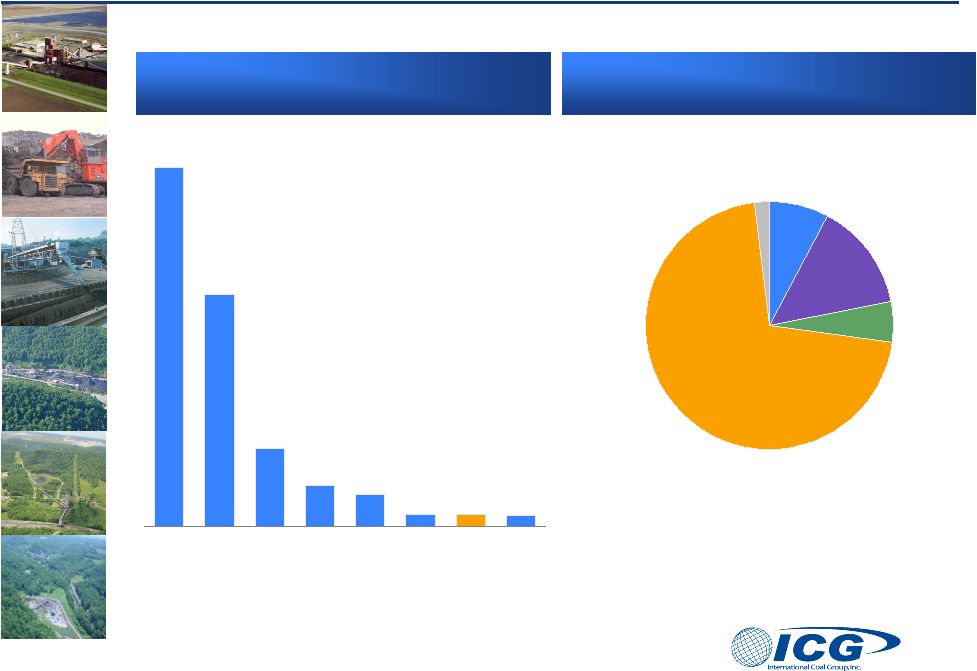 10 Source: Company Reports as of 12/31/05 Total Legacy Liabilities Notes: 1 Legacy liabilities include Post Retirement Benefits, Black Lung liabilities, Reclamation liabilities, Workers Compensation and Coal Act Liabilities 2 As of 12/31/05 as reported by Arch management and is pro forma for Magnum Coal transaction Low Legacy Liabilities ICG Legacy Liabilities Total: $119mm 2 ($ in millions) 3,553 2,298 772 409 320 120 119 110 Consol Peabody Foundation Massey Arch James River ICG Alpha Reclamation 71% Rockefeller 5% Workers Comp 2% FAS 106 8% Black lung 14% 1 |
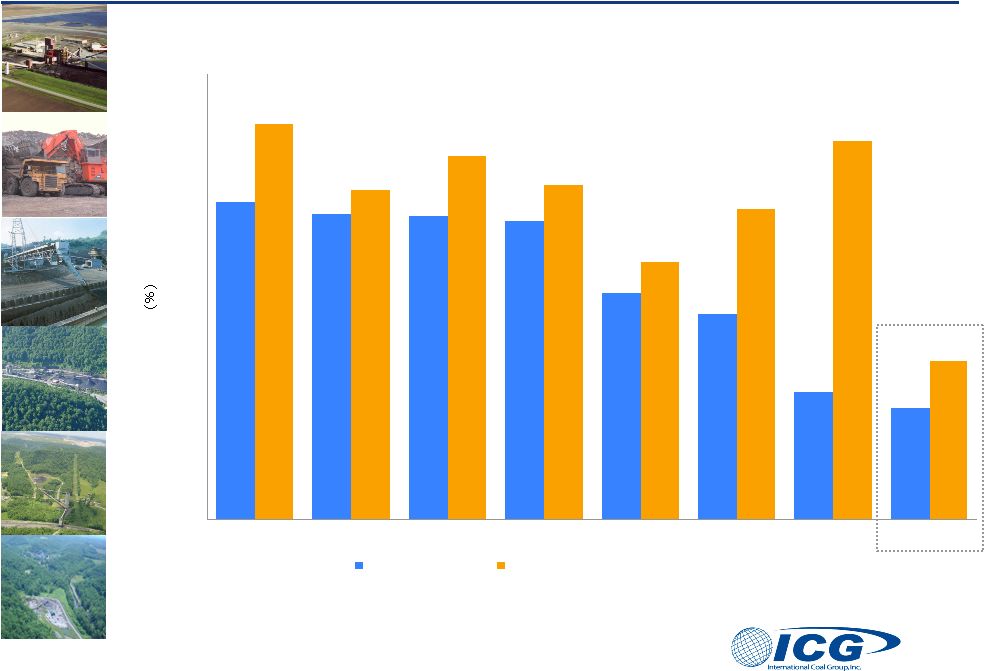 11 64.1 61.8 61.4 60.3 45.8 41.7 25.9 22.7 79.8 66.7 73.5 67.5 52.0 62.8 76.5 32.2 0.0 10.0 20.0 30.0 40.0 50.0 60.0 70.0 80.0 90.0 Foundation Alpha James River Massey Arch Peabody Consol ICG Debt/Capitalization Legacy-Adjusted Debt/Capitalization¹ Total Debt / Capitalization Comparison ICG maintains the lowest debt / capitalization ratio in the sector Source: Company filings as of 9/30/06 Note: 1 Legacy liability adjustments include post retirement benefits, black lung liabilities, reclamation liabilities, workers compensation and Coal Act liabilities 1 |
 12 Experienced Management Team The members of ICG’s senior management team have broad industry work experience Position Years in Industry Prior Employer Ben Hatfield President and CEO 27 Arch Scott Perkins Senior Vice President, KY and Illinois Operations 27 Horizon Sam Kitts Senior Vice President, WV and MD Operations 19 Alpha Natural Resources Roger Nicholson Senior Vice President, General Counsel & Secretary 20 Jackson Kelly Michael Hardesty Senior Vice President, Sales & Marketing 23 Arch Gene Kitts Senior Vice President, Mining Services 29 Arch William Campbell Vice President-Purchasing & Risk Management 31 Horizon Charles Snavely Vice President, Planning and Acquisitions 28 James River Brad Harris Vice President and Chief Financial Officer N/A GMH Communities Trust |
 13 Current market weakness is essentially a short-term correction of the recent supply/demand imbalance - Excess coal supply stems from production growth and mild weather - Broad production cuts now being implemented will take high cost coal off the market - Pricing is generally expected to rebound during 2 half 2007 Long-term outlook for coal demand is strong Continuing growth in electricity demand at roughly 1.6% CAGR (per EIA) Over 50% of US electrical generation is coal-fired, and coal is (by far) the most economic and secure fuel for future demand Emerging markets for coal conversion technologies (coal-to-gas and coal- to-liquids) will further bolster coal demand Long-Term Coal Fundamentals Are Favorable nd |
 14 Increased consolidation through mergers & acquisitions More disciplined growth pace going forward – Sharp contrast versus the rush to boost output of the past 18-24 months - Increased focus on sales contract commitments pre-investment Appalachian region is expected to have flat to declining production. Central Appalachian production will likely decrease over time due to reserve depletion, but Northern Appalachia could see modest production growth Overall result should strengthen the coal industry as marginal mines and operators exit the business Outlook For US Coal Industry |
 15 Questions & Answers |
 16 Appendix EBITDA represents income from continuing operations before deducting net interest expense, income taxes, depreciation, depletion, amortization, and minority interest. We present EBITDA because we consider it an important supplemental measures of our performance and believe it is frequently used by securities analysts, investors and other interested parties in the evaluation of companies in our industry, substantially all of which present EBITDA when reporting their results. We also use EBITDA for the following purposes: Our executive compensation plan bases incentive compensation payments on our EBITDA performance measured against budgets and a peer group. Our amended and restated credit facility uses EBITDA (with additional adjustments) to measure our compliance with covenants, such as interest coverage and debt incurrence. EBITDA is also widely used by us and others in our industry to evaluate and price potential acquisition candidates. EBITDA has limitations as an analytical tool, and you should not consider it in isolation, or as a substitute for analysis of our results as reported under GAAP. Some of these limitations are: EBITDA does not reflect our cash expenditures, or future requirements, for capital expenditures or contractual commitments; EBITDA does not reflect changes in, or cash requirements for, our working capital needs; EBITDA does not reflect the significant interest expense, or the cash requirements necessary to service interest or principal payments, on our debts; Although depreciation and amortization are non-cash charges, the assets being depreciated and amortized will often have to be replaced in the future, and EBITDA does not reflect any cash requirements for such replacements; and Other companies in our industry may calculate EBITDA differently than we do, limiting its usefulness as comparative measures. EBITDA is a measure of our performance that is not required by, or presented in accordance with, GAAP and we also believe it is a useful indicator of our ability to meet debt service and capital expenditure requirements. EBITDA is not a measurement of our financial performance under GAAP and should not be considered as an alternative to net income, operating income or any other performance measures derived in accordance with GAAP or as an alternative to cash flow from operating activities as a measure of our liquidity. The following table reconciles net income, which we believe to be the closest GAAP performance measure, to EBITDA. Year Ended Nine Months Ended Nine Months Ended December 31, September 30, September 30, 2005 2005 2006 Net Income (loss) $ 31,825 $ 28,548 $ (9,223) Interest expense, net (14,394) 10,195 12,961 Income tax expense (benefit) 16,676 14,786 (12,936) Depreciation, depletion and amortization expense 43,195 29,489 50,181 Minority Interest – – 141 EBITDA $ 106,075 $ 83,018 $ 41,124 |