Exhibit 99.1

Diamond Foods Platform for Future Growth Michael J. Mendes Chairman, President and CEO Barclays Capital Back-to-School Consumer Conference September 7, 2011 Diamond
Important Information This document contains forward-looking statements as defined by the Private Securities Litigation Reform Act of 1995, including projections of Diamond’s results. The words “anticipate,” “expect,” “believe,” “goal,” “plan,” “intend,” “estimate,” “may,” “will,” “would” and similar expressions and variations thereof are intended to identify forward-looking statements, but are not the exclusive means of identifying such statements. Forward-looking statements necessarily depend on assumptions, data or methods that may be incorrect or imprecise and are subject to risks and uncertainties. Actual results could differ materially from projections made in this release. Some factors that could cause actual results to differ from our expectations include the timing of closing the transaction and the possibility that the transaction is not consummated, risks of integrating acquired businesses and entering markets in which we have limited experience, availability and pricing of raw materials, impact of additional indebtedness, loss of key suppliers, customers or employees, and an increase in competition. A more extensive list of factors that could materially affect our results can be found in Diamond’s periodic filings with the Securities and Exchange Commission. They are available publicly and on request from Diamond’s Investor Relations Department. 2
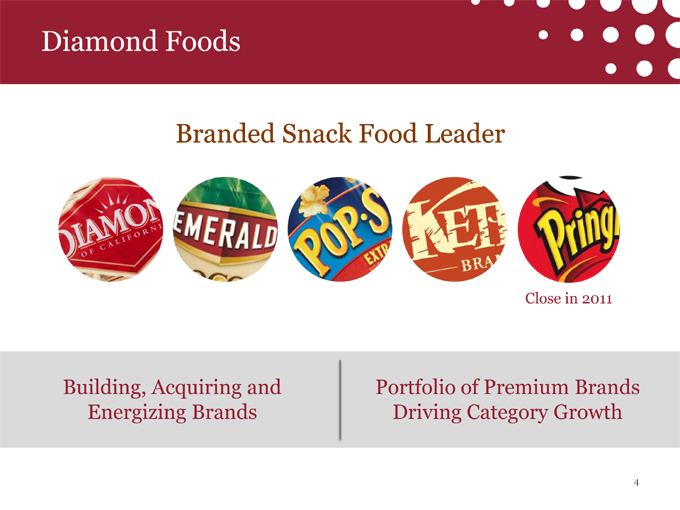
Diamond Foods Branded Snack Food Leader Close in 2011 Building, Acquiring and Portfolio of Premium Brands Energizing Brands Driving Category Growth 4
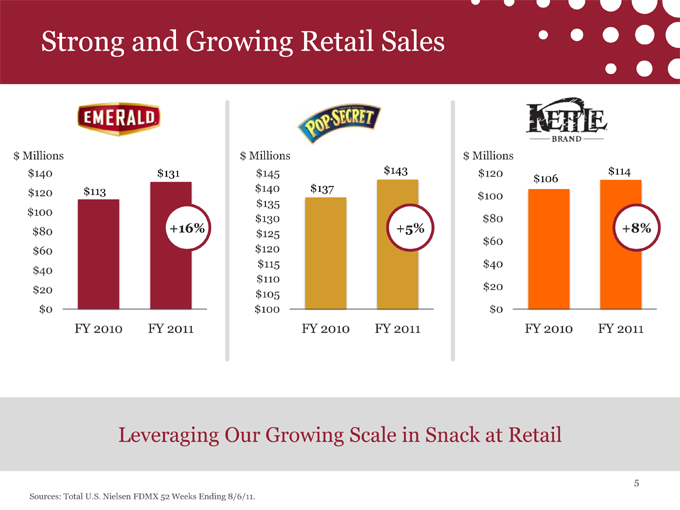
Strong and Growing Retail Sales $ Millions $ Millions $ Millions $140 $131 $145 $143 $120 $114 $106 $120 $113 $140 $137 $100 $135 $100 $130 $80 $80 +16% $125 +5% +8% $60 $60 $120 $115 $40 $40 $110 $20 $20 $105 $0 $100 $0 FY 2010 FY 2011 FY 2010 FY 2011 FY 2010 FY 2011 Leveraging Our Growing Scale in Snack at Retail 5 Sources: Total U.S. Nielsen FDMX 52 Weeks Ending 8/6/11.
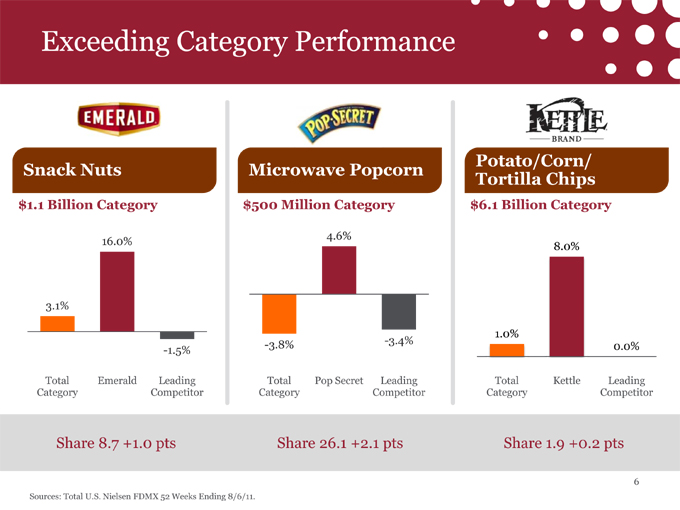
Exceeding Category Performance Potato/Corn/ Snack Nuts Microwave Popcorn Tortilla Chips $1.1 Billion Category $500 Million Category $6.1 Billion Category 4.6% 16.0% 8.0% 3.1% 1.0% -3.8% -3.4% -1.5% 0.0% Total Emerald Leading Total Pop Secret Leading Total Kettle Leading Category Competitor Category Competitor Category Competitor Share 8.7 +1.0 pts Share 26.1 +2.1 pts Share 1.9 +0.2 pts 6 Sources: Total U.S. Nielsen FDMX 52 Weeks Ending 8/6/11.

Outstanding Financial Performance Snack Sales Operating Margin EPS $ Millions % Revenue $ / Share $545-$560 11.0%- $2.48-12.0% $2.52 9.5% $1.91 8.0% $321 $1.47 $189 4.5% 3.0% $0.91 $80 $89 $0.53 ‘07 ‘08 ‘09 ‘10 ‘11e ‘07 ‘08 ‘09 ‘10 ‘11e ‘07 ‘08 ‘09 ‘10 ‘11e High Revenue Growth with Expanding Margins 7 *2011 Estimates Based on Guidance Provided on June 2, 2011

Becoming a Global Snack Leader Top Global Companies Top Global Brands Retail Retail Snack Sales Snack Sales ($ mm) Share ($ mm) Share 1 $29,341 27.6% 1 $7,130 6.7% 2PF $3,459 3.3% 2 3,752 3.5% 2 2,472 2.3% 3 2,970 2.8% 3 2,015 1.9% 4 2,464 2.3% 4 1,965 1.8% 5 2,067 1.9% 5 1,745 1.6% 6 2,025 1.9% 6 1,558 1.5% 7 1,326 1.2% 7 1,417 1.3% 8 987 0.9% 8 1,288 1.2% 9 971 0.9% 9 1,151 1.1% 10 968 0.9% 10 1,100 1.0% 8 Source: Euromonitor 2010 Global Sweet & Savory Snacks Category (includes: chips / crisps; extruded snacks; fruit snacks; popcorn; pretzels; tortilla / corn chips; other sweet and savory snacks
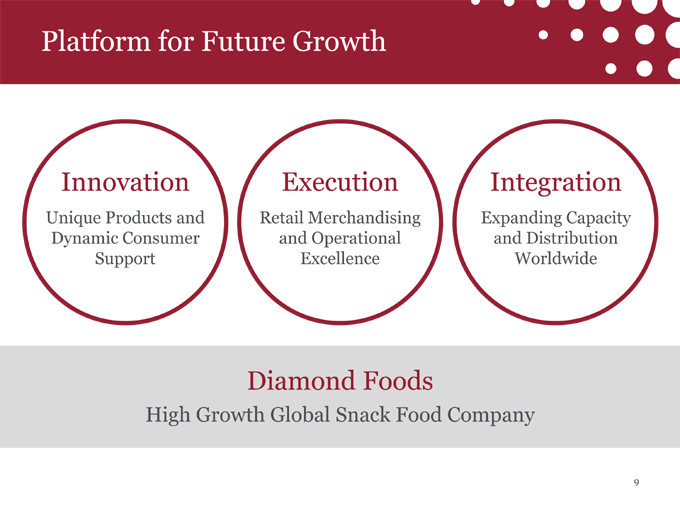
Platform for Future Growth Innovation Execution Integration Unique Products and Retail Merchandising Expanding Capacity Dynamic Consumer and Operational and Distribution Support Excellence Worldwide Diamond Foods High Growth Global Snack Food Company 9
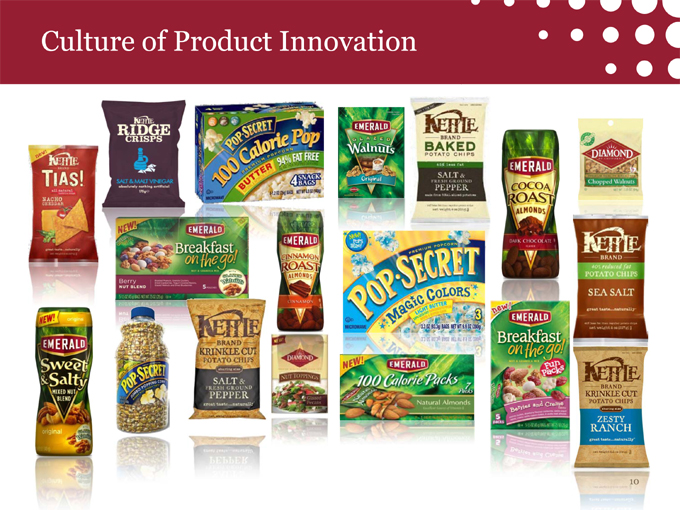
Culture of Product Innovation 10
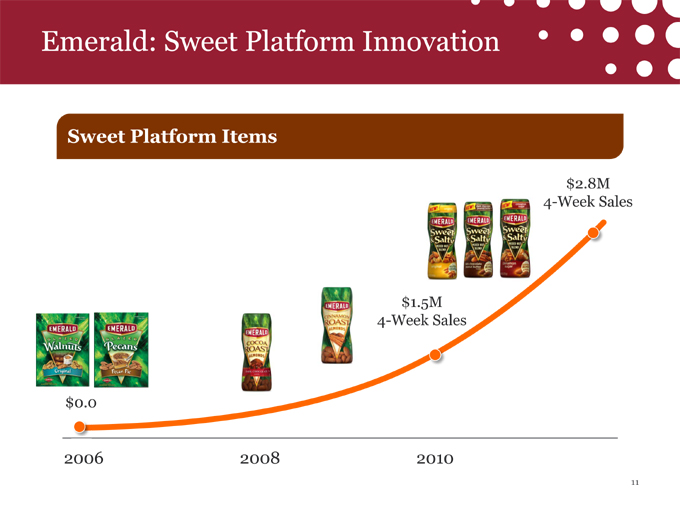
Emerald: Sweet Platform Innovation Sweet Platform Items $2.8M 4-Week Sales $1.5M 4-Week Sales $0.0 2006 2008 2010 11
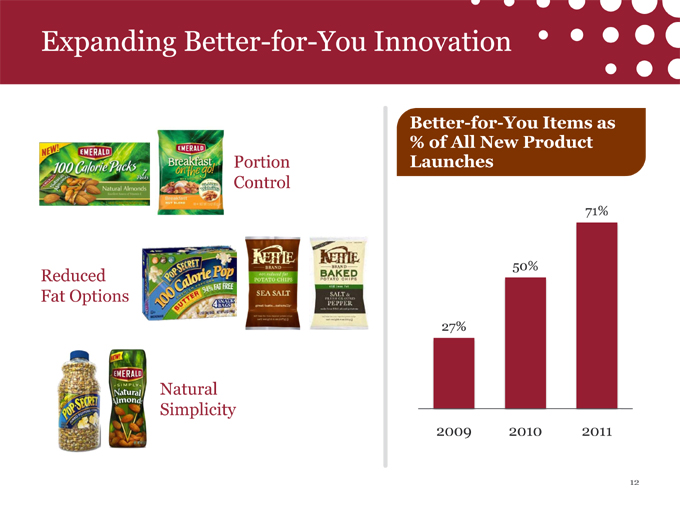
Expanding Better-for-You Innovation Better-for-You Items as % of All New Product Portion Launches Control 71% 50% Reduced Fat Options 27% Natural Simplicity 2009 2010 2011 12
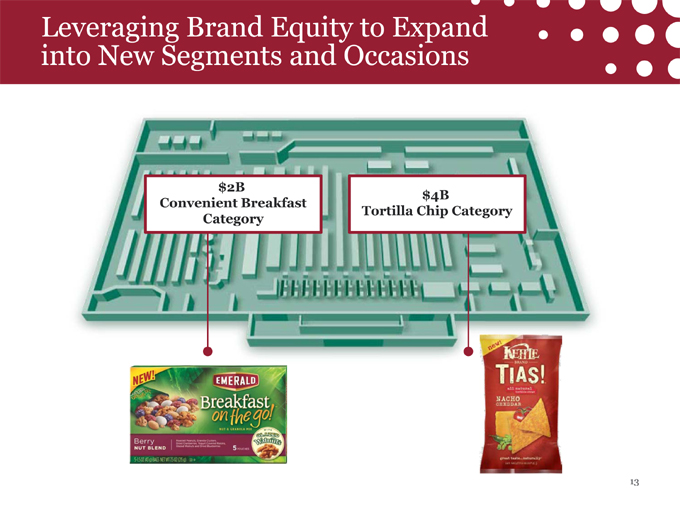
Leveraging Brand Equity to Expand into New Segments and Occasions $2B $4B Convenient Breakfast Tortilla Chip Category Category 13

Breakfast on the Go: Strong Sales Performance Convenient Breakfast Retail Sales Category Growth $1.6 Billion Category $ Millions 3.1% $9.1 $8.5 1.8% $4.7 Total Category Total Category Mar/Apr May/June Jul/Aug w/o BOTG w/BOTG 12 Week Sales *-12% Week Data Currently at 75% ACV Market Share 1.3% 14 Source: Total U.S. Nielsen Grocery $2MM: 12 Weeks Ending 8/6/11
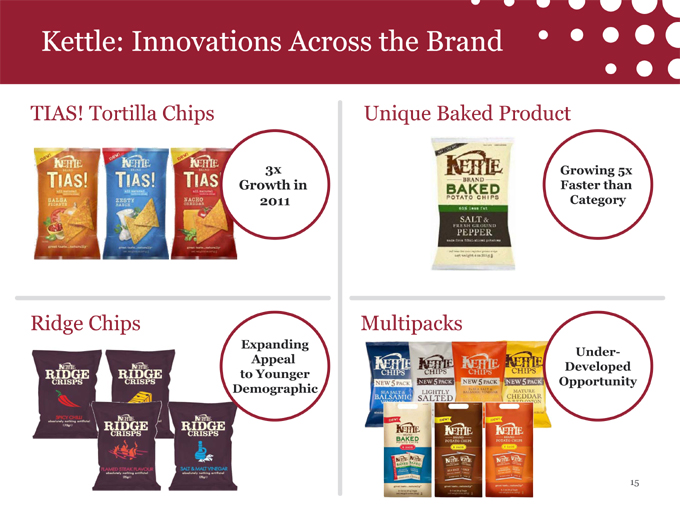
Kettle: Innovations Across the Brand TIAS! Tortilla Chips Unique Baked Product 3x Growing 5x Growth in Faster than 2011 Category Ridge Chips Multipacks Expanding Under-Appeal Developed to Younger Opportunity Demographic 15
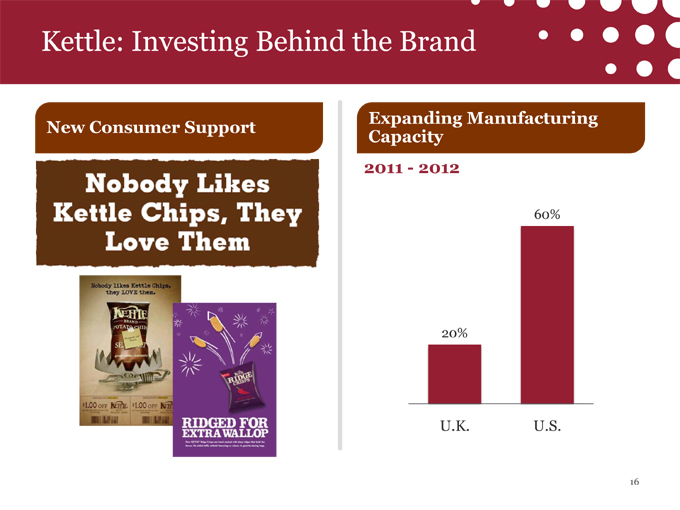
Kettle: Investing Behind the Brand Expanding Manufacturing New Consumer Support Capacity 2011—2012 60% 20% U.K. U.S. 16
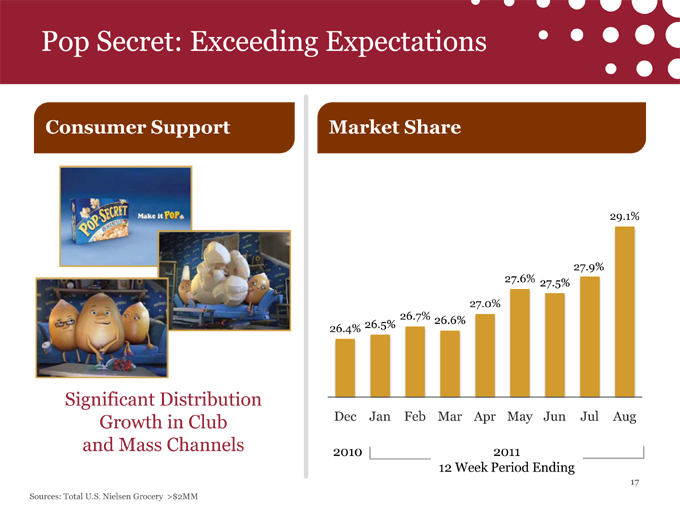
Pop Secret: Exceeding Expectations Consumer Support Market Share 29.1% 27.9% 27.6% 27.5% 27.0% 26.7% 26.6% 26.4% 26.5% Significant Distribution Growth in Club Dec Jan Feb Mar Apr May Jun Jul Aug and Mass Channels 2010 2011 12 Week Period Ending 17 Sources: Total U.S. Nielsen Grocery >$2MM
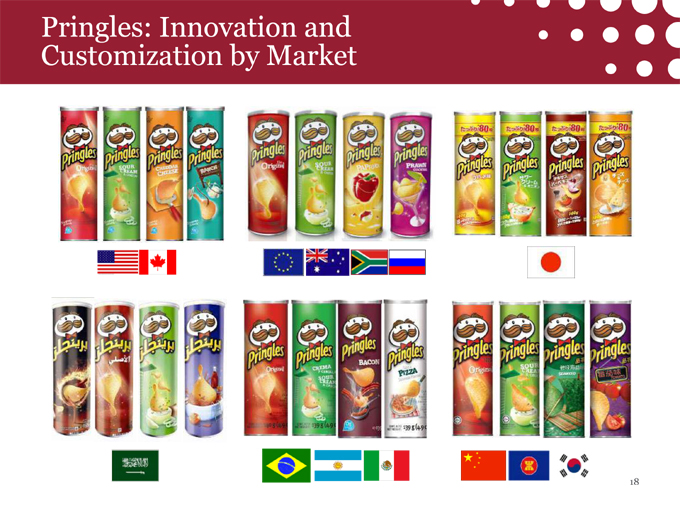
Pringles: Innovation and Customization by Market 18
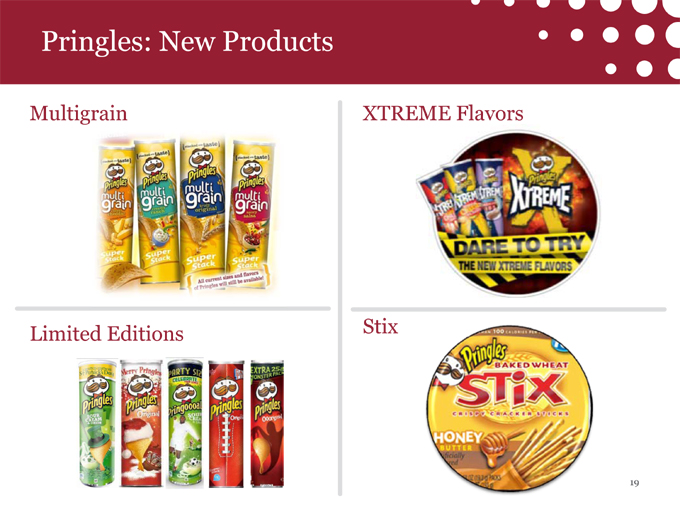
Pringles: New Products Multigrain XTREME Flavors Limited Editions Stix 19
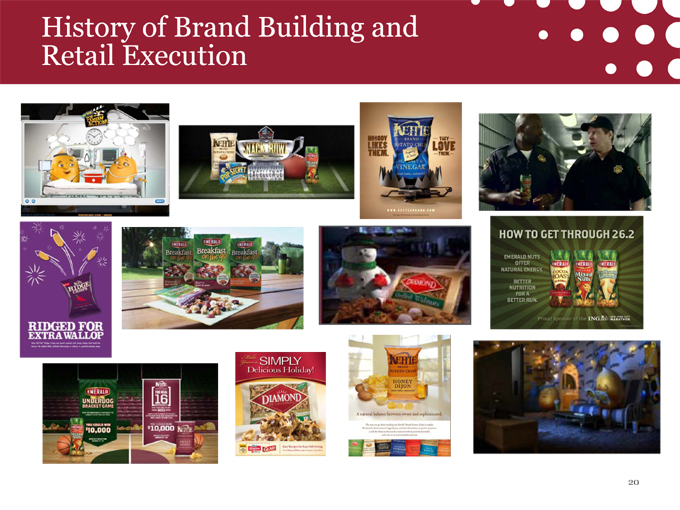
History of Brand Building and Retail Execution 20
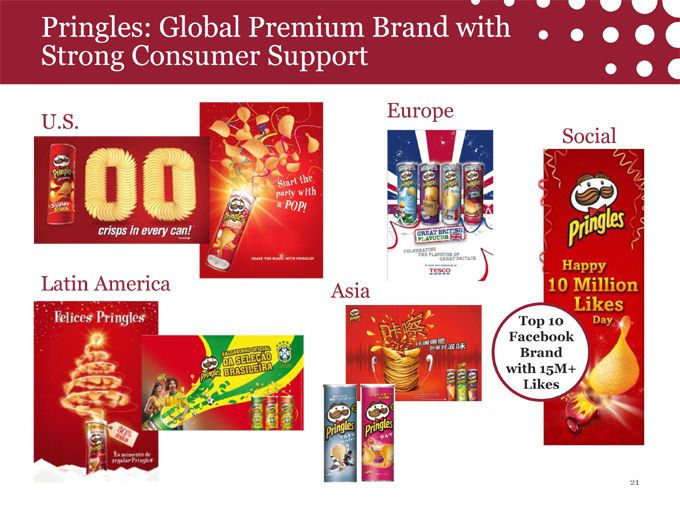
Pringles: Global Premium Brand with Strong Consumer Support Europe U.S. Social Latin America Asia Top 10 Facebook Brand with 15M+ Likes 21

Lloyd J. Johnson EVP and Chief Sales Officer
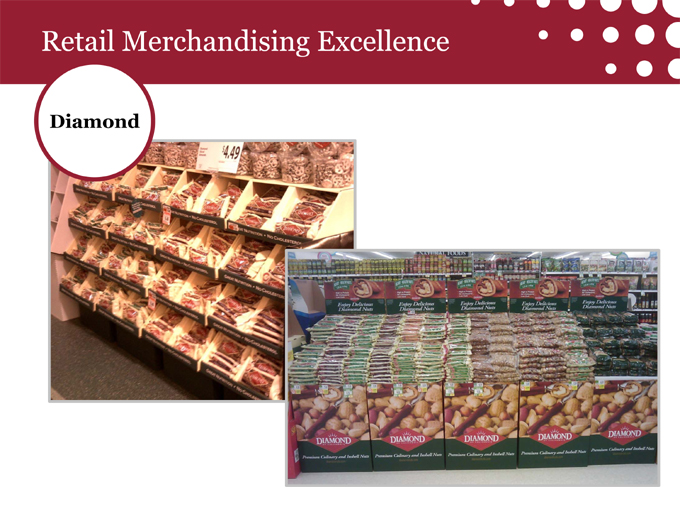
Retail Merchandising Excellence Diamond
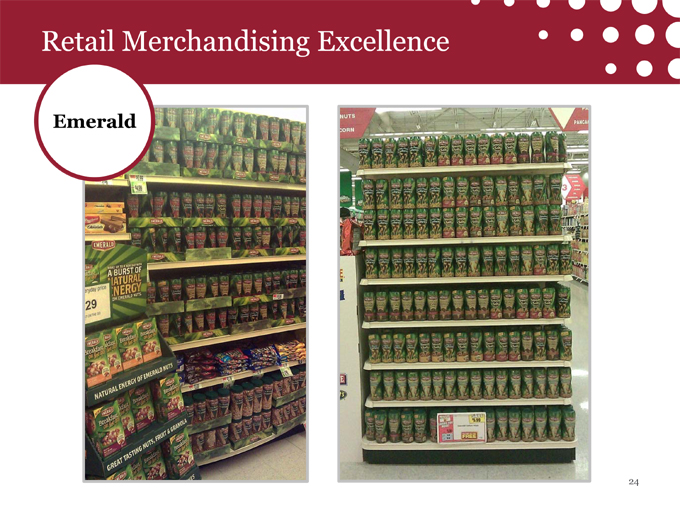
Retail Merchandising Excellence Emerald
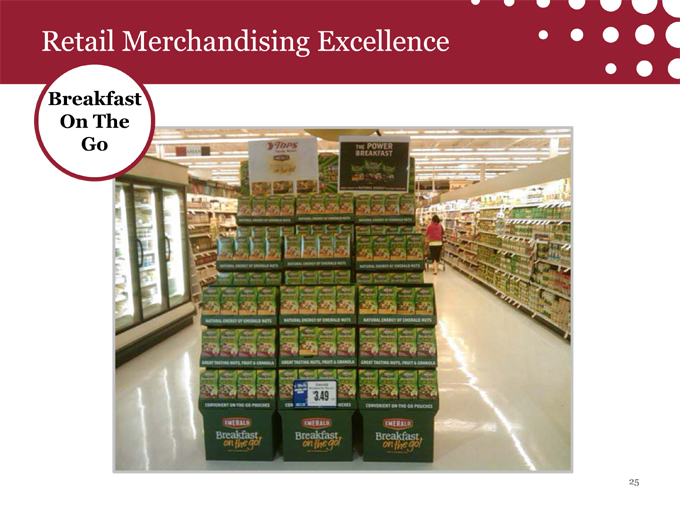
Retail Merchandising Excellence Breakfast On The Go
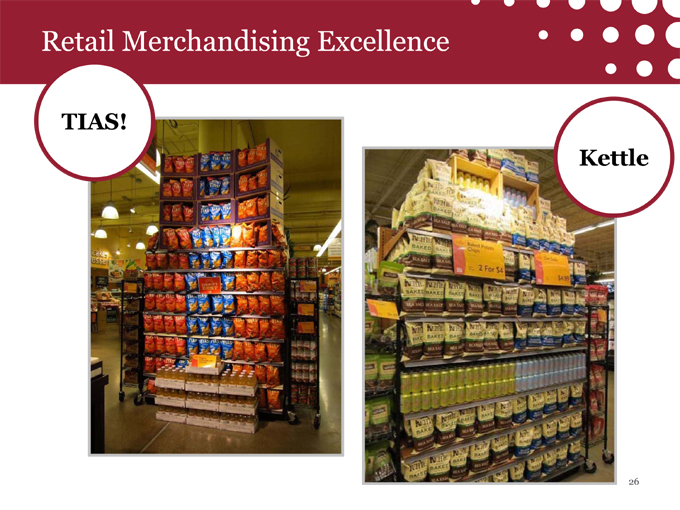
Retail Merchandising Excellence TIAS! Kettle
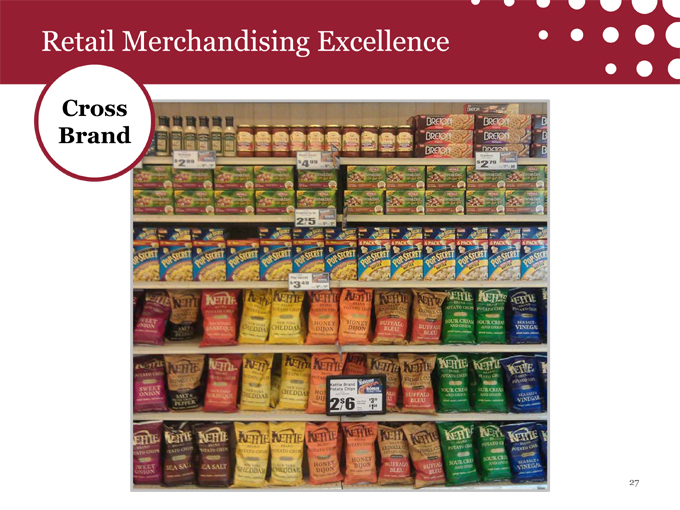
Retail Merchandising Excellence Cross Brand
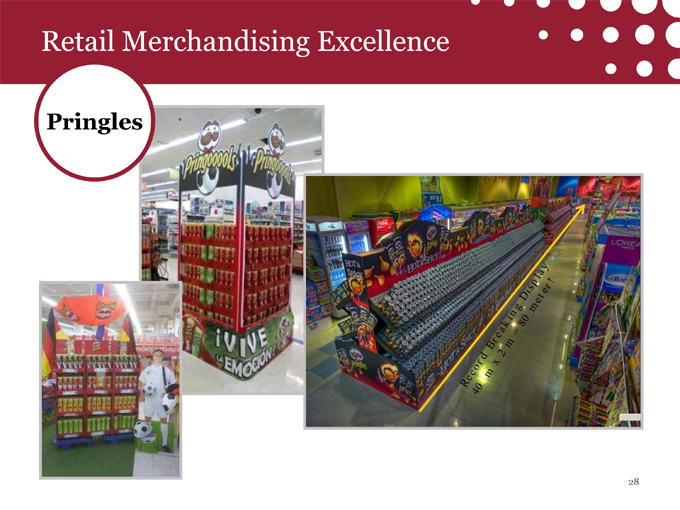
Retail Merchandising Excellence Pringles 28
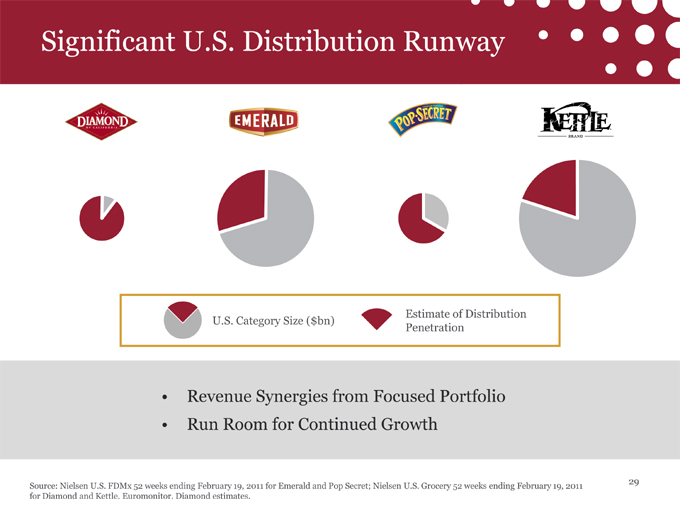
Significant U.S. Distribution Runway Estimate of Distribution U.S. Category Size ($bn) Penetration • Revenue Synergies from Focused Portfolio • Run Room for Continued Growth 29 Source: Nielsen U.S. FDMx 52 weeks ending February 19, 2011 for Emerald and Pop Secret; Nielsen U.S. Grocery 52 weeks ending February 19, 2011 for Diamond and Kettle. Euromonitor. Diamond estimates.
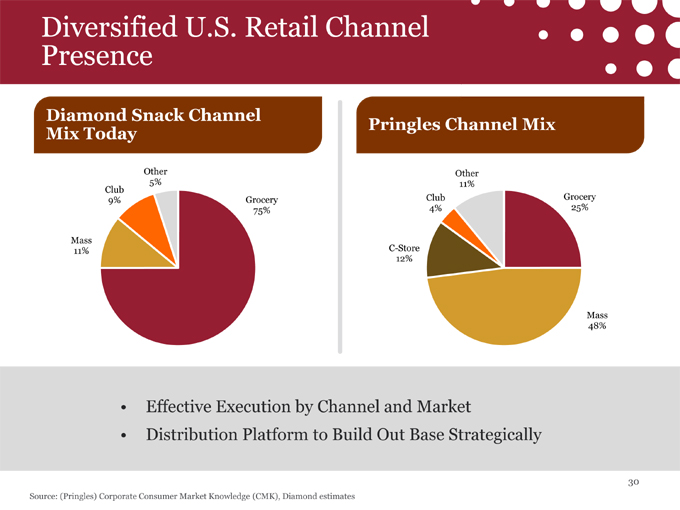
Diversified U.S. Retail Channel Presence Diamond Snack Channel Pringles Channel Mix Mix Today Other Other 5% 11% Club 9% Grocery Club Grocery 75% 4% 25% Mass 11% C-Store 12% Mass 48% • Effective Execution by Channel and Market • Distribution Platform to Build Out Base Strategically 30 Source: (Pringles) Corporate Consumer Market Knowledge (CMK), Diamond estimates

Steven M. Neil EVP, Chief Financial and Administrative Officer
Pringles: Attractive Integration Opportunity • Iconic, Profitable $1B+ Brand • Geographic Diversity • Worldwide Manufacturing Footprint • Global Distribution Reach • Financially Compelling Fit 32
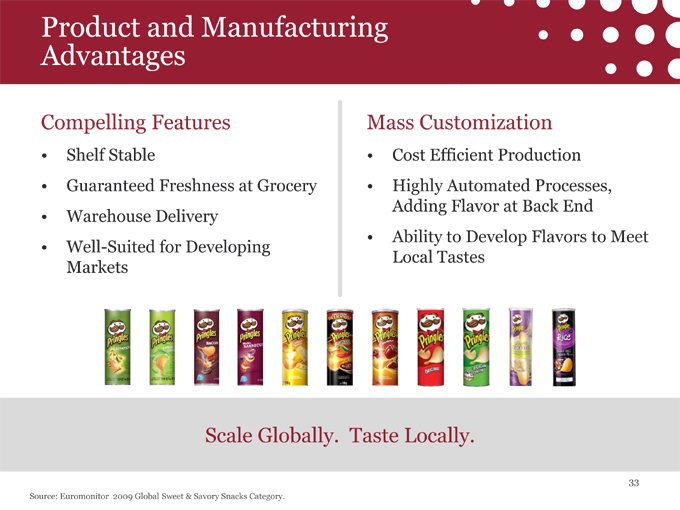
Product and Manufacturing Advantages Compelling Features Mass Customization • Shelf Stable • Cost Efficient Production • Guaranteed Freshness at Grocery • Highly Automated Processes, Adding Flavor at Back End • Warehouse Delivery • Ability to Develop Flavors to Meet • Well-Suited for Developing Local Tastes Markets Scale Globally. Taste Locally. 33 Source: Euromonitor 2009 Global Sweet & Savory Snacks Category.
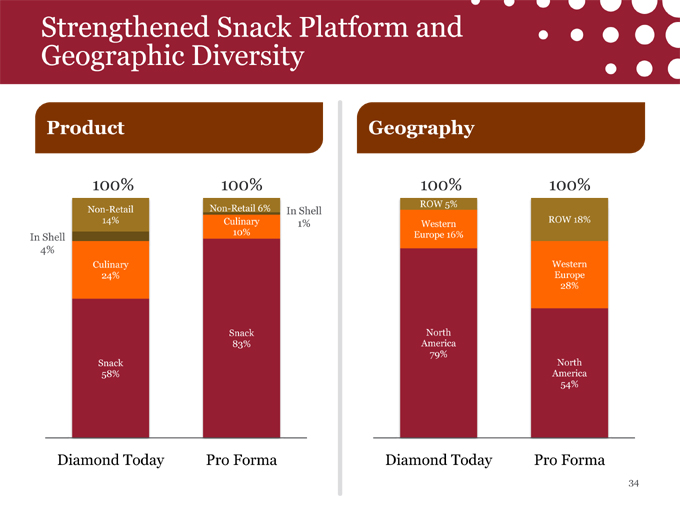
Strengthened Snack Platform and Geographic Diversity Product Geography 100% 100% 100% 100% Non-Retail 6% ROW 5% Non-Retail In Shell 14% Culinary 1% Western ROW 18% 10% Europe 16% In Shell 4% Culinary Western 24% Europe 28% Snack North 83% America Snack 79% North 58% America 54% Diamond Today Pro Forma Diamond Today Pro Forma 34
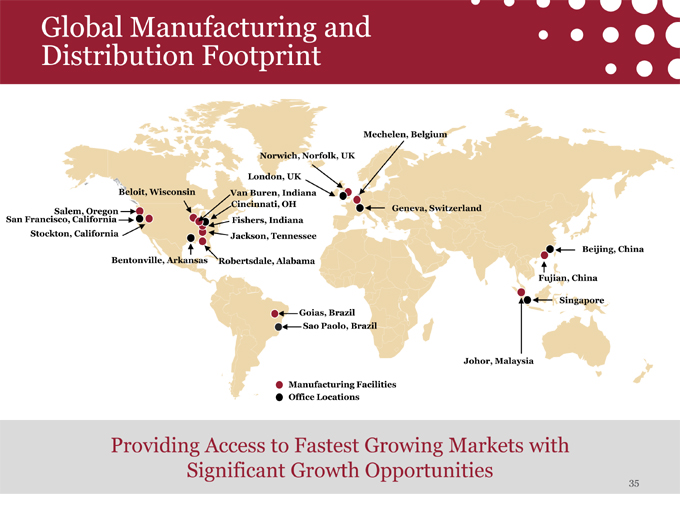
Global Manufacturing and Distribution Footprint Mechelen, Belgium Norwich, Norfolk, UK London, UK Beloit, Wisconsin Van Buren, Indiana Cincinnati, OH Salem, Oregon Geneva, Switzerland San Francisco, California Fishers, Indiana Stockton, California Jackson, Tennessee Beijing, China Bentonville, Arkansas Robertsdale, Alabama Fujian, China Singapore Goias, Brazil Sao Paolo, Brazil Johor, Malaysia Manufacturing Facilities Office Locations Providing Access to Fastest Growing Markets with Significant Growth Opportunities 35
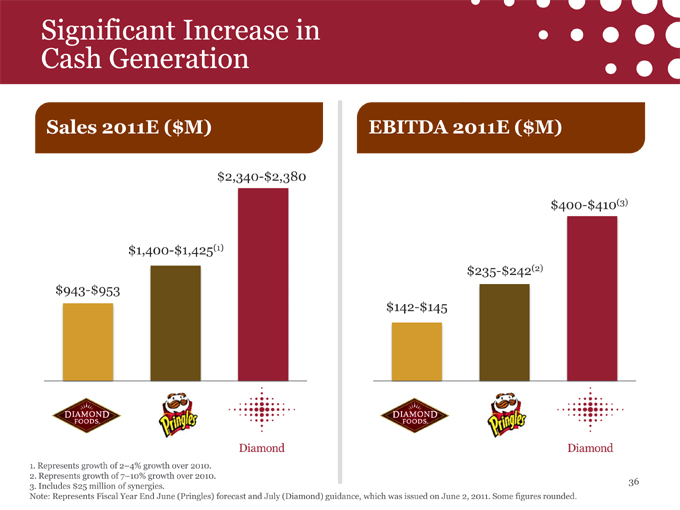
Significant Increase in Cash Generation Sales 2011E ($M) EBITDA 2011E ($M) $2,340-$2,380 $400-$410(3) $1,400-$1,425(1) $235-$242(2) $943-$953 $142-$145 1. Represents growth of 2–4% growth over 2010. 2. Represents growth of 7–10% growth over 2010. 36 3. Includes $25 million of synergies. Note: Represents Fiscal Year End June (Pringles) forecast and July (Diamond) guidance, which was issued on June 2, 2011. Some figures rounded.
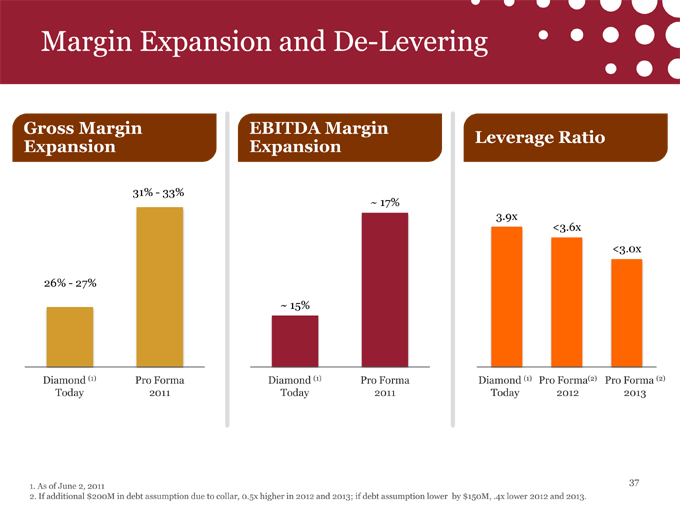
Margin Expansion and De-Levering Gross Margin EBITDA Margin Leverage Ratio Expansion Expansion 31%—33% ~ 17% 3.9x <3.6x <3.0x 26%—27% ~ 15% Diamond (1) Pro Forma Diamond (1) Pro Forma Diamond (1) Pro Forma(2) Pro Forma (2) Today 2011 Today 2011 Today 2012 2013 37 1. As of June 2, 2011 2. If additional $200M in debt assumption due to collar, 0.5x higher in 2012 and 2013; if debt assumption lower by $150M, .4x lower 2012 and 2013.
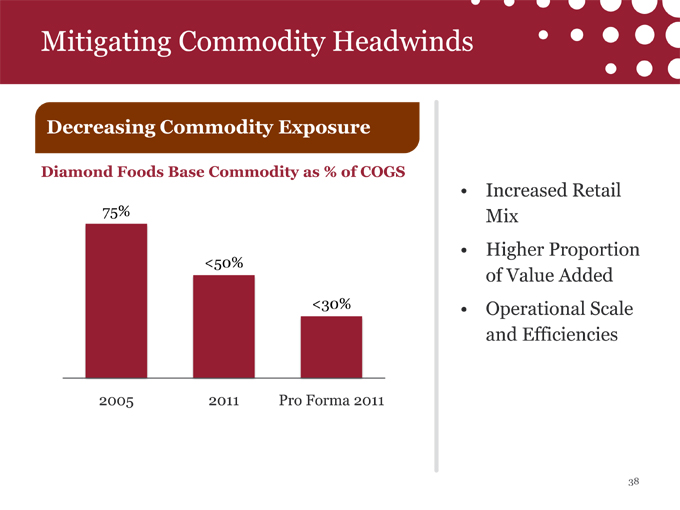
Mitigating Commodity Headwinds Decreasing Commodity Exposure Diamond Foods Base Commodity as % of COGS • Increased Retail 75% Mix • Higher Proportion <50% of Value Added <30% • Operational Scale and Efficiencies 2005 2011 Pro Forma 2011 38
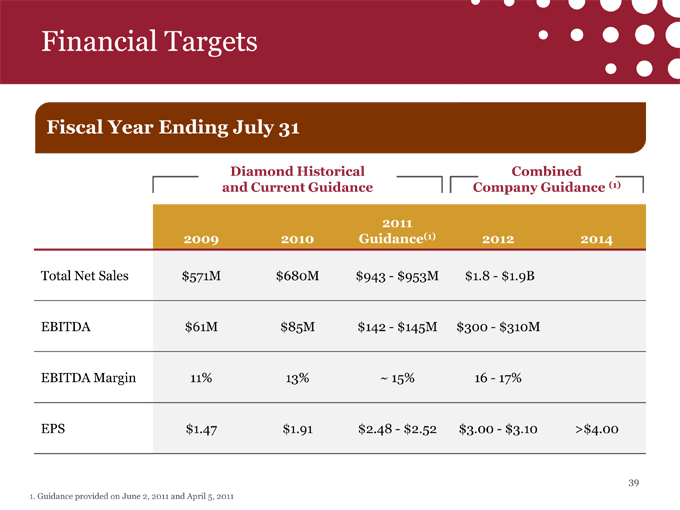
Financial Targets Fiscal Year Ending July 31 Diamond Historical Combined and Current Guidance Company Guidance (1) 2011 2009 2010 Guidance(1) 2012 2014 Total Net Sales $571M $680M $943—$953M $1.8—$1.9B EBITDA $61M $85M $142—$145M $300—$310M EBITDA Margin 11% 13% ~ 15% 16—17% EPS $1.47 $1.91 $2.48—$2.52 $3.00—$3.10 >$4.00 39 1. Guidance provided on June 2, 2011 and April 5, 2011
Platform for Future Growth Innovation Execution Integration Dynamic Strong Proven 40

Diamond Foods Platform for Future Growth Diamond