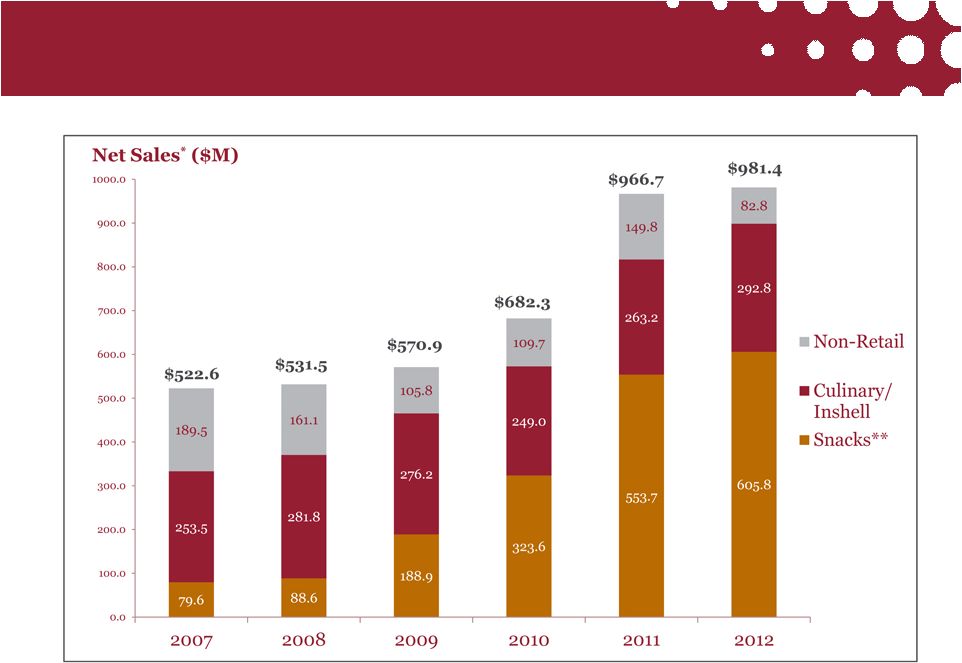
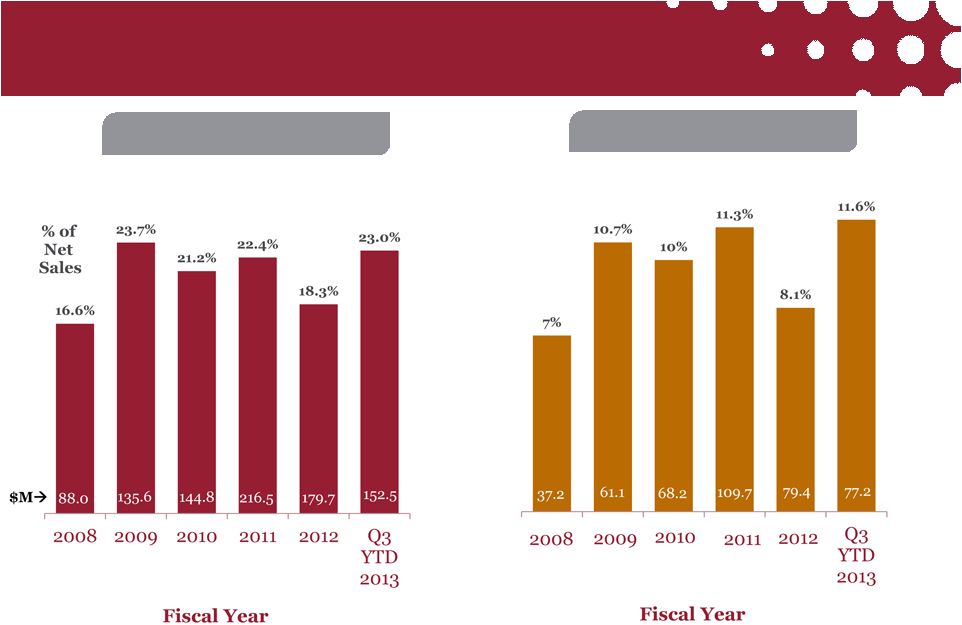
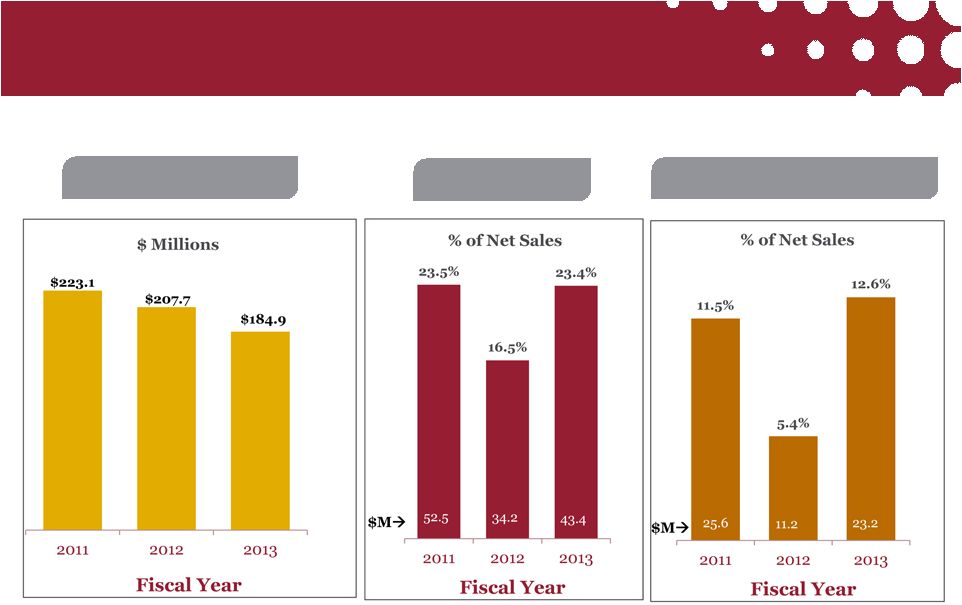
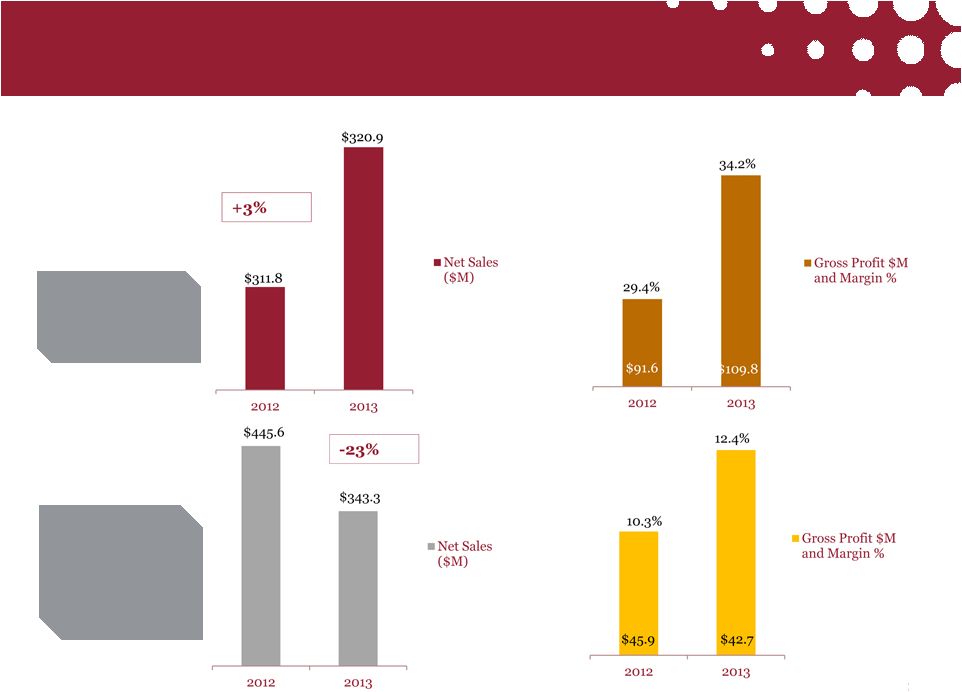
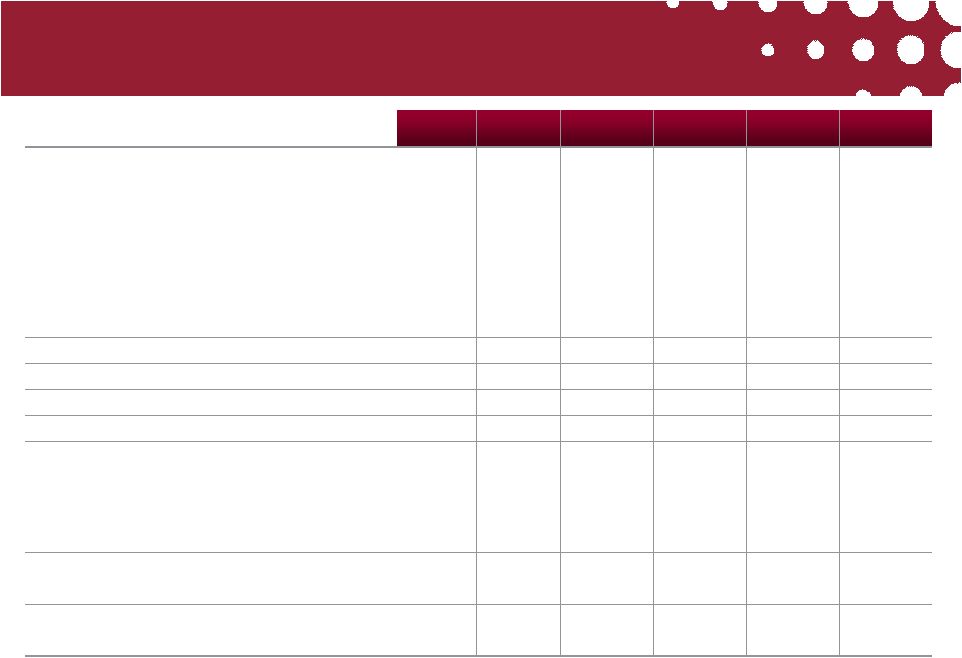
23 Non-GAAP Reconciliation ($Millions, except per share amounts) Q3’13 2012 2011 2010 2009 2008 GAAP Net Sales $184.9 $981.4 $966.7 $682.3 $570.9 $531.5 GAAP Cost of Sales $141.6 $801.7 $750.2 $537.5 $435.3 $443.5 GAAP Operating Expense $45.2 $230.4 $162.9 $109.6 $89.8 $64.1 Adjustment for acquisition and integration related expenses; (gain)/loss on warrant liability; stock based compensation; asset impairment; forbearance fees; fees for tax projects; certain SG&A costs 1 ($14.7) ($92.5) ($20.4) ($12.1) -- -- Non-GAAP Operating Expense $30.5 $137.9 $142.5 $97.5 $89.8 $64.1 Non-GAAP Income from Operations $12.8 $41.9 $74.0 $47.3 $45.8 $23.9 Stock-based compensation expense $1.4 $9.2 $7.7 $3.7 $3.9 $6.9 Depreciation and Amortization $9.1 $28.3 $28.1 $17.2 $11.4 $6.4 Adjusted EBITDA $23.2 $79.4 $109.8 $68.2 $61.1 $37.2 GAAP Interest $14.5 $34.0 $23.9 $10.2 $6.3 $1.0 GAAP Income Tax Expense (Benefit) ($0.8) $1.7 $3.1 $7.5 $14.9 $8.1 Tax effect of Non-GAAP adjustments ($2.0) ($4.1) $7.0 $4.8 $0.4 -- Non-GAAP Income Tax Expense (Benefit) ($2.8) ($2.4) $10.1 $12.4 $15.3 $8.1 GAAP Net Income ($15.6) ($86.3) $26.6 $15.7 $23.7 $14.8 Non-GAAP Net Income $1.1 $12.7 $39.9 $24.8 $24.3 $14.8 GAAP EPS Diluted ($0.71) ($3.98) $1.17 $0.82 $1.44 $0.91 Non-GAAP EPS Diluted $0.05 $0.58 $1.76 $1.29 $1.47 $0.91 1 Related primarily to audit committee investigation, restatement related expenses, Fishers plant closure, impairment of intangible asset, consulting fees, retention and severance | 