
KRATON PERFORMANCE POLYMERS, INC. FOURTH QUARTER 2012 EARNINGS CONFERENCE CALL February 28, 2013
KRATON Fourth Quarter and Full Year 2012 Earnings Call This presentation includes forward - looking statements that reflect our plans, beliefs, expectations and current views with respe ct to, among other things, future events and financial performance. Forward - looking statements are often characterized by the use of words such as “outlook,” “bel ieves,” “estimates,” “expects,” “projects,” “may,” “intends,” “plans” or “anticipates,” or by discussions of strategy, plans or intentions, including stateme nts regarding the anticipated costs, capital structure of, and prospects for our joint venture with FPCC, projected gross profit impact and FIFO to ECRC spreads and expec tat ions regarding monomer pricing. All forward - looking statements in this presentation are made based on management's current expectations and estimates, which inv olve known and unknown risks, uncertainties and other important factors that could cause actual results to differ materially from those expressed in forwar d - l ooking statements. These risks and uncertainties are more fully described in in our latest Annual Report on Form 10 - K, as subsequently amended on March 8, 2012, in cluding but not limited to “Part I, Item 1A. Risk Factors” and “Part I, Item 7. Management’s Discussion and Analysis of Financial Condition and Results of Operat ion s” therein, and in our other filings with the Securities and Exchange Commission, and include, but are not limited to, risks related to: conditions in the global eco nomy and capital markets; declines in raw material costs; our reliance on LyondellBasell Industries for the provision of significant operating and other services; the failure of our raw materials suppliers to perform their obligations under long - term supply agreements, or our inability to replace or renew these agreements when they exp ire; limitations in the availability of raw materials we need to produce our products in the amounts or at the prices necessary for us to effectively and profitably ope rate our business; competition in our end - use markets, from other producers of SBCs and from producers of products that can be substituted for our products; our abili ty to produce and commercialize technological innovations; our ability to protect our intellectual property, on which our business is substantially dependent ; t he possibility that our products infringe on the intellectual property rights of others; significant fluctuation in raw material costs may result in volatility in our qu art erly results; seasonality in our business, particularly for Paving and Roofing end uses; our substantial indebtedness, which could adversely affect our financial condit ion and prevent us from fulfilling our obligations under the senior secured credit agreement and the senior notes; financial and operating constraints related to o ur indebtedness; the inherently hazardous nature of chemical manufacturing; product liability claims and other lawsuits arising from environmental damage, personal inj uri es or other damage associated with chemical manufacturing; political, economic and local business risks in the various countries in which we operate; health, sa fet y and environmental laws, including laws that govern our employees’ exposure to chemicals deemed harmful to humans; regulation of our company or our customers, w hic h could affect the demand for our products or result in increased compliance costs; customs, international trade, export control, antitrust, zoning and occ upa ncy and labor and employment laws that could require us to modify our current business practices and incur increased costs; fluctuations in currency exchange r ate s; our relationship with our employees; loss of key personnel or our inability to attract and retain new qualified personnel; the fact that we typically do not enter in to long - term contracts with our customers; a decrease in the fair value of our pension assets, which could require us to materially increase future funding of the pensi on plan; anticipated benefits of or performance of our products; beliefs regarding opportunities for new, high - margin applications and other innovations; adequacy o f cash flows to fund our working capital requirements; our investment in the joint venture with FPCC; scheduled debt payments, interest payments, capital expe ndi tures, benefit plan contributions, and income tax obligations; our anticipated 2013 capital expenditures, including the amount of expenditures related to the se mi - works facility, compliance with the MACT rule, health, safety and environmental and infrastructure and maintenance projects, projects to optimize the production ca pabilities of our manufacturing assets and to support our innovation platform; our ability to meet conditions required to ensure full access to our senior se cur ed credit facility; expectations regarding availability under our credit facility; our plan to prepay certain outstanding indebtedness under our term loans in 2013; exp ect ations regarding our counterparties’ ability to perform, including with respect to trade receivables; anticipated aggregate and fiscal year 2013 cost estimates fo r t he planned Taiwan manufacturing facility, the portion of such costs we expect to pay, the manner in which we expect to fund such costs, and when we currently ex pect the facility to become operational; estimates regarding the tax expense of repatriating certain cash and short - term investments related to foreign oper ations; expectations regarding Nexar ™; our ability to realize certain deferred tax assets and our beliefs with respect to tax positions; our plans and expectations reg arding our planned Asia expansion project; estimates related to the useful lives of certain assets for tax purposes; our anticipated dividend policy; expectations regar din g our pension contributions for fiscal year 2013; estimates or expectations related to monomer costs, ending inventory levels and related estimated charges; the outcome and financial impact of legal proceedings; expectations regarding the spread between FIFO and ECRC in future periods; and projections regarding environment al costs and capital expenditures and related operational savings. Delaware law and some provisions of our organizational documents make a takeover of our company mor e difficult; our expectation that we will not pay dividends for the foreseeable future; our status as a holding company dependent on dividends from our subsidi ari es; other risks, factors and uncertainties described in this press release and our other reports and documents; and other factors of which we are currentl y u naware or deem immaterial. Readers are cautioned not to place undue reliance on forward - looking statements. Forward - looking statements speak only as of the date th ey are made, and we assume no obligation to update such information in light of new information or future events. Further information concerning issues th at could materially affect financial performance related to forward - looking statements can be found in Kraton’s periodic filings with the Securities and Exchange Com mission. Forward - Looking Statement Disclaimer 2
KRATON Fourth Quarter and Full Year 2012 Earnings Call GAAP Disclaimer This presentation includes the use of both GAAP and non - GAAP financial measures. The non - GAAP financial measures are EBITDA, Adjusted EBITDA, Adjusted EBITDA at ECRC and Gross Profit at ECRC. A table included in this earnings release reconciles each of these non - GAAP financial measures with the most directly comparable GAAP financial measure . We consider these non - GAAP financial measures important supplemental measures of our performance and believe they are frequently used by investors, securities analysts and other interested parties in the evaluation of our performance and/or th at of other companies in our industry, including period - to - period comparisons. Further, management uses these measures to evaluate operating performance, and; our executive compensation plan bases incentive compensation payments on our Adjusted EBITDA and Adjusted EBITDA at ECRC performance, along with other factors. These non - GAAP financial measures have limitations as analytical tools and in some cases can vary substantially from other measures of our performance. You should not consider them in isolation, or as a substitute for analysis of our results under GAAP in the United States. For EBIDTA, these limitations include: EBITDA does not reflect our cash expenditures, or future requirements for capital expenditures or contractual commitments; EBITDA does not reflect changes in, or cash requirements for, our working capital needs; EBITDA does not reflect the significant interest expense, or the cash requirements necessary to service interest or principal payments, on our debt; although depreciation and amortization are non - cash charges, the assets being depreciated and amortized will often have to be replaced in the future, and EBITDA does not reflect any cash requirements for such replacements; EBITDA calculations under the terms of our debt agreements may vary from EBITDA presented herein, and our presentation of EBITDA herein is not for purposes of assessing compliance or non - compliance with financial covenants under our debt agreements; and other companies in our industry may calculate EBITDA differently from how we do, limiting its usefulness as a comparative measure. As an analytical tool, Adjusted EBITDA is subject to all the limitations applicable to EBITDA. In addition, we prepare Adjusted EBITDA by adjusting EBITDA to eliminate the impact of a number of items we do not consider indicative of our on - going performance, but you should be aware that in the future we may incur expenses similar to the adjustments in this presentation. Our presentation of Adjusted EBITDA should not be construed as an inference that our future results will be unaffected by unusual or non - recurring items. As an analytical tool, Adjusted EBITDA at ECRC is subject to all the limitations applicable to EBITDA, as well as the following limitations: due to volatility in raw material prices, Adjusted EBITDA at ECRC may, and often does, vary substantially from EBITDA and other performance measures, including net income calculated in accordance with GAAP; and Adjusted EBITDA at ECRC may, and often will, vary significantly from EBITDA calculations under the terms of our debt agreements and should not be used for assessing compliance or non - compliance with financial covenants under our credit agreement. Because of these and other limitations, EBITDA, Adjusted EBITDA and ECRC Adjusted EBITDA should not be considered as a measure of discretionary cash available to us to invest in the growth of our business. Finally, as a measure of our performance, Gross Profit at ECRC is limited because it often varies substantially fr om gross profit calculated in accordance with GAAP due to volatility in raw material prices. 3
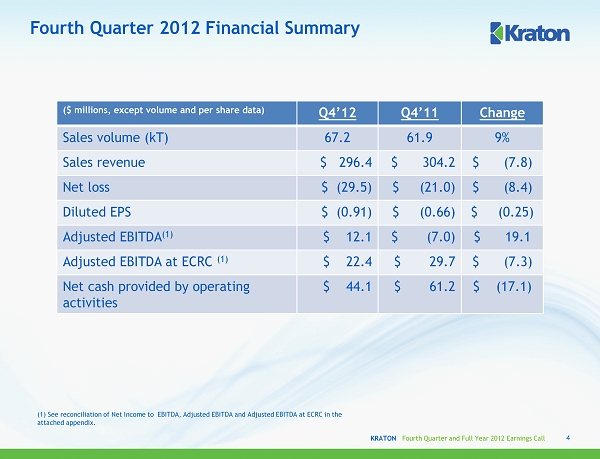
KRATON Fourth Quarter and Full Year 2012 Earnings Call Fourth Quarter 2012 Financial Summary ( $ millions, except volume and per share data) Q4’12 Q4’11 Change Sales volume (kT) 67.2 61.9 9% Sales revenue $ 296.4 $ 304.2 $ (7.8) Net loss $ (29.5) $ (21.0) $ (8.4) Diluted EPS $ (0.91) $ (0.66) $ (0.25) Adjusted EBITDA (1) $ 12.1 $ (7.0) $ 19.1 Adjusted EBITDA at ECRC (1) $ 22.4 $ 29.7 $ (7.3) Net cash provided by operating activities $ 44.1 $ 61.2 $ (17.1) 4 (1) See reconciliation of Net I ncome to EBITDA, Adjusted EBITDA and Adjusted EBITDA at ECRC in the attached appendix.
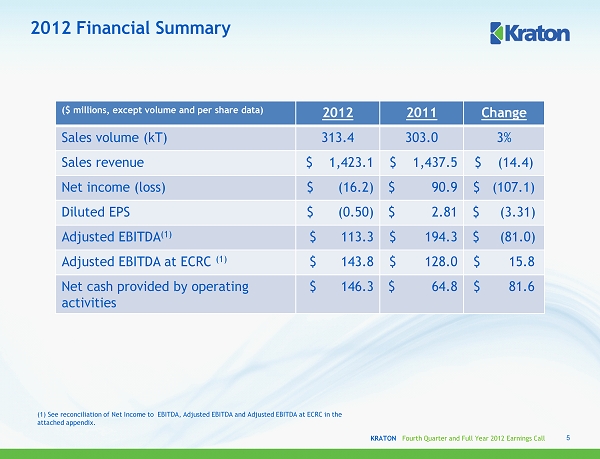
KRATON Fourth Quarter and Full Year 2012 Earnings Call 2012 Financial Summary ( $ millions, except volume and per share data) 2012 2011 Change Sales volume (kT) 313.4 303.0 3% Sales revenue $ 1,423.1 $ 1,437.5 $ (14.4) Net income (loss) $ (16.2) $ 90.9 $ (107.1) Diluted EPS $ (0.50) $ 2.81 $ (3.31) Adjusted EBITDA (1) $ 113.3 $ 194.3 $ (81.0) Adjusted EBITDA at ECRC (1) $ 143.8 $ 128.0 $ 15.8 Net cash provided by operating activities $ 146.3 $ 64.8 $ 81.6 5 (1) See reconciliation of Net I ncome to EBITDA, Adjusted EBITDA and Adjusted EBITDA at ECRC in the attached appendix.

KRATON Fourth Quarter and Full Year 2012 Earnings Call $26 $24 $29 Q4'11 Q3'12 Q4'12 End Use Review 6 Cariflex TM Q4’12 vs. Q3’12 Q4’12 vs. Q4’11 Q4’12 vs. Q4’11 2012 vs. 2011 ▪ Negative impact of currency movements reduced revenue by $1.3 million ▪ Sales volume increased 13.3% ▪ Average selling price increased ▪ Revenue up 6.7% or 13.1% on a currency - adjusted basis ▪ Sales volume increased 7.6%, mainly in surgical glove applications ▪ Average selling prices increased Quarterly Sales Revenue ($ Millions) Annual Sales Revenue ($ Millions) Change in Quarterly Sales Revenue $99 $106 2011 2012 14% 21%

KRATON Fourth Quarter and Full Year 2012 Earnings Call $83 $94 $81 Q4'11 Q3'12 Q4'12 End Use Review 7 Advanced Materials Q4’12 vs. Q3’12 Q4’12 vs. Q4’11 Q4’12 vs. Q4’11 2012 vs. 2011 ▪ $1.5 million of the $ 2.1 million revenue decline due to currency ▪ Sales volume increased 10.3% ▪ Average selling price declined ▪ $10.3 million (~50%) of the revenue decline due to currency ▪ 4.6% volume growth in Asia Pacific ▪ Overall volume decline of 2.8% driven by lower sales of less differentiated products Quarterly Sales Revenue ($ Millions) Annual Sales Revenue ($ Millions) Change in Quarterly Sales Revenue - 2% - 13% $403 $383 2011 2012

KRATON Fourth Quarter and Full Year 2012 Earnings Call End Use Review 8 Adhesives, Sealants & Coatings Q4’12 vs. Q3’12 Q4’12 vs. Q4’11 Q4’12 vs. Q4’11 2012 vs. 2011 ▪ Negative impact of currency movements reduced revenue by $3.5 million ▪ Sales volume increased 1.9% ▪ Average selling price declined ▪ Revenue up 2.2% or 6.9% on a currency - adjusted basis ▪ Volume growth in all regions except North America ▪ Overall volume up 3.7% ▪ Average selling price increased Quarterly Sales Revenue ($ Millions) Annual Sales Revenue ($ Millions) Change in Quarterly Sales Revenue - 3% - 6% $500 $511 2011 2012 $113 $117 $110 Q4'11 Q3'12 Q4'12
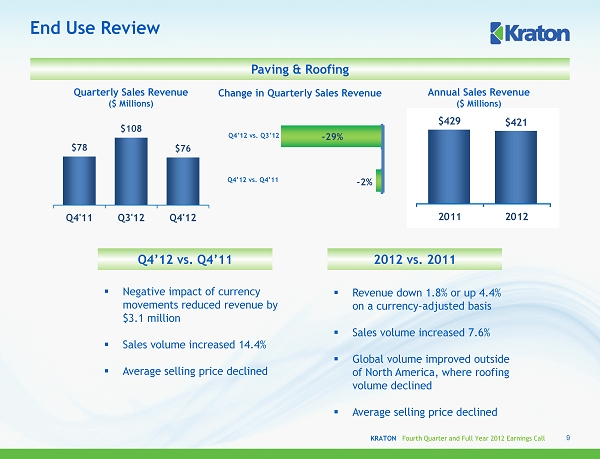
KRATON Fourth Quarter and Full Year 2012 Earnings Call $429 $421 2011 2012 -2% -29% End Use Review 9 Paving & Roofing Q4’12 vs. Q3’12 Q4’12 vs. Q4’11 Q4’12 vs. Q4’11 2012 vs. 2011 ▪ Negative impact of currency movements reduced revenue by $ 3.1 million ▪ Sales volume increased 14.4% ▪ Average selling price declined ▪ Revenue down 1.8% or up 4.4% on a currency - adjusted basis ▪ Sales volume increased 7.6% ▪ Global volume improved outside of North America, where roofing volume declined ▪ Average selling price declined Quarterly Sales Revenue ($ Millions) Annual Sales Revenue ($ Millions) Change in Quarterly Sales Revenue $78 $108 $76 Q4'11 Q3'12 Q4'12

KRATON Fourth Quarter and Full Year 2012 Earnings Call Vitality Index ▪ Select key innovations showing strong y/y revenue growth: ▪ Oilfield innovations up 176% ▪ Adhesive innovations up 90% ▪ PVC alternatives up 48% ▪ Reactive SBS for printing plates up 40% ▪ Paving applications up 21% ▪ Comfort bedding up 14% 10 $ in millions $114 $141 $158 $114 $159 $205 $195 11% 13% 14% 12% 13% 14% 14% 18% 0% 2% 4% 6% 8% 10% 12% 14% 16% 18% -25 25 75 125 175 225 275 2006 2007 2008 2009 2010 2011 2012 Revenue Vitality Index Includes innovation r evenue that rolled out of index in 2012
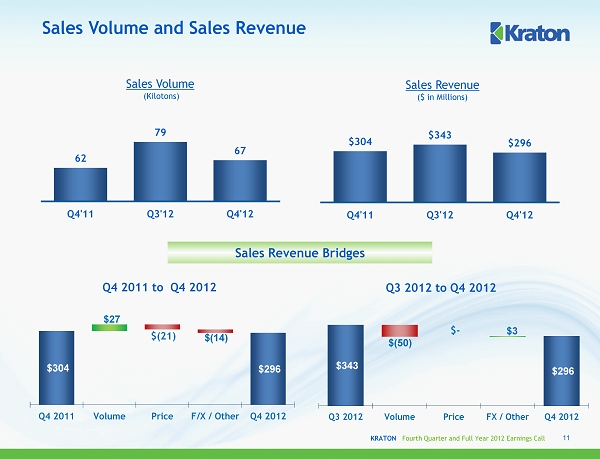
KRATON Fourth Quarter and Full Year 2012 Earnings Call 62 79 67 40 60 80 100 120 140 Q4'11 Q3'12 Q4'12 $304 $343 $296 0 100 200 300 400 500 600 700 800 900 1000 Q4'11 Q3'12 Q4'12 Sales Volume (Kilotons) Sales Volume and Sales Revenue Sales Revenue ($ in Millions) 11 Q4 2011 to Q4 2012 Q3 2012 to Q4 2012 Sales Revenue Bridges $304 $296 $27 $(21) $(14) Q4 2011 Volume Price F/X / Other Q4 2012 $343 $296 $(50) $ - $3 Q3 2012 Volume Price FX / Other Q4 2012
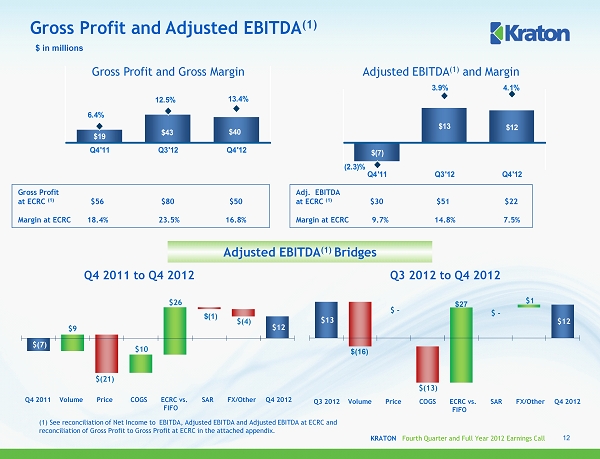
KRATON Fourth Quarter and Full Year 2012 Earnings Call $13 $12 $ - $(16) $ - $(13) $27 $1 $(7) $13 $12 (2.3)% 3.9% 4.1% -10 0 10 20 Q4'11 Q3'12 Q4'12 $19 $43 $40 6.4% 12.5% 13.4% 0 20 40 60 80 100 120 Q4'11 Q3'12 Q4'12 Gross P rofit and Adjusted EBITDA (1) Q3 2012 to Q4 2012 $ in millions Q4 2011 to Q4 2012 12 Gross Profit and Gross Margin Adjusted EBITDA (1 ) and Margin Adjusted EBITDA (1) Bridges Gross Profit at ECRC (1) $56 $80 $50 Margin at ECRC 18.4% 23.5% 16.8% Adj. EBITDA at ECRC (1) $30 $51 $22 Margin at ECRC 9.7% 14.8% 7.5% Q4 2011 Volume Price COGS ECRC vs. SAR FX/Other Q4 2012 FIFO $(7) $12 $9 $(21) $10 $26 $(1) $(4) Q3 2012 Volume Price COGS ECRC vs. SAR FX/Other Q4 2012 FIFO (1) See reconciliation of Net I ncome to EBITDA, Adjusted EBITDA and Adjusted EBITDA at ECRC and reconciliation of Gross Profit to Gross Profit at ECRC in the attached appendix.

KRATON Fourth Quarter and Full Year 2012 Earnings Call 303 313 100 150 200 250 300 350 400 450 500 550 600 2011 2012 $1,437 $1,423 1100 1200 1300 1400 1500 1600 1700 1800 2011 2012 Sales Volume (Kilotons) Sales Volume and Sales Revenue Sales Revenue ($ in Millions) 13 2011 to 2012 Sales Revenue Bridge $1,437 $1,423 $42 $13 $(69) 2011 Volume Price FX/Other 2012
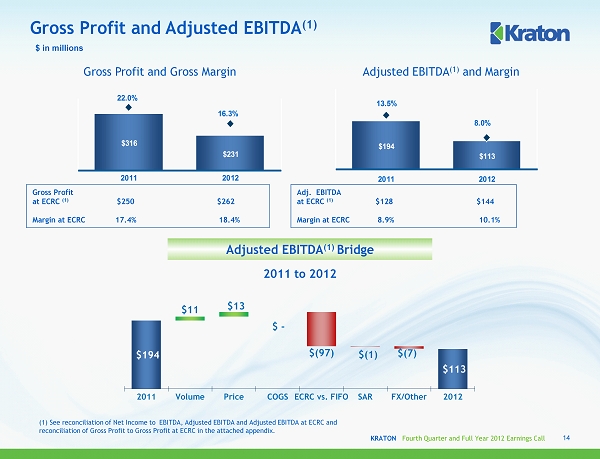
KRATON Fourth Quarter and Full Year 2012 Earnings Call $194 $113 13.5% 8.0% 0 10 20 30 40 50 60 70 80 90 100 110 120 130 140 150 160 170 180 190 200 210 220 230 240 250 260 270 280 290 300 310 320 2011 2012 $316 $231 22.0% 16.3% 100 150 200 250 300 350 2011 2012 Gross P rofit and Adjusted EBITDA (1) $ in millions 2011 to 2012 14 Gross Profit and Gross Margin Adjusted EBITDA (1 ) and Margin Adjusted EBITDA (1) Bridge Gross Profit at ECRC (1) $250 $262 Margin at ECRC 17.4% 18.4% Adj. EBITDA at ECRC (1) $128 $144 Margin at ECRC 8.9% 10.1% $194 $113 $11 $13 $ - $(97) $(1) $(7) 2011 Volume Price COGS ECRC vs. FIFO SAR FX/Other 2012 (1) See reconciliation of Net I ncome to EBITDA, Adjusted EBITDA and Adjusted EBITDA at ECRC and reconciliation of Gross Profit to Gross Profit at ECRC in the attached appendix.
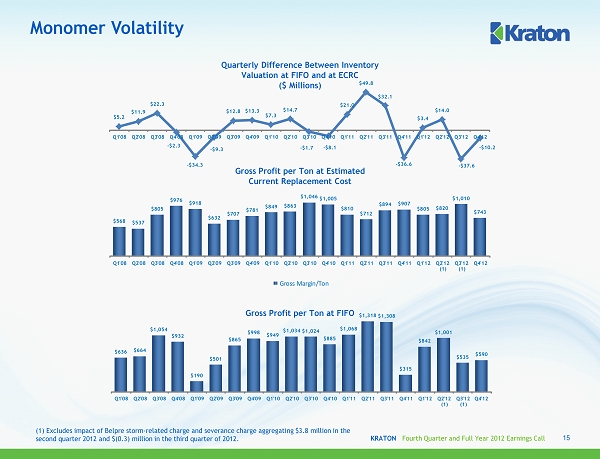
KRATON Fourth Quarter and Full Year 2012 Earnings Call $5.2 $11.9 $22.3 - $2.3 - $34.3 - $9.3 $12.8 $13.3 $7.3 $14.7 - $1.7 - $8.1 $21.0 $49.8 $32.1 - $36.6 $3.4 $14.0 - $37.6 - $10.2 Q1'08 Q2'08 Q3'08 Q4'08 Q1'09 Q2'09 Q3'09 Q4'09 Q1'10 Q2'10 Q3'10 Q4'10 Q1'11 Q2'11 Q3'11 Q4'11 Q1'12 Q2'12 Q3'12 Q4'12 $568 $537 $805 $976 $918 $632 $707 $781 $849 $863 $1,046 $1,005 $810 $712 $894 $907 $805 $820 $1,010 $743 Q1'08 Q2'08 Q3'08 Q4'08 Q1'09 Q2'09 Q3'09 Q4'09 Q1'10 Q2'10 Q3'10 Q4'10 Q1'11 Q2'11 Q3'11 Q4'11 Q1'12 Q2'12 (1) Q3'12 (1) Q4'12 Gross Margin/Ton $636 $664 $1,054 $932 $190 $501 $865 $998 $949 $1,034 $1,024 $885 $1,068 $1,318 $1,308 $315 $842 $1,001 $535 $590 Q1'08 Q2'08 Q3'08 Q4'08 Q1'09 Q2'09 Q3'09 Q4'09 Q1'10 Q2'10 Q3'10 Q4'10 Q1'11 Q2'11 Q3'11 Q4'11 Q1'12 Q2'12 (1) Q3'12 (1) Q4'12 Monomer Volatility Quarterly Difference Between Inventory Valuation at FIFO and at ECRC ($ Millions) Gross Profit per Ton at Estimated Current Replacement Cost Gross Profit per Ton at FIFO 15 (1) Excludes impact of Belpre storm - related charge and severance charge aggregating $3.8 million in the second quarter 2012 and $(0.3) million in the third quarter of 2012.
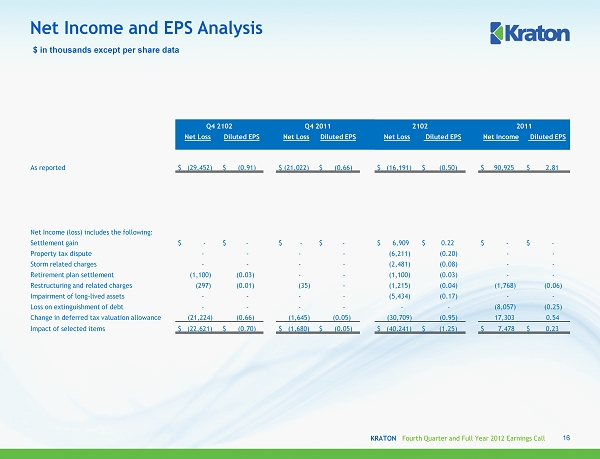
KRATON Fourth Quarter and Full Year 2012 Earnings Call Net Income and EPS Analysis 16 $ in thousands except per share data Q4 2102 Q4 2011 2102 2011 Net Loss Diluted EPS Net Loss Diluted EPS Net Loss Diluted EPS Net Income Diluted EPS As reported $ (29,452) $ (0.91) $ (21,022) $ (0.66) $ (16,191) $ (0.50) $ 90,925 $ 2.81 Net Income (loss) includes the following: Settlement gain $ - $ - $ - $ - $ 6,909 $ 0.22 $ - $ - Property tax dispute - - - - (6,211) (0.20) - - Storm related charges - - - - (2,481) (0.08) - - Retirement plan settlement (1,100) (0.03) - - (1,100) (0.03) - - Restructuring and related charges (297) (0.01) (35) - (1,215) (0.04) (1,768) (0.06) Impairment of long - lived assets - - - - (5,434) (0.17) - - Loss on extinguishment of debt - - - - - - (8,057) (0.25) Change in deferred tax valuation allowance (21,224) (0.66) (1,645) (0.05) (30,709) (0.95) 17,303 0.54 Impact of selected items $ (22,621) $ (0.70) $ ( 1,680) $ (0.05) $ (40,241) $ (1.25) $ 7,478 $ 0.23

KRATON Fourth Quarter and Full Year 2012 Earnings Call $ in millions 49.7% 47.0% 40.7% 39.1% 42.2% 37.2% 37.9% 37.0% 32.1% 32.7% 31.6% 31.4% 0% 5% 10% 15% 20% 25% 30% 35% 40% 45% 50% $100 $150 $200 $250 $300 $350 $400 Net Debt to Cap Net Debt Net Debt and Net Debt to Net Capitalization (1) ▪ Cash at December 31, 2012 of $223 million ▪ Net Debt to Adjusted EBITDA was 2.0x at 12/31/12 (1) See reconciliation of Net D ebt and Net D ebt to Net C apitalization in the attached appendix. Balance Sheet 17 $ Millions 3 Months Ended 12 Months Ended 12/31/12 12/31/11 12/31/12 12/31/11 Net cash provided by operating activities $44.1 $61.2 $146.3 $64.8
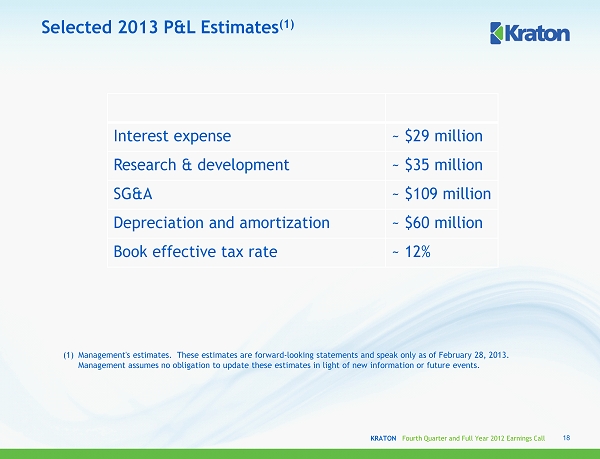
KRATON Fourth Quarter and Full Year 2012 Earnings Call Selected 2013 P&L Estimates (1) (1) Management's estimates. These estimates are forward - looking statements and speak only as of February 28, 2013. Management assumes no obligation to update these estimates in light of new information or future events. 18 Interest expense ~ $29 million Research & development ~ $35 million SG&A ~ $109 million Depreciation and amortization ~ $60 million Book effective tax rate ~ 12%
APPENDIX February 28, 2013
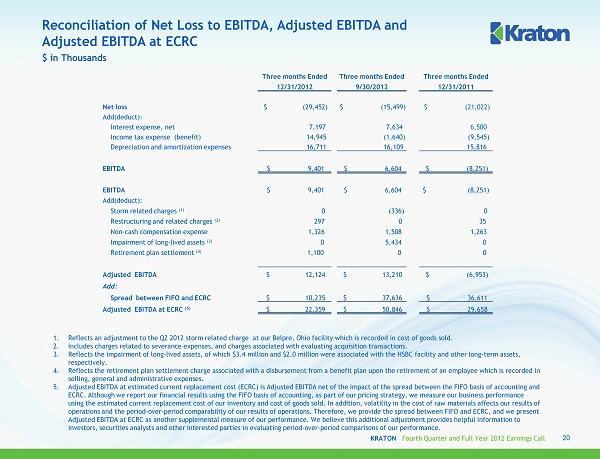
KRATON Fourth Quarter and Full Year 2012 Earnings Call Reconciliation of Net Loss to EBITDA, Adjusted EBITDA and Adjusted EBITDA at ECRC 1. Reflects an adjustment to the Q2 2012 storm related charge at our Belpre, Ohio facility which is recorded in cost of goods sold. 2. Includes charges related to severance expenses, and charges associated with evaluating acquisition transactions. 3. Reflects the impairment of long - lived assets, of which $3.4 million and $2.0 million were associated with the HSBC facility and other long - term assets, respectively. 4. Reflects the retirement plan settlement charge associated with a disbursement from a benefit plan upon the retirement of an employee which is recorded in selling, general and administrative expenses. 5. Adjusted EBITDA at estimated current replacement cost (ECRC) is Adjusted EBITDA net of the impact of the spread between the F IFO basis of accounting and ECRC. Although we report our financial results using the FIFO basis of accounting, as part of our pricing strategy, we measure our bus iness performance using the estimated current replacement cost of our inventory and cost of goods sold. In addition, volatility in the cost of raw materials affects our results of operations and the period - over - period comparability of our results of operations. Therefore, we provide the spread between FIFO and ECRC, and we present Adjusted EBITDA at ECRC as another supplemental measure of our performance. We believe this additional adjustment provides he lpf ul information to investors, securities analysts and other interested parties in evaluating period - over - period comparisons of our performance. $ in Thousands 20 Three months Ended Three months Ended Three months Ended 12/31/2012 9/30/2012 12/31/2011 Net loss $ (29,452) $ (15,499) $ (21,022) Add(deduct): Interest expense, net 7,197 7,634 6,500 Income tax expense (benefit) 14,945 (1,640) (9,545) Depreciation and amortization expenses 16,711 16,109 15,816 EBITDA $ 9,401 $ 6,604 $ (8,251) EBITDA $ 9,401 $ 6,604 $ (8,251) Add(deduct): Storm related charges (1) 0 (336) 0 Restructuring and related charges (2) 297 0 35 Non - cash compensation expense 1,326 1,508 1,263 Impairment of long - lived assets (3) 0 5,434 0 R etirement plan settlement (4) 1,100 0 0 Adjusted EBITDA $ 12,124 $ 13,210 $ (6,953) Add: Spread between FIFO and ECRC $ 10,235 $ 37,636 $ 36,611 Adjusted EBITDA at ECRC (5) $ 22,359 $ 50,846 $ 29,658
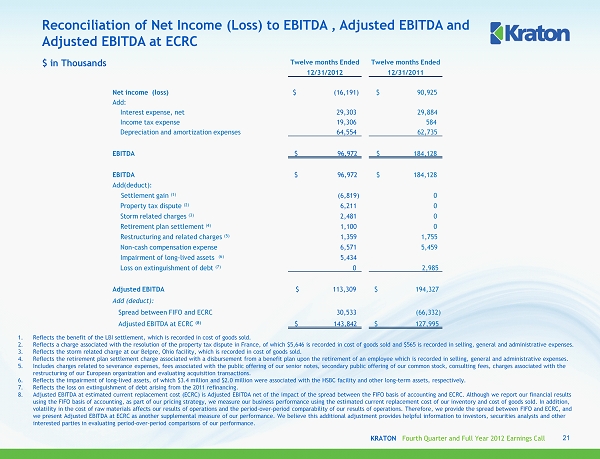
KRATON Fourth Quarter and Full Year 2012 Earnings Call Reconciliation of Net Income (Loss) to EBITDA , Adjusted EBITDA and Adjusted EBITDA at ECRC 1. Reflects the benefit of the LBI settlement, which is recorded in cost of goods sold. 2. Reflects a charge associated with the resolution of the property tax dispute in France, of which $5,646 is recorded in cost o f g oods sold and $565 is recorded in selling, general and administrative expenses. 3. Reflects the storm related charge at our Belpre, Ohio facility, which is recorded in cost of goods sold. 4. Reflects the retirement plan settlement charge associated with a disbursement from a benefit plan upon the retirement of an employee which is recorded in selling, general and administrative expenses. 5. Includes charges related to severance expenses, fees associated with the public offering of our senior notes, secondary publi c o ffering of our common stock, consulting fees, charges associated with the restructuring of our European organization and evaluating acquisition transactions. 6. Reflects the impairment of long - lived assets, of which $3.4 million and $2.0 million were associated with the HSBC facility and other long - term assets, respectively. 7. Reflects the loss on extinguishment of debt arising from the 2011 refinancing. 8. Adjusted EBITDA at estimated current replacement cost (ECRC) is Adjusted EBITDA net of the impact of the spread between the F IFO basis of accounting and ECRC. Although we report our financial results using the FIFO basis of accounting, as part of our pricing strategy, we measure our business performance using the estimated cur rent replacement cost of our inventory and cost of goods sold. In addition, volatility in the cost of raw materials affects our results of operations and the period - over - period comparability of our result s of operations. Therefore, we provide the spread between FIFO and ECRC, and we present Adjusted EBITDA at ECRC as another supplemental measure of our performance. We believe this additional adjustment pro vides helpful information to investors, securities analysts and other interested parties in evaluating period - over - period comparisons of our performance. $ in Thousands 21 Twelve months Ended Twelve months Ended 12/31/2012 12/31/2011 Net income (loss) $ (16,191) $ 90,925 Add: Interest expense, net 29,303 29,884 Income tax expense 19,306 584 Depreciation and amortization expenses 64,554 62,735 EBITDA $ 96,972 $ 184,128 EBITDA $ 96,972 $ 184,128 Add(deduct): Settlement gain (1) (6,819) 0 Property tax dispute (2) 6,211 0 Storm related charges (3) 2,481 0 Retirement plan settlement (4) 1,100 0 Restructuring and related charges (5) 1,359 1,755 Non - cash compensation expense 6,571 5,459 Impairment of long - lived assets (6) 5,434 Loss on extinguishment of debt (7) 0 2,985 Adjusted EBITDA $ 113,309 $ 194,327 Add (deduct): Spread between FIFO and ECRC 30,533 (66,332) Adjusted EBITDA at ECRC (8) $ 143,842 $ 127,995
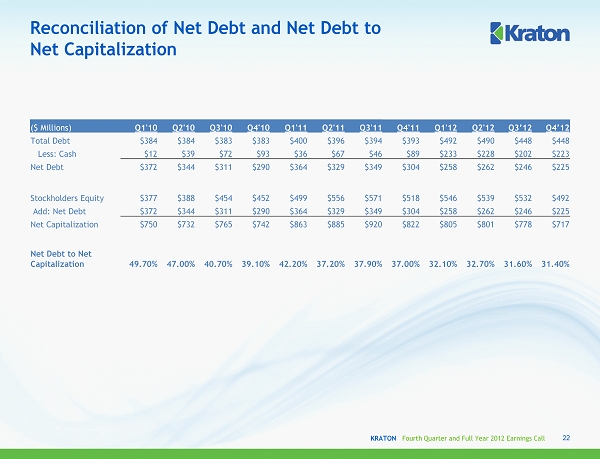
KRATON Fourth Quarter and Full Year 2012 Earnings Call Reconciliation of Net Debt and Net Debt to Net Capitalization 22 ($ Millions) Q1'10 Q2'10 Q3'10 Q4'10 Q1'11 Q2'11 Q3'11 Q4'11 Q1'12 Q2'12 Q3’12 Q4’12 Total Debt $384 $384 $383 $383 $400 $396 $394 $393 $492 $490 $448 $448 Less: Cash $12 $39 $72 $93 $36 $67 $46 $89 $233 $228 $202 $223 Net Debt $372 $344 $311 $290 $364 $329 $349 $304 $258 $262 $246 $225 Stockholders Equity $377 $388 $454 $452 $499 $556 $571 $518 $546 $539 $532 $492 Add: Net Debt $372 $344 $311 $290 $364 $329 $349 $304 $258 $262 $246 $225 Net Capitalization $750 $732 $765 $742 $863 $885 $920 $822 $805 $801 $778 $717 Net Debt to Net Capitalization 49.70% 47.00% 40.70% 39.10% 42.20% 37.20% 37.90% 37.00% 32.10% 32.70% 31.60% 31.40%
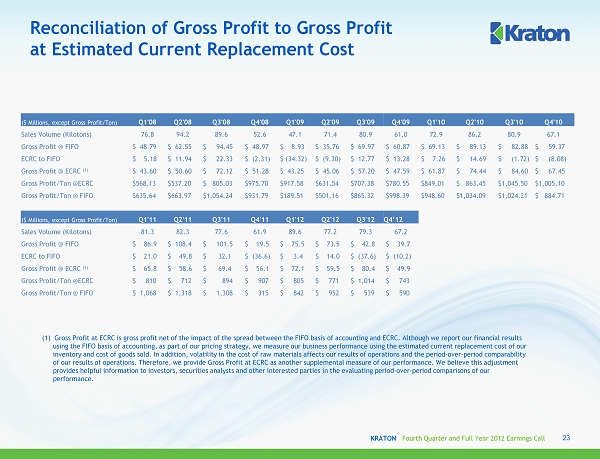
KRATON Fourth Quarter and Full Year 2012 Earnings Call Reconciliation of Gross Profit to Gross Profit at Estimated Current Replacement Cost 23 ($ Millions, except Gross Profit/Ton) Q1'08 Q2'08 Q3'08 Q4'08 Q1'09 Q2'09 Q3'09 Q4'09 Q1'10 Q2'10 Q3'10 Q4'10 Sales Volume (Kilotons) 76.8 94.2 89.6 52.6 47.1 71.4 80.9 61.0 72.9 86.2 80.9 67.1 Gross Profit @ FIFO $ 48.79 $ 62.55 $ 94.45 $ 48.97 $ 8.93 $ 35.76 $ 69.97 $ 60.87 $ 69.13 $ 89.13 $ 82.88 $ 59.37 ECRC to FIFO $ 5.18 $ 11.94 $ 22.33 $ (2.31) $ (34.32) $ (9.30) $ 12.77 $ 13.28 $ 7.26 $ 14.69 $ (1.72) $ (8.08) Gross Profit @ ECRC (1) $ 43.60 $ 50.60 $ 72.12 $ 51.28 $ 43.25 $ 45.06 $ 57.20 $ 47.59 $ 61.87 $ 74.44 $ 84.60 $ 67.45 Gross Profit/Ton @ECRC $568.13 $537.20 $ 805.03 $975.70 $917.58 $631.54 $707.38 $780.55 $849.01 $ 863.45 $1,045.50 $1,005.10 Gross Profit/Ton @ FIFO $635.64 $663.97 $1,054.24 $931.79 $189.51 $501.16 $865.32 $998.39 $948.60 $1,034.09 $1,024.21 $ 884.71 ($ Millions, except Gross Profit/Ton) Q1'11 Q2'11 Q3'11 Q4'11 Q1'12 Q2'12 Q3'12 Q4’12 Sales Volume (Kilotons) 81.3 82.3 77.6 61.9 89.6 77.2 79.3 67.2 Gross Profit @ FIFO $ 86.9 $ 108.4 $ 101.5 $ 19.5 $ 75.5 $ 73.5 $ 42.8 $ 39.7 ECRC to FIFO $ 21.0 $ 49.8 $ 32.1 $ (36.6) $ 3.4 $ 14.0 $ (37.6) $ (10.2) Gross Profit @ ECRC (1) $ 65.8 $ 58.6 $ 69.4 $ 56.1 $ 72.1 $ 59.5 $ 80.4 $ 49.9 Gross Profit/Ton @ECRC $ 810 $ 712 $ 894 $ 907 $ 805 $ 771 $ 1,014 $ 743 Gross Profit/Ton @ FIFO $ 1,068 $ 1,318 $ 1,308 $ 315 $ 842 $ 952 $ 539 $ 590 (1) Gross Profit at ECRC is gross profit net of the impact of the spread between the FIFO basis of accounting and ECRC. Although we report our financial results using the FIFO basis of accounting, as part of our pricing strategy, we measure our business performance using the estimated cur rent replacement cost of our inventory and cost of goods sold. In addition, volatility in the cost of raw materials affects our results of operations and the period - over - period comparability of our results of operations. Therefore, we provide Gross Profit at ECRC as another supplemental measure of our performance. We believe this adjustment provides helpful information to investors, securities analysts and other interested parties in the evaluating period - over - period comparisons of our performance.

KRATON PERFORMANCE POLYMERS, INC. FOURTH QUARTER 2012 EARNINGS CONFERENCE CALL February 28, 2013