KRATON PERFORMANCE POLYMERS, INC. SECOND QUARTER 2013 EARNINGS CONFERENCE CALL August 1, 2013
KRATON Second Quarter 2013 Earnings Call This presentation includes forward - looking statements that reflect our plans, beliefs, expectations and current views with respect to, among other things, future events and financial performance. Forward - looking statements are often characterized by the use of words such as “outlook,” “believes,” “estimates,” “expects,” “projects,” “may,” “intends,” “plans” or “anticipates,” or by discussions of strategy, plans or intentions, including statements regarding raw material price environment; butadiene prices; expectations regarding future spreads between FIFO and ECRC, and statements regarding selected 2013 P&L estimates. All forward - looking statements in this presentation are made based on management's current expectations and estimates, which involve known and unknown risks, uncertainties and other important factors that could cause actual results to differ materially from those expressed in forward - looking statements. These risks and uncertainties are more fully described in in our latest Annual Report on Form 10 - K, including but not limited to “Part I, Item 1A. Risk Factors” and “Part I, Item 7. Management’s Discussion and Analysis of Financial Condition and Results of Operations” therein, and in our other filings with the Securities and Exchange Commission, and include, but are not limited to, risks related to: conditions in the global economy and capital markets; declines in raw material costs; limitations in the availability of raw materials we need to produce our products in the amounts or at the prices necessary for us to effectively and profitably operate our business; competition in our end - use markets, from other producers of SBCs and from producers of products that can be substituted for our products; our investment in the joint venture with FPCC; and other risks, factors and uncertainties described in this press release and our other reports and documents; and other factors of which we are currently unaware or deem immaterial. Readers are cautioned not to place undue reliance on forward - looking statements. Forward - looking statements speak only as of the date they are made, and we assume no obligation to update such information in light of new information or future events. Forward - Looking Statement Disclaimer 2

KRATON Second Quarter 2013 Earnings Call GAAP Disclaimer This presentation includes the use of both GAAP and non - GAAP financial measures. The non - GAAP financial measures are EBITDA, Adjusted EBITDA, Adjusted EBITDA at ECRC, Gross Profit at ECRC and Adjusted Net Income (or earnings per share). A table included in t his presentation reconciles each of these non - GAAP financial measures with the most directly comparable GAAP financial measure . For additional information on the impact of the spread between the FIFO basis of accounting and ECRC, see Management’s Discussion an d Analysis of Financial Condition and Results of Operations in our Quarterly Report on Form 10 - Q for the quarter ended June 30, 20 13. We consider these non - GAAP financial measures important supplemental measures of our performance and believe they are frequently used by investors, securities analysts and other interested parties in the evaluation of our performance and/or that of other comp ani es in our industry, including period - to - period comparisons. Further, management uses these measures to evaluate operating performance, an d our executive compensation plan bases incentive compensation payments on our Adjusted EBITDA and Adjusted EBITDA at ECRC performanc e, along with other factors. These non - GAAP financial measures have limitations as analytical tools and in some cases can vary substantially from other measu res of our performance. You should not consider them in isolation, or as a substitute for analysis of our results under GAAP in the Un ite d States. For EBIDTA, these limitations include: EBITDA does not reflect our cash expenditures, or future requirements for capital expendi tur es or contractual commitments; EBITDA does not reflect changes in, or cash requirements for, our working capital needs; EBITDA does no t reflect the significant interest expense, or the cash requirements necessary to service interest or principal payments, on our debt; alt hough depreciation and amortization are non - cash charges, the assets being depreciated and amortized will often have to be replaced in the future, and EBITDA does not reflect any cash requirements for such replacements; EBITDA calculations under the terms of our d ebt agreements may vary from EBITDA presented herein, and our presentation of EBITDA herein is not for purposes of assessing comp lia nce or non - compliance with financial covenants under our debt agreements; and other companies in our industry may calculate EBITDA diff erently from how we do, limiting its usefulness as a comparative measure. As an analytical tool, Adjusted EBITDA is subject to all t he limitations applicable to EBITDA. In addition, we prepare Adjusted EBITDA by adjusting EBITDA to eliminate the impact of a number of item s w e do not consider indicative of our on - going performance, but you should be aware that in the future we may incur expenses similar to the adjustments in this presentation. Our presentation of Adjusted EBITDA should not be construed as an inference that our futur e r esults will be unaffected by unusual or non - recurring items. As an analytical tool, Adjusted EBITDA at ECRC is subject to all the limitatio ns applicable to EBITDA, as well as the following limitations: due to volatility in raw material prices, Adjusted EBITDA at ECRC may, and o fte n does, vary substantially from EBITDA and other performance measures, including net income calculated in accordance with GAAP; and Adjus ted EBITDA at ECRC may, and often will, vary significantly from EBITDA calculations under the terms of our debt agreements and sh oul d not be used for assessing compliance or non - compliance with financial covenants under our credit agreement. Because of these and other limitations, EBITDA, Adjusted EBITDA and ECRC Adjusted EBITDA should not be considered as a measure of discretionary cash ava ila ble to us to invest in the growth of our business. As a measure of our performance, Gross Profit at ECRC is limited because it often v ari es substantially from gross profit calculated in accordance with GAAP due to volatility in raw material prices. Finally, we pre par e Adjusted Net Income by adjusting net income to eliminate the impact of a number of items we do not consider indicative of our on - going performance, but you should be aware that in the future we may incur expenses similar to the adjustments in this presentation . Our presentation of Adjusted Net Income should not be construed as an inference that our future results will be unaffected by unu sua l or non - recurring items. 3
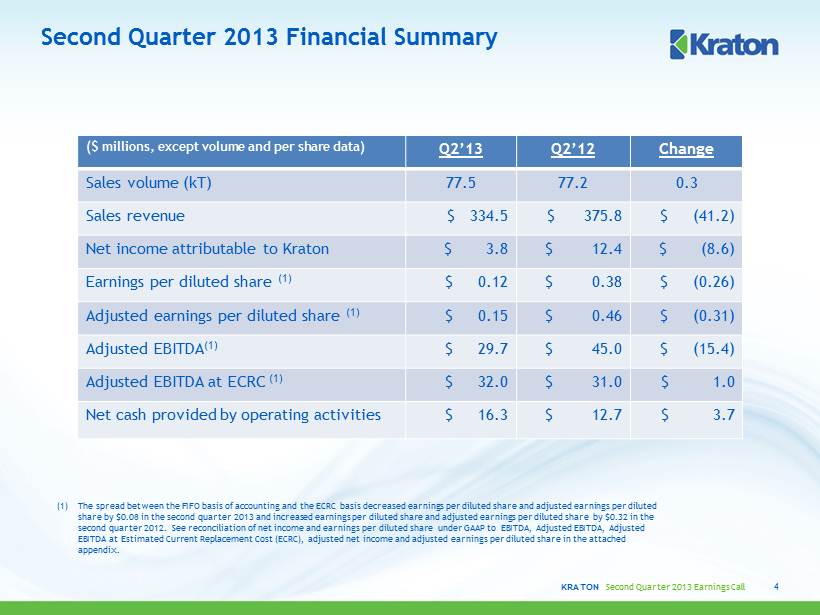
KRATON Second Quarter 2013 Earnings Call Second Quarter 2013 Financial Summary ( $ millions, except volume and per share data) Q2’13 Q2’12 Change Sales volume (kT) 77.5 77.2 0.3 Sales revenue $ 334.5 $ 375.8 $ (41.2) Net income attributable to Kraton $ 3.8 $ 12.4 $ (8.6) Earnings per diluted share (1) $ 0.12 $ 0.38 $ (0.26) Adjusted earnings per diluted share (1) $ 0.15 $ 0.46 $ (0.31) Adjusted EBITDA (1) $ 29.7 $ 45.0 $ (15.4) Adjusted EBITDA at ECRC (1) $ 32.0 $ 31.0 $ 1.0 Net cash provided by operating activities $ 16.3 $ 12.7 $ 3.7 4 (1) The spread between the FIFO basis of accounting and the ECRC basis decreased earnings per diluted share and adjusted earnings per diluted share by $0.08 in the second quarter 2013 and increased earnings per diluted share and adjusted earnings per diluted share by $0.32 in the second quarter 2012 . See reconciliation of net income and earnings per diluted share under GAAP to EBITDA, Adjusted EBITDA, Adjusted EBITDA at Estimated Current Replacement Cost (ECRC), adjusted net income and adjusted earnings per diluted share in the attac hed appendix.

KRATON Second Quarter 2013 Earnings Call $102 $97 $91 Q2'12 Q1'13 Q2'13 Sales Revenue ($ Millions) - 2% 8% Change in Sales Revenue $30 $27 $29 Q2'12 Q1'13 Q2'13 Sales Revenue ($ Millions) End Use Review 5 Advanced Materials Q2’13 vs. Q2’12 ▪ Sales volume increased 3% ▪ Average selling prices decreased, associated primarily with lower average butadiene costs ▪ Currency movements adversely impacted revenue by $1.0 million Q2’13 vs. Q2’12 Cariflex TM ▪ Sales volume decreased slightly, largely due to order timing ▪ Average sales price increased ▪ Currency movements adversely impacted revenue by $1.5 million Q2’13 vs. Q1’13 Q2’13 vs. Q2’12 - 11% - 6% Change in Sales Revenue Q2’13 vs. Q1’13 Q2’13 vs. Q2’12
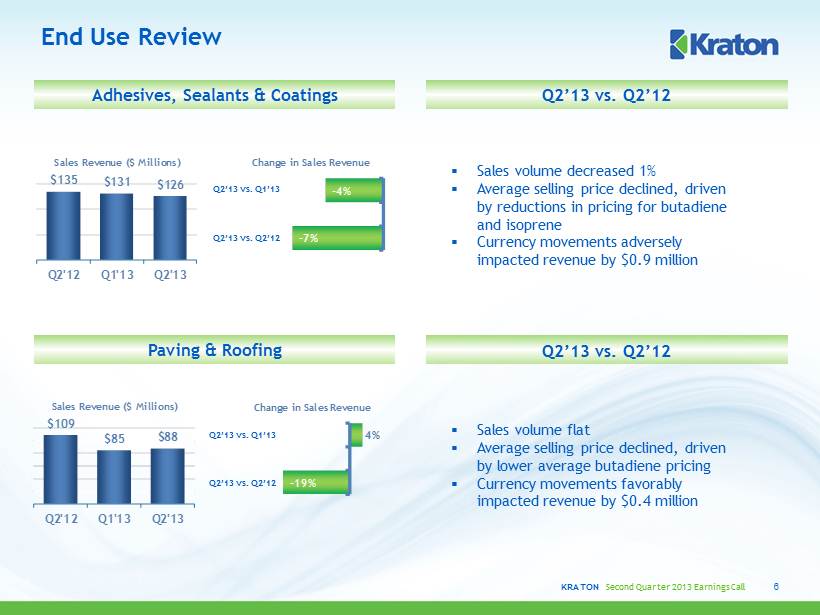
KRATON Second Quarter 2013 Earnings Call $109 $85 $88 Q2'12 Q1'13 Q2'13 Sales Revenue ($ Millions) $135 $131 $126 Q2'12 Q1'13 Q2'13 Sales Revenue ($ Millions) End Use Review 6 Q2’13 vs. Q2’12 Paving & Roofing ▪ Sales volume flat ▪ Average selling price declined, driven by lower average butadiene pricing ▪ Currency movements favorably impacted revenue by $0.4 million Q2’13 vs. Q2’12 Adhesives, Sealants & Coatings ▪ Sales volume decreased 1% ▪ Average selling price declined, driven by reductions in pricing for butadiene and isoprene ▪ Currency movements adversely impacted revenue by $0.9 million Q2’13 vs. Q1’13 Q2’13 vs. Q2’12 Q2’13 vs. Q1’13 Q2’13 vs. Q2’12 - 7% - 4% Change in Sales Revenue - 19% 4% Change in Sales Revenue

KRATON Second Quarter 2013 Earnings Call 77 77 40 60 80 100 120 140 Q2'12 Q2'13 Q2 Sales Volume (Kilotons) Sales Volume and Sales Revenue Year - to - Date Sales Volume (Kilotons) 7 Q2 2012 to Q2 2013 Sales Revenue Bridges $376 $335 $(1) $(37) $(3) Q2 2012 Mix Price F/X / Other Q2 2013 167 156 80 180 1H'12 1H'13 1H 2012 to 1H 2013 $784 $675 $(53) $(47) $(9) 1H 2012 Volume/Mix Price F/X / Other 1H 2013

KRATON Second Quarter 2013 Earnings Call $45 $29 $30 $31 $29 $32 0 20 40 60 80 100 120 Q2'12 Q1'13 Q2'13 As Reported ECRC $73 $60 $60 $60 $60 $62 0 20 40 60 80 100 120 Q2'12 Q1'13 Q2'13 As Reported ECRC Second Quarter Gross P rofit and Adjusted EBITDA (1) $ in millions 8 Gross Profit and Gross Profit at ECRC (1) Adjusted EBITDA and Adjusted EBITDA at ECRC (1) Adjusted EBITDA (1) Bridge Margin 19.6% 17.6% 17.9% Margin at ECRC 15.8% 17.8% 18.6% (1) See reconciliation of Net I ncome (Loss) to EBITDA, Adjusted EBITDA and Adjusted EBITDA at Estimated Current Replacement Cost (ECRC) and reconciliation of Gross Profit to Gross Profit at ECRC in the attached appendix. Margin 12.0% 8.4% 8.9% Margin at ECRC 8.3% 8.6% 9.6% Q2 2012 to Q2 2013 $45 $30 $(1) $(37) $39 $(16) $2 $(2) Q2 2012 Mix Price COGS ECRC vs. FIFO SAR FX/Other Q2 2013

KRATON Second Quarter 2013 Earnings Call $88 $58 $71 $61 $- $10 $20 $30 $40 $50 $60 $70 $80 $90 $100 1H'12 1H'13 As Reported ECRC YTD Gross P rofit and Adjusted EBITDA (1) $ in millions 9 Adjusted EBITDA (1) Bridge Margin 19.0% 17.8% Margin at ECRC 16.8% 18.2% (1) See reconciliation of Net I ncome (Loss) to EBITDA, Adjusted EBITDA and Adjusted EBITDA at Estimated Current Replacement Cost (ECRC) and reconciliation of Gross Profit to Gross Profit at ECRC in the attached appendix. Margin 11.2% 8.6% Margin at ECRC 9.0% 9.1% 1H 2012 to 1H 2013 $88 $58 $(17) $(47) $55 $(20) $3 $(4) 1H 2012 Volume/Mix Price COGS ECRC vs. FIFO SAR FX/Other 1H 2013 $149 $120 $132 $123 $- $20 $40 $60 $80 $100 $120 $140 $160 1H'12 1H'13 As Reported ECRC Gross Profit and Gross Profit at ECRC (1) Adjusted EBITDA and Adjusted EBITDA at ECRC (1)
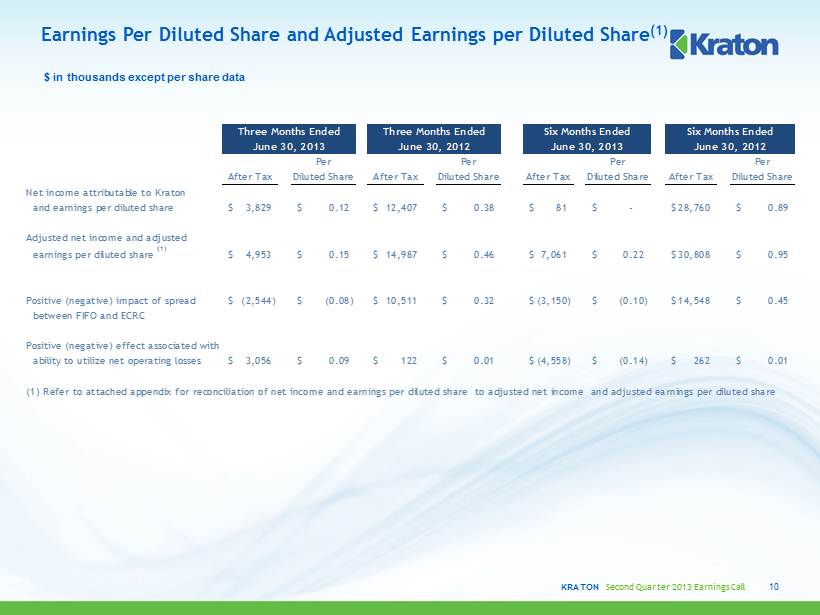
KRATON Second Quarter 2013 Earnings Call Earnings Per Diluted Share and Adjusted Earnings per Diluted Share (1) 10 $ in thousands except per share data Per Per Per Per After Tax Diluted Share After Tax Diluted Share After Tax Diluted Share After Tax Diluted Share Net income attributable to Kraton and earnings per diluted share 3,829$ 0.12$ 12,407$ 0.38$ 81$ -$ 28,760$ 0.89$ Adjusted net income and adjusted earnings per diluted share (1) 4,953$ 0.15$ 14,987$ 0.46$ 7,061$ 0.22$ 30,808$ 0.95$ Positive (negative) impact of spread (2,544)$ (0.08)$ 10,511$ 0.32$ (3,150)$ (0.10)$ 14,548$ 0.45$ between FIFO and ECRC Positive (negative) effect associated with ability to utilize net operating losses 3,056$ 0.09$ 122$ 0.01$ (4,558)$ (0.14)$ 262$ 0.01$ (1) Refer to attached appendix for reconciliation of net income and earnings per diluted share to adjusted net income and adjusted earnings per diluted share June 30, 2013 June 30, 2012 June 30, 2013 June 30, 2012 Three Months Ended Three Months Ended Six Months Ended Six Months Ended
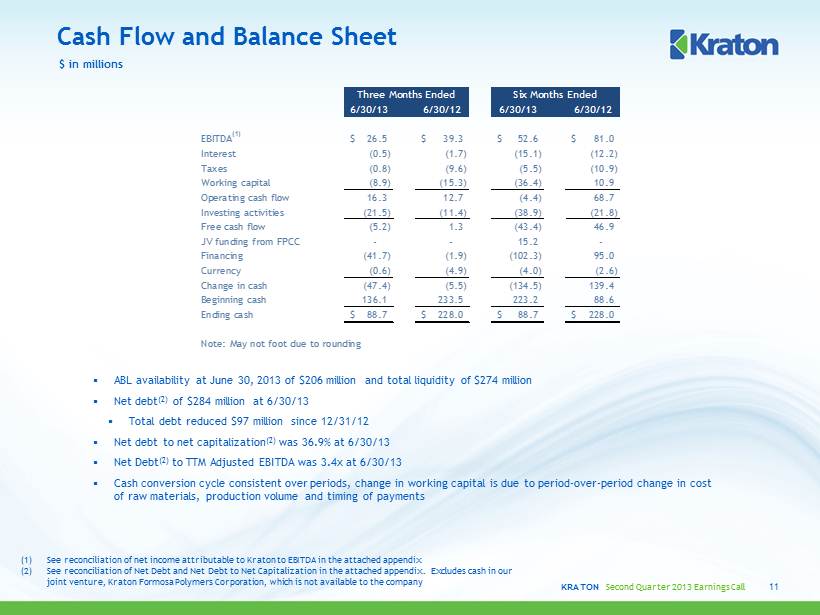
KRATON Second Quarter 2013 Earnings Call $ in millions ▪ ABL availability at June 30, 2013 of $206 million and total liquidity of $274 million ▪ Net debt (2) of $284 million at 6/30/13 ▪ Total debt reduced $97 million since 12/31/12 ▪ Net debt to net capitalization (2) was 36.9% at 6/30/13 ▪ Net Debt (2) to TTM Adjusted EBITDA was 3.4x at 6/30/13 ▪ Cash conversion cycle consistent over periods, change in working capital is due to period - over - period change in cost of raw materials, production volume and timing of payments (1) See reconciliation of net income attributable to Kraton to EBITDA in the attached appendix (2) See reconciliation of Net D ebt and Net D ebt to Net C apitalization in the attached appendix. Excludes cash in our joint venture, Kraton Formosa Polymers Corporation, which is not available to the company Cash Flow and Balance Sheet 11 6/30/13 6/30/12 6/30/13 6/30/12 EBITDA (1) 26.5$ 39.3$ 52.6$ 81.0$ Interest (0.5) (1.7) (15.1) (12.2) Taxes (0.8) (9.6) (5.5) (10.9) Working capital (8.9) (15.3) (36.4) 10.9 Operating cash flow 16.3 12.7 (4.4) 68.7 Investing activities (21.5) (11.4) (38.9) (21.8) Free cash flow (5.2) 1.3 (43.4) 46.9 JV funding from FPCC - - 15.2 - Financing (41.7) (1.9) (102.3) 95.0 Currency (0.6) (4.9) (4.0) (2.6) Change in cash (47.4) (5.5) (134.5) 139.4 Beginning cash 136.1 233.5 223.2 88.6 Ending cash 88.7$ 228.0$ 88.7$ 228.0$ Note: May not foot due to rounding Three Months Ended Six Months Ended
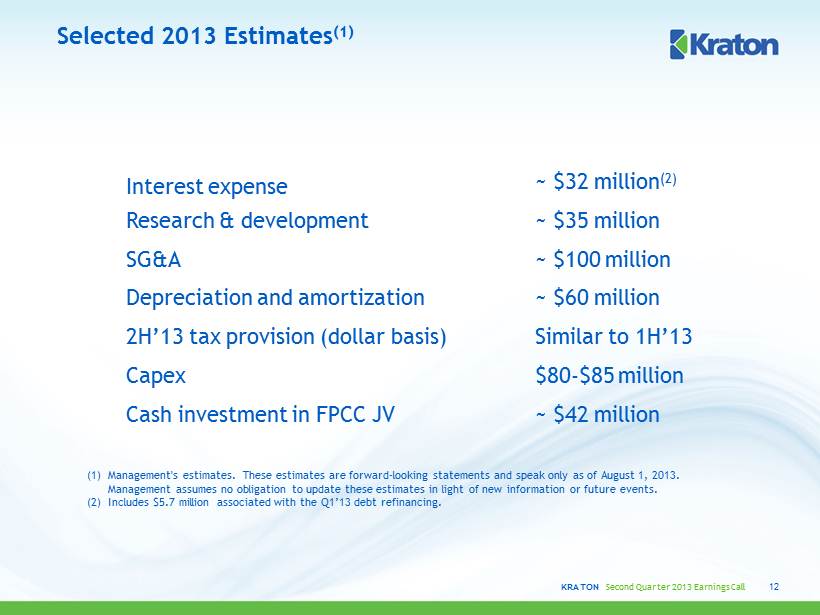
KRATON Second Quarter 2013 Earnings Call Selected 2013 Estimates (1) (1) Management's estimates. These estimates are forward - looking statements and speak only as of August 1, 2013. Management assumes no obligation to update these estimates in light of new information or future events. (2) Includes $5.7 million associated with the Q1’13 debt refinancing. 12 Interest expense ~ $32 million (2) Research & development ~ $35 million SG&A ~ $100 million Depreciation and amortization ~ $60 million 2H’13 tax provision (dollar basis) Similar to 1H’13 Capex $80 - $85 million Cash investment in FPCC JV ~ $42 million
APPENDIX August 1, 2013
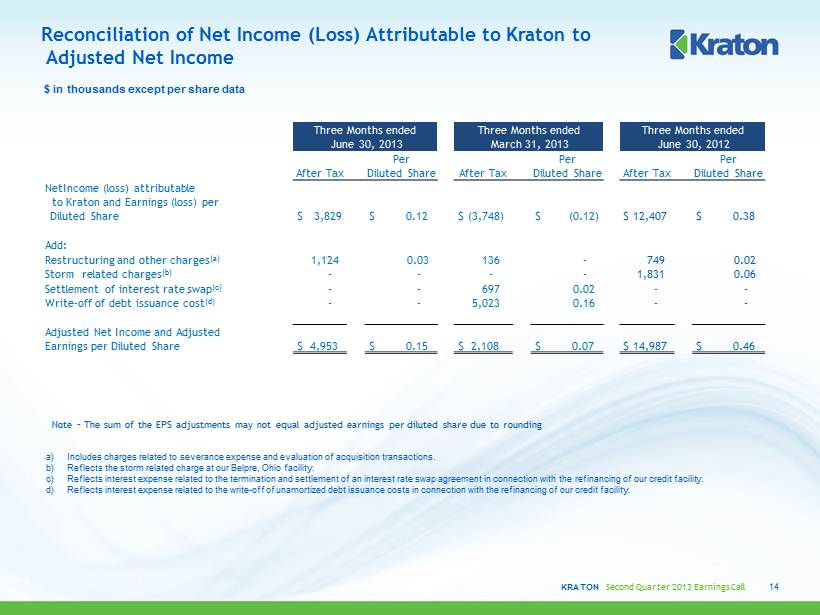
KRATON Second Quarter 2013 Earnings Call Reconciliation of Net Income (Loss) Attributable to Kraton to Adjusted Net Income 14 $ in thousands except per share data a) Includes charges related to severance expense and evaluation of acquisition transactions. b) Reflects the storm related charge at our Belpre, Ohio facility. c) Reflects interest expense related to the termination and settlement of an interest rate swap agreement in connection with the refinanc ing of our credit facility. d) Reflects interest expense related to the write - off of unamortized debt issuance costs in connection with the refinancing of our credit facility. Three Months ended Three Months ended Three Months ended June 30, 2013 March 31, 2013 June 30, 2012 Per Per Per After Tax Diluted Share After Tax Diluted Share After Tax Diluted Share Net I ncome (loss) attributable to Kraton and Earnings (loss) per Diluted Share $ 3,829 $ 0.12 $ (3,748) $ (0.12) $ 12,407 $ 0.38 Add: Restructuring and other charges (a) 1,124 0.03 136 - 749 0.02 Storm related charges (b) - - - - 1,831 0.06 Settlement of interest rate swap (c) - - 697 0.02 - - Write - off of debt issuance cost (d) - - 5,023 0.16 - - Adjusted Net Income and Adjusted Earnings per Diluted Share $ 4,953 $ 0.15 $ 2,108 $ 0.07 $ 14,987 $ 0.46 Note – The sum of the EPS adjustments may not equal adjusted earnings per diluted share due to rounding

KRATON Second Quarter 2013 Earnings Call Reconciliation of Net Income (Loss) Attributable to Kraton to EBITDA, Adjusted EBITDA and Adjusted EBITDA at ECRC 1. Reflects the storm related charge at our Belpre, Ohio facility. 2. Includes charges related to severance expense and charges associated with evaluation of acquisition transactions. 3. Adjusted EBITDA at estimated current replacement cost (ECRC) is Adjusted EBITDA net of the impact of the spread between the FIFO basis of accounting and ECRC. Although we report our financial results using the FIFO basis of accounting, as part of our pricing strategy, we measure our business per for mance using the estimated current replacement cost of our inventory and cost of goods sold. In addition, volatility in the cost of raw materials affects our results of operatio ns and the period - over - period comparability of our results of operations. Therefore, we provide the spread between FIFO and ECRC, and we present Adjusted EBITDA at ECRC as another supp lem ental measure of our performance. We believe this additional adjustment provides helpful information to investors, securities analysts and other interested partie s in evaluating period - over - period comparisons of our performance. $ in Thousands 15 Three months ended Three months ended Three months ended 6/30/2013 3/31/2013 6/30/2012 Net income (loss) attributable to Kraton $ 3,829 $ (3,748) $ 12,407 Net income ( loss) attributable to noncontrolling interest 148 (76) - Consolidated net income (loss) 3,977 (3,824) 12,407 Add: Interest expense, net 5,909 13,298 7,773 Income tax expense 905 1,446 3,269 Depreciation and amortization expenses 15,741 15,098 15,885 EBITDA $ 26,532 $ 26,018 $ 39,334 EBITDA $ 26,532 $ 26,018 $ 39,334 Add ( deduct): Storm related charges (1) - - 2,817 Restructuring and other charges (2) 1,124 136 1,006 Non - cash compensation expense 2,007 2,523 1,857 Adjusted EBITDA $ 29,663 $ 28,677 $ 45,014 Add: Spread between FIFO and ECRC $ 2,304 $ 507 $ (13,966) Adjusted EBITDA at ECRC (3) $ 31,967 $ 29,184 $ 31,048
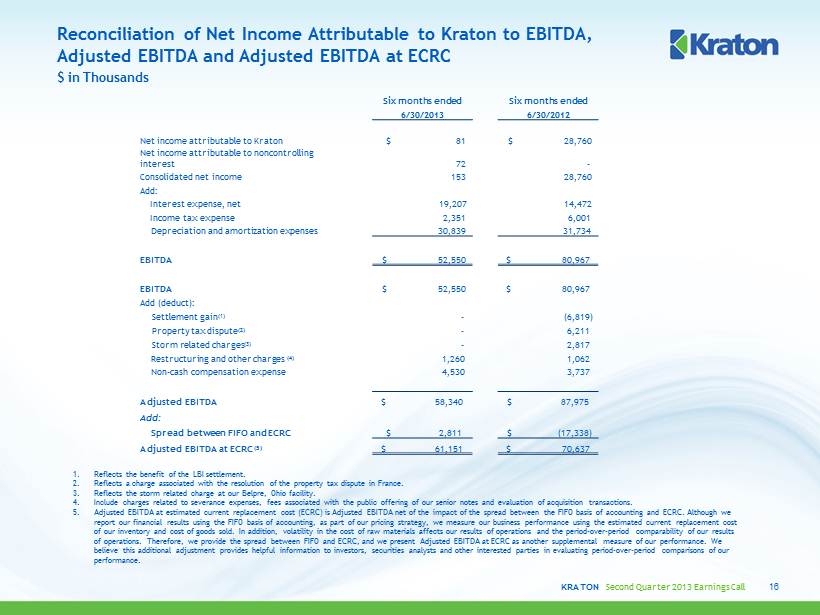
KRATON Second Quarter 2013 Earnings Call Reconciliation of Net Income Attributable to Kraton to EBITDA, Adjusted EBITDA and Adjusted EBITDA at ECRC 1. Reflects the benefit of the LBI settlement. 2. Reflects a charge associated with the resolution of the property tax dispute in France. 3. Reflects the storm related charge at our Belpre, Ohio facility. 4. Include charges related to severance expenses, fees associated with the public offering of our senior notes and evaluation of ac quisition transactions. 5. Adjusted EBITDA at estimated current replacement cost (ECRC) is Adjusted EBITDA net of the impact of the spread between the F IFO basis of accounting and ECRC. Although we report our financial results using the FIFO basis of accounting, as part of our pricing strategy, we measure our business per for mance using the estimated current replacement cost of our inventory and cost of goods sold. In addition, volatility in the cost of raw materials affects our results of operatio ns and the period - over - period comparability of our results of operations. Therefore, we provide the spread between FIFO and ECRC, and we present Adjusted EBITDA at ECRC as another supp lem ental measure of our performance. We believe this additional adjustment provides helpful information to investors, securities analysts and other interested partie s i n evaluating period - over - period comparisons of our performance. $ in Thousands 16 Six months ended Six months ended 6/30/2013 6/30/2012 Net income attributable to Kraton $ 81 $ 28,760 Net income attributable to noncontrolling interest 72 - Consolidated net income 153 28,760 Add: Interest expense, net 19,207 14,472 Income tax expense 2,351 6,001 Depreciation and amortization expenses 30,839 31,734 EBITDA $ 52,550 $ 80,967 EBITDA $ 52,550 $ 80,967 Add ( deduct): Settlement gain (1) - (6,819) Property tax dispute (2) - 6,211 Storm related charges (3) - 2,817 Restructuring and other charges (4) 1,260 1,062 Non - cash compensation expense 4,530 3,737 Adjusted EBITDA $ 58,340 $ 87,975 Add: Spread between FIFO and ECRC $ 2,811 $ (17,338) Adjusted EBITDA at ECRC (5) $ 61,151 $ 70,637

KRATON Second Quarter 2013 Earnings Call Reconciliation of Net Debt and Net Debt to Net Capitalization (1) 17 ($ Millions) Q1'11 Q2'11 Q3'11 Q4'11 Q1'12 Q2'12 Q3’12 Q4’12 Q1’13 Q2’13 Total Debt $400 $396 $394 $393 $492 $490 $448 $448 $391 $351 Less: Cash (2) $36 $67 $46 $89 $233 $228 $202 $223 $105 $67 Net Debt $364 $329 $349 $304 $258 $262 $246 $225 $286 $284 Equity (2) $499 $556 $571 $518 $546 $539 $532 $492 $483 $485 Add: Net Debt $364 $329 $349 $304 $258 $262 $246 $225 $286 $284 Net Capitalization $863 $885 $920 $822 $805 $801 $778 $717 $769 $768 Net Debt to Net Capitalization 42.2% 37.2% 37.9% 37.0% 32.1% 32.7% 31.6% 31.4% 37.2% 36.9% (1) May not foot due to rounding (2) Excludes JV cash and noncontrolling interest beginning in Q1 2013

KRATON Second Quarter 2013 Earnings Call Reconciliation of Gross Profit to Gross Profit at Estimated Current Replacement Cost 18 ($ Millions, except Gross Profit/Ton) Q1'08 Q2'08 Q3'08 Q4'08 Q1'09 Q2'09 Q3'09 Q4'09 Q1'10 Q2'10 Q3'10 Q4'10 Sales Volume (Kilotons) 76.8 94.2 89.6 52.6 47.1 71.4 80.9 61.0 72.9 86.2 80.9 67.1 Gross Profit @ FIFO $ 48.79 $ 62.55 $ 94.45 $ 48.97 $ 8.93 $ 35.76 $ 69.97 $ 60.87 $ 69.13 $ 89.13 $ 82.88 $ 59.37 ECRC to FIFO $ 5.18 $ 11.94 $ 22.33 $ (2.31) $ (34.32) $ (9.30) $ 12.77 $ 13.28 $ 7.26 $ 14.69 $ (1.72) $ (8.08) Gross Profit @ ECRC (1) $ 43.60 $ 50.60 $ 72.12 $ 51.28 $ 43.25 $ 45.06 $ 57.20 $ 47.59 $ 61.87 $ 74.44 $ 84.60 $ 67.45 Gross Profit/Ton @ECRC $568.13 $537.20 $ 805.03 $975.70 $917.58 $631.54 $707.38 $780.55 $849.01 $ 863.45 $1,045.50 $1,005.10 Gross Profit/Ton @ FIFO $635.64 $663.97 $1,054.24 $931.79 $189.51 $501.16 $865.32 $998.39 $948.60 $1,034.09 $1,024.21 $ 884.71 ($ Millions, except Gross Profit/Ton) Q1'11 Q2'11 Q3'11 Q4'11 Q1'12 Q2'12 Q3'12 Q4’12 Q1’13 Q2’13 Sales Volume (Kilotons) 81.3 82.3 77.6 61.9 89.6 77.2 79.3 67.2 78.2 77.5 Gross Profit @ FIFO $ 86.9 $ 108.4 $ 101.5 $ 19.5 $ 75.5 $ 73.5 $ 42.8 $ 39.7 $ 59.9 $ 59.9 ECRC to FIFO $ 21.0 $ 49.8 $ 32.1 $ (36.6) $ 3.4 $ 14.0 $ (37.6) $ (10.2) $ (0.5) $ (2.3) Gross Profit @ ECRC (1) $ 65.8 $ 58.6 $ 69.4 $ 56.1 $ 72.1 $ 59.5 $ 80.4 $ 49.9 $ 60.4 $ 62.2 Gross Profit/Ton @ECRC $ 810 $ 712 $ 894 $ 907 $ 805 $ 771 $ 1,014 $ 743 $ 772 $ 802 Gross Profit/Ton @ FIFO $ 1,068 $ 1,318 $ 1,308 $ 315 $ 842 $ 952 $ 539 $ 590 $ 766 $ 773 (1) G ross Profit at ECRC is gross profit net of the impact of the spread between the FIFO basis of accounting and ECRC. Although we report our financial results using the FIFO basis of accounting, as part of our pricing strategy, we measure our business performance using the estimated cur rent replacement cost of our inventory and cost of goods sold. In addition, volatility in the cost of raw materials affects our results of operations and the period - over - period comparability of our results of operations. Therefore, we provide Gross Profit at ECRC as another supplemental measure of our performance. We believe this adjustment provides helpful information to investors, securities analysts and other interested parties in the evaluating period - over - period comparisons of our performance.

KRATON Second Quarter 2013 Earnings Call Monomer Volatility Quarterly Difference Between Inventory Valuation at FIFO and at ECRC ($ Millions) Gross Profit per Ton at Estimated Current Replacement Cost Gross Profit per Ton at FIFO 19 (1) Excludes impact of Belpre storm - related charge and severance charge aggregating $3.8 million in the second quarter 2012 and $(0.3) million in the third quarter of 2012. $5.2 $11.9 $22.3 - $2.3 - $34.3 - $9.3 $12.8 $13.3 $7.3 $14.7 - $1.7 - $8.1 $21.0 $49.8 $32.1 - $36.6 $3.4 $14.0 - $37.6 - $10.2 - $0.5 - $2.3 Q1'08 Q2'08 Q3'08 Q4'08 Q1'09 Q2'09 Q3'09 Q4'09 Q1'10 Q2'10 Q3'10 Q4'10 Q1'11 Q2'11 Q3'11 Q4'11 Q1'12 Q2'12 Q3'12 Q4'12 Q1'13 Q2'13 $568 $537 $805 $976 $918 $632 $707 $781 $849 $863 $1,046 $1,005 $810 $712 $894 $907 $805 $820 $1,010 $743 $772 $802 Q1'08 Q2'08 Q3'08 Q4'08 Q1'09 Q2'09 Q3'09 Q4'09 Q1'10 Q2'10 Q3'10 Q4'10 Q1'11 Q2'11 Q3'11 Q4'11 Q1'12 Q2'12 (1) Q3'12 (1) Q4'12 Q1'13 Q2'13 $636 $664 $1,054 $932 $190 $501 $865 $998 $949 $1,034 $1,024 $885 $1,068 $1,318 $1,308 $315 $842 $1,001 $535 $590 $766 $773 Q1'08 Q2'08 Q3'08 Q4'08 Q1'09 Q2'09 Q3'09 Q4'09 Q1'10 Q2'10 Q3'10 Q4'10 Q1'11 Q2'11 Q3'11 Q4'11 Q1'12 Q2'12 (1) Q3'12 (1) Q4'12 Q1'13 Q2'13