
KRATON PERFORMANCE POLYMERS, INC. THIRD QUARTER 2013 EARNINGS CONFERENCE CALL October 31, 2013
KRATON Third Quarter 2013 Earnings Call This presentation includes forward - looking statements that reflect our plans, beliefs, expectations and current views with respect to, among other things, future events and financial performance. Forward - looking statements are often characterized by the use of words such as “outlook,” “believes,” “estimates,” “expects,” “projects,” “may,” “intends,” “plans” or “anticipates,” or by discussions of strategy, plans or intentions, including statements regarding raw material price environment; butadiene prices; expectations regarding future spreads between FIFO and ECRC, and statements regarding selected 2013 P&L estimates. All forward - looking statements in this presentation are made based on management's current expectations and estimates, which involve known and unknown risks, uncertainties and other important factors that could cause actual results to differ materially from those expressed in forward - looking statements. These risks and uncertainties are more fully described in in our latest Annual Report on Form 10 - K, including but not limited to “Part I, Item 1A. Risk Factors” and “Part I, Item 7. Management’s Discussion and Analysis of Financial Condition and Results of Operations” therein, and in our other filings with the Securities and Exchange Commission, and include, but are not limited to, risks related to: conditions in the global economy and capital markets; declines in raw material costs; limitations in the availability of raw materials we need to produce our products in the amounts or at the prices necessary for us to effectively and profitably operate our business; competition in our end - use markets, from other producers of SBCs and from producers of products that can be substituted for our products; our investment in the joint venture with FPCC; and other risks, factors and uncertainties described in this presentation and our other reports and documents; and other factors of which we are currently unaware or deem immaterial. Readers are cautioned not to place undue reliance on forward - looking statements. Forward - looking statements speak only as of the date they are made, and we assume no obligation to update such information in light of new information or future events. Forward - Looking Statement Disclaimer 2
KRATON Third Quarter 2013 Earnings Call GAAP Disclaimer This presentation includes the use of both GAAP and non - GAAP financial measures. The non - GAAP financial measures are EBITDA, Adjusted EBITDA, Adjusted EBITDA at ECRC, Gross Profit at ECRC and Adjusted Net Income (or earnings per share). A table included in t his presentation reconciles each of these non - GAAP financial measures with the most directly comparable GAAP financial measure . For additional information on the impact of the spread between the FIFO basis of accounting and ECRC, see Management’s Discussion an d Analysis of Financial Condition and Results of Operations in our Quarterly Report on Form 10 - Q for the quarter ended June 30, 20 13. We consider these non - GAAP financial measures important supplemental measures of our performance and believe they are frequently used by investors, securities analysts and other interested parties in the evaluation of our performance and/or that of other comp ani es in our industry, including period - to - period comparisons. Further, management uses these measures to evaluate operating performance, an d our executive compensation plan bases incentive compensation payments on our Adjusted EBITDA and Adjusted EBITDA at ECRC performanc e, along with other factors. These non - GAAP financial measures have limitations as analytical tools and in some cases can vary substantially from other measu res of our performance. You should not consider them in isolation, or as a substitute for analysis of our results under GAAP in the Un ite d States. For EBIDTA, these limitations include: EBITDA does not reflect our cash expenditures, or future requirements for capital expendi tur es or contractual commitments; EBITDA does not reflect changes in, or cash requirements for, our working capital needs; EBITDA does no t reflect the significant interest expense, or the cash requirements necessary to service interest or principal payments, on our debt; alt hough depreciation and amortization are non - cash charges, the assets being depreciated and amortized will often have to be replaced in the future, and EBITDA does not reflect any cash requirements for such replacements; EBITDA calculations under the terms of our d ebt agreements may vary from EBITDA presented herein, and our presentation of EBITDA herein is not for purposes of assessing comp lia nce or non - compliance with financial covenants under our debt agreements; and other companies in our industry may calculate EBITDA diff erently from how we do, limiting its usefulness as a comparative measure. As an analytical tool, Adjusted EBITDA is subject to all t he limitations applicable to EBITDA. In addition, we prepare Adjusted EBITDA by adjusting EBITDA to eliminate the impact of a number of item s w e do not consider indicative of our on - going performance, but you should be aware that in the future we may incur expenses similar to the adjustments in this presentation. Our presentation of Adjusted EBITDA should not be construed as an inference that our futur e r esults will be unaffected by unusual or non - recurring items. As an analytical tool, Adjusted EBITDA at ECRC is subject to all the limitatio ns applicable to EBITDA, as well as the following limitations: due to volatility in raw material prices, Adjusted EBITDA at ECRC may, and o fte n does, vary substantially from EBITDA and other performance measures, including net income calculated in accordance with GAAP; and Adjus ted EBITDA at ECRC may, and often will, vary significantly from EBITDA calculations under the terms of our debt agreements and sh oul d not be used for assessing compliance or non - compliance with financial covenants under our credit agreement. Because of these and other limitations, EBITDA, Adjusted EBITDA and ECRC Adjusted EBITDA should not be considered as a measure of discretionary cash ava ila ble to us to invest in the growth of our business. As a measure of our performance, Gross Profit at ECRC is limited because it often v ari es substantially from gross profit calculated in accordance with GAAP due to volatility in raw material prices. Finally, we pre par e Adjusted Net Income by adjusting net income to eliminate the impact of a number of items we do not consider indicative of our on - going performance, but you should be aware that in the future we may incur expenses similar to the adjustments in this presentation . Our presentation of Adjusted Net Income should not be construed as an inference that our future results will be unaffected by unu sua l or non - recurring items. 3

KRATON Third Quarter 2013 Earnings Call Third Quarter 2013 Financial Summary ( $ millions, except volume and per share data) Q3’13 Q3’12 Change Sales volume (kT) 83.5 79.3 4.2 Sales revenue $ 327.1 $ 342.6 $ (15.5) Net loss attributable to Kraton $ (5.6) $ (15.5) $ 9.9 Loss per diluted share (1) $ (0.17) $ (0.48) $ 0.31 Adjusted loss per diluted share (1) $ (0.03) $ (0.38) $ 0.35 Adjusted EBITDA at ECRC (1) $ 44.8 $ 50.8 $ (6.1) Net cash provided by operating activities $ 62.5 $ 33.5 $ 29.1 4 (1) The spread between the FIFO basis of accounting and the estimated current replacement cost basis (“ECRC”) decreased earnings per diluted share and adjusted earnings per diluted share by $ 0.63 in the third quarter 2013 and decreased earnings per diluted share and adjusted earnings per diluted share by $1.13 in the third quarter 2012 . See reconciliation of net income and earnings per diluted share under GAAP to EBITDA, Adjusted EBITDA, Adjusted EBITDA at ECRC, adjusted net income and adjusted earnings per diluted share in the attached ap pendix. Note: May not foot due to rounding.
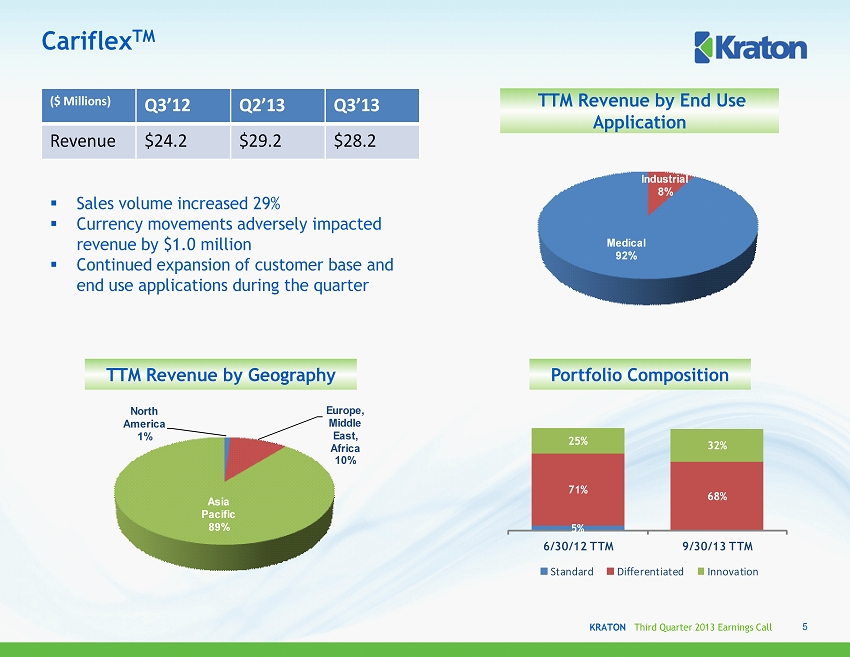
KRATON Third Quarter 2013 Earnings Call Industrial 8% Medical 92% North America 1% Europe, Middle East, Africa 10% Asia Pacific 89% 5% 71% 68% 25% 32% 6/30/12 TTM 9/30/13 TTM Standard Differentiated Innovation Cariflex TM 5 Portfolio Composition TTM Revenue by Geography TTM Revenue by End Use Application ( $ Millions) Q3’12 Q2’13 Q3’13 Revenue $24.2 $29.2 $28.2 ▪ Sales volume increased 29% ▪ Currency movements adversely impacted revenue by $1.0 million ▪ Continued expansion of customer base and end use applications during the quarter
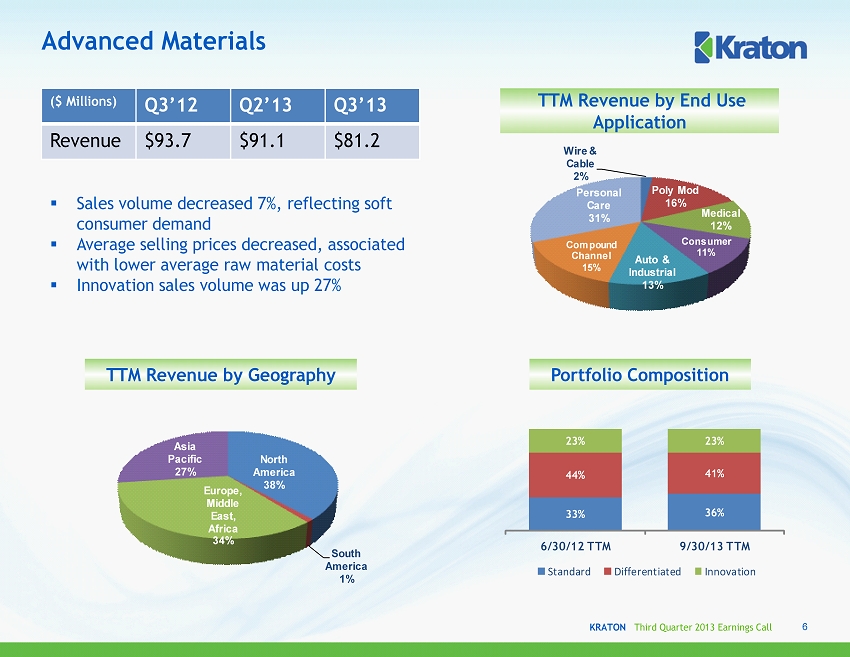
KRATON Third Quarter 2013 Earnings Call North America 38% South America 1% Europe, Middle East, Africa 34% Asia Pacific 27% Wire & Cable 2% Poly Mod 16% Medical 12% Consumer 11% Auto & Industrial 13% Compound Channel 15% Personal Care 31% 23% 23% 44% 41% 33% 36% 6/30/12 TTM 9/30/13 TTM Standard Differentiated Innovation Advanced Materials 6 Portfolio Composition ( $ Millions) Q3’12 Q2’13 Q3’13 Revenue $93.7 $91.1 $81.2 ▪ Sales volume decreased 7 %, reflecting soft consumer demand ▪ Average selling prices decreased, associated with lower average raw material costs ▪ Innovation sales volume was up 27% TTM Revenue by Geography TTM Revenue by End Use Application

KRATON Third Quarter 2013 Earnings Call Other 24% Industrial 27% Printing Plates 8% Hygiene 14% Pressure Sensitive Adhesives 27% North America 42% South America 9% Europe, Middle East, Africa 36% Asia Pacific 13% 51% 52% 42% 43% 7% 5% 6/30/12 TTM 9/30/13 TTM Standard Differentiated Innovation Adhesives, Sealants & Coatings 7 Portfolio Composition ( $ Millions) Q3’12 Q2’13 Q3’13 Revenue $116.5 $126.0 $117.6 ▪ Sales volume increased 7 %, primarily due to timing of lubricant additive sales ▪ Currency movements adversely impacted revenue by $0.7 million ▪ Average selling price declined, associated with lower average raw material costs TTM Revenue by Geography TTM Revenue by End Use Application

KRATON Third Quarter 2013 Earnings Call North America 30% South America 6% Europe, Middle East, Africa 57% Asia Pacific 7% Asphalt & Other 5% Roofing 37% Paving 58% 71% 65% 21% 23% 8% 12% 6/30/12 TTM 9/30/13 TTM Standard Differentiated Innovation Paving & Roofing 8 Portfolio Composition (1) ( $ Millions) Q3’12 Q2’13 Q3’13 Revenue $108.1 $87.8 $99.7 ▪ Sales volume increased 9% ▪ Currency movements favorably impacted revenue by $2.1 million ▪ Average selling price declined, associated with lower average raw material costs ▪ Sales volume of innovation grades up 22% TTM Revenue by Geography TTM Revenue by End Use Application
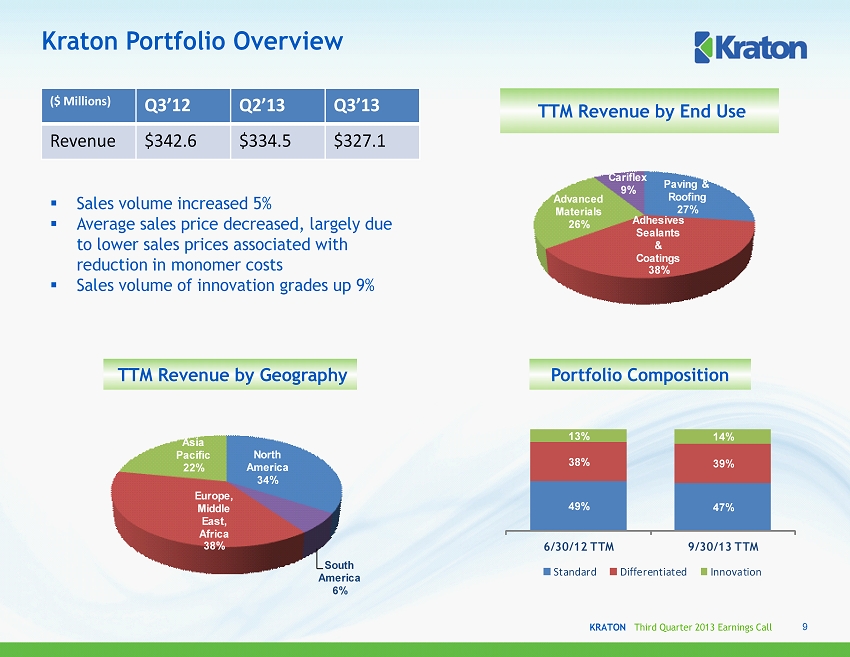
KRATON Third Quarter 2013 Earnings Call Paving & Roofing 27% Adhesives Sealants & Coatings 38% Advanced Materials 26% Cariflex 9% North America 34% South America 6% Europe, Middle East, Africa 38% Asia Pacific 22% 49% 47% 38% 39% 13% 14% 6/30/12 TTM 9/30/13 TTM Standard Differentiated Innovation Kraton Portfolio Overview 9 Portfolio Composition TTM Revenue by Geography TTM Revenue by End Use ( $ Millions) Q3’12 Q2’13 Q3’13 Revenue $342.6 $334.5 $327.1 ▪ Sales volume increased 5% ▪ Average sales price decreased, largely due to lower sales prices associated with reduction in monomer costs ▪ Sales volume of innovation grades up 9%
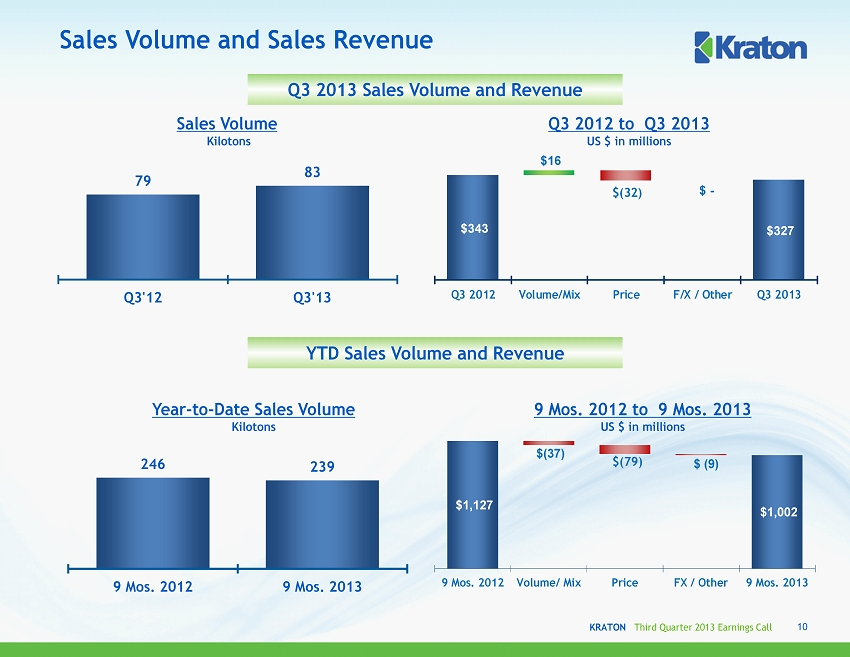
KRATON Third Quarter 2013 Earnings Call $1,127 $1,002 $(37) $(79) $ (9) 9 Mos. 2012 Volume/ Mix Price FX / Other 9 Mos. 2013 79 83 40 60 80 100 120 140 Q3'12 Q3'13 Sales Volume Kilotons Sales Volume and Sales Revenue Year - to - Date Sales Volume Kilotons 10 Q3 2012 to Q3 2013 US $ in millions YTD Sales Volume and Revenue 246 239 0 100 200 300 9 Mos. 2012 9 Mos. 2013 9 Mos. 2012 to 9 Mos. 2013 US $ in millions Q3 2013 Sales Volume and Revenue $343 $327 $16 $(32) $ - Q3 2012 Volume/Mix Price F/X / Other Q3 2013
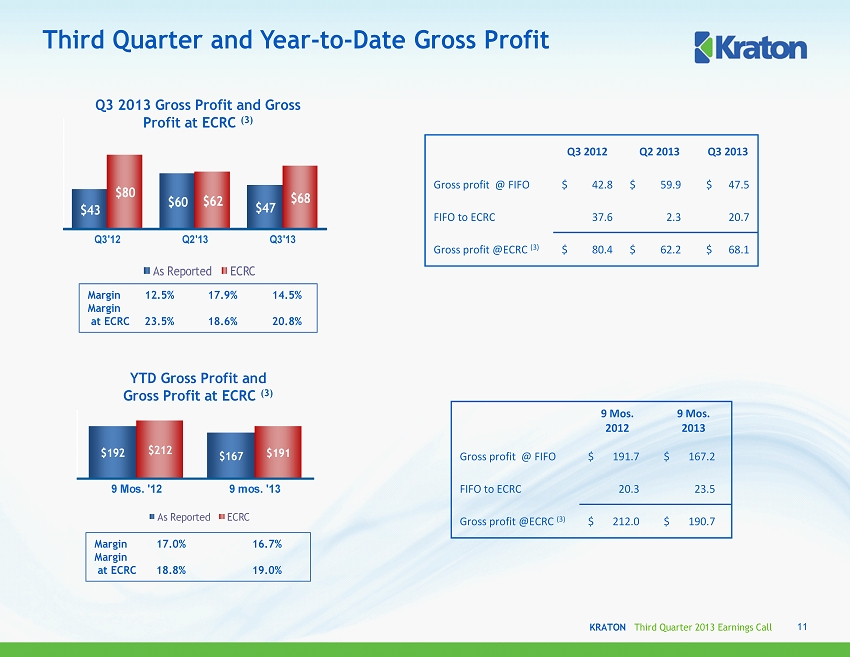
KRATON Third Quarter 2013 Earnings Call Third Quarter and Year - to - Date Gross Profit 11 $43 $60 $47 $80 $62 $68 0 20 40 60 80 100 120 Q3'12 Q2'13 Q3'13 As Reported ECRC Margin 12.5% 17.9% 14.5% Margin at ECRC 23.5% 18.6% 20.8% Q3 2013 Gross Profit and Gross Profit at ECRC (3) Margin 17.0% 16.7% Margin at ECRC 18.8% 19.0% $192 $167 $212 $191 $- $50 $100 $150 $200 $250 9 Mos. '12 9 mos. '13 As Reported ECRC YTD Gross Profit and Gross Profit at ECRC (3) Q3 2012 Q2 2013 Q3 2013 Gross profit @ FIFO $ 42.8 $ 59.9 $ 47.5 FIFO to ECRC 37.6 2.3 20.7 Gross profit @ECRC (3) $ 80.4 $ 62.2 $ 68.1 9 Mos. 2012 9 Mos. 2013 Gross profit @ FIFO $ 191.7 $ 167.2 FIFO to ECRC 20.3 23.5 Gross profit @ECRC (3) $ 212.0 $ 190.7
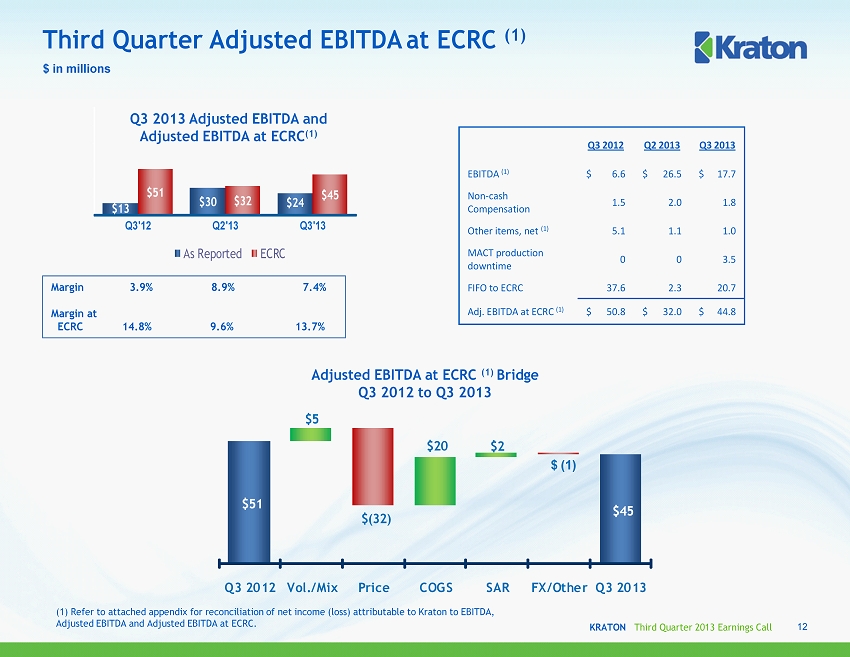
KRATON Third Quarter 2013 Earnings Call Third Quarter Adjusted EBITDA at ECRC (1) $ in millions 12 (1) Refer to attached appendix for reconciliation of net income ( l oss ) attributable to Kraton to EBITDA, Adjusted EBITDA and Adjusted EBITDA at ECRC . $13 $30 $24 $51 $32 $45 0 20 40 60 80 100 120 Q3'12 Q2'13 Q3'13 As Reported ECRC Q3 2013 Adjusted EBITDA and Adjusted EBITDA at ECRC (1) Margin 3.9% 8.9% 7.4% Margin at ECRC 14.8% 9.6% 13.7% Adjusted EBITDA at ECRC (1) Bridge Q3 2012 to Q3 2013 Q3 2012 Q2 2013 Q3 2013 EBITDA (1) $ 6.6 $ 26.5 $ 17.7 Non - cash Compensation 1.5 2.0 1.8 Other items, net (1) 5.1 1.1 1.0 MACT production downtime 0 0 3.5 FIFO to ECRC 37.6 2.3 20.7 Adj. EBITDA at ECRC (1) $ 50.8 $ 32.0 $ 44.8 $51 $45 $5 $(32) $20 $2 $ (1) Q3 2012 Vol./Mix Price COGS SAR FX/Other Q3 2013

KRATON Third Quarter 2013 Earnings Call 9 Mos. ‘12 9 Mos. ‘13 EBITDA (1) $ 87.6 $ 70.3 Non - cash Compensation 5.2 6.4 Other items, net (1) 8.4 2.3 MACT production downtime 0 3.5 FIFO to ECRC 20.3 23.5 Adjusted EBITDA at ECRC (1) $ 121.5 $ 105.9 Adjusted EBITDA at ECRC (1) Bridge 9 Mos. 2012 to 9 Mos. 2013 $101 $82 $121 $106 $- $20 $40 $60 $80 $100 $120 $140 9 Mos. '12 9 Mos. '13 As Reported ECRC YTD Adjusted EBITDA and Adjusted EBITDA at ECRC (1) Year - to - Date Adjusted EBITDA at ECRC (1) $ in millions 13 (1) Refer to attached appendix for reconciliation of net income ( l oss ) attributable to Kraton to EBITDA, Adjusted EBITDA and Adjusted EBITDA at ECRC . Margin 9.0% 8.2% Margin at ECRC 10.8% 10.6% $121 $106 $ (4) $(12) $ (79) $75 $5 9 Mos. 2012 Vol./Mix Price COGS SAR FX/Other 9 Mos. 2013
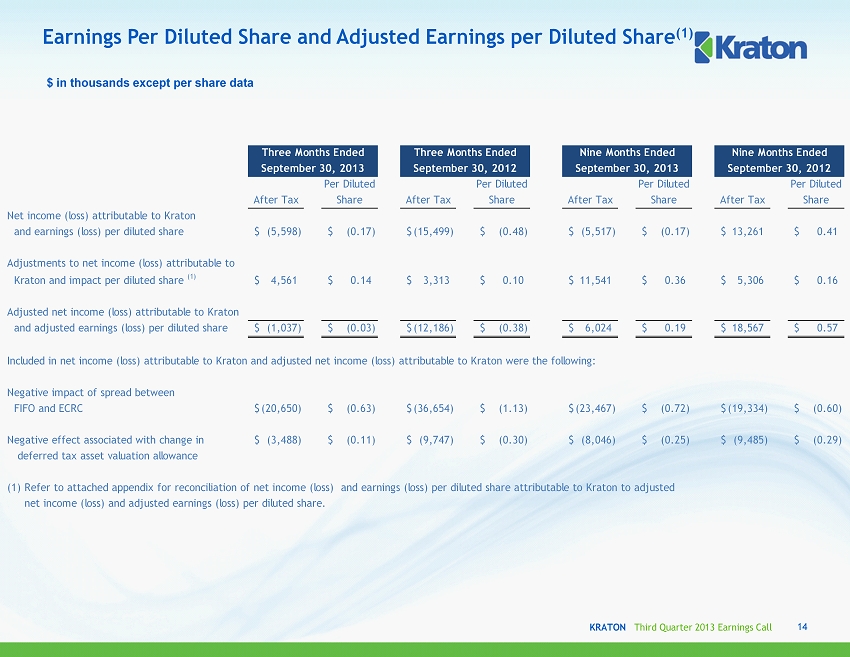
KRATON Third Quarter 2013 Earnings Call 14 Earnings Per Diluted Share and Adjusted Earnings per Diluted Share (1) $ in thousands except per share data Per Diluted Per Diluted Per Diluted Per Diluted After Tax Share After Tax Share After Tax Share After Tax Share Net income (loss) attributable to Kraton and earnings (loss) per diluted share (5,598)$ (0.17)$ (15,499)$ (0.48)$ (5,517)$ (0.17)$ 13,261$ 0.41$ Adjustments to net income (loss) attributable to Kraton and impact per diluted share (1) 4,561$ 0.14$ 3,313$ 0.10$ 11,541$ 0.36$ 5,306$ 0.16$ Adjusted net income (loss) attributable to Kraton and adjusted earnings (loss) per diluted share (1,037)$ (0.03)$ (12,186)$ (0.38)$ 6,024$ 0.19$ 18,567$ 0.57$ Included in net income (loss) attributable to Kraton and adjusted net income (loss) attributable to Kraton were the following: Negative impact of spread between FIFO and ECRC (20,650)$ (0.63)$ (36,654)$ (1.13)$ (23,467)$ (0.72)$ (19,334)$ (0.60)$ Negative effect associated with change in (3,488)$ (0.11)$ (9,747)$ (0.30)$ (8,046)$ (0.25)$ (9,485)$ (0.29)$ deferred tax asset valuation allowance (1) Refer to attached appendix for reconciliation of net income (loss) and earnings (loss) per diluted share attributable to Kraton to adjusted net income (loss) and adjusted earnings (loss) per diluted share. Three Months Ended Three Months Ended Nine Months Ended Nine Months Ended September 30, 2013 September 30, 2012 September 30, 2013 September 30, 2012
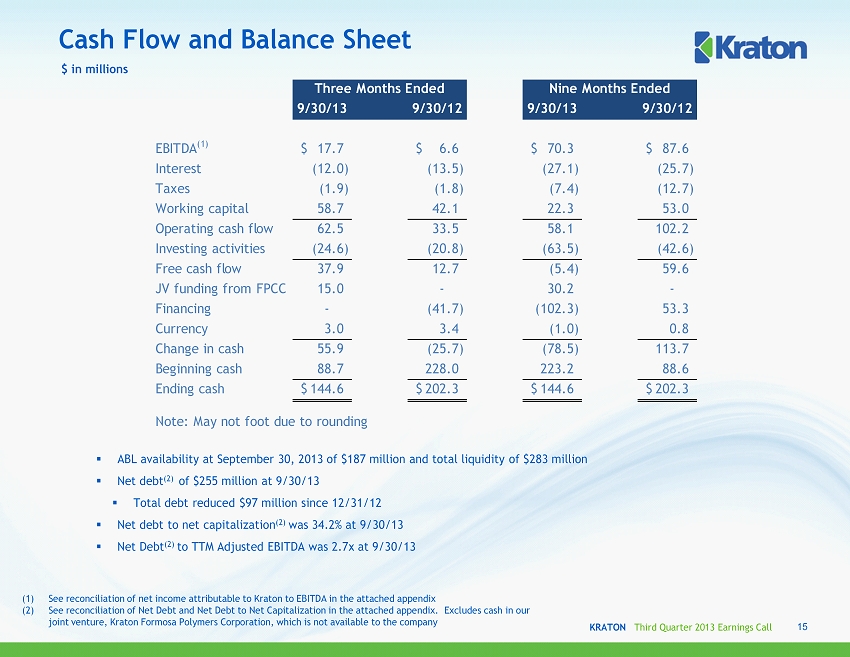
KRATON Third Quarter 2013 Earnings Call $ in millions ▪ ABL availability at September 30, 2013 of $187 million and total liquidity of $283 million ▪ Net debt (2) of $255 million at 9/30/13 ▪ Total debt reduced $97 million since 12/31/12 ▪ Net debt to net capitalization (2) was 34.2% at 9/30/13 ▪ Net Debt (2) to TTM Adjusted EBITDA was 2.7x at 9/30/13 (1) See reconciliation of net income attributable to Kraton to EBITDA in the attached appendix (2) See reconciliation of Net D ebt and Net D ebt to Net C apitalization in the attached appendix. Excludes cash in our joint venture, Kraton Formosa Polymers Corporation, which is not available to the company Cash Flow and Balance Sheet 15 9/30/13 9/30/12 9/30/13 9/30/12 EBITDA (1) 17.7$ 6.6$ 70.3$ 87.6$ Interest (12.0) (13.5) (27.1) (25.7) Taxes (1.9) (1.8) (7.4) (12.7) Working capital 58.7 42.1 22.3 53.0 Operating cash flow 62.5 33.5 58.1 102.2 Investing activities (24.6) (20.8) (63.5) (42.6) Free cash flow 37.9 12.7 (5.4) 59.6 JV funding from FPCC 15.0 - 30.2 - Financing - (41.7) (102.3) 53.3 Currency 3.0 3.4 (1.0) 0.8 Change in cash 55.9 (25.7) (78.5) 113.7 Beginning cash 88.7 228.0 223.2 88.6 Ending cash 144.6$ 202.3$ 144.6$ 202.3$ Note: May not foot due to rounding Three Months Ended Nine Months Ended
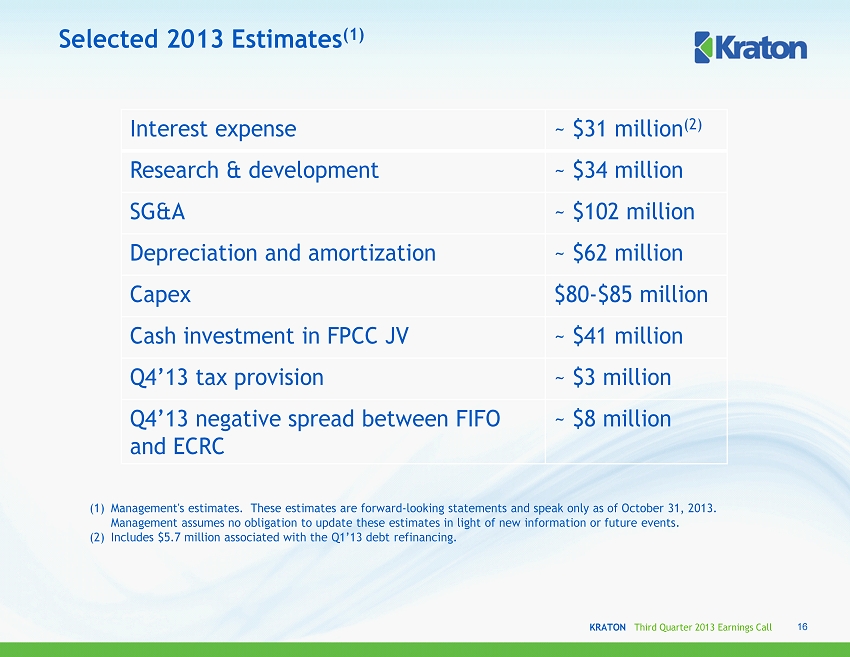
KRATON Third Quarter 2013 Earnings Call Selected 2013 Estimates (1) (1) Management's estimates. These estimates are forward - looking statements and speak only as of October 31, 2013. Management assumes no obligation to update these estimates in light of new information or future events. (2) Includes $5.7 million associated with the Q1’13 debt refinancing. 16 Interest expense ~ $31 million (2) Research & development ~ $34 million SG&A ~ $102 million Depreciation and amortization ~ $62 million Capex $80 - $85 million Cash investment in FPCC JV ~ $41 million Q4’13 tax provision ~ $3 million Q4’13 negative spread between FIFO and ECRC ~ $8 million
APPENDIX October 31, 2013

KRATON Third Quarter 2013 Earnings Call Reconciliation of Net Income (Loss) and Earnings (Loss) Per Diluted Share to Adjusted Net Income (Loss) and Adjusted Earnings (Loss) per Diluted Share 18 $ in thousands except per share data a) Includes other professional fees and severance expenses, which are primarily recorded in selling, general and administrative expenses in 2013 and primarily in cost of goods sold in 2012 . b) Reflects the storm related charge at our Belpre, Ohio facility, which is recorded in cost of goods sold . c) Reflects interest expense related to the write - off of unamortized debt issuance costs in connection with the refinancing of our credit fa cility . d) Reflects the impairment of long - lived assets, of which $3.4 million and $2.0 million were associated with the HSBC facility and other long - term assets, respectively . e) Reflects the non - recurring portion of the $6.1 million of aggregate turnaround costs in 2013. The adjustment relates to the pro duction downtime at our Belpre, Ohio facility, in preparation for the installation of natural gas boilers to replace the coal - burning boilers required by the MACT le gislation, which is recorded in cost of goods sold. f) Reflects the benefit of the LBI settlement, which is recorded in cost of goods sold. g) Reflects a charge associated with the resolution of the property tax dispute in France, of which $5,646 is recorded in cost o f g oods sold and $565 is recorded in selling, general and administrative expenses . h) Includes costs related to the public offering of our senior notes, which are recorded in selling, general and administrative exp enses . i) Reflects interest expense related to the termination and settlement of an interest rate swap agreement in connection with the re financing of our credit facility. Per Diluted Per Diluted Per Diluted Per Diluted After Tax Share After Tax Share After Tax Share After Tax Share Net income (loss) attributable to Kraton and earnings (loss) per diluted share (5,598)$ (0.17)$ (15,499)$ (0.48)$ (5,517)$ (0.17)$ 13,261$ 0.41$ Restructuring and other charges (a) 1,013$ 0.03$ -$ -$ 2,273$ 0.07$ 776$ 0.02$ Storm related charges (b) -$ -$ (219)$ (0.01)$ -$ -$ 1,612$ 0.05$ Write-off of debt issuance cost (c) 42$ -$ -$ -$ 5,065$ 0.16$ -$ -$ Impairment of long-lived assets (d) -$ -$ 3,532$ 0.11$ -$ -$ 3,532$ 0.11$ Production downtime related to MACT legislation (e) 3,506$ 0.11$ -$ -$ 3,506$ 0.11$ -$ -$ Settlement gain (f) -$ -$ -$ -$ -$ -$ (6,909)$ (0.21)$ Property tax dispute (g) -$ -$ -$ -$ -$ -$ 6,211$ 0.19$ Debt offering (h) -$ -$ -$ -$ -$ -$ 84$ -$ Settlement of interest rate swap (i) -$ -$ -$ -$ 697$ 0.02$ -$ -$ Adjusted net income (loss) and adjusted earnings (loss) per diluted share (1,037)$ (0.03)$ (12,186)$ (0.38)$ 6,024$ 0.19$ 18,567$ 0.57$ Three Months Ended Three Months Ended Nine Months Ended Nine Months Ended September 30, 2013 September 30, 2012 September 30, 2013 September 30, 2012
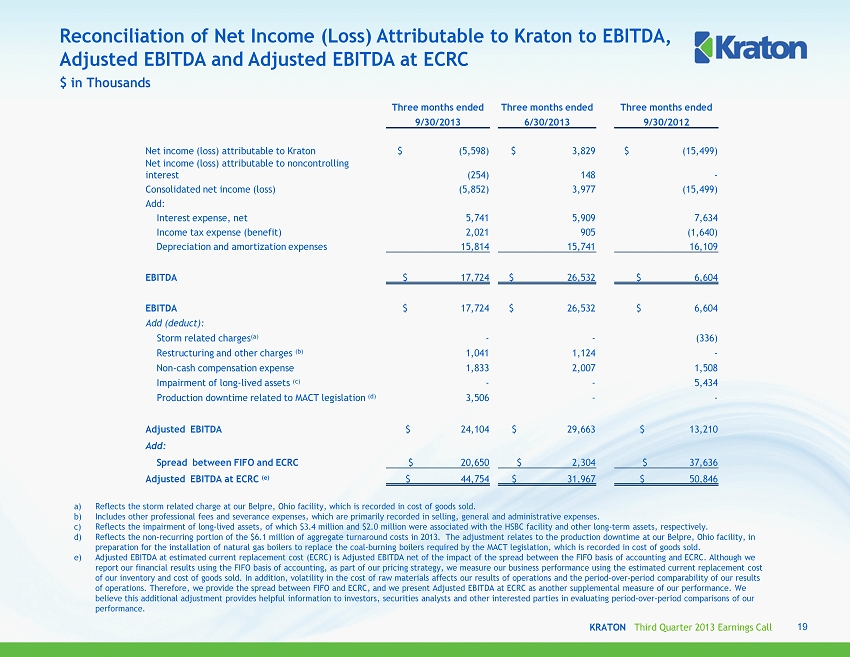
KRATON Third Quarter 2013 Earnings Call Reconciliation of Net Income (Loss) Attributable to Kraton to EBITDA, Adjusted EBITDA and Adjusted EBITDA at ECRC a) Reflects the storm related charge at our Belpre, Ohio facility, which is recorded in cost of goods sold. b) Includes other professional fees and severance expenses, which are primarily recorded in selling, general and administrative exp enses. c) Reflects the impairment of long - lived assets, of which $3.4 million and $2.0 million were associated with the HSBC facility and other lon g - term assets, respectively . d) Reflects the non - recurring portion of the $6.1 million of aggregate turnaround costs in 2013. The adjustment relates to the pro duction downtime at our Belpre, Ohio facility, in preparation for the installation of natural gas boilers to replace the coal - burning boilers required by the MACT legislation, wh ich is recorded in cost of goods sold. e) Adjusted EBITDA at estimated current replacement cost (ECRC) is Adjusted EBITDA net of the impact of the spread between the FIFO basis of accounting and ECRC. Although we report our financial results using the FIFO basis of accounting, as part of our pricing strategy, we measure our business per for mance using the estimated current replacement cost of our inventory and cost of goods sold. In addition, volatility in the cost of raw materials affects our results of operatio ns and the period - over - period comparability of our results of operations. Therefore, we provide the spread between FIFO and ECRC, and we present Adjusted EBITDA at ECRC as another supp lem ental measure of our performance. We believe this additional adjustment provides helpful information to investors, securities analysts and other interested partie s in evaluating period - over - period comparisons of our performance. $ in Thousands 19 Three months ended Three months ended Three months ended 9/30/2013 6/30/2013 9/30/2012 Net income (loss) attributable to Kraton $ (5,598) $ 3,829 $ (15,499) Net income ( loss) attributable to noncontrolling interest (254) 148 - Consolidated net income (loss) (5,852) 3,977 (15,499) Add: Interest expense, net 5,741 5,909 7,634 Income tax expense (benefit) 2,021 905 (1,640) Depreciation and amortization expenses 15,814 15,741 16,109 EBITDA $ 17,724 $ 26,532 $ 6,604 EBITDA $ 17,724 $ 26,532 $ 6,604 Add ( deduct): Storm related charges (a) - - (336) Restructuring and other charges (b) 1,041 1,124 - Non - cash compensation expense 1,833 2,007 1,508 Impairment of long - lived assets (c) - - 5,434 Production downtime related to MACT legislation (d) 3,506 - - Adjusted EBITDA $ 24,104 $ 29,663 $ 13,210 Add: Spread between FIFO and ECRC $ 20,650 $ 2,304 $ 37,636 Adjusted EBITDA at ECRC (e) $ 44,754 $ 31,967 $ 50,846

KRATON Third Quarter 2013 Earnings Call Reconciliation of Net Income (Loss) Attributable to Kraton to EBITDA, Adjusted EBITDA and Adjusted EBITDA at ECRC a) Reflects the benefit of the LBI settlement, which is recorded in cost of goods sold. b) Reflects a charge associated with the resolution of the property tax dispute in France, of which $5,646 is recorded in cost o f g oods sold and $565 is recorded in selling, general and administrative expenses. c) Reflects the storm related charge at our Belpre, Ohio facility, which is recorded in cost of goods sold. d) Includes other professional fees, severance expenses and fees associated with the public offering of our senior notes, which are primarily recorded in selling, general and administrative expenses in 2013 and primarily in cost of goods sold in 2012. e) Reflects the impairment of long - lived assets, of which $3.4 million and $2.0 million were associated with the HSBC facility and other long - term assets, respectively. f) Reflects the non - recurring portion of the $6.1 million of aggregate turnaround costs in 2013. The adjustment relates to the pro duction downtime at our Belpre, Ohio facility, in preparation for the installation of natural gas boilers to replace the coal - burning boilers required by the MACT legislation, which is recorded in cost of goods sol d . g) Adjusted EBITDA at estimated current replacement cost (ECRC) is Adjusted EBITDA net of the impact of the spread between the FIFO basis of accounting and ECRC. Although we report our financial results using the FIFO basis of accounting, as part of our pricing strategy, we measure our business performance using the estimated curren t r eplacement cost of our inventory and cost of goods sold. In addition, volatility in the cost of raw materials affects our results of operations and the period - over - period comparability of our results of operation s. Therefore, we provide the spread between FIFO and ECRC, and we present Adjusted EBITDA at ECRC as another supplemental measure of our performance. We believe this additional adjustment provides he lpf ul information to investors, securities analysts and other interested parties in evaluating period - over - period comparisons of our performance. $ in Thousands 20 Nine months ended Nine months ended 9/30/2013 9/30/2012 Net income (loss) attributable to Kraton $ (5,517) $ 13,261 Net loss attributable to noncontrolling interest (182) - Consolidated net income (loss) (5,699) 13,261 Add: Interest expense, net 24,948 22,106 Income tax expense 4,372 4,361 Depreciation and amortization expenses 46,653 47,843 EBITDA $ 70,274 $ 87,571 EBITDA $ 70,274 $ 87,571 Add ( deduct): Settlement gain (a) - (6,819) Property tax dispute (b) - 6,211 Storm related charges (c) - 2,481 Restructuring and other charges (d) 2,302 1,062 Non - cash compensation expense 6,362 5,245 Impairment of long - lived assets (e) - 5,434 Production downtime related to MACT legislation (f) 3,506 - Adjusted EBITDA $ 82,444 $ 101,185 Add: Spread between FIFO and ECRC $ 23,461 $ 20,297 Adjusted EBITDA at ECRC (g) $ 105,905 $ 121,482
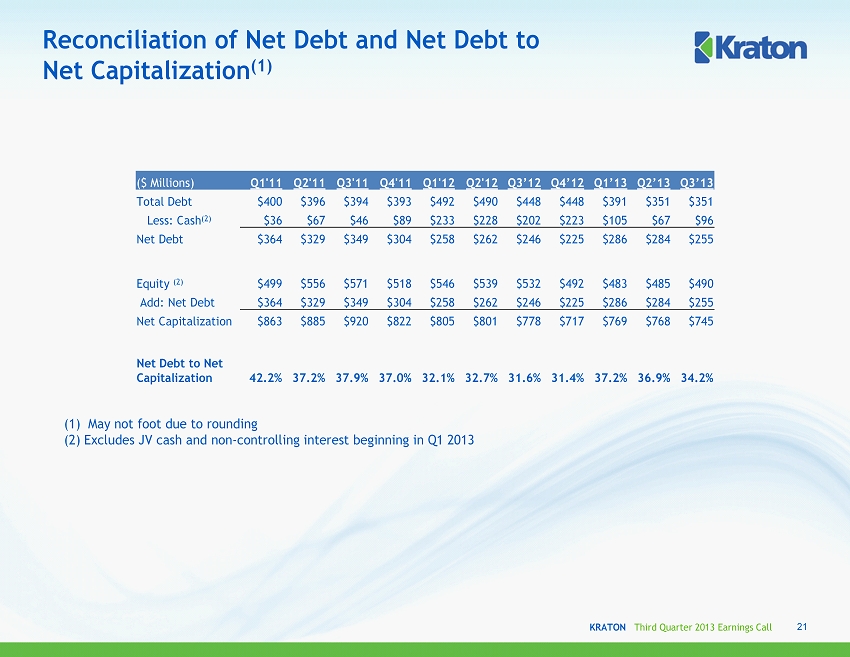
KRATON Third Quarter 2013 Earnings Call Reconciliation of Net Debt and Net Debt to Net Capitalization (1) 21 ($ Millions) Q1'11 Q2'11 Q3'11 Q4'11 Q1'12 Q2'12 Q3’12 Q4’12 Q1’13 Q2’13 Q3’13 Total Debt $400 $396 $394 $393 $492 $490 $448 $448 $391 $351 $351 Less: Cash (2) $36 $67 $46 $89 $233 $228 $202 $223 $105 $67 $96 Net Debt $364 $329 $349 $304 $258 $262 $246 $225 $286 $284 $255 Equity (2) $499 $556 $571 $518 $546 $539 $532 $492 $483 $485 $490 Add: Net Debt $364 $329 $349 $304 $258 $262 $246 $225 $286 $284 $255 Net Capitalization $863 $885 $920 $822 $805 $801 $778 $717 $769 $768 $745 Net Debt to Net Capitalization 42.2% 37.2% 37.9% 37.0% 32.1% 32.7% 31.6% 31.4% 37.2% 36.9% 34.2% (1) May not foot due to rounding (2) Excludes JV cash and non - controlling interest beginning in Q1 2013

KRATON Third Quarter 2013 Earnings Call Reconciliation of Gross Profit to Gross Profit at Estimated Current Replacement Cost 22 (1) G ross Profit at ECRC is gross profit net of the impact of the spread between the FIFO basis of accounting and ECRC. Although we report our financial results using the FIFO basis of accounting, as part of our pricing strategy, we measure our business performance using the estimated cur rent replacement cost of our inventory and cost of goods sold. In addition, volatility in the cost of raw materials affects our results of operations and the period - over - period comparability of our results of operations. Therefore, we provide Gross Profit at ECRC as another supplemental measure of our performance. We believe this adjustment provides helpful information to investors, securities analysts and other interested parties in the evaluating period - over - period comparisons of our performance. ($ Millions, except Gross Profit/Ton) Q1'08 Q2'08 Q3'08 Q4'08 Q1'09 Q2'09 Q3'09 Q4'09 Q1'10 Q2'10 Q3'10 Q4'10 Sales Volume (Kilotons) 76.8 94.2 89.6 52.6 47.1 71.4 80.9 61 72.9 86.2 80.9 67.1 Gross Profit @ FIFO $48.8 $62.6 $94.5 $49.0 $8.9 $35.8 $70.0 $60.9 $69.1 $89.1 $82.9 $59.4 FIFO to ECRC ($5.2) ($11.9) ($22.3) $2.3 $34.3 ($9.3) ($12.8) ($13.3) ($7.3) ($14.7) $1.7 $8.1 Gross Profit @ ECRC (1) $43.6 $50.6 $72.1 $51.3 $43.3 $45.1 $57.2 $47.6 $61.9 $74.4 $84.6 $67.5 Gross Profit/Ton @ECRC $568 $537 $805 $976 $918 $632 $707 $781 $849 $863 $1,046 $1,005 Gross Profit/Ton @ FIFO $636 $664 $1,054 $932 $190 $501 $865 $998 $949 $1,034 $1,024 $885 ($ Millions, except Gross Profit/Ton) Q1'11 Q2'11 Q3'11 Q4'11 Q1'12 Q2'12 Q3'12 Q4’12 Q1’13 Q2’13 Q3’13 Sales Volume (Kilotons) 81.3 82.3 77.6 61.9 89.6 77.2 79.3 67.2 78.2 77.5 83.5 Gross Profit @ FIFO $86.9 $108.4 $101.5 $19.5 $75.5 $73.5 $42.8 $39.7 $59.9 $59.9 $47.5 FIFO to ECRC ($21.0) ($49.8) ($32.1) $36.6 ($3.4) ($14.0) $37.6 $10.2 $0.5 $2.3 $20.7 Gross Profit @ ECRC (1) $65.8 $58.6 $69.4 $56.1 $72.1 $59.5 $80.4 $49.9 $60.4 $62.2 $68.1 Gross Profit/Ton @ECRC $810 $712 $894 $907 $805 $771 $1,014 $743 $772 $802 $858 Gross Profit/Ton @ FIFO $1,068 $1,318 $1,308 $315 $842 $952 $539 $590 $766 $773 $610
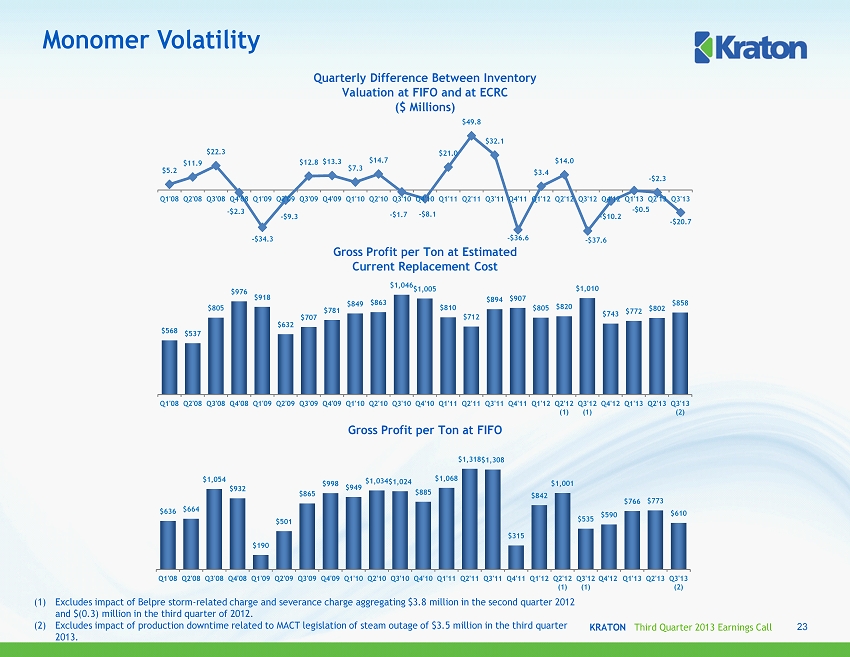
KRATON Third Quarter 2013 Earnings Call $5.2 $11.9 $22.3 - $2.3 - $34.3 - $9.3 $12.8 $13.3 $7.3 $14.7 - $1.7 - $8.1 $21.0 $49.8 $32.1 - $36.6 $3.4 $14.0 - $37.6 - $10.2 - $0.5 - $2.3 - $20.7 Q1'08 Q2'08 Q3'08 Q4'08 Q1'09 Q2'09 Q3'09 Q4'09 Q1'10 Q2'10 Q3'10 Q4'10 Q1'11 Q2'11 Q3'11 Q4'11 Q1'12 Q2'12 Q3'12 Q4'12 Q1'13 Q2'13 Q3'13 Monomer Volatility Quarterly Difference Between Inventory Valuation at FIFO and at ECRC ($ Millions) Gross Profit per Ton at Estimated Current Replacement Cost Gross Profit per Ton at FIFO 23 (1) Excludes impact of Belpre storm - related charge and severance charge aggregating $3.8 million in the second quarter 2012 and $(0.3) million in the third quarter of 2012. (2) Excludes impact of production downtime related to MACT legislation of steam outage of $3.5 million in the third quarter 2013. $636 $664 $1,054 $932 $190 $501 $865 $998 $949 $1,034 $1,024 $885 $1,068 $1,318 $1,308 $315 $842 $1,001 $535 $590 $766 $773 $610 Q1'08 Q2'08 Q3'08 Q4'08 Q1'09 Q2'09 Q3'09 Q4'09 Q1'10 Q2'10 Q3'10 Q4'10 Q1'11 Q2'11 Q3'11 Q4'11 Q1'12 Q2'12 (1) Q3'12 (1) Q4'12 Q1'13 Q2'13 Q3'13 (2) $568 $537 $805 $976 $918 $632 $707 $781 $849 $863 $1,046 $1,005 $810 $712 $894 $907 $805 $820 $1,010 $743 $772 $802 $858 Q1'08 Q2'08 Q3'08 Q4'08 Q1'09 Q2'09 Q3'09 Q4'09 Q1'10 Q2'10 Q3'10 Q4'10 Q1'11 Q2'11 Q3'11 Q4'11 Q1'12 Q2'12 (1) Q3'12 (1) Q4'12 Q1'13 Q2'13 Q3'13 (2)
KRATON PERFORMANCE POLYMERS, INC. THIRD QUARTER 2013 EARNINGS CONFERENCE CALL October 31, 2013