KRATON PERFORMANCE POLYMERS, INC. FIRST QUARTER 2014 EARNINGS CONFERENCE CALL April 30, 2014
KRATON First Quarter 2014 Earnings Call This presentation includes forward - looking statements that reflect our plans, beliefs, expectations and current views with respect to, among other things, future events and financial performance. Forward - looking statements are often characterized by the use of wo rds such as “outlook,” “believes,” “estimates,” “expects,” “projects,” “may,” “intends,” “plans” or “anticipates,” or by discussi ons of strategy, plans or intentions, including statements expected timing of closing the combination with LCY; and the matters described under the captions “Outlook .” and “Selected Estimates”. All forward - looking statements in this presentation are made based on management's current expectations and estimates, which involve known and unknown risks, uncertainties and other important factors that could cause actual results to differ material ly from those expressed in forward - looking statements. These risks and uncertainties are more fully described in our latest Annual Repor t on Form 10 - K, including but not limited to “Part I, Item 1A. Risk Factors” and “Part I, Item 7. Management’s Discussion and Analysi s of Financial Condition and Results of Operations” therein, and in our other filings with the Securities and Exchange Commission, an d include, but are not limited to, risks related to: material regulatory conditions to closing the combination with LCY; busine ss uncertainties and contractual restrictions while the proposed LCY combination is pending; failure to successfully combine wit h t he SBC business of LCY in the expected timeframe; failure to complete the LCY combination; significant delays in completing the LCY combination; inability to realize the benefits we anticipate from the proposed redomestication of our company from Delaware to the United Kingdom; our expectations regarding the startup of our semi - works facility in Belpre, Ohio and its role in future innova tion programs; conditions in the global economy and capital markets; declines in raw material costs; our reliance on LyondellBasell Industries for the provision of significant operating and other services; the failure of our raw materials suppliers to perfo rm their obligations under long - term supply agreements, or our inability to replace or renew these agreements when they expire; limitatio ns in the availability of raw materials we need to produce our products in the amounts or at the prices necessary for us to effecti vel y and profitably operate our business; competition in our end - use markets, from other producers of SBCs and from producers of products that can be substituted for our products; our ability to produce and commercialize technological innovations; our ability to pro tect our intellectual property, on which our business is substantially dependent; hazards inherent to the chemical manufacturing busin ess ; other risks, factors and uncertainties described in this press release and our other reports and documents; and other factors of which we are currently unaware or deem immaterial. Readers are cautioned not to place undue reliance on forward - looking statements. Forward - looking statements speak only as of the date they are made, and we assume no obligation to update such information in li ght of new information or future events. Forward - Looking Statement Disclaimer 2
KRATON First Quarter 2014 Earnings Call GAAP Disclaimer This presentation includes the use of both GAAP and non - GAAP financial measures. The non - GAAP financial measures are EBITDA, Adjusted EBITDA, Adjusted EBITDA at ECRC, Gross Profit at ECRC and Adjusted Net Income (or earnings per share). Tables included in th is presentation reconcile each of these non - GAAP financial measures with the most directly comparable GAAP financial measure. For additional information on the impact of the spread between the FIFO basis of accounting and ECRC, see Management’s Discussion an d Analysis of Financial Condition and Results of Operations in our Annual Report on Form 10 - K for the year ended December 31, 2013. We consider these non - GAAP financial measures important supplemental measures of our performance and believe they are frequently used by investors, securities analysts and other interested parties in the evaluation of our performance including, period - to - period comparisons and/or that of other companies in our industry. Further, management uses these measures to evaluate operating performance, a nd our incentive compensation plan bases incentive compensation payments on our Adjusted EBITDA at ECRC, along with other factors. These non - GAAP financial measures have limitations as analytical tools and in some cases can vary substantially from other measu res of our performance. You should not consider them in isolation, or as a substitute for analysis of our results under GAAP in the Un ite d States. For EBITDA, these limitations include: EBITDA does not reflect our cash expenditures, or future requirements for capital expendi tur es or contractual commitments; EBITDA does not reflect changes in, or cash requirements for, our working capital needs; EBITDA does no t reflect the significant interest expense, or the cash requirements necessary to service interest or principal payments, on our debt; alt hough depreciation and amortization are non - cash charges, the assets being depreciated and amortized will often have to be replaced in the future, and EBITDA does not reflect any cash requirements for such replacements; EBITDA calculations under the terms of our d ebt agreements may vary from EBITDA presented herein, and our presentation of EBITDA herein is not for purposes of assessing comp lia nce or non - compliance with financial covenants under our debt agreements; and other companies in our industry may calculate EBITDA diff erently than we do, limiting its usefulness as a comparative measure; and EBITDA is not a measure of discretionary cash available to us to invest in the growth of our business. As an analytical tool, Adjusted EBITDA is subject to all the limitations applicable to EBITDA. I n a ddition, we prepare Adjusted EBITDA by adjusting EBITDA to eliminate the impact of a number of items we do not consider indicative of our on - going performance, but you should be aware that in the future we may incur expenses similar to the adjustments in this presentation . As an analytical tool, Adjusted EBITDA at ECRC is subject to all the limitations applicable to EBITDA, as well as the following lim ita tions: due to volatility in raw material prices, Adjusted EBITDA at ECRC may, and often does, vary substantially from EBITDA and other perf orm ance measures, including net income calculated in accordance with GAAP; and Adjusted EBITDA at ECRC may, and often will, vary sig nif icantly from EBITDA calculations under the terms of our debt agreements and should not be used for assessing compliance or non - complianc e with financial covenants under our debt agreements. Because of these and other limitations, EBITDA, Adjusted EBITDA and ECRC Adjus ted EBITDA should not be considered as a measure of discretionary cash available to us to invest in the growth of our business. As a measure of our performance, Gross Profit at ECRC is limited because it often varies substantially from gross profit calculated in accord anc e with GAAP due to volatility in raw material prices. Finally, we prepare Adjusted Net Income by adjusting net income to eliminate the i mpa ct of a number of items we do not consider indicative of our on - going performance. Our presentation of non - GAAP financial measures and the adjustments made therein should not be construed as an inference that our future results will be unaffected by unusual or non - re curring items, and in the future we may incur expenses or charges similar to the adjustments made in the presentation of our non - GAAP fi nancial measures. 3

KRATON First Quarter 2014 Earnings Call First Quarter 2014 Financial Summary ( $ millions, except volume and per share data) Q1’14 Q1’13 Change Sales volume (kT) 74.4 78.2 (4.9)% Sales revenue $ 311.7 $ 340.1 $ (28.5) Net loss attributable to Kraton $ (7.9) $ (3.7) $ (4.2) Net loss per diluted share (1) $ (0.24) $ (0.12) $ (0.12) Adjusted income per diluted share (1) $ 0.46 $ 0.07 $ 0.39 Adjusted EBITDA at ECRC (1) $ 37.5 $ 29.2 $ 8.3 4 (1) See Non - GAAP reconciliations included on page 12 and in the appendix to this presentation.
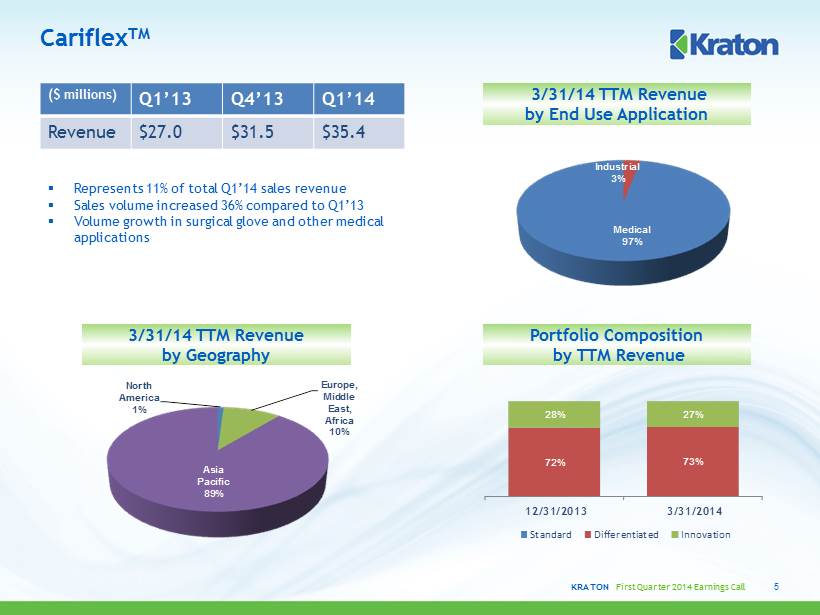
KRATON First Quarter 2014 Earnings Call Industrial 3% Medical 97% North America 1% Europe, Middle East, Africa 10% Asia Pacific 89% 72% 73% 28% 27% 12/31/2013 3/31/2014 Standard Differentiated Innovation Cariflex TM 5 3/31/14 TTM Revenue by End Use Application ( $ millions) Q1’13 Q4’13 Q1’14 Revenue $27.0 $31.5 $35.4 ▪ Represents 11% of total Q1’14 sales revenue ▪ Sales volume increased 36% compared to Q1’13 ▪ Volume growth in surgical glove and other medical applications 3/31/14 TTM Revenue by Geography Portfolio Composition by TTM Revenue
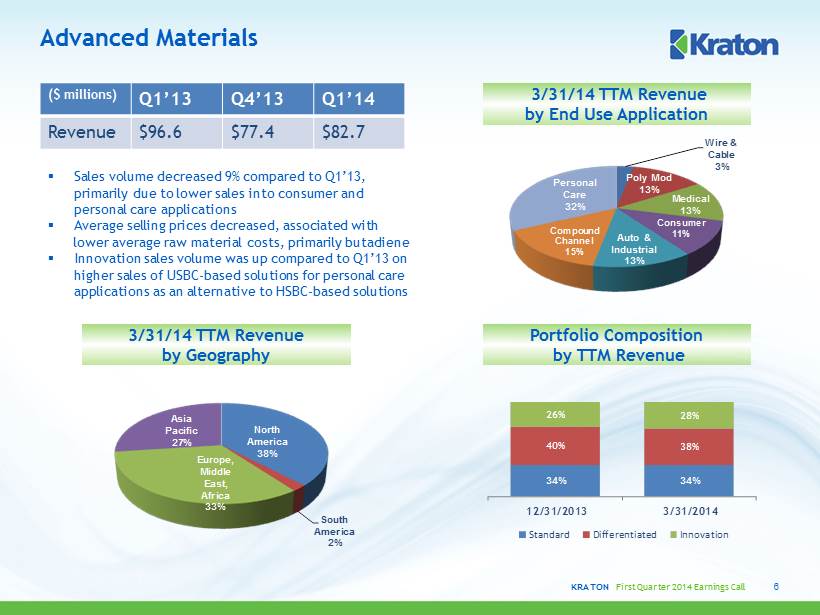
KRATON First Quarter 2014 Earnings Call Wire & Cable 3% Poly Mod 13% Medical 13% Consumer 11% Auto & Industrial 13% Compound Channel 15% Personal Care 32% North America 38% South America 2% Europe, Middle East, Africa 33% Asia Pacific 27% 34% 34% 40% 38% 26% 28% 12/31/2013 3/31/2014 Standard Differentiated Innovation Advanced Materials 6 ▪ Sales volume decreased 9% compared to Q1’13, primarily due to lower sales into consumer and personal care applications ▪ Average selling prices decreased, associated with lower average raw material costs, primarily butadiene ▪ Innovation sales volume was up compared to Q1’13 on higher sales of USBC - based solutions for personal care applications as an alternative to HSBC - based solutions ( $ millions) Q1’13 Q4’13 Q1’14 Revenue $96.6 $77.4 $82.7 3/31/14 TTM Revenue by End Use Application 3/31/14 TTM Revenue by Geography Portfolio Composition by TTM Revenue
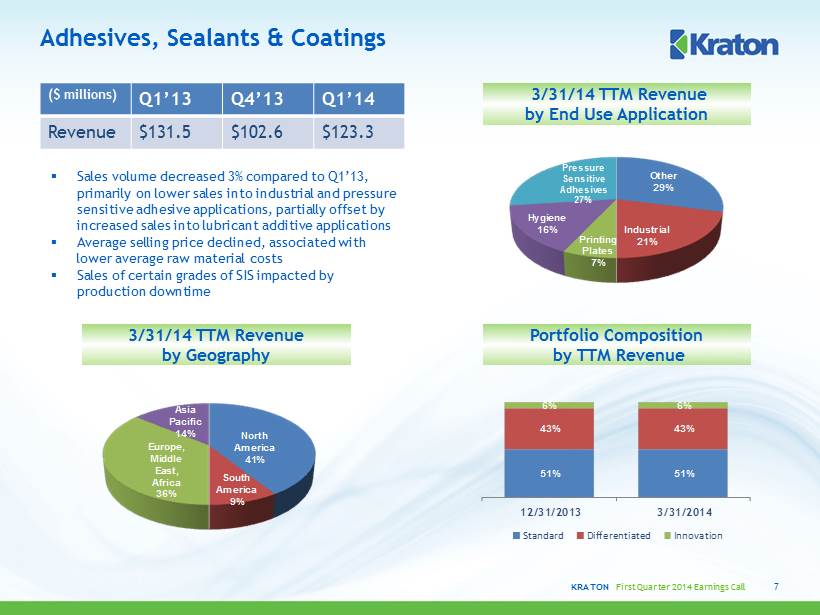
KRATON First Quarter 2014 Earnings Call Other 29% Industrial 21% Printing Plates 7% Hygiene 16% Pressure Sensitive Adhesives 27% North America 41% South America 9% Europe, Middle East, Africa 36% Asia Pacific 14% 51% 51% 43% 43% 6% 6% 12/31/2013 3/31/2014 Standard Differentiated Innovation Adhesives, Sealants & Coatings 7 ▪ Sales volume decreased 3% compared to Q1’13, primarily on lower sales into industrial and pressure sensitive adhesive applications, partially offset by increased sales into lubricant additive applications ▪ Average selling price declined, associated with lower average raw material costs ▪ Sales of certain grades of SIS impacted by production downtime ( $ millions) Q1’13 Q4’13 Q1’14 Revenue $131.5 $102.6 $123.3 3/31/14 TTM Revenue by End Use Application 3/31/14 TTM Revenue by Geography Portfolio Composition by TTM Revenue
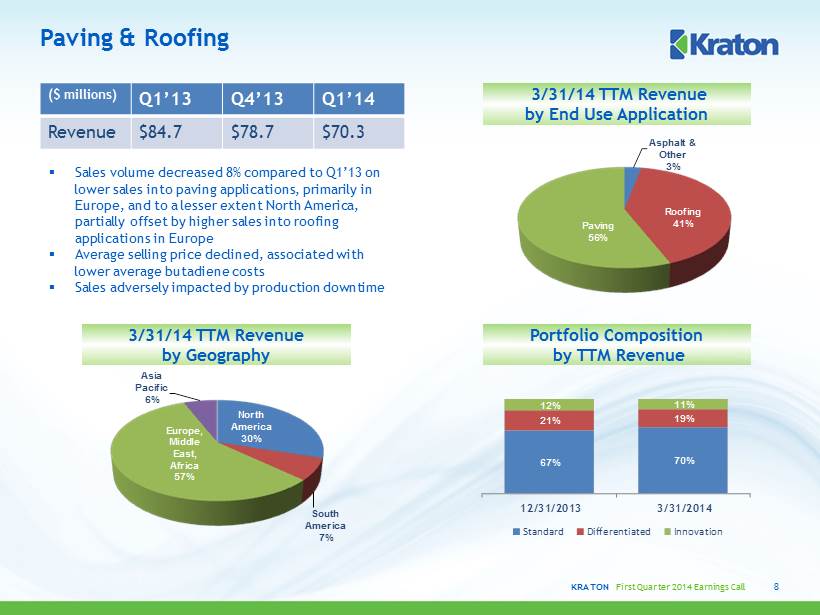
KRATON First Quarter 2014 Earnings Call North America 30% South America 7% Europe, Middle East, Africa 57% Asia Pacific 6% Asphalt & Other 3% Roofing 41% Paving 56% 67% 70% 21% 19% 12% 11% 12/31/2013 3/31/2014 Standard Differentiated Innovation Paving & Roofing 8 ▪ Sales volume decreased 8% compared to Q1’13 on lower sales into paving applications, primarily in Europe, and to a lesser extent North America, partially offset by higher sales into roofing applications in Europe ▪ Average selling price declined, associated with lower average butadiene costs ▪ Sales adversely impacted by production downtime ( $ millions) Q1’13 Q4’13 Q1’14 Revenue $84.7 $78.7 $70.3 3/31/14 TTM Revenue by Geography 3/31/14 TTM Revenue by End Use Application Portfolio Composition by TTM Revenue
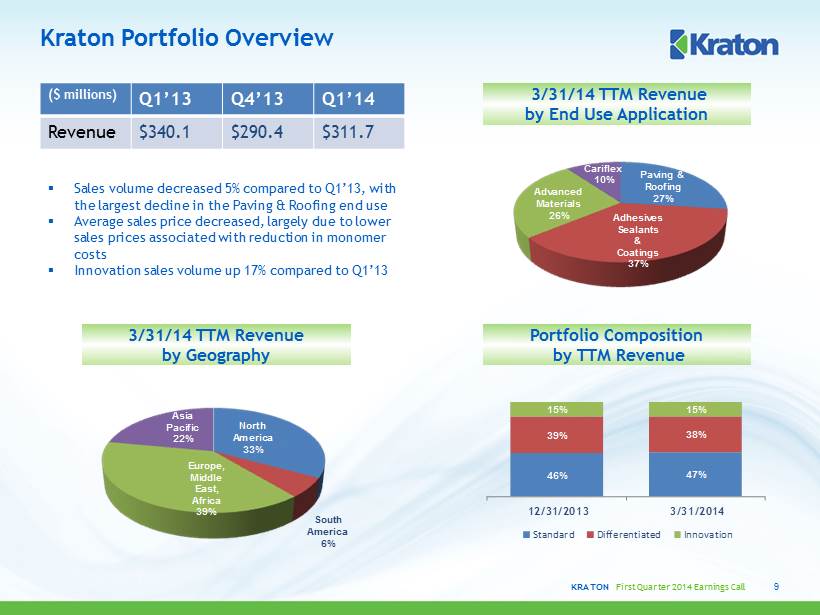
KRATON First Quarter 2014 Earnings Call North America 33% South America 6% Europe, Middle East, Africa 39% Asia Pacific 22% Paving & Roofing 27% Adhesives Sealants & Coatings 37% Advanced Materials 26% Cariflex 10% 46% 47% 39% 38% 15% 15% 12/31/2013 3/31/2014 Standard Differentiated Innovation Kraton Portfolio Overview 9 ▪ Sales volume decreased 5% compared to Q1’13, with the largest decline in the Paving & Roofing end use ▪ Average sales price decreased, largely due to lower sales prices associated with reduction in monomer costs ▪ Innovation sales volume up 17 % compared to Q1’13 ( $ millions) Q1’13 Q4’13 Q1’14 Revenue $340.1 $290.4 $311.7 3/31/14 TTM Revenue by End Use Application 3/31/14 TTM Revenue by Geography Portfolio Composition by TTM Revenue
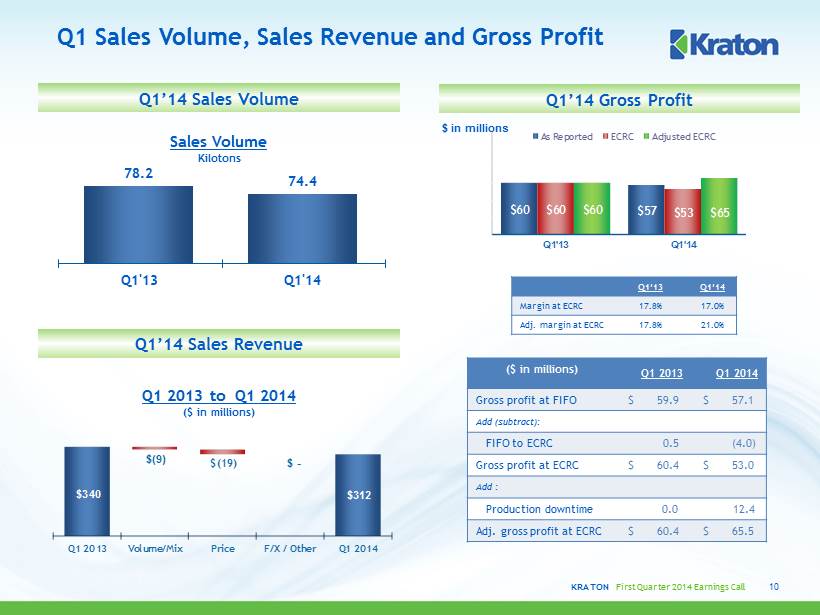
KRATON First Quarter 2014 Earnings Call 78.2 74.4 40 60 80 100 120 140 Q1'13 Q1'14 Sales Volume Kilotons Q1 Sales Volume, Sales Revenue and Gross Profit 10 Q1 2013 to Q1 2014 ($ in millions) Q1’14 Sales Volume Q1’14 Sales Revenue $60 $57 $60 $53 $60 $65 0 20 40 60 80 100 120 Q1'13 Q1'14 As Reported ECRC Adjusted ECRC Q1’13 Q1’14 Margin at ECRC 17.8% 17.0% Adj. margin at ECRC 17.8% 21.0% Q1’14 Gross Profit ($ in millions) Q1 2013 Q1 2014 Gross profit at FIFO $ 59.9 $ 57.1 Add (subtract): FIFO to ECRC 0.5 (4.0) Gross profit at ECRC $ 60.4 $ 53.0 Add : Production downtime 0.0 12.4 Adj. gross profit at ECRC $ 60.4 $ 65.5 $ in millions $340 $312 $(9) $(19) $ - Q1 2013 Volume/Mix Price F/X / Other Q1 2014
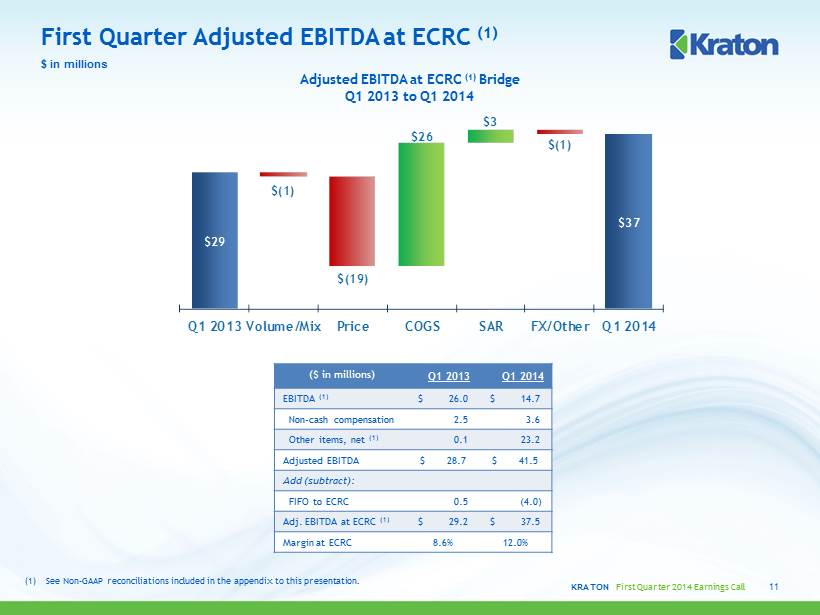
KRATON First Quarter 2014 Earnings Call First Quarter Adjusted EBITDA at ECRC (1) $ in millions 11 Adjusted EBITDA at ECRC (1) Bridge Q1 2013 to Q1 2014 ($ in millions) Q1 2013 Q1 2014 EBITDA (1) $ 26.0 $ 14.7 Non - cash compensation 2.5 3.6 Other items, net (1) 0.1 23.2 Adjusted EBITDA $ 28.7 $ 41.5 Add (subtract): FIFO to ECRC 0.5 (4.0) Adj. EBITDA at ECRC (1) $ 29.2 $ 37.5 Margin at ECRC 8.6% 12.0% $29 $37 $(1) $(19) $26 $3 $(1) Q1 2013 Volume/Mix Price COGS SAR FX/Other Q1 2014 (1) See Non - GAAP reconciliations included in the appendix to this presentation.

KRATON First Quarter 2014 Earnings Call Reconciliation of Net Loss and Loss Per Diluted Share to Adjusted Net Income and Adjusted Earnings per Diluted Share 12 $ in thousands except per share data a) Severance expenses, which are primarily recorded in cost of goods sold for 2014 and selling, general and administrative expen ses for 2013. b) In 2014, primarily professional fees, related to our proposed combination with the styrenic block copolymer operations of LCY Chemical Corp., which are recorded in se lling, general and administrative expenses . c) Production downtime at our Belpre, Ohio and Berre , France facilities, of which $12.4 million is recorded in costs of goods sold and $0.6 million is recorded in selling, gener al and administrative expenses. d) Startup costs related to the joint venture company, Kraton Formosa Polymers Corporation, which are recorded in selling, general and a dm inistrative expenses. e) Reflects interest expense related to the termination and settlement of an interest rate swap agreement in connection with the re financing of our credit facility. f) Reflects interest expense related to the write - off of unamortized debt issuance costs in connection with the refinancing of our credit facility. g) The spread between the FIFO basis of accounting and the estimated current replacement cost basis (“ECRC”) increased earnings pe r diluted share and adjusted earnings per diluted share by $0.12 in the first quarter 2014 and decreased earnings per diluted share and adjusted earnings per diluted share by $0.02 in the first quarter 2013. Per Diluted Per Diluted After Tax Share After Tax Share Net loss attributable to Kraton and loss per diluted share (g) (7,909)$ (0.24)$ (3,748)$ (0.12)$ Restructuring and other charges (a) 422$ 0.01$ 55$ -$ Transaction and acquisition related costs (b) 9,236$ 0.28$ 81$ -$ Production downtime (c) 13,013$ 0.40$ -$ -$ Asia JV (d) 381$ 0.01$ -$ -$ Settlement of interest rate swap (e) -$ -$ 697$ 0.02$ Write-off of debt issuance cost (f) -$ -$ 5,023$ 0.16$ Adjusted net income and adjusted earnings per diluted share (g) 15,143$ 0.46$ 2,108$ 0.07$ Three Months Three Months March 31, 2014 March 31, 2013

KRATON First Quarter 2014 Earnings Call $ in millions ▪ ABL availability at March 31, 2014 of $213.3 million and total liquidity of $255.9 million ▪ Net debt (1) of $312 million at 3/31/14 ▪ Net debt to net capitalization (1) was 37.9% at 3/31/14 ▪ Net Debt (1) to TTM Adjusted EBITDA was 2.5x at 3/31/14 Cash Flow and Balance Sheet 13 March 31, 2014 March 31, 2013 EBITDA (1) $14.7 $26.0 Interest (12.2) (14.7) Taxes (2.3) (4.6) Working capital & other (53.8) (27.5) Operating cash flow (53.6) (20.8) Investing activities (21.2) (17.4) Free cash flow (74.8) (38.2) JV funding from FPCC 0.0 15.2 Financing (2.9) (60.6) Currency (0.8) (3.4) Change in cash (78.6) (87.1) Beginning cash $175.9 $223.2 Ending cash $97.3 $136.1 Three Months Ended Note: May not foot due to rounding (1) See Non - GAAP reconciliations included in the appendix to this presentation.

KRATON First Quarter 2014 Earnings Call Selected 2014 Estimates (1) (1) Management's estimates. These estimates are forward - looking statements and speak only as of April 30, 2014. Management assumes no obligation to update these estimates in light of new information or future events. (2) Excludes transaction costs and expenses related to the proposed combination with the SBC business of LCY Chemical Corp. which we currently expect to be $15 - $28 million. 14 Research & development ~ $35 million SG&A ~$103 million (2) Depreciation and amortization ~ $65 million Interest expense ~ $25 million 2014 tax provision ~$7 million Capex $75 - $80 million Q2’14 positive spread between FIFO and ECRC ~ $6 million Q1 ’14 Q2’14 Q3’14 Q4’14 2014 Turnaround costs $0.8 $2.3 $2.9 $4.0 $10.0
APPENDIX April 30, 2014
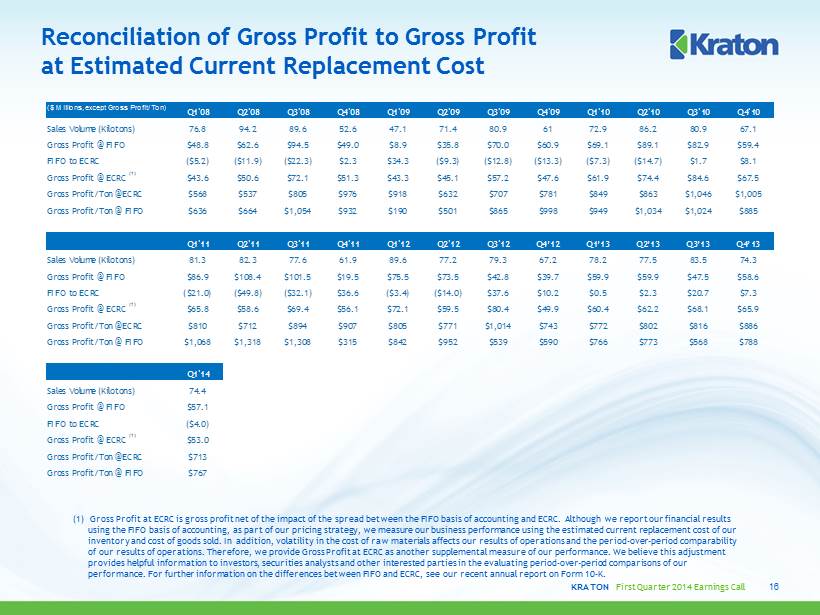
KRATON First Quarter 2014 Earnings Call Reconciliation of Gross Profit to Gross Profit at Estimated Current Replacement Cost 16 (1) G ross Profit at ECRC is gross profit net of the impact of the spread between the FIFO basis of accounting and ECRC. Although we report our financial results using the FIFO basis of accounting, as part of our pricing strategy, we measure our business performance using the estimated cur rent replacement cost of our inventory and cost of goods sold. In addition, volatility in the cost of raw materials affects our results of operations and the period - over - period comparability of our results of operations. Therefore, we provide Gross Profit at ECRC as another supplemental measure of our performance. We believe this adjustment provides helpful information to investors, securities analysts and other interested parties in the evaluating period - over - period comparisons of our performance. For further information on the differences between FIFO and ECRC, see our recent annual report on Form 10 - K. ($ Millions, except Gross Profit/Ton) Q1'08 Q2'08 Q3'08 Q4'08 Q1'09 Q2'09 Q3'09 Q4'09 Q1'10 Q2'10 Q3'10 Q4'10 Sales Volume (Kilotons) 76.8 94.2 89.6 52.6 47.1 71.4 80.9 61 72.9 86.2 80.9 67.1 Gross Profit @ FIFO $48.8 $62.6 $94.5 $49.0 $8.9 $35.8 $70.0 $60.9 $69.1 $89.1 $82.9 $59.4 FIFO to ECRC ($5.2) ($11.9) ($22.3) $2.3 $34.3 ($9.3) ($12.8) ($13.3) ($7.3) ($14.7) $1.7 $8.1 Gross Profit @ ECRC (1) $43.6 $50.6 $72.1 $51.3 $43.3 $45.1 $57.2 $47.6 $61.9 $74.4 $84.6 $67.5 Gross Profit/Ton @ECRC $568 $537 $805 $976 $918 $632 $707 $781 $849 $863 $1,046 $1,005 Gross Profit/Ton @ FIFO $636 $664 $1,054 $932 $190 $501 $865 $998 $949 $1,034 $1,024 $885 Q1'11 Q2'11 Q3'11 Q4'11 Q1'12 Q2'12 Q3'12 Q4’12 Q1’13 Q2’13 Q3’13 Q4’13 Sales Volume (Kilotons) 81.3 82.3 77.6 61.9 89.6 77.2 79.3 67.2 78.2 77.5 83.5 74.3 Gross Profit @ FIFO $86.9 $108.4 $101.5 $19.5 $75.5 $73.5 $42.8 $39.7 $59.9 $59.9 $47.5 $58.6 FIFO to ECRC ($21.0) ($49.8) ($32.1) $36.6 ($3.4) ($14.0) $37.6 $10.2 $0.5 $2.3 $20.7 $7.3 Gross Profit @ ECRC (1) $65.8 $58.6 $69.4 $56.1 $72.1 $59.5 $80.4 $49.9 $60.4 $62.2 $68.1 $65.9 Gross Profit/Ton @ECRC $810 $712 $894 $907 $805 $771 $1,014 $743 $772 $802 $816 $886 Gross Profit/Ton @ FIFO $1,068 $1,318 $1,308 $315 $842 $952 $539 $590 $766 $773 $568 $788 Q1'14 Sales Volume (Kilotons) 74.4 Gross Profit @ FIFO $57.1 FIFO to ECRC ($4.0) Gross Profit @ ECRC (1) $53.0 Gross Profit/Ton @ECRC $713 Gross Profit/Ton @ FIFO $767
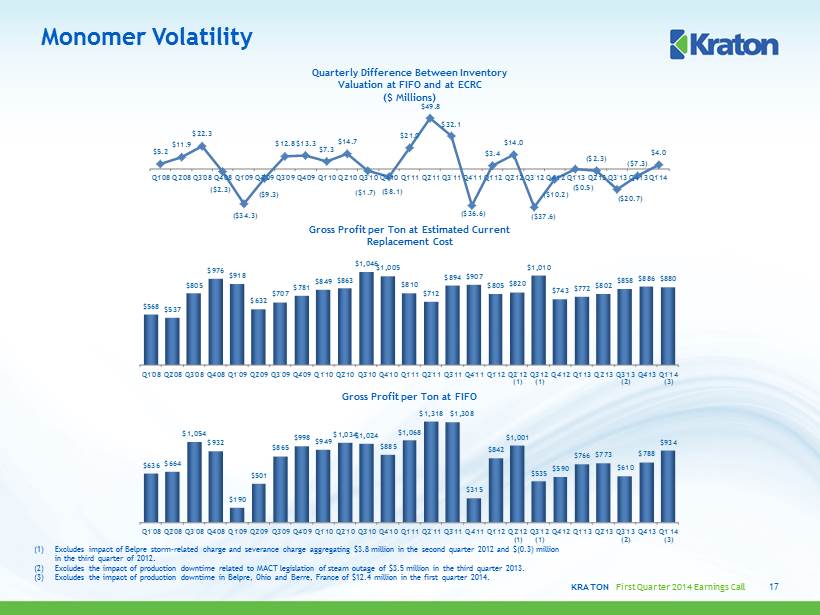
KRATON First Quarter 2014 Earnings Call Monomer Volatility Quarterly Difference Between Inventory Valuation at FIFO and at ECRC ($ Millions) Gross Profit per Ton at Estimated Current Replacement Cost Gross Profit per Ton at FIFO 17 (1) Excludes impact of Belpre storm - related charge and severance charge aggregating $3.8 million in the second quarter 2012 and $(0. 3) million in the third quarter of 2012. (2) Excludes the impact of production downtime related to MACT legislation of steam outage of $3.5 million in the third quarter 2 013 . (3) Excludes the impact of production downtime in Belpre, Ohio and Berre , France of $12.4 million in the first quarter 2014. $5.2 $11.9 $22.3 ($2.3) ($34.3) ($9.3) $12.8 $13.3 $7.3 $14.7 ($1.7) ($8.1) $21.0 $49.8 $32.1 ($36.6) $3.4 $14.0 ($37.6) ($10.2) ($0.5) ($2.3) ($20.7) ($7.3) $4.0 Q1'08 Q2'08 Q3'08 Q4'08 Q1'09 Q2'09 Q3'09 Q4'09 Q1'10 Q2'10 Q3'10 Q4'10 Q1'11 Q2'11 Q3'11 Q4'11 Q1'12 Q2'12 Q3'12 Q4'12 Q1'13 Q2'13 Q3'13 Q4'13 Q1'14 $568 $537 $805 $976 $918 $632 $707 $781 $849 $863 $1,046 $1,005 $810 $712 $894 $907 $805 $820 $1,010 $743 $772 $802 $858 $886 $880 Q1'08 Q2'08 Q3'08 Q4'08 Q1'09 Q2'09 Q3'09 Q4'09 Q1'10 Q2'10 Q3'10 Q4'10 Q1'11 Q2'11 Q3'11 Q4'11 Q1'12 Q2'12 (1) Q3'12 (1) Q4'12 Q1'13 Q2'13 Q3'13 (2) Q4'13 Q1'14 (3) $636 $664 $1,054 $932 $190 $501 $865 $998 $949 $1,034 $1,024 $885 $1,068 $1,318 $1,308 $315 $842 $1,001 $535 $590 $766 $773 $610 $788 $934 Q1'08 Q2'08 Q3'08 Q4'08 Q1'09 Q2'09 Q3'09 Q4'09 Q1'10 Q2'10 Q3'10 Q4'10 Q1'11 Q2'11 Q3'11 Q4'11 Q1'12 Q2'12 (1) Q3'12 (1) Q4'12 Q1'13 Q2'13 Q3'13 (2) Q4'13 Q1'14 (3)
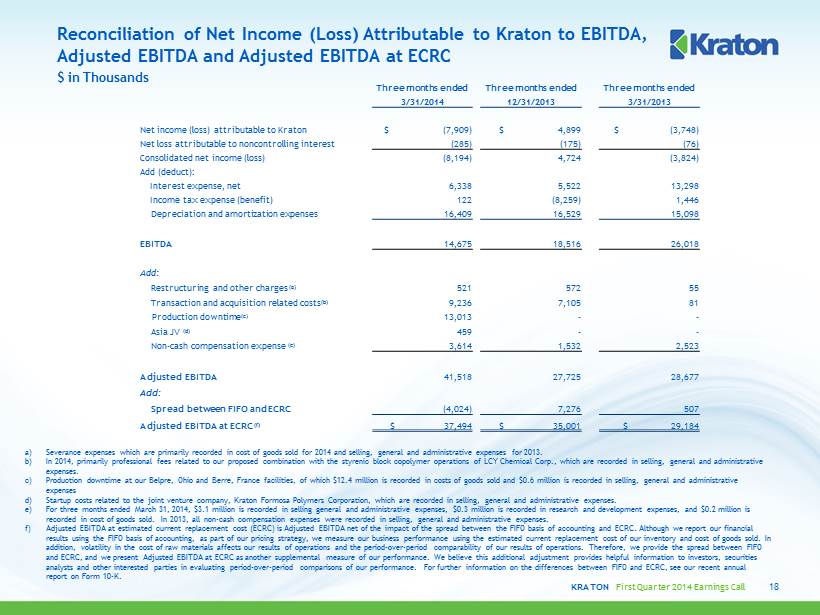
KRATON First Quarter 2014 Earnings Call Reconciliation of Net Income (Loss) Attributable to Kraton to EBITDA, Adjusted EBITDA and Adjusted EBITDA at ECRC a) Severance expenses which are primarily recorded in cost of goods sold for 2014 and selling, general and administrative expenses for 2013. b) In 2014, primarily professional fees related to our proposed combination with the styrenic block copolymer operations of LCY Chemical Corp., which are recorded in se lling, general and administrative expenses . c) Production downtime at our Belpre, Ohio and Berre , France facilities, of which $12.4 million is recorded in costs of goods sold and $0.6 million is recorded in selling, gener al and administrative expenses d) Startup costs related to the joint venture company, Kraton Formosa Polymers Corporation, which are recorded in selling, gener al and administrative expenses. e) For three months ended March 31, 2014, $3.1 million is recorded in selling general and administrative expenses, $0.3 million is recorded in research and development expenses, and $0.2 million is recorded in cost of goods sold. In 2013, all non - cash compensation expenses were recorded in selling, general and administrativ e expenses. f) Adjusted EBITDA at estimated current replacement cost (ECRC) is Adjusted EBITDA net of the impact of the spread between the FIFO basis of accounting and ECRC. Although we report our financial results using the FIFO basis of accounting, as part of our pricing strategy, we measure our business performance using the es tim ated current replacement cost of our inventory and cost of goods sold. In addition, volatility in the cost of raw materials affects our results of operations and the period - over - period comparability of our results of operations. Therefore, we provide the spread between FIFO and ECRC, and we present Adjusted EBITDA at ECRC as another supplemental measure of our performance. We believe this addition al adjustment provides helpful information to investors, securities analysts and other interested parties in evaluating period - over - period comparisons of our performance. For further information on the differences between FIFO and ECRC, see our recent annual report on Form 10 - K . $ in Thousands 18 Three months ended Three months ended Three months ended 3/31/2014 12/31/2013 3/31/2013 Net income (loss) attributable to Kraton $ (7,909) $ 4,899 $ (3,748) Net loss attributable to noncontrolling interest (285) (175) (76) Consolidated net income (loss) (8,194) 4,724 (3,824) Add (deduct): Interest expense, net 6,338 5,522 13,298 Income tax expense (benefit) 122 (8,259) 1,446 Depreciation and amortization expenses 16,409 16,529 15,098 EBITDA 14,675 18,516 26,018 Add: Restructuring and other charges (a) 521 572 55 Transaction and acquisition related costs (b) 9,236 7,105 81 Production downtime (c) 13,013 - - Asia JV (d) 459 - - Non - cash compensation expense (e) 3,614 1,532 2,523 Adjusted EBITDA 41,518 27,725 28,677 Add: Spread between FIFO and ECRC (4,024) 7,276 507 Adjusted EBITDA at ECRC (f) $ 37,494 $ 35,001 $ 29,184
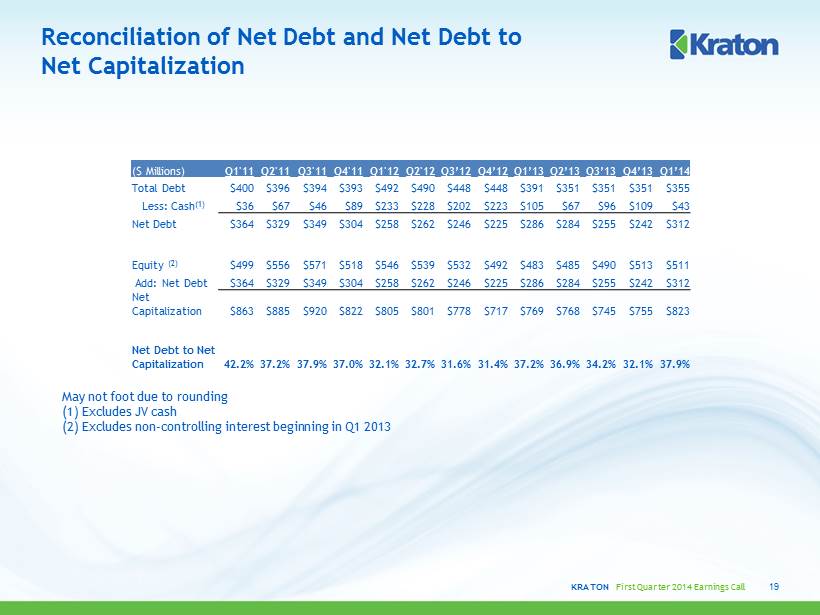
KRATON First Quarter 2014 Earnings Call Reconciliation of Net Debt and Net Debt to Net Capitalization 19 ($ Millions) Q1'11 Q2'11 Q3'11 Q4'11 Q1'12 Q2'12 Q3’12 Q4’12 Q1’13 Q2’13 Q3’13 Q4’13 Q1’14 Total Debt $400 $396 $394 $393 $492 $490 $448 $448 $391 $351 $351 $351 $355 Less: Cash (1) $36 $67 $46 $89 $233 $228 $202 $223 $105 $67 $96 $109 $43 Net Debt $364 $329 $349 $304 $258 $262 $246 $225 $286 $284 $255 $242 $312 Equity (2) $499 $556 $571 $518 $546 $539 $532 $492 $483 $485 $490 $513 $511 Add: Net Debt $364 $329 $349 $304 $258 $262 $246 $225 $286 $284 $255 $242 $312 Net Capitalization $863 $885 $920 $822 $805 $801 $778 $717 $769 $768 $745 $755 $823 Net Debt to Net Capitalization 42.2% 37.2% 37.9% 37.0% 32.1% 32.7% 31.6% 31.4% 37.2% 36.9% 34.2% 32.1% 37.9% May not foot due to rounding (1) Excludes JV cash (2) Excludes non - controlling interest beginning in Q1 2013

KRATON PERFORMANCE POLYMERS, INC. FIRST QUARTER 2014 EARNINGS CONFERENCE CALL April 30, 2014