Exhibit 99.1

KRATON PERFORMANCE POLYMERS, INC. SECOND QUARTER 2014 EARNINGS CONFERENCE CALL July 31, 2014

KRATON Second Quarter 2014 Earnings Call This presentation includes forward - looking statements that reflect our plans, beliefs, expectations and current views with respect to, among other things, future events and financial performance. Forward - looking statements are often characterized by the use of wo rds such as “outlook,” “believes,” “estimates,” “expects,” “projects,” “may,” “intends,” “plans” or “anticipates,” or by discussi ons of strategy, plans or intentions, including statements regarding expected transaction costs and expenses related to the proposed combination with LCY and the matters described under the captions “Outlook .” and “Selected 2014 Estimates”. All forward - looking statements in this presentation are made based on management's current expectations and estimates, which involve known and unknown risks, uncertainties and other important factors that could cause actual results to differ material ly from those expressed in forward - looking statements. These risks and uncertainties are more fully described in our latest Annual Repor t on Form 10 - K, including but not limited to “Part I, Item 1A. Risk Factors” and “Part I, Item 7. Management’s Discussion and Analysi s of Financial Condition and Results of Operations” therein, and in our other filings with the Securities and Exchange Commission, an d include, but are not limited to, risks related to: material regulatory conditions to closing the combination with LCY; busine ss uncertainties and contractual restrictions while the proposed LCY combination is pending; failure to successfully combine wit h t he SBC business of LCY in the expected timeframe; failure to complete the LCY combination; significant delays in completing the LCY combination; inability to realize the benefits we anticipate from the proposed redomestication of our company from Delaware to the United Kingdom; our expectations regarding the startup of our semi - works facility in Belpre, Ohio and its role in future innova tion programs; conditions in the global economy and capital markets; declines in raw material costs; our reliance on LyondellBasell Industries for the provision of significant operating and other services; the failure of our raw materials suppliers to perfo rm their obligations under long - term supply agreements, or our inability to replace or renew these agreements when they expire; limitatio ns in the availability of raw materials we need to produce our products in the amounts or at the prices necessary for us to effecti vel y and profitably operate our business; competition in our end - use markets, from other producers of SBCs and from producers of products that can be substituted for our products; our ability to produce and commercialize technological innovations; our ability to pro tect our intellectual property, on which our business is substantially dependent; hazards inherent to the chemical manufacturing busin ess ; other risks, factors and uncertainties described in this presentation and our other reports and documents; and other factors of which we are currently unaware or deem immaterial. Readers are cautioned not to place undue reliance on forward - looking statements. Forward - looking statements speak only as of the date they are made, and we assume no obligation to update such information in li ght of new information or future events. Forward - Looking Statement Disclaimer 2

KRATON Second Quarter 2014 Earnings Call GAAP Disclaimer This presentation includes the use of both GAAP and non - GAAP financial measures. The non - GAAP financial measures are EBITDA, Adjusted EBITDA, Adjusted EBITDA at ECRC, Gross Profit at ECRC, Adjusted Gross Profit at ECRC and Adjusted Net Income (or earnings per share). Tables included in this presentation reconcile each of these non - GAAP financial measures with the most directly comparable GAAP financial measure. For additional information on the impact of the spread between the FIFO basis of accounting and ECRC, see Management’s Discus sio n and Analysis of Financial Condition and Results of Operations in our Annual Report on Form 10 - K for the year ended December 31, 2013. We consider these non - GAAP financial measures to be important supplemental measures of our performance and believe they are frequently used by investors, securities analysts and other interested parties in the evaluation of our performance including, period - to - period comparisons and/or that of other companies in our industry. Further, management uses these measures to evaluate operating performance, and our inc entive compensation plan bases incentive compensation payments on our Adjusted EBITDA at ECRC performance, along with other factors. We consider these non - GAAP financial measures to be important supplemental measures of our performance and believe they are freq uently used by investors, securities analysts and other interested parties in the evaluation of our performance including period - to - period c omparisons and/or that of other companies in our industry. Further, management uses these measures to evaluate operating performance, and our inc entive compensation plan bases incentive compensation payments on our Adjusted EBITDA at ECRC performance, along with other factors. T hese non - GAAP financial measures have limitations as analytical tools and in some cases can vary substantially from other measures of our performance. You should not consider them in isolation, or as a substitute for analysis of our results under GAAP in the United States. F or EBITDA, these limitations include: EBITDA does not reflect the significant interest expense on our debt; EBITDA does not reflect the significant depreciation an d amortization expense associated with our long - lived assets; EBITDA included herein should not be used for purposes of assessing compliance or non - compliance with financial covenants under our debt agreements. The calculation of EBITDA in the debt agreements includes ad justments, such as extraordinary, non - recurring or one - time charges, proforma cost savings, certain non - cash items, turnaround costs, and other items included in the definition of EBITDA in the debt agreements; and other companies in our industry may calculate EBITDA differe ntl y than we do, limiting its usefulness as a comparative measure. As an analytical tool, Adjusted EBITDA is subject to all the limitations applicable to EBITDA. In addition, we prepare Adjusted EBITDA by adjusting EBITDA to eliminate the impact of a number of items we do not consider indi cat ive of our on - going performance, but you should be aware that in the future we may incur expenses similar to the adjustments in this presen tat ion. Our presentation of Adjusted EBITDA should not be construed as an inference that our future results will be unaffected by unusual or non - recurring items. As an analytical tool, Adjusted EBITDA at ECRC is subject to all the limitations applicable to EBITDA, as well as the followi ng limitations: due to volatility in raw material prices, Adjusted EBITDA at ECRC may, and often does, vary substantially from EBITDA and oth er performance measures, including net income calculated in accordance with U.S. GAAP; and Adjusted EBITDA at ECRC may, and often will, var y s ignificantly from EBITDA calculations under the terms of our debt agreements and should not be used for assessing compliance or non - complianc e with financial covenants under our debt agreements. Because of these and other limitations, EBITDA, Adjusted EBITDA and ECRC Adjus ted EBITDA should not be considered as a measure of discretionary cash available to us to invest in the growth of our business. As a me asu re of our performance, Gross Profit at ECRC and Adjusted Gross Profit at ECRC are limited because they often vary substantially from gross profit calculated in accordance with U.S. GAAP due to volatility in raw material prices. Finally, we prepare Adjusted Net Income by ad justing net income to eliminate the impact of a number of items we do not consider indicative of our on - going performance. Our presentation of non - GAAP financial measures and the adjustments made therein should not be construed as an inference that our future results will be u naf fected by unusual or non - recurring items, and in the future we may incur expenses or charges similar to the adjustments made in the presen tation of our non - GAAP financial measures. 3

KRATON Second Quarter 2014 Earnings Call Second Quarter 2014 Financial Summary ( $ millions, except volume and per share data) Q2’14 Q2’13 Change Sales volume (kT) 78.4 77.5 1.2% Sales revenue $ 323.8 $ 334.5 $ (10.8) Net income attributable to Kraton $ 11.1 $ 3.8 $ 7.3 Earnings per diluted share (1) $ 0.33 $ 0.12 $ 0.21 Adjusted earnings per diluted share (1) $ 0.46 $ 0.15 $ 0.31 Adjusted EBITDA at ECRC (1) $ 38.6 $ 32.0 $ 6.6 4 (1) See Non - GAAP reconciliations included on page 12 and in the appendix to this presentation.
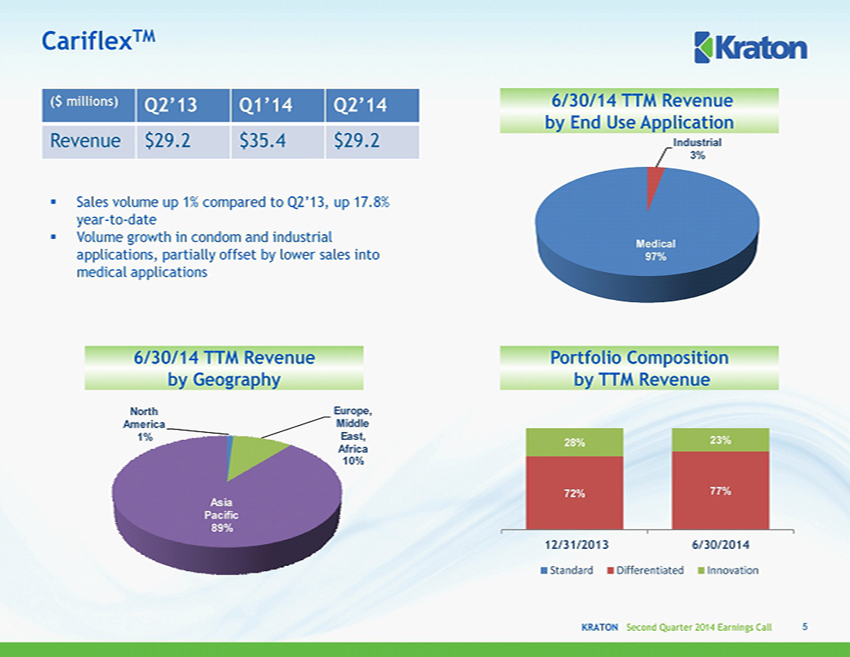
KRATON Second Quarter 2014 Earnings Call Industrial 3% Medical 97% 72% 77% 28% 23% 12/31/2013 6/30/2014 Standard Differentiated Innovation North America 1% Europe, Middle East, Africa 10% Asia Pacific 89% Cariflex TM 5 6/30/14 TTM Revenue by End Use Application ( $ millions) Q2’13 Q1’14 Q2’14 Revenue $29.2 $35.4 $29.2 ▪ Sales volume up 1% compared to Q2’13, up 17.8% year - to - date ▪ Volume growth in condom and industrial applications, partially offset by lower sales into medical applications 6/30/14 TTM Revenue by Geography Portfolio Composition by TTM Revenue
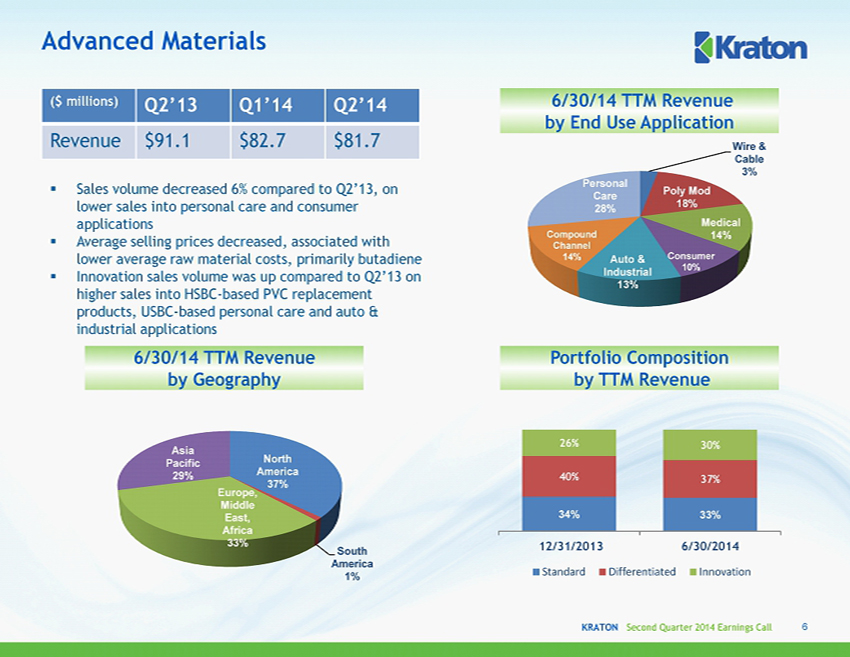
KRATON Second Quarter 2014 Earnings Call Wire & Cable 3% Poly Mod 18% Medical 14% Consumer 10% Auto & Industrial 13% Compound Channel 14% Personal Care 28% North America 37% South America 1% Europe, Middle East, Africa 33% Asia Pacific 29% 34% 33% 40% 37% 26% 30% 12/31/2013 6/30/2014 Standard Differentiated Innovation Advanced Materials 6 ▪ Sales volume decreased 6% compared to Q2’13, on lower sales into personal care and consumer applications ▪ Average selling prices decreased, associated with lower average raw material costs, primarily butadiene ▪ Innovation sales volume was up compared to Q2’13 on higher sales into HSBC - based PVC replacement products, USBC - based personal care and auto & industrial applications ( $ millions) Q2’13 Q1’14 Q2’14 Revenue $91.1 $82.7 $81.7 6/30/14 TTM Revenue by End Use Application 6/30/14 TTM Revenue by Geography Portfolio Composition by TTM Revenue

KRATON Second Quarter 2014 Earnings Call Other 37% Industrial 14% Printing Plates 8% Hygiene 15% Pressure Sensitive Adhesives 26% 51% 51% 43% 44% 6% 5% 12/31/2013 6/30/2014 Standard Differentiated Innovation North America 41% South America 9% Europe, Middle East, Africa 36% Asia Pacific 14% Adhesives, Sealants & Coatings 7 ▪ Sales volume increased 6% compared to Q2’13, due to higher sales into lubricant additive, industrial, printing plate and sealant & caulk applications ▪ Average selling price declined, associated with lower average raw material costs ( $ millions) Q2’13 Q1’14 Q2’14 Revenue $126.0 $123.3 $128.2 6/30/14 TTM Revenue by End Use Application 6/30/14 TTM Revenue by Geography Portfolio Composition by TTM Revenue
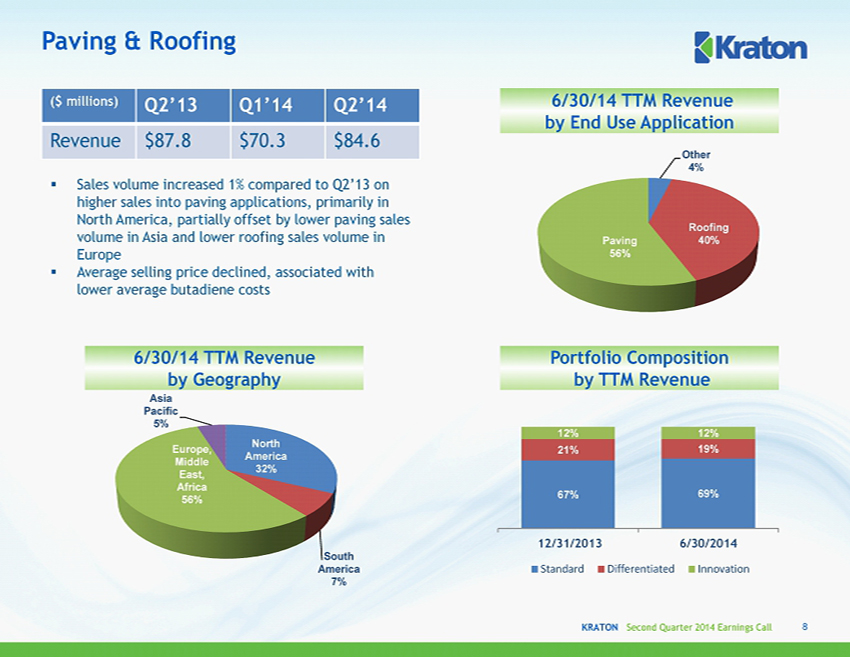
KRATON Second Quarter 2014 Earnings Call 67% 69% 21% 19% 12% 12% 12/31/2013 6/30/2014 Standard Differentiated Innovation Other 4% Roofing 40% Paving 56% North America 32% South America 7% Europe, Middle East, Africa 56% Asia Pacific 5% Paving & Roofing 8 ▪ Sales volume increased 1% compared to Q2’13 on higher sales into paving applications, primarily in North America, partially offset by lower paving sales volume in Asia and lower roofing sales volume in Europe ▪ Average selling price declined, associated with lower average butadiene costs ( $ millions) Q2’13 Q1’14 Q2’14 Revenue $87.8 $70.3 $84.6 6/30/14 TTM Revenue by End Use Application 6/30/14 TTM Revenue by Geography Portfolio Composition by TTM Revenue
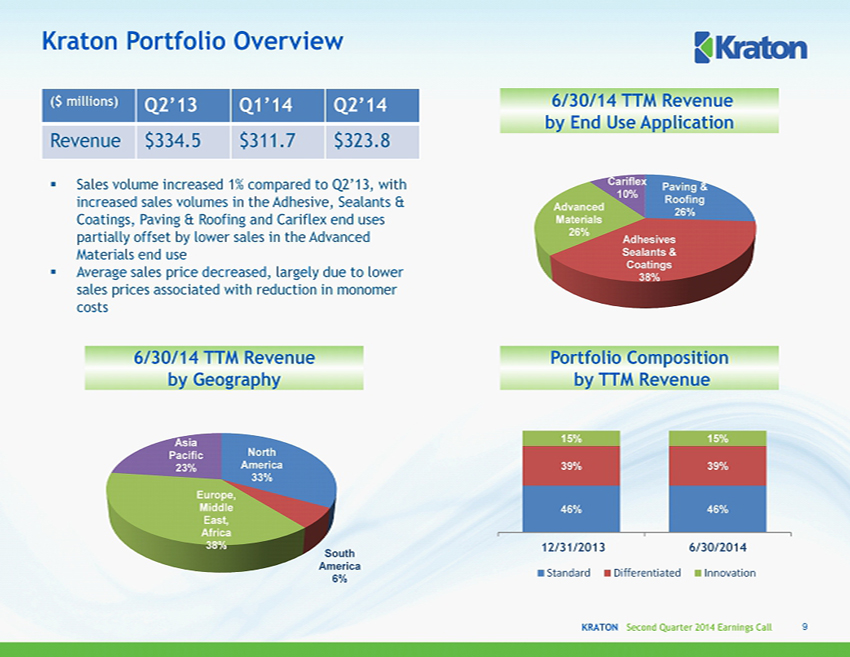
KRATON Second Quarter 2014 Earnings Call Paving & Roofing 26% Adhesives Sealants & Coatings 38% Advanced Materials 26% Cariflex 10% 46% 46% 39% 39% 15% 15% 12/31/2013 6/30/2014 Standard Differentiated Innovation North America 33% South America 6% Europe, Middle East, Africa 38% Asia Pacific 23% Kraton Portfolio Overview 9 ▪ Sales volume increased 1% compared to Q2’13, with increased sales volumes in the Adhesive, Sealants & Coatings, Paving & Roofing and Cariflex end uses partially offset by lower sales in the Advanced Materials end use ▪ Average sales price decreased, largely due to lower sales prices associated with reduction in monomer costs ( $ millions) Q2’13 Q1’14 Q2’14 Revenue $334.5 $311.7 $323.8 6/30/14 TTM Revenue by End Use Application 6/30/14 TTM Revenue by Geography Portfolio Composition by TTM Revenue

KRATON Second Quarter 2014 Earnings Call 77.5 78.4 40 60 80 100 120 140 Q2'13 Q2'14 Sales Volume Kilotons Q2 2014 Sales Volume, Sales Revenue and Gross Profit 10 Q2 2013 to Q2 2014 ($ in millions) Q2’14 Sales Volume Q2’14 Sales Revenue $60 $72 $62 $68 0 20 40 60 80 100 120 Q2'13 Q2'14 As Reported ECRC Q2’13 Q2’14 Margin at ECRC 18.6% 20.9% Q2’14 Gross Profit ($ in millions) Q2 2013 Q2 2014 Gross profit at FIFO $ 59.9 $ 72.1 Add (subtract): FIFO to ECRC 2.3 (4.3) Gross profit at ECRC $ 62.2 $ 67.8 $ in millions $335 $324 $7 $(22) $4 Q2 2013 Volume/Mix Price F/X / Other Q2 2014
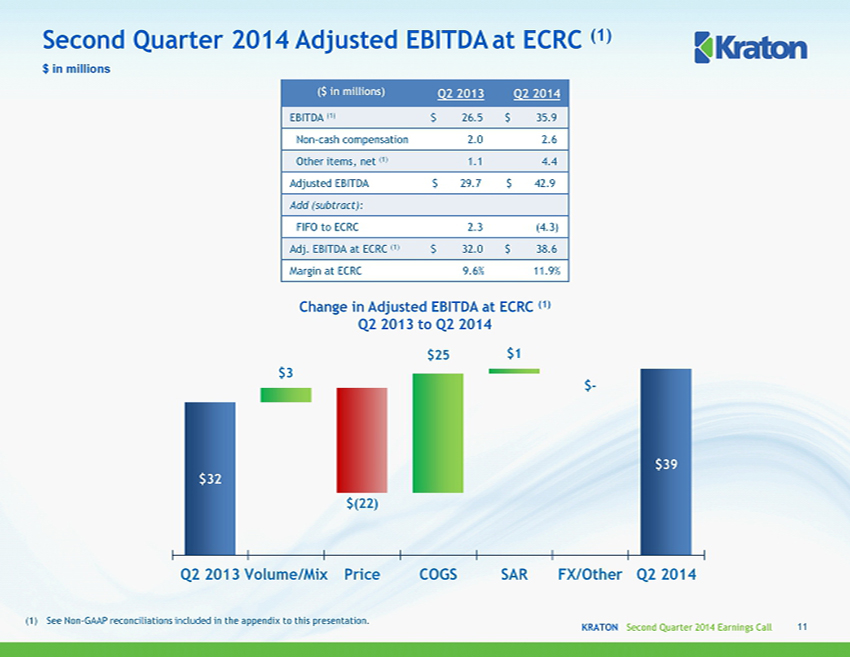
KRATON Second Quarter 2014 Earnings Call Second Quarter 2014 Adjusted EBITDA at ECRC (1) $ in millions 11 Change in Adjusted EBITDA at ECRC (1) Q2 2013 to Q2 2014 ($ in millions) Q2 2013 Q2 2014 EBITDA (1) $ 26.5 $ 35.9 Non - cash compensation 2.0 2.6 Other items, net (1) 1.1 4.4 Adjusted EBITDA $ 29.7 $ 42.9 Add (subtract): FIFO to ECRC 2.3 (4.3) Adj. EBITDA at ECRC (1) $ 32.0 $ 38.6 Margin at ECRC 9.6% 11.9% (1) See Non - GAAP reconciliations included in the appendix to this presentation. $32 $39 $3 $(22) $25 $1 $ - Q2 2013 Volume/Mix Price COGS SAR FX/Other Q2 2014
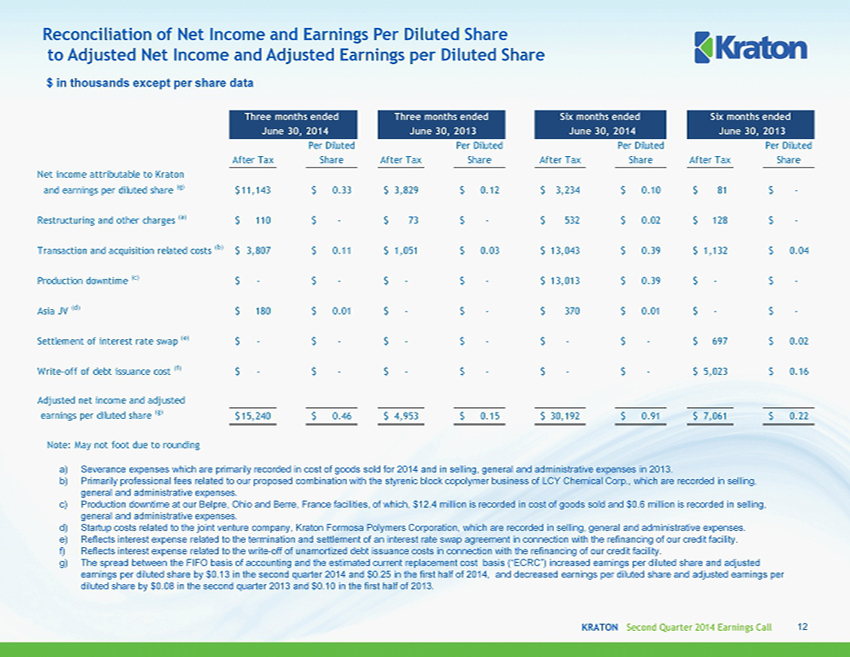
KRATON Second Quarter 2014 Earnings Call Reconciliation of Net Income and Earnings Per Diluted Share to Adjusted Net Income and Adjusted Earnings per Diluted Share 12 $ in thousands except per share data a) Severance expenses which are primarily recorded in cost of goods sold for 2014 and in selling, general and administrative exp ens es in 2013. b) Primarily professional fees related to our proposed combination with the styrenic block copolymer business of LCY Chemical Co rp. , which are recorded in selling, general and administrative expenses. c) Production downtime at our Belpre, Ohio and Berre , France facilities, of which, $12.4 million is recorded in cost of goods sold and $0.6 million is recorded in selling, general and administrative expenses. d) Startup costs related to the joint venture company, Kraton Formosa Polymers Corporation, which are recorded in selling, general and a dm inistrative expenses. e) Reflects interest expense related to the termination and settlement of an interest rate swap agreement in connection with the re financing of our credit facility. f) Reflects interest expense related to the write - off of unamortized debt issuance costs in connection with the refinancing of our credit facility. g) The spread between the FIFO basis of accounting and the estimated current replacement cost basis (“ECRC”) increased earnings pe r diluted share and adjusted earnings per diluted share by $0.13 in the second quarter 2014 and $0.25 in the first half of 2014, and decreased earnings per diluted share and adjusted earnings per diluted share by $0.08 in the second quarter 2013 and $0.10 in the first half of 2013. Six months ended Per Diluted Per Diluted Per Diluted Per Diluted After Tax Share After Tax Share After Tax Share After Tax Share Net income attributable to Kraton and earnings per diluted share (g) 11,143$ 0.33$ 3,829$ 0.12$ 3,234$ 0.10$ 81$ -$ Restructuring and other charges (a) 110$ -$ 73$ -$ 532$ 0.02$ 128$ -$ Transaction and acquisition related costs (b) 3,807$ 0.11$ 1,051$ 0.03$ 13,043$ 0.39$ 1,132$ 0.04$ Production downtime (c) -$ -$ -$ -$ 13,013$ 0.39$ -$ -$ Asia JV (d) 180$ 0.01$ -$ -$ 370$ 0.01$ -$ -$ Settlement of interest rate swap (e) -$ -$ -$ -$ -$ -$ 697$ 0.02$ Write-off of debt issuance cost (f) -$ -$ -$ -$ -$ -$ 5,023$ 0.16$ Adjusted net income and adjusted earnings per diluted share (g) 15,240$ 0.46$ 4,953$ 0.15$ 30,192$ 0.91$ 7,061$ 0.22$ Note: May not foot due to rounding June 30, 2014 June 30, 2013 June 30, 2014 June 30, 2013 Three months endedThree months ended Six months ended
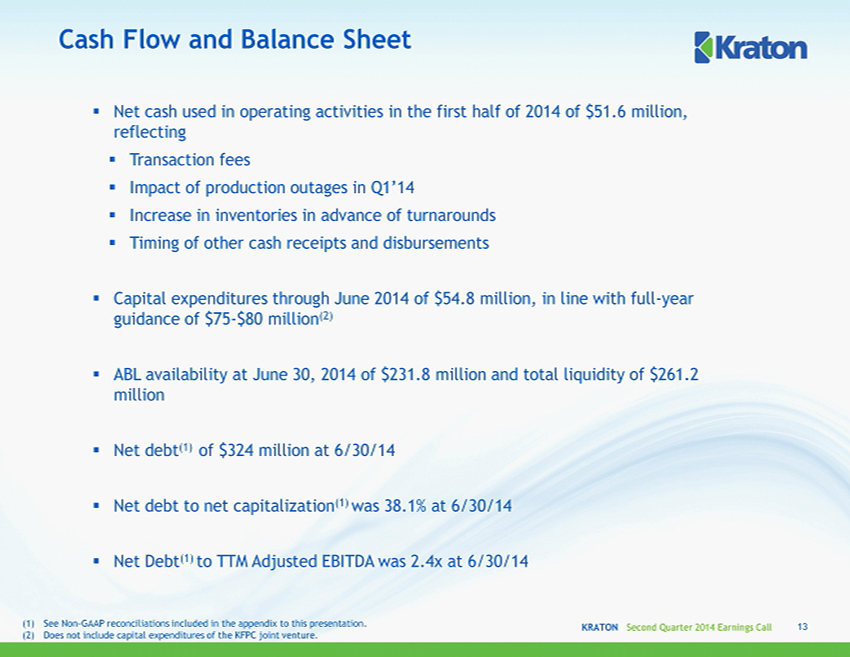
KRATON Second Quarter 2014 Earnings Call ▪ Net cash used in operating activities in the first half of 2014 of $51.6 million, reflecting ▪ Transaction fees ▪ Impact of production outages in Q1’14 ▪ Increase in inventories in advance of turnarounds ▪ Timing of other cash receipts and disbursements ▪ Capital expenditures through June 2014 of $54.8 million, in line with full - year guidance of $75 - $80 million (2) ▪ ABL availability at June 30, 2014 of $231.8 million and total liquidity of $261.2 million ▪ Net debt (1) of $324 million at 6/30/14 ▪ Net debt to net capitalization (1) was 38.1% at 6/30/14 ▪ Net Debt (1) to TTM Adjusted EBITDA was 2.4x at 6/30/14 Cash Flow and Balance Sheet 13 (1) See Non - GAAP reconciliations included in the appendix to this presentation. (2) Does not include capital expenditures of the KFPC joint venture.

KRATON Second Quarter 2014 Earnings Call Selected 2014 Estimates (1) (1) Management's estimates. These estimates are forward - looking statements and speak only as of July 31, 2014. Management assumes no obligation to update these estimates in light of new information or future events. (2) Excludes transaction costs and expenses related to the proposed combination with the SBC business of LCY Chemical Corp. which we currently expect to be $15 - $20 million. (3) Does not include capital expenditures of the KFPC joint venture. 14 Research & development ~ $34 million SG&A ~$99 million (2) Depreciation and amortization ~ $66 million Interest expense ~ $25 million 2014 tax provision ~$7 million Capex $75 - $80 million (3) Q3’14 negative spread between FIFO and ECRC ~ $1 million ($ millions) Q1 ’14 Q2’14 Q3’14 Q4’14 2014 Turnaround costs $0.8 $1.3 $3.0 $4.4 $9.6
APPENDIX July 31, 2014

KRATON Second Quarter 2014 Earnings Call Reconciliation of Gross Profit to Gross Profit at Estimated Current Replacement Cost 16 (1) G ross Profit at ECRC is gross profit net of the impact of the spread between the FIFO basis of accounting and ECRC. Although we report our financial results using the FIFO basis of accounting, as part of our pricing strategy, we measure our business performance using the estimated cur rent replacement cost of our inventory and cost of goods sold. In addition, volatility in the cost of raw materials affects our results of operations and the period - over - period comparability of our results of operations. Therefore, we provide Gross Profit at ECRC as another supplemental measure of our performance. We believe this adjustment provides helpful information to investors, securities analysts and other interested parties in the evaluating period - over - period comparisons of our performance. For further information on the differences between FIFO and ECRC, see our recent annual report on Form 10 - K. ($ Millions, except Gross Profit/Ton) Q1'08 Q2'08 Q3'08 Q4'08 Q1'09 Q2'09 Q3'09 Q4'09 Q1'10 Q2'10 Q3'10 Q4'10 Sales Volume (Kilotons) 76.8 94.2 89.6 52.6 47.1 71.4 80.9 61 72.9 86.2 80.9 67.1 Gross Profit @ FIFO $48.8 $62.6 $94.5 $49.0 $8.9 $35.8 $70.0 $60.9 $69.1 $89.1 $82.9 $59.4 FIFO to ECRC ($5.2) ($11.9) ($22.3) $2.3 $34.3 ($9.3) ($12.8) ($13.3) ($7.3) ($14.7) $1.7 $8.1 Gross Profit @ ECRC (1) $43.6 $50.6 $72.1 $51.3 $43.3 $45.1 $57.2 $47.6 $61.9 $74.4 $84.6 $67.5 Gross Profit/Ton @ECRC $568 $537 $805 $976 $918 $632 $707 $781 $849 $863 $1,046 $1,005 Gross Profit/Ton @ FIFO $636 $664 $1,054 $932 $190 $501 $865 $998 $949 $1,034 $1,024 $885 Q1'11 Q2'11 Q3'11 Q4'11 Q1'12 Q2'12 Q3'12 Q4’12 Q1’13 Q2’13 Q3’13 Q4’13 Sales Volume (Kilotons) 81.3 82.3 77.6 61.9 89.6 77.2 79.3 67.2 78.2 77.5 83.5 74.3 Gross Profit @ FIFO $86.9 $108.4 $101.5 $19.5 $75.5 $73.5 $42.8 $39.7 $59.9 $59.9 $47.5 $58.6 FIFO to ECRC ($21.0) ($49.8) ($32.1) $36.6 ($3.4) ($14.0) $37.6 $10.2 $0.5 $2.3 $20.7 $7.3 Gross Profit @ ECRC (1) $65.8 $58.6 $69.4 $56.1 $72.1 $59.5 $80.4 $49.9 $60.4 $62.2 $68.1 $65.9 Gross Profit/Ton @ECRC $810 $712 $894 $907 $805 $771 $1,014 $743 $772 $802 $816 $886 Gross Profit/Ton @ FIFO $1,068 $1,318 $1,308 $315 $842 $952 $539 $590 $766 $773 $568 $788 Q1'14 Q2'14 Sales Volume (Kilotons) 74.4 78.4 Gross Profit @ FIFO $57.1 $72.1 FIFO to ECRC ($4.0) ($4.3) Gross Profit @ ECRC (1) $53.0 $67.8 Gross Profit/Ton @ECRC $713 $865 Gross Profit/Ton @ FIFO $767 $920

KRATON Second Quarter 2014 Earnings Call $5.2 $11.9 $22.3 ($2.3) ($34.3) ($9.3) $12.8 $13.3 $7.3 $14.7 ($1.7) ($8.1) $21.0 $49.8 $32.1 ($36.6) $3.4 $14.0 ($37.6) ($10.2) ($0.5) ($2.3) ($20.7) ($7.3) $4.0 $4.3 Q1'08 Q2'08 Q3'08 Q4'08 Q1'09 Q2'09 Q3'09 Q4'09 Q1'10 Q2'10 Q3'10 Q4'10 Q1'11 Q2'11 Q3'11 Q4'11 Q1'12 Q2'12 Q3'12 Q4'12 Q1'13 Q2'13 Q3'13 Q4'13 Q1'14 Q2'14 Monomer Volatility Quarterly Difference Between Inventory Valuation at FIFO and at ECRC ($ Millions) Gross Profit per Ton at Estimated Current Replacement Cost Gross Profit per Ton at FIFO 17 (1) Excludes impact of Belpre storm - related charge and severance charge aggregating $3.8 million in the second quarter 2012 and $(0. 3) million in the third quarter of 2012. (2) Excludes the impact of production downtime related to MACT legislation of steam outage of $3.5 million in the third quarter 2 013 . (3) Excludes the impact of production downtime in Belpre, Ohio and Berre , France of $12.4 million in the first quarter 2014. $636 $664 $1,054 $932 $190 $501 $865 $998 $949 $1,034 $1,024 $885 $1,068 $1,318 $1,308 $315 $842 $1,001 $535 $590 $766 $773 $610 $788 $934 $920 Q1'08 Q2'08 Q3'08 Q4'08 Q1'09 Q2'09 Q3'09 Q4'09 Q1'10 Q2'10 Q3'10 Q4'10 Q1'11 Q2'11 Q3'11 Q4'11 Q1'12 Q2'12 (1) Q3'12 (1) Q4'12 Q1'13 Q2'13 Q3'13 (2) Q4'13 Q1'14 (3) Q2'14 $568 $537 $805 $976 $918 $632 $707 $781 $849 $863 $1,046 $1,005 $810 $712 $894 $907 $805 $820 $1,010 $743 $772 $802 $858 $886 $880 $865 Q1'08 Q2'08 Q3'08 Q4'08 Q1'09 Q2'09 Q3'09 Q4'09 Q1'10 Q2'10 Q3'10 Q4'10 Q1'11 Q2'11 Q3'11 Q4'11 Q1'12 Q2'12 (1) Q3'12 (1) Q4'12 Q1'13 Q2'13 Q3'13 (2) Q4'13 Q1'14 (3) Q2'14
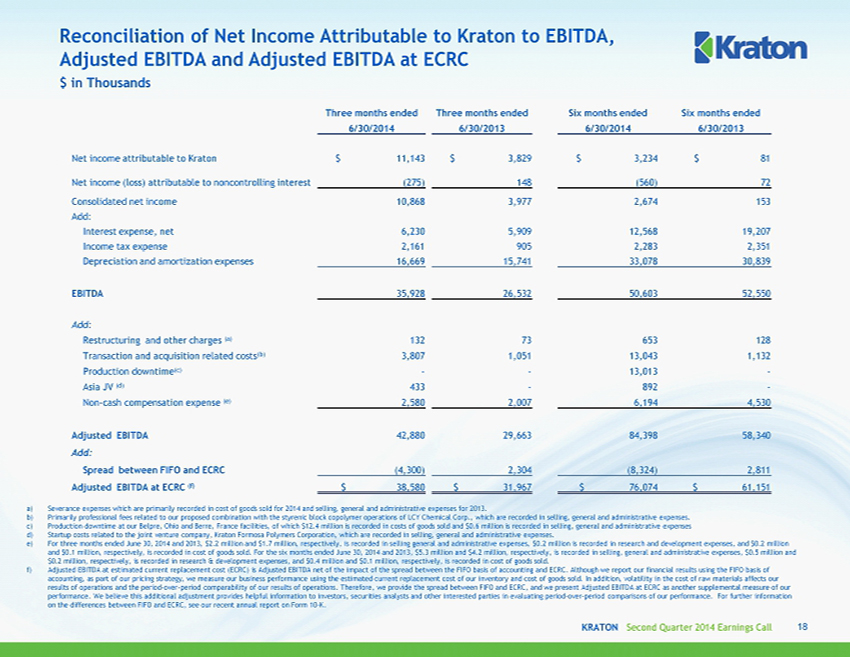
KRATON Second Quarter 2014 Earnings Call Reconciliation of Net Income Attributable to Kraton to EBITDA, Adjusted EBITDA and Adjusted EBITDA at ECRC a) Severance expenses which are primarily recorded in cost of goods sold for 2014 and selling, general and administrative expenses for 2013. b) P rimarily professional fees related to our proposed combination with the styrenic block copolymer operations of LCY Chemical Corp., which are recorded in se lling, general and administrative expenses . c) Production downtime at our Belpre, Ohio and Berre , France facilities, of which $12.4 million is recorded in costs of goods sold and $0.6 million is recorded in selling, gener al and administrative expenses d) Startup costs related to the joint venture company, Kraton Formosa Polymers Corporation, which are recorded in selling, gener al and administrative expenses. e) For three months ended June 30, 2014 and 2013, $2.2 million and $1.7 million, respectively, is recorded in selling general an d a dministrative expenses, $0.2 million is recorded in research and development expenses, and $0.2 million and $0.1 million, respectively, is recorded in cost of goods sold. For the six months ended June 30, 2014 and 2013, $5.3 mill ion and $4.2 million, respectively, is recorded in selling, general and administrative expenses, $0.5 million and $0.2 million, respectively, is recorded in research & development expenses, and $0.4 million and $0.1 million, respectively, is recorded in cost of goods sold. f) Adjusted EBITDA at estimated current replacement cost (ECRC) is Adjusted EBITDA net of the impact of the spread between the FIFO basis of accounting and ECRC. Although we report our financial results using the FIFO basis of accounting, as part of our pricing strategy, we measure our business performance using the estimated current replacement cost of our inventory and cost of goods sold. In addition, volatility in the cost of raw materials affects our results of operations and the period - over - period comparability of our results of operations. Therefore, we provide the spread between FIFO and ECRC, and we present Adjusted EBITDA at ECRC as another supplemental measure of our performance. We believe this additional adjustment provides helpful information to investors, securities analysts and other i nte rested parties in evaluating period - over - period comparisons of our performance. For further information on the differences between FIFO and ECRC, see our recent annual report on Form 10 - K . $ in Thousands 18 Three months ended Three months ended Six months ended Six months ended 6/30/2014 6/30/2013 6/30/2014 6/30/2013 Net income attributable to Kraton $ 11,143 $ 3,829 $ 3,234 $ 81 Net income ( loss) attributable to noncontrolling interest (275) 148 (560) 72 Consolidated net income 10,868 3,977 2,674 153 Add: Interest expense, net 6,230 5,909 12,568 19,207 Income tax expense 2,161 905 2,283 2,351 Depreciation and amortization expenses 16,669 15,741 33,078 30,839 EBITDA 35,928 26,532 50,603 52,550 Add: Restructuring and other charges (a) 132 73 653 128 Transaction and acquisition related costs (b) 3,807 1,051 13,043 1,132 Production downtime (c) - - 13,013 - Asia JV (d) 433 - 892 - Non - cash compensation expense (e) 2,580 2,007 6,194 4,530 Adjusted EBITDA 42,880 29,663 84,398 58,340 Add: Spread between FIFO and ECRC (4,300) 2,304 (8,324) 2,811 Adjusted EBITDA at ECRC (f) $ 38,580 $ 31,967 $ 76,074 $ 61,151
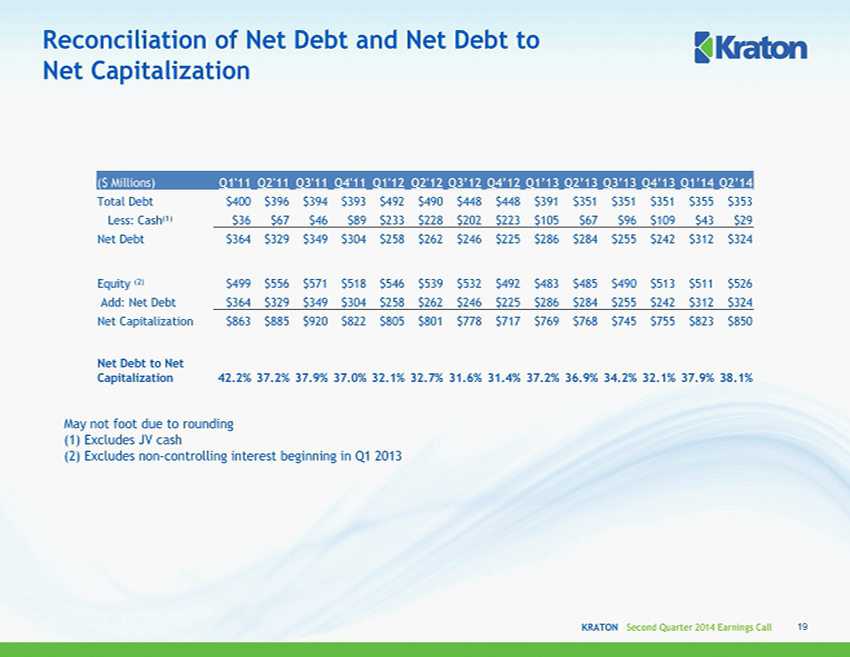
KRATON Second Quarter 2014 Earnings Call Reconciliation of Net Debt and Net Debt to Net Capitalization 19 ($ Millions) Q1'11 Q2'11 Q3'11 Q4'11 Q1'12 Q2'12 Q3’12 Q4’12 Q1’13 Q2’13 Q3’13 Q4’13 Q1’14 Q2’14 Total Debt $400 $396 $394 $393 $492 $490 $448 $448 $391 $351 $351 $351 $355 $353 Less: Cash (1) $36 $67 $46 $89 $233 $228 $202 $223 $105 $67 $96 $109 $43 $29 Net Debt $364 $329 $349 $304 $258 $262 $246 $225 $286 $284 $255 $242 $312 $324 Equity (2) $499 $556 $571 $518 $546 $539 $532 $492 $483 $485 $490 $513 $511 $526 Add: Net Debt $364 $329 $349 $304 $258 $262 $246 $225 $286 $284 $255 $242 $312 $324 Net Capitalization $863 $885 $920 $822 $805 $801 $778 $717 $769 $768 $745 $755 $823 $850 Net Debt to Net Capitalization 42.2% 37.2% 37.9% 37.0% 32.1% 32.7% 31.6% 31.4% 37.2% 36.9% 34.2% 32.1% 37.9% 38.1% May not foot due to rounding (1) Excludes JV cash (2) Excludes non - controlling interest beginning in Q1 2013
KRATON PERFORMANCE POLYMERS, INC. SECOND QUARTER 2014 EARNINGS CONFERENCE CALL July 31, 2014