Exhibit 99.1

KRATON PERFORMANCE POLYMERS, INC. THIRD QUARTER 2014 EARNINGS CONFERENCE CALL October 30, 2014
KRATON Third Quarter 2014 Earnings Call This presentation includes forward - looking statements that reflect our plans, beliefs, expectations and current views with respect to, among other things, future events and financial performance. Forward - looking statements are often characterized by the use of words such as “outlook,” “believes,” “estimates,” “expects,” “projects,” “may,” “intends,” “plans” or “anticipates ,” or by discussions of strategy, plans or intentions, including the matters described under the caption “Selected 2014 Estimates.” All forward - looking statements in this presentation are made based on management's current expectations and estimates, which involve known and unknown risks, uncertainties and other important factors that could cause actual results to differ material ly from those expressed in forward - looking statements. These risks and uncertainties are more fully described in our latest Annual Report on Form 10 - K, including but not limited to “Part I, Item 1A. Risk Factors” and “Part I, Item 7. Management’s Discussion and Analysis of Financial Condition and Results of Operations” therein, and in our other filings with the Securities and Exch ang e Commission, and include, but are not limited to, risks related to: our expectations regarding the start - up of our semi - works facility in Belpre, Ohio and its role in future innovation programs; conditions in the global economy and capital markets; declines in raw material costs; our reliance on LyondellBasell Industries for the provision of significant operating and other services; the failure of our raw materials suppliers to perform their obligations under long - term supply agreements, or our inability to replace or renew these agreements when they expire; limitations in the availability of raw materials we need to produce our products in the amounts or at the prices necessary for us to effectively and profitably operate our business; competition in our end - use markets, from other producers of SBCs and from producers of products that can be substituted for our products; our ability to produce and commercialize technological innovations; our ability to protect our intellectual property, on which our business is substantially dependent; hazards inherent to the chemical manufacturing business; other risks, factors and uncertainties described in this presentation and our other reports and documents; and other factors of which we are currently unaware or deem immaterial. Readers are cautioned not to place undue reliance on forward - looking statements. Forward - looking statements speak only as of the date they are made, and we assume no obligation to update such information in light of new information or future events. Forward - Looking Statement Disclaimer 2

KRATON Third Quarter 2014 Earnings Call GAAP Disclaimer This presentation includes the use of both GAAP and non - GAAP financial measures. The non - GAAP financial measures are EBITDA, Adjusted EBITDA, Adjusted Gross Profit and Adjusted Net Income attributable to Kraton (or earnings per share). Tables included in this ea rnings release reconcile each of these non - GAAP financial measures with the most directly comparable GAAP financial measure. For additional in formation on the impact of the spread between the FIFO basis of accounting and estimated current replacement cost (“ECRC”), see Management’s Discussion and Analysis of Financial Condition and Results of Operations in our Quarterly Report on Form 10 - Q for the quarter ended Septemb er 30, 2014. We consider these non - GAAP financial measures to be important supplemental measures of our performance and believe they are freq uently used by investors, securities analysts and other interested parties in the evaluation of our performance including period - to - period c omparisons and/or that of other companies in our industry. Further, management uses these measures to evaluate operating performance, and our inc entive compensation plan bases incentive compensation payments on our Adjusted EBITDA performance, along with other factors. These non - GAAP financial measures have limitations as analytical tools and in some cases can vary substantially from other measures of our p erf ormance. You should not consider them in isolation, or as a substitute for analysis of our results under GAAP in the United States. For E BIT DA, these limitations include: EBITDA does not reflect the significant interest expense on our debt; EBITDA does not reflect the significant depreciation an d amortization expense associated with our long - lived assets; EBITDA included herein should not be used for purposes of assessing compliance or non - compliance with financial covenants under our debt agreements. Our calculation of EBITDA in the debt agreements includes adjustments, such as extraordinary, non - recurring or one - time charges, proforma cost savings, certain non - cash items, turnaround costs, and other items included in our definition of EBITDA in the debt agreements; and other companies in our industry may calculate EBITDA differently than we do, limiting its usefulness as a comparative measure. As an analytical tool, Adjusted EBITDA is subject to all the limitations applicable to EBITDA. We prepare Adjusted EBITDA by eliminating from EBITDA the impact of a number of items we do not consider indicative of our on - going performance, including the spread between FIFO and ECRC, but you should be aware that in the future we may incur expenses similar to the a dju stments in this presentation. Our presentation of Adjusted EBITDA should not be construed as an inference that our future results will be unaffected by unu sua l or non - recurring items. In addition, due to volatility in raw material prices, Adjusted EBITDA may, and often does, vary substantially from EBITDA and other performance measures, including net income calculated in accordance with U.S. GAAP; and Adjusted EBITDA may, and of ten will, vary significantly from EBITDA calculations under the terms of our debt agreements and should not be used for assessing compliance or non - compliance with financial covenants under our debt agreements. Because of these and other limitations, EBITDA and Adjusted EBITDA shoul d n ot be considered as a measure of discretionary cash available to us to invest in the growth of our business. As a measure of our p erf ormance, Adjusted Gross Profit is limited because it often will vary substantially from gross profit calculated in accordance with U.S. GAAP du e t o volatility in raw material prices. Finally, we prepare Adjusted Net Income attributable to Kraton by eliminating from net income the impact of a number of items we do not consider indicative of our on - going performance, including the spread between FIFO and ECRC. Our presentation of non - GAAP financial measures and the adjustments made therein should not be construed as an inference that our future results will be unaffected by unusual or non - recurring items, and in the future we may incur expenses or charges similar to the adjustments made in the presentation of ou r n on - GAAP financial measures. 3
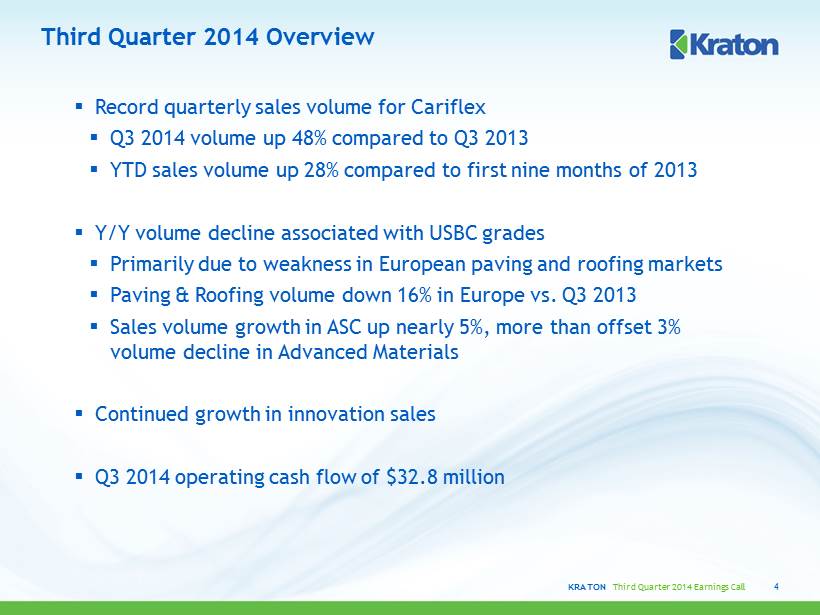
KRATON Third Quarter 2014 Earnings Call Third Quarter 2014 Overview 4 ▪ Record quarterly sales volume for Cariflex ▪ Q3 2014 volume up 48% compared to Q3 2013 ▪ YTD sales volume up 28% compared to first nine months of 2013 ▪ Y/Y volume decline associated with USBC grades ▪ Primarily due to weakness in European paving and roofing markets ▪ Paving & Roofing volume down 16% in Europe vs. Q3 2013 ▪ Sales volume growth in ASC up nearly 5%, more than offset 3% volume decline in Advanced Materials ▪ Continued growth in innovation sales ▪ Q3 2014 operating cash flow of $32.8 million
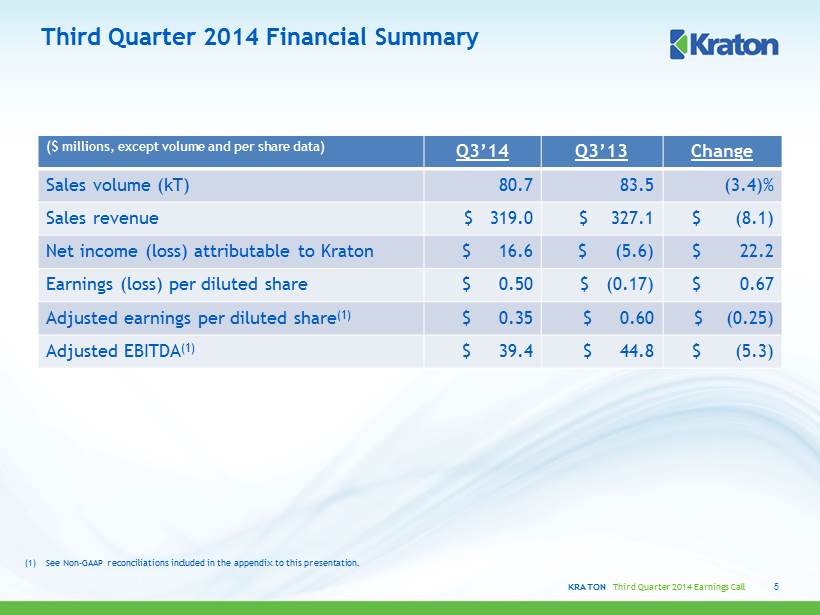
KRATON Third Quarter 2014 Earnings Call Third Quarter 2014 Financial Summary ( $ millions, except volume and per share data) Q3’14 Q3’13 Change Sales volume (kT) 80.7 83.5 (3.4)% Sales revenue $ 319.0 $ 327.1 $ (8.1) Net income (loss) attributable to Kraton $ 16.6 $ (5.6) $ 22.2 Earnings (loss) per diluted share $ 0.50 $ (0.17) $ 0.67 Adjusted earnings per diluted share (1) $ 0.35 $ 0.60 $ (0.25) Adjusted EBITDA (1) $ 39.4 $ 44.8 $ (5.3) 5 (1) See Non - GAAP reconciliations included in the appendix to this presentation.
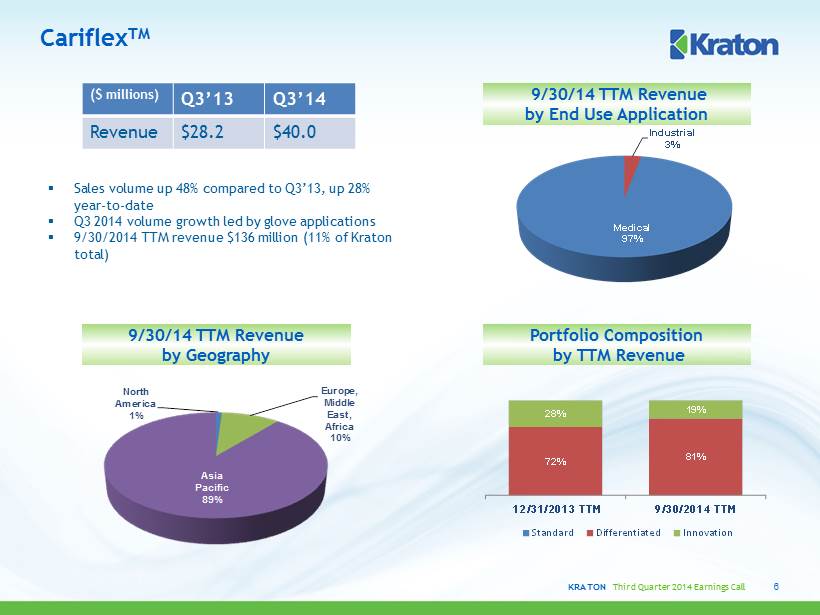
KRATON Third Quarter 2014 Earnings Call 72% 81% 28% 19% 12/31/2013 TTM 9/30/2014 TTM Standard Differentiated Innovation Industrial 3% Medical 97% Cariflex TM 6 9/30/14 TTM Revenue by End Use Application ( $ millions) Q3’13 Q3’14 Revenue $28.2 $40.0 ▪ Sales volume up 48% compared to Q3’13, up 28% year - to - date ▪ Q3 2014 volume growth led by glove applications ▪ 9/30/2014 TTM revenue $136 million (11% of Kraton total) Portfolio Composition by TTM Revenue 9/30/14 TTM Revenue by Geography North America 1% Europe, Middle East, Africa 10% Asia Pacific 89%
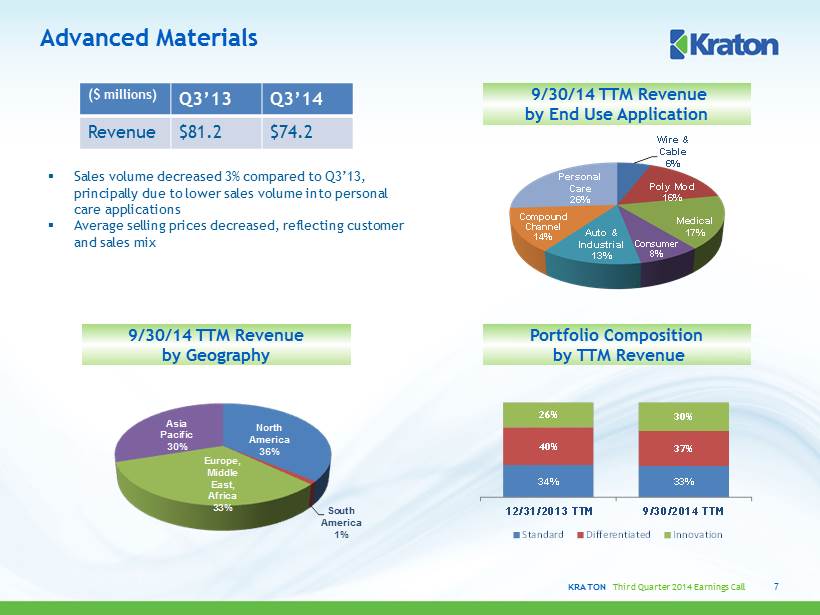
KRATON Third Quarter 2014 Earnings Call Wire & Cable 6% Poly Mod 16% Medical 17% Consumer 8% Auto & Industrial 13% Compound Channel 14% Personal Care 26% 34% 33% 40% 37% 26% 30% 12/31/2013 TTM 9/30/2014 TTM Standard Differentiated Innovation Advanced Materials 7 ▪ Sales volume decreased 3% compared to Q3’13, principally due to lower sales volume into personal care applications ▪ Average selling prices decreased, reflecting customer and sales mix ( $ millions) Q3’13 Q3’14 Revenue $81.2 $74.2 9/30/14 TTM Revenue by End Use Application Portfolio Composition by TTM Revenue 9/30/14 TTM Revenue by Geography North America 36% South America 1% Europe, Middle East, Africa 33% Asia Pacific 30%
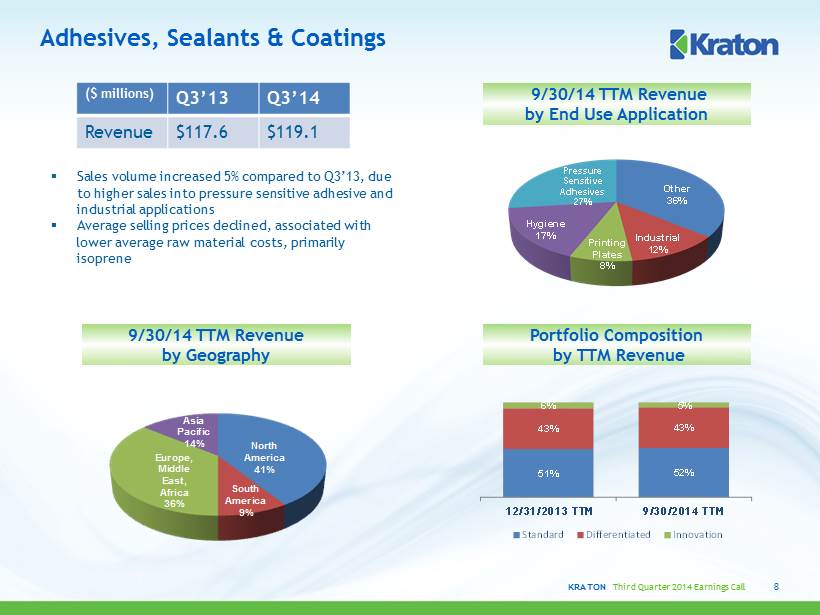
KRATON Third Quarter 2014 Earnings Call Other 36% Industrial 12% Printing Plates 8% Hygiene 17% Pressure Sensitive Adhesives 27% 51% 52% 43% 43% 6% 5% 12/31/2013 TTM 9/30/2014 TTM Standard Differentiated Innovation Adhesives, Sealants & Coatings 8 ▪ Sales volume increased 5% compared to Q3’13, due to higher sales into pressure sensitive adhesive and industrial applications ▪ Average selling prices declined, associated with lower average raw material costs, primarily isoprene ( $ millions) Q3’13 Q3’14 Revenue $117.6 $119.1 9/30/14 TTM Revenue by End Use Application Portfolio Composition by TTM Revenue 9/30/14 TTM Revenue by Geography North America 41% South America 9% Europe, Middle East, Africa 36% Asia Pacific 14%
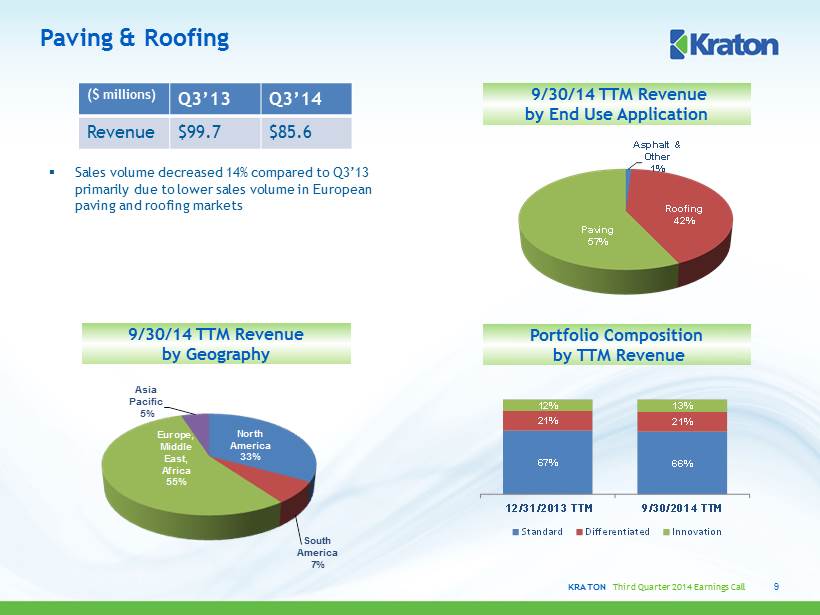
KRATON Third Quarter 2014 Earnings Call Asphalt & Other 1% Roofing 42% Paving 57% 67% 66% 21% 21% 12% 13% 12/31/2013 TTM 9/30/2014 TTM Standard Differentiated Innovation Paving & Roofing 9 ▪ Sales volume decreased 14% compared to Q3’13 primarily due to lower sales volume in European paving and roofing markets ( $ millions) Q3’13 Q3’14 Revenue $99.7 $85.6 9/30/14 TTM Revenue by End Use Application Portfolio Composition by TTM Revenue 9/30/14 TTM Revenue by Geography North America 33% South America 7% Europe, Middle East, Africa 55% Asia Pacific 5%
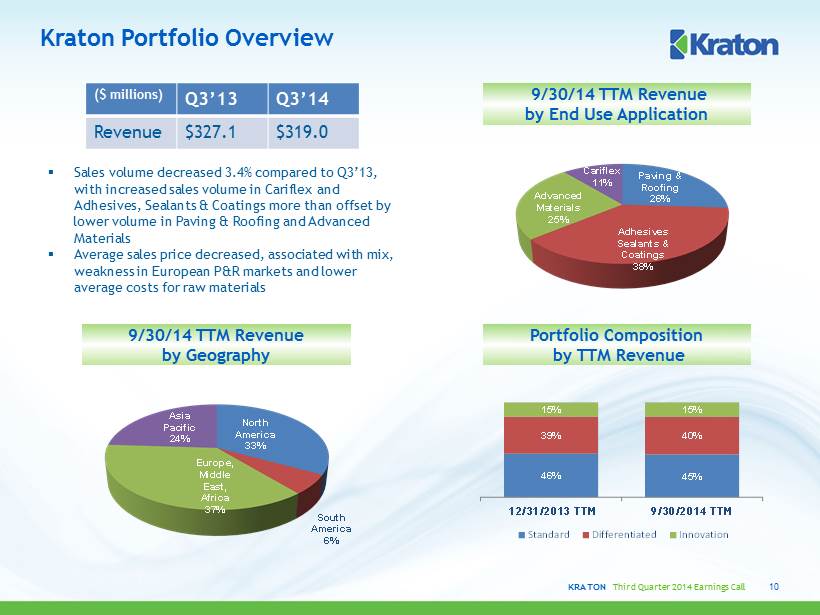
KRATON Third Quarter 2014 Earnings Call North America 33% South America 6% Europe, Middle East, Africa 37% Asia Pacific 24% Paving & Roofing 26% Adhesives Sealants & Coatings 38% Advanced Materials 25% Cariflex 11% 46% 45% 39% 40% 15% 15% 12/31/2013 TTM 9/30/2014 TTM Standard Differentiated Innovation Kraton Portfolio Overview 10 ▪ Sales volume decreased 3.4% compared to Q3’13, with increased sales volume in Cariflex and Adhesives, Sealants & Coatings more than offset by lower volume in Paving & Roofing and Advanced Materials ▪ Average sales price decreased, associated with mix, weakness in European P&R markets and lower average costs for raw materials ( $ millions) Q3’13 Q3’14 Revenue $327.1 $319.0 9/30/14 TTM Revenue by End Use Application 9/30/14 TTM Revenue by Geography Portfolio Composition by TTM Revenue
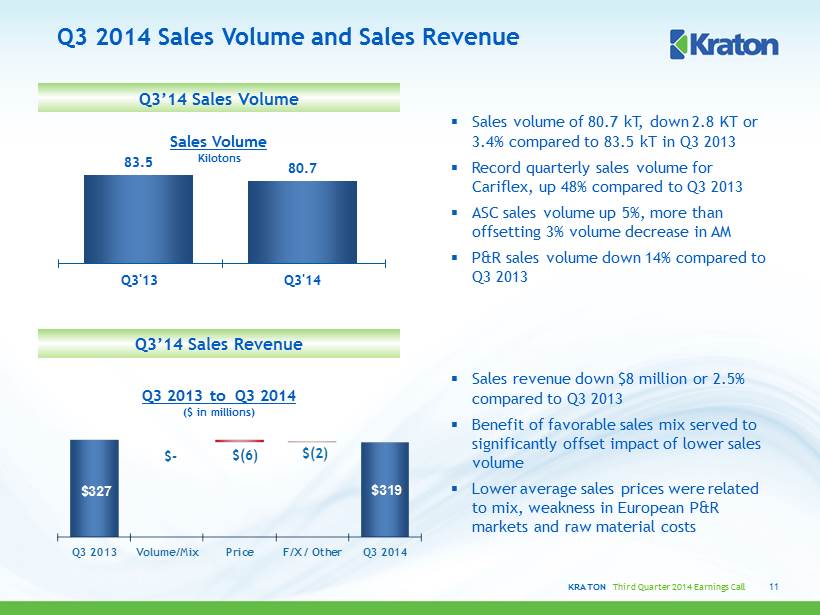
KRATON Third Quarter 2014 Earnings Call 83.5 80.7 40 60 80 100 120 140 Q3'13 Q3'14 Sales Volume Kilotons Q3 2014 Sales Volume and Sales Revenue 11 Q3 2013 to Q3 2014 ($ in millions) Q3’14 Sales Volume Q3’14 Sales Revenue ▪ Sales volume of 80.7 kT, down 2.8 KT or 3.4% compared to 83.5 kT in Q3 2013 ▪ Record quarterly sales volume for Cariflex, up 48% compared to Q3 2013 ▪ ASC sales volume up 5%, more than offsetting 3% volume decrease in AM ▪ P&R sales volume down 14% compared to Q3 2013 ▪ Sales revenue down $8 million or 2.5% compared to Q3 2013 ▪ Benefit of favorable sales mix served to significantly offset impact of lower sales volume ▪ Lower average sales prices were related to mix, weakness in European P&R markets and raw material costs $327 $319 $ - $(6) $(2) Q3 2013 Volume/Mix Price F/X / Other Q3 2014
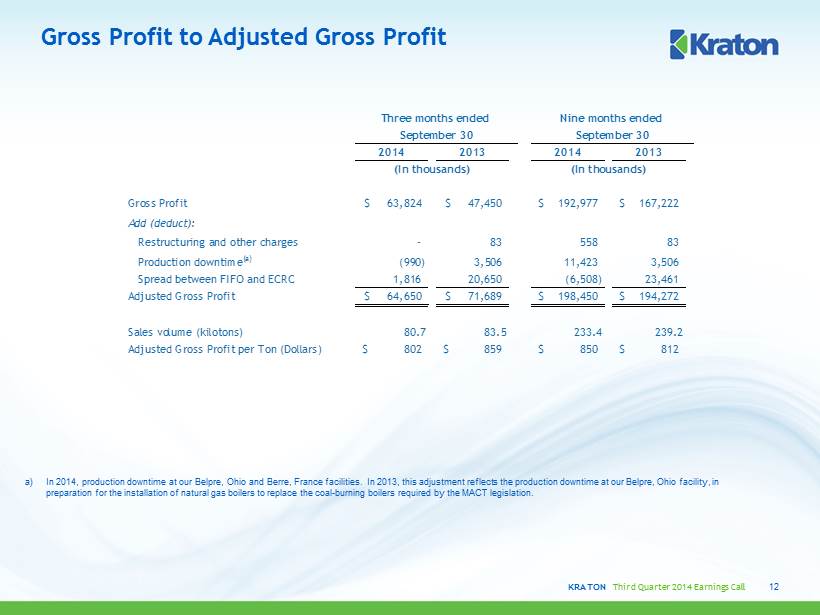
KRATON Third Quarter 2014 Earnings Call Gross Profit to Adjusted Gross Profit 12 a) In 2014, production downtime at our Belpre, Ohio and Berre , France facilities. In 2013, this adjustment reflects the production downtime at our Belpre, Ohio facility, in preparation for the installation of natural gas boilers to replace the coal - burning boilers required by the MACT legislation. 2014 2013 2014 2013 (In thousands) (In thousands) Gross Profit 63,824$ 47,450$ 192,977$ 167,222$ Add (deduct): Restructuring and other charges - 83 558 83 Production downtime (a) (990) 3,506 11,423 3,506 Spread between FIFO and ECRC 1,816 20,650 (6,508) 23,461 Adjusted Gross Profit 64,650$ 71,689$ 198,450$ 194,272$ Sales volume (kilotons) 80.7 83.5 233.4 239.2 Adjusted Gross Profit per Ton (Dollars) 802$ 859$ 850$ 812$ Three months ended September 30 Nine months ended September 30

KRATON Third Quarter 2014 Earnings Call Third Quarter 2014 Earnings $ in millions 13 (1) See Non - GAAP reconciliations included in the appendix to this presentation. Adjusted EBITDA (1) Adjusted Earnings Per Share ▪ Decrease primarily due to weakness in European paving & roofing market and, to a lesser extent, lower HSBC margins compared to Q3 2013, which benefitted from a rapid decline in raw material prices ▪ YTD Adjusted EBITDA is $115.5 million vs. $105.9 million in 2013 3 months ended 9/30/2014 3 months ended 9/30/2013 GAAP EPS $ 0 . 50 $ ( 0 . 17 ) Special items (1) ( 0 . 15 ) 0 . 14 Valuation allowance ( 0 . 06 ) - Spread between FIFO and ECRC (1) 0 . 06 0 . 63 Adjusted EPS $ 0 . 35 $ 0 . 60 9 months ended 9/30/2014 9 months ended 9/30/2013 GAAP EPS $ 0 . 60 $ ( 0 . 17 ) Special items (1) 0 . 67 0 . 35 Valuation allowance ( 0 . 06 ) - Spread between FIFO and ECRC (1) ( 0 . 19 ) 0 . 72 Adjusted EPS $ 1 . 01 $ 0 . 90 $45 $39 $ - $(6) $(2) $1 $1 Q3 2013 Volume/Mix Price COGS SAR FX/Other Q3 2014
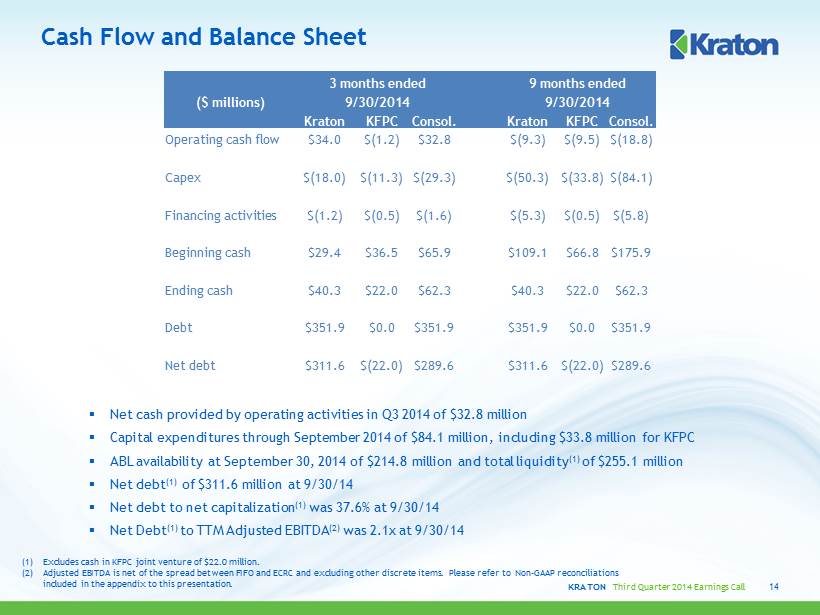
KRATON Third Quarter 2014 Earnings Call Cash Flow and Balance Sheet 14 ▪ Net cash provided by operating activities in Q3 2014 of $32.8 million ▪ Capital expenditures through September 2014 of $84.1 million , including $33.8 million for KFPC ▪ ABL availability at September 30, 2014 of $214.8 million and total liquidity (1) of $ 255.1 million ▪ Net debt (1) of $ 311.6 million at 9/30/14 ▪ Net debt to net capitalization (1) was 37.6% at 9/30/14 ▪ Net Debt (1) to TTM Adjusted EBITDA (2) was 2.1x at 9/30/14 3 months ended 9 months ended ($ millions) 9/30/2014 9/30/2014 Kraton KFPC Consol. Kraton KFPC Consol. Operating cash flow $34.0 $(1.2) $32.8 $(9.3) $(9.5) $(18.8) Capex $(18.0) $(11.3) $(29.3) $(50.3) $(33.8) $(84.1) Financing activities $(1.2) $(0.5) $(1.6) $(5.3) $(0.5) $(5.8) Beginning cash $29.4 $36.5 $65.9 $109.1 $66.8 $175.9 Ending cash $40.3 $22.0 $62.3 $40.3 $22.0 $62.3 Debt $351.9 $0.0 $351.9 $351.9 $0.0 $351.9 Net debt $311.6 $(22.0) $289.6 $311.6 $(22.0) $289.6 (1) Excludes cash in KFPC joint venture of $22.0 million. (2) Adjusted EBITDA is net of the spread between FIFO and ECRC and excluding other discrete items. Please refer to Non - GAAP reconc iliations included in the appendix to this presentation.
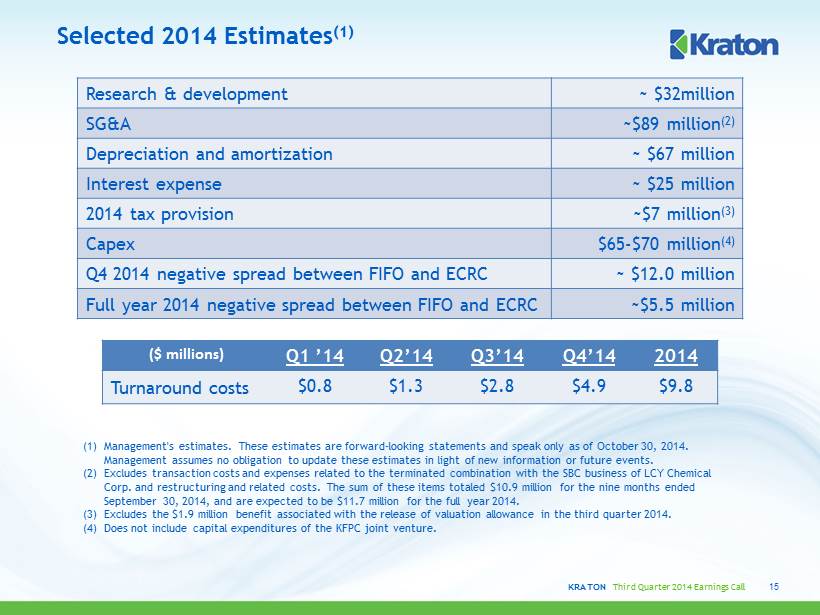
KRATON Third Quarter 2014 Earnings Call Selected 2014 Estimates (1) (1) Management's estimates. These estimates are forward - looking statements and speak only as of October 30, 2014. Management assumes no obligation to update these estimates in light of new information or future events. (2) Excludes transaction costs and expenses related to the terminated combination with the SBC business of LCY Chemical Corp . and restructuring and related costs. The sum of these items totaled $10.9 million for the nine months ended September 30, 2014, and are expected to be $11.7 million for the full year 2014. (3) Excludes the $1.9 million benefit associated with the release of valuation allowance in the third quarter 2014. (4) Does not include capital expenditures of the KFPC joint venture. 15 Research & development ~ $32million SG&A ~$89 million (2) Depreciation and amortization ~ $67 million Interest expense ~ $25 million 2014 tax provision ~$7 million (3) Capex $65 - $70 million (4) Q4 2014 negative spread between FIFO and ECRC ~ $12.0 million Full year 2014 negative spread between FIFO and ECRC ~$5.5 million ($ millions) Q1 ’14 Q2’14 Q3’14 Q4’14 2014 Turnaround costs $0.8 $1.3 $2.8 $4.9 $9.8
APPENDIX October 30, 2014
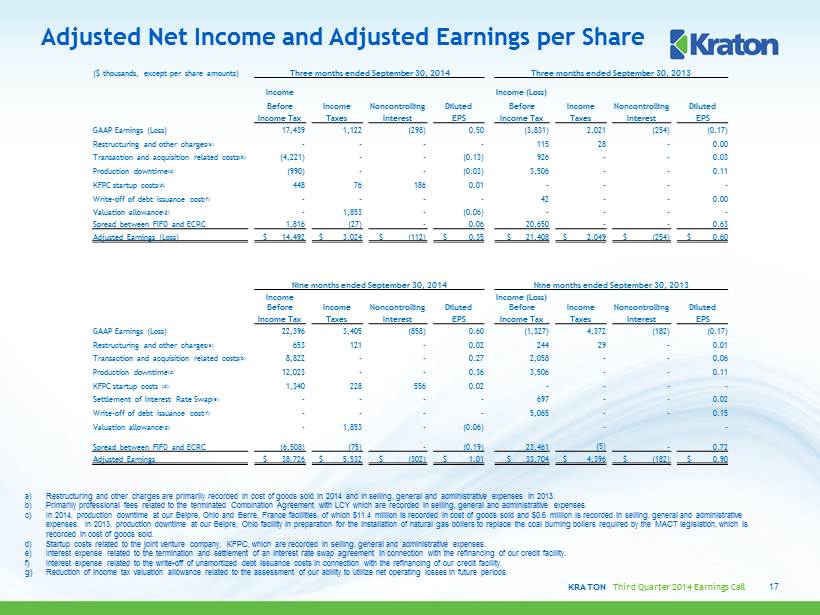
KRATON Third Quarter 2014 Earnings Call Adjusted Net Income and Adjusted Earnings per Share 17 a) Restructuring and other charges are primarily recorded in cost of goods sold in 2014 and in selling, general and administrative expenses in 20 13. b) Primarily professional fees related to the terminated Combination Agreement with LCY which are recorded in selling, general and adminis tra tive expenses. c) In 2014, production downtime at our Belpre, Ohio and Berre , France facilities, of which $ 11.4 million is recorded in cost of goods sold and $0.6 million is recorded in selling, general and administrative expenses. In 2013, production downtime at our Belpre, Ohio facility in preparation for the installation of natural gas boiler s t o replace the coal burning boilers required by the MACT legislation, which is recorded in cost of goods sold. d) Startup costs related to the joint venture company, KFPC, which are recorded in selling, general and administrative expenses. e) Interest expense related to the termination and settlement of an interest rate swap agreement in connection with the refinancing of ou r c redit facility. f) Interest expense related to the write - off of unamortized debt issuance costs in connection with the refinancing of our credit facility. g) Reduction of income tax valuation allowance related to the assessment of our ability to utilize net operating losses in future periods. ($ thousands, except per share amounts) Three months ended September 30, 2014 Three months ended September 30, 2013 Income Income (Loss) Before Income Noncontrolling Diluted Before Income Noncontrolling Diluted Income Tax Taxes Interest EPS Income Tax Taxes Interest EPS GAAP Earnings (Loss) 17,439 1,122 (298) 0.50 (3,831) 2,021 (254) (0.17) Restructuring and other charges (a) - - - - 115 28 - 0.00 Transaction and acquisition related costs (b) (4,221) - - (0.13) 926 - - 0.03 Production downtime (c) (990) - - (0.03) 3,506 - - 0.11 KFPC startup costs (d ) 448 76 186 0.01 - - - - Write - off of debt issuance cost (f) - - - - 42 - - 0.00 Valuation allowance (g) - 1,853 - (0.06) - - - - Spread between FIFO and ECRC 1,816 (27) - 0.06 20,650 - - 0.63 Adjusted Earnings (Loss) $ 14,492 $ 3,024 $ ( 112) $ 0.35 $ 21,408 $ 2,049 $ (254) $ 0.60 Nine months ended September 30, 2014 Nine months ended September 30, 2013 Income Income (Loss) Before Income Noncontrolling Diluted Before Income Noncontrolling Diluted Income Tax Taxes Interest EPS Income Tax Taxes Interest EPS GAAP Earnings (Loss) 22,396 3,405 (858) 0.60 (1,327) 4,372 (182) (0.17) Restructuring and other charges (a) 653 121 - 0.02 244 29 - 0.01 Transaction and acquisition related costs (b) 8,822 - - 0.27 2,058 - - 0.06 Production downtime (c) 12,023 - - 0.36 3,506 - - 0.11 KFPC startup costs (d) 1,340 228 556 0.02 - - - - Settlement of Interest Rate Swap (e) - - - - 697 - - 0.02 Write - off of debt issuance cost (f) - - - - 5,065 - - 0.15 Valuation allowance (g) - 1,853 - (0.06) - - Spread between FIFO and ECRC (6,508) (75) - ( 0.19) 23,461 (5) - 0.72 Adjusted Earnings $ 38,726 $ 5,532 $ (302) $ 1.01 $ 33,704 $ 4,396 $ (182) $ 0.90
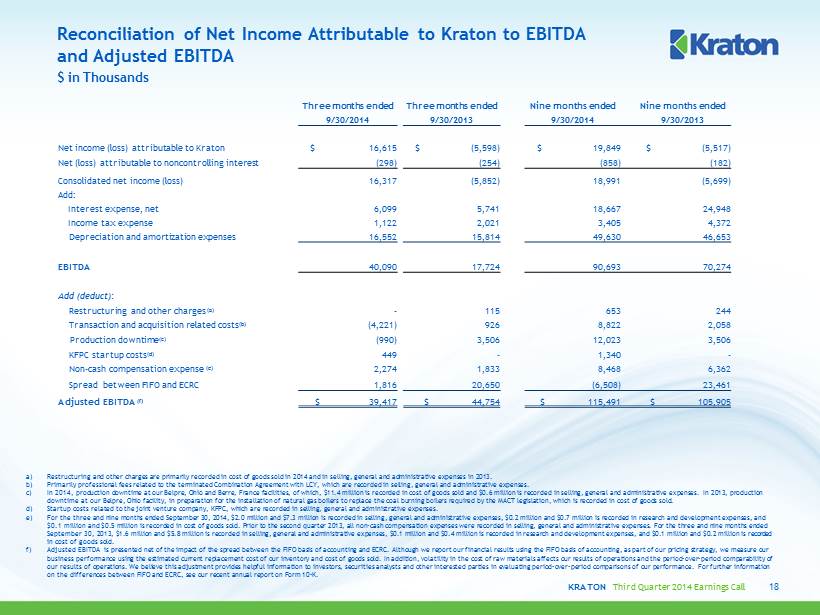
KRATON Third Quarter 2014 Earnings Call Reconciliation of Net Income Attributable to Kraton to EBITDA and Adjusted EBITDA a) Restructuring and other charges are primarily recorded in cost of goods sold in 2014 and in selling, general and administrati ve expenses in 2013. b) Primarily professional fees related to the terminated Combination Agreement with LCY, which are recorded in selling, general and administrative expenses. c) In 2014, production downtime at our Belpre, Ohio and Berre , France facilities, of which, $ 11.4 million is recorded in cost of goods sold and $0.6 million is recorded in selling, general and administrative expenses. In 2 013 , production downtime at our Belpre, Ohio facility, in preparation for the installation of natural gas boilers to replace the coal burning bo ilers required by the MACT legislation, which is recorded in cost of goods sold. d) Startup costs related to the joint venture company, KFPC, which are recorded in selling, general and administrative expenses. e) For the three and nine months ended September 30, 2014, $2.0 million and $7.3 million is recorded in selling, general and adm ini strative expenses, $0.2 million and $0.7 million is recorded in research and development expenses, and $0.1 million and $0.5 million is recorded in cost of goods sold. Prior to the second quarter 2013, all non - cash compensation exp enses were recorded in selling, general and administrative expenses. For the three and nine months ended September 30, 2013, $1.6 million and $5.8 million is recorded in selling, general and administrative expenses, $0.1 million a nd $0.4 million is recorded in research and development expenses, and $0.1 million and $0.2 million is recorded in cost of goods sold. f) Adjusted EBITDA is presented net of the impact of the spread between the FIFO basis of accounting and ECRC. Although we report our financial results using the FIFO basis of accounting, as part of our pricing strategy, we measure our business performance using the estimated current replacement cost of our inventory and cost of goods sold. In addition, volat ili ty in the cost of raw materials affects our results of operations and the period - over - period comparability of our results of operations . We believe this adjustment provides helpful information to investors, securities analysts and other interested parties in evaluating period - over - period comparisons of our performance. For further information on the differences between FIFO and ECRC, see our recent annual report on Form 10 - K . $ in Thousands 18 Three months ended Three months ended Nine months ended Nine months ended 9/30/2014 9/30/2013 9/30/2014 9/30/2013 Net income (loss) attributable to Kraton $ 16,615 $ (5,598) $ 19,849 $ (5,517) Net ( loss) attributable to noncontrolling interest (298) (254) (858) (182) Consolidated net income (loss) 16,317 (5,852) 18,991 (5,699) Add: Interest expense, net 6,099 5,741 18,667 24,948 Income tax expense 1,122 2,021 3,405 4,372 Depreciation and amortization expenses 16,552 15,814 49,630 46,653 EBITDA 40,090 17,724 90,693 70,274 Add (deduct): Restructuring and other charges (a) - 115 653 244 Transaction and acquisition related costs (b) (4,221) 926 8,822 2,058 Production downtime (c) (990) 3,506 12,023 3,506 KFPC startup costs (d) 449 - 1,340 - Non - cash compensation expense (e) 2,274 1,833 8,468 6,362 Spread between FIFO and ECRC 1,816 20,650 (6,508) 23,461 Adjusted EBITDA (f) $ 39,417 $ 44,754 $ 115,491 $ 105,905
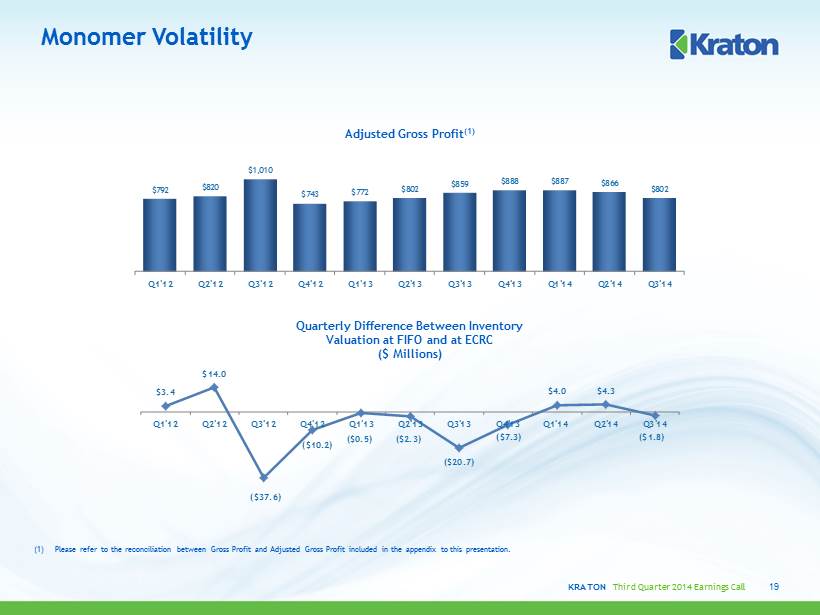
KRATON Third Quarter 2014 Earnings Call Monomer Volatility Quarterly Difference Between Inventory Valuation at FIFO and at ECRC ($ Millions) Adjusted Gross Profit (1) 19 (1) Please refer to the reconciliation between Gross Profit and Adjusted Gross Profit included in the appendix to this presentati on. $792 $820 $1,010 $743 $772 $802 $859 $888 $887 $866 $802 Q1'12 Q2'12 Q3'12 Q4'12 Q1'13 Q2'13 Q3'13 Q4'13 Q1'14 Q2'14 Q3'14 $3.4 $14.0 ($37.6) ($10.2) ($0.5) ($2.3) ($20.7) ($7.3) $4.0 $4.3 ($1.8) Q1'12 Q2'12 Q3'12 Q4'12 Q1'13 Q2'13 Q3'13 Q4'13 Q1'14 Q2'14 Q3'14

KRATON Third Quarter 2014 Earnings Call Reconciliation of Gross Profit to Adjusted Gross Profit (1) 20 (1) Adjusted gross profit is gross profit net of the impact of the spread between the FIFO basis of accounting and ECRC and excluding certain discrete items listed in the table above. Although we report our financial results using the FIFO basis of accounting, as part of our pricing strategy, we measure our bus iness performance using the estimated current replacement cost of our inventory and cost of goods sold. In addition, volatility in the cost of raw materials affects our results of operations and the period - over - period comparability of our results of operations. Therefore, we provide Adjusted Gross Profit as another supplemental measure of our performance. We believe this adjustment provides helpful information to investors, securities ana lys ts and other interested parties in the evaluating period - over - period comparisons of our performance. For further information on the differences between FIFO and ECRC, see our recent annual report on Form 10 - K. ($ millions) Q1'12 Q2'12 Q3'12 Q4’12 Q1’13 Q2’13 Q3’13 Q4’13 Q1'14 Q2'14 Q3'14 Gross Profit @ FIFO $75.5 $73.5 $42.8 $39.7 $59.9 $59.9 $47.5 $58.6 $57.1 $72.1 $ 63.8 FIFO to ECRC ($3.4) ($14.0) $37.6 $10.2 $0.5 $2.3 $ 20.7 $7.3 ($4.0) ($4.3) $1.8 Restructuring and other charges - $1.0 - - - - $0.1 $0.1 $0.5 $0.1 - Production downtime - - - - - - $3.5 - $12.4 - $(1.0) Storm related charges - $2.8 ($0.3) - - - - - - - - Property tax dispute $5.6 - - - - - - - - - - Settlement gain ($6.8) - - - - - - - - - - Adjusted Gross Profit $ 71.0 $63.3 $80.1 $49.9 $60.4 $62.2 $71.7 $66.0 $66.0 $ 67.8 $ 64.7 Sales Volume (Kilotons) 89.6 77.2 79.3 67.2 78.2 77.5 83.5 74.3 74.4 78.4 80.7 Adjusted Gross Profit per ton $792 $820 $1,010 $743 $772 $802 $859 $888 $887 $866 $802
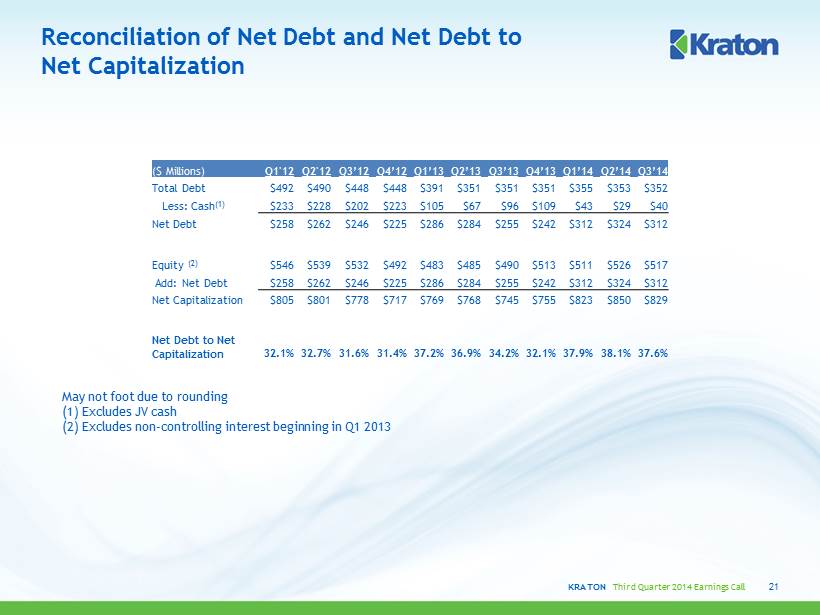
KRATON Third Quarter 2014 Earnings Call Reconciliation of Net Debt and Net Debt to Net Capitalization 21 ($ Millions) Q1'12 Q2'12 Q3’12 Q4’12 Q1’13 Q2’13 Q3’13 Q4’13 Q1’14 Q2’14 Q3’14 Total Debt $492 $490 $448 $448 $391 $351 $351 $351 $355 $353 $352 Less: Cash (1) $233 $228 $202 $223 $105 $67 $96 $109 $43 $29 $40 Net Debt $258 $262 $246 $225 $286 $284 $255 $242 $312 $324 $312 Equity (2) $546 $539 $532 $492 $483 $485 $490 $513 $511 $526 $517 Add: Net Debt $258 $262 $246 $225 $286 $284 $255 $242 $312 $324 $312 Net Capitalization $805 $801 $778 $717 $769 $768 $745 $755 $823 $850 $829 Net Debt to Net Capitalization 32.1% 32.7% 31.6% 31.4% 37.2% 36.9% 34.2% 32.1% 37.9% 38.1% 37.6% May not foot due to rounding (1) Excludes JV cash (2) Excludes non - controlling interest beginning in Q1 2013

KRATON PERFORMANCE POLYMERS, INC. THIRD QUARTER 2014 EARNINGS CONFERENCE CALL October 30, 2014