 UPDATE CALL PROPOSED COMBINATION OF KRATON PERFORMANCE POLYMERS, INC. WITH THE SBC BUSINESS OF LCY CHEMICAL CORP. KRATON PERFORMANCE POLYMERS, INC. KEVIN M. FOGARTY, PRESIDENT AND CHIEF EXECUTIVE OFFICER June 24, 2014 Exhibit 99.1 |
 2 Forward-Looking Statements This presentation includes forward-looking statements that reflect our plans, beliefs, expectations and current views with respect to, among other things, the combination and future events and financial performance. Forward-looking statements are often characterized by the use of words such as "outlook," "believes," "estimates," "expects," "projects," "may," "intends," "plans" or "anticipates," or by discussions of strategy, plans or intentions, including statements regarding expected synergies from the combination and the costs and timing to obtain them; expectations regarding the dilution / accretiveness of the combination; capabilities and advantages of the combined company; whether the transaction will close and the expected timing thereof; projected debt levels and leverage ratios and estimates; and other projected financial metrics, including revenue, margins, ROIC, free cash flow conversion and EBITDA, including components thereof, adjustments thereto and related multiples. All forward-looking statements in this presentation are made based on management's current expectations and estimates, which involve known and unknown risks, uncertainties and other important factors that could cause actual results to differ materially from those expressed in forward-looking statements. Our expectations and assumptions regarding cost rationalizations, variable cost optimizations and reductions in overhead may not materialize, or our costs to achieve synergies may exceed our estimates, any of which would adversely affect our ability to achieve projected synergies. Our expectations and assumptions regarding the financial performance of the combined company may not materialize, which would adversely affect our ability to achieve expected accretion and the expected timing of the accretion. Regulatory approvals that are conditions to the closing may not be obtained as anticipated, which could delay or prevent closing of the transaction. Our performance or that of LCY’s could be adversely affected by other risks and uncertainties, which would adversely affect the ability of the combined company to achieve expected advantages. In the case of Kraton, these risks and uncertainties include, but are not limited to, those described in our latest Annual Report on Form 10-K, including but not limited to "Part I, Item 1A. Risk Factors" and "Part I, Item 7. Management's Discussion and Analysis of Financial Condition and Results of Operations" therein, our Registration Statement described below, including, but not limited to “Risk Factors”, and in our other filings with the Securities and Exchange Commission, and include, but are not limited to, risks related to: conditions in the global economy and capital markets; declines in raw material costs; limitations in the availability of raw materials we need to produce our products in the amounts or at the prices necessary for us to effectively and profitably operate our business; competition in our end-use markets, from other producers of SBCs and from producers of products that can be substituted for our products; and other factors of which we are currently unaware or deem immaterial. Readers are cautioned not to place undue reliance on forward-looking statements. Forward-looking statements speak only as of the date they are made, and we assume no obligation to update such information in light of new information or future events. Additional Information and Where to Find it THIS COMMUNICATION DOES NOT CONSTITUTE AN OFFER TO SELL OR THE SOLICITATION OF AN OFFER TO BUY SECURITIES OF KRATON OR THE COMBINED COMPANY. KRATON WILL FILE A REVISED PRELIMINARY PROXY STATEMENT/PROSPECTUS (AND AN AMENDMENT TO THE RELATED REGISTRATION STATEMENT (FILE NO. 333-195597)) AND OTHER DOCUMENTS WITH THE SEC . INVESTORS AND SECURITY HOLDERS ARE URGED TO CAREFULLY READ THE REVISED PRELIMINARY PROXY STATEMENT/PROSPECTUS AND AMENDMENT TO THE REGISTRATION STATEMENT (INCLUDING ANY FURTHER AMENDMENTS OR SUPPLEMENTS THERETO) WHEN THEY BECOME AVAILABLE, BECAUSE THEY WILL CONTAIN IMPORTANT INFORMATION REGARDING KRATON, LCY AND THE COMBINATION. A DEFINITIVE PROXY STATEMENT/PROSPECTUS WILL BE SENT TO THE SECURITY HOLDERS OF KRATON SEEKING THEIR APPROVAL OF THE COMBINATION. INVESTORS AND SECURITY HOLDERS MAY OBTAIN A FREE COPY OF THE PROXY STATEMENT/PROSPECTUS AND THE REGISTRATION STATEMENT (WHEN AVAILABLE) AND OTHER DOCUMENTS FILED BY KRATON WITH THE SEC AT THE SEC’S WEBSITE AT WWW.SEC.GOV. THE PROXY STATEMENT/PROSPECTUS AND THE REGISTRATION STATEMENT AND OTHER SUCH DOCUMENTS (RELATING TO KRATON) MAY ALSO BE OBTAINED FOR FREE FROM KRATON BY ACCESSING KRATON’S WEBSITE AT WWW.KRATON.COM Participants in the Solicitation Kraton, its directors, executive officers and certain members of management and employees may be considered “participants in the solicitation” of proxies from Kraton’s stockholders in connection with the combination. Information regarding such persons and a description of their interest in the combination is contained in the proxy statement/prospectus. Information concerning beneficial ownership of Kraton common stock by its directors and certain executive officers is included in its proxy statement dated April 15, 2014 and subsequent statements of changes in beneficial ownership on file with the SEC. |
 3 USE OF NON-GAAP FINANCIAL MEASURES This communication includes the use of both GAAP and non-GAAP financial measures. The non-GAAP financial measures are EBITDA and Adjusted EBITDA. We consider these non-GAAP financial measures important supplemental measures of financial performance and believe they are frequently used by investors, securities analysts and other interested parties in the evaluation of our performance and/or that of other companies in our industry, including period-to-period comparisons. Further, management uses these measures to evaluate operating performance. These non-GAAP financial measures have limitations as analytical tools and in some cases can vary substantially from other measures of financial performance. You should not consider them in isolation, or as a substitute for analysis of results under GAAP in the United States. In the case of EBITDA, these limitations include: EBITDA does not reflect cash expenditures, or future requirements for capital expenditures or contractual commitments; EBITDA does not reflect changes in, or cash requirements for, working capital needs; EBITDA does not reflect the significant interest expense, or the cash requirements necessary to service interest or principal payments, on debt; although depreciation and amortization are non-cash charges, the assets being depreciated and amortized will often have to be replaced in the future, and EBITDA does not reflect any cash requirements for such replacements; EBITDA calculations under the terms of debt agreements may vary from EBITDA presented herein, and our presentation of EBITDA herein is not for purposes of assessing compliance or non-compliance with financial covenants under debt agreements; and other companies in our industry may calculate EBITDA differently from how we do, limiting its usefulness as a comparative measure. As an analytical tool, Adjusted EBITDA is subject to all the limitations applicable to EBITDA. In addition, we prepare Adjusted EBITDA by adjusting EBITDA to eliminate the impact of a number of items we do not consider indicative of ongoing performance, but you should be aware that in the future, expenses similar to the adjustments in this presentation may be incurred. Our presentation of Adjusted EBITDA should not be construed as an inference that future results will be unaffected by unusual or non-recurring items. |
 4 Status Update Kraton - estimate for 2014 Adjusted EBITDA @ ECRC remains $150 million First quarter 2014 Adjusted EBITDA at ECRC of $37.5 million Estimate 2014 Adjusted EPS of $1.50 to $1.60 Waiting period under Hart-Scott-Rodino has expired, providing antitrust clearance for transaction in the U.S.; we have also received antitrust regulatory approval in Taiwan and Turkey China competition law and other necessary regulatory approvals in progress Based upon current view of regulatory review process, and subject to satisfaction of remaining conditions, we continue to anticipate closing the transaction in 4Q14 Shareholders of LCY approved combination on March 31, 2014 1Q14 results for LCY’s SBC business below expectations; expect improvement 2H14 |
 5 1Q14 performance significantly below 1Q13 and expectations 1Q14 volume 62 kT, Adjusted EBITDA $2.9 million vs. 1Q13 volume 65 kT, Adjusted EBITDA $20.6 million Approx. 80% of Adjusted EBITDA shortfall vs. expectations due to gross profit decline in China China market – very difficult trading conditions for SBS China represents >50% of LCY’s SBC business (by volume) SBS market decline began in 3Q13 and accelerated 4Q13, carrying over into 1Q14 Lower demand growth, excess inventory, effect of 2013 capacity additions LCY has provided a revised forecast for 2014 Adjusted EBITDA of $37 million 2Q14 similar to 1Q14; significant improvement expected in 2H14 LCY’s SBC Business - Recent Performance |
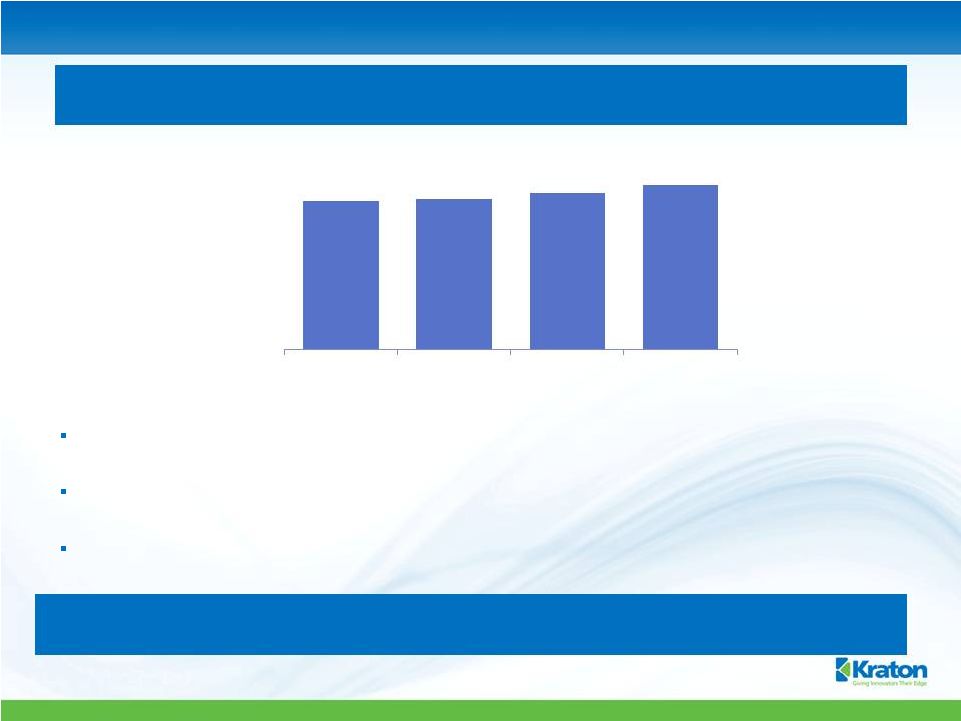 6 Anticipated SBS growth did not materialize in 2013 as key markets softened, with demand weakness carrying over into 2014 China Market – Short-term Decline in Demand Growth Paving – China government policies to tighten liquidity and scrutiny of investment and infrastructure projects Footwear – high finished shoe inventory built in 2011/2012 impacted SBS demand as footwear production reduced in 2013 Weakness in paving and footwear demand was partially offset by continued growth in Adhesives, Compounding and Roofing (1) Source: SAI and Kraton Estimates We expect growth in demand will recover in the second half of 2014 and continue into 2015 624 632 656 692 2012 2013 2014F 2015F Est. China SBS Demand (kT) 1 Y-o-Y Growth 1.3% 3.8% 5.5% |
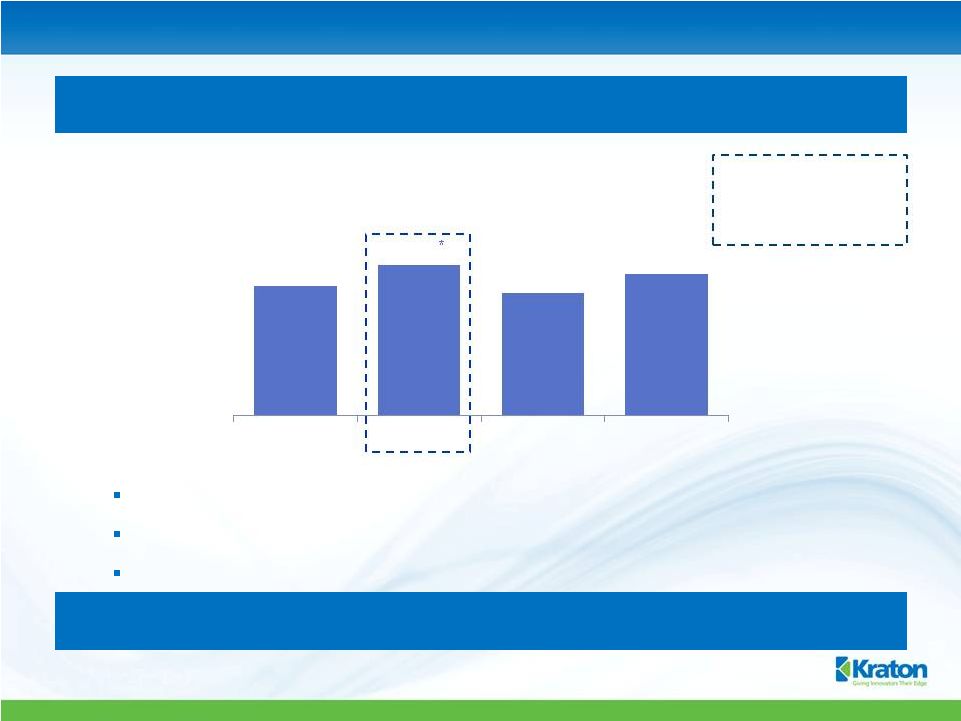 7 79% 64% 74% 2012 2013 2014F 2015F 68% 2013 production rates significantly higher vs. 2012 in anticipation of growth that did not materialize, resulting in a build in SBS inventories China Market – Inventory Build Production continued despite paving slowdown and build in footwear inventory Result was a significant increase in inventory in 2H13 LCY brought 100 kT of SBS capacity on line in 3Q13 * (1) Source: SAI, SCI99 and Kraton estimates *Based on adjusted nameplate capacity of 845kT, which reflects partial year availability of LCY capacity Est. inventory levels increased to ~6 weeks (50kT) vs. typical levels of ~2 weeks Producers reducing output in 2014, and we estimate that excess SBS inventory will be eliminated by mid-2014 China - Estimated SBS Capacity Utilization 1 |
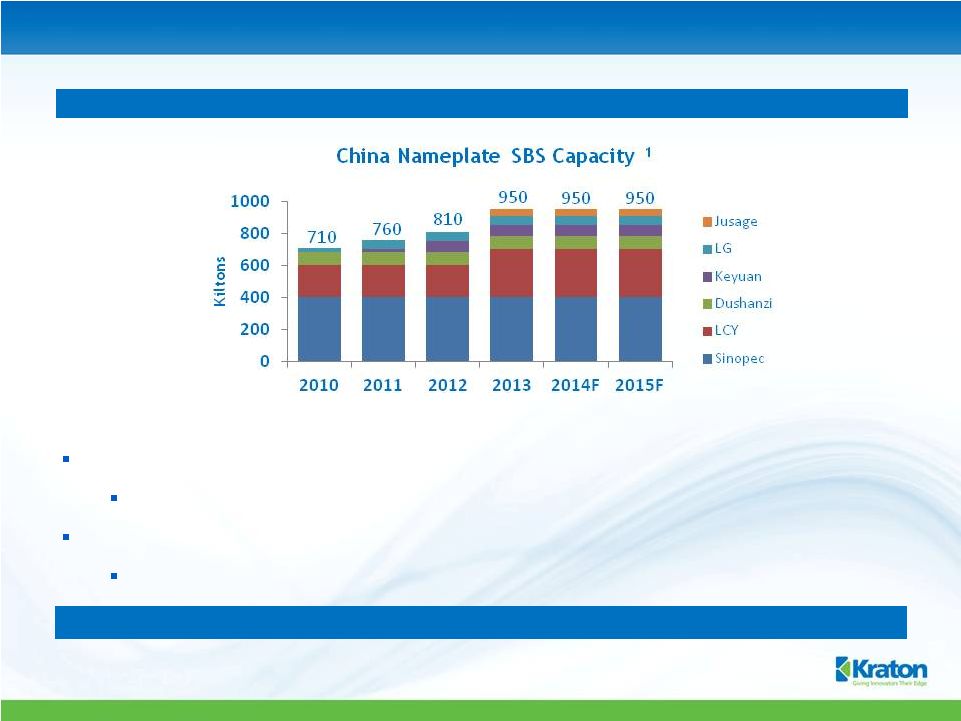 8 Significant SBS capacity was added in China in 2H13, mostly LCY China Market – Capacity Additions Historically, capacity additions have been more in line with demand growth ~ 50 kT added in 2011 and 2012 respectively In 2013, capacity additions were significantly above historical norms ~140 kT or 17% (100 kT LCY in Aug 2013, 40 kT Jusage end-2013) (1) Source: SAI, SCI99 and Kraton estimates Y-o-Y Incr. (kT) 50 50 140 0 0 No SBS capacity additions in China are expected in 2014 or 2015 |
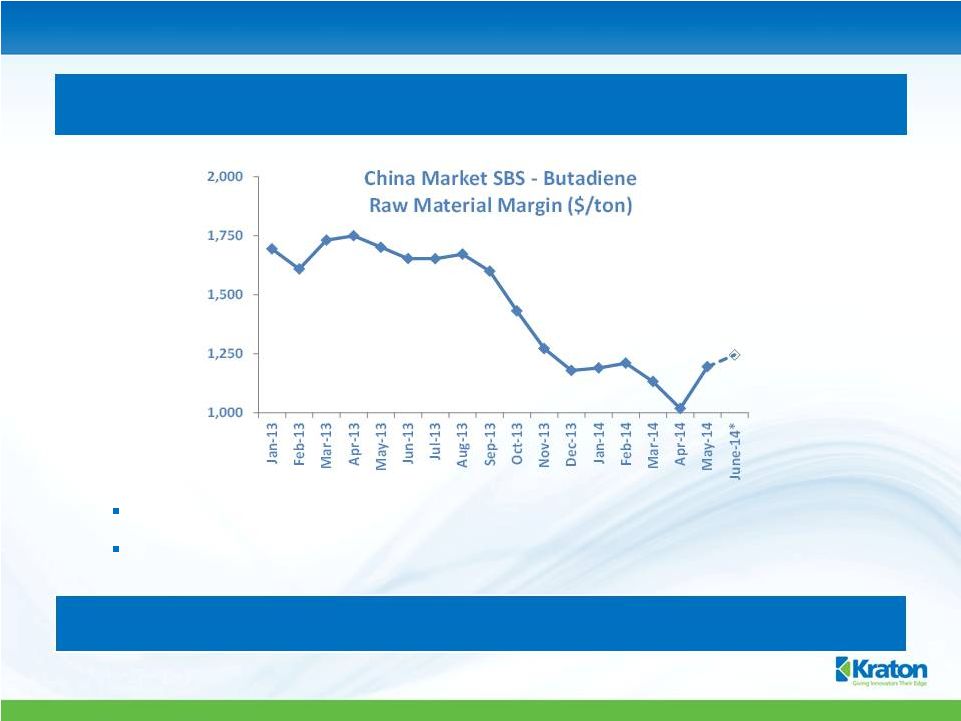 Resulting inventory build, combined with 2H13 capacity additions, created pricing pressure, which accelerated through 2H13 and carried over into 1Q14 China Market – Near-term Pricing and Margin Pressure Raw material margin decreased >$400/ton in 4Q13 Widely-held industry assumption that margins would improve after Chinese New Year was incorrect – in fact, they continued to decline Margins appeared to reach a low in April, increasing in May, and are continuing to increase in June 9 * Preliminary – based upon first two weeks of June 2014 Note: China market SBS-butadiene raw material margin defined as China market SBS price ‘less’ 70% of the spot price for butadiene Source: SCI99 (Sinopec H791 benchmark grade), IHS/CMAI (Northeast Asia spot butadiene price) |
 10 The China SBS Market Recovery Appears to be Underway Producers have taken steps to improve margins from unsustainable levels Market prices have increased since mid-April Production output is at reduced levels as excess SBS inventory is being worked off We expect market conditions to improve in the second half of 2014 as the market absorbs 2013 SBS capacity expansions Footwear supply/demand in balance Second half of the year is normally the peak season for paving demand LCY projects 2014 sales volume of 294 kT, up 12% vs. 2013 In 2015, we expect overall SBS demand in China to return to longer term growth rates of 5-6% per annum Paving demand should improve, driven by need to complete projects included in 5 year plan, which ends in 2015 Continued high single-digit growth for adhesives, compounding and roofing As China recovers, LCY’s SBC business should benefit from its leading market share position (>30%) |
 11 Impact of Revised Market Outlook LCY’s outlook for its 2H14 is significantly better than 1H14 Producers in China are taking actions to improve margins from unsustainable levels, industry production was reduced 1Q14 and excess SBS inventory is being worked off YTD, SBS exports are higher and imports are lower, compared to same period in 2013 2H14 sales volume should be higher than both 2H13 sales volume and 1H14 sales volume Based upon the improvement in 2H14, full-year Adjusted EBITDA for LCY’s SBC business estimated at $37 million We estimate it could take up to 2 years (i.e. until 2016) for the China market to rebalance. Assuming a 2 year delay, we estimate: LCY Adjusted EBITDA for 2015 of ~$71 million, reflecting a modest improvement over the annualized 2H14 run rate; LCY Adjusted EBITDA for 2016 of ~$105 million Our original LCY SBC business Adjusted EBITDA forecasts could be delayed by up to 2 years |
 Transaction Rationale Remains Unchanged The combination addresses strategic objectives of both Kraton and LCY: Kraton: a long-term strategy to access Asian growth markets with cost-effective assets LCY: access to Kraton’s differentiated products, R&D platform and global market reach Enables projected $65 million in annual run-rate cost synergies by 2017 Results in stronger capital structure, reduced leverage and creates a platform for growth Financial metrics still attractive, especially with full run-rate synergies of $65 million 2015 EBITDA multiple* 9.9x pre-synergies and 5.2x post-synergies Dilutive to EPS by $0.19 in 2015; accretive to EPS by $0.29 in 2016 We expect LCY China margins to rebound as market conditions improve Combination gives Kraton immediate access to local capacity in a high growth region, with less risk and capital cost than a “build” option Despite near-term headwinds, China and Asia continue to represent the best long-term growth potential for Kraton *Based on Jan 24, 2014 KRA stock price of $21.66 12 Asia continues to represent significant long-term growth potential |
 13 Appendix |
 14 Kraton Historical Financials 12 months ended December 3 Months Ended 3 Months Ended ($ Millions) 2012 2013 3/31/2013 3/31/2014 Sales Volume (kT) 313 314 78 74 Revenue $1,423 $1,292 $340 $312 EBITDA (1) $97 $89 $26 $15 EBITDA Margin 6.8% 6.9% 7.6% 4.7% Adjusted EBITDA (1) $113 $110 $29 $42 Adjusted EBITDA Margin 8.0% 8.5% 8.4% 13.3% Capex $70 $86 $15 $21 Adjusted EBITDA less Capex $44 $24 $14 $20 (1) Refer to reconciliation of net income (loss) attributable to Kraton to EBITDA and Adjusted EBITDA. |
 15 LCY SBC Historical Financials 12 months ended December 3 Months Ended 3 Months Ended ($ Millions) 2012 2013 3/31/2013 3/31/2014 Sales Volume (kT) 222 263 66 62 Revenue $619 $611 $171 $131 EBITDA (1) $94 $52 $23 $2 EBITDA Margin 15.2% 8.5% 13.2% 0.1% Adjusted EBITDA (1) $91 $48 $21 $3 Adjusted EBITDA Margin 14.7% 7.8% 12.1% 0.2% Capex $18 $13 $3 $2 Adjusted EBITDA less Capex $73 $35 $18 $1 (1) Refer to reconciliation of net income (loss) for the LCY SBC business to EBITDA and Adjusted EBITDA. Note: 2012 data revised from January 28, 2014 presentation, reflects final audited results and eliminates adjustments to corporate overhead for purposes of calculating Adjusted EBITDA |
 16 Reconciliation of Net Income (Loss) Attributable to Kraton to EBITDA and Adjusted EBITDA a) Reflects the benefit of the settlement with LyondellBasell. b) Reflects a charge associated with the resolution of a property tax dispute in France. c) Reflects a storm related charge at our Belpre, Ohio facility. d) Includes other professional fees, severance expenses, fees associated with the public offering of our senior notes and the secondary public offering of our common stock, and charges associated with the restructuring of our European organization. e) Reflects an impairment of long-lived assets, of which $3.4 million and $2.0 million were associated with the HSBC facility and other long-term assets, respectively. f) Reflects the non-recurring portion of the $6.1 million of aggregate turnaround costs in 2013. The adjustment relates to the production downtime at our Belpre, Ohio facility, in preparation for the installation of natural gas boilers to replace the coal-burning boilers required by the MACT legislation. g) Reflects a retirement plan settlement charge associated with a disbursement from a benefit plan upon the retirement of an employee. h) Primarily professional fees related to our proposed combination with the styrenic block copolymer operations of LCY Chemical Corp., which are recorded in selling, general and administrative expenses. i) Reflects $4.2 million of the Asia J.V. pre-startup costs, of which 50% are included in net income/(loss) attributable to Kraton. 3 months ended 3 months ended Forecast ($ Thousands) 2012 2013 3/31/2013 3/31/2014 2014 Net income (loss) attributable to Kraton $(16,191) $ (618) $ (3,748) $ (7,909) $ 16,421 Net loss attributable to noncontrolling interest - (357) (76) (285) (2,134) Consolidated net income (loss) (16,191) (975) (3,824) (8,194) 14,287 Add: Interest expense, net 29,303 30,470 13,298 6,338 24,652 Income tax expense (benefit) 19,306 (3,887) 1,446 122 6,608 Depreciation and amortization expenses 64,554 63,182 15,098 16,409 65,193 EBITDA $ 96,972 $ 88,790 $ 26,018 $ 14,675 $110,740 EBITDA $ 96,972 $ 88,790 $ 26,018 $ 14,675 $110,740 Add (deduct): Settlement gain (a) (6,819) - - - - Property tax dispute (b) 6,211 - - - - Storm related charges (c) 2,481 - - - - Restructuring and other charges (d) 1,359 815 55 521 653 Non-cash compensation expense 6,571 7,894 2,523 3,614 10,613 Impairment of long-lived assets (e) 5,434 - - - - Production downtime (f) - 3,506 - 13,013 13,013 Retirement plan settlement (g) 1,100 - - - - Transaction and acquisition related costs (h) - 9,164 81 9,236 18,511 Pre-startup costs on Asia JV (i) - - - 459 4,194 Adjusted EBITDA $113,309 $110,169 $ 28,677 $ 41,518 $157,724 Add (deduct): Spread between FIFO and ECRC $ 30,533 $ 30,737 $ 507 $ (4,024) $ (7,682) Adjusted EBITDA at ECRC $143,842 $140,906 $ 29,184 $ 37,494 $150,042 12 months ended December |
  17 Reconciliation of Net Income (loss) of the LCY SBC Business to EBITDA and Adjusted EBITDA 3 months ended 3 months ended ($ Thousands) 2012 2013 3/31/2013 3/31/2014 Net income (loss) $ 64,145 $ 27,581 $ 13,893 $ (3,291) Add: Interest expense, net 498 (752) (110) (127) Income tax expense 11,748 7,521 4,410 572 Depreciation and amortization expenses 17,367 17,899 4,433 4,727 EBITDA $ 93,758 $ 52,249 $ 22,626 $ 1,881 EBITDA $ 93,758 $ 52,249 $ 22,626 $ 1,881 Add (deduct): (Gain) / loss on currency transactions and financial instruments (a) (2,588) (4,914) (2,006) 1,017 Transaction costs (b) - 230 - 26 Adjusted EBITDA $ 91,170 $ 47,565 $ 20,620 $ 2,924 12 months ended December a) Reflects (gain)/losses on currency transactions and financial instruments b) Reflects costs associated with the combination with Kraton Note: 2012 data revised from January 28, 2014 presentation, reflects final audited results and eliminates adjustments to corporate overhead for purposes of calculating Adjusted EBITDA |
 18 Reconciliation of Net Income Attributable to Kraton and Income Per Diluted Share to Adjusted Net Income and Adjusted Earnings per Diluted Share $ in thousands except per share data Estimated 12 Mos. Ended 12/31/14 Per Diluted After Tax Share Net income attributable to Kraton and income per diluted share $ 16,421 $ 0.51 Restructuring and other charges (a) $ 532 $ 0.02 Transaction and acquisition related costs (b) $ 18,511 $ 0.58 Production downtime (c) $ 13,013 $ 0.40 Asia startup costs, net of non-controlling interest (d) $ 1,741 $ 0.05 Adjusted net income and adjusted earnings per diluted share $ 50,218 $ 1.56 a) Severance expenses, which are primarily recorded in cost of goods sold. b) Primarily professional fees, related to our proposed combination with the styrenic block copolymer operations of LCY Chemical Corp., which are recorded in selling, general and administrative expenses. c) Production downtime at our Belpre, Ohio and Berre, France facilities, of which $12.4 million is recorded in costs of goods sold and $0.6 million is recorded in selling, general and administrative expenses. d) Startup costs of $4.194 (pre-tax) related to the joint venture company, Kraton Formosa Polymers Corporation, which are recorded in selling, general and administrative expenses, presented net of the associated impact on non-controlling interest. |
 UPDATE CALL PROPOSED COMBINATION OF KRATON PERFORMANCE POLYMERS, INC. WITH THE SBC BUSINESS OF LCY CHEMICAL CORP. KRATON PERFORMANCE POLYMERS, INC. KEVIN M. FOGARTY, PRESIDENT AND CHIEF EXECUTIVE OFFICER June 24, 2014 |