Exhibit 99.1
Confidential
Excerpts from Confidential Information Memorandum December 2015
Kraton Performance Polymers, Inc.
Confidential 1
H. Forward-looking statement disclaimer
This presentation includes forward-looking statements that reflect Kraton Performance Polymers, Inc.’s (“our” or “Kraton”) plans, beliefs, expectations and current views with respect to, among other things, future events and financial performance. Forward-looking statements are often characterized by the use of words such as “outlook,” “believes,” “estimates,” “expects,” “projects,” “may,” “intends,” “plans” or “anticipates,” or by discussions of strategy, plans or intentions.
All forward-looking statements in this presentation are made based on management’s current expectations and estimates, which involve known and unknown risks, uncertainties and other important factors that could cause actual results to differ materially from those expressed in such forward-looking statements. The statements in this presentation that are not historical statements, including statements regarding the benefits, synergies and cost rationalizations of the proposed acquisition of Arizona Chemical Holdings Corporation (the “Acquisition”), the expected method of financing the Acquisition, the expected timing and amount of operating cash flow we expect to generate after the closing of the Acquisition, future opportunities for the combined company and products, beliefs regarding strengthening relationships with customers, statements regarding market share or positioning, the expected timetable for completing the proposed Acquisition, the expected timing and amount of the repayment of indebtedness, future financial performance and any other statements regarding Kraton’s future expectations, beliefs, plans, objectives, financial conditions, assumptions or future events or performance that are not historical facts, are forward-looking statements within the meaning of the federal securities laws. Our expectations and assumptions regarding cost rationalizations, variable cost optimizations and reductions in overhead may not materialize, or our costs to achieve synergies may exceed our estimates, any of which would adversely affect our ability to achieve projected synergies. Our expectations and assumptions regarding the financial performance of the combined company may not materialize, which would adversely affect our ability to achieve expected accretion. Our performance or that of Arizona Chemical Holdings Corporation could be adversely affected by other risks and uncertainties, which would adversely affect the ability of the combined company to achieve expected results and benefits. Additional information concerning factors that could cause actual results to differ materially from those expressed in forward-looking statements is contained in Kraton’s filings with the U.S. Securities and Exchange Commission, including but not limited to Kraton’s most recent annual report on Form 10-K and subsequent quarterly reports on Form 10-Q and include, but are not limited to, risks related to the closing and benefits of the Acquisition; conditions in the global economy and capital markets; declines in raw material costs; limitations in the availability of raw materials we need to produce our products in the amounts or at the prices necessary for us to effectively and profitably operate our business; competition in our end-use markets from other producers of SBCs and from producers of products that can be substituted for our products; and other factors of which we are currently unaware or deem immaterial. Readers are cautioned not to place undue reliance on forward-looking statements. Forward-looking statements speak only as of the date they are made, and we assume no obligation to update such information in light of new information or future events.
Confidential
2
Unless otherwise specified, the term “Kraton” refers to Kraton Polymers LLC in this Confidential Information Memorandum. The terms “Arizona Chemical”, or “AZC” or “Target”, refer to Arizona Chemical Holdings Corporation. Reference to “TTM” means the last twelve months ending 9/30/15 for Kraton and the last twelve months ended 9/30/15 for Arizona Chemical. Throughout this memorandum, some tables and charts may not add up due to rounding. Kraton’s fiscal year ends December 31, and results have been adjusted to reflect calendar year ends where noted.
A. Transaction summary
On September 28, 2015, Kraton Performance Polymers, Inc. (NYSE: KRA), a global producer of highly-engineered polymers, announced that it had entered into a definitive agreement to acquire all of the capital stock of privately held Arizona Chemical for a cash purchase price of $1.37 billion (the “Acquisition”).
Kraton Performance Polymers, Inc., through its wholly-owned subsidiary Kraton, is a leading global producer of styrenic block copolymers (“SBCs”) and other engineered polymers. SBCs are highly-engineered synthetic elastomers, which Kraton invented and commercialized over 50 years ago. Kraton developed the first unhydrogenated styrenic block copolymers (“USBCs”) in 1964 and the first hydrogenated styrenic block copolymers (“HSBCs”) in the late 1960s. SBCs enhance the performance of numerous products by imparting greater flexibility, resilience, strength, durability and processability. Kraton’s products are found in many everyday applications, including personal care products such as disposable diapers and the rubberized grips of toothbrushes, razor blades and power tools. Kraton’s products are also used to impart tack and shear properties in a wide variety of adhesive products and to impart characteristics such as flexibility and durability in sealants and corrosion resistance in coatings. Kraton’s paving and roofing applications provide durability, extending road and roof life.
Arizona Chemical is a leading market-driven global specialty chemicals company that manufactures and sells high value performance products primarily derived from pine wood pulping co-products and is a leading player in the global pine chemicals industry. Arizona Chemical refines and further upgrades two primary feedstocks, crude tall oil (“CTO”) and crude sulfate turpentine (“CST”), both of which are co-products of the wood pulping process, into value-added specialty chemicals. Arizona Chemical’s end use market exposure is highly complementary with that of Kraton, particularly in markets such as adhesives, roads and construction, coatings and oilfield chemicals.
Pro forma for the Acquisition and for TTM September 30, 2015, Kraton would have revenue and Adjusted EBITDA(1) of $1.89 billion and $420 million, respectively, including approximately $65 million in annual run-rate transaction cost synergies, expected to be achieved by the end of 2018.
The Acquisition of Arizona Chemical is expected to provide a number of key benefits to Kraton:
ü Enhances global leader position in specialty chemicals with diverse global footprint
ü Highly complementary end use markets allowing for expansion of organic growth platforms
ü Provides diversification of feedstock and overall supplier base
ü Strong and stable free cash flow profile with significantly increased scale and profit margins
ü Opportunity to capitalize on significant low risk synergy opportunities
(1) See appendix for a complete reconciliation of GAAP financial measures to non -GAAP financial measures.
Confidential 3
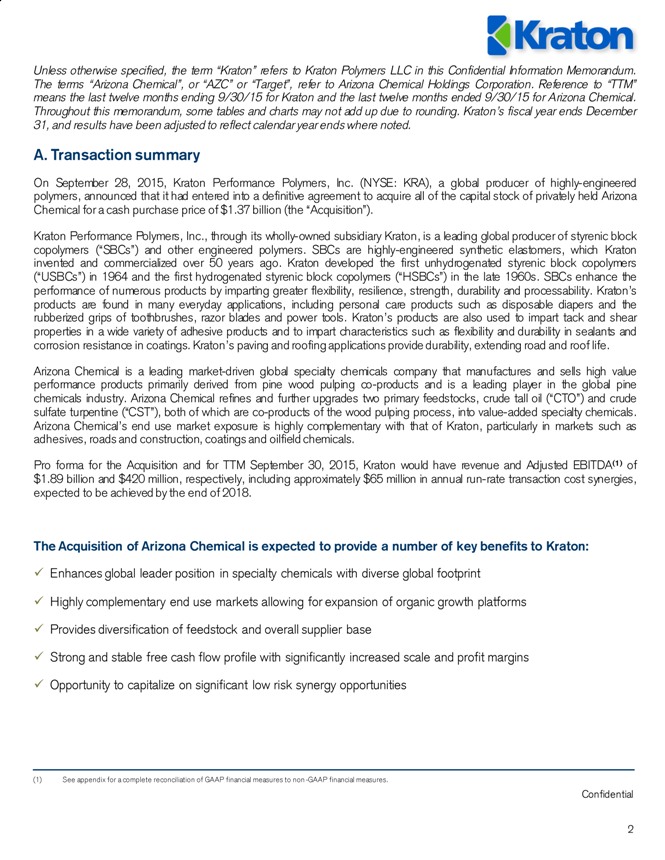
B. Company overview – Pro forma business overview
Pro forma Kraton
Revenue: $1.89 billion,
Adjusted EBITDA(1): $420 million TTM 9/30/2015 (22.2% margin)
Arizona Chemical
Revenue: $831 million,
Adjusted EBITDA(1): $187 million
TTM 9/30/2015
(22.5% margin) Kraton Revenue: $1.06 billion, Adjusted EBITDA(1): $168 million TTM 9/30/2015 (15.8% margin)
Specialty Polymers
CariflexTM Performance Products Adhesives
Roads & Construction
Tires
Chemical Intermediates
Products / description
Application & end markets
HSBCs
Polyisoprene rubber & polyisoprene rubber latex
USBCs
Rosin esters & dispersions
Terpenes & derivatives
Rosin esters
Tall oil fatty acid (“TOFA”) & derivatives
AMS resins
Terpenes & derivatives
Rosins & derivatives
TOFA & derivatives
Terpenes & derivatives
TOR
Consumer products
Wire & cable plastic outer layers
Disposable diapers
Medical applications
Medical applications
? Surgical gloves and condoms
? Catheters
? Stoppers for IV bags and medical bottles
Coatings
Specialized footwear
Paving & roofing
Labels & tapes
Printing plates
Personal care
Adhesive applications
Labels & tapes
Assembly
Packaging
Pavement marking
Paving & roofing
Additives for reclaimed asphalt pavement
High performance tires
? Winter tires
? All-season tires
Coatings
Fuel additives / lubricants / fluids
Oilfield chemicals
Mining
Paper sizing & spot markets
(1) See appendix for a complete reconciliation of GAAP financial measures to non -GAAP financial measures.
Confidential 4
B. Company overview – Kraton portfolio overview
Kraton is a leading global producer of SBCs and other engineered polymers. SBCs are highly-engineered synthetic elastomers, which Kraton invented and commercialized over 50 years ago. Kraton developed the first USBCs in 1964 and the first HSBCs in the late 1960s. Kraton’s SBCs enhance the performance of numerous products by imparting greater flexibility, resilience, strength, durability and processability. Kraton’s products are found in many everyday applications, including personal care products such as disposable diapers and the rubberized grips of toothbrushes, razor blades and power tools. Kraton’s products are also used to impart tack and shear properties in a wide variety of adhesive products and to impart characteristics such as flexibility and durability in sealants and corrosion resistance in coatings. Kraton’s paving and roofing applications provide durability, extending road and roof life.
Kraton’s products are organized into 3 main groups: CariflexTM, Specialty Polymers and Performance Products.
Revenue by geography TTM 9/30/2015
Revenue by product group TTM 9/30/2015 Asia 27% Europe 34% North America 34% South America 5% 39%
Specialty Polymers 34%
Performance Products 53%
Cariflex 13%
For the TTM period ended September 30, 2015, Kraton’s revenue and Adjusted EBITDA(2) was $1.1 billion and $168(1) million, respectively.
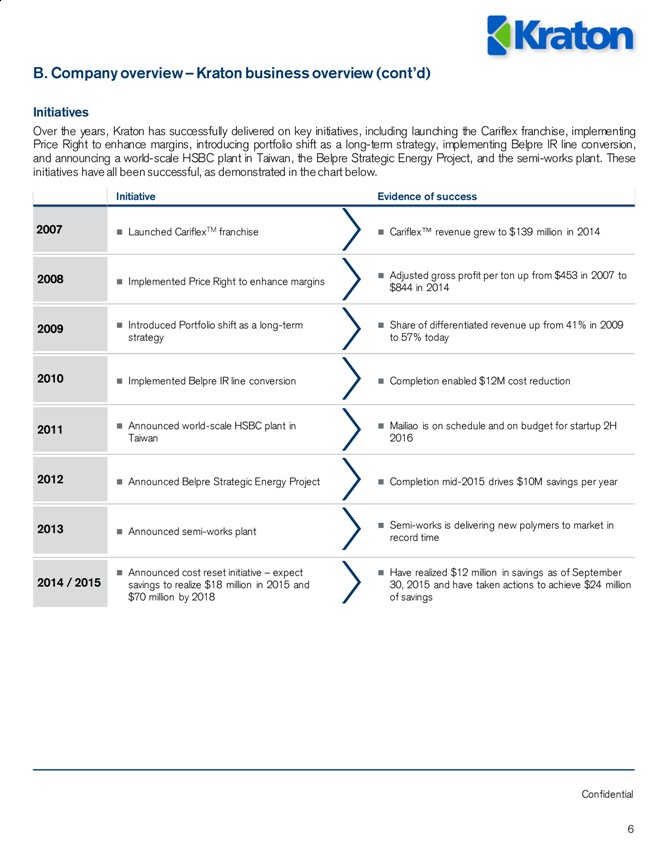
n Performance Products which are USBC products, are primarily used in paving and roofing applications, personal care applications and adhesives applications.
n Performance Products account for 53% of revenues, totaling $567.9 million for TTM September 30, 2015.
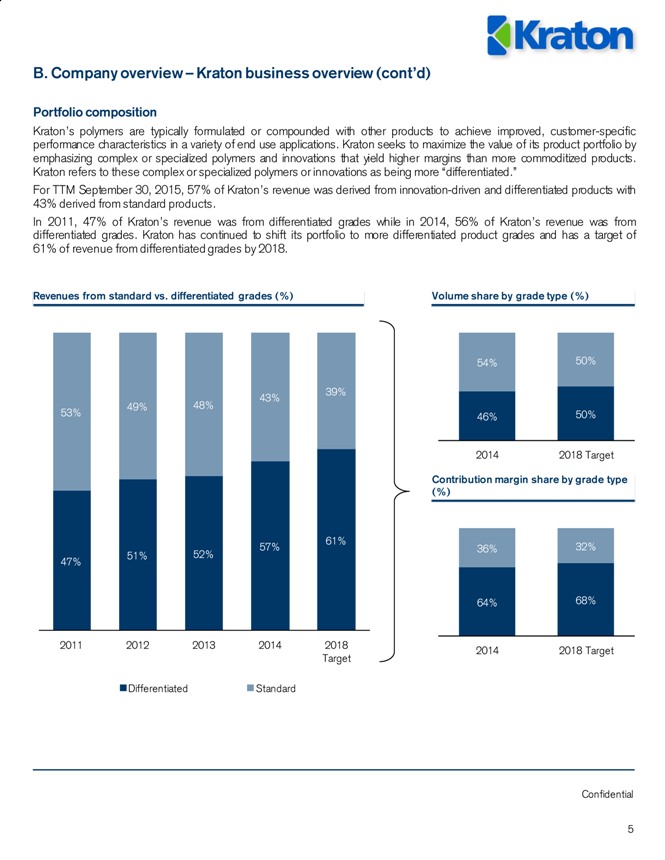
n Specialty Polymers are comprised of HSBC products which are used in lubricant additives, polymer modifications, personal care products as well as other high end applications.
n Specialty Products account for 34% of revenues, totaling $358.0 million for TTM September 30, 2015.
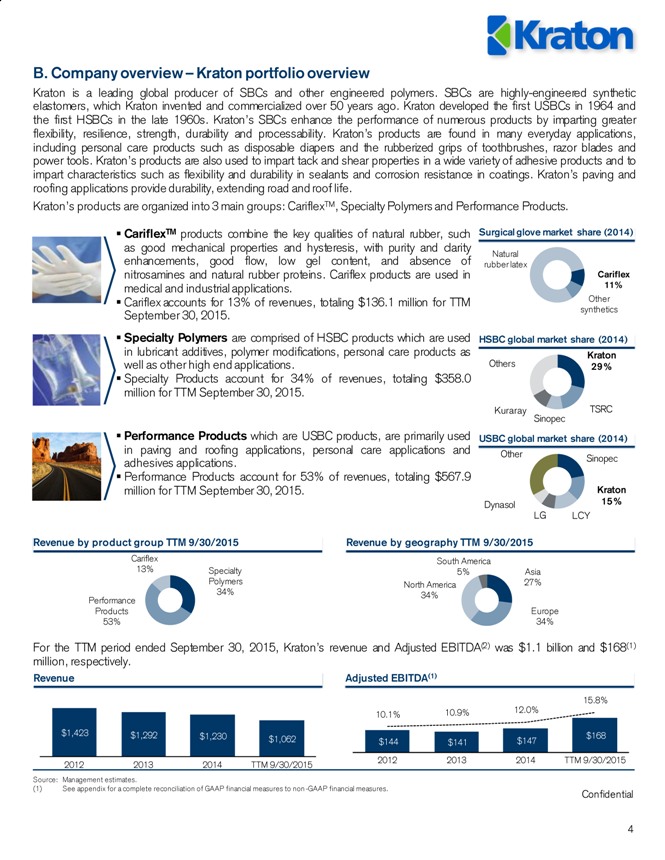
n CariflexTM products combine the key qualities of natural rubber, such as good mechanical properties and hysteresis, with purity and clarity enhancements, good flow, low gel content, and absence of nitrosamines and natural rubber proteins. Cariflex products are used in medical and industrial applications.
n Cariflex accounts for 13% of revenues, totaling $136.1 million for TTM September 30, 2015.
Revenue
Adjusted EBITDA(1)
Sinopec
Kraton 15% LCY LG Dynasol Other
USBC global market share (2014)
Kraton 29%
TSRC
Sinopec
Kuraray Others Cariflex 11% Other synthetics
Natural rubber latex
HSBC global market share (2014)
Surgical glove market share (2014)
Source: Management estimates.
(1) See appendix for a complete reconciliation of GAAP financial measures to non -GAAP financial measures. $1,423 $1,292 $1,230 $1,062
2012 2013 2014 TTM 9/30/2015
$144
$141
$147
$168 10.1% 10.9% 12.0% 15.8%
2012 2013 2014 TTM 9/30/2015
Confidential
5
B. Company overview – Kraton business overview (cont’d)
Portfolio composition
Kraton’s polymers are typically formulated or compounded with other products to achieve improved, customer-specific performance characteristics in a variety of end use applications. Kraton seeks to maximize the value of its product portfolio by emphasizing complex or specialized polymers and innovations that yield higher margins than more commoditized products. Kraton refers to these complex or specialized polymers or innovations as being more “differentiated.”
For TTM September 30, 2015, 57% of Kraton’s revenue was derived from innovation-driven and differentiated products with 43% derived from standard products.
In 2011, 47% of Kraton’s revenue was from differentiated grades while in 2014, 56% of Kraton’s revenue was from differentiated grades. Kraton has continued to shift its portfolio to more differentiated product grades and has a target of 61% of revenue from differentiated grades by 2018.
Volume share by grade type (%)
Contribution margin share by grade type (%) 47%
51%
52%
57%
61%
53%
49%
48%
43%
39%
2011 2012
2013 2014 2018 Target Differentiated Standard
Revenues from standard vs. differentiated grades (%)
46%
50%
54%
50%
2014
2018 Target
64% 68% 36% 32% 2014
2018 Target
Confidential
6
B. Company overview – Kraton business overview (cont’d)
Initiatives
Over the years, Kraton has successfully delivered on key initiatives, including launching the Cariflex franchise, implementing Price Right to enhance margins, introducing portfolio shift as a long-term strategy, implementing Belpre IR line conversion, and announcing a world-scale HSBC plant in Taiwan, the Belpre Strategic Energy Project, and the semi-works plant. These initiatives have all been successful, as demonstrated in the chart below.
2007
Initiative
Evidence of success
Launched CariflexTM franchise
Cariflex™ revenue grew to $139 million in 2014
2008
Implemented Price Right to enhance margins
Adjusted gross profit per ton up from $453 in 2007 to $844 in 2014
2009
Introduced Portfolio shift as a long-term strategy
Share of differentiated revenue up from 41% in 2009 to 57% today
2010
Implemented Belpre IR line conversion
Completion enabled $12M cost reduction
2011
Announced world-scale HSBC plant in Taiwan
Mailiao is on schedule and on budget for startup 2H 2016
2012
Announced Belpre Strategic Energy Project
Completion mid-2015 drives $10M savings per year
2013
Announced semi-works plant
Semi-works is delivering new polymers to market in record time
2014 / 2015
Announced cost reset initiative – expect savings to realize $18 million in 2015 and $70 million by 2018
Have realized $12 million in savings as of September 30, 2015 and have taken actions to achieve $24 million of savings
Confidential Adhesives 29%
Roads & Construction 7% Tires 5% Fuel Additives 6%
Oilfield Chemicals 4% Mining 1% Coatings 7% Metalworking Fluids & Lubricants 4% Inks 8% Flavors & Fragrances 4% Other Chemical Intermediates 14% Renewable Energy 11% Chemical Intermediates 57%
Adhesives 32%
Roads & Construction 6%
Tires 5% 7
B. Company overview – Arizona Chemical business overview
Revenue by end market (2014) Asia 13% Europe 37% Americas 50% 39%
Arizona Chemical is a leading, market-driven, global specialty chemicals company that manufactures and sells high value performance products primarily derived from pine wood pulping co-products. Arizona Chemical refines and further upgrades two primary feedstocks, CTO and CST, both of which are co-products of the wood pulping process, into value-added specialty chemicals.
Arizona Chemical’s business units are Adhesives, Roads & Construction, Tires and Chemical Intermediates.
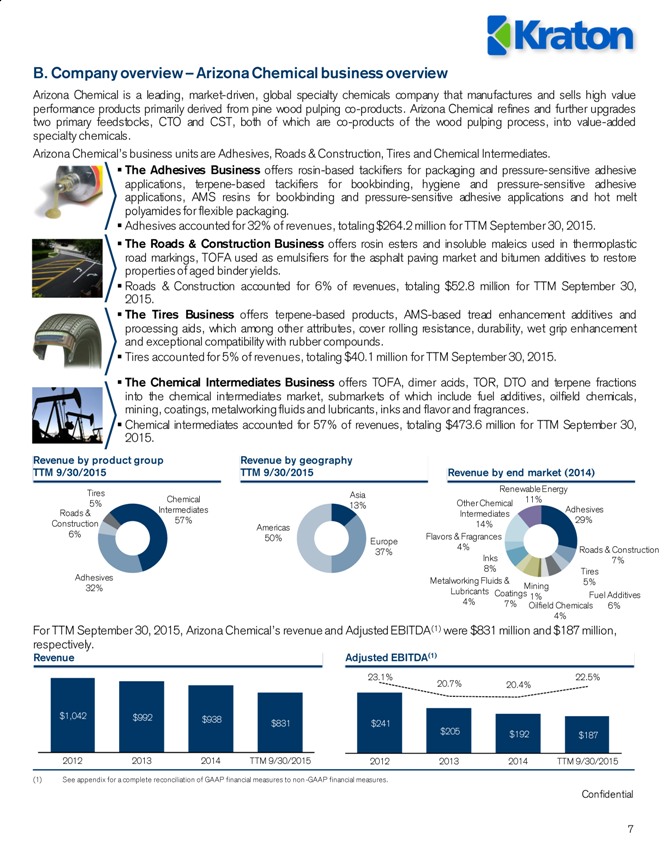
n The Adhesives Business offers rosin-based tackifiers for packaging and pressure-sensitive adhesive applications, terpene-based tackifiers for bookbinding, hygiene and pressure-sensitive adhesive applications, AMS resins for bookbinding and pressure-sensitive adhesive applications and hot melt polyamides for flexible packaging.
n Adhesives accounted for 32% of revenues, totaling $264.2 million for TTM September 30, 2015.
n The Roads & Construction Business offers rosin esters and insoluble maleics used in thermoplastic road markings, TOFA used as emulsifiers for the asphalt paving market and bitumen additives to restore properties of aged binder yields.
n Roads & Construction accounted for 6% of revenues, totaling $52.8 million for TTM September 30, 2015.
n The Tires Business offers terpene-based products, AMS-based tread enhancement additives and processing aids, which among other attributes, cover rolling resistance, durability, wet grip enhancement and exceptional compatibility with rubber compounds.
n Tires accounted for 5% of revenues, totaling $40.1 million for TTM September 30, 2015.
Revenue
Adjusted EBITDA(1)
n The Chemical Intermediates Business offers TOFA, dimer acids, TOR, DTO and terpene fractions into the chemical intermediates market, submarkets of which include fuel additives, oilfield chemicals, mining, coatings, metalworking fluids and lubricants, inks and flavor and fragrances.
n Chemical intermediates accounted for 57% of revenues, totaling $473.6 million for TTM September 30, 2015.
Revenue by geography
TTM 9/30/2015
Revenue by product group
TTM 9/30/2015
For TTM September 30, 2015, Arizona Chemical’s revenue and Adjusted EBITDA(1) were $831 million and $187 million, respectively. $1,042 $992
$938 $831 2012 2013
2014
TTM 9/30/2015
$241
$205 $192 $187 23.1% 20.7%
20.4% 22.5% 2012 2013
2014
TTM 9/30/2015
(1) See appendix for a complete reconciliation of GAAP financial measures to non -GAAP financial measures.
Kraton
Confidential 8
III. Strategic rationale & key credit highlights
Confidential
9
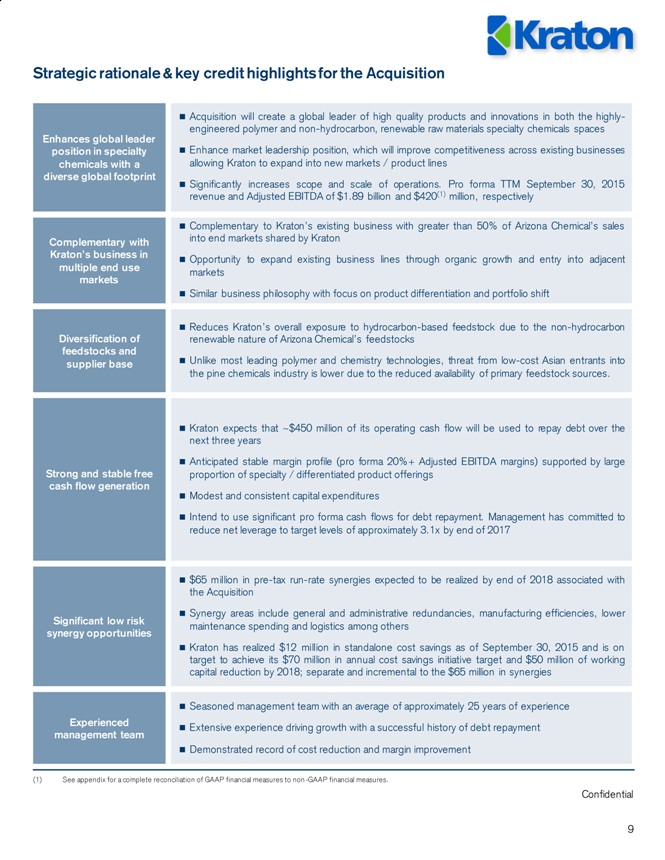
Strategic rationale & key credit highlights for the Acquisition
Enhances global leader position in specialty chemicals with a diverse global footprint
Acquisition will create a global leader of high quality products and innovations in both the highly-engineered polymer and non-hydrocarbon, renewable raw materials specialty chemicals spaces
Enhance market leadership position, which will improve competitiveness across existing businesses allowing Kraton to expand into new markets / product lines
Significantly increases scope and scale of operations. Pro forma TTM September 30, 2015 revenue and Adjusted EBITDA of $1.89 billion and $420(1) million, respectively
Complementary with Kraton’s business in multiple end use markets
Complementary to Kraton’s existing business with greater than 50% of Arizona Chemical’s sales into end markets shared by Kraton
Opportunity to expand existing business lines through organic growth and entry into adjacent markets
Similar business philosophy with focus on product differentiation and portfolio shift
Diversification of feedstocks and supplier base
Reduces Kraton’s overall exposure to hydrocarbon-based feedstock due to the non-hydrocarbon renewable nature of Arizona Chemical’s feedstocks
Unlike most leading polymer and chemistry technologies, threat from low-cost Asian entrants into the pine chemicals industry is lower due to the reduced availability of primary feedstock sources.
Strong and stable free cash flow generation
Kraton expects that ~$450 million of its operating cash flow will be used to repay debt over the next three years
Anticipated stable margin profile (pro forma 20%+ Adjusted EBITDA margins) supported by large proportion of specialty / differentiated product offerings
Modest and consistent capital expenditures
Intend to use significant pro forma cash flows for debt repayment. Management has committed to reduce net leverage to target levels of approximately 3.1x by end of 2017
Significant low risk synergy opportunities
$65 million in pre-tax run-rate synergies expected to be realized by end of 2018 associated with the Acquisition
Synergy areas include general and administrative redundancies, manufacturing efficiencies, lower maintenance spending and logistics among others
Kraton has realized $12 million in standalone cost savings as of September 30, 2015 and is on target to achieve its $70 million in annual cost savings initiative target and $50 million of working capital reduction by 2018; separate and incremental to the $65 million in synergies
Experienced management team
Seasoned management team with an average of approximately 25 years of experience
Extensive experience driving growth with a successful history of debt repayment
Demonstrated record of cost reduction and margin improvement
(1) See appendix for a complete reconciliation of GAAP financial measures to non -GAAP financial measures.
Confidential 10
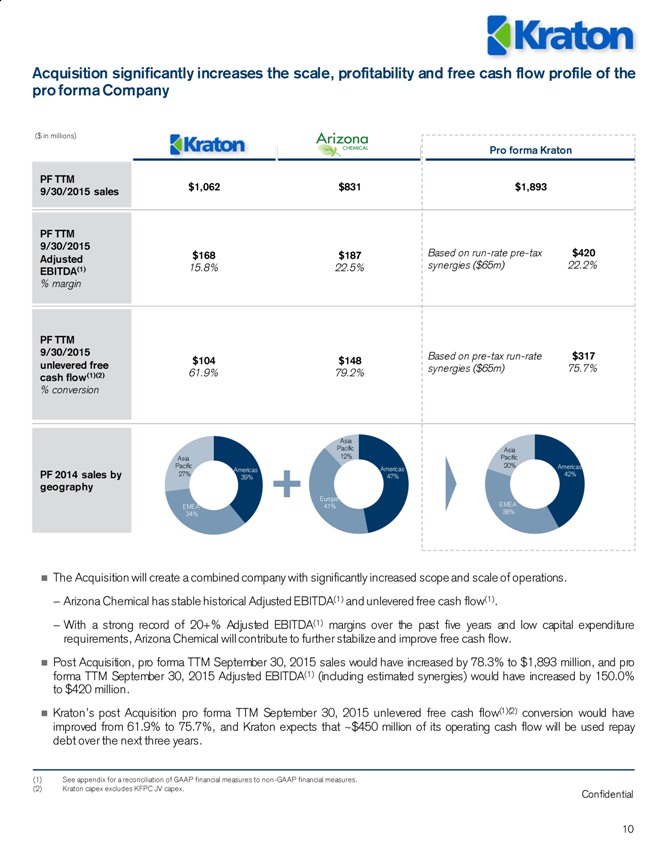
Acquisition significantly increases the scale, profitability and free cash flow profile of the pro forma Company PF TTM 9/30/2015 unlevered free cash flow(1)(2) % conversion PF TTM 9/30/2015 sales
$1,062 PF TTM 9/30/2015 Adjusted EBITDA(1) % margin
Kraton
Arizona Chemical
Pro forma Kraton
$831
$1,893
Based on run-rate pre-tax synergies ($65m)
$420 22.2%
$168
15.8%
$187
22.5%
Based on pre-tax run-rate synergies ($65m)
$317 75.7%
$104
61.9%
$148
79.2% ($ in millions)
PF 2014 sales by geography Americas 39%
EMEA 34%
Asia Pacific 27%
Americas 47%
Europe 41%
Asia Pacific 12%
Americas 42%
EMEA 38%
Asia Pacific 20%
(1) See appendix for a reconciliation of GAAP financial measures to non -GAAP financial measures.
(2) Kraton capex excludes KFPC JV capex.
The Acquisition will create a combined company with significantly increased scope and scale of operations.
Arizona Chemical has stable historical Adjusted EBITDA(1) and unlevered free cash flow(1).
With a strong record of 20+% Adjusted EBITDA(1) margins over the past five years and low capital expenditure requirements, Arizona Chemical will contribute to further stabilize and improve free cash flow.
Post Acquisition, pro forma TTM September 30, 2015 sales would have increased by 78.3% to $1,893 million, and pro forma TTM September 30, 2015 Adjusted EBITDA(1) (including estimated synergies) would have increased by 150.0% to $420 million.
Kraton’s post Acquisition pro forma TTM September 30, 2015 unlevered free cash flow(1)(2) conversion would have improved from 61.9% to 75.7%, and Kraton expects that ~$450 million of its operating cash flow will be used repay debt over the next three years.
Confidential
11
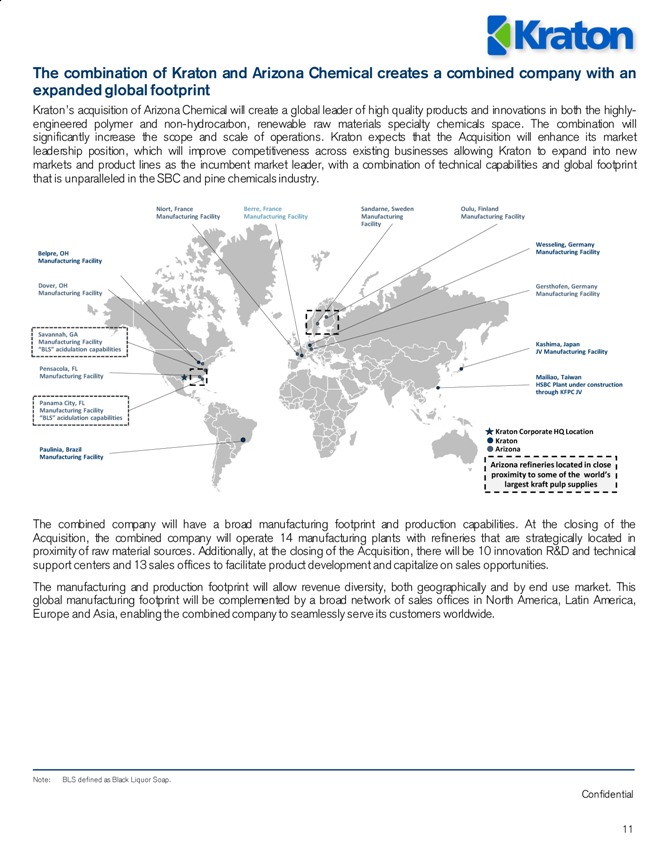
The combination of Kraton and Arizona Chemical creates a combined company with an expanded global footprint
Kraton’s acquisition of Arizona Chemical will create a global leader of high quality products and innovations in both the highly-engineered polymer and non-hydrocarbon, renewable raw materials specialty chemicals space. The combination will significantly increase the scope and scale of operations. Kraton expects that the Acquisition will enhance its market leadership position, which will improve competitiveness across existing businesses allowing Kraton to expand into new markets and product lines as the incumbent market leader, with a combination of technical capabilities and global footprint that is unparalleled in the SBC and pine chemicals industry. Wesseling, Germany Manufacturing Facility Berre, France Manufacturing Facility Belpre, OH Manufacturing Facility Paulinia, Brazil Manufacturing Facility Mailiao, Taiwan HSBC Plant under construction through KFPC JV Kashima, Japan JV Manufacturing Facility Dover, OH Manufacturing Facility Savannah, GA Manufacturing Facility “BLS” acidulation capabilities Pensacola, FL Manufacturing Facility Panama City, FL Manufacturing Facility “BLS” acidulation capabilities Niort, France Manufacturing Facility Sandarne, Sweden Manufacturing Facility Oulu, Finland Manufacturing Facility Gersthofen, Germany Manufacturing Facility Arizona Kraton Kraton Corporate HQ Location Arizona refineries located in close proximity to some of the world’s largest kraft pulp supplies
The combined company will have a broad manufacturing footprint and production capabilities. At the closing of the Acquisition, the combined company will operate 14 manufacturing plants with refineries that are strategically located in proximity of raw material sources. Additionally, at the closing of the Acquisition, there will be 10 innovation R&D and technical support centers and 13 sales offices to facilitate product development and capitalize on sales opportunities.
The manufacturing and production footprint will allow revenue diversity, both geographically and by end use market. This global manufacturing footprint will be complemented by a broad network of sales offices in North America, Latin America, Europe and Asia, enabling the combined company to seamlessly serve its customers worldwide.
Note: BLS defined as Black Liquor Soap.
Confidential
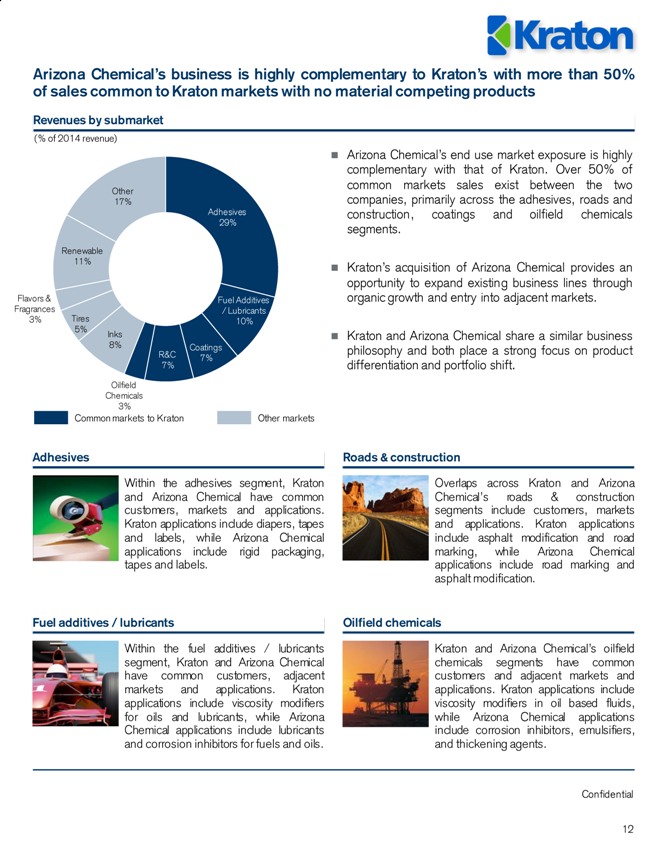
12 Adhesives 29%
Fuel Additives / Lubricants 10%
Coatings 7%
R&C 7%
Oilfield Chemicals 3%
Inks 8%
Tires 5%
Flavors & Fragrances 3%
Renewable 11%
Other 17%
Arizona Chemical’s business is highly complementary to Kraton’s with more than 50% of sales common to Kraton markets with no material competing products
Adhesives
Revenues by submarket
(% of 2014 revenue)
Within the adhesives segment, Kraton and Arizona Chemical have common customers, markets and applications. Kraton applications include diapers, tapes and labels, while Arizona Chemical applications include rigid packaging, tapes and labels.
Common markets to Kraton
Other markets
Arizona Chemical’s end use market exposure is highly complementary with that of Kraton. Over 50% of common markets sales exist between the two companies, primarily across the adhesives, roads and construction, coatings and oilfield chemicals segments.
Kraton’s acquisition of Arizona Chemical provides an opportunity to expand existing business lines through organic growth and entry into adjacent markets.
Kraton and Arizona Chemical share a similar business philosophy and both place a strong focus on product differentiation and portfolio shift.
Roads & construction
Overlaps across Kraton and Arizona Chemical’s roads & construction segments include customers, markets and applications. Kraton applications include asphalt modification and road marking, while Arizona Chemical applications include road marking and asphalt modification.
Fuel additives / lubricants
Oilfield chemicals
Within the fuel additives / lubricants segment, Kraton and Arizona Chemical have common customers, adjacent markets and applications. Kraton applications include viscosity modifiers for oils and lubricants, while Arizona Chemical applications include lubricants and corrosion inhibitors for fuels and oils.
Kraton and Arizona Chemical’s oilfield chemicals segments have common customers and adjacent markets and applications. Kraton applications include viscosity modifiers in oil based fluids, while Arizona Chemical applications include corrosion inhibitors, emulsifiers, and thickening agents.
Confidential
13
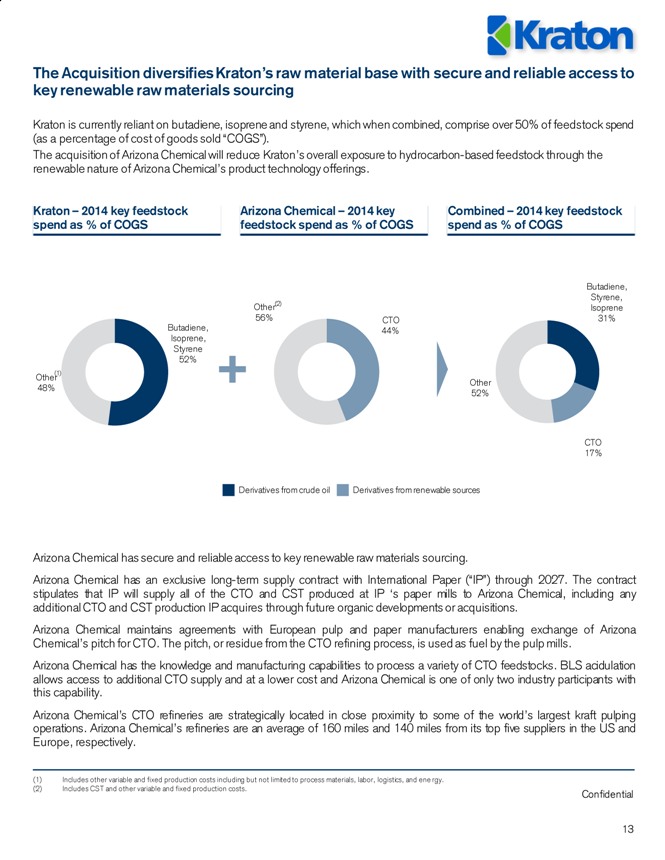
Combined – 2014 key feedstock spend as % of COGS
Arizona Chemical – 2014 key feedstock spend as % of COGS
Kraton – 2014 key feedstock spend as % of COGS
Butadiene, Isoprene, Styrene 52%
Other 48%
(1)
CTO 44%
Other 56%
(2)
Butadiene, Styrene, Isoprene 31%
CTO 17%
Other 52%
Derivatives from crude oil
Derivatives from renewable sources
The Acquisition diversifies Kraton’s raw material base with secure and reliable access to key renewable raw materials sourcing
Kraton is currently reliant on butadiene, isoprene and styrene, which when combined, comprise over 50% of feedstock spend (as a percentage of cost of goods sold “COGS”).
The acquisition of Arizona Chemical will reduce Kraton’s overall exposure to hydrocarbon-based feedstock through the renewable nature of Arizona Chemical’s product technology offerings.
Arizona Chemical has secure and reliable access to key renewable raw materials sourcing.
Arizona Chemical has an exclusive long-term supply contract with International Paper (“IP”) through 2027. The contract stipulates that IP will supply all of the CTO and CST produced at IP ‘s paper mills to Arizona Chemical, including any additional CTO and CST production IP acquires through future organic developments or acquisitions.
Arizona Chemical maintains agreements with European pulp and paper manufacturers enabling exchange of Arizona Chemical’s pitch for CTO. The pitch, or residue from the CTO refining process, is used as fuel by the pulp mills.
Arizona Chemical has the knowledge and manufacturing capabilities to process a variety of CTO feedstocks. BLS acidulation allows access to additional CTO supply and at a lower cost and Arizona Chemical is one of only two industry participants with this capability.
Arizona Chemical’s CTO refineries are strategically located in close proximity to some of the world’s largest kraft pulping operations. Arizona Chemical’s refineries are an average of 160 miles and 140 miles from its top five suppliers in the US and Europe, respectively.
(1) Includes other variable and fixed production costs including but not limited to process materials, labor, logistics, and ene rgy.
(2) Includes CST and other variable and fixed production costs.
Confidential
14
(1) See appendix for a reconciliation of GAAP financial measures to non -GAAP financial measures.
(2) Kraton adjusted to incorporate 50% of KFPC capex.
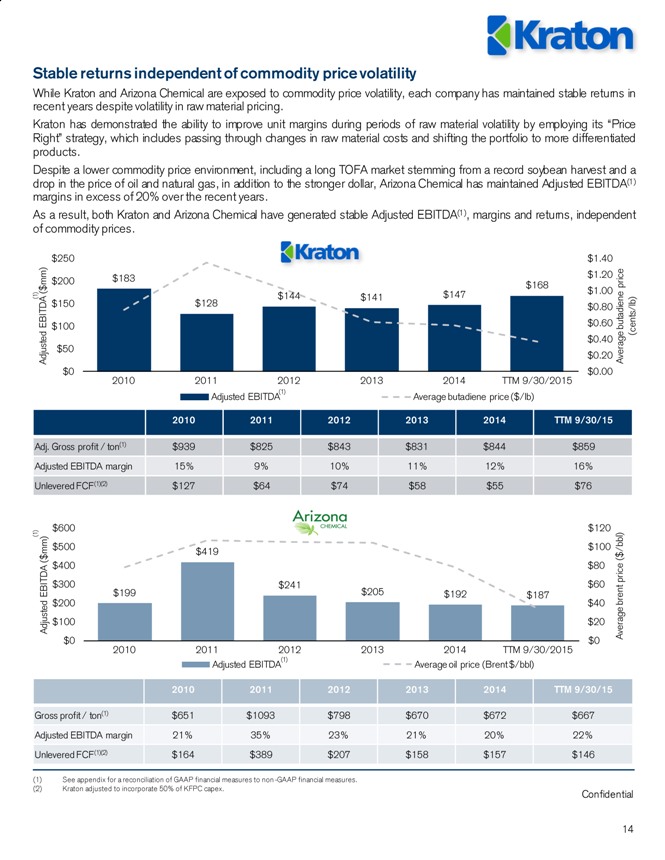
Stable returns independent of commodity price volatility
While Kraton and Arizona Chemical are exposed to commodity price volatility, each company has maintained stable returns in recent years despite volatility in raw material pricing.
Kraton has demonstrated the ability to improve unit margins during periods of raw material volatility by employing its “Price Right” strategy, which includes passing through changes in raw material costs and shifting the portfolio to more differentiated products.
Despite a lower commodity price environment, including a long TOFA market stemming from a record soybean harvest and a drop in the price of oil and natural gas, in addition to the stronger dollar, Arizona Chemical has maintained Adjusted EBITDA(1) margins in excess of 20% over the recent years.
As a result, both Kraton and Arizona Chemical have generated stable Adjusted EBITDA(1), margins and returns, independent of commodity prices.
$183
$128
$144
$141
$147
$168
$0.00
$0.20
$0.40
$0.60
$0.80
$1.00
$1.20
$1.40
$0
$50
$100
$150
$200
$250
2010
2011
2012
2013
2014
TTM 9/30/2015
Average butadiene price (cents/lb)
Adjusted EBITDA ($mm)
Adjusted EBITDA
Average butadiene price ($/lb)
$199
$419
$241
$205
$192
$187
$0
$20
$40
$60
$80
$100
$120
$0
$100
$200
$300
$400
$500
$600
2010
2011
2012
2013
2014
TTM 9/30/2015
Average brent price ($/bbl)
Adjusted EBITDA ($mm)
Adjusted EBITDA
Average oil price (Brent $/bbl) 2010 2011 2012 2013 2014 TTM 9/30/15
Gross profit / ton(1) $651 $1093 $798 $670 $672 $667
Adjusted EBITDA margin 21% 35% 23% 21% 20% 22%
Unlevered FCF(1)(2) $164 $389 $207 $158 $157 $146
Confidential
15
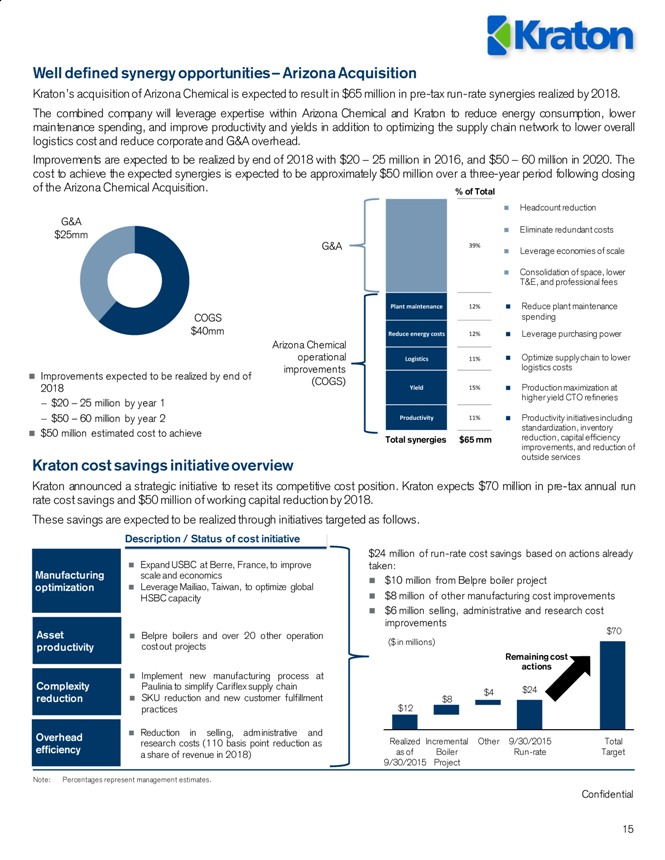
Well defined synergy opportunities – Arizona Acquisition
Kraton’s acquisition of Arizona Chemical is expected to result in $65 million in pre-tax run-rate synergies realized by 2018.
The combined company will leverage expertise within Arizona Chemical and Kraton to reduce energy consumption, lower maintenance spending, and improve productivity and yields in addition to optimizing the supply chain network to lower overall logistics cost and reduce corporate and G&A overhead.
Improvements are expected to be realized by end of 2018 with $20 – 25 million in 2016, and $50 – 60 million in 2020. The cost to achieve the expected synergies is expected to be approximately $50 million over a three-year period following closing of the Arizona Chemical Acquisition.
COGS $40mm
G&A $25mm
Reduce plant maintenance spending
Leverage purchasing power
Optimize supply chain to lower logistics costs
Production maximization at higher yield CTO refineries
Productivity initiatives including standardization, inventory reduction, capital efficiency improvements, and reduction of outside services
Arizona Chemical operational improvements
(COGS)
G&A
Headcount reduction
Eliminate redundant costs
Leverage economies of scale
Consolidation of space, lower T&E, and professional fees
Kraton cost savings initiative overview
Kraton announced a strategic initiative to reset its competitive cost position. Kraton expects $70 million in pre-tax annual run rate cost savings and $50 million of working capital reduction by 2018.
These savings are expected to be realized through initiatives targeted as follows.
Manufacturing optimization
Asset productivity
Complexity reduction
Overhead efficiency
Expand USBC at Berre, France, to improve scale and economics
Leverage Mailiao, Taiwan, to optimize global HSBC capacity
Belpre boilers and over 20 other operation cost out projects
Implement new manufacturing process at Paulinia to simplify Cariflex supply chain
SKU reduction and new customer fulfillment practices
Reduction in selling, administrative and research costs (110 basis point reduction as a share of revenue in 2018)
Description / Status of cost initiative $24 million of run-rate cost savings based on actions already taken:
$10 million from Belpre boiler project
$8 million of other manufacturing cost improvements
$6 million selling, administrative and research cost improvements
$12
$8
$4 $24 $70 Realized as of 9/30/2015 Incremental Boiler Project
Other 9/30/2015 Run-rate
Total Target
Remaining cost actions
($ in millions)
Improvements expected to be realized by end of 2018
$20 – 25 million by year 1
$50 – 60 million by year 2
$50 million estimated cost to achieve
Plant maintenance 12% Reduce energy costs 12% Logistics 11% Yield 15% Productivity 11% 39%
Total synergies
$65 mm
Note: Percentages represent management estimates.
% of Total
Confidential
16
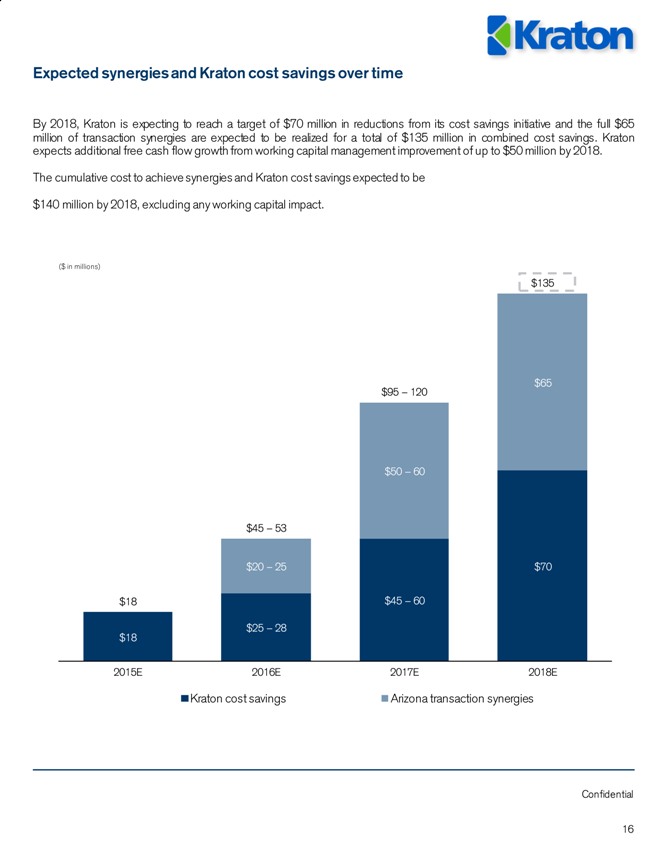
Expected synergies and Kraton cost savings over time
$18
$25 – 28
$45 – 60 $70
$20 – 25
$50 – 60 $65
$18
$45 – 53
$95 – 120 $135
2015E 2016E 2017E
2018E
Kraton cost savings
Arizona transaction synergies
($ in millions)
By 2018, Kraton is expecting to reach a target of $70 million in reductions from its cost savings initiative and the full $65 million of transaction synergies are expected to be realized for a total of $135 million in combined cost savings. Kraton expects additional free cash flow growth from working capital management improvement of up to $50 million by 2018.
The cumulative cost to achieve synergies and Kraton cost savings expected to be
$140 million by 2018, excluding any working capital impact.
Confidential
17
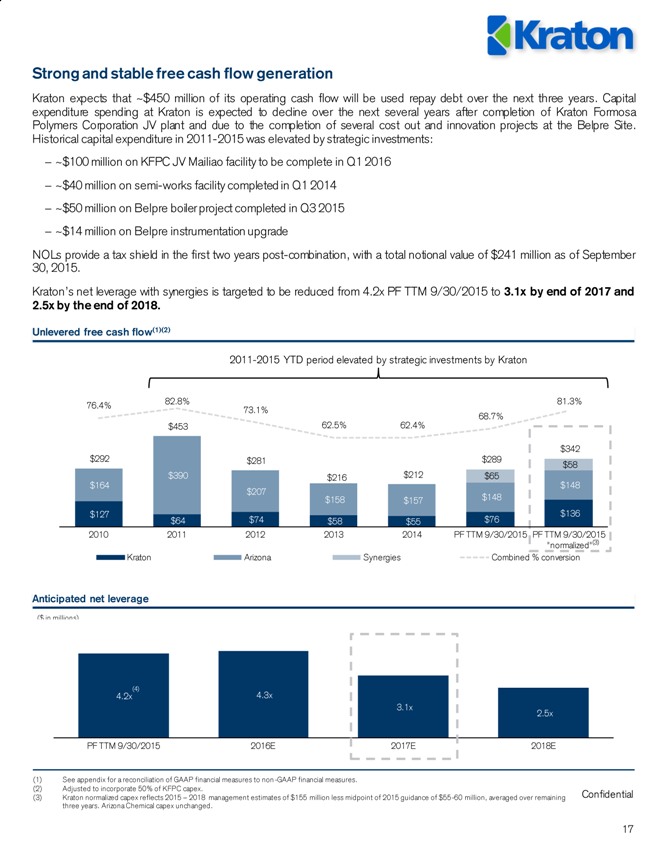
Strong and stable free cash flow generation
Kraton expects that ~$450 million of its operating cash flow will be used repay debt over the next three years. Capital expenditure spending at Kraton is expected to decline over the next several years after completion of Kraton Formosa Polymers Corporation JV plant and due to the completion of several cost out and innovation projects at the Belpre Site. Historical capital expenditure in 2011-2015 was elevated by strategic investments:
? ~$100 million on KFPC JV Mailiao facility to be complete in Q1 2016
? ~$40 million on semi-works facility completed in Q1 2014
? ~$50 million on Belpre boiler project completed in Q3 2015
? ~$14 million on Belpre instrumentation upgrade
NOLs provide a tax shield in the first two years post-combination, with a total notional value of $241 million as of September 30, 2015.
Kraton’s net leverage with synergies is targeted to be reduced from 4.2x PF TTM 9/30/2015 to 3.1x by end of 2017 and 2.5x by the end of 2018.
Unlevered free cash flow(1)(2)
Anticipated net leverage
4.2x
4.3x
3.1x 2.5x
PF TTM 9/30/2015
2016E
2017E
2018E
($ in millions)
(1) See appendix for a reconciliation of GAAP financial measures to non -GAAP financial measures.
(2) Adjusted to incorporate 50% of KFPC capex.
(3) Kraton normalized capex reflects 2015 – 2018 management estimates of $155 million less midpoint of 2015 guidance of $55-60 million, averaged over remaining three years. Arizona Chemical capex unchanged.
2011-2015 YTD period elevated by strategic investments by Kraton
(3)
(4)
$127
$64
$74
$58
$55
$76 $136
$164
$390
$207
$158
$157
$148
$148
$65
$58
$292
$453
$281
$216
$212
$289 $342
76.4%
82.8%
73.1%
62.5%
62.4%
68.7%
81.3%
2010
2011
2012
2013
2014
PF TTM 9/30/2015
PF TTM 9/30/2015 “normalized”
Kraton Arizona
Synergies
Combined % conversion
Confidential 18
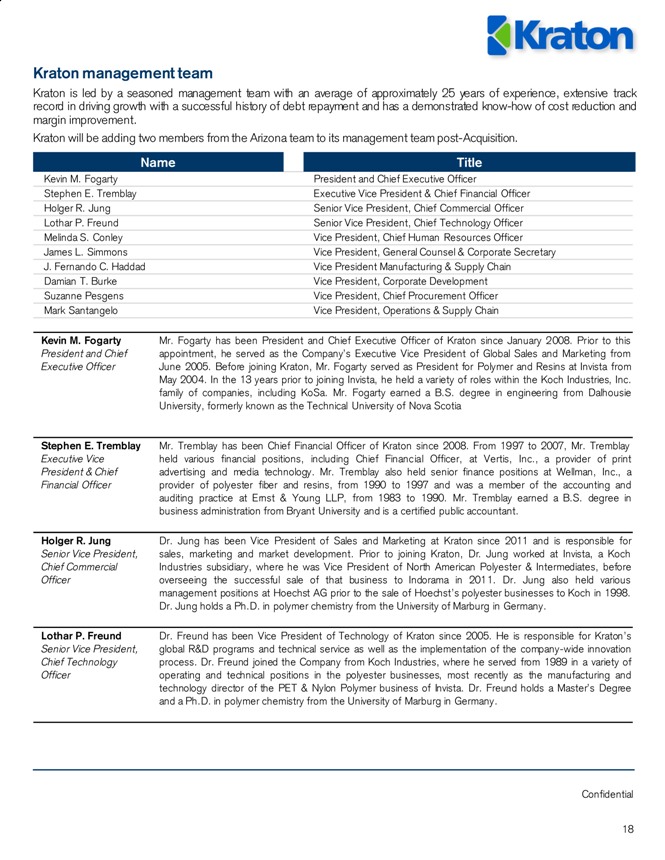
Kraton management team
Kraton is led by a seasoned management team with an average of approximately 25 years of experience, extensive track record in driving growth with a successful history of debt repayment and has a demonstrated know-how of cost reduction and margin improvement.
Kraton will be adding two members from the Arizona team to its management team post-Acquisition. Kevin M. Fogarty President and Chief Executive Officer
Stephen E. Tremblay Executive Vice President & Chief Financial Officer
Holger R. Jung Senior Vice President, Chief Commercial Officer
Lothar P. Freund Senior Vice President, Chief Technology Officer
Melinda S. Conley Vice President, Chief Human Resources Officer
James L. Simmons Vice President, General Counsel & Corporate Secretary
J. Fernando C. Haddad Vice President Manufacturing & Supply Chain
Damian T. Burke Vice President, Corporate Development
Suzanne Pesgens Vice President, Chief Procurement Officer
Mark Santangelo Vice President, Operations & Supply Chain
Confidential
19
Kraton management team (cont’d) Melinda S. Conley
Vice President, Chief Human Resources Officer Ms. Conley was appointed Vice President, Human Resources, in May 2012. Prior to joining Kraton, from 2006 to 2011, Ms. Conley served in various capacities; including Vice President, Total Rewards for Dean Foods, a multi-billion dollar publicly-traded food and beverage company, with responsibility for all compensation and benefits. Ms. Conley earned a B.A. in Speech Communication and an M.A from the School of Labor and Employment Relations at the University of Illinois at Urbana-Champaign, and received her J.D. from Southern Methodist University.
James L. Simmons
Vice President, General Counsel & Corporate Secretary Jay Simmons was named Vice President, General Counsel and Corporate Secretary in December 2014. Mr. Simmons joined Kraton in January 2010 and served in various capacities in Kraton’s legal department, including most recently as Deputy General Counsel and Assistant Secretary. Mr. Simmons earned B.A. and M.A. degrees from Stephen F. Austin State University and his J.D. degree from the University of Houston Law Center.
J. Fernando C. Haddad
Vice President Manufacturing & Supply Chain Mr. Haddad was named Vice President, Manufacturing & Supply Chain in April 2015. He is responsible for Kraton’s global manufacturing, supply planning, and environmental, safety, & health. Prior to joining Kraton, Mr. Haddad worked as the Global Manufacturing & Supply Chain Director for UOP, a Honeywell Company, from 2013 to 2014. Mr. Haddad holds a Bachelor of Science degree in Chemical Engineering from the State University of Campinas (Brazil) and a MBA from Faculdade Getulio Vargas (Brazil).
Damian T. Burke
Vice President, Corporate Development Mr. Burke was appointed Vice President of Corporate Development in 2011. Mr. Burke joined Kraton from Oldcastle, the North American subsidiary of CRH plc., where he was a Senior Vice President for Development and Strategy from 2005 to 2011. Prior to Oldcastle, Mr. Burke was a consultant at Bain & Company. He started his career at ExxonMobil, serving in a variety of roles in Europe and the United States. Mr. Burke earned a Master’s degree in chemical engineering from University College London and an MBA from the Wharton School of the University of Pennsylvania.
Suzanne Pesgens
Vice President,
Chief Procurement Officer Ms. Pesgens, currently Arizona Chemical’s Global Director of Procurement will be promoted to VP and Chief Procurement Officer for the combined company. All non-strategic raw materials (SRM) procurement activity will report through Suzanne.
Mark Santangelo
Vice President,
Operations & Supply Chain Mr. Santangelo, Arizona Chemical’s current VP, Operations and Supply Chain, will continue in this capacity. All manufacturing, engineering, planning, EH&S and supply chain activities, encompassing Arizona Chemical’s existing global manufacturing operations, will continue to report through Mark.
Kraton
Confidential 20
IV. Company overview
Kraton
Confidential 21
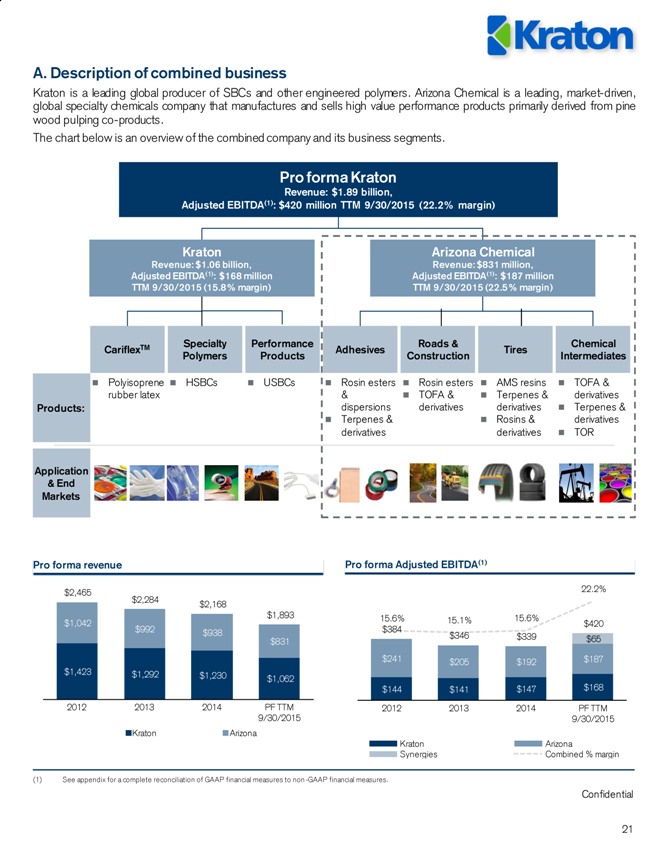
A. Description of combined business
Kraton is a leading global producer of SBCs and other engineered polymers. Arizona Chemical is a leading, market-driven, global specialty chemicals company that manufactures and sells high value performance products primarily derived from pine wood pulping co-products.
The chart below is an overview of the combined company and its business segments.
Pro forma revenue
Pro forma Adjusted EBITDA(1) Pro forma Kraton Revenue: $1.89 billion, Adjusted EBITDA(1): $420 million TTM 9/30/2015 (22.2% margin)
Arizona Chemical
Revenue: $831 million,
Adjusted EBITDA(1): $187 million
TTM 9/30/2015 (22.5% margin)
Specialty Polymers
CariflexTM
Performance Products
Adhesives
Roads & Construction Tires Chemical Intermediates Products: Application & End Markets
HSBCs
Polyisoprene rubber latex
USBCs
Rosin esters & dispersions
Terpenes & derivatives
Rosin esters
TOFA & derivatives
AMS resins
Terpenes & derivatives
Rosins & derivatives
TOFA & derivatives
Terpenes & derivatives
TOR
Kraton
Revenue: $1.06 billion,
Adjusted EBITDA(1): $168 million
TTM 9/30/2015 (15.8% margin) $1,423 $1,292 $1,230
$1,062
$1,042
$992 $938 $831 $2,465 $2,284
$2,168
$1,893 2012 2013 2014 PF TTM 9/30/2015 Kraton Arizona
(1) See appendix for a complete reconciliation of GAAP financial measures to non -GAAP financial measures.
$144
$141 $147 $168 $241 $205
$192
$187 $65 $384 $346 $339 $420 15.6%
15.1% 15.6%
22.2%
2012 2013 2014 PF TTM 9/30/2015 Kraton
Arizona
Synergies Combined % margin
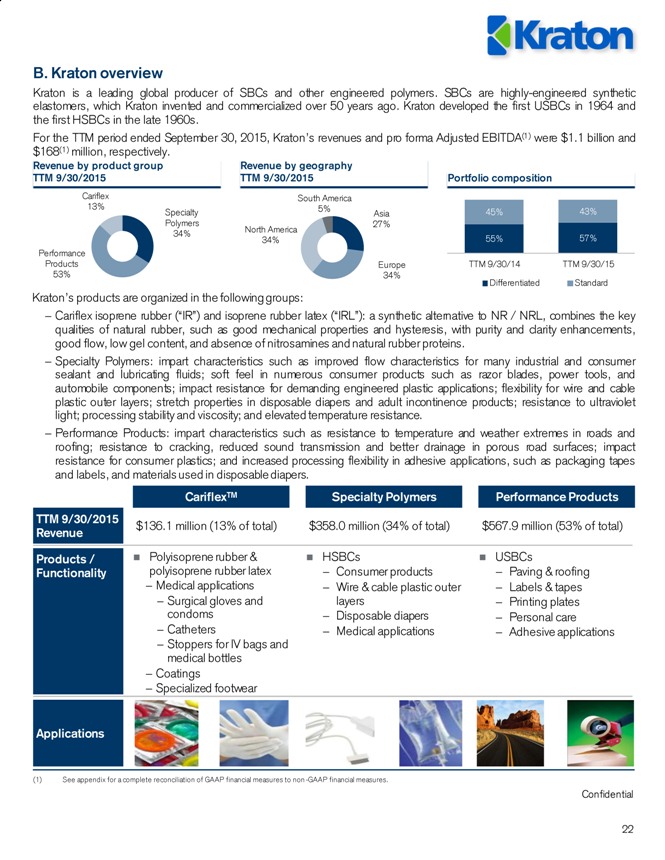
Confidential 22 CariflexTM Specialty Polymers Performance Products
TTM 9/30/2015 Revenue Products / Functionality Applications
$136.1 million (13% of total)
$358.0 million (34% of total)
$567.9 million (53% of total)
Polyisoprene rubber & polyisoprene rubber latex
Medical applications
Surgical gloves and condoms
Catheters
Stoppers for IV bags and medical bottles
Coatings
Specialized footwear
HSBCs
Consumer products
Wire & cable plastic outer layers
Disposable diapers
Medical applications
USBCs
Paving & roofing
Labels & tapes
Printing plates
Personal care
Adhesive applications
B. Kraton overview
Kraton is a leading global producer of SBCs and other engineered polymers. SBCs are highly-engineered synthetic elastomers, which Kraton invented and commercialized over 50 years ago. Kraton developed the first USBCs in 1964 and the first HSBCs in the late 1960s.
For the TTM period ended September 30, 2015, Kraton’s revenues and pro forma Adjusted EBITDA(1) were $1.1 billion and $168(1) million, respectively.
Kraton’s products are organized in the following groups:
Cariflex isoprene rubber (“IR”) and isoprene rubber latex (“IRL”): a synthetic alternative to NR / NRL, combines the key qualities of natural rubber, such as good mechanical properties and hysteresis, with purity and clarity enhancements, good flow, low gel content, and absence of nitrosamines and natural rubber proteins.
Specialty Polymers: impart characteristics such as improved flow characteristics for many industrial and consumer sealant and lubricating fluids; soft feel in numerous consumer products such as razor blades, power tools, and automobile components; impact resistance for demanding engineered plastic applications; flexibility for wire and cable plastic outer layers; stretch properties in disposable diapers and adult incontinence products; resistance to ultraviolet light; processing stability and viscosity; and elevated temperature resistance.
Performance Products: impart characteristics such as resistance to temperature and weather extremes in roads and roofing; resistance to cracking, reduced sound transmission and better drainage in porous road surfaces; impact resistance for consumer plastics; and increased processing flexibility in adhesive applications, such as packaging tapes and labels, and materials used in disposable diapers.
Portfolio composition
55%
57%
45% 43% TTM 9/30/14 TTM 9/30/15
Differentiated Standard
Revenue by geography
TTM 9/30/2015
Revenue by product group
TTM 9/30/2015
Asia 27% Europe 34% North America 34%
South America 5% 39% Specialty Polymers 34%
Performance Products 53%
Cariflex 13%
(1) See appendix for a complete reconciliation of GAAP financial measures to non -GAAP financial measures.
Kraton
Confidential 23
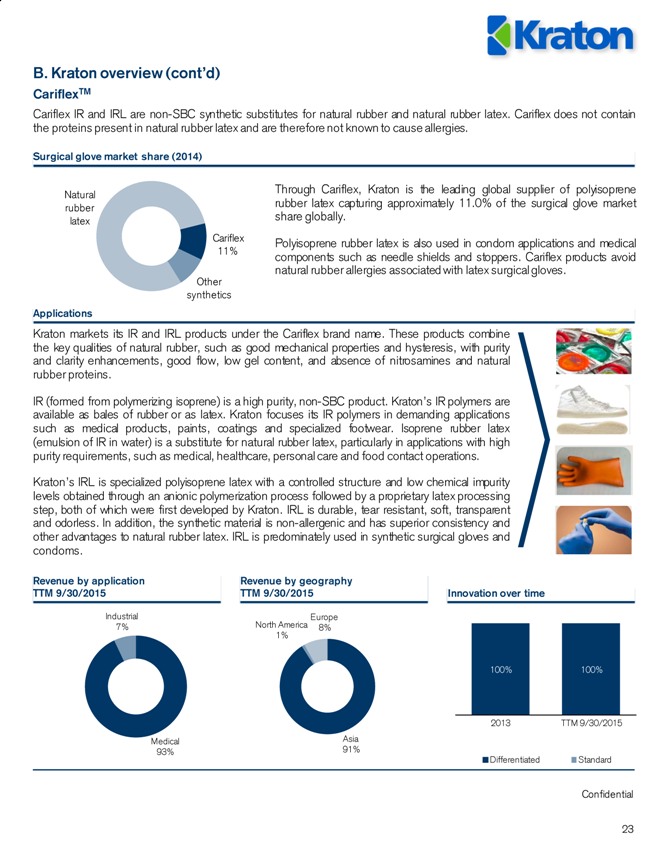
B. Kraton overview (cont’d)
CariflexTM
Cariflex IR and IRL are non-SBC synthetic substitutes for natural rubber and natural rubber latex. Cariflex does not contain the proteins present in natural rubber latex and are therefore not known to cause allergies.
Revenue by application
TTM 9/30/2015
Revenue by geography
TTM 9/30/2015
Surgical glove market share (2014)
Through Cariflex, Kraton is the leading global supplier of polyisoprene rubber latex capturing approximately 11.0% of the surgical glove market share globally.
Polyisoprene rubber latex is also used in condom applications and medical components such as needle shields and stoppers. Cariflex products avoid natural rubber allergies associated with latex surgical gloves.
Applications
Innovation over time
Cariflex 11%
Other synthetics
Natural rubber latex
Kraton markets its IR and IRL products under the Cariflex brand name. These products combine the key qualities of natural rubber, such as good mechanical properties and hysteresis, with purity and clarity enhancements, good flow, low gel content, and absence of nitrosamines and natural rubber proteins.
IR (formed from polymerizing isoprene) is a high purity, non-SBC product. Kraton’s IR polymers are available as bales of rubber or as latex. Kraton focuses its IR polymers in demanding applications such as medical products, paints, coatings and specialized footwear. Isoprene rubber latex (emulsion of IR in water) is a substitute for natural rubber latex, particularly in applications with high purity requirements, such as medical, healthcare, personal care and food contact operations.
Kraton’s IRL is specialized polyisoprene latex with a controlled structure and low chemical impurity levels obtained through an anionic polymerization process followed by a proprietary latex processing step, both of which were first developed by Kraton. IRL is durable, tear resistant, soft, transparent and odorless. In addition, the synthetic material is non-allergenic and has superior consistency and other advantages to natural rubber latex. IRL is predominately used in synthetic surgical gloves and condoms. Medical 93% Industrial 7%
Asia 91%
North America 1%
Europe 8%
100%
100%
2013
TTM 9/30/2015 Differentiated
Standard
Kraton
Confidential
24
B. Kraton overview (cont’d)
CariflexTM (cont’d)
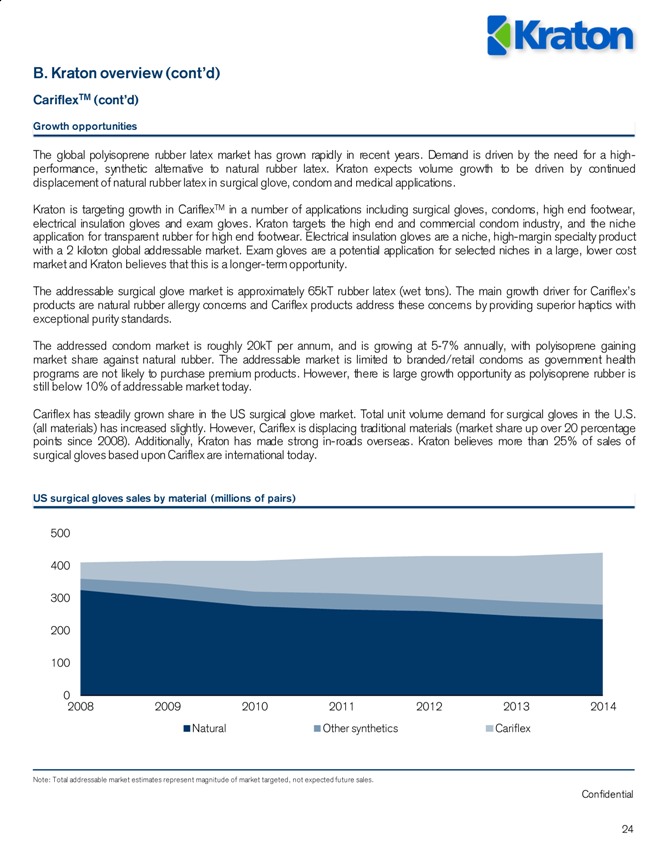
The global polyisoprene rubber latex market has grown rapidly in recent years. Demand is driven by the need for a high-performance, synthetic alternative to natural rubber latex. Kraton expects volume growth to be driven by continued displacement of natural rubber latex in surgical glove, condom and medical applications.
Kraton is targeting growth in CariflexTM in a number of applications including surgical gloves, condoms, high end footwear, electrical insulation gloves and exam gloves. Kraton targets the high end and commercial condom industry, and the niche application for transparent rubber for high end footwear. Electrical insulation gloves are a niche, high-margin specialty product with a 2 kiloton global addressable market. Exam gloves are a potential application for selected niches in a large, lower cost market and Kraton believes that this is a longer-term opportunity.
The addressable surgical glove market is approximately 65kT rubber latex (wet tons). The main growth driver for Cariflex’s products are natural rubber allergy concerns and Cariflex products address these concerns by providing superior haptics with exceptional purity standards.
The addressed condom market is roughly 20kT per annum, and is growing at 5?7% annually, with polyisoprene gaining market share against natural rubber. The addressable market is limited to branded/retail condoms as government health programs are not likely to purchase premium products. However, there is large growth opportunity as polyisoprene rubber is still below 10% of addressable market today.
Cariflex has steadily grown share in the US surgical glove market. Total unit volume demand for surgical gloves in the U.S. (all materials) has increased slightly. However, Cariflex is displacing traditional materials (market share up over 20 percentage points since 2008). Additionally, Kraton has made strong in-roads overseas. Kraton believes more than 25% of sales of surgical gloves based upon Cariflex are international today.
Note: Total addressable market estimates represent magnitude of market targeted, not expected future sales.
Growth opportunities
0
100
200
300
400
500
2008
2009
2010
2011 2012
2013
2014 Natural
Other synthetics
Cariflex
US surgical gloves sales by material (millions of pairs)
Kraton
Confidential
25
B. Kraton overview (cont’d)
Specialty Polymers
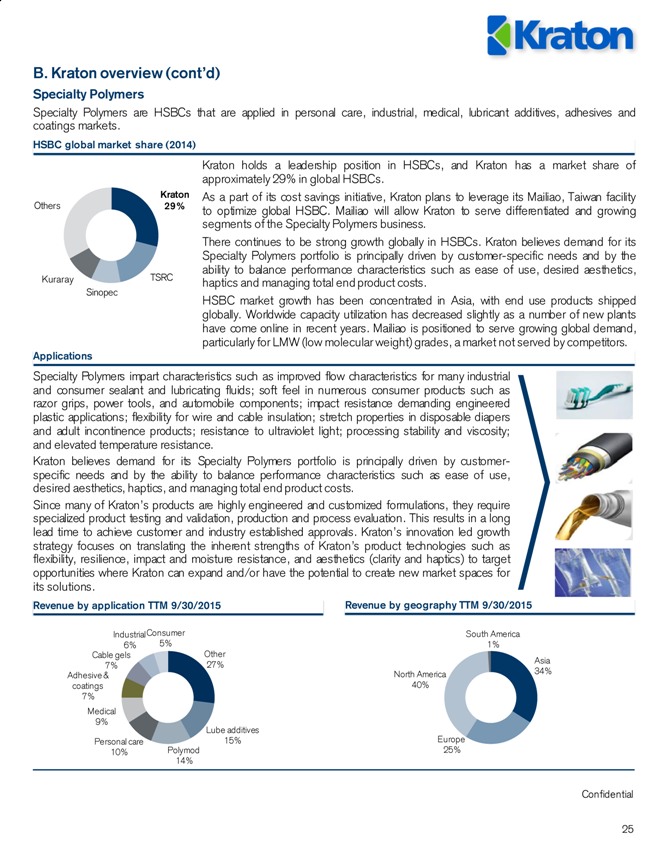
Specialty Polymers are HSBCs that are applied in personal care, industrial, medical, lubricant additives, adhesives and coatings markets.
HSBC global market share (2014)
Kraton holds a leadership position in HSBCs, and Kraton has a market share of approximately 29% in global HSBCs.
As a part of its cost savings initiative, Kraton plans to leverage its Mailiao, Taiwan facility to optimize global HSBC. Mailiao will allow Kraton to serve differentiated and growing segments of the Specialty Polymers business.
There continues to be strong growth globally in HSBCs. Kraton believes demand for its Specialty Polymers portfolio is principally driven by customer-specific needs and by the ability to balance performance characteristics such as ease of use, desired aesthetics, haptics and managing total end product costs.
HSBC market growth has been concentrated in Asia, with end use products shipped globally. Worldwide capacity utilization has decreased slightly as a number of new plants have come online in recent years. Mailiao is positioned to serve growing global demand, particularly for LMW (low molecular weight) grades, a market not served by competitors.
Applications
Kraton 29%
TSRC
Sinopec
Kuraray
Others
Specialty Polymers impart characteristics such as improved flow characteristics for many industrial and consumer sealant and lubricating fluids; soft feel in numerous consumer products such as razor grips, power tools, and automobile components; impact resistance demanding engineered plastic applications; flexibility for wire and cable insulation; stretch properties in disposable diapers and adult incontinence products; resistance to ultraviolet light; processing stability and viscosity; and elevated temperature resistance.
Kraton believes demand for its Specialty Polymers portfolio is principally driven by customer-specific needs and by the ability to balance performance characteristics such as ease of use, desired aesthetics, haptics, and managing total end product costs.
Since many of Kraton’s products are highly engineered and customized formulations, they require specialized product testing and validation, production and process evaluation. This results in a long lead time to achieve customer and industry established approvals. Kraton’s innovation led growth strategy focuses on translating the inherent strengths of Kraton’s product technologies such as flexibility, resilience, impact and moisture resistance, and aesthetics (clarity and haptics) to target opportunities where Kraton can expand and/or have the potential to create new market spaces for its solutions.
Other 27%
Lube additives 15%
Polymod 14%
Personal care 10%
Medical 9%
Adhesive & coatings 7%
Cable gels 7%
Industrial 6%
Consumer 5%
Asia 34%
Europe 25%
North America 40%
South America 1%
Revenue by application TTM 9/30/2015
Revenue by geography TTM 9/30/2015

Kraton
Confidential
26
B. Kraton overview (cont’d)
Performance Products
Performance Products are USBCs that are used in the paving and roofing, labels, tapes, printing plates and personal care end use markets.
Sinopec
Kraton 15%
LCY
LG
Dynasol
Other
Revenue by application
TTM 9/30/2015
Revenue by geography
TTM 9/30/2015
USBC global market share (2014)
Applications
Kraton’s USBC polymers are primarily used in paving and roofing, personal care and adhesive applications.
In paving and roofing applications, Kraton’s styrene butadiene styrene (“SBS”) polymer grades are used to impart performance characteristics such as resistance to temperature and weather extremes, resistance to cracking, reduced sound transmission and better drainage in porous road surfaces. In personal care applications, Kraton’s SBS and SIS products enable thin, stretchable films used in diapers. In adhesive applications, Kraton’s polymers are used to achieve desired adhesive properties such as bond strength, specific adhesion, consistent performance to specification and processing speed.
Kraton believes demand for utilization of SBC based adhesives is primarily driven by the desire for cost reduction and higher performance.
Innovation over time
Paving 27%
Roofing 18%
Personal care 20%
Packaging & industrial adhesives 18%
Other 10%
Industrial 7%
Asia 9%
Europe 45%
North America 38%
South America 8%
35%
38%
65%
62%
2013
TTM 9/30/2015
Differentiated
Standard
Through its Performance Products business unit, Kraton holds a leadership position in USBCs, with approximately 15% of the USBC global market share by volume. USBC demand in Asia declined in 2014 due to butadiene price dynamics and lower infrastructure demand. Kraton’s core USBC markets in Europe and the Americas have remained steady.
Kraton is working to improve its global USBC cost position to better compete against exports from Asia into its core markets. Kraton plans to improve its competitive position in its core USBC markets in Europe and North America by expanding its USBC capacity in Berre, France. The expansion will allow Kraton to leverage favorable feedstock supply and an improved cost structure to more effectively compete against Asian imports.
Source: Management estimates.
Kraton
Confidential
27
C. Joint venture
Mailiao, Taiwan
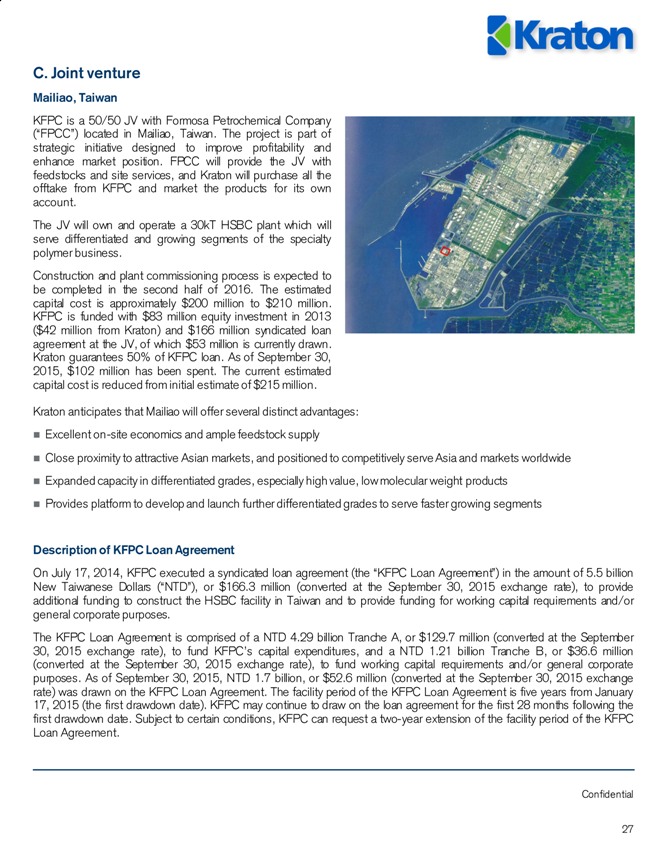
KFPC is a 50/50 JV with Formosa Petrochemical Company (“FPCC”) located in Mailiao, Taiwan. The project is part of strategic initiative designed to improve profitability and enhance market position. FPCC will provide the JV with feedstocks and site services, and Kraton will purchase all the offtake from KFPC and market the products for its own account.
The JV will own and operate a 30kT HSBC plant which will serve differentiated and growing segments of the specialty polymer business.
Construction and plant commissioning process is expected to be completed in the second half of 2016. The estimated capital cost is approximately $200 million to $210 million. KFPC is funded with $83 million equity investment in 2013 ($42 million from Kraton) and $166 million syndicated loan agreement at the JV, of which $53 million is currently drawn. Kraton guarantees 50% of KFPC loan. As of September 30, 2015, $102 million has been spent. The current estimated capital cost is reduced from initial estimate of $215 million.
Kraton anticipates that Mailiao will offer several distinct advantages:
Excellent on-site economics and ample feedstock supply
Close proximity to attractive Asian markets, and positioned to competitively serve Asia and markets worldwide
Expanded capacity in differentiated grades, especially high value, low molecular weight products
Provides platform to develop and launch further differentiated grades to serve faster growing segments
Description of KFPC Loan Agreement
On July 17, 2014, KFPC executed a syndicated loan agreement (the “KFPC Loan Agreement”) in the amount of 5.5 billion New Taiwanese Dollars (“NTD”), or $166.3 million (converted at the September 30, 2015 exchange rate), to provide additional funding to construct the HSBC facility in Taiwan and to provide funding for working capital requirements and/or general corporate purposes.
The KFPC Loan Agreement is comprised of a NTD 4.29 billion Tranche A, or $129.7 million (converted at the September 30, 2015 exchange rate), to fund KFPC’s capital expenditures, and a NTD 1.21 billion Tranche B, or $36.6 million (converted at the September 30, 2015 exchange rate), to fund working capital requirements and/or general corporate purposes. As of September 30, 2015, NTD 1.7 billion, or $52.6 million (converted at the September 30, 2015 exchange rate) was drawn on the KFPC Loan Agreement. The facility period of the KFPC Loan Agreement is five years from January 17, 2015 (the first drawdown date). KFPC may continue to draw on the loan agreement for the first 28 months following the first drawdown date. Subject to certain conditions, KFPC can request a two-year extension of the facility period of the KFPC Loan Agreement.
Kraton
Confidential
28
C. Joint venture (cont’d)
Mailiao, Taiwan (cont’d)
Description of KFPC Loan Agreement (cont’d)
The total outstanding principal amount is payable in six semi-annual installments with the first payment due on July 17, 2017 and each subsequent payment due every six months thereafter. The first five installments shall be in an amount equal to 10% of the outstanding principal amount and the final installment shall be in an amount equal to the remaining 50% of the outstanding principal amount. In the event the extension period is granted, the final 50% of the outstanding principal amount shall be repaid in five equal semi-annual installments with the first installment due on the original final maturity date.
The KFPC Loan Agreement is subject to a variable interest rate composed of a fixed 0.8% margin plus the three-month or six-month fixing rate of the Taipei Interbank Offered Rate (depending on the interest period as selected by KFPC in the drawdown request or the interest period notice), subject to a floor of 1.7%. Interest is payable on a monthly basis.
The KFPC Loan Agreement contains certain financial covenants which change during the term of the KFPC Loan Agreement. The financial covenants include a maximum debt to equity ratio of 3.0 to 1.0 through 2016, which will decrease to 2.0 to 1.0 in 2017 and 1.2 to 1.0 in 2018; a minimum tangible net worth requirement of $50.0 million through 2018, which will increase to $100.0 million in 2019; and a minimum interest coverage ratio of 2.5 to 1.0 commencing in 2016, which will increase to 5.0 to 1.0 in 2017. In each case, these covenants are calculated and tested on an annual basis. Formosa Petrochemical Corporation and Kraton Polymers LLC are the guarantors of the KFPC Loan Agreement with each guarantor guaranteeing 50% of the indebtedness on an unsecured basis. At September 30, 2015, KFPC was in compliance with the covenants under the KFPC Loan Agreement.
Kashima, Japan
Kraton’s Kashima manufacturing facility is owned and operated by Kraton JSR Elastomers K.K., (“KJE”), a joint venture between Kraton and JSR Corporation.
The Kashima facility is located northeast of Tokyo on the main island of Honshu at a JSR site that includes several synthetic rubber facilities and butadiene and isoprene extraction units. This facility is serviced by rail, barge and truck connections. Production capacity is approximately 31 kilotons of USBCs, and Kraton is generally entitled to 50% of this production pursuant to its joint venture agreement.
JSR markets its portion of the production under its own trademarks, and Kraton markets its portion of the production under the Kraton® brand name although this amount may vary from time to time based on the economic interest of the joint venture. Kraton and JSR each have a right of first refusal on the transfer of the joint venture interests of the other.
D. Customers
Kraton’s customers are diversified by industry and geography with more than 800 customers in over 60 countries.
Kraton has had a long-standing relationship with many of its customers and works closely with them to design products that meet application-specific performance and quality requirements. Kraton have a diverse customer base, with no single customer accounting for more than 10.0% of its revenue in 2014, and its top 10 customers together represent approximately 31.7% of its revenues in 2014. Because of the technical expertise and investment required to develop many of Kraton’s product formulations and the lead times required to replace them, Kraton believes many of its customers would likely incur additional costs by changing to an alternative vendor.
Kraton
Confidential
29
E. Competition
Kraton also competes against a broad range of alternative, non-SBC products within each of its product groups.
Kraton’s most significant competitors in the SBC industry are: Asahi Chemical, Chi Mei, Dynasol Elastomers, Kuraray Company, Korea Kumho P.C., LCY, LG Chemical, Sinopec, Taiwan Synthetic Rubber Corporation, Versalis, Voronezh and Zeon Corporation. Generally, however, Kraton believes, no individual competitor competes across all of its product applications.
Kraton competes with other SBC producers and against producers of non-SBC competing materials, primarily on the basis of price, breadth of product availability, product quality and speed of service from order to delivery. Kraton believes its customers also base their supply decisions on the supplier’s ability to design and produce custom products and on the availability of technical support.
CariflexTM
Kraton’s products primarily compete with natural rubber, conventional Ziegler Natta sourced solid IR, halo butyl rubber and several synthetic latex alternatives, notably neoprene, nitrile and polychloroprene latex rubber, as well as polyurethane.
Specialty Polymers
Kraton’s Specialty Polymers products primarily compete against a variety of chemical and non-chemical alternatives including, but not limited to, thermoplastic vulcanizate, thermoplastic polyurethane, PVC, thermoplastic polyolefin, polyethylene terephthalate, polycarbonate, polyamide and ethylene-propylene-diene-monomer based products. Kraton believes demand for its Specialty Polymers portfolio is principally driven by customer-specific needs and by the ability to balance performance characteristics such as ease of use, desired aesthetics, haptics, and managing total end product costs.
Since many of Kraton’s products are highly engineered and customized formulations, they require specialized product testing and validation, production and process evaluation. This results in a long lead time to achieve customer and industry established approvals. Kraton’s innovation led growth strategy focuses on translating the inherent strengths of its product technologies such as flexibility, resilience, impact and moisture resistance, and aesthetics (clarity and haptics) to target opportunities where it can expand and/or have the potential to create new market spaces for its solutions.
Performance Products
In paving and roofing applications, the Performance Products segment primarily compete with chemicals such as styrene-butadiene rubber latex, acetates, polyphosphoric acids and thermoplastic materials like ethylene-propylene-diene-monomer, polyethylene, atactic polypropylene and unmodified asphalts. Kraton believes that customer choice for these markets is driven principally by total end-product cost, temperature performance, bitumen source and application. Styrene-butadiene-styrene (“SBS”)-modified asphalt in roofing applications produces stronger and more durable felts and shingles, thus reducing the possibility of damage from weather, ice and water build-up and therefore extending service life. SBS modified asphalt pavements enhance the strength and elasticity of asphalt-based paving compositions over an extended temperature range, thus increasing resistance to wear, rutting and cracking and again extending service life. For example, Kraton’s HiMA technology polymers provide better rut and cracking resistance than other elastic binders, while achieving 25-40% reduction in road thickness without any major sacrifice of viscosity or temperature performance. Kraton believes this innovation will extend road life by allowing pavements to withstand heavy traffic loads and varying climate conditions.
In personal care applications, Kraton’s products primarily compete against low priced alternatives such as metallocenes. Kraton believes that customer choice for these markets is driven principally by total end-product cost and performance.
In adhesives applications, Performance Products primarily compete with acrylics, silicones and solvent-based rubber systems. The choice between these materials is influenced by bond strength, specific adhesion, consistent performance to specification, processing speed, hot-melt application, resistance to water and total end-product cost. Kraton’s SBCs are compatible with many other formulating ingredients. For example, Kraton has expanded its offering of formulated compounds for adhesives for protective films that provide improved adhesive performance with no residue or haze after removal. Kraton believe demand for utilization of SBC based adhesives is primarily driven by cost reduction and higher performance.
Kraton
Confidential
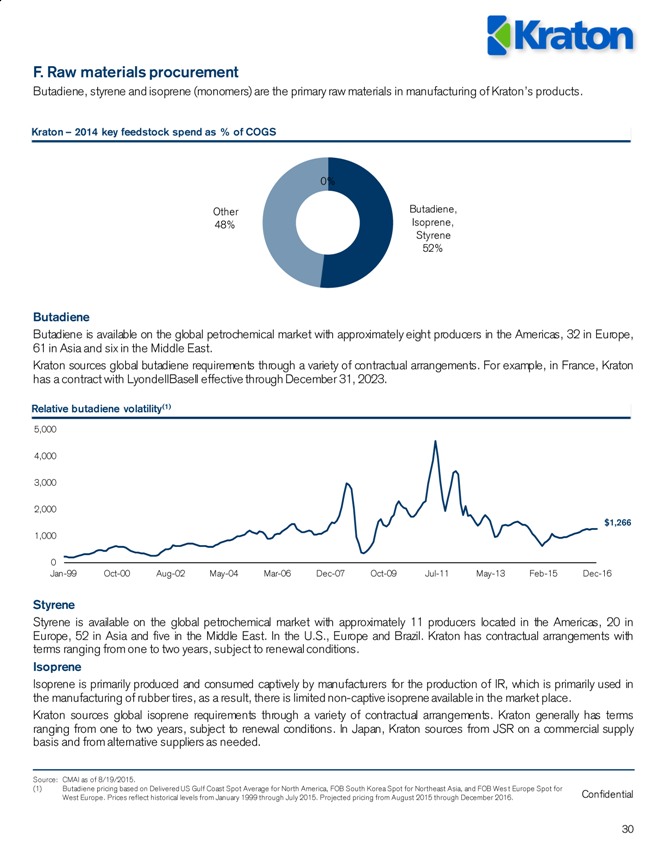
F. Raw materials procurement
Butadiene, styrene and isoprene (monomers) are the primary raw materials in manufacturing of Kraton’s products.
Butadiene
Butadiene is available on the global petrochemical market with approximately eight producers in the Americas, 32 in Europe, 61 in Asia and six in the Middle East.
Kraton sources global butadiene requirements through a variety of contractual arrangements. For example, in France, Kraton has a contract with LyondellBasell effective through December 31, 2023.
Styrene
Styrene is available on the global petrochemical market with approximately 11 producers located in the Americas, 20 in Europe, 52 in Asia and five in the Middle East. In the U.S., Europe and Brazil. Kraton has contractual arrangements with terms ranging from one to two years, subject to renewal conditions.
Isoprene
Isoprene is primarily produced and consumed captively by manufacturers for the production of IR, which is primarily used in the manufacturing of rubber tires, as a result, there is limited non-captive isoprene available in the market place.
Kraton sources global isoprene requirements through a variety of contractual arrangements. Kraton generally has terms ranging from one to two years, subject to renewal conditions. In Japan, Kraton sources from JSR on a commercial supply basis and from alternative suppliers as needed.
30
Source: CMAI as of 8/19/2015.
(1) Butadiene pricing based on Delivered US Gulf Coast Spot Average for North America, FOB South Korea Spot for Northeast Asia, and FOB Wes t Europe Spot for West Europe. Prices reflect historical levels from January 1999 through July 2015. Projected pricing from August 2015 through December 2016.
Relative butadiene volatility(1)
0
1,000
2,000
3,000
4,000
5,000
Jan-99
Oct-00
Aug-02
May-04
Mar-06
Dec-07
Oct-09
Jul-11
May-13
Feb-15
Dec-16
$1,266
Butadiene, Isoprene, Styrene 52%
Other 48%
0%
Kraton – 2014 key feedstock spend as % of COGS
Kraton
Confidential
31
G. Research and development
Kraton’s research and development program is designed to develop new products and applications, provide technical service to customers, develop and optimize process technology, and assist in marketing new products. Approximately +25% of revenue is covered by patents and trade secrets.
The Kraton’s research and development activities are primarily conducted in laboratories in Houston, Texas, and Amsterdam, Netherlands. Kraton also own a laboratory in Paulinia, Brazil, that provides technical services to its South American customers. Kraton’s application and technical service laboratories in Shanghai, China, and Tsukuba, Japan, provide support to its Asian customers. In addition, Kraton has technical service staff located in Mont St. Guibert, Belgium.
In 2014, Kraton successfully launched a semi-works facility located at its production facility in Belpre, Ohio. Kraton believes this will accelerate polymer development efforts and commercialization of products including the reduction of customer qualification lead times. Kraton also anticipates utilizing the semi-works facility to produce small commercial quantities for customers which, prior to the launch of its semi-works facility were satisfied by the Belpre, Ohio production assets. Utilizing the semi-works facility for such smaller quantities is more economical than producing small quantities on the larger-scale Belpre production lines. The semi-works facility will take a shorter time to market, therefore, reducing investment risk, has a shorter product development cycle, and can produce HSBCs, USBCs, and Cariflex products.
Kraton’s professionals perform research using scientific application equipment located primarily at its Houston, Belpre, Amsterdam, and Shanghai research and development facilities. At all of its major research and development facilities, Kraton develops new product samples for its customers and provide guidance to its manufacturing organization. Application equipment is used to evaluate polymers and compounds to determine optimal formulations.
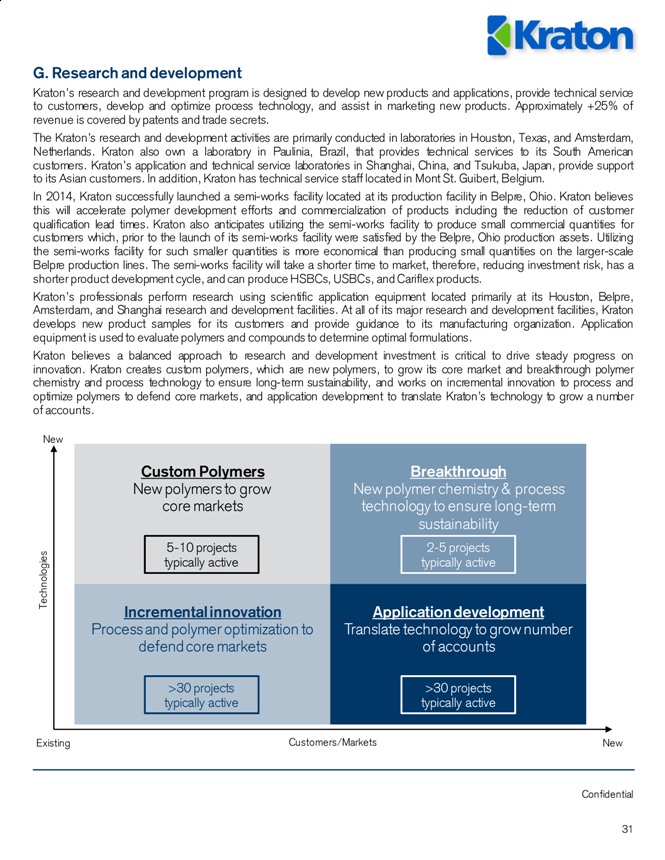
Kraton believes a balanced approach to research and development investment is critical to drive steady progress on innovation. Kraton creates custom polymers, which are new polymers, to grow its core market and breakthrough polymer chemistry and process technology to ensure long-term sustainability, and works on incremental innovation to process and optimize polymers to defend core markets, and application development to translate Kraton’s technology to grow a number of accounts.
New
Existing
New
Technologies
Customers/Markets
Custom Polymers
New polymers to grow core markets
Breakthrough
New polymer chemistry & process technology to ensure long-term sustainability
5-10 projects typically active
2-5 projects typically active
Incremental innovation
Process and polymer optimization to defend core markets
Application development
Translate technology to grow number of accounts
>30 projects typically active
>30 projects typically active
Kraton
Confidential
32
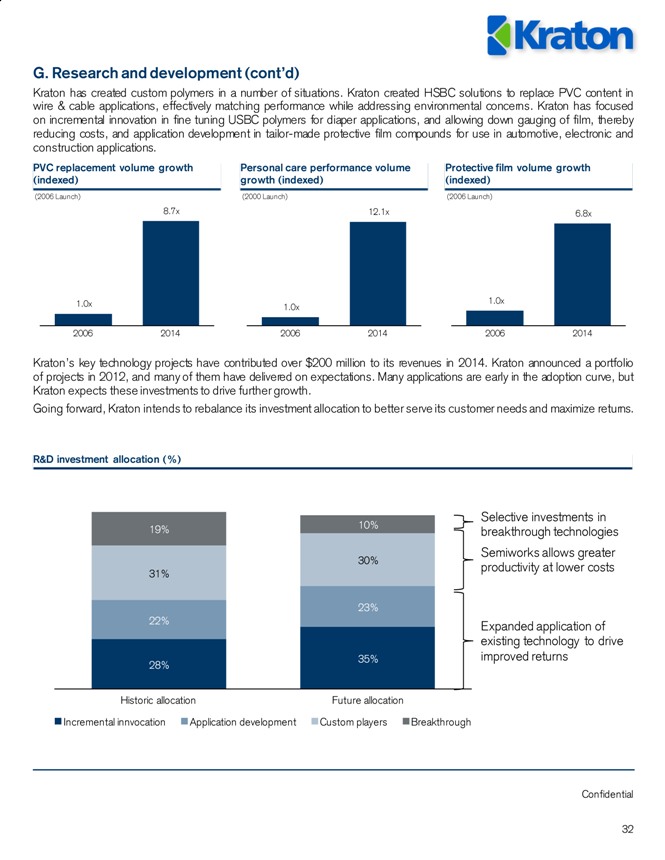
G. Research and development (cont’d)
Kraton has created custom polymers in a number of situations. Kraton created HSBC solutions to replace PVC content in wire & cable applications, effectively matching performance while addressing environmental concerns. Kraton has focused on incremental innovation in fine tuning USBC polymers for diaper applications, and allowing down gauging of film, thereby reducing costs, and application development in tailor-made protective film compounds for use in automotive, electronic and construction applications.
Kraton’s key technology projects have contributed over $200 million to its revenues in 2014. Kraton announced a portfolio of projects in 2012, and many of them have delivered on expectations. Many applications are early in the adoption curve, but Kraton expects these investments to drive further growth.
Going forward, Kraton intends to rebalance its investment allocation to better serve its customer needs and maximize returns.
PVC replacement volume growth (indexed)
Personal care performance volume growth (indexed)
Protective film volume growth (indexed)
1.0x
8.7x
2006
2014
(2006 Launch)
1.0x
12.1x
2006
2014
(2000 Launch)
1.0x
6.8x
2006
2014
(2006 Launch)
R&D investment allocation (%)
Selective investments in breakthrough technologies
Semiworks allows greater productivity at lower costs
Expanded application of existing technology to drive improved returns
28%
35%
22%
23%
31%
30%
19%
10%
Historic allocation
Future allocation
Incremental innvocation
Application development
Custom players
Breakthrough
Confidential
33
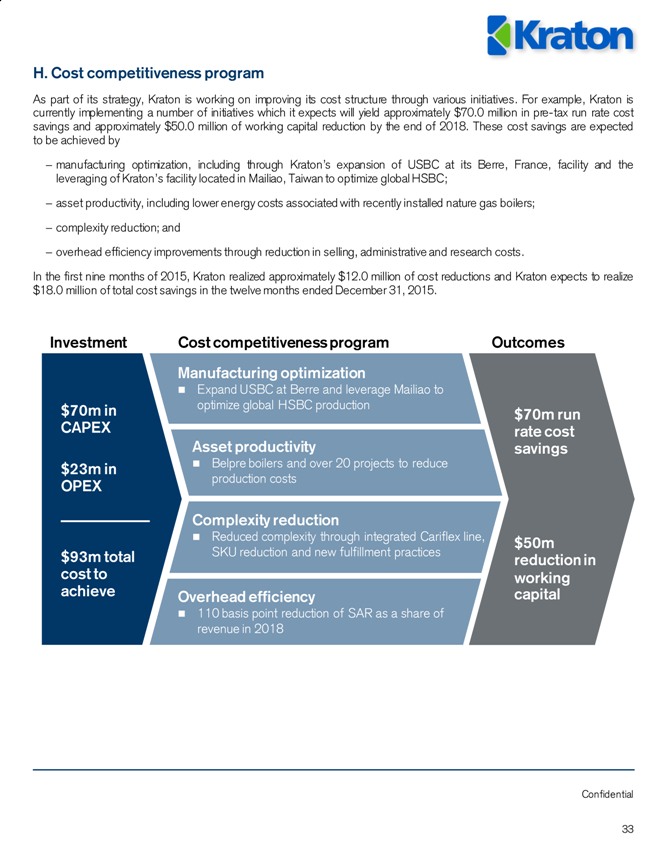
H. Cost competitiveness program
As part of its strategy, Kraton is working on improving its cost structure through various initiatives. For example, Kraton is currently implementing a number of initiatives which it expects will yield approximately $70.0 million in pre-tax run rate cost savings and approximately $50.0 million of working capital reduction by the end of 2018. These cost savings are expected to be achieved by
manufacturing optimization, including through Kraton’s expansion of USBC at its Berre, France, facility and the leveraging of Kraton’s facility located in Mailiao, Taiwan to optimize global HSBC;
asset productivity, including lower energy costs associated with recently installed nature gas boilers;
complexity reduction; and
overhead efficiency improvements through reduction in selling, administrative and research costs.
In the first nine months of 2015, Kraton realized approximately $12.0 million of cost reductions and Kraton expects to realize $18.0 million of total cost savings in the twelve months ended December 31, 2015. Manufacturing optimization
Expand USBC at Berre and leverage Mailiao to optimize global HSBC production
Asset productivity
Belpre boilers and over 20 projects to reduce production costs
Complexity reduction
Reduced complexity through integrated Cariflex line, SKU reduction and new fulfillment practices
Overhead efficiency
110 basis point reduction of SAR as a share of revenue in 2018
$70m in CAPEX
$23m in OPEX
$93m total cost to achieve
$70m run rate cost savings
$50m reduction in working capital
Investment
Cost competitiveness program
Outcomes
Kraton
Confidential 34
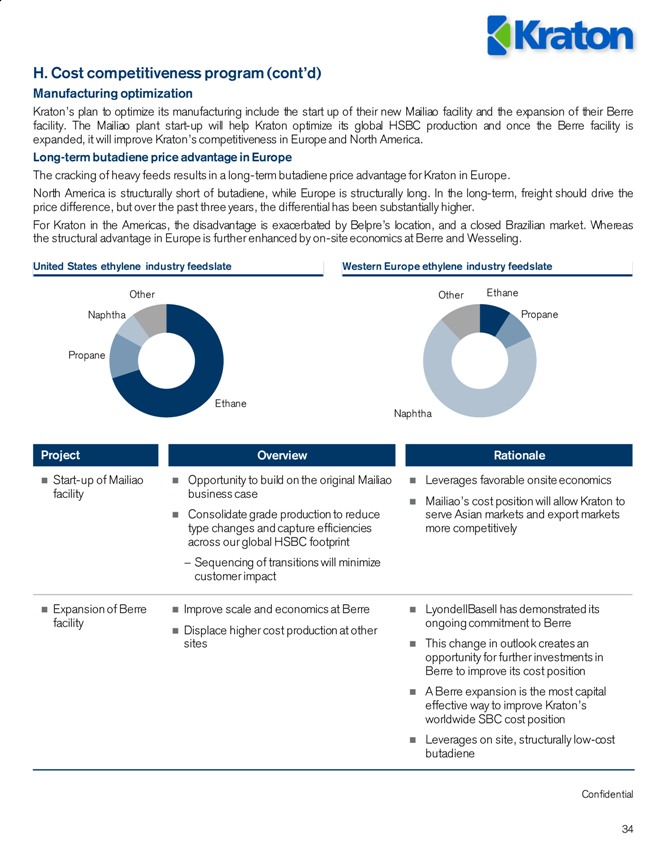
H. Cost competitiveness program (cont’d)
Manufacturing optimization
Kraton’s plan to optimize its manufacturing include the start up of their new Mailiao facility and the expansion of their Berre facility. The Mailiao plant start-up will help Kraton optimize its global HSBC production and once the Berre facility is expanded, it will improve Kraton’s competitiveness in Europe and North America.
Long-term butadiene price advantage in Europe
The cracking of heavy feeds results in a long-term butadiene price advantage for Kraton in Europe.
North America is structurally short of butadiene, while Europe is structurally long. In the long-term, freight should drive the price difference, but over the past three years, the differential has been substantially higher.
For Kraton in the Americas, the disadvantage is exacerbated by Belpre’s location, and a closed Brazilian market. Whereas the structural advantage in Europe is further enhanced by on-site economics at Berre and Wesseling.
United States ethylene industry feedslate
Western Europe ethylene industry feedslate
Ethane
Propane
Naphtha
Other
Ethane
Propane
Naphtha
Other
Start-up of Mailiao facility
Opportunity to build on the original Mailiao business case
Consolidate grade production to reduce type changes and capture efficiencies across our global HSBC footprint
Sequencing of transitions will minimize customer impact
Overview
Rationale
Leverages favorable onsite economics
Mailiao’s cost position will allow Kraton to serve Asian markets and export markets more competitively
Expansion of Berre facility
Improve scale and economics at Berre
Displace higher cost production at other sites
LyondellBasell has demonstrated its ongoing commitment to Berre
This change in outlook creates an opportunity for further investments in Berre to improve its cost position
A Berre expansion is the most capital effective way to improve Kraton’s worldwide SBC cost position
Leverages on site, structurally low?cost butadiene
Project
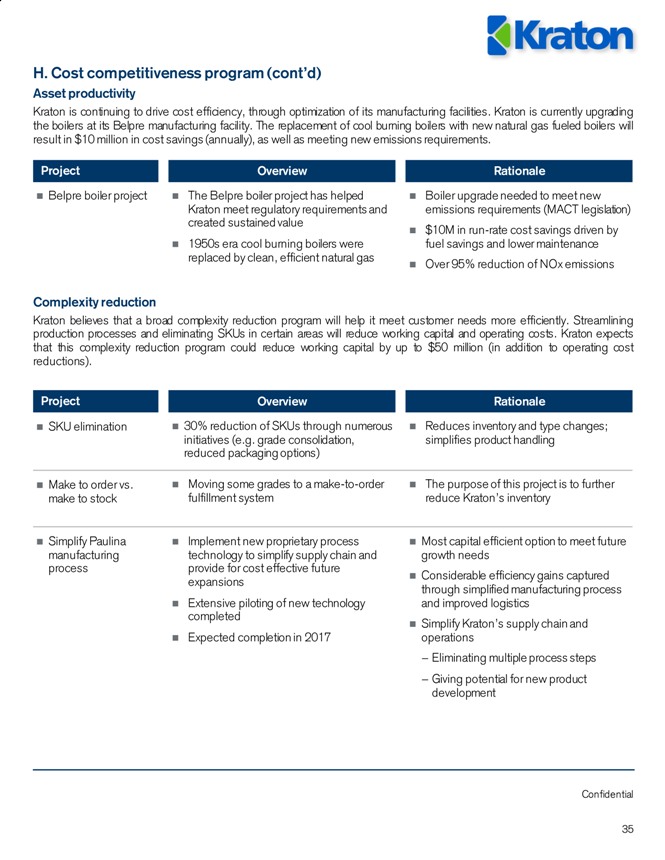
Kraton
Confidential 35
H. Cost competitiveness program (cont’d)
Asset productivity
Kraton is continuing to drive cost efficiency, through optimization of its manufacturing facilities. Kraton is currently upgrading the boilers at its Belpre manufacturing facility. The replacement of cool burning boilers with new natural gas fueled boilers will result in $10 million in cost savings (annually), as well as meeting new emissions requirements.
Belpre boiler project
The Belpre boiler project has helped Kraton meet regulatory requirements and created sustained value
1950s era cool burning boilers were replaced by clean, efficient natural gas
Overview
Rationale
Boiler upgrade needed to meet new emissions requirements (MACT legislation)
$10M in run?rate cost savings driven by fuel savings and lower maintenance
Over 95% reduction of NOx emissions
SKU elimination
30% reduction of SKUs through numerous initiatives (e.g. grade consolidation, reduced packaging options)
Overview
Rationale
Reduces inventory and type changes; simplifies product handling
Make to order vs. make to stock
Moving some grades to a make?to?order fulfillment system
The purpose of this project is to further reduce Kraton’s inventory
Complexity reduction
Kraton believes that a broad complexity reduction program will help it meet customer needs more efficiently. Streamlining production processes and eliminating SKUs in certain areas will reduce working capital and operating costs. Kraton expects that this complexity reduction program could reduce working capital by up to $50 million (in addition to operating cost reductions).
Simplify Paulina manufacturing process
Implement new proprietary process technology to simplify supply chain and provide for cost effective future expansions
Extensive piloting of new technology completed
Expected completion in 2017
Most capital efficient option to meet future growth needs
Considerable efficiency gains captured through simplified manufacturing process and improved logistics
Simplify Kraton’s supply chain and operations
Eliminating multiple process steps
Giving potential for new product development
Project
Project
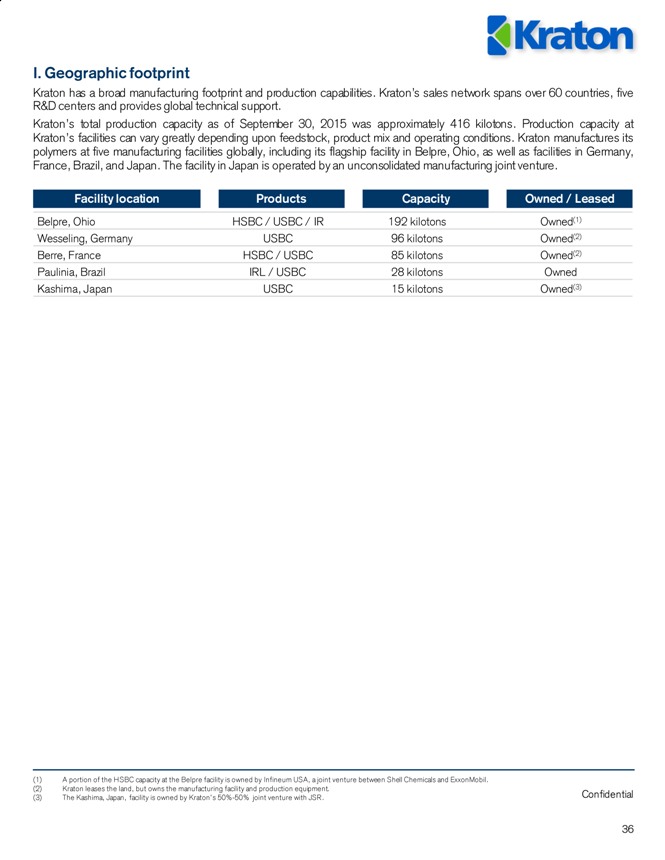
Kraton
Confidential 36
I. Geographic footprint
Kraton has a broad manufacturing footprint and production capabilities. Kraton’s sales network spans over 60 countries, five R&D centers and provides global technical support.
Kraton’s total production capacity as of September 30, 2015 was approximately 416 kilotons. Production capacity at Kraton’s facilities can vary greatly depending upon feedstock, product mix and operating conditions. Kraton manufactures its polymers at five manufacturing facilities globally, including its flagship facility in Belpre, Ohio, as well as facilities in Germany, France, Brazil, and Japan. The facility in Japan is operated by an unconsolidated manufacturing joint venture.
Facility location Products Capacity Owned / Leased Belpre, Ohio HSBC / USBC / IR 192 kilotons Owned(1)
Wesseling, Germany USBC 96 kilotons Owned(2)
Berre, France HSBC / USBC 85 kilotons Owned(2)
Paulinia, Brazil IRL / USBC 28 kilotons Owned
Kashima, Japan USBC 15 kilotons Owned(3)
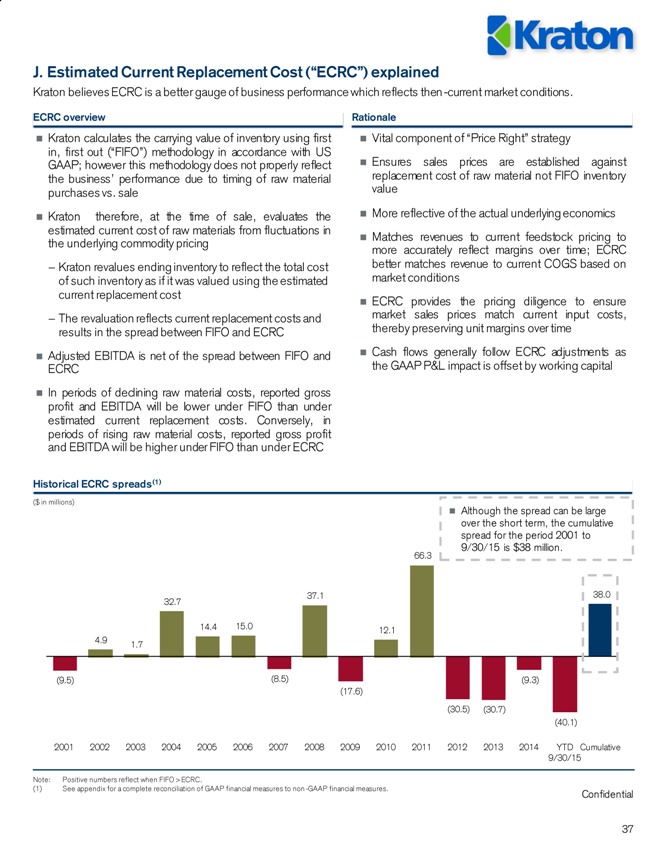
Kraton
Confidential
J. Estimated Current Replacement Cost (“ECRC”) explained
Kraton believes ECRC is a better gauge of business performance which reflects then-current market conditions. 37
Note: Positive numbers reflect when FIFO > ECRC.
(1) See appendix for a complete reconciliation of GAAP financial measures to non -GAAP financial measures.
ECRC overview
Rationale
Kraton calculates the carrying value of inventory using first in, first out (“FIFO”) methodology in accordance with US GAAP; however this methodology does not properly reflect the business’ performance due to timing of raw material purchases vs. sale
Kraton therefore, at the time of sale, evaluates the estimated current cost of raw materials from fluctuations in the underlying commodity pricing
Kraton revalues ending inventory to reflect the total cost of such inventory as if it was valued using the estimated current replacement cost
The revaluation reflects current replacement costs and results in the spread between FIFO and ECRC
Adjusted EBITDA is net of the spread between FIFO and ECRC
In periods of declining raw material costs, reported gross profit and EBITDA will be lower under FIFO than under estimated current replacement costs. Conversely, in periods of rising raw material costs, reported gross profit and EBITDA will be higher under FIFO than under ECRC
Vital component of “Price Right” strategy
Ensures sales prices are established against replacement cost of raw material not FIFO inventory value
More reflective of the actual underlying economics
Matches revenues to current feedstock pricing to more accurately reflect margins over time; ECRC better matches revenue to current COGS based on market conditions
ECRC provides the pricing diligence to ensure market sales prices match current input costs, thereby preserving unit margins over time
Cash flows generally follow ECRC adjustments as the GAAP P&L impact is offset by working capital
Historical ECRC spreads(1)
(9.5)
4.9
1.7 32.7 14.4
15.0
(8.5)
37.1 (17.6)
12.1 66.3
(30.5)
(30.7) (9.3)
(40.1)
38.0
2001
2002
2003 2004 2005
2006
2007
2008 2009
2010 2011
2012
2013 2014
YTD 9/30/15
Cumulative
($ in millions)
Although the spread can be large over the short term, the cumulative spread for the period 2001 to 9/30/15 is $38 million.
V. Arizona Chemical overview
Confidential
38
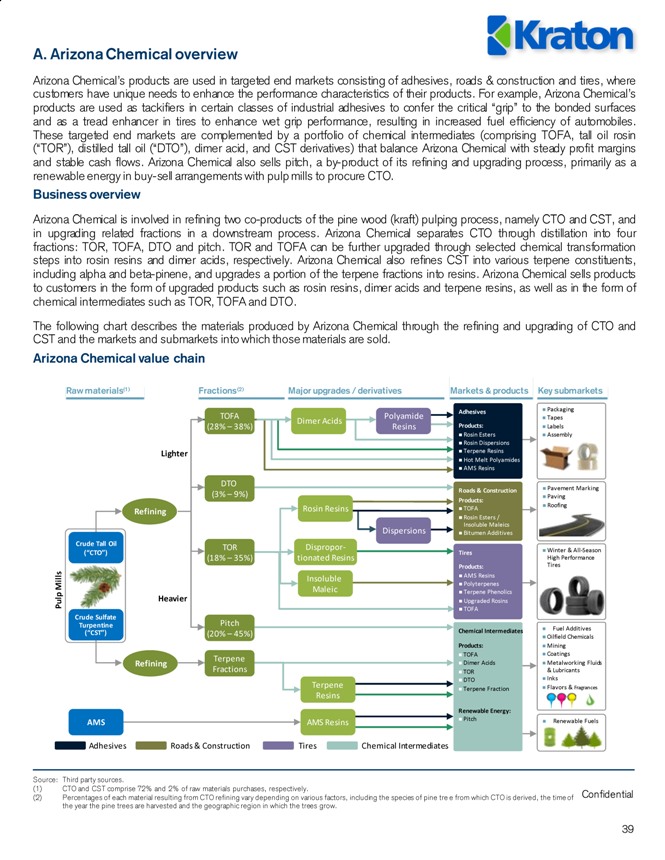
A. Arizona Chemical overview
Arizona Chemical’s products are used in targeted end markets consisting of adhesives, roads & construction and tires, where customers have unique needs to enhance the performance characteristics of their products. For example, Arizona Chemical’s products are used as tackifiers in certain classes of industrial adhesives to confer the critical “grip” to the bonded surfaces and as a tread enhancer in tires to enhance wet grip performance, resulting in increased fuel efficiency of automobiles. These targeted end markets are complemented by a portfolio of chemical intermediates (comprising TOFA, tall oil rosin (“TOR”), distilled tall oil (“DTO”), dimer acid, and CST derivatives) that balance Arizona Chemical with steady profit margins and stable cash flows. Arizona Chemical also sells pitch, a by-product of its refining and upgrading process, primarily as a renewable energy in buy-sell arrangements with pulp mills to procure CTO.
Business overview
Arizona Chemical is involved in refining two co-products of the pine wood (kraft) pulping process, namely CTO and CST, and in upgrading related fractions in a downstream process. Arizona Chemical separates CTO through distillation into four fractions: TOR, TOFA, DTO and pitch. TOR and TOFA can be further upgraded through selected chemical transformation steps into rosin resins and dimer acids, respectively. Arizona Chemical also refines CST into various terpene constituents, including alpha and beta-pinene, and upgrades a portion of the terpene fractions into resins. Arizona Chemical sells products to customers in the form of upgraded products such as rosin resins, dimer acids and terpene resins, as well as in the form of chemical intermediates such as TOR, TOFA and DTO.
The following chart describes the materials produced by Arizona Chemical through the refining and upgrading of CTO and CST and the markets and submarkets into which those materials are sold.
Arizona Chemical value chain
Raw materials(1) Fractions(2) Major upgrades / derivatives Markets & products Key submarkets
Packaging
Adhesives
TOFA Polyamide Tapes
Dimer Acids
(28% – 38%) Resins Products: Labels
Rosin Esters Assembly Rosin Dispersions Lighter Terpene Resins Hot Melt Polyamides AMS Resins
DTO
(3% – 9%) Roads & Construction Pavement Marking
Paving
Products:
Roofing
Refining Rosin Resins TOFA
Rosin Esters /
Dispersions Insoluble Maleics Bitumen Additives
Crude Tall Oil Dispropor-
TOR Tires Winter & All-Season
(“CTO”) High Performance
(18% – 35%) tionated Resins
Products: Tires
Insoluble AMS Resins
Mills Polyterpenes Maleic Terpene Phenolics Pulp Heavier Upgraded Rosins
TOFA
Crude Sulfate Pitch Turpentine
Chemical Intermediates Fuel Additives
(“CST”) (20% – 45%)
Oilfield Chemicals
Products: Mining
TOFA Coatings
Terpene
Refining Fractions Dimer Acids Metalworking Fluids
TOR & Lubricants DTO Inks
Terpene Flavors & Fragrances
Terpene Fraction
Resins
Renewable Energy:
AMS AMS Resins Pitch Renewable Fuels
Adhesives Roads & Construction Tires Chemical Intermediates
Source: Third party sources.
(1) CTO and CST comprise 72% and 2% of raw materials purchases, respectively.
(2) Percentages of each material resulting from CTO refining vary depending on various factors, including the species of pine tre e from which CTO is derived, the time of Confidential the year the pine trees are harvested and the geographic region in which the trees grow.
39
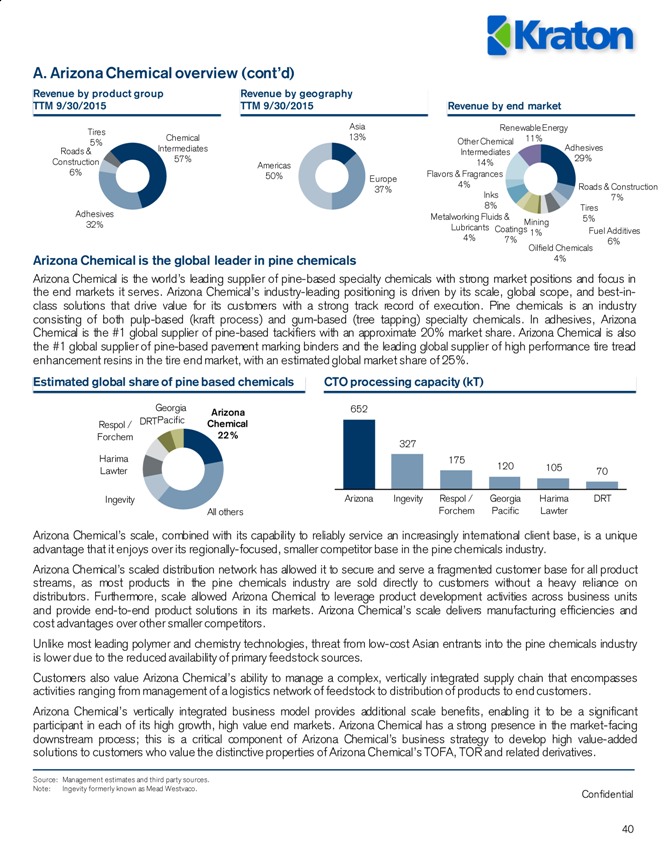
A. Arizona Chemical overview (cont’d)
Revenue by product group Revenue by geography
TTM 9/30/2015 TTM 9/30/2015 Revenue by end market
Tires Asia Renewable Energy
5% Chemical 13% Other Chemical 11%
Roads & Intermediates Intermediates Adhesives
Construction 57% Americas 14% 29%
6% 50% Europe 39% Flavors & Fragrances
37% 4% Roads & Construction
Inks 7%
8% Tires
Adhesives Metalworking Fluids & Mining 5%
32% Lubricants Coatings 1% Fuel Additives
4% 7% 6%
Oilfield Chemicals
Arizona Chemical is the global leader in pine chemicals 4%
Arizona Chemical is the world’s leading supplier of pine-based specialty chemicals with strong market positions and focus in
the end markets it serves. Arizona Chemical’s industry-leading positioning is driven by its scale, global scope, and best-in-
class solutions that drive value for its customers with a strong track record of execution. Pine chemicals is an industry
consisting of both pulp-based (kraft process) and gum-based (tree tapping) specialty chemicals. In adhesives, Arizona
Chemical is the #1 global supplier of pine-based tackifiers with an approximate 20% market share. Arizona Chemical is also
the #1 global supplier of pine-based pavement marking binders and the leading global supplier of high performance tire tread
enhancement resins in the tire end market, with an estimated global market share of 25%.
Estimated global share of pine based chemicals CTO processing capacity (kT)
Georgia Arizona 652
Respol / DRTPacific Chemical
Forchem 22%
327
Harima 175 120 105
Lawter 70
Ingevity Arizona Ingevity Respol / Georgia Harima DRT
All others Forchem Pacific Lawter
Arizona Chemical’s scale, combined with its capability to reliably service an increasingly international client base, is a unique advantage that it enjoys over its regionally-focused, smaller competitor base in the pine chemicals industry.
Arizona Chemical’s scaled distribution network has allowed it to secure and serve a fragmented customer base for all product streams, as most products in the pine chemicals industry are sold directly to customers without a heavy reliance on distributors. Furthermore, scale allowed Arizona Chemical to leverage product development activities across business units and provide end-to-end product solutions in its markets. Arizona Chemical’s scale delivers manufacturing efficiencies and cost advantages over other smaller competitors.
Unlike most leading polymer and chemistry technologies, threat from low-cost Asian entrants into the pine chemicals industry is lower due to the reduced availability of primary feedstock sources.
Customers also value Arizona Chemical’s ability to manage a complex, vertically integrated supply chain that encompasses activities ranging from management of a logistics network of feedstock to distribution of products to end customers.
Arizona Chemical’s vertically integrated business model provides additional scale benefits, enabling it to be a significant participant in each of its high growth, high value end markets. Arizona Chemical has a strong presence in the market-facing downstream process; this is a critical component of Arizona Chemical’s business strategy to develop high value-added solutions to customers who value the distinctive properties of Arizona Chemical’s TOFA, TOR and related derivatives.
Source: Management estimates and third party sources. Note: Ingevity formerly known as Mead Westvaco.
Confidential
40
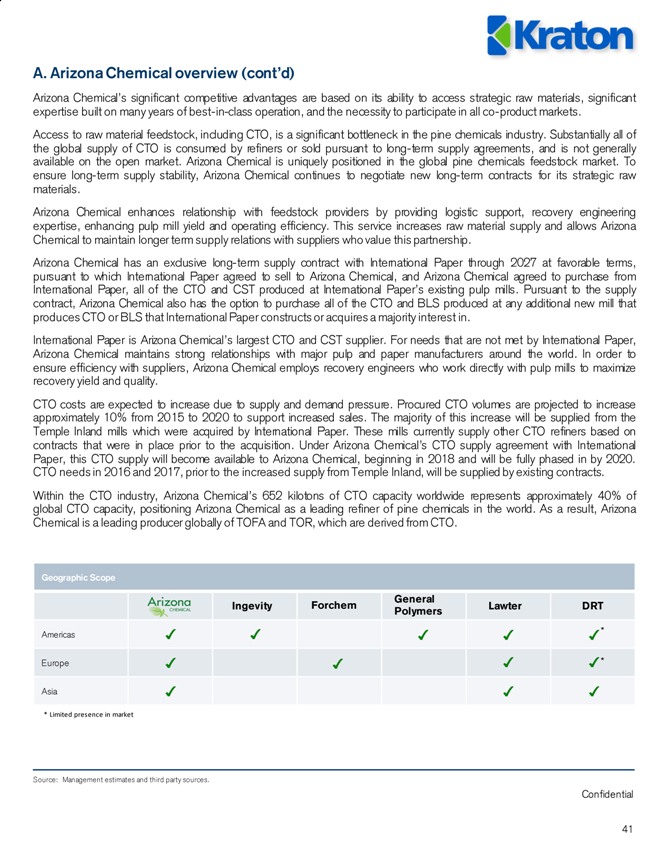
A. Arizona Chemical overview (cont’d)
Arizona Chemical’s significant competitive advantages are based on its ability to access strategic raw materials, significant expertise built on many years of best-in-class operation, and the necessity to participate in all co-product markets.
Access to raw material feedstock, including CTO, is a significant bottleneck in the pine chemicals industry. Substantially all of the global supply of CTO is consumed by refiners or sold pursuant to long-term supply agreements, and is not generally available on the open market. Arizona Chemical is uniquely positioned in the global pine chemicals feedstock market. To ensure long-term supply stability, Arizona Chemical continues to negotiate new long-term contracts for its strategic raw materials.
Arizona Chemical enhances relationship with feedstock providers by providing logistic support, recovery engineering expertise, enhancing pulp mill yield and operating efficiency. This service increases raw material supply and allows Arizona
Chemical to maintain longer term supply relations with suppliers who value this partnership.
Arizona Chemical has an exclusive long-term supply contract with International Paper through 2027 at favorable terms, pursuant to which International Paper agreed to sell to Arizona Chemical, and Arizona Chemical agreed to purchase from
International Paper, all of the CTO and CST produced at International Paper’s existing pulp mills. Pursuant to the supply contract, Arizona Chemical also has the option to purchase all of the CTO and BLS produced at any additional new mill that produces CTO or BLS that International Paper constructs or acquires a majority interest in.
International Paper is Arizona Chemical’s largest CTO and CST supplier. For needs that are not met by International Paper,
Arizona Chemical maintains strong relationships with major pulp and paper manufacturers around the world. In order to ensure efficiency with suppliers, Arizona Chemical employs recovery engineers who work directly with pulp mills to maximize recovery yield and quality.
CTO costs are expected to increase due to supply and demand pressure. Procured CTO volumes are projected to increase approximately 10% from 2015 to 2020 to support increased sales. The majority of this increase will be supplied from the
Temple Inland mills which were acquired by International Paper. These mills currently supply other CTO refiners based on contracts that were in place prior to the acquisition. Under Arizona Chemical’s CTO supply agreement with International
Paper, this CTO supply will become available to Arizona Chemical, beginning in 2018 and will be fully phased in by 2020. CTO needs in 2016 and 2017, prior to the increased supply from Temple Inland, will be supplied by existing contracts. Within the CTO industry, Arizona Chemical’s 652 kilotons of CTO capacity worldwide represents approximately 40% of global CTO capacity, positioning Arizona Chemical as a leading refiner of pine chemicals in the world. As a result, Arizona
Chemical is a leading producer globally of TOFA and TOR, which are derived from CTO.
Geographic Scope
General
Ingevity Forchem Lawter DRT Polymers
Americas * Europe * Asia
* Limited presence in market
Source: Management estimates and third party sources.
Confidential
41
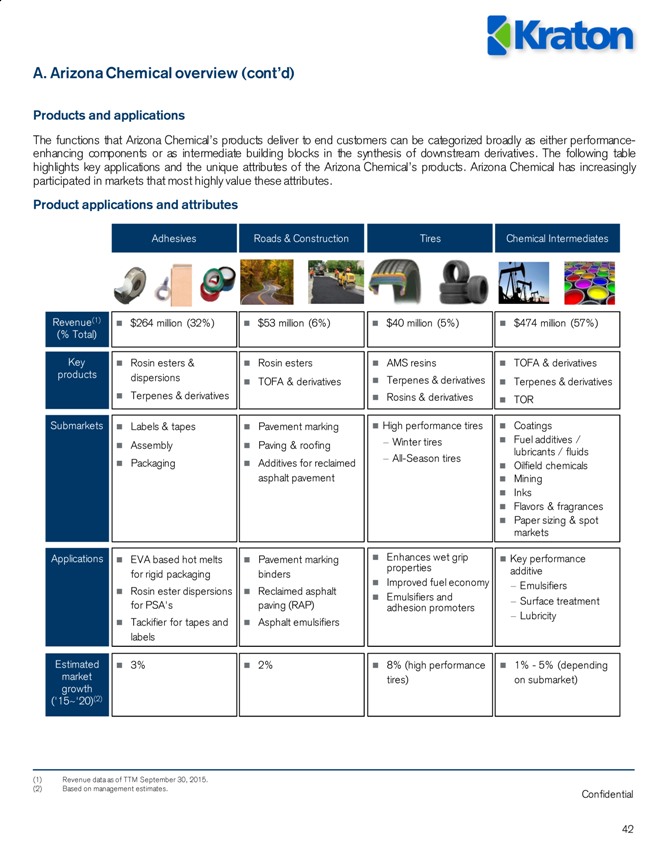
A. Arizona Chemical overview (cont’d)
Products and applications
The functions that Arizona Chemical’s products deliver to end customers can be categorized broadly as either performance-enhancing components or as intermediate building blocks in the synthesis of downstream derivatives. The following table highlights key applications and the unique attributes of the Arizona Chemical’s products. Arizona Chemical has increasingly participated in markets that most highly value these attributes.
Product applications and attributes
Adhesives Roads & Construction Tires Chemical Intermediates
Revenue(1) $264 million (32%) $53 million (6%) $40 million (5%) $474 million (57%)
(% Total)
Key Rosin esters & Rosin esters AMS resins TOFA & derivatives
products dispersions TOFA & derivatives Terpenes & derivatives Terpenes & derivatives
Terpenes & derivatives Rosins & derivatives TOR
Submarkets Labels & tapes Pavement marking High performance tires Coatings
Assembly Paving & roofing—Winter tires Fuel additives /
—All-Season tires lubricants / fluids
Packaging Additives for reclaimed Oilfield chemicals
asphalt pavement Mining
Inks
Flavors & fragrances
Paper sizing & spot
markets
Applications EVA based hot melts Pavement marking Enhances wet grip Key performance
for rigid packaging binders properties additive
Rosin ester dispersions Reclaimed asphalt Improved fuel economy—Emulsifiers
Emulsifiers and
for PSA’s paving (RAP) adhesion promoters—Surface treatment
Tackifier for tapes and Asphalt emulsifiers—Lubricity
labels
Estimated 3% 2% 8% (high performance 1%—5% (depending
market tires) on submarket)
growth
(‘15~‘20)(2)
(1) Revenue data as of TTM September 30, 2015. (2) Based on management estimates.
Confidential
42
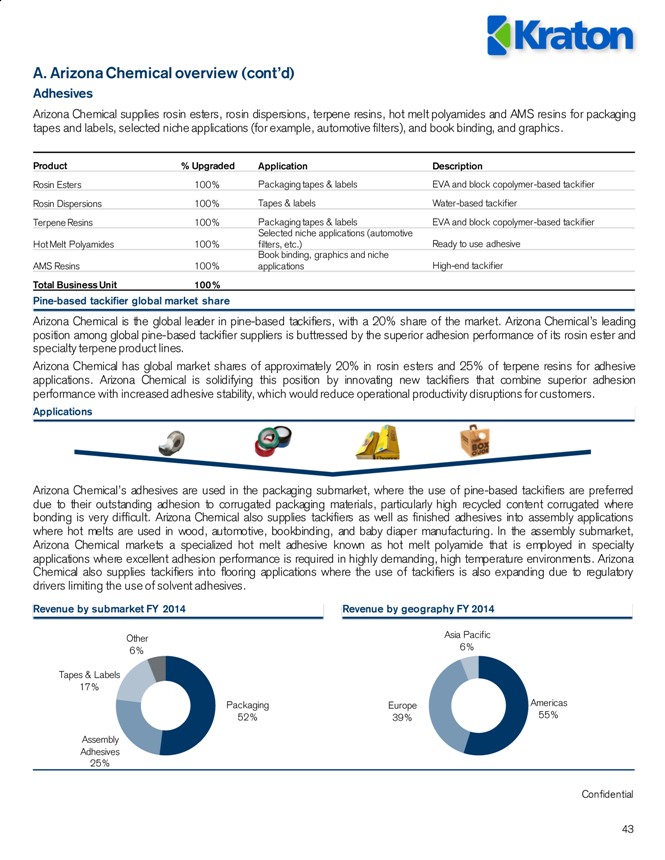
A. Arizona Chemical overview (cont’d)
Adhesives
Arizona Chemical supplies rosin esters, rosin dispersions, terpene resins, hot melt polyamides and AMS resins for packaging tapes and labels, selected niche applications (for example, automotive filters), and book binding, and graphics.
Product % Upgraded Application Description
Rosin Esters 100% Packaging tapes & labels EVA and block copolymer-based tackifier Rosin Dispersions 100% Tapes & labels Water-based tackifier Terpene Resins 100% Packaging tapes & labels EVA and block copolymer-based tackifier Selected niche applications (automotive Hot Melt Polyamides 100% filters, etc.) Ready to use adhesive Book binding, graphics and niche AMS Resins 100% applications High-end tackifier
Total Business Unit 100%
Pine-based tackifier global market share
Arizona Chemical is the global leader in pine-based tackifiers, with a 20% share of the market. Arizona Chemical’s leading position among global pine-based tackifier suppliers is buttressed by the superior adhesion performance of its rosin ester and specialty terpene product lines.
Arizona Chemical has global market shares of approximately 20% in rosin esters and 25% of terpene resins for adhesive applications. Arizona Chemical is solidifying this position by innovating new tackifiers that combine superior adhesion performance with increased adhesive stability, which would reduce operational productivity disruptions for customers.
Applications
Arizona Chemical’s adhesives are used in the packaging submarket, where the use of pine-based tackifiers are preferred due to their outstanding adhesion to corrugated packaging materials, particularly high recycled content corrugated where bonding is very difficult. Arizona Chemical also supplies tackifiers as well as finished adhesives into assembly applications where hot melts are used in wood, automotive, bookbinding, and baby diaper manufacturing. In the assembly submarket, Arizona Chemical markets a specialized hot melt adhesive known as hot melt polyamide that is employed in specialty applications where excellent adhesion performance is required in highly demanding, high temperature environments. Arizona Chemical also supplies tackifiers into flooring applications where the use of tackifiers is also expanding due to regulatory drivers limiting the use of solvent adhesives.
Revenue by submarket FY 2014 Revenue by geography FY 2014
Other Asia Pacific
6% 6% Tapes & Labels 17%
Packaging Europe Americas 52% 39% 55% Assembly Adhesives 25%
Confidential
43
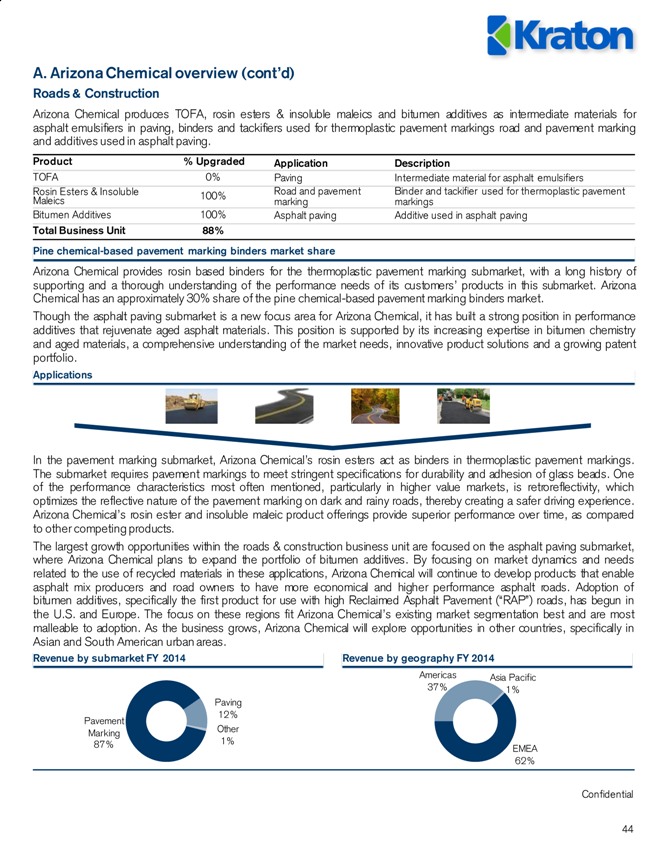
A. Arizona Chemical overview (cont’d)
Roads & Construction
Arizona Chemical produces TOFA, rosin esters & insoluble maleics and bitumen additives as intermediate materials for asphalt emulsifiers in paving, binders and tackifiers used for thermoplastic pavement markings road and pavement marking and additives used in asphalt paving.
Product % Upgraded Application Description
TOFA 0% Paving Intermediate material for asphalt emulsifiers
Rosin Esters & Insoluble Road and pavement Binder and tackifier used for thermoplastic pavement Maleics 100% marking markings Bitumen Additives 100% Asphalt paving Additive used in asphalt paving
Total Business Unit 88% Pine chemical-based pavement marking binders market share
Arizona Chemical provides rosin based binders for the thermoplastic pavement marking submarket, with a long history of supporting and a thorough understanding of the performance needs of its customers’ products in this submarket. Arizona Chemical has an approximately 30% share of the pine chemical-based pavement marking binders market.
Though the asphalt paving submarket is a new focus area for Arizona Chemical, it has built a strong position in performance additives that rejuvenate aged asphalt materials. This position is supported by its increasing expertise in bitumen chemistry and aged materials, a comprehensive understanding of the market needs, innovative product solutions and a growing patent portfolio.
Applications
In the pavement marking submarket, Arizona Chemical’s rosin esters act as binders in thermoplastic pavement markings. The submarket requires pavement markings to meet stringent specifications for durability and adhesion of glass beads. One of the performance characteristics most often mentioned, particularly in higher value markets, is retroreflectivity, which optimizes the reflective nature of the pavement marking on dark and rainy roads, thereby creating a safer driving experience. Arizona Chemical’s rosin ester and insoluble maleic product offerings provide superior performance over time, as compared to other competing products.
The largest growth opportunities within the roads & construction business unit are focused on the asphalt paving submarket, where Arizona Chemical plans to expand the portfolio of bitumen additives. By focusing on market dynamics and needs related to the use of recycled materials in these applications, Arizona Chemical will continue to develop products that enable asphalt mix producers and road owners to have more economical and higher performance asphalt roads. Adoption of bitumen additives, specifically the first product for use with high Reclaimed Asphalt Pavement (“RAP”) roads, has begun in the U.S. and Europe. The focus on these regions fit Arizona Chemical’s existing market segmentation best and are most malleable to adoption. As the business grows, Arizona Chemical will explore opportunities in other countries, specifically in Asian and South American urban areas.
Revenue by submarket FY 2014 Revenue by geography FY 2014
Americas Asia Pacific 37% 1% Paving 12% Pavement Marking Other 87% 1% EMEA
62%
Confidential
44
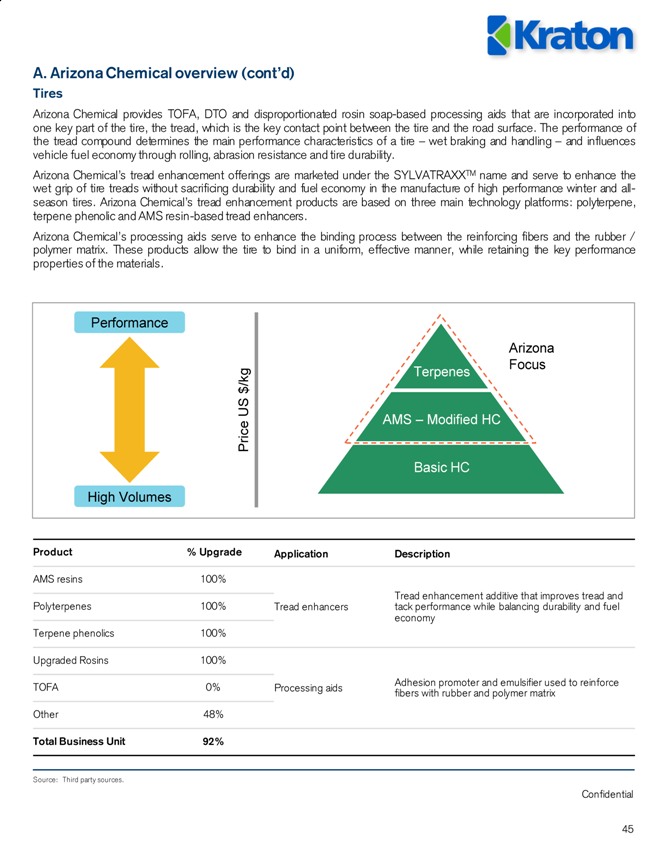
A. Arizona Chemical overview (cont’d)
Tires
Arizona Chemical provides TOFA, DTO and disproportionated rosin soap-based processing aids that are incorporated into one key part of the tire, the tread, which is the key contact point between the tire and the road surface. The performance of the tread compound determines the main performance characteristics of a tire – wet braking and handling – and influences vehicle fuel economy through rolling, abrasion resistance and tire durability.
Arizona Chemical’s tread enhancement offerings are marketed under the SYLVATRAXXTM name and serve to enhance the wet grip of tire treads without sacrificing durability and fuel economy in the manufacture of high performance winter and all-season tires. Arizona Chemical’s tread enhancement products are based on three main technology platforms: polyterpene, terpene phenolic and AMS resin-based tread enhancers.
Arizona Chemical’s processing aids serve to enhance the binding process between the reinforcing fibers and the rubber / polymer matrix. These products allow the tire to bind in a uniform, effective manner, while retaining the key performance properties of the materials.
Performance
Arizona Focus /k g Terpenes $
US
AMS – Modified HC
Price
Basic HC
High Volumes
Product % Upgrade Application Description
AMS resins 100%
Tread enhancement additive that improves tread and Polyterpenes 100% Tread enhancers tack performance while balancing durability and fuel economy Terpene phenolics 100%
Upgraded Rosins 100%
Adhesion promoter and emulsifier used to reinforce TOFA 0% Processing aids fibers with rubber and polymer matrix Other 48%
Total Business Unit 92%
Source: Third party sources.
Confidential
45
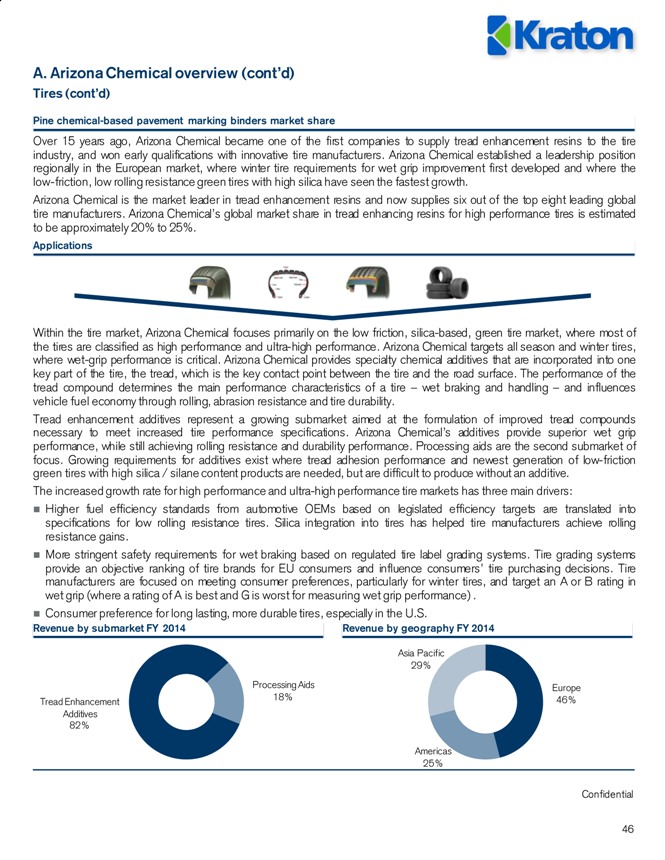
A. Arizona Chemical overview (cont’d)
Tires (cont’d)
Pine chemical-based pavement marking binders market share
Over 15 years ago, Arizona Chemical became one of the first companies to supply tread enhancement resins to the tire industry, and won early qualifications with innovative tire manufacturers. Arizona Chemical established a leadership position regionally in the European market, where winter tire requirements for wet grip improvement first developed and where the low-friction, low rolling resistance green tires with high silica have seen the fastest growth.
Arizona Chemical is the market leader in tread enhancement resins and now supplies six out of the top eight leading global tire manufacturers. Arizona Chemical’s global market share in tread enhancing resins for high performance tires is estimated to be approximately 20% to 25%.
Applications
Within the tire market, Arizona Chemical focuses primarily on the low friction, silica-based, green tire market, where most of the tires are classified as high performance and ultra-high performance. Arizona Chemical targets all season and winter tires, where wet-grip performance is critical. Arizona Chemical provides specialty chemical additives that are incorporated into one key part of the tire, the tread, which is the key contact point between the tire and the road surface. The performance of the tread compound determines the main performance characteristics of a tire – wet braking and handling – and influences vehicle fuel economy through rolling, abrasion resistance and tire durability.
Tread enhancement additives represent a growing submarket aimed at the formulation of improved tread compounds necessary to meet increased tire performance specifications. Arizona Chemical’s additives provide superior wet grip performance, while still achieving rolling resistance and durability performance. Processing aids are the second submarket of focus. Growing requirements for additives exist where tread adhesion performance and newest generation of low-friction green tires with high silica / silane content products are needed, but are difficult to produce without an additive.
The increased growth rate for high performance and ultra-high performance tire markets has three main drivers:
? Higher fuel efficiency standards from automotive OEMs based on legislated efficiency targets are translated into specifications for low rolling resistance tires. Silica integration into tires has helped tire manufacturers achieve rolling resistance gains.
? More stringent safety requirements for wet braking based on regulated tire label grading systems. Tire grading systems provide an objective ranking of tire brands for EU consumers and influence consumers’ tire purchasing decisions. Tire manufacturers are focused on meeting consumer preferences, particularly for winter tires, and target an A or B rating in wet grip (where a rating of A is best and G is worst for measuring wet grip performance) .
? Consumer preference for long lasting, more durable tires, especially in the U.S.
Revenue by submarket FY 2014 Revenue by geography FY 2014
Asia Pacific 29%
Processing Aids Europe 18% 46% Tread Enhancement Additives 82%
Americas 25%
Confidential
46
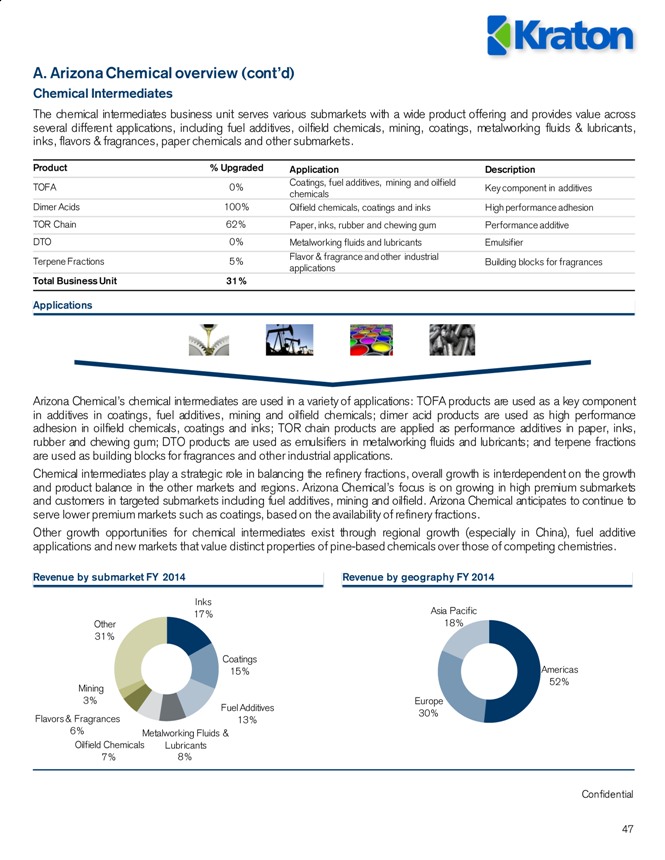
A. Arizona Chemical overview (cont’d)
Chemical Intermediates
The chemical intermediates business unit serves various submarkets with a wide product offering and provides value across several different applications, including fuel additives, oilfield chemicals, mining, coatings, metalworking fluids & lubricants, inks, flavors & fragrances, paper chemicals and other submarkets.
Product % Upgraded Application Description
Coatings, fuel additives, mining and oilfield
TOFA 0% Key component in additives chemicals Dimer Acids 100% Oilfield chemicals, coatings and inks High performance adhesion TOR Chain 62% Paper, inks, rubber and chewing gum Performance additive DTO 0% Metalworking fluids and lubricants Emulsifier Flavor & fragrance and other industrial Terpene Fractions 5% Building blocks for fragrances applications
Total Business Unit 31%
Applications
Arizona Chemical’s chemical intermediates are used in a variety of applications: TOFA products are used as a key component in additives in coatings, fuel additives, mining and oilfield chemicals; dimer acid products are used as high performance adhesion in oilfield chemicals, coatings and inks; TOR chain products are applied as performance additives in paper, inks, rubber and chewing gum; DTO products are used as emulsifiers in metalworking fluids and lubricants; and terpene fractions are used as building blocks for fragrances and other industrial applications.
Chemical intermediates play a strategic role in balancing the refinery fractions, overall growth is interdependent on the growth and product balance in the other markets and regions. Arizona Chemical’s focus is on growing in high premium submarkets and customers in targeted submarkets including fuel additives, mining and oilfield. Arizona Chemical anticipates to continue to serve lower premium markets such as coatings, based on the availability of refinery fractions.
Other growth opportunities for chemical intermediates exist through regional growth (especially in China), fuel additive applications and new markets that value distinct properties of pine-based chemicals over those of competing chemistries.
Revenue by submarket FY 2014 Revenue by geography FY 2014
Inks Asia Pacific 17% 18% Other 31%
Coatings
15% Americas 52% Mining
3% Europe Fuel Additives 30% Flavors & Fragrances 13%
6% Metalworking Fluids & Oilfield Chemicals Lubricants
7% 8%
Confidential
47
A. Arizona Chemical overview (cont’d)
Chemical Intermediates (cont’d)
Fuel Additives
Lubricity additives in diesel, which prevent gripping of fuel injectors and pumps, are based on vegetable and animal derived fatty acids and synthetic derivatives such as poly methacrylates. Compared to other fatty acids, specific TOFA grades provide an advantage in handling and having a lower cloud point, which allows usage at lower temperatures.
TOFA was developed and patented as a lubricity additive by Total SA and has been widely used in Europe. In other parts of the world, including China and Russia, the use of lubricity improvers is rapidly increasing and Arizona Chemical’s business has grown there. In the U.S., the application of TOFA as a fuel additive is being restricted by different specifications, but offers additional upside should the restriction be removed. The customer base for fuel additives consists of additive companies, independent or as part of downstream oil and gas players.
Oilfield Chemicals
The oilfield chemicals submarket is attractive to Arizona Chemical as it offers a rapidly growing market and Arizona Chemical is recognized as a qualified supplier. Arizona Chemical’s TOFA and TOFA-based dimers compete with other fatty acids in this market, mainly oleic acids. TOFA is considered superior to oleic acids, as it provides better solubility in drilling muds as well as a higher surface activity and emulsifying power. The customer base encompasses specialized drilling mud suppliers with only a few major players.
Mining
Arizona Chemical’s interest in the mining market is specific to the production and use of flotation agents in mines. In the mining submarket, long chain fatty acids and their derivatives serve mainly as flotation agents and antifoams in mineral ores. Unsaturated fatty acids like TOFA and oleic acid are mainly used in specific types of phosphate ore mining. Arizona Chemical’s TOFA is often preferred over oleic acid, as lower viscosity and higher affinity with the ore extract allow a higher recovery yield. The customer base is represented by a combination of specialized mining chemical suppliers and mining companies.
Coatings
The coatings submarket, specifically alkyd resins, represents a large market for unsaturated fatty acids, which serve as binders in solvent-based paints as well as in hybrid coatings. Arizona Chemical’s performance advantage in alkyd resins enables it to secure a price premium over various substitutes. From a functional perspective, TOFA is superior to other competing chemistries, as it provides better reactivity and compatibility versus other components. The customer base for
TOFA is represented by both alkyd resin producers as well as integrated coating companies. DTO is also sold into the coatings market to enhance abrasion and mechanical resistance.
Metalworking Fluids & Lubricants
Producers of bio-based lubricants use ester and amide derivatives of TOFA, monomer acid, dimers, isostearic acids and hydroxystearic acids as raw materials. The metalworking fluids and lubricants submarket encompasses chain saw, aluminum rolling, two cycle engine, marine, fiber spinning, greases and metal forming applications. Metalworking fluids require products with emulsification, dispersion, biocidal and anticorrosion properties. The use of DTO, a mixture of TOFA and rosin acids, and a fraction of the CTO refining process, offers these properties.
The metalworking fluids and lubricants’ customer base is represented by leading lubricant companies that are active in the metalworking fluids and lubricants submarket.
Confidential
48
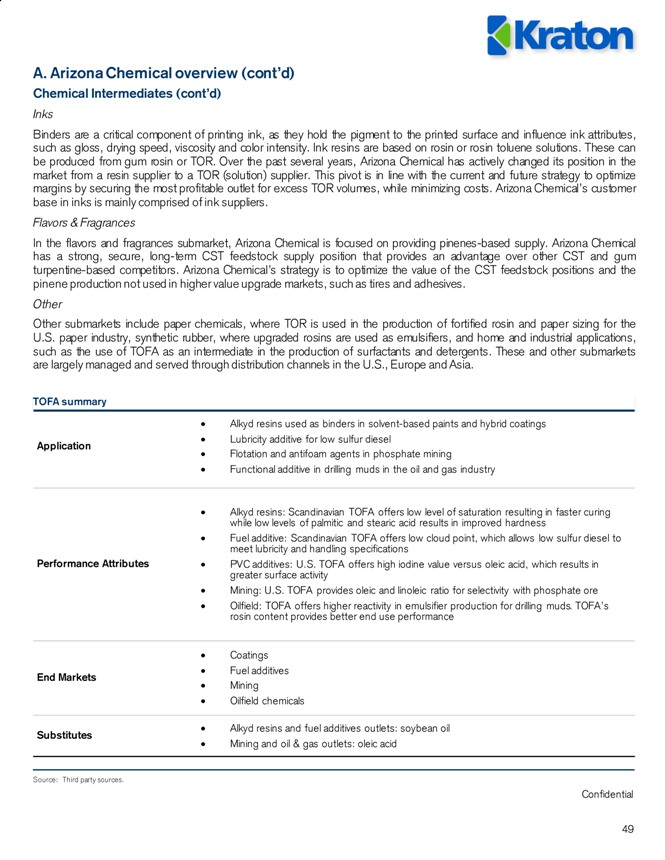
A. Arizona Chemical overview (cont’d)
Chemical Intermediates (cont’d)
Inks
Binders are a critical component of printing ink, as they hold the pigment to the printed surface and influence ink attributes, such as gloss, drying speed, viscosity and color intensity. Ink resins are based on rosin or rosin toluene solutions. These can be produced from gum rosin or TOR. Over the past several years, Arizona Chemical has actively changed its position in the market from a resin supplier to a TOR (solution) supplier. This pivot is in line with the current and future strategy to optimize margins by securing the most profitable outlet for excess TOR volumes, while minimizing costs. Arizona Chemical’s customer base in inks is mainly comprised of ink suppliers.
Flavors & Fragrances
In the flavors and fragrances submarket, Arizona Chemical is focused on providing pinenes-based supply. Arizona Chemical has a strong, secure, long-term CST feedstock supply position that provides an advantage over other CST and gum turpentine-based competitors. Arizona Chemical’s strategy is to optimize the value of the CST feedstock positions and the pinene production not used in higher value upgrade markets, such as tires and adhesives.
Other
Other submarkets include paper chemicals, where TOR is used in the production of fortified rosin and paper sizing for the
U.S. paper industry, synthetic rubber, where upgraded rosins are used as emulsifiers, and home and industrial applications, such as the use of TOFA as an intermediate in the production of surfactants and detergents. These and other submarkets are largely managed and served through distribution channels in the U.S., Europe and Asia.
TOFA summary
· Alkyd resins used as binders in solvent-based paints and hybrid coatings · Lubricity additive for low sulfur diesel
Application
· Flotation and antifoam agents in phosphate mining
· Functional additive in drilling muds in the oil and gas industry
· Alkyd resins: Scandinavian TOFA offers low level of saturation resulting in faster curing while low levels of palmitic and stearic acid results in improved hardness · Fuel additive: Scandinavian TOFA offers low cloud point, which allows low sulfur diesel to meet lubricity and handling specifications Performance Attributes · PVC additives: U.S. TOFA offers high iodine value versus oleic acid, which results in greater surface activity · Mining: U.S. TOFA provides oleic and linoleic ratio for selectivity with phosphate ore · Oilfield: TOFA offers higher reactivity in emulsifier production for drilling muds. TOFA’s rosin content provides better end use performance
· Coatings · Fuel additives
End Markets
· Mining
· Oilfield chemicals
· Alkyd resins and fuel additives outlets: soybean oil
Substitutes
· Mining and oil & gas outlets: oleic acid
Source: Third party sources.
Confidential
49
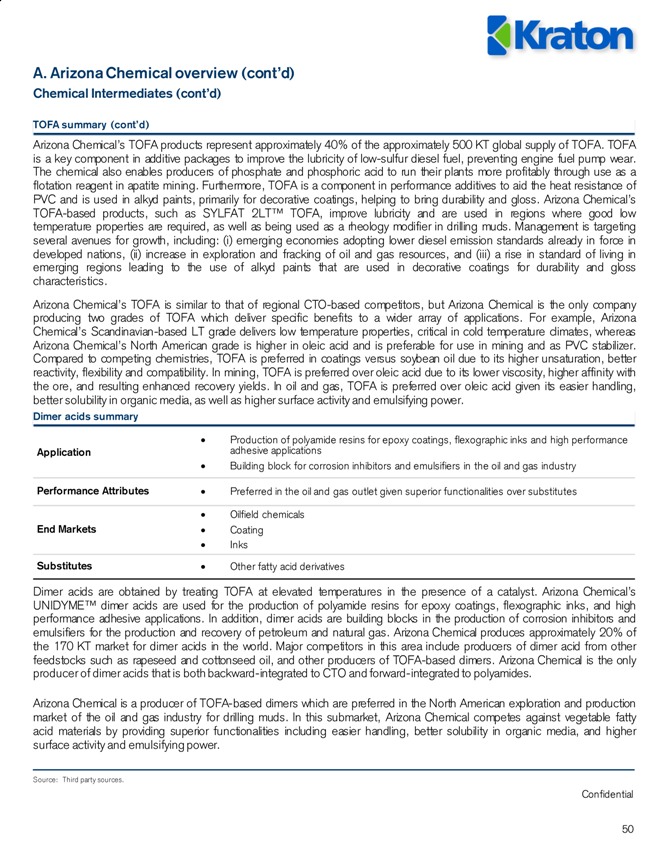
A. Arizona Chemical overview (cont’d)
Chemical Intermediates (cont’d)
TOFA summary (cont’d)
Arizona Chemical’s TOFA products represent approximately 40% of the approximately 500 KT global supply of TOFA. TOFA is a key component in additive packages to improve the lubricity of low-sulfur diesel fuel, preventing engine fuel pump wear.
The chemical also enables producers of phosphate and phosphoric acid to run their plants more profitably through use as a flotation reagent in apatite mining. Furthermore, TOFA is a component in performance additives to aid the heat resistance of PVC and is used in alkyd paints, primarily for decorative coatings, helping to bring durability and gloss. Arizona Chemical’s TOFA-based products, such as SYLFAT 2LT™ TOFA, improve lubricity and are used in regions where good low temperature properties are required, as well as being used as a rheology modifier in drilling muds. Management is targeting several avenues for growth, including: (i) emerging economies adopting lower diesel emission standards already in force in developed nations, (ii) increase in exploration and fracking of oil and gas resources, and (iii) a rise in standard of living in emerging regions leading to the use of alkyd paints that are used in decorative coatings for durability and gloss characteristics.
Arizona Chemical’s TOFA is similar to that of regional CTO-based competitors, but Arizona Chemical is the only company producing two grades of TOFA which deliver specific benefits to a wider array of applications. For example, Arizona
Chemical’s Scandinavian-based LT grade delivers low temperature properties, critical in cold temperature climates, whereas
Arizona Chemical’s North American grade is higher in oleic acid and is preferable for use in mining and as PVC stabilizer.
Compared to competing chemistries, TOFA is preferred in coatings versus soybean oil due to its higher unsaturation, better reactivity, flexibility and compatibility. In mining, TOFA is preferred over oleic acid due to its lower viscosity, higher affinity with the ore, and resulting enhanced recovery yields. In oil and gas, TOFA is preferred over oleic acid given its easier handling, better solubility in organic media, as well as higher surface activity and emulsifying power.
Dimer acids summary
· Production of polyamide resins for epoxy coatings, flexographic inks and high performance Application adhesive applications · Building block for corrosion inhibitors and emulsifiers in the oil and gas industry
Performance Attributes · Preferred in the oil and gas outlet given superior functionalities over substitutes · Oilfield chemicals
End Markets · Coating
· Inks
Substitutes · Other fatty acid derivatives
Dimer acids are obtained by treating TOFA at elevated temperatures in the presence of a catalyst. Arizona Chemical’s UNIDYME™ dimer acids are used for the production of polyamide resins for epoxy coatings, flexographic inks, and high performance adhesive applications. In addition, dimer acids are building blocks in the production of corrosion inhibitors and emulsifiers for the production and recovery of petroleum and natural gas. Arizona Chemical produces approximately 20% of the 170 KT market for dimer acids in the world. Major competitors in this area include producers of dimer acid from other feedstocks such as rapeseed and cottonseed oil, and other producers of TOFA-based dimers. Arizona Chemical is the only producer of dimer acids that is both backward-integrated to CTO and forward-integrated to polyamides.
Arizona Chemical is a producer of TOFA-based dimers which are preferred in the North American exploration and production market of the oil and gas industry for drilling muds. In this submarket, Arizona Chemical competes against vegetable fatty acid materials by providing superior functionalities including easier handling, better solubility in organic media, and higher surface activity and emulsifying power.
Source: Third party sources.
Confidential
50
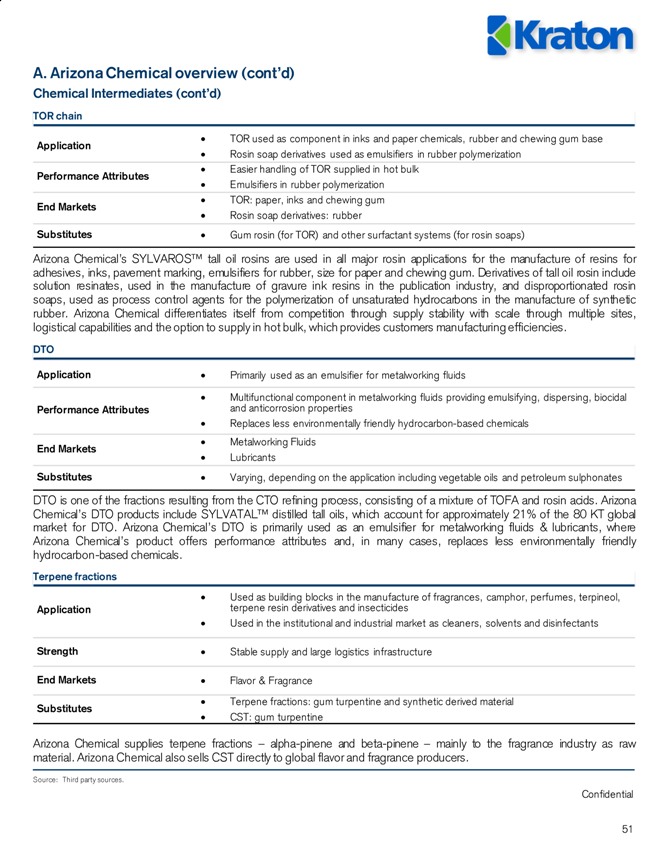
A. Arizona Chemical overview (cont’d)
Chemical Intermediates (cont’d)
TOR chain
· TOR used as component in inks and paper chemicals, rubber and chewing gum base
Application
· Rosin soap derivatives used as emulsifiers in rubber polymerization · Easier handling of TOR supplied in hot bulk
Performance Attributes
· Emulsifiers in rubber polymerization · TOR: paper, inks and chewing gum
End Markets
· Rosin soap derivatives: rubber
Substitutes · Gum rosin (for TOR) and other surfactant systems (for rosin soaps)
Arizona Chemical’s SYLVAROS™ tall oil rosins are used in all major rosin applications for the manufacture of resins for adhesives, inks, pavement marking, emulsifiers for rubber, size for paper and chewing gum. Derivatives of tall oil rosin include solution resinates, used in the manufacture of gravure ink resins in the publication industry, and disproportionated rosin soaps, used as process control agents for the polymerization of unsaturated hydrocarbons in the manufacture of synthetic rubber. Arizona Chemical differentiates itself from competition through supply stability with scale through multiple sites, logistical capabilities and the option to supply in hot bulk, which provides customers manufacturing efficiencies.
DTO
Application · Primarily used as an emulsifier for metalworking fluids
· Multifunctional component in metalworking fluids providing emulsifying, dispersing, biocidal Performance Attributes and anticorrosion properties · Replaces less environmentally friendly hydrocarbon-based chemicals · Metalworking Fluids
End Markets
· Lubricants
Substitutes · Varying, depending on the application including vegetable oils and petroleum sulphonates
DTO is one of the fractions resulting from the CTO refining process, consisting of a mixture of TOFA and rosin acids. Arizona
Chemical’s DTO products include SYLVATAL™ distilled tall oils, which account for approximately 21% of the 80 KT global market for DTO. Arizona Chemical’s DTO is primarily used as an emulsifier for metalworking fluids & lubricants, where Arizona Chemical’s product offers performance attributes and, in many cases, replaces less environmentally friendly hydrocarbon-based chemicals.
Terpene fractions
· Used as building blocks in the manufacture of fragrances, camphor, perfumes, terpineol, Application terpene resin derivatives and insecticides · Used in the institutional and industrial market as cleaners, solvents and disinfectants
Strength · Stable supply and large logistics infrastructure
End Markets · Flavor & Fragrance
· Terpene fractions: gum turpentine and synthetic derived material
Substitutes
· CST: gum turpentine
Arizona Chemical supplies terpene fractions – alpha-pinene and beta-pinene – mainly to the fragrance industry as raw material. Arizona Chemical also sells CST directly to global flavor and fragrance producers.
Source: Third party sources.
Confidential
51
B. Customers
Customer relationships are generally long-standing for a number of reasons. A customer’s familiarity with a supplier is an important determinant in serving value-added end markets. Several applications including tire tread enhancement, fuel additives and oil & mining require extensive testing and lead times to be qualified and approved by the customer.
Consequently, Arizona Chemical has strong, long-standing customer relationships, with eight out of its top 10 customers having been with Arizona Chemical for over 10 years.
Arizona Chemical’s blue chip customer base is characterized by its low concentration and stability. Today, Arizona Chemical serves approximately 550 customers in 68 countries. Arizona Chemical is not overly dependent on any single account, with its top customer representing less than 10% of revenue and the top 10 customers (excluding renewable energy) generating approximately 40%. Customer relationships are generally stable and long-standing, with most of the top 10 customers having relationships spanning 10 years or more.
Arizona Chemical leverages its global key account management capability to better serve market leading adhesive formulators and tape and label producers. This team also services smaller adhesive formulators that operate more regionally but are also important to Arizona Chemical’s business success. Smaller adhesive formulators are further serviced through distributors due to the high degree of end user fragmentation. Arizona Chemical has a strong distribution channel in both established and developing regions.
Arizona Chemical’s roads & construction business unit maintains strong relationships with customers including thermoplastic pavement marking and coating producers, asphalt mix producers, roofing membrane producers, road builders and asphalt emulsifier manufacturers. Arizona Chemical maintains deep relationships with key customers throughout the U.S. and
Europe. Sales are typically made directly with customers, without the use of third party distributors. Arizona Chemical is also developing relationships with key influencers, road owners and regulators in the asphalt paving value chain. Arizona Chemical will continue to evaluate the distribution strategy as the roads & construction business unit expands and matures.
Arizona Chemical uses a key account approach in working with the leading global tire customers. For U.S. and European-based customers, Arizona Chemical coordinates on a global basis directly with the customers’ technical and purchasing teams. In addition, Arizona Chemical ships globally to these accounts’ factories located in different countries.
For customers with headquarters based in Asia, Arizona Chemical uses a distribution network organized by country, but with coordinated key account management with its distributors and the final customer. The distributors for tires have specialized support activities related to the tires market. Arizona Chemical has full transparency on volume levels sold to the final customer and has reports integrated in its internal reporting systems. In three key countries for tire manufacturers (Japan,
Korea and China) Arizona Chemical provides a high degree of direct technical support for several large, priority customers in
Asia that are coordinated with the distributor. The support includes Arizona Chemical technical expertise and management with joint growth initiatives.
Since the customer base for chemical intermediates varies by submarket, region, application and typical size of customers,
Arizona Chemical transacts their business through third party channel partners, who were chosen based on their penetration of select submarkets and supply chain capabilities. For larger blue chip customers and key accounts in select submarkets, Arizona Chemical uses a direct sales effort to maximize value and customer focus. Arizona Chemical’s chemical intermediates business unit maintains long and stable relationships with its diverse range of blue chip customers. The customers and distributors conduct business in both contract and spot transactions.
Confidential
52
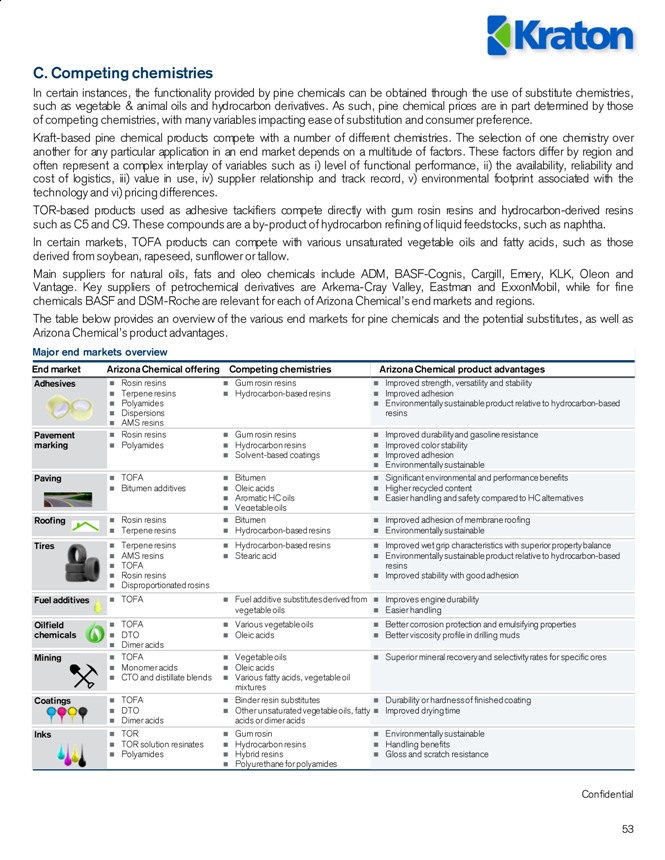
C. Competing chemistries
In certain instances, the functionality provided by pine chemicals can be obtained through the use of substitute chemistries, such as vegetable & animal oils and hydrocarbon derivatives. As such, pine chemical prices are in part determined by those of competing chemistries, with many variables impacting ease of substitution and consumer preference.
Kraft-based pine chemical products compete with a number of different chemistries. The selection of one chemistry over another for any particular application in an end market depends on a multitude of factors. These factors differ by region and often represent a complex interplay of variables such as i) level of functional performance, ii) the availability, reliability and cost of logistics, iii) value in use, iv) supplier relationship and track record, v) environmental footprint associated with the technology and vi) pricing differences.
TOR-based products used as adhesive tackifiers compete directly with gum rosin resins and hydrocarbon-derived resins such as C5 and C9. These compounds are a by-product of hydrocarbon refining of liquid feedstocks, such as naphtha.
In certain markets, TOFA products can compete with various unsaturated vegetable oils and fatty acids, such as those derived from soybean, rapeseed, sunflower or tallow.
Main suppliers for natural oils, fats and oleo chemicals include ADM, BASF-Cognis, Cargill, Emery, KLK, Oleon and Vantage. Key suppliers of petrochemical derivatives are Arkema-Cray Valley, Eastman and ExxonMobil, while for fine chemicals BASF and DSM-Roche are relevant for each of Arizona Chemical’s end markets and regions.
The table below provides an overview of the various end markets for pine chemicals and the potential substitutes, as well as
Arizona Chemical’s product advantages.
Major end markets overview
End market Arizona Chemical offering Competing chemistries Arizona Chemical product advantages
Adhesives Rosin resins Gum rosin resins Improved strength, versatility and stability Terpene resins Hydrocarbon-based resins Improved adhesion
Polyamides Environmentally sustainable product relative to hydrocarbon-based Dispersions resins AMS resins Pavement Rosin resins Gum rosin resins Improved durability and gasoline resistance marking Polyamides Hydrocarbon resins Improved color stability Solvent-based coatings Improved adhesion Environmentally sustainable Paving TOFA Bitumen Significant environmental and performance benefits Bitumen additives Oleic acids Higher recycled content Aromatic HC oils Easier handling and safety compared to HC alternatives Vegetable oils Roofing Rosin resins Bitumen Improved adhesion of membrane roofing Terpene resins Hydrocarbon-based resins Environmentally sustainable Tires Terpene resins Hydrocarbon-based resins Improved wet grip characteristics with superior property balance AMS resins Stearic acid Environmentally sustainable product relative to hydrocarbon-based TOFA resins Rosin resins Improved stability with good adhesion Disproportionated rosins Fuel additives TOFA Fuel additive substitutes derived from Improves engine durability vegetable oils Easier handling Oilfield TOFA Various vegetable oils Better corrosion protection and emulsifying properties chemicals DTO Oleic acids Better viscosity profile in drilling muds Dimer acids Mining TOFA Vegetable oils Superior mineral recovery and selectivity rates for specific ores Monomer acids Oleic acids CTO and distillate blends Various fatty acids, vegetable oil mixtures Coatings TOFA Binder resin substitutes Durability or hardness of finished coating DTO Other unsaturated vegetable oils, fatty Improved drying time Dimer acids acids or dimer acids Inks TOR Gum rosin Environmentally sustainable TOR solution resinates Hydrocarbon resins Handling benefits Polyamides Hybrid resins Gloss and scratch resistance Polyurethane for polyamides
Confidential
53
C. Competing chemistries (cont’d)
Hydrocarbons
Arizona Chemical offers various products, particularly in the adhesives market, that compete with hydrocarbon-based resins.
The pricing of hydrocarbon resins used in adhesives applications is largely dependent on the supply and demand balance of resin formers and their corresponding pricing. This availability is heavily impacted by the ethylene cracking choices of naphtha
(liquid- based), ethane or propane.
Naptha-based hydrocarbon refining yields raw materials called resin formers, which are C5 and C9. These compounds are further processed into tackifiers used in adhesives, pavement marking, tires, inks and various other markets. The availability of these products is impacted dramatically when refiners incorporate higher levels of natural gas in ethylene production, resulting in lower yields of resin formers. This dynamic has a significant influence on supply demand for resin formers directly impacting tackifier market pricing.
Refining trends for hydrocarbons differ by region. In the U.S. hydrocarbon refiners have tended to shift away from liquid feedstocks such as naphtha, toward natural gas, linked to advances in shale gas drilling and the associated proliferation of gas feedstocks. This tightened the supply of C5 and C9, leading to increased prices for these products, and thus represents a positive economic driver for Arizona Chemical. Specifically, as oil prices in 2015 have declined, pricing for C5 resins has continued to increase due to tightness in overall supply. In Europe, the relocation of refining capacity out of the domestic market has also led to the outcome of shortening hydrocarbon resin-former supply. Conversely, in Asia, an expansion in naphtha-based refining capacity has occurred to meet economic growth in the region. This will result in improved supply of
C5 and C9. As the quality and availability of these tackifiers improves within the region, they will be available for exporting to the rest of the world. However, currently the downstream processing of naphtha feedstocks has not been diverted to higher quality resin derivatives, which are required for adhesives.
Gum rosin
Products obtained by manually tapping individual pine trees are referred to as gum products and include gum rosin and gum turpentine. Gum rosin products compete with TOR, a product derived from CTO, as do gum turpentine fractions with CST fractions. However, the characteristics of CTO, CST and gum-based products vary.
The process of manually tapping individual pine trees is labor intensive, and as such, the majority of global production of gum rosin and gum turpentine originates from emerging economies such as China, the largest global supplier and, to a lesser extent, Indonesia, Brazil and more recently Vietnam.
Gum rosin pricing has been trending upward, with supply and demand dynamics for gum rosin products evolving due to the agricultural nature and heavy reliance on manual labor for harvesting. Economic growth in China is driving up labor costs, resulting in increased gum rosin prices. As tapping becomes less economically viable in China, global supply is expected to tighten. These trends have historically been observed in other former, major gum-producing countries, such as the U.S.,
Portugal and Spain.
China’s gum rosin production volume in 2013 was at recent historical lows, 30% lower than recent peak production volumes in 2011. During 2014, production volumes increased modestly, mostly offset by an increase in domestic Chinese consumption. With local demand for gum rosin relatively stable, this tightened supply has decreased China’s exports. Due to these factors, gum rosin prices sharply increased in 2013 and 2014 and have stabilized in a range of 2,100–2,500 $/MT. Prices of gum rosin are expected to continue to fluctuate in these price ranges, increasing over the longer term, broadly in line with growth in Chinese labor costs.
Gum rosin pricing is an important indicator for Arizona Chemical, as it competes with tall oil rosin in certain applications.
Confidential
54
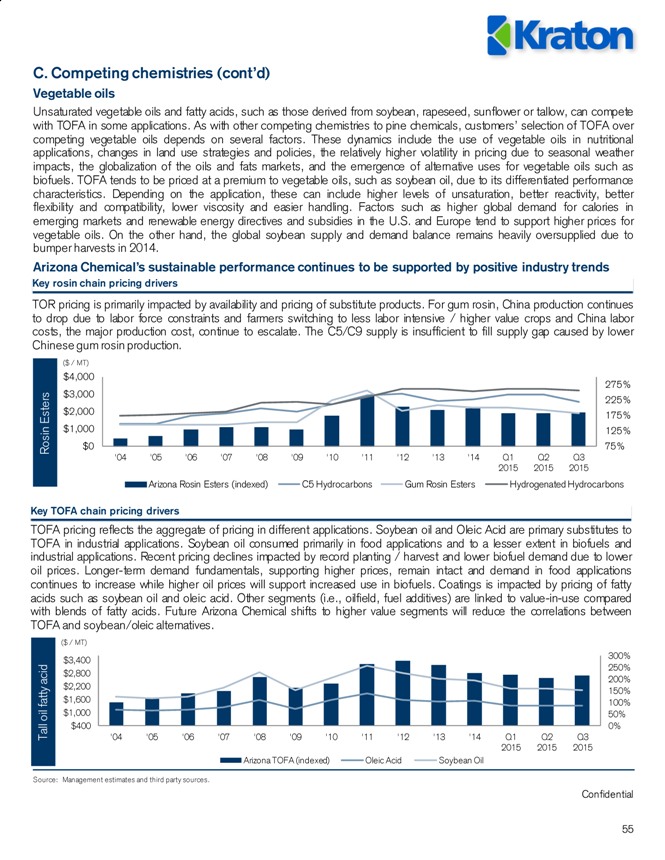
C. Competing chemistries (cont’d)
Vegetable oils
Unsaturated vegetable oils and fatty acids, such as those derived from soybean, rapeseed, sunflower or tallow, can compete with TOFA in some applications. As with other competing chemistries to pine chemicals, customers’ selection of TOFA over competing vegetable oils depends on several factors. These dynamics include the use of vegetable oils in nutritional applications, changes in land use strategies and policies, the relatively higher volatility in pricing due to seasonal weather impacts, the globalization of the oils and fats markets, and the emergence of alternative uses for vegetable oils such as biofuels. TOFA tends to be priced at a premium to vegetable oils, such as soybean oil, due to its differentiated performance characteristics. Depending on the application, these can include higher levels of unsaturation, better reactivity, better flexibility and compatibility, lower viscosity and easier handling. Factors such as higher global demand for calories in emerging markets and renewable energy directives and subsidies in the U.S. and Europe tend to support higher prices for vegetable oils. On the other hand, the global soybean supply and demand balance remains heavily oversupplied due to bumper harvests in 2014.
Arizona Chemical’s sustainable performance continues to be supported by positive industry trends
Key rosin chain pricing drivers
TOR pricing is primarily impacted by availability and pricing of substitute products. For gum rosin, China production continues to drop due to labor force constraints and farmers switching to less labor intensive / higher value crops and China labor costs, the major production cost, continue to escalate. The C5/C9 supply is insufficient to fill supply gap caused by lower
Chinese gum rosin production.
($ / MT)
$4,000
275% $3,000 225% Esters $2,000 175% $1,000 125%
Rosin $0 75%
‘04 ‘05 ‘06 ‘07 ‘08 ‘09 ‘10 ‘11 ‘12 ‘13 ‘14 Q1 Q2 Q3 2015 2015 2015
Arizona Rosin Esters (indexed) C5 Hydrocarbons Gum Rosin Esters Hydrogenated Hydrocarbons
Key TOFA chain pricing drivers
TOFA pricing reflects the aggregate of pricing in different applications. Soybean oil and Oleic Acid are primary substitutes to
TOFA in industrial applications. Soybean oil consumed primarily in food applications and to a lesser extent in biofuels and industrial applications. Recent pricing declines impacted by record planting / harvest and lower biofuel demand due to lower oil prices. Longer-term demand fundamentals, supporting higher prices, remain intact and demand in food applications continues to increase while higher oil prices will support increased use in biofuels. Coatings is impacted by pricing of fatty acids such as soybean oil and oleic acid. Other segments (i.e., oilfield, fuel additives) are linked to value-in-use compared with blends of fatty acids. Future Arizona Chemical shifts to higher value segments will reduce the correlations between
TOFA and soybean/oleic alternatives.
($ / MT)
300% $3,400 250% $2,800
acid 200%
$2,200
150% fatty $1,600 100% $1,000
oil 50%
$400 0% Tall ‘04 ‘05 ‘06 ‘07 ‘08 ‘09 ‘10 ‘11 ‘12 ‘13 ‘14 Q1 Q2 Q3 2015 2015 2015 Arizona TOFA (indexed) Oleic Acid Soybean Oil
Source: Management estimates and third party sources.
Confidential
55
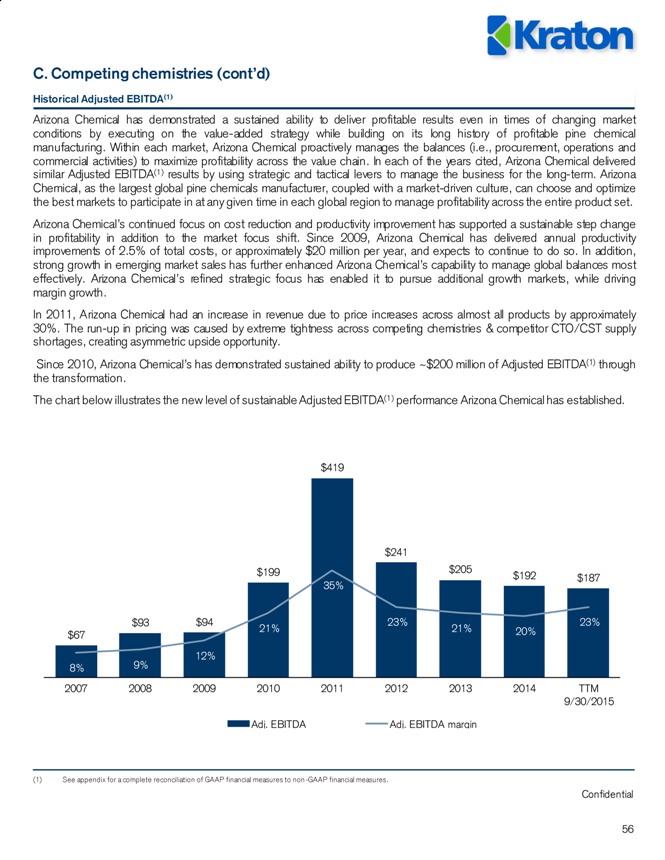
C. Competing chemistries (cont’d)
Historical Adjusted EBITDA(1)
Arizona Chemical has demonstrated a sustained ability to deliver profitable results even in times of changing market conditions by executing on the value-added strategy while building on its long history of profitable pine chemical manufacturing. Within each market, Arizona Chemical proactively manages the balances (i.e., procurement, operations and commercial activities) to maximize profitability across the value chain. In each of the years cited, Arizona Chemical delivered similar Adjusted EBITDA(1) results by using strategic and tactical levers to manage the business for the long-term. Arizona Chemical, as the largest global pine chemicals manufacturer, coupled with a market-driven culture, can choose and optimize the best markets to participate in at any given time in each global region to manage profitability across the entire product set.
Arizona Chemical’s continued focus on cost reduction and productivity improvement has supported a sustainable step change in profitability in addition to the market focus shift. Since 2009, Arizona Chemical has delivered annual productivity improvements of 2.5% of total costs, or approximately $20 million per year, and expects to continue to do so. In addition, strong growth in emerging market sales has further enhanced Arizona Chemical’s capability to manage global balances most effectively. Arizona Chemical’s refined strategic focus has enabled it to pursue additional growth markets, while driving margin growth.
In 2011, Arizona Chemical had an increase in revenue due to price increases across almost all products by approximately
30%. The run-up in pricing was caused by extreme tightness across competing chemistries & competitor CTO/CST supply shortages, creating asymmetric upside opportunity.
Since 2010, Arizona Chemical’s has demonstrated sustained ability to produce ~$200 million of Adjusted EBITDA(1) through the transformation.
The chart below illustrates the new level of sustainable Adjusted EBITDA(1) performance Arizona Chemical has established.
$419
$241 $199 $205
35% $192 $187
$93 $94 23% 23% 21% 21% 20% $67 12%
9% TTM
8%
2007 2008 2009 2010 2011 2012 2013 2014 TTM 9/30/2015
Adj. EBITDA Adj. EBITDA margin
(1) See appendix for a complete reconciliation of GAAP financial measures to non -GAAP financial measures.
Confidential
56
D. Raw materials
Arizona Chemical holds a competitive advantage with its access to secure supplies of high quality CTO and CST.
A key component of Arizona Chemical’s procurement strength is its contract with International Paper, which provides Arizona
Chemical a stable and secure source of high quality CTO and CST. Under the contract, Arizona Chemical’s CTO pricing is indexed to a basket of fossil fuels including natural gas, heavy fuel oil and coal. Furthermore, the contract allows Arizona
Chemical access to the entire CTO and CST volumes produced by International Paper. Supply of CTO and CST is finite, and pricing is relatively inelastic, putting a premium on effective sourcing efforts.
In addition to its relationship with International Paper, Arizona Chemical maintains strong relationships with other major pulp and paper manufacturers around the world, ensuring stability of access to its critical feedstock supply. In Europe, agreements also allow Arizona Chemical to exchange its pitch by-product for CTO. The exchange allows Arizona Chemical to maximize CTO supply and sell its pitch by-product to suppliers, who in turn use pitch as a renewable fuel source for their milling operation.
Arizona Chemical is the world’s largest buyer and processor of black liquor soap (“BLS”), which is produced from CTO.
Arizona Chemical operates two BLS acidulation units located at its Savannah, Georgia and Panama City, Florida sites. In addition, Arizona Chemical has four toll acidulation sites that are under long-term contracts. These units are a key part of the CTO procurement strategy, as they provide access to additional raw material from pulp mills that do not have in-house BLS acidulation capacity.
Relationships with feedstock suppliers are further enhanced by Arizona Chemical’s technical expertise in feedstock recovery. Arizona Chemical possesses industry-leading recovery engineering expertise, which helps pulp mills improve their operations by increasing the yield of BLS and CTO, while increasing their revenue and improving the efficiency of their mill operations.
In addition to improving CTO recovery, Arizona Chemical also maintains an extensive logistics network and works closely with pulp mills to transport BLS and CTO in a timely manner. Mills have limited storage capacity and excessive quantities of BLS or CTO on-site can disrupt pulping operations. This requires extensive information sharing including projected pulping rates, shut-down coordination and transport scheduling.
CTO prices in North America are driven by a variety of influences including commodity prices for oil, natural gas and coal, as well as the supply and demand balance.
CTO prices in Europe are traditionally correlated with the price of oil, with contract prices based on the average heavy fuel oil price from the previous quarter. Heavy fuel oil prices are highly correlated with Brent crude prices. Generally, oil price changes impact European CTO prices on a quarterly lag.
Confidential
57
VII. Financial overview
Confidential
58
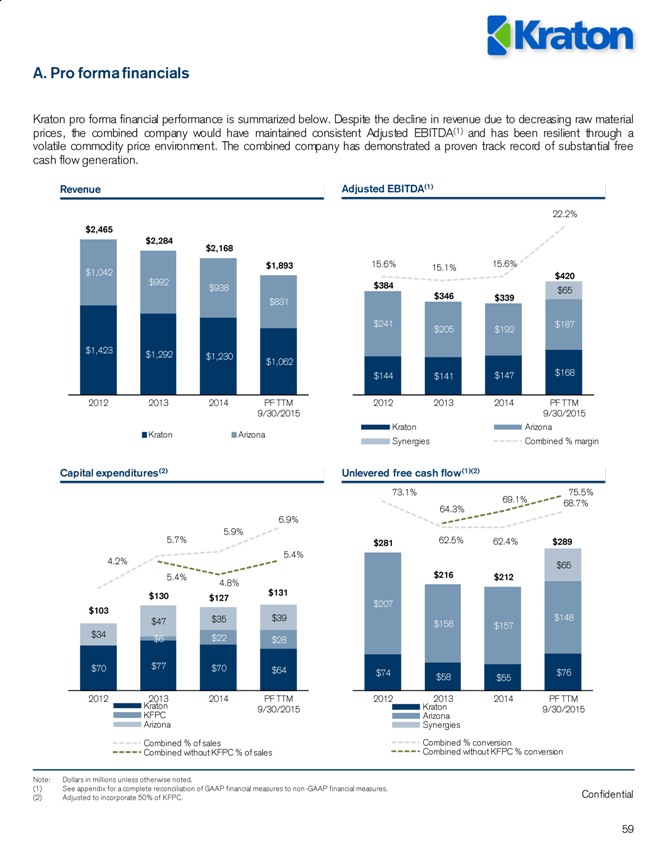
A. Pro forma financials
Kraton pro forma financial performance is summarized below. Despite the decline in revenue due to decreasing raw material prices, the combined company would have maintained consistent Adjusted EBITDA(1) and has been resilient through a volatile commodity price environment. The combined company has demonstrated a proven track record of substantial free cash flow generation.
Revenue Adjusted EBITDA(1)
22.2% $2,465 $2,284 $2,168 $1,042 $1,893 15.6% 15.1% 15.6% $420 $992 $384 $938 $346 $65 $831 $339 $241 $187 $205 $192
$1,423 $1,292 $1,230 $1,062 $144 $141 $147 $168
2012 2013 2014 PF TTM 2012 2013 2014 PF TTM 9/30/2015 9/30/2015 Kraton Arizona Kraton Arizona Synergies Combined % margin
Capital expenditures(2) Unlevered free cash flow(1)(2)
73.1% 75.5% 69.1% 68.7% 64.3%
6.9%
5.7% 5.9% 62.5% $281 62.4% $289
5.4%
4.2% $65
5.4% 4.8% $216 $212 $130 $131 $127 $207 $103
$47 $35 $39 $148 $158 $157
$34 $22
$6 $28
$70 $77 $70
$64 $74 $76
$58 $55
2012 2013 2014 PF TTM 2012 2013 2014 PF TTM Kraton 9/30/2015 Kraton 9/30/2015 KFPC Arizona Arizona Synergies Combined % of sales Combined % conversion Combined without KFPC % of sales Combined without KFPC % conversion
Note: Dollars in millions unless otherwise noted.
(1) See appendix for a complete reconciliation of GAAP financial measures to non -GAAP financial measures.
(2) Adjusted to incorporate 50% of KFPC. Confidential
59
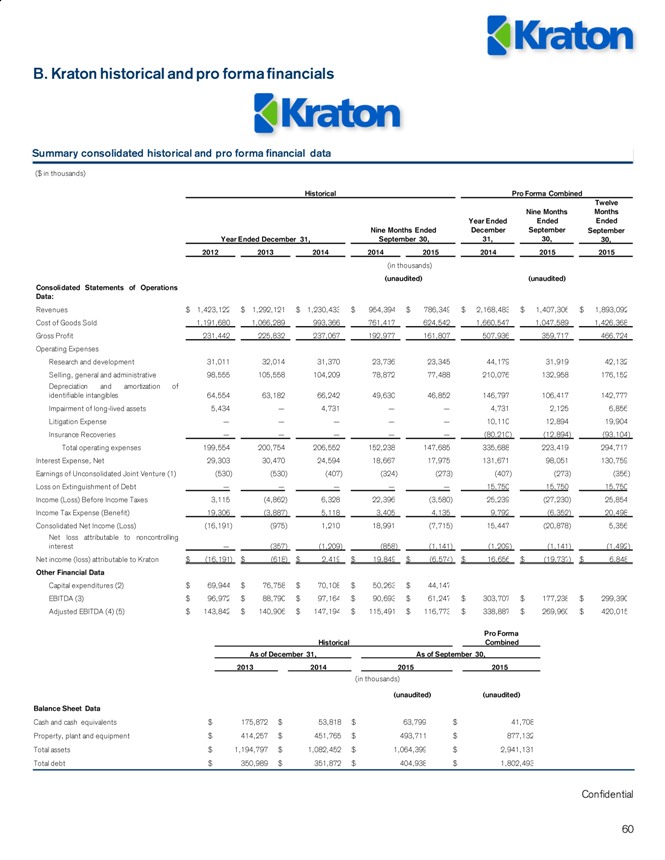
B. Kraton historical and pro forma financials
Summary consolidated historical and pro forma financial data
($ in thousands)
Historical Pro Forma Combined
Twelve
Nine Months Months Year Ended Ended Ended Nine Months Ended December September September Year Ended December 31, September 30, 31, 30, 30, 2012 2013 2014 2014 2015 2014 2015 2015
(in thousands)
(unaudited) (unaudited) Consolidated Statements of Operations
Data:
Revenues $ 1,423,122 $ 1,292,121 $ 1,230,433 $ 954,394 $ 786,349 $ 2,168,483 $ 1,407,306 $ 1,893,092 Cost of Goods Sold 1,191,680 1,066,289 993,366 761,417 624,542 1,660,547 1,047,589 1,426,368 Gross Profit 231,442 225,832 237,067 192,977 161,807 507,936 359,717 466,724
Operating Expenses
Research and development 31,011 32,014 31,370 23,736 23,345 44,179 31,919 42,132 Selling, general and administrative 98,555 105,558 104,209 78,872 77,488 210,076 132,958 176,152 Depreciation and amortization of identifiable intangibles 64,554 63,182 66,242 49,630 46,852 146,797 106,417 142,777 Impairment of long-lived assets 5,434 — 4,731 — — 4,731 2,125 6,856 Litigation Expense — — — — — 10,110 12,894 19,904 Insurance Recoveries — — — — — (80,210) (12,894) (93,104) Total operating expenses 199,554 200,754 206,552 152,238 147,685 335,688 223,419 294,717 Interest Expense, Net 29,303 30,470 24,594 18,667 17,975 131,671 98,051 130,759 Earnings of Unconsolidated Joint Venture (1) (530) (530) (407) (324) (273) (407) (273) (356) Loss on Extinguishment of Debt — — — — — 15,750 15,750 15,750 Income (Loss) Before Income Taxes 3,115 (4,862) 6,328 22,396 (3,580) 25,239 (27,230) 25,854 Income Tax Expense (Benefit) 19,306 (3,887) 5,118 3,405 4,135 9,792 (6,352) 20,498 Consolidated Net Income (Loss) (16,191) (975) 1,210 18,991 (7,715) 15,447 (20,878) 5,356 Net loss attributable to noncontrolling interest — (357) (1,209) (858) (1,141) (1,209) (1,141) (1,492) Net income (loss) attributable to Kraton $ (16,191) $ (618) $ 2,419 $ 19,849 $ (6,574) $ 16,656 $ (19,737) $ 6,848
Other Financial Data
Capital expenditures (2) $ 69,944 $ 76,758 $ 70,108 $ 50,263 $ 44,147
EBITDA (3) $ 96,972 $ 88,790 $ 97,164 $ 90,693 $ 61,247 $ 303,707 $ 177,238 $ 299,390 Adjusted EBITDA (4) (5) $ 143,842 $ 140,906 $ 147,194 $ 115,491 $ 116,773 $ 338,887 $ 269,960 $ 420,015
Pro Forma
Historical Combined
As of December 31, As of September 30, 2013 2014 2015 2015
(in thousands)
(unaudited) (unaudited)
Balance Sheet Data
Cash and cash equivalents $ 175,872 $ 53,818 $ 63,799 $ 41,708 Property, plant and equipment $ 414,257 $ 451,765 $ 493,711 $ 877,132 Total assets $ 1,194,797 $ 1,082,452 $ 1,064,399 $ 2,941,131 Total debt $ 350,989 $ 351,872 $ 404,938 $ 1,802,493
Confidential
60
B. Kraton historical and pro forma financials (cont’d)
Summary consolidated historical and pro forma financial data (cont’d)
(1) Represents our 50% joint venture interest in Kraton JSR Elastomers K.K., which is accounted for using the equity method of accounting.
(2) Excludes capital expenditures incurred by KFPC, our 50/50 joint venture with FPCC.
(3) EBITDA represents net income before interest, taxes, depreciation and amortization. Limitations for EBITDA as an analytical tool include the following:
- EBITDA does not reflect the significant interest expense on our debt;
- EBITDA does not reflect the significant depreciation and amortization expense associated with our long-lived assets;
- EBITDA included herein should not be used for purposes of assessing compliance or non-compliance with financial covenants under our debt agreements. The calculation of EBITDA in the debt agreements includes adjustments, such as extraordinary, non-recurring or one-time charges, proforma cost savings, certain non-cash items, turnaround costs, and other items included in the definition of EBITDA in the debt agreements; and—other companies in our industry may calculate EBITDA differently than we do, limiting its usefulness as a comparative measure.
(4) Although we report our financial results using the first in first out (“FIFO”) basis of accounting, as part of our pricing strategy, we measure our business performance using the estimated current replacement cost (“ECRC”) of our inventory and cost of goods sold. We maintain our perpetual inventory in our global enterprise resource planning system, where the carrying value of our inventory is determined using FIFO. At the beginning of each month, we determine the estimated current cost of our raw materials for that particular month, and using the same perpetual inventory system that we use to manage inventory and therefore costs of goods sold under FIFO, we revalue our ending inventory to reflect the total cost of such inventory as if it was valued using the ECRC. The result of this revaluation from FIFO creates the spread between FIFO and ECRC. With inventory valued under FIFO and ECRC, we then have the ability to report cost of goods sold and therefore Adjusted EBITDA under both our FIFO convention and ECRC.
(5) Adjusted EBITDA is EBITDA net of the impact of the spread between the FIFO basis of accounting and ECRC and net of the impact of items we do not consider indicative of our ongoing operating performance. We explain how each adjustment is derived and why we believe it is helpful and appropriate in the reconciliation below. You are encouraged to evaluate each adjustment and the reasons we consider it appropriate for supplemental analysis. As an analytical tool, Adjusted EBITDA is subject to the limitations applicable to EBITDA described above, as well as the following limitations:—due to volatility in raw material prices, Adjusted EBITDA may, and often does, vary substantially from EBITDA, net income and other performance measures, including net income calculated in accordance with GAAP; and
- Adjusted EBITDA may, and often will, vary significantly from EBITDA calculations under the terms of our debt agreements and should not be used for assessing compliance or non-compliance with financial covenants under our debt agreements.
- Because of these and other limitations, EBITDA and Adjusted EBITDA should not be considered as a measure of discretionary cash available to us to invest in the growth of our business.
Our presentation of non-GAAP financial measures and the adjustments made therein should not be construed as an inference that our future results will be unaffected by unusual or non-recurring items, and in the future we may incur expenses or charges similar to the adjustments made in the presentation of our non-GAAP financial measures.
We compensate for these limitations by relying primarily on our GAAP results and using EBITDA and Adjusted EBITDA only as supplemental measures. See the Kraton Audited Financial Statements and the Kraton Interim Financial Statements included elsewhere in this offering circular.
Confidential
61
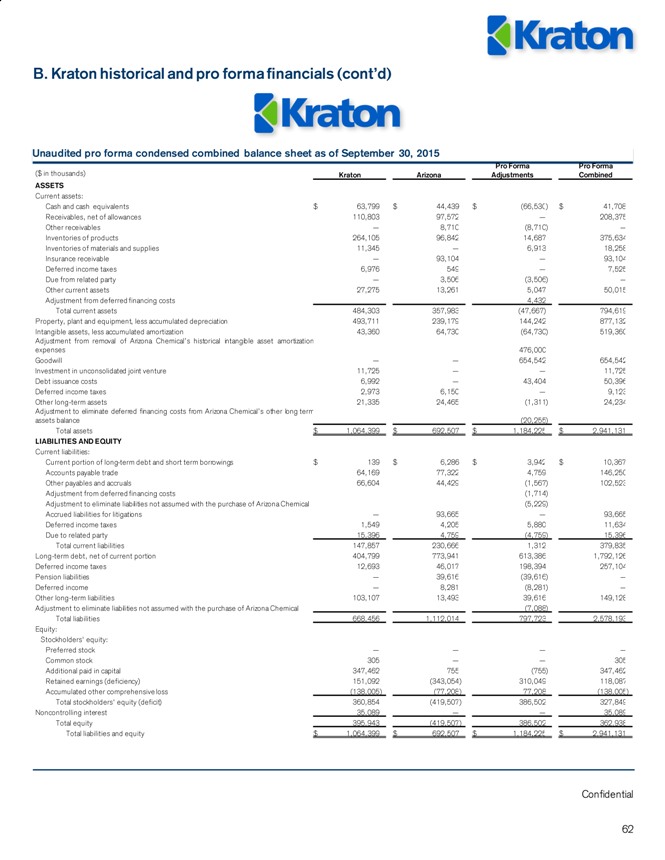
B. Kraton historical and pro forma financials (cont’d)
Unaudited pro forma condensed combined balance sheet as of September 30, 2015
Pro Forma Pro Forma ( $ in thousands) Kraton Arizona Adjustments Combined
ASSETS Current assets:
Cash and cash equivalents $ 63,799 $ 44,439 $ (66,530) $ 41,708 Receivables, net of allowances 110,803 97,572 — 208,375 Other receivables — 8,710 (8,710) — Inventories of products 264,105 96,842 14,687 375,634 Inventories of materials and supplies 11,345 — 6,913 18,258 Insurance receivable — 93,104 — 93,104 Deferred income taxes 6,976 549 — 7,525 Due from related party — 3,506 (3,506) — Other current assets 27,275 13,261 5,047 50,015 Adjustment from deferred financing costs 4,432 Total current assets 484,303 357,983 (47,667) 794,619 Property, plant and equipment, less accumulated depreciation 493,711 239,179 144,242 877,132 Intangible assets, less accumulated amortization 43,360 64,730 (64,730) 519,360 Adjustment from removal of Arizona Chemical’s historical intangible asset amortization expenses 476,000 Goodwill — — 654,542 654,542 Investment in unconsolidated joint venture 11,725 — — 11,725 Debt issuance costs 6,992 — 43,404 50,396 Deferred income taxes 2,973 6,150 — 9,123 Other long-term assets 21,335 24,465 (1,311) 24,234 Adjustment to eliminate deferred financing costs from Arizona Chemical’s other long term assets balance (20,255) Total assets $ 1,064,399 $ 692,507 $ 1,184,225 $ 2,941,131
LIABILITIES AND EQUITY
Current liabilities:
Current portion of long-term debt and short term borrowings $ 139 $ 6,286 $ 3,942 $ 10,367 Accounts payable trade 64,169 77,322 4,759 146,250 Other payables and accruals 66,604 44,429 (1,567) 102,523 Adjustment from deferred financing costs (1,714) Adjustment to eliminate liabilities not assumed with the purchase of Arizona Chemical (5,229) Accrued liabilities for litigations — 93,665 — 93,665 Deferred income taxes 1,549 4,205 5,880 11,634 Due to related party 15,396 4,759 (4,759) 15,396 Total current liabilities 147,857 230,666 1,312 379,835 Long-term debt, net of current portion 404,799 773,941 613,386 1,792,126 Deferred income taxes 12,693 46,017 198,394 257,104 Pension liabilities — 39,616 (39,616) — Deferred income — 8,281 (8,281) — Other long-term liabilities 103,107 13,493 39,616 149,128 Adjustment to eliminate liabilities not assumed with the purchase of Arizona Chemical (7,088) Total liabilities 668,456 1,112,014 797,723 2,578,193
Equity:
Stockholders’ equity:
Preferred stock — — — —
Common stock 305 — — 305 Additional paid in capital 347,462 755 (755) 347,462 Retained earnings (deficiency) 151,092 (343,054) 310,049 118,087 Accumulated other comprehensive loss (138,005) (77,208) 77,208 (138,005) Total stockholders’ equity (deficit) 360,854 (419,507) 386,502 327,849 Noncontrolling interest 35,089 — — 35,089 Total equity 395,943 (419,507) 386,502 362,938 Total liabilities and equity $ 1,064,399 $ 692,507 $ 1,184,225 $ 2,941,131
Confidential
62

B. Kraton historical and pro forma financials (cont’d)
Unaudited pro forma condensed combined statements of operations for the nine months ended September 30, 2015
($ in thousands)
Pro Forma Pro Forma Kraton Arizona Adjustments Combined
Revenue $ 786,349 $ 620,957 $ — $ 1,407,306 Cost of goods sold 624,542 436,039 1,587 1,047,589 Adjustment to reclassify Arizona Chemical’s depreciation and amortization (17,507) Adjustment to reclassify Arizona Chemical’s plant closure costs 3,136 Adjustment to reclassify Arizona Chemical’s foreign currency exchange loss (gain) and other income (208) Gross profit 161,807 184,918 12,992 359,717 Operating expenses: Research and development 23,345 — 8,574 31,919 Selling, general and administrative 77,488 78,205 (5,288) 132,958 Adjustment to reclassify Arizona Chemical’s selling, general and administrative expenses (8,574) Adjustment to remove the effect of one-time transaction costs directly related to the Arizona Chemical Acquisition incurred by Kraton and Arizona Chemical (7,310) Adjustment to remove the effect of management fees and out of pocket expenses paid to the owners of Arizona Chemical (1,563) Plant closure — 5,953 (5,953) —Depreciation and amortization 46,852 — 14,500 106,417 Adjustment from removal of Arizona Chemical’s historical intangible asset amortization expenses 21,578 Adjustment to reclassify Arizona Chemical’s depreciation and amortization 22,795 Adjustment to reclassify Arizona Chemical’s plant closure costs 692 Impairment of long-lived assets — — 2,125 2,125 Litigation expense — 12,894 — 12,894 Insurance recoveries — (12,894) — (12,894) Total operating expenses 147,685 84,158 41,576 273,419 Interest expense, net 17,975 35,928 44,148 98,051 Earnings of unconsolidated joint venture (273) — — (273) Loss on extinguishment of debt — — 15,750 15,750 Loss (gain) on interest rate caps/swaps, net — 7,003 (7,003) —Foreign currency exchange loss (gain), net — (107) 107 —Other income — (101) 101 —Income (loss) before income taxes (3,580) 58,037 (81,687) (27,230) Income tax expense (benefit) 4,135 18,103 (28,590) (6,352) Consolidated net income (loss) (7,715) 39,934 (53,097) (20,878) Net income (loss) attributable to noncontrolling interest (1,141) — — (1,141) Net income (loss) $ (6,574) $ 39,934 $ (53,097) $ (19,737)
Confidential
63
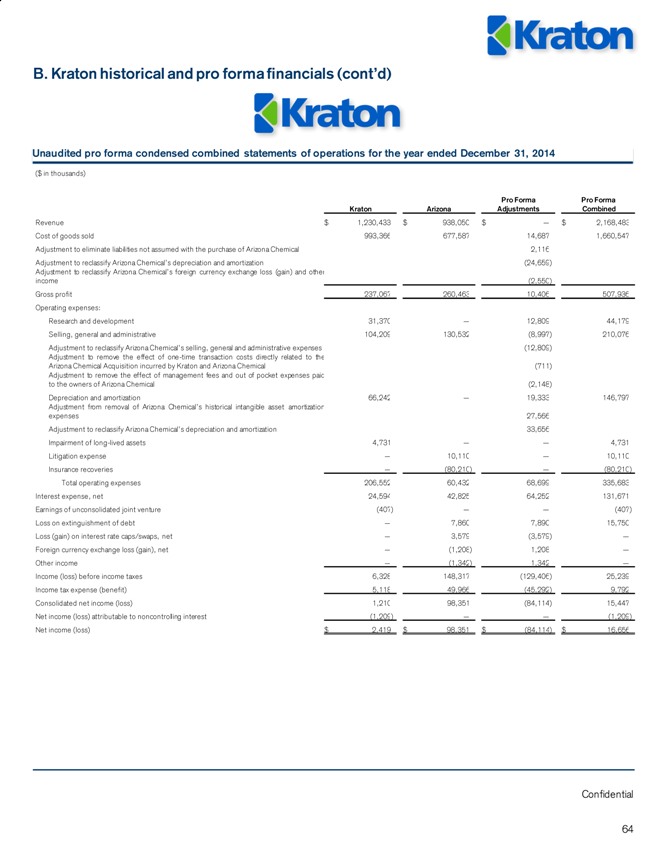
B. Kraton historical and pro forma financials (cont’d)
Unaudited pro forma condensed combined statements of operations for the year ended December 31, 2014
($ in thousands)
Pro Forma Pro Forma Kraton Arizona Adjustments Combined
Revenue $ 1,230,433 $ 938,050 $ — $ 2,168,483 Cost of goods sold 993,366 677,587 14,687 1,660,547 Adjustment to eliminate liabilities not assumed with the purchase of Arizona Chemical 2,116 Adjustment to reclassify Arizona Chemical’s depreciation and amortization (24,659) Adjustment to reclassify Arizona Chemical’s foreign currency exchange loss (gain) and other income (2,550) Gross profit 237,067 260,463 10,406 507,936 Operating expenses: Research and development 31,370 — 12,809 44,179 Selling, general and administrative 104,209 130,532 (8,997) 210,076 Adjustment to reclassify Arizona Chemical’s selling, general and administrative expenses (12,809) Adjustment to remove the effect of one-time transaction costs directly related to the Arizona Chemical Acquisition incurred by Kraton and Arizona Chemical (711) Adjustment to remove the effect of management fees and out of pocket expenses paid to the owners of Arizona Chemical (2,148) Depreciation and amortization 66,242 — 19,333 146,797 Adjustment from removal of Arizona Chemical’s historical intangible asset amortization expenses 27,566 Adjustment to reclassify Arizona Chemical’s depreciation and amortization 33,656 Impairment of long-lived assets 4,731 — — 4,731 Litigation expense — 10,110 — 10,110 Insurance recoveries — (80,210) — (80,210) Total operating expenses 206,552 60,432 68,699 335,683 Interest expense, net 24,594 42,825 64,252 131,671 Earnings of unconsolidated joint venture (407) — — (407) Loss on extinguishment of debt — 7,860 7,890 15,750 Loss (gain) on interest rate caps/swaps, net — 3,579 (3,579) —Foreign currency exchange loss (gain), net — (1,208) 1,208 —Other income — (1,342) 1,342 —Income (loss) before income taxes 6,328 148,317 (129,406) 25,239 Income tax expense (benefit) 5,118 49,966 (45,292) 9,792 Consolidated net income (loss) 1,210 98,351 (84,114) 15,447 Net income (loss) attributable to noncontrolling interest (1,209) — — (1,209) Net income (loss) $ 2,419 $ 98,351 $ (84,114) $ 16,656
Confidential
64
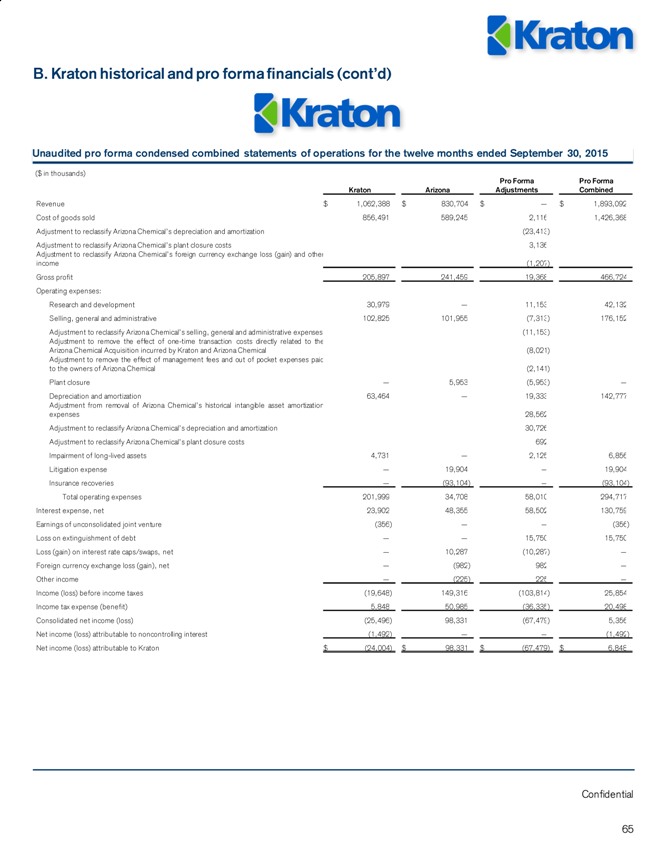
B. Kraton historical and pro forma financials (cont’d)
Unaudited pro forma condensed combined statements of operations for the twelve months ended September 30, 2015
($ in thousands)
Pro Forma Pro Forma Kraton Arizona Adjustments Combined
Revenue $ 1,062,388 $ 830,704 $ — $ 1,893,092 Cost of goods sold 856,491 589,245 2,116 1,426,368 Adjustment to reclassify Arizona Chemical’s depreciation and amortization (23,413) Adjustment to reclassify Arizona Chemical’s plant closure costs 3,136 Adjustment to reclassify Arizona Chemical’s foreign currency exchange loss (gain) and other income (1,207) Gross profit 205,897 241,459 19,368 466,724 Operating expenses: Research and development 30,979 — 11,153 42,132 Selling, general and administrative 102,825 101,955 (7,313) 176,152 Adjustment to reclassify Arizona Chemical’s selling, general and administrative expenses (11,153) Adjustment to remove the effect of one-time transaction costs directly related to the Arizona Chemical Acquisition incurred by Kraton and Arizona Chemical (8,021) Adjustment to remove the effect of management fees and out of pocket expenses paid to the owners of Arizona Chemical (2,141) Plant closure — 5,953 (5,953) —Depreciation and amortization 63,464 — 19,333 142,777 Adjustment from removal of Arizona Chemical’s historical intangible asset amortization expenses 28,562 Adjustment to reclassify Arizona Chemical’s depreciation and amortization 30,726 Adjustment to reclassify Arizona Chemical’s plant closure costs 692 Impairment of long-lived assets 4,731 — 2,125 6,856 Litigation expense — 19,904 — 19,904 Insurance recoveries — (93,104) — (93,104) Total operating expenses 201,999 34,708 58,010 294,717 Interest expense, net 23,902 48,355 58,502 130,759 Earnings of unconsolidated joint venture (356) — — (356) Loss on extinguishment of debt — — 15,750 15,750 Loss (gain) on interest rate caps/swaps, net — 10,287 (10,287) —Foreign currency exchange loss (gain), net — (982) 982 —Other income — (225) 225 —Income (loss) before income taxes (19,648) 149,316 (103,814) 25,854 Income tax expense (benefit) 5,848 50,985 (36,335) 20,498 Consolidated net income (loss) (25,496) 98,331 (67,479) 5,356 Net income (loss) attributable to noncontrolling interest (1,492) — — (1,492) Net income (loss) attributable to Kraton $ (24,004) $ 98,331 $ (67,479) $ 6,848
Confidential
65
C. Management’s discussion and analysis of financial condition and results of operations—Kraton
Three Months Ended September 30, 2015 Compared to Three Months Ended September 30, 2014
Financial Overview
- Sales volume was 81.0 kilotons in the third quarter of 2015 compared to 80.7 kilotons in the third quarter of 2014.
- Revenue was $269.0 million in the third quarter of 2015 compared to $319.0 million in the third quarter of 2014.
- Gross profit was $67.8 million in the third quarter of 2015 compared to $63.8 million in the third quarter of 2014.
Adjusted gross profit (non-GAAP) was $68.8 million in the third quarter of 2015 compared to $64.8 million in the third quarter of 2014.
- Adjusted EBITDA (non-GAAP) was $42.4 million in the third quarter of 2015 compared to $39.4 million in the third quarter of 2014.
- For the third quarter of 2015 compared to the third quarter of 2014, foreign currency fluctuations had a negative impact on adjusted gross profit and adjusted EBITDA of $2.4 million and $1.0 million, respectively.
For a reconciliation of Adjusted gross profit and Adjusted diluted earnings per share to GAAP measures, see the Kraton
Audited Financial Statements.
Revenue
Revenue was $269.0 million for the three months ended September 30, 2015 compared to $319.0 million for the three months ended September 30, 2014, a decrease of $50.0 million or 15.7%. Excluding the $23.9 million negative effect from currency movements, revenue declined $26.0 million, or 8.2%, attributable to lower average selling prices resulting from lower raw material costs. Sales volumes were 81.0 kilotons for the third quarter of 2015 compared to 80.7 kilotons for the third quarter of 2014.
With respect to revenue for each of our product groups:
- Cariflex™ revenue was $34.0 million for the three months ended September 30, 2015 compared to $40.0 million for the three months ended September 30, 2014, a decline of $5.9 million, or 14.8%. The negative effect of currency fluctuations accounted for $2.1 million of the decline. The remaining $3.8 million, or 9.6%, of the decline was primarily due to lower sales volume. Sales volume decreased compared to record sales volume for this product group in the third quarter of 2014 primarily due to lower sales into surgical glove applications associated with variability in customer order patterns which are typical in the Cariflex product group.
- Specialty Polymers revenue was $86.8 million for the three months ended September 30, 2015 compared to $98.7 million for the three months ended September 30, 2014. Of the $11.9 million, or 12.1%, revenue decline, $4.7 million is associated with the negative effect of currency fluctuations, and the balance of the decline is primarily due to lower average selling prices resulting from lower raw material costs. Compared to the third quarter of 2014, sales volumes increased modestly due to growth in industrial, consumer, and cable gel applications partially offset by lower volumes into lubricant additives.
- Performance Products revenue was $148.0 million for the three months ended September 30, 2015 compared to $180.1 million for the three months ended September 30, 2014. Of the $32.1 million, or 17.8%, revenue decline, $17.1 million is associated with the negative effect of currency fluctuations, and the balance of the decline is primarily due to lower average selling prices resulting from lower raw material costs. With respect to sales volume, we experienced strong demand for our paving applications, largely in North America, where we experienced share gains and higher sales of differentiated grades. These sales volume gains were offset by lower sales into roofing applications in Europe and lower sales into less differentiated pressure sensitive and construction adhesive applications.
Confidential
66
C. Management’s discussion and analysis of financial condition and results of operations – Kraton (cont’d)
Three Months Ended September 30, 2015 Compared to Three Months Ended September 30, 2014 (cont’d)
Cost of Goods Sold
Cost of goods sold was $201.2 million for the three months ended September 30, 2015 compared to $255.1 million for the three months ended September 30, 2014. The $53.9 million, or 21.1%, decrease was primarily driven by a $32.0 million reduction in raw material costs, and a $21.4 million positive effect from currency fluctuations. In addition, cost of goods sold decreased $3.7 million associated with cost reduction initiatives and $1.6 million due to lower turnaround costs partially offset by a $1.4 million increase related to modestly higher sales volumes.
Gross Profit
Gross profit was $67.8 million for the three months ended September 30, 2015 compared to $63.8 million for the three months ended September 30, 2014. Gross profit as a percentage of revenue was 25.2% and 20.0% for the three months ended September 30, 2015 and 2014, respectively.
Operating Expenses
Research and development expenses were $7.6 million for the three months ended September 30, 2015 compared to $7.4 million for the three months ended September 30, 2014, an increase of $0.2 million, or 2.1%.
Selling, general and administrative expenses were $26.9 million for the three months ended September 30, 2015 compared to $16.4 million for the three months ended September 30, 2014, an increase of $10.5 million, or 64.4%. This increase was primarily due to $5.0 million of transaction and acquisition related costs incurred in the third quarter 2015, a $4.2 million reduction in the accrual for fees related to the terminated Combination Agreement with the LCY Parties in the third quarter of 2014, and a $2.9 million increase in variable employee compensation costs. These increases were partially offset by a $1.0 million positive effect from currency fluctuations and a $1.0 million decrease associated with cost reduction initiatives.
Depreciation and amortization was $16.1 million for the three months ended September 30, 2015 compared to $16.6 million for the three months ended September 30, 2014, a decrease of $0.4 million or 2.5%, primarily due to a $0.7 million positive effect from currency fluctuations.
Interest expense, net
Interest expense, net was $6.2 million for the three months ended September 30, 2015 compared to $6.1 million for the three months ended September 30, 2014, an increase of $0.1 million or 0.9%.
Income tax expense
Income tax expense was $3.1 million and $1.1 million for the three months ended September 30, 2015 and 2014, respectively. Our effective tax rate was 27.7% and 6.4% for the three months ended September 30, 2015 and 2014, respectively. Our effective tax rate differed from the U.S. corporate statutory tax rate of 35.0% primarily due to the mix of pre-tax income or loss earned in foreign jurisdictions and losses generated in the U.S. tax jurisdiction for which a full valuation allowance has been provided.
We record a valuation allowance when it is more likely than not that some portion, or all, of the deferred tax assets will not be realized. As of September 30, 2015 and December 31, 2014, a valuation allowance of $97.4 million and $90.4 million, respectively, has been provided for net operating loss carryforwards and other deferred tax assets. We increased our valuation allowance by $2.7 million for the three months ended September 30, 2015 primarily related to current period net operating losses in the U.S. tax jurisdiction. We decreased our valuation allowance by $4.4 million for the three months ended September 30, 2014, of which $2.5 million represents utilization of net operating losses in the current period and $1.9 million relates to the assessment of our ability to utilize net operating losses in future periods. Excluding the change in our valuation allowance, our effective tax rate would have been a 3.4% expense and a 31.7% expense for the three months ended September 30, 2015 and 2014, respectively.
Confidential
67
C. Management’s discussion and analysis of financial condition and results of operations – Kraton (cont’d)
Nine Months Ended September 30, 2015 Compared to Nine Months Ended September 30, 2014
Revenue
Revenue was $786.3 million for the nine months ended September 30, 2015 compared to $954.4 million for the nine months ended September 30, 2014, a decrease of $168.0 million or 17.6%. The negative effect from currency movements accounted for $72.7 million of the decrease. The remaining $95.3 million, or 10.0%, decline was due to lower average selling prices amounting to $86.3 million driven by lower average raw material costs and $9.0 million due to lower sales volumes. Sales volumes were 231.6 kilotons for the nine months ended September 30, 2015, a decrease of 1.8 kilotons compared to the nine months ended September 30, 2014.
With respect to revenue for each of our product groups:
- Cariflex™revenue was $102.1 million for the nine months ended September 30, 2015 compared to $104.6 million for the nine months ended September 30, 2014, a decrease of $2.5 million or 2.4%. Cariflex sales volumes increased
5.2% compared to the nine months ended September 30, 2014, driven primarily by higher sales into surgical glove applications. The $6.1 million positive impact on revenue from higher sales volume was more than offset by a $6.6 million negative effect from currency fluctuations and a decline of $2.0 million associated with lower selling prices resulting from lower isoprene costs. Excluding the negative impact from currency fluctuations, revenue would have increased $4.1 million, or 3.9%.
- Specialty Polymers revenue was $263.1 million for the nine months ended September 30, 2015 compared to $317.6 million for the nine months ended September 30, 2014. Of the $54.5 million, or 17.2%, revenue decrease, $15.9 million was associated with the negative effect of currency fluctuations. The balance of the decline was due to lower average selling prices resulting from lower raw material costs and a 5.5% decrease in sales volumes. The decrease in sales volume was largely due to lower sales into lubricant additive applications associated with inventory reduction measures by a significant customer, and, to a lesser extent, lower sales into personal care applications. Partially offsetting these declines were higher sales into industrial, medical, and cable gel applications.
- Performance Products revenue was $420.9 million for the nine months ended September 30, 2015 compared to $531.9 million for the nine months ended September 30, 2014. Of the $111.1 million, or 20.9%, revenue decrease, $50.2 million was associated with the negative effect of currency fluctuations, and the balance of the decline was primarily due to lower average selling prices resulting from lower raw material costs. Sales volume increased modestly, despite the previously disclosed seven kilotons of lost production at our Wesseling and Berre facilities in the second quarter 2015. The net increase in sales volume was driven by higher sales into paving applications in North America and personal care applications, largely offset by lower sales into roofing applications in Europe and adhesives applications.
Cost of Goods Sold
Cost of goods sold was $624.5 million for the nine months ended September 30, 2015 compared to $761.4 million for the nine months ended September 30, 2014. The $136.9 million, or 18.0%, decrease was largely driven by a $63.4 million positive effect from currency fluctuations, a $65.1 million reduction in raw material costs, a $7.1 million decrease due to lower sales volumes, and a $7.5 million decrease related to cost reduction initiatives. In addition, cost of goods sold decreased by $11.9 million due to the absence of the weather-related production downtime at our Belpre, Ohio, facility and an operating disruption from a small fire at our Berre, France, facility that occurred in the first quarter of 2014. These decreases were partially offset by $5.0 million of higher turnaround costs primarily driven by a statutory six-year turnaround at our Berre, France, facility, $2.5 million of higher costs related to an inventory write-down resulting from an operational issue at our Belpre, Ohio, facility and $10.6 million of higher other manufacturing costs that are primarily timing related.
Gross Profit
Gross profit was $161.8 million for the nine months ended September 30, 2015 compared to $193.0 million for the nine months ended September 30, 2014. Gross profit as a percentage of revenue was 20.6% and 20.2% for the nine months ended September 30, 2015 and 2014, respectively.
Confidential
68
C. Management’s discussion and analysis of financial condition and results of operations – Kraton (cont’d)
Nine Months Ended September 30, 2015 Compared to Nine Months Ended September 30, 2014
Operating Expenses
Research and development expenses were $23.3 million for the nine months ended September 30, 2015 compared to $23.7 million for the nine months ended September 30, 2014, a decrease of $0.4 million, or 1.6%. This decrease was primarily driven by a $1.4 million positive effect from currency fluctuations, and a $1.3 million decrease related to cost reduction initiatives. These decreases were partially offset by a $1.2 million increase in variable employee compensation and $0.8 million of higher costs associated with the new semi-works facility.
Selling, general and administrative expenses were $77.5 million for the nine months ended September 30, 2015 compared to $78.9 million for the nine months ended September 30, 2014, a decrease of $1.4 million or 1.8%. This decrease was primarily due to a $3.0 million positive effect from currency fluctuations, a $3.0 million reduction in transaction and acquisition related costs, a $3.1 million decrease from cost reduction initiatives, and $0.9 million of lower marketing costs.
These decreases were partially offset by a $5.9 million increase in employee related costs, primarily variable compensation, and a $2.3 million increase in professional fees.
Depreciation and amortization was $46.9 million for the nine months ended September 30, 2015 compared to $49.6 million for the nine months ended September 30, 2014, a decrease of $2.8 million or 5.6%, primarily due to a $1.9 million positive effect from currency fluctuations.
Interest expense, net
Interest expense, net was $18.0 million for the nine months ended September 30, 2015 compared to $18.7 million for the nine months ended September 30, 2014, a decrease of $0.7 million or 3.7%. The decrease is primarily due to higher capitalized interest related to ongoing capital projects in the nine months ended September 30, 2015 compared with the nine months ended September 30, 2014.
Income tax expense
Income tax expense was $4.1 million and $3.4 million for the nine months ended September 30, 2015 and 2014, respectively. Our effective tax rate was (115.5)% and 15.2% for the nine months ended September 30, 2015 and 2014, respectively. Our effective tax rate differed from the U.S. corporate statutory tax rate of 35.0% primarily due to the mix of pre-tax income or loss earned in foreign jurisdictions and losses generated in the U.S. tax jurisdiction for which a full valuation allowance has been provided, as well as permanent differences, uncertain tax positions and return to provision adjustments.
We record a valuation allowance when it is more likely than not that some portion, or all, of the deferred tax assets will not be realized. As of September 30, 2015 and December 31, 2014, a valuation allowance of $97.4 million and $90.4 million, respectively, has been provided for net operating loss carryforwards and other deferred tax assets. We increased our valuation allowance by $7.0 million for the nine months ended September 30, 2015, which includes $8.1 million related to current period net operating losses, partially offset by a $1.1 million decrease related to changes in other comprehensive income (loss). We decreased our valuation allowance by $4.6 million for the nine months ended September 30, 2014, of which $2.7 million represents utilization of net operating losses in the current period and $1.9 million relates to the assessment of our ability to utilize net operating losses in future periods. Excluding the change in our valuation allowance, our effective tax rate would have been a 110.5% benefit and a 35.8% expense for the nine months ended September 30,
2015 and 2014, respectively.
Confidential
69
C. Management’s discussion and analysis of financial condition and results of operations – Kraton (cont’d)
Year Ended December 31, 2014 Compared to Year Ended December 31, 2013
Revenue
Revenue was $1,230.4 million for the year ended December 31, 2014 compared to $1,292.1 million for the year ended December 31, 2013, a decline of $61.7 million or 4.8% (a decline of $50.3 million or 3.9% excluding an $11.4 million negative effect from currency fluctuations) with $51.3 million of the decline attributable to lower average selling prices associated with lower average raw material costs. Sales volumes declined 7.9 kilotons or 2.5% from 313.5 kilotons for the year ended December 31, 2013 to 305.6 kilotons for the year ended December 31, 2014. The decrease in total sales volume did not have a material impact on the period-over-period change in revenue, as the revenue impact from lower sales volume in our Performance Products business was more than offset by the revenue contribution from increased sales volume in the higher revenue per ton CariflexTM and Specialty Polymers businesses.
With respect to revenue for each of our product groups:
- Cariflex revenue was $138.6 million for the year ended December 31, 2014 compared to $116.0 million for the year ended December 31, 2013. The $22.6 million or 19.5% revenue increase (an increase of $25.4 million or 21.9% excluding a $2.8 million negative effect from currency fluctuations) was due to a 24.1% increase in sales volumes led by sales into surgical glove applications, and to a lesser extent, increased sales into condom and medical stopper markets. The revenue contribution from higher sales volume was partially offset by lower average selling prices due to lower isoprene costs.
- Specialty Polymers revenue was $412.4 million for the year ended December 31, 2014 compared to $412.0 million for the year ended December 31, 2013. The $0.4 million or 0.1% revenue increase (an increase of $1.5 million or 0.4% excluding a $1.1 million negative effect from currency fluctuations) was due to a 4.6% increase in sales volume, which was offset by lower average selling prices reflective of lower raw material costs. The increase in sales volume was primarily due to growth in lubricant additives, cable gels, and polymer modification applications partially offset by lower volume into personal care applications.
- Performance Products revenue was $678.9 million for the year ended December 31, 2014 compared to $762.9 million for the year ended December 31, 2013. The $84.0 million or 11.0% revenue decline (a decline of $76.5 million or 10.0% excluding a $7.5 million negative effect from currency fluctuations) was due to a 6.2% reduction in sales volumes and, to a lesser extent, lower average selling prices driven by lower butadiene and isoprene costs. The decline in sales volume was primarily due to lower paving and roofing volumes in Europe, lower paving volumes in Asia Pacific and lower volumes into packaging & industrial adhesives applications.
Cost of Goods Sold
Cost of goods sold was $993.4 million for the year ended December 31, 2014 compared to $1,066.3 million for the year ended December 31, 2013. The $72.9 million or 6.8% decrease was primarily driven by a $66.0 million reduction in raw material costs (including a period over period benefit of $21.5 million due to the spread between FIFO and ECRC), an $18.6 million decrease from lower sales volumes, and an $11.1 million decrease due to foreign currency fluctuations. Partially offsetting these decreases were $9.9 million of costs associated with the weather-related production downtime at our
Belpre, Ohio, facility and an operating disruption from a small fire at our Berre, France, facility in the first quarter of 2014 and increases in other variable and manufacturing costs.
Gross Profit
Gross profit was $237.1 million for the year ended December 31, 2014 compared to $225.8 million for the year ended
December 31, 2013. Gross profit as a percentage of revenue was 19.3% and 17.5% for the years ended December 31,
2014 and 2013, respectively.
Confidential
70
C. Management’s discussion and analysis of financial condition and results of operations – Kraton (cont’d)
Year Ended December 31, 2014 Compared to Year Ended December 31, 2013 (cont’d)
Operating Expenses
Research and development expenses were $31.4 million for the year ended December 31, 2014 compared to $32.0 million for the year ended December 31, 2013, a decrease of $0.6 million or 2.0% primarily due to lower professional fees and maintenance costs partially offset by higher employee related costs. Research and development expenses were 2.5% of revenue for both of the years ended December 31, 2014 and 2013.
Selling, general and administrative expenses were $104.2 million for the year ended December 31, 2014 compared to $105.6 million for the year ended December 31, 2013, a decrease of $1.3 million or 1.3%. The decrease was primarily due to a $1.3 million decrease in employee related costs, a $1.0 million decrease in professional fees and a $0.8 million decrease in information technology costs. These decreases were partially offset by a $1.7 million increase in restructuring related costs and a $0.4 million increase in transaction and acquisition related costs. Selling, general and administrative expenses were 8.5% and 8.2% of revenue for the years ended December 31, 2014 and 2013, respectively.
Depreciation and amortization was $66.2 million for the year ended December 31, 2014 compared to $63.2 million for the year ended December 31, 2013, an increase of $3.1 million or 4.8%, largely due to capital expenditures.
We incurred impairments of long-lived assets of $4.7 million for the year ended December 31, 2014 related to engineering and design, information technology, and other long-lived assets. We did not incur any impairment charges for the year ended
December 31, 2013.
Interest expense, net
Interest expense, net was $24.6 million for the year ended December 31, 2014 compared to $30.5 million for the year ended December 31, 2013, a decrease of $5.9 million or 19.3%. The decrease was primarily due to charges aggregating $5.8 million incurred in connection with our March 2013 refinancing and to lower outstanding indebtedness in 2014.
Income tax expense (benefit)
Our income tax provision was a $5.1 million expense and a $3.9 million benefit for the years ended December 31, 2014 and 2013, respectively. Our effective tax rate was 80.9% and 79.9% for the years ended December 31, 2014 and 2013, respectively. Our effective tax rates differed from the U.S. corporate statutory tax rate of 35.0%, primarily due to the mix of pre-tax income or loss earned in certain jurisdictions and the change in our valuation allowance.
Income tax expense (benefit) (cont’d)
We record a valuation allowance when it is more likely than not that some portion or all of the deferred tax assets will not be realized. As of December 31, 2014 and December 31, 2013, a valuation allowance of $90.4 million and $90.0 million, respectively, has been provided for net operating loss carryforwards and other deferred tax assets. We increased our valuation allowance by $0.4 million in 2014, which includes a $9.8 million increase related to changes in other comprehensive income (loss), partially offset by a $9.4 million decrease to the income tax provision. The $9.4 million is comprised of $7.6 million related to current year operating income and $1.8 million related to the assessment of our ability to utilize net operating loss carryforwards in future periods. We decreased our valuation allowance by $0.4 million in 2013, which includes a $0.5 million decrease due to changes in other comprehensive income (loss), partially offset by a $0.1 million increase to the income tax provision. The $0.1 million is comprised of $10.2 million related to current year operating losses, offset by a $10.1 million benefit related to the tax effect of unrealized pension gains. We consider the reversal of deferred tax liabilities within the net operating loss carryforward period, projected future taxable income and tax planning strategies in making this assessment. Excluding the change in our valuation allowance, our effective tax rates would have been a 229.0% expense and an 81.4% benefit for the years ended December 31, 2014 and 2013, respectively.
Confidential
71
C. Management’s discussion and analysis of financial condition and results of operations – Kraton (cont’d)
Year Ended December 31, 2013 Compared to Year Ended December 31, 2012
Revenue
Revenue amounted to $1,292.1 million on sales volumes of 313.5 kilotons for the year ended December 31, 2013 compared to $1,423.1 million on sales volumes of 313.4 kilotons for the year ended December 31, 2012. The $131.0 million or 9.2% revenue decline (a decline of $121.7 million or 8.6% excluding a $9.3 million negative effect from currency fluctuations) was largely due to a reduction in global product sales prices associated with lower average raw material costs of $110.4 million and a $10.3 million negative effect associated with revenue mix.
With respect to revenue for each of our product groups:
- Cariflex™revenue was $116.0 million for the year ended December 31, 2013 compared to $105.9 million for the year ended December 31, 2012. The $10.1 million or 9.5% revenue increase (an increase of $14.8 million or 14.0% excluding a $4.7 million negative effect from currency fluctuations) reflects a 13.5% increase in sales volumes, mainly in the surgical glove market and other medical applications.
- Specialty Polymers revenue was $412.0 million for the year ended December 31, 2013 compared to $464.3 million for the year ended December 31, 2012. The $52.3 million or 11.3% revenue decline (a decline of $51.3 million or 11.0% excluding a $1.0 million negative effect from currency fluctuations) was due to lower sales volumes and lower average selling prices, reflective of lower average raw materials costs. The decline in sales volume was primarily due to lower sales in personal care, cable gels, polymer modification and industrial applications.
- Performance Products revenue was $762.9 million for the year ended December 31, 2013 compared to $850.8 million for the year ended December 31, 2012. The $87.8 million or 10.3% revenue decline (a decline of $84.2 million or 9.9% excluding a $3.6 million negative effect from currency fluctuations) was due to lower average selling prices indicative of lower average raw material costs, primarily butadiene, partially offset by increased sales volume. The increase in sales volume was primarily due to increased sales into paving and roofing, personal care, and packaging & industrial adhesives applications. With respect to paving and roofing volumes, although first half 2013 sales volumes were down 15.1% compared to the first half of 2012, primarily due to the effect of poor weather conditions in North
America and Europe, second half 2013 sales volumes were up 14.7% due to improved demand compared to the second half of 2012. As a result, overall sales volume for paving and roofing applications increased 1.0% year on year.
With respect to innovation sales, we experienced growth in personal care applications and improved demand for our
HiMA paving applications.
Cost of Goods Sold
Cost of goods sold was $1,066.3 million for the year ended December 31, 2013 compared to $1,191.7 million for the year ended December 31, 2012. The $125.4 million or 10.5% decrease was driven largely by an $119.6 million reduction in raw material costs, a $5.4 million reduction due to changes in foreign currency exchange rates, a $4.6 million reduction due to sales mix, and the absence of net charges amounting to $2.3 million recorded in 2012, which related to a property tax dispute in France, storm-related charges, restructuring and other charges and the LyondellBasell settlement. Partially offsetting these decreases in cost of goods sold were increased costs from the production downtime related to the MACT legislation of $3.5 million, increased turnaround costs of $2.5 million, and other increases in cost of goods sold.
Gross Profit
Gross profit was $225.8 million for the year ended December 31, 2013 compared to $231.4 million for the year ended
December 31, 2012, a decrease of $5.6 million or 2.4%. Gross profit as a percentage of revenue was 17.5% and 16.3% for the years ended December 31, 2013 and 2012, respectively.
Confidential
72
C. Management’s discussion and analysis of financial condition and results of operations – Kraton (cont’d)
Year Ended December 31, 2013 Compared to Year Ended December 31, 2012 (cont’d)
Operating Expenses
Research and development expenses were $32.0 million for the year ended December 31, 2013 compared to $31.0 million for the year ended December 31, 2012, an increase of $1.0 million or 3.2% primarily due to an increase in employee related costs partially offset by decreased lease expense for our research and development facilities. Research and development expenses were 2.5% and 2.2% of revenue for the years ended December 31, 2013 and 2012, respectively.
Selling, general and administrative expenses were $105.6 million for the year ended December 31, 2013 compared to $98.6 million for the year ended December 31, 2012, an increase of $7.0 million or 7.1%. The increase was primarily due to $9.2 million of professional fees related to the terminated Combination Agreement with the LCY Parties, a $1.1 million increase in costs associated with the joint venture with FPCC and a $1.0 million increase in other professional fees, partially offset by a $1.0 million decrease in employee related costs, lower legal expenses of $1.1 million, and the absence of a
2012 retirement plan settlement charge of $1.1 million and a $0.6 million charge associated with the resolution of a property tax dispute in France during 2012. Selling, general and administrative expenses were 8.2% and 6.9% of revenue for the years ended December 31, 2013 and 2012, respectively.
Depreciation and amortization was $63.2 million for the year ended December 31, 2013 compared to $64.6 million for the year ended December 31, 2012, a decrease of $1.4 million or 2.1%.
We did not incur any impairment charges of long-lived assets for the year ended December 31, 2013 compared to a $5.4 million charge for the year ended December 31, 2012.
Interest expense, net
Interest expense, net was $30.5 million for the year ended December 31, 2013 compared to $29.3 million for the year ended December 31, 2012, an increase of $1.2 million or 4.0%. The reduction in interest expense associated with lower outstanding indebtedness was more than offset by charges aggregating $5.8 million incurred in connection with our 2013 refinancing.
Income tax expense (benefit)
Our income tax provision was a $3.9 million benefit and a $19.3 million expense for the years ended December 31, 2013 and 2012, respectively. Our effective tax rate was 79.9% and 619.8% for the years ended December 31, 2013 and 2012, respectively. Our effective tax rates differed from the U.S. corporate statutory tax rate of 35.0%, primarily due to the mix of pre-tax income or loss earned in certain jurisdictions and the change in our valuation allowance.
Income tax expense (benefit) (cont’d)
We record a valuation allowance when it is more likely than not that some portion or all of the deferred tax assets will not be realized. As of December 31, 2013 and December 31, 2012, a valuation allowance of $90.0 million and $90.4 million, respectively, has been provided for net operating loss carryforwards and other deferred tax assets. We decreased our valuation allowance by $0.4 million in 2013, which includes a $0.5 million decrease due to changes in other comprehensive income (loss), partially offset by a $0.1 million increase to the income tax provision. The $0.1 million is comprised of $10.2 million related to current year operating losses, offset by $10.1 million of income tax benefit related to the tax effect of unrealized pension gains. We increased our valuation allowance by $36.2 million in 2012, of which $30.7 million was included in the income tax provision and $5.5 million represents changes in equity. The $30.7 million increase in the valuation allowance is comprised of $13.5 million related to the reversal of the benefit recorded for prior year’s net operating losses and $17.2 million related to current year operating losses. We consider the reversal of deferred tax liabilities within the net operating loss carryforward period, projected future taxable income and tax planning strategies in making this assessment. Excluding the change in our valuation allowance, our effective tax rates would have been an 81.4% and
366.1% benefit for the years ended December 31, 2013 and 2012, respectively.
Confidential
73
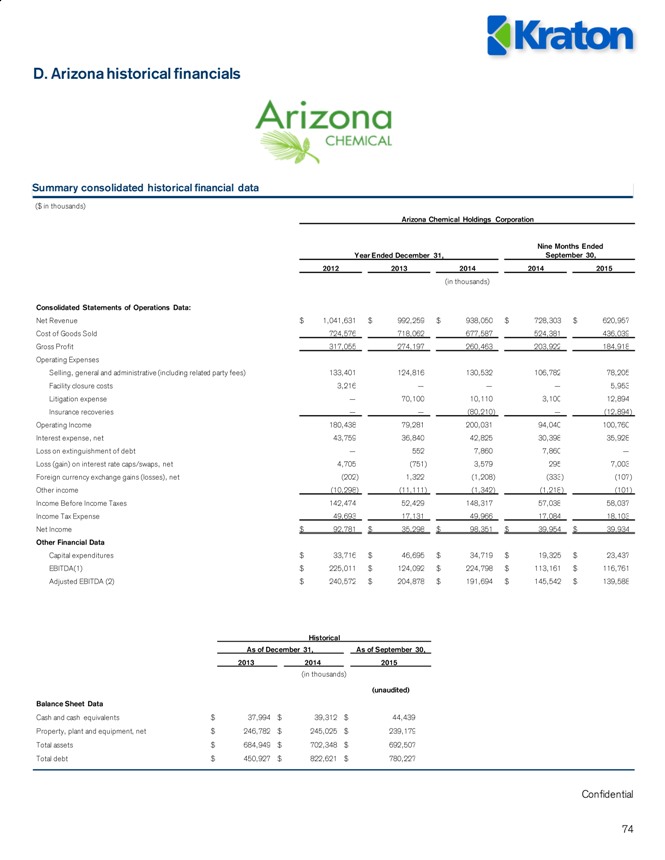
D. Arizona historical financials
Summary consolidated historical financial data
($ in thousands)
Arizona Chemical Holdings Corporation
Nine Months Ended Year Ended December 31, September 30,
2012 2013 2014 2014 2015
(in thousands)
Consolidated Statements of Operations Data:
Net Revenue $ 1,041,631 $ 992,259 $ 938,050 $ 728,303 $ 620,957 Cost of Goods Sold 724,576 718,062 677,587 524,381 436,039 Gross Profit 317,055 274,197 260,463 203,922 184,918 Operating Expenses Selling, general and administrative (including related party fees) 133,401 124,816 130,532 106,782 78,205 Facility closure costs 3,216 — — — 5,953 Litigation expense — 70,100 10,110 3,100 12,894 Insurance recoveries — — (80,210) — (12,894) Operating Income 180,438 79,281 200,031 94,040 100,760 Interest expense, net 43,759 36,840 42,825 30,398 35,928 Loss on extinguishment of debt — 552 7,860 7,860 — Loss (gain) on interest rate caps/swaps, net 4,705 (751) 3,579 295 7,003 Foreign currency exchange gains (losses), net (202) 1,322 (1,208) (333) (107) Other income (10,298) (11,111) (1,342) (1,218) (101) Income Before Income Taxes 142,474 52,429 148,317 57,038 58,037 Income Tax Expense 49,693 17,131 49,966 17,084 18,103 Net Income $ 92,781 $ 35,298 $ 98,351 $ 39,954 $ 39,934
Other Financial Data
Capital expenditures $ 33,716 $ 46,695 $ 34,719 $ 19,325 $ 23,437 EBITDA(1) $ 225,011 $ 124,092 $ 224,798 $ 113,161 $ 116,761 Adjusted EBITDA (2) $ 240,572 $ 204,878 $ 191,694 $ 145,542 $ 139,588
Historical
As of December 31, As of September 30, 2013 2014 2015 (in thousands) (unaudited)
Balance Sheet Data
Cash and cash equivalents $ 37,994 $ 39,312 $ 44,439 Property, plant and equipment, net $ 246,782 $ 245,025 $ 239,179 Total assets $ 684,949 $ 702,348 $ 692,507 Total debt $ 450,927 $ 822,621 $ 780,227
Confidential
74
D. Arizona historical financials (cont‘d)
Summary consolidated historical financial data (cont’d)
(1) Arizona Chemical defines EBITDA as earnings before interest, taxes, depreciation, and amortization. EBITDA should not be considered an alternative to net income, operating income, cash flows from operating activities, or any other measure of financial performance presented in accordance with GAAP. Arizona Chemical’s EBITDA may not be comparable to EBITDA or similarly titled financial metrics of other entities, as other entities may not calculate EBITDA in the same manner as Arizona Chemical does. Arizona Chemical compensates for the limitations of EBITDA as an analytical tool by reviewing the comparable GAAP measures, understanding the differences between the measures, and incorporating this knowledge into management’s decision-making processes.
(2) Arizona Chemical defines Adjusted EBITDA as EBITDA net of the impact of items that Arizona Chemical does not consider indicative of its ongoing operating performance. We explain how each adjustment is derived and why we believe it is helpful and appropriate in the reconciliation below. You are encouraged to evaluate each adjustment and the reasons we consider it appropriate for supplemental analysis. As an analytical tool, Adjusted EBITDA is subject to the limitations applicable to EBITDA described above.
Because of these and other limitations, EBITDA and Adjusted EBITDA should not be considered as a measure of discretionary cash available to Arizona Chemical to invest in the growth of its business.
Arizona Chemical’s presentation of non-GAAP financial measures and the adjustments made therein should not be construed as an inference that its future results will be unaffected by unusual or non-recurring items, and in the future
Arizona Chemical may incur expenses or charges similar to the adjustments made in the presentation of its non-GAAP financial measures.
Arizona Chemical compensates for these limitations by relying primarily on its GAAP results and using EBITDA and Adjusted EBITDA only as supplemental measures.
Confidential
75
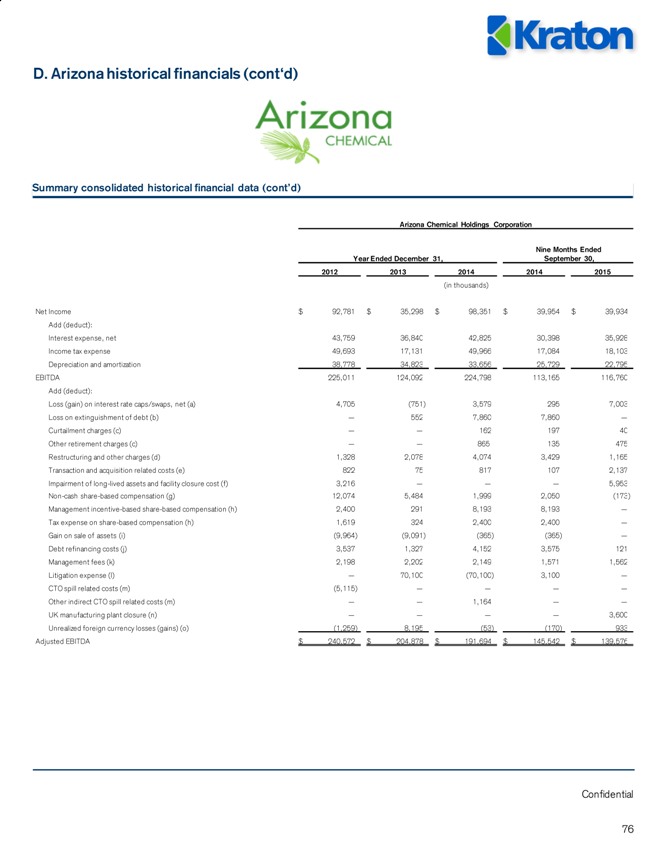
D. Arizona historical financials (cont‘d)
Summary consolidated historical financial data (cont’d)
Arizona Chemical Holdings Corporation
Nine Months Ended Year Ended December 31, September 30, 2012 2013 2014 2014 2015
(in thousands)
Net Income $ 92,781 $ 35,298 $ 98,351 $ 39,954 $ 39,934
Add (deduct):
Interest expense, net 43,759 36,840 42,825 30,398 35,928 Income tax expense 49,693 17,131 49,966 17,084 18,103 Depreciation and amortization 38,778 34,823 33,656 25,729 22,795 EBITDA 225,011 124,092 224,798 113,165 116,760
Add (deduct):
Loss (gain) on interest rate caps/swaps, net (a) 4,705 (751) 3,579 295 7,003 Loss on extinguishment of debt (b) — 552 7,860 7,860 —Curtailment charges (c) — — 162 197 40 Other retirement charges (c) — — 865 135 475 Restructuring and other charges (d) 1,328 2,078 4,074 3,429 1,165 Transaction and acquisition related costs (e) 822 75 817 107 2,137 Impairment of long-lived assets and facility closure cost (f) 3,216 — — — 5,953 Non-cash share-based compensation (g) 12,074 5,484 1,999 2,050 (173) Management incentive-based share-based compensation (h) 2,400 291 8,193 8,193 —Tax expense on share-based compensation (h) 1,619 324 2,400 2,400 —Gain on sale of assets (i) (9,964) (9,091) (365) (365) — Debt refinancing costs (j) 3,537 1,327 4,152 3,575 121 Management fees (k) 2,198 2,202 2,149 1,571 1,562 Litigation expense (l) — 70,100 (70,100) 3,100 —CTO spill related costs (m) (5,115) — — — —Other indirect CTO spill related costs (m) — — 1,164 — — UK manufacturing plant closure (n) — — — — 3,600 Unrealized foreign currency losses (gains) (o) (1,259) 8,195 (53) (170) 933 Adjusted EBITDA $ 240,572 $ 204,878 $ 191,694 $ 145,542 $ 139,576
Confidential
76
D. Arizona historical financials (cont‘d)
Summary consolidated historical financial data (cont’d)
(a) Represents loss (gain) on interest rate caps and swaps.
(b) Represents loss incurred on the extinguishment of debt.
(c) Charges associated with the termination of an employee defined benefit pension plan including curtailment costs and cash costs related to the termination of the plan.
(d) Restructuring and other charges primarily related to severance expenses for employees in eliminated positions which were not replaced.
(e) Professional fees and other costs associated with the evaluation of acquisition transactions. In 2015, primarily professional fees and other related costs associated with the pending sale of Arizona Chemical.
(f) In 2012, impairment and closure costs related to the shutdown of the CST plant in Oulu, Finland, and in 2015, impairment and closure costs related to the cease of operations of the Chester-le-Street plant in the U.K. in late 2015.
(g) Represents expense recognized for non-cash share-based compensation.
(h) Represents other share-based compensation expense in the form of common profit interests granted to certain employees. These interests are recognized as compensation expense at fair market value when probable of monetization.
(i) In 2013 and 2014, the net gains relate to the sale of Arizona Chemical’s personal care business consisting of intellectual property, customer relationships and inventories, for $12.0 million in cash on May 23, 2013 of which $11.4 million was received in May 2013 and $0.6 million was received in June 2014. The gain of $9.1 million in 2013 is net of restructuring expenses and the gain of $0.4 million in 2014 is net of an expense for a claim from a distributor. In
2012, this amount represents a net gain on the sale of Arizona Chemical’s 10% investment in Arboris and the related land for $15 million in cash and $5 million receivable over the following two year period.
(j) Professional fees and other costs incurred related to the refinancing of Arizona Chemical’s historical indebtedness and other financing costs related to the historical indebtedness.
(k) Management fees and out of pocket expenses paid to Arizona Chemical’s owners in accordance with the management agreement that will terminate at the closing of the Arizona Chemical Acquisition.
(l) In 2013, this represents litigation expenses and damages associated with a claim filed by a former customer for an alleged breach of warranty and breach of contract regarding delivery of resin products during the period 2005 through 2009. In 2014, the credit represents an accrued insurance recovery for the related litigation expenses and damages.
(m) In December 2011, a leak was discovered in CTO tanks owned by Arizona Chemical in Söderhamn, Sweden. The net reduction in costs in 2012 represents insurance recoveries related to environmental remediation costs and the amount in 2014 represents additional storage costs incurred as a result of the loss of the CTO tanks.
(n) $4.8 million represents the full year of the expected operational expense savings related to the anticipated closure in late 2015 of Arizona Chemical’s UK manufacturing facility in advance of realizing the actual benefit. For the nine months ended September 30, 2015, $3.6 million represents the pro rata portion of the full year expected savings. (o) Represents unrealized foreign currency losses (gains).
Confidential
77
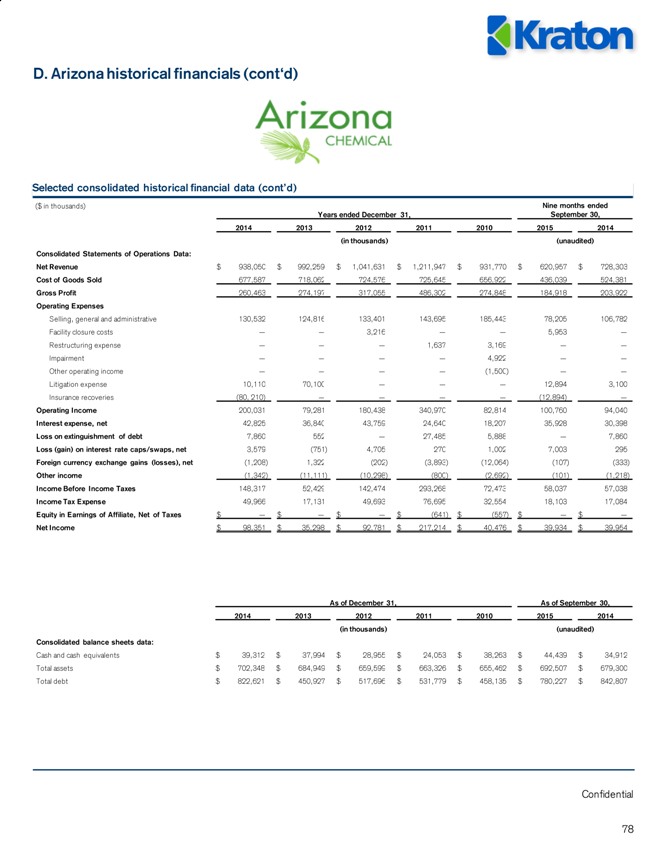
D. Arizona historical financials (cont‘d)
Selected consolidated historical financial data (cont’d)
($ in thousands) Nine months ended Years ended December 31, September 30,
2014 2013 2012 2011 2010 2015 2014
(in thousands) (unaudited)
Consolidated Statements of Operations Data:
Net Revenue $ 938,050 $ 992,259 $ 1,041,631 $ 1,211,947 $ 931,770 $ 620,957 $ 728,303 Cost of Goods Sold 677,587 718,062 724,576 725,645 656,922 436,039 524,381 Gross Profit 260,463 274,197 317,055 486,302 274,848 184,918 203,922
Operating Expenses
Selling, general and administrative 130,532 124,816 133,401 143,695 185,443 78,205 106,782 Facility closure costs — — 3,216 — — 5,953 — Restructuring expense — — — 1,637 3,169 — —
Impairment — — — — 4,922 — —
Other operating income — — — — (1,500) — —Litigation expense 10,110 70,100 — — — 12,894 3,100 Insurance recoveries (80, 210) — — — — (12,894) — Operating Income 200,031 79,281 180,438 340,970 82,814 100,760 94,040 Interest expense, net 42,825 36,840 43,759 24,640 18,207 35,928 30,398
Loss on extinguishment of debt 7,860 552 — 27,485 5,888 — 7,860 Loss (gain) on interest rate caps/swaps, net 3,579 (751) 4,705 270 1,002 7,003 295
Foreign currency exchange gains (losses), net (1,208) 1,322 (202) (3,893) (12,064) (107) (333) Other income (1,342) (11,111) (10,298) (800) (2,692) (101) (1,218) Income Before Income Taxes 148,317 52,429 142,474 293,268 72,473 58,037 57,038 Income Tax Expense 49,966 17,131 49,693 76,695 32,554 18,103 17,084
Equity in Earnings of Affiliate, Net of Taxes $ — $ — $ — $ (641) $ (557) $ — $ —
Net Income $ 98,351 $ 35,298 $ 92,781 $ 217,214 $ 40,476 $ 39,934 $ 39,954
As of December 31, As of September 30, 2014 2013 2012 2011 2010 2015 2014 (in thousands) (unaudited) Consolidated balance sheets data:
Cash and cash equivalents $ 39,312 $ 37,994 $ 28,955 $ 24,053 $ 38,263 $ 44,439 $ 34,912 Total assets $ 702,348 $ 684,949 $ 659,599 $ 663,326 $ 655,462 $ 692,507 $ 679,300 Total debt $ 822,621 $ 450,927 $ 517,696 $ 531,779 $ 458,135 $ 780,227 $ 842,807
Confidential
78
E. Management’s discussion and analysis of financial condition and results of operations – Arizona
Nine Months Ended September 30, 2015 Compared to Nine Months Ended September 30, 2014
Our net revenue for the nine months ended September 30, 2015 was $621.0 million on sales volumes of 454.0 kilotons as compared to net revenue of $728.3 million on sales volumes of 474.7 kilotons during the nine months ended September 30, 2014. The decline of $107.3 million, or 14.7%, was driven partially by the negative effect of currency fluctuations (primarily the Euro versus US dollar) which accounted for $63.0 million of the decrease and the remainder driven by $32.0 million of lower prices and $12.0 million due to lower sales volumes and mix. The decline in sales volumes was mostly attributable to sales volumes associated with our TOFA products sold to customers in North America. We continued to face strong competition in the markets where we sell TOFA products due primarily to oversupply of TOFA in the North America region. Our sales volume declines were partially offset by slightly higher prices for our rosin esters products which are sold into the adhesives and roads & construction markets. The slightly higher prices for our rosin esters products was driven by increased demand for hydrocarbon resin supplies, despite lower oil prices.
Our cost of goods sold for the nine months ended September 30, 2015 decreased by $88.3 million, or 17%, when compared to the nine months ended September 30, 2014. Lower oil prices resulted in lower costs for our raw materials, which contributed $22.0 million, currency fluctuations accounted for $53.0 million of the lower cost of goods sold and the remaining $13.3 million resulted from lower sales volumes and mix as further described in our description of net revenue above. Our Adjusted EBITDA for the nine months ended September 30, 2015 was $140.8 million, or 22.5% of net revenue. This compares with Adjusted EBITDA of $145.5 million, or 20% of net revenue during the nine months ended September 30, 2014. Lower sales prices were partially offset by lower raw material costs and lower SG&A expenses.
Year Ended December 31, 2014 Compared to Year Ended December 31, 2013
Our net revenue for the year ended December 31, 2014 was $938.1 million on sales volumes of 620.4 kilotons as compared to net revenue of $992.3 million on sales volumes of 675.8 kilotons during the year ended December 31, 2013. The decline of $54.2 million, or 5.5%, was driven by $27.0 million of lower prices and $28.0 million due to lower sales volumes, partially offset by the positive effect of $1 million due to currency fluctuations (primarily the Euro versus US dollar). Lower sales prices and volumes for our TOFA products were driven by excess supply in the market in addition to widely available competing vegetable oil-based products. Lower sales prices for our TOFA products were partially offset by slightly higher prices for our rosin esters products which are sold into the adhesives and roads & construction markets. The slightly higher prices for our rosin esters products was driven by increased demand for hydrocarbon resin supplies, despite lower oil prices.
Our cost of goods sold for the year ended December 31, 2014 decreased by $40.0 million, or 5.6%, when compared to the year ended December 31, 2013. Lower oil prices resulted in lower costs for our raw materials which contributed $3.0 million and approximately $34.0 million was driven by lower sales volumes. Currency fluctuations accounted for $1.0 million of the lower cost of goods sold. Our Adjusted EBITDA for the year ended December 31, 2014 was $191.7 million or
20.5% of net revenue, compared to $204.9 million, or 20.7% of net revenue for the year ended December 31, 2013.
Lower sales prices and volumes were only partially offset by lower raw material costs. Our SG&A expenses were approximately $5.7 million higher, however $14.0 million (including approximately $11.0 million in higher share based compensation and approximately $3.0 million of debt issue costs) are addbacks to our Adjusted EBITDA. Excluding these costs, our adjusted SG&A expenses were down approximately $9.0 million driven mostly by the reversal of previously accrued bonuses as we did not achieve our internal targets for payout.
Confidential
79
E. Management’s discussion and analysis of financial condition and results of operations – Arizona (cont’d)
Ye ar E nded December 31, 2013 Compared to Year Ended December 31, 2012
Our net revenue for the year ended December 31, 2013 was $992.3 million on sales volumes of 675.8 kilotons as compared to $1,041.6 million on sales volumes of 656.9 kilotons during the year ended December 31, 2012. The decline of $49.3 million, or 4.7%, was driven by $77.0 million of lower prices, partially offset by $11.0 million of higher sales volumes and approximately $16.0 million in positive currency fluctuations effects (primarily the Euro versus US dollar). The sale price decreases were mainly the result of softer demand during the global economic uncertainty experienced in 2012 and in the first half of 2013, particularly in Europe and the Americas. Partially offsetting those price declines were higher prices for resins in the Asian markets resulting from constrained gum rosin supply in China. Sales vo lumes of our TOFA products increased during the first half of 2013 due to favorable supply and demand conditions. While the supply and demand conditions for TOFA products became less favorable in the second half of 2013, it did not offset the sales volume gains we experienced in the first half of 2013. Our sales volumes were also positively impacted by a lack of supply for TOR and rosin esters products.
Our cost of goods sold for the year ended December 31, 2013 decreased by $7.0 million, or 1.0%, when compared to the year ended December 31, 2012. Lower oil prices resulted in lower costs for our raw materials which contributed $22.0 million and was offset by positive currency fluctuations. Our Adjusted EBITDA for the year ended December 31, 2013 was $204.9 million, or 20.7%, of net revenue, compared to $240.6 million or 23.1% of net revenue for the year ended December 31, 2012. The decrease of $35.7 million or 17.4% was mainly driven by the price declines due to the global economic uncertainty in 2012 and the first half of 2013. These price declines were partially offset by decreases in raw material costs which reduced our cost of goods sold.
Confidential
80

F. Kraton – Reconciliation of GAAP to non-GAAP financial measures
Historical Pro Forma
Year Ended 12/31, 9 months ended TTM Year Ended 12/31, 9 months ended TTM ($ in millions) 2010 2011 2012 2013 2014 9/30/2014 9/30/2015 9/30/2015 2014 9/30/2015 9/30/2015
Net Income (loss) $96.7 $90.9 ($16.2) ($1.0) $1.2 $19.0 ($7.7) ($25.5) $17.6 ($28.9) ($2.1) Interest expense, net 24.0 29.9 29.3 30.5 24.6 18.7 18.0 23.9 129.3 96.4 128.5 Income tax expense (benefit) 15.1 0.6 19.3 (3.9) 5.1 3.4 4.1 5.8 10.9 (10.7) 16.5 Depreciation & Amortization 49.2 62.7 64.6 63.2 66.2 49.6 46.9 63.5 145.9 105.7 141.9 EBITDA $185.0 $184.1 $97.0 $88.8 $97.2 $90.7 $61.2 $67.7 $303.7 $162.6 $284.7
Settlement gain (1) – – ($6.8) – – – – – – – –Property tax dispute (2) – – 6.2 – – – – – – – –Retirement plan charge (3) – – 1.1 – 0.4 – – 0.4 1.4 – 1.1 Restructuring and other charges (4) 6.4 1.8 1.4 0.8 3.0 0.7 1.5 3.8 7.0 6.3 9.2 Transaction and acquisition related costs (5) – – – 9.2 9.6 8.8 5.8 6.6 9.7 0.6 1.4 Impairment of long-lived assets (6) – – 5.4 – 4.7 – – 4.7 4.7 2.1 6.9 Impairment of spare parts inventory (7) – – – – 0.4 – – 0.4 0.4 – 0.4 Production downtime (8) – – 2.5 3.5 10.3 12.0 (0.3) (2.1) 10.3 (0.3) (2.1) KFPC startup costs (9) – – – – 1.9 1.3 1.8 2.4 1.9 1.8 2.4 Non-cash compensation expense (10) 3.5 5.5 6.6 7.9 10.5 8.5 6.6 8.6 12.5 6.4 8.4 Other share based compensation expense (11) – – – – – – – – 10.6 – –Gain on sale of assets (12) – – – – – – – – (0.4) – –Debt refinancing costs (13) – – – – – – – – 4.3 0.1 0.7 Litigation expense (14) – – – – – – – – (70.1) – (73.2) CTO spill related costs (15) – – – – – – – – 1.2 – 1.2 UK manufacturing cost closure (16) – – – – – – – – – 3.6 4.8 Unrealized foreign currency losses (gains) – – – – – – – – (0.2) 0.9 1.0 Loss on extinguishment of debt (17) – 3.0 – – – – – – 15.8 15.8 15.8 Incremental impact of purchase accounting (18) – – – – – – – – 16.8 16.3 16.8 Turnaround costs (19) – – – – – – – 7.5 – 7.5 7.5 Kraton run-rate costs reset initiatives (20) – – – – – – – 12.1 – 6.1 12.1 Estimated pro forma synergies (21) – – – – – – – – – – 65.0 FIFO ECRC spread (22) (12.1) (66.3) 30.5 30.7 9.3 (6.5) 40.1 55.9 9.3 40.1 55.9
Adjusted EBITDA at ECRC $182.8 $128.0 $143.8 $140.9 $147.2 $115.5 $116.8 $168.1 $338.9 $270.0 $420.0
Kraton capex (excluding JV capex) (55.6) (64.4) (69.6) (76.8) (70.1) (47.5) (42.4) (64.0) (70.1) (42.4) (64.0) 50% JV capex – – – (6.2) (22.5) (33.8) (46.1) (28.3) (22.5) (46.1) (28.3) Arizona capex – – – – – – – – (34.7) (23.4) (39.0)
Unlevered Free Cash Flow $127.2 $63.6 $74.2 $58.0 $54.6 $34.1 $28.3 $75.8 $211.6 $158.0 $288.7
Note: Table may not foot due to rounding.
Confidential
81
F. Kraton – Reconciliation of GAAP to non-GAAP financial measures (cont’d)
(1) Receipt from LyondellBasell in settlement of disputed charges. (2) Charge associated with resolution of a property tax dispute in France.
(3) In 2014, charges associated with curtailment charges associated with the termination of certain defined benefit pension plans. In 2012, retirement plan settlement charge associated with a disbursement from a benefit plan upon the retirement of an employee.
(4) Severance expenses, professional fees and other restructuring related charges.
(5) For the years ended December 31, 2014 and 2013, primarily professional fees related to the terminated combination agreement with the LCY Parties. For the nine months ended September 30, 2015, charges are primarily related to the proposed acquisition of Arizona Chemical, and for the nine months ended September 30, 2014, charges are primarily related to the terminated combination agreement with the LCY Parties.
(6) In 2015, impairment related to the announced closure of Arizona Chemical’s Chester-le-Street plant in the U.K. In 2014, $2.4 million was related to engineering and design assets for projects we determined were no longer economically viable; $1.4 million was related to information technology and office assets associated with restructuring activities; and $0.9 million was related to other long-lived assets. In 2012, $3.4 million was associated with the Asia HSBC facility and $2.0 million was associated with other long-lived assets.
(7) Impairment of spare parts inventory associated with the coal-burning boilers which were decommissioned in 2015.
(8) For the nine months ended September 30, 2015, the reduction in costs is due to insurance recoveries related to production downtime at our Belpre, Ohio facility. In 2014 and 2015, costs for weather-related production downtime at our Belpre, Ohio, facility and an operating disruption from a small fire at our Berre, France, facility, which occurred in the first quarter of 2014. In 2013, production downtime at our Belpre, Ohio, facility, in preparation for the installation of natural gas boilers to replace the coal-burning boilers required by the MACT legislation. In 2012, storm related charges at our Belpre, Ohio facility.
(9) Startup costs related to the joint venture company, KFPC. (10) Costs associated with equity compensation plans.
(11) Represents other share-based compensation expense in the form of common profit interests granted to certain Arizona Chemical employees. These interests are recognized as compensation expense at fair market value when probable of monetization.
(12) This gain on sale of assets relates to the sale of Arizona Chemical’s personal care business in 2013, of which $0.6 million was received in June 2014. The gain of $0.4 million shown for 2014 is net of an expense for a claim from a distributor.
(13) Professional fees and other costs incurred related to the refinancing of Arizona Chemical’s historical indebtedness.
(14) This credit represents an accrued insurance recovery for the litigation expenses and damages previously recorded associated with a claim filed by a former customer for an alleged breach of warranty and breach of contract regarding delivery of resin products during the period 2005 through 2009.
(15) This amount represents additional storage costs for CTO incurred as a result of a leak discovered in CTO tanks owned by Arizona Chemical in Söderhamn, Sweden in 2011.
(16) $4.8 million represents the full year of expected operational expense savings related to the anticipated closure in late 2015 of Arizona Chemical’s UK manufacturing facility in advance of realizing the actual benefit for the nine months ended September 30, 2015, $3.6 million represents the pro rata portion of the full year expected savings.
(17) This amount represents the anticipated net loss to retire the issuers’ existing 6.75% Senior Notes in connection with the refinancing of indebtedness. (18) This amount represents incremental costs related to purchase accounting adjustments.
(19) Adjustment to normalize turnaround costs subject to a cap of $7.5 million.
(20) Adjustment to attain the run-rate cost savings for implemented actions. Of the $70 million of Kraton cost reset initiative savings that are expected, we have already taken actions to achieve $24.0 million of the $70.0 million. See note above for how the run-rate was calculated.
(21) We estimate pre-tax run-rate synergies of $65.0 million, to be realized by the end of 2018, as a result of the Arizona Chemical Acquisition comprised of $25.0 million in general and administrative costs, and $40.0 million in the reduction of manufacturing costs and efficiency initiatives, not including an estimated $50.5 million to realize such synergies.
(22) Although we report our financial results using the first in first out (“FIFO”) basis of accounting, as part of our pricing strategy, we measure our business performance using the estimated current replacement cost (“ECRC”) of our inventory and cost of goods sold. We maintain our perpetual inventory in our global enterprise resource planning system, where the carrying value of our inventory is determined using FIFO. At the beginning of each month, we determine the estimated current cost of our raw materials for that particular month, and using the same perpetual inventory system that we use to manage inventory and therefore costs of goods sold under FIFO, we revalue our ending inventory to reflect the total cost of such inventory as if it was valued using the ECRC. The result of this revaluation from FIFO creates the spread between FIFO and ECRC. With inventory valued under FIFO and ECRC, we then have the ability to report cost of goods sold and therefore Adjusted EBITDA under both our FIFO convention and ECRC.
Confidential
82
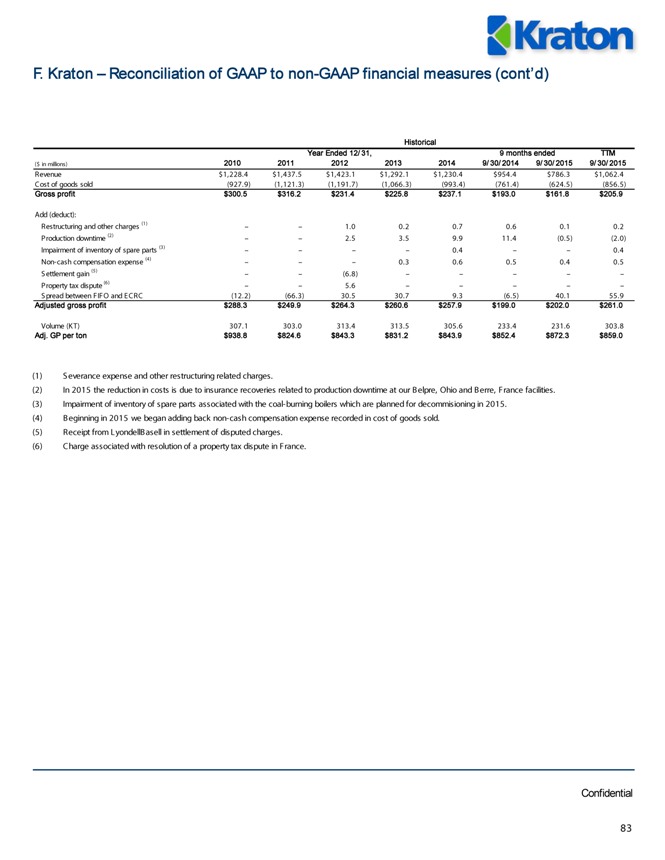
F. Kraton – Reconciliation of GAAP to non-GAAP financial measures (cont’d)
Historical
Year Ended 12/31, 9 months ended TTM ($ in millions) 2010 2011 2012 2013 2014 9/30/2014 9/30/2015 9/30/2015
Revenue $1,228.4 $1,437.5 $1,423.1 $1,292.1 $1,230.4 $954.4 $786.3 $1,062.4 Cost of goods sold (927.9) (1,121.3) (1,191.7) (1,066.3) (993.4) (761.4) (624.5) (856.5)
Gross profit $300.5 $316.2 $231.4 $225.8 $237.1 $193.0 $161.8 $205.9
Add (deduct):
Restructuring and other charges (1) – – 1.0 0.2 0.7 0.6 0.1 0.2 Production downtime (2) – – 2.5 3.5 9.9 11.4 (0.5) (2.0) Impairment of inventory of spare parts (3) – – – – 0.4 – – 0.4 Non-cash compensation expense (4) – – – 0.3 0.6 0.5 0.4 0.5 Settlement gain (5) – – (6.8) – – – – –Property tax dispute (6) – – 5.6 – – – – –Spread between FIFO and ECRC (12.2) (66.3) 30.5 30.7 9.3 (6.5) 40.1 55.9
Adjusted gross profit $288.3 $249.9 $264.3 $260.6 $257.9 $199.0 $202.0 $261.0
Volume (KT) 307.1 303.0 313.4 313.5 305.6 233.4 231.6 303.8
Adj. GP per ton $938.8 $824.6 $843.3 $831.2 $843.9 $852.4 $872.3 $859.0
(1) Severance expense and other restructuring related charges.
(2) In 2015 the reduction in costs is due to insurance recoveries related to production downtime at our Belpre, Ohio and Berre, France facilities. (3) Impairment of inventory of spare parts associated with the coal-burning boilers which are planned for decommisioning in 2015.
(4) Beginning in 2015 we began adding back non-cash compensation expense recorded in cost of goods sold. (5) Receipt from LyondellBasell in settlement of disputed charges.
(6) Charge associated with resolution of a property tax dispute in France.
Confidential
83
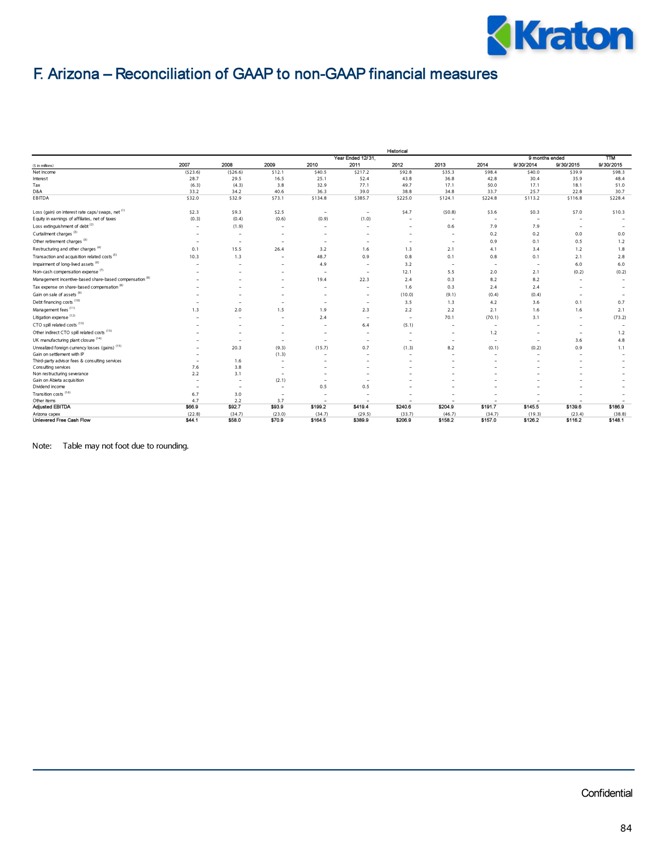
F. Arizona – Reconciliation of GAAP to non-GAAP financial measures
Historical
Year Ended 12/31, 9 months ended TTM ($ in millions) 2007 2008 2009 2010 2011 2012 2013 2014 9/30/2014 9/30/2015 9/30/2015
Net Income ($23.6) ($26.6) $12.1 $40.5 $217.2 $92.8 $35.3 $98.4 $40.0 $39.9 $98.3 Interest 28.7 29.5 16.5 25.1 52.4 43.8 36.8 42.8 30.4 35.9 48.4 Tax (6.3) (4.3) 3.8 32.9 77.1 49.7 17.1 50.0 17.1 18.1 51.0 D&A 33.2 34.2 40.6 36.3 39.0 38.8 34.8 33.7 25.7 22.8 30.7 EBITDA $32.0 $32.9 $73.1 $134.8 $385.7 $225.0 $124.1 $224.8 $113.2 $116.8 $228.4
Loss (gain) on interest rate caps/swaps, net (1) $2.3 $9.3 $2.5 – – $4.7 ($0.8) $3.6 $0.3 $7.0 $10.3 Equity in earnings of affiliates, net of taxes (0.3) (0.4) (0.6) (0.9) (1.0) – – – – – –Loss extinguishment of debt (2) – (1.9) – – – – 0.6 7.9 7.9 – –Curtailment charges (3) – – – – – – – 0.2 0.2 0.0 0.0 Other retirement charges (3) – – – – – – – 0.9 0.1 0.5 1.2 Restructuring and other charges (4) 0.1 15.5 26.4 3.2 1.6 1.3 2.1 4.1 3.4 1.2 1.8 Transaction and acquisition related costs (5) 10.3 1.3 – 48.7 0.9 0.8 0.1 0.8 0.1 2.1 2.8 Impairment of long-lived assets (6) – – – 4.9 – 3.2 – – – 6.0 6.0 Non-cash compensation expense (7) – – – – – 12.1 5.5 2.0 2.1 (0.2) (0.2) Management incentive-based share-based compensation (8) – – – 19.4 22.3 2.4 0.3 8.2 8.2 – –Tax expense on share-based compensation (8) – – – – – 1.6 0.3 2.4 2.4 – –Gain on sale of assets (9) – – – – – (10.0) (9.1) (0.4) (0.4) – –Debt financing costs (10) – – – – – 3.5 1.3 4.2 3.6 0.1 0.7 Management fees (11) 1.3 2.0 1.5 1.9 2.3 2.2 2.2 2.1 1.6 1.6 2.1 Litigation expense (12) – – – 2.4 – – 70.1 (70.1) 3.1 – (73.2) CTO spill related costs (13) – – – – 6.4 (5.1) – – – – –Other indirect CTO spill related costs (13) – – – – – – – 1.2 – – 1.2 UK manufacturing plant closure (14) – – – – – – – – – 3.6 4.8 Unrealized foreign currency losses (gains) (15) – 20.3 (9.3) (15.7) 0.7 (1.3) 8.2 (0.1) (0.2) 0.9 1.1 Gain on settlement with IP – (1.3) – – – – – – – –Third-party advisor fees & consulting services – 1.6 – – – – – – – – –Consulting services 7.6 3.8 – – – – – – – – –Non restructuring severance 2.2 3.1 – – – – – – – – –Gain on Abieta acquisition – – (2.1) – – – – – – – –Dividend income – – – 0.5 0.5 – – – – – –Transition costs (16) 6.7 3.0 – – – – – – – – –Other items 4.7 2.2 3.7 – – – – – – – –
Adjusted EBITDA $66.9 $92.7 $93.9 $199.2 $419.4 $240.6 $204.9 $191.7 $145.5 $139.6 $186.9
Arizona capex (22.8) (34.7) (23.0) (34.7) (29.5) (33.7) (46.7) (34.7) (19.3) (23.4) (38.8)
Unlevered Free Cash Flow $44.1 $58.0 $70.9 $164.5 $389.9 $206.9 $158.2 $157.0 $126.2 $116.2 $148.1
Note: Table may not foot due to rounding.
Confidential
84
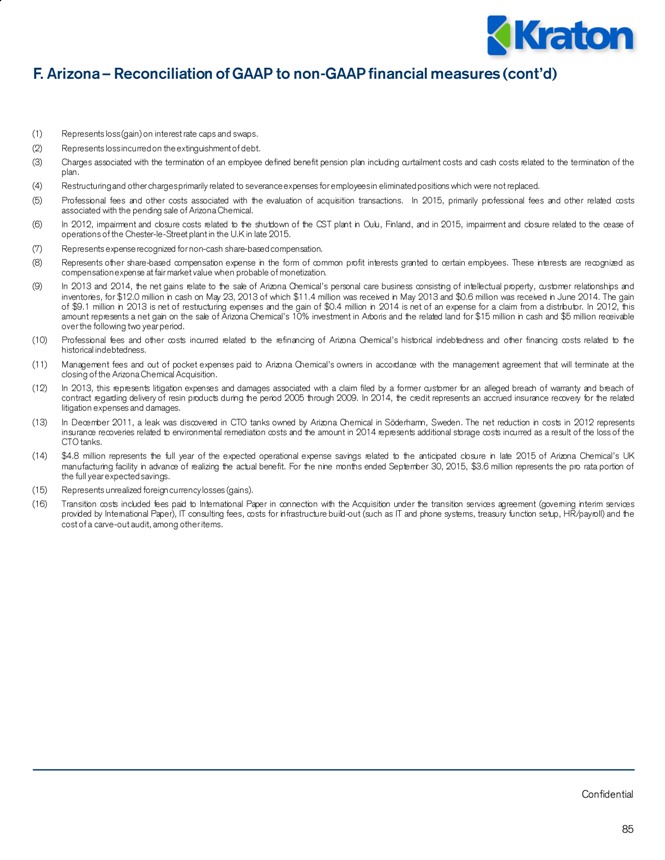
F. Arizona – Reconciliation of GAAP to non-GAAP financial measures (cont’d)
(1) Represents loss (gain) on interest rate caps and swaps. (2) Represents loss incurred on the extinguishment of debt.
(3) Charges associated with the termination of an employee defined benefit pension plan including curtailment costs and cash costs related to the termination of the plan.
(4) Restructuring and other charges primarily related to severance expenses for employees in eliminated positions which were not replaced.
(5) Professional fees and other costs associated with the evaluation of acquisition transactions. In 2015, primarily professional fees and other related costs associated with the pending sale of Arizona Chemical.
(6) In 2012, impairment and closure costs related to the shutdown of the CST plant in Oulu, Finland, and in 2015, impairment and closure related to the cease of operations of the Chester-le-Street plant in the U.K in late 2015.
(7) Represents expense recognized for non-cash share-based compensation.
(8) Represents other share-based compensation expense in the form of common profit interests granted to certain employees. These interests are recognized as compensation expense at fair market value when probable of monetization.
(9) In 2013 and 2014, the net gains relate to the sale of Arizona Chemical’s personal care business consisting of intellectual property, customer relationships and inventories, for $12.0 million in cash on May 23, 2013 of which $11.4 million was received in May 2013 and $0.6 million was received in June 2014. The gain of $9.1 million in 2013 is net of restructuring expenses and the gain of $0.4 million in 2014 is net of an expense for a claim from a distributor. In 2012, this amount represents a net gain on the sale of Arizona Chemical’s 10% investment in Arboris and the related land for $15 million in cash and $5 million receivable over the following two year period.
(10) Professional fees and other costs incurred related to the refinancing of Arizona Chemical’s historical indebtedness and other financing costs related to the historical indebtedness.
(11) Management fees and out of pocket expenses paid to Arizona Chemical’s owners in accordance with the management agreement that will terminate at the closing of the Arizona Chemical Acquisition.
(12) In 2013, this represents litigation expenses and damages associated with a claim filed by a former customer for an alleged breach of warranty and breach of contract regarding delivery of resin products during the period 2005 through 2009. In 2014, the credit represents an accrued insurance recovery for the related litigation expenses and damages.
(13) In December 2011, a leak was discovered in CTO tanks owned by Arizona Chemical in Söderhamn, Sweden. The net reduction in costs in 2012 represents insurance recoveries related to environmental remediation costs and the amount in 2014 represents additional storage costs incurred as a result of the loss of the CTO tanks.
(14) $4.8 million represents the full year of the expected operational expense savings related to the anticipated closure in late 2015 of Arizona Chemical’s UK manufacturing facility in advance of realizing the actual benefit. For the nine months ended September 30, 2015, $3.6 million represents the pro rata portion of the full year expected savings.
(15) Represents unrealized foreign currency losses (gains).
(16) Transition costs included fees paid to International Paper in connection with the Acquisition under the transition services agreement (governing interim services provided by International Paper), IT consulting fees, costs for infrastructure build-out (such as IT and phone systems, treasury function setup, HR/payroll) and the cost of a carve-out audit, among other items.
Confidential
85
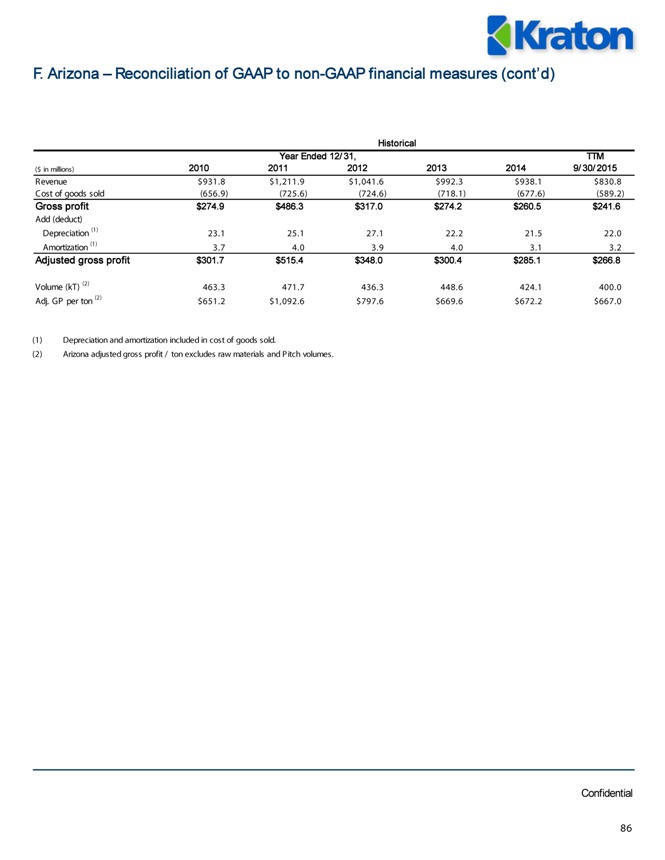
F. Arizona – Reconciliation of GAAP to non-GAAP financial measures (cont’d)
Historical
Year Ended 12/31, TTM ($ in millions) 2010 2011 2012 2013 2014 9/30/2015
Revenue $931.8 $1,211.9 $1,041.6 $992.3 $938.1 $830.8 Cost of goods sold (656.9) (725.6) (724.6) (718.1) (677.6) (589.2)
Gross profit $274.9 $486.3 $317.0 $274.2 $260.5 $241.6
Add (deduct)
Depreciation (1) 23.1 25.1 27.1 22.2 21.5 22.0 Amortization (1) 3.7 4.0 3.9 4.0 3.1 3.2
Adjusted gross profit $301.7 $515.4 $348.0 $300.4 $285.1 $266.8
Volume (kT) (2) 463.3 471.7 436.3 448.6 424.1 400.0 Adj. GP per ton (2) $651.2 $1,092.6 $797.6 $669.6 $672.2 $667.0
(1) Depreciation and amortization included in cost of goods sold.
(2) Arizona adjusted gross profit / ton excludes raw materials and Pitch volumes.
Confidential
86