Exhibit 99.1
SUMMARY CONSOLIDATED HISTORICAL FINANCIAL DATA—ARIZONA CHEMICAL
The table below sets forth Arizona Chemical’s summary consolidated historical financial data for the periods indicated. The summary consolidated historical financial data presented below for the years ended December 31, 2012, 2013 and 2014 and as of December 31, 2013 and 2014 have been derived from, are qualified in their entirety by, and should be read in conjunction with, Arizona Chemical’s audited consolidated financial statements and notes related thereto (the “Arizona Chemical Audited Financial Statements”) included elsewhere in this offering circular. The summary consolidated historical financial data as of and for the nine months ended September 30, 2014 and 2015 are derived from, are qualified in their entirety by, and should be read in conjunction with, Arizona Chemical’s unaudited condensed consolidated financial statements and notes related thereto (the “Arizona Chemical Interim Financial Statements”) included elsewhere in this offering circular. The Arizona Chemical Interim Financial Statements have been prepared on the same basis as the Arizona Chemical Audited Financial Statements and, in the opinion of Arizona Chemical’s management, include all adjustments, consisting only of normal and recurring adjustments, necessary for a fair presentation of the information set forth herein. Interim financial results are not necessarily indicative of results that may be expected for the full fiscal year or any future reporting period. These historical results are not necessarily indicative of future results and should be read in conjunction with “Selected Historical Consolidated Financial Data—Arizona Chemical,” the Arizona Chemical Audited Financial Statements and the Arizona Chemical Interim Financial Statements appearing elsewhere in this offering circular.
| | | | | | | | | | | | | | | | | | | | |
| | | Arizona Chemical Holdings Corporation | |
| | | Year Ended December 31, | | | Nine Months Ended
September 30, | |
| | | 2012 | | | 2013 | | | 2014 | | | 2014 | | | 2015 | |
| | | (in thousands) | |
Consolidated Statements of Operations Data: | | | | | | | | | | | | | | | | | | | | |
Net revenue | | $ | 1,041,631 | | | $ | 992,259 | | | $ | 938,050 | | | $ | 728,303 | | | $ | 620,957 | |
Cost of goods sold | | | 724,576 | | | | 718,062 | | | | 677,587 | | | | 524,381 | | | | 436,039 | |
| | | | | | | | | | | | | | | | | | | | |
Gross profit | | | 317,055 | | | | 274,197 | | | | 260,463 | | | | 203,922 | | | | 184,918 | |
| | | | | | | | | | | | | | | | | | | | |
Operating expenses | | | | | | | | | | | | | | | | | | | | |
Selling, general and administrative (including related party fees) | | | 133,401 | | | | 124,816 | | | | 130,532 | | | | 106,782 | | | | 78,205 | |
Facility closure costs | | | 3,216 | | | | — | | | | — | | | | — | | | | 5,953 | |
Litigation expense | | | — | | | | 70,100 | | | | 10,110 | | | | 3,100 | | | | 12,894 | |
Insurance recoveries | | | — | | | | — | | | | (80,210 | ) | | | — | | | | (12,894 | ) |
| | | | | | | | | | | | | | | | | | | | |
Operating income | | | 180,438 | | | | 79,281 | | | | 200,031 | | | | 94,040 | | | | 100,760 | |
Interest expense, net | | | 43,759 | | | | 36,840 | | | | 42,825 | | | | 30,398 | | | | 35,928 | |
Loss on extinguishment of debt | | | — | | | | 552 | | | | 7,860 | | | | 7,860 | | | | — | |
Loss (gain) on interest rate caps/swaps, net | | | 4,705 | | | | (751 | ) | | | 3,579 | | | | 295 | | | | 7,003 | |
Foreign currency exchange gains (losses), net | | | (202 | ) | | | 1,322 | | | | (1,208 | ) | | | (333 | ) | | | (107 | ) |
Other income | | | (10,298 | ) | | | (11,111 | ) | | | (1,342 | ) | | | (1,218 | ) | | | (101 | ) |
| | | | | | | | | | | | | | | | | | | | |
Income before income taxes | | | 142,474 | | | | 52,429 | | | | 148,317 | | | | 57,038 | | | | 58,037 | |
Income tax expense | | | 49,693 | | | | 17,131 | | | | 49,966 | | | | 17,084 | | | | 18,103 | |
| | | | | | | | | | | | | | | | | | | | |
Net income | | $ | 92,781 | | | $ | 35,298 | | | $ | 98,351 | | | $ | 39,954 | | | $ | 39,934 | |
| | | | | | | | | | | | | | | | | | | | |
Other Financial Data | | | | | | | | | | | | | | | | | | | | |
Capital expenditures | | $ | 33,716 | | | $ | 46,695 | | | $ | 34,719 | | | $ | 19,325 | | | $ | 23,437 | |
EBITDA(1) | | $ | 225,011 | | | $ | 124,092 | | | $ | 224,798 | | | $ | 113,165 | | | $ | 116,760 | |
Adjusted EBITDA(2) | | $ | 240,572 | | | $ | 204,878 | | | $ | 191,694 | | | $ | 145,542 | | | $ | 139,588 | |
1
| | | | | | | | | | | | |
| | | Historical | |
| | | As of December 31, | | | As of
September 30, | |
| | | 2013 | | | 2014 | | | 2015 | |
| | | (in thousands) | |
Balance Sheet Data | | | | | | | | |
Cash and cash equivalents | | $ | 37,994 | | | $ | 39,312 | | | $ | 44,439 | |
Property, plant and equipment, net | | $ | 246,782 | | | $ | 245,025 | | | $ | 239,179 | |
Total assets | | $ | 684,949 | | | $ | 702,348 | | | $ | 692,507 | |
Total debt | | $ | 450,927 | | | $ | 822,621 | | | $ | 780,227 | |
| (1) | Arizona Chemical defines EBITDA as earnings before interest, taxes, depreciation, and amortization. EBITDA should not be considered an alternative to net income, operating income, cash flows from operating activities, or any other measure of financial performance presented in accordance with GAAP. Arizona Chemical’s EBITDA may not be comparable to EBITDA or similarly titled financial metrics of other entities, as other entities may not calculate EBITDA in the same manner as Arizona Chemical does. Arizona Chemical compensates for the limitations of EBITDA as an analytical tool by reviewing the comparable GAAP measures, understanding the differences between the measures, and incorporating this knowledge into management’s decision-making processes. |
| (2) | Arizona Chemical defines Adjusted EBITDA as EBITDA net of the impact of items that Arizona Chemical does not consider indicative of its ongoing operating performance. We explain how each adjustment is derived and why we believe it is helpful and appropriate in the reconciliation below. You are encouraged to evaluate each adjustment and the reasons we consider it appropriate for supplemental analysis. As an analytical tool, Adjusted EBITDA is subject to the limitations applicable to EBITDA described above. |
Because of these and other limitations, EBITDA and Adjusted EBITDA should not be considered as a measure of discretionary cash available to Arizona Chemical to invest in the growth of its business.
Arizona Chemical’s presentation of non-GAAP financial measures and the adjustments made therein should not be construed as an inference that its future results will be unaffected by unusual or non-recurring items, and in the future Arizona Chemical may incur expenses or charges similar to the adjustments made in the presentation of its non-GAAP financial measures.
2
Arizona Chemical compensates for these limitations by relying primarily on its GAAP results and using EBITDA and Adjusted EBITDA only as supplemental measures.
| | | | | | | | | | | | | | | | | | | | |
| | | Arizona Chemical Holdings Corporation | |
| | | Year Ended December 31, | | | Nine Months Ended
September 30, | |
| | | 2012 | | | 2013 | | | 2014 | | | 2014 | | | 2015 | |
| | | (in thousands) | |
Net Income | | $ | 92,781 | | | $ | 35,298 | | | $ | 98,351 | | | $ | 39,954 | | | $ | 39,934 | |
Add (deduct): | | | | | | | | | | | | | | | | | | | | |
Interest expense, net | | | 43,759 | | | | 36,840 | | | | 42,825 | | | | 30,398 | | | | 35,928 | |
Income tax expense | | | 49,693 | | | | 17,131 | | | | 49,966 | | | | 17,084 | | | | 18,103 | |
Depreciation and amortization | | | 38,778 | | | | 34,823 | | | | 33,656 | | | | 25,729 | | | | 22,795 | |
| | | | | | | | | | | | | | | | | | | | |
EBITDA | | | 225,011 | | | | 124,092 | | | | 224,798 | | | | 113,165 | | | | 116,760 | |
Add (deduct): | | | | | | | | | | | | | | | | | | | | |
Loss (gain) on interest rate caps/swaps, net(a) | | | 4,705 | | | | (751 | ) | | | 3,579 | | | | 295 | | | | 7,003 | |
Loss on extinguishment of debt(b) | | | — | | | | 552 | | | | 7,860 | | | | 7,860 | | | | — | |
Curtailment charges(c) | | | — | | | | — | | | | 162 | | | | 197 | | | | 40 | |
Other retirement charges(c) | | | — | | | | — | | | | 865 | | | | 135 | | | | 475 | |
Restructuring and other charges(d) | | | 1,328 | | | | 2,078 | | | | 4,074 | | | | 3,429 | | | | 1,165 | |
Transaction and acquisition related costs(e) | | | 822 | | | | 75 | | | | 817 | | | | 107 | | | | 2,137 | |
Impairment of long-lived assets and facility closure cost(f) | | | 3,216 | | | | — | | | | — | | | | — | | | | 5,953 | |
Non-cash share-based compensation(g) | | | 12,074 | | | | 5,484 | | | | 1,999 | | | | 2,050 | | | | (173 | ) |
Management incentive-based share-based compensation(h) | | | 2,400 | | | | 291 | | | | 8,193 | | | | 8,193 | | | | — | |
Tax expense on share-based compensation(h) | | | 1,619 | | | | 324 | | | | 2,400 | | | | 2,400 | | | | — | |
Gain on sale of assets(i) | | | (9,964 | ) | | | (9,091 | ) | | | (365 | ) | | | (365 | ) | | | — | |
Financing costs in connection with debt(j) | | | 3,537 | | | | 1,327 | | | | 4,152 | | | | 3,575 | | | | 121 | |
Management fees(k) | | | 2,198 | | | | 2,202 | | | | 2,149 | | | | 1,571 | | | | 1,562 | |
Litigation expense(l) | | | — | | | | 70,100 | | | | (70,100 | ) | | | 3,100 | | | | — | |
CTO spill related costs(m) | | | (5,115 | ) | | | — | | | | — | | | | — | | | | — | |
Other indirect CTO spill related costs(m) | | | — | | | | — | | | | 1,164 | | | | — | | | | — | |
UK manufacturing plant closure(n) | | | — | | | | — | | | | — | | | | — | | | | 3,612 | |
Unrealized foreign currency losses (gains)(o) | | | (1,259 | ) | | | 8,195 | | | | (53 | ) | | | (170 | ) | | | 933 | |
| | | | | | | | | | | | | | | | | | | | |
Adjusted EBITDA | | $ | 240,572 | | | $ | 204,878 | | | $ | 191,694 | | | $ | 145,542 | | | $ | 139,588 | |
| | | | | | | | | | | | | | | | | | | | |
| (a) | Represents loss (gain) on interest rate caps and swaps. |
| (b) | Represents loss incurred on the extinguishment of debt. |
| (c) | Charges associated with the termination of an employee defined benefit pension plan including curtailment costs and cash costs related to the termination of the plan. |
| (d) | Restructuring and other charges primarily related to severance expenses for employees in eliminated positions which were not replaced. |
| (e) | Professional fees and other costs associated with the evaluation of acquisition transactions. In 2015, primarily professional fees and other related costs associated with the pending sale of Arizona Chemical. |
| (f) | In 2012, impairment and closure costs related to the shutdown of the CST plant in Oulu, Finland, and in 2015, impairment and closure costs related to the cessation of operations at the Chester-le-Street plant in the U.K in late 2015. |
| (g) | Represents expense recognized for non-cash share-based compensation. |
3
| (h) | Represents other share-based compensation expense in the form of common profit interests granted to certain employees. These interests are recognized as compensation expense at fair market value when probable of monetization. |
| (i) | In 2013 and 2014, the net gains relate to the sale of Arizona Chemical’s personal care business consisting of intellectual property, customer relationships and inventories, for $12.0 million in cash on May 23, 2013 of which $11.4 million was received in May 2013 and $0.6 million was received in June 2014. The gain of $9.0 million in 2013 is net of restructuring expenses and the gain of $0.3 million in 2014 is net of an expense for a claim from a distributor. In 2012, this amount represents a net gain on the sale of Arizona Chemical’s 10% investment in Arboris and the related land for $15 million in cash and $5 million receivable over the following two-year period. |
| (j) | Professional fees and other costs incurred related to the refinancing of Arizona Chemical’s historical indebtedness and other financing costs related to the historical indebtedness. |
| (k) | Management fees and out of pocket expenses paid to Arizona Chemical’s owners in accordance with the management agreement that will terminate at the closing of the pending Arizona Chemical Acquisition. |
| (l) | In 2013, this represents litigation expenses and damages associated with a claim filed by a former customer for an alleged breach of warranty and breach of contract regarding delivery of resin products during the period 2005 through 2009. In 2014, the credit represents an accrued insurance recovery for the related litigation expenses and damages. |
| (m) | In December 2011, a leak was discovered in CTO tanks owned by Arizona Chemical in Sôderhamn, Sweden. The net reduction in costs in 2012 represents insurance recoveries related to environmental remediation costs and the amount in 2014 represents additional storage costs incurred as a result of the loss of the CTO tanks. |
| (n) | Represents the pro rata portion of the full year operational expenses expected to be eliminated upon the cessation of operations in late 2015 of Arizona Chemical’s U.K. manufacturing facility. |
| (o) | Represents unrealized foreign currency losses (gains). |
4
RISK FACTORS
Your investment in the notes will involve substantial risks. You should carefully consider the following factors described below and all other information contained or incorporated by reference in this offering circular before making an investment decision. See “Where You Can Find More Information” and “Incorporation of Certain Documents by Reference.” Although we describe below and elsewhere in this offering circular the risks we consider to be material, there may be other unknown or unpredictable economic, business, competitive, regulatory or other factors that also could have material adverse effects on our results of operations, financial condition, business or operations in the future. In addition, past financial performance may not be a reliable indicator of future performance and historical trends should not be used to anticipate results or trends in future periods. If any of these risks were to materialize, individually or in combination, our business, prospects, financial condition, results of operations and/or cash flows could be materially adversely affected.
Risks Related to Our Indebtedness
Our substantial indebtedness could adversely affect our financial condition and prevent us from fulfilling our obligations under our indebtedness, including the notes and the New Senior Secured Credit Facilities.
As of September 30, 2015, we had $350.0 million principal amount of indebtedness outstanding in the form of our 6.75% Senior Notes and our Existing Senior Secured Credit Facilities were undrawn, with available borrowing capacity of $169.6 million. On a pro forma basis, after giving effect to the Transactions, our total consolidated indebtedness as of September 30, 2015 would have been $1,351.7 million of senior secured indebtedness and $425.0 million of senior unsecured indebtedness. In addition, KFPC executed the KFPC Loan Agreement to provide additional funding to construct the HSBC facility in Taiwan and to provide funding for working capital requirements and/or general corporate purposes. FPCC and Kraton LLC are the guarantors of the KFPC Loan Agreement with each guarantor guaranteeing fifty percent (50%) of the indebtedness, of which NTD 1.7 billion, or $52.6 million (converted at the September 30, 2015 exchange rate), of indebtedness was outstanding as of September 30, 2015.
Although the credit agreements governing the New Senior Secured Credit Facilities and the indenture governing the notes offered hereby will, and the KFPC Loan Agreement does, contain restrictions on the incurrence of additional indebtedness, these restrictions are subject to a number of important exceptions, and additional indebtedness that we may incur from time to time to finance projects or for other reasons in compliance with these restrictions could be substantial. If we and our restricted subsidiaries incur significant additional indebtedness, the related risks that we face could increase.
Our indebtedness could:
| | • | | make it more difficult for us to satisfy our financial obligations; |
| | • | | increase our vulnerability to adverse economic and industry conditions; |
| | • | | increase the risk that we breach financial covenants and other restrictions in our debt agreements, which can be exacerbated by volatility in the cost of our raw materials and the resulting impact on our earnings; |
| | • | | require us to dedicate a substantial portion of our cash flow from operations to make payments on our indebtedness, thereby reducing the availability of our cash flow to fund working capital, capital expenditures and other general corporate purposes; |
| | • | | limit our flexibility in planning for, or reacting to, changes in the business and industry in which we operate; |
| | • | | restrict us from exploiting business opportunities; |
| | • | | place us at a disadvantage compared to our competitors that have less debt and lease obligations; and |
| | • | | limit our ability to borrow additional funds for working capital, capital expenditures, acquisitions, debt service requirements, execution of our business strategy and other general corporate purposes or to refinance our existing debt. |
5
Our ability to pay principal of and interest on indebtedness, fund working capital and make anticipated capital expenditures depends on our future performance, which is subject to general economic conditions and other factors, some of which are beyond our control. There can be no assurance that our business will generate sufficient cash flow from operations or that future borrowings will be available under the New Senior Secured Credit Facilities to fund liquidity needs, including debt service. Furthermore, if we decide to undertake additional investments in existing or new facilities, this will likely require additional capital, and there can be no assurance that this capital will be available.
Despite current indebtedness levels and restrictive covenants, we and our subsidiaries may incur additional indebtedness or we may pay dividends in the future. This could further exacerbate the risks associated with our substantial financial leverage.
We and our subsidiaries may incur significant additional indebtedness in the future under the agreements governing our indebtedness. Although the credit agreements governing the New Senior Secured Credit Facilities and the indenture governing the notes offered hereby will contain restrictions on the incurrence of additional indebtedness and the payment of distributions to our equity holders, these restrictions are subject to a number of thresholds, qualifications and exceptions, and the additional indebtedness incurred, and distributions paid, in compliance with these restrictions could be substantial. Additionally, these restrictions also will permit us to incur obligations that, although preferential to our common stock in terms of payment, do not constitute indebtedness. As of September 30, 2015, on a pro forma basis after giving effect to the Transactions, we would have had approximately $250.0 million of borrowing capacity under the ABL Facility. In addition, if new debt is added to our and/or our subsidiaries’ debt levels, the related risks that we now face as a result of our leverage would intensify. See “Description of Notes—Certain Covenants” and “Description of Other Indebtedness.”
Our debt instruments, including the indenture governing the notes offered hereby and the New Senior Secured Credit Facilities, may impose significant operating and financial restrictions on us and affect our ability to access liquidity.
The indenture governing the notes offered hereby, the credit agreements governing the New Senior Secured Credit Facilities and any future indebtedness may contain, a number of restrictive covenants that impose significant operating and financial restrictions on us. The credit agreement governing the ABL Facility will subject us to a financial covenant requiring us to maintain a fixed charge coverage ratio of 1.0:1.0 if availability under the facilities is below specified amounts. In addition, our debt instruments may include restrictions on our ability to, in certain circumstances, among other things:
| | • | | place liens on our or our restricted subsidiaries’ assets; |
| | • | | make investments other than permitted investments; |
| | • | | incur additional indebtedness; |
| | • | | merge, consolidate or dissolve; |
| | • | | engage in transactions with affiliates; |
| | • | | change the nature of our business; |
| | • | | change our or our subsidiaries’ fiscal year or organizational documents; and |
| | • | | make restricted payments (including certain equity issuances). |
6
A failure by us or our subsidiaries to comply with the covenants and restrictions contained in the agreements governing our indebtedness could result in an event of default under such indebtedness, which could adversely affect our ability to respond to changes in our business and manage our operations. Upon the occurrence of an event of default under any of the agreements governing our indebtedness, the lenders could elect to declare all amounts outstanding to be due and payable and exercise other remedies as set forth in the agreements. Further, an event of default or acceleration of indebtedness under one instrument may constitute an event of default under another instrument. If any of our indebtedness were to be accelerated, there can be no assurance that our assets would be sufficient to repay this indebtedness in full, which could have a material adverse effect on our ability to continue to operate as a going concern.
To service our indebtedness, we will require a significant amount of cash.
Our ability to generate cash depends on many factors beyond our control, and any failure to meet our debt service obligations could harm our business, financial condition and results of operations. Our ability to make payments on and to refinance our indebtedness, including the notes, and to fund working capital needs and planned capital expenditures will depend on our ability to generate cash in the future. This, to a certain extent, is subject to general economic, financial, competitive, business, legislative, regulatory and other factors that are beyond our control, including, among other things, the costs of raw materials used in the production of our products.
If our business does not generate sufficient cash flow from operations or if future borrowings are not available to us in an amount sufficient to enable us to pay our indebtedness, including the notes, or to fund our other liquidity needs, we may need to refinance all or a portion of our indebtedness, including the notes, on or before the maturity thereof, sell assets, reduce or delay capital investments or seek to raise additional capital, any of which could have a material adverse effect on our operations. We might not generate sufficient cash flow to repay indebtedness as currently anticipated. In addition, we may not be able to effect any of these actions, if necessary, on commercially reasonable terms or at all. Our ability to restructure or refinance our indebtedness, including the notes, will depend on the condition of the capital markets and our financial condition at such time. Any refinancing of our indebtedness could be at higher interest rates and may require us to comply with more onerous covenants, which could further restrict our business operations. The terms of existing or future debt instruments, including the indenture governing the notes, may limit or prevent us from taking any of these actions. In addition, any failure to make scheduled payments of interest and principal on our outstanding indebtedness would likely result in a reduction of our credit rating, which could harm our ability to incur additional indebtedness on commercially reasonable terms or at all. Our inability to generate sufficient cash flow to satisfy our debt service obligations, or to refinance or restructure our obligations on commercially reasonable terms or at all, would have an adverse effect, which could be material, on our business, financial condition and results of operations, as well as on our ability to satisfy our obligations in respect of the notes.
Our variable rate indebtedness subjects us to interest rate risk, which could cause our debt service obligations to increase significantly.
Borrowings under the New Senior Secured Credit Facilities are at variable rates of interest and expose us to interest rate risk. Interest rates are currently at historically low levels. If interest rates increase, our debt service obligations on the variable rate indebtedness will increase even though the amount borrowed remained the same, and our net income and cash flows, including cash available for servicing our indebtedness, will correspondingly decrease. As of September 30, 2015, on a pro forma basis after giving effect to the Transactions, approximately $1,350.0 million of our debt would have been variable rate debt, and, holding other variables constant, an increase or decrease in interest rates by 0.125% on our variable rate debt would increase or decrease our annual interest expense by approximately $1.7 million. In the future, we may enter into interest rate swaps that involve the exchange of floating for fixed rate interest payments in order to reduce interest rate volatility. However, we may not maintain interest rate swaps with respect to any of our variable rate indebtedness, and any swaps we enter into may not fully mitigate our interest rate risk.
7
Risk Factors Related to the Notes and this Offering
The notes will be unsecured and will be effectively subordinated to our and the guarantors’ senior secured indebtedness and indebtedness of non-guarantor subsidiaries.
The issuers’ obligations under the notes and the guarantors’ obligations under the guarantees of the notes will not be secured by any of our or our subsidiaries’ assets. Following the consummation of this offering, the issuers will have $1,350.0 million of senior secured indebtedness outstanding under the Term Loan Facility in addition to availability under the ABL Facility. If the issuers and the guarantors were to become insolvent or otherwise fail to make payments on the notes, holders of our and our guarantors’ secured obligations would be paid first and would receive payments from the assets securing such obligations before the holders of the notes would receive any payments. You may therefore not be fully repaid in the event we become insolvent or otherwise fail to make payments on the notes. On a pro forma basis after giving effect to the Transactions, as of September 30, 2015, our non-guarantor subsidiaries (including the non-guarantor subsidiaries of Arizona Chemical) held approximately $1,025.4 million, or 34.8%, of our total assets and approximately $313.9 million, or 12.2%, of our total liabilities and for the nine months ended September 30, 2015, accounted for approximately $764.1 million, or 54.3%, of our net revenue and approximately $39.0 million, or 17.9%, of our EBITDA at ECRC. For a reconciliation of EBITDA to GAAP measures, see “Summary—Summary Consolidated Historical and Pro Forma Financial Data—Kraton.”
The notes will not be guaranteed by all of our subsidiaries. For example, our immaterial subsidiaries are not required to guarantee the notes. Accordingly, claims of holders of the notes will be structurally subordinate to the claims of creditors of these non-guarantor subsidiaries, including trade creditors. All obligations of our non-guarantor subsidiaries will have to be satisfied before any of the assets of such subsidiaries would be available for distribution, upon a liquidation or otherwise, to us or a guarantor of the notes.
Our failure to comply with the agreements relating to our indebtedness, including as a result of events beyond our control, could result in an event of default that could materially and adversely affect our results of operations and our financial condition.
If there were an event of default under any of the agreements relating to our current or future indebtedness, the holders of the defaulted debt could cause all amounts outstanding with respect to that debt to be due and payable immediately. Upon acceleration of certain of our other indebtedness, holders of the notes could declare all amounts outstanding under the notes immediately due and payable. We cannot assure you that our assets or cash flow would be sufficient to fully repay borrowings under our outstanding debt instruments if accelerated upon an event of default. Further, if we are unable to repay, refinance or restructure our secured indebtedness, the holders of such indebtedness could proceed against the collateral securing that indebtedness. In addition, any event of default or declaration of acceleration under one debt instrument could also result in an event of default under one or more of our other debt instruments. In addition, counterparties to some of our long term customer contracts may have the right to amend or terminate those contracts if we have an event of default or a declaration of acceleration under certain of our indebtedness, which could materially adversely affect our business, financial condition or results of operations.
Under certain circumstances a court could cancel the notes or the related guarantees under fraudulent conveyance laws.
Federal and state fraudulent transfer and conveyance statutes may apply to the issuance of the notes and the incurrence of the guarantees. Under federal bankruptcy law and comparable provisions of state fraudulent transfer or conveyance laws, which may vary from state to state, the notes or guarantees could be voided as a fraudulent transfer or conveyance if (1) we or any of the guarantors, as applicable, issued the notes or incurred the guarantees with the intent of hindering, delaying or defrauding creditors or (2) we or any of the guarantors, as applicable, received less than reasonably equivalent value or fair consideration in return for either issuing the notes or incurring the guarantees and, in the case of (2) only, one of the following is also true at the time thereof:
| | • | | we or any of the guarantors, as applicable, were insolvent or rendered insolvent by reason of the issuance of the notes or the incurrence of the guarantees; |
8
| | • | | the issuance of the notes or the incurrence of the guarantees left us or any of the guarantors, as applicable, with an unreasonably small amount of capital to carry on the business; |
| | • | | we or any of the guarantors intended to, or believed that we or such guarantor would, incur debts beyond our or such guarantor’s ability to pay as they mature; or |
| | • | | we or any of the guarantors was a defendant in an action for money damages, or had a judgment for money damages docketed against us or such guarantor if, in either case, after final judgment, the judgment is unsatisfied. |
If a court were to find that the issuance of the notes or the incurrence of the guarantee was a fraudulent transfer or conveyance, the court could void the payment obligations under the notes or such guarantee or further subordinate the notes or such guarantee to presently existing and future indebtedness of ours or of the related guarantor, or require the holders of the notes to repay any amounts received with respect to such guarantee. In the event of a finding that a fraudulent transfer or conveyance occurred, you may not receive any repayment on the notes. Further, the voidance of the notes or the guarantees could result in an event of default with respect to our and our subsidiaries’ other indebtedness that could result in acceleration of such indebtedness.
As a general matter, value is given for a transfer or an obligation if, in exchange for the transfer or obligation, property is transferred or an antecedent debt is secured or satisfied. A debtor will generally not be considered to have received value in connection with a debt offering if the debtor uses the proceeds of that offering to make a dividend payment or otherwise retire or redeem equity securities issued by the debtor. We cannot be certain as to the standards a court would use to determine whether or not we or the guarantors were solvent at the relevant time or, regardless of the standard that a court uses, that the issuance of the guarantees would not be further subordinated to our or any of our guarantors’ other debt.
You may not be able to sell the notes readily or at all or at or above the price that you paid.
We do not intend to apply for the notes to be listed on any securities exchange or to arrange for quotation on any automated dealer quotation system. The initial purchasers have advised us that they intend to make a market in the notes, but they are not obligated to do so and may discontinue any market making in the notes at any time, in their sole discretion. You may not be able to sell your notes at a particular time or at favorable prices. As a result, we cannot assure you as to the liquidity of any trading market for the notes. Accordingly, you may be required to bear the financial risk of your investment in the notes indefinitely. Future trading prices of the notes may be volatile and will depend on many factors, including:
| | • | | our operating performance and financial condition; |
| | • | | the interest of securities dealers in making a market for them; |
| | • | | prevailing interest rates; and |
| | • | | the market for similar securities. |
In addition, the market for non-investment grade debt historically has been subject to disruptions that have caused substantial volatility in the prices of securities similar to the notes. The market for the notes may be subject to similar disruptions that could adversely affect their value.
You may not be able to determine when a change of control has occurred and may not be able to require us to purchase notes as a result of a change in the composition of the directors on our board.
The definition of change of control includes a phrase relating to the sale, lease or transfer of “all or substantially all” of our assets. See “Description of Notes—Repurchase at the Option of Holders—Change of Control.” There is no precisely established definition of the phrase “substantially all” under applicable law. Accordingly, your ability to require us to repurchase your notes as a result of a sale, lease or transfer of less than all of our assets to another individual, group or entity may be uncertain.
9
In addition, a Delaware Chancery Court decision found that incumbent directors are permitted to approve as a continuing director any person, including one nominated by a dissident stockholder and not recommended by the board, as long as the approval is granted in good faith and in accordance with the board’s fiduciary duties. Accordingly if a court were to similarly rule with respect to our notes, you may not be able to require us to purchase your notes as a result of a change in the composition of the directors on our board unless a court were to find that such approval was not granted in good faith or violated the board’s fiduciary duties. The court also observed that certain provisions in indentures, such as continuing director provisions, could function to entrench an incumbent board of directors and could raise enforcement concerns if adopted in violation of a board’s fiduciary duties. If such a provision were found unenforceable, you would not be able to require us to purchase your notes upon a change of control resulting from a change in the composition of our board.
We may not have the ability to raise the funds necessary to finance the change of control offer required by the indenture governing the notes.
Upon the occurrence of a “change of control,” as defined in the indenture governing the notes, we must offer to buy back the notes at a price equal to 101% of the principal amount, together with any accrued and unpaid interest, if any, to the date of the repurchase. Our failure to purchase, or give notice of purchase of, the notes would be a default under the indenture governing the notes. See “Description of Notes—Repurchase at the Option of Holders—Change of Control.”
If a change of control occurs, it is possible that we may not have sufficient assets at the time of the change of control to make the required repurchase of notes or to satisfy all obligations under the Term Loan Facility, the ABL Facility and the indenture governing the notes. In order to satisfy our obligations, we could seek to refinance any or all of our outstanding indebtedness or seek to obtain a waiver from the lenders under the Term Loan Facility or the ABL Facility or the holders of the notes. We cannot assure you that we would be able to obtain a waiver or refinance our indebtedness on terms acceptable to us, if at all.
Volatility in the market price and trading volume of our common stock could adversely impact the trading price of the notes.
The stock market in recent years has experienced significant price and volume fluctuations that have often been unrelated to the operating performance of companies. The market price of our common stock could fluctuate significantly for many reasons, including in response to the risks described in this section, elsewhere in this offering circular or the documents we have incorporated by reference in this offering circular or for reasons unrelated to our operations, such as reports by industry analysts, investor perceptions or negative announcements by our customers, competitors or suppliers regarding their own performance, as well as industry conditions and general financial, economic and political instability. A decrease in the market price of our common stock would likely adversely impact the trading price of the notes.
Any adverse rating of the notes may negatively affect the trading price and liquidity of the notes.
A rating agency’s rating of the notes is not a recommendation to purchase, sell or hold any particular security, including the notes. Such ratings are limited in scope, and do not comment as to material risks relating to an investment in the notes. If one or more rating agencies were to lower its rating of the notes below the rating initially assigned to the notes or otherwise announce its intention to put the notes on credit watch, the trading price or liquidity of the notes could decline.
We have not registered, and will not register, the offer or sale of the notes, which will limit your ability to resell them.
The offer and sale of the notes have not been, and will not be, registered under the Securities Act or any state securities laws. Unless the offer and sale of the notes have been registered, they may not be transferred or resold except in a transaction exempt from or not subject to the registration requirements of the Securities Act and applicable state securities laws. We do not intend to file a registration statement for the resale of the notes.
10
Under Rule 144 under the Securities Act (“Rule 144”) as currently in effect, a person who acquired the notes from us or our affiliate and who has beneficially owned the notes for at least one year is entitled to sell such notes without registration, but only if such person is not our affiliate at the time of, or at any time during three months preceding, the sale. Furthermore, under Rule 144, a person who acquired the notes from us or our affiliate and who has beneficially owned the notes for at least six months is entitled to sell such notes without registration, so long as (i) such person is not our affiliate at the time of, or at any time during three months preceding, the sale and (ii) we have filed all required reports under Section 13 or 15(d) of the Exchange Act, as applicable, during the twelve months preceding such sale (other than current reports on Form 8-K). If we are not current in filing our Exchange Act reports, a person who acquires from us or our affiliate notes could be required to hold such notes for up to one year following such acquisition. If we are not current in filing our Exchange Act reports, a person who is our affiliate and who owns notes could be required to hold such notes indefinitely. As a result of the foregoing, your ability to resell in the public market the notes may be limited, which may adversely affect the size of the market for the notes and pricing on resales. See “Transfer Restrictions.”
The notes may be issued with OID for U.S. federal income tax purposes.
The notes will be treated as issued with original issue discount (“OID”) for U.S. federal income tax purposes if the difference between the principal amount of the notes and their issue price is equal to or greater than a specified de minimis amount. If the notes are issued with OID, a U.S. holder (as defined in “Certain U.S. Federal Income Tax Consequences”) will be required to include such OID in gross income (as ordinary income) on a constant yield to maturity basis in advance of the receipt of cash payment thereof, regardless of such holder’s method of accounting for U.S. federal income tax purposes. See “Certain U.S. Federal Income Tax Consequences.”
Additionally, a bankruptcy court may not allow a claim for all or a portion of any unamortized amount of the OID on the notes.
The lenders under the New Senior Secured Credit Facilities will have the discretion to release the guarantors under the New Senior Secured Credit Facilities in a variety of circumstances, which will cause those guarantors to be released from their guarantees of the notes.
While any obligations under the New Senior Secured Credit Facilities remain outstanding, any guarantee of the notes may be released without action by, or consent of, any holder of the notes or the trustee, at the discretion of lenders under the New Senior Secured Credit Facilities, if such guarantor is no longer a guarantor of obligations under the new Senior Secured Credit Facilities or any capital markets indebtedness above a certain threshold. See “Description of Notes—Guarantees.” The lenders under the New Senior Secured Credit Facilities will have the discretion to release the guarantees under the New Senior Secured Credit Facilities in a variety of circumstances. You will not have a claim as a creditor against any subsidiary that is no longer a guarantor of the notes, and the indebtedness and other liabilities, including trade payables, whether secured or unsecured, of those subsidiaries will effectively be senior to claims of noteholders.
Risk Factors Related to the Pending Arizona Chemical Acquisition
Failure to successfully integrate Arizona Chemical in the expected time frame following completion of the pending Arizona Chemical Acquisition may adversely affect the future results of the combined organization, and, consequently, the value of the notes.
The success of the pending Arizona Chemical Acquisition will depend substantially on our ability to realize the anticipated benefits and synergies from combining our business with Arizona Chemical’s business. To realize these anticipated benefits, the businesses must be successfully integrated and combined, and we will incur substantial costs to do so. We currently estimate the cost to achieve expected annual synergies of approximately $65.0 million (expected to be fully realized by 2018) to be approximately $50.5 million over the three-year period following closing of the Arizona Chemical Acquisition and in addition, expect to incur transaction-related
11
costs associated with completing the acquisition and integrating the businesses. The combined organization may not be able to achieve its objectives or expected synergies for a number of reasons, including, but not limited to, the following: (i) we may fail to integrate the Arizona Chemical business with our existing business into a cohesive, efficient enterprise; (ii) our resources, including management resources, are limited and may be strained, and the Arizona Chemical Acquisition may divert our management’s attention from initiating or carrying out programs to save costs or enhance revenues; (iii) our failure to retain key employees and contracts of Arizona Chemical; (iv) we may fail to identify operating problems or liabilities prior to closing of the Arizona Chemical Acquisition; and (v) we may not be able to implement the requirements of Section 404 of the Sarbanes-Oxley Act of 2002 in a timely manner. In addition, costs to achieve anticipated synergies and benefits may exceed our estimates, and the actual integration may result in additional and unforeseen expenses, which could reduce the anticipated benefits of the pending Arizona Chemical Acquisition. These unrealized benefits and difficulties could result in declines in the value of the notes.
We may be unable to realize the anticipated cost synergies or may incur additional and/or unexpected costs in order to realize them.
There can be no assurance that we will be able to realize the anticipated cost synergies from the pending Arizona Chemical Acquisition in the anticipated amounts or within the anticipated timeframes or costs expectations, or at all. We plan to implement a series of cost savings initiatives at the combined company that, as described above under “Summary—Our Pending Acquisition of Arizona Chemical” and “Summary—Summary Consolidated Historical and Pro Forma Financial Data—Kraton,” we expect to result in annual cost synergies. We expect to incur one-time, non-recurring costs to achieve such cost synergies. These or any other costs or synergies that we realize may differ materially from our estimates. We cannot provide assurances that these anticipated cost synergies will be achieved or that our programs and improvements will be completed as anticipated or at all. In addition, any cost synergies that we realize may be offset, in whole or in part, by reductions in revenues or through increases in other expenses.
Neither our independent registered public accounting firm nor any other independent auditors, have examined, compiled or performed any procedures with respect to these cost synergies, nor have they expressed any opinion, or any other form of assurance on such information or their achievability. Assumptions relating to these cost synergies involve subjective decisions and judgments. Although our management believes these estimates and assumptions to be reasonable, any of the assumptions could be inaccurate and, therefore, there can be no assurance that the Adjusted EBITDA metric described herein will prove to be accurate or that the objectives and plans expressed will be achieved. The internal financial projections used to calculate anticipated cost synergies also do not take into account any circumstances or events occurring after the date on which they were prepared. These internal financial projections reflect assumptions as to certain business decisions that are subject to change. As a result, actual results may differ materially from those contained in these internal financial projections.
Accordingly, there can be no assurance that the internal financial projections and the related anticipated cost synergies will be realized or that actual results will not be significantly higher or lower than projected. We undertake no obligation to update or otherwise revise or reconcile these internal financial projections and the related anticipated cost synergies whether as a result of new information, future events or otherwise.
Failure to complete the pending Arizona Chemical Acquisition, or significant delays in completing the Arizona Chemical Acquisition, could negatively affect our future business and financial results.
If the Arizona Chemical Acquisition is not completed, or if there are significant delays in completing the Arizona Chemical Acquisition, our future business and financial results could be negatively affected, and we will be subject to several risks, including the following:
| | • | | the parties may be liable for damages to one another under the terms and conditions of the Acquisition Agreement; |
| | • | | negative reactions from the financial markets; |
12
| | • | | having to pay certain significant costs relating to the Arizona Chemical Acquisition; and |
| | • | | the attention of our management will have been diverted to the Arizona Chemical Acquisition rather than to our current operations and pursuit of other opportunities that could have been beneficial to us. |
The pro forma financial information in this offering circular may not be reflective of our operating results and financial condition following the Transactions.
The pro forma financial information included in this offering circular is derived from the Arizona Chemical Audited Financial Statements, the Arizona Chemical Interim Financial Statements, the Kraton Audited Financial Statements and the Kraton Interim Financial Statements. We prepared the pro forma information based upon available information and assumptions and estimates that we believe are reasonable. This pro forma information may not necessarily reflect what our results of operations and financial position would have been had the Transactions occurred during the periods presented or what our results of operations and financial position will be in the future. For example, the merger, financing, integration, restructuring and transaction costs related to the pending Arizona Chemical Acquisition could be higher or lower than currently estimated. In addition, our customers may not buy products or services from us following completion of the Transactions in the expected amounts or at all, and as a result, our revenue could materially decline or any anticipated increases in our revenue could be lower than expected.
Risk Factors Related to the Combined Business
LyondellBasell Industries provides significant operating and other services under agreements that are important to our business. The failure of LyondellBasell to perform its obligations, or the termination of these agreements, could adversely affect our operations.
We have operating and service agreements with LyondellBasell Industries, or LyondellBasell, that are important to our business. We are a party to:
| | • | | Operating agreements under which LyondellBasell (in Berre, France and Wesseling, Germany) operates and maintains our European manufacturing facilities and employs and provides substantially all of the staff for those facilities; these operating agreements also provide for site services, utilities, materials and facilities, which had previously been under separate agreements; and |
| | • | | Lease agreements under which we lease our European manufacturing sites (a 96 kiloton capacity facility in Wesseling, Germany and a 85 kiloton capacity facility in Berre, France) from LyondellBasell. |
Under the terms of the above agreements, either party is permitted to terminate the applicable agreement in a variety of situations. The operating agreement relating to the Berre facility is terminable by either party upon 18 months’ written notice. As of November 30, 2015, no such notice has been given by either party. Should LyondellBasell fail to provide these services or should any operating agreement be terminated, we would be forced to obtain these services from third parties or provide them ourselves. Similarly, if in connection with or independent from the termination of an operating agreement, LyondellBasell terminates a facility lease, we would be forced to relocate our manufacturing facility. The failure of LyondellBasell to perform its obligations under, or the termination of, any of these agreements could materially adversely affect our operations and, depending on market conditions at the time of any such termination, we may not be able to enter into substitute arrangements in a timely manner, if at all, and if we are able to enter into a substitute arrangement, it may not be on terms as favorable to us.
Conditions in the global economy and capital markets may adversely affect our results of operations, financial condition and cash flows.
Our products are sold in markets that are sensitive to changes in general economic conditions, such as automotive, construction and consumer products. Downturns in general economic conditions can cause
13
fluctuations in demand for our products, product prices, sales volumes and margins. A decline in the demand for our products or a shift to lower-margin products due to deteriorating economic conditions could adversely affect sales of our products and our profitability and could also result in impairments of certain of our assets.
Our business and operating results have been affected by fluctuating commodity prices, volatile exchange rates and other challenges currently affecting the global economy and our customers. Uncertainty regarding global economic conditions poses a continuing risk to our business, as consumers and businesses may postpone spending in response to tighter credit, negative financial news or declines in income or asset values, which may reduce demand for our products. If global economic and market conditions, or economic conditions in key markets, remain uncertain or deteriorate further, our results of operations, financial condition and cash flows could be materially adversely affected.
The failure of our raw materials suppliers to perform their obligations under long-term supply agreements, or our inability to replace or renew these agreements when they expire, could increase our cost for these materials, interrupt production or otherwise adversely affect our results of operations.
Our manufacturing processes use the following primary raw materials: butadiene, styrene and isoprene, and after the consummation of the pending Arizona Chemical Acquisition, CTO, including black liquor soap which Arizona Chemical refines into CTO. We have entered into long-term supply agreements with Shell Chemicals, LyondellBasell, International Paper (with respect to CTO) and others to supply our raw material needs in the United States and Europe.
In addition, many of our long-term contracts contain provisions that allow our suppliers to limit, or allocate, the amount of raw materials shipped to us below the contracted amount in certain circumstances. If we are required to obtain alternate sources for raw materials because a supplier is unwilling or unable to perform under raw material supply agreements, if a supplier terminates its agreements with us, if we are unable to renew our existing contract, or if we are unable to obtain new long-term supply agreements to meet changing demand, we may not be able to obtain these raw materials in sufficient quantities or in a timely manner, and we may not be able to enter into long-term supply agreements on terms as favorable to us, if at all. A lack of availability of raw materials could have a material adverse effect on our results of operations, financial condition and cash flows.
If the availability of isoprene is limited, we may be unable to produce some of our products in quantities or on economic terms sought by our customers, which could have an adverse effect on our sales of products requiring isoprene.
Isoprene is not widely available, and the few isoprene producers tend to use their production for captive manufacturing purposes or to sell only limited quantities into the world chemicals market. As a result, there is limited non-captive isoprene available for purchase in the markets in which we operate.
Currently, we source our isoprene requirements for the United States and Europe from a portfolio of suppliers. In Japan, we obtain the majority of our isoprene requirements from our joint venture partner, and from alternative suppliers as needed. In Brazil, isoprene is primarily obtained from a local third party supplier. These suppliers may not be able to meet our isoprene requirements, and we may not be able to obtain isoprene in quantities required for our operations on terms favorable to us, or at all. A lack of availability of isoprene in the quantities we require to produce products containing isoprene could have a material adverse effect on our results of operations, financial condition and cash flows.
Because there is limited non-captive isoprene availability, the market for isoprene is thin and prices are particularly volatile. Prices for isoprene are impacted by the supply and prices of natural and synthetic rubber, prevailing energy prices and the existing supply and demand of isoprene in the market. In the past, tight supply in the isoprene market has been exacerbated by operational problems of some key producers and reduced availability of crude C5 inputs for the extraction units. More recently, the trend toward lighter ethylene cracker
14
feed slates has reduced the supply of crude C5 in the United States. This decrease has been replaced by imports of crude C5 and/or isoprene. Significant increases in the cost of isoprene could have a material adverse impact on our results of operations, financial condition and cash flows.
If the availability of butadiene is limited, we may be unable to produce some of our products in quantities or on economic terms sought by our customers, which could have an adverse effect on our sales of products requiring butadiene.
The North American market is structurally short of butadiene and has relied on imports of crude C4 and/or butadiene to balance demand. With the trend toward lighter ethylene cracker feed slates in the United States, there has been a reduction in the supply of crude C4. The North American market has been supplemented by imports of crude C4 and butadiene. Historically, the European market has been better balanced and provided exports to North America. Currently, our butadiene requirements in the United States are satisfied by several suppliers, and LyondellBasell is our major butadiene supplier in Europe. In general, the quantity of butadiene available in any one region is dependent on the cracking inputs of olefins plants, ethylene demand, inter-regional demand for butadiene and demand for other oil derivatives. Suppliers may not be able to meet our butadiene requirements, and we may not be able to obtain substitute supplies of butadiene from alternative suppliers in a timely manner or on favorable terms. A lack of availability of butadiene in the quantities we require to produce products containing butadiene could have a material adverse effect on our results of operations, financial condition and cash flows.
If the availability of styrene is limited, we may be unable to produce some of our products in quantities or on economic terms sought by our customers, which could have an adverse effect on facility utilization and our sales of products requiring styrene.
We satisfy our styrene requirements in the United States and Europe pursuant to purchase agreements with terms of one to two years, subject to renewal conditions. We have more than one supplier in each of these regions and also generally have alternatives for either modifying the contract, supply portfolio or obtaining spot supply. As contracts expire, we cannot give assurances that we will obtain new long-term supply agreements or that the terms of any such agreements will be on terms favorable to us, and consequently our future acquisition costs for styrene may therefore increase which could have a material adverse effect on our results of operations, financial condition and cash flows.
After the consummation of the pending Arizona Chemical Acquisition, if the availability of CTO is limited, Arizona Chemical may be unable to produce some of its products in quantities or on economic terms sought by its customers, which could have an adverse effect on facility utilization and the sales of products requiring CTO.
The availability of CTO is directly linked to the production output of kraft mills using pine as their source of pulp. As a result, there is a finite global supply of CTO, with global demand for kraft board driving the global supply of CTO, rather than demand for CTO itself. Most of the CTO made available for sale by its producers in North America is covered by long-term supply agreements, further constraining availability. Arizona Chemical has a long-term supply contract with International Paper pursuant to which they sell to Arizona Chemical all of the CTO produced at their paper mills. If International Paper, or any of Arizona Chemical’s other suppliers for CTO, fail to meet their respective obligations under Arizona Chemical’s supply agreements or Arizona Chemical is otherwise unable to procure an adequate supply of CTO, Arizona Chemical would be unable to produce the quantity of products that it has historically produced. There are other pressures on the availability of CTO. Some pulp or paper mills may choose to consume their production of CTO to meet their energy needs rather than sell the CTO to third parties. Also, there are regulatory pressures that may incentivize suppliers of CTO to sell CTO into alternative fuel markets rather than to historical end users such as Arizona Chemical. Furthermore, weather conditions have in the past and may in the future affect the availability and quality of pine trees used in the kraft pulping process and therefore the availability of CTO meeting Arizona Chemical’s quality standards. A lack of
15
availability of CTO in the quantities Arizona Chemical requires to produce products containing CTO could have a material adverse effect on our results of operations, financial condition and cash flows following the consummation of the pending Arizona Chemical Acquisition.
The European Union’s Directive 2009/28 on the promotion of the use of energy from renewable resources (“Renewable Energy Directive” or “RED”) and similar legislation in the United States and elsewhere may incentivize the use of CTO as a feedstock for production of alternative fuels.
In December 2008, the European Union adopted RED, which established a 20% EU-wide target for energy consumed from renewable sources relative to the EU’s gross final consumption of energy, as well as a 10% target for energy consumed from renewable sources in the transport section. In order to reach these targets, the RED established mandatory targets for each Member State (as defined in RED) and required each Member State to adopt a national renewable energy action plan setting forth measures to achieve its national targets. RED also established sustainability criteria for biofuels, which must be satisfied in order for the consumption of a fuel to count toward a Member State’s national targets. CTO-based biofuel currently satisfies RED’s biofuel sustainability criteria. In spring 2015, the EU adopted amendments to RED, expressly listing CTO as a residue-type feedstock whose use in biofuel would make that biofuel eligible for double counting towards national targets of the Member States, and at least two Member States additionally have or plan fiscal incentives for the domestic marketing of CTO-based and other qualifying biofuels. In addition to these developments in the European Union, various pieces of legislation regarding the use of alternative fuels have been introduced in the United States. Because the supply of CTO is inherently constrained by the volume of kraft pulp processing, any diversion of CTO for production of alternative fuels would reduce the available supply of CTO as the principal raw material of the pine chemicals industry. A reduced ability to procure an adequate supply of CTO due to competing new uses such as for biofuel production, could have a material adverse effect on our results of operations, financial condition and cash flows following the consummation of the pending Arizona Chemical Acquisition.
Increases in the costs of our raw materials could have an adverse effect on our financial condition and results of operations if those costs cannot be passed on to our customers.
Our results of operations are directly affected by the cost of raw materials. Historically, we have used butadiene, styrene and isoprene as our primary raw materials in manufacturing our products. These monomers together represented approximately $297.7 million, $512.8 million, $609.5 million and $732.9 million or 47.7%, 51.6%, 57.2% and 61.5% of our total cost of goods sold for the nine months ended September 30, 2015 and the years ended December 31, 2014, 2013 and 2012, respectively. After the consummation of the pending Arizona Chemical Acquisition, CTO will become another one of our primary raw materials. CTO purchased was approximately $154.2 million, $286.2 million, $301.0 million and $311.4 million or 35.4%, 42.2%, 41.9%, and 43.0% of Arizona Chemical’s total cost of goods sold for the nine months ended September 30, 2015 and the years ended December 31, 2014, 2013 and 2012, respectively. Since the cost of these primary raw materials comprise a significant amount of the total cost of goods sold, the selling prices for our and Arizona Chemical’s products and therefore total revenue is impacted by movements in raw material costs, as well as the cost of other inputs. In the past we have experienced erratic and significant changes in the costs of these raw materials, the cost of which has generally correlated with changes in energy prices, supply and demand factors, and prices for natural and synthetic rubber. The pricing for butadiene has historically been particularly volatile. Political unrest in the Middle East and market dislocation resulting from U.S. sanctions relating thereto could lead to increases in the price of crude oil, and, as a result, in the price of butadiene, styrene and isoprene. In addition, product mix can have an impact on our overall unit selling prices, since we provide an extensive product offering and therefore experience a wide range of unit selling prices. Because of the significant portion of our cost of goods sold represented by these raw materials, our gross profit margins could be adversely affected by changes in the cost of these raw materials if we are unable to pass the increases on to our customers.
Due to volatile raw material prices, there can be no assurance that we can continue to recover raw material costs or retain customers in the future. As a result of our pricing actions, customers may become more likely to consider competitors’ products, some of which may be available at a lower cost. Significant loss of customers could have a material adverse effect on our results of operations, financial condition and cash flows.
16
Significant fluctuations in raw material costs may result in volatility in our quarterly results of operations, financial condition and cash flows.
In periods of raw material price volatility, reported results under GAAP will differ from what the results would have been if cost of goods sold were based on ECRC. Specifically, in periods of declining raw material costs, reported gross profit will be lower under GAAP than under ECRC, and in periods of rising raw material costs, gross profit will be higher under GAAP than under ECRC. However, because raw material costs are difficult to predict, we cannot accurately anticipate fluctuations in raw material costs with precision, or effectively or economically hedge against the effects of any such change. If raw material costs fluctuate in a quarter, our results of operations, financial condition and cash flows will be affected, the magnitude of which could be significant.
Our industry is highly competitive, and we compete with producers of SBCs, and after the consummation of the pending Arizona Chemical Acquisition, value-added pine based specialty chemicals, or to producers of other products that can be substituted for our products.
Our industry is highly competitive, and we face significant competition from both large international producers and from smaller regional competitors. Our competitors may improve their competitive position in our core markets by successfully introducing new products, improving their manufacturing processes, or expanding their capacity or manufacturing facilities. Further, some of our competitors benefit from advantageous cost positions that could make it increasingly difficult for us to compete in markets for less-differentiated applications. If we are unable to keep pace with our competitors’ product and manufacturing process innovations or cost position, our financial condition, results of operations and cash flows could be materially adversely affected.
In addition, competition in the various product applications in which we compete is intense. Increased competition from existing or newly developed SBCs, value-added specialty chemicals or non-SBC products may reduce demand for our products in the future and our customers may decide on alternate sources to meet their requirements. If we are unable to successfully compete with other producers of SBCs, and following the consummation of the Arizona Chemical Acquisition, refiners of CTO, or if other products can be successfully substituted for our products, our sales may decline. In particular, hydrocarbon and gum-based resins compete with tall oil-based resins in the adhesives and inks markets, and animal and vegetable-based fatty acids compete with TOFA. Arizona Chemical has in certain cases been subject to pricing pressure from Chinese manufacturers of gum rosins, and hydrocarbon competitors have introduced metallocene-based products that compete directly with many of Arizona Chemical’s adhesive tackifiers.
If we are not able to continue the technological innovation and successful commercial introduction of new products, our customers may turn to other producers to meet their requirements which could have a material adverse effect on our financial condition, results of operations and cash flows.
Our industry and the markets into which we sell our products experience periodic technological change and ongoing product improvements. In addition, our customers may introduce new generations of their own products or require new technological and increased performance specifications that would require us to develop customized products. Innovation or other changes in our customers’ product performance requirements may also adversely affect the demand for our products. Our future growth and profitability will depend on our ability to gauge the direction of the commercial and technological progress in all key markets, and upon our ability to successfully develop, manufacture and sell products in such changing markets. In order to maintain our profit margins and our competitive position, we must continue to identify, develop and market innovative products on a timely basis to replace existing products. We may not be successful in developing new products and technology that successfully compete with newly introduced products and materials, and our customers may not accept, or may have lower demand for, any of our new products. Further, an important part of our strategy is the creation of demand for innovations that we develop and introduce to the markets. If we fail to keep pace with evolving
17
technological innovations, fail to modify our products in response to our customers’ needs or fail to develop innovations that generate additional demand, then our business, financial condition and results of operations could be adversely affected as a result of reduced sales of our products or diminished return on investment in innovations.
Our business relies on intellectual property and other proprietary information, and our failure to protect our rights could harm our competitive advantages with respect to the manufacturing of some of our products.
Our success depends, to a significant degree, upon our ability to protect and preserve our intellectual property and other proprietary information relating to our business. However, we may be unable to prevent third parties from using our intellectual property and other proprietary information without our authorization or from independently developing intellectual property and other proprietary information that is similar to ours, particularly in those countries where the laws do not protect our proprietary rights to the same degree as in the United States. The use of our intellectual property and other proprietary information by others could reduce or eliminate any competitive advantage we have developed, potentially causing us to lose sales or otherwise harm our business. If it becomes necessary for us to litigate to protect these rights, any proceedings could be burdensome and costly, and we may not prevail.
In addition, we acquired a significant number of patents from Shell Chemicals. According to the agreements with Shell Chemicals relating to their contribution of these patents to us and our ownership of these patents, Shell Chemicals retained for itself fully-transferable and exclusive licenses to their use outside of the elastomers business, as well as fully-transferable non-exclusive licenses within the field of elastomers for certain limited uses in non-competing activities. Shell Chemicals is permitted to sublicense these rights. Shell Chemicals also retains the right to enforce these patents outside the elastomers field and recover any damages resulting from these actions.
Our patent applications and issued patents may not provide us with any competitive advantage and may be challenged by third parties. Our competitors may also attempt to design around our patents or copy or otherwise obtain and use our intellectual property and other proprietary information. Moreover, our competitors may already hold or have applied for patents in the United States or abroad that, if enforced or issued, could possibly prevail over our patent rights or otherwise limit our ability to manufacture or sell one or more of our products in the United States or abroad. With respect to our pending patent applications, we may not be successful in securing patents for these claims. Our failure to secure these patents may limit our ability to protect inventions that these applications were intended to cover. In addition, the expiration of a patent can result in increased competition with consequent erosion of profit margins.
It is our policy to enter into confidentiality agreements with our employees and third parties to protect our unpatented proprietary manufacturing expertise, continuing technological innovation and other trade secrets, but our confidentiality agreements could be breached or may not provide meaningful protection for our trade secrets or proprietary manufacturing expertise. Adequate remedies may not be available in the event of an unauthorized use or disclosure of our trade secrets and manufacturing expertise. Violations by others of our confidentiality agreements and the loss of employees who have specialized knowledge and expertise could harm our competitive position and cause our sales and operating results to decline as a result of increased competition. In addition, others may obtain knowledge of our trade secrets through independent development or other access by legal means.
The applicable governmental authorities may not approve our pending service mark and trademark applications. A failure to obtain trademark registrations in the United States and in other countries could limit our ability to obtain and retain our trademarks and impede our marketing efforts in those jurisdictions. Moreover, third parties may seek to oppose our applications or otherwise challenge the resulting registrations. In the event that our trademarks are successfully challenged, we could be forced to rebrand our products, which could result in loss of brand recognition and could require us to devote resources to advertising and marketing new brands.
18
The failure of our patents, trademarks or confidentiality agreements to protect our intellectual property and other proprietary information, including our processes, apparatuses, technology, trade secrets, trade names and proprietary manufacturing expertise, methods and compounds, could have a material adverse effect on our competitive advantages over other producers.
Our products may infringe on the intellectual property rights of others, which may cause us to incur unexpected costs or prevent us from selling our products.
Many of our competitors have a substantial amount of intellectual property. We cannot guarantee that our processes and products do not and will not infringe issued patents (whether present or future) or other intellectual property rights belonging to others, including, without limitation, situations in which our products, processes or technologies may be covered by patent applications filed by other parties in the United States or abroad.
From time to time, we oppose patent applications that we consider overbroad or otherwise invalid in order to maintain the necessary freedom to operate fully in our various business lines without the risk of being sued for patent infringement. If, however, patents are subsequently issued on any such applications by other parties, or if patents belonging to others already exist that cover our products, processes or technologies, we could be liable for infringement or have to take other remedial or curative actions to continue our manufacturing and sales activities with respect to one or more products.
We may also be subject to legal proceedings and claims in the ordinary course of our business, including claims of alleged infringement of the patents, trademarks and other intellectual property rights of third parties by us or our licensees in connection with their use of our products. Intellectual property litigation is expensive and time-consuming, regardless of the merits of any claim, and could divert our management’s attention from operating our business.
If we were to discover that our processes, technologies or products infringe the valid intellectual property rights of others, we might need to obtain licenses from these parties or substantially re-engineer our products in order to avoid infringement. We may not be able to obtain the necessary licenses on acceptable terms, or at all, or be able to re-engineer our products successfully. Moreover, if we are sued for infringement and lose, we could be required to pay substantial damages and/or be enjoined from using or selling the infringing products or technology. If we incur significant costs to litigate our intellectual property rights or to obtain licenses, or if our inability to obtain required licenses for our processes, technologies or products prevents us from selling our products, our business and results of operations could be materially adversely affected.
A major failure of our information systems could harm our business.
We depend on integrated information systems to conduct our business. We may experience operating problems with our information systems as a result of system failures, viruses, computer “hackers” or other causes. If our systems for protecting against these risks prove not to be sufficient, we could be adversely affected by, among other things, loss or damage of intellectual property, proprietary information, or customer data, having our business operations interrupted, and increased costs to prevent, respond to, or mitigate attacks on our systems. Any significant disruption or slowdown of our systems could cause customers to cancel orders or cause standard business processes to become inefficient or ineffective, which could adversely affect our financial position, results of operations or cash flows.
Our business is subject to seasonality that may affect our quarterly operating results and impact the market price of our common stock.
Seasonal changes and weather conditions typically affect our sales for paving and roofing applications, including roadmarkings, and following the consummation of the pending Arizona Chemical Acquisition, will affect the ink end-use market. For example, the demand for ink products is typically highest in the third quarter of the year due to increased demand for holiday catalog printing. Additionally, sales volumes for paving products
19
generally rise in the warmer months and generally decline during the colder months of fall and winter, or during abnormally wet seasons. Roofing product sales volumes tend to be more consistent throughout the year. In addition, yields of CTO are higher during the first half off the year due to the natural growth and associated chemical yield cycles of trees in addition to higher yields from kraft pulping during the cooler months. However, because seasonal weather patterns are difficult to predict, we cannot accurately estimate fluctuations in our quarterly paving and roofing sales in any given year or following the consummation of the pending Arizona Chemical Acquisition, in our sales to the ink end-use market or the available yield of CTO.
Chemical manufacturing is inherently hazardous, which could result in accidents that disrupt our operations or expose us to significant losses or liabilities.
Hazards associated with chemical manufacturing and the related storage and transportation of raw materials, products and wastes exist in our operations and the operations of other occupants with whom we share manufacturing sites. These hazards could lead to an interruption or suspension of operations and have an adverse effect on the productivity and profitability of a particular manufacturing facility or on us as a whole. These potential risks include, but are not necessarily limited to:
| | • | | pipeline and storage tank leaks and ruptures; |
| | • | | inclement weather and natural disasters; |
| | • | | mechanical failure; and |
| | • | | chemical spills and other discharges or releases of toxic or hazardous substances or gases. |
These hazards may result in personal injury and loss of life, damage to property and contamination of the environment, which may result in a suspension of operations and the imposition of civil or criminal penalties, including governmental fines, expenses for remediation and claims brought by governmental entities or third parties. The loss or shutdown of operations over an extended period at any of our major operating facilities could have a material adverse effect on our financial condition and results of operations. Our property, business interruption and casualty insurance may not fully insure us against all potential hazards incidental to our business.
We may be liable for damages based on product liability claims brought against our customers.
Many of our products provide critical performance attributes to our customers’ products that are sold to consumers who could potentially bring product liability suits in which we could be named as a defendant. For example, following the consummation of the pending Arizona Chemical Acquisition, some of the chemicals or substances that are used in our businesses, including alkyl phenols such as bisphenol A and nonylphenol, and flammable solvents such as toluene, xylene and alcohols, as well as rosin, formaldehyde and resin dust, have been identified as having potentially harmful health effects. The sale of these products entails the risk of product liability claims. If a person were to bring a product liability suit against one of our customers, the customer may attempt to seek contribution from us. A person may also bring a product liability claim directly against us. A successful product liability claim or series of claims against us in excess of our insurance coverage, for which we are not otherwise indemnified, could have a material adverse effect on our financial condition or results of operations. There can be no assurance that our efforts to protect ourselves from product liability claims in this regard will ultimately protect us from any such claims.
As a global business, we are exposed to local business risks in different countries, which could have a material adverse effect on our financial condition or results of operations.
We have significant operations in foreign countries, including manufacturing facilities, research and development facilities, sales personnel and customer support operations. Currently, we operate, or others operate on our behalf, facilities in Brazil, Germany, France and Japan, in addition to our operations in the United States.
20
Following the consummation of the pending Arizona Chemical Acquisition, we will also operate facilities in Finland and Sweden. Furthermore, we are a 50/50 joint venture partner with FPCC to build, own and operate a 30 kiloton HSBC plant at FPCC’s petrochemical site in Mailiao, Taiwan.
Our foreign operations are subject to risks inherent in doing business in foreign countries, including, but not necessarily limited to:
| | • | | new and different legal and regulatory requirements in local jurisdictions; |
| | • | | export duties or import quotas; |
| | • | | domestic and foreign customs and tariffs or other trade barriers; |
| | • | | potential staffing difficulties and labor disputes; |
| | • | | risk of non-compliance with the United States Foreign Corrupt Practices Act or similar anti-bribery legislation in other countries by agents or other third-party representatives; |
| | • | | managing and obtaining support and distribution for local operations; |
| | • | | increased costs of transportation or shipping; |
| | • | | credit risk and financial conditions of local customers and distributors; |
| | • | | potential difficulties in protecting intellectual property; |
| | • | | risk of nationalization of private enterprises by foreign governments; |
| | • | | potential imposition of restrictions on investments; |
| | • | | potentially adverse tax consequences, including imposition or increase of withholding and other taxes on remittances and other payments by subsidiaries; |
| | • | | foreign currency exchange restrictions and fluctuations; |
| | • | | local political and social conditions, including the possibility of hyperinflationary conditions and political instability in certain countries; and |
| | • | | civil unrest, including labor unrest, in response to local political conditions. |
We may not be successful in developing and implementing policies and strategies to address the foregoing risks in a timely and effective manner at each location where we do business. Consequently, the occurrence of one or more of the foregoing risks could have a material adverse effect on our international operations or upon our financial condition and results of operations.
Compliance with extensive environmental, health and safety laws could require material expenditures, changes in our operations or site remediation.
The manufacturing of our products, can represent potentially significant health and safety concerns. Our products are also used in a variety of applications that have specific regulatory requirements such as those relating to products that have contact with food or are used for medical applications.
We use large quantities of hazardous substances and generate hazardous wastes in our manufacturing operations. Consequently, our operations are subject to extensive environmental, health and safety laws and regulations at the international, national, state and local level in multiple jurisdictions. These laws and regulations govern, among other things, air emissions, wastewater discharges, solid and hazardous waste management, site remediation programs and chemical use and management. Many of these laws and regulations have become more stringent over time and the costs of compliance with these requirements may increase, including costs associated with any necessary capital investments. In addition, our production facilities require operating permits that are
21
subject to renewal and, in some circumstances, revocation. The necessary permits may not be issued or continue in effect, and renewals of any issued permits may contain significant new requirements or restrictions. The nature of the chemical industry exposes us to risks of liability due to the use, production, management, storage, transportation and sale of materials that are heavily regulated or hazardous and can cause contamination or personal injury or damage if released into the environment.
Because of the nature of our operations, we could be subject to legislation and regulation affecting the emission of greenhouse gases. In the last five years, the U.S. Environmental Protection Agency (“EPA”) promulgated regulations applicable to projects involving greenhouse gas emissions above a certain threshold, and the U.S. and certain states within the U.S. have enacted, or are considering, limitations on greenhouse gas emissions.
Jurisdictions outside the U.S. are also addressing greenhouse gases by legislation or regulation. In addition, efforts have been made and continue to be made at the international level toward the adoption of international treaties or protocols that would address global greenhouse gas emissions. These requirements to limit greenhouse gas emissions may require us to incur capital investments to upgrade our operations to comply with any future greenhouse gas emissions controls. While the impact of any such legislation, regulation, treaties or protocols is currently speculative, any such legislation, regulation, treaties or protocols, if enacted, may have an adverse effect on our operations or financial condition. Further, some scientific studies on the effect of the emission of greenhouse gases on climate suggest that adverse weather events may become stronger or more frequent in the future in certain of the areas in which we operate, although the scientific studies are not unanimous. Due to their location, some of our operations may be vulnerable to operational and structural damages resulting from hurricanes and other severe weather systems. Our insurance may not cover all associated losses. We are taking steps to mitigate physical risks from storms, but no assurance can be given that future storms will not have a material adverse effect on our business.
Compliance with environmental laws and regulations generally increases the costs of transportation and storage of raw materials and finished products, as well as the costs of storage and disposal of wastes. We may incur substantial costs, including fines, damages, criminal or civil sanctions and remediation costs, or experience interruptions in our operations for violations arising under environmental laws, regulations or permit requirements.
Regulation of our employees’ exposure to certain chemicals could require material expenditures or changes in our operations.
The Occupational Safety and Health Administration (“OSHA”) in the United States and the Registration, Evaluation and Authorization of Chemicals (“REACH”), directive in Europe, prescribe limits restricting exposure to a number of chemicals used in our operations, including butadiene, and following the consummation of the pending Arizona Chemical Acquisition, formaldehyde and nonylphenol, a raw material used in the manufacture of phenolic ink resins. Butadiene is a known carcinogen in laboratory animals at high doses and is being studied for its potential adverse health effects. Future studies on the health effects of these, and other, chemicals may result in additional regulations or new regulations that further restrict or prohibit the use of, and exposure to, such chemicals. Additional regulation of or requirements for these and other chemicals could require us to change our operations, and these changes could affect the quality of our products and materially increase our costs.
We may be subject to losses due to lawsuits arising out of environmental damage or personal injuries associated with chemical manufacturing.
We face the risk that individuals could, in the future, seek damages for personal injury due to exposure to chemicals at our facilities or to chemicals otherwise owned or controlled by us. We may be subject to future claims with respect to workplace exposure, workers’ compensation and other matters that are filed after the date of our acquisition of Shell Chemicals’ elastomers business. While Shell Chemicals has agreed to indemnify us for certain claims brought with respect to matters occurring before our separation from Shell Chemicals in
22
February 2001, those indemnity obligations are subject to limitations, and we cannot be certain that those indemnities will be sufficient to satisfy claims against us. In addition, we face the risk that future claims would fall outside of the scope of the indemnity due either to the limitations on the indemnity or to their arising from events and circumstances occurring after February 2001. Finally, under certain of the lease and operating agreements under which LyondellBasell leases and provides services to our sites in Wesseling, Germany, and Berre, France, we are required to indemnify LyondellBasell in certain circumstances, including in certain circumstances for loss and damages resulting from LyondellBasell’s negligence in performing their obligations.
Some environmental laws could impose on us the entire cost of clean-up of contamination present at a facility even though we did not cause the contamination. These laws often identify the site owner as one of the parties that can be jointly and severally liable for on-site remediation, regardless of fault or whether the original activity was legal at the time it occurred. For example, our Belpre, Ohio facility is the subject of a required remediation program to clean up past contamination at the site and at an adjacent creek and we are a party to that site clean-up order. While Shell Chemicals has posted financial assurance of $5.2 million for this program and has taken the lead in implementing the program, we may incur costs and be required to take action under this program. Similarly, the Shell Chemicals indemnity for remediation at the Belpre facility may not cover all claims that might be brought against us.
Our Paulinia, Brazil facility also has on-site contamination resulting from past operations of Shell Chemicals. Although an indemnity from Shell Chemicals covers claims related to specified areas within the facility, we may be required to undertake and pay for remediation of these and other areas. The indemnity coverage from Shell Chemicals is limited in time and amount and we cannot rely upon it to cover possible future claims for on-site contamination separate from the areas specified in the indemnity. The Paulinia facility is also adjacent to a former Shell Chemicals site where we believe past manufacturing of hydrocarbons resulted in significant contamination of soil and groundwater and required relocation of nearby residents. It is our understanding that the Shell Chemicals portion of the site has changed ownership several times, which may impact financial responsibility for contamination on the site. While we are not aware of any significant contamination at our Paulinia facility, we could potentially be the subject of claims related to pesticide contamination and effects at some point in the future.
In general, there is always the possibility that a third-party plaintiff or claimant, or governmental or regulatory authority, could seek to include us in an action or claim for damages, clean-up, or remediation pertaining to events or circumstances occurring or existing at one or more of our sites prior to the time of our ownership or occupation of the applicable site. In the event that any of these actions or claims were asserted against us, our results of operations could be adversely affected.
We may be subject to litigation arising from the termination of the Combination Agreement with the LCY Parties.
On October 6, 2014, we and two of our subsidiaries, Kraton Performance Polymers Limited and NY MergerCo, LLC, were named as defendants in a lawsuit filed by the LCY Parties in connection with the previously announced termination of the Combination Agreement, dated as of January 28, 2014, by and among us, Kraton Performance Polymers Limited, NY MergerCo, LLC and the LCY Parties (the “Combination Agreement”). The lawsuit alleged breach of contract by Kraton and sought payment of the $25 million termination fee, along with awards of unspecified compensatory, expectancy and consequential damages. The lawsuit was filed in the United States District Court for the District of Delaware. On July 23, 2015, the LCY Parties’ lawsuit was dismissed from the Delaware federal court on jurisdictional grounds. The LCY Parties have the right to re-file the suit in Delaware state court but have yet to do so. While the ultimate resolution of this lawsuit cannot be predicted with certainty, if this lawsuit is ultimately decided against us, we may be required to pay a significant amount of money to the LCY Parties.
23
We are subject to customs, international trade, export control, antitrust, zoning and occupancy and labor and employment laws that could require us to modify our current business practices and incur increased costs.
We are subject to numerous regulations, including customs and international trade laws, export control, antitrust laws and zoning and occupancy laws that regulate manufacturers generally and/or govern the importation, promotion and sale of our products, the operation of factories and warehouse facilities and our relationship with our customers, suppliers and competitors. If these regulations were to change or were violated by our management, employees, suppliers, buying agents or trading companies, the costs of certain goods could increase, or we could experience delays in shipments of our goods, be subject to fines or penalties, or suffer reputational harm, which could reduce demand for our products and hurt our business and negatively impact our results of operations. In addition, changes in federal and state minimum wage laws and other laws relating to employee benefits could cause us to incur additional wage and benefits costs, which could negatively impact our profitability.
Legal requirements are frequently changed and subject to interpretation, and we are unable to predict the ultimate cost of compliance with these requirements or their effects on our operations. We may be required to make significant expenditures or modify our business practices to comply with existing or future laws and regulations, which may increase our costs and materially limit our ability to operate our business.
Fluctuations in currency exchange rates may significantly impact our results of operations and may significantly affect the comparability of our results between financial periods.
Our operations are conducted by our subsidiaries in many countries. The results of the operations and the financial position of these subsidiaries are reported in the relevant foreign currencies and then translated into U.S. dollars at the applicable exchange rates for inclusion in our consolidated financial statements. The main currencies to which we are exposed, besides the U.S. dollar, are the Euro, Japanese Yen and Brazilian Real, and following the pending Arizona Chemical Acquisition, we will be exposed to the Swedish Krona. The exchange rates between these currencies and the U.S. dollar in recent years have fluctuated significantly and may continue to do so in the future. A depreciation of these currencies against the U.S. dollar will decrease the U.S. dollar equivalent of the amounts derived from these operations reported in our consolidated financial statements and an appreciation of these currencies will result in a corresponding increase in such amounts. Because many of our raw material costs are determined with respect to the U.S. dollar rather than these currencies, depreciation of these currencies may have an adverse effect on our profit margins or our reported results of operations. Conversely, to the extent that we are required to pay for goods or services in foreign currencies, the appreciation of such currencies against the U.S. dollar will tend to negatively impact our results of operations. In addition, currency fluctuations may affect the comparability of our results of operations between financial periods.
We incur currency transaction risk whenever we enter into either a purchase or sale transaction using a currency other than the local currency of the transacting entity. From time to time, we use hedging strategies to reduce our exposure to currency fluctuations. Given the volatility of exchange rates, there can be no assurance that we will be able to effectively manage our currency transaction risks, that our hedging activities will be effective or that any volatility in currency exchange rates will not have a material adverse effect on our financial condition or results of operations.
We may have additional tax liabilities.
We are subject to income taxes and state taxes in the U.S., as well as numerous foreign jurisdictions. Significant judgment is required in determining our worldwide provision for income taxes. In the ordinary course of our business, there are many transactions and calculations where the ultimate tax determination is uncertain. Although we believe our tax estimates are reasonable, the final determination of tax audits and any related litigation could be materially different to that which is reflected in our consolidated financial statements. Should any tax authority take issue with our estimates, our results of operations, financial position and cash flows could be adversely affected.
24
Our formation of a joint venture to expand HSBC capacity in Asia is subject to risks and uncertainties.
We are a 50/50 joint venture partner with FPCC to build, own and operate a 30 kiloton HSBC plant at FPCC’s petrochemical site in Mailiao, Taiwan. Construction of the HSBC plant is ongoing; however, the plant may not be successfully constructed and operated within our expected timeframe or budget or yield expected results. In addition, the project remains subject to numerous known and unknown contingencies, including material governmental approvals and permitting; cost and availability of raw materials, labor and financing; weather and operational delays; and economic, political and other disruptions. If any of these risks materialize, our prospects in Asia and as a result, our ability to meet demand for HSBC products could be materially adversely affected.
In January 2014, a group of local residents in Mailiao, Taiwan, sued the Taiwanese Executive Yuan (the executive branch of the Taiwanese government) to overturn an appeal decision rendered by the Executive Yuan in which it had overturned a prior ruling of the Taiwan Environmental Protection Administration. The Taiwan EPA ruling in question required the inclusion of restrictive conditions relating to FPCC’s entire petrochemical site in Mailiao, Taiwan, which is the site of our joint venture with FPCC, in the environmental permit for the construction of the HSBC plant by our joint venture company. Neither we nor our joint venture is a party to the proceedings, nor do we or our joint venture have any right under Taiwan law to join the proceedings. The court in the proceeding has issued a ruling that could reinstate the restrictive conditions in FPCC’s environmental permit. The Executive Yuan and FPCC have appealed the ruling. The ruling conflicts with the prior appeal decision of the Executive Yuan, and if the ruling is not overturned, it could adversely impact the ability of the joint venture to obtain material operating permits in the future.
Our relationship with our employees could deteriorate, which could adversely affect our operations.
As a manufacturing company, we rely on our employees and good relations with our employees to produce our products and maintain our production processes and productivity. A significant number of our and Arizona Chemical’s non-U.S. employees and approximately 47% of Arizona Chemical’s U.S. employees are unionized or subject to arrangements similar to collective bargaining arrangements. These arrangements are often subject to renewal or re-negotiation. For example, a collective bargaining agreement at Arizona Chemical’s Savannah, Georgia manufacturing facility is currently under negotiation. We may not be able to negotiate existing or future arrangements on satisfactory terms or at all, which may adversely affect our business. If these workers were to engage in a strike, work stoppage or other slowdown, our operations could be disrupted or we could experience higher labor costs, which could adversely affect our business, results of operations, cash flows and financial condition.
In addition, if our other employees were to become unionized, in particular our employees at our Belpre, Ohio facility, we could experience significant operating disruptions and higher ongoing labor costs, which could adversely affect our business and financial condition and results of operations. Because many of the personnel who operate our European facilities are employees of LyondellBasell, relations between LyondellBasell and its employees may also adversely affect our business, results of operations, cash flows and financial condition.
Loss of key personnel or our inability to attract and retain new qualified personnel could hurt our business and inhibit our ability to operate and grow successfully.
Our success in the highly competitive markets in which we operate will continue to depend to a significant extent on our key employees. We are dependent on the expertise of our executive officers. Loss of the services of any of our executive officers could have an adverse effect on our prospects. We may not be able to retain our key employees or to recruit qualified individuals to join our company. The loss of key employees could result in high transition costs and could disrupt our operations.
25
We generally do not have long-term contracts with our customers and the loss of customers could adversely affect our sales and profitability.
With some exceptions, our business is based primarily upon individual sales orders with our customers. As such, our customers could cease buying our products from us at any time, for any reason, with little or no recourse. If multiple customers elected not to purchase products from us, our business prospects, financial condition and results of operations could be adversely affected.
A decrease in the fair value of pension assets could materially increase future funding requirements of the pension plans.
We sponsor a defined benefit pension plan. The total projected benefit obligation of our defined benefit pension plan exceeded the fair value of the plan assets by approximately $54.1 million at December 31, 2014. We contributed $7.2 million to the pension plan in 2014. After the consummation of the pending Arizona Chemical Acquisition, we will maintain several additional international pension plans and an additional U.S. defined benefit pension plan. The total projected benefit obligation of Arizona Chemical’s international pension plans and U.S. pension plan exceeded the fair value of the plan assets by approximately $37.9 million and $5.2 million, respectively, at December 31, 2014. Arizona Chemical contributed $3.6 million and $1.2 million, respectively, to the international pension plans and the U.S. pension plan in 2014. Among the key assumptions inherent in the actuarially calculated pension plan obligation and pension plan expense are the discount rate and the expected rate of return on plan assets. If discount rates or actual rates of return on invested plan assets were to decrease, the pension plan obligation could increase materially. The size of future required pension contributions could result in our dedicating a substantial portion of our cash flow from operations to making the contributions, which could materially adversely affect our business, financial condition and results of operations.
26
THE TRANSACTIONS
In this offering circular, we refer to (i) the consummation of the pending Arizona Chemical Acquisition, (ii) our entry into the Term Loan Facility and the ABL Facility and the initial borrowings thereunder, (iii) the repayment of borrowings under, and the termination of, the Existing Senior Secured Credit Facilities, (iv) the Tender Offer and Consent Solicitation and the repurchase and redemption of all subsequently outstanding 6.75% Senior Notes, and (v) the consummation of this offering of notes and the use of proceeds herefrom, collectively as the “Transactions.”
Our Pending Acquisition of Arizona Chemical
On September 27, 2015, Kraton LLC, one of our wholly-owned subsidiaries, entered into the Acquisition Agreement with Arizona Chemical and Seller. Pursuant to the Acquisition Agreement, we agreed to acquire all of the outstanding capital stock of Arizona Chemical for a cash purchase price of $1,370.0 million. The purchase price, which is subject to adjustment as provided in the Acquisition Agreement, will be funded in part by a portion of the proceeds of this offering and in part by initial borrowings under the Term Loan Facility. The Arizona Chemical Acquisition is expected to close in late 2015, subject to the satisfaction or waiver of customary closing conditions.
Kraton LLC, Arizona Chemical and Seller have made customary representations and warranties to each other in the Acquisition Agreement and have agreed to certain limitations on the conduct of Arizona Chemical’s business prior to closing. All of the representations and warranties of Kraton LLC, Arizona Chemical and Seller that are included in the Acquisition Agreement terminate at the earlier of the closing of the transaction or the termination of the Acquisition Agreement. The Acquisition Agreement also contains customary covenants, including those relating to the efforts and actions necessary to obtain approval of the transaction under the Hart-Scott-Rodino Antitrust Improvements Act and other antitrust and competition laws. The parties have agreed to use their reasonable best efforts to cooperate with each other and respond to and comply promptly with any requests for information with respect to antitrust and competition laws, provided that neither party shall be obligated to divest any assets or business or terminate any contract or business relationship to obtain antitrust clearance of the transaction if such divestiture or termination would have a material impact on the business, operations or financial condition of Kraton LLC and Arizona Chemical in the aggregate.
The Acquisition Agreement contains certain customary termination rights for both Kraton LLC and Seller, including, among others, the right of either party to terminate the Acquisition Agreement if, subject to certain exceptions, the Arizona Chemical Acquisition is not consummated by February 5, 2016 (although either party may extend such end date to a date no later than March 4, 2016 if all conditions other than certain regulatory conditions have been satisfied). In the event the Acquisition Agreement is terminated by Seller because (i) we materially breached a representation, warranty or covenant or (ii) we fail to consummate the transaction when required to do so and the other parties stood ready to close, we would be obligated to pay a $75 million termination fee to Seller, plus Seller’s attorneys’ fees and interest on the termination fee in the event the obligation is litigated.
The foregoing description of the Acquisition Agreement provides only a summary of the Acquisition Agreement and the transactions contemplated thereunder, does not purport to be complete and is subject to and is qualified in its entirety by, reference to the full text of the Acquisition Agreement, a copy of which is filed as Exhibit 2.1 to our Current Report on Form 8-K filed on September 30, 2015 and incorporated by reference in this offering circular.
You should carefully review the Arizona Chemical Audited Financial Statements, the Arizona Chemical Interim Financial Statements and our unaudited pro forma condensed combined financial statements and the notes related thereto contained in this offering circular. Please also read “Risk Factors—Risk Factors Related to the Pending Arizona Chemical Acquisition.”
27
Neither the completion of this offering, nor entry into the Term Loan Facility, is a condition to the closing of the pending Arizona Chemical Acquisition.
Financing Transactions
Term Loan Facility, ABL Facility and Repayment of the Existing Senior Secured Credit Facilities
In connection with the consummation of the pending Arizona Chemical Acquisition, Kraton Polymers U.S. LLC, as borrower, anticipates entering into the ABL Facility and Kraton LLC, as borrower, anticipates entering into the Term Loan Facility. We intend to use a portion of borrowings under the Term Loan Facility to repay all outstanding borrowings, if any, under and terminate our Existing Senior Secured Credit Facilities. As of the date of this offering circular, there was no indebtedness outstanding under the Existing Senior Secured Credit Facilities.
On December 1, 2015, we launched syndication of the Term Loan Facility. The Credit Agreement will provide for a term loan in an aggregate principal amount equal to $1,350.0 million at closing. Subject to compliance with certain covenants and other conditions, we expect to have the option to borrow up to $350.0 million of incremental term loans plus an additional amount subject to a Senior Secured Net Leverage Ratio (as defined in the Credit Agreement). The principal amount outstanding under the Term Loan Facility will be due and payable in full on the sixth anniversary of its closing date. We will be required to make scheduled quarterly payments on the Term Loan Facility of 2.50% of the original principal amount per year through the end of the last quarter of 2016 and 5.0% thereafter, with the balance due and payable in full on the sixth anniversary of its closing date. Borrowings under the Term Loan Facility will bear interest at a rate per annum equal to an applicable margin, plus, at our option, either (a) an adjusted LIBOR rate (subject to a 1% floor) determined by reference to the costs of funds for U.S. dollar deposits for the interest period relevant to such borrowing adjusted for statutory reserve requirements or (b) an alternate base rate (subject to a 2% floor) determined by reference to the highest of (1) the prime rate of Credit Suisse A.G., (2) the federal funds effective rate plus 0.50% and (3) the one month adjusted LIBOR rate plus 1% per annum. All obligations under the Term Loan Facility will be guaranteed by Kraton and each of our domestic wholly-owned subsidiaries (including after the consummation of the pending Arizona Chemical Acquisition, Arizona Chemical and its domestic wholly-owned subsidiaries), with certain exceptions to be set forth in the Credit Agreement.
The ABL Facility will provide financing of up to $250.0 million, subject to borrowing base limitations and compliance with certain covenants and other conditions. The borrowing base at any time will equal the sum of 85% of eligible accounts receivable and the lesser of 85% of the net orderly liquidation value of eligible inventory and 65% of the value of eligible inventory (at the lower of book value and market), less certain reserves and subject to certain limitations on in-transit inventory and inventory and accounts receivable owed by non-U.S. persons. The ABL Facility will include a $50.0 million sub-facility for letters of credit and sub-facility for borrowings on same-day notice equal to 10% of the borrowing base, referred to as the swingline loans. We do not expect to draw on the ABL Facility at the closing of the Transactions. As of October 31, 2015, on a pro forma basis after giving effect to the Transactions, the borrowing base under this facility would have been approximately $230.0 million. We will have the right to request up to $100.0 million of additional commitments under the ABL Facility at any time, although the lenders under the ABL Facility will not be under any obligation to provide any such additional commitments. Borrowings under the ABL Facility will bear interest at a rate per annum equal to the applicable margin plus (1) a base rate determined by reference to the prime rate of Bank of America, N.A. in the jurisdiction where the currency is being funded or (2) LIBOR for loans that bear interest based on LIBOR. In addition to paying interest on outstanding principal under the ABL Facility, we will be required to pay a commitment fee of 0.375% per annum in respect of the unutilized commitments thereunder. We also will pay customary letter of credit fees and agency fees. All obligations under the ABL Facility will be guaranteed by Kraton and each of our domestic wholly-owned subsidiaries (including after the consummation of the pending Arizona Chemical Acquisition, Arizona Chemical and its domestic wholly-owned subsidiaries), with certain exceptions to be set forth in the ABL Facility. In addition, certain foreign obligations under the ABL
28
Facility will be guaranteed by Kraton Polymers Nederland B.V., Kraton Polymers Holdings B.V. and K.P. Global Holdings C.V. All obligations under the ABL Facility will be secured, subject to certain exceptions as set forth therein. The principal amount outstanding of the loans under the ABL Facility will be due and payable in full at maturity, five years from the date of closing of the Transactions.
See “Description of Other Indebtedness” for a description of the Term Loan Facility and the ABL Facility.
Tender Offer, Consent Solicitation and Redemption of the 6.75% Senior Notes
On December 1, 2015, Kraton LLC commenced a cash Tender Offer to purchase all $350.0 million aggregate principal amount of its outstanding 6.75% Senior Notes at a purchase price of $1,028.50 per $1,000 principal amount of 6.75% Senior Notes validly tendered on or before the Consent Payment Deadline, which includes a Consent Fee. Holders who validly tender their 6.75% Senior Notes after the Consent Payment Deadline will be eligible to receive only $998.50 per $1,000 principal amount of Notes validly tendered, which does not include the Consent Fee. The Tender Offer is scheduled to expire at 11:59 p.m., New York City time, on December 29, 2015, unless extended or earlier terminated. In conjunction with the Tender Offer, Kraton LLC also commenced a Consent Solicitation to solicit consents to certain proposed amendments to the indenture governing the 6.75% Senior Notes that will eliminate or modify substantially all restrictive covenants, certain events of default and related provisions contained therein. The Tender Offer and Consent Solicitation are being made on the terms and subject to the conditions set forth in an offer to purchase and consent solicitation statement, dated December 1, 2015, as amended or supplemented from time to time. Holders who validly tender 6.75% Senior Notes pursuant to the Tender Offer must also consent to the proposed amendments, and holders who consent will be required to tender their 6.75% Senior Notes.
The Tender Offer and Consent Solicitation is conditioned on, among other things, the completion of this offering of notes and the closing of the pending Arizona Chemical Acquisition. This offering of notes, however, is not conditioned on the Tender Offer and Consent Solicitation. To the extent that any 6.75% Senior Notes are not validly tendered in the Tender Offer, Kraton LLC intends to redeem such 6.75% Senior Notes on March 1, 2016 pursuant to the redemption and satisfaction and discharge provisions of the indenture governing the 6.75% Senior Notes.
Kraton LLC intends to use a portion of the net proceeds from this offering of notes to finance the Tender Offer and Consent Solicitation, and if necessary, for the irrevocable deposit of funds with the trustee of the 6.75% Senior Notes to redeem any 6.75% Senior Notes outstanding after the Tender Offer on March 1, 2016 pursuant to the redemption and satisfaction and discharge provisions of the indenture governing the 6.75% Senior Notes. We cannot assure you that Kraton LLC will be successful in consummating the Tender Offer and Consent Solicitation or that any of the 6.75% Senior Notes will be tendered pursuant to the Tender Offer. Nothing in this offering circular should be construed as an offer to purchase any of the 6.75% Senior Notes.
29
UNAUDITED PRO FORMA FINANCIAL DATA
Our unaudited pro forma condensed combined balance sheet as of September 30, 2015 and our unaudited pro forma condensed combined statements of operations for the nine months ended September 30, 2015, the year ended December 31, 2014 and the TTM Period, have been derived by application of pro forma adjustments to the Kraton Audited Financial Statements, the Kraton Interim Financial Statements, the Arizona Chemical Audited Financial Statements and the Arizona Chemical Interim Financial Statements, each included elsewhere in this offering circular and reflect the following transactions:
| | • | | this offering of notes for estimated gross proceeds of approximately $425.0 million, before deducting selling discounts and our offering expenses; |
| | • | | our pending Arizona Chemical Acquisition, for net cash consideration in the amount of approximately $1,337.0 million, subject to adjustment for working capital and other matters; |
| | • | | the Tender Offer and Consent Solicitation, and our subsequent redemption of any remaining outstanding 6.75% Senior Notes on March 1, 2016; |
| | • | | the repayment in full of all borrowings outstanding under our Existing Senior Secured Credit Facilities; and |
| | • | | our entry into the ABL Facility and the Term Loan Facility and the initial borrowings thereunder. |
The unaudited pro forma condensed combined balance sheet gives effect to the Transactions as if they had occurred on September 30, 2015. The unaudited pro forma condensed combined statements of operations give effect to the Transactions as if they had occurred on the first day of the applicable period.
The unaudited pro forma condensed combined financial information includes adjustments directly attributable to the Transactions that are expected to have a continuing impact on us. The pro forma adjustments are described in the notes accompanying the unaudited pro forma condensed combined financial information. The pro forma adjustments are based upon available information and certain assumptions we believe are reasonable.
The pending Arizona Chemical Acquisition will be accounted for using the purchase method of accounting. The purchase accounting allocations in the pending Arizona Chemical Acquisition will be determined at a later date and will depend on a number of factors, including the final valuation of our tangible and identifiable intangible assets acquired and liabilities assumed in the pending Arizona Chemical Acquisition. The actual fair values of Arizona Chemical’s assets acquired, liabilities assumed and resulting goodwill may differ significantly from the adjustments set forth in the unaudited pro forma condensed combined financials fair value analysis. The unaudited pro forma condensed combined financial statements and accompanying notes should be read in conjunction with “Risk Factors,” “Management’s Discussion and Analysis of Financial Condition and Results of Operations” and the historical financial statements of each of Kraton and Arizona Chemical and related notes thereto appearing elsewhere herein. The unaudited pro forma condensed combined financial data for the TTM Period have been derived by adding the unaudited pro forma combined financial data from our pro forma condensed combined financial statements for the year ended December 31, 2014 to the unaudited pro forma combined financial data from our pro forma condensed combined financial statements for the nine months ended September 30, 2015 and then subtracting the unaudited pro forma combined financial data from our pro forma condensed combined financial statements for the nine months ended September 30, 2014.
The unaudited pro forma condensed combined financial statements do not purport to be indicative of the results of operations or financial position that we actually would have achieved if the Transactions had been consummated on the dates indicated, nor do they project our results of operations or financial position for any future period or date.
30
KRATON PERFORMANCE POLYMERS, INC.
UNAUDITED PRO FORMA CONDENSED COMBINED BALANCE SHEET
AS OF SEPTEMBER 30, 2015
(in thousands)
| | | | | | | | | | | | | | | | | | |
| | | Kraton | | | Arizona
Chemical | | | Pro Forma
Adjustments | | | | | Pro Forma
Combined | |
ASSETS | | | | | | | | | | | | | | | | | | |
Current assets: | | | | | | | | | | | | | | | | | | |
Cash and cash equivalents | | $ | 63,799 | | | $ | 44,439 | | | $ | (66,530 | ) | | (A) | | $ | 41,708 | |
Receivables, net of allowances | | | 110,803 | | | | 97,572 | | | | — | | | | | | 208,375 | |
Other receivables | | | — | | | | 8,710 | | | | (8,710 | ) | | (B) | | | — | |
Inventories of products | | | 264,105 | | | | 96,842 | | | | 14,687 | | | (C) | | | 375,634 | |
Inventories of materials and supplies | | | 11,345 | | | | — | | | | 6,913 | | | (B) | | | 18,258 | |
Insurance receivable | | | — | | | | 93,104 | | | | — | | | | | | 93,104 | |
Deferred income taxes | | | 6,976 | | | | 549 | | | | — | | | | | | 7,525 | |
Due from related party | | | — | | | | 3,506 | | | | (3,506 | ) | | (B) | | | — | |
Other current assets | | | 27,275 | | | | 13,261 | | | | 5,047 | | | (B) | | | 51,388 | |
| | | | | | | | | | | 5,805 | | | (E) | | | | |
| | | | | | | | | | | | | | | | | | |
Total current assets | | | 484,303 | | | | 357,983 | | | | (46,294 | ) | | | | | 795,992 | |
Property, plant and equipment, less accumulated depreciation | | | 493,711 | | | | 239,179 | | | | 144,242 | | | (F) | | | 877,132 | |
Intangible assets, less accumulated amortization | | | 43,360 | | | | 64,730 | | | | (64,730 | ) | | (G) | | | 519,360 | |
| | | | | | | | | | | 476,000 | | | (G) | | | | |
Goodwill | | | — | | | | — | | | | 654,542 | | | (H) | | | 654,542 | |
Investment in unconsolidated joint venture | | | 11,725 | | | | — | | | | — | | | | | | 11,725 | |
Debt issuance costs | | | 6,992 | | | | — | | | | 42,031 | | | (E) | | | 49,023 | |
Deferred income taxes | | | 2,973 | | | | 6,150 | | | | — | | | | | | 9,123 | |
Other long-term assets | | | 21,335 | | | | 24,465 | | | | (1,311 | ) | | (B) | | | 24,234 | |
| | | | | | | | | | | (20,255 | ) | | (I) | | | | |
| | | | | | | | | | | | | | | | | | |
Total assets | | $ | 1,064,399 | | | $ | 692,507 | | | $ | 1,184,225 | | | | | $ | 2,941,131 | |
| | | | | | | | | | | | | | | | | | |
LIABILITIES AND EQUITY | | | | | | | | | | | | | | | | | | |
Current liabilities: | | | | | | | | | | | | | | | | | | |
Current portion of long-term debt and short term borrowings | | $ | 139 | | | $ | 6,286 | | | $ | 23,006 | | | (J) | | $ | 29,431 | |
Accounts payable trade | | | 64,169 | | | | 77,322 | | | | 4,759 | | | (B) | | | 146,250 | |
Other payables and accruals | | | 66,604 | | | | 44,429 | | | | (1,567 | ) | | (B) | | | 102,523 | |
| | | | | | | | | | | (1,714 | ) | | (E) | | | | |
| | | | | | | | | | | (5,229 | ) | | (K) | | | | |
Accrued liabilities for litigations | | | — | | | | 93,665 | | | | — | | | | | | 93,665 | |
Deferred income taxes | | | 1,549 | | | | 4,205 | | | | 5,880 | | | (D) | | | 11,634 | |
Due to related party | | | 15,396 | | | | 4,759 | | | | (4,759 | ) | | (B) | | | 15,396 | |
| | | | | | | | | | | | | | | | | | |
Total current liabilities | | | 147,857 | | | | 230,666 | | | | 20,376 | | | | | | 398,899 | |
Long-term debt, net of current portion | | | 404,799 | | | | 773,941 | | | | 594,072 | | | (J) | | | 1,772,812 | |
Deferred income taxes | | | 12,693 | | | | 46,017 | | | | 198,394 | | | (D) | | | 257,104 | |
Pension liabilities | | | — | | | | 39,616 | | | | (39,616 | ) | | (B) | | | — | |
Deferred income | | | — | | | | 8,281 | | | | (8,281 | ) | | (K) | | | — | |
Other long-term liabilities | | | 103,107 | | | | 13,493 | | | | 39,616 | | | (B) | | | 149,128 | |
| | | | | | | | | | | (7,088 | ) | | (K) | | | | |
| | | | | | | | | | | | | | | | | | |
Total liabilities | | | 668,456 | | | | 1,112,014 | | | | 797,473 | | | | | | 2,577,943 | |
| | | | | | | | | | | | | | | | | | |
Equity: | | | | | | | | | | | | | | | | | | |
Stockholders’ equity: | | | | | | | | | | | | | | | | | | |
Preferred stock | | | — | | | | — | | | | — | | | | | | — | |
Common stock | | | 305 | | | | — | | | | — | | | | | | 305 | |
Additional paid in capital | | | 347,462 | | | | 755 | | | | (755 | ) | | (L) | | | 347,462 | |
Retained earnings (deficiency) | | | 151,092 | | | | (343,054 | ) | | | 310,299 | | | (L) | | | 118,337 | |
Accumulated other comprehensive loss | | | (138,005 | ) | | | (77,208 | ) | | | 77,208 | | | (L) | | | (138,005 | ) |
| | | | | | | | | | | | | | | | | | |
Total stockholders’ equity (deficit) | | | 360,854 | | | | (419,507 | ) | | | 386,752 | | | | | | 328,099 | |
Noncontrolling interest | | | 35,089 | | | | — | | | | — | | | | | | 35,089 | |
| | | | | | | | | | | | | | | | | | |
Total equity | | | 395,943 | | | | (419,507 | ) | | | 386,752 | | | | | | 363,188 | |
| | | | | | | | | | | | | | | | | | |
Total liabilities and equity | | $ | 1,064,399 | | | $ | 692,507 | | | $ | 1,184,225 | | | | | $ | 2,941,131 | |
| | | | | | | | | | | | | | | | | | |
The accompanying notes are an integral part of these unaudited pro forma condensed combined financial statements.
31
KRATON PERFORMANCE POLYMERS, INC.
UNAUDITED PRO FORMA CONDENSED COMBINED STATEMENTS OF OPERATIONS
FOR THE NINE MONTHS ENDED SEPTEMBER 30, 2015
(in thousands)
| | | | | | | | | | | | | | | | | | |
| | | Kraton | | | Arizona
Chemical | | | Pro Forma
Adjustments | | | | | Pro Forma
Combined | |
Revenue | | $ | 786,349 | | | $ | 620,957 | | | $ | — | | | | | $ | 1,407,306 | |
Cost of goods sold | | | 624,542 | | | | 436,039 | | | | 1,587 | | | (K) | | | 1,047,589 | |
| | | | | | | | | | | (17,507 | ) | | (M) | | | | |
| | | | | | | | | | | 3,136 | | | (N) | | | | |
| | | | | | | | | | | (208 | ) | | (O) | | | | |
| | | | | | | | | | | | | | | | | | |
Gross profit | | | 161,807 | | | | 184,918 | | | | 12,992 | | | | | | 359,717 | |
| | | | | | | | | | | | | | | | | | |
Operating expenses: | | | | | | | | | | | | | | | | | | |
Research and development | | | 23,345 | | | | — | | | | 8,574 | | | (P) | | | 31,919 | |
Selling, general and administrative (including related party fees) | | | 77,488 | | | | 78,205 | | | | (5,288 | ) | | (M) | | | 132,959 | |
| | | | | | | | | | | (8,574 | ) | | (P) | | | | |
| | | | | | | | | | | (7,310 | ) | | (Q) | | | | |
| | | | | | | | | | | (1,562 | ) | | (R) | | | | |
Plant closure | | | — | | | | 5,953 | | | | (5,953 | ) | | (N) | | | — | |
Depreciation and amortization | | | 46,852 | | | | — | | | | 14,500 | | | (F) | | | 106,417 | |
| | | | | | | | | | | 21,578 | | | (G) | | | | |
| | | | | | | | | | | 22,795 | | | (M) | | | | |
| | | | | | | | | | | 692 | | | (N) | | | | |
Impairment of long-lived assets | | | — | | | | — | | | | 2,125 | | | (N) | | | 2,125 | |
Litigation expense | | | — | | | | 12,894 | | | | — | | | | | | 12,894 | |
Insurance recoveries | | | — | | | | (12,894 | ) | | | — | | | | | | (12,894 | ) |
| | | | | | | | | | | | | | | | | | |
Total operating expenses | | | 147,685 | | | | 84,158 | | | | 41,577 | | | | | | 273,420 | |
Interest expense, net | | | 17,975 | | | | 35,928 | | | | 49,043 | | | (S) | | | 102,946 | |
Earnings of unconsolidated joint venture | | | (273 | ) | | | — | | | | — | | | | | | (273 | ) |
Loss on extinguishment of debt | | | — | | | | — | | | | 15,750 | | | (T) | | | 15,750 | |
Loss (gain) on interest rate caps/swaps, net | | | — | | | | 7,003 | | | | (7,003 | ) | | (U) | | | — | |
Foreign currency exchange loss (gain), net | | | — | | | | (107 | ) | | | 107 | | | (O) | | | — | |
Other income | | | — | | | | (101 | ) | | | 101 | | | (O) | | | — | |
| | | | | | | | | | | | | | | | | | |
Income (loss) before income taxes | | | (3,580 | ) | | | 58,037 | | | | (86,583 | ) | | | | | (32,126 | ) |
Income tax expense (benefit) | | | 4,135 | | | | 18,103 | | | | (30,304 | ) | | (V) | | | (8,066 | ) |
| | | | | | | | | | | | | | | | | | |
Consolidated net income (loss) | | | (7,715 | ) | | | 39,934 | | | | (56,279 | ) | | | | | (24,060 | ) |
Net income (loss) attributable to noncontrolling interest | | | (1,141 | ) | | | — | | | | — | | | | | | (1,141 | ) |
| | | | | | | | | | | | | | | | | | |
Net income (loss) | | $ | (6,574 | ) | | $ | 39,934 | | | $ | (56,279 | ) | | | | $ | (22,919 | ) |
| | | | | | | | | | | | | | | | | | |
The accompanying notes are an integral part of these unaudited pro forma condensed combined financial statements.
32
KRATON PERFORMANCE POLYMERS, INC.
UNAUDITED PRO FORMA CONDENSED COMBINED STATEMENTS OF OPERATIONS
FOR THE YEAR ENDED DECEMBER 31, 2014
(in thousands)
| | | | | | | | | | | | | | | | | | |
| | | Kraton | | | Arizona
Chemical | | | Pro Forma
Adjustments | | | | | Pro Forma
Combined | |
Revenue | | $ | 1,230,433 | | | $ | 938,050 | | | $ | — | | | | | $ | 2,168,483 | |
Cost of goods sold | | | 993,366 | | | | 677,587 | | | | 14,687 | | | (C) | | | 1,660,547 | |
| | | | | | | | | | | 2,116 | | | (K) | | | | |
| | | | | | | | | | | (24,659 | ) | | (M) | | | | |
| | | | | | | | | | | (2,550 | ) | | (O) | | | | |
| | | | | | | | | | | | | | | | | | |
Gross profit | | | 237,067 | | | | 260,463 | | | | 10,406 | | | | | | 507,936 | |
| | | | | | | | | | | | | | | | | | |
Operating expenses: | | | | | | | | | | | | | | | | | | |
Research and development | | | 31,370 | | | | — | | | | 12,809 | | | (P) | | | 44,179 | |
Selling, general and administrative (including related party fees) | | | 104,209 | | | | 130,532 | | | | (8,997 | ) | | (M) | | | 210,075 | |
| | | | | | | | | | | (12,809 | ) | | (P) | | | | |
| | | | | | | | | | | (711 | ) | | (Q) | | | | |
| | | | | | | | | | | (2,149 | ) | | (R) | | | | |
Depreciation and amortization | | | 66,242 | | | | — | | | | 19,333 | | | (F) | | | 146,797 | |
| | | | | | | | | | | 27,566 | | | (G) | | | | |
| | | | | | | | | | | 33,656 | | | (M) | | | | |
Impairment of long-lived assets | | | 4,731 | | | | — | | | | — | | | (N) | | | 4,731 | |
Litigation expense | | | — | | | | 10,110 | | | | — | | | | | | 10,110 | |
Insurance recoveries | | | — | | | | (80,210 | ) | | | — | | | | | | (80,210 | ) |
| | | | | | | | | | | | | | | | | | |
Total operating expenses | | | 206,552 | | | | 60,432 | | | | 68,698 | | | | | | 335,682 | |
Interest expense, net | | | 24,594 | | | | 42,825 | | | | 70,944 | | | (S) | | | 138,363 | |
Earnings of unconsolidated joint venture | | | (407 | ) | | | — | | | | — | | | | | | (407 | ) |
Loss on extinguishment of debt | | | — | | | | 7,860 | | | | 7,890 | | | (T) | | | 15,750 | |
Loss (gain) on interest rate caps/swaps, net | | | — | | | | 3,579 | | | | (3,579 | ) | | (U) | | | — | |
Foreign currency exchange loss (gain), net | | | — | | | | (1,208 | ) | | | 1,208 | | | (O) | | | — | |
Other income | | | — | | | | (1,342 | ) | | | 1,342 | | | (O) | | | — | |
| | | | | | | | | | | | | | | | | | |
Income (loss) before income taxes | | | 6,328 | | | | 148,317 | | | | (136,097 | ) | | | | | 18,548 | |
Income tax expense (benefit) | | | 5,118 | | | | 49,966 | | | | (47,634 | ) | | (V) | | | 7,450 | |
| | | | | | | | | | | | | | | | | | |
Consolidated net income (loss) | | | 1,210 | | | | 98,351 | | | | (88,463 | ) | | | | | 11,098 | |
Net income (loss) attributable to noncontrolling interest | | | (1,209 | ) | | | — | | | | — | | | | | | (1,209 | ) |
| | | | | | | | | | | | | | | | | | |
Net income (loss) | | $ | 2,419 | | | $ | 98,351 | | | $ | (88,463 | ) | | | | $ | 12,307 | |
| | | | | | | | | | | | | | | | | | |
The accompanying notes are an integral part of these unaudited pro forma condensed combined financial statements.
33
KRATON PERFORMANCE POLYMERS, INC.
UNAUDITED PRO FORMA CONDENSED COMBINED STATEMENTS OF OPERATIONS
FOR THE TWELVE MONTHS ENDED SEPTEMBER 30, 2015
(in thousands)
| | | | | | | | | | | | | | | | | | |
| | | Kraton | | | Arizona
Chemical | | | Pro Forma
Adjustments | | | | | Pro Forma
Combined | |
Revenue | | $ | 1,062,388 | | | $ | 830,704 | | | $ | — | | | | | $ | 1,893,092 | |
Cost of goods sold | | | 856,491 | | | | 589,245 | | | | 2,116 | | | (K) | | | 1,426,372 | |
| | | | | | | | | | | (23,409 | ) | | (M) | | | | |
| | | | | | | | | | | 3,136 | | | (N) | | | | |
| | | | | | | | | | | (1,207 | ) | | (O) | | | | |
| | | | | | | | | | | | | | | | | | |
Gross profit | | | 205,897 | | | | 241,459 | | | | 19,364 | | | | | | 466,720 | |
| | | | | | | | | | | | | | | | | | |
Operating expenses: | | | | | | | | | | | | | | | | | | |
Research and development | | | 30,979 | | | | — | | | | 11,153 | | | (P) | | | 42,132 | |
Selling, general and administrative (including related party fees) | | | 102,825 | | | | 101,955 | | | | (7,313 | ) | | (M) | | | 176,153 | |
| | | | | | | | | | | (11,153 | ) | | (P) | | | | |
| | | | | | | | | | | (8,021 | ) | | (Q) | | | | |
| | | | | | | | | | | (2,140 | ) | | (R) | | | | |
Plant closure | | | — | | | | 5,953 | | | | (5,953 | ) | | (N) | | | — | |
Depreciation and amortization | | | 63,464 | | | | — | | | | 19,333 | | | (F) | | | 142,773 | |
| | | | | | | | | | | 28,562 | | | (G) | | | | |
| | | | | | | | | | | 30,722 | | | (M) | | | | |
| | | | | | | | | | | 692 | | | (N) | | | | |
Impairment of long-lived assets | | | 4,731 | | | | — | | | | 2,125 | | | (N) | | | 6,856 | |
Litigation expense | | | — | | | | 19,904 | | | | — | | | | | | 19,904 | |
Insurance recoveries | | | — | | | | (93,104 | ) | | | — | | | | | | (93,104 | ) |
| | | | | | | | | | | | | | | | | | |
Total operating expenses | | | 201,999 | | | | 34,708 | | | | 58,007 | | | | | | 294,714 | |
Interest expense, net | | | 23,902 | | | | 48,355 | | | | 65,061 | | | (S) | | | 137,318 | |
Earnings of unconsolidated joint venture | | | (356 | ) | | | — | | | | — | | | | | | (356 | ) |
Loss on extinguishment of debt | | | — | | | | — | | | | 15,750 | | | (T) | | | 15,750 | |
Loss (gain) on interest rate caps/swaps, net | | | — | | | | 10,287 | | | | (10,287 | ) | | (U) | | | — | |
Foreign currency exchange loss (gain), net | | | — | | | | (982 | ) | | | 982 | | | (O) | | | — | |
Other income | | | — | | | | (225 | ) | | | 225 | | | (O) | | | — | |
| | | | | | | | | | | | | | | | | | |
Income (loss) before income taxes | | | (19,648 | ) | | | 149,316 | | | | (110,374 | ) | | | | | 19,294 | |
Income tax expense (benefit) | | | 5,848 | | | | 50,985 | | | | (38,631 | ) | | (V) | | | 18,202 | |
| | | | | | | | | | | | | | | | | | |
Consolidated net income (loss) | | | (25,496 | ) | | | 98,331 | | | | (71,743 | ) | | | | | 1,092 | |
Net income (loss) attributable to noncontrolling interest | | | (1,492 | ) | | | — | | | | — | | | | | | (1,492 | ) |
| | | | | | | | | | | | | | | | | | |
Net income (loss) | | $ | (24,004 | ) | | $ | 98,331 | | | $ | (71,743 | ) | | | | $ | 2,584 | |
| | | | | | | | | | | | | | | | | | |
The accompanying notes are an integral part of these unaudited pro forma condensed combined financial statements.
34
NOTES TO UNAUDITED PRO FORMA CONDENSED COMBINED FINANCIAL STATEMENTS
1. Basis of Presentation
On September 27, 2015, Kraton Polymers LLC, one of our wholly owned subsidiaries (“Kraton LLC”), entered into a stock purchase agreement with AZC Holding Company LLC (“Seller”), the sole stockholder of Arizona Chemical Holdings Corporation (“Arizona Chemical”). Pursuant to the stock purchase agreement, we agreed to acquire all of the outstanding capital stock of Arizona Chemical for a cash purchase price of $1,370.0 million, subject to adjustment for cash and indebtedness at closing, as well as an adjustment for working capital and other items (the “Arizona Chemical Acquisition”). The Arizona Chemical Acquisition is expected to close in late 2015, subject to certain customary closing conditions.
The accompanying pro forma financial statements present the pro forma combined financial position and results of operations of the two companies based upon the historical financial statements of Kraton Performance Polymers, Inc. (“Kraton”) and Arizona Chemical, after giving effect to the combination and adjustments described in these notes, and are intended to reflect the impact of the combination on Kraton’s consolidated financial statements. The accompanying pro forma financial statements are presented for illustrative purposes only and do not reflect the costs of any integration activities or benefits that may result from realization of future cost savings due to operating efficiencies or synergies that could result from the combination.
The pro forma balance sheet gives effect to the combination as if it had been completed on September 30, 2015. The pro forma statement of operations gives effect to the combination as if it had been completed as of January 1, 2014.
The accompanying pro forma financial statements were prepared using the acquisition method of accounting with Kraton considered the accounting acquirer of Arizona Chemical. In accordance with accounting guidance for business combinations, the assets acquired and the liabilities assumed have been measured at fair value, and estimated pro forma adjustments have been reflected for these preliminary valuations. These fair value measurements are based on estimates and the pro forma adjustments included herein are likely to be revised as additional information becomes available and as additional analyses are performed. The final purchase price allocation will be determined after the combination is completed and the final amounts recorded for the combination may differ materially from the information presented in these pro forma financial statements.
2. Preliminary Purchase Price
The preliminary purchase price is computed based on the preliminary consideration of $1,370.0 million less a deduction of $32.9 million related to the underfunded status of Arizona Chemical’s defined benefit pension plans. The final purchase price is subject to adjustment for cash and indebtedness at closing, as well as an adjustment for working capital and other items. The following table summarizes the preliminary allocation of the purchase price to the estimated fair value of the assets expected to be acquired and liabilities expected to be assumed at the date of closing of the Arizona Chemical Acquisition (in thousands):
| | | | |
Current assets | | $ | 328,231 | |
Property, plant and equipment | | | 383,421 | |
Intangible assets | | | 476,000 | |
Goodwill | | | 654,542 | |
Other long-term assets | | | 10,360 | |
| | | | |
Total assets acquired | | | 1,852,554 | |
| | | | |
Current liabilities | | | 225,031 | |
Other long-term liabilities | | | 290,432 | |
| | | | |
Total liabilities assumed | | | 515,463 | |
| | | | |
Net assets acquired | | $ | 1,337,091 | |
| | | | |
35
The final determination of the fair value of the identifiable net assets acquired may change significantly from these preliminary estimates. The actual acquisition accounting of the combination will be based on the fair value of the consideration and the fair value of the assets and liabilities of Arizona Chemical as of the date of completion of the combination.
3. Pro Forma Adjustments
| (A) | Reflects the cash impact of the following transactions: |
| | | | |
$1,350.0 million of anticipated cash proceeds from the Term Loan Facility | | $ | 1,350,000 | |
$425.0 million of anticipated cash proceeds from this offering of notes | | | 425,000 | |
Preliminary cash consideration paid for the Arizona Chemical Acquisition | | | (1,337,091 | ) |
Elimination of Arizona Chemical’s cash balance which is excluded from the acquisition purchase price | | | (44,439 | ) |
$350.0 million repayment of our 6.75% Senior Notes | | | (350,000 | ) |
Estimated costs relating to the Arizona Chemical Acquisition and debt offering expenses in connection with this offering of notes, Tender Offer fees, original issue discount on the Term Loan Facility, early call premium on the 6.75% Senior Notes and all other fees and expenses in connection with the Transactions | | | (110,000 | ) |
| | | | |
Net change in cash | | $ | (66,530 | ) |
| | | | |
| (B) | Adjustment to reclassify the following items included in the historical presentation of Arizona Chemical to conform to Kraton’s presentation: |
| | (1) | Other receivables of $8.7 million from Other receivables to Other current assets |
| | (2) | Inventories of materials and supplies of $5.6 million from Other current assets and $1.3 million from Other long term assets to Inventories of materials and supplies |
| | (3) | Receivables from International Paper of $3.5 million from Due from related party to Other current assets |
| | (4) | Payables to International Paper of $4.8 million from Due to related party to Accounts payable trade |
| | (5) | Value-added taxes payable of $1.6 million from Other payables and accruals to Other current assets |
| | (6) | Pension liabilities of $39.6 million from Pension liabilities to Other long-term liabilities |
| (C) | Adjustment to reflect the estimated fair value of inventory of Arizona Chemical and the additional expense recognized in Cost of goods sold. Fair value of finished goods inventory has been determined based on estimated selling price, net of selling costs based on historical gross profit margins for Arizona Chemical. Fair value of raw materials has been assumed to equal their book values. |
| (D) | Represents an adjustment to deferred tax liabilities based on the U.S. federal statutory tax rate of 35% multiplied by the fair value adjustments made to assets acquired and liabilities assumed, excluding goodwill, as calculated below: |
| | | | |
Fair value adjustment to increase inventory | | $ | 14,687 | |
Fair value adjustment to increase property, plant and equipment | | | 144,242 | |
Fair value adjustment to increase intangible assets | | | 411,270 | |
Fair value adjustment to decrease other payables and accruals | | | 5,161 | |
Fair value adjustment to decrease deferred income | | | 8,281 | |
| | | | |
| | | 583,641 | |
U.S. federal statutory tax rate | | | 35 | % |
| | | | |
| | $ | 204,274 | |
| | | | |
Current deferred tax liability | | | 5,880 | |
Long-term deferred tax liability | | | 198,394 | |
36
| (E) | Reflects the following adjustments related to deferred financing costs: |
| | | | | | | | |
| | | Other Current
Assets | | | Debt Issuance
Costs | |
Estimated deferred financing costs for the Term Loan Facility, less $1.7 million of costs accrued as of September 30, 2014 | | $ | 5,238 | | | $ | 25,446 | |
Estimated deferred financing costs for this offering of notes | | | 1,447 | | | | 15,904 | |
Estimated deferred financing costs for the ABL Facility | | | 1,418 | | | | 4,582 | |
Estimated write-off of deferred financing costs related to the 6.75% Senior Notes and write-off of a portion of the deferred financing costs related to our Existing Senior Secured Credit Facilities | | | (2,298 | ) | | | (3,901 | ) |
| | | | | | | | |
Total Change | | $ | 5,805 | | | $ | 42,031 | |
| | | | | | | | |
In addition, estimated amortization expense for deferred financing costs and the anticipated original issue discount on the Term Loan Facility consists of the following:
| | | | | | | | | | | | | | | | | | | | |
| | | | | | | | | Amortization Expense | |
| | | Book
Value | | | Amortization
Period | | | For the Nine
Months Ended
September 30, 2015 | | | For the Year Ended
December 31, 2014 | | | For the Twelve
Months Ended
September 30, 2015 | |
Deferred financing costs: | | | | | | | | |
Term Loan Facility | | $ | 32,399 | | | | 6.0 | | | $ | 4,031 | | | $ | 5,239 | | | $ | 5,359 | |
This offering of notes | | | 17,350 | | | | 8.0 | | | | 1,191 | | | | 1,447 | | | | 1,568 | |
ABL Facility(a) | | | 7,091 | | | | 5.0 | | | | 1,064 | | | | 1,418 | | | | 1,418 | |
Original issue discount: | | | | | | | | |
Term Loan Facility | | | 27,000 | | | | 6.0 | | | | 3,405 | | | | 4,458 | | | | 4,532 | |
| | | | | | | | | | | | | | | | | | | | |
Total | | $ | 83,840 | | | | | | | $ | 9,691 | | | $ | 12,562 | | | $ | 12,877 | |
| | | | | | | | | | | | | | | | | | | | |
| (a) | The ABL Facility book value includes $6.0 million of estimated deferred financing costs to be incurred related to the current refinancing and $1.1 million of deferred financing costs which are estimated to carry over from the Existing Senior Secured Credit Facilities. |
| (F) | Reflects fair value adjustments for property, plant and equipment and intangible assets acquired and related pro forma depreciation and amortization expense adjustments. Pro forma depreciation expense is calculated based on an average remaining useful life of 15 years for buildings and five years for plant and equipment. |
| | | | | | | | | | | | | | | | | | | | | | | | |
| | | Property, Plant and Equipment | | | Depreciation Expense | |
| | | Historical
Amounts | | | Fair Value | | | Fair Value
Adjustment | | | For the Nine
Months Ended
September 30,
2015 | | | For The
Year Ended
December 31,
2014 | | | For the Twelve
Months Ended
September 30,
2015 | |
Property, plant and equipment | | | | | | | | | | | | | | | | | | | | | | | | |
Land | | $ | 34,110 | | | $ | 18,458 | | | $ | 15,652 | | | $ | — | | | $ | — | | | $ | — | |
Buildings | | | 73,520 | | | | 25,000 | | | | 48,520 | | | | 2,426 | | | | 3,235 | | | | 3,235 | |
Plant and equipment | | | 241,411 | | | | 160,919 | | | | 80,492 | | | | 12,074 | | | | 16,098 | | | | 16,098 | |
Construction in progress | | | 34,380 | | | | 34,802 | | | | (422 | ) | | | — | | | | — | | | | — | |
| | | | | | | | | | | | | | | | | | | | | | | | |
Total | | $ | 383,421 | | | $ | 239,179 | | | $ | 144,242 | | | $ | 14,500 | | | $ | 19,333 | | | $ | 19,333 | |
| | | | | | | | | | | | | | | | | | | | | | | | |
37
| (G) | The balance sheet adjustment reflects the removal of $64.7 million for the net book value of Arizona Chemical’s existing intangible assets as of September 30, 2015 and the addition of $476.0 million for the fair value of intangible assets resulting from purchase accounting. The income statement adjustments reflect the removal of Arizona Chemical’s historical intangible asset amortization expense and the addition of amortization expense related to the fair value adjustments resulting from purchase accounting as follows: |
| | | | | | | | | | | | | | | | | | | | |
| | | | | | | | | Amortization Expense | |
| | | Book
Value | | | Amortization
Period | | | For the Nine
Months Ended
September 30, 2015 | | | For the Year Ended
December 31, 2014 | | | For the Twelve
Months Ended
September 30, 2015 | |
Intangible assets: | | | | | | | | |
Customer relationships | | $ | 145,000 | | | | 18.0 | | | $ | 6,042 | | | $ | 8,056 | | | $ | 8,056 | |
Trade name | | | 45,000 | | | | 10.0 | | | | 3,375 | | | | 4,500 | | | | 4,500 | |
Technology | | | 115,000 | | | | 16.0 | | | | 5,391 | | | | 7,188 | | | | 7,188 | |
Non-compete agreements | | | 1,000 | | | | 2.0 | | | | 375 | | | | 500 | | | | 500 | |
Supplier agreements | | | 170,000 | | | | 12.0 | | | | 10,625 | | | | 14,167 | | | | 14,167 | |
| | | | | | | | | | | | | | | | | | | | |
Total amortization | | $ | 476,000 | | | | | | | | 25,808 | | | | 34,411 | | | | 34,411 | |
Reverse Arizona Chemical historical intangible asset amortization expense | | | | | | | | | | | (4,230 | ) | | | (6,845 | ) | | | (5,849 | ) |
| | | | | | | | | | | | | | | | | | | | |
Net change in amortization expense | | | | | | | | | | $ | 21,578 | | | $ | 27,566 | | | $ | 28,562 | |
| | | | | | | | | | | | | | | | | | | | |
| (H) | Reflects the goodwill related to the Arizona Chemical Acquisition. |
| (I) | Adjustment to eliminate $20.3 million of deferred financing costs from Arizona Chemical’s other long term assets balance. |
| (J) | Reflects the following adjustments to debt: |
| | | | | | | | | | | | |
| | | Total Debt | | | Current Portion of
Long-Term Debt | | | Long-Term Debt | |
Term Loan Facility | | $ | 1,350,000 | | | $ | 33,750 | | | $ | 1,316,250 | |
Estimated original issue discount related to the Term Loan Facility | | | (27,000 | ) | | | (4,458 | ) | | | (22,542 | ) |
This offering of notes | | | 425,000 | | | | — | | | | 425,000 | |
Retirement of the 6.75% Senior Notes | | | (350,695 | ) | | | — | | | | (350,695 | ) |
Elimination of Arizona Chemical’s existing indebtedness | | | (780,227 | ) | | | (6,286 | ) | | | (773,941 | ) |
| | | | | | | | | | | | |
Total Change | | $ | 617,078 | | | $ | 23,006 | | | $ | 594,072 | |
| | | | | | | | | | | | |
| (K) | Adjustment to eliminate the following liabilities which will not be assumed with the purchase of Arizona Chemical: |
| | (1) | deferred income liability and income recognized in association with the Arizona Chemical sale and leaseback of certain rail cars; |
| | (2) | liabilities for Arizona Chemical’s accrued interest related to their existing indebtedness; and |
| | (3) | liabilities for Arizona Chemical’s interest rate swaps related to their existing indebtedness. |
38
| (L) | Adjustments reflect the elimination of Arizona Chemical’s equity related to purchase accounting adjustments. In addition, retained earnings reflects the following adjustments: |
| | | | |
| | | Retained Earnings | |
Elimination of Arizona Chemical’s retained earnings balance | | $ | 343,054 | |
Loss on early call premium from the Tender Offer for the 6.75% Senior Notes | | | (10,246 | ) |
Gain on write off of issuance premium for the 6.75% Senior Notes | | | 695 | |
Write-off of deferred financing costs on the 6.75% Senior Notes and Existing Senior Secured Credit Facilities | | | (6,199 | ) |
Estimated transaction costs related to the Arizona Chemical Acquisition | | | (17,005 | ) |
| | | | |
Total | | $ | 310,299 | |
| | | | |
| (M) | Adjustments to reclassify depreciation and amortization expense for Arizona Chemical from Cost of goods sold and Selling, general and administrative expenses into Depreciation and amortization to conform with Kraton’s presentation. |
| (N) | Adjustments to reclassify Arizona Chemical’s plant closure costs into Cost of goods sold, Depreciation and amortization, and Impairment of long-lived assets to conform with Kraton’s presentation. |
| (O) | Adjustments to reclassify Foreign currency exchange loss (gain) and Other income into Cost of goods sold to conform with Kraton’s presentation. |
| (P) | Adjustments to reclassify research and development expenses for Arizona Chemical from Selling, general and administrative expenses into Research and development. |
| (Q) | Adjustment to remove the effect of one-time transaction costs directly related to the Arizona Chemical Acquisition incurred by Kraton and Arizona Chemical. |
| (R) | Adjustment to remove the effect of management fees and out of pocket expenses paid to the owners of Arizona Chemical. |
| (S) | Reflects the elimination of interest expense related to Kraton and Arizona Chemical’s historical financing arrangements. In addition, this adjustment reflects the additional interest expense related to the Term Loan Facility, this offering of notes, and the ABL Facility: |
| | | | | | | | | | | | |
| | | Interest Expense | |
| | | For the Nine
Months Ended
September 30, 2015 | | | For the Year Ended
December 31, 2014 | | | For the Twelve
Months Ended
September 30, 2015 | |
Remove Arizona Chemical interest expense and deferred financing amortization associated with existing indebtedness | | $ | (35,998 | ) | | $ | (42,888 | ) | | $ | (48,452 | ) |
Remove Kraton interest expense and deferred financing amortization related to the 6.75% Senior Notes and Existing Senior Secured Credit Facilities | | | (20,414 | ) | | | (27,096 | ) | | | (27,147 | ) |
Assumed interest expense for the Term Loan Facility, the notes offered hereby and the ABL Facility(a) | | | 95,764 | | | | 128,366 | | | | 127,783 | |
Assumed amortization of deferred financing costs and original issue discount on the Term Loan Facility, the notes offered hereby and the ABL Facility (see footnote E) | | | 9,691 | | | | 12,562 | | | | 12,877 | |
| | | | | | | | | | | | |
Total | | $ | 49,043 | | | $ | 70,944 | | | $ | 65,061 | |
| | | | | | | | | | | | |
| (a) | Represents a blended interest rate assumption on the Term Loan Facility, this offering of notes, and the ABL Facility. A 0.25% change in the assumed interest rate would change annual interest expense by $4.4 million. |
39
| (T) | Adjustment reflects the debt extinguishment costs incurred as a result of refinancing our existing indebtedness and the elimination of Arizona Chemical’s historical loss on extinguishment of debt for a previous refinancing: |
| | | | | | | | | | | | |
| | | Loss (Gain) on Extinguishment of Debt | |
| | | For the Nine
Months Ended
September 30, 2015 | | | For the Year Ended
December 31, 2014 | | | For the Twelve
Months Ended
September 30, 2015 | |
Loss on early call premium from the Tender Offer for the 6.75% Senior Notes | | $ | 10,246 | | | $ | 10,246 | | | $ | 10,246 | |
Gain on write off of issuance premium for the 6.75% Senior Notes | | | (695 | ) | | | (695 | ) | | | (695 | ) |
Write-off of deferred financing costs on 6.75% Senior Notes and Existing Senior Secured Credit Facilities | | | 6,199 | | | | 6,199 | | | | 6,199 | |
Arizona Chemical Loss on extinguishment of debt | | | — | | | | (7,860 | ) | | | — | |
| | | | | | | | | | | | |
Total | | $ | 15,750 | | | $ | 7,890 | | | $ | 15,750 | |
| | | | | | | | | | | | |
| (U) | Reflects the elimination of loss (gain) on interest interest rate caps and swaps associated with Arizona Chemical’s historical indebtedness. |
| (V) | Reflects the tax impact of the pro forma adjustments based on the U.S. federal statutory tax rate of 35%. |
40
BUSINESS
Arizona Chemical Holdings Corporation
The terms “Arizona Chemical,” “our company,” “we,” “our,” “ours” and “us” as used in the following section refer collectively to Arizona Chemical Holdings Corporation and its consolidated subsidiaries. Arizona Chemical and its consolidated subsidiaries will operate as a separate company from Kraton until the pending Arizona Chemical Acquisition is consummated.
Our Company
We are a leading, market-driven, global specialty chemicals company that manufactures and sells high value performance products primarily derived from pine wood pulping co-products. We are a leading supplier of pine-based chemicals as measured by sales. We refine and further upgrade two primary feedstocks, CTO and CST, both of which are co-products of the wood pulping process, into value-added specialty chemicals. We refine CTO through a distillation process into four primary constituent fractions: TOFA, TOR, DTO and Pitch. We further upgrade TOFA, TOR and DTO into derivatives including dimer acids, polyamide resins, rosin resins, dispersions and disproportionated resins. We refine CST into terpene fractions which can be further upgraded into terpene resins. The various fractions and derivatives resulting from our CTO and CST refining process provide for distinct functionalities and properties, determining their respective applications and end markets. We focus our resources on four target markets that we believe offer the greatest potential for growth and in which we offer our highest value-added products. These markets are: (1) adhesives, (2) roads & construction, (3) tires and (4) chemical intermediates. Within our target markets, these products are sold into a diverse range of submarkets, including packaging, tapes and labels, pavement marking, high performance tires, fuel additives, oilfield and mining, coatings, metalworking fluids and lubricants, inks, and flavor and fragrances, among others.
41
The chart below illustrates the materials produced through the refining and further upgrading of CTO and CST and the markets and submarkets into which those materials are sold.
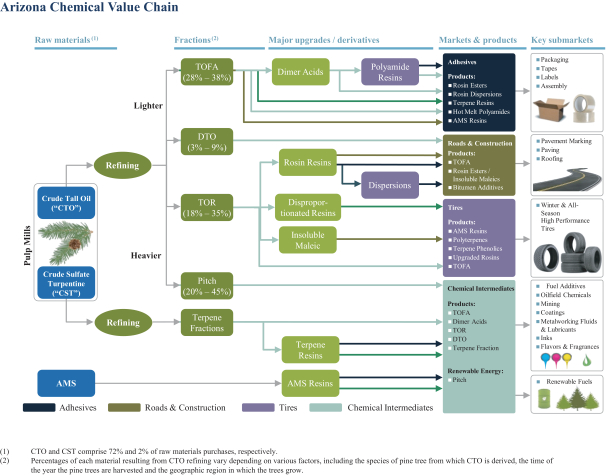
While our business is based predominantly on the refining and upgrading of CTO and CST, as shown above, we have the capacity to use both hydrocarbon-based raw materials, such as AMS, rosins, and gum rosins where appropriate and, accordingly, are able to offer tailored solutions for our customers.
Our products and our technical support enhance the value of our customers’ products by improving their performance, providing them with essential attributes, lowering costs and simplifying processes. We have endeavored to cultivate longstanding relationships with leading customers in our key markets and have a history of co-developing many of our products with our customers in order to satisfy specific product requirements. Our innovative products and solutions help our customers replace non-renewable raw materials with more sustainable alternatives. We serve approximately 550 customers in more than 68 countries through our worldwide network of nine strategically located manufacturing facilities, three laboratories and seven representative offices.
42
Our Products and Markets
The following chart presents the percentage of our net sales attributable to our four target markets and our portfolio of chemical intermediaries.
Diverse End Markets
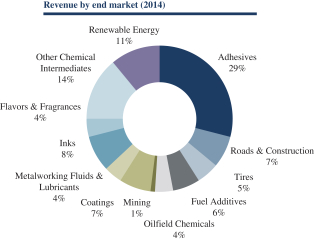
Adhesives
For the nine months ended September 30, 2015, approximately 52% of our adhesives products were sold into the packaging submarket, while approximately 17% were sold into the tapes and labels submarket and approximately 25% were sold into the assembly submarket.
We currently offer a broad range of products to service our target adhesives submarkets, including rosin- based tackifiers for packaging and pressure-sensitive adhesive applications, terpene-based tackifiers for bookbinding, hygiene and pressure-sensitive adhesive applications, AMS resins for bookbinding and pressure-sensitive adhesive applications and hot melt polyamides for flexible packaging.
Our tackifiers are primarily used in hot melt adhesives, which are heavily used in the packaging submarket. Our focus in packaging is to improve our competitive position by introducing higher stability tackifiers that work in new polymer systems. We believe our efforts to improve functionality of tackifier offerings will enable differentiated and profitable growth in emerging markets.
Across all adhesive submarkets, our products are designed to allow our customers to significantly improve the sustainability of their adhesive systems and reduce the impact of their products on the environment, while maintaining the performance the industry demands. In the construction market, we believe that the trend toward “green” buildings, together with a legislative push for the reduction of volatile organic content (“VOC”) and improved air quality, is likely to create further opportunities for our tackifiers. In hot melt adhesives our tackifiers are particularly effective as a low VOC alternative to solvent-based adhesives.
43
Approximately $204.0 million, or 32.9%, and $269 million, or 28.7%, of our net sales for the nine months ended September 30, 2015 and the year ended December 31, 2014, respectively, were from products sold into the adhesives market. These products include:
| | • | | Rosin-Based Tackifiers. Our SYLVATAC™ and SYLVALITE™ rosin ester tackifiers are particularly effective in hot melt adhesives and for bonding surfaces that are difficult to bond, such as highly-recycled packaging materials. We also offer a range of rosin ester dispersions under the AQUATAC™ trade name, for use in water-based adhesive applications such as paper labels. |
| | • | | Terpene-Based Tackifiers. Our range of terpene phenol, styrenated terpene and polyterpene resins, which we market under the SYLVARES™ and ZONATAC™ trade names, offer broad polymer compatibility, which allows our customers to develop and manufacture adhesives that bond to a wide variety of plastic surfaces. Our products are also used because they offer certain “in-service” performance requirements such as low odor, clear color, heat and chemical resistance, and can be applied at low temperatures. |
| | • | | AMS Tackifiers. Supplementing our range of tackifiers based on renewable resources are tackifiers based on AMS, a hydrocarbon. Our tackifiers based on this monomer, which we also market under the SYLVARES™ trade name, are almost water-white and adhere well to difficult-to-bond materials. There are only two other significant producers of AMS tackifiers and our range of AMS phenolics, which are used in high-end applications, is unique. |
| | • | | Hot Melt Polyamides.Our UNI-REZ™ thermoplastic polyamide adhesives are distinct within our range of offerings in that they are finished, end-use adhesives, rather than tackifiers. They bond to a wide variety of substrates and offer outstanding resistance to chemicals and oils. |
Roads & Construction
We provide rosin based binders for the thermoplastic pavement marking submarket, with a long history of supporting and understanding the performance needs of our customers’ products in this submarket. Additionally, our manufacturing footprint enables us to provide stable supply to customers in this submarket, a significant competitive advantage. We have also built a strong position in performance additives that rejuvenate aged asphalt materials. This position is supported by our increasing expertise in bitumen chemistry and aged materials, a comprehensive understanding of the market needs, innovative product solutions and a growing patent portfolio. Within the paving submarket, we produce upgrades and sell niche products, including rosin esters, insoluble maleic-based tackifiers and bitumen additives.
Approximately $41.6 million, or 6.7%, and $66 million, or 7.0%, of our net sales for the nine months ended September 30, 2015 and the year ended December 31, 2014, respectively, were from products sold into the roads & construction market. These products include:
| | • | | Rosin Esters and Insoluble Maleics. We sell our rosin esters and insoluble maleics used in thermoplastic road markings, under the SYLVATAC® and SYLVACOTE® trade names. Our rosin esters and insoluble maleics offer superior characteristics versus competitor products and competing chemistries, namely superior reflectivity and adhesion with glass beads. Recent production introduction further enhances shelf life and color stability for our customers. |
| | • | | TOFA. Our SYLFAT® TOFA serves as an intermediate in the synthesis of fatty amines, used as emulsifiers for the asphalt paving market, particularly cold paving. The cold paving market benefits from industry emphasis on pavement maintenance and also provides for environmental benefits as compared to traditional high temperature asphalt paving. |
| | • | | Bitumen Additives. Since 2010, we have been developing and implementing a strategy to create a bitumen additives business. The first new product, SYLVAROAD™ RP 1000 Performance Additive, was launched at the end of 2013. Developed specifically to address unmet needs of the asphalt paving market, the patent pending technology enables the use of reclaimed asphalt pavement (RAP) at high levels in an |
44
| | asphalt mix, while meeting local performance specifications. Our innovation enables a market that historically utilized about 20% RAP levels to improve to at least 50% RAP content or higher. For our customers, use of the additive to restore properties of aged binder yields many economic and environmental benefits: (1) it reduces the consumption of virgin materials; (2) it eliminates potential disposal fees; and (3) it increases sustainability of asphalt mixes. We have conducted testing to ensure the additive will perform over the designed lifetime of a road, an important need for road owners. |
Tires
We market AMS-based tread enhancement additives under the SYLVATRAXX™ trade name, with product attributes including rolling resistance, durability, wet grip enhancement and exceptional compatibility with rubber compounds, especially solution styrene butadiene rubber polymers. The quest for improved fuel economy has prompted the introduction of “green tires” of which certain of our products are a key component. AMS resins were the first tread enhancement additive commercialized beyond basic hydrocarbon tackifiers. AMS resins offer a range of wet grip improvement options with a good balance of properties, price and performance ratio for current generation tires, a key industry benchmark for performance. Current market trends are driving the use of our tread enhancers and processing aids.
Over 15 years ago, we became one of the first companies to supply tread enhancement resins to the tire industry and won early qualifications with innovative tire manufacturers. As such, we now supply six out of the top eight leading global tire manufacturers with performance tire tread enhancement resins. Beginning in 2011, we began a focused effort to expand into the Asian tire market and now derive close to 30% of our tire business unit revenue from Asia.
In the processing aid submarket, we have achieved a strong market position in the North American adhesion promotion and emulsification space, due to our strong technology base and suite of product offerings. As of September 30, 2015, our 34 granted tire application patents further bolster a strong technology base and product portfolio across both the tread enhancement and processing aid submarkets.
Our tread enhancement offerings serve to enhance the wet grip of tire treads without sacrificing durability and fuel economy in the manufacture of high performance winter and all-season tires. Our tread enhancement products are based on three main technology platforms: polyterpene, terpene phenolic and AMS resin-based tread enhancers.
Approximately $31.9 million, or 5.1%, and $46 million, or 4.9%, of our net sales for the nine months ended September 30, 2015 and the year ended December 31, 2014, respectively, were from products sold into the tires and rubber market. These products include:
| | • | | Terpene Tread Enhancement Resins. We offer a broad range of products including terpene phenol, double modified terpene phenol, terpene and polyterpene resins, which are marketed under the SYLVATRAXXTMtrade name. Terpene-based products offer unique performance attributes including excellent compatibility with a range of tire tread compound formulations, which optimizes wet grip improvements while maintaining rolling resistance and durability which contribute to improved vehicle fuel efficiency. Our products also allow tire manufacturers to achieve good mixing and processability of their high silica tread compounds. |
| | • | | AMS Tread Enhancement Resin. We market AMS-based tread enhancement additives under the SYLVATRAXXTM trade name, with product attributes including exceptional compatibility with rubber compounds, especially solution styrene butadiene rubber polymers. AMS resins offer a range of wet grip improvement options with a good balance of properties, price and performance ratio for current generation tires, a key industry benchmark for performance. |
| | • | | TOFA, DTO and Disproportionated Rosin Soap-Based Processing Aids.Products sold as processing aids provide select functionalities at various steps in the rubber and tire manufacturing process. These |
45
| | products are based on our strong CTO value chain, supply position and ability to meet and maintain quality levels necessary for the rubber and tire industries. In emulsion styrene butadiene rubber polymerization, processing aids have been used for many years as emulsifiers. There is a growth trend for use of higher performing processing aids utilizing TOFA and rosin technology due to the more difficult processing challenges of silica-based, green tires. |
Chemical Intermediates
The chemical intermediates market serves various submarkets with a wide product offering and provides value across several different applications:
| | • | | Fuel Additives. Lubricity additives in diesel, which prevent gripping of fuel injectors and pumps, are based on vegetable and animal derived fatty acids and synthetic derivatives such as poly methacrylates. Compared to other fatty acids, specific TOFA grades provide an advantage in handling and having a lower cloud point, which allows usage at lower temperatures. |
| | • | | Oilfield Chemicals. The oilfield chemicals submarket is attractive to us and we are recognized as a qualified supplier. Our TOFA and TOFA-based dimers compete with other fatty acids in this market, mainly oleic acids. TOFA is considered superior to oleic acids, as it provides better solubility in drilling muds as well as a higher surface activity and emulsifying power. |
| | • | | Mining. Our interest in the mining market is specific to the production and use of flotation agents to extract the desired mineral from ore. Unsaturated fatty acids like TOFA and oleic acid are mainly used in specific types of phosphate ore mining. Our TOFA is often preferred over oleic acid, as lower viscosity and higher affinity with the ore extract allow a higher recovery yield. |
| | • | | Coatings. The coatings submarket, specifically alkyd resins, represents a large market for unsaturated fatty acids, which serve as binders in solvent-based paints as well as in hybrid coatings. Our performance advantage in alkyd resins enables us to secure a price premium over various substitutes. From a functional perspective, TOFA is superior to other competing chemistries, as it provides better reactivity and compatibility versus other components. |
| | • | | Metalworking Fluids & Lubricants. The metalworking fluids and lubricants submarket encompasses chain saw, aluminum rolling, two cycle engine, marine, fiber spinning, greases and metal forming applications. The use of DTO, a mixture of TOFA and rosin acids, and a fraction of the CTO refining process, offers emulsification, dispersion, biocidal and anticorrosion properties required in water based metal working fluids. Producers of bio-based lubricants use ester and amide derivatives of TOFA, monomer acid, dimers, isostearic acids and hydroxystearic acids as raw materials. |
| | • | | Inks. Binders are a critical component of printing ink, as they hold the pigment to the printed surface and influence ink attributes, such as gloss, drying speed, viscosity and color intensity. Ink resins are based on rosin or rosin toluene solutions. These can be produced from gum rosin or TOR. |
| | • | | Flavors and Fragrances. In the flavors and fragrances submarket, we are focused on providing pinene-based supply. We have a strong, secure, long-term CST feedstock supply position that provides an advantage over other CST and gum turpentine-based competitors. Our strategy is to optimize the value of the CST feedstock positions and the pinene production not used in higher value upgrade markets, such as tires and adhesives. |
| | • | | Other.Other submarkets include paper chemicals, where TOR is used in the production of rosin size for the U.S. paper industry, synthetic rubber, where upgraded rosins are used as emulsifiers, and home and industrial applications, such as the use of TOFA as an intermediate in the production of surfactants and detergents. These and other submarkets are largely managed and served through distribution channels in the United States, Europe and Asia. |
46
Approximately $339.9 million, or 54.7%, and $557.2 million, or 59.4%, of our net sales for the nine months ended September 30, 2015 and the year ended December 31, 2014, respectively, were from products sold into the chemical intermediates submarkets as listed above. These products include:
| | • | | TOFA. The largest and most important products within the chemical intermediates business unit are TOFA and its derivatives, mainly TOFA-based dimer acids. Compared to other fatty acids obtained from various vegetable and animal origins, TOFA has a unique chemical composition characterized by distinctive features. For example: |
| | • | | in coatings, TOFA is preferred over soybean oil due to its higher unsaturation, better reactivity, flexibility and compatibility; |
| | • | | in mining, TOFA is preferred over oleic acid due to its lower viscosity, higher affinity with the ore, and resulting enhanced recovery yields; and |
| | • | | in oil and gas, TOFA is preferred over oleic acid given its easier handling, better solubility in organic media, as well as higher surface activity and emulsifying power. |
TOFA is a key component in additive packages to improve the lubricity of low-sulfur diesel fuel, preventing engine fuel pump wear. The chemical also enables producers of phosphate and phosphoric acid to run their plants more profitably through use as a flotation reagent in apatite mining. Furthermore, TOFA is a component in performance additives to aid the heat resistance of PVC and is used in alkyd paints, primarily for decorative coatings, helping to bring durability and gloss. Our TOFA-based products improve lubricity and are used in regions where good low temperature properties are required, or, as a rheology modifier in drilling muds. Several avenues for growth exist, including: (1) emerging economies adopting lower diesel emission standards already in force in developed nations, (2) increase in exploration and fracking of oil and gas resources, and (3) a rise in standard of living in emerging regions leading to the use of alkyd paints that are used in decorative coatings for durability and gloss characteristics.
| | • | | Dimer Acids. Dimer acids are obtained by treating TOFA at elevated temperatures in the presence of a catalyst. Our UNIDYME™ dimer acids are used for the production of polyamide resins for epoxy coatings, flexographic inks, and high performance adhesive applications. In addition, dimer acids are building blocks in the production of corrosion inhibitors and emulsifiers for the production and recovery of petroleum and natural gas. Major competitors in this area include producers of dimer acid from other feedstocks such as rapeseed and cottonseed oil, and other producers of TOFA-based dimers. We believe we are the only producer of dimer acids that is both backward-integrated to CTO and forward-integrated to polyamides. |
| | • | | TOR Chain. Our SYLVAROS™ tall oil rosins are used in all major rosin applications for the manufacture of resins for adhesives, inks, pavement marking, emulsifiers for rubber, size for paper and chewing gum. Derivatives of tall oil rosin include solution resinates, used in the manufacture of gravure ink resins in the publication industry, and disproportionated rosin soaps, used as process control agents for the polymerization of unsaturated hydrocarbons in the manufacture of synthetic rubber. We differentiate ourselves from competition through supply stability with scale through multiple sites, logistical capabilities and the option to supply in hot bulk, which provides customers manufacturing efficiencies. |
| | • | | DTO. DTO is one of the fractions resulting from the CTO refining process, consisting of a mixture of TOFA and rosin acids. Our DTO is primarily used as an emulsifier for metalworking fluids and lubricants, where our product offers performance attributes and, in many cases, replaces less environmentally friendly hydrocarbon-based chemicals. In these applications, it is sometimes used in place of TOFA. |
| | • | | Terpene Fractions. We supply terpene fractions, alpha-pinene and beta-pinene, mainly to the fragrance industry as raw material. We also sell CST directly to global flavor and fragrance producers. |
47
Financial Highlights
Our competitive strengths, together with the importance of our portfolio to our customer base, our value pricing and our ability to shift production and manage costs have enabled us to generate improving profit margins across diverse macroeconomic environments. Despite rapidly changing raw material, energy and freight costs, as well as difficult economic environment that affected the chemicals industry in late 2008 and 2009, we have been successful in increasing our Adjusted EBITDA and margins from $93.9 million and 12.2%, respectively, in 2009 to $191.6 million and 20.4%, respectively, in 2014. For a definition of Adjusted EBITDA, a description of our use of Adjusted EBITDA as a measure of operating performance and a reconciliation of Adjusted EBITDA to net income, see “Summary—Summary Consolidated Historical Financial Data—Arizona Chemical.” References to sales volumes in this subsection are inclusive of Pitch and raw materials.
Nine Months Ended September 30, 2015 Compared to Nine Months Ended September 30, 2014
Our net revenue for the nine months ended September 30, 2015 was $621.0 million on sales volumes of 454.0 kilotons as compared to net revenue of $728.3 million on sales volumes of 474.7 kilotons during the nine months ended September 30, 2014. The decline of $107.3 million, or 14.7%, was driven partially by the negative effect of currency fluctuations (primarily the Euro versus US dollar) which accounted for $63.0 million of the decrease and the remainder driven by $32.0 million of lower prices and $12.0 million due to lower sales volumes and mix. The decline in sales volumes was mostly attributable to sales volumes associated with our TOFA products sold to customers in North America. We continued to face strong competition in the markets where we sell TOFA products due primarily to oversupply of TOFA in the North America region. Our sales volume declines were partially offset by slightly higher prices for our rosin esters products which are sold into the adhesives and roads & construction markets. The slightly higher prices for our rosin esters products was driven by increased demand for hydrocarbon resin supplies, despite lower oil prices.
Our cost of goods sold for the nine months ended September 30, 2015 decreased by $88.3 million, or 17%, when compared to the nine months ended September 30, 2014. Lower oil prices resulted in lower costs for our raw materials, which contributed $22.0 million, currency fluctuations accounted for $53.0 million of the lower cost of goods sold and the remaining $13.3 million resulted from lower sales volumes and mix as further described in our description of net revenue above. Our Adjusted EBITDA for the nine months ended September 30, 2015 was $139.6 million, or 22.5% of net revenue. This compares with Adjusted EBITDA of $145.5 million, or 20% of net revenue during the nine months ended September 30, 2014. Lower sales prices were partially offset by lower raw material costs and lower SG&A expenses. For a reconciliation of Adjusted EBITDA to GAAP measures, see “Summary—Summary Consolidated Historical Financial Data—Arizona Chemical.”
Year Ended December 31, 2014 Compared to Year Ended December 31, 2013
Our net revenue for the year ended December 31, 2014 was $938.1 million on sales volumes of 620.4 kilotons as compared to net revenue of $992.3 million on sales volumes of 675.8 kilotons during the year ended December 31, 2013. The decline of $54.2 million, or 5.5%, was driven by $27.0 million of lower prices and $28.0 million due to lower sales volumes, partially offset by the positive effect of $1 million due to currency fluctuations (primarily the Euro versus US dollar). Lower sales prices and volumes for our TOFA products were driven by excess supply in the market in addition to widely available competing vegetable oil-based products. Lower sales prices for our TOFA products were partially offset by slightly higher prices for our rosin esters products which are sold into the adhesives and roads & construction markets. The slightly higher prices for our rosin esters products was driven by increased demand for hydrocarbon resin supplies, despite lower oil prices.
Our cost of goods sold for the year ended December 31, 2014 decreased by $40.0 million, or 5.6%, when compared to the year ended December 31, 2013. Lower oil prices resulted in lower costs for our raw materials which contributed $2.9 million and $33.6 million was driven by lower sales volumes. Currency fluctuations
48
accounted for $1.0 million of the lower cost of goods sold. Our Adjusted EBITDA for the year ended December 31, 2014 was $191.7 million or 20.5% of net revenue, compared to $204.9 million, or 20.7% of net revenue for the year ended December 31, 2013. Lower sales prices and volumes were only partially offset by lower raw material costs. Our SG&A expenses were approximately $5.7 million higher, however $14.0 million (including approximately $11.0 million in higher share based compensation and approximately $3.0 million of debt issue costs) are addbacks to our Adjusted EBITDA. Excluding these costs, our adjusted SG&A expenses were down approximately $9.0 million driven mostly by the reversal of previously accrued bonuses as we did not achieve our internal targets for payout. For a reconciliation of Adjusted EBITDA to GAAP measures, see “Summary—Summary Consolidated Historical Financial Data—Arizona Chemical.”
Year Ended December 31, 2013 Compared to Year Ended December 31, 2012
Our net revenue for the year ended December 31, 2013 was $992.3 million on sales volumes of 675.8 kilotons as compared to $1,041.6 million on sales volumes of 656.9 kilotons during the year ended December 31, 2012. The decline of $49.3 million, or 4.7%, was driven by $77.0 million of lower prices, partially offset by $11.3 million of higher sales volumes and $16.4 million in positive currency fluctuations effects (primarily the Euro versus US dollar). The sale price decreases were mainly the result of softer demand during the global economic uncertainty experienced in 2012 and in the first half of 2013, particularly in Europe and the Americas. Partially offsetting those price declines were higher prices for resins in the Asian markets resulting from constrained gum rosin supply in China. Sales volumes of our TOFA products increased during the first half of 2013 due to favorable supply and demand conditions. While the supply and demand conditions for TOFA products became less favorable in the second half of 2013, it did not offset the sales volume gains we experienced in the first half of 2013. Our sales volumes were also positively impacted by a lack of supply for TOR and rosin esters products.
Our cost of goods sold for the year ended December 31, 2013 decreased by $7.0 million, or 1.0%, when compared to the year ended December 31, 2012. Lower oil prices resulted in lower costs for our raw materials which contributed $22.0 million and was offset by positive currency fluctuations. Our Adjusted EBITDA for the year ended December 31, 2013 was $204.9 million or 20.7% of net revenue, compared to $240.6 million or 23.1% of net revenue for the year ended December 31, 2012. The decrease of $35.7 million or 17.4% was mainly driven by the price declines due to the global economic uncertainty in 2012 and the first half of 2013. These price declines were partially offset by decreases in raw material costs which reduced our cost of goods sold and slightly higher SG&A expenses due largely to increased recruiting costs following a reorganization of our commercial team. For a reconciliation of Adjusted EBITDA to GAAP measures, see “Summary—Summary Consolidated Historical Financial Data—Arizona Chemical.”
Sales and Marketing
As of September 30, 2015, we employed a total of 39 full-time sales employees with an average of over 10 years of experience. Our sales network consists of a direct sales force covering target markets for the Americas, Europe, including Russia, and Asia, three channel partners improving the coverage and sales process efficiency for selected chemical intermediates products and a network of distributors and agents in over 50 countries. Our sales personnel are primarily responsible for maintaining relationships with our customer base and coordinating contact between customers and research and development and marketing functions. We use third-party agents and distributors in markets where they have existing platforms and are more cost effective in completing market coverage.
Our direct sales force, agents and distributors were responsible for 91% and 86% of net revenue during the nine months ended September 30, 2015 and the year ended December 31, 2014, respectively, with channel partners accounting for the remainder. We maintain sales offices in Jacksonville and Miami, Florida; Almere, The Netherlands; San Juan del Rio, Mexico; Singapore; Moscow, Russia; and Shanghai, China.
49
Our marketing team is charged with maintaining our presence within existing markets and profitably expanding our presence in new markets. We employ a total of 19 full-time marketing employees globally. Our cross-functional teams are responsible for identifying unmet customer needs in our target markets, and our marketing personnel work directly with our customers and our research and development personnel to develop products and applications to meet the needs identified.
With approximately 550 customers in more than 68 countries, we have a broad customer base covering our diverse end-user industries. No single customer accounted for more than 10% of our net sales for the nine months ended September 30, 2015 or the year ended December 31, 2014 and, our top ten customers represented approximately 38% and 33% of our net sales for the nine months ended September 30, 2015 and the year ended December 31, 2014, respectively. Sales revenue derived from outside the United States and Europe increased from 11% of revenue in 2010 to 18% in 2014. For the nine months ended September 30, 2015, 47%, 38.1%, 11.8%, and 3.1% or our sales were generated in North America, Europe, Asia, and Latin America, respectively. For the year ended December 31, 2014, 41%, 41%, 12% and 6% or our sales were generated in North America, Europe, Asia, and Latin America, respectively.
Research, Development and Technology
Our research and development functions are organized to endeavor to optimize our ability to develop new products and new applications based on a thorough and informed understanding of our markets and the chemistries used in our business. We have developed new products in the last five years that have generated approximately 3.5% of net revenue in 2014. We incurred $8.2 million, $12.8 million, $13.3 million and $12.9 million in research and development expense for the nine months ended September 30, 2015 and the years ended December 31, 2014, 2013 and 2012, respectively, representing 1.3%, 1.1%, 1.3% and 1.2% of revenue, respectively.
Our research and development activities are primarily conducted in laboratories at our facilities located in Savannah, Georgia, Almere, The Netherlands, and Shanghai, China. In January 2014, we opened a new state-of-the-art facility in Savannah, Georgia at a total cost of approximately $10 million.
Our professionals develop new products in response to customer needs and provide technical service to customers that enhance customer relations. Additionally, we employ process engineers who work with our professionals to safely and efficiently transition products from the development phase to full-scale manufacturing, and who assist in the identification and development of new process technology and approaches. As of September 30, 2015, we employed 71 science professionals, 31 (or 37%) of whom hold advanced degrees (Masters or Ph.D.), and 17 process engineers. Over the past five years we have applied for 33 priority patents applications.
Our track record of product innovation extends more than 80 years and includes:
| | • | | adhesive tackifiers designed to enable the use of a higher amount of recycled content in packaging materials; |
| | • | | high solid adhesive dispersions for labels and tapes that allow for higher coating speeds and that lower process energy costs; |
| | • | | heat stable rheology, ink resins that reduce formulation complexity for ink manufacturers while improving print performance; |
| | • | | high performance tire tread resins that promote wet grip, fuel economy and tire life; |
| | • | | fuel lubricity improvers that ensure low sulfur targets for diesel fuel can be met; |
| | • | | bitumen additives for the asphalt paving market that enable high recycled content in asphalt mixes; and |
| | • | | insolublemaleic rosin esters used in pavement marking binders that provide thermal oxidation resistance. |
50
Sources and Availability of Raw Materials
We have the capacity to refine approximately 650,000 metric tons of CTO annually, representing what we believe is approximately 40% of global CTO refining capacity. We have an exclusive long-term supply contract with International Paper, through 2027, pursuant to which they have agreed to sell to us, and we agreed to purchase from them, all of the CTO and CST produced at their paper mills. We also maintain long-standing relationships with other major suppliers of CTO and CST in the United States and Europe.
We have access to a broad source of raw materials thanks to our ability to process a wide variety of CTO feedstocks. These include Black Liquor Soap (“BLS”), a precursor to CTO which we are able to refine into CTO in the United States. When we refer to CTO in this offering circular, we are referring generally to CTO and BLS, together. In addition, most of our manufacturing facilities are located in close proximity to the facilities of our raw material suppliers, allowing us to procure our raw materials at a low delivered cost. Furthermore, we work directly with our suppliers at their production facilities to enhance their CTO and CST yields through technological improvements, which maximize our raw material supplies, improves the efficiency of our suppliers’ operations and enables us to foster strong, long-lasting relationships with them.
Pricing
Our results of operations are partially dependent on pricing for raw materials, including CTO. Pricing for CTO is subject to particular pricing pressures, including, but not limited to, limited supply elasticity of the product and competing demand for its use. Factors which derive pressure on the price of CTO include:
| | • | | the global supply of CTO which is inherently constrained by the volume of kraft pulping processing; |
| | • | | the amount of CTO burned as alternative fuels, either in support of the originating pulp mill operations, by energy companies or biofuel companies; and |
| | • | | regulations or other incentives to mandate or encourage the consumption of biofuels as alternatives, including CTO. |
Competition
In each of our target markets, we compete on the basis of a range of factors, including: price, breadth of product availability, product quality, and the speed of service from order to delivery. We believe our customers also base their supply decisions on a supplier’s ability to design and produce customized products, the environmentally sustainable nature of pine chemicals compared to hydrocarbon-based alternatives and the availability of technical support.
Industry.Our most significant competitors in the specialty chemicals industry are: (1) other pine chemical manufacturers, including WestRock Co./Ingevity, Harima Lawter, Inc., Les Dérivés Résiniques et Terpéniques, Georgia-Pacific LLC, and Respol Group, (2) gum rosin processors, including Harima Lawter Inc. and (3) companies that refine and upgrade hydrocarbons or vegetable oil, including ExxonMobil Corp., Eastman Chemical Company, Archer-Daniels-Midland Company, BASF SE, Cargill, Inc., Energy Oleo Chemicals LLC, KLK Oleo, Oleon NV and Vantage Oleon Chemicals.
Product Substitution.We also compete against a broad range of pine, petrochemical, animal and vegetable-based substitutes throughout our product groups. See “—Our Products and Markets” for further discussion of product substitution.
Information Systems
We utilize ERP software systems to support our activities worldwide. Our ERP software systems utilize a single global system, which provides reliability of our systems. Our ERP software system also includes a customer relationship management system to drive revenue and maintain strong relationships with our customers. New technology continues to be approved and implemented to improve efficiencies, network resiliency and critical information protection.
51
Patents, Trademarks, Copyrights and Other Intellectual Property Rights
We have a sizable intellectual property portfolio, including both patents (current and pending) and trade secrets, as well as a wide range of trademarks that are well known and support the various market sectors in which we participate. Our proprietary knowledge has been a major contributing factor to our industry and market positions. As of September 30, 2015, we had 221 issued patents, with a further 115 patent applications pending globally. These protect our innovative technologies and applications against infringement, and create long-term, sustainable competitive advantages in our core growth markets. Patents are generally in effect for a period of 20 years after the filing date, and therefore, assuming most of these applications will be granted, a significant portion of our patent portfolio is expected to remain in effect for a long period.
As a result of developing products and markets with selected customers, we have three patent families that are jointly-held with certain of our customers. These patents are in the areas of tackifiers for adhesives and specialty polyamides for fragrance formulations. At the time of such product or market development, we entered into written agreements with these customers that limit the rights of each party with respect to jointly developed inventions and inventions made with confidential information of the other party. These written agreements were made in exchange for exclusive licenses or supply agreements, for limited periods.
As a general matter, our trade names are protected by trademark laws. We maintain a number of trademarks, including “ABIETA®”, “AQUATAC®”, “ARIZONA CHEMICAL®”, “CENTURY®”, “CENWAX®”, “RENEWABLE RESOURCES ENDLESS POSSIBILITIES®”, “SYLVABLEND®”, “SYLVACLEAR®”, “SYLVACOTE®”, “SYLFAT®”, “SYLVAFUEL®”, “SYLVAGEL®”, “SYLVAGUM®”, “SYLVALITE®”, “SYLVAMIN®”, “SYLVAPACK®”, “SYLVAPINE®”, “SYLVAPRINT®”, “SYLVARES®”, “SYLVAROAD®”, “SYLVAROS®”, “SYLVASOL®”, “SYLVATAC®”, “SYLVATAL®”, “SYLVATRAXX®”, “UNICLEAR®”, “UNIDYME®”, “UNIFLEX®”, “UNI-REZ®” and “ZONATAC®”, which are registered in the United States and in other countries.
We have accumulated a substantial amount of technical and business expertise. Our expertise includes product development, design and formulation, information relating to the applications in which its products are used, process and manufacturing technology, including the process and design information used in the operation, maintenance and debottlenecking of our manufacturing facilities, and the technical service that it provides to customers. We hold extensive discussions with customers and potential customers to define their market needs and product application opportunities. Where necessary, we have implemented trade secret protection for our technical knowledge through non-analysis, secrecy and related agreements.
Properties
Our principal executive offices are located at 4600 Touchton Road East, Building 100, Suite 1200, Jacksonville, Florida 32246 and at Transistorstraat 16, 1322 CE Almere, The Netherlands.
We believe that our properties and equipment are generally in good operating condition and are adequate for our present needs. Production capacity at our sites can vary depending on feedstock, product mix and operating conditions.
52
Our properties consist primarily of manufacturing facilities for the production of specialty chemicals. The following table sets forth our principal facilities:
| | | | | | | | | | |
Location | | Approximate
Square Footage | | | Use | | Owned/Leased | |
Panama City, Florida | | | 217,626 | | | Manufacturing and Warehouse | | | Owned | |
| | | |
Pensacola, Florida | | | 64,109 | | | Manufacturing | | | Owned | |
| | | |
Savannah, Georgia | | | 186,125 | | | Manufacturing and R&D | | | Owned | (1) |
| | | |
Dover, Ohio | | | 166,824 | | | Manufacturing | | | Owned | |
| | | |
Almere, The Netherlands | | | 42,590 | | | R&D | | | Owned | |
| | | |
Oulu, Finland | | | 167,681 | | | Manufacturing | | | Owned | (2) |
| | | |
Chester-le-Street, United Kingdom(3) | | | 57,458 | | | Manufacturing | | | Owned | |
| | | |
Niort, France | | | 187,405 | | | Manufacturing | | | Owned | |
| | | |
Sandarne, Sweden | | | 378,892 | | | Manufacturing | | | Owned | |
| | | |
Gersthofen, Germany | | | 39,116 | | | Manufacturing | | | Owned | |
| (1) | We own our BLS acidulation manufacturing facility located in Savannah, Georgia. However, this manufacturing facility is located on land that we lease from International Paper. This lease expires on February 28, 2057. |
| (2) | We own our manufacturing facility located in Oulu, Finland. However, this facility is located on land that we lease from Enso Oy. This lease expires on August 31, 2046, with an option to extend the term until August 31, 2095. |
| (3) | Our operations at Chester-le-Street, United Kingdom are being prepared for closure in late 2015. |
Employees
We had 1,120 employees, of which 1,082 are full-time employees, at September 30, 2015.
In Europe, a significant number of our employees are in arrangements similar to collective bargaining arrangements. In the United States, approximately 47% of our employees, limited to those of our hourly-paid manufacturing employees, are represented by unions. A collective bargaining agreement at our Savannah, Georgia manufacturing facility is currently under negotiation. We believe our relationships with our employees continue to be good.
Environmental Regulation
We are subject to extensive environmental, health and safety (“EHS”) laws and regulations in the United States, the European Union and elsewhere our operations are located. Many of these laws and regulations impose requirements relating to air emissions, wastewater discharges, the use, handling and disposal of hazardous materials and wastes, exposure to chemicals and other hazards, occupational health and safety, including dust and noise control, and the investigation and clean-up of contamination. Our facilities are required to obtain and comply with a wide variety of environmental permits and authorizations for different aspects of our operations. Environmental laws can impose liability for violations or in the event of harm to people, natural resources or property, and provide for substantial fines, injunctions and potential civil and criminal sanctions for violations. The nature of our operations exposes us to risks of liability pursuant to these laws and regulations as a result of the production, handling, use, storage, transportation and sale of materials that can cause contamination or personal injury when handled improperly or released into the environment. Our products, and the raw materials we handle, are also subject to stringent industrial hygiene regulations and assessment requirements.
53
Generally, environmental laws and regulations applicable to our operations are becoming increasingly more stringent and the cost of compliance with EHS requirements can be expected to increase over time. In particular, the European Union’s Registration, Evaluation and Authorization of Chemicals (“REACH”) directive which requires the registration and evaluation of potential environmental and health impacts of chemicals manufactured in or imported to the European Union, became effective in the European Union in 2012. REACH will impose additional costs on the chemical industry over the next 10 to 15 years and may affect customer demand for certain of our products or our ability to continue to manufacture and sell particular products in the European Union.
In addition, restrictions on the emission of greenhouse gas emissions in the European Union, which will become increasingly strict in future years, and pending legislative and regulatory initiatives in the United States and elsewhere could also increase our cost of production, affect the cost or availability of feedstocks or otherwise adversely affect our operations. Our operations in Europe are subject to binding caps on carbon dioxide emissions imposed by Member States of the European Union. Such measures could result in increased costs for us to operate and maintain our facilities. In the United States, various bills and regulatory initiatives have been introduced that would regulate emissions of carbon dioxide and other greenhouse gases from industrial facilities. Although we believe that the regulation of greenhouse gases will increase in the near future, we do not expect that they will materially affect our operations or cause us to materially exceed our level of anticipated capital expenditures.
We believe that we are in material compliance with current environmental laws and regulations and we have an EHS management system in place to ensure continued compliance. We currently estimate that any expenses incurred in maintaining compliance with these requirements will not materially affect our results of operations or cause us to materially exceed our anticipated level of capital expenditures. However, regulatory requirements or permit conditions may change, and we cannot predict the costs of, or expenses related to, additional measures that may be required to maintain compliance as a result of such future changes.
Environmental laws and regulations in various jurisdictions also can impose obligations to clean up contamination from current or historic operations. Under some circumstances, the current owner or operator of a site can be held responsible for the entire cost of the remediation of past contamination regardless of fault and regardless of whether the activity was legal at the time that it occurred. We can also be held liable for the remediation of contamination at offsite locations, including waste disposal sites that have been affected by past operations. Evaluating and estimating the potential liability related to site remediation projects involves significant uncertainties, and many of our facilities have been affected by contamination from historic operations. We currently estimate that the costs and expenses relating to clean up obligations will not materially affect our operations or cause us to materially exceed our level of anticipated capital expenditures.
Environmental contamination in excess of regulatory standards is known to exist at certain of our facilities, including our current and former facilities located in Dover, Ohio; Panama City and Pensacola, Florida; Savannah and Valdosta, Georgia; Sandarne, Sweden; Oulu, Finland; Niort, France; Chester-le-Street, U.K. and Gersthofen, Germany.
Costs of remediation at our current and former facilities are covered by indemnification agreements, insurance or through allocated reserves. We currently estimate that the costs of remediation will not materially affect our operations or cause us to materially exceed our anticipated level of capital expenditures.
Although resolution of environmental liabilities will require future cash outlays, it is not expected that such outlays will materially impact our liquidity position, although there can be no assurance that such impacts could not occur. As of September 30, 2015, we have accrued a $4.5 million reserve for environmental liabilities.
Our operations at Chester-le-Street, U.K. are being prepared for closure and additional environmental site investigations will be carried out. We do not expect there will be any material costs or expenses to address this site closure.
54
While we recognize that we may, in the future, be held liable with respect for remediation activities beyond those identified to date, at present we are not aware of any circumstances that are reasonably expected to give rise to remediation claims that would have a material adverse effect on our results of operations or cause us to exceed our projected level of required remedial expenditures.
Insurance
We have levels of insurance that we believe to be customary for a company of our size in our industry. Our insurance policies are subject to customary deductibles and limits.
Seasonality
Seasonality typically affects the availability of CTO and CST, our raw material inventory. Yields of CTO and CST are higher during the first half of the year, generally peaking during the early summer months, due to the natural growth and associated chemical yield cycles of trees in addition to higher yields from kraft pulping during the cooler months. Additionally, seasonal changes and weather conditions affect sales volumes with respect to road pavement and construction industries and generally result in higher sales volumes into this market in the second and third quarters of the calendar year compared to the first and fourth quarters of the calendar year.
Legal Proceedings
We received a claim on March 21, 2011, from a former customer, Mohawk Industries, Inc., relating to an alleged breach of warranty and breach of contract regarding delivery of resin products during the period 2005 through 2009. On March 6, 2014, the jury returned a verdict against us for $70.1 million. In addition, the trial court entered a separate judgment against us for attorneys’ fees, costs and interest of approximately $18.0 million. We have filed an appeal with the appellate court. Our insurance company is expected to reimburse us for the full amount of any judgments that are upheld on appeal.
We and certain of our subsidiaries, from time to time, are parties to various other legal proceedings, claims and disputes that have arisen in the ordinary course of business. These claims may involve significant amounts, some of which would not be covered by insurance. While the outcome of these proceedings cannot be predicted with certainty, our management does not expect any of these other existing matters, individually or in the aggregate, to have a material adverse effect upon our financial position, results of operations or cash flows.
55