Kraton Performance Polymers, Inc. Second Quarter 2016 Earnings Presentation July 28, 2016
1 Kraton Second Quarter 2016 Earnings Call Disclaimers Forward Looking Statements Some of the statements in this presentation contain forward-looking statements within the meaning of the Private Securities Litigation Reform Act of 1995. This presentation includes forward-looking statements that reflect our plans, beliefs, expectations, and current views with respect to, among other things, future events and financial performance. Forward-looking statements are often characterized by the use of words such as “outlook,” “believes,” “estimates,” “expects,” “projects,” “may,” “intends,” “plans”, “on track” “on trend”, or “anticipates,” or by discussions of strategy, plans or intentions, including all matters described on the slide titled “2016 Modeling Assumptions” including, but not limited to, expectations for revenue, adjusted EBITDA, depreciation and amortization, non-cash compensation expense, interest expense, tax provision, capital expenditures, spread between FIFO and ECRC, net debt, anticipated synergies and cost reset savings. All forward-looking statements in this presentation are made based on management's current expectations and estimates, which involve known and unknown risks, uncertainties, and other important factors that could cause actual results to differ materially from those expressed in forward-looking statements. These risks and uncertainties are more fully described in our latest Annual Report on Form 10-K, including but not limited to “Part I, Item 1A. Risk Factors” and “Part II, Item 7. Management’s Discussion and Analysis of Financial Condition and Results of Operations” therein, and in our other filings with the Securities and Exchange Commission, and include, but are not limited to, risks related to: the integration of Arizona Chemical (now, AZ Chem Holdings LP); Kraton's ability to repay its indebtedness; Kraton's reliance on third parties for the provision of significant operating and other services; conditions in the global economy and capital markets; fluctuations in raw material costs; limitations in the availability of raw materials; competition in Kraton's end-use markets; and other factors of which we are currently unaware or deem immaterial. Readers are cautioned not to place undue reliance on our forward-looking statements. Forward-looking statements speak only as of the date they are made, and we assume no obligation to update such information in light of new information or future events. Pro Forma Financial Information The unaudited pro forma information presented herein is for information purposes only and is not necessarily indicative of the operating results that would have occurred had the Arizona Chemical Acquisition been consummated at the beginning of the period, nor is it necessarily indicative of future operating results. The unaudited pro forma amounts above have been calculated after applying Kraton's accounting policies and adjusting the Arizona Chemical results to reflect (1) the additional depreciation and amortization that would have been charged assuming the fair value adjustments to property, plant, and equipment and intangible assets had been applied from January 1, 2015; (2) the elimination of historical interest expense for Arizona Chemical as this debt was paid off by the previous owners; (3) the additional interest expense resulting from the debt issued to fund the Arizona Chemical Acquisition; (4) the elimination of transaction-related costs; and (5) an adjustment to tax-effect the aforementioned unaudited pro forma adjustments using an estimated aggregate statutory income tax rate of the jurisdiction to which that above adjustments relate. The unaudited pro forma amounts do not include any potential synergies, cost savings or other expected benefits of the Arizona Chemical Acquisition
2 Kraton Second Quarter 2016 Earnings Call Disclaimers GAAP Disclaimer This presentation includes the use of both GAAP and non-GAAP financial measures. The non-GAAP financial measures are EBITDA, Adjusted EBITDA, Adjusted Gross Profit and Adjusted Net Income attributable to Kraton (or earnings per share). Tables included in this presentation and our earnings release reconcile each of these non-GAAP financial measures with the most directly comparable GAAP financial measure. For additional information on the impact of the spread between the FIFO basis of accounting and estimated current replacement cost (“ECRC”), see Management’s Discussion and Analysis of Financial Condition and Results of Operations in our Annual Report on Form 10-K for the fiscal year ended December 31, 2015. We consider these non-GAAP financial measures to be important supplemental measures of our performance and believe they are frequently used by investors, securities analysts and other interested parties in the evaluation of our performance including period-to-period comparisons and/or that of other companies in our industry. Further, management uses these measures to evaluate operating performance, and our incentive compensation plan bases incentive compensation payments on our Adjusted EBITDA performance, along with other factors. These non-GAAP financial measures have limitations as analytical tools and in some cases can vary substantially from other measures of our performance. You should not consider them in isolation, or as a substitute for analysis of our results under GAAP in the United States. For EBITDA, which represents net income before interest, taxes, depreciation and amortization, these limitations include: EBITDA does not reflect the significant interest expense on our debt; EBITDA does not reflect the significant depreciation and amortization expense associated with our long-lived assets; and EBITDA included herein should not be used for purposes of assessing compliance or non-compliance with financial covenants under our debt agreements. The calculation of EBITDA in our debt agreements includes adjustments, such as extraordinary, non-recurring or one-time charges, pro forma cost savings, certain non-cash items, turnaround costs, and other items included in the definition of EBITDA in our debt agreements. Other companies in our industry may calculate EBITDA differently than we do, limiting its usefulness as a comparative measure. As an analytical tool, Adjusted EBITDA is subject to all the limitations applicable to EBITDA. We prepare Adjusted EBITDA by eliminating from EBITDA the impact of a number of items we do not consider indicative of our on-going performance, including the spread between FIFO and ECRC, but you should be aware that in the future we may incur expenses similar to the adjustments in this presentation. Our presentation of Adjusted EBITDA should not be construed as an inference that our future results will be unaffected by unusual or non-recurring items. In addition, due to volatility in raw material prices, Adjusted EBITDA may, and often does, vary substantially from EBITDA and other performance measures, including net income calculated in accordance with U.S. GAAP; and Adjusted EBITDA may, and often will, vary significantly from EBITDA calculations under the terms of our debt agreements and should not be used for assessing compliance or non-compliance with financial covenants under our debt agreements. Because of these and other limitations, EBITDA and Adjusted EBITDA should not be considered as a measure of discretionary cash available to us to invest in the growth of our business. As a measure of our performance, Adjusted Gross Profit is limited because it often will vary substantially from gross profit calculated in accordance with U.S. GAAP due to volatility in raw material prices. Finally, we prepare Adjusted Net Income attributable to Kraton by eliminating from net income the impact of a number of items we do not consider indicative of our on-going performance, including the spread between FIFO and ECRC. Our presentation of non-GAAP financial measures and the adjustments made therein should not be construed as an inference that our future results will be unaffected by unusual or non-recurring items, and in the future we may incur expenses or charges similar to the adjustments made in the presentation of our non-GAAP financial measures.

3 Kraton Second Quarter 2016 Earnings Call Second Quarter 2016 Highlights Polymer segment Q2’16 operating income was $17.3 million, with Adjusted EBITDA(1) of $39.2 million; H1’16 operating income was $31.2 million, with Adjusted EBITDA of $91.4 million Chemical segment Q2’16 operating income was $29.5 million, with Adjusted EBITDA(1) of $53.5 million; H1’16 operating income(2) was $18.8 million, with Adjusted EBITDA(1) of $94.4 million Solid Q2 and YTD(2) Adjusted EBITDA(1) for Polymer and Chemical Segments Cost reduction and synergy capture programs remain on track Expect $25-$28 million of cost reductions in 2016 and $70 million by 2018 $3.1 million in Q2’16; $6.8 million in H1’16 Integration synergies of $21-$27 million expected in 2016 $6.9 million in Q2’16; $9.8 million in H1’16 Mailiao HSBC expansion capital cost expected at $185 million, below original $200+ million estimate On trend for 2016 debt reduction target Kraton net debt reduced by $48 million since March 31, 2016; expect Kraton net debt of approximately $1.6 billion by year end Strong volume growth in Polymers and stable performance in Chemicals Polymers sales volume up 17.9%, with growth in all three businesses Chemicals sales volume in line with Q2’15 and up 14.7% sequentially (1) See non-GAAP reconciliations included in the accompanying financial tables for the reconciliation of each non-GAAP measure to its most directly comparable GAAP measure. (2) Chemical segment results for the period January 6, 2016 (the date of the Arizona Chemical Acquisition) through June 30, 2016.
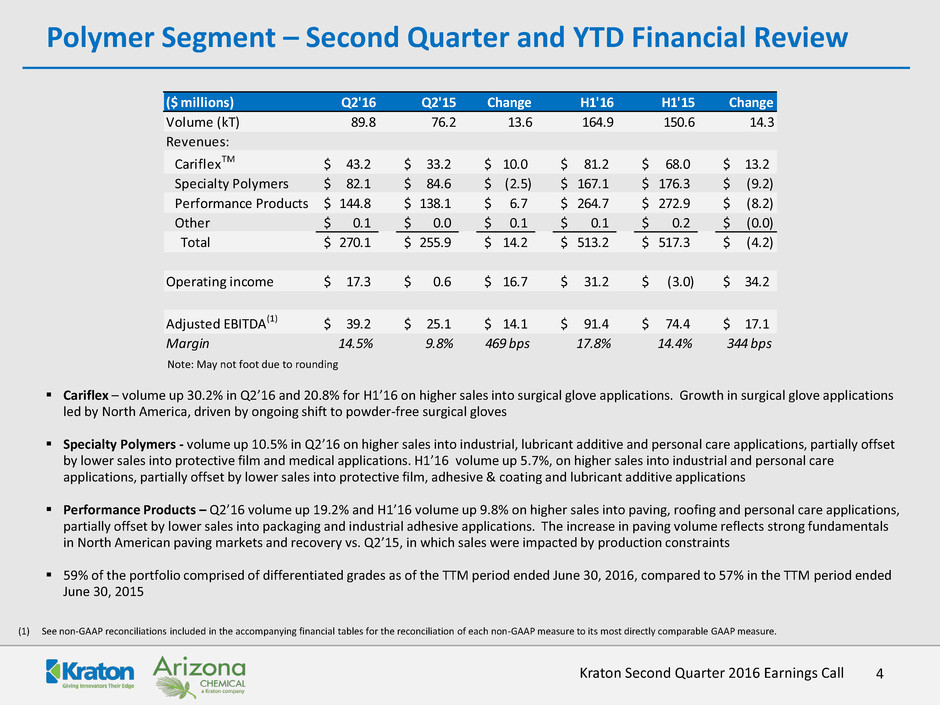
4 Kraton Second Quarter 2016 Earnings Call Polymer Segment – Second Quarter and YTD Financial Review (1) See non-GAAP reconciliations included in the accompanying financial tables for the reconciliation of each non-GAAP measure to its most directly comparable GAAP measure. Cariflex – volume up 30.2% in Q2’16 and 20.8% for H1’16 on higher sales into surgical glove applications. Growth in surgical glove applications led by North America, driven by ongoing shift to powder-free surgical gloves Specialty Polymers - volume up 10.5% in Q2’16 on higher sales into industrial, lubricant additive and personal care applications, partially offset by lower sales into protective film and medical applications. H1’16 volume up 5.7%, on higher sales into industrial and personal care applications, partially offset by lower sales into protective film, adhesive & coating and lubricant additive applications Performance Products – Q2’16 volume up 19.2% and H1’16 volume up 9.8% on higher sales into paving, roofing and personal care applications, partially offset by lower sales into packaging and industrial adhesive applications. The increase in paving volume reflects strong fundamentals in North American paving markets and recovery vs. Q2’15, in which sales were impacted by production constraints 59% of the portfolio comprised of differentiated grades as of the TTM period ended June 30, 2016, compared to 57% in the TTM period ended June 30, 2015 Note: May not foot due to rounding ($ millions) Q2'16 Q2'15 Change H1'16 H1'15 Change Volume (kT) 89.8 76.2 13.6 164.9 150.6 14.3 Revenues: CariflexTM 43.2$ 33.2$ 10.0$ 81.2$ 68.0$ 13.2$ Specialty Polymers 82.1$ 84.6$ (2.5)$ 167.1$ 176.3$ (9.2)$ Performance Products 144.8$ 138.1$ 6.7$ 264.7$ 272.9$ (8.2)$ Other 0.1$ 0.0$ 0.1$ 0.1$ 0.2$ (0.0)$ Total 270.1$ 255.9$ 14.2$ 513.2$ 517.3$ (4.2)$ Operating income 17.3$ 0.6$ 16.7$ 31.2$ (3.0)$ 34.2$ Adjusted EBITDA(1) 39.2$ 25.1$ 14.1$ 91.4$ 74.4$ 17.1$ Margin 14.5% 9.8% 469 bps 17.8% 14.4% 344 bps

5 Kraton Second Quarter 2016 Earnings Call (1) See non-GAAP reconciliations included in the accompanying financial tables for the reconciliation of each non-GAAP measure to its most directly comparable GAAP measure. (2) Chemical segment results for the period January 6, 2016 (the date of the Arizona Chemical Acquisition) through June 30, 2016. (3) The 2015 amounts have been derived from the Arizona Chemical historical operating results and are being included for comparative purposes only. Chemical Segment – Second Quarter and YTD(2) Financial Review Adhesives – Q2’16 volume essentially flat despite increased availability of low cost C5 hydrocarbon-based tackifier resins. H1’16 volume down 5.5% compared to H1’15, in part due to lower Q1’16 sales vs. Q1’15, in which sales volume benefitted from a competitor outage Roads & Construction – volume up 14.2% in Q2’16 and 9.4% for H1’16, driven by strong paving activity in North America Tires – volume essentially flat in Q2’16 and H1’16, as sales growth in Asia, offset by lower volumes into the Americas Chemical Intermediates – Q2’16 volume down 3.0% vs. Q2’15 with increased sales into coating, mining, lubricant, paper and oilfield applications offset by lower sales into other applications including packaging and flavors & fragrances. H1’16 sales volume down 3.6% vs. H1’15 Note: May not foot due to rounding ($ millions) Q2'16 Q2'15(3) Change H1'16(2) H1'15(3) Change Volume (kT) 108.9 110.5 (1.6) 203.7 210.6 (6.9) Revenues: Adhesives 63.2$ 67.9$ (4.7)$ 126.1$ 139.5$ (13.4)$ Roads & Construction 16.4$ 15.1$ 1.3$ 27.1$ 25.7$ 1.4$ Tires 10.9$ 11.3$ (0.4)$ 19.9$ 21.0$ (1.1)$ Chemical Intermediates 94.1$ 115.2$ (21.1)$ 188.4$ 227.3$ (38.9)$ Total 184.5$ 209.5$ (25.0)$ 361.4$ 413.5$ (52.1)$ Operating Income 29.5$ 18.8$ Adjusted EBITDA(1) 53.5$ 94.4$ Margin 29.0% 26.1%
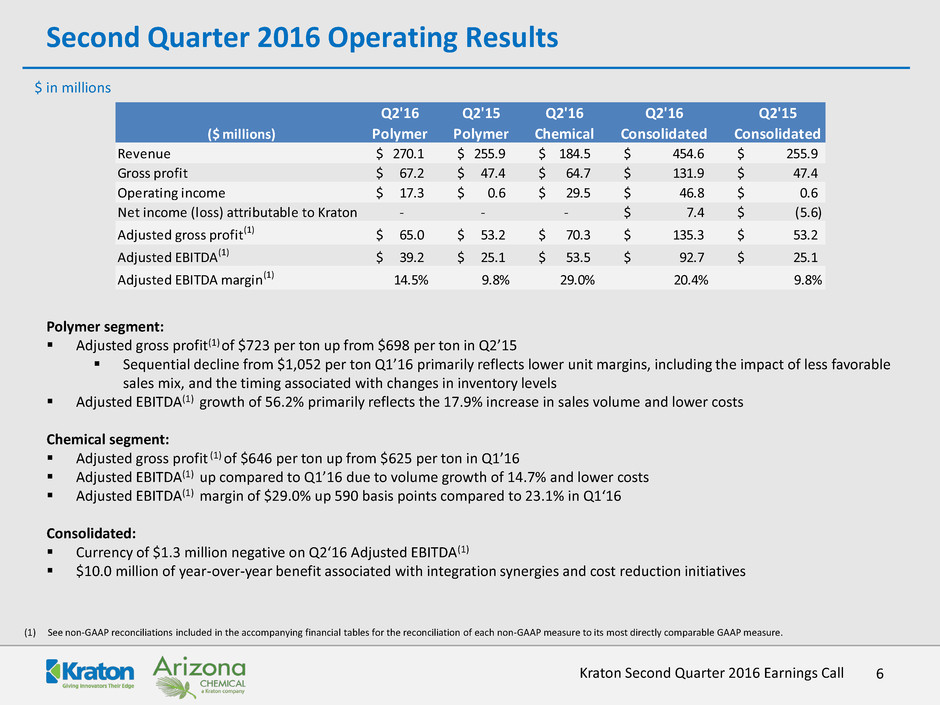
6 Kraton Second Quarter 2016 Earnings Call Second Quarter 2016 Operating Results $ in millions (1) See non-GAAP reconciliations included in the accompanying financial tables for the reconciliation of each non-GAAP measure to its most directly comparable GAAP measure. Polymer segment: Adjusted gross profit(1) of $723 per ton up from $698 per ton in Q2’15 Sequential decline from $1,052 per ton Q1’16 primarily reflects lower unit margins, including the impact of less favorable sales mix, and the timing associated with changes in inventory levels Adjusted EBITDA(1) growth of 56.2% primarily reflects the 17.9% increase in sales volume and lower costs Chemical segment: Adjusted gross profit (1) of $646 per ton up from $625 per ton in Q1’16 Adjusted EBITDA(1) up compared to Q1’16 due to volume growth of 14.7% and lower costs Adjusted EBITDA(1) margin of $29.0% up 590 basis points compared to 23.1% in Q1‘16 Consolidated: Currency of $1.3 million negative on Q2‘16 Adjusted EBITDA(1) $10.0 million of year-over-year benefit associated with integration synergies and cost reduction initiatives Q2'16 Q2'15 Q2'16 Q2'16 Q2'15 ($ millions) Polymer Polymer Chemical Consolidated Consolidated Revenue 270.1$ 255.9$ 184.5$ 454.6$ 255.9$ Gross profit 67.2$ 47.4$ 64.7$ 131.9$ 47.4$ Operating income 17.3$ 0.6$ 29.5$ 46.8$ 0.6$ Net income (loss) attributable to Kraton - - - 7.4$ (5.6)$ Adjusted gross profit(1) 65.0$ 53.2$ 70.3$ 135.3$ 53.2$ Adjusted EBITDA(1) 39.2$ 25.1$ 53.5$ 92.7$ 25.1$ Adjusted EBITDA margin(1) 14.5% 9.8% 29.0% 20.4% 9.8%

7 Kraton Second Quarter 2016 Earnings Call Year-to-Date 2016 Operating Results(1) $ in millions (1) Chemical segment results for the the period January 6, 2016 (the date of the Arizona Chemical Acquisition) through June 30, 2016. (2) See non-GAAP reconciliations included in the accompanying financial tables for the reconciliation of each non-GAAP measure to its most directly comparable GAAP measure. Polymer segment: Adjusted gross profit(2) of $873 per ton comparable to $884 per ton in H1’15 Adjusted EBITDA(2) growth of 22.9% results from 9.5% increase in volume, lower costs, partially offset by lower average unit margins, which includes the impact of less favorable sales mix Chemical segment: Q2’16 adjusted gross profit(2) of $646 per ton up from $625 per ton in Q1’16, resulting in H1’16 adjusted gross profit(2) of $636 per ton Consolidated Currency $4.3 million negative on H1’16 Adjusted EBITDA(2) $16.6 million benefit associated with integration synergies and cost reduction initiatives vs. H1’15 H1'16 H1'15 H1'16 H1'16 H1'15 ($ millions) Polymer Polymer Chemical (1) Consolidated Consolidated Revenue(1) 513.2$ 517.3$ 361.4$ 874.6$ 517.3$ Gross profit(1) 132.8$ 94.0$ 92.9$ 225.7$ 94.0$ Operating income(1) 31.2$ (3.0)$ 18.8$ 50.0$ (3.0)$ Net income (loss) attributable to Kraton - - - 95.5$ (15.0)$ Adjusted gross profit(1)(2) 143.9$ 133.2$ 129.6$ 273.5$ 133.2$ Adjusted EBITDA(1)(2) 91.4$ 74.4$ 94.4$ 185.8$ 74.4$ Adjusted EBITDA margin(1)(2) 17.8% 14.4% 26.1% 21.2% 14.4%
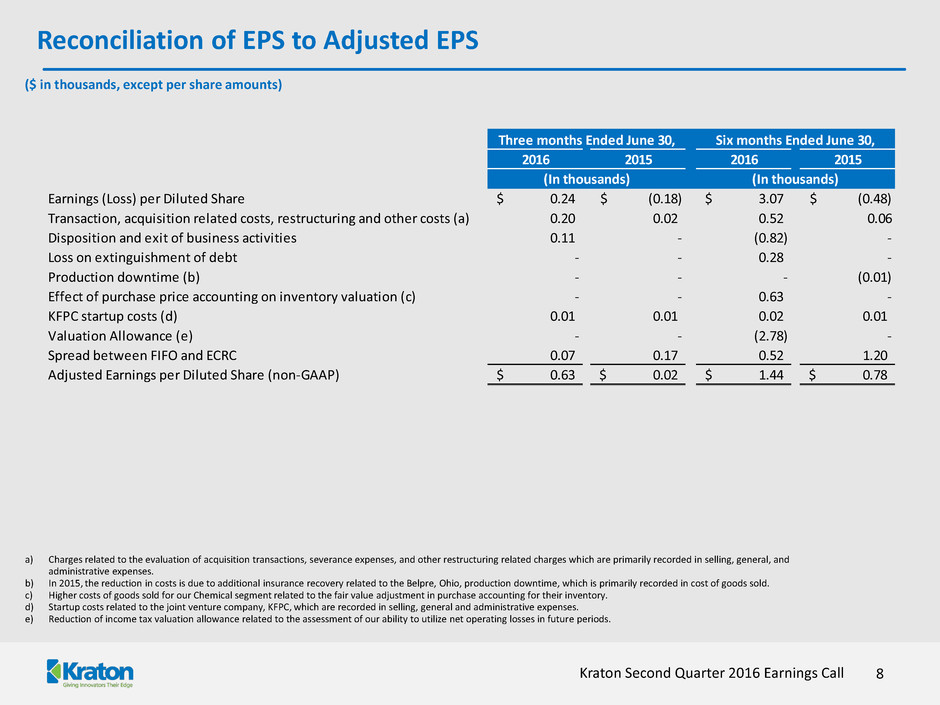
8 Kraton Second Quarter 2016 Earnings Call Reconciliation of EPS to Adjusted EPS ($ in thousands, except per share amounts) a) Charges related to the evaluation of acquisition transactions, severance expenses, and other restructuring related charges which are primarily recorded in selling, general, and administrative expenses. b) In 2015, the reduction in costs is due to additional insurance recovery related to the Belpre, Ohio, production downtime, which is primarily recorded in cost of goods sold. c) Higher costs of goods sold for our Chemical segment related to the fair value adjustment in purchase accounting for their inventory. d) Startup costs related to the joint venture company, KFPC, which are recorded in selling, general and administrative expenses. e) Reduction of income tax valuation allowance related to the assessment of our ability to utilize net operating losses in future periods. 2016 2015 2016 2015 Earnings (Loss) per Diluted Share 0.24$ (0.18)$ 3.07$ (0.48)$ Transaction, acquisition related costs, restructuring and other costs (a) 0.20 0.02 0.52 0.06 Disposition and exit of business activities 0.11 - (0.82) - Loss on extinguishment of debt - - 0.28 - Production downtime (b) - - - (0.01) Effect of purchase price accounting on inventory valuation (c) - - 0.63 - KFPC startup costs (d) 0.01 0.01 0.02 0.01 Valuation Allowance (e) - - (2.78) - Spread between FIFO and ECRC 0.07 0.17 0.52 1.20 Adjusted Earnings per Diluted Share (non-GAAP) 0.63$ 0.02$ 1.44$ 0.78$ (In thousands) (In thousands) Three months Ended June 30, Six months Ended June 30,

9 Kraton Second Quarter 2016 Earnings Call Cost Reduction Initiatives Remain on Target Manufacturing Optimization HSBC facility in Mailiao reached mechanical completion in Q2’16, expect commercial samples in Q4’16 Berre expansion design expected to be complete Q3’16 with anticipated mechanical completion by Q4’17 Asset Productivity Continuing favorability in new boilers due to natural gas pricing and electricity cogeneration Improvements in solvent recovery, BD unloading and packaging cost reductions Other manufacturing projects Complexity Reduction Cariflex “direct coupling” design underway with expected mechanical completion by Q4’17 SKU elimination work progressing along with service level optimization activities Other inventory reduction initiatives continue Total cost to achieve estimated at $90-$95 million 2015 Boiler Other 2016 2017 2018 $19 $25-$28 $70 $37-$47 $ in millions

10 Kraton Second Quarter 2016 Earnings Call Mailiao Update Kraton Formosa Polymers Corporation (KFPC) – 50/50 joint venture between Kraton and Formosa Petrochemical Corporation established February 2013 KFPC will own and operate a 30 kiloton hydrogenated styrenic block copolymer facility located in Mailiao, Taiwan Construction is mechanically complete, with plant going through commissioning steps Expect to introduce hydrocarbons in Q4’16, with commercial samples by end of Q4’16 Capital cost now estimated at $185 million, down from original cost estimates of $200 - $215 million
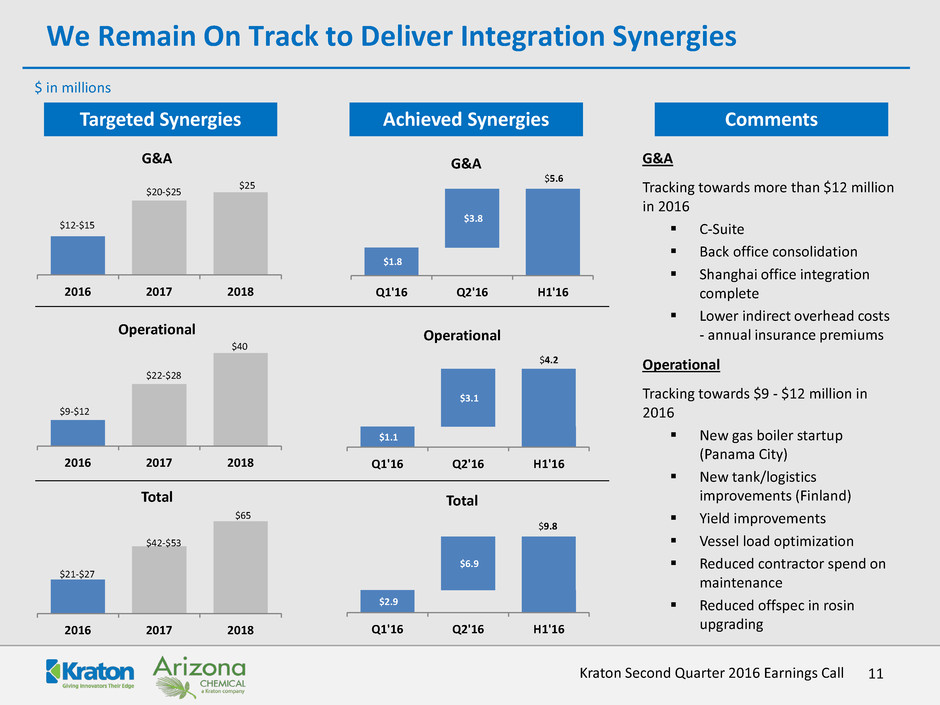
11 Kraton Second Quarter 2016 Earnings Call We Remain On Track to Deliver Integration Synergies G&A Tracking towards more than $12 million in 2016 C-Suite Back office consolidation Shanghai office integration complete Lower indirect overhead costs - annual insurance premiums Operational Tracking towards $9 - $12 million in 2016 New gas boiler startup (Panama City) New tank/logistics improvements (Finland) Yield improvements Vessel load optimization Reduced contractor spend on maintenance Reduced offspec in rosin upgrading 2016 2017 2018 G&A $12-$15 $20-$25 $25 2016 2017 2018 Operational $9-$12 $22-$28 $40 2016 2017 2018 Total $21-$27 $42-$53 $65 $ in millions Targeted Synergies Achieved Synergies Comments $1.8 $3.8 Q1'16 Q2'16 H1'16 G&A $5.6 $1.1 $3.1 Q1'16 Q2'16 H1'16 Operational $4.2 $2.9 $6.9 Q1'16 Q2'16 H1'16 Total $9.8
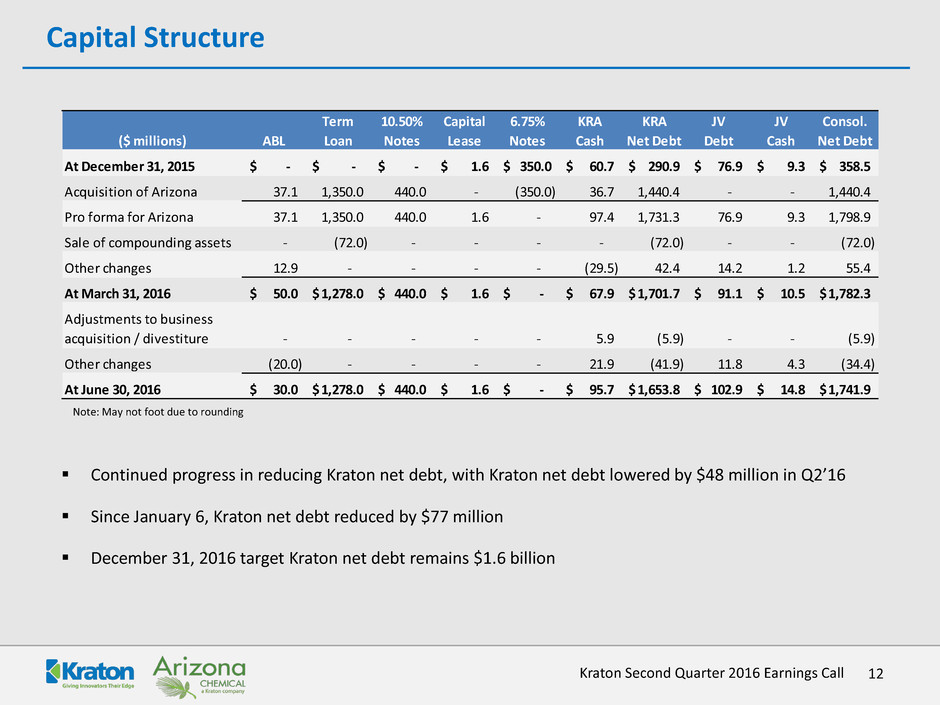
12 Kraton Second Quarter 2016 Earnings Call Capital Structure Continued progress in reducing Kraton net debt, with Kraton net debt lowered by $48 million in Q2’16 Since January 6, Kraton net debt reduced by $77 million December 31, 2016 target Kraton net debt remains $1.6 billion Note: May not foot due to rounding Term 10.50% Capital 6.75% KRA KRA JV JV Consol. ($ millions) ABL Loan Notes Lease Notes Cash Net Debt Debt Cash Net Debt At December 31, 2015 -$ -$ -$ 1.6$ 350.0$ 60.7$ 290.9$ 76.9$ 9.3$ 358.5$ Acquisition of Arizona 37.1 1,350.0 440.0 - (350.0) 36.7 1,440.4 - - 1,440.4 Pro forma for Arizona 37.1 1,350.0 440.0 1.6 - 97.4 1,731.3 76.9 9.3 1,798.9 Sale of compounding assets - (72.0) - - - - (72.0) - - (72.0) Other changes 12.9 - - - - (29.5) 42.4 14.2 1.2 55.4 At March 31, 2016 50.0$ 1,278.0$ 440.0$ 1.6$ -$ 67.9$ 1,701.7$ 91.1$ 10.5$ 1,782.3$ Adjustments to business acquisition / divestiture - - - - - 5.9 (5.9) - - (5.9) Other changes (20.0) - - - - 21.9 (41.9) 11.8 4.3 (34.4) At June 30, 2016 30.0$ 1,278.0$ 440.0$ 1.6$ -$ 95.7$ 1,653.8$ 102.9$ 14.8$ 1,741.9$

13 Kraton Second Quarter 2016 Earnings Call 2016 Modeling Assumptions(1) ($ in millions) Revenue $1,800 Adjusted EBITDA(2) $370 - $380 Non-cash compensation expense $10 Depreciation & amortization $125 - $130 Interest expense Includes estimated amortization of DFC and accretion of OID totaling approximately $14.0 million $135 - $140 Effective tax rate excluding release of valuation allowance in Q1 2016 10% – 15% Capex Excludes KFPC capex of approximately $50 million Excludes capitalized interest of $5 million $85 - $95 Estimated third quarter 2016 positive spread between FIFO and ECRC Less than $5 Estimated net debt at December 31, 2016 Excludes estimated KFPC net debt of approximately $130 million $1,600 Anticipated synergies from Arizona Chemical Acquisition in 2016 $21 - $27 Cost reset initiative savings in 2016 $25 - $28 (1) Management's estimates. These estimates are forward-looking statements and speak only as of July 28, 2016. Management assumes no obligation to update these estimates in light of new information or future events. (2) We have not reconciled Adjusted EBITDA guidance to net income (loss) because we do not provide guidance for net income (loss) or for items that we do not consider indicative of our on-going performance, including, but not limited to, transaction and acquisition costs and costs associated with dispositions, business exits, and production downtime, as certain of these items are out of our control and/or cannot be reasonably predicted. Accordingly, a reconciliation of the non-GAAP financial measure guidance to the corresponding GAAP measures is not available without unreasonable effort. Note: Non-cash compensation expense is excluded in determining Adjusted EBITDA and included in determining Adjusted EPS.
Appendix

15 Kraton Second Quarter 2016 Earnings Call Polymers – Revenue by Geography and Product Group TTM June 30, 2016 CARIFLEX R ev en u e b y G eog ra p h y R ev en u e b y P rod u ct G rou p SPECIALTY POLYMERS PERFORMANCE PRODUCTS Note: May not foot due to rounding
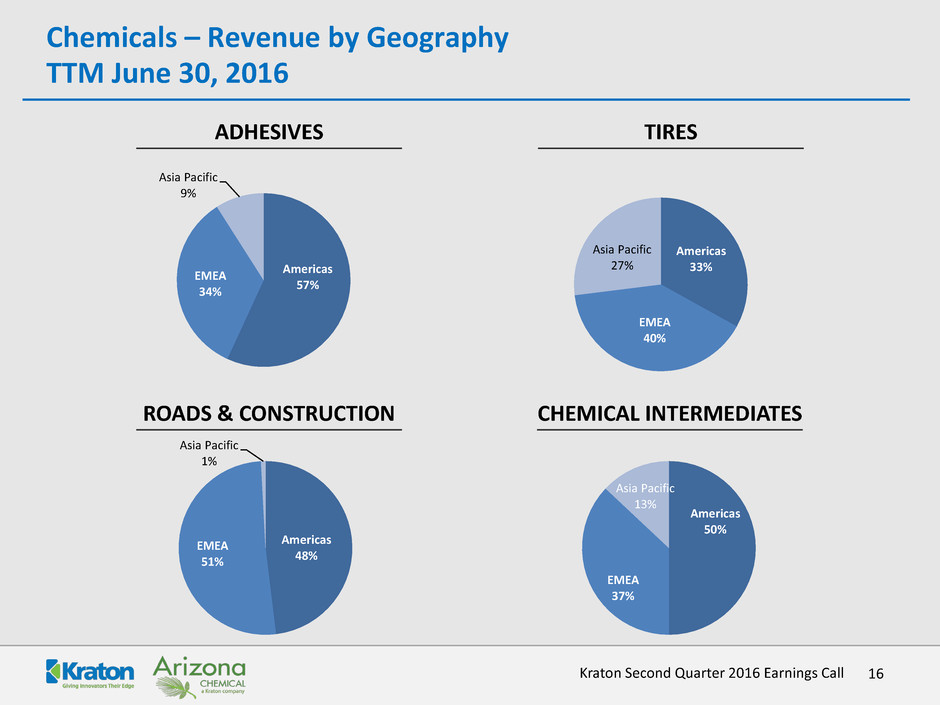
16 Kraton Second Quarter 2016 Earnings Call Chemicals – Revenue by Geography TTM June 30, 2016 ADHESIVES TIRES ROADS & CONSTRUCTION CHEMICAL INTERMEDIATES Americas 57% EMEA 34% Asia Pacific 9% Americas 33% EMEA 40% Asia Pacific 27% Americas 48% EMEA 51% Asia Pacific 1% Americas 50% EMEA 37% Asia Pacific 13%

Reconciliation of Gross Profit to Adjusted Gross Profit – Q2 2016 Columns may not foot due to rounding. 17 ($ in thousands) Three Months Ended June 30, 2016 Three Months Ended June 30, 2015 Polymer Chemical Total Total Gross profit $ 67,241 $ 64,656 $ 131,897 $ 47,436 Add (deduct): Restructuring and other charges 11 (149 ) (138 ) 53 Production downtime (a) — — — (171 ) Non-cash compensation expense 123 — 123 117 Spread between FIFO and ECRC (2,420 ) 5,812 3,392 5,810 Adjusted gross profit $ 64,955 $ 70,319 $ 135,274 $ 53,245 Sales volume (Kilotons) 89.8 108.9 198.7 76.2 Adjusted gross profit per ton $723 $646 $681 $698 Kraton Second Quarter 2016 Earnings Call a) In 2015, the reduction in costs is due to additional insurance recovery related to the Belpre, Ohio, production downtime.
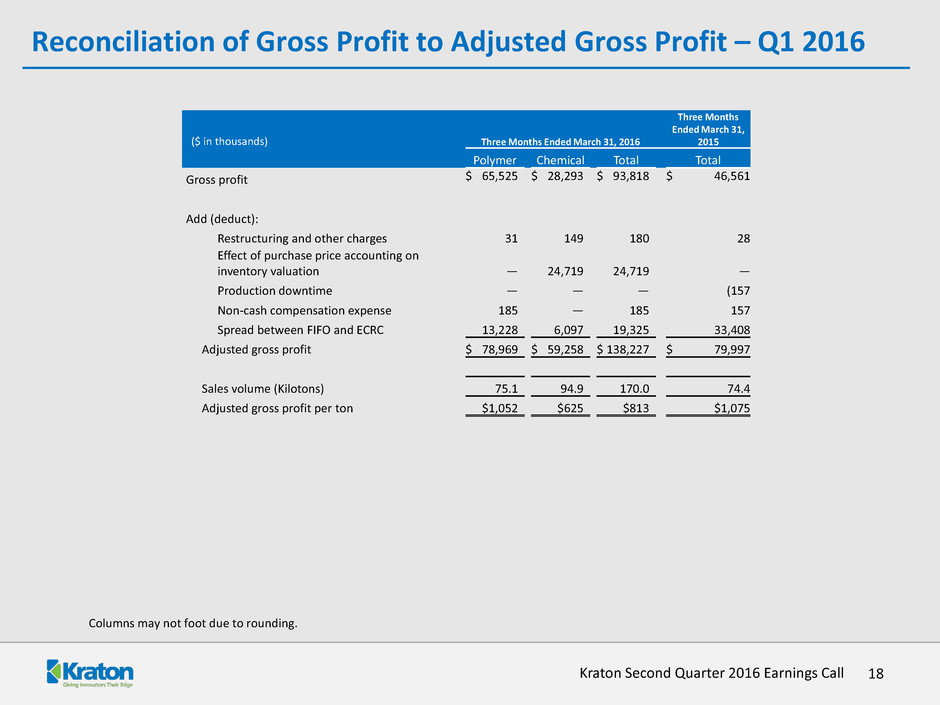
Reconciliation of Gross Profit to Adjusted Gross Profit – Q1 2016 Columns may not foot due to rounding. 18 Kraton Second Quarter 2016 Earnings Call ($ in thousands) Three Months Ended March 31, 2016 Three Months Ended March 31, 2015 Polymer Chemical Total Total Gross profit $ 65,525 $ 28,293 $ 93,818 $ 46,561 Add (deduct): Restructuring and other charges 31 149 180 28 Effect of purchase price accounting on inventory valuation — 24,719 24,719 — Production downtime — — — (157 Non-cash compensation expense 185 — 185 157 Spread between FIFO and ECRC 13,228 6,097 19,325 33,408 Adjusted gross profit $ 78,969 $ 59,258 $ 138,227 $ 79,997 Sales volume (Kilotons) 75.1 94.9 170.0 74.4 Adjusted gross profit per ton $1,052 $625 $813 $1,075
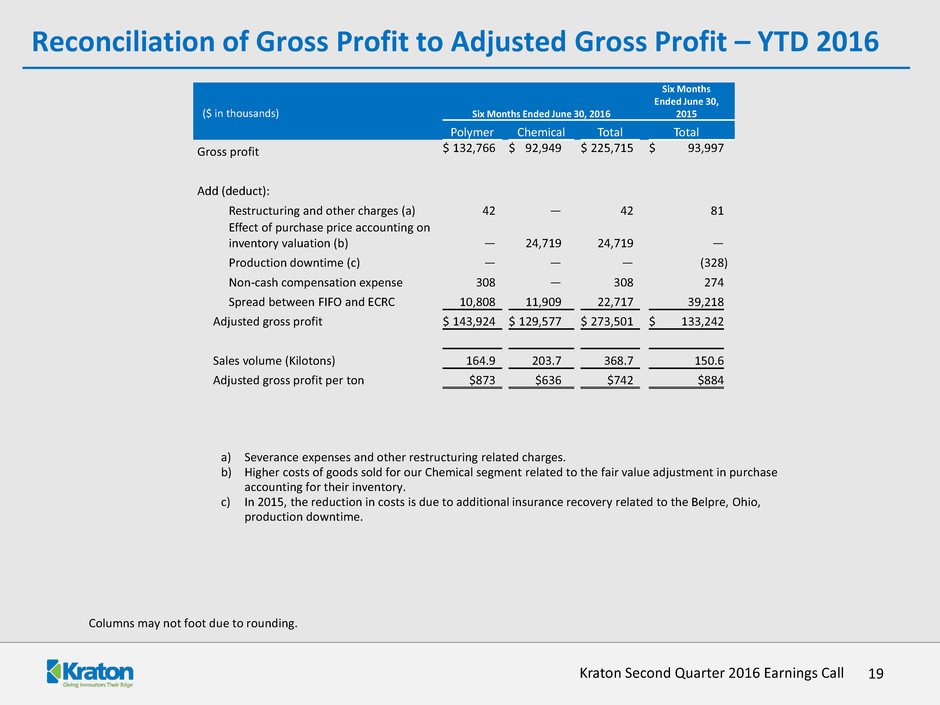
Reconciliation of Gross Profit to Adjusted Gross Profit – YTD 2016 Columns may not foot due to rounding. 19 ($ in thousands) Six Months Ended June 30, 2016 Six Months Ended June 30, 2015 Polymer Chemical Total Total Gross profit $ 132,766 $ 92,949 $ 225,715 $ 93,997 Add (deduct): Restructuring and other charges (a) 42 — 42 81 Effect of purchase price accounting on inventory valuation (b) — 24,719 24,719 — Production downtime (c) — — — (328 ) Non-cash compensation expense 308 — 308 274 Spread between FIFO and ECRC 10,808 11,909 22,717 39,218 Adjusted gross profit $ 143,924 $ 129,577 $ 273,501 $ 133,242 Sales volume (Kilotons) 164.9 203.7 368.7 150.6 Adjusted gross profit per ton $873 $636 $742 $884 Kraton Second Quarter 2016 Earnings Call a) Severance expenses and other restructuring related charges. b) Higher costs of goods sold for our Chemical segment related to the fair value adjustment in purchase accounting for their inventory. c) In 2015, the reduction in costs is due to additional insurance recovery related to the Belpre, Ohio, production downtime.
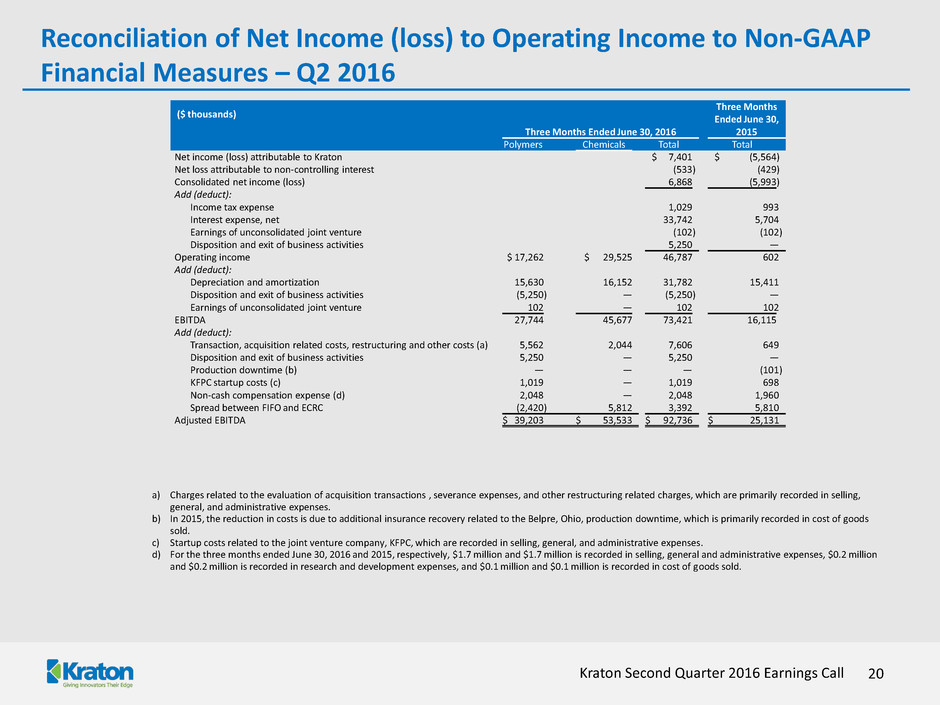
20 Kraton Second Quarter 2016 Earnings Call Reconciliation of Net Income (loss) to Operating Income to Non-GAAP Financial Measures – Q2 2016 ($ thousands) Three Months Ended June 30, 2016 Three Months Ended June 30, 2015 Polymers Chemicals Total Total Net income (loss) attributable to Kraton $ 7,401 $ (5,564 ) Net loss attributable to non-controlling interest (533 ) (429 ) Consolidated net income (loss) 6,868 (5,993 ) Add (deduct): Income tax expense 1,029 993 Interest expense, net 33,742 5,704 Earnings of unconsolidated joint venture (102 ) (102 ) Disposition and exit of business activities 5,250 — Operating income $ 17,262 $ 29,525 46,787 602 Add (deduct): Depreciation and amortization 15,630 16,152 31,782 15,411 Disposition and exit of business activities (5,250 ) — (5,250 ) — Earnings of unconsolidated joint venture 102 — 102 102 EBITDA 27,744 45,677 73,421 16,115 Add (deduct): Transaction, acquisition related costs, restructuring and other costs (a) 5,562 2,044 7,606 649 Disposition and exit of business activities 5,250 — 5,250 — Production downtime (b) — — — (101 ) KFPC startup costs (c) 1,019 — 1,019 698 Non-cash compensation expense (d) 2,048 — 2,048 1,960 Spread between FIFO and ECRC (2,420 ) 5,812 3,392 5,810 Adjusted EBITDA $ 39,203 $ 53,533 $ 92,736 $ 25,131 a) Charges related to the evaluation of acquisition transactions , severance expenses, and other restructuring related charges, which are primarily recorded in selling, general, and administrative expenses. b) In 2015, the reduction in costs is due to additional insurance recovery related to the Belpre, Ohio, production downtime, which is primarily recorded in cost of goods sold. c) Startup costs related to the joint venture company, KFPC, which are recorded in selling, general, and administrative expenses. d) For the three months ended June 30, 2016 and 2015, respectively, $1.7 million and $1.7 million is recorded in selling, general and administrative expenses, $0.2 million and $0.2 million is recorded in research and development expenses, and $0.1 million and $0.1 million is recorded in cost of goods sold.
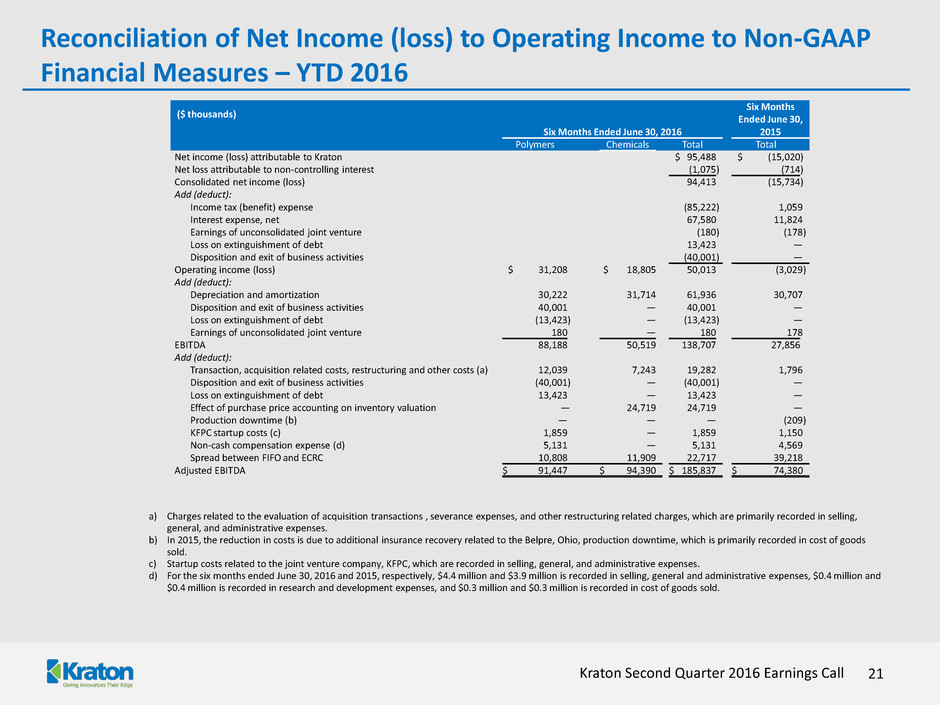
21 Kraton Second Quarter 2016 Earnings Call Reconciliation of Net Income (loss) to Operating Income to Non-GAAP Financial Measures – YTD 2016 ($ thousands) Six Months Ended June 30, 2016 Six Months Ended June 30, 2015 Polymers Chemicals Total Total Net income (loss) attributable to Kraton $ 95,488 $ (15,020 ) Net loss attributable to non-controlling interest (1,075 ) (714 ) Consolidated net income (loss) 94,413 (15,734 ) Add (deduct): Income tax (benefit) expense (85,222 ) 1,059 Interest expense, net 67,580 11,824 Earnings of unconsolidated joint venture (180 ) (178 ) Loss on extinguishment of debt 13,423 — Disposition and exit of business activities (40,001 ) — Operating income (loss) $ 31,208 $ 18,805 50,013 (3,029 ) Add (deduct): Depreciation and amortization 30,222 31,714 61,936 30,707 Disposition and exit of business activities 40,001 — 40,001 — Loss on extinguishment of debt (13,423 ) — (13,423 ) — Earnings of unconsolidated joint venture 180 — 180 178 EBITDA 88,188 50,519 138,707 27,856 Add (deduct): Transaction, acquisition related costs, restructuring and other costs (a) 12,039 7,243 19,282 1,796 Disposition and exit of business activities (40,001 ) — (40,001 ) — Loss on extinguishment of debt 13,423 — 13,423 — Effect of purchase price accounting on inventory valuation — 24,719 24,719 — Production downtime (b) — — — (209 ) KFPC startup costs (c) 1,859 — 1,859 1,150 Non-cash compensation expense (d) 5,131 — 5,131 4,569 Spread between FIFO and ECRC 10,808 11,909 22,717 39,218 Adjusted EBITDA $ 91,447 $ 94,390 $ 185,837 $ 74,380 a) Charges related to the evaluation of acquisition transactions , severance expenses, and other restructuring related charges, which are primarily recorded in selling, general, and administrative expenses. b) In 2015, the reduction in costs is due to additional insurance recovery related to the Belpre, Ohio, production downtime, which is primarily recorded in cost of goods sold. c) Startup costs related to the joint venture company, KFPC, which are recorded in selling, general, and administrative expenses. d) For the six months ended June 30, 2016 and 2015, respectively, $4.4 million and $3.9 million is recorded in selling, general and administrative expenses, $0.4 million and $0.4 million is recorded in research and development expenses, and $0.3 million and $0.3 million is recorded in cost of goods sold.


