UNITED STATES
SECURITIES AND EXCHANGE COMMISSION
Washington, D.C. 20549
FORM N-CSR
CERTIFIED SHAREHOLDER REPORT OF REGISTERED MANAGEMENT INVESTMENT COMPANIES
Investment Company Act file number 811-21744
Name of Fund: FDP Series, Inc.
Franklin Templeton Total Return FDP Fund
Invesco Value FDP Fund
Marsico Growth FDP Fund
MFS Research International FDP Fund
Fund Address: 100 Bellevue Parkway, Wilmington, DE 19809
Name and address of agent for service: John M. Perlowski, Chief Executive Officer, FDP Series, Inc., 55 East 52nd Street, New York, NY 10055
Registrant’s telephone number, including area code: (800) 441-7762
Date of fiscal year end: 05/31/2013
Date of reporting period: 11/30/2012
Item 1 – Report to Stockholders
NOVEMBER 30, 2012
| SEMI-ANNUAL REPORT (UNAUDITED) | |  |
FDP Series, Inc.
> MFS Research International FDP Fund
> Marsico Growth FDP Fund
> Invesco Value FDP Fund
> Franklin Templeton Total Return FDP Fund
Not FDIC Insured • May Lose Value • No Bank Guarantee
Table of Contents
FDP Series, Inc. is part of the Funds Diversified PortfoliosSM (FDP) Service. You may receive separate shareholder reports for other funds available through the Service.
| 2 | FDP SERIES, INC. | NOVEMBER 30, 2012 |
Dear Shareholder
As 2011 came to a close, financial markets were in a mode of gradual improvement, although volatility remained relatively high. Global central bank actions and better-than-expected economic data tempered investors’ anxiety after markets had been upended in mid-2011 by sovereign debt turmoil in the United States and Europe. Improving investor sentiment carried over into early 2012 as investors felt some relief from the world’s financial woes. Volatility was lower and risk assets (including stocks, commodities and high yield bonds) moved boldly higher through the first two months of 2012, while climbing US Treasury yields pressured higher-quality fixed income assets.
Markets reversed course in the spring when Europe’s debt problems boiled over once again. High levels of volatility returned as political instability threatened Greece’s membership in the eurozone and debt problems in Spain grew increasingly severe. Sovereign debt yields in peripheral European countries continued to rise, while finance leaders deliberated over the fiscal integration of the currency bloc. Alongside the drama in Europe, investors were discouraged by gloomy economic reports from various parts of the world. A slowdown in China, a key powerhouse for global growth, emerged as a particular concern. In the United States, disappointing jobs reports dealt a blow to investor sentiment. Risk assets sold off in the second quarter as investors retreated to safe haven assets.
Despite ongoing concerns about the health of the global economy and the debt crisis in Europe, most asset classes enjoyed a robust summer rally powered mainly by expectations for policy stimulus from central banks in Europe and the United States. Global economic data continued to be mixed, but the spate of downside surprises seen in the second quarter had receded and, outside of some areas of Europe, the risk of recession largely subsided. Additionally, in response to mounting debt pressures, the European Central Bank allayed fears by affirming its conviction to preserve the euro bloc. Early in September, the European Central Bank announced its plan to purchase sovereign debt in the eurozone’s most troubled nations. Later that month, the US Federal Reserve announced its long-awaited — and surprisingly aggressive — stimulus program involving agency mortgage-backed securities purchases. These central bank actions boosted investor confidence and risk assets rallied globally.
In the final months of the reporting period, most stock markets outside the United States continued to advance as macroeconomic fundamentals showed signs of improvement. However, as corporate earnings season got underway in the United States, lackluster results pointed to the fragility of global growth and pushed US equity markets down for the month of October. In November, investors around the world turned their attention to the US Presidential election and how the outcome might impact the ability of US politicians to resolve the nation’s looming budget crisis, known as the “fiscal cliff.” The election results led to heightened concerns that bipartisan gridlock may preclude a resolution before the end of the year when automatic tax increases and spending cuts would otherwise take effect. Trading activity was driven largely by daily reports out of Washington signaling that negotiations were progressing toward an agreement or spiraling toward a stalemate, but on the whole, November brought positive results for most markets.
All asset classes performed well for the 6- and 12-month periods ended November 30, 2012. Riskier assets outperformed higher quality investments as investors sought meaningful returns in a low-interest-rate environment. International and emerging market equities were the strongest performers during the six-month reporting period. US Treasury yields were volatile, but declined overall, resulting in moderate gains for higher quality fixed income sectors. Tax-exempt municipal bonds continued to benefit from a favorable supply-and-demand backdrop. Near-zero short term interest rates continued to keep yields on money market securities near their all-time lows.
Although the financial world remains highly uncertain, we believe there are new avenues of opportunity — new ways to invest and new markets to consider. We believe it’s our responsibility to help investors adapt to today’s new world of investing and build the portfolios these times require. We encourage you to visit www.blackrock.com/newworld for more information.
Sincerely,

Rob Kapito
President, BlackRock Advisors, LLC

“Although the financial world remains highly uncertain, we believe there are new avenues of opportunity.”
Rob Kapito
President, BlackRock Advisors, LLC
Total Returns as of November 30, 2012
| | | | |
| | 6-month | 12-month |
| |
| US large cap equities | 9.32 | % | 16.13 | % |
| (S&P 500® Index) | | | | |
| |
| US small cap equities | 8.68 | | 13.09 | |
| (Russell 2000® Index) | | | | |
| |
| International equities | 18.16 | | 12.61 | |
| (MSCI Europe, Australasia, | | | | |
| Far East Index) | | | | |
| |
| Emerging market equities | 12.63 | | 11.35 | |
| (MSCI Emerging | | | | |
| Markets Index) | | | | |
| |
| 3-month Treasury bill | 0.07 | | 0.09 | |
| (BofA Merrill Lynch | | | | |
| 3-Month US Treasury | | | | |
| Bill Index) | | | | |
| |
| US Treasury securities | 1.20 | | 7.31 | |
| (BofA Merrill Lynch 10- | | | | |
| Year US Treasury Index) | | | | |
| |
| US investment grade | 1.99 | | 5.51 | |
| bonds (Barclays US | | | | |
| Aggregate Bond Index) | | | | |
| |
| Tax-exempt municipal | 4.52 | | 10.94 | |
| bonds (S&P Municipal | | | | |
| Bond Index) | | | | |
| |
| US high yield bonds | 8.54 | | 17.02 | |
| (Barclays US Corporate | | | | |
| High Yield 2% Issuer | | | | |
| Capped Index) | | | | |
Past performance is no guarantee of future results. Index performance is shown for illustrative purposes only. You cannot invest directly in an index.
| | THIS PAGE NOT PART OF YOUR FUND REPORT | 3 |
| |
| Fund Summary as of November 30, 2012 | MFS Research International FDP Fund |
Investment Objective
MFS Research International FDP Fund’s (the “Fund”) investment objective is to seek to provide shareholders with capital appreciation.
Portfolio Management Commentary
How did the Fund perform?
| • | | For the six-month period ended November 30, 2012, the Fund underperformed both its primary benchmark, the MSCI Europe, Australasia and Far East (“EAFE”) Index, and its secondary benchmark, the MSCI All Country World (excluding US) Index. The following discussion of relative performance pertains to the MSCI EAFE Index. |
What factors influenced performance?
| • | | The Fund’s relative currency exposure, resulting primarily from differences between the benchmark index constituents and the Fund’s holdings of securities denominated in foreign currencies, was the largest detractor from performance for the period. Security selection in the energy sector also detracted from the Fund’s performance relative to the MSCI EAFE Index. Within this sector, the Fund’s position in the poor-performing oil and gas exploration company Inpex Corp. hurt returns. Additionally, a combination of stock selection and an underweight in financials had a negative impact on results, as did security selection in the consumer discretionary sector, where holdings of television broadcasting company Nippon Television Network Corp. (Japan) and export trading company Li & Fung Ltd. (Hong Kong) weakened relative performance. Notable individual detractors in other sectors included Australian mining company Iluka Resources Ltd., international food producer Danone SA (France), Japanese parcel delivery services company Yamato Holdings Co. Ltd., digital cameras and office equipment manufacturer Canon, Inc. (Japan), telecommunications service provider Tim Participacoes SA—ADR (Brazil) and medical diagnostics company Diagnosticos da America SA (Brazil). Lastly, as the MSCI EAFE Index rose during the period, holding cash hurt the Fund’s performance as compared to the benchmark index, which has no cash position. |
| • | | Relative to the MSCI EAFE Index, the Fund benefited from stock selection in the health care sector, where a position in the strong-performing German health care products maker Bayer AG boosted returns, and not holding the weak-performing pharmaceutical firm GlaxoSmithKline Plc (United Kingdom) proved to be an advantage. Elsewhere in the Fund, the most significant individual contributors included global banking group BNP Paribas SA (France), Dutch brewer Heineken NV and two financial services firms—Barclays Plc (United Kingdom) and ING Groep NV CVA (Netherlands). Other notable performers included Austrian financial services company Erste Group Bank AG, diversified bank Westpac Banking Corp. (Australia), French electrical distribution equipment manufacturer Schneider Electric SA and financial services provider HDFC Bank Ltd. (India). |
Describe recent portfolio activity.
| • | | In the industrials sector, the Fund continued to maintain a defensive, quality bias in the capital goods industry group with a focus on industry leaders with proven track records. In consumer discretionary, the Fund exited its position in Inditex SA, one of its better-performing global apparel retailers, due to concerns about its exposure to peripheral Europe, which accounts for a large part of the company’s revenues. The Fund used the proceeds of this sale to invest in another leading European apparel retailer, Hennes & Mauritz AB (H&M), which offers long-term competitive advantages and was trading at attractive valuations. In financials, the Fund maintained an underweight in European banks given concerns about structural issues such as the challenging growth environment and the eventual implementation of fiscal and austerity measures. |
Describe portfolio positioning at period end.
| • | | The Fund is a sector-neutral portfolio that emphasizes bottom-up fundamental analysis and therefore, regional and industry allocations are strictly a by-product of where Fund management finds the most attractive opportunities. Stock selection during the period resulted in slightly lower exposures to Europe and emerging markets and increased exposure to the Asia-Pacific region ex-Japan. |
The views expressed reflect the opinions of the Fund’s sub-advisor as of the date of this report and are subject to change based on changes in market, economic or other conditions. These views are not intended to be a forecast of future events and are no guarantee of future results.
| 4 | FDP SERIES, INC. | NOVEMBER 30, 2012 |
MFS Research International FDP Fund
Total Return Based on a $10,000 Investment
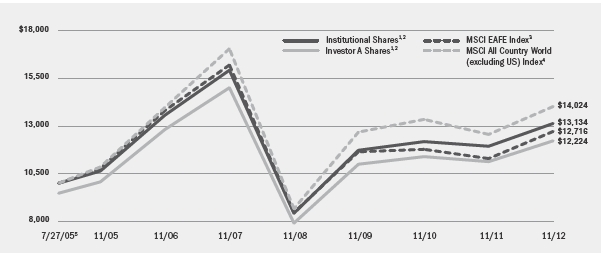
| 1 | | Assuming maximum sales charges, if any, transaction costs and other operating expenses, including advisory fees. Institutional Shares do not have a sales charge. |
| 2 | | The Fund invests, under normal market conditions, at least 65% of its assets in equity securities of foreign companies, including emerging market issuers. |
| 3 | | This unmanaged broad-based index measures the total returns of developed foreign stock markets in Europe, Australasia and the Far East. |
| 4 | | This market capitalization index is designed to measure equity market performance in the developed and emerging markets, excluding the US. |
| 5 | | Commencement of operations. |
Performance Summary for the Period Ended November 30, 2012
| | | | | Average Annual Total Returns 6 |
| | | | | 1 Year | | 5 Years | | Since Inception 7 |
| | 6-Month
Total Returns | | w/o sales
charge | w/sales
charge | | w/o sales
charge | w/sales
charge | | w/o sales
charge | w/sales
charge |
| Institutional | 15.82 | % | | 10.00 | % | N/A | | | (3.78 | )% | N/A | | | 3.78 | % | N/A | |
| Investor A | 15.65 | | | 9.82 | | 4.05 | % | | (4.02 | ) | (5.05 | )% | | 3.53 | | 2.77 | % |
| Investor B | 15.24 | | | 8.96 | | 4.46 | | | (4.78 | ) | (5.15 | ) | | 2.72 | | 2.72 | |
| Investor C | 15.16 | | | 8.94 | | 7.94 | | | (4.75 | ) | (4.75 | ) | | 2.74 | | 2.74 | |
| MSCI EAFE Index | 18.16 | | | 12.61 | | N/A | | | (4.73 | ) | N/A | | | 3.33 | | N/A | |
| MSCI All Country World (excluding US) Index | 16.35 | | | 11.66 | | N/A | | | (3.84 | ) | N/A | | | 4.71 | | N/A | |
| 6 | | Assuming maximum sales charges, if any. Average annual total returns with and without sales charges reflect reductions for distribution and service fees. See “About Fund Performance” on page 12 for a detailed description of share classes, including any related sales charges and fees. |
| 7 | | The Fund commenced operations on July 27, 2005. |
N/A — Not applicable as share class and index do not have a sales charge.
Past performance is not indicative of future results.
Expense Example
| | Actual | | Hypothetical9 | | |
| | Beginning
Account Value
June 1, 2012 | Ending
Account Value
November 30, 2012 | Expenses Paid
During the Period8 | | Beginning
Account Value
June 1, 2012 | Ending
Account Value
November 30, 2012 | Expenses Paid
During the Period8 | Annualized
Expense
Ratio |
| Institutional | $ | 1,000.00 | $ | 1,158.20 | $ | 6.93 | | $ | 1,000.00 | $ | 1,018.67 | $ | 6.48 | 1.28 | % |
| Investor A | $ | 1,000.00 | $ | 1,156.50 | $ | 8.22 | | $ | 1,000.00 | $ | 1,017.47 | $ | 7.69 | 1.52 | % |
| Investor B | $ | 1,000.00 | $ | 1,152.40 | $ | 12.63 | | $ | 1,000.00 | $ | 1,013.37 | $ | 11.81 | 2.34 | % |
| Investor C | $ | 1,000.00 | $ | 1,151.60 | $ | 12.35 | | $ | 1,000.00 | $ | 1,013.57 | $ | 11.56 | 2.29 | % |
| 8 | | For each class of the Fund, expenses are equal to the annualized expense ratio for the class, multiplied by the average account value over the period, multiplied by 183/365 (to reflect the one-half year period shown). |
| 9 | | Hypothetical 5% annual return before expenses is calculated by pro rating the number of days in the most recent fiscal half year divided by 365. |
See “Disclosure of Expenses” on page 13 for further information on how expenses were calculated.
| FDP SERIES, INC. | NOVEMBER 30, 2012 | 5 |
| |
| Fund Summary as of November 30, 2012 | Marsico Growth FDP Fund |
Investment Objective
Marsico Growth FDP Fund’s (the “Fund”) investment objective is to seek to provide shareholders with long-term growth of capital.
Portfolio Management Commentary
How did the Fund perform?
| • | | For the six-month period ended November 30, 2012, the Fund underperformed its benchmark, the S&P 500® Index. |
What factors influenced performance?
| • | | Stock selection in the consumer discretionary sector hampered performance, particularly in the consumer durables & apparel and retailing sub-sectors. Stock selection and an underweight allocation in the energy sector had a negative impact on returns as well. Positions in Mead Johnson Nutrition Co., Coach Inc., Nike Inc.–Class B and Halliburton Co. were the largest individual detractors in the period. Mead Johnson Nutrition Co., Coach Inc. and Halliburton Co. were sold during the period. In financials, stock selection hurt returns, as did an underweight allocation to the sector, which posted the strongest gain in the benchmark index for the period. |
| • | | Relative to the S&P 500® Index, the Fund benefited from stock selection in the information technology (“IT”) sector, most notably within the technology hardware & equipment space. Certain positions within the software & services industry group posted strong performance as well. The Fund’s lack of exposure to the weak-performing semiconductors & semiconductor equipment industry also had a positive impact on relative performance. Elsewhere in the Fund, the avoidance of utilities stocks proved beneficial as this sector generated the worst performance during the period. Notable individual contributors to the Fund’s performance included Visa, Inc., The Home Depot, Inc., Monsanto Co., Gilead Sciences, Inc., Biogen Idec, Inc. and Wynn Resorts Ltd. |
Describe recent portfolio activity.
| • | | During the six-month period, the Fund modestly increased its allocations to the health care, financials and consumer discretionary sectors, and pared its allocations to IT, consumer staples and energy. |
Describe portfolio positioning at period end.
| • | | On an absolute basis, the Fund’s largest sector allocations at period end included consumer discretionary, IT, health care and industrials. Relative to the S&P 500® Index, the Fund was most notably overweight in the consumer discretionary sector, while it was modestly overweight in materials and industrials. The Fund’s most significant underweights included consumer staples, financials and energy. The Fund had no exposure to telecommunication services or utilities. |
The views expressed reflect the opinions of the Fund’s sub-advisor as of the date of this report and are subject to change based on changes in market, economic or other conditions. These views are not intended to be a forecast of future events and are no guarantee of future results.
| 6 | FDP SERIES, INC. | NOVEMBER 30, 2012 |
Marsico Growth FDP Fund
Total Return Based on a $10,000 Investment
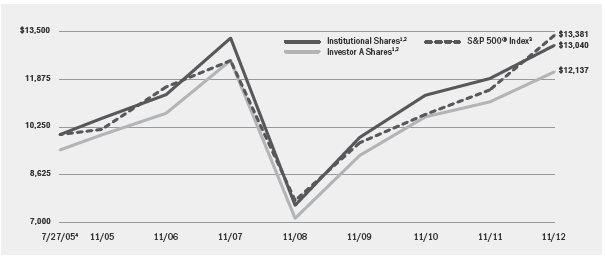
| 1 | | Assuming maximum sales charges, if any, transaction costs and other operating expenses, including advisory fees. Institutional Shares do not have a sales charge. |
| 2 | | The Fund invests primarily in equity securities of large cap companies that are selected for their growth potential. |
| 3 | | This unmanaged broad-based index is comprised of 500 industrial, utility, transportation and financial companies of the US markets (mostly New York Stock Exchange (“NYSE”) issues), representing about 75% of NYSE capitalization and 30% of NYSE issues. |
| 4 | | Commencement of operations. |
Performance Summary for the Period Ended November 30, 2012
| | | | | Average Annual Total Returns5 |
| | | | | 1 Year | | 5 Years | | Since Inception6 |
| | 6-Month
Total Returns | | w/o sales
charge | w/sales
charge | | w/o sales
charge | w/sales
charge | | w/o sales
charge | w/sales
charge |
| Institutional | 3.25 | % | | 9.49 | % | N/A | | | (0.38 | )% | N/A | | | 3.68 | % | N/A | |
| Investor A | 3.06 | | | 9.21 | | 3.47 | % | | (0.63 | ) | (1.69 | )% | | 3.43 | | 2.67 | % |
| Investor B | 2.72 | | | 8.33 | | 3.83 | | | (1.41 | ) | (1.81 | ) | | 2.62 | | 2.62 | |
| Investor C | 2.71 | | | 8.32 | | 7.32 | | | (1.38 | ) | (1.38 | ) | | 2.64 | | 2.64 | |
| S&P 500® Index | 9.32 | | | 16.13 | | N/A | | | 1.34 | | N/A | | | 4.04 | | N/A | |
5 Assuming maximum sales charges, if any. Average annual total returns with and without sales charges reflect reductions for distribution and service fees. See “About Fund Performance” on page 12 for a detailed description of share classes, including any related sales charges and fees.
6 The Fund commenced operations on July 27, 2005.
N/A — Not applicable as share class and index do not have a sales charge.
Past performance is not indicative of future results.
Expense Example
| | Actual | | Hypothetical8 | | |
| | Beginning
Account Value
June 1, 2012 | Ending
Account Value
November 30, 2012 | Expenses Paid
During the Period7 | | Beginning
Account Value
June 1, 2012 | Ending
Account Value
November 30, 2012 | Expenses Paid
During the Period7 | Annualized
Expense
Ratio |
| Institutional | $ | 1,000.00 | $ | 1,032.50 | $ | 5.55 | | $ | 1,000.00 | $ | 1,019.57 | $ | 5.52 | 1.09 | % |
| Investor A | $ | 1,000.00 | $ | 1,030.60 | $ | 6.77 | | $ | 1,000.00 | $ | 1,018.37 | $ | 6.73 | 1.33 | % |
| Investor B | $ | 1,000.00 | $ | 1,027.20 | $ | 10.93 | | $ | 1,000.00 | $ | 1,014.27 | $ | 10.86 | 2.15 | % |
| Investor C | $ | 1,000.00 | $ | 1,027.10 | $ | 10.67 | | $ | 1,000.00 | $ | 1,014.57 | $ | 10.61 | 2.10 | % |
| 7 | | For each class of the Fund, expenses are equal to the annualized expense ratio for the class, multiplied by the average account value over the period, multiplied by 183/365 (to reflect the one-half year period shown). |
| 8 | | Hypothetical 5% annual return before expenses is calculated by pro rating the number of days in the most recent fiscal half year divided by 365. |
See “Disclosure of Expenses” on page 13 for further information on how expenses were calculated.
| FDP SERIES, INC. | NOVEMBER 30, 2012 | 7 |
| |
| Fund Summary as of November 30, 2012 | Invesco Value FDP Fund |
Investment Objective
Invesco Value FDP Fund’s (the “Fund”) (formerly known as Van Kampen Value FDP Fund) investment objective is to seek to provide shareholders with capital growth and income.
Portfolio Management Commentary
How did the Fund perform?
| • | | For the six-month period ended November 30, 2012, the Fund’s Institutional and Investor A Shares outperformed its benchmark, the Russell 1000® Value Index, while the Fund’s Investor B and Investor C Shares performed in line with the benchmark index. |
What factors influenced performance?
| • | | The largest contribution to the Fund’s positive performance came from stock selection in the financials sector, specifically among large diversified financials and insurance stocks, where holdings in Citigroup, Inc. and The Allstate Corp., each delivered double-digit gains for the period. Also having a positive impact on Fund performance was stock selection and a sector overweight in consumer discretionary, particularly within the media industry, where holdings in Comcast Corp., Time Warner Cable, Inc. and Time Warner, Inc. were the strongest individual performers. The Fund’s underweight to utilities, which was the worst-performing sector in the benchmark index, proved beneficial for relative performance, as did stock selection within that space. Stock selection within materials enhanced performance, with International Paper Co. making a significant contribution to returns as the stock rallied on strong revenue growth. In the industrials sector, the Fund’s avoidance of the poor-performing FedEx Corp. and Norfolk Southern Corp. helped relative performance. In consumer staples, stock selection had a positive impact, with particularly strong performance from Unilever NV and the recently added Archer-Daniels-Midland Co. |
| • | | Detracting from performance relative to the benchmark index was stock selection and an overweight in the poor-performing information technology (“IT”) sector, where positions in Hewlett-Packard Co. and Microsoft Corp. produced negative returns. Stock selection in health care also hurt results as shares of Bristol-Myers Squibb Co., WellPoint, Inc. and UnitedHealth Group, Inc. declined during the period. Stock selection and an underweight to energy stocks detracted from performance, with a position in Weatherford International Ltd. posting negative returns as the company continued to struggle in an unfavorable drilling and service environment. In telecommunication services (“telecom”), holdings of Vodafone Group Plc and Verizon Communications, Inc. had a negative impact on the Fund’s performance, as did not owning strong performers such as Sprint Nextel Corp., which gained over 120% for the period. |
Describe recent portfolio activity.
| • | | During the six-month period, the Fund pared its industry group holdings based on relative valuations within select media, capital goods, telecom, and food and staples retailing names. In the consumer staples sector, the Fund initiated a position in Archer-Daniels-Midland Co. The Fund also added to select positions within the energy and health care sectors. |
Describe portfolio positioning at period end.
| • | | At period end, the Fund remained materially overweight relative to the Russell 1000® Value Index in consumer discretionary, particularly in the media industry, oil-related services (energy), diversified financial services (financials), pharmaceuticals (health care) and IT names. The Fund was underweight in materials, consumer staples, insurance (financials), telecom and utilities stocks. |
The views expressed reflect the opinions of the Fund’s sub-advisor as of the date of this report and are subject to change based on changes in market, economic or other conditions. These views are not intended to be a forecast of future events and are no guarantee of future results.
| 8 | FDP SERIES, INC. | NOVEMBER 30, 2012 |
Invesco Value FDP Fund
Total Return Based on a $10,000 Investment
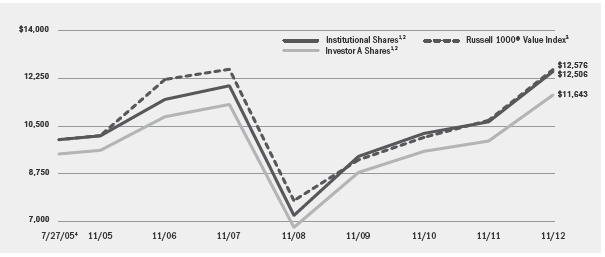
| 1 | | Assuming maximum sales charges, if any, transaction costs and other operating expenses, including advisory fees. Institutional Shares do not have a sales charge. |
| 2 | | The Fund invests, under normal market conditions, at least 80% of its net assets (plus any borrowings for investment purposes) in common stocks at the time of investment. The Fund invests primarily in a portfolio of equity securities, consisting principally of common stocks. |
| 3 | | This unmanaged broad-based index is a subset of the Russell 1000® Index consisting of those Russell 1000® securities with lower price/book ratios and lower forecasted growth values. |
| 4 | | Commencement of operations. |
Performance Summary for the Period Ended November 30, 2012
| | | | | | | | | | | | | | | | | |
| | | | | Average Annual Total Returns 5 |
| | | | | 1 Year | | 5 Years | | Since Inception 6 |
| | 6-Month
Total Returns | | w/o sales
charge | w/sales
charge | | w/o sales
charge | w/sales
charge | | w/o sales
charge | w/sales
charge |
| Institutional | 11.81 | % | | 17.37 | % | N/A | | | 0.86 | % | N/A | | | 3.09 | % | N/A | |
| Investor A | 11.70 | | | 17.02 | | 10.88 | % | | 0.61 | | (0.47 | )% | | 2.84 | | 2.09 | % |
| Investor B | 11.22 | | | 16.08 | | 11.58 | | | (0.18 | ) | (0.57 | ) | | 2.04 | | 2.04 | |
| Investor C | 11.25 | | | 16.19 | | 15.19 | | | (0.14 | ) | (0.14 | ) | | 2.07 | | 2.07 | |
| Russell 1000® Value Index | 11.20 | | | 17.45 | | N/A | | | (0.01 | ) | N/A | | | 3.17 | | N/A | |
| 5 | | Assuming maximum sales charges, if any. Average annual total returns with and without sales charges reflect reductions for distribution and service fees. See “About Fund Performance” on page 12 for a detailed description of share classes, including any related sales charges and fees. |
| 6 | | The Fund commenced operations on July 27, 2005. |
N/A — Not applicable as share class and index do not have a sales charge.
Past performance is not indicative of future results.
Expense Example
| | | | | | | | | | | | | | | |
| | Actual | | Hypothetical8 | | |
| | Beginning
Account Value
June 1, 2012 | Ending
Account Value
November 30, 2012 | Expenses Paid
During the Period7 | | Beginning
Account Value
June 1, 2012 | Ending
Account Value
November 30, 2012 | Expenses Paid
During the Period7 | Annualized
Expense
Ratio |
| Institutional | $ | 1,000.00 | $ | 1,118.10 | $ | 5.52 | | $ | 1,000.00 | $ | 1,019.87 | $ | 5.27 | 1.04 | % |
| Investor A | $ | 1,000.00 | $ | 1,117.00 | $ | 6.79 | | $ | 1,000.00 | $ | 1,018.67 | $ | 6.48 | 1.28 | % |
| Investor B | $ | 1,000.00 | $ | 1,112.20 | $ | 11.12 | | $ | 1,000.00 | $ | 1,014.57 | $ | 10.61 | 2.10 | % |
| Investor C | $ | 1,000.00 | $ | 1,112.50 | $ | 10.86 | | $ | 1,000.00 | $ | 1,014.77 | $ | 10.35 | 2.05 | % |
| 7 | | For each class of the Fund, expenses are equal to the annualized expense ratio for the class, multiplied by the average account value over the period, multiplied by 183/365 (to reflect the one-half year period shown). |
| 8 | | Hypothetical 5% annual return before expenses is calculated by pro rating the number of days in the most recent fiscal half year divided by 365. |
See “Disclosure of Expenses” on page 13 for further information on how expenses were calculated.
| FDP SERIES, INC. | NOVEMBER 30, 2012 | 9 |
| |
| Fund Summary as of November 30, 2012 | Franklin Templeton Total Return FDP Fund |
Investment Objective
Franklin Templeton Total Return FDP Fund’s (the “Fund”) investment objective is to seek to provide shareholders with high current income, consistent with preservation of capital. The Fund’s secondary objective is capital appreciation over the long term.
Portfolio Management Commentary
How did the Fund perform?
| • | | For the six-month period ended November 30, 2012, the Fund outperformed its benchmark, the Barclays US Aggregate Bond Index. |
What factors influenced performance?
| • | | Despite ongoing concerns about global economic growth and political and regulatory uncertainty around tax increases and spending cuts in the United States, US Treasuries lagged most spread sectors during the period. The Fund benefited from its holdings of non-US dollar-denominated bonds across the yield curve due to higher interest rates in non-US markets. The Fund’s foreign currency exposures also contributed positively to performance. Exposure to commercial mortgage-backed securities and security selection within that space had a positive impact on returns, as did an allocation to non-agency residential mortgage-backed securities (“RMBS”). Holdings in high yield corporate bonds provided a strong contribution to overall performance, while the Fund’s investment grade credit positions also enhanced results. In addition, the Fund’s yield curve positioning contributed positively. |
| • | | Relative to the Barclays US Aggregate Bond Index, the Fund’s lower weighting in agency debentures detracted slightly from performance for the period. |
Describe recent portfolio activity.
| • | | During the six-month period, the Fund slightly reduced exposure to investment grade corporate bonds and floating rate loan interests, while slightly increasing exposure to high yield corporate bonds. In the securitized space, the Fund decreased its allocations to asset-backed securities and US Treasury Inflation Protected Securities, and added to its RMBS allocation given attractive valuations in that space. Additionally, the Fund selectively pared its global bond exposure throughout the period to improve overall portfolio risk diversification. |
| • | | The Fund makes use of mortgage dollar roll transactions, which requires future mortgage settlements. To meet forward liabilities, cash is held or invested in high-quality assets. The Fund’s allocation to cash and cash equivalents did not materially impact performance during the period. |
Describe portfolio positioning at period end.
| • | | As of period end, the Fund remained overweight relative to the Barclays US Aggregate Bond Index in many of the credit sectors, including corporate credit and securitized products, where valuations appear attractive for the long term. The Fund also continued to maintain large exposures to international bonds and foreign currencies as many of the more favorable opportunities in global bond markets remained outside the United States. |
The views expressed reflect the opinions of the Fund’s sub-advisor as of the date of this report and are subject to change based on changes in market, economic or other conditions. These views are not intended to be a forecast of future events and are no guarantee of future results.
| 10 | FDP SERIES, INC. | NOVEMBER 30, 2012 |
Franklin Templeton Total Return FDP Fund
Total Return Based on a $10,000 Investment
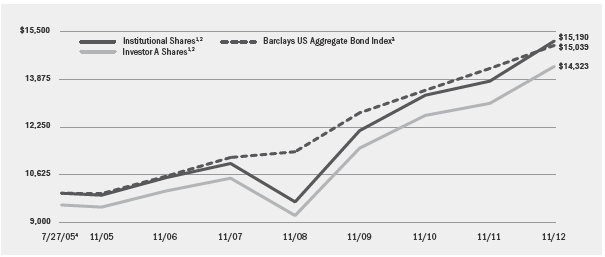
| 1 | | Assuming maximum sales charges, if any, transaction costs and other operating expenses, including advisory fees. Institutional Shares do not have a sales charge. |
| 2 | | The Fund invests, under normal market conditions, at least 80% of its assets in investment grade debt securities and investments, including government and corporate debt securities, mortgage- and asset-backed securities, investment grade corporate loans and futures with reference securities that are investment grade. |
| 3 | | This unmanaged market-weighted index is comprised of investment grade corporate bonds (rated BBB or better), mortgages and US Treasury and government agency issues with at least one year to maturity. |
| 4 | | Commencement of operations. |
Performance Summary for the Period Ended November 30, 2012
| | | | | | | Average Annual Total Returns5 |
| | | | | | | 1 Year | | 5 Years | | Since Inception6 |
| | Standardized
30-Day Yields | 6-Month
Total Returns | | w/o sales
charge | w/sales
charge | | w/o sales
charge | w/sales
charge | | w/o sales
charge | w/sales
charge |
| Institutional | 2.05 | % | 5.30 | % | | 9.91 | % | N/A | | | 6.64 | % | N/A | | | 5.86 | % | N/A | |
| Investor A | 1.74 | | 5.08 | | | 9.64 | | 5.26 | % | | 6.38 | | 5.52 | % | | 5.60 | | 5.01 | % |
| Investor B | 1.26 | | 4.79 | | | 9.05 | | 5.05 | | | 5.81 | | 5.49 | | | 5.04 | | 5.04 | |
| Investor C | 1.25 | | 4.78 | | | 9.04 | | 8.04 | | | 5.79 | | 5.79 | | | 5.01 | | 5.01 | |
| Barclays US Aggregate Bond Index | — | | 1.99 | | | 5.51 | | N/A | | | 6.04 | | N/A | | | 5.71 | | N/A | |
| 5 | | Assuming maximum sales charges, if any. Average annual total returns with and without sales charges reflect reductions for distribution and service fees. See “About Fund Performance” on page 12 for a detailed description of share classes, including any related sales charges and fees. |
| 6 | | The Fund commenced operations on July 27, 2005. |
N/A — Not applicable as share class and index do not have a sales charge.
Past performance is not indicative of future results.
Expense Example
| | Actual | | Hypothetical8 | | |
| | Beginning
Account Value
June 1, 2012 | Ending
Account Value
November 30, 2012 | Expenses Paid
During the Period7 | | Beginning
Account Value
June 1, 2012 | Ending
Account Value
November 30, 2012 | Expenses Paid
During the Period7 | Annualized
Expense
Ratio |
| Institutional | $ | 1,000.00 | $ | 1,053.00 | $ | 3.65 | | $ | 1,000.00 | $ | 1,012.47 | $ | 3.60 | 0.71 | % |
| Investor A | $ | 1,000.00 | $ | 1,050.80 | $ | 4.88 | | $ | 1,000.00 | $ | 1,020.27 | $ | 4.81 | 0.95 | % |
| Investor B | $ | 1,000.00 | $ | 1,047.90 | $ | 7.75 | | $ | 1,000.00 | $ | 1,017.47 | $ | 7.64 | 1.51 | % |
| Investor C | $ | 1,000.00 | $ | 1,047.80 | $ | 7.80 | | $ | 1,000.00 | $ | 1,017.47 | $ | 7.69 | 1.52 | % |
| 7 | | For each class of the Fund, expenses are equal to the annualized expense ratio for the class, multiplied by the average account value over the period, multiplied by 183/365 (to reflect the one-half year period shown). |
| 8 | | Hypothetical 5% annual return before expenses is calculated by pro rating the number of days in the most recent fiscal half year divided by 365. |
See “Disclosure of Expenses” on page 13 for further information on how expenses were calculated.
| FDP SERIES, INC. | NOVEMBER 30, 2012 | 11 |
About Fund Performance
Shares are only available for purchase through the FDP Service.
| • | | Institutional Shares are not subject to any sales charge. These shares bear no ongoing distribution or service fees and are available only to eligible investors. |
| • | | Investor A Shares (for all Funds except Franklin Templeton Total Return FDP Fund) are subject to a maximum initial sales charge (front-end load) of 5.25% and a service fee of 0.25% per year (but no distribution fee). Investor A Shares for Franklin Templeton Total Return FDP Fund incur a maximum initial sales charge (front-end load) of 4.00% and a service fee of 0.25% per year (but no distribution fee). |
| • | | Investor B Shares (for all Funds except Franklin Templeton Total Return FDP Fund) are subject to a maximum contingent deferred sales charge (“CDSC”) of 4.50% declining to 0% after six years. In addition, these shares are subject to a distribution fee of 0.75% per year and a service fee of 0.25% per year. These shares automatically convert to Investor A Shares after approximately eight years. (There is no initial sales charge for automatic share conversions.) Investor B Shares for Franklin Templeton Total Return FDP Fund are subject to a maximum CDSC of 4.00% declining to 0% after six years. In addition, its Investor B Shares are subject to a distribution fee of 0.50% per year and a service fee of 0.25% per year. These shares automatically convert to Investor A Shares after approximately ten years. (There is no initial sales charge for automatic share conversions.) Investor B Shares of the Funds are only available through exchanges and dividend reinvestments by existing shareholders and for purchase by certain qualified employee benefit plans. |
| • | | Investor C Shares (for all Funds except Franklin Templeton Total Return FDP Fund) are subject to a distribution fee of 0.75% per year and a service fee of 0.25% per year. Investor C Shares for Franklin Templeton Total Return FDP Fund are subject to a distribution fee of 0.55% per year and a service fee of 0.25% per year. In addition, these shares for all Funds are subject to a 1.00% CDSC if redeemed within one year of purchase. |
Performance information reflects past performance and does not guarantee future results. Current performance may be lower or higher than the performance data quoted. Refer to www.blackrock.com/funds to obtain performance data current to the most recent month end. Performance results do not reflect the deduction of taxes that a shareholder would pay on fund distributions or the redemption of fund shares. Figures shown in the performance tables on the previous pages assume reinvestment of all dividends and capital gain distributions, if any, at net asset value (“NAV”) on the ex-dividend date. Investment return and principal value of shares will fluctuate so that shares, when redeemed, may be worth more or less than their original cost. Dividends paid to each class of shares will vary because of the different levels of service, distribution and transfer agency fees applicable to each class, which are deducted from the income available to be paid to shareholders. In certain periods, the Funds’ investment advisor waived a portion of its fees. Without such waiver, the Funds’ performance would have been lower.
| 12 | FDP SERIES, INC. | NOVEMBER 30, 2012 |
Disclosure of Expenses
Shareholders of each Fund may incur the following charges: (a) expenses related to transactions, including sales charges and exchange fees; and (b) operating expenses, including advisory fees, service and distribution fees, including 12b-1 fees, and other Fund expenses. The expense examples on the previous pages (which are based on a hypothetical investment of $1,000 invested on June 1, 2012 and held through November 30, 2012) are intended to assist shareholders both in calculating expenses based on an investment in each Fund and in comparing these expenses with similar costs of investing in other mutual funds.
The expense examples provide information about actual account values and actual expenses. In order to estimate the expenses a shareholder paid during the period covered by this report, shareholders can divide their account value by $1,000 and then multiply the result by the number corresponding to their Fund and share class under the heading entitled “Expenses Paid During the Period.”
The expense examples also provide information about hypothetical account values and hypothetical expenses based on each Fund’s actual expense ratio and an assumed rate of return of 5% per year before expenses. In order to assist shareholders in comparing the ongoing expenses of investing in these Funds and other funds, compare the 5% hypothetical examples with the 5% hypothetical examples that appear in other funds’ shareholder reports.
The expenses shown in the expense examples are intended to highlight shareholders’ ongoing costs only and do not reflect any transactional expenses, such as sales charges or exchange fees, if any. Therefore, the hypothetical examples are useful in comparing ongoing expenses only, and will not help shareholders determine the relative total expenses of owning different funds. If these transactional expenses were included, shareholder expenses would have been higher.
Derivative Financial Instruments
The Funds may invest in various derivative financial instruments, including financial futures contracts, foreign currency exchange contracts and swaps, as specified in Note 2 of the Notes to Financial Statements, which may constitute forms of economic leverage. Such derivative financial instruments are used to obtain exposure to a security, index and/or market without owning or taking physical custody of securities or to hedge market, equity, credit, interest rate and/or foreign currency exchange rate risks. Derivative financial instruments involve risks, including the imperfect correlation between the value of a derivative financial instrument and the underlying asset, possible default of the counterparty to the transaction or illiquidity of the derivative financial instrument.
The Funds’ ability to use a derivative financial instrument successfully depends on the investment advisor’s ability to predict pertinent market movements accurately, which cannot be assured. The use of derivative financial instruments may result in losses greater than if they had not been used, may require a Fund to sell or purchase portfolio investments at inopportune times or for distressed values, may limit the amount of appreciation a Fund can realize on an investment, may result in lower dividends paid to shareholders or may cause a Fund to hold an investment that it might otherwise sell. The Funds’ investments in these instruments are discussed in detail in the Notes to Financial Statements.
| FDP SERIES, INC. | NOVEMBER 30, 2012 | 13 |
Portfolio Information as of November 30, 2012
MFS Research International FDP Fund
| Ten Largest Holdings | Percent of
Long-Term Investments |
| Royal Dutch Shell Plc, Class A | 3 | % |
| Nestlé SA, Registered Shares | 3 | |
| Roche Holding AG. | 3 | |
| Rio Tinto Plc | 2 | |
| Novartis AG, Registered Shares | 2 | |
| Heineken NV | 2 | |
| BPPlc | 2 | |
| Bayer AG, Registered Shares | 2 | |
| Westpac Banking Corp. | 2 | |
| Barclays Plc | 2 | |
| |
| Geographic Allocation | Percent of
Long-Term Investments |
| Japan | 22 | % |
| United Kingdom | 18 | |
| Switzerland | 13 | |
| France | 9 | |
| Germany | 6 | |
| Hong Kong | 6 | |
| Netherlands | 6 | |
| Australia | 4 | |
| Brazil | 2 | |
| Sweden | 2 | |
| Other1 | 12 | |
| 1 | | Other includes a 1% holding or less in each of the following countries: Singapore, United States, India, Austria, Spain, China, Taiwan, Indonesia, Italy, Belgium, Bermuda, Canada, Czech Republic, Thailand, Mexico and Israel. |
Marsico Growth FDP Fund
| | |
| Ten Largest Holdings | Percent of
Long-Term Investments |
| Apple, Inc. | 4 | % |
| QALCOMM, Inc. | 4 | |
| Wells Fargo & Co. | 4 | |
| Biogen Idec, Inc. | 3 | |
| Visa, Inc., Class A | 3 | |
| Gilead Sciences, Inc. | 3 | |
| National Oilwell Varco, Inc. | 3 | |
| TJX Cos., Inc. | 3 | |
| U.S. Bancorp | 3 | |
| Starwood Hotels & Resorts Worldwide, Inc. | 3 | |
| |
| Sector Allocation | Percent of
Long-Term Investments |
| Consumer Discretionary | 36 | % |
| Information Technology | 19 | |
| Health Care | 12 | |
| Industrials | 11 | |
| Financials | 9 | |
| Energy | 7 | |
| Materials | 5 | |
| Consumer Staples | 1 | |
For Fund compliance purposes, the Fund’s sector classifications refer to any one or more of the sector sub-classifications used by one or more widely recognized market indexes or rating group indexes, and/or as defined by Fund management. These definitions may not apply for purposes of this report, which may combine such sector sub-classifications for reporting ease.
| 14 | FDP SERIES, INC. | NOVEMBER 30, 2012 |
Portfolio Information as of November 30, 2012 (concluded)
Invesco Value FDP Fund
| | |
| Ten Largest Holdings | Percent of
Long-Term Investments |
| Citigroup, Inc. | 4 | % |
| JPMorgan Chase & Co. | 3 | |
| Comcast Corp., Class A | 3 | |
| Allstate Corp. | 3 | |
| Time Warner Cable, Inc. | 3 | |
| Pfizer, Inc. | 3 | |
| Microsoft Corp. | 2 | |
| BPPlc—ADR | 2 | |
| Merck & Co., Inc. | 2 | |
| Viacom, Inc., Class B | 2 | |
| |
| Sector Allocation | Percent of
Long-Term Investments |
| Financials | 23 | % |
| Consumer Discretionary | 17 | |
| Health Care | 15 | |
| Energy | 14 | |
| Information Technology | 10 | |
| Industrials | 7 | |
| Consumer Staples | 6 | |
| Materials | 3 | |
| Telecommunication Services | 3 | |
| Utilities | 2 | |
For Fund compliance purposes, the Fund’s sector classifications refer to any one or more of the sector sub-classifications used by one or more widely recognized market indexes or rating group indexes, and/or as defined by Fund management. These definitions may not apply for purposes of this report, which may combine such sector sub-classifications for reporting ease.
Franklin Templeton Total Return FDP Fund
| | |
| Portfolio Composition | Percent of
Long-Term Investments |
| US Government Sponsored Agency Securities | 25 | % |
| Corporate Bonds | 25 | |
| US Treasury Obligations | 23 | |
| Foreign Agency Obligations | 11 | |
| Floating Rate Loan Interests | 7 | |
| Non-Agency Mortgage-Backed Securities | 4 | |
| Asset-Backed Securities | 2 | |
| Preferred Securities | 2 | |
| Taxable Municipal Bonds | 1 | |
| |
| Credit Quality Allocation1 | Percent of
Long-Term Investments |
| AAA/Aaa2 | 67 | % |
| AA/Aa | 1 | |
| A | 9 | |
| BBB/Baa | 17 | |
| BB/Ba | 3 | |
| B | 3 | |
| 1 | | Using the higher of Standard & Poor’s (“S&P’s”) or Moody’s Investors Service (“Moody’s”) ratings. |
| 2 | | Includes US Government Sponsored Agency Securities and US Treasury Obligations, which were deemed AAA/Aaa by the investment advisor. |
| FDP SERIES, INC. | NOVEMBER 30, 2012 | 15 |
| |
| Schedule of Investments November 30, 2012 (Unaudited) | MFS Research International FDP Fund |
| | (Percentages shown are based on Net Assets) |
| | |
| Common Stocks | Shares | Value |
| |
| Argentina — 0.3% | | |
| Arcos Dorados Holdings, Inc., Class A | 35,270 | $ | 432,057 |
| Australia — 3.5% | | |
| Iluka Resources Ltd. | 140,566 | 1,210,175 |
| Newcrest Mining Ltd. | 22,379 | 598,124 |
| Westpac Banking Corp. | 97,250 | 2,590,227 |
| | | 4,398,526 |
| Austria — 1.3% | | |
| Erste Group Bank AG (a) | 57,454 | 1,692,094 |
| Belgium — 0.6% | | |
| KBC Group Holding | 26,200 | 790,321 |
| Bermuda — 0.5% | | |
| Hiscox Ltd. | 79,688 | 613,912 |
| Brazil — 2.3% | | |
| Cia de Saneamento Basico do Estado de Sao | | |
| Paulo | 5,200 | 210,502 |
| Diagnosticos da America SA | 83,000 | 482,432 |
| EDP — Energias do Brasil SA | 144,700 | 820,743 |
| Itau Unibanco Holdings SA — ADR | 25,420 | 385,113 |
| M Dias Branco SA | 19,300 | 643,363 |
| Tim Participacoes SA — ADR | 19,671 | 348,767 |
| | | 2,890,920 |
| Canada — 0.4% | | |
| Cenovus Energy, Inc. | 16,210 | 544,386 |
| China — 1.1% | | |
| China Unicom Hong Kong Ltd. | 500,000 | 776,721 |
| CNOOC Ltd. | 237,000 | 506,157 |
| Wumart Stores, Inc., Class H | 68,000 | 141,414 |
| | | 1,424,292 |
| Czech Republic — 0.4% | | |
| CEZ AS | 15,664 | 520,502 |
| France — 8.7% | | |
| BNP Paribas SA | 32,846 | 1,838,097 |
| Danone SA | 36,527 | 2,318,409 |
| Dassault Systemes SA | 7,602 | 861,039 |
| GDF Suez | 33,113 | 744,953 |
| Legrand SA | 10,709 | 434,269 |
| LVMH Möet Hennessy Louis Vuitton SA | 7,237 | 1,270,744 |
| Publicis Groupe SA | 20,399 | 1,155,065 |
| Schneider Electric SA | 28,033 | 1,973,377 |
| Suez Environnement Co. | 44,600 | 486,107 |
| | | 11,082,060 |
| Germany — 6.4% | | |
| Bayer AG, Registered Shares | 28,882 | 2,613,901 |
| GSW Immobilien AG | 13,330 | 565,150 |
| Linde AG | 12,807 | 2,215,421 |
| Siemens AG, Registered Shares | 21,457 | 2,218,359 |
| Symrise AG | 15,731 | 547,931 |
| | | 8,160,762 |
| | | |
| | |
| Common Stocks | Shares | Value |
| |
| Hong Kong — 5.6% | | |
| AIA Group Ltd. | 395,800 | $ | 1,539,255 |
| BOC Hong Kong Holdings Ltd. | 156,500 | 480,417 |
| China Resources Gas Group Ltd. | 66,000 | 142,492 |
| Hang Lung Properties Ltd. | 278,000 | 1,018,304 |
| Hutchison Whampoa Ltd. | 109,000 | 1,120,592 |
| Li & Fung Ltd. | 678,000 | 1,115,890 |
| Sands China Ltd. | 332,400 | 1,417,041 |
| Sinotruk Hong Kong Ltd. | 395,500 | 262,723 |
| | | 7,096,714 |
| India — 1.4% | | |
| HDFC Bank Ltd. — ADR | 14,520 | 611,583 |
| ICICI Bank Ltd. | 23,143 | 465,601 |
| Reliance Industries Ltd. | 43,974 | 641,359 |
| | | 1,718,543 |
| Indonesia — 0.7% | | |
| Bank Mandiri Persero Tbk PT | 509,500 | 437,738 |
| Bank Rakyat Indonesia Persero Tbk PT | 609,000 | 446,936 |
| | | 884,674 |
| Israel — 0.2% | | |
| Bezeq The Israeli Telecommunication Corp. Ltd. | 245,730 | 300,460 |
| Italy — 0.7% | | |
| Telecom Italia SpA | 270,840 | 246,753 |
| Telecom Italia SpA (Non-Convertible Savings Shares) | 761,105 | 607,910 |
| | | 854,663 |
| Japan — 21.5% | | |
| Aeon Credit Service Co. Ltd. | 34,400 | 674,084 |
| Canon, Inc. | 35,900 | 1,270,085 |
| Chugoku Marine Paints Ltd. | 46,000 | 250,181 |
| Denso Corp. | 45,300 | 1,497,469 |
| East Japan Railway Co. | 11,900 | 782,276 |
| GLORY Ltd. | 42,400 | 939,335 |
| Honda Motor Co. Ltd. | 57,300 | 1,909,885 |
| Inpex Corp. | 192 | 1,032,484 |
| Japan Tobacco, Inc. | 71,900 | 2,155,889 |
| JGC Corp. | 56,000 | 1,854,563 |
| KDDI Corp. | 28,900 | 2,144,464 |
| Lawson, Inc. | 11,800 | 798,817 |
| Miraca Holdings, Inc. | 20,400 | 830,298 |
| Mitsubishi Corp. | 45,200 | 860,391 |
| Mitsubishi UFJ Financial Group, Inc. | 173,300 | 797,076 |
| Nippon Paint Co. Ltd. | 50,000 | 415,761 |
| Nippon Television Network Corp. | 59,100 | 774,944 |
| Nomura Research Institute Ltd. | 32,900 | 637,761 |
| Santen Pharmaceutical Co. Ltd. | 44,500 | 1,912,204 |
| Sony Financial Holdings, Inc. | 34,900 | 602,048 |
| Sumitomo Mitsui Financial Group, Inc. | 61,000 | 1,974,594 |
| Tokyo Gas Co. Ltd. | 231,000 | 1,134,027 |
| Yahoo! Japan Corp. | 2,157 | 726,666 |
| Yamato Holdings Co. Ltd. | 93,100 | 1,397,435 |
| | | 27,372,737 |
Portfolio Abbreviations
| | | | | | |
| To simplify the listings of portfolio holdings in the Schedules of Investments, the names and descriptions of many of the securities have been abbreviated according to the following list: | ADR | American Depositary | EUR | Euro | MXN | Mexican New Peso |
| | Receipts | GBP | British Pound | MYR | Malaysian Ringgit |
| AGM | Assured Guaranty | GO | General Obligation | PEN | Peruvian Nuevo Sol |
| | Municipal Corp. | | Bonds | PHP | Philippine Peso |
| AUD | Australian Dollar | HKD | Hong Kong Dollar | PLN | Polish Zloty |
| BRL | Brazilian Real | IDR | Indonesian Rupiah | RB | Revenue Bonds |
| CHF | Swiss Franc | ILS | Israeli New Shekel | SEK | Swedish Krona |
| CLP | Chilean Peso | INR | Indian Rupee | SGD | Singapore Dollar |
| DIP | Debtor-In-Possession | JPY | Japanese Yen | TBA | To Be Announced |
| DKK | Danish Krone | KRW | South Korean Won | USD | US Dollar |
See Notes to Financial Statements.
| 16 | FDP SERIES, INC. | NOVEMBER 30, 2012 |
| |
| Schedule of Investments (continued) | MFS Research International FDP Fund |
| | (Percentages shown are based on Net Assets) |
| Common Stocks | | Shares | Value |
| |
| Mexico — 0.4% | | | |
| Grupo Financiero Santander Mexico SAB de CV — ADR, | | | |
| Class B (a) | | 33,680 | $ | 492,065 |
| Netherlands — 5.5% | | | |
| Akzo Nobel NV | | 34,322 | 1,963,631 |
| ASML Holding NV | | 4,761 | 297,706 |
| Delta Lloyd NV | | 27,890 | 416,952 |
| Heineken NV | | 40,025 | 2,641,597 |
| ING Groep NV CVA (a) | | 180,307 | 1,629,251 |
| | | | 6,949,137 |
| Singapore — 1.5% | | | |
| DBS Group Holdings Ltd. | | 94,000 | 1,112,428 |
| Keppel Corp. Ltd. | | 87,400 | 766,324 |
| | | | 1,878,752 |
| Spain — 1.2% | | | |
| Amadeus IT Holding SA, Class A | | 31,684 | 740,159 |
| Banco Santander SA | | 108,137 | 833,038 |
| | | | 1,573,197 |
| Sweden — 1.8% | | | |
| Hennes & Mauritz AB, Class B | | 26,650 | 865,616 |
| Telefonaktiebolaget LM Ericsson, Class B | | 147,537 | 1,382,963 |
| | | | 2,248,579 |
| Switzerland — 13.0% | | | |
| Julius Baer Group Ltd. (a) | | 8,666 | 297,125 |
| Kuehne & Nagel International AG, | | | |
| Registered Shares | | 8,920 | 1,074,775 |
| Nestlé SA, Registered Shares | | 56,312 | 3,686,050 |
| Novartis AG, Registered Shares | | 46,450 | 2,878,383 |
| Roche Holding AG | | 18,551 | 3,654,457 |
| Schindler Holding AG, Participation Certificates | | 11,441 | 1,605,464 |
| Sonova Holding AG, Registered Shares (a) | | 6,504 | 710,479 |
| Swiss Re AG (a) | | 24,898 | 1,795,594 |
| UBS AG, Registered Shares (a) | | 55,970 | 877,696 |
| | | | 16,580,023 |
| Taiwan — 0.8% | | | |
| Taiwan Semiconductor Manufacturing Co. Ltd. | | 305,439 | 1,037,839 |
| Thailand — 0.4% | | | |
| Siam Commercial Bank PCL | | 95,400 | 505,132 |
| United Kingdom — 17.5% | | | |
| Barclays Plc | | 586,437 | 2,326,004 |
| BG Group Plc | | 48,287 | 828,438 |
| BP Plc | | 377,354 | 2,619,702 |
| BT Group Plc | | 136,920 | 512,088 |
| Cairn Energy Plc (a) | | 56,804 | 244,451 |
| Compass Group Plc | | 55,660 | 643,261 |
| GKN Plc | | 210,110 | 748,196 |
| HSBC Holdings Plc | | 120,609 | 1,231,676 |
| Pearson Plc | | 4,450 | 84,095 |
| Reckitt Benckiser Group Plc | | 25,420 | 1,598,909 |
| Rio Tinto Plc | | 58,360 | 2,897,956 |
| Royal Dutch Shell Plc, Class A | | 111,718 | 3,740,481 |
| Standard Chartered Plc | | 84,152 | 1,962,849 |
| Vodafone Group Plc | | 727,048 | 1,875,518 |
| Whitbread Plc | | 23,809 | 916,187 |
| | | | 22,229,811 |
| United States — 1.4% | | | |
| Cognizant Technology Solutions Corp., | | | |
| Class A (a) | | 9,370 | 629,945 |
| Joy Global, Inc. | | 21,300 | 1,213,887 |
| | | | 1,843,832 |
| Total Long-Term Investments | | | |
| (Cost — $107,835,311) — 99.1% | | | 126,115,990 |
| | | | |
| | | |
| | | Par | |
| Short-Term Securities | | (000) | Value |
| |
| Time Deposits — 0.7% | | | |
| Japan — 0.1% | | | |
| Citibank NA, 0.01%, 12/03/12 | JPY | 5,993 | $ 72,698 |
| Switzerland — 0.1% | | | |
| Brown Brothers Harriman & Co., | | | |
| 0.01%, 12/03/12 | CHF | 111 | 119,376 |
| United Kingdom — 0.0% | | | |
| Brown Brothers Harriman & Co., | | | |
| 0.07%, 12/03/12 | GBP | 1 | 1,065 |
| United States — 0.5% | | | |
| Brown Brothers Harriman & Co., | | | |
| 0.08%, 12/03/12 | USD | 699 | 698,686 |
| Total Short-Term Securities | | | |
| (Cost — $891,825) — 0.7% | | | 891,825 |
| Total Investments (Cost — $108,727,136) — 99.8% | | 127,007,815 |
| Other Assets Less Liabilities — 0.2% | | | 270,440 |
| Net Assets — 100.0% | | | $ | 127,278,255 |
| (a) | | Non-income producing security. |
| • | | Foreign currency exchange contracts as of November 30, 2012 were as follows: |
Currency
Purchased | Currency
Sold | Counterparty | Settlement
Date | Unrealized
Appreciation
(Depreciation) |
| HKD | 75,413 | USD | 9,731 | UBS AG | 12/03/12 | — |
| USD | 26,780 | GBP | 16,729 | Deutsche | 12/03/12 | $ | (21) |
| | | | | Bank AG | | |
| USD | 3,464 | JPY | 284,580 | Brown Brothers | 12/03/12 | 11 |
| | | | | Harriman & Co. | | |
| USD | 11,919 | JPY | 979,290 | Brown Brothers | 12/03/12 | 40 |
| | | | | Harriman & Co. | | |
| USD | 42,954 | GBP | 26,781 | Barclays Plc | 12/04/12 | 47 |
| USD | 24,611 | JPY | 2,031,120 | Brown Brothers | 12/04/12 | (28) |
| | | | | Harriman & Co. | | |
| USD | 22,932 | JPY | 1,892,550 | Brown Brothers | 12/04/12 | (27) |
| | | | | Harriman & Co. | | |
| USD | 9,756 | JPY | 805,194 | Brown Brothers | 12/04/12 | (11) |
| | | | | Harriman & Co. | | |
| USD | 88,035 | GBP | 54,940 | UBS AG | 12/05/12 | 13 |
| Total | | | | | | $ | 24 |
| • | | Fair Value Measurements — Various inputs are used in determining the fair value of investments and derivative financial instruments. These inputs to valuation techniques are categorized into a disclosure hierarchy consisting of three broad levels for financial statement purposes as follows: |
| • | | Level 1 — unadjusted price quotations in active markets/exchanges for identical assets and liabilities that the Fund has the ability to access |
| • | | Level 2 — other observable inputs (including, but not limited to, quoted prices for similar assets or liabilities in markets that are active, quoted prices for identical or similar assets or liabilities in markets that are not active, inputs other than quoted prices that are observable for the assets or liabilities (such as interest rates, yield curves, volatilities, prepayment speeds, loss severities, credit risks and default rates) or other market-corroborated inputs) |
| • | | Level 3 — unobservable inputs based on the best information available in the circumstances, to the extent observable inputs are not available (including the Fund’s own assumptions used in determining the fair value of investments and derivative financial instruments) |
See Notes to Financial Statements.
| FDP SERIES, INC. | NOVEMBER 30, 2012 | 17 |
| |
| Schedule of Investments (concluded) | MFS Research International FDP Fund |
The hierarchy gives the highest priority to unadjusted quoted prices in active markets for identical assets or liabilities (Level 1 measurements) and the lowest priority to unobservable inputs (Level 3 measurements). Accordingly, the degree of judgment exercised in determining fair value is greatest for instruments categorized in Level 3. The inputs used to measure fair value may fall into different levels of the fair value hierarchy. In such cases, for disclosure purposes, the level in the fair value hierarchy within which the fair value measurement falls in its entirety is determined based on the lowest level input that is significant to the fair value measurement in its entirety.
Changes in valuation techniques may result in transfers into or out of an assigned level within the disclosure hierarchy. In accordance with the Fund’s policy, transfers between different levels of the fair value disclosure hierarchy are deemed to have occurred as of the beginning of the reporting period. The categorization of a value determined for investments and derivative financial instruments is based on the pricing transparency of the investment and derivative financial instrument and is not necessarily an indication of the risks associated with investing in those securities. For information about the Fund’s policy regarding valuation of investments and derivative financial instruments and other significant accounting policies, please refer to Note 1 of the Notes to Financial Statements.
The following tables summarize the Fund’s investments and derivative financial instruments categorized in the disclosure hierarchy as of November 30, 2012:
| | | Level 1 | | Level 2 | | Level 3 | | Total |
| Assets: | | | | | | | | | | | | | | | | |
| Investments: | | | | | | | | | | | | | | | | |
| Long-Term Investments: | | | | | | | | | | | | | | | | |
| Common Stocks: | | | | | | | | | | | | | | | | |
| Argentina | | $ | 432,057 | | | | — | | | | — | | | $ | 432,057 | |
| Australia | | | — | | | $ | 4,398,526 | | | | — | | | | 4,398,526 | |
| Austria | | | — | | | | 1,692,094 | | | | — | | | | 1,692,094 | |
| Belgium | | | — | | | | 790,321 | | | | — | | | | 790,321 | |
| Bermuda | | | — | | | | 613,912 | | | | — | | | | 613,912 | |
| Brazil | | | 2,890,920 | | | | — | | | | — | | | | 2,890,920 | |
| Canada | | | 544,386 | | | | — | | | | — | | | | 544,386 | |
| China | | | — | | | | 1,424,292 | | | | — | | | | 1,424,292 | |
| Czech Republic | | | 520,502 | | | | — | | | | — | | | | 520,502 | |
| France | | | — | | | | 11,082,060 | | | | — | | | | 11,082,060 | |
| Germany | | | — | | | | 8,160,762 | | | | — | | | | 8,160,762 | |
| Hong Kong | | | — | | | | 7,096,714 | | | | — | | | | 7,096,714 | |
| India | | | 611,583 | | | | 1,106,960 | | | | — | | | | 1,718,543 | |
| Indonesia | | | — | | | | 884,674 | | | | — | | | | 884,674 | |
| Israel | | | — | | | | 300,460 | | | | — | | | | 300,460 | |
| Italy | | | — | | | | 854,663 | | | | — | | | | 854,663 | |
| Japan | | | — | | | | 27,372,737 | | | | — | | | | 27,372,737 | |
| Mexico | | | 492,065 | | | | — | | | | — | | | | 492,065 | |
| Netherlands | | | — | | | | 6,949,137 | | | | — | | | | 6,949,137 | |
| Singapore | | | — | | | | 1,878,752 | | | | — | | | | 1,878,752 | |
| Spain | | | — | | | | 1,573,197 | | | | — | | | | 1,573,197 | |
| Sweden | | | — | | | | 2,248,579 | | | | — | | | | 2,248,579 | |
| Switzerland | | | — | | | | 16,580,023 | | | | — | | | | 16,580,023 | |
| Taiwan | | | — | | | | 1,037,839 | | | | — | | | | 1,037,839 | |
| Thailand | | | 505,132 | | | | — | | | | — | | | | 505,132 | |
| United Kingdom | | | — | | | | 22,229,811 | | | | — | | | | 22,229,811 | |
| United States | | | 1,843,832 | | | | — | | | | — | | | | 1,843,832 | |
| Short-Term Securities: | | | | | | | | | | | | | | | | |
| Time Deposits | | | — | | | | 891,825 | | | | — | | | | 891,825 | |
| Total | | $ | 7,840,477 | | | $ | 119,167,338 | | | | — | | | $ | 127,007,815 | |
| | | Level 1 | | Level 2 | | Level 3 | | Total |
| Derivative Financial Instruments1 | | | | | | | | | | | | | | | | |
| Assets: | | | | | | | | | | | | | | | | |
| Foreign currency exchange | | | | | | | | | | | | | | | | |
| contracts | | | — | | | $ | 111 | | | | — | | | $ | 111 | |
| Liabilities: | | | | | | | | | | | | | | | | |
| Foreign currency exchange | | | | | | | | | | | | | | | | |
| contracts | | | — | | | | (87 | ) | | | — | | | | (87 | ) |
| Total | | | — | | | $ | 24 | | | | — | | | $ | 24 | |
| 1 | | Derivative financial instruments are foreign currency exchange contracts, which are valued at the unrealized appreciation/depreciation on the instrument. |
Certain of the Fund’s assets are held at carrying amount, which approximates fair value for financial statement purposes. As of November 30, 2012, foreign currency at value of $1,313 is categorized as Level 1 within the disclosure hierarchy.
There were no transfers between levels during the six months ended November 30, 2012.
See Notes to Financial Statements.
| 18 | FDP SERIES, INC. | NOVEMBER 30, 2012 |
| |
| Schedule of Investments November 30, 2012 (Unaudited) | Marsico Growth FDP Fund |
| | (Percentages shown are based on Net Assets) |
| | |
| Common Stocks | Shares | Value |
| |
| Aerospace & Defense — 2.5% | | |
| Precision Castparts Corp. | 14,254 | $ | 2,614,041 |
| Beverages — 0.7% | | |
| Anheuser-Busch InBev NV — ADR | 8,560 | 753,023 |
| Biotechnology — 6.1% | | |
| Biogen Idec, Inc. (a) | 22,086 | 3,292,802 |
| Gilead Sciences, Inc. (a) | 41,954 | 3,146,550 |
| | | 6,439,352 |
| Chemicals — 5.0% | | |
| LyondellBasell Industries NV, Class A | 51,006 | 2,536,528 |
| Monsanto Co. | 29,771 | 2,726,726 |
| | | 5,263,254 |
| Commercial Banks — 6.2% | | |
| U.S. Bancorp | 90,922 | 2,933,143 |
| Wells Fargo & Co. | 109,177 | 3,603,933 |
| | | 6,537,076 |
| Communications Equipment — 3.4% | | |
| QUALCOMM, Inc. | 57,232 | 3,641,100 |
| Computers & Peripherals — 3.7% | | |
| Apple, Inc. | 6,766 | 3,960,004 |
| Energy Equipment & Services — 5.4% | | |
| National Oilwell Varco, Inc. | 44,455 | 3,036,276 |
| Schlumberger Ltd. | 37,632 | 2,695,204 |
| | | 5,731,480 |
| Health Care Equipment & Supplies — 1.1% | | |
| Intuitive Surgical, Inc. (a) | 2,154 | 1,139,466 |
| Health Care Providers & Services — 2.0% | | |
| Express Scripts Holding Co. (a) | 40,570 | 2,184,694 |
| Hotels, Restaurants & Leisure — 9.1% | | |
| Chipotle Mexican Grill, Inc. (a) | 3,497 | 922,439 |
| McDonald’s Corp. | 12,073 | 1,050,834 |
| Starbucks Corp. | 30,709 | 1,592,876 |
| Starwood Hotels & Resorts Worldwide, Inc. | 54,142 | 2,921,502 |
| Wynn Resorts Ltd. | 20,169 | 2,266,995 |
| Yum! Brands, Inc. | 13,970 | 937,108 |
| | | 9,691,754 |
| Industrial Conglomerates — 1.0% | | |
| Danaher Corp. | 20,059 | 1,082,584 |
| Internet & Catalog Retail — 2.9% | | |
| Amazon.com, Inc. (a) | 3,637 | 916,706 |
| Priceline.com, Inc. (a) | 3,230 | 2,142,007 |
| | | 3,058,713 |
| Internet Software & Services — 5.2% | | |
| eBay, Inc. (a) | 40,526 | 2,140,583 |
| Equinix, Inc. (a) | 7,926 | 1,472,334 |
| Google, Inc., Class A (a) | 1,518 | 1,060,126 |
| LinkedIn Corp., Class A (a) | 8,204 | 887,180 |
| | | 5,560,223 |
| IT Services — 3.8% | | |
| Accenture Plc, Class A | 12,410 | 842,887 |
| Visa, Inc., Class A | 21,416 | 3,206,190 |
| | | 4,049,077 |
| Machinery — 2.6% | | |
| Cummins, Inc. | 10,663 | 1,046,680 |
| Pentair Ltd., Registered Shares | 35,357 | 1,714,461 |
| | | 2,761,141 |
| | | |
| | |
| Common Stocks | Shares | Value |
| |
| Media — 5.1% | | |
| CBS Corp., Class B | 79,570 | $ | 2,862,928 |
| Comcast Corp., Class A | 25,915 | 963,520 |
| Liberty Global, Inc., Class A (a) | 27,472 | 1,539,531 |
| | | 5,365,979 |
| Multiline Retail — 1.0% | | |
| Dollar General Corp. (a) | 21,147 | 1,057,350 |
| Oil, Gas & Consumable Fuels — 1.0% | | |
| Kinder Morgan, Inc. | 30,860 | 1,043,377 |
| Personal Products — 0.7% | | |
| The Estée Lauder Cos., Inc., Class A | 13,024 | 758,648 |
| Pharmaceuticals — 1.9% | | |
| Bristol-Myers Squibb Co. | 46,283 | 1,510,214 |
| Perrigo Co. | 4,825 | 499,388 |
| | | 2,009,602 |
| Real Estate Investment Trusts (REITs) — 1.6% | | |
| American Tower Corp. | 22,458 | 1,682,778 |
| Road & Rail — 1.2% | | |
| Union Pacific Corp. | 10,294 | 1,263,897 |
| Software — 1.4% | | |
| VMware, Inc., Class A (a) | 16,607 | 1,510,407 |
| Specialty Retail — 12.5% | | |
| AutoZone, Inc. (a) | 5,449 | 2,091,163 |
| Dick’s Sporting Goods, Inc. | 20,168 | 1,059,022 |
| GNC Holdings, Inc., Class A | 21,704 | 762,462 |
| The Home Depot, Inc. | 33,750 | 2,196,112 |
| Limited Brands, Inc. | 22,092 | 1,152,098 |
| Lowe’s Cos., Inc. | 51,368 | 1,853,871 |
| O’Reilly Automotive, Inc. (a) | 11,687 | 1,099,513 |
| TJX Cos., Inc. | 68,039 | 3,016,849 |
| | | 13,231,090 |
| Textiles, Apparel & Luxury Goods — 3.4% | | |
| Lululemon Athletica, Inc. (a) | 23,544 | 1,689,988 |
| NIKE, Inc., Class B | 19,207 | 1,872,299 |
| | | 3,562,287 |
| Trading Companies & Distributors — 2.0% | | |
| W.W. Grainger, Inc. | 10,727 | 2,081,253 |
| Transportation Infrastructure — 1.1% | | |
| Hutchison Port Holdings Trust | 1,456,000 | 1,127,611 |
| Total Common Stocks — 93.6% | | 99,161,261 |
| |
| |
| |
| Preferred Stocks — 0.5% | | |
| |
| Commercial Banks — 0.5% | | |
| Wells Fargo & Co., Series J, 8.00% | 17,400 | 513,300 |
| Total Long-Term Investments | | |
| (Cost — $80,535,563) — 94.1% | | 99,674,561 |
See Notes to Financial Statements.
| FDP SERIES, INC. | NOVEMBER 30, 2012 | 19 |
| |
| Schedule of Investments (concluded) | Marsico Growth FDP Fund |
| | (Percentages shown are based on Net Assets) |
| | |
| | Par | |
| Short-Term Securities | (000) | Value |
| |
| Time Deposits — 7.3% | | |
| United States — 7.3% | | |
| Brown Brothers Harriman & Co., 0.08%, 12/03/12 | $ | 7,776 | $ | 7,775,889 |
| Total Short-Term Securities | | |
| (Cost — $7,775,889) — 7.3% | | 7,775,889 |
| Total Investments (Cost — $88,311,452) — 101.4% | | 107,450,450 |
| Liabilities in Excess of Other Assets — (1.4)% | | (1,571,808) |
| Net Assets — 100.0% | | $ | 105,878,642 |
| | | | |
| (a) | | Non-income producing security. |
| • | | For Fund compliance purposes, the Fund’s industry classifications refer to any one or more of the industry sub-classifications used by one or more widely recognized market indexes or rating group indexes, and/or as defined by Fund management. These definitions may not apply for purposes of this report, which may combine such industry sub-classifications for reporting ease. |
| • | | Fair Value Measurements — Various inputs are used in determining the fair value of investments. These inputs to valuation techniques are categorized into a disclosure hierarchy consisting of three broad levels for financial statement purposes as follows: |
| • | | Level 1 — unadjusted price quotations in active markets/exchanges for identical assets and liabilities that the Fund has the ability to access |
| • | | Level 2 — other observable inputs (including, but not limited to, quoted prices for similar assets or liabilities in markets that are active, quoted prices for identical or similar assets or liabilities in markets that are not active, inputs other than quoted prices that are observable for the assets or liabilities (such as interest rates, yield curves, volatilities, prepayment speeds, loss severities, credit risks and default rates) or other market-corroborated inputs) |
| • | | Level 3 — unobservable inputs based on the best information available in the circumstances, to the extent observable inputs are not available (including the Fund’s own assumptions used in determining the fair value of investments) |
The hierarchy gives the highest priority to unadjusted quoted prices in active markets for identical assets or liabilities (Level 1 measurements) and the lowest priority to unobservable inputs (Level 3 measurements). Accordingly, the degree of judgment exercised in determining fair value is greatest for instruments categorized in Level 3. The inputs used to measure fair value may fall into different levels of the fair value hierarchy. In such cases, for disclosure purposes, the level in the fair value hierarchy within which the fair value measurement falls in its entirety is determined based on the lowest level input that is significant to the fair value measurement in its entirety.
Changes in valuation techniques may result in transfers into or out of an assigned level within the disclosure hierarchy. In accordance with the Fund’s policy, transfers between different levels of the fair value disclosure hierarchy are deemed to have occurred as of the beginning of the reporting period. The categorization of a value determined for investments is based on the pricing transparency of the investment and is not necessarily an indication of the risks associated with investing in those securities. For information about the Fund’s policy regarding valuation of investments and other significant accounting policies, please refer to Note 1 of the Notes to Financial Statements.
The following table summarizes the Fund’s investments categorized in the disclosure hierarchy as of November 30, 2012:
| | | Level 1 | | Level 2 | | Level 3 | | Total |
| Assets: | | | | | | | | | | | | | | | | |
| Investments: | | | | | | | | | | | | | | | | |
| Long-Term Investments1 | | $ | 98,546,950 | | | $ | 1,127,611 | | | | — | | | $ | 99,674,561 | |
| Short-Term Securities | | | — | | | | 7,775,889 | | | | — | | | | 7,775,889 | |
| Total | | $ | 98,546,950 | | | $ | 8,903,500 | | | | — | | | $ | 107,450,450 | |
| 1 | | See above Schedule of Investments for values in each industry, excluding Level 2, Transportation Infrastructure, within the table. |
There were no transfers between levels during the six months ended November 30, 2012.
See Notes to Financial Statements.
| 20 | FDP SERIES, INC. | NOVEMBER 30, 2012 |
| |
| Schedule of Investments November 30, 2012 (Unaudited) | Invesco Value FDP Fund |
| | (Percentages shown are based on Net Assets) |
| | |
| Common Stocks | Shares | Value |
| |
| Aerospace & Defense — 1.3% | | |
| Honeywell International, Inc. | 12,251 | $ | 751,354 |
| Textron, Inc. | 26,721 | 627,676 |
| | | 1,379,030 |
| Automobiles — 1.9% | | |
| General Motors Co. (a) | 75,508 | 1,954,147 |
| Capital Markets — 4.5% | | |
| The Bank of New York Mellon Corp. | 92,035 | 2,203,318 |
| The Goldman Sachs Group, Inc. | 8,597 | 1,012,640 |
| Morgan Stanley | 54,156 | 913,612 |
| State Street Corp. | 12,006 | 533,547 |
| | | 4,663,117 |
| Commercial Banks — 4.0% | | |
| Fifth Third Bancorp | 73,688 | 1,078,792 |
| The PNC Financial Services Group, Inc. (b) | 500 | 28,070 |
| U.S. Bancorp | 23,572 | 760,433 |
| Wells Fargo & Co. | 68,422 | 2,258,610 |
| | | 4,125,905 |
| Communications Equipment — 1.1% | | |
| Cisco Systems, Inc. | 59,452 | 1,124,237 |
| Computers & Peripherals — 1.4% | | |
| Dell, Inc. | 21,885 | 210,971 |
| Hewlett-Packard Co. | 93,959 | 1,220,528 |
| | | 1,431,499 |
| Diversified Financial Services — 8.1% | | |
| Bank of America Corp. | 149,062 | 1,469,751 |
| Citigroup, Inc. | 105,482 | 3,646,513 |
| JPMorgan Chase & Co. | 81,219 | 3,336,477 |
| | | 8,452,741 |
| Diversified Telecommunication Services — 1.6% | | |
| AT&T, Inc. | 17,085 | 583,111 |
| Verizon Communications, Inc. | 23,491 | 1,036,423 |
| | | 1,619,534 |
| Electric Utilities — 2.4% | | |
| FirstEnergy Corp. | 20,682 | 878,158 |
| PPL Corp. | 54,516 | 1,600,044 |
| | | 2,478,202 |
| Electrical Equipment — 1.2% | | |
| Emerson Electric Co. | 24,507 | 1,230,987 |
| Electronic Equipment, Instruments & | | |
| Components — 1.2% | | |
| Corning, Inc. | 105,314 | 1,287,990 |
| Energy Equipment & Services — 4.3% | | |
| Halliburton Co. | 61,030 | 2,035,350 |
| Noble Corp. | 15,832 | 546,046 |
| Weatherford International Ltd. (a) | 180,280 | 1,876,715 |
| | | 4,458,111 |
| Food & Staples Retailing — 2.0% | | |
| CVS Caremark Corp. | 37,592 | 1,748,404 |
| Wal-Mart Stores, Inc. | 4,609 | 331,940 |
| | | 2,080,344 |
| Food Products — 3.9% | | |
| Archer-Daniels-Midland Co. | 25,931 | 692,358 |
| Kraft Foods Group, Inc. (a) | 12,307 | 556,523 |
| Mondelez International, Inc., Class A | 36,923 | 955,936 |
| Tyson Foods, Inc., Class A | 18,914 | 362,581 |
| Unilever NV — NY Shares | 38,204 | 1,445,257 |
| | | 4,012,655 |
| | | |
| | |
| Common Stocks | Shares | Value |
| |
| Health Care Providers & Services — 3.8% | | |
| Cardinal Health, Inc. | 22,111 | $ | 894,390 |
| UnitedHealth Group, Inc. | 37,568 | 2,043,324 |
| WellPoint, Inc. | 18,550 | 1,036,945 |
| | | 3,974,659 |
| Hotels, Restaurants & Leisure — 1.0% | | |
| Carnival Corp. | 27,846 | 1,076,526 |
| Household Durables — 0.5% | | |
| Newell Rubbermaid, Inc. | 22,661 | 494,236 |
| Household Products — 0.4% | | |
| The Procter & Gamble Co. | 6,116 | 427,080 |
| Industrial Conglomerates — 2.2% | | |
| General Electric Co. | 106,294 | 2,245,992 |
| Insurance — 5.3% | | |
| Aflac, Inc. | 8,834 | 468,114 |
| The Allstate Corp. | 63,934 | 2,588,048 |
| MetLife, Inc. | 35,409 | 1,175,225 |
| The Travelers Cos., Inc. | 18,703 | 1,324,546 |
| | | 5,555,933 |
| Internet Software & Services — 3.7% | | |
| eBay, Inc. (a) | 35,067 | 1,852,239 |
| Yahoo! Inc. (a) | 103,629 | 1,945,116 |
| | | 3,797,355 |
| Machinery — 1.6% | | |
| Ingersoll-Rand Plc | 34,273 | 1,671,837 |
| Media — 10.1% | | |
| Comcast Corp., Class A | 70,501 | 2,621,227 |
| News Corp., Class B | 75,910 | 1,914,450 |
| Time Warner Cable, Inc. | 27,270 | 2,587,651 |
| Time Warner, Inc. | 22,944 | 1,085,251 |
| Viacom, Inc., Class B | 44,120 | 2,277,033 |
| | | 10,485,612 |
| Metals & Mining — 1.1% | | |
| Alcoa, Inc. | 131,833 | 1,108,716 |
| Multiline Retail — 1.5% | | |
| Kohl’s Corp. | 12,269 | 547,811 |
| Target Corp. | 15,506 | 978,894 |
| | | 1,526,705 |
| Oil, Gas & Consumable Fuels — 9.0% | | |
| BP Plc — ADR | 57,038 | 2,381,907 |
| Chevron Corp. | 13,762 | 1,454,506 |
| Murphy Oil Corp. | 29,758 | 1,688,469 |
| Occidental Petroleum Corp. | 10,582 | 795,872 |
| QEP Resources, Inc. | 44,763 | 1,258,735 |
| Royal Dutch Shell Plc — ADR | 27,046 | 1,811,271 |
| | | 9,390,760 |
| Paper & Forest Products — 1.9% | | |
| International Paper Co. | 52,068 | 1,933,806 |
| Pharmaceuticals — 11.1% | | |
| Bristol-Myers Squibb Co. | 58,700 | 1,915,381 |
| GlaxoSmithKline Plc — ADR | 25,570 | 1,099,766 |
| Merck & Co., Inc. | 52,634 | 2,331,686 |
| Novartis AG, Registered Shares | 17,725 | 1,098,371 |
| Pfizer, Inc. | 103,092 | 2,579,362 |
| Roche Holding AG — ADR | 20,651 | 1,016,236 |
| Sanofi — ADR | 32,538 | 1,451,845 |
| | | 11,492,647 |
| Semiconductors & Semiconductor | | |
| Equipment — 0.5% | | |
| Intel Corp. | 29,214 | 571,718 |
See Notes to Financial Statements.
| FDP SERIES, INC. | NOVEMBER 30, 2012 | 21 |
| |
| Schedule of Investments (continued) | Invesco Value FDP Fund |
| | (Percentages shown are based on Net Assets) |
| | |
| Common Stocks | Shares | Value |
| |
| Software — 2.3% | | |
| Microsoft Corp. | 91,741 | $ | 2,442,146 |
| Specialty Retail — 2.1% | | |
| Lowe’s Cos., Inc. | 42,392 | 1,529,927 |
| Staples, Inc. | 57,107 | 668,152 |
| | | 2,198,079 |
| Wireless Telecommunication Services — 1.0% | | |
| Vodafone Group Plc — ADR | 39,146 | 1,009,967 |
| Total Long-Term Investments | | |
| (Cost — $86,910,086) — 98.0% | | 101,702,273 |
| |
| |
| | Par | |
| Short-Term Securities | (000) | |
| |
| Time Deposits — 1.6% | | |
| United States — 1.6% | | |
| Brown Brothers Harriman & Co., 0.08%, 12/03/12 | $ | 1,668 | 1,667,988 |
| Total Short-Term Securities | | |
| (Cost — $1,667,988) — 1.6% | | 1,667,988 |
| Total Investments (Cost — $88,578,074) — 99.6% | | 103,370,261 |
| Other Assets Less Liabilities — 0.4% | | 379,320 |
| Net Assets — 100.0% | | $ | 103,749,581 |
| (a) | | Non-income producing security. |
| (b) | | Investments in issuers considered to be an affiliate of the Fund during the six months ended November 30, 2012, for purposes of Section 2(a)(3) of the Investment Company Act of 1940, as amended, were as follows: |
| Affiliate | Shares Held
at May 31,
2012 | Shares
Purchased | Shares Sold | Shares Held
at November 30,
2012 | Value
at November 30,
2012 | Income | Realized
Gain (Loss) |
| |
| The PNC Financial Services Group, Inc. | 500 | — | — | 500 | $28,070 | $400 | — |
| • | | For Fund compliance purposes, the Fund’s industry classifications refer to any one or more of the industry sub-classifications used by one or more widely recognized market indexes or rating group indexes, and/or as defined by Fund management. These definitions may not apply for purposes of this report, which may combine such industry sub-classifications for reporting ease. |
| • | | Foreign currency exchange contracts as of November 30, 2012 were as follows: |
Currency
Purchased | | Currency
Sold | | Counterparty | | Settlement
Date | | Unrealized
Appreciation
(Depreciation) |
| CHF | | | 81,924 | | | USD | | | 87,901 | | | State Street Corp. | | 1/15/13 | | $ | 560 | |
| EUR | | | 105,574 | | | USD | | | 136,222 | | | Bank of New York | | 1/15/13 | | | 1,143 | |
| | | | | | | | | | | | | Mellon Corp. | | | | | | |
| GBP | | | 162,364 | | | USD | | | 259,593 | | | State Street Corp. | | 1/15/13 | | | 519 | |
| USD | | | 541,389 | | | CHF | | | 503,838 | | | Citigroup, Inc. | | 1/15/13 | | | (2,651 | ) |
| USD | | | 540,130 | | | CHF | | | 502,667 | | | Bank of New York | | 1/15/13 | | | (2,645 | ) |
| | | | | | | | | | | | | Mellon Corp. | | | | | | |
| USD | | | 756,186 | | | CHF | | | 703,733 | | | State Street Corp. | | 1/15/13 | | | (3,699 | ) |
| USD | | | 1,020,094 | | | EUR | | | 789,094 | | | Canadian | | 1/15/13 | | | (6,616 | ) |
| | | | | | | | | | | | | Imperial Bank of | | | | | | |
| | | | | | | | | | | | | Commerce | | | | | | |
| USD | | | 1,142,677 | | | EUR | | | 883,785 | | | Citigroup, Inc. | | 1/15/13 | | | (7,239 | ) |
| USD | | | 818,402 | | | EUR | | | 633,029 | | | Bank of New York | | 1/15/13 | | | (5,248 | ) |
| | | | | | | | | | | | | Mellon Corp. | | | | | | |
| USD | | | 1,199,810 | | | EUR | | | 927,974 | | | State Street Corp. | | 1/15/13 | | | (7,601 | ) |
| USD | | | 1,462,503 | | | GBP | | | 913,850 | | | Canadian | | 1/15/13 | | | (1,513 | ) |
| | | | | | | | | | | | | Imperial Bank of | | | | | | |
| | | | | | | | | | | | | Commerce | | | | | | |
| USD | | | 758,443 | | | GBP | | | 473,850 | | | Citigroup, Inc. | | 1/15/13 | | | (679 | ) |
| USD | | | 1,075,999 | | | GBP | | | 672,300 | | | Bank of New York | | 1/15/13 | | | (1,046 | ) |
| | | | | | | | | | | | | Mellon Corp. | | | | | | |
| USD | | | 736,741 | | | GBP | | | 460,310 | | | State Street Corp. | | 1/15/13 | | | (690 | ) |
| Total | | | | | | | | | | | | | | | | $ | (37,405 | ) |
| • | | Fair Value Measurements — Various inputs are used in determining the fair value of investments and derivative financial instruments. These inputs to valuation techniques are categorized into a disclosure hierarchy consisting of three broad levels for financial statement purposes as follows: |
| • | | Level 1 — unadjusted price quotations in active markets/exchanges for identical assets and liabilities that the Fund has the ability to access |
| • | | Level 2 — other observable inputs (including, but not limited to, quoted prices for similar assets or liabilities in markets that are active, quoted prices for identical or similar assets or liabilities in markets that are not active, inputs other than quoted prices that are observable for the assets or liabilities (such as interest rates, yield curves, volatilities, prepayment speeds, loss severities, credit risks and default rates) or other market-corroborated inputs) |
| • | | Level 3 — unobservable inputs based on the best information available in the circumstances, to the extent observable inputs are not available (including the Fund’s own assumptions used in determining the fair value of investments and derivative financial instruments) |
The hierarchy gives the highest priority to unadjusted quoted prices in active markets for identical assets or liabilities (Level 1 measurements) and the lowest priority to unobservable inputs (Level 3 measurements). Accordingly, the degree of judgment exercised in determining fair value is greatest for instruments categorized in Level 3. The inputs used to measure fair value may fall into different levels of the fair value hierarchy. In such cases, for disclosure purposes, the level in the fair value hierarchy within which the fair value measurement falls in its entirety is determined based on the lowest level input that is significant to the fair value measurement in its entirety.
See Notes to Financial Statements.
| 22 | FDP SERIES, INC. | NOVEMBER 30, 2012 |
| |
| Schedule of Investments (concluded) | Invesco Value FDP Fund |
Changes in valuation techniques may result in transfers into or out of an assigned level within the disclosure hierarchy. In accordance with the Fund’s policy, transfers between different levels of the fair value disclosure hierarchy are deemed to have occurred as of the beginning of the reporting period. The categorization of a value determined for investments and derivative financial instruments is based on the pricing transparency of the investment and derivative financial instrument and is not necessarily an indication of the risks associated with investing in those securities. For information about the Fund’s policy regarding valuation of investments and derivative financial instruments and other significant accounting policies, please refer to Note 1 of the Notes to Financial Statements.
The following tables summarize the Fund’s investments and derivative financial instruments categorized in the disclosure hierarchy as of November 30, 2012:
| | | Level 1 | | Level 2 | | Level 3 | | Total |
| Assets: | | | | | | | | | | | | | | | | |
| Investments: | | | | | | | | | | | | | | | | |
| Long-Term Investments1 | | $ | 100,603,902 | | | $ | 1,098,371 | | | | — | | | $ | 101,702,273 | |
| Short-Term Securities | | | — | | | | 1,667,988 | | | | — | | | | 1,667,988 | |
| Total | | $ | 100,603,902 | | | $ | 2,766,359 | | | | — | | | $ | 103,370,261 | |
| 1 | | See above Schedule of Investments for values in each industry excluding Level 2, in Pharmaceuticals, within the table. |
| | | Level 1 | | Level 2 | | Level 3 | | Total |
| Derivative Financial Instruments2 | | | | | | | | | | | | | | | | |
| Assets: | | | | | | | | | | | | | | | | |
| Foreign currency exchange | | | | | | | | | | | | | | | | |
| contracts | | | — | | | $ | 2,222 | | | | — | | | $ | 2,222 | |
| Liabilities: | | | | | | | | | | | | | | | | |
| Foreign currency exchange | | | | | | | | | | | | | | | | |
| contracts | | | — | | | | (39,627 | ) | | | — | | | | (39,627 | ) |
| Total | | | — | | | $ | (37,405 | ) | | | — | | | $ | (37,405 | ) |
| 2 | | Derivative financial instruments are foreign currency exchange contracts, which are valued at the unrealized appreciation/depreciation on the instrument. |
Certain of the Fund’s assets are held at carrying amount, which approximates fair value for financial statement purposes. As of November 30, 2012, foreign currency at value of $173 is categorized as Level 1 within the disclosure hierarchy.
There were no transfers between levels during the six months ended November 30, 2012.
See Notes to Financial Statements.
| FDP SERIES, INC. | NOVEMBER 30, 2012 | 23 |
| |
| Schedule of Investments November 30, 2012 (Unaudited) | Franklin Templeton Total Return FDP Fund |
| | (Percentages shown are based on Net Assets) |
| | | |
| | | Par | |
| Asset-Backed Securities | | (000) | Value |
| |
| Aames Mortgage Investment Trust, Series 2005-4, | | | |
| Class M1, 0.91%, 10/25/35 (a) | USD | 172 | $ | 169,860 |
| Ameriquest Mortgage Securities, Inc. (a): | | | |
| Series 2004-R4, Class M1, 1.03%, 6/25/34 | | 475 | 465,684 |
| Series 2005-R9, Class A2B, | | | |
| 0.44%, 11/25/35 | | 82 | 81,008 |
| Argent Securities, Inc., Series 2005-W2, | | | |
| Class A2C, 0.57%, 10/25/35 (a) | | 225 | 180,428 |
| Bayview Financial Acquisition Trust, | | | |
| Series 2004-D, Class M1, 0.84%, 8/28/44 (a) | | 252 | 245,369 |
| Chase Funding Mortgage Loan Asset-Backed | | | |
| Certificates, Series 2004-2, Class 2A2, | | | |
| 0.71%, 2/25/35 (a) | | 230 | 191,298 |
| CitiFinancial Mortgage Securities, Inc., | | | |
| Series 2003-4, Class AF6, | | | |
| 4.49%, 10/25/33 (a) | | 263 | 267,978 |
| Countryplace Manufactured Housing Contract | | | |
| Trust, Series 2005-1, Class A3, | | | |
| 4.80%, 12/15/35 (a)(b) | | 48 | 49,886 |
| Countrywide Asset-Backed Certificates (a): | | | |
| Series 2004-1, Class M1, 0.96%, 3/25/34 | | 123 | 111,000 |
| Series 2005-11, Class AF4, 5.21%, 2/25/36 | | 700 | 452,229 |
| Series 2005-14, Class 3A2, 0.45%, 4/25/36 | | 131 | 129,708 |
| Green Tree Financial Corp., Series 1996-3, | | | |
| Class M1, 7.70%, 5/15/27 (a) | | 173 | 141,402 |
| Greenpoint Manufactured Housing, Series 1999-3, | | | |
| Class 1A7, 7.27%, 6/15/29 | | 655 | 638,959 |
| Home Equity Mortgage Trust, Series 2004-4, | | | |
| Class M3, 1.18%, 12/25/34 (a) | | 178 | 139,024 |
| JPMorgan Mortgage Acquisition Corp., | | | |
| Series 2006-ACC1, Class A4, | | | |
| 0.36%, 5/25/36 (a) | | 109 | 104,355 |
| Long Beach Mortgage Loan Trust, | | | |
| Series 2005-WL2, Class M1, | | | |
| 0.68%, 8/25/35 (a) | | 111 | 108,111 |
| Morgan Stanley ABS Capital I (a): | | | |
| Series 2003-HE1, Class M1, 1.41%, 5/25/33 | | 280 | 256,471 |
| Series 2005-WMC1, Class M2, | | | |
| 0.94%, 1/25/35 | | 136 | 122,637 |
| Residential Asset Securities Corp., | | | |
| Series 2005-AHL2, Class A2, | | | |
| 0.47%, 10/25/35 (a) | | 88 | 87,306 |
| Structured Asset Securities Corp., | | | |
| Series 2006-WF1, Class A5, | | | |
| 0.51%, 2/25/36 (a) | | 553 | 540,371 |
| Total Asset-Backed Securities — 2.6% | | | 4,483,084 |
| |
| |
| Common Stocks — 0.0% | | Shares | |
| |
| Automobiles — 0.0% | | | |
| General Motors Co. (c) | | 661 | 17,107 |
| |
| |
| |
| | | Par | |
| Corporate Bonds | | (000) | |
| |
| Aerospace & Defense — 0.1% | | | |
| United Technologies Corp., 3.10%, 6/01/22 | USD | 200 | 215,232 |
| Beverages — 0.4% | | | |
| Heineken NV, 2.75%, 4/01/23 (b) | | 700 | 693,395 |
| Biotechnology — 0.5% | | | |
| Gilead Sciences, Inc., 4.50%, 4/01/21 | | 800 | 921,078 |
| | | | |
| | | |
| | | Par | |
| Corporate Bonds | | (000) | Value |
| |
| Capital Markets — 1.4% | | | |
| Credit Suisse, 2.20%, 1/14/14 | USD | 500 | $ | 508,041 |
| Export-Import Bank of Korea, 1.25%, 11/20/15 | | 200 | 200,116 |
| The Goldman Sachs Group, Inc., 5.25%, 7/27/21 | | 250 | 285,868 |
| KKR Group Finance Co. LLC, 6.38%, 9/29/20 (b) | | 200 | 234,208 |
| Merrill Lynch & Co., Inc., 6.88%, 4/25/18 | | 700 | 842,008 |
| Morgan Stanley: | | | |
| 6.00%, 4/28/15 | | 300 | 326,897 |
| 5.50%, 1/26/20 | | 100 | 111,494 |
| | | | 2,508,632 |
| Chemicals — 0.4% | | | |
| Ineos Finance Plc, 9.00%, 5/15/15 (b) | | 100 | 106,620 |
| Ineos Group Holdings Plc, 7.88%, 2/15/16 (b) | EUR | 75 | 94,737 |
| PTT Global Chemical PCL, 4.25%, 9/19/22 (b) | USD | 200 | 206,249 |
| RPM International, Inc., 6.25%, 12/15/13 | | 50 | 52,610 |
| RPM United Kingdom GP, 6.70%, 11/01/15 (b) | | 200 | 225,060 |
| | | | 685,276 |
| Commercial Banks — 2.9% | | | |
| Banco do Brasil SA, 5.88%, 1/26/22 (b) | | 500 | 542,500 |
| CIT Group, Inc.: | | | |
| 5.38%, 5/15/20 | | 100 | 106,750 |
| 5.00%, 8/15/22 | | 100 | 104,847 |
| Halyk Savings Bank of Kazakhstan, | | | |
| 7.25%, 5/03/17 | | 400 | 434,000 |
| HSBC Bank Brasil SA — Banco Multiplo, | | | |
| 4.00%, 5/11/16 (b) | | 200 | 206,250 |
| HSBC Holdings Plc, 6.50%, 9/15/37 | | 400 | 487,922 |
| ICICI Bank Ltd — Dubai, 4.70%, 2/21/18 (b) | | 200 | 207,918 |
| ING Bank NV (b): | | | |
| 2.01%, 9/25/15 (a) | | 500 | 505,634 |
| 2.63%, 12/05/22 | | 500 | 502,943 |
| Nykredit Realkredit A/S: | | | |
| 2.00%, 1/01/16 | DKK | 3,000 | 544,532 |
| Series 10S, 4.00%, 1/01/16 | | 1,500 | 287,645 |
| Series 12E, 4.00%, 1/01/16 | | 1,500 | 287,743 |
| Regions Financial Corp., 7.75%, 11/10/14 | USD | 200 | 220,500 |
| The Royal Bank of Scotland Plc: | | | |
| 6.93%, 4/09/18 | EUR | 100 | 142,277 |
| 6.13%, 12/15/22 | USD | 100 | 102,549 |
| SVB Financial Group, 5.38%, 9/15/20 | | 300 | 340,048 |
| | | | 5,024,058 |
| Commercial Services & Supplies — 0.2% | | | |
| Aviation Capital Group Corp., 6.75%, 4/06/21 (b) | | 300 | 311,373 |
| Construction Materials — 0.1% | | | |
| Cemex SAB de CV, 9.00%, 1/11/18 (b) | | 200 | 211,500 |
| Consumer Finance — 0.8% | | | |
| American Express Credit Corp., 5.38%, 10/01/14 | GBP | 400 | 686,325 |
| Discover Financial Services, 3.85%, 11/21/22 (b) | USD | 400 | 403,096 |
| Ford Motor Credit Co. LLC: | | | |
| 5.00%, 5/15/18 | | 150 | 164,466 |
| 8.13%, 1/15/20 | | 100 | 127,086 |
| | | | 1,380,973 |
| Containers & Packaging — 0.2% | | | |
| Reynolds Group Issuer, Inc., 5.75%, 10/15/20 (b) | USD | 200 | 204,500 |
| Sealed Air Corp., 6.50%, 12/01/20 (b) | | 150 | 156,750 |
| | | | 361,250 |
| Diversified Financial Services — 1.7% | | | |
| Ally Financial, Inc.: | | | |
| 8.00%, 12/31/18 | | 50 | 57,688 |
| 7.50%, 9/15/20 | | 200 | 241,000 |
| Bank of America Corp., 5.63%, 10/14/16 | | 500 | 568,902 |
| General Electric Capital Corp.: | | | |
| 4.88%, 3/06/13 | EUR | 150 | 197,334 |
| 6.00%, 8/07/19 | USD | 500 | 611,521 |
See Notes to Financial Statements.
| 24 | FDP SERIES, INC. | NOVEMBER 30, 2012 |
| |
| Schedule of Investments (continued) | Franklin Templeton Total Return FDP Fund |
| | (Percentages shown are based on Net Assets) |
| | | |
| | | Par | |
| Corporate Bonds | | (000) | Value |
| |
| Diversified Financial Services (concluded) | | | |
| JPMorgan Chase & Co.: | | | |
| 4.38%, 1/30/14 | EUR | 300 | $ | 406,857 |
| 4.25%, 10/15/20 | USD | 700 | 777,101 |
| | | | 2,860,403 |
| Diversified Telecommunication Services — 2.1% | | | |
| AT&T, Inc., 4.38%, 3/15/13 | EUR | 300 | 394,457 |
| CenturyLink, Inc., Series T, 5.80%, 3/15/22 | USD | 300 | 317,024 |
| Frontier Communications Corp.: | | | |
| 8.50%, 4/15/20 | | 100 | 114,250 |
| 7.13%, 1/15/23 | | 100 | 105,750 |
| Intelsat Jackson Holdings SA: | | | |
| 7.50%, 4/01/21 | | 100 | 107,000 |
| 6.63%, 12/15/22 (b) | | 100 | 100,000 |
| Telecom Italia Capital SA, 7.00%, 6/04/18 | | 500 | 563,125 |
| Telefonica Emisiones SAU, 4.95%, 1/15/15 | | 250 | 258,800 |
| Verizon New York, Inc., Series B, 7.38%, 4/01/32 | | 100 | 131,577 |
| Windstream Corp., 8.13%, 8/01/13 | | 1,500 | 1,560,000 |
| | | | 3,651,983 |
| Electric Utilities — 0.7% | | | |
| Dominion Resources, Inc., 8.88%, 1/15/19 | | 600 | 819,333 |
| Georgia Power Co., 4.30%, 3/15/42 | | 100 | 105,321 |
| Pacific Gas & Electric Co., 4.45%, 4/15/42 | | 300 | 329,240 |
| | | | 1,253,894 |
| Energy Equipment & Services — 0.1% | | | |
| Cie Générale de Géophysique — Veritas, | | | |
| 6.50%, 6/01/21 | | 100 | 105,000 |
| Food & Staples Retailing — 1.2% | | | |
| Cencosud SA, 4.88%, 1/20/23 (b) | | 500 | 500,709 |
| CVS Caremark Corp., 5.75%, 6/01/17 | | 300 | 360,454 |
| Rite Aid Corp.: | | | |
| 9.75%, 6/12/16 | | 100 | 108,500 |
| 8.00%, 8/15/20 | | 100 | 112,250 |
| Safeway, Inc., 3.95%, 8/15/20 | | 600 | 597,766 |
| Woolworths Ltd., 4.00%, 9/22/20 (b) | | 300 | 326,234 |
| | | | 2,005,913 |
| Food Products — 1.4% | | | |
| Bunge Ltd. Finance Corp.: | | | |
| 5.88%, 5/15/13 | | 300 | 306,696 |
| 5.10%, 7/15/15 | | 400 | 434,883 |
| Ingredion, Inc., 4.63%, 11/01/20 | | 300 | 338,443 |
| Kraft Foods Group, Inc., 3.50%, 6/06/22 (b) | | 800 | 854,296 |
| Sigma Alimentos SA de CV, 5.63%, 4/14/18 (b) | | 200 | 226,500 |
| Wm. Wrigley Jr. Co., 3.05%, 6/28/13 (b) | | 200 | 202,754 |
| | | | 2,363,572 |
| Health Care Equipment & Supplies — 0.4% | | | |
| PerkinElmer, Inc., 5.00%, 11/15/21 | | 600 | 669,071 |
| Health Care Providers & Services — 1.5% | | | |
| HCA, Inc., 6.75%, 7/15/13 | | 1,500 | 1,545,000 |
| Laboratory Corp. of America Holdings, 3.75%, 8/23/22 | 100 | 106,514 |
| Medco Health Solutions, Inc., 7.13%, 3/15/18 | | 800 | 1,004,221 |
| | | | 2,655,735 |
| Hotels, Restaurants & Leisure — 0.3% | | | |
| Caesars Entertainment Operating Co., Inc., | | | |
| 11.25%, 6/01/17 | | 300 | 322,312 |
| MGM Resorts International: | | | |
| 6.63%, 7/15/15 | | 100 | 106,500 |
| 6.75%, 10/01/20 (b) | | 100 | 100,750 |
| | | | 529,562 |
| Independent Power Producers & | | | |
| Energy Traders — 0.1% | | | |
| Texas Competitive Electric Holdings Co. LLC, | | | |
| 11.50%, 10/01/20 (b) | | 300 | 222,000 |
| | | | |
| | | |
| | | Par | |
| Corporate Bonds | | (000) | Value |
| |
| Industrial Conglomerates — 0.2% | | | |
| General Electric Co., 2.70%, 10/09/22 | USD | 200 | $ | 203,889 |
| Hutchison Whampoa International Ltd., | | | |
| 7.45%, 11/24/33 (b) | | 50 | 71,883 |
| | | | 275,772 |
| Insurance — 1.1% | | | |
| Aflac, Inc., 8.50%, 5/15/19 | | 100 | 136,534 |
| Liberty Mutual Group, Inc., 4.95%, 5/01/22 (b) | | 600 | 651,351 |
| PRICOA Global Funding I, 5.45%, 6/11/14 (b) | | 300 | 321,512 |
| Prudential Covered Trust, 3.00%, 9/30/15 (b) | | 475 | 493,456 |
| Willis Group Holdings Plc, 5.75%, 3/15/21 | | 200 | 228,133 |
| | | | 1,830,986 |
| Media — 1.9% | | | |
| CBS Corp., 1.95%, 7/01/17 | | 500 | 512,069 |
| Clear Channel Communications, Inc., | | | |
| 9.00%, 3/01/21 | | 100 | 88,250 |
| Clear Channel Worldwide Holdings, Inc., Series B, | | | |
| 7.63%, 3/15/20 | | 100 | 98,000 |
| DIRECTV Holdings LLC, 3.80%, 3/15/22 | | 500 | 510,343 |
| DISH DBS Corp., 5.88%, 7/15/22 | | 200 | 214,250 |
| NBC Universal Media LLC, 2.88%, 1/15/23 | | 200 | 201,208 |
| News America, Inc., 7.25%, 5/18/18 | | 400 | 507,661 |
| Time Warner Cable, Inc., 6.75%, 7/01/18 | | 700 | 876,460 |
| Time Warner, Inc., 6.10%, 7/15/40 | | 200 | 246,265 |
| | | | 3,254,506 |
| Metals & Mining — 0.5% | | | |
| ArcelorMittal, 6.00%, 3/01/21 | | 100 | 99,822 |
| Cliffs Natural Resources, Inc., 4.80%, 10/01/20 | | 200 | 196,080 |
| FMG Resources August 2006 Property Ltd., | | | |
| 6.88%, 4/01/22 (b) | | 200 | 195,000 |
| Teck Resources Ltd., 4.50%, 1/15/21 | | 300 | 323,080 |
| | | | 813,982 |
| Multi-Utilities — 0.5% | | | |
| CenterPoint Energy, Inc., 6.50%, 5/01/18 | | 300 | 367,921 |
| CenterPoint Energy Resources Corp., | | | |
| 6.13%, 11/01/17 | | 200 | 241,974 |
| GDF Suez, 1.63%, 10/10/17 (b) | | 300 | 301,602 |
| | | | 911,497 |
| Oil, Gas & Consumable Fuels — 3.9% | | | |
| Apache Corp., 4.25%, 1/15/44 | | 500 | 509,463 |
| Canadian Natural Resources Ltd., | | | |
| 5.90%, 2/01/18 | | 500 | 605,894 |
| Chesapeake Energy Corp., 6.63%, 8/15/20 | | 200 | 209,500 |
| CNPC HK Overseas Capital Ltd., | | | |
| 5.95%, 4/28/41 (b) | | 200 | 258,118 |
| Energy Transfer Equity LP, 7.50%, 10/15/20 | | 100 | 113,500 |
| ENI SpA, 4.15%, 10/01/20 (b) | | 300 | 310,056 |
| Enogex LLC, 6.25%, 3/15/20 (b) | | 400 | 461,608 |
| Enterprise Products Operating LLC: | | | |
| 5.20%, 9/01/20 | | 100 | 119,229 |
| 7.03%, 1/15/68 (a) | | 200 | 225,500 |
| Gaz Capital for Gazprom, 6.21%, 11/22/16 (b) | | 500 | 559,500 |
| Kinder Morgan Finance Co. LLC, | | | |
| 6.00%, 1/15/18 (b) | | 200 | 218,769 |
| Plains Exploration & Production Co., | | | |
| 6.63%, 5/01/21 | | 200 | 205,000 |
| Samson Investment Co., 9.75%, 2/15/20 (b) | | 100 | 105,750 |
| SandRidge Energy, Inc.: | | | |
| 8.75%, 1/15/20 | | 100 | 108,250 |
| 7.50%, 2/15/23 | | 100 | 104,000 |
| Valero Energy Corp., 9.38%, 3/15/19 | | 800 | 1,097,724 |
| Weatherford International Ltd., 5.95%, 4/15/42 | | 900 | 907,375 |
| Woodside Finance Ltd., 4.50%, 11/10/14 (b) | | 600 | 635,890 |
| | | | 6,755,126 |
See Notes to Financial Statements.
| FDP SERIES, INC. | NOVEMBER 30, 2012 | 25 |
| |
| Schedule of Investments (continued) | Franklin Templeton Total Return FDP Fund |
| | (Percentages shown are based on Net Assets) |
| | | |
| | | Par | |
| Corporate Bonds | | (000) | Value |
| |
| Paper & Forest Products — 0.0% | | | |
| NewPage Corp., 11.38%, 12/31/14 (c)(d) | USD | 100 | $ | 48,000 |
| Pharmaceuticals — 0.2% | | | |
| AbbVie, Inc., 2.90%, 11/06/22 (b) | | 300 | 306,343 |
| Watson Pharmaceuticals, Inc., 3.25%, 10/01/22 | | 100 | 102,856 |
| | | | 409,199 |
| Real Estate Investment Trusts (REITs) — 1.2% | | | |
| ERP Operating LP, 5.75%, 6/15/17 | | 500 | 592,611 |
| Healthcare Realty Trust, Inc.: | | | |
| 6.50%, 1/17/17 | | 500 | 575,581 |
| 4.13%, 4/01/19 | | 500 | 538,006 |
| KimCo Realty Corp., 6.88%, 10/01/19 | | 200 | 248,094 |
| | | | 1,954,292 |
| Real Estate Management & | | | |
| Development — 0.4% | | | |
| Forest City Enterprises, Inc., 7.63%, 6/01/15 | | 29 | 29,073 |
| WEA Finance LLC, 5.70%, 10/01/16 (b) | | 540 | 614,370 |
| | | | 643,443 |
| Semiconductors & Semiconductor | | | |
| Equipment — 0.1% | | | |
| Freescale Semiconductor, Inc.: | | | |
| 9.25%, 4/15/18 (b) | | 75 | 80,719 |
| 10.75%, 8/01/20 | | 134 | 140,532 |
| | | | 221,251 |
| Software — 0.3% | | | |
| Symantec Corp., 2.75%, 6/15/17 | | 500 | 516,888 |
| Tobacco — 0.4% | | | |
| Altria Group, Inc., 9.70%, 11/10/18 | | 169 | 238,496 |
| Lorillard Tobacco Co., 2.30%, 8/21/17 | | 400 | 406,575 |
| | | | 645,071 |
| Transportation Infrastructure — 0.5% | | | |
| DP World Ltd., 6.85%, 7/02/37 (b) | | 380 | 423,700 |
| Sydney Airport Finance Co. Property Ltd., | | | |
| 3.90%, 3/22/23 (b) | | 500 | 509,500 |
| | | | 933,200 |
| Utilities — 0.3% | | | |
| Sempra Energy, 2.88%, 10/01/22 | | 600 | 604,030 |
| Wireless Telecommunication Services — 0.1% | | | |
| Sprint Nextel Corp., 7.00%, 3/01/20 (b) | | 200 | 231,500 |
| Total Corporate Bonds — 28.1% | | | 48,678,643 |
| |
| |
| Floating Rate Loan Interests (a) | | | |
| |
| Aerospace & Defense — 0.1% | | | |
| TransDigm, Inc.: | | | |
| Tranche B1 Term Loan, 4.00%, 2/14/17 | | 184 | 184,308 |
| Tranche B2 Term Loan, 4.00%, 2/14/17 | | 28 | 27,906 |
| | | | 212,214 |
| Auto Components — 0.0% | | | |
| Federal-Mogul Corp.: | | | |
| Term Loan B, 2.15%, 12/29/14 | | 47 | 43,520 |
| Term Loan C, 2.15%, 12/28/15 | | 24 | 22,205 |
| | | | 65,725 |
| Chemicals — 0.3% | | | |
| Ineos US Finance LLC, Dollar Term Loan, | | | |
| 6.50%, 5/04/18 | | 286 | 289,494 |
| PL Propylene LLC, Term Loan B, 7.00%, 3/27/17 | | 146 | 148,409 |
| | | | |
| | | |
| | | Par | |
| Floating Rate Loan Interests (a) | | (000) | Value |
| |
| Chemicals (concluded) | | | |
| Tronox Pigments (Netherlands) BV: | | | |
| Delayed Draw Term Loan, 4.25%, 2/08/18 | USD | 21 | $ | 20,674 |
| Closing Date Term Loan B, 4.25%, 2/08/18 | | 75 | 75,807 |
| | | | 534,384 |
| Commercial Services & Supplies — 0.5% | | | |
| ARAMARK Corp.: | | | |
| Extended Synthetic LC, 3.31%, 7/26/16 | | 14 | 14,523 |
| Extended Synthetic LC, 3.31%, 7/26/16 | | —(e) | 123 |
| Extended Term Loan B, 3.46%, 7/26/16 | | 220 | 220,820 |
| Extended Term Loan C, 3.46% — | | | |
| 3.61%, 7/26/16 | | 2 | 1,528 |
| Interactive Data Corp., Term Loan B, | | | |
| 4.50%, 2/12/18 | | 341 | 342,364 |
| KAR Auction Services, Inc., Term Loan, | | | |
| 5.00%, 5/19/17 | | 277 | 278,963 |
| | | | 858,321 |
| Consumer Finance — 0.5% | | | |
| Moneygram Payment Systems Worldwide, Inc.: | | | |
| Term Loan B, 4.25%, 11/20/17 | | 445 | 445,211 |
| Term Loan B-1, 4.25%, 11/17/17 | | 366 | 365,890 |
| | | | 811,101 |
| Containers & Packaging — 0.3% | | | |
| Exopack LLC, Term Loan, 6.50%, 5/31/17 | | 17 | 16,980 |
| Reynolds Group Holdings, Inc., Term Loan, | | | |
| 4.75%, 9/28/18 | | 445 | 448,329 |
| | | | 465,309 |
| Diversified Financial Services — 0.3% | | | |
| Asurion LLC: | | | |
| Term Loan (First Lien), 5.50%, 5/24/18 | | 38 | 38,370 |
| Term Loan B-1, 4.75%, 7/23/17 | | 56 | 56,062 |
| TransUnion LLC, Term Loan, 5.50%, 2/10/18 | | 314 | 317,963 |
| | | | 412,395 |
| Diversified Telecommunication | | | |
| Services — 0.4% | | | |
| Intelsat Jackson Holdings S.A., Tranche B Term | | | |
| Loan, 4.50%, 4/02/18 | | 698 | 699,364 |
| Electronic Equipment, Instruments & | | | |
| Components — 0.1% | | | |
| Flextronics International Ltd., Delayed Draw: | | | |
| Term Loan A, 2.46%, 10/01/14 | | 12 | 11,933 |
| Term Loan A-1A, 2.46%, 10/01/14 | | 3 | 3,429 |
| Term Loan A-1B, 2.46%, 10/01/14 | | 16 | 16,191 |
| Term Loan A-2, 2.46%, 10/01/14 | | 10 | 9,848 |
| Term Loan A-3, 2.46%, 10/01/14 | | 55 | 54,821 |
| | | | 96,222 |
| Food Products — 0.3% | | | |
| Advance Pierre Foods, Inc., Term Loan (Second | | | |
| Lien), 5.75%, 7/10/17 | | 77 | 77,491 |
| Del Monte Foods Co., Initial Term Loan, | | | |
| 4.50%, 3/08/18 | | 538 | 538,496 |
| | | | 615,987 |
| Health Care Equipment & Supplies — 0.3% | | | |
| Bausch & Lomb, Inc., Parent Term Loan, | | | |
| 5.25%, 5/18/19 | | 371 | 375,998 |
| Hologic, Inc., Term Loan B, 4.50%, 8/01/19 | | 100 | 101,407 |
| | | | 477,405 |
| Health Care Providers & Services — 1.0% | | | |
| Community Health Systems, Inc., Extended Term | | | |
| Loan, 3.81% — 3.86%, 1/25/17 | | 598 | 601,367 |
See Notes to Financial Statements.
| 26 | FDP SERIES, INC. | NOVEMBER 30, 2012 |
| |
| Schedule of Investments (continued) | Franklin Templeton Total Return FDP Fund |
| | (Percentages shown are based on Net Assets) |
| | | |
| | | Par | |
| Floating Rate Loan Interests (a) | | (000) | Value |
| |
| Health Care Providers & Services (concluded) | | | |
| DaVita, Inc.: | | | |
| Tranche B Term Loan, 4.50%, 10/20/16 | USD | 154 | $ | 154,841 |
| Term Loan B2, 4.00%, 8/24/19 | | 235 | 235,260 |
| HCA, Inc., Tranche B-2 Term Loan, | | | |
| 3.61%, 3/31/17 | | 533 | 533,491 |
| Universal Health Services, Inc., New Tranche B | | | |
| Term Loan, 3.75%, 11/15/16 | | 171 | 171,083 |
| | | | 1,696,042 |
| Hotels, Restaurants & Leisure — 0.3% | | | |
| Ameristar Casinos, Inc., Term Loan B, | | | |
| 4.00%, 4/16/18 | | 126 | 126,562 |
| Burger King Holdings, Inc., Tranche B Term Loan, | | | |
| 3.75%, 9/27/19 | | 237 | 238,134 |
| DineEquity, Inc., Term Loan B-1, | | | |
| 4.25%, 10/19/17 | | 170 | 171,476 |
| Wendy’s International, Inc., Term Loan B, | | | |
| 4.75%, 5/15/19 | | 76 | 76,346 |
| | | | 612,518 |
| Household Products — 0.0% | | | |
| Spectrum Brands, Inc., Term Loan, | | | |
| 6.50%, 12/17/19 | | 28 | 28,175 |
| Machinery — 0.5% | | | |
| Allison Transmission, Inc., Term Loan B3, | | | |
| 4.25%, 8/23/19 | | 99 | 99,447 |
| Rexnord Corp., Term Loan B, 4.50%, 4/02/18 | | 320 | 322,782 |
| Terex Corp., US Term Loan, 4.50%, 4/28/17 | | 270 | 271,847 |
| Tomkins LLC and Tomkins, Inc., Term Loan B-1, | | | |
| 4.25%, 9/29/16 | | 125 | 125,344 |
| | | | 819,420 |
| Media — 0.8% | | | |
| Cinemark USA, Inc., Extended Term Loan, 3.46% — | | | |
| 3.62%, 4/29/16 | | 152 | 152,557 |
| CSC Holdings, Inc. (Cablevision): | | | |
| Incremental Term Loan B-2, 1.96%, 3/29/16 | | 169 | 169,798 |
| Incremental Term Loan B-3, 1.96%, 3/29/16 | | 54 | 53,883 |
| Foxco Acquisition Sub LLC, Term Loan B, | | | |
| 5.50%, 7/14/17 | | 53 | 53,799 |
| Regal Cinemas Corp., Term Loan, 3.21% — | | | |
| 3.36%, 8/23/17 | | 204 | 204,231 |
| Sinclair Television Group, Inc., Tranche B Term | | | |
| Loan, 4.00%, 10/28/16 | | 83 | 83,495 |
| Telesat Canada, Term Loan B, 4.25%, 3/26/19 | | 212 | 212,631 |
| UPC Financing Partnership: | | | |
| Term Loan AF, 3.71%, 1/29/21 | | 52 | 51,805 |
| Term Loan T, 3.71%, 12/31/16 | | 206 | 204,503 |
| Term Loan X, 3.71%, 12/29/17 | | 140 | 139,469 |
| Weather Channel, Term Loan B, 4.25%, 2/13/17 | | 145 | 146,224 |
| | | | 1,472,395 |
| Metals & Mining — 0.6% | | | |
| American Rock Salt Co. LLC, Initial Loan, | | | |
| 5.50%, 4/25/17 | | 133 | 131,789 |
| FMG America Finance, Inc., Term Loan, | | | |
| 5.25%, 10/18/17 | | 184 | 184,460 |
| Walter Energy, Inc., Term Loan B, 5.75%, 4/02/18 | | 627 | 628,971 |
| | | | 945,220 |
| Oil, Gas & Consumable Fuels — 0.2% | | | |
| Arch Coal, Inc., Term Loan, 5.75%, 5/16/18 | | 316 | 318,399 |
| Plains Exploration and Production, Term Loan B, | | | |
| 6.50%, 11/30/19 | | 145 | 145,443 |
| | | | 463,842 |
| | | | |
| | | |
| | | Par | |
| Floating Rate Loan Interests (a) | | (000) | Value |
| |
| Paper & Forest Products — 0.2% | | | |
| NewPage Corp.: | | | |
| DIP Term Loan, 8.75%, 3/07/13 | USD | 184 | $ | 183,761 |
| Term Loan B, 6.50%, 12/21/18 | | 162 | 160,826 |
| | | | 344,587 |
| Pharmaceuticals — 0.5% | | | |
| Par Pharmaceutical Cos., Inc., Term Loan B, | | | |
| 5.00%, 9/30/19 | | 77 | 77,233 |
| Valeant Pharmaceuticals International, Inc.: | | | |
| Series C, Tranche B, 6.50%, 12/11/19 | | 187 | 187,059 |
| Series D, Tranche B, 4.25%, 2/13/19 | | 184 | 184,925 |
| Warner Chilcott Corp.: | | | |
| Incremental Term Loan B-1, 4.25%, 3/15/18 | | 67 | 67,319 |
| Term Loan B, 4.25%, 3/15/18 | | 176 | 177,269 |
| Term Loan B-2, 4.25%, 3/15/18 | | 88 | 88,635 |
| WC Luxco S.a.r.l., Term Loan B-3, | | | |
| 4.25%, 3/15/18 | | 121 | 121,873 |
| | | | 904,313 |
| Road & Rail — 0.2% | | | |
| Avis Budget Car Rental LLC, Tranche C Term Loan, | | | |
| 4.25%, 3/15/19 | | 126 | 126,311 |
| The Hertz Corp.: | | | |
| Credit Linked Deposit, 3.75%, 3/09/18 | | 40 | 39,010 |
| Tranche B Term Loan, 3.75%, 3/11/18 | | 166 | 166,197 |
| | | | 331,518 |
| Specialty Retail — 0.6% | | | |
| BJ’s Wholesale Club, Inc., Term Loan (First Lien), | | | |
| 5.75%, 9/26/19 | | 545 | 551,320 |
| Evergreen Acqco 1 LP, Term Loan, | | | |
| 5.00%, 7/09/19 | | 255 | 255,598 |
| Party City Holdings Inc., Term Loan B, | | | |
| 5.75%, 7/26/19 | | 176 | 177,541 |
| | | | 984,459 |
| Total Floating Rate Loan Interests — 8.0% | | | 13,850,916 |
| |
| |
| Foreign Agency Obligations | | | |
| |
| Australia Government Bond, Series 118, | | | |
| 6.50%, 5/15/13 | AUD | 85 | 90,130 |
| Brazil Notas do Tesouro Nacional, Series F, | | | |
| 10.00%, 1/01/17 | BRL | 2,800(f) | 1,367,772 |
| Hungary Government International Bond: | | | |
| 6.00%, 1/11/19 | EUR | 120 | 159,849 |
| 3.88%, 2/24/20 | | 40 | 47,028 |
| Iceland Government International Bond, | | | |
| 5.88%, 5/11/22 (b) | USD | 100 | 109,250 |
| Ireland Government Bond: | | | |
| 4.60%, 4/18/16 | EUR | 29 | 40,262 |
| 4.50%, 10/18/18 | | 34 | 45,922 |
| 4.40%, 6/18/19 | | 64 | 84,166 |
| 5.90%, 10/18/19 | | 149 | 212,607 |
| 4.50%, 4/18/20 | | 113 | 148,032 |
| 5.00%, 10/18/20 | | 186 | 250,137 |
| 5.40%, 3/13/25 | | 172 | 231,278 |
| Israel Government Bond: | | | |
| Series 0313, 5.00%, 3/31/13 | ILS | 318 | 84,242 |
| Series 0913, 3.50%, 9/30/13 | | 643 | 170,738 |
| Korea Monetary Stabilization Bond: | | | |
| Series 1304, 3.83%, 4/02/13 | KRW | 45,140 | 41,828 |
| Series 1306, 3.76%, 6/02/13 | | 72,220 | 67,009 |
| Series 1308, 3.90%, 8/02/13 | | 135,430 | 125,969 |
| Series 1310, 3.59%, 10/02/13 | | 126,390 | 117,482 |
| Series 1312, 3.48%, 12/02/13 | | 216,700 | 201,446 |
| Series 1402, 3.47%, 2/02/14 | | 297,980 | 277,246 |
See Notes to Financial Statements.
| FDP SERIES, INC. | NOVEMBER 30, 2012 | 27 |
| |
| Schedule of Investments (continued) | Franklin Templeton Total Return FDP Fund |
| | (Percentages shown are based on Net Assets) |
| | | |
| | | Par | |
| Foreign Agency Obligations | | (000) | Value |
| |
| Korea Monetary Stabilization Bond (concluded): | | | |
| Series 1404, 3.59%, 4/02/14 | KRW | 437,940 | $ | 408,469 |
| Series 1406, 3.28%, 6/02/14 | | 519,220 | 482,634 |
| Series 1408, 2.82%, 8/02/14 | | 14,200 | 13,111 |
| Series 1410, 2.78%, 10/02/14 | | 56,600 | 52,232 |
| Korea Treasury Bond: | | | |
| Series 1212, 4.25%, 12/10/12 | | 20,000 | 18,473 |
| Series 1303, 5.25%, 3/10/13 | | 9,900 | 9,201 |
| Series 1312, 3.00%, 12/10/13 | | 349,000 | 322,936 |
| Series 1406, 3.50%, 6/10/14 | | 332,710 | 310,328 |
| Series 1412, 3.25%, 12/10/14 | | 4,700 | 4,376 |
| Lithuania Government International Bond (b): | | | |
| 6.75%, 1/15/15 | USD | 130 | 143,185 |
| 7.38%, 2/11/20 | | 310 | 400,675 |
| Malaysia Government Bond: | | | |
| Series 3/03, 3.70%, 2/25/13 | MYR | 1,549 | 510,296 |
| Series 0507, 3.70%, 5/15/13 | | 265 | 87,427 |
| Series 0509, 3.21%, 5/31/13 | | 2,655 | 874,088 |
| Series 0108, 3.46%, 7/31/13 | | 855 | 282,002 |
| Series 4/98, 8.00%, 10/30/13 | | 10 | 3,434 |
| Series 2/04, 5.09%, 4/30/14 | | 170 | 57,467 |
| Series 0211, 3.43%, 8/15/14 | | 40 | 13,234 |
| Series 2/03, 4.24%, 2/07/18 | | 2,250 | 773,309 |
| Mexican Bonos (g): | | | |
| Series M, 9.00%, 6/20/13 | MXN | 81,720(g) | 646,288 |
| Series MI 10, 9.00%, 12/20/12 | | 46,000(g) | 356,271 |
| Series MI 10, 8.00%, 12/19/13 | | 90,800(g) | 725,270 |
| Series MI 10, 9.50%, 12/18/14 | | 34,000(g) | 286,328 |
| New South Wales Treasury Corp.: | | | |
| Series 13, 5.25%, 5/01/13 | AUD | 20 | 21,082 |
| Series 813, 5.50%, 8/01/13 | | 795 | 843,977 |
| Peru Government Bond, 7.84%, 8/12/20 | PEN | 615(h) | 296,173 |
| Philippine Government Bond, Series 7-43, | | | |
| 8.75%, 3/03/13 | PHP | 4,350 | 108,490 |
| Poland Government Bond: | | | |
| Series 0413, 5.25%, 4/25/13 | PLN | 290 | 92,500 |
| Series 0713, 3.47%, 7/25/13 (i) | | 2,490 | 772,098 |
| Series 1013, 5.00%, 10/24/13 | | 2,345 | 753,031 |
| Series 0114, 3.49%, 1/25/14 (i) | | 800 | 244,027 |
| Series 0414, 5.75%, 4/25/14 | | 1,395 | 456,021 |
| Series 0415, 5.50%, 4/25/15 | | 365 | 121,333 |
| Series 1015, 6.25%, 10/24/15 | | 420 | 143,361 |
| Series 0117, 5.15%, 1/25/17 (a) | | 376 | 119,561 |
| Series 0121, 5.15%, 1/25/21 (a) | | 381 | 120,111 |
| Poland Government International Bond, | | | |
| 6.38%, 7/15/19 | USD | 340 | 425,000 |
| Queensland Treasury Corp., Series 13, | | | |
| 6.00%, 8/14/13 | AUD | 70 | 74,651 |
| Republic of Ghana, 8.50%, 10/04/17 (b) | USD | 100 | 115,000 |
| Republic of Hungary: | | | |
| 3.50%, 7/18/16 | EUR | 20 | 24,976 |
| 4.38%, 7/04/17 | | 45 | 57,062 |
| 5.75%, 6/11/18 | | 95 | 125,638 |
| Russian Government International Bond, | | | |
| 7.50%, 3/31/30 (b) | USD | 760 | 965,400 |
| Sweden Government Bond: | | | |
| Series 1055, 1.50%, 8/30/13 | SEK | 8,850 | 1,338,909 |
| Series 1041, 6.75%, 5/05/14 | | 10,050 | 1,638,005 |
| Ukraine Government International Bond, | | | |
| 7.95%, 2/23/21 (b) | USD | 200 | 212,208 |
| Venezuela Government International Bond, | | | |
| 10.75%, 9/19/13 | | 80 | 82,800 |
| Vietnam Government International Bond, | | | |
| 6.75%, 1/29/20 (b) | | 320 | 369,200 |
| Western Australia Treasury Corp., Series 13, | | | |
| 8.00%, 6/15/13 | AUD | 179 | 191,817 |
| Total Foreign Agency Obligations — 11.8% | | | 20,365,858 |
| | | | |
| | | |
| | | Par | |
| Non-Agency Mortgage-Backed Securities | | (000) | Value |
| |
| Collateralized Mortgage Obligations — 0.6% | | | |
| Bear Stearns Alt-A Trust, Series 2004-13, | | | |
| Class A2, 1.09%, 11/25/34 (a) | USD | 117 | $ | 104,365 |
| Credit Suisse Mortgage Capital Certificates, | | | |
| Series 2009-15R, Class 3A1, | | | |
| 5.35%, 3/26/36 (a)(b) | | 525 | 555,760 |
| Wells Fargo Mortgage-Backed Securities Trust: | | | |
| Series 2004-W, Class A9, | | | |
| 2.70%, 11/25/34 (a) | | 224 | 228,281 |
| Series 2007-3, Class 3A1, 5.50%, 4/25/22 | | 117 | 121,296 |
| | | | 1,009,702 |
| Commercial Mortgage-Backed Securities — 4.1% | | | |
| Banc of America Large Loan, Inc., Series 2010, | | | |
| Class HLTN, 2.51%, 11/15/15 (a)(b) | | 459 | 458,018 |
| Banc of America Merrill Lynch Commercial | | | |
| Mortgage, Inc., Series 2006-4: | | | |
| Class AM, 5.68%, 7/10/46 | | 500 | 561,043 |
| Class AJ, 5.70%, 7/10/46 (a) | | 732 | 693,651 |
| Bear Stearns Commercial Mortgage Securities (a): | | | |
| Series 2006-PW11, Class AJ, | | | |
| 5.62%, 3/11/39 | | 694 | 690,973 |
| Series 2006-PW12, Class AJ, | | | |
| 5.93%, 9/11/38 | | 112 | 109,847 |
| Series 2006-PW13, Class AJ, | | | |
| 5.61%, 9/11/41 | | 640 | 622,452 |
| Series 2006-T24, Class B, 5.66%, 10/12/41 | | | |
| (b) | | 148 | 96,200 |
| Citigroup Commercial Mortgage Trust: | | | |
| Series 2006-C5, Class AJ, 5.48%, 10/15/49 | | 210 | 199,742 |
| Series 2007-C6, Class AM | | | |
| 5.89%, 12/10/49 (a) | | 506 | 566,032 |
| Citigroup/Deutsche Bank Commercial Mortgage | | | |
| Trust, Series 2006-CD3, Series AJ, | | | |
| 5.69%, 10/15/48 | | 425 | 361,588 |
| GMAC Commercial Mortgage Securities, Inc., | | | |
| Series 2005-C1, Class B, 4.94%, 5/10/43 | | 750 | 396,945 |
| Greenwich Capital Commercial Funding Corp. (a): | | | |
| Series 2005-GG5, Class B 5.50%, 4/10/37 | | 350 | 130,724 |
| Series 2006-GG7, Class AJ 6.06%, 7/10/38 | | 640 | 619,464 |
| JPMorgan Chase Commercial Mortgage | | | |
| Securities Corp.: | | | |
| Series 2006-CB14, Class AM | | | |
| 5.64%, 12/12/44 (a) | | 400 | 432,700 |
| Series 2006-CB17, Class AM | | | |
| 5.46%, 12/12/43 | | 300 | 310,135 |
| Series 2006-LDP7, Class AJ | | | |
| 6.06%, 4/15/45 (a) | | 240 | 233,378 |
| Morgan Stanley Capital I Trust, Series 2006-HQ8, | | | |
| Class AJ, 5.68%, 3/12/44 (a) | | 260 | 255,529 |
| Wachovia Bank Commercial Mortgage Trust, | | | |
| Series 2007-WHL8, Class A1, | | | |
| 0.29%, 6/15/20 (a)(b) | | 333 | 326,142 |
| | | | 7,064,563 |
| Total Non-Agency Mortgage-Backed | | | |
| Securities — 4.7% | | | 8,074,265 |
| |
| |
| | Beneficial | |
| | | Interest | |
| Other Interests — 0.0% (j) | | (000) | |
| |
| Automobiles — 0.0% | | | |
| General Motors II | | 7 | — |
| Motors Liquidation Co. GUC Trust (c) | | —(e) | 3,237 |
| | | | 3,237 |
See Notes to Financial Statements.
| 28 | FDP SERIES, INC. | NOVEMBER 30, 2012 |
| |
| Schedule of Investments (continued) | Franklin Templeton Total Return FDP Fund |
| | (Percentages shown are based on Net Assets) |
| | | |
| | | Par | |
| Preferred Securities | | (000) | Value |
| |
| Capital Trusts | | | |
| |
| Commercial Banks — 1.0% | | | |
| Bank of America Corp., Series M, 8.13% (a)(k) | USD | 300 | $ | 332,595 |
| Fifth Third Capital Trust IV, 6.50%, 4/15/67 (a) | | 500 | 501,250 |
| Wachovia Capital Trust III, 5.57% (a)(k) | | 1,000 | 996,250 |
| | | | 1,830,095 |
| Consumer Finance — 0.1% | | | |
| Capital One Capital VI, 8.88%, 5/15/40 | | 100 | 100,550 |
| Diversified Financial Services — 0.4% | | | |
| JPMorgan Chase & Co., 7.90% (a)(k) | | 575 | 649,577 |
| Insurance — 0.4% | | | |
| MetLife, Inc., 6.40%, 12/15/66 | | 600 | 637,420 |
| Mitsui Sumitomo Insurance Co. Ltd., | | | |
| 7.00%, 3/15/72 (a)(b) | | 100 | 117,393 |
| | | | 754,813 |
| Total Capital Trusts — 1.9% | | | 3,335,035 |
| |
| |
| Preferred Stocks — 0.4% | | Shares | |
| |
| Commercial Banks — 0.4% | | | |
| US Bancorp, Series G, 6.00% (a) | | 24,000 | 661,920 |
| |
| |
| Trust Preferreds — 0.1% | | | |
| |
| Diversified Financial Services — 0.1% | | | |
| GMAC Capital Trust I, Series 2, | | | |
| 8.13%, 2/15/40 (a) | | 3,800 | 98,604 |
| Total Preferred Securities — 2.4% | | | 4,095,559 |
| |
| |
| | | Par | |
| Taxable Municipal Bonds | | (000) | |
| |
| City of Tulare California, RB, Build America Bonds | | | |
| (AGM), 8.75%, 11/15/44 | USD | 75 | 93,860 |
| New York City Industrial Development Agency, RB, | | | |
| 11.00%, 3/01/29 (b) | | 100 | 135,728 |
| State of California, GO, Various Purpose, | | | |
| 6.00%, 11/01/39 | | 210 | 264,955 |
| State of Illinois, GO, 5.88%, 3/01/19 | | 495 | 573,987 |
| Total Municipal Bonds — 0.6% | | | 1,068,530 |
| |
| |
| US Government Sponsored Agency Securities | | | |
| |
| Agency Obligations — 2.6% | | | |
| Fannie Mae, 5.38%, 6/12/17 | | 1,000 | $ | 1,210,339 |
| Freddie Mac: | | | |
| 2.88%, 2/09/15 | | 2,000 | 2,110,668 |
| 6.25%, 7/15/32 | | 800 | 1,210,297 |
| | | | 4,531,304 |
| Collateralized Mortgage Obligations — 1.1% | | | |
| Fannie Mae Mortgage-Backed Securities, | | | |
| Series 2007-1, Class NF, 0.46%, 2/25/37 (a) | | 753 | 755,495 |
| Freddie Mac Mortgage-Backed Securities, | | | |
| Series 2643, Class OG, 5.00%, 7/15/32 | | 1,000 | 1,060,091 |
| | | | 1,815,586 |
| | | | |
| | | |
| | | Par | |
| US Government Sponsored Agency Securities | | (000) | Value |
| |
| Mortgage-Backed Securities — 24.4% | | | |
| Fannie Mae Mortgage-Backed Securities: | | | |
| 1.88%, 5/01/33 (a) | USD | 13 | $ | 13,482 |
| 2.06%, 4/01/35 (a) | | 20 | 20,652 |
| 2.11%, 10/01/32 (a) | | 136 | 142,490 |
| 2.34%, 9/01/34 (a) | | 479 | 502,563 |
| 2.50%, 12/15/27 (l) | | 900 | 941,344 |
| 2.59%, 4/01/35 (a) | | 243 | 258,322 |
| 3.00%, 12/15/42 (l) | | 7,900 | 8,312,281 |
| 3.50%, 12/15/27–12/15/42 (l) | | 4,350 | 4,622,508 |
| 4.00%, 12/15/27 (l) | | 3,100 | 3,316,031 |
| 5.00%, 8/01/35–12/15/42 (l) | | 9,873 | 10,702,515 |
| 5.50%, 11/01/34–3/01/36 | | 3,220 | 3,625,029 |
| 6.00%, 6/01/21–9/01/38 | | 1,794 | 1,991,417 |
| 6.50%, 1/01/36 | | 156 | 177,284 |
| Freddie Mac Mortgage-Backed Securities: | | | |
| 2.32%, 11/01/27 (a) | | 249 | 261,353 |
| 2.46%, 4/01/32 (a) | | 86 | 91,451 |
| 2.85%, 9/01/32 (a) | | 14 | 14,577 |
| 3.00%, 12/15/42 (l) | | 3,300 | 3,459,844 |
| 4.50%, 9/01/20 | | 61 | 65,069 |
| 5.00%, 7/01/23–12/15/42 (l) | | 2,758 | 2,959,493 |
| 5.50%, 11/01/37 | | 14 | 14,862 |
| 6.00%, 10/01/21–2/01/39 | | 329 | 360,053 |
| 6.50%, 9/01/38 | | 47 | 53,950 |
| Ginnie Mae Mortgage-Backed Securities, | | | |
| 6.50%, 12/20/37–07/15/38 | | 374 | 426,964 |
| | | | 42,333,534 |
| Total US Government Sponsored | | | |
| Agency Securities — 28.1% | | | 48,680,424 |
| |
| |
| US Treasury Obligations | | | |
| |
| US Treasury Bonds: | | | |
| 6.25%, 5/15/30 | | 1,700 | 2,683,345 |
| 4.75%, 2/15/37 | | 950 | 1,324,359 |
| 5.00%, 5/15/37 | | 400 | 576,812 |
| 4.25%, 5/15/39 | | 600 | 783,469 |
| 4.63%, 2/15/40 | | 2,200 | 3,041,843 |
| 4.38%, 5/15/40 | | 450 | 599,695 |
| 4.38%, 5/15/41 | | 300 | 400,219 |
| 3.13%, 2/15/42 | | 1,100 | 1,180,437 |
| 3.00%, 5/15/42 | | 400 | 418,375 |
| US Treasury Inflation Indexed Bonds: | | | |
| 2.00%, 1/15/16 | | 1,166 | 1,294,696 |
| 0.13%, 4/15/16 | | 1,573 | 1,656,696 |
| US Treasury Notes: | | | |
| 2.75%, 10/31/13 | | 600 | 613,875 |
| 2.00%, 11/30/13 | | 2,800 | 2,849,655 |
| 1.75%, 3/31/14 | | 3,300 | 3,366,000 |
| 1.88%, 4/30/14 | | 1,100 | 1,125,352 |
| 2.25%, 5/31/14 | | 1,500 | 1,544,883 |
| 2.25%, 1/31/15 | | 1,000 | 1,042,500 |
| 4.00%, 2/15/15 | | 1,000 | 1,081,484 |
| 2.50%, 4/30/15 | | 2,900 | 3,053,836 |
| 4.13%, 5/15/15 | | 500 | 546,719 |
| 4.25%, 8/15/15 | | 1,100 | 1,216,016 |
| 4.50%, 11/15/15 | | 400 | 448,750 |
| 4.88%, 8/15/16 | | 3,600 | 4,187,250 |
| 4.63%, 11/15/16 | | 900 | 1,046,531 |
| 4.63%, 2/15/17 | | 1,000 | 1,171,562 |
| 4.50%, 5/15/17 | | 350 | 411,004 |
| 4.75%, 8/15/17 | | 1,400 | 1,671,578 |
| 3.50%, 2/15/18 | | 1,000 | 1,144,453 |
| 3.38%, 11/15/19 | | 2,300 | 2,667,282 |
| 3.50%, 5/15/20 | | 2,100 | 2,460,937 |
| Total US Treasury Obligations — 26.3% | | | 45,609,613 |
See Notes to Financial Statements.
| FDP SERIES, INC. | NOVEMBER 30, 2012 | 29 |
| |
| Schedule of Investments (continued) | Franklin Templeton Total Return FDP Fund |
| | (Percentages shown are based on Net Assets) |
| | | |
| Warrants (m) | | Shares | Value |
| |
| Automobiles — 0.0% | | | |
| General Motors Co. (Issued/Exercisable | | | |
| 11/02/10, 1.0 Share for 1 Warrant, Expires | | | |
| 7/10/16, Strike Price USD 10.00) | | 600 | $ | 10,032 |
| General Motors Co. (Issued/Exercisable | | | |
| 11/02/10, 1.0 Share for 1 Warrant, Expires | | | |
| 7/10/19, Strike Price USD 18.33) | | 600 | 6,342 |
| Total Warrants — 0.0% | | | 16,374 |
| Total Long-Term Investments | | | |
| (Cost — $186,503,762) — 112.6% | | | 194,943,610 |
| |
| |
| | | Par | |
| Short-Term Securities | | (000) | |
| |
| Foreign Agency Obligations — 1.6% | | | |
| Malaysia — 0.5% | | | |
| Bank Negara Malaysia Monetary Notes (n): | | | |
| Series 0212, 2.83% – 2.93%, 1/10/13 | MYR | 115 | 37,717 |
| Series 0512, 2.83% – 2.93%, 1/17/13 | | 90 | 29,503 |
| Series 1012, 1.00% – 3.01%, 12/20/12 | | 153 | 50,261 |
| Series 1112, 1.00%, 2/19/13 | | 130 | 42,506 |
| Series 1412, 1.00%, 2/26/13 | | 75 | 24,510 |
| Series 2212, 2.90%, 1/15/13 | | 170 | 55,738 |
| Series 3912, 2.90%, 5/02/13 | | 60 | 19,507 |
| Series 4012, 2.99%, 12/04/12 | | 40 | 13,158 |
| Series 4212, 3.03%, 12/11/12 | | 20 | 6,574 |
| Series 4512, 2.90% – 3.16%, 5/23/13 | | 60 | 19,473 |
| Series 5112, 2.94%, 6/18/13 | | 20 | 6,474 |
| Series 5212, 2.89% – 3.03%, 6/20/13 | | 275 | 88,997 |
| Series 5712, 2.87%, 7/11/13 | | 120 | 38,767 |
| Series 5912, 2.87%, 7/25/13 | | 130 | 41,949 |
| Series 6512, 2.88%, 3/07/13 | | 5 | 1,632 |
| Series 6612, 2.87%, 8/06/13 | | 230 | 74,497 |
| Series 6812, 3.00% – 3.01%, 3/12/13 | | 65 | 21,208 |
| Series 6912, 2.87%, 3/14/13 | | 80 | 26,101 |
| Series 7012, 2.87%, 8/15/13 | | 290 | 93,424 |
| Series 7112, 2.87%, 8/27/13 | | 120 | 38,626 |
| Series 7512, 2.90%, 9/05/13 | | 30 | 9,649 |
| Series 7812, 2.90%, 9/17/13 | | 60 | 19,278 |
| Series 8112, 2.90%, 9/26/13 | | 70 | 22,474 |
| Series 8612, 2.90%, 10/10/13 | | 60 | 19,241 |
| Series 9012, 3.00% – 3.01%, 5/28/13 | | 25 | 8,105 |
| Series 9112, 2.90%, 10/31/13 | | 10 | 3,201 |
| Malaysia Treasury Bill, Series 364 (n): | | | |
| 2.89%, 1/25/13 | | 10 | 3,276 |
| 2.90%, 5/03/13 | | 10 | 3,251 |
| | | | 819,097 |
| | | | |
| | | |
| | | Par | |
| Short-Term Securities | | (000) | Value |
| |
| Foreign Agency Obligations (concluded) | | | |
| Republic Of Korea — 0.6% | | | |
| Korea Monetary Stabilization Bond, | | | |
| Series 1305 (n): | | | |
| 3.25%, 12/18/12 | KRW | 112,870 | $ | 104,097 |
| 3.38%, 5/09/13 | | 451,000 | 416,635 |
| 3.28%, 6/09/13 | | 541,610 | 500,208 |
| | | | 1,020,940 |
| Singapore — 0.3% | | | |
| Singapore Treasury Bill, Series 365, | | | |
| 0.23% —0.24%, 5/02/13 (n) | SGD | 760 | 622,004 |
| Sweden — 0.2% | | | |
| Sweden Treasury Bill (n) | | | |
| 0.89%, 12/19/12 | SEK | 680 | 102,159 |
| 0.87%, 3/20/13 | | 1,640 | 245,785 |
| | | | 347,944 |
| Total Foreign Agency Obligations — 1.6% | | | 2,809,985 |
| |
| |
| Time Deposits — 4.5% | | | |
| |
| Europe — 0.0% | | | |
| Brown Brothers Harriman & Co., | | | |
| (0.03)%, 12/03/12 | EUR | 9 | 11,391 |
| Norway — 0.0% | | | |
| Brown Brothers Harriman & Co., | | | |
| 0.30%, 12/03/12 | NOK | 7 | 1,303 |
| Sweden — 0.0% | | | |
| Brown Brothers Harriman & Co., | | | |
| 0.30%, 12/03/12 | SEK | 46 | 6,872 |
| United States — 4.5% | | | |
| Brown Brothers Harriman & Co., | | | |
| 0.08%, 12/03/12 | USD | 7,836 | 7,835,662 |
| Total Time Deposits — 4.5% | | | 7,855,228 |
| Total Short-Term Securities | | | |
| (Cost — $10,559,169) — 6.1% | | | 10,665,213 |
| Total Investments (Cost — $197,062,931) — 118.7% | | 205,608,823 |
| Liabilities in Excess of Other Assets — (18.7)% | | (32,415,207) |
| Net Assets — 100.0% | | | $ | 173,193,616 |
| | | | | |
| (a) | | Variable rate security. Rate shown is as of report date. |
| (b) | | Security exempt from registration pursuant to Rule 144A under the Securities Act of 1933, as amended. These securities may be resold in transactions exempt from registration to qualified institutional investors. |
| (c) | | Non-income producing security. |
| (d) | | Issuer filed for bankruptcy and/or is in default of principal and/or interest payments. |
| (e) | | Amount is less than $500. |
| (f) | | Security trades in units with each unit equal to a par amount of BRL 1,000. |
| (g) | | Security trades in units with each unit equal to a par amount of MXN 100. |
| (h) | | Security trades in units with each unit equal to a par amount of PEN 1,000. |
| (i) | | Represents a zero-coupon bond. Rate shown reflects the current yield as of report date. |
| (j) | | Other interests represent beneficial interests in liquidation trusts and other reorganization or private entities. |
| (k) | | Security is perpetual in nature and has no stated maturity date. |
See Notes to Financial Statements.
| 30 | FDP SERIES, INC. | NOVEMBER 30, 2012 |
| |
| Schedule of Investments (continued) | Franklin Templeton Total Return FDP Fund |
| (l) | | Represents or includes a TBA transaction. Unsettled TBA transactions as of November 30, 2012 were as follows: |
| Counterparty | | Value | | Unrealized
Appreciation
(Depreciation) |
| Banc of America Securities | | $ | 3,287,938 | | | $ | 4,844 | |
| Barclays Capital Corp. | | $ | 10,588,195 | | | $ | 53,109 | |
| Credit Suisse Securities (USA) LLC | | $ | 10,112,845 | | | $ | (62,686 | ) |
| Nomura Securities International, Inc. Ltd. | | $ | 3,316,031 | | | $ | 9,203 | |
| RBS Greenwich Capital | | $ | 6,303,211 | | | $ | (9,273 | ) |
| (m) | | Warrants entitle the Fund to purchase a predetermined number of shares of common stock and are non-income producing. The purchase price and number of shares are subject to adjustment under certain conditions until the expiration date of the warrants, if any. |
| (n) | | Rates shown are discount rates or a range of discount rates paid at the time of purchase. |
| • | | For Fund compliance purposes, the Fund’s industry classifications refer to any one or more of the industry sub-classifications used by one or more widely recognized market indexes or rating group indexes, and/or as defined by Fund management. These definitions may not apply for purposes of this report, which may combine such industry sub-classifications for reporting ease. |
| • | | Financial futures contracts purchased as of November 30, 2012 were as follows: |
| Contracts | Issue | Exchange | Expiration | Notional
Value | Unrealized
Appreciation |
| 13 | 2-Year US | Chicago | March | USD $2,865,891 | $983 |
| | Treasury Note | Board of Trade | 2013 | | |
| • | | Foreign currency exchange contracts as of November 30, 2012 were as follows: |
Currency
Purchased | | Currency Sold | | Counterparty | | Settlement
Date | | Unrealized
Appreciation
(Depreciation) |
| INR | | | 1,425,000 | | | | USD | | | | 25,152 | | | Deutsche | | 12/04/12 | | $ | 1,046 | |
| | | | | | | | | | | | | | | Bank AG | | | | | | |
| INR | | | 1,646,000 | | | | USD | | | | 29,055 | | | HSBC | | 12/04/12 | | | 1,205 | |
| | | | | | | | | | | | | | | Holdings Plc | | | | | | |
| USD | | | 26,134 | | | | INR | | | | 1,425,000 | | | Deutsche | | 12/04/12 | | | (63 | ) |
| | | | | | | | | | | | | | | Bank AG | | | | | | |
| USD | | | 30,187 | | | | INR | | | | 1,646,000 | | | HSBC | | 12/04/12 | | | (73 | ) |
| | | | | | | | | | | | | | | Holdings Plc | | | | | | |
| USD | | | 14,010 | | | | MYR | | | | 42,613 | | | Brown Brothers | | 12/04/12 | | | (9 | ) |
| | | | | | | | | | | | | | | Harriman & Co. | | | | | | |
| INR | | | 1,050,000 | | | | USD | | | | 18,492 | | | Deutsche | | 12/07/12 | | | 800 | |
| | | | | | | | | | | | | | | Bank AG | | | | | | |
| INR | | | 280,000 | | | | USD | | | | 4,922 | | | HSBC | | 12/10/12 | | | 219 | |
| | | | | | | | | | | | | | | Holdings Plc | | | | | | |
| INR | | | 284,000 | | | | USD | | | | 5,033 | | | Deutsche | | 12/11/12 | | | 181 | |
| | | | | | | | | | | | | | | Bank AG | | | | | | |
| INR | | | 710,000 | | | | USD | | | | 12,588 | | | HSBC | | 12/13/12 | | | 442 | |
| | | | | | | | | | | | | | | Holdings Plc | | | | | | |
| INR | | | 711,000 | | | | USD | | | | 12,814 | | | Deutsche | | 12/18/12 | | | 223 | |
| | | | | | | | | | | | | | | Bank AG | | | | | | |
| INR | | | 648,000 | | | | USD | | | | 11,857 | | | Deutsche | | 12/20/12 | | | 20 | |
| | | | | | | | | | | | | | | Bank AG | | | | | | |
| INR | | | 19,595,750 | | | | USD | | | | 374,690 | | | Deutsche | | 1/09/13 | | | (16,846 | ) |
| | | | | | | | | | | | | | | Bank AG | | | | | | |
| USD | | | 20,642 | | | | DKK | | | | 120,000 | | | Deutsche | | 1/15/13 | | | (297 | ) |
| | | | | | | | | | | | | | | Bank AG | | | | | | |
| USD | | | 10,438 | | | | DKK | | | | 60,000 | | | Deutsche | | 1/15/13 | | | (32 | ) |
| | | | | | | | | | | | | | | Bank AG | | | | | | |
| USD | | | 200,000 | | | | EUR | | | | 151,837 | | | Deutsche | | 1/30/13 | | | 2,413 | |
| | | | | | | | | | | | | | | Bank AG | | | | | | |
| CLP | | | 182,965,000 | | | | USD | | | | 365,200 | | | Morgan Stanley | | 1/31/13 | | | 12,389 | |
| CLP | | | 136,164,600 | | | | USD | | | | 269,499 | | | Morgan Stanley | | 2/01/13 | | | 11,472 | |
| IDR | | | 11,679,000,000 | | | | USD | | | | 1,267,115 | | | JPMorgan | | 2/06/13 | | | (58,949 | ) |
| | | | | | | | | | | | | | | Chase & Co. | | | | | | |
| CLP | | | 88,700,000 | | | | USD | | | | 178,939 | | | Barclays Plc | | 2/13/13 | | | 3,799 | |
Foreign currency exchange contracts as of November 30, 2012 were as follows (continued):
Currency
Purchased | | Currency Sold | | Counterparty | | Settlement
Date | | Unrealized
Appreciation
(Depreciation) |
| INR | | | | 1,425,000 | | | | USD | | | | 25,752 | | | Deutsche | | 3/04/13 | | $ | 36 | |
| | | | | | | | | | | | | | | | Bank AG | | | | | | |
| INR | | | | 1,425,000 | | | | | | | | | | | | | | | | | |
| INR | | | | 1,646,000 | | | | USD | | | | 29,751 | | | HSBC | | 3/04/13 | | | 36 | |
| | | | | | | | | | | | | | | | Holdings Plc | | | | | | |
| SGD | | | | 152,100 | | | | USD | | | | 120,114 | | | Deutsche | | 3/19/13 | | | 4,500 | |
| | | | | | | | | | | | | | | | Bank AG | | | | | | |
| SGD | | | | 174,000 | | | | USD | | | | 137,691 | | | HSBC | | 3/19/13 | | | 4,865 | |
| | | | | | | | | | | | | | | | Holdings Plc | | | | | | |
| SGD | | | | 110,000 | | | | USD | | | | 90,105 | | | JPMorgan | | 3/19/13 | | | 17 | |
| | | | | | | | | | | | | | | | Chase & Co. | | | | | | |
| CLP | | | | 42,351,250 | | | | USD | | | | 84,872 | | | JPMorgan | | 3/21/13 | | | 1,961 | |
| | | | | | | | | | | | | | | | Chase & Co. | | | | | | |
| SGD | | | | 163,700 | | | | USD | | | | 130,521 | | | Deutsche | | 3/21/13 | | | 3,596 | |
| | | | | | | | | | | | | | | | Bank AG | | | | | | |
| SGD | | | | 131,000 | | | | USD | | | | 104,432 | | | HSBC | | 3/21/13 | | | 2,894 | |
| | | | | | | | | | | | | | | | Holdings Plc | | | | | | |
| USD | | | | 85,489 | | | | CLP | | | | 42,351,250 | | | JPMorgan | | 3/21/13 | | | (1,344 | ) |
| | | | | | | | | | | | | | | | Chase & Co. | | | | | | |
| USD | | | | 586,165 | | | | EUR | | | | 470,438 | | | Deutsche | | 3/22/13 | | | (26,340 | ) |
| | | | | | | | | | | | | | | | Bank AG | | | | | | |
| CLP | | | | 34,940,000 | | | | USD | | | | 68,881 | | | Morgan Stanley | | 4/15/13 | | | 2,524 | |
| INR | | | | 1,508,000 | | | | USD | | | | 27,659 | | | JPMorgan | | 4/16/13 | | | (558 | ) |
| | | | | | | | | | | | | | | | Chase & Co. | | | | | | |
| INR | | | | 1,481,000 | | | | USD | | | | 27,071 | | | JPMorgan | | 4/18/13 | | | (464 | ) |
| | | | | | | | | | | | | | | | Chase & Co. | | | | | | |
| CLP | | | | 31,310,000 | | | | USD | | | | 61,780 | | | Morgan Stanley | | 4/19/13 | | | 2,174 | |
| INR | | | | 740,000 | | | | USD | | | | 13,559 | | | JPMorgan | | 4/22/13 | | | (273 | ) |
| | | | | | | | | | | | | | | | Chase & Co. | | | | | | |
| USD | | | | 61,527 | | | | EUR | | | | 47,248 | | | Barclays Plc | | 4/25/13 | | | (12 | ) |
| CLP | | | | 50,230,000 | | | | USD | | | | 99,465 | | | Citigroup, Inc. | | 4/29/13 | | | 3,001 | |
| CLP | | | | 31,162,000 | | | | USD | | | | 61,536 | | | JPMorgan | | 4/29/13 | | | 2,032 | |
| | | | | | | | | | | | | | | | Chase & Co. | | | | | | |
| INR | | | | 894,000 | | | | USD | | | | 16,040 | | | JPMorgan | | 4/29/13 | | | (8 | ) |
| | | | | | | | | | | | | | | | Chase & Co. | | | | | | |
| USD | | | | 100,945 | | | | CLP | | | | 50,230,000 | | | Citigroup, Inc. | | 4/29/13 | | | (1,522 | ) |
| USD | | | | 12,058 | | | | CLP | | | | 6,000,000 | | | JPMorgan | | 4/29/13 | | | (182 | ) |
| | | | | | | | | | | | | | | | Chase & Co. | | | | | | |
| INR | | | | 745,000 | | | | USD | | | | 13,340 | | | JPMorgan | | 4/30/13 | | | 18 | |
| | | | | | | | | | | | | | | | Chase & Co. | | | | | | |
| INR | | | | 13,116,700 | | | | USD | | | | 233,474 | | | JPMorgan | | 5/06/13 | | | 1,487 | |
| | | | | | | | | | | | | | | | Chase & Co. | | | | | | |
| SGD | | | | 823,234 | | | | USD | | | | 650,963 | | | Morgan Stanley | | 5/17/13 | | | 23,520 | |
| USD | | | | 266,161 | | | | EUR | | | | 207,000 | | | Deutsche | | 5/17/13 | | | (3,513 | ) |
| | | | | | | | | | | | | | | | Bank AG | | | | | | |
| USD | | | | 175,540 | | | | EUR | | | | 138,600 | | | Deutsche | | 7/05/13 | | | (5,124 | ) |
| | | | | | | | | | | | | | | | Bank AG | | | | | | |
| USD | | | | 118,111 | | | | EUR | | | | 95,745 | | | Deutsche | | 7/23/13 | | | (6,717 | ) |
| | | | | | | | | | | | | | | | Bank AG | | | | | | |
| USD | | | | 500,423 | | | | EUR | | | | 385,000 | | | Barclays Plc | | 7/26/13 | | | (1,542 | ) |
| USD | | | | 24,624 | | | | EUR | | | | 18,969 | | | Citigroup, Inc. | | 7/26/13 | | | (108 | ) |
| USD | | | | 304,675 | | | | EUR | | | | 250,000 | | | Deutsche | | 7/29/13 | | | (21,288 | ) |
| | | | | | | | | | | | | | | | Bank AG | | | | | | |
| USD | | | | 133,935 | | | | EUR | | | | 108,890 | | | Barclays Plc | | 8/01/13 | | | (8,047 | ) |
| USD | | | | 45,929 | | | | EUR | | | | 36,797 | | | Citigroup, Inc. | | 8/08/13 | | | (2,054 | ) |
| USD | | | | 12,994 | | | | EUR | | | | 10,398 | | | Citigroup, Inc. | | 8/09/13 | | | (565 | ) |
| USD | | | | 64,834 | | | | EUR | | | | 51,776 | | | Barclays Plc | | 8/23/13 | | | (2,694 | ) |
| USD | | | | 38,307 | | | | EUR | | | | 30,592 | | | Barclays Plc | | 8/23/13 | | | (1,592 | ) |
| USD | | | | 42,003 | | | | EUR | | | | 33,526 | | | Barclays Plc | | 8/26/13 | | | (1,724 | ) |
| USD | | | | 3,820,839 | | | | EUR | | | | 3,040,000 | | | Deutsche | | 8/28/13 | | | (144,248 | ) |
| | | | | | | | | | | | | | | | Bank AG | | | | | | |
| USD | | | | 38,594 | | | | EUR | | | | 30,707 | | | Deutsche | | 8/28/13 | | | (1,457 | ) |
| | | | | | | | | | | | | | | | Bank AG | | | | | | |
See Notes to Financial Statements.
| FDP SERIES, INC. | NOVEMBER 30, 2012 | 31 |
| |
| Schedule of Investments (continued) | Franklin Templeton Total Return FDP Fund |
Foreign currency exchange contracts as of November 30, 2012 were as follows (concluded):
Currency
Purchased | | Currency Sold | | Counterparty | | Settlement
Date | | Unrealized
Depreciation |
| USD | | | | 1,120 | | | | EUR | | | | 891 | | | Deutsche | | 8/28/13 | | $ | (42 | ) |
| | | | | | | | | | | | | | | | Bank AG | | | | | | |
| PHP | | | | 52,545,000 | | | | USD | | | | 1,238,101 | | | JPMorgan | | 9/04/13 | | | 42,282 | |
| | | | | | | | | | | | | | | | Chase & Co. | | | | | | |
| USD | | | | 39,939 | | | | EUR | | | | 31,549 | | | Barclays Plc | | 9/10/13 | | | (1,216 | ) |
| USD | | | | 39,451 | | | | EUR | | | | 30,733 | | | Barclays Plc | | 9/12/13 | | | (641 | ) |
| USD | | | | 114,249 | | | | EUR | | | | 88,247 | | | Barclays Plc | | 9/16/13 | | | (879 | ) |
| USD | | | | 107,327 | | | | EUR | | | | 82,955 | | | UBS AG | | 9/17/13 | | | (898 | ) |
| SGD | | | | 108,000 | | | | USD | | | | 88,293 | | | JPMorgan | | 9/19/13 | | | 214 | |
| | | | | | | | | | | | | | | | Chase & Co. | | | | | | |
| USD | | | | 26,840 | | | | EUR | | | | 20,375 | | | Barclays Plc | | 9/19/13 | | | 258 | |
| USD | | | | 65,410 | | | | EUR | | | | 50,324 | | | Barclays Plc | | 9/24/13 | | | (250 | ) |
| USD | | | | 33,691 | | | | GBP | | | | 21,500 | | | Deutsche | | 10/01/13 | | | (720 | ) |
| | | | | | | | | | | | | | | | Bank AG | | | | | | |
| USD | | | | 8,590 | | | | EUR | | | | 6,585 | | | Barclays Plc | | 10/25/13 | | | (5 | ) |
| USD | | | | 19,971 | | | | EUR | | | | 15,341 | | | Barclays Plc | | 11/05/13 | | | (56 | ) |
| USD | | | | 1,101,245 | | | | EUR | | | | 857,000 | | | Deutsche | | 11/08/13 | | | (17,553 | ) |
| | | | | | | | | | | | | | | | Bank AG | | | | | | |
| USD | | | | 5,227 | | | | EUR | | | | 4,082 | | | JPMorgan | | 11/12/13 | | | (102 | ) |
| | | | | | | | | | | | | | | | Chase & Co. | | | | | | |
| USD | | | | 126,341 | | | | EUR | | | | 98,696 | | | UBS AG | | 11/20/13 | | | (2,525 | ) |
| USD | | | | 20,768 | | | | DKK | | | | 120,000 | | | Deutsche | | 1/15/14 | | | (300 | ) |
| | | | | | | | | | | | | | | | Bank AG | | | | | | |
| USD | | | | 10,494 | | | | DKK | | | | 60,000 | | | Deutsche | | 1/15/14 | | | (40 | ) |
| | | | | | | | | | | | | | | | Bank AG | | | | | | |
| USD | | | | 421,450 | | | | EUR | | | | 326,250 | | | Deutsche | | 2/06/14 | | | (4,952 | ) |
| | | | | | | | | | | | | | | | Bank AG | | | | | | |
| USD | | | | 657,119 | | | | GBP | | | | 421,500 | | | Deutsche | | 10/01/14 | | | (16,448 | ) |
| | | | | | | | | | | | | | | | Bank AG | | | | | | |
| USD | | | | 20,855 | | | | DKK | | | | 120,000 | | | Deutsche | | 1/15/15 | | | (332 | ) |
| | | | | | | | | | | | | | | | Bank AG | | | | | | |
| USD | | | | 10,530 | | | | DKK | | | | 60,000 | | | Deutsche | | 1/15/15 | | | (63 | ) |
| | | | | | | | | | | | | | | | Bank AG | | | | | | |
| USD | | | | 144,949 | | | | EUR | | | | 112,766 | | | Deutsche | | 6/22/15 | | | (3,273 | ) |
| | | | | | | | | | | | | | | | Bank AG | | | | | | |
| USD | | | | 542,986 | | | | DKK | | | | 3,120,000 | | | Deutsche | | 1/15/16 | | | (9,878 | ) |
| | | | | | | | | | | | | | | | Bank AG | | | | | | |
| USD | | | | 537,880 | | | | DKK | | | | 3,060,000 | | | Deutsche | | 1/15/16 | | | (4,352 | ) |
| | | | | | | | | | | | | | | | Bank AG | | | | | | |
| Total | | | | | | | | | | | | | | | | | | | $ | (242,546 | ) |
| • | | Credit default swaps on single name issues — buy protection outstanding as of November 30, 2012 were as follows: |
| Issuer | Pay
Fixed
Rate | Counterparty | Expiration
Date | Notional
Amount
(000) | Unrealized
Appreciation
(Depreciation) |
| HCA, Inc. | 5.00% | Goldman | 9/20/13 | USD | 1,500 | $ | 203 |
| | | Sachs Group, | | | | |
| | | Inc. | | | | |
| Windstream | 5.00% | Goldman | 9/20/13 | USD | 1,500 | 3,778 |
| Corp. | | Sachs Group, | | | | |
| | | Inc. | | | | |
| ENI SpA | 1.00% | Citigroup, Inc. | 9/20/17 | USD | 150 | (8,651) |
| ENI SpA | 1.00% | Morgan | 9/20/17 | USD | 150 | (8,652) |
| | | Stanley | | | | |
| Merrill Lynch | 1.00% | Credit Suisse | 9/20/17 | USD | 700 | (2,428) |
| & Co., Inc. | | Group AG | | | | |
| Owens- | 5.00% | Goldman | 12/20/17 | USD | 150 | (911) |
| Illinois, | | Sachs Group, | | | | |
| Inc. | | Inc. | | | | |
| Total | | | | | | $ | (16,661) |
| • | | Credit default swaps on single name issues — sold protection outstanding as of November 30, 2012 were as follows: |
Issuer/
Index | Receive
Fixed
Rate | Counterparty | Expiration
Date | Issuer
Credit
Rating1 | Notional
Amount
(000)2 | Unrealized
Appreciation
(Depreciation) |
| PSE&G | 1.00% | Credit Suisse | 6/20/17 | BBB | USD | 300 | $ | 3,845 |
| Power | | Group AG | | | | | |
| Republic of | 1.00% | Deutsche | 6/20/17 | BB+ | USD | 2,200 | 48,791 |
| Indonesia | | Bank AG | | | | | |
| Bank of | 1.00% | Credit Suisse | 9/20/17 | A- | USD | 700 | 1,985 |
| America | | Group AG | | | | | |
| Corp. | | | | | | | |
| Berkshire | 1.00% | Deutsche | 9/20/17 | AA+ | USD | 350 | (2,601) |
| Hathaway, | | Bank AG | | | | | |
| Inc. | | | | | | | |
| Hewlett- | 1.00% | Deutsche | 9/20/17 | BBB+ | USD | 500 | (15,723) |
| Packard | | Bank AG | | | | | |
| Co. | | | | | | | |
| Hewlett- | 1.00% | Credit Suisse | 6/20/21 | BBB+ | USD | 500 | (31,534) |
| Packard | | Group AG | | | | | |
| Co. | | | | | | | |
| Total | | | | | | | $ | 4,763 |
| 2 | | The maximum potential amount the Fund may pay should a negative credit event take place as defined under the terms of the agreement. |
| • | | Credit default swaps on traded indexes — sold protection outstanding as of November 30, 2012 were as follows: |
| Index | Receive
Fixed
Rate | Counterparty | Expiration
Date | Credit
Rating3 | Notional
Amount
(000)4 | Unrealized
Appreciation |
| Markit MCDX | 1.00% | Citigroup, Inc. | 12/20/17 | AA | USD | 2,150 | $ | 839 |
| North | | | | | | | |
| American | | | | | | | |
| Index | | | | | | | |
| Series 19 | | | | | | | |
| Markit CMBX | 1.09% | Citigroup, Inc. | 3/15/49 | BB- | USD | 490 | 14,292 |
| North | | | | | | | |
| America | | | | | | | |
| AM Index | | | | | | | |
| Series 2 | | | | | | | |
| Total | | | | | | | $ | 15,131 |
| 3 | | Using S&P’s rating of the underlying securities. |
| 4 | | The maximum potential amount the Fund may pay should a negative credit event take place as defined under the terms of the agreement. |
See Notes to Financial Statements.
| 32 | FDP SERIES, INC. | NOVEMBER 30, 2012 |
| |
| Schedule of Investments (concluded) | Franklin Templeton Total Return FDP Fund |
| • | | Fair Value Measurements — Various inputs are used in determining the fair value of investments and derivative financial instruments. These inputs to valuation techniques are categorized into a disclosure hierarchy consisting of three broad levels for financial statement purposes as follows: |
| • | | Level 1 — unadjusted price quotations in active markets/exchanges for identical assets and liabilities that the Fund has the ability to access |
| • | | Level 2 — other observable inputs (including, but not limited to, quoted prices for similar assets or liabilities in markets that are active, quoted prices for identical or similar assets or liabilities in markets that are not active, inputs other than quoted prices that are observable for the assets or liabilities (such as interest rates, yield curves, volatilities, prepayment speeds, loss severities, credit risks and default rates) or other market-corroborated inputs) |
| • | | Level 3 — unobservable inputs based on the best information available in the circumstances, to the extent observable inputs are not available (including the Fund’s own assumptions used in determining the fair value of investments and derivative financial instruments) |
The hierarchy gives the highest priority to unadjusted quoted prices in active markets for identical assets or liabilities (Level 1 measurements) and the lowest priority to unobservable inputs (Level 3 measurements). Accordingly, the degree of judgment exercised in determining fair value is greatest for instruments categorized in Level 3. The inputs used to measure fair value may fall into different levels of the fair value hierarchy. In such cases, for disclosure purposes, the level in the fair value hierarchy within which the fair value measurement falls in its entirety is determined based on the lowest level input that is significant to the fair value measurement in its entirety.
Changes in valuation techniques may result in transfers into or out of an assigned level within the disclosure hierarchy. In accordance with the Fund’s policy, transfers between different levels of the fair value disclosure hierarchy are deemed to have occurred as of the beginning of the reporting period. The categorization of a value determined for investments and derivative financial instruments is based on the pricing transparency of the investment and derivative financial instrument and is not necessarily an indication of the risks associated with investing in those securities. For information about the Fund’s policy regarding valuation of investments and derivative financial instruments and other significant accounting policies, please refer to Note 1 of the Notes to Financial Statements.
The following tables summarize the Fund’s investments and derivative financial instruments categorized in the disclosure hierarchy as of November 30, 2012:
| | | Level 1 | | Level 2 | | Level 3 | | Total |
| Assets: | | | | | | | | | | | | | | | | |
| Investments: | | | | | | | | | | | | | | | | |
| Long-Term Investments: | | | | | | | | | | | | | | | | |
| Asset-Backed | | | | | | | | | | | | | | | | |
| Securities | | | — | | | $ | 4,483,084 | | | | — | | | $ | 4,483,084 | |
| Common Stocks | | $ | 17,107 | | | | — | | | | — | | | | 17,107 | |
| Corporate Bonds | | | — | | | | 48,678,643 | | | | — | | | | 48,678,643 | |
| Floating Rate Loan | | | | | | | | | | | | | | | | |
| Interests | | | — | | | | 13,833,936 | | | $ | 16,980 | | | | 13,850,916 | |
| Foreign Agency | | | | | | | | | | | | | | | | |
| Obligations | | | — | | | | 20,365,858 | | | | — | | | | 20,365,858 | |
| Non-Agency Mortgage- | | | | | | | | | | | | | | | | |
| Backed Securities | | | — | | | | 8,074,265 | | | | — | | | | 8,074,265 | |
| Other Interests | | | 3,237 | | | | — | | | | — | | | | 3,237 | |
| Preferred Securities | | | 760,524 | | | | 3,335,035 | | | | — | | | | 4,095,559 | |
| Taxable Municipal | | | | | | | | | | | | | | | | |
| Bonds | | | — | | | | 1,068,530 | | | | — | | | | 1,068,530 | |
| US Government | | | | | | | | | | | | | | | | |
| Sponsored Agency | | | | | | | | | | | | | | | | |
| Securities | | | — | | | | 48,680,424 | | | | — | | | | 48,680,424 | |
| US Treasury | | | | | | | | | | | | | | | | |
| Obligations | | | — | | | | 45,609,613 | | | | — | | | | 45,609,613 | |
| Warrants | | | 16,374 | | | | — | | | | — | | | | 16,374 | |
| Short-Term Securities: | | | | | | | | | | | | | | | | |
| Foreign Agency | | | | | | | | | | | | | | | | |
| Obligations | | | — | | | | 2,809,985 | | | | — | | | | 2,809,985 | |
| Time Deposits | | | — | | | | 7,855,228 | | | | — | | | | 7,855,228 | |
| Total | | $ | 797,242 | | | $ | 204,794,601 | | | $ | 16,980 | | | $ | 205,608,823 | |
| | | Level 1 | | Level 2 | | Level 3 | | Total |
| Derivative Financial Instruments1 | | | | | | | | | | | | | | | | |
| Assets: | | | | | | | | | | | | | | | | |
| Credit contracts | | | — | | | $ | 73,733 | | | | $— | | | $ | 73,733 | |
| Foreign currency exchange | | | | | | | | | | | | | | | | |
| contracts | | | — | | | | 129,624 | | | | — | | | | 129,624 | |
| Interest rate contracts | | $ | 983 | | | | — | | | | — | | | | 983 | |
| Liabilities: | | | | | | | | | | | | | | | | |
| Credit contracts | | | — | | | | (70,500 | ) | | | — | | | | (70,500 | ) |
| Foreign currency exchange | | | | | | | | | | | | | | | | |
| contracts | | | — | | | | (372,170 | ) | | | — | | | | (372,170 | ) |
| Total | | $ | 983 | | | $ | (239,313 | ) | | | — | | | $ | (238,330 | ) |
| 1 | | Derivative financial instruments are swaps, financial futures contracts and foreign currency exchange contracts. Swaps, financial futures contracts and foreign currency exchange contracts are valued at the unrealized appreciation/ depreciation on the instrument. |
Certain of the Fund’s assets are held at carrying amount, which approximates fair value for financial statement purposes. As of November 30, 2012, such assets are categorized within the disclosure hierarchy as follows:
| | | Level 1 | | Level 2 | | Level 3 | | Total |
| Assets: | | | | | | | | | | | | | | | | |
| Foreign currency at value | | $ | 717,495 | | | | — | | | | — | | | $ | 717,495 | |
| Cash pledged as collateral | | | | | | | | | | | | | | | | |
| for swaps | | | 390,000 | | | | — | | | | — | | | | 390,000 | |
| Total | | $ | 1,107,495 | | | | — | | | | — | | | $ | 1,107,495 | |
There were no transfers between levels during the six months ended November 30, 2012.
Certain of the Fund’s investments are categorized as Level 3 and were valued utilizing transaction prices from recent transactions or third party pricing information without adjustment. Such valuations are based on unobservable inputs. A significant change in the unobservable inputs could result in a significantly lower or higher value in such Level 3 investments.
See Notes to Financial Statements.
| FDP SERIES, INC. | NOVEMBER 30, 2012 | 33 |
Statements of Assets and Liabilities
| November 30, 2012 (Unaudited) | MFS
Research
International
FDP Fund | Marsico
Growth
FDP Fund | Invesco
Value
FDP Fund | Franklin
Templeton
Total Return
FDP Fund |
| |
| Assets | | | | | | | | | | | |
| Investments at value — unaffiliated1 | $ | 127,007,815 | | $ | 107,450,450 | | $ | 103,342,191 | | $ | 205,608,823 |
| Investments at value — affiliated2 | | — | | | — | | | 28,070 | | | — |
| Investments sold receivable | | 231,564 | | | 541,888 | | | 284,787 | | | 2,207,556 |
| Interest receivable | | — | | | — | | | — | | | 1,533,759 |
| Capital shares sold receivable | | 200,162 | | | 206,678 | | | 187,351 | | | 540,633 |
| Dividends receivable | | 461,855 | | | 244,659 | | | 418,166 | | | — |
| Foreign currency at value3 | | 1,313 | | | — | | | 173 | | | 717,495 |
| Cash pledged as collateral for swaps | | — | | | — | | | — | | | 390,000 |
| Unrealized appreciation on foreign currency exchange contracts | | 111 | | | — | | | 2,222 | | | 129,624 |
| Unrealized appreciation on swaps | | — | | | — | | | — | | | 73,733 |
| Swap premiums paid | | — | | | — | | | — | | | 35,725 |
| Swaps receivable | | — | | | — | | | — | | | 19,489 |
| Variation margin receivable | | — | | | — | | | — | | | 3,331 |
| Principal paydowns receivable | | — | | | — | | | — | | | 2,824 |
| Prepaid expenses | | 2,075 | | | 1,848 | | | 1,748 | | | 2,443 |
| Total assets | | 127,904,895 | | | 108,445,523 | | | 104,264,708 | | | 211,265,435 |
| |
| Liabilities | | | | | | | | | | | |
| Investments purchased payable | | 86,440 | | | 2,177,811 | | | 77,969 | | | 36,216,266 |
| Capital shares redeemed payable | | 289,770 | | | 224,377 | | | 250,517 | | | 348,727 |
| Swap premiums received | | — | | | — | | | — | | | 484,986 |
| Unrealized depreciation on foreign currency exchange contracts | | 87 | | | — | | | 39,627 | | | 372,170 |
| Income dividends payable | | — | | | — | | | — | | | 318,657 |
| Service and distribution fees payable | | 76,206 | | | 62,953 | | | 62,788 | | | 85,633 |
| Investment advisory fees payable | | 92,246 | | | 63,821 | | | 59,086 | | | 56,745 |
| Unrealized depreciation on swaps | | — | | | — | | | — | | | 70,500 |
| Swaps payable | | — | | | — | | | — | | | 34,431 |
| Other affiliates payable | | 1,062 | | | 839 | | | 834 | | | 1,364 |
| Other accrued expenses payable | | 80,829 | | | 37,080 | | | 24,306 | | | 82,340 |
| Total liabilities | | 626,640 | | | 2,566,881 | | | 515,127 | | | 38,071,819 |
| Net Assets | $ | 127,278,255 | | $ | 105,878,642 | | $ | 103,749,581 | | $ | 173,193,616 |
| |
| |
| Net Assets Consist of | | | | | | | | | | | |
| Paid-in capital | $ | 152,342,059 | | $ | 97,163,617 | | $ | 116,483,187 | | $ | 163,029,588 |
| Undistributed (accumulated) net investment income (loss) | | 94,940 | | | (284,829 | ) | | 394,169 | | | 1,737,156 |
| Accumulated net realized gain (loss) | | (43,425,583 | ) | | (10,139,144 | ) | | (27,882,557 | ) | | 91,757 |
| Net unrealized appreciation/depreciation | | 18,266,839 | | | 19,138,998 | | | 14,754,782 | | | 8,335,115 |
| Net Assets | $ | 127,278,255 | | $ | 105,878,642 | | $ | 103,749,581 | | $ | 173,193,616 |
| 1 Investments at cost — unaffiliated | $ | 108,727,136 | | $ | 88,311,452 | | $ | 88,550,681 | | $ | 197,062,931 |
| 2 Investments at cost — affiliated | | — | | | — | | $ | 27,393 | | | — |
| 3 Foreign currency at cost | $ | 1,458 | | | — | | $ | 173 | | $ | 693,315 |
See Notes to Financial Statements.
| 34 | FDP SERIES, INC. | NOVEMBER 30, 2012 |
Statements of Assets and Liabilities (concluded)
| November 30, 2012 (Unaudited) | MFS
Research
International
FDP Fund | Marsico
Growth
FDP Fund | Invesco
Value
FDP Fund | Franklin
Templeton
Total Return
FDP Fund |
| Net Asset Value | | | | | | | | |
| Institutional: | | | | | | | | |
| Net assets | $ | 4,318,482 | $ | 3,921,651 | $ | 3,550,756 | $ | 5,114,555 |
| Shares outstanding, 100 million shares authorized, $0.10 par value | | 401,660 | | 300,817 | | 320,423 | | 466,680 |
| Net asset value | $ | 10.75 | $ | 13.04 | $ | 11.08 | $ | 10.96 |
| Investor A: | | | | | | | | |
| Net assets | $ | 37,276,389 | $ | 31,321,733 | $ | 30,440,806 | $ | 54,306,467 |
| Shares outstanding, 100 million shares authorized, $0.10 par value | | 3,481,070 | | 2,445,227 | | 2,769,185 | | 4,953,366 |
| Net asset value | $ | 10.71 | $ | 12.81 | $ | 10.99 | $ | 10.96 |
| Investor B: | | | | | | | | |
| Net assets | $ | 1,245,915 | $ | 1,070,134 | $ | 1,085,621 | $ | 1,698,067 |
| Shares outstanding, 100 million shares authorized, $0.10 par value | | 116,015 | | 88,528 | | 99,399 | | 154,871 |
| Net asset value | $ | 10.74 | $ | 12.09 | $ | 10.92 | $ | 10.96 |
| Investor C: | | | | | | | | |
| Net assets | $ | 84,437,469 | $ | 69,565,124 | $ | 68,672,398 | $ | 112,074,527 |
| Shares outstanding, 100 million shares authorized, $0.10 par value | | 7,947,294 | | 5,743,807 | | 6,329,111 | | 10,222,565 |
| Net asset value | $ | 10.62 | $ | 12.11 | $ | 10.85 | $ | 10.96 |
See Notes to Financial Statements.
| FDP SERIES, INC. | NOVEMBER 30, 2012 | 35 |
Statements of Operations
| Six Months Ended November 30, 2012 (Unaudited) | MFS
Research
International
FDP Fund | Marsico
Growth
FDP Fund | Invesco
Value
FDP Fund | Franklin
Templeton
Total Return
FDP Fund |
| Investment Income | | | | | | | | | | | | |
| Dividends — unaffiliated | $ | 1,444,018 | | $ | 988,280 | | $ | 1,330,331 | | $ | 17,500 | |
| Foreign taxes withheld | | (88,346 | ) | | (24,767 | ) | | (5,680 | ) | | (5,477 | ) |
| Interest | | 59 | | | — | | | — | | | 3,049,316 | |
| Dividends — affiliated | | — | | | — | | | 400 | | | — | |
| Total income | | 1,355,731 | | | 963,513 | | | 1,325,051 | | | 3,061,339 | |
| |
| Expenses | | | | | | | | | | | | |
| Investment advisory | | 555,714 | | | 424,022 | | | 361,950 | | | 340,787 | |
| Service — Investor A | | 43,659 | | | 37,446 | | | 36,660 | | | 64,293 | |
| Service and distribution — Investor B | | 6,429 | | | 5,804 | | | 5,724 | | | 6,768 | |
| Service and distribution — Investor C | | 416,009 | | | 355,208 | | | 347,430 | | | 449,096 | |
| Transfer agent — Institutional | | 2,301 | | | 2,164 | | | 2,006 | | | 2,501 | |
| Transfer agent — Investor A | | 17,751 | | | 15,624 | | | 15,169 | | | 23,605 | |
| Transfer agent — Investor B | | 1,085 | | | 1,006 | | | 1,007 | | | 1,376 | |
| Transfer agent — Investor C | | 51,841 | | | 45,635 | | | 44,039 | | | 64,037 | |
| Professional | | 70,111 | | | 57,524 | | | 60,027 | | | 73,279 | |
| Accounting services | | 21,843 | | | 16,365 | | | 15,909 | | | 34,441 | |
| Custodian | | 35,944 | | | 7,780 | | | 6,311 | | | 24,139 | |
| Printing | | 12,855 | | | 11,123 | | | 10,054 | | | 14,258 | |
| Registration | | 7,940 | | | 6,219 | | | 4,902 | | | 5,666 | |
| Officer and Directors | | 4,382 | | | 4,019 | | | 3,750 | | | 4,199 | |
| Miscellaneous | | 12,982 | | | 16,614 | | | 15,937 | | | 22,167 | |
| Total expenses | | 1,260,846 | | | 1,006,553 | | | 930,875 | | | 1,130,612 | |
| Less fees waived by Manager | | — | | | (26,501 | ) | | — | | | — | |
| Total expenses after fees waived | | 1,260,846 | | | 980,052 | | | 930,875 | | | 1,130,612 | |
| Net investment income (loss) | | 94,885 | | | (16,539 | ) | | 394,176 | | | 1,930,727 | |
| |
| Realized and Unrealized Gain (Loss) | | | | | | | | | | | | |
| Net realized gain (loss) from: | | | | | | | | | | | | |
| Investments | | 1,300,437 | | | 7,324,964 | | | 3,934,428 | | | 2,124,640 | |
| Financial futures contracts | | — | | | — | | | — | | | 1,487 | |
| Foreign currency transactions | | 7,261 | | | (9 | ) | | (178,194 | ) | | 946,383 | |
| Swaps | | — | | | — | | | — | | | 94,433 | |
| | | 1,307,698 | | | 7,324,955 | | | 3,756,234 | | | 3,166,943 | |
| Net change in unrealized appreciation/depreciation on: | | | | | | | | | | | | |
| Investments | | 15,990,393 | | | (4,360,352 | ) | | 6,965,257 | | | 4,050,189 | |
| Financial futures contracts | | — | | | — | | | — | | | (1,090 | ) |
| Foreign currency translations | | (10,384 | ) | | — | | | (37,405 | ) | | (1,062,449 | ) |
| Swaps | | — | | | — | | | — | | | 91,126 | |
| Unfunded loan commitments | | — | | | — | | | — | | | 361 | |
| | | 15,980,009 | | | (4,360,352 | ) | | 6,927,852 | | | 3,078,137 | |
| Total realized and unrealized gain | | 17,287,707 | | | 2,964,603 | | | 10,684,086 | | | 6,245,080 | |
| Net Increase in Net Assets Resulting from Operations | $ | 17,382,592 | | $ | 2,948,064 | | $ | 11,078,262 | | $ | 8,175,807 | |
See Notes to Financial Statements.
| 36 | FDP SERIES, INC. | NOVEMBER 30, 2012 |
Statements of Changes in Net Assets
| | MFS Research
International FDP Fund | | Marsico Growth FDP Fund |
| Increase (Decrease) in Net Assets: | Six Months
Ended
November 30,
2012
(Unaudited) | Year Ended
May 31,
2012 | | Six Months
Ended
November 30,
2012
(Unaudited) | Year Ended
May 31,
2012 |
| Operations |
| Net investment income | $ | 94,885 | | $ | 1,270,435 | | | $ | (16,539 | ) | $ | (575,792 | ) |
| Net realized gain (loss) | | 1,307,698 | | | (4,335,758 | ) | | | 7,324,955 | | | 8,614,942 | |
| Net change in unrealized appreciation/depreciation | | 15,980,009 | | | (25,663,612 | ) | | | (4,360,352 | ) | | (9,530,091 | ) |
| Net increase (decrease) in net assets resulting from operations | | 17,382,592 | | | (28,728,935 | ) | | | 2,948,064 | | | (1,490,941 | ) |
| |
| Dividends to Shareholders From1 |
| Net investment income: | | | | | | | | | | | | | |
| Institutional | | (71,397 | ) | | (56,085 | ) | | | — | | | — | |
| Investor A | | (538,219 | ) | | (368,774 | ) | | | — | | | — | |
| Investor B | | (6,966 | ) | | (4,361 | ) | | | — | | | — | |
| Investor C | | (604,433 | ) | | (468,314 | ) | | | — | | | — | |
| Decrease in net assets resulting from dividends to shareholders | | (1,221,015 | ) | | (897,534 | ) | | | — | | | — | |
| |
| Capital Share Transactions |
| Net increase (decrease) in net assets derived from capital share transactions | | (2,139,617 | ) | | 2,933,069 | | | | (2,470,359 | ) | | (10,447,112 | ) |
| |
| Net Assets |
| Total increase (decrease) in net assets | | 14,021,960 | | | (26,693,400 | ) | | | 477,705 | | | (11,938,053 | ) |
| Beginning of period | | 113,256,295 | | | 139,949,695 | | | | 105,400,937 | | | 117,338,990 | |
| End of period | $ | 127,278,255 | | $ | 113,256,295 | | | $ | 105,878,642 | | $ | 105,400,937 | |
| Undistributed (accumulated) net investment income (loss) | $ | 94,940 | | $ | 1,221,070 | | | $ | (284,829 | ) | $ | (268,290 | ) |
| 1 | | Dividends are determined in accordance with federal income tax regulations. |
See Notes to Financial Statements.
| FDP SERIES, INC. | NOVEMBER 30, 2012 | 37 |
Statements of Changes in Net Assets (concluded)
| | Invesco Value FDP Fund | | Franklin Templeton
Total Return FDP Fund |
| Increase (Decrease) in Net Assets: | Six Months
Ended
November 30,
2012
(Unaudited) | Year Ended
May 31,
2012 | | Six Months
Ended
November 30,
2012
(Unaudited) | Year Ended
May 31,
2012 |
| Operations |
| Net investment income | $ | 394,176 | | $ | 693,929 | | | $ | 1,930,727 | | $ | 4,186,003 | |
| Net realized gain | | 3,756,234 | | | 5,393,430 | | | | 3,166,943 | | | 4,922,901 | |
| Net change in unrealized appreciation/depreciation | | 6,927,852 | | | (12,999,965 | ) | | | 3,078,137 | | | (3,844,138 | ) |
| Net increase (decrease) in net assets resulting from operations | | 11,078,262 | | | (6,912,606 | ) | | | 8,175,807 | | | 5,264,766 | |
| |
| Dividends to Shareholders From1 |
| Net investment income: | | | | | | | | | | | | | |
| Institutional | | (20,821 | ) | | (47,391 | ) | | | (71,910 | ) | | (142,798 | ) |
| Investor A | | (147,446 | ) | | (303,892 | ) | | | (685,258 | ) | | (1,275,387 | ) |
| Investor B | | (1,317 | ) | | (4,986 | ) | | | (19,049 | ) | | (53,604 | ) |
| Investor C | | (124,247 | ) | | (330,715 | ) | | | (1,176,400 | ) | | (2,892,296 | ) |
| Decrease in net assets resulting from dividends to shareholders | | (293,831 | ) | | (686,984 | ) | | | (1,952,617 | ) | | (4,364,085 | ) |
| |
| Capital Share Transactions |
| Net decrease in net assets derived from capital share transactions | | (5,234,035 | ) | | (8,323,642 | ) | | | (1,486,364 | ) | | (7,979,025 | ) |
| |
| Net Assets |
| Total increase (decrease) in net assets | | 5,550,396 | | | (15,923,232 | ) | | | 4,736,826 | | | (7,078,344 | ) |
| Beginning of period | | 98,199,185 | | | 114,122,417 | | | | 168,456,790 | | | 175,535,134 | |
| End of period | $ | 103,749,581 | | $ | 98,199,185 | | | $ | 173,193,616 | | $ | 168,456,790 | |
| Undistributed net investment income | $ | 394,169 | | $ | 293,824 | | | $ | 1,737,156 | | $ | 1,759,046 | |
| 1 | | Dividends are determined in accordance with federal income tax regulations. |
See Notes to Financial Statements.
| 38 | FDP SERIES, INC. | NOVEMBER 30, 2012 |
| |
| Financial Highlights | MFS Research International FDP Fund |
| | Institutional |
| | Six Months
Ended
November 30,
2012
(Unaudited) |
Year Ended May 31, |
| | 2012 | 2011 | 2010 | 2009 | 2008 |
| Per Share Operating Performance | | | | | | | | | | | | | | | | | | |
| Net asset value, beginning of period | $ | 9.45 | | $ | 11.98 | | $ | 9.02 | | $ | 8.59 | | $ | 13.86 | | $ | 14.63 | |
| Net investment income1 | | 0.05 | | | 0.20 | | | 0.17 | | | 0.16 | | | 0.15 | | | 0.21 | |
| Net realized and unrealized gain (loss) | | 1.43 | | | (2.56 | ) | | 2.95 | 2 | | 0.42 | 2 | | (5.24 | )2 | | 0.12 | 2 |
| Net increase (decrease) from investment operations | | 1.48 | | | (2.36 | ) | | 3.12 | | | 0.58 | | | (5.09 | ) | | 0.33 | |
| Dividends and distributions from:3 | | | | | | | | | | | | | | | | | | |
| Net investment income | | (0.18 | ) | | (0.17 | ) | | (0.16 | ) | | (0.15 | ) | | (0.12 | ) | | (0.08 | ) |
| Net realized gain | | — | | | — | | | — | | | — | | | (0.06 | ) | | (1.02 | ) |
| Total dividends and distributions | | (0.18 | ) | | (0.17 | ) | | (0.16 | ) | | (0.15 | ) | | (0.18 | ) | | (1.10 | ) |
| Net asset value, end of period | $ | 10.75 | | $ | 9.45 | | $ | 11.98 | | $ | 9.02 | | $ | 8.59 | | $ | 13.86 | |
| |
| Total Investment Return4 | | | | | | | | | | | | | | | | | | |
| Based on net asset value | | 15.82 | %5 | | (19.97 | )% | | 35.00 | %6 | | 6.76 | %6 | | (37.06 | )%6 | | 2.66 | % |
| |
| Ratios to Average Net Assets | | | | | | | | | | | | | | | | | | |
| Total expenses | | 1.28 | %7 | | 1.31 | % | | 1.27 | % | | 1.35 | % | | 1.43 | % | | 1.32 | % |
| Net investment income | | 0.92 | %7 | | 1.89 | % | | 1.62 | % | | 1.67 | % | | 1.67 | % | | 1.55 | % |
| |
| Supplemental Data | | | | | | | | | | | | | | | | | | |
| Net assets, end of period (000) | $ | 4,318 | | $ | 3,761 | | $ | 3,788 | | $ | 2,405 | | $ | 2,412 | | $ | 3,571 | |
| Portfolio turnover | | 14 | % | | 39 | % | | 44 | % | | 61 | % | | 76 | % | | 69 | % |
| 1 | | Based on average shares outstanding. |
| 2 | | Includes a redemption fee, which is less than $0.01 per share. |
| 3 | | Dividends and distributions are determined in accordance with federal income tax regulations. |
| 4 | | Where applicable, total investment returns include the reinvestment of dividends and distributions. |
| 5 | | Aggregate total investment return. |
| 6 | | Total return calculation includes redemption fees received by the Fund. The impact to the return is less than 0.01% |
See Notes to Financial Statements.
| FDP SERIES, INC. | NOVEMBER 30, 2012 | 39 |
| |
| Financial Highlights (continued) | MFS Research International FDP Fund |
| | Investor A |
| | Six Months
Ended
November 30,
2012
(Unaudited) |
Year Ended May 31, |
| | 2012 | 2011 | 2010 | 2009 | 2008 |
| Per Share Operating Performance | | | | | | | | | | | | | | | | | | |
| Net asset value, beginning of period | $ | 9.41 | | $ | 11.93 | | $ | 8.97 | | $ | 8.55 | | $ | 13.82 | | $ | 14.59 | |
| Net investment income1 | | 0.03 | | | 0.17 | | | 0.14 | | | 0.14 | | | 0.13 | | | 0.17 | |
| Net realized and unrealized gain (loss) | | 1.43 | | | (2.55 | ) | | 2.95 | 2 | | 0.40 | 2 | | (5.23 | )2 | | 0.12 | 2 |
| Net increase (decrease) from investment operations | | 1.46 | | | (2.38 | ) | | 3.09 | | | 0.54 | | | (5.10 | ) | | 0.29 | |
| Dividends and distributions from:3 | | | | | | | | | | | | | | | | | | |
| Net investment income | | (0.16 | ) | | (0.14 | ) | | (0.13 | ) | | (0.12 | ) | | (0.11 | ) | | (0.06 | ) |
| Net realized gain | | — | | | — | | | — | | | — | | | (0.06 | ) | | (1.00 | ) |
| Total dividends and distributions | | (0.16 | ) | | (0.14 | ) | | (0.13 | ) | | (0.12 | ) | | (0.17 | ) | | (1.06 | ) |
| Net asset value, end of period | $ | 10.71 | | $ | 9.41 | | $ | 11.93 | | $ | 8.97 | | $ | 8.55 | | $ | 13.82 | |
| |
| Total Investment Return4 | | | | | | | | | | | | | | | | | | |
| Based on net asset value | | 15.65 | %5 | | (20.15 | )% | | 34.87 | %6 | | 6.40 | %6 | | (37.24 | )%6 | | 2.42 | % |
| |
| Ratios to Average Net Assets | | | | | | | | | | | | | | | | | | |
| Total expenses | | 1.52 | %7 | | 1.55 | % | | 1.52 | % | | 1.60 | % | | 1.67 | % | | 1.56 | % |
| Net investment income | | 0.67 | %7 | | 1.67 | % | | 1.29 | % | | 1.42 | % | | 1.43 | % | | 1.27 | % |
| |
| Supplemental Data | | | | | | | | | | | | | | | | | | |
| Net assets, end of period (000) | $ | 37,276 | | $ | 30,343 | | $ | 29,747 | | $ | 21,502 | | $ | 22,280 | | $ | 34,072 | |
| Portfolio turnover | | 14 | % | | 39 | % | | 44 | % | | 61 | % | | 76 | % | | 69 | % |
| 1 | | Based on average shares outstanding. |
| 2 | | Includes a redemption fee, which is less than $0.01 per share. |
| 3 | | Dividends and distributions are determined in accordance with federal income tax regulations. |
| 4 | | Where applicable, total investment returns exclude the effects of any sales charges and include the reinvestment of dividends and distributions. |
| 5 | | Aggregate total investment return. |
| 6 | | Total return calculation includes redemption fees received by the Fund. The impact to the return is less than 0.01% |
See Notes to Financial Statements.
| 40 | FDP SERIES, INC. | NOVEMBER 30, 2012 |
| |
| Financial Highlights (continued) | MFS Research International FDP Fund |
| | Investor B |
| | Six Months
Ended
November 30,
2012
(Unaudited) |
Year Ended May 31, |
| | 2012 | 2011 | 2010 | 2009 | 2008 |
| Per Share Operating Performance | | | | | | | | | | | | | | | | | | |
| Net asset value, beginning of period | $ | 9.37 | | $ | 11.86 | | $ | 8.90 | | $ | 8.45 | | $ | 13.72 | | $ | 14.49 | |
| Net investment income (loss)1 | | (0.01 | ) | | 0.07 | | | 0.04 | | | 0.05 | | | 0.05 | | | 0.05 | |
| Net realized and unrealized gain (loss) | | 1.43 | | | (2.53 | ) | | 2.95 | 2 | | 0.43 | 2 | | (5.20 | )2 | | 0.14 | 2 |
| Net increase (decrease) from investment operations | | 1.42 | | | (2.46 | ) | | 2.99 | | | 0.48 | | | (5.15 | ) | | 0.19 | |
| Dividends and distributions from:3 | | | | | | | | | | | | | | | | | | |
| Net investment income | | (0.05 | ) | | (0.03 | ) | | (0.03 | ) | | (0.03 | ) | | (0.06 | ) | | (0.02 | ) |
| Net realized gain | | — | | | — | | | — | | | — | | | (0.06 | ) | | (0.94 | ) |
| Total dividends and distributions | | (0.05 | ) | | (0.03 | ) | | (0.03 | ) | | (0.03 | ) | | (0.12 | ) | | (0.96 | ) |
| Net asset value, end of period | $ | 10.74 | | $ | 9.37 | | $ | 11.86 | | $ | 8.90 | | $ | 8.45 | | $ | 13.72 | |
| |
| Total Investment Return4 | | | | | | | | | | | | | | | | | | |
| Based on net asset value | | 15.24 | %5 | | (20.79 | )% | | 33.71 | %6 | | 5.66 | %6 | | (37.76 | )%6 | | 1.62 | % |
| |
| Ratios to Average Net Assets | | | | | | | | | | | | | | | | | | |
| Total expenses | | 2.34 | %7 | | 2.35 | % | | 2.31 | % | | 2.39 | % | | 2.45 | % | | 2.35 | % |
| Net investment income (loss) | | (0.13 | )%7 | | 0.72 | % | | 0.36 | % | | 0.53 | % | | 0.51 | % | | 0.40 | % |
| |
| Supplemental Data | | | | | | | | | | | | | | | | | | |
| Net assets, end of period (000) | $ | 1,246 | | $ | 1,292 | | $ | 1,728 | | $ | 1,859 | | $ | 2,581 | | $ | 5,365 | |
| Portfolio turnover | | 14 | % | | 39 | % | | 44 | % | | 61 | % | | 76 | % | | 69 | % |
| 1 | | Based on average shares outstanding. |
| 2 | | Includes a redemption fee, which is less than $0.01 per share. |
| 3 | | Dividends and distributions are determined in accordance with federal income tax regulations. |
| 4 | | Where applicable, total investment returns exclude the effects of any sales charges and include the reinvestment of dividends and distributions. |
| 5 | | Aggregate total investment return. |
| 6 | | Total return calculation includes redemption fees received by the Fund. The impact to the return is less than 0.01% |
See Notes to Financial Statements.
| FDP SERIES, INC. | NOVEMBER 30, 2012 | 41 |
| |
| Financial Highlights (concluded) | MFS Research International FDP Fund |
| | Investor C |
| | Six Months
Ended
November 30,
2012
(Unaudited) |
Year Ended May 31, |
| | 2012 | 2011 | 2010 | 2009 | 2008 |
| Per Share Operating Performance | | | | | | | | | | | | | | | | | | |
| Net asset value, beginning of period | $ | 9.29 | | $ | 11.78 | | $ | 8.86 | | $ | 8.43 | | $ | 13.69 | | $ | 14.48 | |
| Net investment income (loss)1 | | (0.00 | )2 | | 0.08 | | | 0.05 | | | 0.06 | | | 0.05 | | | 0.07 | |
| Net realized and unrealized gain (loss) | | 1.40 | | | (2.52 | ) | | 2.93 | 3 | | 0.42 | 3 | | (5.18 | )3 | | 0.10 | 3 |
| Net increase (decrease) from investment operations | | 1.40 | | | (2.44 | ) | | 2.98 | | | 0.48 | | | (5.13 | ) | | 0.17 | |
| Dividends and distributions from:4 | | | | | | | | | | | | | | | | | | |
| Net investment income | | (0.07 | ) | | (0.05 | ) | | (0.06 | ) | | (0.05 | ) | | (0.07 | ) | | (0.02 | ) |
| Net realized gain | | — | | | — | | | — | | | — | | | (0.06 | ) | | (0.94 | ) |
| Total dividends and distributions | | (0.07 | ) | | (0.05 | ) | | (0.06 | ) | | (0.05 | ) | | (0.13 | ) | | (0.96 | ) |
| Net asset value, end of period | $ | 10.62 | | $ | 9.29 | | $ | 11.78 | | $ | 8.86 | | $ | 8.43 | | $ | 13.69 | |
| |
| Total Investment Return5 | | | | | | | | | | | | | | | | | | |
| Based on net asset value | | 15.16 | %6 | | (20.77 | )% | | 33.81 | %7 | | 5.71 | %7 | | (37.75 | )%7 | | 1.57 | % |
| |
| Ratios to Average Net Assets | | | | | | | | | | | | | | | | | | |
| Total expenses | | 2.29 | %8 | | 2.31 | % | | 2.28 | % | | 2.35 | % | | 2.43 | % | | 2.32 | % |
| Net investment income (loss) | | (0.10 | )%8 | | 0.79 | % | | 0.48 | % | | 0.66 | % | | 0.62 | % | | 0.51 | % |
| |
| Supplemental Data | | | | | | | | | | | | | | | | | | |
| Net assets, end of period (000) | $ | 84,437 | | $ | 77,861 | | $ | 104,687 | | $ | 85,137 | | $ | 89,330 | | $ | 153,414 | |
| Portfolio turnover | | 14 | % | | 39 | % | | 44 | % | | 61 | % | | 76 | % | | 69 | % |
| 1 | | Based on average shares outstanding. |
| 2 | | Amount is greater than $(0.01) per share. |
| 3 | | Includes a redemption fee, which is less than $0.01 per share. |
| 4 | | Dividends and distributions are determined in accordance with federal income tax regulations. |
| 5 | | Where applicable, total investment returns exclude the effects of any sales charges and include the reinvestment of dividends and distributions. |
| 6 | | Aggregate total investment return. |
| 7 | | Total return calculation includes redemption fees received by the Fund. The impact to the return is less than 0.01% |
See Notes to Financial Statements.
| 42 | FDP SERIES, INC. | NOVEMBER 30, 2012 |
| |
| Financial Highlights | Marsico Growth FDP Fund |
| | Institutional |
| | Six Months
Ended
November 30,
2012
(Unaudited) |
Year Ended May 31, |
| | 2012 | 2011 | 2010 | 2009 | 2008 |
| Per Share Operating Performance | | | | | | | | | | | | | | | | | | |
| Net asset value, beginning of period | $ | 12.63 | | $ | 12.68 | | $ | 9.88 | | $ | 8.29 | | $ | 12.28 | | $ | 12.35 | |
| Net investment income1 | | 0.05 | | | 0.03 | | | 0.02 | | | 0.02 | | | 0.05 | | | 0.03 | |
| Net realized and unrealized gain (loss) | | 0.36 | | | (0.08 | ) | | 2.78 | | | 1.57 | | | (4.04 | ) | | (0.10 | ) |
| Net increase (decrease) from investment operations | | 0.41 | | | (0.05 | ) | | 2.80 | | | 1.59 | | | (3.99 | ) | | (0.07 | ) |
| Net asset value, end of period | $ | 13.04 | | $ | 12.63 | | $ | 12.68 | | $ | 9.88 | | $ | 8.29 | | $ | 12.28 | |
| |
| Total Investment Return2 | | | | | | | | | | | | | | | | | | |
| Based on net asset value | | 3.25 | %3 | | (0.39 | )% | | 28.34 | % | | 19.18 | % | | (32.49 | )% | | (0.57 | )% |
| |
| Ratios to Average Net Assets | | | | | | | | | | | | | | | | | | |
| Total expenses | | 1.14 | %4 | | 1.14 | % | | 1.10 | % | | 1.18 | % | | 1.20 | % | | 1.09 | % |
| Total expenses after fees waived | | 1.09 | %4 | | 1.14 | % | | 1.10 | % | | 1.18 | % | | 1.20 | % | | 1.09 | % |
| Net investment income | | 0.74 | %4 | | 0.27 | % | | 0.19 | % | | 0.22 | % | | 0.54 | % | | 0.27 | % |
| |
| Supplemental Data | | | | | | | | | | | | | | | | | | |
| Net assets, end of period (000) | $ | 3,922 | | $ | 3,787 | | $ | 3,430 | | $ | 2,365 | | $ | 2,102 | | $ | 3,184 | |
| Portfolio turnover | | 59 | % | | 61 | % | | 66 | % | | 72 | % | | 83 | % | | 67 | % |
| 1 | | Based on average shares outstanding. |
| 2 | | Where applicable, total investment returns include the reinvestment of dividends and distributions. |
| 3 | | Aggregate total investment return. |
See Notes to Financial Statements.
| FDP SERIES, INC. | NOVEMBER 30, 2012 | 43 |
| |
| Financial Highlights (continued) | Marsico Growth FDP Fund |
| | Investor A |
| | Six Months
Ended
November 30,
2012
(Unaudited) |
Year Ended May 31, |
| | 2012 | 2011 | 2010 | 2009 | 2008 |
| Per Share Operating Performance | | | | | | | | | | | | | | | | | | |
| Net asset value, beginning of period | $ | 12.43 | | $ | 12.50 | | $ | 9.77 | | $ | 8.21 | | $ | 12.20 | | $ | 12.30 | |
| Net investment income (loss)1 | | 0.03 | | | 0.00 | 2 | | (0.01 | ) | | (0.00 | )3 | | 0.03 | | | 0.00 | 2 |
| Net realized and unrealized gain (loss) | | 0.35 | | | (0.07 | ) | | 2.74 | | | 1.56 | | | (4.02 | ) | | (0.10 | ) |
| Net increase (decrease) from investment operations | | 0.38 | | | (0.07 | ) | | 2.73 | | | 1.56 | | | (3.99 | ) | | (0.10 | ) |
| Net asset value, end of period | $ | 12.81 | | $ | 12.43 | | $ | 12.50 | | $ | 9.77 | | $ | 8.21 | | $ | 12.20 | |
| |
| Total Investment Return4 | | | | | | | | | | | | | | | | | | |
| Based on net asset value | | 3.06 | %5 | | (0.56 | )% | | 27.94 | % | | 19.00 | % | | (32.70 | )% | | (0.81 | )% |
| |
| Ratios to Average Net Assets | | | | | | | | | | | | | | | | | | |
| Total expenses | | 1.38 | %6 | | 1.39 | % | | 1.35 | % | | 1.42 | % | | 1.44 | % | | 1.33 | % |
| Total expenses after fees waived | | 1.33 | %6 | | 1.39 | % | | 1.35 | % | | 1.42 | % | | 1.44 | % | | 1.33 | % |
| Net investment income (loss) | | 0.51 | %6 | | 0.02 | % | | (0.06 | )% | | (0.03 | )% | | 0.30 | % | | 0.03 | % |
| |
| Supplemental Data | | | | | | | | | | | | | | | | | | |
| Net assets, end of period (000) | $ | 31,322 | | $ | 28,104 | | $ | 24,809 | | $ | 19,779 | | $ | 18,156 | | $ | 28,583 | |
| Portfolio turnover | | 59 | % | | 61 | % | | 66 | % | | 72 | % | | 83 | % | | 67 | % |
| 1 | | Based on average shares outstanding. |
| 2 | | Amount is less than $0.01 per share. |
| 3 | | Amount is greater than $(0.01) per share. |
| 4 | | Where applicable, total investment returns exclude the effects of any sales charges and include the reinvestment of dividends and distributions. |
| 5 | | Aggregate total investment return. |
See Notes to Financial Statements.
| 44 | FDP SERIES, INC. | NOVEMBER 30, 2012 |
| |
| Financial Highlights (continued) | Marsico Growth FDP Fund |
| | Investor B |
| | Six Months
Ended
November 30,
2012
(Unaudited) |
Year Ended May 31, |
| | 2012 | 2011 | 2010 | 2009 | 2008 |
| Per Share Operating Performance | | | | | | | | | | | | | | | | | | |
| Net asset value, beginning of period | $ | 11.77 | | $ | 11.94 | | $ | 9.40 | | $ | 7.97 | | $ | 11.94 | | $ | 12.12 | |
| Net investment loss1 | | (0.02 | ) | | (0.09 | ) | | (0.09 | ) | | (0.07 | ) | | (0.04 | ) | | (0.09 | ) |
| Net realized and unrealized gain (loss) | | 0.34 | | | (0.08 | ) | | 2.63 | | | 1.50 | | | (3.93 | ) | | (0.09 | ) |
| Net increase (decrease) from investment operations | | 0.32 | | | (0.17 | ) | | 2.54 | | | 1.43 | | | (3.97 | ) | | 0.18 | |
| Net asset value, end of period | $ | 12.09 | | $ | 11.77 | | $ | 11.94 | | $ | 9.40 | | $ | 7.97 | | $ | 11.94 | |
| |
| Total Investment Return2 | | | | | | | | | | | | | | | | | | |
| Based on net asset value | | 2.72 | %3 | | (1.42 | )% | | 27.02 | % | | 17.94 | % | | (33.25 | )% | | (1.49 | )% |
| |
| Ratios to Average Net Assets | | | | | | | | | | | | | | | | | | |
| Total expenses | | 2.20 | %4 | | 2.18 | % | | 2.15 | % | | 2.22 | % | | 2.24 | % | | 2.11 | % |
| Total expenses after fees waived | | 2.15 | %4 | | 2.18 | % | | 2.15 | % | | 2.22 | % | | 2.24 | % | | 2.11 | % |
| Net investment loss | | (0.37 | )%4 | | (0.78 | )% | | (0.86 | )% | | (0.81 | )% | | (0.48 | )% | | (0.74 | )% |
| |
| Supplemental Data | | | | | | | | | | | | | | | | | | |
| Net assets, end of period (000) | $ | 1,070 | | $ | 1,243 | | $ | 1,546 | | $ | 1,806 | | $ | 2,133 | | $ | 4,412 | |
| Portfolio turnover | | 59 | % | | 61 | % | | 66 | % | | 72 | % | | 83 | % | | 67 | % |
| 1 | | Based on average shares outstanding. |
| 2 | | Where applicable, total investment returns exclude the effects of any sales charges and include the reinvestment of dividends and distributions. |
| 3 | | Aggregate total investment return. |
See Notes to Financial Statements.
| FDP SERIES, INC. | NOVEMBER 30, 2012 | 45 |
| |
| Financial Highlights (concluded) | Marsico Growth FDP Fund |
| | Investor C |
| | Six Months
Ended
November 30,
2012
(Unaudited) |
Year Ended May 31, |
| | 2012 | 2011 | 2010 | 2009 | 2008 |
| Per Share Operating Performance | | | | | | | | | | | | | | | | | | |
| Net asset value, beginning of period | $ | 11.79 | | $ | 11.96 | | $ | 9.41 | | $ | 7.97 | | $ | 11.94 | | $ | 12.13 | |
| Net investment loss1 | | (0.02 | ) | | (0.09 | ) | | (0.09 | ) | | (0.07 | ) | | (0.04 | ) | | (0.09 | ) |
| Net realized and unrealized gain (loss) | | 0.34 | | | (0.08 | ) | | 2.64 | | | 1.51 | | | (3.93 | ) | | (0.10 | ) |
| Net increase (decrease) from investment operations | | 0.32 | | | (0.17 | ) | | 2.55 | | | 1.44 | | | (3.97 | ) | | (0.19 | ) |
| Net asset value, end of period | $ | 12.11 | | $ | 11.79 | | $ | 11.96 | | $ | 9.41 | | $ | 7.97 | | $ | 11.94 | |
| |
| Total Investment Return2 | | | | | | | | | | | | | | | | | | |
| Based on net asset value | | 2.71 | %3 | | (1.42 | )% | | 27.10 | % | | 18.07 | % | | (33.25 | )% | | (1.57 | )% |
| |
| Ratios to Average Net Assets | | | | | | | | | | | | | | | | | | |
| Total expenses | | 2.15 | %4 | | 2.15 | % | | 2.11 | % | | 2.17 | % | | 2.21 | % | | 2.09 | % |
| Total expenses after fees waived | | 2.10 | %4 | | 2.15 | % | | 2.11 | % | | 2.17 | % | | 2.21 | % | | 2.09 | % |
| Net investment loss | | (0.30 | )%4 | | (0.75 | )% | | (0.82 | )% | | (0.78 | )% | | (0.46 | )% | | (0.74 | )% |
| |
| Supplemental Data | | | | | | | | | | | | | | | | | | |
| Net assets, end of period (000) | $ | 69,565 | | $ | 72,267 | | $ | 87,554 | | $ | 77,640 | | $ | 72,992 | | $ | 127,254 | |
| Portfolio turnover | | 59 | % | | 61 | % | | 66 | % | | 72 | % | | 83 | % | | 67 | % |
| 1 | | Based on average shares outstanding. |
| 2 | | Where applicable, total investment returns exclude the effects of any sales charges and include the reinvestment of dividends and distributions. |
| 3 | | Aggregate total investment return. |
See Notes to Financial Statements.
| 46 | FDP SERIES, INC. | NOVEMBER 30, 2012 |
| |
| Financial Highlights | Invesco Value FDP Fund |
| | Institutional |
| | Six Months
Ended
November 30,
2012
(Unaudited) |
Year Ended May 31, |
| | 2012 | 2011 | 2010 | 2009 | 2008 |
| Per Share Operating Performance | | | | | | | | | | | | | | | | | | |
| Net asset value, beginning of period | $ | 9.97 | | $ | 10.69 | | $ | 8.53 | | $ | 7.00 | | $ | 10.30 | | $ | 12.45 | |
| Net investment income1 | | 0.08 | | | 0.15 | | | 0.12 | | | 0.08 | | | 0.15 | | | 0.18 | |
| Net realized and unrealized gain (loss) | | 1.09 | | | (0.72 | ) | | 2.10 | | | 1.51 | | | (3.27 | ) | | (1.90 | ) |
| Net increase (decrease) from investment operations | | 1.17 | | | (0.57 | ) | | 2.22 | | | 1.59 | | | (3.12 | ) | | (1.72 | ) |
| Dividends and distributions from:2 | | | | | | | | | | | | | | | | | | |
| Net investment income | | (0.06 | ) | | (0.15 | ) | | (0.06 | ) | | (0.06 | ) | | (0.17 | ) | | (0.17 | ) |
| Net realized gain | | — | | | — | | | — | | | — | | | (0.01 | ) | | (0.26 | ) |
| Total dividends and distributions | | (0.06 | ) | | (0.15 | ) | | (0.06 | ) | | (0.06 | ) | | (0.18 | ) | | (0.43 | ) |
| Net asset value, end of period | $ | 11.08 | | $ | 9.97 | | $ | 10.69 | | $ | 8.53 | | $ | 7.00 | | $ | 10.30 | |
| |
| Total Investment Return3 | | | | | | | | | | | | | | | | | | |
| Based on net asset value | | 11.81 | %4 | | (5.36 | )% | | 26.09 | % | | 22.83 | % | | (30.38 | )% | | (14.15 | )% |
| |
| Ratios to Average Net Assets | | | | | | | | | | | | | | | | | | |
| Total expenses | | 1.04 | %5 | | 1.05 | % | | 1.00 | % | | 1.08 | % | | 1.06 | % | | 1.02 | % |
| Net investment income | | 1.52 | %5 | | 1.46 | % | | 1.25 | % | | 0.98 | % | | 1.95 | % | | 1.65 | % |
| |
| Supplemental Data | | | | | | | | | | | | | | | | | | |
| Net assets, end of period (000) | $ | 3,551 | | $ | 3,347 | | $ | 3,226 | | $ | 2,351 | | $ | 2,105 | | $ | 3,131 | |
| Portfolio turnover | | 7 | % | | 17 | % | | 24 | % | | 19 | % | | 38 | % | | 25 | % |
| 1 | | Based on average shares outstanding. |
| 2 | | Dividends and distributions are determined in accordance with federal income tax regulations. |
| 3 | | Where applicable, total investment returns include the reinvestment of dividends and distributions. |
| 4 | | Aggregate total investment return. |
See Notes to Financial Statements.
| FDP SERIES, INC. | NOVEMBER 30, 2012 | 47 |
| |
| Financial Highlights (continued) | Invesco Value FDP Fund |
| | Investor A |
| | Six Months
Ended
November 30,
2012
(Unaudited) |
Year Ended May 31, |
| | 2012 | 2011 | 2010 | 2009 | 2008 |
| Per Share Operating Performance | | | | | | | | | | | | | | | | | | |
| Net asset value, beginning of period | $ | 9.89 | | $ | 10.61 | | $ | 8.51 | | $ | 6.99 | | $ | 10.29 | | $ | 12.43 | |
| Net investment income1 | | 0.07 | | | 0.12 | | | 0.10 | | | 0.07 | | | 0.13 | | | 0.15 | |
| Net realized and unrealized gain (loss) | | 1.08 | | | (0.72 | ) | | 2.08 | | | 1.50 | | | (3.27 | ) | | (1.89 | ) |
| Net increase (decrease) from investment operations | | 1.15 | | | (0.60 | ) | | 2.18 | | | 1.57 | | | (3.14 | ) | | (1.74 | ) |
| Dividends and distributions from:2 | | | | | | | | | | | | | | | | | | |
| Net investment income | | (0.05 | ) | | (0.12 | ) | | (0.08 | ) | | (0.05 | ) | | (0.15 | ) | | (0.14 | ) |
| Net realized gain | | — | | | — | | | — | | | — | | | (0.01 | ) | | (0.26 | ) |
| Total dividends and distributions | | (0.05 | ) | | (0.12 | ) | | (0.08 | ) | | (0.05 | ) | | (0.16 | ) | | (0.40 | ) |
| Net asset value, end of period | $ | 10.99 | | $ | 9.89 | | $ | 10.61 | | $ | 8.51 | | $ | 6.99 | | $ | 10.29 | |
| |
| Total Investment Return3 | | | | | | | | | | | | | | | | | | |
| Based on net asset value | | 11.70 | %4 | | (5.63 | )% | | 25.72 | % | | 22.61 | % | | (30.62 | )% | | (14.29 | )% |
| |
| Ratios to Average Net Assets | | | | | | | | | | | | | | | | | | |
| Total expenses | | 1.28 | %5 | | 1.30 | % | | 1.25 | % | | 1.32 | % | | 1.30 | % | | 1.26 | % |
| Net investment income | | 1.29 | %5 | | 1.22 | % | | 1.00 | % | | 0.85 | % | | 1.69 | % | | 1.40 | % |
| |
| Supplemental Data | | | | | | | | | | | | | | | | | | |
| Net assets, end of period (000) | $ | 30,441 | | $ | 26,457 | | $ | 24,215 | | $ | 19,197 | | $ | 17,813 | | $ | 27,616 | |
| Portfolio turnover | | 7 | % | | 17 | % | | 24 | % | | 19 | % | | 38 | % | | 25 | % |
| 1 | | Based on average shares outstanding. |
| 2 | | Dividends and distributions are determined in accordance with federal income tax regulations. |
| 3 | | Where applicable, total investment returns exclude the effects of any sales charges and include the reinvestment of dividends and distributions. |
| 4 | | Aggregate total investment return. |
See Notes to Financial Statements.
| 48 | FDP SERIES, INC. | NOVEMBER 30, 2012 |
| |
| Financial Highlights (continued) | Invesco Value FDP Fund |
| | Investor B |
| | Six Months
Ended
November 30,
2012
(Unaudited) |
Year Ended May 31, |
| | 2012 | 2011 | 2010 | 2009 | 2008 |
| Per Share Operating Performance | | | | | | | | | | | | | | | | | | |
| Net asset value, beginning of period | $ | 9.83 | | $ | 10.53 | | $ | 8.44 | | $ | 6.97 | | $ | 10.23 | | $ | 12.36 | |
| Net investment income (loss)1 | | 0.02 | | | 0.04 | | | 0.02 | | | (0.01 | ) | | 0.07 | | | 0.07 | |
| Net realized and unrealized gain (loss) | | 1.08 | | | (0.71 | ) | | 2.07 | | | 1.51 | | | (3.25 | ) | | (1.89 | ) |
| Net increase (decrease) from investment operations | | 1.10 | | | (0.67 | ) | | 2.09 | | | 1.50 | | | (3.18 | ) | | (1.82 | ) |
| Dividends and distributions from:2 | | | | | | | | | | | | | | | | | | |
| Net investment income | | (0.01 | ) | | (0.03 | ) | | — | | | (0.03 | ) | | (0.07 | ) | | (0.05 | ) |
| Net realized gain | | — | | | — | | | — | | | — | | | (0.01 | ) | | (0.26 | ) |
| Total dividends and distributions | | (0.01 | ) | | (0.03 | ) | | — | | | (0.03 | ) | | (0.08 | ) | | (0.31 | ) |
| Net asset value, end of period | $ | 10.92 | | $ | 9.83 | | $ | 10.53 | | $ | 8.44 | | $ | 6.97 | | $ | 10.23 | |
| |
| Total Investment Return3 | | | | | | | | | | | | | | | | | | |
| Based on net asset value | | 11.22 | %4 | | (6.32 | )% | | 24.76 | % | | 21.56 | % | | (31.13 | )% | | (14.99 | )% |
| |
| Ratios to Average Net Assets | | | | | | | | | | | | | | | | | | |
| Total expenses | | 2.10 | %5 | | 2.10 | % | | 2.05 | % | | 2.11 | % | | 2.08 | % | | 2.05 | % |
| Net investment income (loss) | | 0.45 | %5 | | 0.42 | % | | 0.21 | % | | (0.07 | )% | | 0.91 | % | | 0.60 | % |
| |
| Supplemental Data | | | | | | | | | | | | | | | | | | |
| Net assets, end of period (000) | $ | 1,086 | | $ | 1,184 | | $ | 1,551 | | $ | 1,807 | | $ | 2,182 | | $ | 4,303 | |
| Portfolio turnover | | 7 | % | | 17 | % | | 24 | % | | 19 | % | | 38 | % | | 25 | % |
| 1 | | Based on average shares outstanding. |
| 2 | | Dividends and distributions are determined in accordance with federal income tax regulations. |
| 3 | | Where applicable, total investment returns exclude the effects of any sales charges and include the reinvestment of dividends and distributions. |
| 4 | | Aggregate total investment return. |
See Notes to Financial Statements.
| FDP SERIES, INC. | NOVEMBER 30, 2012 | 49 |
| |
| Financial Highlights (concluded) | Invesco Value FDP Fund |
| | Investor C |
| | Six Months
Ended
November 30,
2012
(Unaudited) |
Year Ended May 31, |
| | 2012 | 2011 | 2010 | 2009 | 2008 |
| Per Share Operating Performance | | | | | | | | | | | | | | | | | | |
| Net asset value, beginning of period | $ | 9.77 | | $ | 10.47 | | $ | 8.43 | | $ | 6.95 | | $ | 10.21 | | $ | 12.35 | |
| Net investment income1 | | 0.03 | | | 0.04 | | | 0.02 | | | 0.01 | | | 0.07 | | | 0.07 | |
| Net realized and unrealized gain (loss) | | 1.07 | | | (0.70 | ) | | 2.05 | | | 1.50 | | | (3.24 | ) | | (1.89 | ) |
| Net increase (decrease) from investment operations | | 1.10 | | | (0.66 | ) | | 2.07 | | | 1.51 | | | (3.17 | ) | | (1.82 | ) |
| Dividends and distributions from:2 | | | | | | | | | | | | | | | | | | |
| Net investment income | | (0.02 | ) | | (0.04 | ) | | (0.03 | ) | | (0.03 | ) | | (0.08 | ) | | (0.06 | ) |
| Net realized gain | | — | | | — | | | — | | | — | | | (0.01 | ) | | (0.26 | ) |
| Total dividends and distributions | | (0.02 | ) | | (0.04 | ) | | (0.03 | ) | | (0.03 | ) | | (0.09 | ) | | (0.32 | ) |
| Net asset value, end of period | $ | 10.85 | | $ | 9.77 | | $ | 10.47 | | $ | 8.43 | | $ | 6.95 | | $ | 10.21 | |
| |
| Total Investment Return3 | | | | | | | | | | | | | | | | | | |
| Based on net asset value | | 11.25 | %4 | | (6.28 | )% | | 24.61 | % | | 21.84 | % | | (31.13 | )% | | (15.00 | )% |
| |
| Ratios to Average Net Assets | | | | | | | | | | | | | | | | | | |
| Total expenses | | 2.05 | %5 | | 2.05 | % | | 2.01 | % | | 2.08 | % | | 2.06 | % | | 2.02 | % |
| Net investment income | | 0.51 | %5 | | 0.46 | % | | 0.24 | % | | 0.11 | % | | 0.93 | % | | 0.63 | % |
| |
| Supplemental Data | | | | | | | | | | | | | | | | | | |
| Net assets, end of period (000) | $ | 68,672 | | $ | 67,211 | | $ | 85,130 | | $ | 75,817 | | $ | 71,843 | | $ | 122,891 | |
| Portfolio turnover | | 7 | % | | 17 | % | | 24 | % | | 19 | % | | 38 | % | | 25 | % |
| 1 | | Based on average shares outstanding. |
| 2 | | Dividends and distributions are determined in accordance with federal income tax regulations. |
| 3 | | Where applicable, total investment returns exclude the effects of any sales charges and include the reinvestment of dividends and distributions. |
| 4 | | Aggregate total investment return. |
See Notes to Financial Statements.
| 50 | FDP SERIES, INC. | NOVEMBER 30, 2012 |
| |
| Financial Highlights | Franklin Templeton Total Return FDP Fund |
| | Institutional |
| | Six Months
Ended
November 30,
2012
(Unaudited) |
Year Ended May 31, |
| | 2012 | 2011 | 2010 | 2009 | 2008 |
| Per Share Operating Performance | | | | | | | | | | | | | | | | | | |
| Net asset value, beginning of period | $ | 10.56 | | $ | 10.50 | | $ | 9.78 | | $ | 8.97 | | $ | 9.80 | | $ | 9.86 | |
| Net investment income1 | | 0.16 | | | 0.33 | | | 0.38 | | | 0.42 | | | 0.42 | | | 0.46 | |
| Net realized and unrealized gain (loss) | | 0.40 | | | 0.08 | | | 0.72 | | | 0.81 | | | (0.61 | ) | | (0.02 | ) |
| Net increase (decrease) from investment operations | | 0.56 | | | 0.41 | | | 1.10 | | | 1.23 | | | (0.19 | ) | | 0.44 | |
| Dividends and distributions from:2 | | | | | | | | | | | | | | | | | | |
| Net investment income | | (0.16 | ) | | (0.35 | ) | | (0.38 | ) | | (0.42 | ) | | (0.56 | ) | | (0.46 | ) |
| Net realized gain | | — | | | — | | | — | | | — | | | (0.08 | ) | | (0.04 | ) |
| Total dividends and distributions | | (0.16 | ) | | (0.35 | ) | | (0.38 | ) | | (0.42 | ) | | (0.64 | ) | | (0.50 | ) |
| Net asset value, end of period | $ | 10.96 | | $ | 10.56 | | $ | 10.50 | | $ | 9.78 | | $ | 8.97 | | $ | 9.80 | |
| |
| Total Investment Return3 | | | | | | | | | | | | | | | | | | |
| Based on net asset value | | 5.30 | %4 | | 3.89 | % | | 11.37 | % | | 13.88 | % | | (1.49 | )% | | 4.45 | % |
| |
| Ratios to Average Net Assets | | | | | | | | | | | | | | | | | | |
| Total expenses | | 0.71 | %5 | | 0.74 | % | | 0.71 | % | | 0.78 | % | | 0.82 | % | | 0.66 | % |
| Net investment income | | 2.88 | %5 | | 3.16 | % | | 3.71 | % | | 4.39 | % | | 4.77 | % | | 4.58 | % |
| |
| Supplemental Data | | | | | | | | | | | | | | | | | | |
| Net assets, end of period (000) | $ | 5,115 | | $ | 4,809 | | $ | 3,989 | | $ | 2,828 | | $ | 2,347 | | $ | 3,091 | |
| Portfolio turnover | | 167 | %6 | | 292 | %7 | | 200 | %8 | | 206 | %9 | | 304 | %10 | | 288 | %11 |
| 1 | | Based on average shares outstanding. |
| 2 | | Dividends and distributions are determined in accordance with federal income tax regulations. |
| 3 | | Where applicable, total investment returns include the reinvestment of dividends and distributions. |
| 4 | | Aggregate total investment return. |
| 6 | | Includes mortgage dollar roll transactions. Excluding these transactions, the portfolio turnover rate would have been 82%. |
| 7 | | Includes mortgage dollar roll transactions. Excluding these transactions, the portfolio turnover rate would have been 137%. |
| 8 | | Includes mortgage dollar roll transactions. Excluding these transactions, the portfolio turnover rate would have been 80%. |
| 9 | | Includes mortgage dollar roll transactions. Excluding these transactions, the portfolio turnover rate would have been 47%. |
| 10 | | Includes mortgage dollar roll transactions. Excluding these transactions, the portfolio turnover rate would have been 151%. |
| 11 | | Includes TBA transactions. Excluding these transactions, the portfolio turnover rate would have been 150%. |
See Notes to Financial Statements.
| FDP SERIES, INC. | NOVEMBER 30, 2012 | 51 |
| |
| Financial Highlights (continued) | Franklin Templeton Total Return FDP Fund |
| | Investor A |
| | Six Months
Ended
November 30,
2012
(Unaudited) |
Year Ended May 31, |
| | 2012 | 2011 | 2010 | 2009 | 2008 |
| Per Share Operating Performance | | | | | | | | | | | | | | | | | | |
| Net asset value, beginning of period | $ | 10.57 | | $ | 10.50 | | $ | 9.79 | | $ | 8.98 | | $ | 9.80 | | $ | 9.86 | |
| Net investment income1 | | 0.14 | | | 0.30 | | | 0.35 | | | 0.40 | | | 0.40 | | | 0.43 | |
| Net realized and unrealized gain (loss) | | 0.40 | | | 0.09 | | | 0.71 | | | 0.81 | | | (0.60 | ) | | (0.02 | ) |
| Net increase (decrease) from investment operations | | 0.54 | | | 0.39 | | | 1.06 | | | 1.21 | | | (0.20 | ) | | 0.41 | |
| Dividends and distributions from:2 | | | | | | | | | | | | | | | | | | |
| Net investment income | | (0.15 | ) | | (0.32 | ) | | (0.35 | ) | | (0.40 | ) | | (0.54 | ) | | (0.43 | ) |
| Net realized gain | | — | | | — | | | — | | | — | | | (0.08 | ) | | (0.04 | ) |
| Total dividends and distributions | | (0.15 | ) | | (0.32 | ) | | (0.35 | ) | | (0.40 | ) | | (0.62 | ) | | (0.47 | ) |
| Net asset value, end of period | $ | 10.96 | | $ | 10.57 | | $ | 10.50 | | $ | 9.79 | | $ | 8.98 | | $ | 9.80 | |
| |
| Total Investment Return3 | | | | | | | | | | | | | | | | | | |
| Based on net asset value | | 5.08 | %4 | | 3.74 | % | | 10.99 | % | | 13.60 | % | | (1.62 | )% | | 4.20 | % |
| |
| Ratios to Average Net Assets | | | | | | | | | | | | | | | | | | |
| Total expenses | | 0.95 | %5 | | 0.99 | % | | 0.96 | % | | 1.02 | % | | 1.04 | % | | 0.92 | % |
| Net investment income | | 2.64 | %5 | | 2.90 | % | | 3.47 | % | | 4.15 | % | | 4.54 | % | | 4.32 | % |
| |
| Supplemental Data | | | | | | | | | | | | | | | | | | |
| Net assets, end of period (000) | $ | 54,306 | | $ | 48,467 | | $ | 38,482 | | $ | 31,586 | | $ | 25,699 | | $ | 37,566 | |
| Portfolio turnover | | 167 | %6 | | 292 | %7 | | 200 | %8 | | 206 | %9 | | 304 | %10 | | 288 | %11 |
| 1 | | Based on average shares outstanding. |
| 2 | | Dividends and distributions are determined in accordance with federal income tax regulations. |
| 3 | | Where applicable, total investment returns exclude the effects of any sales charges and include the reinvestment of dividends and distributions. |
| 4 | | Aggregate total investment return. |
| 6 | | Includes mortgage dollar roll transactions. Excluding these transactions, the portfolio turnover rate would have been 82%. |
| 7 | | Includes mortgage dollar roll transactions. Excluding these transactions, the portfolio turnover rate would have been 137%. |
| 8 | | Includes mortgage dollar roll transactions. Excluding these transactions, the portfolio turnover rate would have been 80%. |
| 9 | | Includes mortgage dollar roll transactions. Excluding these transactions, the portfolio turnover rate would have been 47%. |
| 10 | | Includes mortgage dollar roll transactions. Excluding these transactions, the portfolio turnover rate would have been 151%. |
| 11 | | Includes TBA transactions. Excluding these transactions, the portfolio turnover rate would have been 150%. |
See Notes to Financial Statements.
| 52 | FDP SERIES, INC. | NOVEMBER 30, 2012 |
| |
| Financial Highlights (continued) | Franklin Templeton Total Return FDP Fund |
| | Investor B |
| | Six Months
Ended
November 30,
2012
(Unaudited) |
Year Ended May 31, |
| | 2012 | 2011 | 2010 | 2009 | 2008 |
| Per Share Operating Performance | | | | | | | | | | | | | | | | | | |
| Net asset value, beginning of period | $ | 10.57 | | $ | 10.50 | | $ | 9.79 | | $ | 8.98 | | $ | 9.80 | | $ | 9.86 | |
| Net investment income1 | | 0.11 | | | 0.24 | | | 0.30 | | | 0.35 | | | 0.36 | | | 0.38 | |
| Net realized and unrealized gain (loss) | | 0.40 | | | 0.10 | | | 0.71 | | | 0.80 | | | (0.61 | ) | | (0.02 | ) |
| Net increase (decrease) from investment operations | | 0.51 | | | 0.34 | | | 1.01 | | | 1.15 | | | (0.25 | ) | | 0.36 | |
| Dividends and distributions from:2 | | | | | | | | | | | | | | | | | | |
| Net investment income | | (0.12 | ) | | (0.27 | ) | | (0.30 | ) | | (0.34 | ) | | (0.49 | ) | | (0.38 | ) |
| Net realized gain | | — | | | — | | | — | | | — | | | (0.08 | ) | | (0.04 | ) |
| Total dividends and distributions | | (0.12 | ) | | (0.27 | ) | | (0.30 | ) | | (0.34 | ) | | (0.57 | ) | | (0.42 | ) |
| Net asset value, end of period | $ | 10.96 | | $ | 10.57 | | $ | 10.50 | | $ | 9.79 | | $ | 8.98 | | $ | 9.80 | |
| |
| Total Investment Return3 | | | | | | | | | | | | | | | | | | |
| Based on net asset value | | 4.79 | %4 | | 3.19 | % | | 10.40 | % | | 13.00 | % | | (2.16 | )% | | 3.66 | % |
| |
| Ratios to Average Net Assets | | | | | | | | | | | | | | | | | | |
| Total expenses | | 1.51 | %5 | | 1.52 | % | | 1.50 | % | | 1.55 | % | | 1.57 | % | | 1.45 | % |
| Net investment income | | 2.08 | %5 | | 2.24 | % | | 2.97 | % | | 3.62 | % | | 3.99 | % | | 3.80 | % |
| |
| Supplemental Data | | | | | | | | | | | | | | | | | | |
| Net assets, end of period (000) | $ | 1,698 | | $ | 1,909 | | $ | 2,062 | | $ | 2,521 | | $ | 2,489 | | $ | 4,138 | |
| Portfolio turnover | | 167 | %6 | | 292 | %7 | | 200 | %8 | | 206 | %9 | | 304 | %10 | | 288 | %11 |
| 1 | | Based on average shares outstanding. |
| 2 | | Dividends and distributions are determined in accordance with federal income tax regulations. |
| 3 | | Where applicable, total investment returns exclude the effects of any sales charges and include the reinvestment of dividends and distributions. |
| 4 | | Aggregate total investment return. |
| 6 | | Includes mortgage dollar roll transactions. Excluding these transactions, the portfolio turnover rate would have been 82%. |
| 7 | | Includes mortgage dollar roll transactions. Excluding these transactions, the portfolio turnover rate would have been 137%. |
| 8 | | Includes mortgage dollar roll transactions. Excluding these transactions, the portfolio turnover rate would have been 80%. |
| 9 | | Includes mortgage dollar roll transactions. Excluding these transactions, the portfolio turnover rate would have been 47%. |
| 10 | | Includes mortgage dollar roll transactions. Excluding these transactions, the portfolio turnover rate would have been 151%. |
| 11 | | Includes TBA transactions. Excluding these transactions, the portfolio turnover rate would have been 150%. |
See Notes to Financial Statements.
| FDP SERIES, INC. | NOVEMBER 30, 2012 | 53 |
| |
| Financial Highlights (concluded) | Franklin Templeton Total Return FDP Fund |
| | Investor C |
| | Six Months
Ended
November 30,
2012
(Unaudited) |
Year Ended May 31, |
| | 2012 | 2011 | 2010 | 2009 | 2008 |
| Per Share Operating Performance | | | | | | | | | | | | | | | | | | |
| Net asset value, beginning of period | $ | 10.57 | | $ | 10.50 | | $ | 9.79 | | $ | 8.98 | | $ | 9.80 | | $ | 9.86 | |
| Net investment income1 | | 0.11 | | | 0.24 | | | 0.30 | | | 0.34 | | | 0.35 | | | 0.37 | |
| Net realized and unrealized gain (loss) | | 0.40 | | | 0.09 | | | 0.70 | | | 0.81 | | | (0.60 | ) | | (0.01 | ) |
| Net increase (decrease) from investment operations | | 0.51 | | | 0.33 | | | 1.00 | | | 1.15 | | | (0.25 | ) | | 0.36 | |
| Dividends and distributions from:2 | | | | | | | | | | | | | | | | | | |
| Net investment income | | (0.12 | ) | | (0.26 | ) | | (0.29 | ) | | (0.34 | ) | | (0.49 | ) | | (0.38 | ) |
| Net realized gain | | — | | | — | | | — | | | — | | | (0.08 | ) | | (0.04 | ) |
| Total dividends and distributions | | (0.12 | ) | | (0.26 | ) | | (0.29 | ) | | (0.34 | ) | | (0.57 | ) | | (0.42 | ) |
| Net asset value, end of period | $ | 10.96 | | $ | 10.57 | | $ | 10.50 | | $ | 9.79 | | $ | 8.98 | | $ | 9.80 | |
| |
| Total Investment Return3 | | | | | | | | | | | | | | | | | | |
| Based on net asset value | | 4.78 | %4 | | 3.16 | % | | 10.38 | % | | 12.97 | % | | (2.18 | )% | | 3.62 | % |
| |
| Ratios to Average Net Assets | | | | | | | | | | | | | | | | | | |
| Total expenses | | 1.52 | %5 | | 1.54 | % | | 1.52 | % | | 1.57 | % | | 1.59 | % | | 1.48 | % |
| Net investment income | | 2.07 | %5 | | 2.35 | % | | 2.92 | % | | 3.60 | % | | 3.97 | % | | 3.75 | % |
| |
| Supplemental Data | | | | | | | | | | | | | | | | | | |
| Net assets, end of period (000) | $ | 112,075 | | $ | 113,271 | | $ | 131,002 | | $ | 120,836 | | $ | 105,212 | | $ | 164,222 | |
| Portfolio turnover | | 167 | %6 | | 292 | %7 | | 200 | %8 | | 206 | %9 | | 304 | %10 | | 288 | %11 |
| 1 | | Based on average shares outstanding. |
| 2 | | Dividends and distributions are determined in accordance with federal income tax regulations. |
| 3 | | Where applicable, total investment returns exclude the effects of any sales charges and include the reinvestment of dividends and distributions. |
| 4 | | Aggregate total investment return. |
| 6 | | Includes mortgage dollar roll transactions. Excluding these transactions, the portfolio turnover rate would have been 82%. |
| 7 | | Includes mortgage dollar roll transactions. Excluding these transactions, the portfolio turnover rate would have been 137%. |
| 8 | | Includes mortgage dollar roll transactions. Excluding these transactions, the portfolio turnover rate would have been 80%. |
| 9 | | Includes mortgage dollar roll transactions. Excluding these transactions, the portfolio turnover rate would have been 47%. |
| 10 | | Includes mortgage dollar roll transactions. Excluding these transactions, the portfolio turnover rate would have been 151%. |
| 11 | | Includes TBA transactions. Excluding these transactions, the portfolio turnover rate would have been 150%. |
See Notes to Financial Statements.
| 54 | FDP SERIES, INC. | NOVEMBER 30, 2012 |
Notes to Financial Statements (Unaudited)
1. Organization and Significant Accounting Policies:
MFS Research International FDP Fund (“MFS Fund”), Marsico Growth FDP Fund (“Marsico Fund”), Invesco Value FDP Fund (formerly known as Van Kampen Value FDP Fund),(“Invesco Fund”) and Franklin Templeton Total Return FDP Fund (“Franklin Templeton Fund”) (each a “Fund,” collectively, the “Funds”) are each a series of FDP Series, Inc. (the “Corporation”). The Corporation is registered under the Investment Company Act of 1940, as amended (the “1940 Act”). Each Fund is registered as a diversified, open-end management investment company. The Corporation is organized as a Maryland corporation. The Funds’ financial statements are prepared in conformity with accounting principles generally accepted in the United States of America (“US GAAP”), which may require management to make estimates and assumptions that affect the reported amounts of assets and liabilities in the financial statements and the reported amounts of increases and decreases in net assets from operations during the reporting period. Actual results could differ from those estimates. Each Fund offers multiple classes of shares. Institutional Shares are sold without a sales charge and only to certain eligible investors. Investor A Shares are generally sold with a front-end sales charge. Investor B and Investor C Shares may be subject to a CDSC. All classes of shares have identical voting, dividend, liquidation and other rights and the same terms and conditions, except that Investor A, Investor B and Investor C Shares bear certain expenses related to the shareholder servicing of such shares, and Investor B and Investor C Shares also bear certain expenses related to the distribution of such shares. Investor B Shares automatically convert to Investor A Shares after approximately eight years for MFS Fund, Marsico Fund and Invesco Fund and after ten years for Franklin Templeton Fund. Investor B Shares are only available through exchanges and dividend reinvestments by existing shareholders and for purchase by certain qualified employee benefit plans. Each class has exclusive voting rights with respect to matters relating to its shareholder servicing and distribution expenditures (except that Investor B shareholders may vote on material changes to the Investor A distribution and service plan).
The following is a summary of significant accounting policies followed by the Funds:
Valuation: US GAAP defines fair value as the price the Funds would receive to sell an asset or pay to transfer a liability in an orderly transaction between market participants at the measurement date. The Funds determine the fair values of their financial instruments at market value using independent dealers or pricing services under policies approved by the Board of Directors of the Corporation (the “Board”). The BlackRock Global Valuation Methodologies Committee (the “Global Valuation Committee”) is the committee formed by management to develop global pricing policies and procedures and to provide oversight of the pricing function for the Funds for all financial instruments.
The Funds value their bond investments on the basis of last available bid prices or current market quotations provided by dealers or pricing services. Floating rate loan interests are valued at the mean of the bid prices from one or more brokers or dealers as obtained from a pricing service. In determining the value of a particular investment, pricing services may use certain information with respect to transactions in such investments, quotations from dealers, pricing matrixes, market transactions in comparable investments, various relationships observed in the market between investments and calculated yield measures. Asset-backed and mortgage-backed securities are valued by independent pricing services using models that consider estimated cash flows of each tranche of the security, establish a benchmark yield and develop an estimated tranche specific spread to the benchmark yield based on the unique attributes of the tranche. Financial futures contracts traded on exchanges are valued at their last sale price. To-be-announced (“TBA”) commitments are valued on the basis of last available bid prices or current market quotations provided by pricing services. Swap agreements are valued utilizing quotes received daily by the Funds’ pricing service or through brokers, which are derived using daily swap curves and models that incorporate a number of market data factors, such as discounted cash flows, trades and values of the underlying reference instruments. Short-term securities with remaining maturities of 60 days or less may be valued at amortized cost, which approximates fair value.
Municipal investments (including commitments to purchase such investments on a “when-issued” basis) are valued on the basis of prices provided by dealers or pricing services. In determining the value of a particular investment, pricing services may use certain information with respect to transactions in such investments, quotations from dealers, pricing matrixes, market transactions in comparable investments and information with respect to various relationships between investments.
Equity investments traded on a recognized securities exchange or the NASDAQ Global Market System (“NASDAQ”) are valued at the last reported sale price that day or the NASDAQ official closing price, if applicable. For equity investments traded on more than one exchange, the last reported sale price on the exchange where the stock is primarily traded is used. Equity investments traded on a recognized exchange for which there were no sales on that day are valued at the last available bid (long positions) or ask (short positions) price. If no bid or ask price is available, the prior day’s price will be used, unless it is determined that such prior day’s price no longer reflects the fair value of the security.
Securities and other assets and liabilities denominated in foreign currencies are translated into US dollars using exchange rates determined as of the close of business on the New York Stock Exchange (“NYSE”). Foreign currency exchange contracts are valued at the mean between the bid and ask prices and are determined as of the close of business on the NYSE. Interpolated values are derived when the settlement date of the contract is an interim date for which quotations are not available.
In the event that application of these methods of valuation results in a price for an investment that is deemed not to be representative of the market value of such investment, or if a price is not available, the investment will be valued by the Global Valuation Committee, or its delegate, in accordance with a policy approved by the Board as reflecting fair value (“Fair Value Assets”). When determining the price for Fair Value Assets, the Global Valuation Committee, or its delegate, seeks to determine the price that each Fund might reasonably expect to receive from the current sale of that asset in an arm’s-length transaction. Fair value determinations shall be based upon all available factors that the investment advisor and/or sub-advisor deems relevant consistent with the
| FDP SERIES, INC. | NOVEMBER 30, 2012 | 55 |
Notes to Financial Statements (continued)
principles of fair value measurement, which include the market approach, income approach and/or cost approach, as appropriate. A market approach generally consists of using comparable market transactions. The income approach generally is used to discount future cash flows to present value and adjust for liquidity as appropriate. These factors include but are not limited to (i) attributes specific to the investment or asset; (ii) the principal market for the investment or asset; (iii) the customary participants in the principal market for the investment or asset; (iv) data assumptions by market participants for the investment or asset, if reasonably available; (v) quoted prices for similar investments or assets in active markets; and (vi) other factors, such as future cash flows, interest rates, yield curves, volatilities, prepayment speeds, loss severities, credit risks, recovery rates, liquidation amounts and/or default rates. Due to the inherent uncertainty of valuations of such investments, the fair values may differ from the values that would have been used had an active market existed. The Global Valuation Committee, or its delegate, employs various methods for calibrating valuation approaches for investments where an active market does not exist, including regular due diligence of the Fund’s pricing vendors, a regular review of key inputs and assumptions, transactional back-testing or disposition analysis to compare unrealized gains and losses to realized gains and losses, reviews of missing or stale prices and large movements in market values and reviews of any market related activity. The pricing of all Fair Value Assets is subsequently reported to the Board or a committee thereof on a quarterly basis.
Generally, trading in foreign instruments is substantially completed each day at various times prior to the close of business on the NYSE. Occasionally, events affecting the values of such instruments may occur between the foreign market close and the close of business on the NYSE that may not be reflected in the computation of the Funds’ net assets. If events (for example, a company announcement, market volatility or a natural disaster) occur during such periods that are expected to affect the value of such instruments materially, those instruments may be Fair Value Assets and valued at their fair value, as determined in good faith by the Global Valuation Committee using a pricing service and/or policies approved by the Board. Each business day, the Funds use a pricing service to assist with the valuation of certain foreign exchange-traded equity securities and foreign exchange-traded and OTC options (the “Systematic Fair Value Price”). Using current market factors, the Systematic Fair Value Price is designed to value such foreign securities and foreign options at fair value as of the close of business on the NYSE, which follows the close of the local markets.
Foreign Currency: The Funds’ books and records are maintained in US dollars. Purchases and sales of investment securities are recorded at the rates of exchange prevailing on the respective date of such transactions. Generally, when the US dollar rises in value against a foreign currency, the Funds’ investments denominated in that currency will lose value because that currency is worth fewer US dollars; the opposite effect occurs if the US dollar falls in relative value.
The Funds do not isolate the portion of the results of operations arising as a result of changes in the foreign exchange rates from the changes in the market prices of investments held or sold for financial reporting purposes. Accordingly, the effects of changes in foreign currency exchange rates on investments are not segregated in the Statements of Operations from the effects of changes in market prices of those investments but are included as a component of net realized and unrealized gain (loss) from investments. The Funds report realized currency gains (losses) on foreign currency related transactions as components of net realized gain (loss) for financial reporting purposes, whereas such components are treated as ordinary income for federal income tax purposes.
Asset-Backed and Mortgage-Backed Securities: Franklin Templeton Fund may invest in asset-backed securities. Asset-backed securities are generally issued as pass-through certificates, which represent undivided fractional ownership interests in an underlying pool of assets, or as debt instruments, which are also known as collateralized obligations, and are generally issued as the debt of a special purpose entity organized solely for the purpose of owning such assets and issuing such debt. Asset-backed securities are often backed by a pool of assets representing the obligations of a number of different parties. The yield characteristics of certain asset-backed securities may differ from traditional debt securities. One such major difference is that all or a principal part of the obligations may be prepaid at any time because the underlying assets (i.e., loans) may be prepaid at any time. As a result, a decrease in interest rates in the market may result in increases in the level of prepayments as borrowers, particularly mortgagors, refinance and repay their loans. An increased prepayment rate with respect to an asset-backed security subject to such a prepayment feature will have the effect of shortening the maturity of the security. If the Fund has purchased such an asset-backed security at a premium, a faster than anticipated prepayment rate could result in a loss of principal to the extent of the premium paid.
Franklin Templeton Fund may purchase certain mortgage pass-through securities. There are a number of important differences among the agencies and instrumentalities of the US government that issue mortgage-related securities and among the securities that they issue. For example, mortgage-related securities guaranteed by Ginnie Mae are guaranteed as to the timely payment of principal and interest by Ginnie Mae and such guarantee is backed by the full faith and credit of the United States. However, mortgage-related securities issued by Freddie Mac and Fannie Mae, including Freddie Mac and Fannie Mae guaranteed Mortgage Pass-Through Certificates, which are solely the obligations of Freddie Mac and Fannie Mae, are not backed by or entitled to the full faith and credit of the United States but are supported by the right of the issuer to borrow from the Treasury.
Inflation-Indexed Bonds: Franklin Templeton Fund may invest in inflation-indexed bonds. Inflation-indexed bonds are fixed income securities whose principal value is periodically adjusted according to the rate of inflation. If the index measuring inflation rises or falls, the principal value of inflation-indexed bonds will be adjusted upward or downward, and consequently the interest payable on these securities (calculated with respect to a larger or smaller principal amount) will be increased or reduced, respectively. Any upward or downward adjustment in the principal amount of an inflation-indexed bond will be included as interest income in the Statements of Operations, even though investors do not receive their principal until maturity. Repayment of the original bond principal upon maturity (as adjusted for inflation) is guaranteed in the case of US Treasury
| 56 | FDP SERIES, INC. | NOVEMBER 30, 2012 |
Notes to Financial Statements (continued)
inflation-indexed bonds. For bonds that do not provide a similar guarantee, the adjusted principal value of the bond repaid at maturity may be less than the original principal.
Multiple Class Pass-Through Securities: Franklin Templeton Fund may invest in multiple class pass-through securities, including collateralized mortgage obligations (“CMOs”) and commercial mortgage-backed securities. These multiple class securities may be issued by Ginnie Mae, US government agencies or instrumentalities or by trusts formed by private originators of, or investors in, mortgage loans. In general, CMOs are debt obligations of a legal entity that are collateralized by, and multiple class pass-through securities represent direct ownership interests in, a pool of residential or commercial mortgage loans or mortgage pass-through securities (the “Mortgage Assets”), the payments on which are used to make payments on the CMOs or multiple pass-through securities. Classes of CMOs include interest only (“IOs”), principal only (“POs”), planned amortization classes and targeted amortization classes. IOs and POs are stripped mortgage-backed securities representing interests in a pool of mortgages, the cash flow from which has been separated into interest and principal components. IOs receive the interest portion of the cash flow while POs receive the principal portion. IOs and POs can be extremely volatile in response to changes in interest rates. As interest rates rise and fall, the value of IOs tends to move in the same direction as interest rates. POs perform best when prepayments on the underlying mortgages rise since this increases the rate at which the principal is returned and the yield to maturity on the PO. When payments on mortgages underlying a PO are slower than anticipated, the life of the PO is lengthened and the yield to maturity is reduced. If the underlying Mortgage Assets experience greater than anticipated pre-payments of principal, the Fund may not fully recoup its initial investment in IOs.
Zero-Coupon Bonds: Franklin Templeton Fund may invest in zero-coupon bonds, which are normally issued at a significant discount from face value and do not provide for periodic interest payments. Zero-coupon bonds may experience greater volatility in market value than similar maturity debt obligations, which provide for regular interest payments.
Capital Trusts: Franklin Templeton Fund may invest in capital trusts. These securities are typically issued by corporations, generally in the form of interest-bearing notes with preferred securities characteristics, or by an affiliated business trust of a corporation, generally in the form of beneficial interests in subordinated debentures or similarly structured securities. The securities can be structured as either fixed or adjustable coupon securities that can have either a perpetual or stated maturity date. Dividends can be deferred without creating an event of default or acceleration, although maturity cannot take place unless all cumulative payment obligations have been met. The deferral of payments does not affect the purchase or sale of these securities in the open market. Payments on these securities are treated as interest rather than dividends for federal income tax purposes. These securities generally are rated below that of the issuing company’s senior debt securities.
Preferred Stock: The Funds may invest in preferred stock. Preferred stock has a preference over common stock in liquidation (and generally in receiving dividends as well) but is subordinated to the liabilities of the issuer in all respects. As a general rule, the market value of preferred stock with a fixed dividend rate and no conversion element varies inversely with interest rates and perceived credit risk, while the market price of convertible preferred stock generally also reflects some element of conversion value. Because preferred stock is junior to debt securities and other obligations of the issuer, deterioration in the credit quality of the issuer will cause greater changes in the value of a preferred stock than in a more senior debt security with similar stated yield characteristics. Unlike interest payments on debt securities, preferred stock dividends are payable only if declared by the issuer’s board of directors. Preferred stock also may be subject to optional or mandatory redemption provisions.
Floating Rate Loan Interests: Franklin Templeton Fund may invest in floating rate loan interests. The floating rate loan interests the Fund holds are typically issued to companies (the “borrower”) by banks, other financial institutions, and privately and publicly offered corporations (the “lender”). Floating rate loan interests are generally non-investment grade, often involve borrowers whose financial condition is troubled or uncertain and companies that are highly leveraged. The Fund may invest in obligations of borrowers who are in bankruptcy proceedings. Floating rate loan interests may include fully funded term loans or revolving lines of credit. Floating rate loan interests are typically senior in the corporate capital structure of the borrower. Floating rate loan interests generally pay interest at rates that are periodically determined by reference to a base lending rate plus a premium. The base lending rates are generally the lending rate offered by one or more European banks, such as London Interbank Offered Rate (“LIBOR”), the prime rate offered by one or more US banks or the certificate of deposit rate. Floating rate loan interests may involve foreign borrowers, and investments may be denominated in foreign currencies. The Fund considers these investments to be investments in debt securities for purposes of its investment policies.
When the Fund purchases a floating rate loan interest it may receive a facility fee and when it sells a floating rate loan interest it may pay a facility fee. On an ongoing basis, the Fund may receive a commitment fee based on the undrawn portion of the underlying line of credit amount of a floating rate loan interest. Facility and commitment fees are typically amortized to income over the term of the loan or term of the commitment, respectively. Consent and amendment fees are recorded to income as earned. Prepayment penalty fees, which may be received by the Fund upon the prepayment of a floating rate loan interest by a borrower, are recorded as realized gains. The Fund may invest in multiple series or tranches of a loan. A different series or tranche may have varying terms and carry different associated risks.
Floating rate loan interests are usually freely callable at the borrower’s option. The Fund may invest in such loans in the form of participations in loans (“Participations”) or assignments (“Assignments”) of all or a portion of loans from third parties. Participations typically will result in the Fund having a contractual relationship only with the lender, not with the borrower. The Fund will have the right to receive payments of principal, interest and any fees to which it is entitled only from the lender selling the Participation and only upon receipt by the lender of the payments from the borrower. In connection with purchasing Participations, the Fund generally will have no right to enforce compliance by the borrower with the terms of
| FDP SERIES, INC. | NOVEMBER 30, 2012 | 57 |
Notes to Financial Statements (continued)
the loan agreement, nor any rights of offset against the borrower, and the Fund may not benefit directly from any collateral supporting the loan in which it has purchased the Participation. As a result, the Fund will assume the credit risk of both the borrower and the lender that is selling the Participation. The Fund’s investment in loan participation interests involves the risk of insolvency of the financial intermediaries who are parties to the transactions. In the event of the insolvency of the lender selling the Participation, the Fund may be treated as a general creditor of the lender and may not benefit from any offset between the lender and the borrower. Assignments typically result in the Fund having a direct contractual relationship with the borrower, and the Fund may enforce compliance by the borrower with the terms of the loan agreement.
TBA Commitments: Franklin Templeton Fund may enter into TBA commitments. TBA commitments are forward agreements for the purchase or sale of mortgage-backed securities for a fixed price, with payment and delivery on an agreed upon future settlement date. The specific securities to be delivered are not identified at the trade date. However, delivered securities must meet specified terms, including issuer, rate and mortgage terms. The Fund generally enters into TBA commitments with the intent to take possession of or deliver the underlying mortgage-backed securities but can extend the settlement or roll the transaction. TBA commitments involve a risk of loss if the value of the security to be purchased or sold declines or increases, respectively, prior to settlement date.
Mortgage Dollar Roll Transactions: Franklin Templeton Fund may sell TBA mortgage-backed securities and simultaneously contract to repurchase substantially similar (same type, coupon and maturity) securities on a specific future date at an agreed upon price. During the period between the sale and repurchase, the Fund will not be entitled to receive interest and principal payments on the securities sold. The Fund accounts for mortgage dollar roll transactions as purchases and sales and realizes gains and losses on these transactions. These transactions may increase the Fund’s portfolio turnover rate. Mortgage dollar rolls involve the risk that the market value of the securities that the Fund is required to purchase may decline below the agreed upon repurchase price of those securities.
Segregation and Collateralization: In cases in which the 1940 Act and the interpretive positions of the Securities and Exchange Commission (“SEC”) require that each Fund either deliver collateral or segregate assets in connection with certain investments (e.g., dollar rolls, TBA sale commitments, financial futures contracts, foreign currency exchange contracts and swaps) each Fund will, consistent with SEC rules and/or certain interpretive letters issued by the SEC, segregate collateral or designate on its books and records cash or liquid securities having a market value at least equal to the amount that would otherwise be required to be physically segregated. Furthermore, based on requirements and agreements with certain exchanges and third party broker-dealers, a Fund engaging in such transactions may have requirements to deliver/ deposit securities to/with an exchange or broker-dealer as collateral for certain investments.
Investment Transactions and Investment Income: For financial reporting purposes, investment transactions are recorded on the dates the transactions are entered into (the trade dates). Realized gains and losses on investment transactions are determined on the identified cost basis. Dividend income is recorded on the ex-dividend dates. Dividends from foreign securities where the ex-dividend date may have passed are subsequently recorded when the Funds are informed of the ex-dividend date. Under the applicable foreign tax laws, a withholding tax at various rates may be imposed on capital gains, dividends and interest. Upon notification from issuers, some of the dividend income received from a real estate investment trust may be redesignated as a reduction of cost of the related investment and/or realized gain. Interest income, including amortization and accretion of premiums and discounts on debt securities, is recognized on the accrual basis. Income and realized and unrealized gains and losses are allocated daily to each class based on its relative net assets. Consent fees are compensation for agreeing to changes in the terms of debt instruments and are included in interest income in the Statements of Operations.
Dividends and Distributions: For MFS Fund, Marsico Fund and Invesco Fund, dividends and distributions paid by the Funds are recorded on the ex-dividend dates. For Franklin Templeton Fund, dividends from net investment income are declared daily and paid monthly. Distributions of capital gains are recorded on the ex-dividend dates. The portion of distributions that exceeds a Fund’s current and accumulated earnings and profits, which are measured on a tax basis, will constitute a nontaxable return of capital. Distributions in excess of a Fund’s taxable income and net capital gains, but not in excess of a Fund’s earnings and profits, will be taxable to shareholders as ordinary income and will not constitute a nontaxable return of capital. Capital losses carried forward from years beginning before 2011 do not reduce earnings and profits, even if such carried forward losses offset current year realized gains. The character and timing of dividends and distributions are determined in accordance with federal income tax regulations, which may differ from US GAAP.
Income Taxes: It is the Funds’ policy to comply with the requirements of the Internal Revenue Code of 1986, as amended, applicable to regulated investment companies and to distribute substantially all of their taxable income to their shareholders. Therefore, no federal income tax provision is required.
Each Fund files US federal and various state and local tax returns. No income tax returns are currently under examination. The statute of limitations on the Funds’ US federal tax returns remains open for each of the four years ended May 31, 2012. The statutes of limitations on each Fund’s state and local tax returns may remain open for an additional year depending upon the jurisdiction. Management does not believe there are any uncertain tax positions that require recognition of a tax liability.
Recent Accounting Standard: In December 2011, the Financial Accounting Standards Board issued guidance that will expand current disclosure requirements on the offsetting of certain assets and liabilities. The new disclosures will be required for investments and derivative financial instruments subject to master netting or similar agreements which are eligible for offset in the Statements of Assets and Liabilities and will require an entity to disclose both gross and net information about such investments and transactions in the financial statements. The guidance is effective for financial statements with fiscal years beginning on or after
| 58 | FDP SERIES, INC. | NOVEMBER 30, 2012 |
Notes to Financial Statements (continued)
January 1, 2013, and interim periods within those fiscal years. Management is evaluating the impact of this guidance on the Funds’ financial statement disclosures.
Other: Expenses directly related to a Fund or its classes are charged to that Fund or class. Other operating expenses shared by several funds are pro rated among those funds on the basis of relative net assets or other appropriate methods. Expenses directly related to the Funds and other shared expenses pro rated to the Funds are allocated daily to each class based on its relative net assets or other appropriate methods.
The Funds have an arrangement with the custodian whereby fees may be reduced by credits earned on uninvested cash balances, which, if applicable, are shown as fees paid indirectly in the Statements of Operations. The custodian imposes fees on overdrawn cash balances, which can be offset by accumulated credits earned or may result in additional custody charges.
2. Derivative Financial Instruments:
The Funds engage in various portfolio investment strategies using derivative contracts both to increase the returns of the Funds and/or to economically hedge, or protect, their exposure to certain risks such as credit risk, equity risk, interest rate risk, foreign currency exchange rate risk or other risk (inflation risk). These contracts may be transacted on an exchange or OTC.
Losses may arise if the value of the contract decreases due to an unfavorable change in the market rates or values of the underlying instrument or if the counterparty does not perform under the contract. The Funds’ maximum risk of loss from counterparty credit risk on OTC derivatives is generally the aggregate unrealized gain netted against any collateral pledged by/posted to the counterparty. Counterparty risk related to exchange-traded financial futures contracts and options and centrally cleared swaps is deemed to be minimal due to the protection against defaults provided by the exchange on which these contracts trade.
The Funds may mitigate counterparty risk by procuring collateral and through netting provisions included within an International Swaps and Derivatives Association, Inc. master agreement (“ISDA Master Agreement”) implemented between a Fund and each of its respective counterparties. An ISDA Master Agreement allows each Fund to offset with each separate counterparty certain derivative financial instrument’s payables and/or receivables with collateral held. The amount of collateral moved to/from applicable counterparties is generally based upon minimum transfer amounts of up to $500,000. To the extent amounts due to the Funds from their counterparties are not fully collateralized, contractually or otherwise, the Funds bear the risk of loss from counterparty non-performance. See Note 1 “Segregation and Collateralization” for information with respect to collateral practices. In addition, the Funds manage counterparty risk by entering into agreements only with counterparties that it believes have the financial resources to honor their obligations and by monitoring the financial stability of those counterparties.
Certain ISDA Master Agreements allow counterparties to OTC derivatives to terminate derivative contracts prior to maturity in the event the Funds’ net assets decline by a stated percentage or the Funds fail to meet the terms of their ISDA Master Agreements, which would cause the Funds to accelerate payment of any net liability owed to the counterparty.
Financial Futures Contracts: The Funds purchase or sell financial futures contracts and options on financial futures contracts to gain exposure to, or economically hedge against, changes in interest rates (interest rate risk), changes in the value of equity securities (equity risk) or foreign currencies (foreign currency exchange rate risk). Financial futures contracts are agreements between the Funds and counterparty to buy or sell a specific quantity of an underlying instrument at a specified price and at a specified date. Depending on the terms of the particular contract, financial futures contracts are settled either through physical delivery of the underlying instrument on the settlement date or by payment of a cash settlement amount on the settlement date. Pursuant to the contract, the Funds agree to receive from or pay to the broker an amount of cash equal to the daily fluctuation in value of the contract. Such receipts or payments are known as variation margin and are recorded by the Funds as unrealized appreciation or depreciation. When the contract is closed, the Funds record a realized gain or loss equal to the difference between the value of the contract at the time it was opened and the value at the time it was closed. The use of financial futures contracts involves the risk of an imperfect correlation in the movements in the price of financial futures contracts, interest or foreign currency exchange rates and the underlying assets.
Foreign Currency Exchange Contracts: The Funds enter into foreign currency exchange contracts as an economic hedge against either specific transactions or portfolio instruments or to obtain exposure to foreign currencies (foreign currency exchange rate risk). A foreign currency exchange contract is an agreement between two parties to buy and sell a currency at a set exchange rate on a future date. Foreign currency exchange contracts, when used by the Funds, help to manage the overall exposure to the currencies in which some of the investments held by the Funds are denominated. The contract is marked-to-market daily and the change in market value is recorded by the Funds as an unrealized gain or loss. When the contract is closed, the Funds record a realized gain or loss equal to the difference between the value at the time it was opened and the value at the time it was closed. The use of foreign currency exchange contracts involves the risk that the value of a foreign currency exchange contract changes unfavorably due to movements in the value of the referenced foreign currencies and the risk that the counterparty to the contract does not perform its obligations under the agreement.
Swaps: Certain Funds enter into swap agreements, in which the Funds and a counterparty agree to either make periodic net payments on a specified notional amount or a net payment upon termination. Swap agreements are privately negotiated in the OTC market and may be executed on a registered financial and commodities exchange (“centrally cleared swaps”). In a centrally cleared swap, the Funds typically enter into an agreement with a counterparty; however, performance is guaranteed by the central clearinghouse reducing or eliminating the Funds’ exposure to the credit risk of the counterparty. These payments received or made by the Funds are recorded in the Statements of Operations as realized gains
| FDP SERIES, INC. | NOVEMBER 30, 2012 | 59 |
Notes to Financial Statements (continued)
or losses, respectively. Any upfront fees paid are recorded as assets and any upfront fees received are recorded as liabilities and are shown as swap premiums paid and swap premiums received, respectively in the Statements of Assets and Liabilities and amortized over the term of the swap. Swaps are marked-to-market daily and changes in value are recorded as unrealized appreciation (depreciation). The daily change in valuation of centrally cleared swaps, if any, is recorded as a receivable or payable for variation margin in the Statements of Assets and Liabilities. When the swap is terminated, the Funds will record a realized gain or loss equal to the difference between the proceeds from (or cost of) the closing transaction and the Funds’ basis in the contract, if any. Generally, the basis of the contracts is the premium received or paid. Swap transactions involve, to varying degrees, elements of interest rate, credit and market risk in excess of the amounts recognized in the Statements of Assets and Liabilities. Such risks involve the possibility that there will be no liquid market for these agreements, that the counterparty to the agreements may default on its obligation to perform or disagree as to the meaning of the contractual terms in the agreements, and that there may be unfavorable changes in interest rates and/or market values associated with these transactions.
| • | | Credit default swaps — Certain Funds enter into credit default swaps to manage their exposure to the market or certain sectors of the market, to reduce their risk exposure to defaults of corporate and/or sovereign issuers or to create exposure to corporate and/or sovereign issuers to which they are not otherwise exposed (credit risk). The Funds may either buy or sell (write) credit default swaps on single-name issuers (corporate or sovereign), a combination or basket of single-name issuers or traded indexes. Credit default swaps on single-name issuers are agreements in which the protection buyer pays fixed periodic payments to the protection seller in consideration for a guarantee from the protection seller to make a specific payment should a negative credit event take place with respect to the referenced entity (e.g., bankruptcy, failure to pay, obligation accelerators, repudiation, moratorium or restructuring). Credit default swaps on traded indexes are agreements in which the buyer pays fixed periodic payments to the seller in consideration for a guarantee from the seller to make a specific payment should a write-down, principal or interest shortfall or default of all or individual underlying securities included in the index occurs. As a buyer, if an underlying credit event occurs, the Funds will either receive from the seller an amount equal to the notional amount of the swap and deliver the referenced security or underlying securities comprising the index or receive a net settlement of cash equal to the notional amount of the swap less the recovery value of the security or underlying securities comprising the index. As a seller (writer), if an underlying credit event occurs, the Funds will either pay the buyer an amount equal to the notional amount of the swap and take delivery of the referenced security or underlying securities comprising the index or pay a net settlement of cash equal to the notional amount of the swap less the recovery value of the security or underlying securities comprising the index. |
Derivative Financial Instruments Categorized by Risk Exposure:
Fair Values of Derivative Financial Instruments as of November 30, 2012
Asset Derivatives
| | Statements of Assets and Liabilities Location | MFS Fund | Invesco
Fund | Franklin
Templeton
Fund |
| Interest rate contracts | Net unrealized appreciation1 | | — | | — | $ | 983 |
| Foreign currency exchange contracts | Unrealized appreciation on foreign currency exchange contracts | $ | 111 | $ | 2,222 | | 129,624 |
| Credit contracts | Unrealized appreciation on swaps1; Swap premiums paid | | — | | — | | 73,733 |
| Total | | $ | 111 | $ | 2,222 | $ | 204,340 |
Liability Derivatives
| | Statements of Assets and Liabilities Location | MFS Fund | Invesco
Fund | Franklin
Templeton
Fund |
| Foreign currency exchange contracts | Unrealized depreciation on foreign currency exchange contracts | $ | 87 | $ | 39,627 | $ | 372,170 |
| Credit contracts | Unrealized depreciation on swaps1; Swap premiums received | | — | | — | | 70,500 |
| Total | | $ | 87 | $ | 39,627 | $ | 442,670 |
| 1 | | Includes cumulative appreciation/depreciation on financial futures contracts as reported in the Schedules of Investments. Only current day’s variation margin is reported within the Statements of Assets and Liabilities. |
| 60 | FDP SERIES, INC. | NOVEMBER 30, 2012 |
Notes to Financial Statements (continued)
The Effect of Derivative Financial Instruments in the Statements of Operations
Six Months Ended November 30, 2012
| | Net Realized Gain (Loss) From |
| | MFS
Fund | Marsico
Fund | Invesco
Fund | Franklin
Templeton
Fund |
| Interest rate contracts: | | | | | | | | | | |
| Financial futures contracts | | — | | — | | | — | | $ | 1,487 |
| Foreign currency exchange contracts: | | | | | | | | | | |
| Foreign currency transactions | $ | 13,691 | $ | (16 | ) | $ | (178,812 | ) | | 1,030,672 |
| Credit contracts: | | | | | | | | | | |
| Swaps | | — | | — | | | — | | | 94,433 |
| Total | $ | 13,691 | $ | (16 | ) | $ | (178,812 | ) | $ | 1,126,592 |
| | Net Change in Unrealized
Appreciation/Depreciation on |
| |
| | MFS Fund | Invesco
Fund | Franklin
Templeton
Fund |
| Interest rate contracts: | | | | | | | | | |
| Financial futures contracts | | — | | | — | | $ | (1,090 | ) |
| Foreign currency exchange contracts: | | | | | | | | | |
| Foreign currency translations | $ | (80 | ) | $ | (37,405 | ) | | (1,160,121 | ) |
| Credit contracts: | | | | | | | | | |
| Swaps | | — | | | — | | | 91,126 | |
| Total | $ | (80 | ) | $ | (37,405 | ) | $ | (1,070,085 | ) |
For the six months ended November 30, 2012, the average quarterly balances of outstanding derivative financial instruments were as follows:
| | MFS
Fund | Marsico
Fund | Invesco Fund | Franklin
Templeton
Fund |
| Financial futures contracts: | | | | | | | | |
| Average number of contracts purchased | | — | | — | | — | | 14 |
| Average notional value of contracts purchased | | — | | — | | — | $ | 3,087,281 |
| Foreign currency exchange contracts: | | | | | | | | |
| Average number of contracts — US dollars purchased | | 15 | | 1 | | 6 | | 46 |
| Average number of contracts — US dollars sold | | 1 | | — | | 2 | | 35 |
| Average US dollar amounts purchased | $ | 747,553 | $ | 22,574 | $ | 5,026,187 | $ | 10,938,051 |
| Average US dollar amounts sold | $ | 4,865 | | — | $ | 241,858 | $ | 6,802,494 |
| Credit default swaps: | | | | | | | | |
| Average number of contracts — buy protection | | — | | — | | — | | 4 |
| Average number of contracts — sell protection | | — | | — | | — | | 7 |
| Average notional value — buy protection | | — | | — | | — | $ | 2,225,000 |
| Average notional value — sell protection | | — | | — | | — | $ | 5,370,000 |
3. Investments Advisory Agreement and Other Transactions with Affiliates:
The PNC Financial Services Group, Inc. (“PNC”) is the largest stockholder and an affiliate, for 1940 Act purposes, of BlackRock, Inc. (“BlackRock”).
The Corporation, on behalf of the Funds, entered into an Investment Advisory Agreement with BlackRock Advisors, LLC (the “Manager”), the Funds’ investment advisor, an indirect, wholly owned subsidiary of BlackRock, to provide investment advisory and administration services. The Manager is responsible for the management of each Fund’s portfolio and provides the necessary personnel, facilities, equipment and certain other services necessary to the operations of each Fund.
For such services, each Fund pays the Manager a monthly fee based on a percentage of each Fund’s average daily net assets at the following annual rates:
| | MFS
Fund | Marsico
Fund | Invesco
Fund | Franklin
Templeton
Fund |
| First $1 Billion | 0.90 | % | 0.80 | % | 0.70 | % | 0.40 | % |
| $1 Billion — $3 Billion | 0.85 | % | 0.75 | % | 0.66 | % | 0.38 | % |
| $3 Billion — $5 Billion | 0.81 | % | 0.72 | % | 0.63 | % | 0.36 | % |
| $5 Billion — $10 Billion | 0.78 | % | 0.70 | % | 0.61 | % | 0.35 | % |
| Greater than $10 Billion | 0.77 | % | 0.68 | % | 0.60 | % | 0.34 | % |
| FDP SERIES, INC. | NOVEMBER 30, 2012 | 61 |
Notes to Financial Statements (continued)
The Manager entered into a sub-advisory agreement with respect to each Fund. Pursuant to the sub-advisory agreements, the Manager pays each sub-advisor for services they provide, a monthly fee that is a percentage of the Manager’s investment advisory fee at the following annual rates, based on each Fund’s average daily net assets:
| | Sub-Advisor | Sub-Advisory
Fee |
| MFS Fund | Massachusetts Financial Services Company | 0.45 | % |
| Marsico Fund | Marsico Capital Management, LLC | 0.40 | % |
| Invesco Fund | Invesco Advisers, Inc. | 0.35 | % |
| Franklin Templeton Fund | Franklin Advisers, Inc. | 0.25 | % |
For the six months ended November 30, 2012, the Funds reimbursed the Manager for certain accounting services, which is included in accounting services in the Statements of Operations. The reimbursements were as follows:
| | |
| MFS Fund | $ | 730 |
| Marsico Fund | $ | 549 |
| Invesco Fund | $ | 549 |
| Franklin Templeton Fund | $ | 915 |
The Corporation, on behalf of the Funds, entered into a Distribution Agreement and Distribution and Service Plan with BlackRock Investments, LLC (“BRIL”), an affiliate of the Manager. Pursuant to the Distribution and Service Plan and in accordance with Rule 12b-1 under the 1940 Act, each Fund pays BRIL ongoing service and distribution fees. The fees are accrued daily and paid monthly at annual rates based upon the average daily net assets of the shares of each Fund as follows:
| Service Fees | MFS
Fund | Marsico
Fund | Invesco
Fund | Franklin
Templeton
Fund |
| Investor A Shares | 0.25 | % | 0.25 | % | 0.25 | % | 0.25 | % |
| Investor B Shares | 0.25 | % | 0.25 | % | 0.25 | % | 0.25 | % |
| Investor C Shares | 0.25 | % | 0.25 | % | 0.25 | % | 0.25 | % |
| Distribution Fees | | | | | | | | |
| Investor B Shares | 0.75 | % | 0.75 | % | 0.75 | % | 0.50 | % |
| Investor C Shares | 0.75 | % | 0.75 | % | 0.75 | % | 0.55 | % |
Pursuant to sub-agreements with BRIL, broker-dealers and BRIL provide shareholder servicing and distribution services to each Fund. The ongoing service and/or distribution fee compensates BRIL and each broker-dealer for providing shareholder servicing and/or distribution related services to Investor A, Investor B and Investor C shareholders.
Effective June 1, 2012, the Manager has agreed to voluntarily waive, as a percentage of average daily net assets, 0.05% of its management fee payable by Marsico Fund. This voluntary waiver may be reduced or discontinued at any time without notice. For the six months ended November 30, 2012, the Manager waived $26,501, which is included in fees waived by Manager in the Statements of Operations.
The Manager voluntarily agreed to waive and/or reimburse fees or expenses, excluding interest expense, dividend expense, acquired fund fees and expenses and certain other fund expenses, which constitute extraordinary expenses not incurred in the ordinary course of the Funds’ business, in order to limit expenses. The expense limitation as a percentage of average daily net assets is as follows:
| | MFS
Fund | Marsico
Fund | Invesco
Fund | Franklin
Templeton
Fund |
| Institutional Shares | 1.95 | % | 1.95 | % | 1.95 | % | 1.95 | % |
| Investor A Shares | 2.20 | % | 2.20 | % | 2.20 | % | 2.20 | % |
| Investor B Shares | 2.95 | % | 2.95 | % | 2.95 | % | 2.70 | % |
| Investor C Shares | 2.95 | % | 2.95 | % | 2.95 | % | 2.75 | % |
The Manager may reduce or discontinue these arrangements at any time without notice. The Manager did not waive or reimburse any fees or expenses under these arrangements during the six months ended November 30, 2012.
For the six months ended November 30, 2012, affiliates earned underwriting discounts, direct commissions and dealer concessions on sales of the Funds’ Investor A Shares as follows:
| | |
| | Investor A |
| MFS Fund | $ | 7,847 |
| Marsico Fund | $ | 7,364 |
| Invesco Fund | $ | 6,526 |
| Franklin Templeton Fund | $ | 13,851 |
For the six months ended November 30, 2012, affiliates received CDSCs as follows:
| | | | | | |
| | Investor A | Investor B | Investor C |
| MFS Fund | $ | 25 | $ | 359 | $ | 3,635 |
| Marsico Fund | $ | 24 | $ | 298 | $ | 2,635 |
| Invesco Fund | | — | $ | 255 | $ | 2,563 |
| Franklin Templeton Fund | | — | $ | 161 | $ | 4,386 |
Certain officers and/or directors of the Corporation are officers and/or directors of BlackRock or its affiliates. The Funds reimburse the Manager for a portion of the compensation paid to the Corporation’s Chief Compliance Officer.
4. Investments:
Purchases and sales of investments including paydowns, mortgage dollar roll and TBA transactions and excluding short-term securities and US government securities for the six months ended November 30, 2012, were as follows:
| | | | |
| | Purchases | Sales |
| MFS Fund | $ | 17,261,304 | $ | 19,680,146 |
| Marsico Fund | $ | 58,488,030 | $ | 64,688,851 |
| Invesco Fund | $ | 7,148,598 | $ | 12,470,369 |
| Franklin Templeton Fund | $ | 304,277,215 | $ | 312,411,436 |
Purchases and sales of US government securities for Franklin Templeton Fund for the six months ended November 30, 2012, were $13,741,877 and $8,359,409, respectively.
| 62 | FDP SERIES, INC. | NOVEMBER 30, 2012 |
Notes to Financial Statements (continued)
For the six months ended November 30, 2012, purchases and sales of mortgage dollar rolls for Franklin Templeton Fund were $162,431,660 and $162,634,467, respectively.
5. Income Tax Information:
As of May 31, 2012, the Funds had capital loss carryforwards available to offset future realized capital gains through the indicated expiration dates as follows:
| Expires May 31, | MFS Fund | Marsico
Fund | Invesco
Fund | Franklin
Templeton
Fund |
| 2017 | $ | 6,469,241 | $ | 5,492,661 | $ | 4,691,364 | $ | 354,555 |
| 2018 | | 30,473,505 | | 10,698,920 | | 25,222,993 | | 1,651,733 |
| 2019 | | — | | — | | — | | 1,056,763 |
| No expiration | | | | | | | | |
| date1 | | 415,841 | | — | | — | | — |
| Total | $ | 37,358,587 | $ | 16,191,581 | $ | 29,914,357 | $ | 3,063,051 |
| 1 | | Must be utilized prior to losses subject to expiration. |
As of November 30, 2012, gross unrealized appreciation and gross unrealized depreciation based on cost for federal income tax purposes were as follows:
| | MFS Fund | Marsico
Fund | Invesco
Fund | Franklin
Templeton
Fund |
| Tax cost | $ | 111,801,903 | | $ | 89,237,911 | | $ | 90,014,475 | | $ | 197,108,337 | |
| Gross unrealized | | | | | | | | | | | | |
| appreciation | $ | 23,227,083 | | $ | 20,394,014 | | $ | 22,916,206 | | $ | 9,775,952 | |
| Gross unrealized | | | | | | | | | | | | |
| depreciation | | (8,021,171 | ) | | (2,181,475 | ) | | (9,560,420 | ) | | (1,275,466 | ) |
| Net unrealized | | | | | | | | | | | | |
| appreciation | | | | | | | | | | | | |
| (depreciation) | $ | 15,205,912 | | $ | 18,212,539 | | $ | 13,355,786 | | $ | 8,500,486 | |
6. Borrowings:
The Corporation, on behalf of the Funds, along with certain other funds managed by the Manager and its affiliates, is a party to a $500 million credit agreement with a group of lenders. The Funds may borrow under the credit agreement to fund shareholder redemptions. Effective November 2011 to November 2012, the credit agreement had the following terms: a commitment fee of 0.065% per annum based on the Funds’ pro rata share of the unused portion of the credit agreement and interest at a rate equal to the higher of (a) the one-month London Interbank Offered Rate (“LIBOR”) plus 0.80% per annum or (b) the Fed Funds rate plus 0.80% per annum on amounts borrowed. In addition, the Funds paid administration and arrangement fees which were allocated to the Funds based on their net assets as of October 31, 2011. The credit agreement, which expired in November 2012, was renewed with the same terms until November 2013. Effective November 2012 to November 2013, the credit agreement has the following terms: a commitment fee of 0.065% per annum based on the Funds’ pro rata share of the unused portion of the credit agreement and interest at a rate equal to the higher of (a) the one-month LIBOR plus 0.80% per annum or (b) the Fed Funds rate plus 0.80% per annum on amounts borrowed. In addition, the Funds paid administration and arrangement fees which were allocated to the Funds based on their net assets as of October 31, 2012. The Funds did not borrow under the credit agreement during the six months ended November 30, 2012.
7. Commitments:
Franklin Templeton Fund may invest in floating rate loan interests. In connection with these investments, the Fund may also enter into unfunded floating rate loan interests. In connection with these commitments, the Fund earns a commitment fee, typically set as a percentage of the commitment amount. Such fee income, which is included in interest income in the Statements of Operations, is recognized ratably over the commitment period. Commitment fees received in advance and unrecognized are recorded in the Statements of Assets and Liabilities as deferred income. Unfunded floating rate loan interests are marked-to-market daily, and any unrealized appreciation or depreciation is included in the Statements of Assets and Liabilities and Statements of Operations. As of November 30, 2012, the Fund had no outstanding unfunded floating rate loan interests.
8. Concentration, Market and Credit Risk:
In the normal course of business, the Funds invest in securities and enter into transactions where risks exist due to fluctuations in the market (market risk) or failure of the issuer of a security to meet all its obligations (issuer credit risk). The value of securities held by the Funds may decline in response to certain events, including those directly involving the issuers whose securities are owned by the Funds; conditions affecting the general economy; overall market changes; local, regional or global political, social or economic instability; and currency and interest rate and price fluctuations. Similar to issuer credit risk, the Funds may be exposed to counterparty credit risk, or the risk that an entity with which the Funds have unsettled or open transactions may fail to or be unable to perform on its commitments. The Funds manage counterparty credit risk by entering into transactions only with counterparties that they believe have the financial resources to honor their obligations and by monitoring the financial stability of those counterparties. Financial assets, which potentially expose the Funds to market, issuer and counterparty credit risks, consist principally of financial instruments and receivables due from counterparties. The extent of the Funds’ exposure to market, issuer and counterparty credit risks with respect to these financial assets is generally approximated by their value recorded in the Statements of Assets and Liabilities, less any collateral held by the Funds.
MFS Fund invests a substantial amount of its assets in issuers located in a single country or a limited number of countries. When the Fund concentrates its investments in this manner, it assumes the risk that economic, political and social conditions in those countries may have a significant impact on their investment performance. Foreign issuers may not be subject to the same uniform accounting, auditing and financial reporting standards and practices as used in the US. Foreign securities markets may also be less liquid, more volatile, and less subject to governmental supervision not typically associated with investing in US securities. Please see the Schedule of Investments for concentrations in specific countries.
MFS Fund invests a significant portion of its assets in securities of issuers located in Europe or with significant exposure to European issuers or countries. The European financial markets have recently experienced volatility and adverse trends due to concerns about economic downturns in, or rising government debt levels of several European countries,
| FDP SERIES, INC. | NOVEMBER 30, 2012 | 63 |
Notes to Financial Statements (continued)
including Greece, Ireland, Italy, Portugal and Spain. As of November 30, 2012, these events have adversely affected the exchange rate of the euro and may continue to spread to other countries in Europe, including countries that do not use the euro. These events may affect the value and liquidity of certain of the Fund’s investments.
As of November 30, 2012, MFS Fund and Invesco Fund invested a significant portion of their assets in securities in the financials sector and Marsico Fund invested a significant portion of its assets in securities in the consumer discretionary sector. Changes in economic conditions affecting the financials and consumer discretionary sectors would have a greater impact on the Funds and could affect the value, income and/or liquidity of positions in such securities.
As of November 30, 2012, MFS Fund had the following industry classifications:
| | |
| Industry | Percent of
Long-Term
Investments |
| Commercial Banks | 17 | % |
| Pharmaceuticals | 9 | % |
| Oil, Gas and Consumable Fuels | 8 | % |
| Food Products | 5 | % |
| Other1 | 61 | % |
| 1 | | All other industries held were each less than 5% of long-term investments. |
Franklin Templeton Fund invests a significant portion of its assets in securities backed by commercial or residential mortgage loans or in issuers that hold mortgage and other asset-backed securities. Please see the Schedule of Investments for these securities. Changes in economic conditions, including delinquencies and/or defaults on assets underlying these securities, can affect the value, income and/or liquidity of such positions.
9. Capital Share Transactions:
Transactions in capital shares for each class were as follows:
| | | | | | | | | | | |
| | Six Months Ended
November 30, 2012 | | Year Ended
May 31, 2012 |
| MFS Fund | Shares | Amount | | Shares | Amount |
| Institutional | | | | | | | | | | | |
| Shares sold | 42,155 | | $ | 429,238 | | | 163,110 | | $ | 1,705,745 | |
| Shares issued to shareholders in reinvestment of dividends | 5,718 | | | 56,953 | | | 4,217 | | | 49,006 | |
| Shares redeemed | (44,113 | ) | | (449,952 | ) | | (85,573 | ) | | (912,261 | ) |
| Net increase | 3,760 | | $ | 36,239 | | | 81,754 | | $ | 842,490 | |
| |
| Investor A | | | | | | | | | | | |
| Shares sold and automatic conversion of shares | 607,771 | | $ | 6,131,358 | | | 1,499,840 | | $ | 15,557,609 | |
| Shares issued to shareholders in reinvestment of dividends | 43,076 | | | 427,322 | | | 29,137 | | | 337,688 | |
| Shares redeemed | (395,208 | ) | | (4,049,103 | ) | | (797,839 | ) | | (8,344,100 | ) |
| Net increase | 255,639 | | $ | 2,509,577 | | | 731,138 | | $ | 7,551,197 | |
| |
| Investor B | | | | | | | | | | | |
| Shares sold | 4,319 | | $ | 43,952 | | | 47,399 | | $ | 503,633 | |
| Shares issued to shareholders in reinvestment of dividends | 353 | | | 3,525 | | | 302 | | | 3,516 | |
| Shares redeemed and automatic conversion of shares | (26,473 | ) | | (269,057 | ) | | (55,535 | ) | | (573,578 | ) |
| Net decrease | (21,801 | ) | $ | (221,580 | ) | | (7,834 | ) | $ | (66,429 | ) |
| |
| Investor C | | | | | | | | | | | |
| Shares sold | 637,015 | | $ | 6,373,588 | | | 2,451,262 | | $ | 25,142,194 | |
| Shares issued to shareholders in reinvestment of dividends | 49,447 | | | 488,075 | | | 36,313 | | | 418,325 | |
| Shares redeemed | (1,120,953 | ) | | (11,325,516 | ) | | (2,995,253 | ) | (30,954,708 | ) |
| Net decrease | (434,491 | ) | $ | (4,463,853 | ) | | (507,678 | ) | $ | (5,394,189 | ) |
| Total Net Increase (Decrease) | (196,893 | ) | $ | (2,139,617 | ) | | 297,380 | | $ | 2,933,069 | |
| 64 | FDP SERIES, INC. | NOVEMBER 30, 2012 |
Notes to Financial Statements (continued)
| | Six Months Ended
November 30, 2012 | | Year Ended
May 31, 2012 |
| Marsico Fund | Shares | Amount | | Shares | Amount |
| Institutional | | | | | | | | | | | |
| Shares sold | 31,797 | | $ | 410,690 | | | 106,296 | | $ | 1,300,828 | |
| Shares redeemed | (30,761 | ) | | (396,800 | ) | | (77,079 | ) | | (954,975 | ) |
| Net increase | 1,036 | | $ | 13,890 | | | 29,217 | | $ | 345,853 | |
| |
| Investor A | | | | | | | | | | | |
| Shares sold and automatic conversion of shares | 421,268 | | $ | 5,348,166 | | | 954,019 | | $ | 11,471,763 | |
| Shares redeemed | (237,721 | ) | | (3,024,217 | ) | | (676,506 | ) | | (8,160,472 | ) |
| Net increase | 183,547 | | $ | 2,323,949 | | | 277,513 | | $ | 3,311,291 | |
| |
| Investor B | | | | | | | | | | | |
| Shares sold | 3,463 | | $ | 41,195 | | | 29,572 | | $ | 332,376 | |
| Shares redeemed and automatic conversion of shares | (20,534 | ) | | (246,375 | ) | | (53,422 | ) | | (609,466 | ) |
| Net decrease | (17,071 | ) | $ | (205,180 | ) | | (23,850 | ) | $ | (277,090 | ) |
| |
| Investor C | | | | | | | | | | | |
| Shares sold | 404,790 | | $ | 4,868,005 | | | 1,417,415 | | $ | 16,082,169 | |
| Shares redeemed | (788,042 | ) | | (9,471,023 | ) | | (2,611,707 | ) | (29,909,335 | ) |
| Net decrease | (383,252 | ) | $ | (4,603,018 | ) | | (1,194,292 | ) | $ | (13,827,166 | ) |
| Total Net Decrease | (215,740 | ) | $ | (2,470,359 | ) | | (911,412 | ) | $ | (10,447,112 | ) |
| |
| Invesco Fund | | | | | | | | | | | |
| Institutional | | | | | | | | | | | |
| Shares sold | 22,491 | | $ | 241,961 | | | 121,016 | | $ | 1,206,940 | |
| Shares issued to shareholders in reinvestment of dividends | 1,548 | | | 16,181 | | | 3,758 | | | 37,652 | |
| Shares redeemed | (39,455 | ) | | (420,392 | ) | | (90,788 | ) | | (917,016 | ) |
| Net increase (decrease) | (15,416 | ) | $ | (162,250 | ) | | 33,986 | | $ | 327,576 | |
| |
| Investor A | | | | | | | | | | | |
| Shares sold and automatic conversion of shares | 411,888 | | | 4,371,441 | | | 1,108,001 | | $ | 10,902,906 | |
| Shares issued to shareholders in reinvestment of dividends | 10,871 | | | 112,739 | | | 24,443 | | | 243,476 | |
| Shares redeemed | (328,970 | ) | | (3,520,189 | ) | | (740,078 | ) | | (7,283,445 | ) |
| Net increase | 93,789 | | $ | 963,991 | | | 392,366 | | $ | 3,862,937 | |
| |
| Investor B | | | | | | | | | | | |
| Shares sold | 2,065 | | $ | 21,589 | | | 36,381 | | $ | 352,225 | |
| Shares issued to shareholders in reinvestment of dividends | 56 | | | 583 | | | 294 | | | 2,931 | |
| Shares redeemed and automatic conversion of shares | (23,174 | ) | | (243,873 | ) | | (63,516 | ) | | (619,631 | ) |
| Net decrease | (21,053 | ) | $ | (221,701 | ) | | (26,841 | ) | $ | (264,475 | ) |
| |
| Investor C | | | | | | | | | | | |
| Shares sold | 345,185 | | $ | 3,629,516 | | | 1,529,343 | | $ | 14,736,547 | |
| Shares issued to shareholders in reinvestment of dividends | 9,480 | | | 97,362 | | | 27,673 | | | 272,789 | |
| Shares redeemed | (907,892 | ) | | (9,540,953 | ) | | (2,805,536 | ) | (27,259,016 | ) |
| Net decrease | (553,227 | ) | $ | (5,814,075 | ) | | (1,248,520 | ) | $ | (12,249,680 | ) |
| Total Net Decrease | (495,907 | ) | $ | (5,234,035 | ) | | (849,009 | ) | $ | (8,323,642 | ) |
| FDP SERIES, INC. | NOVEMBER 30, 2012 | 65 |
Notes to Financial Statements (concluded)
| | Six Months Ended
November 30, 2012 | | Year Ended
May 31, 2012 |
| Franklin Templeton Fund | Shares | Amount | | Shares | Amount |
| Institutional | | | | | | | | | | | |
| Shares sold | 51,313 | | $ | 555,583 | | | 181,207 | | $ | 1,898,029 | |
| Shares issued to shareholders in reinvestment of dividends | 5,149 | | | 55,848 | | | 10,359 | | | 108,529 | |
| Shares redeemed | (45,357 | ) | | (488,748 | ) | | (115,991 | ) | | (1,214,150 | ) |
| Net increase | 11,103 | | $ | 122,683 | | | 75,575 | | $ | 792,408 | |
| |
| Investor A | | | | | | | | | | | |
| Shares sold and automatic conversion of shares | 850,992 | | $ | 9,197,817 | | | 2,140,551 | | $ | 22,430,313 | |
| Shares issued to shareholders in reinvestment of dividends | 49,290 | | | 535,036 | | | 90,657 | | | 950,251 | |
| Shares redeemed | (530,871 | ) | | (5,728,792 | ) | | (1,312,331 | ) | (13,708,020 | ) |
| Net increase | 369,411 | | $ | 4,004,061 | | | 918,877 | | $ | 9,672,544 | |
| |
| Investor B | | | | | | | | | | | |
| Shares sold | 2,596 | | $ | 28,224 | | | 78,015 | | $ | 815,367 | |
| Shares issued to shareholders in reinvestment of dividends | 863 | | | 9,357 | | | 2,777 | | | 29,082 | |
| Shares redeemed and automatic conversion of shares | (29,230 | ) | | (315,555 | ) | | (96,553 | ) | | (1,011,246 | ) |
| Net decrease | (25,771 | ) | $ | (277,974 | ) | | (15,761 | ) | $ | (166,797 | ) |
| |
| Investor C | | | | | | | | | | | |
| Shares sold | 810,196 | | $ | 8,772,019 | | | 2,510,461 | | $ | 26,294,388 | |
| Shares issued to shareholders in reinvestment of dividends | 84,403 | | | 915,688 | | | 215,015 | | | 2,252,056 | |
| Shares redeemed | (1,393,278 | ) | | (15,022,841 | ) | | (4,480,290 | ) | (46,823,624 | ) |
| Net decrease | (498,679 | ) | $ | (5,335,134 | ) | | (1,754,814 | ) | $ | (18,277,180 | ) |
| Total Net Decrease | (143,934 | ) | $ | (1,486,364 | ) | | (776,123 | ) | $ | (7,979,025 | ) |
10. Subsequent Events:
Management’s evaluation of the impact of all subsequent events on the Funds’ financial statements was completed through the date the financial statements were issued and the following items were noted:
Invesco Fund paid a net investment income dividend in the following amounts per share on December 7, 2012, to shareholders of record on December 5, 2012:
| | |
| Invesco Fund | Dividend
Per Share |
| Institutional | $ | 0.071375 |
| Investor A | $ | 0.056523 |
| Investor B | $ | 0.000272 |
| Investor C | $ | 0.006423 |
| 66 | FDP SERIES, INC. | NOVEMBER 30, 2012 |
Officers and Directors
Robert M. Hernandez, Chairman of the Board and Director
Fred G. Weiss, Vice Chairman of the Board and Director
Paul L. Audet, Director
James H. Bodurtha, Director
Bruce R. Bond, Director
Donald W. Burton, Director
Honorable Stuart E. Eizenstat, Director
Laurence D. Fink, Director
Kenneth A. Froot, Director
Henry Gabbay, Director
John F. O’Brien, Director
Roberta Cooper Ramo, Director
David H. Walsh, Director
John M. Perlowski, President and Chief Executive Officer
Brendan Kyne, Vice President
Neal Andrews, Chief Financial Officer
Jay Fife, Treasurer
Brian Kindelan, Chief Compliance Officer and
Anti-Money Laundering Officer
Benjamin Archibald, Secretary | Investment Advisor
BlackRock Advisors, LLC
Wilmington, DE 19809 Sub-Advisors
Massachusetts Financial Services Company
Boston, MA 02116 Marsico Capital Management, LLC
Denver, CO 80202 Invesco Advisers, Inc.
Atlanta, GA 30309 Franklin Advisers, Inc.
San Mateo, CA 94403 Custodian
Brown Brothers Harriman & Co.
Boston, MA 02109 Transfer Agent
BNY Mellon Investment Servicing (US) Inc.
Wilmington, DE 19809 Accounting Agent
State Street Bank and Trust Company
Boston, MA 02110 Distributor
BlackRock Investments, LLC
New York, NY 10022 Independent Registered Public Accounting Firm
Deloitte & Touche LLP
Boston, MA 02116 Legal Counsel
Willkie Farr & Gallagher LLP
New York, NY 10019 Address of the Funds
100 Bellevue Parkway
Wilmington, DE 19809 |
| FDP SERIES, INC. | NOVEMBER 30, 2012 | 67 |
Additional Information
General Information
Electronic Delivery
Electronic copies of most financial reports and prospectuses are available on the Funds’ websites or shareholders can sign up for e-mail notifications of quarterly statements, annual and semi-annual reports and prospectuses by enrolling in the Funds’ electronic delivery program.
To enroll:
Shareholders Who Hold Accounts with Investment Advisors, Banks or Brokerages:
Please contact your financial advisor. Please note that not all investment advisors, banks or brokerages may offer this service.
Shareholders Who Hold Accounts Directly with BlackRock:
| 1) | | Access the BlackRock website at
http://www.blackrock.com/edelivery |
| 2) | | Select “eDelivery” under the “More Information” section |
Householding
The Funds will mail only one copy of shareholder documents, including prospectuses, annual and semi-annual reports and proxy statements, to shareholders with multiple accounts at the same address. This practice is commonly called “householding” and is intended to reduce expenses and eliminate duplicate mailings of shareholder documents. Mailings of your shareholder documents may be householded indefinitely unless you instruct us otherwise. If you do not want the mailing of these documents to be combined with those for other members of your household, please call the Funds at (800) 441-7762.
Availability of Quarterly Schedule of Investments
The Funds file their complete schedule of portfolio holdings with the SEC for the first and third quarters of each fiscal year on Form N-Q. The Funds’ Forms N-Q are available on the SEC’s website at http://www.sec.gov and may also be reviewed and copied at the SEC’s Public Reference Room in Washington, DC. Information on how to access documents on the SEC’s website without charge may be obtained by calling (800) SEC-0330. The Funds’ Forms N-Q may also be obtained upon request and without charge by calling (800) 441-7762.
Availability of Proxy Voting Policies and Procedures
A description of the policies and procedures that the Funds use to determine how to vote proxies relating to portfolio securities is available (1) without charge, upon request, by calling (800) 441-7762; (2) at http://www.blackrock.com; and (3) on the SEC’s website at http://www.sec.gov.
Availability of Proxy Voting Record
Information about how the Funds voted proxies relating to securities held in the Funds’ portfolios during the most recent 12-month period ended June 30 is available upon request and without charge (1) at http://www.blackrock.com or by calling (800) 441-7762 and (2) on the SEC’s website at http://www.sec.gov.
| 68 | FDP SERIES, INC. | NOVEMBER 30, 2012 |
Additional Information (concluded)
Shareholder Privileges
Account Information
Call us at (800) 441-7762 from 8:00 AM to 6:00 PM EST on any business day to get information about your account balances, recent transactions and share prices. You can also reach us on the Web at http://www.blackrock.com/funds.
Automatic Investment Plans
Investor Class shareholders who want to invest regularly can arrange to have $50 or more automatically deducted from their checking or savings account and invested in any of the BlackRock funds.
Systematic Withdrawal Plans
Investor Class shareholders can establish a systematic withdrawal plan and receive periodic payments of $50 or more from their BlackRock funds, as long as their account balance is at least $10,000.
Retirement Plans
Shareholders may make investments in conjunction with Traditional, Rollover, Roth, Coverdell, Simple IRAs, SEP IRAs and 403(b) Plans.
BlackRock Privacy Principles
BlackRock is committed to maintaining the privacy of its current and former fund investors and individual clients (collectively, “Clients”) and to safe-guarding their non-public personal information. The following information is provided to help you understand what personal information BlackRock collects, how we protect that information and why in certain cases we share such information with select parties.
If you are located in a jurisdiction where specific laws, rules or regulations require BlackRock to provide you with additional or different privacy-related rights beyond what is set forth below, then BlackRock will comply with those specific laws, rules or regulations.
BlackRock obtains or verifies personal non-public information from and about you from different sources, including the following: (i) information we receive from you or, if applicable, your financial intermediary, on applications, forms or other documents; (ii) information about your transactions with us, our affiliates, or others; (iii) information we receive from a consumer reporting agency; and (iv) from visits to our websites.
BlackRock does not sell or disclose to non-affiliated third parties any non-public personal information about its Clients, except as permitted by law or as is necessary to respond to regulatory requests or to service Client accounts. These non-affiliated third parties are required to protect the confidentiality and security of this information and to use it only for its intended purpose.
We may share information with our affiliates to service your account or to provide you with information about other BlackRock products or services that may be of interest to you. In addition, BlackRock restricts access to non-public personal information about its Clients to those BlackRock employees with a legitimate business need for the information. BlackRock maintains physical, electronic and procedural safeguards that are designed to protect the non-public personal information of its Clients, including procedures relating to the proper storage and disposal of such information.
| FDP SERIES, INC. | NOVEMBER 30, 2012 | 69 |
A World-Class Mutual Fund Family
BlackRock offers a diverse lineup of open-end mutual funds crossing all investment styles and managed by experts in equity, fixed income and tax-exempt investing.
Equity Funds
| | |
| BlackRock ACWI ex-US Index Fund | BlackRock Global Long/Short Equity Fund | BlackRock Mid Cap Value Opportunities Fund |
| BlackRock All-Cap Energy & Resources Portfolio | BlackRock Global Opportunities Portfolio | BlackRock Multi-Asset Real Return Fund† |
| BlackRock Balanced Capital Fund† | BlackRock Global SmallCap Fund | BlackRock Natural Resources Trust |
| BlackRock Basic Value Fund | BlackRock Health Sciences Opportunities Portfolio | BlackRock Pacific Fund |
| BlackRock Capital Appreciation Fund | BlackRock Index Equity Portfolio | BlackRock Real Estate Securities Fund |
| BlackRock China Fund | BlackRock India Fund | BlackRock Russell 1000 Index Fund |
| BlackRock Commodity Strategies Fund | BlackRock International Fund | BlackRock Science & Technology |
| BlackRock Emerging Markets Fund | BlackRock International Index Fund | Opportunities Portfolio |
| BlackRock Emerging Markets Long/Short | BlackRock International Opportunities Portfolio | BlackRock Small Cap Growth Equity Portfolio |
| Equity Fund | BlackRock Large Cap Core Fund | BlackRock Small Cap Growth Fund II |
| BlackRock Energy & Resources Portfolio | BlackRock Large Cap Core Plus Fund | BlackRock Small Cap Index Fund |
| BlackRock Equity Dividend Fund | BlackRock Large Cap Growth Fund | BlackRock S&P 500 Index Fund |
| BlackRock EuroFund | BlackRock Large Cap Value Fund | BlackRock S&P 500 Stock Fund |
| BlackRock Flexible Equity Fund | BlackRock Latin America Fund | BlackRock Strategic Risk Allocation Fund† |
| BlackRock Focus Growth Fund | BlackRock Long-Horizon Equity Fund | BlackRock U.S. Opportunities Portfolio |
| BlackRock Global Allocation Fund† | BlackRock Managed Volatility Portfolio† | BlackRock Value Opportunities Fund |
| BlackRock Global Dividend Income Portfolio | BlackRock Mid-Cap Growth Equity Portfolio | BlackRock World Gold Fund |
Taxable Fixed Income Funds
| | |
| BlackRock Bond Index Fund | BlackRock High Yield Bond Portfolio | BlackRock Strategic Income |
| BlackRock Core Bond Portfolio | BlackRock Inflation Protected Bond Portfolio | Opportunities Portfolio |
| BlackRock CoreAlpha Bond Fund | BlackRock International Bond Portfolio | BlackRock Total Return Fund |
| BlackRock Emerging Market Local Debt Portfolio | BlackRock Long Duration Bond Portfolio | BlackRock US Government Bond Portfolio |
| BlackRock Floating Rate Income Portfolio | BlackRock Low Duration Bond Portfolio | BlackRock US Mortgage Portfolio |
| BlackRock Global Long/Short Credit Fund | BlackRock Multi-Asset Income Portfolio† | BlackRock World Income Fund |
| BlackRock GNMA Portfolio | BlackRock Secured Credit Portfolio | |
Municipal Fixed Income Funds
| | |
| BlackRock California Municipal Bond Fund | BlackRock National Municipal Fund | BlackRock Pennsylvania Municipal Bond Fund |
| BlackRock High Yield Municipal Fund | BlackRock New Jersey Municipal Bond Fund | BlackRock Short-Term Municipal Fund |
| BlackRock Intermediate Municipal Fund | BlackRock New York Municipal Bond Fund | |
Target Risk & Target Date Funds
| | | | | | |
| BlackRock Prepared Portfolios | LifePath Active Portfolios | LifePath Portfolios | LifePath Index Portfolios |
| Conservative Prepared Portfolio | 2015 | 2035 | Retirement | 2040 | Retirement | 2040 |
| Moderate Prepared Portfolio | 2020 | 2040 | 2020 | 2045 | 2020 | 2045 |
| Growth Prepared Portfolio | 2025 | 2045 | 2025 | 2050 | 2025 | 2050 |
| Aggressive Growth Prepared Portfolio | 2030 | 2050 | 2030 | 2055 | 2030 | 2055 |
| | | | 2035 | | 2035 | |
BlackRock mutual funds are currently distributed by BlackRock Investments, LLC. You should consider the investment objectives, risks, charges and expenses of the funds under consideration carefully before investing. Each fund’s prospectus contains this and other information and is available at www.blackrock.com or by calling (800) 441-7762 or from your financial advisor. The prospectus should be read carefully before investing.
| 70 | FDP SERIES, INC. | NOVEMBER 30, 2012 |
This report is not authorized for use as an offer of sale or a solicitation of an offer to buy shares of the Funds unless accompanied or preceded by that Fund’s current prospectus. Past performance results shown in this report should not be considered a representation of future performance. Investment returns and principal value of shares will fluctuate so that shares, when redeemed, may be worth more or less than their original cost. Statements and other information herein are as dated and are subject to change. Please see the Funds’ prospectus for a description of risks associated with global investments.

#FDPS-11/12-SAR |  |
| Item 2 – | Code of Ethics – Not Applicable to this semi-annual report |
| Item 3 – | Audit Committee Financial Expert – Not Applicable to this semi-annual report |
| Item 4 – | Principal Accountant Fees and Services – Not Applicable to this semi-annual report |
| Item 5 – | Audit Committee of Listed Registrants – Not Applicable |
| Item 6 – | Investments |
| | (a) The registrant’s Schedule of Investments is included as part of the Report to Stockholders filed under Item 1 of this Form. |
| | (b) Not Applicable due to no such divestments during the semi-annual period covered since the previous Form N-CSR filing. |
| Item 7 – | Disclosure of Proxy Voting Policies and Procedures for Closed-End Management Investment Companies – Not Applicable |
| Item 8 – | Portfolio Managers of Closed-End Management Investment Companies – Not Applicable |
| Item 9 – | Purchases of Equity Securities by Closed-End Management Investment Company and Affiliated Purchasers – Not Applicable |
| Item 10 – | Submission of Matters to a Vote of Security Holders – There have been no material changes to these procedures. |
| Item 11 – | Controls and Procedures |
| | (a) – The registrant’s principal executive and principal financial officers, or persons performing similar functions, have concluded that the registrant’s disclosure controls and procedures (as defined in Rule 30a-3(c) under the Investment Company Act of 1940, as amended (the “1940 Act”)) are effective as of a date within 90 days of the filing of this report based on the evaluation of these controls and procedures required by Rule 30a-3(b) under the 1940 Act and Rule 15d-15(b) under the Securities Exchange Act of 1934, as amended. |
| | (b) – There were no changes in the registrant’s internal control over financial reporting (as defined in Rule 30a-3(d) under the 1940 Act) that occurred during the second fiscal quarter of the period covered by this report that have materially affected, or are reasonably likely to materially affect, the registrant’s internal control over financial reporting. |
| Item 12 – | Exhibits attached hereto |
| | (a)(1) – Code of Ethics – Not Applicable to this semi-annual report |
| | (a)(2) – Certifications – Attached hereto |
| | (a)(3) – Not Applicable |
| | (b) –Certifications – Attached hereto |
Pursuant to the requirements of the Securities Exchange Act of 1934 and the Investment Company Act of 1940, the registrant has duly caused this report to be signed on its behalf by the undersigned, thereunto duly authorized.
FDP Series, Inc.
By: /s/ John M. Perlowski
John M. Perlowski
Chief Executive Officer (principal executive officer) of
FDP Series, Inc.
Date: February 4, 2013
Pursuant to the requirements of the Securities Exchange Act of 1934 and the Investment Company Act of 1940, this report has been signed below by the following persons on behalf of the registrant and in the capacities and on the dates indicated.
By: /s/ John M. Perlowski
John M. Perlowski
Chief Executive Officer (principal executive officer) of
FDP Series, Inc.
Date: February 4, 2013
By: /s/ Neal J. Andrews
Neal J. Andrews
Chief Financial Officer (principal financial officer) of
FDP Series, Inc.
Date: February 4, 2013