UNITED STATES
SECURITIES AND EXCHANGE COMMISSION
Washington, D.C. 20549
FORM N-CSR
CERTIFIED SHAREHOLDER REPORT OF REGISTERED MANAGEMENT
INVESTMENT COMPANIES
Investment Company Act file number 811-21749
CRM Mutual Fund Trust
(Exact name of registrant as specified in charter)
c/o Cramer Rosenthal McGlynn, LLC.
28 Havemeyer Place
Greenwich, CT 06830
(Address of principal executive offices) (Zip code)
Corporation Service Company
2711 Centerville Road Suite 400
Wilmington, DE 19808
(Name and address of agent for service)
Copy to:
Lea Anne Copenhefer
Morgan, Lewis & Bockius LLP
One Federal Street
Boston, MA 02110
Registrant’s telephone number, including area code: 212-326-5300
Date of fiscal year end: June 30
Date of reporting period: December 31, 2022
Item 1. Reports to Stockholders.
The Report to Shareholders is attached herewith.
SEMI-ANNUAL REPORT
December 31, 2022 (Unaudited)
CRM Small Cap Value Fund
CRM Small/Mid Cap Value Fund
CRM Mid Cap Value Fund
CRM All Cap Value Fund
CRM Long/Short Opportunities Fund |

SEMI-ANNUAL REPORT (Unaudited) | December 31, 2022 |
President’s Message |
Dear Fellow Shareholders:
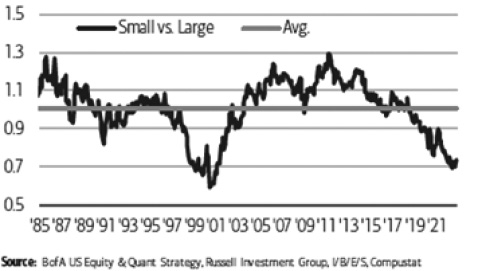
2022 was one of the worst years for the market over the last few decades. The market also ended on a weak note, selling-off in December after staging a rally earlier in the period. Last year was a normalization period for the market as fiscal and monetary accommodation was being removed from the system. Interestingly, the market correction was mainly driven by P/E multiple compression as the discount rate normalized due to the dramatic rise in interest rates. We still expect earnings to be reset lower for the market as demand normalizes and margins are pressured. This is the unpleasant part of a normal market cycle. But, as history has shown us, these market inflections tend to lead to regime changes and new leadership in the market. We see multiple reasons to be bullish on small to mid-cap stocks over the next few years which, by the way, is a part of the market that’s woefully underinvested versus history. This is an exciting time to be an active manager down cap.
Small caps trading at extreme discount vs large caps
only ever seen once before during the Tech Bubble
(Relative Forward P/E Russell 2000® vs. Russell 1000®, 1985-10/31/22)
We see multiple vectors of demand drivers for domestic small to mid-cap stocks. After enduring tariff wars between the U.S. and China, a global pandemic, and Russia’s war against Ukraine, CEOs are being forced to rethink their global
1 |
supply chains. Just-in-time manufacturing is being replaced with safety stock and re-shoring or near-shoring efforts. More focus is being placed on certainty of production and delivery than the lowest cost available. We believe this is a long-term positive for domestic oriented businesses. In addition, the U.S. government has also woken up to the fact they need to work in partnership with businesses to ensure the availability of strategically important products. Over the past 18 months, Congress has passed several important pieces of legislation to support this effort including the $1 trillion Infrastructure Investment and Jobs Act, the CHIPS and Science Act ($52 billion for domestic semiconductor manufacturing), and $740 billion Inflation Reduction Act ($369 billion allocated to clean energy funding). These bills should spur capital expenditures (“cap ex”) in the U.S., which is expected to provide a multi-year growth tail wind for domestic oriented businesses, which we believe will disproportionately benefit small and mid-cap stocks.
Small caps are particularly | Mentions of re-shoring on earnings calls have skyrocketed |
 | 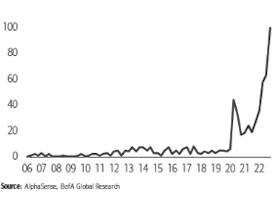 |
Inflation, although moderating from near term peak levels, remained higher than expected in 2022, which is highly constructive for small and mid-cap stocks. Goods inflation has led the recent declines in overall inflation as supply chains have been normalizing and consumer demand has shifted from goods to services. We still expect services inflation, the largest component of overall inflation, to remain sticky on the way down due to the robust labor market. Although recent indicators have pointed to a modest reduction in the labor costs (i.e., slower growth in December’s Average Hourly Earnings), the pandemic has likely resulted in a change in the percentage of profits shared with employees. The lack of labor availability due to health issues or immigration changes will likely slow the rebalancing necessary to return labor cost growth to a level more consistent with 2% inflation. We can debate the length of time required to achieve labor market equilibrium, but history tells us when inflation is above 3% but falling, this is a highly attractive market for small and mid-cap stocks.
2 |
The negative earnings revision cycle has begun. There are several pressures that will drive 2023 results downward including lower demand, higher interest rates, and less of a benefit from pricing. Since the second of half of 2022, small and mid-cap stocks have witnessed a sharper negative estimate revision cycle compared to large caps. Excluding the outsized energy sector contribution, the market now expects small and mid-caps’ estimates for 2023 to be flat to down while consensus still believe large cap stocks will generate positive earnings growth. As has been the case in the past, the market moves more quickly to revise small and mid-cap companies’ estimates compared to their larger cap brethren. As we have experienced in past cycles, stocks tend to rally before the trough in earnings, so the investor seeking to capture these returns needs to be invested prior to the turn. In addition, small and mid-cap stocks have historically tended to lead the market coming out of an economic slowdown.
At the same time, we continue to caution against relying on passive strategies to gain exposure to small and mid-cap stocks. As we have discussed in the past, the quality of market indices has declined dramatically over the past few years as newly formed SPACs, meme stocks, and non-profitable/non-revenue companies have become a greater percentage of the market. This creates an increasingly attractive market opportunity for nimble, active managers.
Return on Assets (“ROA”) levels are hitting new lows across the Russell indexes performance
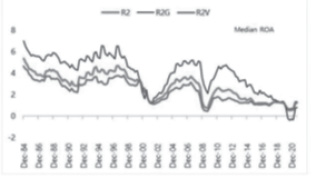
Source: Factset; FTSE Russell; Jefferies
Nonearners weight has risen and will impact benchmark

Source: Factset; FTSE Russell; Jefferies
3 |
This was the third worst year for the Russell 2000® Value Index and the fourth worst year for the Russell Mid Cap® Value Index since 1979. Historically, small and mid-cap stocks tend to rally in the subsequent year after large downturns. The market sell-off has uncovered tremendous value for patient long-term investors. We believe investors should favor relative value, actively managed strategies with portfolios constructed with companies that have healthy balance sheets and growing market shares. We believe the small and mid-cap stocks have been more severely impacted during this sell-off and are extremely neglected today. This group, which tends to be more domestically oriented, should benefit from the re-shoring and near-shoring of supply chains that have failed many companies over the past few years. We also note that historically the best backdrop for small and mid-cap stocks tends to be when inflation is above 3% and declining, which appears to be the environment we are headed into. In sum, this appears to be a very attractive market for nimble, active managers in the small and mid cap value space.
The following is a discussion of factors that influenced the performance of each of the CRM Funds during the six-month period ended December 31, 2022.
CRM Small Cap Value Fund returned 10.08% and 9.94% for the Institutional and Investor Share classes, respectively, in the period, as compared to 3.42% and 3.91% for the Russell 2000® Value Index and the Russell 2000® Index, respectively2. Stock selection was the primary driver of outperformance during the period, most notably in the Industrials and Information Technology sectors. The portfolio also modestly benefitted from our underweight to the Communication Services and Industrials sectors relative to the benchmark. Leading contributors to performance for this period included (i) ChampionX Corporation; (ii) Valmont Industries, Inc.; and (iii) Agilysys, Inc. Oilfield services provider ChampionX Corporation (CHX) delivered strong third quarter 2022 results and raised its fourth quarter 2022 guidance. Over the near to medium term, we believe ChampionX will benefit from price increases enacted earlier in 2022, while raw materials costs begin to abate. Valmont Industries, Inc. (VMI), a utility and agricultural equipment provider, appreciated during the period as higher earnings were driven by strong customer demand and a favorable price/cost mix. The outlook for the company’s sales remains favorable, with elevated global farmer income along with tailwinds for utility spending based on resiliency upgrades and investments in renewable energy. Agilysys, Inc. (AGYS), a software provider to the hospitality and gaming industries, reported strong earnings during the period, supported by a combination of improving travel trends and continued market share gains.
Individual holdings that negatively impacted performance included (i) Kaman Corporation; (ii) Ollie’s Bargain Outlet Holdings, Inc.; and (iii) James River Group Holdings, Ltd. Kaman Corporation (KAMN), a diversified aviation and defense company, reported weaker-than-expected results during the period due to revenue recognition delays in its fuse and structures business that came about from supply
4 |
chain challenges. In addition, the company recently completed the acquisition of Parker-Hannifin’s aircraft wheel and brake business, a higher-value engineered products business, and funded the acquisition with debt. This increased balance sheet leverage, coupled with reduced earnings expectations in Kaman’s other business segments, reduced overall cash flows. Given the company’s reduced financial flexibility, we elected to exit the position during the period. Ollie’s Bargain Outlet Holdings, Inc. (OLLI), a retail chain operator that offers brand name products at deeply discounted prices, reported third quarter 2022 results that were below expectations due to a slowdown in retail spending towards the end of their fiscal quarter. James River Group Holdings (JRVR), a specialty Property & Casualty (P&C) insurer, declined following a third quarter 2022 earnings report in which the company reported in-line earnings but slower-than-expected premium growth. The lower premium growth relates to a conscious decision by management to reduce riskier exposures and focus on more stable lines of business, which we believe will benefit the company over the long-term.
CRM Small/Mid Cap Value Fund returned 5.19% and 5.11% for the Institutional and Investor Share classes, respectively, in the period, as compared to 4.29% and 4.40% for the Russell 2500TM Value Index and the Russell 2500TM Index, respectively3. The Consumer Discretionary and Energy sectors were the top contributors to performance during the period, primarily due to stock selection within each sector. Conversely, stock selection in the Industrials and Health Care sectors detracted slightly from overall Fund performance during the period. Individual holdings that were leading contributors to performance included (i) ChampionX Corporation; (ii) Clean Harbors, Inc.; and (iii) Burlington Stores, Inc. Oilfield services provider ChampionX Corporation (CHX) delivered strong third quarter 2022 results and raised its fourth quarter 2022 guidance. Over the near to medium term, we believe ChampionX will benefit from price increases enacted earlier in 2022, while raw materials costs begin to abate. Clean Harbors, Inc. (CLH) provides environmental remediation and industrial waste management services to domestic customers. The company was a top contributor during the period as operating results in both segments materially outperformed expectations. Strong demand and pricing for its environmental services drove the highest margin outperformance in the peer waste management sector from an achieved pricing versus cost perspective. The company also reiterated guidance in its used motor oil collection segment. Lastly, Clean Harbors is seeing longer-term demand in its customer base to utilize the company’s services to assist in customers’ Environmental, Social and Governance (“ESG”) efforts. Burlington Stores, Inc. (BURL), an off-price retailer, reported third quarter 2022 results that showed improved execution as the company continues to benefit from an increasingly favorable inventory backdrop and an inflection in customer trends.
Individual holdings that negatively affected performance included (i) Clarivate PLC; (ii) Kaman Corporation; and (iii) Tenable Holdings, Inc. Clarivate PLC
5 |
(CLVT), a data and analytics company focused on life sciences and intellectual property end markets, underperformed during the period because of weaker than anticipated growth in the fourth quarter 2022 due mainly to transactional revenues. We believe the new management team has recalibrated expectations conservatively and are uniquely well suited for executing on improving organic growth strategy as well as margin and free cash flow opportunities over the next few years. The equity price incorporates substantial neglect around improving fundamentals and we believe it currently trades at a substantial discount to intrinsic value. Kaman Corporation (KAMN), a diversified aviation and defense company, reported weaker-than-expected results during the period due to revenue recognition delays in its fuse and structures business that came about from supply chain challenges. In addition, the company recently completed the acquisition of Parker-Hannifin’s aircraft wheel and brake business, a higher-value engineered products business, and funded the acquisition with debt. This increased balance sheet leverage, coupled with reduced earnings expectations in Kaman’s other business segments, reduced overall cash flows. Given the company’s reduced financial flexibility, we elected to exit the position during the period. Tenable Holdings, Inc. (TENB), a cybersecurity software provider, beat expectations and raised their guidance during the period, but like other software companies highlighted weakness in Europe, which led to growing concerns about the strength of their forward outlook. We believe demand trends remain very robust, and the next few quarters’ organic performance should resolve any demand-related concerns.
CRM Mid Cap Value Fund returned 5.17% and 5.05% for the Institutional and Investor Share classes, respectively, in the six-month period, as compared to 5.01% and 5.43% for the Russell Midcap® Value Index and the Russell Midcap® Index, respectively4. Stock selection in the Consumer Discretionary and Energy sectors, as well as our underweight to the Real Estate sector were the largest contributors to Fund performance during the period. Conversely, stock selection in the Health Care and Industrials sectors was a headwind to performance. Individual holdings that contributed positively to performance during the period included (i) Burlington Stores, Inc.; (ii) ChampionX Corporation; and (iii) Valmont Industries, Inc. Burlington Stores, Inc. (BURL), an off-price retailer, reported third quarter 2022 results that showed improved execution as the company continues to benefit from an increasingly favorable inventory backdrop and an inflection in customer trends. Oilfield services provider ChampionX Corporation (CHX) delivered strong third quarter 2022 results and raised its fourth quarter 2022 guidance. Over the near to medium term, we believe ChampionX will benefit from price increases enacted earlier in 2022, while raw materials costs begin to abate. Valmont Industries, Inc. (VMI), a utility and agricultural equipment provider, appreciated during the period as higher earnings were driven by strong customer demand and a favorable price/cost mix. The outlook for the company’s sales remains favorable, with elevated
6 |
global farmer income along with tailwinds for utility spending based on resiliency upgrades and investments in renewable energy.
Holdings that detracted from Fund performance during the period included (i) Clarivate PLC; (ii) Avantor, Inc.; and (iii) Nomad Foods, Ltd. Clarivate PLC (CLVT), a data and analytics company focused on life sciences and intellectual property end markets, underperformed during the period because of weaker than anticipated growth in the fourth quarter 2022 due mainly to transactional revenues. We believe the new management team has recalibrated expectations conservatively and are uniquely well suited for executing on improving organic growth strategy as well as margin and free cash flow opportunities over the next few years. The equity price incorporates substantial neglect around improving fundamentals and we believe it currently trades at a substantial discount to intrinsic value. Avantor, Inc. (AVTR) is a global manufacturer and distributor of laboratory equipment, consumables, and services in the pharmaceuticals, government, academic, healthcare, clinical, and industrial end markets. The company was a detractor during the period as they lowered forward outlook on revenue and profit expectations due to softer performance in their two recent acquisitions, lower COVID-19 testing and vaccine contributions, as well as foreign exchange impacts. Recently at an investor conference, the company further revised expectations for its acquisition performance, yet importantly maintained that the core business is achieving its organic growth expectations. The combination of softer current expectations, poor communication on setting appropriate expectations, elevated leverage, as well as macroeconomic concerns have driven Avantor’s valuation to recession levels and a substantial discount to life science peers. Nomad Food (NOMD) is a producer of branded frozen food in Western Europe, including: vegetables, fish, pizza, ice cream, and other products. The company was a detractor to performance during the period, as it continued to experience volume pressure based on increased product pricing, while private label competition has maintained lower pricing on a similar product offering. We believe the company is getting closer to improving its margin profile given the moderating of commodity costs, but increased promotional activity and a plateau in its plant-based protein products may not allow for profit improvement in the medium term. Free cash flow has also underperformed, as inventory management has been challenging during this uncertain environment for its fish supply. We sold our position and will revisit the investment case when a clearer picture of volume and profit performance exists.
CRM All Cap Value Fund returned 5.34% and 5.27% for the Institutional and Investor Share classes, respectively, during the period, as compared to 5.95% and 2.40% for the Russell 3000® Value Index and the Russell 3000® Index, respectively5. Stock selection within the Financials sector, as well as our underweight to both the Communication Services and Real Estate sectors were the primary drivers of relative performance during the period. Conversely, stock selection within the Industrials and Health Care sectors detracted from performance during the period.
7 |
Leading contributors to Fund performance were (i) Valmont Industries, Inc.; (ii) ChampionX Corporation; and (iii) Burlington Stores, Inc. Valmont Industries, Inc. (VMI), a utility and agricultural equipment provider, appreciated during the period as higher earnings were driven by strong customer demand and a favorable price/cost mix. The outlook for the company’s sales remains favorable, with elevated global farmer income along with tailwinds for utility spending based on resiliency upgrades and investments in renewable energy. Oilfield services provider ChampionX Corporation (CHX) delivered strong third quarter 2022 results and raised its fourth quarter 2022 guidance. Over the near to medium term, we believe ChampionX will benefit from price increases enacted earlier in 2022, while raw materials costs begin to abate. Burlington Stores, Inc. (BURL), an off-price retailer, reported third quarter 2022 results that showed improved execution as the company continues to benefit from an increasingly favorable inventory backdrop and an inflection in customer trends.
Individual holdings that negatively impacted performance included (i) Clarivate PLC; (ii) Kaman Corporation; and (iii) Avantor, Inc. Clarivate PLC (CLVT), a data and analytics company focused on life sciences and intellectual property end markets, underperformed during the period because of weaker than anticipated growth in the fourth quarter 2022 due mainly to transactional revenues. We believe the new management team has recalibrated expectations conservatively and are uniquely well suited for executing on improving organic growth strategy as well as margin and free cash flow opportunities over the next few years. The equity price incorporates substantial neglect around improving fundamentals and we believe it currently trades at a substantial discount to intrinsic value. Kaman Corporation (KAMN), a diversified aviation and defense company, reported weaker-than-expected results during the period due to revenue recognition delays in its fuse and structures business that came about from supply chain challenges. In addition, the company recently completed the acquisition of Parker-Hannifin’s aircraft wheel and brake business, a higher-value engineered products business, and funded the acquisition with debt. This increased balance sheet leverage, coupled with reduced earnings expectations in Kaman’s other business segments, reduced overall cash flows. Given the company’s reduced financial flexibility, we elected to exit the position during the period. Avantor, Inc. (AVTR) is a global manufacturer and distributor of laboratory equipment, consumables, and services in the pharmaceuticals, government, academic, healthcare, clinical, and industrial end markets. The company was a detractor during the period as they lowered their forward outlook on revenue and profit expectations due to softer performance in their two recent acquisitions, lower COVID-19 testing and vaccine contributions, as well as foreign exchange impacts. Recently at an investor conference, the company further revised expectations for its acquisition performance, yet importantly maintained that the core business is achieving its organic growth expectations. The combination of softer current expectations, poor communication on setting
8 |
appropriate expectations, elevated leverage, as well as macroeconomic concerns have driven Avantor’s valuation to recession levels and a substantial discount to life science peers.
CRM Long/Short Opportunities Fund returned 3.91% in the first half of the fiscal year as compared to 2.31% for the S&P 500® Index6. During the six-month period ended December 31, 2022, both sides of the book contributed to overall performance. From a sector perspective, Health Care, Financials, and Consumer Discretionary contributed most to performance during the period, while Information Technology was the largest detractor. In terms of exposure during the period, the Fund averaged approximately 89% gross long, 49% gross short, and 39% net long. The top contributors in the long portfolio were (i) Clean Harbors, Inc.; (ii) Burlington Stores, Inc.; and (iii) Valmont Industries, Inc. Clean Harbors, Inc. (CLH) provides environmental remediation and industrial waste management services to domestic customers. The company was a top contributor during the period as operating results in both segments materially outperformed expectations. Strong demand and pricing for its environmental services drove the highest margin outperformance in the peer waste management sector from an achieved pricing versus cost perspective. The company also reiterated guidance in its used motor oil collection segment. Lastly, Clean Harbors is seeing longer-term demand in its customer base to utilize the company’s services to assist in customers’ Environmental, Social and Governance (“ESG”) efforts. Burlington Stores, Inc. (BURL), an off-price retailer, reported third quarter 2022 results that showed improved execution as the company continues to benefit from an increasingly favorable inventory backdrop and an inflection in customers trends. Valmont Industries, Inc. (VMI), a utility and agricultural equipment provider, appreciated during the period as higher earnings were driven by strong customer demand and a favorable price/cost mix. The outlook for the company’s sales remains favorable, with elevated global farmer income along with tailwinds for utility spending based on resiliency upgrades and investments in renewable energy.
Top individual names that negatively impacted the long portfolio included (i) Tenable Holdings; (ii) G-III Apparel Group, Inc.; and (iii) Avantor, Inc. Tenable Holdings, Inc. (TENB), a cybersecurity software provider, beat expectations and raised their guidance during the period, but like other software companies highlighted weakness in Europe, which led to growing concerns about the strength of their forward outlook. We believe demand trends remain very robust, and the next few quarters’ organic performance should resolve any demand-related concerns. Shares of G-III Apparel Group, Inc. (GIII), a global apparel, accessory and footwear manufacturer, traded off as investors worried about higher inventories in the channel and potential promotions. We exited our position after the company announced weaker than expected earnings and notably the loss of two key licensed brands over a multi-year period. Given the future decline in earnings and the lack of visibility we sold the position for better risk/reward opportunities. Avantor, Inc. (AVTR) is a global
9 |
manufacturer and distributor of laboratory equipment, consumables, and services in the pharmaceuticals, government, academic, healthcare, clinical, and industrial end markets. The company was a detractor during the period as they lowered their forward outlook on revenue and profit expectations due to softer performance in their two recent acquisitions, lower COVID-19 testing and vaccine contributions, as well as foreign exchange impacts. Recently at an investor conference, the company further revised expectations for its acquisition performance, yet importantly maintained that the core business is achieving its organic growth expectations. The combination of softer current expectations, poor communication on setting appropriate expectations, elevated leverage, as well as macroeconomic concerns have driven Avantor’s valuation to recession levels and a substantial discount to life science peers.
Our top short contributors included (i) a contract manufacturer in the healthcare sector; (ii) a genetic testing company; and (iii) a provider of food and animal health products. A contract manufacturer in the healthcare sector missed recent and forward margin expectations and will likely be losing its largest customer in the middle of 2023. The company is experiencing manufacturing and supply chain problems and is seeing a slower macroeconomic environment putting pressure on its customers’ ability to spend on additional growth. A genetic testing company reported lower results in the most recent period and for the balance of the calendar year, when the peer group all experienced substantial testing volume upside in similar categories. The company also purchased a pharma company, which may not prove to be an appropriate fit with the testing business. A provider of food and animal health products came into the calendar year with much higher pro forma guidance for a large merger, which doubled the size of the company. Over the course of the calendar year before the merger was completed, both entities had lower sales and operating performance which lowered expectations by approximately 30% post deal closing.
The top detractors in the short portfolio were (i) a footwear company; (ii) a commodity components company; and (iii) a U.S. based advertising agency. During the period, a footwear company posted better than expected earnings in their international business despite increasing price pressure in their domestic business. A commodity components company appreciated during the period on still strong pricing increases and a more benign forecast on margin normalization. A U.S. based advertising agency appreciated as demand for their services remained robust
10 |
even as digital spending initiatives slowed and as companies begin to cut back on marketing outlays due to a more uncertain economic outlook.
Sincerely,

Ronald H. McGlynn
Trustee and President, CRM Mutual Fund Trust
1“Picks and Shovels” is an investment strategy that refers to investing in businesses that supply the tools, services, or underlying technology needed to produce a final product. It’s an indirect way of investing in an industry without the greater risk of investing directly in the company that produces the finished product.
2Russell 2000® Value Index is the Fund’s benchmark. The Russell 2000® Value Index measures the performance of those companies in the Russell 2000® Index with lower price-to-book ratios and lower forecasted growth values. The Russell 2000® Index is an unmanaged, capitalization weighted index of 2,000 small cap U.S. companies. The returns of the indexes include the reinvestment of dividends but do not account for transaction costs or other expenses which an investor might incur in attempting to obtain such returns. It is not possible to invest directly in an index.
3Russell 2500TM Value Index is the Fund’s benchmark. The Russell 2500TM Value Index is an unmanaged index that measures the performance of those companies in the Russell 2500TM Index with lower price-to-book ratios and lower forecasted growth values. The Russell 2500TM Index is an unmanaged index that measures the performance of the 2,500 smallest companies in the Russell 3000® Index. The returns of the indexes include the reinvestment of dividends but do not account for transaction costs or other expenses which an investor might incur in attempting to obtain such returns. It is not possible to invest directly in an index.
4Russell Midcap® Value Index is the Fund’s benchmark. The Russell Midcap® Value Index measures the performance of those companies in the Russell Midcap® Index with lower price-to-book ratios and lower forecasted growth values. The Russell Midcap® Index measures the performance of the 800 smallest companies in the Russell 1000® Index, which represents the performance of the 1,000 largest companies in the U.S. equity market. The returns of the indexes include the reinvestment of dividends but do not account for transaction costs or other expenses which an investor might incur in attempting to obtain such returns. It is not possible to invest directly in an index.
5Russell 3000® Value Index is the Fund’s benchmark. The Russell 3000® Value Index measures the performance of those companies in the Russell 3000® Index with lower price-to-book ratios and lower forecasted growth values. The Russell 3000® Index is an unmanaged, capitalization weighted index of the 3,000 largest U.S. companies, which represent approximately 98% of the investable U.S. equity market. The returns of the indexes include the reinvestment of dividends but do not account for transaction costs or other expenses which an investor might incur in attempting to obtain such returns. It is not possible to invest directly in an index.
6The S&P 500® Index is the Fund’s benchmark. The S&P 500® Index is an index of 500 companies chosen for market size, liquidity and industry grouping, among other factors. The S&P 500® is designed to be a leading indicator of U.S. equities and is meant to reflect the risk/return characteristics of the large cap universe. The returns of the index include the reinvestment of dividends but do not account for transaction costs or other expenses which an investor might incur in attempting to obtain such returns. It is not possible to invest directly in an index.
11 |
Performance quoted represents past performance and does not guarantee future results. Investment return and principal value will fluctuate. Shares, when redeemed, may be worth more or less than their original cost. Current performance may be lower or higher than that shown here. Performance data current to the most recent month-end is available by calling (800) CRM-2883. During the period, certain fees and expenses were waived by the Funds’ service providers. Without these waivers, total returns would have been lower.
Fund holdings and sector allocations are subject to change at any time and are not recommendations to buy or sell any security. Please refer to the Schedules of Investments for a complete list of Fund holdings. The information contained herein is not a complete analysis of every aspect of any market, industry, security, or Fund. Opinions expressed herein are as of December 31, 2022 and are subject to change at any time, are not guaranteed, and should not be considered investment advice.
Investments in small and mid capitalization companies generally are more volatile due to limited product lines, fewer capital resources and less depth of management than larger companies. Value-based investments are subject to the risk that the broad market may not recognize their intrinsic values or that the investment has not been undervalued by the market. Investments in foreign securities, including emerging markets, involve special risks such as greater social, economic, regulatory, and political uncertainties, and currency fluctuation.
The Long/Short Opportunities Fund will hold long equity securities that the Fund’s adviser has identified as undervalued and take short positions (through short sales) in equity securities that the Fund’s adviser has identified as overvalued or poised for underperformance. Short sales involve significant risks, including the risk that the Fund may have to cover its short position at a higher price than the short sale price, resulting in a loss. Short sales involve borrowing securities and then selling them, which may cause the value of the Fund’s shares to be more volatile than if the Fund did not borrow.
The information concerning the Funds included in the shareholder report contains certain forward-looking statements about the factors that may affect the performance of the Funds in the future. These statements are based on Fund management’s predictions and expectations concerning certain future events and their expected impact on the Funds, such as performance of the economy as a whole and of specific industry sectors, the impact of developing world events, and other factors that may influence the future performance of the Funds. Management believes these forward-looking statements to be reasonable, although they are inherently uncertain and difficult to predict. Actual events may cause adjustments in portfolio management strategies from those currently expected to be employed.
This report must be preceded or accompanied by the current prospectus for the Funds. Before investing, you should carefully read the prospectus and consider the investment objectives, risks, charges and expenses of the Funds. Additional copies of the prospectus may be obtained at www.crmfunds.com or at 800-CRM-2883.
Distributed by ALPS Distributors, Inc.
12 |
CRM FUNDS EXPENSE DISCLOSURE (Unaudited) |
DISCLOSURE OF FUND EXPENSES
The following Expense Tables are shown so that you can understand the impact of fees on your investment. All mutual funds have operating expenses. As a shareholder of a Fund, you incur ongoing costs, including management fees, shareholder servicing fees and other Fund expenses. A Fund’s expenses are expressed as a percentage of its average net assets. This figure is known as the expense ratio. The following examples are intended to help you understand the ongoing costs (in dollars) of investing in a Fund and to compare these costs with the ongoing costs of investing in other mutual funds. The examples are based on an investment of $1,000 made at the beginning of the period shown and held for the entire period (July 1, 2022 through December 31, 2022). The “Annualized Expense Ratio” reflects the actual expenses, net of fee waivers, where applicable, for the six-month period July 1, 2022 to December 31, 2022.
The Expense Tables below illustrate your Fund’s expenses in two ways.
● | Actual fund return. The first line of the table below provides information about actual account values and actual expenses. You may use the information in this line, together with the amount you invested, to estimate the expenses that you paid over the period. Simply divide your account value by $1,000 (for example, an $8,600 account value divided by $1,000 = 8.6), then multiply the result by the number in the first line under the heading entitled “Expenses Paid During Period” to estimate the expenses you paid on your account during the period. |
● | Hypothetical 5% return. The second line of the table below provides information about hypothetical account values and hypothetical expenses based on the Fund’s actual expense ratio and an assumed rate of return of 5% per year before expenses, which is not the Fund’s actual return. The hypothetical account values and expenses may not be used to estimate the actual ending account balance or expenses you paid for the period. You may use this information to compare the ongoing cost of investing in the Fund and other funds. To do so, compare this 5% hypothetical example with the 5% hypothetical examples that appear in the shareholder reports of the other funds. |
Please note that the expenses shown in the tables are meant to highlight your ongoing costs only and do not reflect any transactional costs that may be levied by
CRM Funds | ||
13 |
CRM FUNDS EXPENSE DISCLOSURE (Unaudited) (Continued) |
other funds, such as sales charges (loads), redemption fees, or exchange fees, if any. Therefore, the second line of the table is useful in comparing ongoing costs only, and will not help you determine the relative total cost of owning different funds. In addition, if these transactional costs were included, your costs would have been higher. The “Annualized Expense Ratio” reflects the actual expenses for the period indicated.
For the Six Months Ended December 31, 2022
Expense Table
Fund/Class | Beginning | Ending | Annualized | Expenses | ||||||||||||
CRM Small Cap Value Fund - Investor Shares | ||||||||||||||||
Actual Fund Return | $ | 1,000.00 | $ | 1,099.40 | 1.22 | % | $ | 6.46 | ||||||||
Hypothetical (5% Return Before Expenses) | $ | 1,000.00 | $ | 1,019.06 | 1.22 | % | $ | 6.21 | ||||||||
CRM Small Cap Value Fund - Institutional Shares | ||||||||||||||||
Actual Fund Return | $ | 1,000.00 | $ | 1,100.80 | 1.05 | % | $ | 5.56 | ||||||||
Hypothetical (5% Return Before Expenses) | $ | 1,000.00 | $ | 1,019.91 | 1.05 | % | $ | 5.35 | ||||||||
CRM Small/Mid Cap Value Fund - Investor Shares | ||||||||||||||||
Actual Fund Return | $ | 1,000.00 | $ | 1,051.10 | 1.19 | % | $ | 6.15 | ||||||||
Hypothetical (5% Return Before Expenses) | $ | 1,000.00 | $ | 1,019.21 | 1.19 | % | $ | 6.06 | ||||||||
CRM Small/Mid Cap Value Fund - Institutional Shares | ||||||||||||||||
Actual Fund Return | $ | 1,000.00 | $ | 1,051.90 | 1.03 | % | $ | 5.33 | ||||||||
Hypothetical (5% Return Before Expenses) | $ | 1,000.00 | $ | 1,020.01 | 1.03 | % | $ | 5.24 | ||||||||
CRM Mid Cap Value Fund - Investor Shares | ||||||||||||||||
Actual Fund Return | $ | 1,000.00 | $ | 1,050.50 | 1.15 | % | $ | 5.94 | ||||||||
Hypothetical (5% Return Before Expenses) | $ | 1,000.00 | $ | 1,019.41 | 1.15 | % | $ | 5.85 | ||||||||
CRM Funds | ||
14 |
CRM FUNDS EXPENSE DISCLOSURE (Unaudited) (Concluded) |
Fund/Class | Beginning | Ending | Annualized | Expenses | ||||||||||||
CRM Mid Cap Value Fund - Institutional Shares | ||||||||||||||||
Actual Fund Return | $ | 1,000.00 | $ | 1,051.70 | 0.99 | % | $ | 5.12 | ||||||||
Hypothetical (5% Return Before Expenses) | $ | 1,000.00 | $ | 1,020.21 | 0.99 | % | $ | 5.04 | ||||||||
CRM All Cap Value Fund - Investor Shares | ||||||||||||||||
Actual Fund Return | $ | 1,000.00 | $ | 1,052.70 | 1.37 | % | $ | 7.09 | ||||||||
Hypothetical (5% Return Before Expenses) | $ | 1,000.00 | $ | 1,018.30 | 1.37 | % | $ | 6.97 | ||||||||
CRM All Cap Value Fund - Institutional Shares | ||||||||||||||||
Actual Fund Return | $ | 1,000.00 | $ | 1,053.40 | 1.14 | % | $ | 5.90 | ||||||||
Hypothetical (5% Return Before Expenses) | $ | 1,000.00 | $ | 1,019.46 | 1.14 | % | $ | 5.80 | ||||||||
CRM Long/Short Opportunities Fund - Institutional Shares | ||||||||||||||||
Actual Fund Return | $ | 1,000.00 | $ | 1,039.10 | 2.27 | % | $ | 11.67 | ||||||||
Hypothetical (5% Return Before Expenses) | $ | 1,000.00 | $ | 1,013.76 | 2.27 | % | $ | 11.52 | ||||||||
(1) | The expense ratio for CRM Long/Short Opportunities Fund includes the impact of dividend expense and net interest expense (when applicable), on securities sold short. Excluding such expenses, the ratio of expenses to average net assets would have been 1.60%. |
(2) | Expenses are equal to the Fund’s annualized expense ratio multiplied by the average account value over the period, multiplied by 184/ 365 (to reflect the most recent one-half year period). |
CRM Funds | ||
15 |
CRM FUNDS DISCLOSURE OF PORTFOLIO HOLDINGS (Unaudited) |
PORTFOLIO HOLDINGS
December 31, 2022
The following tables present a summary of the portfolio holdings of each of the CRM Funds as a percentage of their total investments, before short-term investments held as collateral for loaned securities.
CRM Small Cap Value Fund- | |
Common Stock | |
Financials | 21.5% |
Industrials | 18.5 |
Real Estate | 9.0 |
Consumer Staples | 8.3 |
Technology | 7.6 |
Health Care | 7.4 |
Utilities | 7.1 |
Energy | 6.8 |
Consumer Discretionary | 6.0 |
Materials | 2.5 |
Short-Term Investments | 5.3 |
100.0% | |
CRM Small/Mid Cap Value Fund- | |
Common Stock | |
Financials | 20.2% |
Industrials | 15.7 |
Technology | 12.6 |
Consumer Discretionary | 10.3 |
Materials | 9.9 |
Health Care | 9.4 |
Energy | 6.8 |
Utilities | 6.3 |
Real Estate | 5.7 |
Consumer Staples | 3.1 |
100.0% | |
CRM Mid Cap Value Fund- | |
Common Stock | |
Industrials | 16.8% |
Financials | 14.9 |
Technology | 12.6 |
Materials | 10.2 |
Utilities | 9.9 |
Consumer Discretionary | 9.8 |
Health Care | 8.1 |
Energy | 6.6 |
Real Estate | 3.9 |
Consumer Staples | 3.3 |
Short-Term Investments | 3.9 |
100.0% | |
CRM All Cap Value Fund- | |
Common Stock | |
Technology | 18.6% |
Financials | 17.2 |
Health Care | 17.2 |
Industrials | 12.8 |
Consumer Discretionary | 9.3 |
Energy | 6.5 |
Materials | 6.2 |
Consumer Staples | 3.0 |
Utilities | 2.5 |
Real Estate | 2.3 |
Short-Term Investments | 4.4 |
100.0% | |
CRM Funds | ||
16 |
CRM FUNDS DISCLOSURE OF PORTFOLIO HOLDINGS (Unaudited) (Concluded) |
The following tables present a summary of the portfolio holdings of the CRM Long/Short Opportunities Fund as a percentage of its total net assets.
CRM Long/Short Opportunities Fund- | |
Common Stock | |
Industrials | 16.7% |
Technology | 15.8 |
Consumer Discretionary | 15.3 |
Financials | 9.7 |
Health Care | 9.2 |
Consumer Staples | 5.2 |
Utilities | 5.0 |
Energy | 3.6 |
Communications | 3.4 |
Short-Term Investments | 13.4 |
Common Stock Sold Short | |
Industrials | (13.0) |
Consumer Discretionary | (10.2) |
Technology | (5.9) |
Financials | (4.3) |
Communications | (3.4) |
Health Care | (2.8) |
Consumer Staples | (2.5) |
Real Estate | (2.5) |
Materials | (1.6) |
Utilities | (1.3) |
Energy | (0.5) |
49.3% | |
Portfolio holdings are subject to change at any time.
CRM Funds | ||
17 |
CRM FUNDS CRM SMALL CAP VALUE FUND SCHEDULE OF INVESTMENTS December 31, 2022 (Unaudited) |
Shares | Value | |||||||
COMMON STOCK — 95.8% | ||||||||
Consumer Discretionary — 6.1% | ||||||||
Apparel & Textile Products — 2.4% | ||||||||
| 86,139 | Steven Madden Ltd.1 | $ | 2,753,002 | |||||
Home Construction — 1.5% | ||||||||
| 32,586 | Skyline Champion Corporation1 | 1,678,505 | ||||||
Leisure Facilities & Services — 2.2% | ||||||||
| 94,286 | BJ’s Restaurants, Inc.1 | 2,487,265 | ||||||
Total Consumer Discretionary | 6,918,772 | |||||||
Consumer Staples — 8.4% | ||||||||
Beverages — 1.1% | ||||||||
| 81,607 | Primo Water Corporation | 1,268,173 | ||||||
Food — 4.9% | ||||||||
| 145,919 | Hostess Brands, Inc.1 | 3,274,422 | ||||||
| 60,865 | The Simply Good Foods Company1 | 2,314,696 | ||||||
| 5,589,118 | ||||||||
Retail - Consumer Staples — 2.4% | ||||||||
| 56,636 | Ollie’s Bargain Outlet Holdings, Inc.1 | 2,652,830 | ||||||
Total Consumer Staples | 9,510,121 | |||||||
Energy — 6.9% | ||||||||
Oil & Gas Producers — 3.1% | ||||||||
| 62,070 | Matador Resources Company | 3,552,887 | ||||||
Oil & Gas Services & Equipment — 3.8% | ||||||||
| 147,019 | ChampionX Corporation | 4,262,081 | ||||||
Total Energy | 7,814,968 | |||||||
Financials — 21.7% | ||||||||
Banking — 16.8% | ||||||||
| 26,827 | Amalgamated Financial Corporation | 618,094 | ||||||
| 127,484 | Cadence Bank | 3,143,755 | ||||||
| 139,415 | Central Pacific Financial Corporation1 | 2,827,336 | ||||||
| 131,555 | CVB Financial Corporation | 3,387,542 | ||||||
Shares | Value | |||||||
Financials — (continued) | ||||||||
Banking — (continued) | ||||||||
| 97,433 | First Interstate Bancsystem, Inc., Class A | $ | 3,765,786 | |||||
| 67,282 | Hancock Whitney Corporation | 3,255,776 | ||||||
| 159,059 | Heritage Commerce Corporation | 2,067,767 | ||||||
| 19,066,056 | ||||||||
Insurance — 4.9% | ||||||||
| 100,211 | Horace Mann Educators Corporation | 3,744,885 | ||||||
| 88,670 | James River Group Holdings, Ltd. | 1,854,090 | ||||||
| 5,598,975 | ||||||||
Total Financials | 24,665,031 | |||||||
Health Care — 7.5% | ||||||||
Biotechnology & Pharmaceuticals — 2.0% | ||||||||
| 147,712 | ABCAM PLC – ADR1,2,3 | 2,298,399 | ||||||
Medical Equipment & Devices — 5.5% | ||||||||
| 94,852 | Envista Holdings Corporation1 | 3,193,666 | ||||||
| 65,189 | LeMaitre Vascular, Inc. | 2,999,998 | ||||||
| 6,193,664 | ||||||||
Total Health Care | 8,492,063 | |||||||
Industrials — 18.7% | ||||||||
Aerospace & Defense — 3.1% | ||||||||
| 87,537 | Barnes Group, Inc. | 3,575,886 | ||||||
Commercial Support Services — 2.4% | ||||||||
| 24,061 | Clean Harbors, Inc.1 | 2,745,841 | ||||||
Electrical Equipment — 2.5% | ||||||||
| 43,263 | SPX Technologies, Inc.1 | 2,840,216 | ||||||
Engineering & Construction — 2.6% | ||||||||
| 54,995 | Arcosa, Inc. | 2,988,428 | ||||||
See accompanying notes to financial statements. | CRM Funds | |
18 | ||
CRM FUNDS CRM SMALL CAP VALUE FUND SCHEDULE OF INVESTMENTS (Continued) December 31, 2022 (Unaudited) |
Shares | Value | |||||||
Industrials — (continued) | ||||||||
Industrial Intermediate Products — 3.2% | ||||||||
| 78,285 | Janus International Group, Inc.1 | $ | 745,273 | |||||
| 8,569 | Valmont Industries, Inc. | 2,833,512 | ||||||
| 3,578,785 | ||||||||
Industrial Support Services — 1.9% | ||||||||
| 16,812 | Applied Industrial Technologies, Inc. | 2,118,816 | ||||||
Transportation & Logistics — 3.0% | ||||||||
| 52,410 | Kirby Corporation1 | 3,372,584 | ||||||
Total Industrials | 21,220,556 | |||||||
Materials — 2.5% | ||||||||
Chemicals — 2.5% | ||||||||
| 40,323 | HB Fuller Company | 2,887,933 | ||||||
Real Estate — 9.2% | ||||||||
REIT — 9.2% | ||||||||
| 70,962 | American Assets Trust, Inc. | 1,880,493 | ||||||
| 135,335 | Equity Commonwealth1 | 3,379,314 | ||||||
| 30,707 | Terreno Realty Corporation | 1,746,307 | ||||||
| 145,431 | Urban Edge Properties | 2,049,123 | ||||||
| 101,553 | Xenia Hotels & Resorts, Inc. | 1,338,469 | ||||||
Total Real Estate | 10,393,706 | |||||||
Technology — 7.7% | ||||||||
Software — 6.0% | ||||||||
| 38,794 | Agilysys, Inc.1 | 3,070,157 | ||||||
| 61,262 | Envestnet, Inc.1 | 3,779,866 | ||||||
| 6,850,023 | ||||||||
Technology Services — 1.7% | ||||||||
| 243,360 | Paya Holdings, Inc.1 | 1,915,243 | ||||||
Total Technology | 8,765,266 | |||||||
Shares | Value | |||||||
Utilities — 7.1% | ||||||||
Electric Utilities — 2.4% | ||||||||
| 38,674 | Black Hills Corporation | $ | 2,720,329 | |||||
Gas & Water Utilities — 4.7% | ||||||||
| 47,235 | Northwest Natural Holdings Company | 2,247,914 | ||||||
| 38,842 | SJW Group1 | 3,153,582 | ||||||
| 5,401,496 | ||||||||
Total Utilities | 8,121,825 | |||||||
TOTAL COMMON STOCK (Cost $97,327,443) | 108,790,241 | |||||||
SHORT-TERM INVESTMENTS — 5.4% | ||||||||
| 3,057,207 | Blackrock Liquidity Funds T-Fund, Institutional Shares, 4.03%4 | 3,057,207 | ||||||
| 3,057,209 | Federated Hermes Treasury Obligations Fund, Institutional Shares, 4.14%4 | 3,057,209 | ||||||
TOTAL SHORT-TERM INVESTMENTS (Cost $6,114,416) | 6,114,416 | |||||||
TOTAL INVESTMENTS — 101.2% (Cost $103,441,859) | $ | 114,904,657 | ||||||
LIABILITIES IN EXCESS OF OTHER ASSETS — (1.2)% | (1,404,245 | ) | ||||||
NET ASSETS — 100.0% | $ | 113,500,412 | ||||||
See accompanying notes to financial statements. | CRM Funds | |
19 | ||
CRM FUNDS CRM SMALL CAP VALUE FUND SCHEDULE OF INVESTMENTS (Concluded) December 31, 2022 (Unaudited) |
A summary of inputs used to value the Fund’s investments as of December 31, 2022 is as follows (see Note 2 in Notes to Financial Statements):
Assets | Level 1 | Level 2 | Level 3 | Investments | ||||||||||||
Common Stock | $ | 108,790,241 | — | — | $ | 108,790,241 | ||||||||||
Short-Term Investments | 6,114,416 | — | — | 6,114,416 | ||||||||||||
Total | $ | 114,904,657 | — | — | $ | 114,904,657 | ||||||||||
There were no transfers into or out of Level 3 related to securities held at December 31, 2022.
1 | Non-income producing security. |
2 | PLC – Public Limited Company |
3 | ADR – American Depositary Receipt |
4 | Rate disclosed is the seven day effective yield as of December 31, 2022. |
See accompanying notes to financial statements. | CRM Funds | |
20 | ||
CRM FUNDS CRM SMALL/MID CAP VALUE FUND SCHEDULE OF INVESTMENTS December 31, 2022 (Unaudited) |
Shares | Value | |||||||
COMMON STOCK — 95.4% | ||||||||
Consumer Discretionary — 9.8% | ||||||||
Home Construction — 1.2% | ||||||||
| 37,289 | Skyline Champion Corporation1 | $ | 1,920,756 | |||||
Leisure Facilities & Services — 1.3% | ||||||||
| 15,271 | Marriott Vacations Worldwide Corporation1 | 2,055,324 | ||||||
Retail - Discretionary — 4.4% | ||||||||
| 25,878 | Burlington Stores, Inc.1 | 5,247,023 | ||||||
| 6,325 | RH1 | 1,689,977 | ||||||
| 6,937,000 | ||||||||
Wholesale - Discretionary — 2.9% | ||||||||
| 83,415 | LKQ Corporation | 4,455,195 | ||||||
Total Consumer Discretionary | 15,368,275 | |||||||
Consumer Staples — 3.0% | ||||||||
Food — 3.0% | ||||||||
| 52,899 | Lamb Weston Holdings, Inc. | 4,727,055 | ||||||
Energy — 6.5% | ||||||||
Oil & Gas Producers — 2.3% | ||||||||
| 15,851 | Pioneer Natural Resources Company | 3,620,210 | ||||||
Oil & Gas Services & Equipment — 3.7% | ||||||||
| 198,140 | ChampionX Corporation | 5,744,079 | ||||||
Renewable Energy — 0.5% | ||||||||
| 35,652 | Sunrun, Inc.1 | 856,361 | ||||||
Total Energy | 10,220,650 | |||||||
Financials — 19.3% | ||||||||
Asset Management — 2.4% | ||||||||
| 17,403 | LPL Financial Holdings, Inc. | 3,762,007 | ||||||
Banking — 9.6% | ||||||||
| 120,390 | Cadence Bank | 2,968,817 | ||||||
| 105,639 | CVB Financial Corporation | 2,720,204 | ||||||
Shares | Value | |||||||
Financials — (continued) | ||||||||
Banking — (Continued) | ||||||||
| 134,670 | First Interstate Bancsystem, Inc., Class A | $ | 5,204,995 | |||||
| 88,188 | Webster Financial Corporation | 4,174,820 | ||||||
| 15,068,836 | ||||||||
Insurance — 7.3% | ||||||||
| 37,488 | American Financial Group, Inc. | 5,146,352 | ||||||
| 105,488 | James River Group Holdings, Ltd. | 2,205,754 | ||||||
| 55,924 | W.R. Berkley Corporation | 4,058,405 | ||||||
| 11,410,511 | ||||||||
Total Financials | 30,241,354 | |||||||
Health Care — 8.9% | ||||||||
Biotechnology & Pharmaceuticals — 2.0% | ||||||||
| 203,612 | ABCAM PLC - ADR1,2,3 | 3,168,203 | ||||||
Medical Equipment & Devices — 6.9% | ||||||||
| 9,997 | Bio-Rad Laboratories, Inc., Class A1 | 4,203,639 | ||||||
| 126,685 | Envista Holdings Corporation1 | 4,265,484 | ||||||
| 27,923 | QuidelOrtho Corporation1 | 2,392,163 | ||||||
| 10,861,286 | ||||||||
Total Health Care | 14,029,489 | |||||||
Industrials — 15.0% | ||||||||
Aerospace & Defense — 1.5% | ||||||||
| 6,071 | Teledyne Technologies, Inc.1 | 2,427,854 | ||||||
Commercial Support Services — 3.0% | ||||||||
| 40,974 | Clean Harbors, Inc.1 | 4,675,953 | ||||||
Electrical Equipment — 4.1% | ||||||||
| 60,823 | nVent Electric PLC3 | 2,339,861 | ||||||
| 209,659 | Vontier Corporation1 | 4,052,708 | ||||||
| 6,392,569 | ||||||||
See accompanying notes to financial statements. | CRM Funds | |
21 | ||
CRM FUNDS CRM SMALL/MID CAP VALUE FUND SCHEDULE OF INVESTMENTS (Continued) December 31, 2022 (Unaudited) |
Shares | Value | |||||||
Industrials — (continued) | ||||||||
Industrial Intermediate Products — 2.9% | ||||||||
| 116,718 | Janus International Group, Inc.1 | $ | 1,111,155 | |||||
| 10,571 | Valmont Industries, Inc. | 3,495,513 | ||||||
| 4,606,668 | ||||||||
Machinery — 1.0% | ||||||||
| 13,289 | Regal Rexnord Corporation | 1,594,414 | ||||||
Transportation & Logistics — 2.5% | ||||||||
| 60,394 | Kirby Corporation1 | 3,886,354 | ||||||
Total Industrials | 23,583,812 | |||||||
Materials — 9.4% | ||||||||
Chemicals — 6.6% | ||||||||
| 54,305 | Ashland, Inc. | 5,839,416 | ||||||
| 46,320 | RPM International, Inc. | 4,513,884 | ||||||
| 10,353,300 | ||||||||
Construction Materials — 2.8% | ||||||||
| 33,689 | Eagle Materials, Inc. | 4,475,584 | ||||||
Total Materials | 14,828,884 | |||||||
Real Estate — 5.5% | ||||||||
REIT — 5.5% | ||||||||
| 153,916 | Equity Commonwealth1 | 3,843,282 | ||||||
| 27,932 | Terreno Realty Corporation | 1,588,493 | ||||||
| 222,006 | Urban Edge Properties | 3,128,065 | ||||||
Total Real Estate | 8,559,840 | |||||||
Technology — 12.0% | ||||||||
Software — 9.7% | ||||||||
| 497,407 | Clarivate PLC1,3 | 4,148,374 | ||||||
| 81,072 | Envestnet, Inc.1 | 5,002,143 | ||||||
| 22,338 | PTC, Inc.1 | 2,681,454 | ||||||
| 88,320 | Tenable Holdings, Inc.1 | 3,369,408 | ||||||
| 15,201,379 | ||||||||
Technology Hardware — 2.3% | ||||||||
| 71,382 | Ciena Corporation1 | 3,639,054 | ||||||
Total Technology | 18,840,433 | |||||||
Shares | Value | |||||||
Utilities — 6.0% | ||||||||
Electric Utilities — 3.7% | ||||||||
| 30,554 | Black Hills Corporation | $ | 2,149,168 | |||||
| 51,225 | NextEra Energy Partners LP4,5 | 3,590,360 | ||||||
| 5,739,528 | ||||||||
Gas & Water Utilities — 2.3% | ||||||||
| 133,764 | Nisource, Inc. | 3,667,809 | ||||||
Total Utilities | 9,407,337 | |||||||
TOTAL COMMON STOCK (Cost $118,346,416) | 149,807,129 | |||||||
TOTAL INVESTMENTS BEFORE SHORT-TERM INVESTMENTS HELD AS COLLATERAL FOR LOANED SECURITIES – 95.4% (Cost $118,346,416) | 149,807,129 | |||||||
Principal | ||||||||
SHORT-TERM INVESTMENTS HELD AS COLLATERAL FOR LOANED SECURITIES — 2.5% | ||||||||
REPURCHASE AGREEMENTS — 2.5% | ||||||||
| 1,000,000 | With Citigroup Global Markets, Inc.: at 4.25%, dated 12/30/22, to be repurchased on 1/3/23, repurchase price $1,000,472 (collateralized by US Treasury Securities, par values ranging from $0 - $213,551, coupon rates ranging from 0.00% to 4.50%, 4/11/23 – 10/31/29; total market value $1,020,000) | 1,000,000 | ||||||
See accompanying notes to financial statements. | CRM Funds | |
22 | ||
CRM FUNDS CRM SMALL/MID CAP VALUE FUND SCHEDULE OF INVESTMENTS (Continued) December 31, 2022 (Unaudited) |
Principal | Value | |||||||
REPURCHASE AGREEMENTS — (continued) | ||||||||
| 922,949 | With HSBC Securities USA, Inc.: at 4.25%, dated 12/30/22, to be repurchased on 1/3/23, repurchase price $923,385 (collateralized by US Treasury Securities, par values ranging from $291 - $479,166, coupon rates ranging from 0.00% to 4.50%, 4/30/23 - 2/15/51; total market value $941,408) | $ | 922,949 | |||||
| 1,000,000 | With JP Morgan Securities LLC: at 4.26%, dated 12/30/22, to be repurchased on 1/3/23, repurchase price $1,000,473 (collateralized by US Treasury Securities, par values ranging from $7,219 - $1,017,711, coupon rates ranging from 0.00% to 0.13%, 5/15/23 – 12/28/23; total market value $1,020,000) | 1,000,000 | ||||||
Principal | Value | |||||||
REPURCHASE AGREEMENTS — (continued) | ||||||||
| 1,000,000 | With Mizuho Securities USA, LLC.: at 4.25%, dated 12/30/22, to be repurchased on 1/3/23, repurchase price $1,000,472 (collateralized by US Treasury Securities, par values ranging from $6,007 - $449,997, coupon rates ranging from 0.75% to 2.88%, 1/31/23 – 5/15/28; total market value $1,020,001) | $ | 1,000,000 | |||||
TOTAL SHORT-TERM INVESTMENTS HELD AS COLLATERAL FOR LOANED SECURITIES (Cost $3,922,949) | 3,922,949 | |||||||
TOTAL INVESTMENTS — 97.9% (Cost $122,269,365) | $ | 153,730,078 | 6 | |||||
OTHER ASSETS IN EXCESS OF LIABILITIES — 2.1% | 3,283,000 | |||||||
NET ASSETS — 100.0% | $ | 157,013,078 | ||||||
See accompanying notes to financial statements. | CRM Funds | |
23 | ||
CRM FUNDS CRM SMALL/MID CAP VALUE FUND SCHEDULE OF INVESTMENTS (Concluded) December 31, 2022 (Unaudited) |
A summary of inputs used to value the Fund’s investments as of December 31, 2022 is as follows (see Note 2 in Notes to Financial Statements):
Assets | Level 1 | Level 2 | Level 3 | Investments | ||||||||||||
Common Stock | $ | 149,807,129 | — | — | $ | 149,807,129 | ||||||||||
Short-Term Investments Held As Collateral For Loaned Securities | — | $ | 3,922,949 | — | 3,922,949 | |||||||||||
Total | $ | 149,807,129 | $ | 3,922,949 | — | $ | 153,730,078 | |||||||||
There were no transfers into or out of Level 3 related to securities held at December 31, 2022.
1 | Non-income producing security. |
2 | ADR – American Depositary Receipt |
3 | PLC – Public Limited Company |
4 | LP – Limited Partnership |
5 | Security partially or fully on loan. |
6 | At December 31, 2022, the market value of securities on loan for CRM Small/Mid Cap Value Fund was $3,804,874. In the event that the collateral received is insufficient to cover the value of the loaned securities and provided such collateral shortfall is not the result of investment losses, the Fund’s securities lending agent, The Bank of New York Mellon, has agreed to pay the amount of the shortfall to the Fund, or at its discretion, replace the loaned securities. |
See accompanying notes to financial statements. | CRM Funds | |
24 | ||
CRM FUNDS CRM MID CAP VALUE FUND SCHEDULE OF INVESTMENTS December 31, 2022 (Unaudited) |
Shares | Value | |||||||
COMMON STOCK — 96.1% | ||||||||
Consumer Discretionary — 9.8% | ||||||||
Apparel & Textile Products — 1.9% | ||||||||
| 247,272 | Steven Madden Ltd.1 | $ | 7,902,813 | |||||
Leisure Facilities & Services — 1.2% | ||||||||
| 38,632 | Marriott Vacations Worldwide Corporation1 | 5,199,481 | ||||||
Retail - Discretionary — 3.7% | ||||||||
| 75,466 | Burlington Stores, Inc.1 | 15,301,486 | ||||||
Wholesale - Discretionary — 3.0% | ||||||||
| 233,933 | LKQ Corporation | 12,494,362 | ||||||
Total Consumer Discretionary | 40,898,142 | |||||||
Consumer Staples — 3.3% | ||||||||
Food — 3.3% | ||||||||
| 152,608 | Lamb Weston Holdings, Inc. | 13,637,051 | ||||||
Energy — 6.6% | ||||||||
Oil & Gas Producers — 2.8% | ||||||||
| 51,932 | Pioneer Natural Resources Company | 11,860,749 | ||||||
Oil & Gas Services & Equipment — 3.8% | ||||||||
| 544,720 | ChampionX Corporation | 15,791,433 | ||||||
Total Energy | 27,652,182 | |||||||
Financials — 14.9% | ||||||||
Asset Management — 2.4% | ||||||||
| 45,822 | LPL Financial Holdings, Inc. | 9,905,342 | ||||||
Banking — 5.6% | ||||||||
| 246,212 | Cadence Bank | 6,071,588 | ||||||
| 61,865 | First Republic Bank | 7,540,725 | ||||||
| 202,759 | Webster Financial Corporation | 9,598,611 | ||||||
| 23,210,924 | ||||||||
Institutional Financial Services — 1.0% | ||||||||
| 55,703 | State Street Corporation | 4,320,882 | ||||||
Shares | Value | |||||||
Financials — (continued) | ||||||||
Insurance — 5.9% | ||||||||
| 104,372 | American Financial Group, Inc. | $ | 14,328,187 | |||||
| 141,310 | W.R. Berkley Corporation | 10,254,867 | ||||||
| 24,583,054 | ||||||||
Total Financials | 62,020,202 | |||||||
Health Care — 8.1% | ||||||||
Medical Equipment & Devices — 8.1% | ||||||||
| 236,950 | Avantor, Inc.1 | 4,997,276 | ||||||
| 26,572 | Bio-Rad Laboratories, Inc., Class A1 | 11,173,260 | ||||||
| 333,977 | Envista Holdings Corporation1 | 11,245,005 | ||||||
| 74,453 | QuidelOrtho Corporation1 | 6,378,389 | ||||||
Total Health Care | 33,793,930 | |||||||
Industrials — 16.8% | ||||||||
Aerospace & Defense — 4.1% | ||||||||
| 21,165 | Teledyne Technologies, Inc.1 | 8,464,095 | ||||||
| 90,168 | Woodward, Inc. | 8,711,131 | ||||||
| 17,175,226 | ||||||||
Electrical Equipment — 6.6% | ||||||||
| 81,191 | AMETEK, Inc. | 11,344,006 | ||||||
| 161,569 | nVent Electric PLC2 | 6,215,559 | ||||||
| 503,594 | Vontier Corporation1 | 9,734,472 | ||||||
| 27,294,037 | ||||||||
Industrial Intermediate Products — 2.2% | ||||||||
| 28,161 | Valmont Industries, Inc. | 9,311,998 | ||||||
Industrial Support Services — 0.7% | ||||||||
| 21,394 | Applied Industrial Technologies, Inc. | 2,696,286 | ||||||
Machinery — 1.0% | ||||||||
| 35,456 | Regal Rexnord Corporation | 4,254,011 | ||||||
See accompanying notes to financial statements. | CRM Funds | |
25 | ||
CRM FUNDS CRM MID CAP VALUE FUND SCHEDULE OF INVESTMENTS (Continued) December 31, 2022 (Unaudited) |
Shares | Value | |||||||
Industrials — (continued) | ||||||||
Transportation & Logistics — 2.2% | ||||||||
| 123,740 | Canadian Pacific Railway Ltd.3 | $ | 9,229,767 | |||||
Total Industrials | 69,961,325 | |||||||
Materials — 10.2% | ||||||||
Chemicals — 10.2% | ||||||||
| 140,448 | Ashland, Inc. | 15,102,373 | ||||||
| 259,876 | Corteva, Inc. | 15,275,512 | ||||||
| 123,283 | RPM International, Inc. | 12,013,928 | ||||||
Total Materials | 42,391,813 | |||||||
Real Estate — 3.9% | ||||||||
REIT — 3.9% | ||||||||
| 77,380 | American Assets Trust, Inc. | 2,050,570 | ||||||
| 402,152 | Equity Commonwealth1 | 10,041,735 | ||||||
| 152,522 | Highwoods Properties, Inc. | 4,267,566 | ||||||
Total Real Estate | 16,359,871 | |||||||
Technology — 12.6% | ||||||||
Semiconductors — 2.2% | ||||||||
| 133,943 | Microchip Technology, Inc. | 9,409,496 | ||||||
Software — 6.2% | ||||||||
| 1,325,798 | Clarivate PLC1,2 | 11,057,155 | ||||||
| 58,872 | PTC, Inc.1 | 7,066,995 | ||||||
| 197,679 | Tenable Holdings, Inc.1 | 7,541,454 | ||||||
| 25,665,604 | ||||||||
Technology Hardware — 2.3% | ||||||||
| 190,509 | Ciena Corporation1 | 9,712,149 | ||||||
Technology Services — 1.9% | ||||||||
| 36,117 | Morningstar, Inc. | 7,822,581 | ||||||
Total Technology | 52,609,830 | |||||||
Shares | Value | |||||||
Utilities — 9.9% | ||||||||
Electric Utilities — 4.7% | ||||||||
| 134,224 | Black Hills Corporation | $ | 9,441,316 | |||||
| 145,873 | NextEra Energy Partners LP3 | 10,224,239 | ||||||
| 19,665,555 | ||||||||
Gas & Water Utilities — 5.2% | ||||||||
| 86,189 | Atmos Energy Corporation | 9,659,201 | ||||||
| 430,362 | Nisource, Inc. | 11,800,526 | ||||||
| 21,459,727 | ||||||||
Total Utilities | 41,125,282 | |||||||
TOTAL COMMON STOCK (Cost $309,961,522) | 400,449,628 | |||||||
SHORT-TERM INVESTMENTS — 3.9% | ||||||||
| 8,059,393 | Blackrock Liquidity Funds T-Fund, Institutional Shares, 4.03%4 | 8,059,393 | ||||||
| 8,059,395 | Federated Hermes Treasury Obligations Fund, Institutional Shares, 4.14%4 | 8,059,395 | ||||||
TOTAL SHORT-TERM INVESTMENTS (Cost $16,118,788) | 16,118,788 | |||||||
TOTAL INVESTMENTS BEFORE SHORT-TERM INVESTMENTS HELD AS COLLATERAL FOR LOANED SECURITIES — 100.0% (Cost $326,080,310) | 416,568,416 | |||||||
See accompanying notes to financial statements. | CRM Funds | |
26 | ||
CRM FUNDS CRM MID CAP VALUE FUND SCHEDULE OF INVESTMENTS (Continued) December 31, 2022 (Unaudited) |
Principal | ||||||||
SHORT-TERM INVESTMENTS HELD AS COLLATERAL FOR LOANED SECURITIES — 3.3% | ||||||||
REPURCHASE AGREEMENTS — 3.3% | ||||||||
| 683,504 | With Bank of America Securities, Inc.: at 4.25%, dated 12/30/22, to be repurchased on 1/3/23, repurchase price $683,827 (collateralized by US Treasury Securities, par values ranging from $344,655 - $386,857, coupon rates ranging from 0.75% to 4.50%, 11/15/25 – 3/31/26; total market value $697,174) | $ | 683,504 | |||||
| 3,248,983 | With Citigroup Global Markets, Inc.: at 4.25%, dated 12/30/22, to be repurchased on 1/3/23, repurchase price $3,250,517 (collateralized by US Treasury Securities, par values ranging from $0 - $693,822, coupon rates ranging from 0.00% to 4.50%, 4/11/23 – 10/31/29 total market value $3,313,963) | 3,248,983 | ||||||
| 3,248,983 | With Deutsche Bank Securities, Inc.: at 4.26%, dated 12/30/22, to be repurchased on 1/3/23, repurchase price $3,250,521 (collateralized by US Treasury Securities, par values ranging from $59,307 - $785,110, coupon rates ranging from 0.00% to 0.00%, 1/10/23 – 6/29/23; total market value $3,313,963) | 3,248,983 | ||||||
Principal | Value | |||||||
REPURCHASE AGREEMENTS — (continued) | ||||||||
| 3,248,983 | With JP Morgan Securities LLC: at 4.26%, dated 12/30/22, to be repurchased on 1/3/23, repurchase price $3,250,521 (collateralized by US Treasury Securities, par values ranging from $23,456 - $3,306,527, coupon rates ranging from 0.00% to 0.13%, 5/15/23 – 12/28/23; total market value $3,313,963) | $ | 3,248,983 | |||||
| 3,248,983 | With Mizuho Securities USA, LLC.: at 4.25%, dated 12/30/22, to be repurchased on 1/3/23, repurchase price $3,250,517 (collateralized by US Treasury Securities, par values ranging from $19,517 - $1,462,033, coupon rates ranging from 0.75% to 2.88%, 1/31/23 – 5/15/28; total market value $3,313,964) | 3,248,983 | ||||||
TOTAL SHORT-TERM INVESTMENTS HELD AS COLLATERAL FOR LOANED SECURITIES (Cost $13,679,436) | 13,679,436 | |||||||
TOTAL INVESTMENTS — 103.3% (Cost $339,759,746) | $ | 430,247,852 | 5 | |||||
LIABILITIES IN EXCESS OF OTHER ASSETS — (3.3)% | (13,555,020 | ) | ||||||
NET ASSETS — 100.0% | $ | 416,692,832 | ||||||
See accompanying notes to financial statements. | CRM Funds | |
27 | ||
CRM FUNDS CRM MID CAP VALUE FUND SCHEDULE OF INVESTMENTS (Concluded) December 31, 2022 (Unaudited) |
A summary of inputs used to value the Fund’s investments as of December 31, 2022 is as follows (see Note 2 in Notes to Financial Statements):
Assets | Level 1 | Level 2 | Level 3 | Investments | ||||||||||||
Common Stock | $ | 400,449,628 | — | — | $ | 400,449,628 | ||||||||||
Short-Term Investments | 16,118,788 | — | — | 16,118,788 | ||||||||||||
Short-Term Investments Held As Collateral For Loaned Securities | — | $ | 13,679,436 | — | 13,679,436 | |||||||||||
Total | $ | 416,568,416 | $ | 13,679,436 | — | $ | 430,247,852 | |||||||||
There were no transfers into or out of Level 3 related to securities held at December 31, 2022.
1 | Non-income producing security. |
2 | PLC – Public Limited Company |
3 | Security partially or fully on loan. |
4 | Rate disclosed is the seven day effective yield as of December 31, 2022. |
5 | At December 31, 2022, the market value of securities on loan for CRM Mid Cap Value Fund was $13,205,972. In the event that the collateral received is insufficient to cover the value of the loaned securities and provided such collateral shortfall is not the result of investment losses, the Fund’s securities lending agent, The Bank of New York Mellon, has agreed to pay the amount of the shortfall to the Fund, or at its discretion, replace the loaned securities. |
See accompanying notes to financial statements. | CRM Funds | |
28 | ||
CRM FUNDS CRM ALL CAP VALUE FUND SCHEDULE OF INVESTMENTS December 31, 2022 (Unaudited) |
Shares | Value | |||||||
COMMON STOCK — 95.7% | ||||||||
Consumer Discretionary — 9.3% | ||||||||
Apparel & Textile Products — 1.7% | ||||||||
| 13,114 | Steven Madden Ltd.1 | $ | 419,123 | |||||
Home Construction — 1.7% | ||||||||
| 7,953 | Skyline Champion Corporation1 | 409,659 | ||||||
Leisure Facilities & Services — 1.3% | ||||||||
| 2,359 | Marriott Vacations Worldwide Corporation1 | 317,498 | ||||||
Retail - Discretionary — 2.6% | ||||||||
| 3,155 | Burlington Stores, Inc.1 | 639,708 | ||||||
Wholesale - Discretionary — 2.0% | ||||||||
| 9,129 | LKQ Corporation | 487,580 | ||||||
Total Consumer Discretionary | 2,273,568 | |||||||
Consumer Staples — 3.0% | ||||||||
Food — 3.0% | ||||||||
| 8,271 | Lamb Weston Holdings, Inc. | 739,097 | ||||||
Energy — 6.5% | ||||||||
Oil & Gas Producers — 2.7% | ||||||||
| 24,593 | Marathon Oil Corporation | 665,733 | ||||||
Oil & Gas Services & Equipment — 3.8% | ||||||||
| 31,619 | ChampionX Corporation | 916,634 | ||||||
Total Energy | 1,582,367 | |||||||
Financials — 17.3% | ||||||||
Asset Management — 2.8% | ||||||||
| 8,183 | Charles Schwab Corporation (The) | 681,317 | ||||||
Banking — 9.6% | ||||||||
| 3,102 | First Republic Bank | 378,103 | ||||||
| 12,601 | Hancock Whitney Corporation | 609,762 | ||||||
| 14,475 | Truist Financial Corporation | 622,859 | ||||||
| 15,518 | Webster Financial Corporation | 734,622 | ||||||
| 2,345,346 | ||||||||
Shares | Value | |||||||
Financials — (continued) | ||||||||
Insurance — 4.9% | ||||||||
| 4,401 | American Financial Group, Inc. | $ | 604,169 | |||||
| 9,120 | American International Group, Inc. | 576,749 | ||||||
| 1,180,918 | ||||||||
Total Financials | 4,207,581 | |||||||
Health Care — 17.2% | ||||||||
Biotechnology & Pharmaceuticals — 3.2% | ||||||||
| 4,463 | Johnson & Johnson | 788,389 | ||||||
Health Care Facilities & Services — 3.5% | ||||||||
| 1,635 | Humana, Inc. | 837,431 | ||||||
Medical Equipment & Devices — 10.5% | ||||||||
| 13,494 | Avantor, Inc.1 | 284,588 | ||||||
| 2,757 | Danaher Corporation | 731,763 | ||||||
| 18,169 | Envista Holdings Corporation1 | 611,750 | ||||||
| 5,233 | LeMaitre Vascular, Inc. | 240,823 | ||||||
| 8,139 | QuidelOrtho Corporation1 | 697,268 | ||||||
| 2,566,192 | ||||||||
Total Health Care | 4,192,012 | |||||||
Industrials — 12.8% | ||||||||
Aerospace & Defense — 2.4% | ||||||||
| 6,159 | Woodward, Inc. | 595,021 | ||||||
Electrical Equipment — 1.0% | ||||||||
| 6,265 | nVent Electric PLC2 | 241,015 | ||||||
Industrial Intermediate Products — 2.5% | ||||||||
| 1,829 | Valmont Industries, Inc. | 604,795 | ||||||
Transportation & Logistics — 6.9% | ||||||||
| 7,450 | Canadian Pacific Railway Ltd.3 | 555,696 | ||||||
| 17,435 | Kirby Corporation1 | 1,121,942 | ||||||
| 1,677,638 | ||||||||
Total Industrials | 3,118,469 | |||||||
��
See accompanying notes to financial statements. | CRM Funds | |
29 | ||
CRM FUNDS CRM ALL CAP VALUE FUND SCHEDULE OF INVESTMENTS (Continued) December 31, 2022 (Unaudited) |
Shares | Value | |||||||
Materials — 6.2% | ||||||||
Chemicals — 6.2% | ||||||||
| 6,539 | Ashland, Inc. | $ | 703,139 | |||||
| 13,865 | Corteva, Inc. | 814,984 | ||||||
Total Materials | 1,518,123 | |||||||
Real Estate — 2.3% | ||||||||
REIT — 2.3% | ||||||||
| 6,442 | Terreno Realty Corporation | 366,357 | ||||||
| 14,581 | Xenia Hotels & Resorts, Inc. | 192,178 | ||||||
Total Real Estate | 558,535 | |||||||
Technology — 18.6% | ||||||||
Semiconductors — 3.0% | ||||||||
| 5,178 | Microchip Technology, Inc. | 363,755 | ||||||
| 3,464 | QUALCOMM, Inc. | 380,832 | ||||||
| 744,587 | ||||||||
Software — 7.5% | ||||||||
| 98,589 | Clarivate PLC1,2 | 822,231 | ||||||
| 4,277 | PTC, Inc.1 | 513,411 | ||||||
| 12,672 | Tenable Holdings, Inc.1 | 483,437 | ||||||
| 1,819,079 | ||||||||
Technology Hardware — 4.5% | ||||||||
| 13,079 | Ciena Corporation1 | 666,767 | ||||||
| 33,757 | DZS, Inc.1 | 428,039 | ||||||
| 1,094,806 | ||||||||
Technology Services — 3.6% | ||||||||
| 1,237 | MasterCard, Inc., Class A | 430,142 | ||||||
| 57,993 | Paya Holdings, Inc.1 | 456,405 | ||||||
| 886,547 | ||||||||
Total Technology | 4,545,019 | |||||||
Utilities — 2.5% | ||||||||
Electric Utilities — 2.5% | ||||||||
| 7,388 | NextEra Energy, Inc. | 617,637 | ||||||
TOTAL COMMON STOCK (Cost $19,716,185) | 23,352,408 | |||||||
Shares | Value | |||||||
SHORT-TERM INVESTMENTS — 4.4% | ||||||||
| 537,094 | Blackrock Liquidity Funds T-Fund, Institutional Shares, 4.03%4 | $ | 537,094 | |||||
| 537,094 | Federated Hermes Treasury Obligations Fund, Institutional Shares, 4.14%4 | 537,094 | ||||||
TOTAL SHORT-TERM INVESTMENTS (Cost $1,074,188) | 1,074,188 | |||||||
TOTAL INVESTMENTS BEFORE SHORT-TERM INVESTMENT HELD AS COLLATERAL FOR LOANED SECURITIES — 100.1% (Cost $20,790,373) | 24,426,596 | |||||||
See accompanying notes to financial statements. | CRM Funds | |
30 | ||
CRM FUNDS CRM ALL CAP VALUE FUND SCHEDULE OF INVESTMENTS (Continued) December 31, 2022 (Unaudited) |
Principal | Value | |||||||
SHORT-TERM INVESTMENT HELD AS COLLATERAL FOR LOANED SECURITIES — 2.3% | ||||||||
REPURCHASE AGREEMENT — 2.3% | ||||||||
| 573,277 | With JP Morgan Securities LLC: at 4.26%, dated 12/30/22, to be repurchased on 1/3/23, repurchase price $573,548 (collateralized by US Treasury Securities, par values ranging from $4,139 - $583,430, coupon rates ranging from 0.00% to 0.13%, 5/15/23 - 12/28/23; total market value $584,743) | $ | 573,277 | |||||
TOTAL SHORT-TERM INVESTMENT HELD AS COLLATERAL FOR LOANED SECURITIES (Cost $573,277) | 573,277 | |||||||
TOTAL INVESTMENTS — 102.4% (Cost $21,363,650) | $ | 24,999,873 | 5 | |||||
LIABILITIES IN EXCESS OF OTHER ASSETS — (2.4)% | (591,478 | ) | ||||||
NET ASSETS — 100.0% | $ | 24,408,395 | ||||||
See accompanying notes to financial statements. | CRM Funds | |
31 | ||
CRM FUNDS CRM ALL CAP VALUE FUND SCHEDULE OF INVESTMENTS (Concluded) December 31, 2022 (Unaudited) |
A summary of inputs used to value the Fund’s investments as of December 31, 2022 is as follows (see Note 2 in Notes to Financial Statements):
Assets | Level 1 | Level 2 | Level 3 | Investments | ||||||||||||
Common Stock | $ | 23,352,408 | — | — | $ | 23,352,408 | ||||||||||
Short-Term Investments | 1,074,188 | — | — | 1,074,188 | ||||||||||||
Short-Term Investments Held As Collateral For Loaned Securities | — | $ | 573,277 | — | 573,277 | |||||||||||
Total | $ | 24,426,596 | $ | 573,277 | — | $ | 24,999,873 | |||||||||
There were no transfers into or out of Level 3 related to securities held at December 31, 2022.
1 | Non-income producing security. |
2 | PLC - Public Limited Company. |
3 | Security partially or fully on loan. |
4 | Rate disclosed is the seven day effective yield as of December 31, 2022. |
5 | At December 31, 2022, the market value of securities on loan for CRM All Cap Value Fund was $555,696. In the event that the collateral received is insufficient to cover the value of the loaned securities and provided such collateral shortfall is not the result of investment losses, the Fund’s securities lending agent, The Bank of New York Mellon, has agreed to pay the amount of the shortfall to the Fund, or at its discretion, replace the loaned securities. |
See accompanying notes to financial statements. | CRM Funds | |
32 | ||
CRM FUNDS CRM LONG/SHORT OPPORTUNITIES FUND SCHEDULE OF INVESTMENTS December 31, 2022 (Unaudited) |
Shares | Value | |||||||
COMMON STOCK — 83.9% | ||||||||
Communications — 3.4% | ||||||||
Entertainment Content — 1.1% | ||||||||
| 26,668 | Walt Disney Company (The)1 | $ | 2,316,916 | |||||
Internet Media & Services — 2.3% | ||||||||
| 2,356 | Booking Holdings, Inc.1 | 4,748,000 | ||||||
Total Communications | 7,064,916 | |||||||
Consumer Discretionary — 15.3% | ||||||||
Apparel & Textile Products — 2.1% | ||||||||
| 137,638 | Steven Madden Ltd.1 | 4,398,911 | ||||||
Home Construction — 3.3% | ||||||||
| 135,544 | Skyline Champion Corporation1 | 6,981,872 | ||||||
Leisure Facilities & Services — 3.9% | ||||||||
| 115,190 | BJ’s Restaurants, Inc.1 | 3,038,712 | ||||||
| 37,326 | Marriott Vacations Worldwide Corporation1 | 5,023,706 | ||||||
| 8,062,418 | ||||||||
Retail - Discretionary — 3.7% | ||||||||
| 28,640 | Burlington Stores, Inc.1 | 5,807,046 | ||||||
| 7,146 | RH1 | 1,909,340 | ||||||
| 7,716,386 | ||||||||
Wholesale - Discretionary — 2.3% | ||||||||
| 91,956 | LKQ Corporation | 4,911,370 | ||||||
Total Consumer Discretionary | 32,070,957 | |||||||
Consumer Staples — 5.2% | ||||||||
Beverages — 2.6% | ||||||||
| 2,479,999 | Becle SAB de CV | 5,414,928 | ||||||
Food — 2.6% | ||||||||
| 60,937 | Lamb Weston Holdings, Inc. | 5,445,330 | ||||||
Total Consumer Staples | 10,860,258 | |||||||
Shares | Value | |||||||
Energy — 3.6% | ||||||||
Oil & Gas Producers — 1.6% | ||||||||
| 15,248 | Pioneer Natural Resources Company | $ | 3,482,491 | |||||
Renewable Energy — 2.0% | ||||||||
| 172,816 | Sunrun, Inc.1 | 4,151,040 | ||||||
Total Energy | 7,633,531 | |||||||
Financials — 9.7% | ||||||||
Asset Management — 3.1% | ||||||||
| 77,818 | Charles Schwab Corporation (The) | 6,479,127 | ||||||
Banking — 1.6% | ||||||||
| 69,347 | Webster Financial Corporation | 3,282,887 | ||||||
Institutional Financial Services — 1.9% | ||||||||
| 47,545 | Morgan Stanley | 4,042,276 | ||||||
Insurance — 3.1% | ||||||||
| 50,094 | Progressive Corporation (The) | 6,497,693 | ||||||
Total Financials | 20,301,983 | |||||||
Health Care — 9.2% | ||||||||
Health Care Facilities & Services — 3.0% | ||||||||
| 12,183 | Humana, Inc. | 6,240,011 | ||||||
Medical Equipment & Devices — 6.2% | ||||||||
| 135,390 | Avantor, Inc.1 | 2,855,375 | ||||||
| 20,446 | Danaher Corporation | 5,426,777 | ||||||
| 140,857 | Envista Holdings Corporation1 | 4,742,655 | ||||||
| 13,024,807 | ||||||||
Total Health Care | 19,264,818 | |||||||
Industrials — 16.7% | ||||||||
Commercial Support Services — 3.1% | ||||||||
| 56,471 | Clean Harbors, Inc.1 | 6,444,471 | ||||||
Electrical Equipment — 3.5% | ||||||||
| 183,751 | Hayward Holdings, Inc.1 | 1,727,259 | ||||||
| 287,898 | Vontier Corporation1 | 5,565,068 | ||||||
| 7,292,327 | ||||||||
See accompanying notes to financial statements. | CRM Funds | |
33 | ||
CRM FUNDS CRM LONG/SHORT OPPORTUNITIES FUND SCHEDULE OF INVESTMENTS (Continued) December 31, 2022 (Unaudited) |
Shares | Value | |||||||
Industrials — (continued) | ||||||||
Engineering & Construction — 3.2% | ||||||||
| 124,524 | Arcosa, Inc. | $ | 6,766,634 | |||||
Industrial Intermediate Products — 0.7% | ||||||||
| 157,045 | Janus International Group, Inc.1 | 1,495,068 | ||||||
Transportation & Logistics — 6.2% | ||||||||
| 87,706 | Canadian Pacific Railway Ltd. | 6,541,991 | ||||||
| 101,059 | Kirby Corporation1 | 6,503,147 | ||||||
| 13,045,138 | ||||||||
Total Industrials | 35,043,638 | |||||||
Technology — 15.8% | ||||||||
Semiconductors — 2.0% | ||||||||
| 38,643 | QUALCOMM, Inc. | 4,248,411 | ||||||
Software — 10.4% | ||||||||
| 230,742 | Clarivate PLC1,2 | 1,924,388 | ||||||
| 188,741 | Jamf Holding Corporation1 | 4,020,183 | ||||||
| 20,484 | Microsoft Corporation | 4,912,473 | ||||||
| 53,560 | PTC, Inc.1 | 6,429,342 | ||||||
| 117,778 | Tenable Holdings, Inc.1 | 4,493,231 | ||||||
| 21,779,617 | ||||||||
Technology Services — 3.4% | ||||||||
| 20,638 | MasterCard, Inc., Class A | 7,176,452 | ||||||
Total Technology | 33,204,480 | |||||||
Utilities — 5.0% | ||||||||
Electric Utilities — 5.0% | ||||||||
| 125,910 | NextEra Energy, Inc. | 10,526,076 | ||||||
TOTAL COMMON STOCK (Cost $168,859,070) | 175,970,657 | |||||||
Shares | Value | |||||||
SHORT-TERM INVESTMENTS — 13.4% | ||||||||
| 14,083,869 | Blackrock Liquidity Funds T-Fund, Institutional Shares, 4.03%3 | $ | 14,083,869 | |||||
| 14,083,869 | Federated Hermes Treasury Obligations Fund, Institutional Shares, 4.14%3 | 14,083,869 | ||||||
TOTAL SHORT-TERM INVESTMENTS (Cost $28,167,738) | 28,167,738 | |||||||
TOTAL INVESTMENTS IN SECURITIES – 97.3% (Cost $197,026,808) | 204,138,395 | |||||||
COMMON STOCK SOLD SHORT — (48.0)% | ||||||||
Communications — (3.4)% | ||||||||
Advertising & Marketing — (1.6)% | ||||||||
| (40,946 | ) | Omnicom Group, Inc. | (3,339,965 | ) | ||||
Entertainment Content — (0.4)% | ||||||||
| (55,724 | ) | Paramount Global, Class B | (940,621 | ) | ||||
Publishing & Broadcasting — (0.5)% | ||||||||
| (97,034 | ) | Pearson PLC2 | (1,101,694 | ) | ||||
Telecommunications — (0.9)% | ||||||||
| (100,897 | ) | AT&T, Inc. | (1,857,514 | ) | ||||
Total Communications | (7,239,794 | ) | ||||||
Consumer Discretionary — (10.2)% | ||||||||
Apparel & Textile Products — (1.4)% | ||||||||
| (14,493 | ) | Crocs, Inc. | (1,571,476 | ) | ||||
| (33,145 | ) | Kontoor Brands, Inc. | (1,325,469 | ) | ||||
| (2,896,945 | ) | |||||||
Automotive — (0.4)% | ||||||||
| (238,128 | ) | Canoo, Inc. | (292,897 | ) | ||||
| (354,965 | ) | Lordstown Motors Corporation | (404,660 | ) | ||||
| (128,890 | ) | Sono Group | (126,931 | ) | ||||
| (824,488 | ) | |||||||
See accompanying notes to financial statements. | CRM Funds | |
34 | ||
CRM FUNDS CRM LONG/SHORT OPPORTUNITIES FUND SCHEDULE OF INVESTMENTS (Continued) December 31, 2022 (Unaudited) |
Shares | Value | |||||||
Consumer Discretionary — (continued) | ||||||||
Consumer Services — (3.4)% | ||||||||
| (35,771 | ) | Adtalem Global Education, Inc. | $ | (1,269,871 | ) | |||
| (254,669 | ) | Perdoceo Education Corporation | (3,539,899 | ) | ||||
| (30,557 | ) | Strategic Education, Inc. | (2,393,224 | ) | ||||
| (7,202,994 | ) | |||||||
E-Commerce Discretionary — (0.4)% | ||||||||
| (115,467 | ) | FIGS, Inc. | (777,093 | ) | ||||
Leisure Facilities & Services — (1.6)% | ||||||||
| (160,310 | ) | Life Time Group Holdings, Inc. | (1,917,308 | ) | ||||
| (25,367 | ) | SeaWorld Entertainment, Inc. | (1,357,388 | ) | ||||
| (3,274,696 | ) | |||||||
Retail — Discretionary — (3.0)% | ||||||||
| (216,519 | ) | EVgo, Inc. | (967,840 | ) | ||||
| (61,877 | ) | Lovesac Company (The) | (1,361,913 | ) | ||||
| (35,745 | ) | Pandora | (2,511,897 | ) | ||||
| (13,484 | ) | Williams-Sonoma, Inc. | (1,549,581 | ) | ||||
| (6,391,231 | ) | |||||||
Total Consumer Discretionary | (21,367,447 | ) | ||||||
Consumer Staples — (2.5)% | ||||||||
Food — (0.7)% | ||||||||
| (18,867 | ) | Kellogg Company | (1,344,085 | ) | ||||
Retail — Consumer Staples — (1.8)% | ||||||||
| (33,838 | ) | Kroger Company (The) | (1,508,498 | ) | ||||
| (61,446 | ) | Walgreens Boots Alliance, Inc. | (2,295,623 | ) | ||||
| (3,804,121 | ) | |||||||
Total Consumer Staples | (5,148,206 | ) | ||||||
Energy — (0.5)% | ||||||||
Renewable Energy — (0.5)% | ||||||||
| (83,424 | ) | Plug Power, Inc. | (1,031,955 | ) | ||||
Shares | Value | |||||||
Financials — (4.3)% | ||||||||
Asset Management — (0.6)% | ||||||||
| (17,235 | ) | Blackstone Group LP (The)4 | $ | (1,278,665 | ) | |||
Banking — (0.5)% | ||||||||
| (22,310 | ) | Silvergate Capital Corporation, Class A | (388,194 | ) | ||||
| (2,495 | ) | SVB Financial Group | (574,199 | ) | ||||
| (962,393 | ) | |||||||
Institutional Financial Services — (0.2)% | ||||||||
| (13,530 | ) | Coinbase Global, Inc., Class A | (478,827 | ) | ||||
Insurance — (0.4)% | ||||||||
| (19,637 | ) | Trupanion, Inc. | (933,347 | ) | ||||
Specialty Finance — (2.6)% | ||||||||
| (65,727 | ) | Ally Financial, Inc. | (1,607,025 | ) | ||||
| (27,007 | ) | Capital One Financial Corporation | (2,510,571 | ) | ||||
| (189,920 | ) | Rocket Companies, Inc. | (1,329,440 | ) | ||||
| (5,447,036 | ) | |||||||
Total Financials | (9,100,268 | ) | ||||||
Health Care — (2.8)% | ||||||||
Biotechnology & Pharmaceuticals — (0.4)% | ||||||||
| (37,688 | ) | Twist Bioscience Corporation | (897,351 | ) | ||||
Health Care Facilities & Services — (2.4)% | ||||||||
| (96,300 | ) | AdaptHealth Corporation | (1,850,886 | ) | ||||
| (41,908 | ) | Agiliti, Inc. | (683,519 | ) | ||||
| (61,861 | ) | Fulgent Genetics, Inc. | (1,842,221 | ) | ||||
| (411,944 | ) | Ginkgo Bioworks Holdings, Inc. | (696,185 | ) | ||||
| (5,072,811 | ) | |||||||
Total Health Care | (5,970,162 | ) | ||||||
See accompanying notes to financial statements. | CRM Funds | |
35 | ||
CRM FUNDS CRM LONG/SHORT OPPORTUNITIES FUND SCHEDULE OF INVESTMENTS (Continued) December 31, 2022 (Unaudited) |
Shares | Value | |||||||
Industrials — (13.0)% | ||||||||
Commercial Support Services — (1.1)% | ||||||||
| (32,205 | ) | TriNet Group, Inc. | $ | (2,183,499 | ) | |||
Electrical Equipment — (4.6)% | ||||||||
| (16,734 | ) | Acuity Brands, Inc. | (2,771,318 | ) | ||||
| (18,967 | ) | Advanced Energy Industries, Inc. | (1,626,989 | ) | ||||
| (53,857 | ) | Blink Charging Company | (590,811 | ) | ||||
| (80,767 | ) | Bloom Energy Corporation, Class A | (1,544,265 | ) | ||||
| (10,974 | ) | Generac Holdings, Inc. | (1,104,643 | ) | ||||
| (62,344 | ) | Signify | (2,094,822 | ) | ||||
| (9,732,848 | ) | |||||||
Industrial Intermediate Products — (0.9)% | ||||||||
| (260,183 | ) | Hillman Solutions Corporation | (1,875,919 | ) | ||||
Industrial Support Services — (1.5)% | ||||||||
| (42,678 | ) | Resideo Technologies, Inc. | (702,053 | ) | ||||
| (10,043 | ) | Watsco, Inc. | (2,504,724 | ) | ||||
| (3,206,777 | ) | |||||||
Machinery — (0.5)% | ||||||||
| (4,528 | ) | Snap-on, Inc. | (1,034,603 | ) | ||||
Transportation & Logistics — (2.9)% | ||||||||
| (15,787 | ) | CH Robinson Worldwide, Inc. | (1,445,458 | ) | ||||
| (10,727 | ) | Old Dominion Freight Line, Inc. | (3,044,108 | ) | ||||
| (7,320 | ) | Saia, Inc. | (1,534,858 | ) | ||||
| (6,024,424 | ) | |||||||
Transportation Equipment — (1.5)% | ||||||||
| (32,036 | ) | Wabtec Corporation | (3,197,513 | ) | ||||
Total Industrials | (27,255,583 | ) | ||||||
Materials — (1.6)% | ||||||||
Chemicals — (1.1)% | ||||||||
| (22,456 | ) | Celanese Corporation | (2,295,901 | ) | ||||
Shares | Value | |||||||
Materials — (continued) | ||||||||
Metals & Mining — (0.5)% | ||||||||
| (7,116 | ) | Encore Wire Corporation | $ | (978,877 | ) | |||
Total Materials | (3,274,778 | ) | ||||||
Real Estate — (2.5)% | ||||||||
Real Estate Services — (0.4)% | ||||||||
| (135,343 | ) | Anywhere Real Estate, Inc. | (864,842 | ) | ||||
REIT — (2.1)% | ||||||||
| (19,044 | ) | Extra Space Storage, Inc. | (2,802,896 | ) | ||||
| (39,413 | ) | Kilroy Realty Corporation | (1,524,101 | ) | ||||
| (4,326,997 | ) | |||||||
Total Real Estate | (5,191,839 | ) | ||||||
Technology — (5.9)% | ||||||||
Semiconductors — (2.4)% | ||||||||
| (38,289 | ) | Kulicke & Soffa Industries, Inc. | (1,694,671 | ) | ||||
| (37,665 | ) | Marvell Technology, Inc. | (1,395,112 | ) | ||||
| (32,367 | ) | ON Semiconductor Corporation | (2,018,730 | ) | ||||
| (5,108,513 | ) | |||||||
Software — (1.4)% | ||||||||
| (11,097 | ) | Guidewire Software, Inc. | (694,228 | ) | ||||
| (19,891 | ) | Qualys, Inc. | (2,232,367 | ) | ||||
| (2,926,595 | ) | |||||||
Technology Hardware — (1.2)% | ||||||||
| (213,119 | ) | 3D Systems Corporation | (1,577,081 | ) | ||||
| (3,157 | ) | Ubiquiti Networks, Inc. | (863,534 | ) | ||||
| (2,440,615 | ) | |||||||
Technology Services — (0.9)% | ||||||||
| (71,557 | ) | DXC Technology Company | (1,896,260 | ) | ||||
Total Technology | (12,371,983 | ) | ||||||
See accompanying notes to financial statements. | CRM Funds | |
36 | ||
CRM FUNDS CRM LONG/SHORT OPPORTUNITIES FUND SCHEDULE OF INVESTMENTS (Continued) December 31, 2022 (Unaudited) |
Shares | Value | |||||||
Utilities — (1.3)% | ||||||||
Electric Utilities — (1.3)% | ||||||||
| (64,688 | ) | Avangrid, Inc. | $ | (2,780,290 | ) | |||
TOTAL COMMON STOCK SOLD SHORT — (Proceeds - $116,763,438) | $ | (100,732,305 | ) | |||||
OTHER ASSETS IN EXCESS OF LIABILITIES — 50.7% | 106,434,592 | |||||||
NET ASSETS — 100.0% | $ | 209,840,682 | ||||||
A summary of inputs used to value the Fund’s investments as of December 31, 2022 is as follows (see Note 2 in Notes to Financial Statements):
| Level 1 | Level 2 | Level 3 | Investments | ||||||||||||
Assets: | ||||||||||||||||
Investments in Securities: | ||||||||||||||||
Common Stock | $ | 175,970,657 | — | — | $ | 175,970,657 | ||||||||||
Short-Term Investments | 28,167,738 | — | — | 28,167,738 | ||||||||||||
Total Assets – Investments in Securities | $ | 204,138,395 | — | — | $ | 204,138,395 | ||||||||||
Other Financial Instruments:* | ||||||||||||||||
Total Return Swap Agreements – Equity Contracts | — | $ | 9,305 | — | $ | 9,305 | ||||||||||
Total Assets – Other Financial Instruments | — | $ | 9,305 | — | $ | 9,305 | ||||||||||
See accompanying notes to financial statements. | CRM Funds | |
37 | ||
CRM FUNDS CRM LONG/SHORT OPPORTUNITIES FUND SCHEDULE OF INVESTMENTS (Continued) December 31, 2022 (Unaudited) |
| Level 1 | Level 2 | Level 3 | Investments | ||||||||||||
Liabilities: | ||||||||||||||||
Investments in Securities: | ||||||||||||||||
Common Stock Sold Short | $ | (100,732,305 | ) | — | — | $ | (100,732,305 | ) | ||||||||
Total Liabilities – Investments in Securities | $ | (100,732,305 | ) | — | — | $ | (100,732,305 | ) | ||||||||
Other Financial Instruments:* | ||||||||||||||||
Total Return Swap Agreements – Equity Contracts | — | $ | (139,657 | — | $ | (139,657 | ) | |||||||||
Total Liabilities – Other Financial Instruments | — | $ | (139,657 | ) | — | $ | (139,657 | ) | ||||||||
* | Other financial instruments are derivative instruments not reflected in the Schedule of Investments, such as total return swap agreements, which are recorded at fair value. |
There were no transfers into or out of Level 3 related to securities held at December 31, 2022.
1 | Non-income producing security. |
2 | PLC - Public Limited Company. |
3 | Rate disclosed is the seven day effective yield as of December 31, 2022. |
4 | LP – Limited Partnership |
See accompanying notes to financial statements. | CRM Funds | |
38 | ||
CRM FUNDS CRM LONG/SHORT OPPORTUNITIES FUND SCHEDULE OF INVESTMENTS (Continued) December 31, 2022 (Unaudited) |
OTC Total return swap agreements outstanding at December 31, 2022:
Counterparty | Financing | Termination | Long (Short) | ||||||
Morgan Stanley | 4.98% (Fed Funds Rate + 0.65%) | 03/23/2023 | $ | 5,599,193 | |||||
Morgan Stanley | 3.88% (Fed Funds Rate minus 0.45%) | 08/1/2023 | (21,411 | ) | |||||
Morgan Stanley | 3.88% (Fed Funds Rate minus 0.45%) | 08/1/2023 | (21,585 | ) | |||||
Morgan Stanley | 3.88% (Fed Funds Rate minus 0.45%) | 08/1/2023 | (21,401 | ) | |||||
Morgan Stanley | 3.89% (Fed Funds Rate minus 0.44%) | 08/1/2023 | (21,262 | ) | |||||
Morgan Stanley | 3.89% (Fed Funds Rate minus 0.44%) | 08/1/2023 | (21,462 | ) | |||||
Morgan Stanley | 3.89% (Fed Funds Rate minus 0.44%) | 08/1/2023 | (21,448 | ) | |||||
Morgan Stanley | 3.88% (Fed Funds Rate minus 0.45%) | 08/1/2023 | (21,102 | ) | |||||
Morgan Stanley | 3.88% (Fed Funds Rate minus 0.45%) | 08/1/2023 | (21,617 | ) | |||||
Morgan Stanley | 3.89% (Fed Funds Rate minus 0.44%) | 08/1/2023 | (21,288 | ) | |||||
Morgan Stanley | 3.89% (Fed Funds Rate minus 0.44%) | 08/1/2023 | (21,061 | ) | |||||
Morgan Stanley | 3.88% (Fed Funds Rate minus 0.45%) | 08/1/2023 | (20,962 | ) | |||||
Morgan Stanley | 3.89% (Fed Funds Rate minus 0.44%) | 08/1/2023 | (20,973 | ) | |||||
Morgan Stanley | 3.88% (Fed Funds Rate minus 0.45%) | 08/1/2023 | (20,926 | ) | |||||
Morgan Stanley | 3.89% (Fed Funds Rate minus 0.44%) | 08/1/2023 | (21,131 | ) | |||||
Morgan Stanley | 3.88% (Fed Funds Rate minus 0.45%) | 08/1/2023 | (20,934 | ) | |||||
Morgan Stanley | 3.88% (Fed Funds Rate minus 0.45%) | 08/1/2023 | (20,961 | ) | |||||
Morgan Stanley | 3.89% (Fed Funds Rate minus 0.44%) | 08/1/2023 | (21,105 | ) | |||||
Morgan Stanley | 3.88% (Fed Funds Rate minus 0.45%) | 08/1/2023 | (21,108 | ) | |||||
Morgan Stanley | 3.89% (Fed Funds Rate minus 0.44%) | 08/1/2023 | (21,045 | ) | |||||
Morgan Stanley | 3.88% (Fed Funds Rate minus 0.45%) | 08/1/2023 | (20,863 | ) | |||||
See accompanying notes to financial statements. | CRM Funds | |
39 | ||
CRM FUNDS CRM LONG/SHORT OPPORTUNITIES FUND SCHEDULE OF INVESTMENTS (Continued) December 31, 2022 (Unaudited) |
OTC Total return swap agreements outstanding at December 31, 2022 (continued):
Reference | Fair | Upfront | Unrealized | |||||||||
Eagle Materials, Inc. | $ | (139,407 | ) | $ | — | $ | (139,407 | ) | ||||
Morgan Stanley Custom Swap (MSCMS684) Index(3) | 1,475 | — | 1,475 | |||||||||
Morgan Stanley Custom Swap (MSCMS685) Index(3) | 1,324 | — | 1,324 | |||||||||
Morgan Stanley Custom Swap (MSCMS686) Index(3) | 817 | — | 817 | |||||||||
Morgan Stanley Custom Swap (MSCMS687) Index(3) | 558 | — | 558 | |||||||||
Morgan Stanley Custom Swap (MSCMS688) Index(3) | 811 | — | 811 | |||||||||
Morgan Stanley Custom Swap (MSCMS689) Index(3) | 808 | — | 808 | |||||||||
Morgan Stanley Custom Swap (MSCMS690) Index(3) | 662 | — | 662 | |||||||||
Morgan Stanley Custom Swap (MSCMS691) Index(3) | 1,240 | — | 1,240 | |||||||||
Morgan Stanley Custom Swap (MSCMS692) Index(3) | 838 | — | 838 | |||||||||
Morgan Stanley Custom Swap (MSCMS693) Index(3) | 390 | — | 390 | |||||||||
Morgan Stanley Custom Swap (MSCMS694) Index(3) | 10 | — | 10 | |||||||||
Morgan Stanley Custom Swap (MSCMS695) Index(3) | 46 | — | 46 | |||||||||
Morgan Stanley Custom Swap (MSCMS696) Index(3) | (128 | ) | — | (128 | ) | |||||||
Morgan Stanley Custom Swap (MSCMS697) Index(3) | 72 | — | 72 | |||||||||
Morgan Stanley Custom Swap (MSCMS698) Index(3) | (16 | ) | — | (16 | ) | |||||||
Morgan Stanley Custom Swap (MSCMS699) Index(3) | (41 | ) | — | (41 | ) | |||||||
Morgan Stanley Custom Swap (MSCMS700) Index(3) | 110 | — | 110 | |||||||||
Morgan Stanley Custom Swap (MSCMS701) Index(3) | 144 | — | 144 | |||||||||
Morgan Stanley Custom Swap (MSCMS702) Index(3) | (33 | ) | — | (33 | ) | |||||||
Morgan Stanley Custom Swap (MSCMS703) Index(3) | (32 | ) | — | (32 | ) | |||||||
Total Unrealized Appreciation | $ | 9,305 | ||||||||||
Total Unrealized (Depreciation) | $ | (139,657 | ) | |||||||||
Total | $ | (130,352 | ) | $ | — | $ | (130,352 | ) | ||||
(1) | Paid monthly. |
(2) | Morgan Stanley acts as the counterparty to the total return swap contracts listed above. The Fund either receives fees from, or pays fees to, the counterparty, depending upon the total return of the benchmark, and the agreed -upon floating rate financing rate. |
(3) | See the tables below for the swap constituents. |
See accompanying notes to financial statements. | CRM Funds | |
40 | ||
CRM FUNDS CRM LONG/SHORT OPPORTUNITIES FUND SCHEDULE OF INVESTMENTS (Continued) December 31, 2022 (Unaudited) |
The following table represents the individual positions and related values of underlying securities of Morgan Stanley Custom Basket (MSCMS684) Index total return swap with Morgan Stanley Bank as of December 31, 2022, termination date 8/1/23:
Reference Entity | Shares | Market | % of Total | |||||||||
Allstate Corporation (The) | 12 | $ | 1,592 | 7.99 | % | |||||||
Mettler-Toledo International, Inc. | 1 | 1,503 | 7.54 | % | ||||||||
AT&T, Inc. | 81 | 1,487 | 7.46 | % | ||||||||
Motorola Solutions, Inc. | 6 | 1,470 | 7.37 | % | ||||||||
Capital One Financial Corporation | 16 | 1,451 | 7.28 | % | ||||||||
CDW Corporation | 8 | 1,448 | 7.26 | % | ||||||||
Amgen, Inc. | 5 | 1,424 | 7.14 | % | ||||||||
Discover Financial Services | 15 | 1,423 | 7.14 | % | ||||||||
Cognizant Technology Solutions Corporation | 25 | 1,416 | 7.10 | % | ||||||||
Canadian Imperial Bank of Commerce | 35 | 1,408 | 7.06 | % | ||||||||
Constellation Brands, Inc. | 6 | 1,388 | 6.96 | % | ||||||||
Apple, Inc. | 10 | 1,358 | 6.81 | % | ||||||||
General Motors Company | 38 | 1,290 | 6.47 | % | ||||||||
Ford Motor Company | 110 | 1,280 | 6.42 | % | ||||||||
| $ | 19,938 | 100.00 | % | |||||||||
The following table represents the individual positions and related values of underlying securities of Morgan Stanley Custom Basket (MSCMS685) Index total return swap with Morgan Stanley Bank as of December 31, 2022, termination date 8/1/23:
Reference Entity | Shares | Market | % of Total | |||||||||
Allstate Corporation (The) | 6 | $ | 779 | 3.84 | % | |||||||
Emerson Electric Company | 8 | 745 | 3.68 | % | ||||||||
O’Reilly Automotive, Inc. | 1 | 739 | 3.65 | % | ||||||||
LyondellBasell Industries N.V. - Class A | 9 | 735 | 3.63 | % | ||||||||
Cintas Corporation | 2 | 734 | 3.62 | % | ||||||||
Mettler-Toledo International, Inc. | 1 | 731 | 3.61 | % | ||||||||
Cummins, Inc. | 3 | 729 | 3.60 | % | ||||||||
AT&T, Inc. | 40 | 728 | 3.59 | % | ||||||||
Eaton Corporation PLC | 5 | 722 | 3.56 | % | ||||||||
Capital One Financial Corporation | 8 | 715 | 3.53 | % | ||||||||
Motorola Solutions, Inc. | 3 | 710 | 3.50 | % | ||||||||
CDW Corporation | 4 | 707 | 3.49 | % | ||||||||
Old Dominion Freight Line, Inc. | 2 | 704 | 3.47 | % | ||||||||
PACCAR, Inc. | 7 | 703 | 3.47 | % | ||||||||
See accompanying notes to financial statements. | CRM Funds | |
41 | ||
CRM FUNDS CRM LONG/SHORT OPPORTUNITIES FUND SCHEDULE OF INVESTMENTS (Continued) December 31, 2022 (Unaudited) |
Reference Entity | Shares | Market | % of Total | |||||||||
Discover Financial Services | 7 | $ | 698 | 3.44 | % | |||||||
Genuine Parts Company | 4 | 697 | 3.44 | % | ||||||||
W. W. Grainger, Inc. | 1 | 695 | 3.43 | % | ||||||||
Sherwin-Williams Company (The) | 3 | 692 | 3.42 | % | ||||||||
Fastenal Company | 15 | 692 | 3.42 | % | ||||||||
Amgen, Inc. | 3 | 692 | 3.42 | % | ||||||||
United Parcel Service - Class B | 4 | 690 | 3.41 | % | ||||||||
Cognizant Technology Solutions Corporation | 12 | 689 | 3.40 | % | ||||||||
Canadian Imperial Bank of Commerce | 17 | 689 | 3.40 | % | ||||||||
CVS Health Corporation | 7 | 683 | 3.37 | % | ||||||||
Automatic Data Processing, Inc. | 3 | 665 | 3.28 | % | ||||||||
Apple, Inc. | 5 | 661 | 3.26 | % | ||||||||
General Motors Company | 19 | 634 | 3.13 | % | ||||||||
Ford Motor Company | 54 | 631 | 3.11 | % | ||||||||
Albemarle Corporation | 3 | 573 | 2.83 | % | ||||||||
| $ | 20,262 | 100.00 | % | |||||||||
The following table represents the individual positions and related values of underlying securities of Morgan Stanley Custom Basket (MSCMS686) Index total return swap with Morgan Stanley Bank as of December 31, 2022, termination date 8/1/23:
Reference Entity | Shares | Market | % of Total | |||||||||
Estee Lauder Companies, Inc. (The) | 2 | $ | 417 | 2.03 | % | |||||||
Allstate Corporation (The) | 3 | 411 | 2.00 | % | ||||||||
Caterpillar, Inc. | 2 | 401 | 1.95 | % | ||||||||
Realty Income Corporation | 6 | 397 | 1.93 | % | ||||||||
Tractor Supply Company | 2 | 396 | 1.92 | % | ||||||||
Pfizer, Inc. | 8 | 393 | 1.91 | % | ||||||||
Emerson Electric Company | 4 | 393 | 1.91 | % | ||||||||
Dollar General Corporation | 2 | 390 | 1.89 | % | ||||||||
O’Reilly Automotive, Inc. | — | 389 | 1.89 | % | ||||||||
Mettler-Toledo International, Inc. | — | 387 | 1.88 | % | ||||||||
Hershey Company (The) | 2 | 386 | 1.87 | % | ||||||||
Ulta Beauty, Inc. | 1 | 386 | 1.87 | % | ||||||||
Cummins, Inc. | 2 | 384 | 1.87 | % | ||||||||
Home Depot, Inc. (The) | 1 | 384 | 1.86 | % | ||||||||
Prologis, Inc. | 3 | 384 | 1.86 | % | ||||||||
PepsiCo, Inc. | 2 | 384 | 1.86 | % | ||||||||
McCormick & Company, Inc. | 5 | 384 | 1.86 | % | ||||||||
See accompanying notes to financial statements. | CRM Funds | |
42 | ||
CRM FUNDS CRM LONG/SHORT OPPORTUNITIES FUND SCHEDULE OF INVESTMENTS (Continued) December 31, 2022 (Unaudited) |
Reference Entity | Shares | Market | % of Total | |||||||||
Cintas Corporation | 1 | $ | 382 | 1.86 | % | |||||||
AT&T, Inc. | 21 | 382 | 1.86 | % | ||||||||
International Flavors & Fragrances, Inc. | 4 | 382 | 1.86 | % | ||||||||
Rockwell Automation, Inc. | 1 | 382 | 1.86 | % | ||||||||
Old Dominion Freight Line, Inc. | 1 | 381 | 1.85 | % | ||||||||
Eaton Corporation PLC | 2 | 381 | 1.85 | % | ||||||||
Capital One Financial Corporation | 4 | 381 | 1.85 | % | ||||||||
General Mills, Inc. | 5 | 378 | 1.84 | % | ||||||||
Restaurant Brands International, Inc. | 6 | 378 | 1.84 | % | ||||||||
Kellogg Company | 5 | 378 | 1.84 | % | ||||||||
McDonald’s Corporation | 1 | 378 | 1.84 | % | ||||||||
Kroger Company (The) | 8 | 376 | 1.83 | % | ||||||||
Ecolab, Inc. | 3 | 376 | 1.83 | % | ||||||||
Cardinal Health, Inc. | 5 | 376 | 1.83 | % | ||||||||
Hormel Foods Corporation | 8 | 376 | 1.83 | % | ||||||||
Motorola Solutions, Inc. | 1 | 374 | 1.82 | % | ||||||||
United Parcel Service - Class B | 2 | 373 | 1.81 | % | ||||||||
Starbucks Corporation | 4 | 373 | 1.81 | % | ||||||||
PACCAR, Inc. | 4 | 373 | 1.81 | % | ||||||||
Moody’s Corporation | 1 | 372 | 1.81 | % | ||||||||
CDW Corporation | 2 | 372 | 1.81 | % | ||||||||
W. W. Grainger, Inc. | 1 | 369 | 1.79 | % | ||||||||
Cognizant Technology Solutions Corporation | 6 | 368 | 1.79 | % | ||||||||
Discover Financial Services | 4 | 368 | 1.79 | % | ||||||||
Extra Space Storage, Inc. | 2 | 365 | 1.77 | % | ||||||||
Genuine Parts Company | 2 | 365 | 1.77 | % | ||||||||
Canadian Imperial Bank of Commerce | 9 | 364 | 1.77 | % | ||||||||
Costco Wholesale Corporation | 1 | 363 | 1.76 | % | ||||||||
Fastenal Company | 8 | 362 | 1.76 | % | ||||||||
CVS Health Corporation | 4 | 355 | 1.72 | % | ||||||||
Constellation Brands, Inc. | 2 | 354 | 1.72 | % | ||||||||
Walgreens Boots Alliance, Inc. | 9 | 353 | 1.71 | % | ||||||||
Automatic Data Processing, Inc. | 1 | 351 | 1.70 | % | ||||||||
Sysco Corporation | 5 | 349 | 1.69 | % | ||||||||
Apple, Inc. | 3 | 345 | 1.68 | % | ||||||||
Lululemon Athletica, Inc. | 1 | 327 | 1.59 | % | ||||||||
CF Industries Holdings, Inc. | 4 | 320 | 1.55 | % | ||||||||
Albemarle Corporation | 1 | 318 | 1.54 | % | ||||||||
| $ | 20,586 | 100.00 | % | |||||||||
See accompanying notes to financial statements. | CRM Funds | |
43 | ||
CRM FUNDS CRM LONG/SHORT OPPORTUNITIES FUND SCHEDULE OF INVESTMENTS (Continued) December 31, 2022 (Unaudited) |
The following table represents the individual positions and related values of underlying securities of Morgan Stanley Custom Basket (MSCMS687) Index total return swap with Morgan Stanley Bank as of December 31, 2022, termination date 8/1/23:
Reference Entity | Shares | Market | % of Total | |||||||||
Caterpillar, Inc. | 2 | $ | 447 | 2.16 | % | |||||||
Estee Lauder Companies, Inc. (The) | 2 | 446 | 2.15 | % | ||||||||
Allstate Corporation (The) | 3 | 443 | 2.14 | % | ||||||||
Tractor Supply Company | 2 | 441 | 2.13 | % | ||||||||
Pfizer, Inc. | 9 | 439 | 2.12 | % | ||||||||
Emerson Electric Company | 5 | 434 | 2.10 | % | ||||||||
O’Reilly Automotive, Inc. | 1 | 433 | 2.09 | % | ||||||||
Realty Income Corporation | 7 | 431 | 2.08 | % | ||||||||
Ulta Beauty, Inc. | 1 | 429 | 2.07 | % | ||||||||
Dollar General Corporation | 2 | 427 | 2.06 | % | ||||||||
Rockwell Automation, Inc. | 2 | 427 | 2.06 | % | ||||||||
International Flavors & Fragrances, Inc. | 4 | 426 | 2.06 | % | ||||||||
Cintas Corporation | 1 | 425 | 2.05 | % | ||||||||
Hershey Company (The) | 2 | 424 | 2.05 | % | ||||||||
PepsiCo, Inc. | 2 | 424 | 2.05 | % | ||||||||
Eaton Corporation PLC | 3 | 424 | 2.05 | % | ||||||||
Mettler-Toledo International, Inc. | - | 424 | 2.05 | % | ||||||||
United Parcel Service - Class B | 2 | 423 | 2.04 | % | ||||||||
Capital One Financial Corporation | 5 | 421 | 2.03 | % | ||||||||
Old Dominion Freight Line, Inc. | 1 | 421 | 2.03 | % | ||||||||
Cummins, Inc. | 2 | 420 | 2.03 | % | ||||||||
Prologis, Inc. | 4 | 419 | 2.02 | % | ||||||||
McCormick & Company, Inc. | 5 | 418 | 2.02 | % | ||||||||
General Mills, Inc. | 5 | 418 | 2.02 | % | ||||||||
Ecolab, Inc. | 3 | 418 | 2.02 | % | ||||||||
Kellogg Company | 6 | 415 | 2.00 | % | ||||||||
Hormel Foods Corporation | 9 | 414 | 2.00 | % | ||||||||
McDonald’s Corporation | 2 | 413 | 1.99 | % | ||||||||
Motorola Solutions, Inc. | 2 | 412 | 1.99 | % | ||||||||
Cardinal Health, Inc. | 5 | 412 | 1.99 | % | ||||||||
CDW Corporation | 2 | 412 | 1.99 | % | ||||||||
Kroger Company (The) | 9 | 410 | 1.98 | % | ||||||||
AT&T, Inc. | 22 | 409 | 1.98 | % | ||||||||
Cognizant Technology Solutions Corporation | 7 | 409 | 1.98 | % | ||||||||
W. W. Grainger, Inc. | 1 | 408 | 1.97 | % | ||||||||
PACCAR, Inc. | 4 | 407 | 1.97 | % | ||||||||
Moody’s Corporation | 1 | 406 | 1.96 | % | ||||||||
See accompanying notes to financial statements. | CRM Funds | |
44 | ||
CRM FUNDS CRM LONG/SHORT OPPORTUNITIES FUND SCHEDULE OF INVESTMENTS (Continued) December 31, 2022 (Unaudited) |
Reference Entity | Shares | Market | % of Total | |||||||||
Genuine Parts Company | 2 | $ | 405 | 1.96 | % | |||||||
Fastenal Company | 8 | 402 | 1.94 | % | ||||||||
Extra Space Storage, Inc. | 3 | 402 | 1.94 | % | ||||||||
Discover Financial Services | 4 | 401 | 1.94 | % | ||||||||
Canadian Imperial Bank of Commerce | 10 | 400 | 1.93 | % | ||||||||
Constellation Brands, Inc. | 2 | 399 | 1.93 | % | ||||||||
Automatic Data Processing, Inc. | 2 | 394 | 1.90 | % | ||||||||
CVS Health Corporation | 4 | 392 | 1.89 | % | ||||||||
Walgreens Boots Alliance, Inc. | 10 | 392 | 1.89 | % | ||||||||
Apple, Inc. | 3 | 387 | 1.87 | % | ||||||||
Sysco Corporation | 5 | 387 | 1.87 | % | ||||||||
Albemarle Corporation | 2 | 358 | 1.73 | % | ||||||||
CF Industries Holdings, Inc. | 4 | 358 | 1.73 | % | ||||||||
| $ | 20,706 | 100.00 | % | |||||||||
The following table represents the individual positions and related values of underlying securities of Morgan Stanley Custom Basket (MSCMS688) Index total return swap with Morgan Stanley Bank as of December 31, 2022, termination date 8/1/23:
Reference Entity | Shares | Market | % of Total | |||||||||
Estee Lauder Companies, Inc. (The) | 2 | $ | 544 | 2.63 | % | |||||||
Caterpillar, Inc. | 2 | 533 | 2.58 | % | ||||||||
Allstate Corporation (The) | 4 | 531 | 2.57 | % | ||||||||
Pfizer, Inc. | 10 | 520 | 2.52 | % | ||||||||
Emerson Electric Company | 5 | 517 | 2.50 | % | ||||||||
Rockwell Automation, Inc. | 2 | 515 | 2.49 | % | ||||||||
Eaton Corporation PLC | 3 | 508 | 2.46 | % | ||||||||
Realty Income Corporation | 8 | 508 | 2.46 | % | ||||||||
Cintas Corporation | 1 | 508 | 2.46 | % | ||||||||
United Parcel Service - Class B | 3 | 507 | 2.45 | % | ||||||||
Cummins, Inc. | 2 | 506 | 2.45 | % | ||||||||
PepsiCo, Inc. | 3 | 505 | 2.44 | % | ||||||||
Old Dominion Freight Line, Inc. | 2 | 504 | 2.44 | % | ||||||||
Mettler-Toledo International, Inc. | — | 504 | 2.44 | % | ||||||||
Ecolab, Inc. | 3 | 501 | 2.43 | % | ||||||||
Hershey Company (The) | 2 | 499 | 2.42 | % | ||||||||
Prologis, Inc. | 4 | 495 | 2.40 | % | ||||||||
McCormick & Company, Inc. | 6 | 495 | 2.40 | % | ||||||||
International Flavors & Fragrances, Inc. | 5 | 494 | 2.39 | % | ||||||||
See accompanying notes to financial statements. | CRM Funds | |
45 | ||
CRM FUNDS CRM LONG/SHORT OPPORTUNITIES FUND SCHEDULE OF INVESTMENTS (Continued) December 31, 2022 (Unaudited) |
Reference Entity | Shares | Market | % of Total | |||||||||
CDW Corporation | 3 | $ | 492 | 2.38 | % | |||||||
Motorola Solutions, Inc. | 2 | 492 | 2.38 | % | ||||||||
Kellogg Company | 7 | 491 | 2.38 | % | ||||||||
Cognizant Technology Solutions Corporation | 9 | 491 | 2.38 | % | ||||||||
General Mills, Inc. | 6 | 490 | 2.37 | % | ||||||||
Cardinal Health, Inc. | 6 | 489 | 2.37 | % | ||||||||
Hormel Foods Corporation | 11 | 487 | 2.36 | % | ||||||||
AT&T, Inc. | 26 | 486 | 2.35 | % | ||||||||
Kroger Company (The) | 11 | 484 | 2.34 | % | ||||||||
W. W. Grainger, Inc. | 1 | 483 | 2.34 | % | ||||||||
PACCAR, Inc. | 5 | 483 | 2.34 | % | ||||||||
Discover Financial Services | 5 | 480 | 2.32 | % | ||||||||
Fastenal Company | 10 | 480 | 2.32 | % | ||||||||
Constellation Brands, Inc. | 2 | 479 | 2.32 | % | ||||||||
Extra Space Storage, Inc. | 3 | 477 | 2.31 | % | ||||||||
Canadian Imperial Bank of Commerce | 12 | 477 | 2.31 | % | ||||||||
Apple, Inc. | 4 | 470 | 2.28 | % | ||||||||
Automatic Data Processing, Inc. | 2 | 470 | 2.28 | % | ||||||||
Amgen, Inc. | 2 | 468 | 2.27 | % | ||||||||
Marvell Technology, Inc. | 13 | 467 | 2.26 | % | ||||||||
Sysco Corporation | 6 | 463 | 2.24 | % | ||||||||
CF Industries Holdings, Inc. | 5 | 432 | 2.09 | % | ||||||||
Albemarle Corporation | 2 | 429 | 2.08 | % | ||||||||
| $ | 20,654 | 100.00 | % | |||||||||
The following table represents the individual positions and related values of underlying securities of Morgan Stanley Custom Basket (MSCMS689) Index total return swap with Morgan Stanley Bank as of December 31, 2022, termination date 8/1/23:
Reference Entity | Shares | Market | % of Total | |||||||||
Allstate Corporation (The) | 6 | $ | 801 | 3.88 | % | |||||||
Estee Lauder Companies, Inc. (The) | 3 | 785 | 3.80 | % | ||||||||
Capital One Financial Corporation | 8 | 763 | 3.70 | % | ||||||||
Realty Income Corporation | 12 | 760 | 3.68 | % | ||||||||
Pfizer, Inc. | 15 | 760 | 3.68 | % | ||||||||
PepsiCo, Inc. | 4 | 755 | 3.66 | % | ||||||||
Ecolab, Inc. | 5 | 749 | 3.63 | % | ||||||||
Mettler-Toledo International, Inc. | 1 | 749 | 3.63 | % | ||||||||
International Flavors & Fragrances, Inc. | 7 | 747 | 3.62 | % | ||||||||
See accompanying notes to financial statements. | CRM Funds | |
46 | ||
CRM FUNDS CRM LONG/SHORT OPPORTUNITIES FUND SCHEDULE OF INVESTMENTS (Continued) December 31, 2022 (Unaudited) |
Reference Entity | Shares | Market | % of Total | |||||||||
Kellogg Company | 10 | $ | 745 | 3.61 | % | |||||||
McCormick & Company, Inc. | 9 | 743 | 3.60 | % | ||||||||
Cognizant Technology Solutions Corporation | 13 | 741 | 3.59 | % | ||||||||
AT&T, Inc. | 40 | 739 | 3.58 | % | ||||||||
Hershey Company (The) | 3 | 737 | 3.57 | % | ||||||||
Prologis, Inc. | 7 | 736 | 3.56 | % | ||||||||
General Mills, Inc. | 9 | 735 | 3.56 | % | ||||||||
Hormel Foods Corporation | 16 | 734 | 3.56 | % | ||||||||
CDW Corporation | 4 | 734 | 3.55 | % | ||||||||
Motorola Solutions, Inc. | 3 | 733 | 3.55 | % | ||||||||
Cardinal Health, Inc. | 10 | 731 | 3.54 | % | ||||||||
Discover Financial Services | 7 | 730 | 3.54 | % | ||||||||
Canadian Imperial Bank of Commerce | 18 | 725 | 3.51 | % | ||||||||
Constellation Brands, Inc. | 3 | 722 | 3.50 | % | ||||||||
Kroger Company (The) | 16 | 721 | 3.49 | % | ||||||||
Extra Space Storage, Inc. | 5 | 718 | 3.48 | % | ||||||||
Sysco Corporation | 9 | 700 | 3.39 | % | ||||||||
Apple, Inc. | 5 | 699 | 3.39 | % | ||||||||
Albemarle Corporation | 3 | 650 | 3.15 | % | ||||||||
| $ | 20,642 | 100.00 | % | |||||||||
The following table represents the individual positions and related values of underlying securities of Morgan Stanley Custom Basket (MSCMS690) Index total return swap with Morgan Stanley Bank as of December 31, 2022, termination date 8/1/23:
Reference Entity | Shares | Market | % of Total | |||||||||
Allstate Corporation (The) | 3 | $ | 377 | 1.85 | % | |||||||
Caterpillar, Inc. | 2 | 377 | 1.84 | % | ||||||||
Estee Lauder Companies, Inc. (The) | 1 | 369 | 1.81 | % | ||||||||
Tractor Supply Company | 2 | 369 | 1.81 | % | ||||||||
Emerson Electric Company | 4 | 365 | 1.79 | % | ||||||||
O’Reilly Automotive, Inc. | - | 365 | 1.79 | % | ||||||||
Cummins, Inc. | 2 | 364 | 1.78 | % | ||||||||
Dollar General Corporation | 1 | 362 | 1.77 | % | ||||||||
Cintas Corporation | 1 | 356 | 1.74 | % | ||||||||
Ulta Beauty, Inc. | 1 | 356 | 1.74 | % | ||||||||
Mettler-Toledo International, Inc. | - | 355 | 1.74 | % | ||||||||
Eaton Corporation PLC | 2 | 355 | 1.74 | % | ||||||||
Rockwell Automation, Inc. | 1 | 355 | 1.74 | % | ||||||||
See accompanying notes to financial statements. | CRM Funds | |
47 | ||
CRM FUNDS CRM LONG/SHORT OPPORTUNITIES FUND SCHEDULE OF INVESTMENTS (Continued) December 31, 2022 (Unaudited) |
Reference Entity | Shares | Market | % of Total | |||||||||
Cardinal Health, Inc. | 5 | $ | 355 | 1.74 | % | |||||||
Pfizer, Inc. | 7 | 354 | 1.73 | % | ||||||||
PepsiCo, Inc. | 2 | 353 | 1.73 | % | ||||||||
Home Depot, Inc. (The) | 1 | 352 | 1.72 | % | ||||||||
Kellogg Company | 5 | 352 | 1.72 | % | ||||||||
Capital One Financial Corporation | 4 | 352 | 1.72 | % | ||||||||
Realty Income Corporation | 6 | 352 | 1.72 | % | ||||||||
Cognizant Technology Solutions Corporation | 6 | 351 | 1.72 | % | ||||||||
Target Corporation | 2 | 350 | 1.71 | % | ||||||||
United Parcel Service - Class B | 2 | 350 | 1.71 | % | ||||||||
Agilent Technologies, Inc. | 2 | 350 | 1.71 | % | ||||||||
Hershey Company (The) | 2 | 350 | 1.71 | % | ||||||||
International Flavors & Fragrances, Inc. | 3 | 350 | 1.71 | % | ||||||||
PACCAR, Inc. | 4 | 350 | 1.71 | % | ||||||||
General Mills, Inc. | 4 | 349 | 1.71 | % | ||||||||
Starbucks Corporation | 4 | 349 | 1.71 | % | ||||||||
McCormick & Company, Inc. | 4 | 348 | 1.70 | % | ||||||||
Restaurant Brands International, Inc. | 5 | 348 | 1.70 | % | ||||||||
Old Dominion Freight Line, Inc. | 1 | 347 | 1.70 | % | ||||||||
Motorola Solutions, Inc. | 1 | 347 | 1.70 | % | ||||||||
Prologis, Inc. | 3 | 347 | 1.70 | % | ||||||||
Hormel Foods Corporation | 8 | 346 | 1.69 | % | ||||||||
McDonald’s Corporation | 1 | 346 | 1.69 | % | ||||||||
Ecolab, Inc. | 2 | 346 | 1.69 | % | ||||||||
Moody’s Corporation | 1 | 346 | 1.69 | % | ||||||||
AT&T, Inc. | 19 | 345 | 1.69 | % | ||||||||
CDW Corporation | 2 | 344 | 1.68 | % | ||||||||
Kroger Company (The) | 8 | 343 | 1.68 | % | ||||||||
Constellation Brands, Inc. | 1 | 342 | 1.67 | % | ||||||||
Genuine Parts Company | 2 | 340 | 1.66 | % | ||||||||
Discover Financial Services | 3 | 340 | 1.66 | % | ||||||||
W. W. Grainger, Inc. | 1 | 338 | 1.65 | % | ||||||||
Costco Wholesale Corporation | 1 | 338 | 1.65 | % | ||||||||
Canadian Imperial Bank of Commerce | 8 | 337 | 1.65 | % | ||||||||
Amgen, Inc. | 1 | 337 | 1.65 | % | ||||||||
Extra Space Storage, Inc. | 2 | 336 | 1.64 | % | ||||||||
Sysco Corporation | 4 | 332 | 1.62 | % | ||||||||
Automatic Data Processing, Inc. | 1 | 332 | 1.62 | % | ||||||||
Fastenal Company | 7 | 332 | 1.62 | % | ||||||||
Walgreens Boots Alliance, Inc. | 9 | 330 | 1.62 | % | ||||||||
CVS Health Corporation | 4 | 328 | 1.61 | % | ||||||||
Apple, Inc. | 3 | 327 | 1.60 | % | ||||||||
Marvell Technology, Inc. | 9 | 319 | 1.56 | % | ||||||||
See accompanying notes to financial statements. | CRM Funds | |
48 | ||
CRM FUNDS CRM LONG/SHORT OPPORTUNITIES FUND SCHEDULE OF INVESTMENTS (Continued) December 31, 2022 (Unaudited) |
Reference Entity | Shares | Market | % of Total | |||||||||
Ford Motor Company | 27 | $ | 316 | 1.55 | % | |||||||
General Motors Company | 9 | 314 | 1.54 | % | ||||||||
Albemarle Corporation | 1 | 306 | 1.50 | % | ||||||||
| $ | 20,441 | 100.00 | % | |||||||||
The following table represents the individual positions and related values of underlying securities of Morgan Stanley Custom Basket (MSCMS691) Index total return swap with Morgan Stanley Bank as of December 31, 2022, termination date 8/1/23:
Reference Entity | Shares | Market | % of Total | |||||||||
Allstate Corporation (The) | 4 | $ | 544 | 2.67 | % | |||||||
Tractor Supply Company | 2 | 542 | 2.66 | % | ||||||||
Estee Lauder Companies, Inc. (The) | 2 | 525 | 2.58 | % | ||||||||
O’Reilly Automotive, Inc. | 1 | 523 | 2.57 | % | ||||||||
Dollar General Corporation | 2 | 520 | 2.55 | % | ||||||||
Ulta Beauty, Inc. | 1 | 514 | 2.52 | % | ||||||||
Target Corporation | 3 | 514 | 2.52 | % | ||||||||
International Flavors & Fragrances, Inc. | 5 | 511 | 2.51 | % | ||||||||
Pfizer, Inc. | 10 | 508 | 2.49 | % | ||||||||
PepsiCo, Inc. | 3 | 508 | 2.49 | % | ||||||||
Realty Income Corporation | 8 | 507 | 2.49 | % | ||||||||
Mettler-Toledo International, Inc. | - | 503 | 2.47 | % | ||||||||
Cognizant Technology Solutions Corporation | 9 | 501 | 2.46 | % | ||||||||
Hershey Company (The) | 2 | 500 | 2.45 | % | ||||||||
Ecolab, Inc. | 3 | 500 | 2.45 | % | ||||||||
Cardinal Health, Inc. | 7 | 500 | 2.45 | % | ||||||||
Starbucks Corporation | 5 | 499 | 2.45 | % | ||||||||
General Mills, Inc. | 6 | 499 | 2.45 | % | ||||||||
Hormel Foods Corporation | 11 | 499 | 2.45 | % | ||||||||
McCormick & Company, Inc. | 6 | 499 | 2.45 | % | ||||||||
Home Depot, Inc. (The) | 2 | 498 | 2.44 | % | ||||||||
Kellogg Company | 7 | 498 | 2.44 | % | ||||||||
Restaurant Brands International, Inc. | 8 | 496 | 2.43 | % | ||||||||
Moody’s Corporation | 2 | 495 | 2.43 | % | ||||||||
Prologis, Inc. | 4 | 494 | 2.42 | % | ||||||||
Kroger Company (The) | 11 | 494 | 2.42 | % | ||||||||
AT&T, Inc. | 27 | 493 | 2.42 | % | ||||||||
Genuine Parts Company | 3 | 493 | 2.42 | % | ||||||||
McDonald’s Corporation | 2 | 493 | 2.42 | % | ||||||||
See accompanying notes to financial statements. | CRM Funds | |
49 | ||
CRM FUNDS CRM LONG/SHORT OPPORTUNITIES FUND SCHEDULE OF INVESTMENTS (Continued) December 31, 2022 (Unaudited) |
Reference Entity | Shares | Market | % of Total | |||||||||
Motorola Solutions, Inc. | 2 | $ | 492 | 2.41 | % | |||||||
Amgen, Inc. | 2 | 491 | 2.41 | % | ||||||||
Constellation Brands, Inc. | 2 | 488 | 2.39 | % | ||||||||
CDW Corporation | 3 | 487 | 2.39 | % | ||||||||
Costco Wholesale Corporation | 1 | 484 | 2.38 | % | ||||||||
Discover Financial Services | 5 | 480 | 2.36 | % | ||||||||
Extra Space Storage, Inc. | 3 | 480 | 2.36 | % | ||||||||
Sysco Corporation | 6 | 476 | 2.34 | % | ||||||||
Walgreens Boots Alliance, Inc. | 13 | 470 | 2.31 | % | ||||||||
Apple, Inc. | 4 | 465 | 2.28 | % | ||||||||
CVS Health Corporation | 5 | 464 | 2.28 | % | ||||||||
Albemarle Corporation | 2 | 432 | 2.12 | % | ||||||||
| $ | 20,379 | 100.00 | % | |||||||||
The following table represents the individual positions and related values of underlying securities of Morgan Stanley Custom Basket (MSCMS692) Index total return swap with Morgan Stanley Bank as of December 31, 2022, termination date 8/1/23:
Reference Entity | Shares | Market | % of Total | |||||||||
Tractor Supply Company | 2 | $ | 379 | 1.85 | % | |||||||
Allstate Corporation (The) | 3 | 376 | 1.84 | % | ||||||||
O’Reilly Automotive, Inc. | — | 372 | 1.82 | % | ||||||||
Caterpillar, Inc. | 2 | 367 | 1.79 | % | ||||||||
Dollar General Corporation | 1 | 365 | 1.78 | % | ||||||||
Ulta Beauty, Inc. | 1 | 365 | 1.78 | % | ||||||||
Estee Lauder Companies, Inc. (The) | 1 | 361 | 1.76 | % | ||||||||
Cummins, Inc. | 1 | 360 | 1.76 | % | ||||||||
Waters Corporation | 1 | 359 | 1.75 | % | ||||||||
Target Corporation | 2 | 357 | 1.74 | % | ||||||||
Church & Dwight Company, Inc. | 4 | 355 | 1.74 | % | ||||||||
PepsiCo, Inc. | 2 | 355 | 1.74 | % | ||||||||
Cardinal Health, Inc. | 5 | 355 | 1.74 | % | ||||||||
Kroger Company (The) | 8 | 354 | 1.73 | % | ||||||||
Hershey Company (The) | 2 | 354 | 1.73 | % | ||||||||
Emerson Electric Company | 4 | 354 | 1.73 | % | ||||||||
International Flavors & Fragrances, Inc. | 3 | 353 | 1.73 | % | ||||||||
Cintas Corporation | 1 | 353 | 1.73 | % | ||||||||
Realty Income Corporation | 6 | 352 | 1.72 | % | ||||||||
Hormel Foods Corporation | 8 | 352 | 1.72 | % | ||||||||
See accompanying notes to financial statements. | CRM Funds | |
50 | ||
CRM FUNDS CRM LONG/SHORT OPPORTUNITIES FUND SCHEDULE OF INVESTMENTS (Continued) December 31, 2022 (Unaudited) |
Reference Entity | Shares | Market | % of Total | |||||||||
Genuine Parts Company | 2 | $ | 352 | 1.72 | % | |||||||
Starbucks Corporation | 4 | 351 | 1.72 | % | ||||||||
Canadian Imperial Bank of Commerce | 9 | 351 | 1.72 | % | ||||||||
PACCAR, Inc. | 4 | 350 | 1.71 | % | ||||||||
Kellogg Company | 5 | 349 | 1.71 | % | ||||||||
Cognizant Technology Solutions Corporation | 6 | 349 | 1.71 | % | ||||||||
Pfizer, Inc. | 7 | 349 | 1.71 | % | ||||||||
Amgen, Inc. | 1 | 348 | 1.70 | % | ||||||||
Motorola Solutions, Inc. | 1 | 348 | 1.70 | % | ||||||||
General Mills, Inc. | 4 | 348 | 1.70 | % | ||||||||
AT&T, Inc. | 19 | 348 | 1.70 | % | ||||||||
Constellation Brands, Inc. | 1 | 347 | 1.70 | % | ||||||||
Restaurant Brands International, Inc. | 5 | 347 | 1.70 | % | ||||||||
McDonald’s Corporation | 1 | 347 | 1.70 | % | ||||||||
Eaton Corporation PLC | 2 | 346 | 1.69 | % | ||||||||
McCormick & Company, Inc. | 4 | 346 | 1.69 | % | ||||||||
Mettler-Toledo International, Inc. | — | 345 | 1.69 | % | ||||||||
Ecolab, Inc. | 2 | 344 | 1.68 | % | ||||||||
W. W. Grainger, Inc. | 1 | 343 | 1.68 | % | ||||||||
Agilent Technologies, Inc. | 2 | 343 | 1.68 | % | ||||||||
Home Depot, Inc. (The) | 1 | 343 | 1.68 | % | ||||||||
Rockwell Automation, Inc. | 1 | 342 | 1.67 | % | ||||||||
United Parcel Service - Class B | 2 | 341 | 1.67 | % | ||||||||
Fastenal Company | 7 | 341 | 1.67 | % | ||||||||
Capital One Financial Corporation | 4 | 339 | 1.66 | % | ||||||||
Costco Wholesale Corporation | 1 | 338 | 1.65 | % | ||||||||
Extra Space Storage, Inc. | 2 | 337 | 1.65 | % | ||||||||
Old Dominion Freight Line, Inc. | 1 | 336 | 1.64 | % | ||||||||
Prologis, Inc. | 3 | 336 | 1.64 | % | ||||||||
Sysco Corporation | 4 | 334 | 1.63 | % | ||||||||
CDW Corporation | 2 | 334 | 1.63 | % | ||||||||
Moody’s Corporation | 1 | 333 | 1.63 | % | ||||||||
CVS Health Corporation | 4 | 332 | 1.62 | % | ||||||||
Discover Financial Services | 3 | 331 | 1.62 | % | ||||||||
Automatic Data Processing, Inc. | 1 | 329 | 1.61 | % | ||||||||
Walgreens Boots Alliance, Inc. | 9 | 329 | 1.61 | % | ||||||||
Apple, Inc. | 2 | 322 | 1.57 | % | ||||||||
Marvell Technology, Inc. | 8 | 307 | 1.50 | % | ||||||||
Albemarle Corporation | 1 | 299 | 1.46 | % | ||||||||
| $ | 20,452 | 100.00 | % | |||||||||
See accompanying notes to financial statements. | CRM Funds | |
51 | ||
CRM FUNDS CRM LONG/SHORT OPPORTUNITIES FUND SCHEDULE OF INVESTMENTS (Continued) December 31, 2022 (Unaudited) |
The following table represents the individual positions and related values of underlying securities of Morgan Stanley Custom Basket (MSCMS693) Index total return swap with Morgan Stanley Bank as of December 31, 2022, termination date 8/1/23:
Reference Entity | Shares | Market | % of Total | |||||||||
Tractor Supply Company | 2 | $ | 556 | 2.69 | % | |||||||
Allstate Corporation (The) | 4 | 556 | 2.69 | % | ||||||||
O’Reilly Automotive, Inc. | 1 | 552 | 2.67 | % | ||||||||
Ulta Beauty, Inc. | 1 | 540 | 2.61 | % | ||||||||
Kroger Company (The) | 12 | 530 | 2.56 | % | ||||||||
Waters Corporation | 2 | 530 | 2.56 | % | ||||||||
Dollar General Corporation | 2 | 530 | 2.56 | % | ||||||||
International Flavors & Fragrances, Inc. | 5 | 529 | 2.56 | % | ||||||||
LyondellBasell Industries N.V. - Class A | 6 | 528 | 2.55 | % | ||||||||
PepsiCo, Inc. | 3 | 525 | 2.54 | % | ||||||||
Cognizant Technology Solutions Corporation | 9 | 523 | 2.53 | % | ||||||||
Hershey Company (The) | 2 | 522 | 2.53 | % | ||||||||
Realty Income Corporation | 8 | 522 | 2.53 | % | ||||||||
HCA Healthcare, Inc. | 2 | 522 | 2.52 | % | ||||||||
Mettler-Toledo International, Inc. | — | 522 | 2.52 | % | ||||||||
Hormel Foods Corporation | 11 | 522 | 2.52 | % | ||||||||
Cardinal Health, Inc. | 7 | 521 | 2.52 | % | ||||||||
Target Corporation | 3 | 520 | 2.52 | % | ||||||||
Starbucks Corporation | 5 | 517 | 2.50 | % | ||||||||
Motorola Solutions, Inc. | 2 | 516 | 2.50 | % | ||||||||
Genuine Parts Company | 3 | 516 | 2.50 | % | ||||||||
Amgen, Inc. | 2 | 516 | 2.50 | % | ||||||||
Constellation Brands, Inc. | 2 | 515 | 2.49 | % | ||||||||
Agilent Technologies, Inc. | 3 | 515 | 2.49 | % | ||||||||
Kellogg Company | 7 | 515 | 2.49 | % | ||||||||
McCormick & Company, Inc. | 6 | 512 | 2.48 | % | ||||||||
Restaurant Brands International, Inc. | 8 | 512 | 2.48 | % | ||||||||
General Mills, Inc. | 6 | 511 | 2.47 | % | ||||||||
McDonald’s Corporation | 2 | 511 | 2.47 | % | ||||||||
Sherwin-Williams Company (The) | 2 | 508 | 2.46 | % | ||||||||
Home Depot, Inc. (The) | 2 | 504 | 2.44 | % | ||||||||
Costco Wholesale Corporation | 1 | 503 | 2.43 | % | ||||||||
Extra Space Storage, Inc. | 3 | 502 | 2.43 | % | ||||||||
Pfizer, Inc. | 10 | 501 | 2.42 | % | ||||||||
Sysco Corporation | 6 | 496 | 2.40 | % | ||||||||
CDW Corporation | 3 | 495 | 2.39 | % | ||||||||
Prologis, Inc. | 4 | 494 | 2.39 | % | ||||||||
See accompanying notes to financial statements. | CRM Funds | |
52 | ||
CRM FUNDS CRM LONG/SHORT OPPORTUNITIES FUND SCHEDULE OF INVESTMENTS (Continued) December 31, 2022 (Unaudited) |
Reference Entity | Shares | Market | % of Total | |||||||||
CVS Health Corporation | 5 | $ | 493 | 2.38 | % | |||||||
Walgreens Boots Alliance, Inc. | 13 | 490 | 2.37 | % | ||||||||
Apple, Inc. | 4 | 483 | 2.34 | % | ||||||||
| $ | 20,675 | 100.00 | % | |||||||||
The following table represents the individual positions and related values of underlying securities of Morgan Stanley Custom Basket (MSCMS694) Index total return swap with Morgan Stanley Bank as of December 31, 2022, termination date 8/1/23:
Reference Entity | Shares | Market | % of Total | |||||||||
Waters Corporation | 21 | $ | 7,036 | 33.58 | % | |||||||
Agilent Technologies, Inc. | 47 | 6,977 | 33.30 | % | ||||||||
Amgen, Inc. | 26 | 6,941 | 33.12 | % | ||||||||
| $ | 20,954 | 100.00 | % | |||||||||
The following table represents the individual positions and related values of underlying securities of Morgan Stanley Custom Basket (MSCMS695) Index total return swap with Morgan Stanley Bank as of December 31, 2022, termination date 8/1/23:
Reference Entity | Shares | Market | % of Total | |||||||||
Tractor Supply Company | 3 | $ | 660 | 3.15 | % | |||||||
Ulta Beauty, Inc. | 1 | 642 | 3.07 | % | ||||||||
O’Reilly Automotive, Inc. | 1 | 642 | 3.07 | % | ||||||||
Allstate Corporation (The) | 5 | 638 | 3.05 | % | ||||||||
LyondellBasell Industries N.V. - Class A | 8 | 636 | 3.04 | % | ||||||||
Cognizant Technology Solutions Corporation | 11 | 636 | 3.04 | % | ||||||||
Motorola Solutions, Inc. | 2 | 631 | 3.02 | % | ||||||||
Waters Corporation | 2 | 625 | 2.99 | % | ||||||||
Mettler-Toledo International, Inc. | — | 625 | 2.99 | % | ||||||||
Kroger Company (The) | 14 | 621 | 2.97 | % | ||||||||
Prologis, Inc. | 6 | 620 | 2.96 | % | ||||||||
Starbucks Corporation | 6 | 620 | 2.96 | % | ||||||||
Agilent Technologies, Inc. | 4 | 619 | 2.96 | % | ||||||||
PepsiCo, Inc. | 3 | 619 | 2.96 | % | ||||||||
Realty Income Corporation | 10 | 617 | 2.95 | % | ||||||||
Pfizer, Inc. | 12 | 616 | 2.94 | % | ||||||||
See accompanying notes to financial statements. | CRM Funds | |
53 | ||
CRM FUNDS CRM LONG/SHORT OPPORTUNITIES FUND SCHEDULE OF INVESTMENTS (Continued) December 31, 2022 (Unaudited) |
Reference Entity | Shares | Market | % of Total | |||||||||
AT&T, Inc. | 33 | $ | 615 | 2.94 | % | |||||||
Dollar General Corporation | 2 | 613 | 2.93 | % | ||||||||
McDonald’s Corporation | 2 | 612 | 2.92 | % | ||||||||
Costco Wholesale Corporation | 1 | 611 | 2.92 | % | ||||||||
Sherwin-Williams Company (The) | 3 | 610 | 2.91 | % | ||||||||
Extra Space Storage, Inc. | 4 | 609 | 2.91 | % | ||||||||
CDW Corporation | 3 | 608 | 2.91 | % | ||||||||
Amgen, Inc. | 2 | 607 | 2.90 | % | ||||||||
Genuine Parts Company | 3 | 606 | 2.90 | % | ||||||||
Restaurant Brands International, Inc. | 9 | 605 | 2.89 | % | ||||||||
Home Depot, Inc. (The) | 2 | 603 | 2.88 | % | ||||||||
CVS Health Corporation | 6 | 603 | 2.88 | % | ||||||||
Cardinal Health, Inc. | 8 | 599 | 2.86 | % | ||||||||
Apple, Inc. | 5 | 597 | 2.85 | % | ||||||||
General Mills, Inc. | 7 | 596 | 2.85 | % | ||||||||
Walgreens Boots Alliance, Inc. | 16 | 591 | 2.82 | % | ||||||||
ON Semiconductor Corporation | 9 | 589 | 2.81 | % | ||||||||
Marvell Technology, Inc. | 16 | 587 | 2.80 | % | ||||||||
| $ | 20,928 | 100.00 | % | |||||||||
The following table represents the individual positions and related values of underlying securities of Morgan Stanley Custom Basket (MSCMS696) Index total return swap with Morgan Stanley Bank as of December 31, 2022, termination date 8/1/23:
Reference Entity | Shares | Market | % of Total | |||||||||
Agilent Technologies, Inc. | 47 | $ | 7,095 | 33.70 | % | |||||||
Waters Corporation | 21 | 7,076 | 33.60 | % | ||||||||
Amgen, Inc. | 26 | 6,886 | 32.70 | % | ||||||||
| $ | 21,057 | 100.00 | % | |||||||||
See accompanying notes to financial statements. | CRM Funds | |
54 | ||
CRM FUNDS CRM LONG/SHORT OPPORTUNITIES FUND SCHEDULE OF INVESTMENTS (Continued) December 31, 2022 (Unaudited) |
The following table represents the individual positions and related values of underlying securities of Morgan Stanley Custom Basket (MSCMS697) Index total return swap with Morgan Stanley Bank as of December 31, 2022, termination date 8/1/23:
Reference Entity | Shares | Market | % of Total | |||||||||
Ulta Beauty, Inc. | 1 | $ | 477 | 2.26 | % | |||||||
Cognizant Technology Solutions Corporation | 8 | 464 | 2.20 | % | ||||||||
Mettler-Toledo International, Inc. | — | 460 | 2.18 | % | ||||||||
LyondellBasell Industries N.V. - Class A | 6 | 459 | 2.18 | % | ||||||||
International Flavors & Fragrances, Inc. | 4 | 458 | 2.17 | % | ||||||||
O’Reilly Automotive, Inc. | 1 | 458 | 2.17 | % | ||||||||
Cummins, Inc. | 2 | 456 | 2.17 | % | ||||||||
Ecolab, Inc. | 3 | 455 | 2.16 | % | ||||||||
AT&T, Inc. | 25 | 455 | 2.16 | % | ||||||||
Caterpillar, Inc. | 2 | 455 | 2.16 | % | ||||||||
Cintas Corporation | 1 | 455 | 2.16 | % | ||||||||
Allstate Corporation (The) | 3 | 453 | 2.15 | % | ||||||||
Ford Motor Company | 39 | 453 | 2.15 | % | ||||||||
Rockwell Automation, Inc. | 2 | 452 | 2.15 | % | ||||||||
Starbucks Corporation | 5 | 452 | 2.15 | % | ||||||||
Emerson Electric Company | 5 | 452 | 2.15 | % | ||||||||
General Mills, Inc. | 5 | 451 | 2.14 | % | ||||||||
Motorola Solutions, Inc. | 2 | 450 | 2.14 | % | ||||||||
Constellation Brands, Inc. | 2 | 450 | 2.14 | % | ||||||||
Hormel Foods Corporation | 10 | 450 | 2.14 | % | ||||||||
HCA Healthcare, Inc. | 2 | 450 | 2.14 | % | ||||||||
Eaton Corporation PLC | 3 | 450 | 2.14 | % | ||||||||
General Dynamics Corporation | 2 | 450 | 2.14 | % | ||||||||
Kellogg Company | 6 | 448 | 2.13 | % | ||||||||
United Parcel Service - Class B | 3 | 447 | 2.12 | % | ||||||||
Restaurant Brands International, Inc. | 7 | 447 | 2.12 | % | ||||||||
Kroger Company (The) | 10 | 447 | 2.12 | % | ||||||||
McCormick & Company, Inc. | 5 | 446 | 2.12 | % | ||||||||
Old Dominion Freight Line, Inc. | 2 | 446 | 2.12 | % | ||||||||
Pfizer, Inc. | 9 | 446 | 2.12 | % | ||||||||
CDW Corporation | 2 | 446 | 2.12 | % | ||||||||
Costco Wholesale Corporation | 1 | 446 | 2.12 | % | ||||||||
PepsiCo, Inc. | 2 | 445 | 2.11 | % | ||||||||
PACCAR, Inc. | 4 | 445 | 2.11 | % | ||||||||
Sherwin-Williams Company (The) | 2 | 444 | 2.11 | % | ||||||||
Fastenal Company | 9 | 444 | 2.11 | % | ||||||||
Hershey Company (The) | 2 | 443 | 2.10 | % | ||||||||
See accompanying notes to financial statements. | CRM Funds | |
55 | ||
CRM FUNDS CRM LONG/SHORT OPPORTUNITIES FUND SCHEDULE OF INVESTMENTS (Continued) December 31, 2022 (Unaudited) |
Reference Entity | Shares | Market | % of Total | |||||||||
W. W. Grainger, Inc. | 1 | $ | 442 | 2.10 | % | |||||||
Genuine Parts Company | 3 | 441 | 2.09 | % | ||||||||
McDonald’s Corporation | 2 | 441 | 2.09 | % | ||||||||
Apple, Inc. | 3 | 439 | 2.08 | % | ||||||||
CVS Health Corporation | 5 | 438 | 2.08 | % | ||||||||
Automatic Data Processing, Inc. | 2 | 438 | 2.08 | % | ||||||||
Sysco Corporation | 6 | 436 | 2.07 | % | ||||||||
Cardinal Health, Inc. | 6 | 432 | 2.05 | % | ||||||||
General Motors Company | 13 | 427 | 2.03 | % | ||||||||
Walgreens Boots Alliance, Inc. | 11 | 422 | 2.00 | % | ||||||||
| $ | 21,061 | 100.00 | % | |||||||||
The following table represents the individual positions and related values of underlying securities of Morgan Stanley Custom Basket (MSCMS698) Index total return swap with Morgan Stanley Bank as of December 31, 2022, termination date 8/1/23:
Reference Entity | Shares | Market | % of Total | |||||||||
Tractor Supply Company | 3 | $ | 615 | 2.93 | % | |||||||
Target Corporation | 4 | 614 | 2.93 | % | ||||||||
Ulta Beauty, Inc. | 1 | 608 | 2.90 | % | ||||||||
Cognizant Technology Solutions Corporation | 11 | 603 | 2.88 | % | ||||||||
AT&T, Inc. | 32 | 595 | 2.84 | % | ||||||||
O’Reilly Automotive, Inc. | 1 | 593 | 2.83 | % | ||||||||
LyondellBasell Industries N.V. - Class A | 7 | 591 | 2.82 | % | ||||||||
Allstate Corporation (The) | 4 | 590 | 2.82 | % | ||||||||
Dollar General Corporation | 2 | 590 | 2.82 | % | ||||||||
Starbucks Corporation | 6 | 589 | 2.81 | % | ||||||||
Hormel Foods Corporation | 13 | 588 | 2.81 | % | ||||||||
Kroger Company (The) | 13 | 588 | 2.81 | % | ||||||||
Mettler-Toledo International, Inc. | — | 587 | 2.80 | % | ||||||||
Motorola Solutions, Inc. | 2 | 587 | 2.80 | % | ||||||||
Constellation Brands, Inc. | 3 | 582 | 2.78 | % | ||||||||
Kellogg Company | 8 | 582 | 2.78 | % | ||||||||
Pfizer, Inc. | 11 | 581 | 2.77 | % | ||||||||
CVS Health Corporation | 6 | 580 | 2.77 | % | ||||||||
PepsiCo, Inc. | 3 | 580 | 2.77 | % | ||||||||
Home Depot, Inc. (The) | 2 | 580 | 2.77 | % | ||||||||
Costco Wholesale Corporation | 1 | 579 | 2.76 | % | ||||||||
HCA Healthcare, Inc. | 2 | 579 | 2.76 | % | ||||||||
See accompanying notes to financial statements. | CRM Funds | |
56 | ||
CRM FUNDS CRM LONG/SHORT OPPORTUNITIES FUND SCHEDULE OF INVESTMENTS (Continued) December 31, 2022 (Unaudited) |
Reference Entity | Shares | Market | % of Total | |||||||||
Realty Income Corporation | 9 | $ | 579 | 2.76 | % | |||||||
Ford Motor Company | 50 | 579 | 2.76 | % | ||||||||
CDW Corporation | 3 | 578 | 2.76 | % | ||||||||
Hershey Company (The) | 2 | 578 | 2.76 | % | ||||||||
McDonald’s Corporation | 2 | 576 | 2.75 | % | ||||||||
Restaurant Brands International, Inc. | 9 | 575 | 2.74 | % | ||||||||
Sherwin-Williams Company (The) | 2 | 574 | 2.74 | % | ||||||||
Genuine Parts Company | 3 | 571 | 2.72 | % | ||||||||
Walgreens Boots Alliance, Inc. | 15 | 567 | 2.71 | % | ||||||||
Cardinal Health, Inc. | 7 | 563 | 2.69 | % | ||||||||
Apple, Inc. | 4 | 562 | 2.68 | % | ||||||||
ON Semiconductor Corporation | 9 | 562 | 2.68 | % | ||||||||
Marvell Technology, Inc. | 15 | 559 | 2.67 | % | ||||||||
General Motors Company | 16 | 549 | 2.62 | % | ||||||||
| $ | 20,953 | 100.00 | % | |||||||||
The following table represents the individual positions and related values of underlying securities of Morgan Stanley Custom Basket (MSCMS699) Index total return swap with Morgan Stanley Bank as of December 31, 2022, termination date 8/1/23:
Reference Entity | Shares | Market | % of Total | |||||||||
Cognizant Technology Solutions Corporation | 8 | $ | 461 | 2.19 | % | |||||||
Ford Motor Company | 40 | 459 | 2.19 | % | ||||||||
Ulta Beauty, Inc. | 1 | 459 | 2.19 | % | ||||||||
O’Reilly Automotive, Inc. | 1 | 458 | 2.18 | % | ||||||||
LyondellBasell Industries N.V. - Class A | 5 | 455 | 2.17 | % | ||||||||
International Flavors & Fragrances, Inc. | 4 | 453 | 2.16 | % | ||||||||
Emerson Electric Company | 5 | 451 | 2.15 | % | ||||||||
Motorola Solutions, Inc. | 2 | 451 | 2.15 | % | ||||||||
Caterpillar, Inc. | 2 | 451 | 2.15 | % | ||||||||
AT&T, Inc. | 24 | 450 | 2.14 | % | ||||||||
Extra Space Storage, Inc. | 3 | 450 | 2.14 | % | ||||||||
Cummins, Inc. | 2 | 450 | 2.14 | % | ||||||||
Old Dominion Freight Line, Inc. | 2 | 450 | 2.14 | % | ||||||||
Rockwell Automation, Inc. | 2 | 450 | 2.14 | % | ||||||||
General Dynamics Corporation | 2 | 450 | 2.14 | % | ||||||||
Eaton Corporation PLC | 3 | 449 | 2.14 | % | ||||||||
Mettler-Toledo International, Inc. | — | 449 | 2.14 | % | ||||||||
CDW Corporation | 3 | 449 | 2.14 | % | ||||||||
General Motors Company | 13 | 448 | 2.13 | % | ||||||||
Constellation Brands, Inc. | 2 | 448 | 2.13 | % | ||||||||
See accompanying notes to financial statements. | CRM Funds | |
57 | ||
CRM FUNDS CRM LONG/SHORT OPPORTUNITIES FUND SCHEDULE OF INVESTMENTS (Continued) December 31, 2022 (Unaudited) |
Reference Entity | Shares | Market | % of Total | |||||||||
Hormel Foods Corporation | 10 | $ | 448 | 2.13 | % | |||||||
Dollar General Corporation | 2 | 448 | 2.13 | % | ||||||||
Allstate Corporation (The) | 3 | 447 | 2.13 | % | ||||||||
Restaurant Brands International, Inc. | 7 | 447 | 2.13 | % | ||||||||
Realty Income Corporation | 7 | 447 | 2.13 | % | ||||||||
Automatic Data Processing, Inc. | 2 | 446 | 2.12 | % | ||||||||
Cintas Corporation | 1 | 446 | 2.12 | % | ||||||||
CVS Health Corporation | 5 | 446 | 2.12 | % | ||||||||
PepsiCo, Inc. | 2 | 446 | 2.12 | % | ||||||||
Costco Wholesale Corporation | 1 | 445 | 2.12 | % | ||||||||
HCA Healthcare, Inc. | 2 | 445 | 2.12 | % | ||||||||
Kellogg Company | 6 | 444 | 2.11 | % | ||||||||
Pfizer, Inc. | 9 | 443 | 2.11 | % | ||||||||
Fastenal Company | 9 | 443 | 2.11 | % | ||||||||
McDonald’s Corporation | 2 | 443 | 2.11 | % | ||||||||
Genuine Parts Company | 3 | 443 | 2.11 | % | ||||||||
PACCAR, Inc. | 4 | 443 | 2.11 | % | ||||||||
W. W. Grainger, Inc. | 1 | 443 | 2.11 | % | ||||||||
Sysco Corporation | 6 | 442 | 2.10 | % | ||||||||
United Parcel Service - Class B | 3 | 442 | 2.10 | % | ||||||||
Hershey Company (The) | 2 | 440 | 2.10 | % | ||||||||
Kroger Company (The) | 10 | 440 | 2.10 | % | ||||||||
McCormick & Company, Inc. | 5 | 440 | 2.10 | % | ||||||||
General Mills, Inc. | 5 | 440 | 2.10 | % | ||||||||
Sherwin-Williams Company (The) | 2 | 440 | 2.09 | % | ||||||||
Apple, Inc. | 3 | 439 | 2.09 | % | ||||||||
Cardinal Health, Inc. | 6 | 426 | 2.03 | % | ||||||||
| $ | 21,003 | 100.00 | % | |||||||||
The following table represents the individual positions and related values of underlying securities of Morgan Stanley Custom Basket (MSCMS700) Index total return swap with Morgan Stanley Bank as of December 31, 2022, termination date 8/1/23:
Reference Entity | Shares | Market | % of Total | |||||||||
Tractor Supply Company | 2 | $ | 465 | 2.21 | % | |||||||
Ulta Beauty, Inc. | 1 | 461 | 2.20 | % | ||||||||
Ford Motor Company | 40 | 460 | 2.19 | % | ||||||||
Cognizant Technology Solutions Corporation | 8 | 458 | 2.18 | % | ||||||||
O’Reilly Automotive, Inc. | 1 | 455 | 2.17 | % | ||||||||
International Flavors & Fragrances, Inc. | 4 | 453 | 2.16 | % | ||||||||
AT&T, Inc. | 25 | 451 | 2.15 | % | ||||||||
See accompanying notes to financial statements. | CRM Funds | |
58 | ||
CRM FUNDS CRM LONG/SHORT OPPORTUNITIES FUND SCHEDULE OF INVESTMENTS (Continued) December 31, 2022 (Unaudited) |
Reference Entity | Shares | Market | % of Total | |||||||||
Emerson Electric Company | 5 | $ | 451 | 2.15 | % | |||||||
Mettler-Toledo International, Inc. | — | 451 | 2.15 | % | ||||||||
Cummins, Inc. | 2 | 451 | 2.15 | % | ||||||||
Motorola Solutions, Inc. | 2 | 451 | 2.15 | % | ||||||||
Rockwell Automation, Inc. | 2 | 450 | 2.14 | % | ||||||||
CDW Corporation | 3 | 450 | 2.14 | % | ||||||||
Eaton Corporation PLC | 3 | 449 | 2.14 | % | ||||||||
General Dynamics Corporation | 2 | 449 | 2.14 | % | ||||||||
ON Semiconductor Corporation | 7 | 449 | 2.14 | % | ||||||||
LyondellBasell Industries N.V. - Class A | 5 | 448 | 2.13 | % | ||||||||
Caterpillar, Inc. | 2 | 448 | 2.13 | % | ||||||||
Hormel Foods Corporation | 10 | 448 | 2.13 | % | ||||||||
Constellation Brands, Inc. | 2 | 448 | 2.13 | % | ||||||||
HCA Healthcare, Inc. | 2 | 448 | 2.13 | % | ||||||||
Marvell Technology, Inc. | 12 | 447 | 2.13 | % | ||||||||
Restaurant Brands International, Inc. | 7 | 447 | 2.13 | % | ||||||||
General Motors Company | 13 | 447 | 2.13 | % | ||||||||
Allstate Corporation (The) | 3 | 446 | 2.12 | % | ||||||||
Old Dominion Freight Line, Inc. | 2 | 445 | 2.12 | % | ||||||||
Automatic Data Processing, Inc. | 2 | 445 | 2.12 | % | ||||||||
PepsiCo, Inc. | 2 | 445 | 2.12 | % | ||||||||
Fastenal Company | 9 | 445 | 2.12 | % | ||||||||
Pfizer, Inc. | 9 | 444 | 2.11 | % | ||||||||
Cintas Corporation | 1 | 444 | 2.11 | % | ||||||||
Kellogg Company | 6 | 443 | 2.11 | % | ||||||||
Costco Wholesale Corporation | 1 | 443 | 2.11 | % | ||||||||
Apple, Inc. | 3 | 442 | 2.11 | % | ||||||||
McDonald’s Corporation | 2 | 442 | 2.11 | % | ||||||||
Realty Income Corporation | 7 | 442 | 2.11 | % | ||||||||
W. W. Grainger, Inc. | 1 | 442 | 2.11 | % | ||||||||
PACCAR, Inc. | 4 | 442 | 2.10 | % | ||||||||
McCormick & Company, Inc. | 5 | 442 | 2.10 | % | ||||||||
Genuine Parts Company | 3 | 441 | 2.10 | % | ||||||||
United Parcel Service - Class B | 3 | 441 | 2.10 | % | ||||||||
General Mills, Inc. | 5 | 441 | 2.10 | % | ||||||||
Hershey Company (The) | 2 | 441 | 2.10 | % | ||||||||
Sysco Corporation | 6 | 440 | 2.10 | % | ||||||||
Sherwin-Williams Company (The) | 2 | 439 | 2.09 | % | ||||||||
Kroger Company (The) | 10 | 436 | 2.08 | % | ||||||||
Cardinal Health, Inc. | 6 | 431 | 2.05 | % | ||||||||
| $ | 20,997 | 100.00 | % | |||||||||
See accompanying notes to financial statements. | CRM Funds | |
59 | ||
CRM FUNDS CRM LONG/SHORT OPPORTUNITIES FUND SCHEDULE OF INVESTMENTS (Continued) December 31, 2022 (Unaudited) |
The following table represents the individual positions and related values of underlying securities of Morgan Stanley Custom Basket (MSCMS701) Index total return swap with Morgan Stanley Bank as of December 31, 2022, termination date 8/1/23:
Reference Entity | Shares | Market | % of Total | |||||||||
Marvell Technology, Inc. | 16 | $ | 586 | 2.80 | % | |||||||
ON Semiconductor Corporation | 9 | 580 | 2.77 | % | ||||||||
Cognizant Technology Solutions Corporation | 10 | 577 | 2.75 | % | ||||||||
Ulta Beauty, Inc. | 1 | 577 | 2.75 | % | ||||||||
Tractor Supply Company | 3 | 575 | 2.74 | % | ||||||||
Motorola Solutions, Inc. | 2 | 573 | 2.73 | % | ||||||||
Pfizer, Inc. | 11 | 571 | 2.72 | % | ||||||||
O’Reilly Automotive, Inc. | 1 | 570 | 2.72 | % | ||||||||
Apple, Inc. | 4 | 570 | 2.72 | % | ||||||||
Mettler-Toledo International, Inc. | — | 570 | 2.72 | % | ||||||||
CDW Corporation | 3 | 569 | 2.71 | % | ||||||||
Eaton Corporation PLC | 4 | 569 | 2.71 | % | ||||||||
General Dynamics Corporation | 2 | 569 | 2.71 | % | ||||||||
AT&T, Inc. | 31 | 569 | 2.71 | % | ||||||||
Constellation Brands, Inc. | 2 | 569 | 2.71 | % | ||||||||
Allstate Corporation (The) | 4 | 569 | 2.71 | % | ||||||||
Fastenal Company | 12 | 568 | 2.71 | % | ||||||||
Emerson Electric Company | 6 | 567 | 2.71 | % | ||||||||
Hormel Foods Corporation | 12 | 567 | 2.70 | % | ||||||||
Restaurant Brands International, Inc. | 9 | 566 | 2.70 | % | ||||||||
Cummins, Inc. | 2 | 566 | 2.70 | % | ||||||||
LyondellBasell Industries N.V. - Class A | 7 | 565 | 2.69 | % | ||||||||
Sherwin-Williams Company (The) | 2 | 565 | 2.69 | % | ||||||||
Automatic Data Processing, Inc. | 2 | 565 | 2.69 | % | ||||||||
McDonald’s Corporation | 2 | 563 | 2.69 | % | ||||||||
PepsiCo, Inc. | 3 | 563 | 2.69 | % | ||||||||
PACCAR, Inc. | 6 | 563 | 2.69 | % | ||||||||
Caterpillar, Inc. | 2 | 562 | 2.68 | % | ||||||||
W. W. Grainger, Inc. | 1 | 561 | 2.68 | % | ||||||||
Cintas Corporation | 1 | 561 | 2.68 | % | ||||||||
United Parcel Service - Class B | 3 | 560 | 2.67 | % | ||||||||
Hershey Company (The) | 2 | 560 | 2.67 | % | ||||||||
Sysco Corporation | 7 | 559 | 2.67 | % | ||||||||
Kellogg Company | 8 | 559 | 2.67 | % | ||||||||
Genuine Parts Company | 3 | 558 | 2.66 | % | ||||||||
Cardinal Health, Inc. | 7 | 554 | 2.64 | % | ||||||||
Kroger Company (The) | 12 | 553 | 2.64 | % | ||||||||
| $ | 20,968 | 100.00 | % | |||||||||
See accompanying notes to financial statements. | CRM Funds | |
60 | ||
CRM FUNDS CRM LONG/SHORT OPPORTUNITIES FUND SCHEDULE OF INVESTMENTS (Continued) December 31, 2022 (Unaudited) |
The following table represents the individual positions and related values of underlying securities of Morgan Stanley Custom Basket (MSCMS702) Index total return swap with Morgan Stanley Bank as of December 31, 2022, termination date 8/1/23:
Reference Entity | Shares | Market | % of Total | |||||||||
Marvell Technology, Inc. | 22 | $ | 810 | 3.84 | % | |||||||
ON Semiconductor Corporation | 13 | 801 | 3.80 | % | ||||||||
Apple, Inc. | 6 | 798 | 3.79 | % | ||||||||
Cognizant Technology Solutions Corporation | 14 | 796 | 3.78 | % | ||||||||
CDW Corporation | 4 | 788 | 3.74 | % | ||||||||
Motorola Solutions, Inc. | 3 | 786 | 3.73 | % | ||||||||
Extra Space Storage, Inc. | 5 | 784 | 3.72 | % | ||||||||
Ulta Beauty, Inc. | 2 | 783 | 3.71 | % | ||||||||
LyondellBasell Industries N.V. - Class A | 9 | 783 | 3.71 | % | ||||||||
Mettler-Toledo International, Inc. | 1 | 782 | 3.71 | % | ||||||||
AT&T, Inc. | 42 | 782 | 3.71 | % | ||||||||
Pfizer, Inc. | 15 | 781 | 3.71 | % | ||||||||
Emerson Electric Company | 8 | 781 | 3.70 | % | ||||||||
Eaton Corporation PLC | 5 | 780 | 3.70 | % | ||||||||
General Dynamics Corporation | 3 | 778 | 3.69 | % | ||||||||
Cummins, Inc. | 3 | 777 | 3.69 | % | ||||||||
Realty Income Corporation | 12 | 776 | 3.68 | % | ||||||||
Cintas Corporation | 2 | 775 | 3.68 | % | ||||||||
Allstate Corporation (The) | 6 | 775 | 3.68 | % | ||||||||
Caterpillar, Inc. | 3 | 775 | 3.68 | % | ||||||||
Sherwin-Williams Company (The) | 3 | 774 | 3.67 | % | ||||||||
O’Reilly Automotive, Inc. | 1 | 774 | 3.67 | % | ||||||||
W. W. Grainger, Inc. | 1 | 773 | 3.67 | % | ||||||||
PACCAR, Inc. | 8 | 772 | 3.66 | % | ||||||||
McDonald’s Corporation | 3 | 769 | 3.65 | % | ||||||||
Genuine Parts Company | 4 | 767 | 3.64 | % | ||||||||
Cardinal Health, Inc. | 10 | 757 | 3.59 | % | ||||||||
| $ | 21,077 | 100.00 | % | |||||||||
See accompanying notes to financial statements. | CRM Funds | |
61 | ||
CRM FUNDS CRM LONG/SHORT OPPORTUNITIES FUND SCHEDULE OF INVESTMENTS (Concluded) December 31, 2022 (Unaudited) |
The following table represents the individual positions and related values of underlying securities of Morgan Stanley Custom Basket (MSCMS703) Index total return swap with Morgan Stanley Bank as of December 31, 2022, termination date 8/1/23:
Reference Entity | Shares | Market | % of Total | |||||||||
Marvell Technology, Inc. | 18 | $ | 661 | 3.16 | % | |||||||
PACCAR, Inc. | 7 | 659 | 3.15 | % | ||||||||
Apple, Inc. | 5 | 658 | 3.15 | % | ||||||||
Cummins, Inc. | 3 | 658 | 3.15 | % | ||||||||
LyondellBasell Industries N.V. - Class A | 8 | 657 | 3.14 | % | ||||||||
Cognizant Technology Solutions Corporation | 11 | 657 | 3.14 | % | ||||||||
Hormel Foods Corporation | 14 | 657 | 3.14 | % | ||||||||
O’Reilly Automotive, Inc. | 1 | 657 | 3.14 | % | ||||||||
Kroger Company (The) | 15 | 656 | 3.14 | % | ||||||||
Pfizer, Inc. | 13 | 655 | 3.13 | % | ||||||||
AT&T, Inc. | 36 | 655 | 3.13 | % | ||||||||
Eaton Corporation PLC | 4 | 655 | 3.13 | % | ||||||||
Caterpillar, Inc. | 3 | 654 | 3.13 | % | ||||||||
Emerson Electric Company | 7 | 654 | 3.13 | % | ||||||||
Motorola Solutions, Inc. | 3 | 653 | 3.13 | % | ||||||||
General Dynamics Corporation | 3 | 653 | 3.13 | % | ||||||||
Fastenal Company | 14 | 653 | 3.13 | % | ||||||||
ON Semiconductor Corporation | 10 | 653 | 3.13 | % | ||||||||
Allstate Corporation (The) | 5 | 652 | 3.12 | % | ||||||||
CDW Corporation | 4 | 652 | 3.12 | % | ||||||||
PepsiCo, Inc. | 4 | 651 | 3.12 | % | ||||||||
McDonald’s Corporation | 2 | 650 | 3.11 | % | ||||||||
Realty Income Corporation | 10 | 650 | 3.11 | % | ||||||||
Genuine Parts Company | 4 | 650 | 3.11 | % | ||||||||
W. W. Grainger, Inc. | 1 | 649 | 3.11 | % | ||||||||
Prologis, Inc. | 6 | 649 | 3.11 | % | ||||||||
Cardinal Health, Inc. | 8 | 649 | 3.11 | % | ||||||||
Cintas Corporation | 1 | 649 | 3.11 | % | ||||||||
Extra Space Storage, Inc. | 4 | 648 | 3.10 | % | ||||||||
Constellation Brands, Inc. | 3 | 648 | 3.10 | % | ||||||||
Mettler-Toledo International, Inc. | — | 647 | 3.10 | % | ||||||||
Sherwin-Williams Company (The) | 3 | 645 | 3.09 | % | ||||||||
| $ | 20,894 | 100.00 | % | |||||||||
See accompanying notes to financial statements. | CRM Funds | |
62 | ||
CRM FUNDS STATEMENTS OF ASSETS AND LIABILITIES December 31, 2022 (Unaudited) |
CRM Small Cap | CRM Small/Mid | CRM Mid Cap | ||||||||||
ASSETS: | ||||||||||||
Investments in securities | ||||||||||||
Investments in securities, at cost | $ | 103,441,859 | $ | 122,269,365 | $ | 339,759,746 | ||||||
Net unrealized appreciation | 11,462,798 | 31,460,713 | 90,488,106 | |||||||||
Total investments in securities, at value1 | 114,904,657 | 153,730,078 | 430,247,852 | |||||||||
Receivable for securities sold | 192,046 | 8,236,250 | 3,116,556 | |||||||||
Dividends and interest receivable | 117,838 | 114,639 | 215,745 | |||||||||
Receivable for fund shares sold | 18,998 | 412,040 | 321,600 | |||||||||
Receivable for securities lending income | — | 361 | 472 | |||||||||
Other assets | 22,085 | 57,754 | 71,478 | |||||||||
Total Assets | 115,255,624 | 162,551,122 | 433,973,703 | |||||||||
LIABILITIES: | ||||||||||||
Due to custodian | — | 884,405 | — | |||||||||
Obligation to return securities lending collateral | — | 3,922,949 | 13,679,436 | |||||||||
Payable for securities purchased | 1,054,113 | 415,034 | 2,209,364 | |||||||||
Payable for fund shares redeemed | 539,196 | 125,588 | 921,768 | |||||||||
Accrued advisory fee | 73,411 | 104,988 | 267,649 | |||||||||
Trustees fees payable | 3,105 | 2,133 | 5,461 | |||||||||
Audit and tax fees | 7,921 | 8,745 | 16,304 | |||||||||
Other accrued expenses | 77,466 | 74,202 | 180,889 | |||||||||
Total Liabilities | 1,755,212 | 5,538,044 | 17,280,871 | |||||||||
NET ASSETS | $ | 113,500,412 | $ | 157,013,078 | $ | 416,692,832 | ||||||
COMPONENTS OF NET ASSETS | ||||||||||||
Paid in capital | $ | 97,416,510 | $ | 121,280,444 | $ | 321,555,806 | ||||||
Total distributable earnings | 16,083,902 | 35,732,634 | 95,137,026 | |||||||||
NET ASSETS | $ | 113,500,412 | $ | 157,013,078 | $ | 416,692,832 | ||||||
NET ASSET VALUE PER SHARE | ||||||||||||
INVESTOR CLASS SHARES | ||||||||||||
Net assets | $ | 30,012,062 | $ | 19,859,322 | $ | 168,919,677 | ||||||
Shares of Beneficial Interest Outstanding ($0.01 par value, unlimited authorized shares) | 2,448,985 | 2,020,945 | 7,828,451 | |||||||||
Net asset value, offering and redemption price per share | $ | 12.25 | $ | 9.83 | $ | 21.58 | ||||||
INSTITUTIONAL CLASS SHARES | ||||||||||||
Net assets | $ | 83,488,350 | $ | 137,153,756 | $ | 247,773,155 | ||||||
Shares of Beneficial Interest Outstanding ($0.01 par value, unlimited authorized shares) | 5,486,339 | 13,343,729 | 10,859,742 | |||||||||
Net asset value, offering and redemption price per share | $ | 15.22 | $ | 10.28 | $ | 22.82 | ||||||
1 Includes securities loaned of: | $ | — | $ | 3,804,874 | $ | 13,205,972 | ||||||
See accompanying notes to financial statements. | CRM Funds | |
63 | ||
CRM FUNDS STATEMENTS OF ASSETS AND LIABILITIES December 31, 2022 (Unaudited) |
CRM All Cap | CRM Long/Short | |||||||
ASSETS: | ||||||||
Investments in securities | ||||||||
Investments in securities, at cost | $ | 21,363,650 | $ | 197,026,808 | ||||
Net unrealized appreciation | 3,636,223 | 7,111,587 | ||||||
Total investments in securities, at value1 | 24,999,873 | 204,138,395 | ||||||
Cash pledged with broker for securities sold short | — | 100,744,801 | ||||||
Foreign currencies held with broker for securities sold short (cost $0 and $4,826,252, respectively) | — | 4,979,855 | ||||||
Receivable for securities sold | — | 1,852,271 | ||||||
Dividends and interest receivable | 12,806 | 215,389 | ||||||
Receivable for fund shares sold | — | 213,055 | ||||||
Swap income receivable | — | 225,122 | ||||||
Unrealized appreciation on swap agreements | — | 9,305 | ||||||
Other assets | 24,369 | 39,440 | ||||||
Total Assets | 25,037,048 | 312,417,633 | ||||||
LIABILITIES: | ||||||||
Obligation to return securities lending collateral | 573,277 | — | ||||||
Securities sold short, at value (proceeds $0 and $116,763,438, respectively) | — | 100,732,305 | ||||||
Unrealized depreciation on swap agreements | — | 139,657 | ||||||
Payable for dividends on securities sold short | — | 105,824 | ||||||
Payable for securities purchased | 25,317 | 1,124,430 | ||||||
Payable for fund shares redeemed | — | 163,468 | ||||||
Accrued advisory fee | 14,587 | 251,333 | ||||||
Trustees fees payable | 360 | 2,415 | ||||||
Audit and tax fees | 5,056 | 11,375 | ||||||
Other accrued expenses | 10,056 | 46,144 | ||||||
Total Liabilities | 628,653 | 102,576,951 | ||||||
NET ASSETS | $ | 24,408,395 | $ | 209,840,682 | ||||
COMPONENTS OF NET ASSETS | ||||||||
Paid in capital | $ | 21,365,671 | $ | 197,740,005 | ||||
Total distributable earnings | 3,042,724 | 12,100,677 | ||||||
NET ASSETS | $ | 24,408,395 | $ | 209,840,682 | ||||
NET ASSET VALUE PER SHARE | ||||||||
INVESTOR CLASS SHARES | ||||||||
Net assets | $ | 7,973,170 | ||||||
Shares of Beneficial Interest Outstanding ($0.01 par value, unlimited authorized shares) | 1,253,181 | |||||||
Net asset value, offering and redemption price per share | $ | 6.36 | ||||||
INSTITUTIONAL CLASS SHARES | ||||||||
Net assets | $ | 16,435,225 | $ | 209,840,682 | ||||
Shares of Beneficial Interest Outstanding ($0.01 par value, unlimited authorized shares) | 2,496,261 | 18,384,604 | ||||||
Net asset value, offering and redemption price per share | $ | 6.58 | $ | 11.41 | ||||
1 Includes securities loaned of: | $ | 555,696 | $ | — | ||||
See accompanying notes to financial statements. | CRM Funds | |
64 | ||
CRM FUNDS STATEMENTS OF OPERATIONS FOR THE SIX MONTHS ENDED December 31, 2022 (Unaudited) |
CRM Small Cap | CRM Small/Mid | CRM Mid Cap | ||||||||||
INVESTMENT INCOME: | ||||||||||||
Dividends and interest | $ | 1,031,956 | $ | 1,373,794 | $ | 3,790,566 | ||||||
Securities lending income | 256 | 516 | 1,924 | |||||||||
Foreign tax withheld | (1,646 | ) | (2,386 | ) | (2,604 | ) | ||||||
Total investment income | 1,030,566 | 1,371,924 | 3,789,886 | |||||||||
EXPENSES: | ||||||||||||
Investment advisory fees | 433,058 | 582,060 | 1,545,615 | |||||||||
Sub-Transfer agent fees - Institutional Shares | 33,582 | 59,882 | 105,239 | |||||||||
Shareholder Services - Investor Shares | 38,288 | 26,685 | 212,803 | |||||||||
Administration and accounting fees | 22,730 | 30,058 | 78,096 | |||||||||
Transfer agent fees | 15,330 | 25,730 | 43,243 | |||||||||
Registration fees | 20,369 | 18,888 | 22,820 | |||||||||
Trustee fees and expenses | 11,837 | 14,705 | 40,051 | |||||||||
Insurance fees | 18,480 | 13,431 | 29,681 | |||||||||
Legal fees | 6,506 | 8,409 | 23,080 | |||||||||
Audit and tax fees | 7,921 | 8,745 | 16,304 | |||||||||
Shareholder reports | 4,234 | 6,570 | 17,905 | |||||||||
Custody fees | 7,559 | 7,557 | 7,561 | |||||||||
Other expenses | 13,084 | 14,094 | 36,753 | |||||||||
Total expenses | 632,978 | 816,814 | 2,179,151 | |||||||||
NET INVESTMENT INCOME | 397,588 | 555,110 | 1,610,735 | |||||||||
NET REALIZED AND UNREALIZED GAIN ON INVESTMENTS | ||||||||||||
Net realized gain from: | ||||||||||||
Investments | 1,477,271 | 57,395 | 13,396,833 | |||||||||
Net change in unrealized appreciation on: | ||||||||||||
Investments | 9,149,118 | 5,909,055 | 4,726,756 | |||||||||
Foreign currency transactions | — | — | 4 | |||||||||
Net change in unrealized appreciation | 9,149,118 | 5,909,055 | 4,726,760 | |||||||||
Net realized and unrealized gain on investments | 10,626,389 | 5,966,450 | 18,123,593 | |||||||||
NET INCREASE IN NET ASSETS RESULTING FROM OPERATIONS | $ | 11,023,977 | $ | 6,521,560 | $ | 19,734,328 | ||||||
See accompanying notes to financial statements. | CRM Funds | |
65 | ||
CRM FUNDS STATEMENTS OF OPERATIONS FOR THE SIX MONTHS ENDED December 31, 2022 (Unaudited) |
CRM All Cap | CRM Long/Short | |||||||
INVESTMENT INCOME: | ||||||||
Dividends and interest | $ | 155,525 | $ | 1,754,357 | ||||
Foreign tax withheld | (157 | ) | (9,602 | ) | ||||
Total investment income | 155,368 | 1,744,755 | ||||||
EXPENSES: | ||||||||
Investment advisory fees | 85,447 | 1,467,265 | ||||||
Dividend expense on securities sold short | — | 649,843 | ||||||
Sub-Transfer agent fees - Institutional Shares | 1,338 | 32,897 | ||||||
Shareholder Services - Investor Shares | 10,045 | — | ||||||
Registration fees | 17,038 | 17,589 | ||||||
Transfer agent fees | 6,889 | 22,512 | ||||||
Audit and tax fees | 5,056 | 11,375 | ||||||
Administration and accounting fees | 5,313 | 37,927 | ||||||
Custody fees | 7,558 | 7,551 | ||||||
Trustee fees and expenses | 2,409 | 19,478 | ||||||
Insurance fees | 1,816 | 10,821 | ||||||
Legal fees | 1,389 | 11,210 | ||||||
Shareholder reports | 1,010 | 8,524 | ||||||
Other expenses | 3,063 | 21,588 | ||||||
Total expenses | 148,371 | 2,318,580 | ||||||
Expenses waived | — | (102,585 | ) | |||||
Net expenses | 148,371 | 2,215,995 | ||||||
NET INVESTMENT INCOME (LOSS) | 6,997 | (471,240 | ) | |||||
NET REALIZED AND UNREALIZED GAIN (LOSS) ON INVESTMENTS, DERIVATIVES AND FOREIGN CURRENCY | ||||||||
Net realized gain (loss) from: | ||||||||
Investments | 352,876 | (1,778,630 | ) | |||||
Securities sold short | — | 1,912,533 | ||||||
Swap agreements | — | (1,819,624 | ) | |||||
Purchased Options | — | 806,938 | ||||||
Written Options | — | 61,269 | ||||||
Foreign currency transactions | — | (81,748 | ) | |||||
Net realized gain (loss) | 352,876 | (899,262 | ) | |||||
Net change in unrealized appreciation on: | ||||||||
Investments | 893,425 | 5,270,336 | ||||||
Securities sold short | — | 2,218,529 | ||||||
Swap agreements | — | 826,440 | ||||||
Foreign currency transactions | — | 175,336 | ||||||
Net change in unrealized appreciation | 893,425 | 8,490,641 | ||||||
Net realized and unrealized gain on investments, derivatives and foreign currency | 1,246,301 | 7,591,379 | ||||||
NET INCREASE IN NET ASSETS RESULTING FROM OPERATIONS | $ | 1,253,298 | $ | 7,120,139 | ||||
See accompanying notes to financial statements. | CRM Funds | |
66 | ||
CRM FUNDS STATEMENTS OF CHANGES IN NET ASSETS |
CRM Small Cap Value Fund | ||||||||
Six Months Ended | Year Ended | |||||||
NET ASSETS - BEGINNING OF YEAR/PERIOD | $ | 118,775,543 | $ | 337,718,750 | ||||
OPERATIONS | ||||||||
Net investment income | 397,588 | 446,714 | ||||||
Net realized gain from investments | 1,477,271 | 41,694,551 | ||||||
Net change in unrealized appreciation (depreciation) on investments | 9,149,118 | (74,634,511 | ) | |||||
Net increase (decrease) in net assets resulting from operations | 11,023,977 | (32,493,246 | ) | |||||
DISTRIBUTIONS TO SHAREHOLDERS | ||||||||
Investor Class | (711,393 | ) | (7,929,406 | ) | ||||
Institutional Class | (1,651,048 | ) | (52,503,591 | ) | ||||
Total distributions to shareholders | (2,362,441 | ) | (60,432,997 | ) | ||||
CAPITAL SHARE TRANSACTIONS | ||||||||
Sale of shares - Investor Shares | 64,154 | 583,477 | ||||||
Sale of shares - Institutional Shares | 2,355,783 | 28,108,834 | ||||||
Reinvestment of distributions - Investor Class | 667,951 | 7,304,224 | ||||||
Reinvestment of distributions - Institutional Class | 1,285,743 | 47,663,292 | ||||||
Redemption of shares - Investor Class | (1,148,501 | ) | (4,681,308 | ) | ||||
Redemption of shares - Institutional Class | (17,161,797 | ) | (204,995,483 | ) | ||||
Net decrease from capital share transactions | (13,936,667 | ) | (126,016,964 | ) | ||||
Total decrease in net assets | (5,275,131 | ) | (218,943,207 | ) | ||||
NET ASSETS - END OF YEAR/PERIOD | $ | 113,500,412 | $ | 118,775,543 | ||||
SHARE ACTIVITY | ||||||||
Investor Class: | ||||||||
Sold | 5,141 | 38,168 | ||||||
Issued on reinvestment of distributions | 53,181 | 527,238 | ||||||
Redeemed | (93,748 | ) | (303,262 | ) | ||||
Net increase (decrease) | (35,426 | ) | 262,144 | |||||
Institutional Class: | ||||||||
Sold | 152,537 | 1,518,939 | ||||||
Issued on reinvestment of distributions | 82,419 | 2,799,683 | ||||||
Redeemed | (1,163,611 | ) | (12,462,492 | ) | ||||
Net decrease | (928,655 | ) | (8,143,870 | ) | ||||
See accompanying notes to financial statements. | CRM Funds | |
67 | ||
CRM FUNDS STATEMENTS OF CHANGES IN NET ASSETS |
CRM Small/Mid Cap Value Fund | ||||||||
Six Months Ended | Year Ended | |||||||
NET ASSETS - BEGINNING OF YEAR/PERIOD | $ | 140,297,796 | $ | 313,225,268 | ||||
OPERATIONS | ||||||||
Net investment income | 555,110 | 1,746,165 | ||||||
Net realized gain from investments | 57,395 | 54,043,235 | ||||||
Net change in unrealized appreciation (depreciation) on investments | 5,909,055 | (77,848,761 | ) | |||||
Net increase (decrease) in net assets resulting from operations | 6,521,560 | (22,059,361 | ) | |||||
DISTRIBUTIONS TO SHAREHOLDERS | ||||||||
Investor Class | (1,264,375 | ) | (10,028,969 | ) | ||||
Institutional Class | (8,541,502 | ) | (43,784,589 | ) | ||||
Total distributions to shareholders | (9,805,877 | ) | (53,813,558 | ) | ||||
CAPITAL SHARE TRANSACTIONS | ||||||||
Sale of shares - Investor Shares | 429,398 | 14,710,375 | ||||||
Sale of shares - Institutional Shares | 31,510,752 | 37,089,294 | ||||||
Reinvestment of distributions - Investor Class | 1,237,084 | 9,954,998 | ||||||
Reinvestment of distributions - Institutional Class | 8,354,636 | 42,756,724 | ||||||
Redemption of shares - Investor Class | (2,510,517 | ) | (17,399,666 | ) | ||||
Redemption of shares - Institutional Class | (19,021,754 | ) | (184,166,278 | ) | ||||
Net increase (decrease) from capital share transactions | 19,999,599 | (97,054,553 | ) | |||||
Total increase (decrease) in net assets | 16,715,282 | (172,927,472 | ) | |||||
NET ASSETS - END OF YEAR/PERIOD | $ | 157,013,078 | $ | 140,297,796 | ||||
SHARE ACTIVITY | ||||||||
Investor Class: | ||||||||
Sold | 41,056 | 1,043,459 | ||||||
Issued on reinvestment of distributions | 123,585 | 870,953 | ||||||
Redeemed | (248,680 | ) | (1,531,017 | ) | ||||
Net increase (decrease) | (84,039 | ) | 383,395 | |||||
Institutional Class: | ||||||||
Sold | 2,844,387 | 3,036,191 | ||||||
Issued on reinvestment of distributions | 797,959 | 3,586,973 | ||||||
Redeemed | (1,804,055 | ) | (13,189,739 | ) | ||||
Net increase (decrease) | 1,838,291 | (6,566,575 | ) | |||||
See accompanying notes to financial statements. | CRM Funds | |
68 | ||
CRM FUNDS STATEMENTS OF CHANGES IN NET ASSETS |
CRM Mid Cap Value Fund | ||||||||
Six Months Ended | Year Ended | |||||||
NET ASSETS - BEGINNING OF YEAR/PERIOD | $ | 384,065,255 | $ | 439,057,786 | ||||
OPERATIONS | ||||||||
Net investment income | 1,610,735 | 4,842,362 | ||||||
Net realized gain from investments | 13,396,833 | 21,447,221 | ||||||
Net change in unrealized appreciation (depreciation) on investments | 4,726,760 | (53,252,573 | ) | |||||
Net increase (decrease) in net assets resulting from operations | 19,734,328 | (26,962,990 | ) | |||||
DISTRIBUTIONS TO SHAREHOLDERS | ||||||||
Investor Class | (7,142,897 | ) | (31,529,470 | ) | ||||
Institutional Class | (10,218,630 | ) | (41,057,815 | ) | ||||
Total distributions to shareholders | (17,361,527 | ) | (72,587,285 | ) | ||||
CAPITAL SHARE TRANSACTIONS | ||||||||
Sale of shares - Investor Shares | 10,550,247 | 21,210,975 | ||||||
Sale of shares - Institutional Shares | 38,425,345 | 28,351,424 | ||||||
Reinvestment of distributions - Investor Class | 7,031,109 | 30,961,960 | ||||||
Reinvestment of distributions - Institutional Class | 9,472,114 | 37,597,239 | ||||||
Redemption of shares - Investor Class | (14,414,374 | ) | (31,768,603 | ) | ||||
Redemption of shares - Institutional Class | (20,809,665 | ) | (41,795,251 | ) | ||||
Net increase from capital share transactions | 30,254,776 | 44,557,744 | ||||||
Total increase (decrease) in net assets | 32,627,577 | (54,992,531 | ) | |||||
NET ASSETS - END OF YEAR/PERIOD | $ | 416,692,832 | $ | 384,065,255 | ||||
SHARE ACTIVITY | ||||||||
Investor Class: | ||||||||
Sold | 476,257 | 887,875 | ||||||
Issued on reinvestment of distributions | 319,887 | 1,284,729 | ||||||
Redeemed | (656,109 | ) | (1,251,319 | ) | ||||
Net increase | 140,035 | 921,285 | ||||||
Institutional Class: | ||||||||
Sold | 1,654,114 | 1,096,756 | ||||||
Issued on reinvestment of distributions | 407,578 | 1,479,042 | ||||||
Redeemed | (896,885 | ) | (1,553,490 | ) | ||||
Net increase | 1,164,807 | 1,022,308 | ||||||
See accompanying notes to financial statements. | CRM Funds | |
69 | ||
CRM FUNDS STATEMENTS OF CHANGES IN NET ASSETS |
CRM All Cap Value Fund | ||||||||
Six Months Ended | Year Ended | |||||||
NET ASSETS - BEGINNING OF YEAR/PERIOD | $ | 23,131,491 | $ | 27,309,419 | ||||
OPERATIONS | ||||||||
Net investment income | 6,997 | 124,195 | ||||||
Net realized gain from investments | 352,876 | 1,768,579 | ||||||
Net change in unrealized appreciation (depreciation) on investments | 893,425 | (4,444,658 | ) | |||||
Net increase (decrease) in net assets resulting from operations | 1,253,298 | (2,551,884 | ) | |||||
DISTRIBUTIONS TO SHAREHOLDERS | ||||||||
Investor Class | (543,588 | ) | (1,719,934 | ) | ||||
Institutional Class | (1,112,197 | ) | (3,399,568 | ) | ||||
Total distributions to shareholders | (1,655,785 | ) | (5,119,502 | ) | ||||
CAPITAL SHARE TRANSACTIONS | ||||||||
Sale of shares - Investor Shares | 68,929 | 151,705 | ||||||
Sale of shares - Institutional Shares | 312,694 | 620,494 | ||||||
Reinvestment of distributions - Investor Class | 515,831 | 1,623,939 | ||||||
Reinvestment of distributions - Institutional Class | 1,062,276 | 3,263,495 | ||||||
Redemption of shares - Investor Class | (98,810 | ) | (501,342 | ) | ||||
Redemption of shares - Institutional Class | (181,529 | ) | (1,664,833 | ) | ||||
Net increase from capital share transactions | 1,679,391 | 3,493,458 | ||||||
Total increase (decrease) in net assets | 1,276,904 | (4,177,928 | ) | |||||
NET ASSETS - END OF YEAR/PERIOD | $ | 24,408,395 | $ | 23,131,491 | ||||
SHARE ACTIVITY | ||||||||
Investor Class: | ||||||||
Sold | 10,000 | 19,329 | ||||||
Issued on reinvestment of distributions | 79,359 | 219,748 | ||||||
Redeemed | (14,480 | ) | (65,032 | ) | ||||
Net increase | 74,879 | 174,045 | ||||||
Institutional Class: | ||||||||
Sold | 45,976 | 78,011 | ||||||
Issued on reinvestment of distributions | 158,077 | 427,719 | ||||||
Redeemed | (26,998 | ) | (202,857 | ) | ||||
Net increase | 177,055 | 302,873 | ||||||
See accompanying notes to financial statements. | CRM Funds | |
70 | ||
CRM FUNDS STATEMENTS OF CHANGES IN NET ASSETS |
CRM Long/Short Opportunities Fund | ||||||||
Six Months Ended | Year Ended | |||||||
NET ASSETS - BEGINNING OF YEAR/PERIOD | $ | 185,463,235 | $ | 127,930,416 | ||||
OPERATIONS | ||||||||
Net investment loss | (471,240 | ) | (2,862,531 | ) | ||||
Net realized gain (loss) from investments and foreign currency | (899,262 | ) | 10,097,124 | |||||
Net change in unrealized appreciation (depreciation) on investments and foreign currency | 8,490,641 | (11,890,823 | ) | |||||
Net increase (decrease) in net assets resulting from operations | 7,120,139 | (4,656,230 | ) | |||||
DISTRIBUTIONS TO SHAREHOLDERS | ||||||||
Institutional Class | (3,277,663 | ) | (1,310,755 | ) | ||||
Total distributions to shareholders | (3,277,663 | ) | (1,310,755 | ) | ||||
CAPITAL SHARE TRANSACTIONS | ||||||||
Sale of shares - Institutional Shares | 44,268,304 | 192,936,504 | ||||||
Reinvestment of distributions - Institutional Class | 3,271,562 | 1,307,761 | ||||||
Redemption of shares - Institutional Class | (27,004,895 | ) | (130,744,461 | ) | ||||
Net increase from capital share transactions | 20,534,971 | 63,499,804 | ||||||
Total increase in net assets | 24,377,447 | 57,532,819 | ||||||
NET ASSETS - END OF YEAR/PERIOD | $ | 209,840,682 | $ | 185,463,235 | ||||
SHARE ACTIVITY | ||||||||
Institutional Class: | ||||||||
Sold | 3,838,363 | 16,603,125 | ||||||
Issued on reinvestment of distributions | 286,226 | 108,618 | ||||||
Redeemed | (2,378,904 | ) | (11,081,349 | ) | ||||
Net increase | 1,745,685 | 5,630,394 | ||||||
See accompanying notes to financial statements. | CRM Funds | |
71 | ||
CRM FUNDS FINANCIAL HIGHLIGHTS |
The following tables include selected data for a share outstanding throughout each period and other performance information derived from the financial statements. The total returns in the tables represent the rate an investor would have earned or lost on an investment in the funds (assuming reinvestment of all dividends and distributions). This information should be read in conjunction with the financial statements and notes thereto.
CRM Small Cap Value Fund — Investor Shares | ||||||||||||||||||||||||
Six Months | For the Years Ended June 30, | |||||||||||||||||||||||
(Unaudited)1 | 2022 | 2021 | 2020 | 2019 | 2018 | |||||||||||||||||||
Net Asset Value - Beginning of Year/Period | $ | 11.40 | $ | 17.35 | $ | 11.22 | $ | 15.34 | $ | 17.15 | $ | 18.06 | ||||||||||||
Investment operations: | ||||||||||||||||||||||||
Net investment income2 | 0.04 | — | 3 | 0.04 | 0.04 | 0.02 | 0.09 | 4 | ||||||||||||||||
Net realized and unrealized gain (loss) on investments | 1.10 | (2.26 | ) | 6.16 | (3.07 | ) | (0.22 | ) | 1.87 | |||||||||||||||
Total from investment operations | 1.14 | (2.26 | ) | 6.20 | (3.03 | ) | (0.20 | ) | 1.96 | |||||||||||||||
Distributions to shareholders: | ||||||||||||||||||||||||
From net investment income | (0.06 | ) | (0.01 | ) | (0.07 | ) | (0.03 | ) | (0.04 | ) | (0.09 | ) | ||||||||||||
From net realized gain on investments | (0.23 | ) | (3.68 | ) | — | (1.06 | ) | (1.57 | ) | (2.78 | ) | |||||||||||||
Total distributions to shareholders | (0.29 | ) | (3.69 | ) | (0.07 | ) | (1.09 | ) | (1.61 | ) | (2.87 | ) | ||||||||||||
Net Asset Value - End of Year/Period | $ | 12.25 | $ | 11.40 | $ | 17.35 | $ | 11.22 | $ | 15.34 | $ | 17.15 | ||||||||||||
Total return | 9.94 | % | (15.73 | )% | 55.36 | % | (21.53 | )% | (0.17 | )% | 11.17 | % | ||||||||||||
Ratios/Supplemental Data: | ||||||||||||||||||||||||
Ratios to average net assets: | ||||||||||||||||||||||||
Expenses | 1.22 | % | 1.16 | % | 1.15 | % | 1.16 | % | 1.15 | % | 1.13 | % | ||||||||||||
Net investment income | 0.59 | % | 0.01 | % | 0.30 | % | 0.27 | % | 0.12 | % | 0.52 | %4 | ||||||||||||
Portfolio turnover rate | 16 | % | 54 | % | 63 | % | 60 | % | 48 | % | 49 | % | ||||||||||||
Net Assets at end of year/period (000’s omitted) | $ | 30,012 | $ | 28,325 | $ | 38,548 | $ | 33,526 | $ | 58,787 | $ | 76,779 | ||||||||||||
(1) | For the six months ended December 31, 2022. All ratios for the period have been annualized. Total returns and portfolio turnover for the period have not been annualized. |
(2) | Calculated using the average shares method. |
See accompanying notes to financial statements. | CRM Funds | |
72 | ||
CRM FUNDS FINANCIAL HIGHLIGHTS |
(3) | Amount represents less than $0.005. |
(4) | For the year ended June 30, 2018, net investment income per share reflects special dividends which amount to $0.13 per share. Excluding the special dividends, the ratio of net investment income to average net assets would have been (0.22)%. |
See accompanying notes to financial statements. | CRM Funds | |
73 | ||
CRM FUNDS FINANCIAL HIGHLIGHTS |
CRM Small Cap Value Fund — Institutional Shares | ||||||||||||||||||||||||
Six Months | For the Years Ended June 30, | |||||||||||||||||||||||
(Unaudited)1 | 2022 | 2021 | 2020 | 2019 | 2018 | |||||||||||||||||||
Net Asset Value - Beginning of Year/Period | $ | 14.10 | $ | 20.55 | $ | 13.28 | $ | 17.96 | $ | 19.77 | $ | 20.41 | ||||||||||||
Investment operations: | ||||||||||||||||||||||||
Net investment income2 | 0.06 | 0.03 | 0.09 | 0.08 | 0.07 | 0.16 | 3 | |||||||||||||||||
Net realized and unrealized gain (loss) on investments | 1.37 | (2.75 | ) | 7.28 | (3.63 | ) | (0.23 | ) | 2.11 | |||||||||||||||
Total from investment operations | 1.43 | (2.72 | ) | 7.37 | (3.55 | ) | (0.16 | ) | 2.27 | |||||||||||||||
Distributions to shareholders: | ||||||||||||||||||||||||
From net investment income | (0.08 | ) | (0.05 | ) | (0.10 | ) | (0.07 | ) | (0.08 | ) | (0.13 | ) | ||||||||||||
From net realized gain on investments | (0.23 | ) | (3.68 | ) | — | (1.06 | ) | (1.57 | ) | (2.78 | ) | |||||||||||||
Total distributions to shareholders | (0.31 | ) | (3.73 | ) | (0.10 | ) | (1.13 | ) | (1.65 | ) | (2.91 | ) | ||||||||||||
Net Asset Value - End of Year/Period | $ | 15.22 | $ | 14.10 | $ | 20.55 | $ | 13.28 | $ | 17.96 | $ | 19.77 | ||||||||||||
Total return | 10.08 | % | (15.53 | )% | 55.68 | % | (21.34 | )% | 0.11 | % | 11.44 | % | ||||||||||||
Ratios/Supplemental Data: | ||||||||||||||||||||||||
Ratios to average net assets: | ||||||||||||||||||||||||
Expenses | 1.05 | % | 0.93 | % | 0.91 | % | 0.92 | % | 0.91 | % | 0.89 | % | ||||||||||||
Net investment income | 0.73 | % | 0.18 | % | 0.54 | % | 0.52 | % | 0.38 | % | 0.77 | %3 | ||||||||||||
Portfolio turnover rate | 16 | % | 54 | % | 63 | % | 60 | % | 48 | % | 49 | % | ||||||||||||
Net Assets at end of year/period (000’s omitted) | $ | 83,488 | $ | 90,451 | $ | 299,170 | $ | 198,589 | $ | 266,562 | $ | 283,762 | ||||||||||||
(1) | For the six months ended December 31, 2022. All ratios for the period have been annualized. Total returns and portfolio turnover for the period have not been annualized. |
(2) | Calculated using the average shares method. |
(3) | For the year ended June 30, 2018, net investment income per share reflects special dividends which amount to $0.15 per share. Excluding the special dividends, the ratio of net investment income to average net assets would have been 0.01%. |
See accompanying notes to financial statements. | CRM Funds | |
74 | ||
CRM FUNDS FINANCIAL HIGHLIGHTS |
CRM Small/Mid Cap Value Fund — Investor Shares | ||||||||||||||||||||||||
Six Months | For the Years Ended June 30, | |||||||||||||||||||||||
(Unaudited)1 | 2022 | 2021 | 2020 | 2019 | 2018 | |||||||||||||||||||
Net Asset Value - Beginning of Year/Period | $ | 9.94 | $ | 15.37 | $ | 9.71 | $ | 11.36 | $ | 13.09 | $ | 14.54 | ||||||||||||
Investment operations: | ||||||||||||||||||||||||
Net investment income (loss)2 | 0.03 | 0.10 | 0.11 | 0.02 | 0.03 | (0.01 | ) | |||||||||||||||||
Net realized and unrealized gain (loss) on investments | 0.49 | (1.39 | ) | 6.29 | (1.35 | ) | (0.01 | ) | 2.15 | |||||||||||||||
Total from investment operations | 0.52 | (1.29 | ) | 6.40 | (1.33 | ) | 0.02 | 2.14 | ||||||||||||||||
Distributions to shareholders: | ||||||||||||||||||||||||
From net investment income | (0.06 | ) | (0.17 | ) | (0.03 | ) | (0.03 | ) | — | — | ||||||||||||||
From net realized gain on investments | (0.57 | ) | (3.97 | ) | (0.71 | ) | (0.29 | ) | (1.75 | ) | (3.59 | ) | ||||||||||||
Total distributions to shareholders | (0.63 | ) | (4.14 | ) | (0.74 | ) | (0.32 | ) | (1.75 | ) | (3.59 | ) | ||||||||||||
Net Asset Value - End of Year/Period | $ | 9.83 | $ | 9.94 | $ | 15.37 | $ | 9.71 | $ | 11.36 | $ | 13.09 | ||||||||||||
Total return | 5.11 | % | (11.92 | )% | 67.80 | % | (12.18 | )% | 1.91 | % | 16.75 | % | ||||||||||||
Ratios/Supplemental Data: | ||||||||||||||||||||||||
Ratios to average net assets: | ||||||||||||||||||||||||
Expenses | 1.19 | % | 1.18 | % | 1.15 | % | 1.17 | % | 1.15 | % | 1.13 | % | ||||||||||||
Net investment income (loss) | 0.56 | % | 0.82 | % | 0.83 | % | 0.22 | % | 0.21 | % | (0.05 | )% | ||||||||||||
Portfolio turnover rate | 28 | % | 34 | % | 59 | % | 80 | % | 45 | % | 48 | % | ||||||||||||
Net Assets at end of year/period (000’s omitted) | $ | 19,859 | $ | 20,914 | $ | 26,464 | $ | 16,259 | $ | 24,455 | $ | 29,116 | ||||||||||||
(1) | For the six months ended December 31, 2022. All ratios for the period have been annualized. Total returns and portfolio turnover for the period have not been annualized. |
(2) | Calculated using the average shares method. |
See accompanying notes to financial statements. | CRM Funds | |
75 | ||
CRM FUNDS FINANCIAL HIGHLIGHTS |
CRM Small/Mid Cap Value Fund — Institutional Shares | ||||||||||||||||||||||||
Six Months | For the Years Ended June 30, | |||||||||||||||||||||||
(Unaudited)1 | 2022 | 2021 | 2020 | 2019 | 2018 | |||||||||||||||||||
Net Asset Value - Beginning of Year/Period | $ | 10.38 | $ | 15.87 | $ | 10.00 | $ | 11.70 | $ | 13.43 | $ | 14.80 | ||||||||||||
Investment operations: | ||||||||||||||||||||||||
Net investment income2 | 0.04 | 0.13 | 0.13 | 0.05 | 0.05 | 0.02 | ||||||||||||||||||
Net realized and unrealized gain (loss) on investments | 0.51 | (1.46 | ) | 6.50 | (1.41 | ) | — | 3 | 2.20 | |||||||||||||||
Total from investment operations | 0.55 | (1.33 | ) | 6.63 | (1.36 | ) | 0.05 | 2.22 | ||||||||||||||||
Distributions to shareholders: | ||||||||||||||||||||||||
From net investment income | (0.08 | ) | (0.19 | ) | (0.05 | ) | (0.05 | ) | (0.03 | ) | — | |||||||||||||
From net realized gain on investments | (0.57 | ) | (3.97 | ) | (0.71 | ) | (0.29 | ) | (1.75 | ) | (3.59 | ) | ||||||||||||
Total distributions to shareholders | (0.65 | ) | (4.16 | ) | (0.76 | ) | (0.34 | ) | (1.78 | ) | (3.59 | ) | ||||||||||||
Net Asset Value - End of Year/Period | $ | 10.28 | $ | 10.38 | $ | 15.87 | $ | 10.00 | $ | 11.70 | $ | 13.43 | ||||||||||||
Total return | 5.19 | % | (11.78 | )% | 68.26 | % | (12.06 | )% | 2.13 | % | 17.03 | % | ||||||||||||
Ratios/Supplemental Data: | ||||||||||||||||||||||||
Ratios to average net assets: | ||||||||||||||||||||||||
Expenses | 1.03 | % | 1.00 | % | 0.93 | % | 0.95 | % | 0.94 | % | 0.91 | % | ||||||||||||
Net investment income | 0.74 | % | 0.98 | % | 0.99 | % | 0.44 | % | 0.42 | % | 0.16 | % | ||||||||||||
Portfolio turnover rate | 28 | % | 34 | % | 59 | % | 80 | % | 45 | % | 48 | % | ||||||||||||
Net Assets at end of year/period (000’s omitted) | $ | 137,154 | $ | 119,384 | $ | 286,762 | $ | 220,919 | $ | 253,964 | $ | 261,428 | ||||||||||||
(1) | For the six months ended December 31, 2022. All ratios for the period have been annualized. Total returns and portfolio turnover for the period have not been annualized. |
(2) | Calculated using the average shares method. |
(3) | Amount represents less than $0.005. |
See accompanying notes to financial statements. | CRM Funds | |
76 | ||
CRM FUNDS FINANCIAL HIGHLIGHTS |
CRM Mid Cap Value Fund — Investor Shares | ||||||||||||||||||||||||
Six Months | For the Years Ended June 30, | |||||||||||||||||||||||
(Unaudited)1 | 2022 | 2021 | 2020 | 2019 | 2018 | |||||||||||||||||||
Net Asset Value - Beginning of Year/Period | $ | 21.43 | $ | 27.71 | $ | 18.34 | $ | 21.22 | $ | 22.58 | $ | 23.18 | ||||||||||||
Investment operations: | ||||||||||||||||||||||||
Net investment income2 | 0.08 | 0.27 | 0.15 | 0.08 | 0.08 | 0.14 | 3 | |||||||||||||||||
Net realized and unrealized gain (loss) on investments | 1.02 | (1.57 | ) | 9.67 | (2.33 | ) | 0.41 | 3.57 | ||||||||||||||||
Total from investment operations | 1.10 | (1.30 | ) | 9.82 | (2.25 | ) | 0.49 | 3.71 | ||||||||||||||||
Distributions to shareholders: | ||||||||||||||||||||||||
From net investment income | (0.26 | ) | (0.26 | ) | (0.09 | ) | (0.09 | ) | (0.04 | ) | (0.29 | ) | ||||||||||||
From net realized gain on investments | (0.69 | ) | (4.72 | ) | (0.36 | ) | (0.54 | ) | (1.81 | ) | (4.02 | ) | ||||||||||||
Total distributions to shareholders | (0.95 | ) | (4.98 | ) | (0.45 | ) | (0.63 | ) | (1.85 | ) | (4.31 | ) | ||||||||||||
Net Asset Value - End of Year/Period | $ | 21.58 | $ | 21.43 | $ | 27.71 | $ | 18.34 | $ | 21.22 | $ | 22.58 | ||||||||||||
Total return | 5.05 | % | (6.68 | )% | 54.09 | % | (10.98 | )% | 3.39 | % | 17.80 | % | ||||||||||||
Ratios/Supplemental Data: | ||||||||||||||||||||||||
Ratios to average net assets: | ||||||||||||||||||||||||
Expenses | 1.15 | % | 1.14 | % | 1.15 | % | 1.16 | % | 1.14 | % | 1.11 | % | ||||||||||||
Net investment income | 0.68 | % | 1.06 | % | 0.66 | % | 0.42 | % | 0.37 | % | 0.62 | %3 | ||||||||||||
Portfolio turnover rate | 19 | % | 23 | % | 63 | % | 37 | % | 40 | % | 58 | % | ||||||||||||
Net Assets at end of year/period (000’s omitted) | $ | 168,920 | $ | 164,743 | $ | 187,541 | $ | 152,370 | $ | 220,014 | $ | 243,062 | ||||||||||||
(1) | For the six months ended December 31, 2022. All ratios for the period have been annualized. Total returns and portfolio turnover for the period have not been annualized. |
(2) | Calculated using the average shares method. |
(3) | For the year ended June 30, 2018, net investment income per share reflects special dividends which amount to $0.13 per share. Excluding the special dividends, the ratio of net investment income to average net assets would have been 0.04%. |
See accompanying notes to financial statements. | CRM Funds | |
77 | ||
CRM FUNDS FINANCIAL HIGHLIGHTS |
CRM Mid Cap Value Fund — Institutional Shares | ||||||||||||||||||||||||
Six Months | For the Years Ended June 30, | |||||||||||||||||||||||
(Unaudited)1 | 2022 | 2021 | 2020 | 2019 | 2018 | |||||||||||||||||||
Net Asset Value - Beginning of Year/Period | $ | 22.62 | $ | 29.00 | $ | 19.17 | $ | 22.16 | $ | 23.49 | $ | 23.96 | ||||||||||||
Investment operations: | ||||||||||||||||||||||||
Net investment income2 | 0.10 | 0.33 | 0.20 | 0.12 | 0.13 | 0.19 | 3 | |||||||||||||||||
Net realized and unrealized gain (loss) on investments | 1.09 | (1.67 | ) | 10.12 | (2.44 | ) | 0.43 | 3.71 | ||||||||||||||||
Total from investment operations | 1.19 | (1.34 | ) | 10.32 | (2.32 | ) | 0.56 | 3.90 | ||||||||||||||||
Distributions to shareholders: | ||||||||||||||||||||||||
From net investment income | (0.30 | ) | (0.32 | ) | (0.13 | ) | (0.13 | ) | (0.08 | ) | (0.35 | ) | ||||||||||||
From net realized gain on investments | (0.69 | ) | (4.72 | ) | (0.36 | ) | (0.54 | ) | (1.81 | ) | (4.02 | ) | ||||||||||||
Total distributions to shareholders | (0.99 | ) | (5.04 | ) | (0.49 | ) | (0.67 | ) | (1.89 | ) | (4.37 | ) | ||||||||||||
Net Asset Value - End of Year/Period | $ | 22.82 | $ | 22.62 | $ | 29.00 | $ | 19.17 | $ | 22.16 | $ | 23.49 | ||||||||||||
Total return | 5.17 | % | (6.55 | )% | 54.44 | % | (10.83 | )% | 3.61 | % | 18.04 | % | ||||||||||||
Ratios/Supplemental Data: | ||||||||||||||||||||||||
Ratios to average net assets: | ||||||||||||||||||||||||
Expenses | 0.99 | % | 0.97 | % | 0.94 | % | 0.96 | % | 0.94 | % | 0.91 | % | ||||||||||||
Net investment income | 0.85 | % | 1.23 | % | 0.84 | % | 0.59 | % | 0.58 | % | 0.82 | %3 | ||||||||||||
Portfolio turnover rate | 19 | % | 23 | % | 63 | % | 37 | % | 40 | % | 58 | % | ||||||||||||
Net Assets at end of year/period (000’s omitted) | $ | 247,773 | $ | 219,322 | $ | 251,517 | $ | 202,989 | $ | 243,851 | $ | 312,290 | ||||||||||||
(1) | For the six months ended December 31, 2022. All ratios for the period have been annualized. Total returns and portfolio turnover for the period have not been annualized. |
(2) | Calculated using the average shares method. |
(3) | For the year ended June 30, 2018, net investment income per share reflects special dividends which amount to $0.13 per share. Excluding the special dividends, the ratio of net investment income to average net assets would have been 0.24%. |
See accompanying notes to financial statements. | CRM Funds | |
78 | ||
CRM FUNDS FINANCIAL HIGHLIGHTS |
CRM All Cap Value Fund — Investor Shares | ||||||||||||||||||||||||
Six Months | For the Years Ended June 30, | |||||||||||||||||||||||
(Unaudited)1 | 2022 | 2021 | 2020 | 2019 | 2018 | |||||||||||||||||||
Net Asset Value - Beginning of Year/Period | $ | 6.47 | $ | 8.88 | $ | 5.91 | $ | 6.99 | $ | 8.81 | $ | 9.28 | ||||||||||||
Investment operations: | ||||||||||||||||||||||||
Net investment income (loss)2 | — | 3 | 0.02 | 0.02 | 0.01 | 0.01 | (0.01 | ) | ||||||||||||||||
Net realized and unrealized gain (loss) on investments | 0.35 | (0.70 | ) | 3.16 | (0.67 | ) | (0.26 | ) | 1.00 | |||||||||||||||
Total from investment operations | 0.35 | (0.68 | ) | 3.18 | (0.66 | ) | (0.25 | ) | 0.99 | |||||||||||||||
Distributions to shareholders: | ||||||||||||||||||||||||
From net investment income | (0.01 | ) | (0.04 | ) | (0.02 | ) | (0.01 | ) | — | — | ||||||||||||||
From net realized gain on investments | (0.45 | ) | (1.69 | ) | (0.19 | ) | (0.41 | ) | (1.57 | ) | (1.46 | ) | ||||||||||||
Total distributions to shareholders | (0.46 | ) | (1.73 | ) | (0.21 | ) | (0.42 | ) | (1.57 | ) | (1.46 | ) | ||||||||||||
Net Asset Value - End of Year/Period | $ | 6.36 | $ | 6.47 | $ | 8.88 | $ | 5.91 | $ | 6.99 | $ | 8.81 | ||||||||||||
Total return | 5.27 | % | (10.09 | )% | 54.42 | % | (10.16 | )% | (0.72 | )% | 11.20 | % | ||||||||||||
Ratios/Supplemental Data: | ||||||||||||||||||||||||
Ratios to average net assets: | ||||||||||||||||||||||||
Expenses, including waiver/reimbursement | 1.37 | % | 1.33 | % | 1.37 | % | 1.40 | % | 1.50 | % | 1.50 | % | ||||||||||||
Expenses, excluding waiver/reimbursement | 1.37 | % | 1.33 | % | 1.39 | % | 1.50 | % | 2.20 | % | 1.93 | % | ||||||||||||
Net investment income (loss), including waiver/reimbursement | (0.10 | )% | 0.32 | % | 0.31 | % | 0.22 | % | 0.12 | % | (0.07 | )% | ||||||||||||
Portfolio turnover rate | 21 | % | 38 | % | 87 | % | 65 | % | 112 | % | 72 | % | ||||||||||||
Net Assets at end of year/period (000’s omitted) | $ | 7,973 | $ | 7,622 | $ | 8,916 | $ | 6,893 | $ | 9,256 | $ | 4,694 | ||||||||||||
(1) | For the six months ended December 31, 2022. All ratios for the period have been annualized. Total returns and portfolio turnover for the period have not been annualized. |
(2) | Calculated using the average shares method. |
(3) | Amount represents less than $0.005. |
See accompanying notes to financial statements. | CRM Funds | |
79 | ||
CRM FUNDS FINANCIAL HIGHLIGHTS |
CRM All Cap Value Fund — Institutional Shares | ||||||||||||||||||||||||
Six Months | For the Years Ended June 30, | |||||||||||||||||||||||
(Unaudited)1 | 2022 | 2021 | 2020 | 2019 | 2018 | |||||||||||||||||||
Net Asset Value - Beginning of Year/Period | $ | 6.69 | $ | 9.12 | $ | 6.07 | $ | 7.16 | $ | 8.98 | $ | 9.40 | ||||||||||||
Investment operations: | ||||||||||||||||||||||||
Net investment income2 | — | 3 | 0.04 | 0.04 | 0.03 | 0.03 | 0.01 | |||||||||||||||||
Net realized and unrealized gain (loss) on investments | 0.37 | (0.72 | ) | 3.24 | (0.68 | ) | (0.27 | ) | 1.03 | |||||||||||||||
Total from investment operations | 0.37 | (0.68 | ) | 3.28 | (0.65 | ) | (0.24 | ) | 1.04 | |||||||||||||||
Distributions to shareholders: | ||||||||||||||||||||||||
From net investment income | (0.03 | ) | (0.06 | ) | (0.04 | ) | (0.03 | ) | (0.01 | ) | — | |||||||||||||
From net realized gain on investments | (0.45 | ) | (1.69 | ) | (0.19 | ) | (0.41 | ) | (1.57 | ) | (1.46 | ) | ||||||||||||
Total distributions to shareholders | (0.48 | ) | (1.75 | ) | (0.23 | ) | (0.44 | ) | (1.58 | ) | (1.46 | ) | ||||||||||||
Net Asset Value - End of Year/Period | $ | 6.58 | $ | 6.69 | $ | 9.12 | $ | 6.07 | $ | 7.16 | $ | 8.98 | ||||||||||||
Total return | 5.34 | % | (9.81 | )% | 54.66 | % | (9.87 | )% | (0.51 | )% | 11.63 | % | ||||||||||||
Ratios/Supplemental Data: | ||||||||||||||||||||||||
Ratios to average net assets: | ||||||||||||||||||||||||
Expenses, including waiver/reimbursement | 1.14 | % | 1.09 | % | 1.11 | % | 1.15 | % | 1.25 | % | 1.25 | % | ||||||||||||
Expenses, excluding waiver/reimbursement | 1.14 | % | 1.09 | % | 1.13 | % | 1.25 | % | 1.96 | % | 1.68 | % | ||||||||||||
Net investment income, including waiver/reimbursement | 0.13 | % | 0.56 | % | 0.52 | % | 0.47 | % | 0.36 | % | 0.18 | % | ||||||||||||
Portfolio turnover rate | 21 | % | 38 | % | 87 | % | 65 | % | 112 | % | 72 | % | ||||||||||||
Net Assets at end of year/period (000’s omitted) | $ | 16,435 | $ | 15,509 | $ | 18,393 | $ | 18,307 | $ | 26,816 | $ | 14,082 | ||||||||||||
(1) | For the six months ended December 31, 2022. All ratios for the period have been annualized. Total returns and portfolio turnover for the period have not been annualized. |
(2) | Calculated using the average shares method. |
(3) | Amount represents less than $0.005. |
See accompanying notes to financial statements. | CRM Funds | |
80 | ||
CRM FUNDS FINANCIAL HIGHLIGHTS |
CRM Long/Short Opportunities Fund — Institutional Shares | ||||||||||||||||||||||||
Six Months | For the Years Ended June 30, | |||||||||||||||||||||||
(Unaudited)1 | 2022 | 2021 | 2020 | 2019 | 2018 | |||||||||||||||||||
Net Asset Value - Beginning of Year/Period | $ | 11.15 | $ | 11.62 | $ | 10.23 | $ | 10.27 | $ | 10.68 | $ | 10.25 | ||||||||||||
Investment operations: | ||||||||||||||||||||||||
Net investment loss2 | (0.03 | ) | (0.23 | ) | (0.25 | ) | (0.10 | ) | (0.11 | ) | (0.10 | ) | ||||||||||||
Net realized and unrealized gain (loss) on investments, derivatives and foreign currency | 0.47 | (0.15 | ) | 2.22 | 0.50 | (0.14 | ) | 0.55 | ||||||||||||||||
Total from investment operations | 0.44 | (0.38 | ) | 1.97 | 0.40 | (0.25 | ) | 0.45 | ||||||||||||||||
Distributions to shareholders: | ||||||||||||||||||||||||
From net realized gain on investments | (0.18 | ) | (0.09 | ) | (0.58 | ) | (0.44 | ) | (0.16 | ) | (0.02 | ) | ||||||||||||
Total distributions to shareholders | (0.18 | ) | (0.09 | ) | (0.58 | ) | (0.44 | ) | (0.16 | ) | (0.02 | ) | ||||||||||||
Net Asset Value - End of Year/Period | $ | 11.41 | $ | 11.15 | $ | 11.62 | $ | 10.23 | $ | 10.27 | $ | 10.68 | ||||||||||||
Total return | 3.91 | % | (3.33 | )% | 19.49 | % | 3.93 | % | (2.18 | )% | 4.44 | % | ||||||||||||
Ratios to average net assets: | ||||||||||||||||||||||||
Expenses, including waiver/reimbursement | 2.27 | % | 2.68 | % | 2.79 | % | 2.95 | % | 3.03 | % | 2.80 | % | ||||||||||||
Expenses, including waiver/reimbursement and excluding interest and dividend expense relating to short sales | 1.60 | % | 1.60 | % | 1.60 | % | 1.59 | % | 1.60 | % | 1.60 | % | ||||||||||||
Expenses, excluding waiver/reimbursement | 2.37 | % | 2.80 | % | 2.90 | % | 3.03 | % | 3.10 | % | 2.85 | % | ||||||||||||
Expenses, excluding waiver/reimbursement and interest and dividend expense relating to short sales | 1.71 | % | 1.72 | % | 1.71 | % | 1.67 | % | 1.67 | % | 1.65 | % | ||||||||||||
Net investment loss, including waiver/reimbursement | (0.48 | )% | (2.00 | )% | (2.18 | )% | (0.99 | )% | (1.03 | )% | (0.94 | )% | ||||||||||||
See accompanying notes to financial statements. | CRM Funds | |
81 | ||
CRM FUNDS FINANCIAL HIGHLIGHTS |
CRM Long/Short Opportunities Fund — Institutional Shares | ||||||||||||||||||||||||
Six Months | For the Years Ended June 30, | |||||||||||||||||||||||
(Unaudited)1 | 2022 | 2021 | 2020 | 2019 | 2018 | |||||||||||||||||||
Portfolio turnover rate | 43 | % | 157 | % | 201 | % | 177 | % | 195 | % | 251 | % | ||||||||||||
Net Assets at end of year/period (000’s omitted) | $ | 209,841 | $ | 185,463 | $ | 127,930 | $ | 56,540 | $ | 482,050 | $ | 709,303 | ||||||||||||
(1) | For the six months ended December 31, 2022. All ratios for the period have been annualized. Total returns and portfolio turnover for the period have not been annualized. |
(2) | Calculated using the average shares method. |
See accompanying notes to financial statements. | CRM Funds | |
82 | ||
CRM FUNDS NOTES TO FINANCIAL STATEMENTS — December 31, 2022 (Unaudited) |
1. | Description of the Funds. CRM Small Cap Value Fund (“Small Cap Value Fund”), CRM Small/Mid Cap Value Fund (“Small/Mid Cap Value Fund”), CRM Mid Cap Value Fund (“Mid Cap Value Fund”), CRM All Cap Value Fund (“All Cap Value Fund”) and CRM Long/Short Opportunities Fund (“Long/Short Opportunities Fund”) (each, a “Fund” and collectively, the “Funds”) are series of the CRM Mutual Fund Trust (the “Trust”). The Trust consists of five funds. A shareholder of one series is not deemed to be a shareholder of any other series. The Trust is registered under the Investment Company Act of 1940, as amended (the “1940 Act”), as an open-end management investment company and was organized as a Delaware statutory trust on March 30, 2005. |
Small Cap Value Fund, Small/Mid Cap Value Fund, Mid Cap Value Fund, and All Cap Value Fund: Each Fund offers Investor and Institutional Shares. Each class has different minimum investment requirements, fees and expenses. All classes of shares have identical voting, dividend and liquidation rights. Investor Shares are available to all investors and are subject to a shareholder servicing fee. Institutional Shares are offered only to those investors who invest in a Fund through an intermediary (i.e. broker) or through a consultant and who invest $1,000,000 or more or where related accounts total $1,000,000 or more when combined.
Long/Short Opportunities Fund: The Fund offers Institutional Shares. Shares are generally available for purchase and sale by registered investment advisers acting in a fiduciary capacity on behalf of their clients and by or through other qualified intermediaries and programs sponsored by such qualified financial intermediaries. Initial investments in the Fund are subject to a $10,000 minimum per registered investment adviser or qualified financial intermediary.
2. | Significant Accounting Policies. The Funds’ financial statements have been prepared in conformity with U.S. generally accepted accounting principles (“U.S. GAAP”). The Funds are investment companies and follow the accounting and reporting requirements for investment companies under Financial Accounting Standards Board (“FASB”), Accounting Standards Codification Topic 946. The following is a summary of the significant accounting policies of the Funds: |
CRM Funds | ||
83 |
CRM FUNDS NOTES TO FINANCIAL STATEMENTS — December 31, 2022 (Unaudited) (Continued) |
Security Valuation. The Funds value their investment securities based on current market values when such values are available. These prices normally are supplied by a pricing service.
In valuing a Fund’s investment securities, a security listed on the New York Stock Exchange (the “Exchange”) (and not subject to restrictions against sale by the Fund on the Exchange) will be valued at its last sale price on the Exchange on the day the security is valued. Lacking any sales on such day, the security will be valued at the mean between the closing asked price and the closing bid price. Securities listed on other exchanges (and not subject to restriction against sale by the Fund on such exchanges) will be similarly valued, using quotations on the exchange on which the security is traded most extensively. Securities that are quoted on the NASDAQ Stock Market, for which there have been sales of such securities on such day, shall be valued at the last sale price reported on such system on the day the security is valued. If there are no such sales on such day, the value shall be the mean between the closing asked price and the closing bid price. The value of such securities quoted on the stock market system, but not listed on the national market system, shall be valued at the mean between the closing asked price and the closing bid price. Unlisted securities that are not quoted on the NASDAQ Stock Market and for which over-the-counter market quotations are readily available will be valued at the mean between the current bid and asked prices for such security in the over-the-counter market.
Short-term investments with remaining maturities of less than 61 days are valued at amortized cost, provided such amount approximates fair value. A Fund’s currency valuations, if any, are also valued at the close of regular trading on the Exchange. Investments in other open-end investment companies are valued at such investment company’s current day closing net asset value per share. Swaps and forward foreign currency exchange contracts are valued utilizing market quotations provided by a third-party pricing service. Option contracts are generally valued at the mean between the last bid and ask prices on the principal exchange where they are traded.
Pursuant to Rule 2a-5 under the 1940 Act, the Board of Trustees of the Trust (the “Board” or “Trustees”) has designated Cramer Rosenthal McGlynn, LLC, the adviser, to serve as the Trust’s Valuation Designee, to perform any fair value determinations for securities and other assets held by the Funds for which market quotations are not readily available in accordance with the
CRM Funds | ||
84 |
CRM FUNDS NOTES TO FINANCIAL STATEMENTS — December 31, 2022 (Unaudited) (Continued) |
Trust’s Securities Pricing Procedures. In addition, the Funds may use fair value methodologies if it is determined that a significant event has occurred between the time at which a market price is determined and the time at which the Fund’s net asset value (“NAV”) is calculated and that may materially affect the value of the security. In particular, the value of foreign securities may be materially affected by events occurring after the close of the market on which they are valued, but before a Fund prices its shares. Securities trading in overseas markets present time zone arbitrage opportunities when events affecting portfolio security values occur after the close of the overseas market but prior to the close of the U.S. market. In addition, arbitrage opportunities may exist when trading in a portfolio security or securities is halted and does not resume before a fund calculates its NAV. These arbitrage opportunities may enable short-term traders to profit at the expense of long-term investors. Valuing securities using fair value methodologies involves greater reliance on judgment than valuing securities based on readily available market quotations. A Fund, when using fair value methodologies to price securities, may value those securities higher or lower than another fund using market quotations or its own fair value methodologies to price the same securities. There can be no assurance that a Fund could obtain the fair value assigned to a security if it were to sell the security.
The Funds disclose the value of their investments in a hierarchy based on the inputs used to value the investments. The disclosure hierarchy consists of three broad levels:
● Level 1 — | quoted prices in active markets for identical securities |
Investments whose values are based on quoted market prices in active markets, and whose values are therefore classified as Level 1 prices, include active listed equity securities. The Funds do not adjust the quoted price for such investments, even in situations where the Funds hold a large position and a sale could reasonably impact the quoted price.
● Level 2 — | other significant observable inputs (including quoted prices for similar securities, interest rates, prepayment speeds, credit risk, etc.) |
Investments that trade in markets that are not considered to be active, but whose values are based on quoted market prices, dealer quotations or
CRM Funds | ||
85 |
CRM FUNDS NOTES TO FINANCIAL STATEMENTS — December 31, 2022 (Unaudited) (Continued) |
valuations provided by alternative pricing sources supported by observable inputs are classified as Level 2 prices. These generally include certain U.S. government and sovereign obligations, most government agency securities, investment-grade corporate bonds and less liquid listed equity securities. In addition, foreign securities may require revised valuations if the values of the securities are materially affected by events occurring after the close of the market on which they are valued, but before a Fund prices its shares. As investments whose values are classified as Level 2 prices may include positions that are not traded in active markets and/or are subject to transfer restrictions, valuations may be adjusted to reflect illiquidity and/or non-transferability, which are generally based on available market information.
● Level 3 — | significant unobservable inputs (including the Fund’s own assumptions in determining the fair value of investments) |
Investments whose values are classified as Level 3 prices have significant unobservable inputs, as they may trade infrequently or not at all. When observable prices are not available for these securities, the Funds use one or more valuation techniques for which sufficient and reliable data is available. The inputs used by the Funds in estimating the value of Level 3 prices may include the original transaction price, quoted prices for comparable companies or assets in active markets, completed or pending third-party transactions in the underlying investment or comparable issuers, and changes in financial ratios or cash flows. Level 3 prices may also be adjusted to reflect illiquidity and/or non-transferability, with the amount of such discount estimated by the Funds in the absence of market information. Assumptions used by the Funds due to the lack of observable inputs may significantly impact the resulting value and therefore the Funds’ results of operations.
The inputs or methodology used for valuing securities are not necessarily an indication of the risk associated with investing in those securities. A financial instrument’s level within the fair value hierarchy is based on the lowest level of any inputs both individually and in the aggregate that is significant to the fair value measurement. The Funds’ policy is to recognize transfers among levels as of the beginning of the reporting period. A summary of the inputs used to value the Funds’ investments as of December 31, 2022 is included with each Fund’s Schedule of Investments.
CRM Funds | ||
86 |
CRM FUNDS NOTES TO FINANCIAL STATEMENTS — December 31, 2022 (Unaudited) (Continued) |
Foreign Currency Translations. The books and records of the Funds are maintained in U.S. dollars. Transactions denominated in foreign currencies are recorded at the prevailing exchange rates on the valuation date. The value of all assets and liabilities denominated in foreign currencies are translated into U.S. dollars at the exchange rate of such currencies against the U.S. dollar daily. The Funds do not isolate that portion of the results of operations resulting from changes in foreign exchange rates on investments from the fluctuations arising from changes in market prices of those investments. Such fluctuations are included with the net realized and unrealized gain or loss from investments that are disclosed within each Fund’s statement of operations, as applicable.
Federal Income Taxes. Each Fund is treated as a separate entity for federal income tax purposes and intends to continue to qualify as a “regulated investment company” (“RIC”) under Subchapter M of the Internal Revenue Code of 1986, as amended, and to distribute substantially all of its taxable income to its shareholders. Therefore, no Federal income tax provision has been made.
Accounting for Uncertainty in Income Taxes sets forth a minimum threshold for financial statement recognition of the benefit of a tax position taken or expected to be taken in a tax return. Management has analyzed each of the Fund’s tax positions and has concluded that no provision for U.S. income tax is required in each of the Fund’s financial statements. Each of the Fund’s federal tax returns for the prior three fiscal years remains subject to examination by the Internal Revenue Service. On an ongoing basis, management monitors the Funds’ tax positions to determine if any adjustments to its conclusions are necessary.
The Funds recognize interest and penalties, if any, related to unrecognized tax benefits as income tax expense on the Statements of Operations. During the six months ended December 31, 2022, the Funds did not incur any interest or penalties.
Security Transactions and Investment Income. Investment security transactions are accounted for on a trade date basis for financial reporting purposes. Each Fund uses the specific identification method for determining realized gains and losses on investments for both financial and federal income tax reporting purposes. Interest income is recorded on the accrual basis and includes the
CRM Funds | ||
87 |
CRM FUNDS NOTES TO FINANCIAL STATEMENTS — December 31, 2022 (Unaudited) (Continued) |
amortization of premium and the accretion of discount. Dividend income and expense are recorded on the ex-dividend date. Foreign dividends are also recorded on the ex-dividend date, net of all tax withholdings not eligible for rebates. Withholding taxes on foreign dividends are recorded in accordance with the Fund’s understanding of the applicable country’s tax rules and rates. Distributions received from investments in Real Estate Investment Trusts (“REITs”) are recorded as dividend income on the ex-dividend date, subject to reclassification upon notice of the character of the distributions by the issuer or management estimate. The Funds record expenses as incurred. Common expenses of the Trust are allocated on a pro-rata basis amongst the series of the Trust based on relative net assets.
The Funds’ investments in certain countries are subjected to additional capital gain taxes. Such taxes are due upon sale of individual securities. The Funds accrue for taxes on the capital gains throughout the holding period based on the unrealized gain of the underlying securities, as applicable. The Funds held no such securities during the six months ended December 31, 2022.
Class Accounting. In calculating the NAV per share for each class, investment income, realized and unrealized gains and losses and expenses other than class specific expenses, are allocated daily to each class of shares based upon the proportion of net assets of each class at the beginning of each day.
Repurchase Agreements. Each Fund (except Long/Short Opportunities Fund) may, through its custodian, receive delivery of the underlying securities used to collateralize repurchase agreements, the market value of which is required to be in an amount at least equal to 101% of the resale price. The Funds’ investment adviser is responsible for determining that the market value of these underlying securities is maintained at all times at a level at least equal to 101% of the resale price. In event of default of the obligation to repurchase, each Fund has the right to liquidate the collateral and apply the proceeds in satisfaction of the obligation. Provisions of each agreement require that the market value of the collateral is sufficient in the event of default; however, in the event of default or bankruptcy by the other party to the agreement, realization and/or retention of the collateral may be subject to legal proceedings.
Repurchase agreements are entered into by the Funds under Master Repurchase Agreements (“MRA”) which permit the Funds, under certain circumstances
CRM Funds | ||
88 |
CRM FUNDS NOTES TO FINANCIAL STATEMENTS — December 31, 2022 (Unaudited) (Continued) |
including an event of default (such as bankruptcy or insolvency), to offset payables and/or receivables under the MRA with collateral held and/or posted to the counterparty and create one single net payment due to or from the Fund.
At December 31, 2022, the open repurchase agreements by counterparty which are subject to a MRA on a net payment basis are as follows:
Repurchase | Fair Value | Cash | Net Amount2 | |||||||||||||
Small/Mid Cap Value Fund | ||||||||||||||||
Citigroup Global Markets, Inc. | $ | 1,000,000 | $ | 1,000,000 | $ | — | $ | — | ||||||||
HSBC Securities USA, Inc. | 922,949 | 922,949 | — | — | ||||||||||||
JP Morgan Securities LLC | 1,000,000 | 1,000,000 | — | — | ||||||||||||
Mizuho Securities USA, LLC. | 1,000,000 | 1,000,000 | — | — | ||||||||||||
| $ | 3,922,949 | $ | 3,922,949 | $ | — | $ | — | |||||||||
Mid Cap Value Fund | ||||||||||||||||
Bank of America Securities, Inc. | $ | 683,504 | $ | 683,504 | $ | — | $ | — | ||||||||
Citigroup Global Markets, Inc. | 3,248,983 | 3,248,983 | — | — | ||||||||||||
Deutsche Bank Securities, Inc. | 3,248,983 | 3,248,983 | — | — | ||||||||||||
JP Morgan Securities LLC | 3,248,983 | 3,248,983 | — | — | ||||||||||||
Mizuho Securities USA, LLC | 3,248,983 | 3,248,983 | — | — | ||||||||||||
| $ | 13,679,436 | $ | 13,679,436 | $ | — | $ | — | |||||||||
All Cap Value Fund | ||||||||||||||||
JP Morgan Securities LLC | $ | 573,277 | $ | 573,277 | $ | — | $ | — | ||||||||
| $ | 573,277 | $ | 573,277 | $ | — | $ | — | |||||||||
1 | The value of collateral shown in the table does not reflect value that exceeds the value of the repurchase agreement. Collateral with a value of $4,001,409, $13,953,027, and $584,743, respectively, has been received in connection with open repurchase agreements. |
2 | Net exposure represents the receivable (payable) that would be due to (from) the counterparty in an event of default. |
Distributions to Shareholders. Dividends and distributions to shareholders are recorded on the ex-dividend date. Distributions from net investment income and net realized gains, if any, will be declared and paid annually.
Use of Estimates in the Preparation of Financial Statements. The preparation of financial statements in conformity with U.S. GAAP requires management to
CRM Funds | ||
89 |
CRM FUNDS NOTES TO FINANCIAL STATEMENTS — December 31, 2022 (Unaudited) (Continued) |
make estimates and assumptions that affect the reported amounts of assets and liabilities at the date of the financial statements and the reported amounts of revenues and expenses during the reporting period. Actual results could differ from those estimates.
3. | Advisory Fees and Other Transactions with Affiliates. Cramer Rosenthal McGlynn, LLC (“CRM”) serves as investment adviser to the Funds. CRM receives an advisory fee from Small Cap Value Fund, Small/Mid Cap Value Fund, and Mid Cap Value Fund of 0.75% of each Fund’s first $1 billion of average daily net assets; 0.70% of each Fund’s next $1 billion of average daily net assets; and 0.65% of each Fund’s average daily net assets in excess of $2 billion. For its advisory services to All Cap Value Fund, CRM receives 0.70% of the Fund’s first $1 billion of average daily net assets; 0.65% of the Fund’s next $1 billion of average daily net assets; and 0.60% of the Fund’s average daily net assets in excess of $2 billion. |
CRM has contractually agreed to waive a portion of its fees and assume certain expenses of the Funds to the extent that total annual fund operating expenses (excluding taxes, extraordinary expenses, brokerage commissions, acquired fund fees and expenses and interest) exceeds the percentage of average daily net assets as follows:
Investor | Institutional | |
Small Cap Value Fund | 1.50% | 1.25% |
Small/Mid Cap Value Fund | 1.50% | 1.25% |
Mid Cap Value Fund | 1.50% | 1.25% |
All Cap Value Fund | 1.45% | 1.20% |
For its advisory services to Long/Short Opportunities Fund, CRM receives 1.50% of the Fund’s first $1 billion of average daily net assets; 1.45% of the Fund’s next $1 billion of average daily net assets; and 1.40% of the Fund’s average daily net assets in excess of $2 billion. CRM has contractually agreed to waive a portion of its fees and assume certain expenses of Long/Short Opportunities Fund to the extent that total annual fund operating expenses
CRM Funds | ||
90 |
CRM FUNDS NOTES TO FINANCIAL STATEMENTS — December 31, 2022 (Unaudited) (Continued) |
(excluding taxes, extraordinary expenses, brokerage commissions, interest, dividend and interest expenses related to short sales, and acquired fund fees and expenses) exceeds the percentage of average daily net assets as follows:
Institutional | |
Long/Short Opportunities Fund | 1.60% |
The expense limitations are in effect until November 1, 2023. Prior to that date, the arrangement may be terminated for a class of a Fund only by the vote of the Board of Trustees of the Funds.
Northern Lights Compliance Services, LLC provides compliance services to the Trust.
Compensation of Trustees and Officers. Trustees and officers of the Funds who are interested persons of CRM, as defined in the 1940 Act, receive no compensation from the Funds.
Trustees of the Funds who are not interested persons of CRM, as defined in the 1940 Act (each an “Independent Trustee”), receive compensation and reimbursement of expenses. Each Independent Trustee receives aggregate annual compensation from the Trust at an annual rate of $60,000 which is allocated on a pro-rata basis amongst the series of the Trust based on relative net assets. Under a Deferred Compensation Plan (the “Plan”) adopted August 12, 2005, an Independent Trustee may elect to defer receipt of all, or a portion, of his annual compensation. If an Independent Trustee opts for deferral, then the deferred amounts are credited to an Independent Trustee’s deferral account and invested and reinvested in Institutional Shares of one or more of the Funds in the series of the Trust until such amounts are distributed in accordance with the Plan. No Independent Trustee deferred their compensation earned for the six months ended December 31, 2022. Trustees’ fees reflected in the accompanying financial statements include total compensation earned, which were paid in cash. Each trustee serves during the continued lifetime of the Funds, or the earlier of when his or her successor is elected or qualified, the officer dies, resigns, is removed or becomes disqualified.
Shareholder Servicing Fees. The Board has adopted a Shareholder Servicing Plan which allows each Fund to obtain, for its Investor Shares, the services of
CRM Funds | ||
91 |
CRM FUNDS NOTES TO FINANCIAL STATEMENTS — December 31, 2022 (Unaudited) (Continued) |
CRM and other qualified financial institutions to act as shareholder servicing agents for its shareholders. Under the Shareholder Servicing Plan, each Fund may pay shareholder servicing agents, including CRM, monthly fees at an annual rate not to exceed 0.25% of the Fund’s average daily net assets attributable to its Investor Shares.
Sub-Transfer Agent Fees. Institutional Shares of each Fund are sold through certain intermediaries that provide accounting, recordkeeping, and/or other services to shareholders. The Board of Trustees has approved payment of the fees charged by these intermediaries for providing these sub-transfer agency services from the assets of the Institutional Shares of each Fund based on reasonable charges for similar services in the industry, subject to certain limitations. CRM, as the Funds’ agent, remits these payments to the intermediaries. In some cases, where the sub-transfer agency fees of an intermediary are greater than the amounts paid to CRM by the Funds for that intermediary, CRM will pay the balance of those fees itself.
4. | Investment Securities Transactions. The cost of investments purchased and the proceeds from investments sold (excluding in-kind transactions and short-term investments) for the six months ended December 31, 2022, were as follows: |
Purchases | Sales | Short Sales | Purchases to | |||||||||||||
Small Cap Value Fund | $ | 17,993,801 | $ | 33,996,362 | $ | — | $ | — | ||||||||
Small/Mid Cap Value Fund | 49,660,391 | 40,271,856 | — | — | ||||||||||||
Mid Cap Value Fund | 87,128,143 | 75,625,837 | — | — | ||||||||||||
All Cap Value Fund | 4,818,410 | 4,932,311 | — | — | ||||||||||||
Long/Short Opportunities Fund | 56,882,088 | 36,215,623 | 77,541,232 | 51,070,719 | ||||||||||||
5. | Securities Lending Agreement. Each Fund (except Long/Short Opportunities Fund) may lend their securities pursuant to a securities lending agreement (“Lending Agreement”) with The Bank of New York Mellon. Security loans made pursuant to the Lending Agreement are required at all times to be secured by cash collateral at least equal to 102% of the market value of the securities loaned. The market value of the loaned securities is determined at the close of business of the Fund and any additional required collateral is delivered to the Fund on the next business day. Cash collateral received, pursuant to investment guidelines established by the Funds and approved by the Board of |
CRM Funds | ||
92 |
CRM FUNDS NOTES TO FINANCIAL STATEMENTS — December 31, 2022 (Unaudited) (Continued) |
Trustees, is invested in short-term fixed income securities rated in the highest rating category by nationally recognized statistical rating organizations (or of comparable quality if unrated) with a maturity date of 397 days or less, including corporate obligations and money market mutual funds. All such investments are made at the risk of the Funds and, as such, the Funds are liable for investment losses. The Bank of New York Mellon and the lender retain a portion of the earnings from the collateral investments, with the remainder being retained by the Fund. The Funds record securities lending income net of such allocations. In the event the borrower fails to return loaned securities and the collateral received is insufficient to cover the value of the loaned securities and provided such collateral shortfall is not the result of investment losses, The Bank of New York Mellon has agreed to pay the amount of the shortfall to the Funds, or at its discretion, replace the loaned securities. In the event of default or bankruptcy by The Bank of New York Mellon, realization and/or retention of the collateral may be subject to legal proceedings.
At December 31, 2022, the following Funds had securities on loan:
Market | Cash | |||||||
Small/Mid Cap Value Fund | $ | 3,804,874 | $ | 3,922,949 | ||||
Mid Cap Value Fund | 13,205,972 | 13,679,436 | ||||||
All Cap Value Fund | 555,696 | 573,277 | ||||||
* | Please note any reported shortfall in required collateral coverage of 102% is based on closing market value of securities on loan as of the date of the report. Any required collateral adjustment needed in order to bring coverage to 102% is done on the next business day. |
6. | Short Sale Transactions. In short sale transactions, the Fund sells a security it does not hold in anticipation of a decline in the market price of that security. When the Fund makes a short sale, it will borrow the security sold short (borrowed bond) and deliver the security to the counterparty to which it sold the security short. An amount equal to the proceeds received by the Fund is reflected as an asset and an equivalent liability. The amount of the liability is subsequently marked-to-market to reflect the market value of the short sale. The Fund is required to repay the counterparty any dividends declared on the security sold short, which is shown as dividend expense in the Statements of Operations. The Fund is exposed to market risk based on the amount, if any, that the market value of the security increases beyond the market value at which the position was sold. Thus, a short sale of a security involves the risk |
CRM Funds | ||
93 |
CRM FUNDS NOTES TO FINANCIAL STATEMENTS — December 31, 2022 (Unaudited) (Continued) |
that instead of declining, the price of the security sold short will rise. The short sale of securities involves the possibility of an unlimited loss since there is an unlimited potential for the market price of the security sold short to increase. A gain is limited to the price at which the Fund sold the security short. A realized gain or loss is recognized upon the termination of a short sale if the market price is either less than or greater than the proceeds originally received. There is no assurance that the Fund will be able to close out a short position at a particular time or at an acceptable price.
The Fund is required to pledge cash or securities to the broker as collateral for the securities sold short. Collateral requirements are calculated daily based on the current market value of the short positions. Cash that has been pledged to secure the Fund’s obligation to cover the short positions is reported separately on the Statements of Assets and Liabilities. The Fund may receive from or pay to the broker the net of the following amounts:(i) income on cash collateral held at the broker and (ii) a financing charge to the extent the cash collateral is less than the margin requirement. The net amounts of income or fees are included as interest income or expense, as applicable, on securities sold short in the Statements of Operations.
During the six months ended December 31, 2022, Long/Short Opportunities Fund participated in short sale transactions.
7. | Federal Tax Information. Distributions to shareholders from net investment income and realized gains are determined in accordance with Federal income tax regulations, which may differ from net investment income and realized gains recognized for financial reporting purposes. Additionally, net short-term realized gains are treated as “ordinary income” for tax purposes. Accordingly, the character of distributions and composition of net assets for tax purposes may differ from those reflected in the accompanying financial statements. To the extent these differences are permanent, such amounts are reclassified within the capital accounts based on the tax treatment; temporary differences do not require such reclassification. |
The total cost of investments and net unrealized appreciation or depreciation for federal income tax purposes were different from amounts reported for financial reporting purposes. The federal tax cost, and related gross unrealized
CRM Funds | ||
94 |
CRM FUNDS NOTES TO FINANCIAL STATEMENTS — December 31, 2022 (Unaudited) (Continued) |
appreciation and depreciation of securities held by the Funds as of December 31, 2022 were as follows:
Tax Cost of | Gross | Gross | Net Unrealized | |||||||||||||
Small Cap Value Fund | $ | 103,942,899 | $ | 18,383,450 | $ | (7,421,692 | ) | $ | 10,961,758 | |||||||
Small/Mid Cap Value Fund | 124,153,392 | �� | 39,653,009 | (10,076,323 | ) | 29,576,686 | ||||||||||
Mid Cap Value Fund | 343,127,939 | 114,930,113 | (27,810,200 | ) | 87,119,913 | |||||||||||
All Cap Value Fund | 21,697,288 | 5,210,739 | (1,908,154 | ) | 3,302,585 | |||||||||||
Long/Short Opportunities Fund | 89,321,431 | 25,767,960 | (11,683,301 | ) | 14,084,659 | |||||||||||
8. | Derivative Financial Instruments. Each Fund may, but is not required to, invest in derivative contracts, such as swaps and options on securities and securities indices, for a variety of purposes, including: in an attempt to hedge against adverse changes in the market price of securities, interest rates or currency exchange rates; as a substitute for purchasing or selling securities, including short sales; to attempt to increase the Fund’s return as a non-hedging strategy that may be considered speculative; to manage portfolio characteristics; and as a cash flow management technique. Using swaps, options and other derivatives can increase Fund losses and reduce opportunities for gains when market prices, interest rates or the derivative instruments themselves behave in a way not anticipated by the Fund. Using derivatives may increase the volatility of the Fund’s net asset value and may not provide the result intended. Derivatives may have a leveraging effect on the Fund. Some derivatives have the potential for unlimited loss, regardless of the size of the Fund’s initial investment. Changes in a derivative’s value may not correlate well with the referenced asset or metric. The Fund also may have to sell assets at inopportune times to satisfy its obligations. Derivatives may be difficult to sell, unwind or value, and the counterparty may default on its obligations to the Fund. |
Options. A Fund purchases and writes call and put options to increase or decrease its exposure to underlying instruments (including credit risk, equity risk, foreign currency exchange rate risk and/or interest rate risk) and/or, in the case of options written, to generate gains from options premiums.
A call option gives the purchaser (holder) of the option the right (but not the obligation) to buy, and obligates the seller (writer) to sell (when the option is exercised) the underlying instrument at the exercise or strike price at any time
CRM Funds | ||
95 |
CRM FUNDS NOTES TO FINANCIAL STATEMENTS — December 31, 2022 (Unaudited) (Continued) |
or at a specified time during the option period. A put option gives the holder the right to sell and obligates the writer to buy the underlying instrument at the exercise or strike price at any time or at a specified time during the option period.
Premiums paid on options purchased and premiums received on options written, as well as the daily fluctuation in market value, are included in the Statements of Assets and Liabilities. When an instrument is purchased or sold through the exercise of an option, the premium is offset against the cost or proceeds of the underlying instrument. When an option expires, a realized gain or loss is recorded in the Statements of Operations to the extent of the premiums received or paid. When an option is closed or sold, a gain or loss is recorded in the Statements of Operations to the extent the cost of the closing transaction exceeds the premiums received or paid). When the Fund writes an option, such option is covered by cash in an amount sufficient to cover the obligation. In purchasing and writing options, the Fund bears the risk of an unfavorable change in the value of the underlying instrument or the risk that the Fund may not be able to enter into a closing transaction due to an illiquid market. Exercise of a written option could result in the Fund purchasing or selling a security when it otherwise would not, or at a price different from the current market value.
As of December 31, 2022, the Funds did not hold any option contracts.
Forward Foreign Currency Exchange Contracts. A Fund enters into forward foreign currency exchange contracts to gain or reduce exposure, to foreign currencies (foreign currency exchange rate risk). A forward foreign currency exchange contract is an agreement between two parties to buy and sell a currency at a set exchange rate on a specified date. These contracts help to manage the overall exposure to the currencies in which some of the investments held by the Fund are denominated and, in some cases, may be used to obtain exposure to a particular market.
The contract is marked to market daily and the change in market value is recorded as unrealized appreciation (depreciation) in the Statements of Assets and Liabilities. When a contract is closed, a realized gain or loss is recorded in the Statements of Operations equal to the difference between the value at the time it was opened and the value at the time it was closed. Non-deliverable
CRM Funds | ||
96 |
CRM FUNDS NOTES TO FINANCIAL STATEMENTS — December 31, 2022 (Unaudited) (Continued) |
forward foreign currency exchange contracts are settled with the counterparty in cash without the delivery of foreign currency. The use of forward foreign currency exchange contracts involves the risk that the value of a forward foreign currency exchange contract changes unfavorably due to movements in the value of the referenced foreign currencies.
As of December 31, 2022, the Funds did not hold any forward foreign currency exchange contracts.
Swaps. A Fund enters into swap contracts to manage exposure to issuers, markets and securities. Such contracts are agreements between the Fund and a counterparty to make periodic net payments on a specified notional amount or a net payment upon termination. Swap agreements are privately negotiated in the OTC market and may be entered into as a bilateral contract (“OTC swaps”) or centrally cleared (“centrally cleared swaps”). For OTC swaps, any upfront premiums paid are recorded as assets and any upfront fees received are recorded as liabilities and are shown as swap premiums paid and swap premiums received, respectively, in the Statements of Assets and Liabilities and amortized over the term of the OTC swap. Payments received or made by the Fund for OTC swaps are recorded in the Statements of Operations as realized gains or losses, respectively. When an OTC swap is terminated, the Fund will record a realized gain or loss equal to the difference between the proceeds from (or cost of) the closing transaction and the Fund’s basis in the contract, if any. Generally, the basis of the contract is the premium received or paid.
In a centrally cleared swap, immediately following execution of the swap agreement, the swap agreement is novated to a central counterparty (the “CCP”) and the Fund’s counterparty on the swap agreement becomes the CCP. The Fund is required to interface with the CCP through a broker. Upon entering into a centrally cleared swap, the Fund is required to deposit initial margin with the broker in the form of cash or securities in an amount that varies depending on the size and risk profile of the particular swap. The daily change in valuation of centrally cleared swaps is recorded as a receivable or payable for variation margin in the Statements of Assets and Liabilities. Payments received from (paid to) the counterparty, including at termination, are recorded as realized gain (loss) in the Statements of Operations.
CRM Funds | ||
97 |
CRM FUNDS NOTES TO FINANCIAL STATEMENTS — December 31, 2022 (Unaudited) (Continued) |
Swap transactions involve, to varying degrees, elements of interest rate, credit and market risk. Such risks involve the possibility that there will be no liquid market for these agreements, that the counterparty to the agreements may default on its obligation to perform or disagree as to the meaning of the contractual terms in the agreements, and that there may be unfavorable changes in interest rates and/or market values associated with these transactions.
Collateral Requirements. For derivatives traded under an International Swaps and Derivatives Association, Inc. Master Agreement (“ISDA MA”), the collateral requirements are typically calculated by netting the mark-to-market amount for each transaction under such agreement and comparing that amount to the value of any collateral currently pledged by the Fund and the counterparty.
Generally, the amount of collateral due from or to a counterparty is subject to a certain minimum transfer amount threshold before a transfer is required, which is determined at the close of business of the Fund. Any additional required collateral is delivered to/pledged by the Fund on the next business day. Typically, the counterparty is not permitted to sell, re-pledge or use cash and non-cash collateral it receives. The Fund generally agrees not to use non-cash collateral that it receives but may, absent default or certain other circumstances defined in the underlying ISDA MA, be permitted to use cash collateral received. In such cases, interest may be paid pursuant to the collateral arrangement with the counterparty. To the extent amounts due to the Fund from its counterparties are not fully collateralized, they bear the risk of loss from counterparty non-performance. Likewise, to the extent the Fund has delivered collateral to a counterparty and stands ready to perform under the terms of its agreement with such counterparty, they bear the risk of loss from a counterparty in the amount of the value of the collateral in the event the counterparty fails to return such collateral. Based on the terms of agreements, collateral may not be required for all derivative contracts.
CRM Funds | ||
98 |
CRM FUNDS NOTES TO FINANCIAL STATEMENTS — December 31, 2022 (Unaudited) (Continued) |
The following is a summary of the location of derivatives on Long/Short Opportunities Fund’s Statement of Assets and Liabilities as of December 31, 2022:
Location on the Statement of Assets and Liabilities | ||
Derivative Type | Asset Derivatives | Liability Derivatives |
Equity Contracts | Unrealized appreciation on swap agreements | Unrealized depreciation on swap agreements |
Asset Derivative Value | ||
Total | Equity | |
Swap Agreements | $9,305 | $9,305 |
Liability Derivative Value | ||
Total | Equity | |
Swap Agreements | $139,657 | $139,657 |
The following is a summary of the location of derivatives on Long/Short Opportunities Fund’s Statement of Operations for the six months ended December 31, 2022:
Location on the Statements of Operations | ||
Derivative Type | Net Realized Gain (Loss) | Net Change in Unrealized |
Equity Contracts | Net realized gain (loss) from: Swap Agreements, Purchased Option Contracts, and Written Option Contracts | Net change in unrealized appreciation (depreciation) on: Swap agreements |
Net Realized Gain (Loss) | ||
Total | Equity | |
Swap Agreements | $ (1,819,624) | $ (1,819,624) |
Purchased Option Contracts | 806,938 | 806,938 |
Written Option Contracts | 61,269 | 61,269 |
CRM Funds | ||
99 |
CRM FUNDS NOTES TO FINANCIAL STATEMENTS — December 31, 2022 (Unaudited) (Continued) |
Net Change in Unrealized Appreciation (Depreciation) | ||
Total | Equity | |
Swap Agreements | $ 826,440 | $ 826,440 |
The table below summarizes the average balance of derivative holdings by Long/Short Opportunities Fund during the six months ended December 31, 2022. The average balance of derivatives held is indicative of the trading volume of the Long/Short Opportunities Fund.
Derivative Volume |
Swap |
$829,659 |
In order to define its contractual rights and to secure rights that will help it mitigate its counterparty risk, a Fund may enter into an ISDA MA or similar agreement with its counterparties. An ISDA MA is a bilateral agreement between the Fund and a counterparty that governs certain OTC derivatives and typically contains, among other things, collateral posting terms and netting provisions in the event of a default and/or termination event. Under an ISDA MA, the Fund may, under certain circumstances, offset with the counterparty certain derivative financial instruments’ payables and/or receivables with collateral held and/or posted and create one single net payment. The provisions of the ISDA MA typically permit a single net payment in the event of default including the bankruptcy or insolvency of the counterparty. Bankruptcy or insolvency laws of a particular jurisdiction may restrict or prohibit the right of offset in bankruptcy, insolvency or other events. For example, notwithstanding what contractual rights may be included in an ISDA MA, such laws may prohibit the Fund from setting off amounts owed to a defaulting counterparty under an ISDA MA against amounts owed to the Fund by affiliates of the defaulting counterparty. The insolvency regimes of many jurisdictions do, however, generally permit set-off of simultaneous payables and receivables under certain types of financial contracts between the same legal entity upon a default of the entity, regardless of the existence of a contractual set-off right in those contracts. In addition, certain ISDA MA allow counterparties to OTC derivatives to terminate derivative contracts prior to maturity in the event the
CRM Funds | ||
100 |
CRM FUNDS NOTES TO FINANCIAL STATEMENTS — December 31, 2022 (Unaudited) (Continued) |
Fund’s net assets decline by a stated percentage or the Fund fails to meet the terms of its ISDA MA, which would cause the Fund to accelerate payment of any net liability owed to the counterparty.
Offsetting of Financial and Derivative Assets and Liabilities. For financial reporting purposes, the Funds do not offset derivative assets and derivative liabilities that are subject to netting arrangements in the Statements of Assets and Liabilities.
The following table presents derivative assets and liabilities net of amounts available for offset under an ISDA MA or similar agreement and, as applicable, the related collateral and potential loss exposure to Long/Short Opportunities Fund as of December 31, 2022:
Assets | Liabilities | |||||||
Derivative Financial Instruments: | ||||||||
Swap Agreements | $ | 9,305 | $ | 139,657 | ||||
Total derivative assets and liabilities in the Statements of Assets and Liabilities | 9,305 | 139,657 | ||||||
Derivatives not subject to an ISDA MA or similar agreement | — | — | ||||||
Total assets and liabilities subject to an ISDA MA | $ | 9,305 | $ | 139,657 | ||||
At December 31, 2022, derivative assets and liabilities by counterparty net of amounts available for offset under an ISDA MA and net of the related collateral received by the Long/Short Opportunities Fund are as follows:
Counterparty | Derivative | Derivative | Value of | Collateral | Net |
Morgan Stanley | $9,305 | $(139,657) | $(130,352) | $(130,352) | $— |
1 | Net exposure represents the receivable (payable) that would be due to (from) the counterparty in an event of default. |
9. | Risks. In the normal course of business, the Funds invest in securities and enter into transactions where risks exist due to fluctuations in the market (market risk) or failure of the issuer to meet all its obligations, including the ability to pay principal and interest when due (issuer credit risk). The value of securities |
CRM Funds | ||
101 |
CRM FUNDS NOTES TO FINANCIAL STATEMENTS — December 31, 2022 (Unaudited) (Continued) |
held by a Fund may decline in response to certain events, including those directly involving the issuers of securities owned by the Fund. Changes arising from the general economy, the overall market and local, regional or global political or/and social instability, as well as currency, interest rate and price fluctuations, may also affect the securities’ value.
In addition to the risks discussed above, Long/Short Opportunities Fund may also be exposed to counterparty credit risk, or the risk that an entity may fail to or be unable to perform on its commitments related to unsettled or open transactions. The Fund manages counterparty credit risk by entering into transactions only with counterparties that CRM believes have the financial resources to honor its obligations and by monitoring the financial stability of those counterparties. Financial assets, which potentially expose a Fund to market, issuer and counterparty credit risks, consist principally of financial instruments and receivables due from counterparties. The extent of a Fund’s exposure to market, issuer and counterparty credit risks with respect to these financial assets is approximately its value recorded in the Statements of Assets and Liabilities, less any collateral held by the Fund.
A derivative contract may suffer mark-to-market loss if the value of the contract decreases due to an unfavorable change in the market rates or values of the underlying instrument. Losses can also occur if the counterparty does not perform under the contract.
A Fund’s risk of loss from counterparty credit risk on OTC derivatives is generally limited to the aggregate unrealized gain less the value of any collateral held by the Fund.
For OTC options purchased, a Fund bears the risk of loss in the amount of the premiums paid plus the positive change in market values net of any collateral held by the Fund should the counterparty fail to perform under the contracts. Options written by a Fund do not typically give rise to counterparty credit risk, as options written generally obligate the Fund, and not the counterparty, to perform. A Fund may be exposed to counterparty credit risk with respect to options written to the extent the Fund deposits collateral with its counterparty to a written option. With exchange-traded options purchased and centrally cleared swaps, there is less counterparty credit risk to a Fund since the exchange or clearinghouse, as counterparty to such instruments, guarantees against
CRM Funds | ||
102 |
CRM FUNDS NOTES TO FINANCIAL STATEMENTS — December 31, 2022 (Unaudited) (Continued) |
possible default. The clearinghouse stands between the buyer and the seller of the contract; therefore, credit risk is limited to failure of the clearinghouse. While offset rights may exist under applicable law, the Fund does not have a contractual right of offset against a clearing broker or clearinghouse in event of a default (including the bankruptcy or insolvency). Additionally, credit risk exists in centrally cleared swaps with respect to initial and variation margin that is held in a clearing broker’s customer accounts. While clearing brokers are required to segregate customer margin from their own assets, in the event that a clearing broker becomes insolvent or goes into bankruptcy and at that time there is a shortfall in the aggregate amount of margin held by the clearing broker for all its clients, typically the shortfall would be allocated on a pro rata basis across all the clearing broker’s customers, potentially resulting in losses to the Fund.
An outbreak of respiratory disease caused by a coronavirus (“COVID-19”) has resulted in a global pandemic and major disruption to economies and markets around the world, including the United States. The ongoing impact of COVID-19 and its subsequent variants have been rapidly evolving, and have resulted in a general decline in global economic activity, as well as a negative effect on the investment performance of individual countries, asset classes, industries and sectors in significant and unforeseen ways. While in the process of gradually reversing, these circumstances may continue for an extended period of time, and may continue to affect adversely the value and liquidity of investments. The ultimate economic fallout from the pandemic, and the long-term impact on economies, markets, industries and individual issuers, are not known. Governments and central banks, including the U.S. Federal Reserve, have taken extraordinary and unprecedented actions to support local and global economies and the financial markets. Until recently, these actions resulted in very low interest rates and a rapid and significant expansion of public debt, including in the U.S. The impact of these measures, and whether they will be effective to mitigate the economic and market disruption caused by COVID-19, may not be known for some time. Lately, rising inflation and interest rates have resulted from these mitigation measures and actions, and may rise further. The ultimate consequences of high public debt, including its future impact on the economy and securities markets, likewise may not be known for some time. In addition, following Russia’s recent invasion of Ukraine, Russian stocks lost all, or nearly all, of their market value. Other securities or markets could be similarly affected by past or future geopolitical or other events or conditions.
CRM Funds | ||
103 |
CRM FUNDS NOTES TO FINANCIAL STATEMENTS — December 31, 2022 (Unaudited) (Concluded) |
10. | Contractual Obligations. The Funds enter into contracts in the normal course of business that contain a variety of indemnification obligations. The Funds’ maximum exposure under these arrangements is unknown. |
However, the Funds have not had prior claims or losses pursuant to these contracts. Management has reviewed the Funds’ existing contracts and expects the risk of liability for indemnity claims to be remote.
11. | Subsequent Events. Management has evaluated the impact of all subsequent events on the Funds and has determined that no subsequent event currently requires recognition or disclosure in the financial statements. |
CRM Funds | ||
104 |
CRM FUNDS OTHER INFORMATION (Unaudited) |
Quarterly Portfolio Schedule
The Trust files a complete schedule of portfolio holdings for each Fund with the SEC for the first and third quarters of each fiscal year as an exhibit to its reports on Form N-PORT. Form N-PORT is available on the SEC’s website at http://www.sec.gov.
Voting Proxies on Fund Portfolio Securities
A description of the policies and procedures that the Trust used to determine how to vote proxies relating to securities held in the Trust’s portfolios is available, without charge and upon request, by calling 800-CRM-2883 and on the SEC’s website at http://www.sec.gov. Information regarding how the Trust voted proxies relating to portfolio securities during the most recent twelve month period ended June 30 is available without charge and upon request by calling 800-CRM-2883, and on the SEC’s website listed above.
Statement of Additional Information
The Statement of Additional Information (“SAI”) for the Funds includes additional information about the Trustees and is available upon request, without charge, by calling 800-CRM-2883 or by visiting the Funds’ website at http://www.crmfunds.com.
Privacy Notice
(THIS PRIVACY NOTICE IS BEING DELIVERED WITH THE FUNDS’ SHAREHOLDER REPORT BUT IS NOT DEEMED TO BE A PART OF THE FUNDS’ SHAREHOLDER REPORT)
Set forth below is the policy of CRM Mutual Fund Trust (the “Trust”) concerning the collection and disclosure of non-public personal information regarding investors and prospective investors in the CRM Funds (the “Fund”) who are individuals investing for personal, family, or household purposes. The words “we” and “us” refers to the Trust and the Fund. The words “you” and “your” refers to investors and prospective investors in the Fund who are covered by this policy.
We use administrators, investment managers, custodians, transfer agents, securities brokers, and other third party businesses to conduct many aspects of our business, including processing initial investments, additional investments, redemptions, share transfers, and other transactions that you request. We refer to these third parties below as our “Service Agents.”
CRM Funds | ||
105 |
CRM FUNDS OTHER INFORMATION (Unaudited) (Concluded) |
As we work together to achieve your investment goals, we will often share with our Service Agents personal and financial information, including, for example, your name, address and telephone number, your e-mail address, your purchases and redemptions of shares of the Funds, your banking arrangements, information on your family members, and your social security number. Our Service Agents may also receive these types of information from other firms that assist us in conducting our business. This information is collected in order to properly handle your account.
To protect the security of your personal and financial information, our Service Agents maintain physical, electronic, and procedural safeguards that meet the standards of applicable laws and regulations.
We may, and we may authorize our Service Agents to, use your personal and financial information and share it with us, other Service Agents, and affiliates of Service Agents in order to provide you with investment services, improve our services, make our procedures more efficient, implement security measures, and fight fraud.
We will not sell your personal and financial information to any outside party. We obtain from our Service Agents confidentiality agreements that prohibit them from selling or improperly using your personal or financial information.
On occasion, we and our Service Agents may be required to provide information about you and your transactions to governmental agencies, self-regulatory organizations, industry associations and similar bodies in order to fulfill legal and regulatory requirements. In addition, federal, state, and foreign laws give people involved in lawsuits and other legal proceedings the right under certain circumstances to obtain information from us and our Service Agents, including your personal and financial information. We and our Service Agents may make other disclosures to non-affiliated third parties as permitted by law.
CRM Funds | ||
106 |

TRUSTEES
F. Gregory Ahern
Ronald H. McGlynn
Rodney P. Wood
INVESTMENT ADVISER
Cramer Rosenthal McGlynn, LLC
28 Havemeyer Place, 1st floor
Greenwich, CT 06830
DISTRIBUTOR
ALPS Distributors, Inc.
1290 Broadway, Suite 1000
Denver, CO 80203
ADMINISTRATOR & TRANSFER AGENT
Ultimus Fund Solutions, LLC
225 Pictoria Drive, Suite 450
Cincinnati, OH 45246
CUSTODIAN
The Bank of New York Mellon
2 Hanson Place, 7th Floor
Brooklyn, NY 11217
LEGAL COUNSEL
Morgan, Lewis & Bockius LLP
One Federal Street
Boston, MA 02110
Investor Information:
800-CRM-2883
www.crmfunds.com
This report is authorized for distribution only to shareholders and to others who have received current prospectuses of the CRM Funds.
CRM-SAR-22
Item 2. Code of Ethics.
Not Applicable.
Item 3. Audit Committee Financial Expert.
Not Applicable.
Item 4. Principal Accountant Fees and Services.
Not Applicable.
Item 5. Audit Committee of Listed Registrants.
Not applicable.
Item 6. Investments.
| (a) | Schedule of Investments in securities of unaffiliated issuers as of the close of the reporting period is included as part of the report to shareholders filed under Item 1 of this Form. |
| (b) | Not applicable. |
Item 7. Disclosure of Proxy Voting Policies and Procedures for Closed-End Management Investment Companies.
Not applicable.
Item 8. Portfolio Managers of Closed-End Management Investment Companies.
Not applicable.
Item 9. Purchases of Equity Securities by Closed-End Management Investment Company and Affiliated Purchasers.
Not applicable.
Item 10. Submission of Matters to a Vote of Security Holders.
There have been no material changes to the procedures by which shareholders may recommend nominees to the Registrant’s Board of Trustees, where those changes were implemented after the registrant last provided disclosure in response to the requirements of Item 407(c)(2)(iv) of Regulation S-K (17 CFR 229.407) (as required by Item 22(b)(15) of Schedule 14A (17 CFR 240.14a-101)), or this Item.
Item 11. Controls and Procedures.
| (a) | The Registrant’s Principal Executive and Principal Financial Officers have concluded that the Registrant’s disclosure controls and procedures (as defined in Rule 30a-3(c) under the Investment Company Act of 1940 (17 CFR 270.30a-3(c))) are effective based on their evaluation of these controls and procedures required by Rule 30a-3(b) under the Investment Company Act of 1940 (17 CFR 270.30a-3(b)) and Rules 13a-15(b) or 15d-15(b) under the Securities Exchange Act of 1934, as amended (17 CFR 240.13a-15(b) or 240.15d-15(b)). |
| (b) | There were no changes in the Registrant’s internal control over financial reporting (as defined in Rule 30a-3(d) under the Investment Company Act of 1940 (17 CFR 270.30a-3(d))) that occurred during the period covered by this report that has materially affected, or is reasonably likely to materially affect, the Registrant’s internal control over financial reporting. |
Item 12. Disclosure of Securities Lending Activities for Closed-End Management Investment Companies.
Not applicable.
Item 13. Exhibits.
| (a)(1) | Not applicable. |
SIGNATURES
Pursuant to the requirements of the Securities Exchange Act of 1934 and the Investment Company Act of 1940, the registrant has duly caused this report to be signed on its behalf by the undersigned, thereunto duly authorized.
| (Registrant) | CRM Mutual Fund Trust | ||
| By (Signature and Title)* | /s/ Ronald H. McGlynn | ||
| Ronald H. McGlynn, President and Chief Executive Officer | |||
| (Principal Executive Officer) | |||
| Date: | 3/2/2023 |
Pursuant to the requirements of the Securities Exchange Act of 1934 and the Investment Company Act of 1940, this report has been signed below by the following persons on behalf of the registrant and in the capacities and on the dates indicated.
| By (Signature and Title)* | /s/ Ronald H. McGlynn | ||
| Ronald H. McGlynn, President and Chief Executive Officer | |||
| (Principal Executive Officer) | |||
| Date: | 3/2/2023 |
| By (Signature and Title)* | /s/ Laura Szalyga | ||
| Laura Szalyga, Treasurer | |||
| (Principal Financial Officer) | |||
| Date: | 3/2/2023 |
* | Print the name and title of each signing officer under his or her signature. |