UNITED STATES
SECURITIES AND EXCHANGE COMMISSION
Washington, D.C. 20549
FORM N-CSR
CERTIFIED SHAREHOLDER REPORT OF REGISTERED MANAGEMENT
INVESTMENT COMPANIES
Investment Company Act file number 811-21749
CRM Mutual Fund Trust
(Exact name of registrant as specified in charter)
c/o Cramer Rosenthal McGlynn, LLC.
300 First Stamford Place, Suite 440
Stamford, CT 06902
(Address of principal executive offices) (Zip code)
Corporation Service Company
2711 Centerville Road Suite 400
Wilmington, DE 19808
(Name and address of agent for service)
Copy to:
Lea Anne Copenhefer
Morgan, Lewis & Bockius LLP
One Federal Street
Boston, MA 02110
Registrant’s telephone number, including area code: 212-326-5300
Date of fiscal year end: June 30
Date of reporting period: June 30, 2023
Item 1. Reports to Stockholders.
The Report to Shareholders is attached herewith.
June 30, 2023
CRM Small Cap Value Fund
CRM Small/Mid Cap Value Fund
CRM Mid Cap Value Fund
CRM All Cap Value Fund
CRM Long/Short Opportunities Fund |
ANNUAL REPORT
[THIS PAGE INTENTIONALLY LEFT BLANK]

ANNUAL REPORT | June 30, 2023 |
President’s Message (Unaudited) |
Dear Fellow Shareholders:
2022 was one of the worst calendar years for the market over the last few decades. The market ended on a weak note, selling-off in December after staging a rally earlier in the period. Last year was a normalization period for the market as fiscal and monetary accommodation was being removed from the system. In the second half of the fiscal year, we seem to have gone through the gamut of permutations: economic data, the yield curve, credit spreads, commodities, volatility measures, and market positioning/sentiment have flashed conflicting signals. In addition, we endured and successfully navigated the political cliff walk of the debt ceiling, which allowed the U.S. government to avoid default and a credit downgrade. Interestingly, many of the “crises” we witnessed this year (bank failures, debt ceiling, recession, etc.) have resolved themselves in a positive way, which has fueled the market rally in the second half of the fiscal year.
We see multiple vectors of demand drivers for domestic small to mid-cap stocks. After enduring tariff wars between the U.S. and China, a global pandemic, and Russia’s war against Ukraine, CEOs are being forced to rethink their global supply chains. Just-in-time manufacturing is being replaced with safety stock and re-shoring or near-shoring efforts. More focus is being placed on certainty of production and delivery than the lowest cost available. We believe this is a long-term positive for domestic oriented businesses. In addition, the U.S. government has also woken up to the fact they need to work in partnership with businesses to ensure the availability of strategically important products. It’s hard to discuss the market performance and the outlook for 2023 without touching on Generative Artificial Intelligence (AI), which has captivated the attention of investors and the media this year. ChatGPT, a natural language processing tool driven by AI technology, has been quickly adopted, particularly by school aged children to the chagrin of their teachers. Nvidia shocked the market when they provided a revenue outlook 50% higher than street expectations due to outsized AI demand for their coveted Graphics Processing Units (GPUs). Is this the dawn of the next mega cycle? We’ll avoid making a prediction. As you can imagine, AI is a difficult investing theme for a true value manager such as CRM. Not to discount the potential impact of AI, but we believe value managers also have a mega cycle occurring right in front of them, with much less fanfare on CNBC. It’s the recently passed Infrastructure Investment and Jobs Act (IIJA), the CHIPS and Science Act, and the Inflation Reduction Act (IRA). We see these $2
1 |
trillion+ bills providing a multi-year growth tail wind for small and mid-cap value stocks, the “picks and shovels1” companies, which tend to be more domestically oriented. These bills should spur capital expenditure spending in the U.S. as efforts are made to re-shore and near shore our critical supply chains.
Despite this attractive tailwind, the market has been overly fixated on large cap growth stocks. As has been widely broadcast, seven stocks (AAPL, MSFT, TSLA, AMZN, NVDA, GOOG, and META) have driven the performance of the S&P 500 index in the 2023 calendar year to date. This has resulted in small and mid-cap stocks trading at a multi-decade discount to large cap and particularly mega cap stocks. We are not the only ones pointing out this market anomaly. For only the second time in the last 25 years, the Nasdaq-100 is undertaking a special rebalance to reduce the weighting of these seven stocks from 56% of the index to 44%. Given the diversification requirements under the Investment Company Act of 1940, which mandates a “diversified” fund cannot hold more than 25% of its portfolio in positions that each account for greater than 5% of its portfolio, it has become challenging to run a diversified large cap growth mutual fund given significant concentration and large weighting of these seven names.
Another attractive vector for small and mid-cap stocks is the likely peak in inflation. Goods deflation has led to the recent declines in overall inflation as supply chains have been normalizing and consumer demand has shifted away from goods. In addition, the front-end indicators for services inflation, the largest component of overall inflation, appear to be peaking. We are seeing asking rents decline year-over-year in multiple cities across the U.S. In addition, the labor market is starting to come off its peak as unemployment claims are rising and average hourly earnings growth is slowing. An environment in which inflation is above 3% but falling has historically been an attractive market for small and mid-cap stocks.
Despite the underperformance of small vs. large and value vs. growth in 2023, we see multiple long-term drivers for small and mid-cap value stocks. This group, which tends to be more domestically oriented, should benefit from the re-shoring and near shoring of supply chains. Recent legislation (the Infrastructure Investment and Jobs Act, the CHIPS and Science Act, and the Inflation Reduction Act) are expected to spur cap-ex spending in the U.S., which could provide a multi-year growth tail wind, which we believe will disproportionately benefit small cap stocks. We believe the market is underappreciating these tailwinds with the group trading at a historic discount to large cap growth stocks. As such, we see small and mid-caps as extremely neglected today. We remain focused on companies that have self-help opportunities, healthy balance sheets, and strong market shares that can weather different inflationary and economic environments. We expect stock selection to be a key differentiator as monetary and fiscal accommodation is reduced. Despite the current crosscurrents, we believe this is an attractive market for nimble and disciplined active managers.
2 |
The following is a discussion of factors that influenced the performance of each of the CRM Funds during the fiscal year ended June 30, 2023.
CRM Small Cap Value Fund returned 12.33% and 12.09% for the Institutional and Investor Share classes, respectively, in the period, as compared to 6.01% and 12.31% for the Russell 2000® Value Index and the Russell 2000® Index, respectively2. Stock selection was the primary driver of outperformance during the period, most notably in the Industrials, Health Care, and Consumer Staples sectors. The portfolio also benefitted from our overweight to the Industrials sector relative to the Russell 2000® Value Index. Leading contributors to performance for the fiscal year included (i) Clean Harbors, Inc.; (ii) SPX Technologies, Inc.; and (iii) ChampionX Corporation. Clean Harbors, Inc. (CLH) provides environmental remediation and industrial waste management services to domestic customers. The company’s quarterly operating performance and forward guidance in its Environmental Services segment outperformed expectations during the fiscal year. Strong demand and pricing for its environmental services drove 30% profit growth year-over-year, with Environmental Services segment margins substantially more favorable than the margins of most of its peers, which were about flat given continued price / cost pressures. At a recent investor day, the company provided long term financial targets highlighting free cash flow per share well above expectations. The company continues to invest in organic and inorganic projects, which could further enhance their earnings profile, yet their shares remain at an attractive valuation given the unique asset base for remediation of hazardous waste that cannot be easily replicated by potential competitors. SPX Technologies, a supplier of commercial HVAC and detection and measurement products, has performed well as the management team has successfully redeployed the capital from its Transformer business exit into accretive acquisitions broadening its HVAC business. The company is well on plan to meet its 2025 targets. Oilfield services provider ChampionX Corporation (CHX) delivered strong quarterly results during the period, and indicated they would surpass their prior 20% EBITDA margin guidance by the 2023 calendar year end. The margin progression continues to unfold as their management team has communicated, and we believe there continues to be room for margin improvement beyond sell-side expectations.
Individual holdings that negatively impacted performance included (i) CVB Financial Corporation; (ii) First Interstate BancSystem, Inc.; and (iii) Kaman Corporation. CVB Financial Corporation, a regional bank, sold off with other regional banks following the failures of Silicon Valley Bank and Signature Bank in March 2023. First Interstate BancSystem, Inc. (FIBK), an upper Midwest and West coast regional bank, reported earnings results that were below expectations due to the same industry issue we witnessed at other banks during the period. The bank group experienced a sharp rise in funding costs as deposits migrated from low-cost non-interest bearings and savings accounts to higher cost time deposits and short-term borrowings following the SVB Bank failure. Kaman Corporation (KAMN),
3 |
a diversified aviation and defense company, reported weaker-than-expected results during the period due to revenue recognition delays in its fuse and structures business that came about from supply chain challenges. In addition, the company completed the acquisition of Parker-Hannifin’s aircraft wheel and brake business, a higher-value Engineered Products business, and funded it with debt. This increased balance sheet leverage, coupled with reduced earnings expectations in Kaman’s other business segments, reduced overall cash flows. Given the company’s reduced financial flexibility, we elected to exit the position during the period.
CRM Small/Mid Cap Value Fund returned 9.28% and 9.07% for the Institutional and Investor Share classes, respectively, in the period, as compared to 10.37% and 13.58% for the Russell 2500 Value Index™ and the Russell 2500 Index™, respectively3. Relative underperformance during the period was mainly attributed to stock selection, most notably in the Financials and Industrials sectors. Stock selection in the Consumer Staples sector was a positive contributor to performance. Individual holdings that were leading contributors to performance included (i) Clean Harbors, Inc.; (ii) Eagle Materials, Inc.; and (iii) ChampionX Corporation. Clean Harbors, Inc. (CLH) provides environmental remediation and industrial waste management services to domestic customers. The company’s quarterly operating performance and forward guidance in its Environmental Services segment outperformed expectations during the fiscal year. Strong demand and pricing for its environmental services drove 30% profit growth year-over-year, with Environmental Services segment margins substantially more favorable than the margins of most of its peers, which were about flat given continued price / cost pressures. At a recent investor day, the company provided long term financial targets highlighting free cash flow per share well above expectations. The company continues to invest in organic and inorganic projects, which could further enhance their earnings profile, yet their shares remain at an attractive valuation given the unique asset base for remediation of hazardous waste that cannot be easily replicated by potential competitors. Eagle Materials, Inc. (EXP), a producer of cement, concrete aggregates, and wallboard to the residential housing and commercial construction markets, experienced improving Cement and Aggregate pricing, which is expected to increase again in the second half of the 2023 calendar year in certain markets. The demand for these products should continue to grow for a multi-year period given domestic infrastructure related spend. Pricing in their Wallboard segment will likely remain resilient even as volumes decline, which has not occurred in prior negative housing cycles. The Wallboard industry remains disciplined on capacity, as existing manufacturing amongst Eagle Materials competitors in the industry will continue to be pressured by elevated raw material costs. The company has continued positive capital allocation decisions with share repurchases and the purchase of a cement terminal in Northern California. Oilfield services provider ChampionX Corporation (CHX) delivered strong quarterly results during the period, and indicated they would surpass their prior 20% EBITDA
4 |
margin guidance by the 2023 calendar year end. The margin progression continues to unfold as their management team has communicated, and we believe there continues to be room for margin improvement beyond sell-side expectations.
Individual holdings that negatively affected performance included (i) Clarivate PLC; (ii) First Interstate BancSystem, Inc.; and (iii) Bio-Rad Laboratories, Inc. Clarivate PLC (CLVT), a data and analytics company focused on life sciences and intellectual property end markets, underperformed during the period because of weaker than anticipated growth in the fourth quarter 2022 due mainly to transactional revenues. First Interstate BancSystem, Inc. (FIBK), an upper Midwest and West coast regional bank, reported earnings results that were below expectations due to the same industry issue we witnessed at other banks during the period. The bank group experienced a sharp rise in funding costs as deposits migrated from low-cost non-interest bearing and savings accounts to higher cost time deposits and short-term borrowings following the SVB Bank failure in March 2023. During the fiscal year, Bio-Rad Laboratories, Inc. (BIO), a life science and diagnostic equipment and consumables manufacturer, reported weaker than anticipated sales and profits and lowered guidance for the year. Customers running down bioprocessing related consumables and slower early-stage biotech R&D spending has similarly impacted the life science tools group over the short term. The company has taken cost actions to accelerate margin and cash flow improvement plans and has stepped up stock buybacks with its net cash position.
CRM Mid Cap Value Fund returned 6.00% and 5.78% for the Institutional and Investor Share classes, respectively, in the fiscal year, as compared to 10.50% and 14.92% for the Russell Midcap® Value Index and the Russell Midcap® Index, respectively4. Relative underperformance during the fiscal year was mainly attributed to stock selection within the Health Care, Industrials, and Financials sectors. Our underweight to the Real Estate sector, versus the Russell Midcap® Value Index, was a tailwind to performance. Individual holdings that contributed positively to performance during the period included (i) Lamb Weston Holdings, Inc.; (ii) ChampionX Corporation; and (iii) Vontier Corporation. Lamb Weston Holdings, Inc. (LW), a frozen potato processor, outperformed during 1Q23 on strong earnings as the company continued to benefit from price increases, abating cost headwinds, and strong quick serve restaurant demand. Oilfield services provider ChampionX Corporation (CHX) delivered strong quarterly results during the period, and indicated they would surpass their prior 20% EBITDA margin guidance by the 2023 calendar year end. The margin progression continues to unfold as their management team has communicated, and we believe there continues to be room for margin improvement beyond sell-side expectations. Two years post its spin-off from Fortive, industrial technology company Vontier Corporation (VNT) is finally showing the benefits of its new strategy as an independent company. The headwinds from its legacy fuel dispensing payment products have abated and the company is
5 |
repositioned for growth with a broader suite of products serving the convenience store/fueling station end market.
Holdings that detracted from Fund performance during the fiscal year included (i) First Republic Bank; (ii) Clarivate PLC; and (iii) Avantor, Inc. First Republic Bank (FRC), a regional bank, sold off materially following the failures of Silicon Valley Bank and Signature Bank in March 2023. The company’s strategy of lending to high-net-worth individuals with low loan to value, high credit quality, first lien residential mortgages has historically rewarded investors during previous economic slowdowns, which was the consensus outlook for this year. However, First Republic’s balance sheet liquidity became more of the focus than its high credit quality following the two bank failures. The company had a high percentage of uninsured deposits as they catered to high-net-worth individuals and business customers. This group of highly desirable depositors turned from an asset to a liability in short order due to their now higher risk of elevated withdrawals. We sold the stock at a substantially higher price than current levels given our concerns about deposit outflow risk. Clarivate PLC (CLVT), a data and analytics company focused on life sciences and intellectual property end markets, underperformed during the period because of weaker than anticipated growth in the fourth quarter 2022 due mainly to transactional revenues. Avantor, Inc. (AVTR) is a global manufacturer and distributor of laboratory equipment, consumables, and services in the pharmaceuticals, government, academic, healthcare, clinical, and industrial end markets. The company was a detractor during the period as they lowered forward outlook on revenue and profit expectations due to softer performance in their two recent acquisitions, lower COVID-19 testing and vaccine contributions, as well as foreign exchange impacts. At an investor conference during the period, the company further revised expectations for its acquisition performance, yet importantly maintained that the core business is achieving its organic growth expectations. The combination of softer current expectations, poor communication on setting appropriate expectations, elevated leverage, as well as macroeconomic concerns have driven Avantor’s valuation to recession levels and a substantial discount to life science peers.
CRM All Cap Value Fund returned 5.18% and 4.94% for the Institutional and Investor Share classes, respectively, during the period, as compared to 11.22% and 18.95% for the Russell 3000® Value Index and the Russell 3000® Index, respectively5. Relative underperformance was attributed to stock selection within the Financials, Industrials, and Health Care sectors. Our overall allocation versus the Russell 3000® Value Index was additive to performance. Leading contributors to Fund performance were (i) ChampionX Corporation; (ii) Lamb Weston Holdings, Inc.; and (iii) Kirby Corporation. Oilfield services provider ChampionX Corporation (CHX) delivered strong quarterly results during the period, and indicated they would surpass their prior 20% EBITDA margin guidance by the 2023 calendar year end. The margin progression continues to unfold as their management
6 |
team has communicated, and we believe there continues to be room for margin improvement beyond sell-side expectations. Lamb Weston Holdings, Inc. (LW), a frozen potato processor, outperformed during the fiscal year on strong earnings as the company continued to benefit from price increases, abating cost headwinds, and strong quick serve restaurant demand. Kirby Corporation, a leading operator of inland marine barges, appreciated as they saw an inflection in utilization and spot and contract pricing as industry supply comes offline from a surge in scheduled maintenance visits and a lack of new builds due to the digestion of oversupply from the last cycle. High steel prices and interest rates make new builds economically unattractive, which should continue to benefit Kirby’s industry leading market position.
Individual holdings that negatively impacted performance included (i) Clarivate PLC; (ii) Truist Financial Corporation; and (iii) Kaman Corporation. Clarivate PLC (CLVT), a data and analytics company focused on life sciences and intellectual property end markets, underperformed during the period because of weaker than anticipated growth in the fourth quarter 2022, due mainly to transactional revenues. Truist Financial Corporation (TRC), a leading regional bank in the Southeast, sold off during the period following the March 2023 bank failures that led to elevated liquidity and profitability concerns for financial stocks. Kaman Corporation (KAMN), a diversified aviation and defense company, reported weaker-than-expected results during the period due to revenue recognition delays in its fuse and structures business that came about from supply chain challenges. In addition, the company completed the acquisition of Parker-Hannifin’s aircraft wheel and brake business, a higher-value Engineered Products business, and funded it with debt. This increased balance sheet leverage, coupled with reduced earnings expectations in Kaman’s other business segments, reduced overall cash flows. Given the company’s reduced financial flexibility, we elected to exit the position during the period.
CRM Long/Short Opportunities Fund returned 10.29% in the fiscal year as compared to 19.59% for the S&P 500® Index6. From a sector perspective, Industrials, Consumer Discretionary, Materials, and Consumer Staples contributed most to performance during the fiscal year. Financials was the only detractor to performance on a sector basis. In terms of exposure during the period, the Fund averaged approximately 89% gross long, 49% gross short, and 40% net long.
The top contributors in the long portfolio were (i) Clean Harbors, Inc.; (ii) Arcosa, Inc.; and (iii) Vontier Corporation. Clean Harbors, Inc. (CLH) provides environmental remediation and industrial waste management services to domestic customers. The company’s quarterly operating performance and forward guidance in its Environmental Services segment outperformed expectations during the fiscal year. Strong demand and pricing for its environmental services drove 30% profit growth year-over-year, with Environmental Services segment margins substantially
7 |
more favorable than the margins of most of its peers, which were about flat given continued price / cost pressures. At a recent investor day, the company provided long term financial targets highlighting free cash flow per share well above expectations. The company continues to invest in organic and inorganic projects, which could further enhance their earnings profile, yet their shares remain at an attractive valuation given the unique asset base for remediation of hazardous waste that cannot be easily replicated by potential competitors. Arcosa, Inc. (ACA), a diversified construction products and industrials company, reported better than expected revenue and margins and reaffirmed guidance towards the higher end of expectations. The company enjoyed strong pricing in its Construction Products segment and significant order interest and product growth in its Wind / Utilities segment based in part on Inflation Reduction Act (IRA) spending for wind projects. Lastly, Arcosa has seen an increasing backlog in its more cyclically depressed Transportation Segment as steel plate pricing is falling. The company continues to have an under-levered balance sheet and is trading at a 20-30% discount to its Sum of the Parts valuation. Two years post its spin-off from Fortive, industrial technology company Vontier Corporation (VNT) is finally showing the benefits of its new strategy as an independent company. The headwinds from its legacy fuel dispensing payment products have abated and the company is repositioned for growth with a broader suite of products serving the convenience store/fueling station end market.
Top individual names that negatively impacted the long portfolio included (i) G-III Apparel Group, Inc.; (ii) Charles Schwab Corporation; and (iii) Avantor, Inc. Shares of G-III Apparel Group, Inc. (GIII), a global apparel, accessory and footwear manufacturer, traded off as investors worried about higher inventories in the channel and potential promotions. We exited our position after the company announced weaker than expected earnings and notably the loss of two key licensed brands over a multi-year period. Given the future decline in earnings and the lack of visibility we sold the position for better risk/reward opportunities. Charles Schwab Corporation (SCHW), a market leading retail broker-dealer and financial services company, sold off following the March 2023 bank failures that led to elevated liquidity and profitability concerns for financial stocks. Avantor, Inc. (AVTR) is a global manufacturer and distributor of laboratory equipment, consumables, and services in the pharmaceuticals, government, academic, healthcare, clinical, and industrial end markets. The company was a detractor during the period as they lowered forward outlook on revenue and profit expectations due to softer performance in their two recent acquisitions, lower COVID-19 testing and vaccine contributions, as well as foreign exchange impacts. At an investor conference during the period, the company further revised expectations for its acquisition performance, yet importantly maintained that the core business is achieving its organic growth expectations. The combination of softer current expectations, poor communication on setting appropriate expectations, elevated leverage, as well as
8 |
macroeconomic concerns have driven Avantor’s valuation to recession levels and a substantial discount to life science peers.
Our top short contributors included (i) a contract manufacturer in the healthcare sector; (ii) a provider of home durable medical equipment; and (iii) a pet insurance company. A contract manufacturer in the healthcare sector missed recent and forward margin expectations during the fiscal year. A provider of home durable medical equipment is seeing lower growth with a much higher labor and startup cost. The company is highly levered, and has employed a prior acquisition strategy to increase its revenue growth, which is now slowing given the higher interest rate environment. The company’s capital requirements for growth are accelerating with a weak free cash flow profile. A pet insurance company underperformed due to higher-than-expected claims in the current inflationary environment as well as difficulty in procuring the necessary price increases from regulators to offset this claims inflation. Several key executives also departed the company at a particularly inopportune time.
The top detractors in the short portfolio were (i) a footwear company; (ii) a leading U.S. based advertising agency; and (iii) a distributor of HVAC equipment. During the period, a footwear company posted better than expected earnings in their international business despite increasing price pressure in their domestic business. A U.S. based advertising agency appreciated as demand for their services remained robust even as digital spending initiatives slowed and as companies begin to cut back on marketing outlays due to a more uncertain economic outlook. A distributor of HVAC equipment appreciated as the market sought out safer, defensive names within Industrials that would be less exposed to a recessionary slowdown.
Sincerely,

Ronald H. McGlynn
Trustee and President, CRM Mutual Fund Trust
1“Picks and Shovels” is an investment strategy that refers to investing in businesses that supply the tools, services, or underlying technology needed to produce a final product. It’s an indirect way of investing in an industry without the greater risk of investing directly in the company that produces the finished product.
2Russell 2000® Value Index is the Fund’s benchmark. The Russell 2000® Value Index measures the performance of those companies in the Russell 2000® Index with lower price-to-book ratios and lower forecasted growth values. The Russell 2000® Index is an unmanaged, capitalization weighted index of 2,000 small cap U.S. companies. The returns of the indexes include the reinvestment of dividends but do not account for transaction costs or other expenses which an investor might incur in attempting to obtain such returns. It is not possible to invest directly in an index.
9 |
3Russell 2500™ Value Index is the Fund’s benchmark. The Russell 2500™ Value Index is an unmanaged index that measures the performance of those companies in the Russell 2500™ Index with lower price-to-book ratios and lower forecasted growth values. The Russell 2500™ Index is an unmanaged index that measures the performance of the 2,500 smallest companies in the Russell 3000® Index. The returns of the indexes include the reinvestment of dividends but do not account for transaction costs or other expenses which an investor might incur in attempting to obtain such returns. It is not possible to invest directly in an index.
4Russell Midcap® Value Index is the Fund’s benchmark. The Russell Midcap® Value Index measures the performance of those companies in the Russell Midcap® Index with lower price-to-book ratios and lower forecasted growth values. The Russell Midcap® Index measures the performance of the 800 smallest companies in the Russell 1000® Index, which represents the performance of the 1,000 largest companies in the U.S. equity market. The returns of the indexes include the reinvestment of dividends but do not account for transaction costs or other expenses which an investor might incur in attempting to obtain such returns. It is not possible to invest directly in an index.
5Russell 3000® Value Index is the Fund’s benchmark. The Russell 3000® Value Index measures the performance of those companies in the Russell 3000® Index with lower price-to-book ratios and lower forecasted growth values. The Russell 3000® Index is an unmanaged, capitalization weighted index of the 3,000 largest U.S. companies, which represent approximately 98% of the investable U.S. equity market. The returns of the indexes include the reinvestment of dividends but do not account for transaction costs or other expenses which an investor might incur in attempting to obtain such returns. It is not possible to invest directly in an index.
6The S&P 500® Index is the Fund’s benchmark. The S&P 500® Index is an index of 500 companies chosen for market size, liquidity and industry grouping, among other factors. The S&P 500® is designed to be a leading indicator of U.S. equities and is meant to reflect the risk/return characteristics of the large cap universe. The returns of the index include the reinvestment of dividends but do not account for transaction costs or other expenses which an investor might incur in attempting to obtain such returns. It is not possible to invest directly in an index.
Performance quoted represents past performance and does not guarantee future results. Investment return and principal value will fluctuate. Shares, when redeemed, may be worth more or less than their original cost. Current performance may be lower or higher than that shown here. Performance data current to the most recent month-end is available by calling (800) CRM-2883. During the period, certain fees and expenses were waived by the Funds’ service providers. Without these waivers, total returns would have been lower. Additional performance figures for the Funds can be found in the Comparison of Change in Value section of this report.
Fund holdings and sector allocations are subject to change at any time and are not recommendations to buy or sell any security. Please refer to the Schedules of Investments for a complete list of Fund holdings. The information contained herein is not a complete analysis of every aspect of any market, industry, security, or Fund. Opinions expressed herein are as of June 30, 2023 and are subject to change at any time, are not guaranteed, and should not be considered investment advice.
Investments in small and mid capitalization companies generally are more volatile due to limited product lines, fewer capital resources and less depth of management than larger companies. Value-based investments are subject to the risk that the broad market may not recognize their intrinsic values or that the investment has not been undervalued by the market. Investments in foreign securities, including emerging markets, involve special risks such as greater social, economic, regulatory, and political uncertainties, and currency fluctuation.
The Long/Short Opportunities Fund will hold long equity securities that the Fund’s adviser has identified as undervalued and take short positions (through short sales) in equity securities that the Fund’s adviser has identified as overvalued or poised for underperformance. Short sales involve significant risks, including the risk that the Fund may have to cover its short position at a higher price than the short sale price, resulting in a loss. Short sales involve borrowing securities and then selling them, which may cause the value of the Fund’s shares to be more volatile than if the Fund did not borrow.
10 |
The information concerning the Funds included in the shareholder report contains certain forward-looking statements about the factors that may affect the performance of the Funds in the future. These statements are based on Fund management’s predictions and expectations concerning certain future events and their expected impact on the Funds, such as performance of the economy as a whole and of specific industry sectors, the impact of developing world events, and other factors that may influence the future performance of the Funds. Management believes these forward-looking statements to be reasonable, although they are inherently uncertain and difficult to predict. Actual events may cause adjustments in portfolio management strategies from those currently expected to be employed.
This report must be preceded or accompanied by the current prospectus for the Funds. Before investing, you should carefully read the prospectus and consider the investment objectives, risks, charges and expenses of the Funds. Additional copies of the prospectus may be obtained at www.crmfunds.com or at 800-CRM-2883.
Distributed by ALPS Distributors, Inc.
11 |
CRM FUNDS CRM SMALL CAP VALUE FUND COMPARISON OF CHANGE IN VALUE (Unaudited) June 30, 2023 |
The following information compares the performance of the CRM Small Cap Value Fund (“Fund”) with the performance of the Russell 2000® Index and Russell 2000® Value Index. The Russell 2000® Index is an unmanaged, capitalization-weighted index of 2,000 small capitalization U.S. companies. The Russell 2000® Value Index measures the performance of those Russell 2000® Index companies with lower price-to-book ratios and lower forecasted growth values. Total return for the Fund assumes reinvestment of dividends and distributions. The index returns reflect the reinvestment of dividends, but exclude the effect of any expenses, which have been deducted from the Fund’s return. The performance in the below tables and graphs does not reflect the deduction of taxes the shareholder would pay on Fund distributions or redemption of Fund shares.
Compared to mutual funds that focus on large capitalization companies, shares of the Fund may be more volatile because of the Fund’s focus on smaller capitalization companies. These companies are more likely to have more limited product lines, fewer capital resources and less depth of management than larger companies.
CRM Small Cap Value Fund — Investor Shares vs. Russell 2000® Index and Russell 2000® Value Index1

CRM Funds | ||
12 |
CRM FUNDS CRM SMALL CAP VALUE FUND COMPARISON OF CHANGE IN VALUE (Unaudited) (Continued) June 30, 2023 |
Average Annual Total Returns | |||
1 Year | 5 Years | 10 Years | |
Small Cap Value Fund - Investor Shares | 12.09% | 2.83% | 7.12% |
Russell 2000® Index | 12.31% | 4.21% | 8.26% |
Russell 2000® Value Index | 6.01% | 3.54% | 7.29% |
Expense Ratio (per prospectus dated 10/28/22) — 1.17%
1 | The Fund is professionally managed, while the indices are unmanaged and are not available for investment. |
This line graph for Investor Shares shows values based on an assumed investment of $10,000.
Performance quoted represents past performance and does not guarantee future results. Investment return and principal value will fluctuate. Shares, when redeemed, may be worth more or less than their original cost. Current performance may be lower or higher than that shown here. Performance data current to the most recent month-end is available by calling (800) CRM-2883. The Fund’s expense ratio may fluctuate over time, and vary from the Fund’s expenses for the period covered by this report. Please refer to the financial highlights for a more current expense ratio.
CRM Funds | ||
13 |
CRM FUNDS CRM SMALL CAP VALUE FUND COMPARISON OF CHANGE IN VALUE (Unaudited) (Concluded) June 30, 2023 |
CRM Small Cap Value Fund — Institutional Shares vs. Russell 2000® Index and Russell 2000® Value Index1
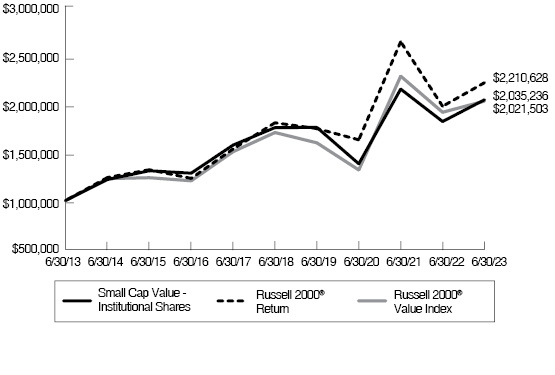
Average Annual Total Returns | |||
1 Year | 5 Years | 10 Years | |
Small Cap Value Fund - Institutional Shares | 12.33% | 3.07% | 7.36% |
Russell 2000® Index | 12.31% | 4.21% | 8.26% |
Russell 2000® Value Index | 6.01% | 3.54% | 7.29% |
Expense Ratio (per prospectus dated 10/28/22) — 0.94%
1 | The Fund is professionally managed, while the indices are unmanaged and are not available for investment. |
The line graph for Institutional Shares shows values based on an assumed investment of $1,000,000.
Performance quoted represents past performance and does not guarantee future results. Investment return and principal value will fluctuate. Shares, when redeemed, may be worth more or less than their original cost. Current performance may be lower or higher than that shown here. Performance data current to the most recent month-end is available by calling (800) CRM-2883. The Fund’s expense ratio may fluctuate over time, and vary from the Fund’s expenses for the period covered by this report. Please refer to the financial highlights for a more current expense ratio.
CRM Funds | ||
14 |
CRM FUNDS CRM SMALL/MID CAP VALUE FUND COMPARISON OF CHANGE IN VALUE (Unaudited) June 30, 2023 |
The following information compares the performance of the CRM Small/Mid Cap Value Fund (“Fund”) with the performance of the Russell 2500™ Index and Russell 2500™ Value Index. The Russell 2500™ Value Index is an unmanaged index that measures the performance of those companies in the Russell 2500™ Index with lower price-to-book ratios and lower forecasted growth values. The Russell 2500™ Index measures the performance of the 2,500 smallest companies in the Russell 3000® Index, which represents the performance of the 3,000 largest U.S. companies. Total return for the Fund assumes reinvestment of dividends and distributions. The index returns reflect the reinvestment of dividends, but exclude the effect of any expenses, which have been deducted from the Fund’s return. The performance in the below tables and graphs does not reflect the deduction of taxes the shareholder would pay on Fund distributions or redemption of Fund shares.
Compared to mutual funds that focus on large capitalization companies, shares of the Fund may be more volatile because of the Fund’s focus on smaller capitalization companies. These companies are more likely to have more limited product lines, fewer capital resources and less depth of management than larger companies.
CRM Small/Mid Cap Value Fund — Investor Shares vs. Russell 2500™ Index and Russell 2500™ Value Index1

CRM Funds | ||
15 |
CRM FUNDS CRM SMALL/MID CAP VALUE FUND COMPARISON OF CHANGE IN VALUE (Unaudited) (Continued) June 30, 2023 |
Average Annual Total Returns | |||
1 Year | 5 Years | 10 Years | |
Small/Mid Cap Value Fund - Investor Shares | 9.07% | 7.61% | 8.89% |
Russell 2500TM Index | 13.58% | 6.55% | 9.38% |
Russell 2500TM Value Index | 10.37% | 5.32% | 8.02% |
Expense Ratio (per prospectus dated 10/28/22) — 1.19%
1 | The Fund is professionally managed, while the indices are unmanaged and are not available for investment. |
The line graph for Investor Shares shows values based on an assumed investment of $10,000.
Performance quoted represents past performance and does not guarantee future results. Investment return and principal value will fluctuate. Shares, when redeemed, may be worth more or less than their original cost. Current performance may be lower or higher than that shown here. Performance data current to the most recent month-end is available by calling (800) CRM-2883. The Fund’s expense ratio may fluctuate over time, and vary from the Fund’s expenses for the period covered by this report. Please refer to the financial highlights for a more current expense ratio.
CRM Funds | ||
16 |
CRM FUNDS CRM SMALL/MID CAP VALUE FUND COMPARISON OF CHANGE IN VALUE (Unaudited) (Concluded) June 30, 2023 |
CRM Small/Mid Cap Value Fund — Institutional Shares vs.
Russell 2500™ Index and Russell 2500™ Value Index1
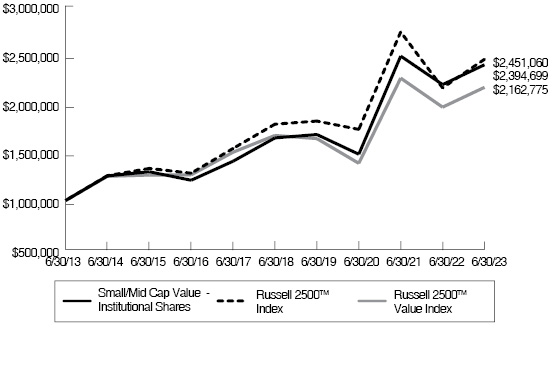
Average Annual Total Returns | |||
1 Year | 5 Years | 10 Years | |
Small/Mid Cap Value - Institutional Shares | 9.28% | 7.82% | 9.13% |
Russell 2500TM Index | 13.58% | 6.55% | 9.38% |
Russell 2500TM Value Index | 10.37% | 5.32% | 8.02% |
Expense Ratio (per prospectus dated 10/28/22) — 1.01%
1 | The Fund is professionally managed, while the indices are unmanaged and are not available for investment. |
The line graph for Institutional Shares shows values based on an assumed investment of $1,000,000.
Performance quoted represents past performance and does not guarantee future results. Investment return and principal value will fluctuate. Shares, when redeemed, may be worth more or less than their original cost. Current performance may be lower or higher than that shown here. Performance data current to the most recent month-end is available by calling (800) CRM-2883. The Fund’s expense ratio may fluctuate over time, and vary from the Fund’s expenses for the period covered by this report. Please refer to the financial highlights for a more current expense ratio.
CRM Funds | ||
17 |
CRM FUNDS CRM MID CAP VALUE FUND COMPARISON OF CHANGE IN VALUE (Unaudited) June 30, 2023 |
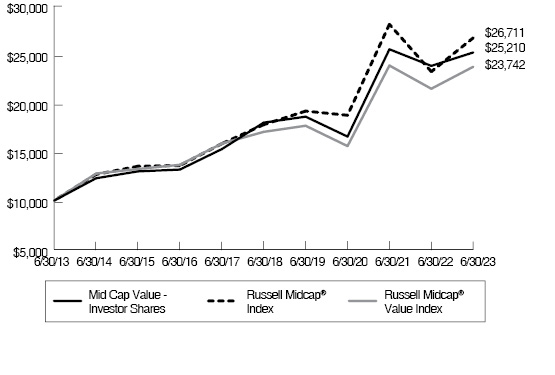
The following information compares the performance of the CRM Mid Cap Value Fund (“Fund”) with the performance of the Russell Midcap® Index and Russell Midcap® Value Index. The Russell Midcap® Index measures the performance of 800 of the smallest companies in the Russell 1000® Index. The Russell 1000® Index measures the performance of the 1,000 largest companies in the Russell 3000® Index, which represents the performance of the 3,000 largest U.S. companies. The Russell Midcap® Value Index measures the performance of those Russell Midcap® Index companies with lower price-to-book ratios and lower forecasted growth values. Total return for the Fund assumes reinvestment of dividends and distributions. The index returns reflect reinvestment of dividends but exclude the effect of any expenses, which have been deducted from the Fund’s return. The performance in the below tables and graphs does not reflect the deduction of taxes the shareholder would pay on Fund distributions or redemption of Fund shares.
Compared to mutual funds that focus on large capitalization companies, shares of the Fund may be more volatile because the Fund invests in mid capitalization companies. These companies are more likely to have more limited product lines, fewer capital resources and less depth of management than larger companies.
CRM Mid Cap Value Fund — Investor Shares vs. Russell Midcap® Index and Russell Midcap® Value Index1
CRM Funds | ||
18 |
CRM FUNDS CRM MID CAP VALUE FUND COMPARISON OF CHANGE IN VALUE (Unaudited) (Continued) June 30, 2023 |
Average Annual Total Returns | |||
1 Year | 5 Years | 10 Years | |
Mid Cap Value Fund - Investor Shares | 5.78% | 6.96% | 9.69% |
Russell Midcap® Index | 14.92% | 8.46% | 10.32% |
Russell Midcap® Value Index | 10.50% | 6.84% | 9.03% |
Expense Ratio (per prospectus dated 10/28/22) — 1.15%
1 | The Fund is professionally managed, while the indices are unmanaged and are not available for investment. |
The line graph for Investor Shares shows values based on an assumed investment of $10,000.
Performance quoted represents past performance and does not guarantee future results. Investment return and principal value will fluctuate. Shares, when redeemed, may be worth more or less than their original cost. Current performance may be lower or higher than that shown here. Performance data current to the most recent month-end is available by calling (800) CRM-2883. The Fund’s expense ratio may fluctuate over time, and vary from the Fund’s expenses for the period covered by this report. Please refer to the financial highlights for a more current expense ratio.
CRM Funds | ||
19 |
CRM FUNDS CRM MID CAP VALUE FUND COMPARISON OF CHANGE IN VALUE (Unaudited) (Concluded) June 30, 2023 |
CRM Mid Cap Value Fund — Institutional Shares vs. Russell Midcap® Index and Russell Midcap® Value Index1

Average Annual Total Returns | |||
1 Year | 5 Years | 10 Years | |
Mid Cap Value - Institutional Shares | 6.00% | 7.17% | 9.90% |
Russell Midcap® Index | 14.92% | 8.46% | 10.32% |
Russell Midcap® Value Index | 10.50% | 6.84% | 9.03% |
Expense Ratio (per prospectus dated 10/28/22) — 0.98%
1 | The Fund is professionally managed, while the indices are unmanaged and are not available for investment. |
This line graph for Institutional Shares shows values based on an assumed investment of $1,000,000.
Performance quoted represents past performance and does not guarantee future results. Investment return and principal value will fluctuate. Shares, when redeemed, may be worth more or less than their original cost. Current performance may be lower or higher than that shown here. Performance data current to the most recent month-end is available by calling (800) CRM-2883. The Fund’s expense ratio may fluctuate over time, and vary from the Fund’s expenses for the period covered by this report. Please refer to the financial highlights for a more current expense ratio.
CRM Funds | ||
20 |
CRM FUNDS CRM ALL CAP VALUE FUND COMPARISON OF CHANGE IN VALUE (Unaudited) June 30, 2023 |
The following information compares the performance of the CRM All Cap Value Fund (“Fund”) with the performance of the Russell 3000® Index and the Russell 3000® Value Index. The Russell 3000® Index measures the performance of the 3,000 largest U.S. companies. The Russell 3000® Value Index measures the performance of those Russell 3000® companies with lower price-to-book ratios and lower forecasted growth values. Total return for the Fund assumes reinvestment of dividends and distributions. The index returns reflect the reinvestment of dividends but exclude the effect of any expenses, which have been deducted from the Fund’s return. The performance in the below tables and graphs does not reflect the deduction of taxes the shareholder would pay on Fund distributions or redemption of Fund shares.
Compared to mutual funds that focus exclusively on large capitalization companies, shares of the Fund may be more volatile because, while the Fund may invest in large capitalization companies, the Fund may also invest in small and mid capitalization companies. These companies are more likely to have more limited product lines, fewer capital resources and less depth of management than larger companies.
CRM All Cap Value Fund — Investor Shares vs. Russell 3000® Index and Russell 3000® Value Index1

CRM Funds | ||
21 |
CRM FUNDS CRM ALL CAP VALUE FUND COMPARISON OF CHANGE IN VALUE (Unaudited) (Continued) June 30, 2023 |
Average Annual Total Returns | |||
1 Year | 5 Years | 10 Years | |
All Cap Value Fund - Investor Shares | 4.94% | 5.38% | 7.96% |
Russell 3000® Index | 18.95% | 11.39% | 12.34% |
Russell 3000® Value Index | 11.22% | 7.79% | 9.09% |
Expense Ratios (per prospectus dated 10/28/22) — 1.34%
1 | The Fund is professionally managed, while the indices are unmanaged and are not available for investment. |
The line graph for Investor Shares shows values based on an assumed investment of $10,000.
Performance quoted represents past performance and does not guarantee future results. Investment return and principal value will fluctuate. Shares, when redeemed, may be worth more or less than their original cost. Current performance may be lower or higher than that shown here. Performance data current to the most recent month-end is available by calling (800) CRM-2883. The Fund’s expense ratio may fluctuate over time, and vary from the Fund’s expenses for the period covered by this report. Please refer to the financial highlights for a more current expense ratio.
CRM Funds | ||
22 |
CRM FUNDS CRM ALL CAP VALUE FUND COMPARISON OF CHANGE IN VALUE (Unaudited) (Concluded) June 30, 2023 |
CRM All Cap Value Fund — Institutional Shares vs. Russell 3000® Index and Russell 3000® Value Index1

Average Annual Total Returns | |||
1 Year | 5 Years | 10 Years | |
All Cap Value Fund - Institutional Shares | 5.18% | 5.64% | 8.23% |
Russell 3000® Index | 18.95% | 11.39% | 12.34% |
Russell 3000® Value Index | 11.22% | 7.79% | 9.09% |
Expense Ratios (per prospectus dated 10/28/22) — 1.10%
1 | The Fund is professionally managed, while the indices are unmanaged and are not available for investment. |
The line graph for Institutional Shares shows values based on an assumed investment of $1,000,000.
Performance quoted represents past performance and does not guarantee future results. Investment return and principal value will fluctuate. Shares, when redeemed, may be worth more or less than their original cost. Current performance may be lower or higher than that shown here. Performance data current to the most recent month-end is available by calling (800) CRM-2883. The Fund’s expense ratio may fluctuate over time, and vary from the Fund’s expenses for the period covered by this report. Please refer to the financial highlights for a more current expense ratio.
CRM Funds | ||
23 |
CRM FUNDS CRM LONG/SHORT OPPORTUNITIES FUND COMPARISON OF CHANGE IN VALUE (Unaudited) June 30, 2023 |
The following information compares the performance of the CRM Long/Short Opportunities Fund (“Fund”) with the performance of the S&P 500® Index. The S&P 500® Index is an index of 500 stocks chosen for market size, liquidity and industry grouping, among other factors. The S&P 500® is designed to be a leading indicator of U.S. equities and is meant to reflect the risk/return characteristics of the large cap universe. Total return for the Fund assumes reinvestment of dividends and distributions. The index returns reflect reinvestment of dividends but exclude the effect of any expenses, which have been deducted from the Fund’s return. The performance in the below table and graph does not reflect the deduction of taxes the shareholder would pay on Fund distributions or redemption of Fund shares.
The Fund will hold long equity securities that the Fund’s adviser has identified as undervalued and take short positions (through short sales) in equity securities that the Fund’s adviser has identified as overvalued or poised for underperformance. Short sales involve significant risks, including the risk that the Fund may have to cover its short position at a higher price than the short sale price, resulting in a loss. Short sales involve borrowing securities and then selling them, which may cause the value of the Fund’s shares to be more volatile than if the Fund did not borrow.
CRM Long/Short Opportunities Fund — Institutional Shares vs.
S&P 500® Index1

CRM Funds | ||
24 |
CRM FUNDS CRM LONG/SHORT OPPORTUNITIES FUND COMPARISON OF CHANGE IN VALUE (Unaudited) (Concluded) June 30, 2023 |
Average Annual Total Returns | |||
1 Year | 5 Years | Since | |
Long/Short Opportunities Fund - Institutional Shares2 | 10.29% | 5.29% | 4.87% |
S&P 500® Index | 19.59% | 12.31% | 12.99% |
Expense Ratios (per prospectus dated 10/28/22) — Gross: 2.82% Net: 2.70%4
1 | The Fund is professionally managed, while the index is unmanaged and is not available for investment. |
2 | Total return would have been lower had certain fees and expenses not been waived and/or reimbursed. |
3 | Return calculated since the Institutional Shares’ inception on August 16, 2016. |
4 | The investment adviser has a contractual obligation to waive a portion of its fees and to assume certain expenses of the Fund to the extent that the total annual fund operating expenses, excluding taxes, extraordinary expenses, brokerage commissions, interest, dividends and interest expense relating to short sales and acquired fund fees and expenses, exceed 1.60% of average daily net assets of the Fund. The expense limitation is in effect until November 1, 2024. |
The line graph for Institutional Shares shows values based on an assumed investment of $1,000,000.
Performance quoted represents past performance and does not guarantee future results. Investment return and principal value will fluctuate. Shares, when redeemed, may be worth more or less than their original cost. Current performance may be lower or higher than that shown here. Performance data current to the most recent month-end is available by calling (800) CRM-2883. The Fund’s expense ratio may fluctuate over time, and vary from the Fund’s expenses for the period covered by this report. Please refer to the financial highlights for a more current expense ratio.
CRM Funds | ||
25 |
CRM FUNDS EXPENSE DISCLOSURE (Unaudited) |
DISCLOSURE OF FUND EXPENSES
The following Expense Tables are shown so that you can understand the impact of fees on your investment. All mutual funds have operating expenses. As a shareholder of a Fund, you incur ongoing costs, including management fees, shareholder servicing fees and other Fund expenses. A Fund’s expenses are expressed as a percentage of its average net assets. This figure is known as the expense ratio. The following examples are intended to help you understand the ongoing costs (in dollars) of investing in a Fund and to compare these costs with the ongoing costs of investing in other mutual funds. The examples are based on an investment of $1,000 made at the beginning of the period shown and held for the entire period (January 1, 2023 through June 30, 2023). The “Annualized Expense Ratio” reflects the actual expenses, net of fee waivers, where applicable, for the six-month period January 1, 2023 to June 30, 2023.
The Expense Tables below illustrate your Fund’s expenses in two ways.
● | Actual fund return. The first line of the table below provides information about actual account values and actual expenses. You may use the information in this line, together with the amount you invested, to estimate the expenses that you paid over the period. Simply divide your account value by $1,000 (for example, an $8,600 account value divided by $1,000 = 8.6), then multiply the result by the number in the first line under the heading entitled “Expenses Paid During Period” to estimate the expenses you paid on your account during the period. |
● | Hypothetical 5% return. The second line of the table below provides information about hypothetical account values and hypothetical expenses based on the Fund’s actual expense ratio and an assumed rate of return of 5% per year before expenses, which is not the Fund’s actual return. The hypothetical account values and expenses may not be used to estimate the actual ending account balance or expenses you paid for the period. You may use this information to compare the ongoing cost of investing in the Fund and other funds. To do so, compare this 5% hypothetical example with the 5% hypothetical examples that appear in the shareholder reports of the other funds. |
Please note that the expenses shown in the tables are meant to highlight your ongoing costs only and do not reflect any transactional costs that may be levied by
CRM Funds | ||
26 |
CRM FUNDS EXPENSE DISCLOSURE (Unaudited) (Continued) |
other funds, such as sales charges (loads), redemption fees, or exchange fees, if any. Therefore, the second line of the table is useful in comparing ongoing costs only, and will not help you determine the relative total cost of owning different funds. In addition, if these transactional costs were included, your costs would have been higher. The “Annualized Expense Ratio” reflects the actual expenses for the period indicated.
For the Six Months Ended June 30, 2023
Expense Table
Fund/Class | Beginning | Ending | Annualized | Expenses | ||||||||||||
CRM Small Cap Value Fund - Investor Shares | ||||||||||||||||
Actual Fund Return | $ | 1,000.00 | $ | 1,019.60 | 1.20 | % | $ | 6.01 | ||||||||
Hypothetical (5% Return Before Expenses) | $ | 1,000.00 | $ | 1,018.84 | 1.20 | % | $ | 6.01 | ||||||||
CRM Small Cap Value Fund - Institutional Shares | ||||||||||||||||
Actual Fund Return | $ | 1,000.00 | $ | 1,020.40 | 0.96 | % | $ | 4.81 | ||||||||
Hypothetical (5% Return Before Expenses) | $ | 1,000.00 | $ | 1,020.03 | 0.96 | % | $ | 4.81 | ||||||||
CRM Small/Mid Cap Value Fund - Investor Shares | ||||||||||||||||
Actual Fund Return | $ | 1,000.00 | $ | 1,037.60 | 1.17 | % | $ | 5.91 | ||||||||
Hypothetical (5% Return Before Expenses) | $ | 1,000.00 | $ | 1,018.99 | 1.17 | % | $ | 5.86 | ||||||||
CRM Small/Mid Cap Value Fund - Institutional Shares | ||||||||||||||||
Actual Fund Return | $ | 1,000.00 | $ | 1,038.90 | 1.00 | % | $ | 5.06 | ||||||||
Hypothetical (5% Return Before Expenses) | $ | 1,000.00 | $ | 1,019.84 | 1.00 | % | $ | 5.01 | ||||||||
CRM Mid Cap Value Fund - Investor Shares | ||||||||||||||||
Actual Fund Return | $ | 1,000.00 | $ | 1,007.00 | 1.15 | % | $ | 5.72 | ||||||||
Hypothetical (5% Return Before Expenses) | $ | 1,000.00 | $ | 1,019.09 | 1.15 | % | $ | 5.76 | ||||||||
CRM Funds | ||
27 |
CRM FUNDS EXPENSE DISCLOSURE (Unaudited) (Concluded) |
Fund/Class | Beginning | Ending | Annualized | Expenses | ||||||||||||
CRM Mid Cap Value Fund - Institutional Shares | ||||||||||||||||
Actual Fund Return | $ | 1,000.00 | $ | 1,007.90 | 0.99 | % | $ | 4.93 | ||||||||
Hypothetical (5% Return Before Expenses) | $ | 1,000.00 | $ | 1,019.89 | 0.99 | % | $ | 4.96 | ||||||||
CRM All Cap Value Fund - Investor Shares | ||||||||||||||||
Actual Fund Return | $ | 1,000.00 | $ | 996.90 | 1.45 | % | $ | 7.18 | ||||||||
Hypothetical (5% Return Before Expenses) | $ | 1,000.00 | $ | 1,017.60 | 1.45 | % | $ | 7.25 | ||||||||
CRM All Cap Value Fund - Institutional Shares | ||||||||||||||||
Actual Fund Return | $ | 1,000.00 | $ | 998.50 | 1.22 | % | $ | 6.05 | ||||||||
Hypothetical (5% Return Before Expenses) | $ | 1,000.00 | $ | 1,018.74 | 1.22 | % | $ | 6.11 | ||||||||
CRM Long/Short Opportunities Fund - Institutional Shares | ||||||||||||||||
Actual Fund Return | $ | 1,000.00 | $ | 1,061.30 | 2.65 | % | $ | 13.54 | ||||||||
Hypothetical (5% Return Before Expenses) | $ | 1,000.00 | $ | 1,011.65 | 2.65 | % | $ | 13.22 | ||||||||
(1) | The expense ratio for CRM Long/Short Opportunities Fund includes the impact of dividend expense and net interest expense (when applicable), on securities sold short. Excluding such expenses, the ratio of expenses to average net assets would have been 1.60%. |
(2) | Expenses are equal to the Fund’s annualized expense ratio multiplied by the average account value over the period, multiplied by 181/ 365 (to reflect the most recent one-half year period). |
CRM Funds | ||
28 |
CRM FUNDS DISCLOSURE OF PORTFOLIO HOLDINGS (Unaudited) |
PORTFOLIO HOLDINGS
June 30, 2023
The following tables present a summary of the portfolio holdings of each of the CRM Funds as a percentage of their total investments, before short-term investments held as collateral for loaned securities.
CRM Small Cap Value Fund- | |
Common Stock | |
Financials | 21.6% |
Industrials | 19.0 |
Energy | 10.0 |
Consumer Staples | 8.6 |
Health Care | 8.5 |
Consumer Discretionary | 6.8 |
Real Estate | 6.6 |
Technology | 5.9 |
Utilities | 5.9 |
Materials | 3.8 |
Short-Term Investments | 3.3 |
100.0% | |
CRM Small/Mid Cap Value Fund- | |
Common Stock | |
Industrials | 16.6% |
Financials | 16.5 |
Technology | 12.5 |
Materials | 11.8 |
Health Care | 10.4 |
Consumer Discretionary | 9.4 |
Energy | 5.7 |
Utilities | 5.6 |
Real Estate | 5.0 |
Consumer Staples | 2.7 |
Short-Term Investments | 3.8 |
100.0% | |
CRM Mid Cap Value Fund- | |
Common Stock | |
Industrials | 17.1% |
Technology | 16.6 |
Materials | 11.8 |
Financials | 10.8 |
Utilities | 9.7 |
Consumer Discretionary | 7.9 |
Health Care | 7.6 |
Energy | 6.7 |
Consumer Staples | 4.2 |
Real Estate | 4.1 |
Short-Term Investments | 3.5 |
100.0% | |
CRM All Cap Value Fund- | |
Common Stock | |
Technology | 17.0% |
Financials | 16.8 |
Health Care | 15.5 |
Industrials | 11.7 |
Materials | 9.7 |
Energy | 9.4 |
Consumer Discretionary | 6.3 |
Consumer Staples | 6.1 |
Utilities | 2.5 |
Real Estate | 1.5 |
Short-Term Investments | 3.5 |
100.0% | |
CRM Funds | ||
29 |
CRM FUNDS DISCLOSURE OF PORTFOLIO HOLDINGS (Unaudited) (Concluded) |
The following tables present a summary of the portfolio holdings of the CRM Long/Short Opportunities Fund as a percentage of its total net assets.
CRM Long/Short Opportunities Fund- | |
Common Stock | |
Industrials | 22.8% |
Technology | 16.3 |
Consumer Discretionary | 11.4 |
Consumer Staples | 6.8 |
Health Care | 6.8 |
Materials | 5.8 |
Utilities | 4.5 |
Financials | 4.3 |
Energy | 3.7 |
Communications | 2.7 |
Short-Term Investments | 14.5 |
Common Stock Sold Short | |
Industrials | (11.5) |
Consumer Discretionary | (9.3) |
Technology | (6.6) |
Financials | (4.7) |
Consumer Staples | (4.2) |
Communications | (2.7) |
Health Care | (2.1) |
Real Estate | (1.6) |
Utilities | (1.1) |
Materials | (1.0) |
Energy | (0.4) |
54.4% | |
Portfolio holdings are subject to change at any time.
CRM Funds | ||
30 |
CRM FUNDS CRM SMALL CAP VALUE FUND SCHEDULE OF INVESTMENTS June 30, 2023 |
Shares | Value | |||||||
COMMON STOCK — 97.7% | ||||||||
Consumer Discretionary — 6.8% | ||||||||
Apparel & Textile Products — 2.0% | ||||||||
| 47,955 | Steven Madden Ltd. | $ | 1,567,649 | |||||
Home Construction — 2.7% | ||||||||
| 32,195 | Skyline Champion Corporation1 | 2,107,163 | ||||||
Leisure Facilities & Services — 2.1% | ||||||||
| 50,808 | BJ’s Restaurants, Inc.1 | 1,615,694 | ||||||
Total Consumer Discretionary | 5,290,506 | |||||||
Consumer Staples — 8.7% | ||||||||
Beverages — 0.9% | ||||||||
| 54,213 | Primo Water Corporation | 679,831 | ||||||
Food — 5.3% | ||||||||
| 96,845 | Hostess Brands, Inc.1 | 2,452,115 | ||||||
| 45,293 | The Simply Good Foods Company1 | 1,657,271 | ||||||
| 4,109,386 | ||||||||
Retail — Consumer Staples - 2.5% | ||||||||
| 33,100 | Ollie’s Bargain Outlet Holdings, Inc.1 | 1,917,483 | ||||||
Total Consumer Staples | 6,706,700 | |||||||
Energy — 10.1% | ||||||||
Oil & Gas Producers — 3.3% | ||||||||
| 49,121 | Matador Resources Company | 2,570,011 | ||||||
Oil & Gas Services & Equipment — 3.9% | ||||||||
| 97,765 | ChampionX Corporation | 3,034,625 | ||||||
Renewable Energy — 2.9% | ||||||||
| 20,704 | EnerSys | 2,246,798 | ||||||
Total Energy | 7,851,434 | |||||||
Financials — 21.9% | ||||||||
Banking — 12.8% | ||||||||
| 84,821 | Cadence Bank | 1,665,884 | ||||||
| 127,665 | Central Pacific Financial Corporation | 2,005,617 | ||||||
Shares | Value | |||||||
Financials — (continued) | ||||||||
Banking — (continued) | ||||||||
| 46,509 | First Interstate Bancsystem, Inc., Class A | $ | 1,108,775 | |||||
| 44,557 | Hancock Whitney Corporation | 1,710,098 | ||||||
| 104,961 | Heritage Commerce Corporation | 869,077 | ||||||
| 143,367 | TFS Financial Corporation | 1,802,123 | ||||||
| 24,782 | TrustCo Bank Corporation | 709,013 | ||||||
| 9,870,587 | ||||||||
Institutional Financial Services — 2.7% | ||||||||
| 45,873 | Moelis & Company, Class A2 | 2,079,882 | ||||||
Insurance — 3.9% | ||||||||
| 66,647 | Horace Mann Educators Corporation | �� | 1,976,750 | |||||
| 58,529 | James River Group Holdings, Ltd. | 1,068,740 | ||||||
| 3,045,490 | ||||||||
Specialty Finance — 2.5% | ||||||||
| 47,525 | Stewart Information Services Corporation | 1,955,179 | ||||||
Total Financials | 16,951,138 | |||||||
Health Care — 8.5% | ||||||||
Biotechnology & Pharmaceuticals — 3.5% | ||||||||
| 111,543 | ABCAM PLC - ADR1,3,4 | 2,729,457 | ||||||
Medical Equipment & Devices — 5.0% | ||||||||
| 70,413 | Envista Holdings Corporation1 | 2,382,777 | ||||||
| 22,466 | LeMaitre Vascular, Inc. | 1,511,512 | ||||||
| 3,894,289 | ||||||||
Total Health Care | 6,623,746 | |||||||
Industrials — 19.2% | ||||||||
Commercial Support Services — 2.4% | ||||||||
| 11,118 | Clean Harbors, Inc.1 | 1,828,133 | ||||||
See accompanying notes to financial statements. | CRM Funds | |
31 | ||
CRM FUNDS CRM SMALL CAP VALUE FUND SCHEDULE OF INVESTMENTS (Continued) June 30, 2023 |
Shares | Value | |||||||
Industrials — (continued) | ||||||||
Electrical Equipment — 4.3% | ||||||||
| 66,493 | Hayward Holdings, Inc.1 | $ | 854,435 | |||||
| 28,773 | SPX Technologies, Inc.1 | 2,444,841 | ||||||
| 3,299,276 | ||||||||
Engineering & Construction — 3.9% | ||||||||
| 39,952 | Arcosa, Inc. | 3,027,163 | ||||||
Industrial Intermediate Products — 1.7% | ||||||||
| 4,650 | Valmont Industries, Inc. | 1,353,383 | ||||||
Industrial Support Services — 1.2% | ||||||||
| 6,394 | Applied Industrial Technologies, Inc. | 926,043 | ||||||
Machinery — 2.7% | ||||||||
| 6,602 | John Bean Technologies Corporation | 800,823 | ||||||
| 80,515 | Mueller Water Products, Inc. | 1,306,758 | ||||||
| 2,107,581 | ||||||||
Transportation & Logistics — 3.0% | ||||||||
| 30,163 | Kirby Corporation1 | 2,321,043 | ||||||
Total Industrials | 14,862,622 | |||||||
Materials — 3.8% | ||||||||
Chemicals — 3.8% | ||||||||
| 122,175 | Ecovyst, Inc.1 | 1,400,126 | ||||||
| 9,665 | Rogers Corporation1 | 1,565,053 | ||||||
Total Materials | 2,965,179 | |||||||
Real Estate — 6.7% | ||||||||
REIT — 6.7% | ||||||||
| 99,409 | Equity Commonwealth1 | 2,014,026 | ||||||
| 19,597 | Terreno Realty Corporation | 1,177,780 | ||||||
| 128,609 | Urban Edge Properties | 1,984,437 | ||||||
Total Real Estate | 5,176,243 | |||||||
Shares | Value | |||||||
Technology — 6.0% | ||||||||
Software — 6.0% | ||||||||
| 31,970 | ACV Auctions, Inc.1 | $ | 552,122 | |||||
| 24,307 | Agilysys, Inc.1 | 1,668,432 | ||||||
| 40,746 | Envestnet, Inc.1 | 2,418,275 | ||||||
Total Technology | 4,638,829 | |||||||
Utilities – 6.0% | ||||||||
Electric Utilities — 2.0% | ||||||||
| 25,576 | Black Hills Corporation | 1,541,210 | ||||||
Gas & Water Utilities – 4.0% | ||||||||
| 35,963 | Northwest Natural Holdings Company | 1,548,207 | ||||||
| 21,630 | SJW Group1 | 1,516,479 | ||||||
| 3,064,686 | ||||||||
Total Utilities | 4,605,896 | |||||||
TOTAL COMMON STOCK (Cost $65,649,497) | 75,672,293 | |||||||
SHORT-TERM INVESTMENTS — 3.4% | ||||||||
| 1,309,096 | Blackrock Liquidity Funds T-Fund, Institutional Shares, 4.98%5 | 1,309,096 | ||||||
| 1,309,096 | Federated Hermes Treasury Obligations Fund, Institutional Shares, 4.95%5 | 1,309,096 | ||||||
TOTAL SHORT-TERM INVESTMENTS (Cost $2,618,192) | 2,618,192 | |||||||
TOTAL INVESTMENTS BEFORE SHORT-TERM INVESTMENTS HELD AS COLLATERAL FOR LOANED SECURITIES – 101.1% (Cost $68,267,689) | 78,290,485 | |||||||
See accompanying notes to financial statements. | CRM Funds | |
32 | ||
CRM FUNDS CRM SMALL CAP VALUE FUND SCHEDULE OF INVESTMENTS (Continued) June 30, 2023 |
Principal ($) | Value | |||||||
SHORT-TERM INVESTMENTS HELD AS COLLATERAL FOR LOANED SECURITIES — 2.8% | ||||||||
REPURCHASE AGREEMENTS — 2.8% | ||||||||
| 168,959 | With BNP Paribas SA: at 5.05%, dated 6/30/23, to be repurchased on 7/3/23, repurchase price $169,030 (collateralized by US Treasury Securities, par values ranging from $0 - $56,273, coupon rates ranging from 0.00% to 3.50%, 7/15/23 - 2/15/51; total market value $172,338) | $ | 168,959 | |||||
| 1,000,000 | With Daiwa Capital Markets America: at 5.06%, dated 6/30/23, to be repurchased on 7/3/23, repurchase price $1,000,422 (collateralized by US Treasury Securities, par values ranging from $398 - $1,023,396, coupon rates ranging from 1.13% to 5.45%, 8/31/23 - 6/30/30; total market value $1,020,000) | 1,000,000 | ||||||
Principal ($) | Value | |||||||
REPURCHASE AGREEMENTS — (continued) | ||||||||
| 1,000,000 | With JP Morgan Securities LLC: at 5.05%, dated 6/30/23, to be repurchased on 7/3/23, repurchase price $1,000,421 (collateralized by US Treasury Securities, par values ranging from $45,715 - $554,026, coupon rates ranging from 0.00% to 2.75%, 7/5/23 - 9/30/26; total market value $1,020,000) | $ | 1,000,000 | |||||
TOTAL SHORT-TERM INVESTMENTS HELD AS COLLATERAL FOR LOANED SECURITIES (Cost $2,168,959) | 2,168,959 | |||||||
TOTAL INVESTMENTS — 103.9% (Cost $70,436,648) | $ | 80,459,444 | 6 | |||||
LIABILITIES IN EXCESS OF OTHER ASSETS — (3.9)% | (3,033,883 | ) | ||||||
NET ASSETS — 100.0% | $ | 77,425,561 | ||||||
See accompanying notes to financial statements. | CRM Funds | |
33 | ||
CRM FUNDS CRM SMALL CAP VALUE FUND SCHEDULE OF INVESTMENTS (Concluded) June 30, 2023 |
A summary of inputs used to value the Fund’s investments as of June 30, 2023 is as follows (see Note 2 in Notes to Financial Statements):
Assets | Level 1 | Level 2 | Level 3 | Investments | ||||||||||||
Common Stock | $ | 75,672,293 | — | — | $ | 75,672,293 | ||||||||||
Short-Term Investments | 2,618,192 | — | — | 2,618,192 | ||||||||||||
Short-Term Investments Held As Collateral For Loaned Securities | — | $ | 2,168,959 | — | 2,168,959 | |||||||||||
Total | $ | 78,290,485 | $ | 2,168,959 | — | $ | 80,459,444 | |||||||||
There were no transfers into or out of Level 3 related to securities held at June 30, 2023.
1 | Non-income producing security. |
2 | Security partially or fully on loan. |
3 | PLC – Public Limited Company |
4 | ADR – American Depositary Receipt |
5 | Rate disclosed is the seven day effective yield as of June 30, 2023. |
6 | At June 30, 2023, the market value of securities on loan for CRM Small Cap Value Fund was $2,079,882. In the event that the collateral received is insufficient to cover the value of the loaned securities and provided such collateral shortfall is not the result of investment losses, the Fund’s securities lending agent, The Bank of New York Mellon, has agreed to pay the amount of the shortfall to the Fund, or at its discretion, replace the loaned securities. |
See accompanying notes to financial statements. | CRM Funds | |
34 | ||
CRM FUNDS CRM SMALL/MID CAP VALUE FUND SCHEDULE OF INVESTMENTS June 30, 2023 |
Shares | Value | |||||||
COMMON STOCK — 96.6% | ||||||||
Consumer Discretionary — 9.5% | ||||||||
Apparel & Textile Products — 1.2% | ||||||||
| 79,517 | Steven Madden Ltd. | $ | 2,599,411 | |||||
Home Construction — 1.5% | ||||||||
| 52,439 | Skyline Champion Corporation1 | 3,432,133 | ||||||
Retail — Discretionary - 3.8% | ||||||||
| 34,835 | Burlington Stores, Inc.1 | 5,482,681 | ||||||
| 8,514 | RH1 | 2,806,129 | ||||||
| 8,288,810 | ||||||||
Wholesale — Discretionary - 3.0% | ||||||||
| 112,287 | LKQ Corporation | 6,542,963 | ||||||
Total Consumer Discretionary | 20,863,317 | |||||||
Consumer Staples — 2.7% | ||||||||
Food — 2.7% | ||||||||
| 51,791 | Lamb Weston Holdings, Inc. | 5,953,375 | ||||||
Energy — 5.8% | ||||||||
Oil & Gas Producers — 2.0% | ||||||||
| 21,337 | Pioneer Natural Resources Company | 4,420,600 | ||||||
Oil & Gas Services & Equipment — 3.8% | ||||||||
| 266,719 | ChampionX Corporation | 8,278,957 | ||||||
Total Energy | 12,699,557 | |||||||
Financials — 16.6% | ||||||||
Asset Management — 1.8% | ||||||||
| 17,710 | LPL Financial Holdings, Inc. | 3,850,685 | ||||||
Banking — 5.7% | ||||||||
| 162,059 | Cadence Bank | 3,182,839 | ||||||
| 130,322 | First Interstate Bancsystem, Inc., Class A | 3,106,876 | ||||||
| 211,547 | TFS Financial Corporation | 2,659,146 | ||||||
| 93,861 | Webster Financial Corporation | 3,543,253 | ||||||
| 12,492,114 | ||||||||
Shares | Value | |||||||
Financials — (continued) | ||||||||
Institutional Financial Services — 1.9% | ||||||||
| 94,029 | Moelis & Company, Class A2 | $ | 4,263,275 | |||||
Insurance — 7.2% | ||||||||
| 47,300 | American Financial Group, Inc. | 5,616,874 | ||||||
| 14,645 | Everest Re Group Ltd. | 5,006,540 | ||||||
| 122,142 | James River Group Holdings, Ltd. | 2,230,313 | ||||||
| 51,537 | W.R. Berkley Corporation | 3,069,544 | ||||||
| 15,923,271 | ||||||||
Total Financials | 36,529,345 | |||||||
Health Care — 10.4% | ||||||||
Biotechnology & Pharmaceuticals — 3.2% | ||||||||
| 291,048 | ABCAM PLC - ADR1,3,4 | 7,121,945 | ||||||
Medical Equipment & Devices — 7.2% | ||||||||
| 13,458 | Bio-Rad Laboratories, Inc., Class A1 | 5,102,197 | ||||||
| 170,532 | Envista Holdings Corporation1 | 5,770,802 | ||||||
| 60,165 | QuidelOrtho Corporation1 | 4,985,272 | ||||||
| 15,858,271 | ||||||||
Total Health Care | 22,980,216 | |||||||
Industrials — 16.6% | ||||||||
Aerospace & Defense — 1.5% | ||||||||
| 8,172 | Teledyne Technologies, Inc.1 | 3,359,591 | ||||||
Commercial Support Services — 3.3% | ||||||||
| 44,389 | Clean Harbors, Inc.1 | 7,298,884 | ||||||
Electrical Equipment — 4.1% | ||||||||
| 282,225 | Vontier Corporation | 9,090,468 | ||||||
Engineering & Construction — 3.0% | ||||||||
| 87,364 | Arcosa, Inc. | 6,619,570 | ||||||
Industrial Intermediate Products — 0.8% | ||||||||
| 157,115 | Janus International Group, Inc.1 | 1,674,846 | ||||||
See accompanying notes to financial statements. | CRM Funds | |
35 | ||
CRM FUNDS CRM SMALL/MID CAP VALUE FUND SCHEDULE OF INVESTMENTS (Continued) June 30, 2023 |
Shares | Value | |||||||
Industrials — (continued) | ||||||||
Machinery — 1.3% | ||||||||
| 17,889 | Regal Rexnord Corporation | $ | 2,753,117 | |||||
Transportation & Logistics — 2.6% | ||||||||
| 75,541 | Kirby Corporation1 | 5,812,880 | ||||||
Total Industrials | 36,609,356 | |||||||
Materials — 11.8% | ||||||||
Chemicals — 5.4% | ||||||||
| 68,349 | Ashland, Inc. | 5,940,212 | ||||||
| 67,567 | RPM International, Inc. | 6,062,787 | ||||||
| 12,002,999 | ||||||||
Construction Materials — 6.4% | ||||||||
| 48,813 | Advanced Drainage Systems, Inc. | 5,553,943 | ||||||
| 45,349 | Eagle Materials, Inc. | 8,453,960 | ||||||
| 14,007,903 | ||||||||
Total Materials | 26,010,902 | |||||||
Real Estate — 5.0% | ||||||||
REIT — 5.0% | ||||||||
| 207,189 | Equity Commonwealth1 | 4,197,649 | ||||||
| 37,600 | Terreno Realty Corporation | 2,259,760 | ||||||
| 298,846 | Urban Edge Properties | 4,611,194 | ||||||
Total Real Estate | 11,068,603 | |||||||
Technology — 12.5% | ||||||||
Software — 7.2% | ||||||||
| 109,132 | Envestnet, Inc.1 | 6,476,985 | ||||||
| 30,070 | PTC, Inc.1 | 4,278,961 | ||||||
| 118,889 | Tenable Holdings, Inc.1 | 5,177,616 | ||||||
| 15,933,562 | ||||||||
Technology Hardware — 2.3% | ||||||||
| 116,458 | Ciena Corporation1 | 4,948,300 | ||||||
Technology Services — 3.0% | ||||||||
| 703,612 | Clarivate PLC1,3 | 6,705,422 | ||||||
Total Technology | 27,587,284 | |||||||
Utilities — 5.7% | ||||||||
Shares | Value | |||||||
Electric Utilities — 3.4% | ||||||||
| 41,129 | Black Hills Corporation | $ | 2,478,434 | |||||
| 85,958 | NextEra Energy Partners LP2,5 | 5,040,576 | ||||||
| 7,519,010 | ||||||||
Gas & Water Utilities — 2.3% | ||||||||
| 180,062 | Nisource, Inc. | 4,924,696 | ||||||
Total Utilities | 12,443,706 | |||||||
TOTAL COMMON STOCK (Cost $177,507,082) | 212,745,661 | |||||||
SHORT-TERM INVESTMENTS — 3.8% | ||||||||
| 4,196,749 | Blackrock Liquidity Funds T-Fund, Institutional Shares, 4.98%6 | 4,196,749 | ||||||
| 4,196,749 | Federated Hermes Treasury Obligations Fund, Institutional Shares, 4.95%6 | 4,196,749 | ||||||
TOTAL SHORT-TERM INVESTMENTS (Cost $8,393,498) | 8,393,498 | |||||||
TOTAL INVESTMENTS BEFORE SHORT-TERM INVESTMENTS HELD AS COLLATERAL FOR LOANED SECURITIES – 100.4% (Cost $185,900,580) | 221,139,159 | |||||||
See accompanying notes to financial statements. | CRM Funds | |
36 | ||
CRM FUNDS CRM SMALL/MID CAP VALUE FUND SCHEDULE OF INVESTMENTS (Continued) June 30, 2023 |
Principal ($) | Value | |||||||
SHORT-TERM INVESTMENTS HELD AS COLLATERAL FOR LOANED SECURITIES — 3.1% | ||||||||
REPURCHASE AGREEMENTS — 3.1% | ||||||||
| 1,728,610 | With BNP Paribas SA: at 5.05%, dated 6/30/23, to be repurchased on 7/3/23, repurchase price $1,729,337 (collateralized by US Treasury Securities, par values ranging from $1 - $575,726, coupon rates ranging from 0.00% to 3.50%, 7/15/23 - 2/15/51; total market value $1,763,182) | $ | 1,728,610 | |||||
| 1,727,820 | With Citigroup Global Markets, Inc.: at 5.05%, dated 6/30/23, to be repurchased on 7/3/23, repurchase price $1,728,547 (collateralized by US Treasury Securities, par values ranging from $372,206 - $1,414,514, coupon rates ranging from 0.25% to 2.38%, 11/15/23 - 2/29/24; total market value $1,762,377) | 1,727,820 | ||||||
REPURCHASE AGREEMENTS — (continued) | ||||||||
Principal ($) | Value | |||||||
| 1,728,610 | With Daiwa Capital Markets America: at 5.06%, dated 6/30/23, to be repurchased on 7/3/23, repurchase price $1,729,339 (collateralized by US Treasury Securities, par values ranging from $689 - $1,769,053, coupon rates ranging from 1.13% to 5.45%, 8/31/23 - 6/30/30; total market value $1,763,183) | $ | 1,728,610 | |||||
| 1,728,610 | With JP Morgan Securities LLC: at 5.05%, dated 6/30/23, to be repurchased on 7/3/23, repurchase price $1,729,337 (collateralized by US Treasury Securities, par values ranging from $79,023 - $957,695, coupon rates ranging from 0.00% to 2.75%, 7/5/23 - 9/30/26; total market value $1,763,182) | 1,728,610 | ||||||
TOTAL SHORT-TERM INVESTMENTS HELD AS COLLATERAL FOR LOANED SECURITIES (Cost $6,913,650) | 6,913,650 | |||||||
TOTAL INVESTMENTS — 103.5% (Cost $192,814,230) | $ | 228,052,809 | 7 | |||||
LIABILITIES IN EXCESS OF OTHER ASSETS — (3.5)% | (7,793,657 | ) | ||||||
NET ASSETS — 100.0% | $ | 220,259,152 | ||||||
See accompanying notes to financial statements. | CRM Funds | |
37 | ||
CRM FUNDS CRM SMALL/MID CAP VALUE FUND SCHEDULE OF INVESTMENTS (Concluded) June 30, 2023 |
A summary of inputs used to value the Fund’s investments as of June 30, 2023 is as follows (see Note 2 in Notes to Financial Statements):
Assets | Level 1 | Level 2 | Level 3 | Investments | ||||||||||||
Common Stock | $ | 212,745,661 | — | — | $ | 212,745,661 | ||||||||||
Short-Term Investments | 8,393,498 | — | — | 8,393,498 | ||||||||||||
Short-Term Investments Held As Collateral For Loaned Securities | — | $ | 6,913,650 | — | 6,913,650 | |||||||||||
Total | $ | 221,139,159 | $ | 6,913,650 | — | $ | 228,052,809 | |||||||||
There were no transfers into or out of Level 3 related to securities held at June 30, 2023.
1 | Non-income producing security. |
2 | Security partially or fully on loan. |
3 | PLC - Public Limited Company |
4 | ADR - American Depositary Receipt |
5 | LP - Limited Partnership |
6 | Rate disclosed is the seven day effective yield as of June 30, 2023. |
7 | At June 30, 2023, the market value of securities on loan for CRM Small/Mid Cap Value Fund was $6,748,670. In the event that the collateral received is insufficient to cover the value of the loaned securities and provided such collateral shortfall is not the result of investment losses, the Fund’s securities lending agent, The Bank of New York Mellon, has agreed to pay the amount of the shortfall to the Fund, or at its discretion, replace the loaned securities. |
See accompanying notes to financial statements. | CRM Funds | |
38 | ||
CRM FUNDS CRM MID CAP VALUE FUND SCHEDULE OF INVESTMENTS June 30, 2023 |
Shares | Value | |||||||
COMMON STOCK — 97.1% | ||||||||
Consumer Discretionary — 8.0% | ||||||||
Apparel & Textile Products — 1.9% | ||||||||
| 245,056 | Steven Madden Ltd. | $ | 8,010,881 | |||||
Retail — Discretionary - 2.8% | ||||||||
| 73,335 | Burlington Stores, Inc.1 | 11,542,196 | ||||||
Wholesale — Discretionary - 3.3% | ||||||||
| 230,970 | LKQ Corporation | 13,458,621 | ||||||
Total Consumer Discretionary | 33,011,698 | |||||||
Consumer Staples — 4.2% | ||||||||
Food — 2.7% | ||||||||
| 96,707 | Lamb Weston Holdings, Inc. | 11,116,470 | ||||||
Household Products — 1.5% | ||||||||
| 236,774 | Kenvue, Inc.1,2 | 6,255,569 | ||||||
Total Consumer Staples | 17,372,039 | |||||||
Energy — 6.7% | ||||||||
Oil & Gas Producers — 2.6% | ||||||||
| 51,624 | Pioneer Natural Resources Company | 10,695,460 | ||||||
Oil & Gas Services & Equipment — 4.1% | ||||||||
| 545,307 | ChampionX Corporation | 16,926,330 | ||||||
Total Energy | 27,621,790 | |||||||
Financials — 10.9% | ||||||||
Asset Management — 1.8% | ||||||||
| 34,815 | LPL Financial Holdings, Inc. | 7,569,825 | ||||||
Banking — 2.9% | ||||||||
| 294,527 | Cadence Bank | 5,784,510 | ||||||
| 158,549 | Webster Financial Corporation | 5,985,225 | ||||||
| 11,769,735 | ||||||||
Insurance — 6.2% | ||||||||
| 91,459 | American Financial Group, Inc. | 10,860,756 | ||||||
| 25,624 | Everest Re Group Ltd. | 8,759,821 | ||||||
Shares | Value | |||||||
Financials — (continued) | ||||||||
Insurance — (continued) | ||||||||
| 100,800 | W.R. Berkley Corporation | $ | 6,003,648 | |||||
| 25,624,225 | ||||||||
Total Financials | 44,963,785 | |||||||
Health Care — 7.6% | ||||||||
Medical Equipment & Devices — 7.6% | ||||||||
| 26,224 | Bio-Rad Laboratories, Inc., Class A1 | 9,942,043 | ||||||
| 330,171 | Envista Holdings Corporation1 | 11,172,986 | ||||||
| 124,587 | QuidelOrtho Corporation1 | 10,323,279 | ||||||
Total Health Care | 31,438,308 | |||||||
Industrials — 17.2% | ||||||||
Aerospace & Defense — 4.7% | ||||||||
| 21,004 | Teledyne Technologies, Inc.1 | 8,634,954 | ||||||
| 89,511 | Woodward, Inc. | 10,643,753 | ||||||
| 19,278,707 | ||||||||
Electrical Equipment — 6.6% | ||||||||
| 70,368 | AMETEK, Inc. | 11,391,172 | ||||||
| 496,980 | Vontier Corporation | 16,007,727 | ||||||
| 27,398,899 | ||||||||
Industrial Intermediate Products — 1.0% | ||||||||
| 13,926 | Valmont Industries, Inc. | 4,053,162 | ||||||
Industrial Support Services — 0.8% | ||||||||
| 21,574 | Applied Industrial Technologies, Inc. | 3,124,562 | ||||||
Machinery — 1.3% | ||||||||
| 35,090 | Regal Rexnord Corporation | 5,400,351 | ||||||
Transportation & Logistics — 2.8% | ||||||||
| 144,206 | Canadian Pacific Kansas City Ltd.2 | 11,647,519 | ||||||
Total Industrials | 70,903,200 | |||||||
See accompanying notes to financial statements. | CRM Funds | |
39 | ||
CRM FUNDS CRM MID CAP VALUE FUND SCHEDULE OF INVESTMENTS (Continued) June 30, 2023 |
Shares | Value | |||||||
Materials — 11.9% | ||||||||
Chemicals — 7.6% | ||||||||
| 130,977 | Ashland, Inc. | $ | 11,383,211 | |||||
| 141,734 | Corteva, Inc. | 8,121,358 | ||||||
| 129,973 | RPM International, Inc. | 11,662,477 | ||||||
| 31,167,046 | ||||||||
Construction Materials — 4.3% | ||||||||
| 70,680 | Advanced Drainage Systems, Inc. | 8,041,970 | ||||||
| 21,454 | Martin Marietta Materials, Inc. | 9,905,098 | ||||||
| 17,947,068 | ||||||||
Total Materials | 49,114,114 | |||||||
Real Estate — 4.1% | ||||||||
REIT — 4.1% | ||||||||
| 576,750 | Equity Commonwealth1 | 11,684,955 | ||||||
| 88,362 | Terreno Realty Corporation | 5,310,556 | ||||||
Total Real Estate | 16,995,511 | |||||||
Technology — 16.7% | ||||||||
Semiconductors — 2.9% | ||||||||
| 134,366 | Microchip Technology, Inc. | 12,037,850 | ||||||
Software — 4.1% | ||||||||
| �� | 59,141 | PTC, Inc.1 | 8,415,764 | |||||
| 198,577 | Tenable Holdings, Inc.1 | 8,648,029 | ||||||
| 17,063,793 | ||||||||
Technology Hardware — 2.2% | ||||||||
| 216,537 | Ciena Corporation1 | 9,200,657 | ||||||
Technology Services — 7.5% | ||||||||
| 1,375,979 | Clarivate PLC1,3 | 13,113,080 | ||||||
| 171,907 | Fidelity National Information Services, Inc. | 9,403,313 | ||||||
| 42,183 | Morningstar, Inc. | 8,270,821 | ||||||
| 30,787,214 | ||||||||
Total Technology | 69,089,514 | |||||||
Shares | Value | |||||||
Utilities — 9.8% | ||||||||
Electric Utilities — 4.5% | ||||||||
| 134,841 | Black Hills Corporation | $ | 8,125,519 | |||||
| 177,629 | NextEra Energy Partners LP2,4 | 10,416,164 | ||||||
| 18,541,683 | ||||||||
Gas & Water Utilities — 5.3% | ||||||||
| 85,665 | Atmos Energy Corporation | 9,966,266 | ||||||
| 431,320 | Nisource, Inc. | 11,796,602 | ||||||
| 21,762,868 | ||||||||
Total Utilities | 40,304,551 | |||||||
TOTAL COMMON STOCK (Cost $307,180,534) | 400,814,510 | |||||||
SHORT-TERM INVESTMENTS — 3.5% | ||||||||
| 7,194,502 | Blackrock Liquidity Funds T-Fund, Institutional Shares, 4.98%5 | 7,194,502 | ||||||
| 7,194,503 | Federated Hermes Treasury Obligations Fund, Institutional Shares, 4.95%5 | 7,194,503 | ||||||
TOTAL SHORT-TERM INVESTMENTS (Cost $14,389,005) | 14,389,005 | |||||||
TOTAL INVESTMENTS BEFORE SHORT-TERM INVESTMENTS HELD AS COLLATERAL FOR LOANED SECURITIES – 100.6% - (Cost $321,569,539) | 415,203,515 | |||||||
See accompanying notes to financial statements. | CRM Funds | |
40 | ||
CRM FUNDS CRM MID CAP VALUE FUND SCHEDULE OF INVESTMENTS (Continued) June 30, 2023 |
Principal ($) | Value | |||||||
SHORT-TERM INVESTMENTS HELD AS COLLATERAL FOR LOANED SECURITIES — 5.4% | ||||||||
REPURCHASE AGREEMENTS — 4.1% | ||||||||
| 5,565,803 | With BNP Paribas SA: at 5.05%, dated 6/30/23, to be repurchased on 7/3/23, repurchase price $5,568,145 (collateralized by US Treasury Securities, par values ranging from $2 - $1,853,730, coupon rates ranging from 0.00% to 3.50%, 7/15/23 - 2/15/51; total market value $5,677,120) | $ | 5,565,803 | |||||
| 394,168 | With Citigroup Global Markets, Inc.: at 5.05%, dated 6/30/23, to be repurchased on 7/3/23, repurchase price $394,334 (collateralized by US Treasury Securities, par values ranging from $84,911 - $322,693, coupon rates ranging from 0.25% to 2.38%, 11/15/23 - 2/29/24; total market value $402,052) | 394,168 | ||||||
Principal ($) | Value | |||||||
REPURCHASE AGREEMENTS — (continued) | ||||||||
| 5,565,803 | With Daiwa Capital Markets America: at 5.06%, dated 6/30/23, to be repurchased on 7/3/23, repurchase price $5,568,150 (collateralized by US Treasury Securities, par values ranging from $2,217 - $5,696,021, coupon rates ranging from 1.13% to 5.45%, 8/31/23 - 6/30/30; total market value $5,677,121) | $ | 5,565,803 | |||||
| 5,565,803 | With JP Morgan Securities LLC: at 5.05%, dated 6/30/23, to be repurchased on 7/3/23, repurchase price $5,568,145 (collateralized by US Treasury Securities, par values ranging from $254,439 - $3,083,598, coupon rates ranging from 0.00% to 2.75%, 7/5/23 - 9/30/26; total market value $5,677,119) | 5,565,803 | ||||||
TOTAL REPURCHASE AGREEMENTS | 17,091,577 | |||||||
See accompanying notes to financial statements. | CRM Funds | |
41 | ||
CRM FUNDS CRM MID CAP VALUE FUND SCHEDULE OF INVESTMENTS (Concluded) June 30, 2023 |
Shares | Value | |||||||
TIME DEPOSITS — 1.3% | ||||||||
| 1,040,000 | Barclays Bank PLC, 5.09% due 7/3/233 | $ | 1,040,000 | |||||
| 1,030,000 | Canadian Imperial Bank of Commerce, 5.06% due 7/3/23 | 1,030,000 | ||||||
| 1,020,000 | Landesbank Baden-Wurttemberg, 5.07% due 7/3/23 | 1,020,000 | ||||||
| 1,040,000 | Mizuho Bank Ltd., 5.07% due 7/3/23 | 1,040,000 | ||||||
Shares | Value | |||||||
TIME DEPOSITS — (continued) | ||||||||
1,040,000 | Royal Bank of Canada, 5.07% due 7/3/23 | $ | 1,040,000 | |||||
TOTAL TIME DEPOSITS | 5,170,000 | |||||||
TOTAL SHORT-TERM INVESTMENTS HELD AS COLLATERAL FOR LOANED SECURITIES (Cost $22,261,577) | 22,261,577 | |||||||
TOTAL INVESTMENTS - 106.0% (Cost $343,831,116) | $ | 437,465,092 | 6 | |||||
LIABILITIES IN EXCESS OF OTHER ASSETS - (6.0)% | (24,577,156 | ) | ||||||
NET ASSETS - 100.0% | $ | 412,887,936 | ||||||
A summary of inputs used to value the Fund’s investments as of June 30, 2023 is as follows (see Note 2 in Notes to Financial Statements):
Assets | Level 1 | Level 2 | Level 3 | Investments | ||||||||||||
Common Stock | $ | 400,814,510 | — | — | $ | 400,814,510 | ||||||||||
Short-Term Investments | 14,389,005 | — | — | 14,389,005 | ||||||||||||
Short-Term Investments Held As Collateral For Loaned Securities | — | $ | 22,261,577 | — | 22,261,577 | |||||||||||
Total | $ | 415,203,515 | $ | 22,261,577 | — | $ | 437,465,092 | |||||||||
There were no transfers into or out of Level 3 related to securities held at June 30, 2023.
1 | Non-income producing security. |
2 | Security partially or fully on loan. |
3 | PLC – Public Limited Company |
4 | LP – Limited Partnership |
5 | Rate disclosed is the seven day effective yield as of June 30, 2023. |
6 | At June 30, 2023, the market value of securities on loan for CRM Mid Cap Value Fund was $22,226,430. In the event that the collateral received is insufficient to cover the value of the loaned securities and provided such collateral shortfall is not the result of investment losses, the Fund’s securities lending agent, The Bank of New York Mellon, has agreed to pay the amount of the shortfall to the Fund, or at its discretion, replace the loaned securities. |
See accompanying notes to financial statements. | CRM Funds | |
42 | ||
CRM FUNDS CRM ALL CAP VALUE FUND SCHEDULE OF INVESTMENTS June 30, 2023 |
Shares | Value | |||||||
COMMON STOCK — 95.8% | ||||||||
Consumer Discretionary — 6.2% | ||||||||
Apparel & Textile Products — 1.7% | ||||||||
| 12,830 | Steven Madden Ltd. | $ | 419,413 | |||||
Retail — Discretionary - 2.3% | ||||||||
| 3,438 | Burlington Stores, Inc.1 | 541,107 | ||||||
Wholesale — Discretionary - 2.2% | ||||||||
| 8,931 | LKQ Corporation | 520,409 | ||||||
Total Consumer Discretionary | 1,480,929 | |||||||
Consumer Staples — 6.0% | ||||||||
Food — 2.5% | ||||||||
| 5,132 | Lamb Weston Holdings, Inc. | 589,923 | ||||||
Household Products — 3.5% | ||||||||
| 2,993 | Estee Lauder Companies, Inc. (The), Class A | 587,765 | ||||||
| 9,225 | Kenvue, Inc.1 | 243,725 | ||||||
| 831,490 | ||||||||
Total Consumer Staples | 1,421,413 | |||||||
Energy — 9.4% | ||||||||
Oil & Gas Producers — 3.3% | ||||||||
| 34,099 | Marathon Oil Corporation | 784,959 | ||||||
Oil & Gas Services & Equipment — 4.1% | ||||||||
| 30,935 | ChampionX Corporation | 960,222 | ||||||
Renewable Energy — 2.0% | ||||||||
| 4,357 | EnerSys | 472,822 | ||||||
Total Energy | 2,218,003 | |||||||
Financials — 16.7% | ||||||||
Asset Management — 2.5% | ||||||||
| 10,401 | Charles Schwab Corporation (The) | 589,529 | ||||||
Banking — 4.5% | ||||||||
| 22,133 | Truist Financial Corporation | 671,737 | ||||||
Shares | Value | |||||||
Financials — (continued) | ||||||||
Banking — (continued) | ||||||||
| 10,340 | Webster Financial Corporation | $ | 390,335 | |||||
| 1,062,072 | ||||||||
Institutional Financial Services — 3.4% | ||||||||
| 10,245 | Moelis & Company, Class A2 | 464,508 | ||||||
| 3,882 | Morgan Stanley | 331,523 | ||||||
| 796,031 | ||||||||
Insurance — 6.3% | ||||||||
| 4,306 | American Financial Group, Inc. | 511,337 | ||||||
| 8,922 | American International Group, Inc. | 513,371 | ||||||
| 1,396 | Everest Re Group Ltd. | 477,237 | ||||||
| 1,501,945 | ||||||||
Total Financials | 3,949,577 | |||||||
Health Care — 15.3% | ||||||||
Biotechnology & Pharmaceuticals — 3.0% | ||||||||
| 4,366 | Johnson & Johnson | 722,660 | ||||||
Health Care Facilities & Services — 3.0% | ||||||||
| 1,599 | Humana, Inc.1 | 714,961 | ||||||
Medical Equipment & Devices — 9.3% | ||||||||
| 2,697 | Danaher Corporation | 647,280 | ||||||
| 17,776 | Envista Holdings Corporation1 | 601,540 | ||||||
| 3,458 | LeMaitre Vascular, Inc. | 232,654 | ||||||
| 8,649 | QuidelOrtho Corporation1 | 716,656 | ||||||
| 2,198,130 | ||||||||
Total Health Care | 3,635,751 | |||||||
Industrials — 11.6% | ||||||||
Aerospace & Defense — 2.3% | ||||||||
| 4,556 | Woodward, Inc. | 541,754 | ||||||
Industrial Intermediate Products — 1.0% | ||||||||
| 799 | Valmont Industries, Inc. | 232,549 | ||||||
See accompanying notes to financial statements. | CRM Funds | |
43 | ||
CRM FUNDS CRM ALL CAP VALUE FUND SCHEDULE OF INVESTMENTS (Continued) June 30, 2023 |
Shares | Value | |||||||
Industrials — (continued) | ||||||||
Machinery — 1.2% | ||||||||
| 3,182 | Crane Company | $ | 283,580 | |||||
Transportation & Logistics — 7.1% | ||||||||
| 7,288 | Canadian Pacific Kansas City Ltd.2 | 588,652 | ||||||
| 14,196 | Kirby Corporation1 | 1,092,382 | ||||||
| 1,681,034 | ||||||||
Total Industrials | 2,738,917 | |||||||
Materials — 9.7% | ||||||||
Chemicals — 4.4% | ||||||||
| 6,253 | Ashland, Inc. | 543,448 | ||||||
| 8,819 | Corteva, Inc. | 505,329 | ||||||
| 1,048,777 | ||||||||
Construction Materials — 5.3% | ||||||||
| 7,487 | Advanced Drainage Systems, Inc. | 851,870 | ||||||
| 837 | Martin Marietta Materials, Inc. | 386,435 | ||||||
| 1,238,305 | ||||||||
Total Materials | 2,287,082 | |||||||
Real Estate — 1.5% | ||||||||
REIT — 1.5% | ||||||||
| 5,793 | Terreno Realty Corporation | 348,159 | ||||||
Technology — 16.9% | ||||||||
Semiconductors — 3.0% | ||||||||
| 7,401 | Intel Corporation | 247,489 | ||||||
| 5,066 | Microchip Technology, Inc. | 453,863 | ||||||
| 701,352 | ||||||||
Software — 5.1% | ||||||||
| 4,971 | PTC, Inc.1 | 707,374 | ||||||
| 11,611 | Tenable Holdings, Inc.1 | 505,659 | ||||||
| 1,213,033 | ||||||||
Technology Hardware — 2.3% | ||||||||
| 12,796 | Ciena Corporation1 | 543,702 | ||||||
Shares | Value | |||||||
Technology — (continued) | ||||||||
Technology Services — 6.5% | ||||||||
| 99,764 | Clarivate PLC1,3 | $ | 950,752 | |||||
| 10,876 | Fidelity National Information Services, Inc. | 594,917 | ||||||
| 1,545,669 | ||||||||
Total Technology | 4,003,756 | |||||||
Utilities — 2.5% | ||||||||
Electric Utilities — 2.5% | ||||||||
| 8,058 | NextEra Energy, Inc. | 597,904 | ||||||
TOTAL COMMON STOCK (Cost $19,279,472) | 22,681,491 | |||||||
SHORT-TERM INVESTMENTS — 3.4% | ||||||||
| 405,950 | Blackrock Liquidity Funds T-Fund, Institutional Shares, 4.98%4 | 405,950 | ||||||
| 405,950 | Federated Hermes Treasury Obligations Fund, Institutional Shares, 4.95%4 | 405,950 | ||||||
TOTAL SHORT-TERM INVESTMENTS (Cost $811,900) | 811,900 | |||||||
TOTAL INVESTMENTS BEFORE SHORT-TERM INVESTMENTS HELD AS COLLATERAL FOR LOANED SECURITIES – 99.2% (Cost $20,091,372) | 23,493,391 | |||||||
See accompanying notes to financial statements. | CRM Funds | |
44 | ||
CRM FUNDS CRM ALL CAP VALUE FUND SCHEDULE OF INVESTMENTS (Continued) June 30, 2023 |
Principal ($) | Value | |||||||
SHORT-TERM INVESTMENTS HELD AS COLLATERAL FOR LOANED SECURITIES — 4.6% | ||||||||
REPURCHASE AGREEMENTS — 4.6% | ||||||||
| 76,267 | With Daiwa Capital Markets America: at 5.06%, dated 6/30/23, to be repurchased on 7/3/23, repurchase price $76,299 (collateralized by US Treasury Securities, par values ranging from $30 - $78,051, coupon rates ranging from 1.13% to 5.45%, 8/31/23 - 6/30/30; total market value $77,792) | $ | 76,267 | |||||
| 1,000,000 | With JP Morgan Securities LLC: at 5.05%, dated 6/30/23, to be repurchased on 7/3/23, repurchase price $1,000,421 (collateralized by US Treasury Securities, par values ranging from $45,715 - $554,026, coupon rates ranging from 0.00% to 2.75%, 7/5/23 - 9/30/26; total market value $1,020,000) | 1,000,000 | ||||||
TOTAL SHORT-TERM INVESTMENTS HELD AS COLLATERAL FOR LOANED SECURITIES (Cost $1,076,267) | 1,076,267 | |||||||
TOTAL INVESTMENTS — 103.8% (Cost $21,167,639) | $ | 24,569,658 | 5 | |||||
LIABILITIES IN EXCESS OF OTHER ASSETS — (3.8)% | (901,529 | ) | ||||||
NET ASSETS — 100.0% | $ | 23,668,129 | ||||||
See accompanying notes to financial statements. | CRM Funds | |
45 | ||
CRM FUNDS CRM ALL CAP VALUE FUND SCHEDULE OF INVESTMENTS (Concluded) June 30, 2023 |
A summary of inputs used to value the Fund’s investments as of June 30, 2023 is as follows (see Note 2 in Notes to Financial Statements):
Assets | Level 1 | Level 2 | Level 3 | Investments | ||||||||||||
Common Stock | $ | 22,681,491 | — | — | $ | 22,681,491 | ||||||||||
Short-Term Investments | 811,900 | — | — | 811,900 | ||||||||||||
Short-Term Investments Held As Collateral For Loaned Securities | — | $ | 1,076,267 | — | 1,076,267 | |||||||||||
Total | $ | 23,493,391 | $ | 1,076,267 | — | $ | 24,569,658 | |||||||||
There were no transfers into or out of Level 3 related to securities held at June 30, 2023.
1 | Non-income producing security. |
2 | Security partially or fully on loan. |
3 | PLC – Public Limited Company |
4 | Rate disclosed is the seven day effective yield as of June 30, 2023. |
5 | At June 30, 2023, the market value of securities on loan for CRM All Cap Value Fund was $1,053,160. In the event that the collateral received is insufficient to cover the value of the loaned securities and provided such collateral shortfall is not the result of investment losses, the Fund’s securities lending agent, The Bank of New York Mellon, has agreed to pay the amount of the shortfall to the Fund, or at its discretion, replace the loaned securities. |
See accompanying notes to financial statements. | CRM Funds | |
46 | ||
CRM FUNDS CRM LONG/SHORT OPPORTUNITIES FUND SCHEDULE OF INVESTMENTS June 30, 2023 |
Shares | Value | |||||||
COMMON STOCK — 85.1% | ||||||||
Communications — 2.7% | ||||||||
Internet Media & Services — 2.7% | ||||||||
| 959 | Booking Holdings, Inc.1 | $ | 2,589,616 | |||||
| 15,300 | Meta Platforms, Inc., Class A1 | 4,390,795 | ||||||
Total Communications | 6,980,411 | |||||||
Consumer Discretionary — 11.4% | ||||||||
Apparel & Textile Products — 2.1% | ||||||||
| 164,529 | Steven Madden Ltd. | 5,378,453 | ||||||
Home Construction — 1.8% | ||||||||
| 70,568 | Skyline Champion Corporation1 | 4,618,676 | ||||||
Leisure Facilities & Services – 2.0% | ||||||||
| 157,331 | BJ’s Restaurants, Inc.1 | 5,003,126 | ||||||
Retail — Discretionary - 3.1% | ||||||||
| 32,798 | Burlington Stores, Inc.1 | 5,162,078 | ||||||
| 8,226 | RH1 | 2,711,207 | ||||||
| 7,873,285 | ||||||||
Wholesale — Discretionary - 2.4% | ||||||||
| 105,307 | LKQ Corporation | 6,136,238 | ||||||
Total Consumer Discretionary | 29,009,778 | |||||||
Consumer Staples — 6.8% | ||||||||
Beverages — 2.7% | ||||||||
| 2,854,640 | Becle SAB de CV | 6,993,405 | ||||||
Food — 2.7% | ||||||||
| 60,525 | Lamb Weston Holdings, Inc. | 6,957,349 | ||||||
Household Products — 1.4% | ||||||||
| 18,092 | Estee Lauder Companies, Inc. (The), Class A | 3,552,907 | ||||||
Total Consumer Staples | 17,503,661 | |||||||
Energy — 3.7% | ||||||||
Oil & Gas Producers — 1.4% | ||||||||
| 17,463 | Pioneer Natural Resources Company | 3,617,984 | ||||||
Shares | Value | |||||||
Energy — (continued) | ||||||||
Renewable Energy — 2.3% | ||||||||
| 54,001 | EnerSys | $ | 5,860,188 | |||||
Total Energy | 9,478,172 | |||||||
Financials — 4.3% | ||||||||
Institutional Financial Services — 2.1% | ||||||||
| 60,986 | Morgan Stanley | 5,208,205 | ||||||
Insurance — 2.2% | ||||||||
| 16,647 | Everest Re Group Ltd. | 5,690,943 | ||||||
Total Financials | 10,899,148 | |||||||
Health Care — 6.8% | ||||||||
Health Care Facilities & Services — 2.5% | ||||||||
| 14,041 | Humana, Inc.1 | 6,278,152 | ||||||
Medical Equipment & Devices — 4.3% | ||||||||
| 23,410 | Danaher Corporation | 5,618,400 | ||||||
| 161,303 | Envista Holdings Corporation1 | 5,458,493 | ||||||
| 11,076,893 | ||||||||
Total Health Care | 17,355,045 | |||||||
Industrials — 22.8% | ||||||||
Aerospace & Defense — 1.0% | ||||||||
| 22,531 | Woodward, Inc. | 2,679,161 | ||||||
Commercial Support Services — 3.2% | ||||||||
| 49,179 | Clean Harbors, Inc.1 | 8,086,503 | ||||||
Diversified Industrials — 1.7% | ||||||||
| 38,746 | General Electric, Company | 4,256,248 | ||||||
Electrical Equipment — 5.4% | ||||||||
| 257,285 | Hayward Holdings, Inc.1 | 3,306,112 | ||||||
| 329,697 | Vontier Corporation | 10,619,541 | ||||||
| 13,925,653 | ||||||||
Engineering & Construction — 5.1% | ||||||||
| 171,036 | Arcosa, Inc. | 12,959,397 | ||||||
Transportation & Logistics — 6.4% | ||||||||
| 100,441 | Canadian Pacific Kansas City Ltd. | 8,112,619 | ||||||
See accompanying notes to financial statements. | CRM Funds | |
47 | ||
CRM FUNDS CRM LONG/SHORT OPPORTUNITIES FUND SCHEDULE OF INVESTMENTS (Continued) June 30, 2023 |
Shares | Value | |||||||
Industrials — (continued) | ||||||||
Transportation & Logistics — (continued) | ||||||||
| 108,250 | Kirby Corporation1 | $ | 8,329,837 | |||||
| 16,442,456 | ||||||||
Total Industrials | 58,349,418 | |||||||
Materials — 5.8% | ||||||||
Chemicals — 1.4% | ||||||||
| 39,792 | Ashland, Inc. | 3,458,323 | ||||||
Construction Materials — 4.4% | ||||||||
| 56,705 | Advanced Drainage Systems, Inc. | 6,451,895 | ||||||
| 10,371 | Martin Marietta Materials, Inc. | 4,788,187 | ||||||
| 11,240,082 | ||||||||
Total Materials | 14,698,405 | |||||||
Technology — 16.3% | ||||||||
Semiconductors — 2.1% | ||||||||
| 44,250 | QUALCOMM, Inc. | 5,267,521 | ||||||
Software — 11.2% | ||||||||
| 239,210 | ACV Auctions, Inc.1 | 4,131,157 | ||||||
| 101,070 | Jamf Holding Corporation1 | 1,972,886 | ||||||
| 25,946 | Microsoft Corporation | 8,835,650 | ||||||
| 53,620 | PTC, Inc.1 | 7,630,126 | ||||||
| 138,912 | Tenable Holdings, Inc.1 | 6,049,618 | ||||||
| 28,619,437 | ||||||||
Technology Services — 3.0% | ||||||||
| 320,921 | Clarivate PLC1,2 | 3,058,377 | ||||||
| 11,754 | MasterCard, Inc., Class A | 4,622,849 | ||||||
| 7,681,226 | ||||||||
Total Technology | 41,568,184 | |||||||
Utilities — 4.5% | ||||||||
Electric Utilities — 4.5% | ||||||||
| 155,904 | NextEra Energy, Inc. | 11,568,077 | ||||||
TOTAL COMMON STOCKS (Cost $183,709,263) | 217,410,299 | |||||||
Shares | Value | |||||||
SHORT-TERM INVESTMENTS — 14.5% | ||||||||
| 18,448,205 | Blackrock Liquidity Funds T-Fund, Institutional Shares, 4.98%3 | $ | 18,448,205 | |||||
| 18,448,206 | Federated Hermes Treasury Obligations Fund, Institutional Shares, 4.95%3 | 18,448,206 | ||||||
TOTAL SHORT-TERM INVESTMENTS (Cost $36,896,411) | 36,896,411 | |||||||
TOTAL INVESTMENTS IN SECURITIES (Cost $220,605,674) | 254,306,710 | |||||||
COMMON STOCK SOLD SHORT — (45.2)% | ||||||||
Communications — (2.7)% | ||||||||
Advertising & Marketing — (1.8)% | ||||||||
| (46,892 | ) | Omnicom Group, Inc. | (4,461,774 | ) | ||||
Entertainment Content — (0.2)% | ||||||||
| (31,831 | ) | Paramount Global, Class B | (506,431 | ) | ||||
Telecommunications — (0.7)% | ||||||||
| (115,545 | ) | AT&T, Inc. | (1,842,943 | ) | ||||
Total Communications | (6,811,148 | ) | ||||||
Consumer Discretionary — (9.3)% | ||||||||
Apparel & Textile Products — (1.1)% | ||||||||
| (31,681 | ) | Capri Holding Ltd.1 | (1,137,031 | ) | ||||
| (37,957 | ) | Kontoor Brands, Inc. | (1,597,990 | ) | ||||
| (2,735,021 | ) | |||||||
Automotive — (0.1)% | ||||||||
| (297,603 | ) | Canoo, Inc.1 | (142,671 | ) | ||||
Consumer Services — (2.0)% | ||||||||
| (266,929 | ) | Perdoceo Education Corporation | (3,275,218 | ) | ||||
| (27,178 | ) | Strategic Education, Inc. | (1,843,755 | ) | ||||
| (5,118,973 | ) | |||||||
See accompanying notes to financial statements. | CRM Funds | |
48 | ||
CRM FUNDS CRM LONG/SHORT OPPORTUNITIES FUND SCHEDULE OF INVESTMENTS (Continued) June 30, 2023 |
Shares | Value | |||||||
Consumer Discretionary — (continued) | ||||||||
Leisure Facilities & Services — (1.9)% | ||||||||
| (25,963 | ) | Dutch Bros., Inc. | $ | (738,647 | ) | |||
| (92,791 | ) | Life Time Group Holdings, Inc.1 | (1,825,199 | ) | ||||
| (42,398 | ) | SeaWorld Entertainment, Inc.1 | (2,374,712 | ) | ||||
| (4,938,558 | ) | |||||||
Retail — Discretionary - (4.2)% | ||||||||
| (30,989 | ) | Bath & Body Works, Inc. | (1,162,087 | ) | ||||
| (120,961 | ) | EVgo, Inc.1 | (483,844 | ) | ||||
| (111,051 | ) | Lovesac Company (The) | (2,992,824 | ) | ||||
| (40,908 | ) | Pandora A/S | (3,656,719 | ) | ||||
| (34,978 | ) | Victoria’s Secret & Company1 | (609,667 | ) | ||||
| (15,521 | ) | Williams-Sonoma, Inc. | (1,942,298 | ) | ||||
| (10,847,439 | ) | |||||||
Total Consumer Discretionary | (23,782,662 | ) | ||||||
Consumer Staples — (4.2)% | ||||||||
Food — (1.5)% | ||||||||
| (42,664 | ) | Cal-Maine Foods, Inc. | (1,919,880 | ) | ||||
| (30,263 | ) | Kellogg Company | (2,039,726 | ) | ||||
| (3,959,606 | ) | |||||||
Retail — Consumer Staples - (2.7)% | ||||||||
| (38,949 | ) | Kroger Company (The) | (1,830,603 | ) | ||||
| (54,834 | ) | Sprouts Farmers Market, Inc.1 | (2,014,053 | ) | ||||
| (103,774 | ) | Walgreens Boots Alliance, Inc. | (2,956,521 | ) | ||||
| (6,801,177 | ) | |||||||
Total Consumer Staples | (10,760,783 | ) | ||||||
Energy — (0.4)% | ||||||||
Renewable Energy — (0.4)% | ||||||||
| (93,908 | ) | Plug Power, Inc.1 | (975,704 | ) | ||||
Financials — (4.7)% | ||||||||
Asset Management — (0.7)% | ||||||||
| (19,980 | ) | Blackstone Group LP (The)4 | (1,857,541 | ) | ||||
Shares | Value | |||||||
Financials — (continued) | ||||||||
Banking — (0.8)% | ||||||||
| (48,904 | ) | Bank OZK | $ | (1,963,985 | ) | |||
Insurance — (1.3)% | ||||||||
| (19,244 | ) | Progressive Corporation (The) | (2,547,328 | ) | ||||
| (38,418 | ) | Trupanion, Inc.1 | (756,066 | ) | ||||
| (3,303,394 | ) | |||||||
Specialty Finance — (1.9)% | ||||||||
| (50,602 | ) | Ally Financial, Inc. | (1,366,760 | ) | ||||
| (35,820 | ) | Blackstone Mortgage Trust, Inc., Class A | (745,414 | ) | ||||
| (25,724 | ) | Capital One Financial Corporation | (2,813,434 | ) | ||||
| (4,925,608 | ) | |||||||
Total Financials | (12,050,528 | ) | ||||||
Health Care — (2.1)% | ||||||||
Health Care Facilities & Services — (2.1)% | ||||||||
| (13,252 | ) | Ensign Group, Inc. (The) | (1,265,036 | ) | ||||
| (17,833 | ) | Fulgent Genetics, Inc.1 | (660,356 | ) | ||||
| (690,241 | ) | Ginkgo Bioworks Holdings, Inc.1 | (1,283,848 | ) | ||||
| (9,587 | ) | Medpace Holdings, Inc.1 | (2,302,510 | ) | ||||
Total Health Care | (5,511,750 | ) | ||||||
Industrials — (11.5)% | ||||||||
Diversified Industrials — (0.6)% | ||||||||
| (23,288 | ) | Pentair PLC2 | (1,504,405 | ) | ||||
Electrical Equipment — (4.3)% | ||||||||
| (19,164 | ) | Acuity Brands, Inc. | (3,125,265 | ) | ||||
| (21,833 | ) | Advanced Energy Industries, Inc. | (2,433,288 | ) | ||||
| (32,744 | ) | Blink Charging Company1 | (196,137 | ) | ||||
| (138,974 | ) | ChargePoint Holdings, Inc.1 | (1,221,581 | ) | ||||
| (12,675 | ) | Generac Holdings, Inc.1 | (1,890,223 | ) | ||||
| (71,960 | ) | Signify NV | (2,017,373 | ) | ||||
| (10,883,867 | ) | |||||||
See accompanying notes to financial statements. | CRM Funds | |
49 | ||
CRM FUNDS CRM LONG/SHORT OPPORTUNITIES FUND SCHEDULE OF INVESTMENTS (Continued) June 30, 2023 |
Shares | Value | |||||||
Industrials — (continued) | ||||||||
Industrial Intermediate Products — (1.3)% | ||||||||
| (211,031 | ) | Hillman Solutions Corporation | $ | (1,901,389 | ) | |||
| (16,022 | ) | Mueller Industries, Inc. | (1,398,400 | ) | ||||
| (3,299,789 | ) | |||||||
Industrial Support Services — (1.8)% | ||||||||
| (109,227 | ) | Resideo Technologies, Inc. | $ | (1,928,949 | ) | |||
| (7,340 | ) | Watsco, Inc. | (2,799,990 | ) | ||||
| (4,728,939 | ) | |||||||
Machinery — (0.3)% | ||||||||
| (2,526 | ) | Snap-on, Inc. | (727,968 | ) | ||||
Transportation & Logistics — (2.2)% | ||||||||
| (9,803 | ) | CH Robinson Worldwide, Inc. | (924,913 | ) | ||||
| (6,985 | ) | Old Dominion Freight Line, Inc. | (2,582,704 | ) | ||||
| (6,294 | ) | Saia, Inc.1 | (2,155,128 | ) | ||||
| (5,662,745 | ) | |||||||
Transportation Equipment — (1.0)% | ||||||||
| (23,207 | ) | Wabtec Corporation | (2,545,112 | ) | ||||
Total Industrials | (29,352,825 | ) | ||||||
Materials — (1.0)% | ||||||||
Chemicals — (0.5)% | ||||||||
| (10,265 | ) | Celanese Corporation | (1,188,687 | ) | ||||
Metals & Mining — (0.5)% | ||||||||
| (7,389 | ) | Encore Wire Corporation | (1,373,837 | ) | ||||
Total Materials | (2,562,524 | ) | ||||||
Real Estate — (1.6)% | ||||||||
REIT — (1.6)% | ||||||||
| (14,757 | ) | Extra Space Storage, Inc. | (2,196,580 | ) | ||||
| (10,302 | ) | Innovative Industrial Properties, Inc. | (752,149 | ) | ||||
| (37,726 | ) | Kilroy Realty Corporation | (1,135,175 | ) | ||||
Total Real Estate | (4,083,904 | ) | ||||||
Shares | Value | |||||||
Technology — (6.6)% | ||||||||
Semiconductors — (1.7)% | ||||||||
| (44,073 | ) | Kulicke & Soffa Industries, Inc. | $ | (2,620,140 | ) | |||
| (16,839 | ) | ON Semiconductor Corporation1 | (1,592,633 | ) | ||||
| (4,212,773 | ) | |||||||
Software — (1.4)% | ||||||||
| (27,009 | ) | Qualys, Inc.1 | (3,488,752 | ) | ||||
Technology Hardware — (0.9)% | ||||||||
| (238,430 | ) | 3D Systems Corporation1 | (2,367,610 | ) | ||||
Technology Services — (2.6)% | ||||||||
| (109,154 | ) | DXC Technology Company1 | (2,916,595 | ) | ||||
| (28,623 | ) | International Business Machines Corporation | (3,830,044 | ) | ||||
| (6,746,639 | ) | |||||||
Total Technology | (16,815,774 | ) | ||||||
Utilities — (1.1)% | ||||||||
Electric Utilities — (1.1)% | ||||||||
| (74,078 | ) | Avangrid, Inc. | (2,791,259 | ) | ||||
TOTAL COMMON STOCK SOLD SHORT — (Proceeds - $121,486,068) | (115,498,861 | ) | ||||||
OTHER ASSETS IN EXCESS OF LIABILITIES — 45.6% | 116,532,713 | |||||||
NET ASSETS — 100.0% | $ | 255,340,562 | ||||||
See accompanying notes to financial statements. | CRM Funds | |
50 | ||
CRM FUNDS CRM LONG/SHORT OPPORTUNITIES FUND SCHEDULE OF INVESTMENTS (Continued) June 30, 2023 |
A summary of inputs used to value the Fund’s investments as of June 30, 2023 is as follows (see Note 2 in Notes to Financial Statements):
Level 1 | Level 2 | Level 3 | Investments | |||||||||||||
Assets: Investments in Securities: Common Stock | $ | 217,410,299 | — | — | $ | 217,410,299 | ||||||||||
Short-Term Investments | 36,896,411 | — | — | 36,896,411 | ||||||||||||
Total Assets – Investments in Securities | $ | 254,306,710 | — | — | $ | 254,306,710 | ||||||||||
Other Financial Instruments:* Total Return Swap Agreements | ||||||||||||||||
—Equity Contracts | — | $ | 2,306,135 | — | $ | 2,306,135 | ||||||||||
Total Assets – Other Financial Instruments | — | $ | 2,306,135 | — | $ | 2,306,135 | ||||||||||
Liabilities: Investments in Securities: Common Stock Sold Short | $ | (115,498,861 | ) | — | $ | (115,498,861 | ) | |||||||||
Total Liabilities – Investments in Securities | $ | (115,498,861 | ) | — | — | $ | (115,498,861 | ) | ||||||||
Other Financial Instruments:* Total Return Swap Agreements | ||||||||||||||||
—Equity Contracts | — | $ | (334,570 | ) | — | $ | (334,570 | ) | ||||||||
Total Liabilities – Other Financial Instruments | — | $ | (334,570 | ) | — | $ | (334,570 | ) |
* | Other financial instruments are derivative instruments not reflected in the Schedule of Investments, such as total return swap agreements, which are recorded at fair value. |
There were no transfers into or out of Level 3 related to securities held at June 30, 2023.
1 | Non-income producing security. |
2 | PLC – Public Limited Company |
3 | Rate disclosed is the seven day effective yield as of June 30, 2023. |
4 | LP – Limited Partnership |
See accompanying notes to financial statements. | CRM Funds | |
51 | ||
CRM FUNDS CRM LONG/SHORT OPPORTUNITIES FUND SCHEDULE OF INVESTMENTS (Continued) June 30, 2023 |
OTC Total return swap agreements outstanding at June 30, 2023:
Counterparty | Financing | Termination | Long (Short) | ||||||
Morgan Stanley | 5.72% (Fed Funds Rate + 0.65%) | 3/25/2024 | $ | 6,477,213 | |||||
Morgan Stanley | 4.62% (Fed Funds Rate - 0.45%) | 8/1/2023 | (757,439 | ) | |||||
Morgan Stanley | 4.62% (Fed Funds Rate - 0.45%) | 8/1/2023 | (760,069 | ) | |||||
Morgan Stanley | 4.62% (Fed Funds Rate - 0.45%) | 8/1/2023 | (757,467 | ) | |||||
Morgan Stanley | 4.62% (Fed Funds Rate - 0.45%) | 8/1/2023 | (756,874 | ) | |||||
Morgan Stanley | 4.62% (Fed Funds Rate - 0.45%) | 8/1/2023 | (749,822 | ) | |||||
Morgan Stanley | 4.62% (Fed Funds Rate - 0.45%) | 8/1/2023 | (752,121 | ) | |||||
Morgan Stanley | 4.62% (Fed Funds Rate - 0.45%) | 8/1/2023 | (752,776 | ) | |||||
Morgan Stanley | 4.62% (Fed Funds Rate - 0.45%) | 8/1/2023 | (753,690 | ) | |||||
Morgan Stanley | 4.62% (Fed Funds Rate - 0.45%) | 8/1/2023 | (752,812 | ) | |||||
Morgan Stanley | 4.62% (Fed Funds Rate - 0.45%) | 8/1/2023 | (749,425 | ) | |||||
Morgan Stanley | 4.62% (Fed Funds Rate - 0.45%) | 8/1/2023 | (760,364 | ) | |||||
Morgan Stanley | 4.62% (Fed Funds Rate - 0.45%) | 8/1/2023 | (750,787 | ) | |||||
Morgan Stanley | 4.62% (Fed Funds Rate - 0.45%) | 8/1/2023 | (754,204 | ) | |||||
Morgan Stanley | 4.62% (Fed Funds Rate - 0.45%) | 8/1/2023 | (760,151 | ) | |||||
Morgan Stanley | 4.62% (Fed Funds Rate - 0.45%) | 8/1/2023 | (761,376 | ) | |||||
Morgan Stanley | 4.62% (Fed Funds Rate - 0.45%) | 8/1/2023 | (759,112 | ) | |||||
Morgan Stanley | 4.62% (Fed Funds Rate - 0.45%) | 8/1/2023 | (759,448 | ) | |||||
Morgan Stanley | 4.62% (Fed Funds Rate - 0.45%) | 8/1/2023 | (752,386 | ) | |||||
Morgan Stanley | 4.62% (Fed Funds Rate - 0.45%) | 8/1/2023 | (759,580 | ) | |||||
Morgan Stanley | 4.62% (Fed Funds Rate - 0.45%) | 8/1/2023 | (766,950 | ) | |||||
See accompanying notes to financial statements. | CRM Funds | |
52 | ||
CRM FUNDS CRM LONG/SHORT OPPORTUNITIES FUND SCHEDULE OF INVESTMENTS (Continued) June 30, 2023 |
OTC Total return swap agreements outstanding at June 30, 2023 (continued):
Reference | Fair | Upfront | Unrealized | |||||||||
Eagle Materials, Inc. | $ | 2,295,505 | $ | — | $ | 2,295,505 | ||||||
Morgan Stanley Custom Swap (MSCMS807) Index(3) | (57,007 | ) | — | (57,007 | ) | |||||||
Morgan Stanley Custom Swap (MSCMS808) Index(3) | (18,840 | ) | — | (18,840 | ) | |||||||
Morgan Stanley Custom Swap (MSCMS809) Index(3) | (7,031 | ) | — | (7,031 | ) | |||||||
Morgan Stanley Custom Swap (MSCMS810) Index(3) | (39,182 | ) | — | (39,182 | ) | |||||||
Morgan Stanley Custom Swap (MSCMS811) Index(3) | (13,866 | ) | — | (13,866 | ) | |||||||
Morgan Stanley Custom Swap (MSCMS812) Index(3) | (36,929 | ) | — | (36,929 | ) | |||||||
Morgan Stanley Custom Swap (MSCMS813) Index(3) | (39,149 | ) | — | (39,149 | ) | |||||||
Morgan Stanley Custom Swap (MSCMS814) Index(3) | (33,570 | ) | — | (33,570 | ) | |||||||
Morgan Stanley Custom Swap (MSCMS815) Index(3) | (5,062 | ) | — | (5,062 | ) | |||||||
Morgan Stanley Custom Swap (MSCMS816) Index(3) | 3,730 | — | 3,730 | |||||||||
Morgan Stanley Custom Swap (MSCMS817) Index(3) | 2,776 | — | 2,776 | |||||||||
Morgan Stanley Custom Swap (MSCMS818) Index(3) | (8,065 | ) | — | (8,065 | ) | |||||||
Morgan Stanley Custom Swap (MSCMS819) Index(3) | (17,204 | ) | — | (17,204 | ) | |||||||
Morgan Stanley Custom Swap (MSCMS820) Index(3) | (16,480 | ) | — | (16,480 | ) | |||||||
Morgan Stanley Custom Swap (MSCMS821) Index(3) | 2,482 | — | 2,482 | |||||||||
Morgan Stanley Custom Swap (MSCMS822) Index(3) | (19,989 | ) | — | (19,989 | ) | |||||||
Morgan Stanley Custom Swap (MSCMS823) Index(3) | 1,642 | — | 1,642 | |||||||||
Morgan Stanley Custom Swap (MSCMS824) Index(3) | (4,057 | ) | — | (4,057 | ) | |||||||
Morgan Stanley Custom Swap (MSCMS825) Index(3) | (12,699 | ) | — | (12,699 | ) | |||||||
Morgan Stanley Custom Swap (MSCMS826) Index(3) | (5,440 | ) | — | (5,440 | ) | |||||||
Total Unrealized Appreciation | $ | 2,306,135 | ||||||||||
Total Unrealized (Depreciation) | $ | (334,570 | ) | |||||||||
Total | $ | 1,971,565 | $ | — | $ | 1,971,565 | ||||||
(1) | Paid monthly. |
(2) | Morgan Stanley acts as the counterparty to the total return swap contracts listed above. The Fund either receives fees from, or pays fees to, the counterparty, depending upon the total return of the benchmark, and the agreed -upon floating rate financing rate. |
(3) | See the tables below for the swap constituents. |
See accompanying notes to financial statements. | CRM Funds | |
53 | ||
CRM FUNDS CRM LONG/SHORT OPPORTUNITIES FUND SCHEDULE OF INVESTMENTS (Continued) June 30, 2023 |
The following table represents the individual positions and related values of underlying securities of Morgan Stanley Custom Basket (MSCMS807) Index total return swap with Morgan Stanley Bank as of June 30, 2023, termination date 8/1/23:
Reference Entity | Shares | Market | % of Total | |||||||||
Ford Motor Company | 4,443 | $ | 67,225 | 8.25 | % | |||||||
General Motors Company | 1,630 | 62,835 | 7.71 | % | ||||||||
Cardinal Health, Inc. | 645 | 60,999 | 7.49 | % | ||||||||
HCA Healthcare, Inc. | 201 | 60,960 | 7.48 | % | ||||||||
West Company, Inc. | 158 | 60,257 | 7.40 | % | ||||||||
Steris Corporation | 266 | 59,804 | 7.34 | % | ||||||||
ON Semiconductor Corporation | 612 | 57,863 | 7.10 | % | ||||||||
Blackstone, Inc. | 617 | 57,407 | 7.05 | % | ||||||||
CDW Corporation | 311 | 56,981 | 7.00 | % | ||||||||
Amgen, Inc. | 251 | 55,753 | 6.85 | % | ||||||||
Agilent Technologies, Inc. | 463 | 55,654 | 6.83 | % | ||||||||
AT&T, Inc. | 3,403 | 54,284 | 6.67 | % | ||||||||
Marvell Technology, Inc. | 881 | 52,645 | 6.46 | % | ||||||||
Pfizer, Inc. | 1,415 | 51,911 | 6.37 | % | ||||||||
| $ | 814,578 | 100.00 | % | |||||||||
The following table represents the individual positions and related values of underlying securities of Morgan Stanley Custom Basket (MSCMS808) Index total return swap with Morgan Stanley Bank as of June 30, 2023, termination date 8/1/23:
Reference Entity | Shares | Market | % of Total | |||||||||
Cardinal Health, Inc. | 360 | $ | 34,014 | 4.37 | % | |||||||
West Company, Inc. | 89 | 33,853 | 4.35 | % | ||||||||
HCA Healthcare, Inc. | 111 | 33,665 | 4.32 | % | ||||||||
Steris Corporation | 148 | 33,313 | 4.28 | % | ||||||||
Ecolab, Inc. | 176 | 32,813 | 4.21 | % | ||||||||
Eaton Corporation PLC | 163 | 32,809 | 4.21 | % | ||||||||
Church & Dwight Company, Inc. | 324 | 32,506 | 4.17 | % | ||||||||
AT&T, Inc. | 2,000 | 31,904 | 4.10 | % | ||||||||
Motorola Solutions, Inc. | 108 | 31,559 | 4.05 | % | ||||||||
Cognizant Technology Solutions Corporation | 477 | 31,149 | 4.00 | % | ||||||||
Sysco Corporation | 419 | 31,077 | 3.99 | % | ||||||||
Darden Restaurants, Inc. | 185 | 30,988 | 3.98 | % | ||||||||
Agilent Technologies, Inc. | 257 | 30,946 | 3.97 | % | ||||||||
PepsiCo, Inc. | 165 | 30,616 | 3.93 | % | ||||||||
Constellation Brands, Inc. | 124 | 30,512 | 3.92 | % | ||||||||
See accompanying notes to financial statements. | CRM Funds | |
54 | ||
CRM FUNDS CRM LONG/SHORT OPPORTUNITIES FUND SCHEDULE OF INVESTMENTS (Continued) June 30, 2023 |
Reference Entity | Shares | Market | % of Total | |||||||||
Realty Income Corporation | 510 | $ | 30,470 | 3.91 | % | |||||||
Kellogg Company | 451 | 30,429 | 3.91 | % | ||||||||
Canadian Imperial Bank of Commerce | 712 | 30,388 | 3.90 | % | ||||||||
International Flavors & Fragrances, Inc. | 380 | 30,249 | 3.88 | % | ||||||||
Hormel Foods Corporation | 746 | 30,014 | 3.85 | % | ||||||||
McCormick & Company, Inc. | 344 | 30,001 | 3.85 | % | ||||||||
Mettler-Toledo International, Inc. | 23 | 29,944 | 3.84 | % | ||||||||
Hershey Company (The) | 117 | 29,117 | 3.74 | % | ||||||||
Pfizer, Inc. | 793 | 29,092 | 3.73 | % | ||||||||
General Mills, Inc. | 360 | 27,586 | 3.54 | % | ||||||||
| $ | 779,014 | 100.00 | % | |||||||||
The following table represents the individual positions and related values of underlying securities of Morgan Stanley Custom Basket (MSCMS809) Index total return swap with Morgan Stanley Bank as of June 30, 2023, termination date 8/1/23:
Reference Entity | Shares | Market | % of Total | |||||||||
Align Technology, Inc. | 118 | $ | 41,748 | 5.46 | % | |||||||
West Company, Inc. | 105 | 40,122 | 5.25 | % | ||||||||
Albemarle Corporation | 175 | 38,980 | 5.10 | % | ||||||||
Dollar General Corporation | 227 | 38,498 | 5.03 | % | ||||||||
Lululemon Athletica, Inc. | 101 | 38,253 | 5.00 | % | ||||||||
Extra Space Storage, Inc. | 249 | 37,124 | 4.86 | % | ||||||||
Sysco Corporation | 497 | 36,848 | 4.82 | % | ||||||||
Kroger Company (The) | 781 | 36,687 | 4.80 | % | ||||||||
Constellation Brands, Inc. | 148 | 36,313 | 4.75 | % | ||||||||
PepsiCo, Inc. | 196 | 36,225 | 4.74 | % | ||||||||
International Flavors & Fragrances, Inc. | 452 | 36,006 | 4.71 | % | ||||||||
Kellogg Company | 534 | 35,970 | 4.70 | % | ||||||||
Realty Income Corporation | 600 | 35,904 | 4.70 | % | ||||||||
Hormel Foods Corporation | 888 | 35,722 | 4.67 | % | ||||||||
Prologis, Inc. | 289 | 35,446 | 4.64 | % | ||||||||
McCormick & Company, Inc. | 406 | 35,403 | 4.63 | % | ||||||||
CVS Health Corporation | 509 | 35,204 | 4.60 | % | ||||||||
Hershey Company (The) | 139 | 34,666 | 4.53 | % | ||||||||
Pfizer, Inc. | 932 | 34,188 | 4.47 | % | ||||||||
Walgreens Boots Alliance, Inc. | 1,153 | 32,842 | 4.30 | % | ||||||||
General Mills, Inc. | 423 | 32,415 | 4.24 | % | ||||||||
| $ | 764,564 | 100.00 | % | |||||||||
See accompanying notes to financial statements. | CRM Funds | |
55 | ||
CRM FUNDS CRM LONG/SHORT OPPORTUNITIES FUND SCHEDULE OF INVESTMENTS (Continued) June 30, 2023 |
The following table represents the individual positions and related values of underlying securities of Morgan Stanley Custom Basket (MSCMS810) Index total return swap with Morgan Stanley Bank as of June 30, 2023, termination date 8/1/23:
Reference Entity | Shares | Market | % of Total | |||||||||
Align Technology, Inc. | 191 | $ | 67,570 | 8.49 | % | |||||||
HCA Healthcare, Inc. | 215 | 65,147 | 8.18 | % | ||||||||
West Company, Inc. | 168 | 64,316 | 8.08 | % | ||||||||
Caterpillar, Inc. | 257 | 63,190 | 7.94 | % | ||||||||
Steris Corporation | 281 | 63,180 | 7.94 | % | ||||||||
Dollar General Corporation | 371 | 62,910 | 7.90 | % | ||||||||
Albemarle Corporation | 273 | 60,942 | 7.65 | % | ||||||||
Extra Space Storage, Inc. | 406 | 60,462 | 7.59 | % | ||||||||
Agilent Technologies, Inc. | 496 | 59,608 | 7.49 | % | ||||||||
Amgen, Inc. | 263 | 58,426 | 7.34 | % | ||||||||
Realty Income Corporation | 970 | 58,002 | 7.28 | % | ||||||||
Prologis, Inc. | 463 | 56,735 | 7.13 | % | ||||||||
Pfizer, Inc. | 1,517 | 55,651 | 6.99 | % | ||||||||
| $ | 796,139 | 100.00 | % | |||||||||
The following table represents the individual positions and related values of underlying securities of Morgan Stanley Custom Basket (MSCMS811) Index total return swap with Morgan Stanley Bank as of June 30, 2023, termination date 8/1/23:
Reference Entity | Shares | Market | % of Total | |||||||||
Ulta Beauty, Inc. | 181 | $ | 85,185 | 11.15 | % | |||||||
Lululemon Athletica, Inc. | 213 | 80,442 | 10.53 | % | ||||||||
Caterpillar, Inc. | 319 | 78,573 | 10.29 | % | ||||||||
Agilent Technologies, Inc. | 645 | 77,581 | 10.16 | % | ||||||||
Albemarle Corporation | 344 | 76,688 | 10.04 | % | ||||||||
Extra Space Storage, Inc. | 503 | 74,893 | 9.81 | % | ||||||||
International Flavors & Fragrances, Inc. | 926 | 73,729 | 9.65 | % | ||||||||
Realty Income Corporation | 1,233 | 73,728 | 9.65 | % | ||||||||
Prologis, Inc. | 587 | 72,030 | 9.43 | % | ||||||||
Pfizer, Inc. | 1,934 | 70,945 | 9.29 | % | ||||||||
| $ | 763,794 | 100.00 | % | |||||||||
See accompanying notes to financial statements. | CRM Funds | |
56 | ||
CRM FUNDS CRM LONG/SHORT OPPORTUNITIES FUND SCHEDULE OF INVESTMENTS (Continued) June 30, 2023 |
The following table represents the individual positions and related values of underlying securities of Morgan Stanley Custom Basket (MSCMS812) Index total return swap with Morgan Stanley Bank as of June 30, 2023, termination date 8/1/23:
Reference Entity | Shares | Market | % of Total | |||||||||
Ulta Beauty, Inc. | 150 | $ | 70,441 | 8.93 | % | |||||||
Genuine Parts Company | 407 | 68,843 | 8.72 | % | ||||||||
PACCAR, Inc. | 817 | 68,381 | 8.66 | % | ||||||||
Cummins, Inc. | 276 | 67,755 | 8.59 | % | ||||||||
Eaton Corporation PLC | 334 | 67,142 | 8.51 | % | ||||||||
Lululemon Athletica, Inc. | 177 | 66,869 | 8.47 | % | ||||||||
Caterpillar, Inc. | 267 | 65,811 | 8.34 | % | ||||||||
Extra Space Storage, Inc. | 429 | 63,867 | 8.09 | % | ||||||||
Albemarle Corporation | 286 | 63,699 | 8.07 | % | ||||||||
Tractor Supply Company | 286 | 63,180 | 8.01 | % | ||||||||
Realty Income Corporation | 1,030 | 61,606 | 7.81 | % | ||||||||
Prologis, Inc. | 502 | 61,564 | 7.80 | % | ||||||||
| $ | 789,158 | 100.00 | % | |||||||||
The following table represents the individual positions and related values of underlying securities of Morgan Stanley Custom Basket (MSCMS813) Index total return swap with Morgan Stanley Bank as of June 30, 2023, termination date 8/1/23:
Reference Entity | Shares | Market | % of Total | |||||||||
Old Dominion Freight Line, Inc. | 79 | $ | 29,305 | 3.70 | % | |||||||
HCA Healthcare, Inc. | 89 | 27,097 | 3.42 | % | ||||||||
Ulta Beauty, Inc. | 57 | 26,959 | 3.40 | % | ||||||||
West Company, Inc. | 70 | 26,650 | 3.37 | % | ||||||||
Cardinal Health, Inc. | 280 | 26,449 | 3.34 | % | ||||||||
PACCAR, Inc. | 316 | 26,422 | 3.34 | % | ||||||||
Steris Corporation | 117 | 26,378 | 3.33 | % | ||||||||
Genuine Parts Company | 156 | 26,356 | 3.33 | % | ||||||||
Cummins, Inc. | 107 | 26,252 | 3.31 | % | ||||||||
Rockwell Automation, Inc. | 79 | 26,170 | 3.30 | % | ||||||||
Eaton Corporation PLC | 130 | 26,056 | 3.29 | % | ||||||||
Emerson Electric Company | 288 | 26,052 | 3.29 | % | ||||||||
ON Semiconductor Corporation | 273 | 25,783 | 3.26 | % | ||||||||
Blackstone, Inc. | 275 | 25,583 | 3.23 | % | ||||||||
United Parcel Service - Class B | 142 | 25,515 | 3.22 | % | ||||||||
Lululemon Athletica, Inc. | 67 | 25,487 | 3.22 | % | ||||||||
Caterpillar, Inc. | 103 | 25,406 | 3.21 | % | ||||||||
See accompanying notes to financial statements. | CRM Funds | |
57 | ||
CRM FUNDS CRM LONG/SHORT OPPORTUNITIES FUND SCHEDULE OF INVESTMENTS (Continued) June 30, 2023 |
Reference Entity | Shares | Market | % of Total | |||||||||
Target Corporation | 191 | $ | 25,206 | 3.18 | % | |||||||
Agilent Technologies, Inc. | 210 | 25,202 | 3.18 | % | ||||||||
LyondellBasell Industries N.V. - Class A | 273 | 25,034 | 3.16 | % | ||||||||
Extra Space Storage, Inc. | 168 | 24,998 | 3.16 | % | ||||||||
Sysco Corporation | 335 | 24,823 | 3.13 | % | ||||||||
Automatic Data Processing, Inc. | 113 | 24,783 | 3.13 | % | ||||||||
Constellation Brands, Inc. | 100 | 24,722 | 3.12 | % | ||||||||
Tractor Supply Company | 112 | 24,701 | 3.12 | % | ||||||||
Amgen, Inc. | 111 | 24,629 | 3.11 | % | ||||||||
Albemarle Corporation | 110 | 24,553 | 3.10 | % | ||||||||
Prologis, Inc. | 200 | 24,532 | 3.10 | % | ||||||||
AT&T, Inc. | 1,521 | 24,268 | 3.06 | % | ||||||||
Realty Income Corporation | 398 | 23,822 | 3.01 | % | ||||||||
Pfizer, Inc. | 623 | 22,842 | 2.88 | % | ||||||||
| $ | 792,035 | 100.00 | % | |||||||||
The following table represents the individual positions and related values of underlying securities of Morgan Stanley Custom Basket (MSCMS814) Index total return swap with Morgan Stanley Bank as of June 30, 2023, termination date 8/1/23:
Reference Entity | Shares | Market | % of Total | |||||||||
Old Dominion Freight Line, Inc. | 98 | $ | 36,345 | 4.62 | % | |||||||
Ulta Beauty, Inc. | 71 | 33,328 | 4.23 | % | ||||||||
HCA Healthcare, Inc. | 109 | 33,059 | 4.20 | % | ||||||||
Ford Motor Company | 2,184 | 33,040 | 4.20 | % | ||||||||
Cardinal Health, Inc. | 345 | 32,643 | 4.15 | % | ||||||||
Steris Corporation | 145 | 32,566 | 4.14 | % | ||||||||
Genuine Parts Company | 190 | 32,204 | 4.09 | % | ||||||||
West Company, Inc. | 84 | 32,204 | 4.09 | % | ||||||||
Rockwell Automation, Inc. | 97 | 32,003 | 4.06 | % | ||||||||
CDW Corporation | 174 | 31,869 | 4.05 | % | ||||||||
Target Corporation | 238 | 31,381 | 3.98 | % | ||||||||
ON Semiconductor Corporation | 330 | 31,255 | 3.97 | % | ||||||||
Blackstone, Inc. | 335 | 31,123 | 3.95 | % | ||||||||
Caterpillar, Inc. | 126 | 31,123 | 3.95 | % | ||||||||
Cognizant Technology Solutions Corporation | 475 | 31,023 | 3.94 | % | ||||||||
Lululemon Athletica, Inc. | 82 | 30,935 | 3.93 | % | ||||||||
Prologis, Inc. | 252 | 30,849 | 3.92 | % | ||||||||
Extra Space Storage, Inc. | 207 | 30,812 | 3.91 | % | ||||||||
Amgen, Inc. | 138 | 30,737 | 3.90 | % | ||||||||
Albemarle Corporation | 138 | 30,717 | 3.90 | % | ||||||||
See accompanying notes to financial statements. | CRM Funds | |
58 | ||
CRM FUNDS CRM LONG/SHORT OPPORTUNITIES FUND SCHEDULE OF INVESTMENTS (Continued) June 30, 2023 |
Reference Entity | Shares | Market | % of Total | |||||||||
Agilent Technologies, Inc. | 254 | $ | 30,526 | 3.88 | % | |||||||
Tractor Supply Company | 137 | 30,314 | 3.85 | % | ||||||||
AT&T, Inc. | 1,889 | 30,130 | 3.83 | % | ||||||||
Realty Income Corporation | 494 | 29,510 | 3.75 | % | ||||||||
Pfizer, Inc. | 754 | 27,664 | 3.51 | % | ||||||||
| $ | 787,360 | 100.00 | % | |||||||||
The following table represents the individual positions and related values of underlying securities of Morgan Stanley Custom Basket (MSCMS815) Index total return swap with Morgan Stanley Bank as of June 30, 2023, termination date 8/1/23:
Reference Entity | Shares | Market | % of Total | |||||||||
Ulta Beauty, Inc. | 189 | $ | 88,798 | 11.72 | % | |||||||
ON Semiconductor Corporation | 904 | 85,459 | 11.28 | % | ||||||||
Extra Space Storage, Inc. | 574 | 85,432 | 11.27 | % | ||||||||
Prologis, Inc. | 690 | 84,617 | 11.16 | % | ||||||||
AT&T, Inc. | 5,293 | 84,421 | 11.14 | % | ||||||||
Agilent Technologies, Inc. | 701 | 84,259 | 11.12 | % | ||||||||
Amgen, Inc. | 377 | 83,745 | 11.05 | % | ||||||||
Realty Income Corporation | 1,368 | 81,817 | 10.79 | % | ||||||||
Marvell Technology, Inc. | 1,328 | 79,391 | 10.47 | % | ||||||||
| $ | 757,939 | 100.00 | % | |||||||||
The following table represents the individual positions and related values of underlying securities of Morgan Stanley Custom Basket (MSCMS816) Index total return swap with Morgan Stanley Bank as of June 30, 2023, termination date 8/1/23:
Reference Entity | Shares | Market | % of Total | |||||||||
CDW Corporation | 473 | $ | 86,738 | 11.63 | % | |||||||
Extra Space Storage, Inc. | 582 | 86,687 | 11.62 | % | ||||||||
Agilent Technologies, Inc. | 699 | 84,061 | 11.27 | % | ||||||||
Prologis, Inc. | 683 | 83,712 | 11.22 | % | ||||||||
Amgen, Inc. | 376 | 83,369 | 11.18 | % | ||||||||
Target Corporation | 626 | 82,633 | 11.08 | % | ||||||||
Realty Income Corporation | 1,364 | 81,570 | 10.94 | % | ||||||||
Marvell Technology, Inc. | 1,326 | 79,251 | 10.63 | % | ||||||||
Pfizer, Inc. | 2,121 | 77,784 | 10.43 | % | ||||||||
| $ | 745,805 | 100.00 | % | |||||||||
See accompanying notes to financial statements. | CRM Funds | |
59 | ||
CRM FUNDS CRM LONG/SHORT OPPORTUNITIES FUND SCHEDULE OF INVESTMENTS (Continued) June 30, 2023 |
The following table represents the individual positions and related values of underlying securities of Morgan Stanley Custom Basket (MSCMS817) Index total return swap with Morgan Stanley Bank as of June 30, 2023, termination date 8/1/23:
Reference Entity | Shares | Market | % of Total | |||||||||
ON Semiconductor Corporation | 924 | $ | 87,351 | 11.53 | % | |||||||
CDW Corporation | 472 | 86,544 | 11.42 | % | ||||||||
Extra Space Storage, Inc. | 577 | 85,814 | 11.33 | % | ||||||||
General Motors Company | 2,210 | 85,216 | 11.25 | % | ||||||||
Prologis, Inc. | 690 | 84,673 | 11.17 | % | ||||||||
Agilent Technologies, Inc. | 693 | 83,365 | 11.00 | % | ||||||||
Realty Income Corporation | 1,373 | 82,068 | 10.83 | % | ||||||||
Amgen, Inc. | 368 | 81,682 | 10.78 | % | ||||||||
Marvell Technology, Inc. | 1,355 | 80,996 | 10.69 | % | ||||||||
| $ | 757,709 | 100.00 | % | |||||||||
The following table represents the individual positions and related values of underlying securities of Morgan Stanley Custom Basket (MSCMS818) Index total return swap with Morgan Stanley Bank as of June 30, 2023, termination date 8/1/23:
Reference Entity | Shares | Market | % of Total | |||||||||
Ford Motor Company | 7,490 | $ | 113,318 | 14.93 | % | |||||||
Extra Space Storage, Inc. | 743 | 110,654 | 14.58 | % | ||||||||
General Motors Company | 2,845 | 109,707 | 14.45 | % | ||||||||
Prologis, Inc. | 881 | 108,000 | 14.23 | % | ||||||||
Target Corporation | 807 | 106,458 | 14.03 | % | ||||||||
Marvell Technology, Inc. | 1,767 | 105,632 | 13.92 | % | ||||||||
Realty Income Corporation | 1,759 | 105,185 | 13.86 | % | ||||||||
| $ | 758,954 | 100.00 | % | |||||||||
The following table represents the individual positions and related values of underlying securities of Morgan Stanley Custom Basket (MSCMS819) Index total return swap with Morgan Stanley Bank as of June 30, 2023, termination date 8/1/23:
Reference Entity | Shares | Market | % of Total | |||||||||
Old Dominion Freight Line, Inc. | 37 | $ | 13,634 | 1.77 | % | |||||||
W. W. Grainger, Inc. | 16 | 12,759 | 1.65 | % | ||||||||
PACCAR, Inc. | 152 | 12,716 | 1.65 | % | ||||||||
Sherwin-Williams Company (The) | 48 | 12,638 | 1.64 | % | ||||||||
See accompanying notes to financial statements. | CRM Funds | |
60 | ||
CRM FUNDS CRM LONG/SHORT OPPORTUNITIES FUND SCHEDULE OF INVESTMENTS (Continued) June 30, 2023 |
Reference Entity | Shares | Market | % of Total | |||||||||
Ford Motor Company | 831 | $ | 12,578 | 1.63 | % | |||||||
HCA Healthcare, Inc. | 41 | 12,575 | 1.63 | % | ||||||||
Church & Dwight Company, Inc. | 125 | 12,548 | 1.63 | % | ||||||||
Genuine Parts Company | 74 | 12,536 | 1.62 | % | ||||||||
ON Semiconductor Corporation | 132 | 12,510 | 1.62 | % | ||||||||
Ulta Beauty, Inc. | 26 | 12,444 | 1.61 | % | ||||||||
Cummins, Inc. | 51 | 12,432 | 1.61 | % | ||||||||
Motorola Solutions, Inc. | 42 | 12,422 | 1.61 | % | ||||||||
Apple, Inc. | 64 | 12,394 | 1.61 | % | ||||||||
Rockwell Automation, Inc. | 37 | 12,349 | 1.60 | % | ||||||||
Emerson Electric Company | 136 | 12,314 | 1.60 | % | ||||||||
O’Reilly Automotive, Inc. | 13 | 12,309 | 1.59 | % | ||||||||
Fastenal Company | 208 | 12,288 | 1.59 | % | ||||||||
Cardinal Health, Inc. | 130 | 12,253 | 1.59 | % | ||||||||
Costco Wholesale Corporation | 23 | 12,247 | 1.59 | % | ||||||||
Eaton Corporation PLC | 61 | 12,240 | 1.59 | % | ||||||||
CDW Corporation | 67 | 12,235 | 1.59 | % | ||||||||
Ecolab, Inc. | 65 | 12,220 | 1.58 | % | ||||||||
General Motors Company | 317 | 12,215 | 1.58 | % | ||||||||
Home Depot, Inc. (The) | 39 | 12,184 | 1.58 | % | ||||||||
Dollar General Corporation | 72 | 12,165 | 1.58 | % | ||||||||
Kellogg Company | 180 | 12,154 | 1.57 | % | ||||||||
LyondellBasell Industries N.V. - Class A | 132 | 12,136 | 1.57 | % | ||||||||
Cintas Corporation | 24 | 12,130 | 1.57 | % | ||||||||
Blackstone, Inc. | 130 | 12,128 | 1.57 | % | ||||||||
Kroger Company (The) | 258 | 12,124 | 1.57 | % | ||||||||
Sysco Corporation | 163 | 12,102 | 1.57 | % | ||||||||
Moody’s Corporation | 35 | 12,084 | 1.57 | % | ||||||||
Mettler-Toledo International, Inc. | 9 | 12,078 | 1.57 | % | ||||||||
Caterpillar, Inc. | 49 | 12,062 | 1.56 | % | ||||||||
Tractor Supply Company | 54 | 12,045 | 1.56 | % | ||||||||
Restaurant Brands International, Inc. | 155 | 12,039 | 1.56 | % | ||||||||
McDonald’s Corporation | 40 | 12,038 | 1.56 | % | ||||||||
Agilent Technologies, Inc. | 100 | 12,031 | 1.56 | % | ||||||||
Discover Financial Services | 102 | 11,957 | 1.55 | % | ||||||||
United Parcel Service - Class B | 67 | 11,954 | 1.55 | % | ||||||||
AT&T, Inc. | 749 | 11,949 | 1.55 | % | ||||||||
Cognizant Technology Solutions Corporation | 183 | 11,939 | 1.55 | % | ||||||||
Constellation Brands, Inc. | 49 | 11,938 | 1.55 | % | ||||||||
Darden Restaurants, Inc. | 71 | 11,912 | 1.54 | % | ||||||||
CVS Health Corporation | 172 | 11,901 | 1.54 | % | ||||||||
International Flavors & Fragrances, Inc. | 149 | 11,879 | 1.54 | % | ||||||||
Allstate Corporation (The) | 109 | 11,869 | 1.54 | % | ||||||||
See accompanying notes to financial statements. | CRM Funds | |
61 | ||
CRM FUNDS CRM LONG/SHORT OPPORTUNITIES FUND SCHEDULE OF INVESTMENTS (Continued) June 30, 2023 |
Reference Entity | Shares | Market | % of Total | |||||||||
Capital One Financial Corporation | 108 | $ | 11,849 | 1.54 | % | |||||||
PepsiCo, Inc. | 64 | 11,816 | 1.53 | % | ||||||||
General Dynamics Corporation | 55 | 11,803 | 1.53 | % | ||||||||
Automatic Data Processing, Inc. | 54 | 11,796 | 1.53 | % | ||||||||
Target Corporation | 89 | 11,749 | 1.52 | % | ||||||||
Canadian Imperial Bank of Commerce | 274 | 11,690 | 1.51 | % | ||||||||
Lululemon Athletica, Inc. | 31 | 11,668 | 1.51 | % | ||||||||
Hologic, Inc. | 144 | 11,668 | 1.51 | % | ||||||||
Hormel Foods Corporation | 290 | 11,660 | 1.51 | % | ||||||||
Marvell Technology, Inc. | 194 | 11,618 | 1.51 | % | ||||||||
Starbucks Corporation | 117 | 11,564 | 1.50 | % | ||||||||
Amgen, Inc. | 52 | 11,482 | 1.49 | % | ||||||||
Hershey Company (The) | 46 | 11,421 | 1.48 | % | ||||||||
Albemarle Corporation | 51 | 11,357 | 1.47 | % | ||||||||
General Mills, Inc. | 147 | 11,244 | 1.46 | % | ||||||||
McCormick & Company, Inc. | 127 | 11,096 | 1.44 | % | ||||||||
Walgreens Boots Alliance, Inc. | 365 | 10,398 | 1.35 | % | ||||||||
| $ | 771,533 | 100.00 | % | |||||||||
The following table represents the individual positions and related values of underlying securities of Morgan Stanley Custom Basket (MSCMS820) Index total return swap with Morgan Stanley Bank as of June 30, 2023, termination date 8/1/23:
Reference Entity | Shares | Market | % of Total | |||||||||
Old Dominion Freight Line, Inc. | 36 | $ | 13,256 | 1.71 | % | |||||||
Ford Motor Company | 835 | 12,638 | 1.63 | % | ||||||||
ON Semiconductor Corporation | 133 | 12,576 | 1.62 | % | ||||||||
Sherwin-Williams Company (The) | 47 | 12,575 | 1.62 | % | ||||||||
PACCAR, Inc. | 149 | 12,476 | 1.61 | % | ||||||||
W. W. Grainger, Inc. | 16 | 12,444 | 1.60 | % | ||||||||
Steris Corporation | 55 | 12,424 | 1.60 | % | ||||||||
HCA Healthcare, Inc. | 41 | 12,384 | 1.59 | % | ||||||||
Apple, Inc. | 64 | 12,348 | 1.59 | % | ||||||||
Cummins, Inc. | 50 | 12,309 | 1.58 | % | ||||||||
Genuine Parts Company | 73 | 12,274 | 1.58 | % | ||||||||
Ulta Beauty, Inc. | 26 | 12,242 | 1.58 | % | ||||||||
Motorola Solutions, Inc. | 42 | 12,216 | 1.57 | % | ||||||||
Blackstone, Inc. | 131 | 12,215 | 1.57 | % | ||||||||
General Motors Company | 316 | 12,201 | 1.57 | % | ||||||||
Church & Dwight Company, Inc. | 122 | 12,182 | 1.57 | % | ||||||||
CDW Corporation | 66 | 12,160 | 1.56 | % | ||||||||
See accompanying notes to financial statements. | CRM Funds | |
62 | ||
CRM FUNDS CRM LONG/SHORT OPPORTUNITIES FUND SCHEDULE OF INVESTMENTS (Continued) June 30, 2023 |
Reference Entity | Shares | Market | % of Total | |||||||||
West Company, Inc. | 32 | $ | 12,142 | 1.56 | % | |||||||
Costco Wholesale Corporation | 23 | 12,134 | 1.56 | % | ||||||||
Emerson Electric Company | 134 | 12,104 | 1.56 | % | ||||||||
Cognizant Technology Solutions Corporation | 185 | 12,100 | 1.56 | % | ||||||||
Kellogg Company | 180 | 12,098 | 1.56 | % | ||||||||
Home Depot, Inc. (The) | 39 | 12,098 | 1.56 | % | ||||||||
Ecolab, Inc. | 65 | 12,094 | 1.56 | % | ||||||||
United Parcel Service - Class B | 67 | 12,090 | 1.56 | % | ||||||||
Eaton Corporation PLC | 60 | 12,087 | 1.56 | % | ||||||||
Kroger Company (The) | 256 | 12,049 | 1.55 | % | ||||||||
Cardinal Health, Inc. | 127 | 12,039 | 1.55 | % | ||||||||
Rockwell Automation, Inc. | 37 | 12,028 | 1.55 | % | ||||||||
Moody’s Corporation | 35 | 12,028 | 1.55 | % | ||||||||
LyondellBasell Industries N.V. - Class A | 131 | 12,024 | 1.55 | % | ||||||||
Fastenal Company | 203 | 11,985 | 1.54 | % | ||||||||
Sysco Corporation | 161 | 11,969 | 1.54 | % | ||||||||
AT&T, Inc. | 750 | 11,966 | 1.54 | % | ||||||||
Cintas Corporation | 24 | 11,965 | 1.54 | % | ||||||||
Restaurant Brands International, Inc. | 154 | 11,934 | 1.54 | % | ||||||||
Caterpillar, Inc. | 48 | 11,932 | 1.54 | % | ||||||||
O’Reilly Automotive, Inc. | 12 | 11,928 | 1.54 | % | ||||||||
Dollar General Corporation | 70 | 11,902 | 1.53 | % | ||||||||
Agilent Technologies, Inc. | 99 | 11,901 | 1.53 | % | ||||||||
Marvell Technology, Inc. | 199 | 11,896 | 1.53 | % | ||||||||
Mettler-Toledo International, Inc. | 9 | 11,889 | 1.53 | % | ||||||||
McDonald’s Corporation | 40 | 11,865 | 1.53 | % | ||||||||
Allstate Corporation (The) | 109 | 11,853 | 1.53 | % | ||||||||
Capital One Financial Corporation | 108 | 11,829 | 1.52 | % | ||||||||
CVS Health Corporation | 170 | 11,772 | 1.51 | % | ||||||||
Discover Financial Services | 101 | 11,766 | 1.51 | % | ||||||||
Darden Restaurants, Inc. | 70 | 11,758 | 1.51 | % | ||||||||
Tractor Supply Company | 53 | 11,745 | 1.51 | % | ||||||||
Constellation Brands, Inc. | 48 | 11,704 | 1.51 | % | ||||||||
Lululemon Athletica, Inc. | 31 | 11,701 | 1.51 | % | ||||||||
PepsiCo, Inc. | 63 | 11,697 | 1.51 | % | ||||||||
Automatic Data Processing, Inc. | 53 | 11,670 | 1.50 | % | ||||||||
Hologic, Inc. | 144 | 11,645 | 1.50 | % | ||||||||
Canadian Imperial Bank of Commerce | 272 | 11,629 | 1.50 | % | ||||||||
Target Corporation | 88 | 11,595 | 1.49 | % | ||||||||
General Dynamics Corporation | 54 | 11,583 | 1.49 | % | ||||||||
Hormel Foods Corporation | 288 | 11,578 | 1.49 | % | ||||||||
Amgen, Inc. | 52 | 11,452 | 1.47 | % | ||||||||
Starbucks Corporation | 115 | 11,388 | 1.47 | % | ||||||||
See accompanying notes to financial statements. | CRM Funds | |
63 | ||
CRM FUNDS CRM LONG/SHORT OPPORTUNITIES FUND SCHEDULE OF INVESTMENTS (Continued) June 30, 2023 |
Reference Entity | Shares | Market | % of Total | |||||||||
Albemarle Corporation | 51 | $ | 11,340 | 1.46 | % | |||||||
Hershey Company (The) | 45 | 11,295 | 1.45 | % | ||||||||
General Mills, Inc. | 144 | 11,037 | 1.42 | % | ||||||||
McCormick & Company, Inc. | 126 | 10,948 | 1.41 | % | ||||||||
Walgreens Boots Alliance, Inc. | 371 | 10,572 | 1.36 | % | ||||||||
| $ | 776,724 | 100.00 | % | |||||||||
The following table represents the individual positions and related values of underlying securities of Morgan Stanley Custom Basket (MSCMS821) Index total return swap with Morgan Stanley Bank as of June 30, 2023, termination date 8/1/23:
Reference Entity | Shares | Market | % of Total | |||||||||
Align Technology, Inc. | 163 | $ | 57,598 | 7.59 | % | |||||||
Extra Space Storage, Inc. | 380 | 56,609 | 7.46 | % | ||||||||
Prologis, Inc. | 459 | 56,287 | 7.41 | % | ||||||||
Kellogg Company | 831 | 56,001 | 7.38 | % | ||||||||
Sysco Corporation | 744 | 55,178 | 7.27 | % | ||||||||
Realty Income Corporation | 916 | 54,757 | 7.21 | % | ||||||||
Constellation Brands, Inc. | 222 | 54,655 | 7.20 | % | ||||||||
Target Corporation | 411 | 54,263 | 7.15 | % | ||||||||
Hormel Foods Corporation | 1,341 | 53,941 | 7.11 | % | ||||||||
PepsiCo, Inc. | 291 | 53,845 | 7.09 | % | ||||||||
Hershey Company (The) | 209 | 52,244 | 6.88 | % | ||||||||
Pfizer, Inc. | 1,406 | 51,582 | 6.80 | % | ||||||||
General Mills, Inc. | 670 | 51,383 | 6.77 | % | ||||||||
McCormick & Company, Inc. | 581 | 50,677 | 6.68 | % | ||||||||
| $ | 759,020 | 100.00 | % | |||||||||
The following table represents the individual positions and related values of underlying securities of Morgan Stanley Custom Basket (MSCMS822) Index total return swap with Morgan Stanley Bank as of June 30, 2023, termination date 8/1/23:
Reference Entity | Shares | Market | % of Total | |||||||||
Old Dominion Freight Line, Inc. | 83 | $ | 30,710 | 3.94 | % | |||||||
Align Technology, Inc. | 83 | 29,175 | 3.74 | % | ||||||||
PACCAR, Inc. | 346 | 28,931 | 3.71 | % | ||||||||
United Parcel Service - Class B | 160 | 28,725 | 3.69 | % | ||||||||
Cummins, Inc. | 117 | 28,665 | 3.68 | % | ||||||||
Rockwell Automation, Inc. | 87 | 28,530 | 3.66 | % | ||||||||
See accompanying notes to financial statements. | CRM Funds | |
64 | ||
CRM FUNDS CRM LONG/SHORT OPPORTUNITIES FUND SCHEDULE OF INVESTMENTS (Continued) June 30, 2023 |
Reference Entity | Shares | Market | % of Total | |||||||||
Caterpillar, Inc. | 116 | $ | 28,472 | 3.65 | % | |||||||
Prologis, Inc. | 232 | 28,458 | 3.65 | % | ||||||||
Extra Space Storage, Inc. | 191 | 28,445 | 3.65 | % | ||||||||
Ecolab, Inc. | 152 | 28,429 | 3.65 | % | ||||||||
Emerson Electric Company | 313 | 28,290 | 3.63 | % | ||||||||
LyondellBasell Industries N.V. - Class A | 307 | 28,204 | 3.62 | % | ||||||||
Ulta Beauty, Inc. | 60 | 28,155 | 3.61 | % | ||||||||
Kellogg Company | 416 | 28,061 | 3.60 | % | ||||||||
Eaton Corporation PLC | 140 | 28,055 | 3.60 | % | ||||||||
Church & Dwight Company, Inc. | 279 | 27,997 | 3.59 | % | ||||||||
Sysco Corporation | 374 | 27,784 | 3.57 | % | ||||||||
Kroger Company (The) | 588 | 27,634 | 3.55 | % | ||||||||
Constellation Brands, Inc. | 112 | 27,548 | 3.54 | % | ||||||||
Albemarle Corporation | 123 | 27,487 | 3.53 | % | ||||||||
Tractor Supply Company | 124 | 27,426 | 3.52 | % | ||||||||
Target Corporation | 206 | 27,143 | 3.48 | % | ||||||||
PepsiCo, Inc. | 146 | 27,005 | 3.47 | % | ||||||||
Hormel Foods Corporation | 670 | 26,961 | 3.46 | % | ||||||||
Hershey Company (The) | 105 | 26,145 | 3.36 | % | ||||||||
Pfizer, Inc. | 708 | 25,981 | 3.33 | % | ||||||||
General Mills, Inc. | 334 | 25,587 | 3.28 | % | ||||||||
McCormick & Company, Inc. | 289 | 25,231 | 3.24 | % | ||||||||
| $ | 779,234 | 100.00 | % | |||||||||
The following table represents the individual positions and related values of underlying securities of Morgan Stanley Custom Basket (MSCMS823) Index total return swap with Morgan Stanley Bank as of June 30, 2023, termination date 8/1/23:
Reference Entity | Shares | Market | % of Total | |||||||||
United Parcel Service - Class B | 258 | $ | 46,241 | 6.10 | % | |||||||
Ecolab, Inc. | 247 | 46,119 | 6.09 | % | ||||||||
Church & Dwight Company, Inc. | 457 | 45,850 | 6.05 | % | ||||||||
Kellogg Company | 679 | 45,787 | 6.04 | % | ||||||||
Sysco Corporation | 616 | 45,692 | 6.03 | % | ||||||||
Constellation Brands, Inc. | 184 | 45,247 | 5.97 | % | ||||||||
Ulta Beauty, Inc. | 96 | 45,240 | 5.97 | % | ||||||||
Lululemon Athletica, Inc. | 119 | 45,129 | 5.95 | % | ||||||||
Starbucks Corporation | 454 | 44,941 | 5.93 | % | ||||||||
Kroger Company (The) | 955 | 44,899 | 5.92 | % | ||||||||
PepsiCo, Inc. | 241 | 44,644 | 5.89 | % | ||||||||
Albemarle Corporation | 198 | 44,143 | 5.82 | % | ||||||||
See accompanying notes to financial statements. | CRM Funds | |
65 | ||
CRM FUNDS CRM LONG/SHORT OPPORTUNITIES FUND SCHEDULE OF INVESTMENTS (Continued) June 30, 2023 |
Reference Entity | Shares | Market | % of Total | |||||||||
Hormel Foods Corporation | 1,093 | $ | 43,953 | 5.80 | % | |||||||
Target Corporation | 331 | 43,703 | 5.77 | % | ||||||||
Hershey Company (The) | 172 | 42,877 | 5.66 | % | ||||||||
General Mills, Inc. | 544 | 41,756 | 5.51 | % | ||||||||
McCormick & Company, Inc. | 478 | 41,670 | 5.50 | % | ||||||||
| $ | 757,891 | 100.00 | % | |||||||||
The following table represents the individual positions and related values of underlying securities of Morgan Stanley Custom Basket (MSCMS824) Index total return swap with Morgan Stanley Bank as of June 30, 2023, termination date 8/1/23:
Reference Entity | Shares | Market | % of Total | |||||||||
Cognizant Technology Solutions Corporation | 1,004 | $ | 65,559 | 8.67 | % | |||||||
CDW Corporation | 357 | 65,484 | 8.66 | % | ||||||||
ON Semiconductor Corporation | 690 | 65,270 | 8.63 | % | ||||||||
Sysco Corporation | 864 | 64,109 | 8.47 | % | ||||||||
Kellogg Company | 951 | 64,065 | 8.47 | % | ||||||||
Constellation Brands, Inc. | 257 | 63,179 | 8.35 | % | ||||||||
PepsiCo, Inc. | 340 | 63,060 | 8.33 | % | ||||||||
Hormel Foods Corporation | 1,566 | 62,977 | 8.32 | % | ||||||||
Marvell Technology, Inc. | 1,046 | 62,552 | 8.27 | % | ||||||||
Hershey Company (The) | 244 | 60,910 | 8.05 | % | ||||||||
General Mills, Inc. | 784 | 60,109 | 7.94 | % | ||||||||
McCormick & Company, Inc. | 680 | 59,307 | 7.84 | % | ||||||||
| $ | 756,581 | 100.00 | % | |||||||||
The following table represents the individual positions and related values of underlying securities of Morgan Stanley Custom Basket (MSCMS825) Index total return swap with Morgan Stanley Bank as of June 30, 2023, termination date 8/1/23:
Reference Entity | Shares | Market | % of Total | |||||||||
ON Semiconductor Corporation | 2,079 | $ | 196,605 | 25.46 | % | |||||||
Cognizant Technology Solutions Corporation | 2,992 | 195,315 | 25.29 | % | ||||||||
AT&T, Inc. | 12,015 | 191,642 | 24.82 | % | ||||||||
Marvell Technology, Inc. | 3,156 | 188,685 | 24.43 | % | ||||||||
| $ | 772,247 | 100.00 | % | |||||||||
See accompanying notes to financial statements. | CRM Funds | |
66 | ||
CRM FUNDS CRM LONG/SHORT OPPORTUNITIES FUND SCHEDULE OF INVESTMENTS (Concluded) June 30, 2023 |
The following table represents the individual positions and related values of underlying securities of Morgan Stanley Custom Basket (MSCMS826) Index total return swap with Morgan Stanley Bank as of June 30, 2023, termination date 8/1/23:
Reference Entity | Shares | Market | % of Total | |||||||||
Align Technology, Inc. | 278 | $ | 98,488 | 12.75 | % | |||||||
ON Semiconductor Corporation | 1,034 | 97,772 | 12.66 | % | ||||||||
Motorola Solutions, Inc. | 330 | 96,734 | 12.52 | % | ||||||||
CDW Corporation | 527 | 96,689 | 12.52 | % | ||||||||
Pfizer, Inc. | 2,635 | 96,663 | 12.51 | % | ||||||||
Cognizant Technology Solutions Corporation | 1,475 | 96,279 | 12.47 | % | ||||||||
AT&T, Inc. | 5,957 | 95,009 | 12.30 | % | ||||||||
Mettler-Toledo International, Inc. | 72 | 94,809 | 12.27 | % | ||||||||
| $ | 772,443 | 100.00 | % | |||||||||
See accompanying notes to financial statements. | CRM Funds | |
67 | ||
CRM FUNDS STATEMENTS OF ASSETS AND LIABILITIES June 30, 2023 |
CRM Small Cap | CRM Small/Mid | CRM Mid Cap | ||||||||||
ASSETS: | ||||||||||||
Investments in securities | ||||||||||||
Investments in securities, at cost | $ | 70,436,648 | $ | 192,814,230 | $ | 343,831,116 | ||||||
Net unrealized appreciation | 10,022,796 | 35,238,579 | 93,633,976 | |||||||||
Total investments in securities, at value1 | 80,459,444 | 228,052,809 | 437,465,092 | |||||||||
Receivable for securities sold | — | 1,661,176 | 2,665,262 | |||||||||
Dividends and interest receivable | 45,411 | 108,151 | 140,115 | |||||||||
Receivable for fund shares sold | 1,164 | 205,299 | 109,892 | |||||||||
Receivable for securities lending income | 60 | 445 | 614 | |||||||||
Other assets | 4,663 | 65,328 | 32,454 | |||||||||
Total Assets | 80,510,742 | 230,093,208 | 440,413,429 | |||||||||
LIABILITIES: | ||||||||||||
Obligation to return securities lending collateral | 2,168,959 | 6,913,650 | 22,261,577 | |||||||||
Payable for securities purchased | 691,115 | 2,589,284 | 4,714,495 | |||||||||
Payable for fund shares redeemed | 127,842 | 115,210 | 116,227 | |||||||||
Accrued advisory fee | 46,977 | 132,741 | 248,997 | |||||||||
Trustees fees payable | 1,928 | — | 1,594 | |||||||||
Audit and tax fees | 14,451 | 18,514 | 31,914 | |||||||||
Other accrued expenses | 33,909 | 64,657 | 150,689 | |||||||||
Total Liabilities | 3,085,181 | 9,834,056 | 27,525,493 | |||||||||
NET ASSETS | $ | 77,425,561 | $ | 220,259,152 | $ | 412,887,936 | ||||||
COMPONENTS OF NET ASSETS | ||||||||||||
Paid in capital | $ | 66,296,344 | $ | 186,912,892 | $ | 315,953,286 | ||||||
Total distributable earnings | 11,129,217 | 33,346,260 | 96,934,650 | |||||||||
NET ASSETS | $ | 77,425,561 | $ | 220,259,152 | $ | 412,887,936 | ||||||
NET ASSET VALUE PER SHARE | ||||||||||||
INVESTOR CLASS SHARES | ||||||||||||
Net assets | $ | 28,659,638 | $ | 23,017,644 | $ | 159,796,905 | ||||||
Shares of Beneficial Interest Outstanding ($0.01 par value, unlimited authorized shares) | 2,294,006 | 2,256,442 | 7,353,721 | |||||||||
Net asset value, offering and redemption price per share | $ | 12.49 | $ | 10.20 | $ | 21.73 | ||||||
INSTITUTIONAL CLASS SHARES | ||||||||||||
Net assets | $ | 48,765,923 | $ | 197,241,508 | $ | 253,091,031 | ||||||
Shares of Beneficial Interest Outstanding ($0.01 par value, unlimited authorized shares) | 3,139,801 | 18,470,790 | 11,006,101 | |||||||||
Net asset value, offering and redemption price per share | $ | 15.53 | $ | 10.68 | $ | 23.00 | ||||||
1 Includes securities loaned of: | $ | 2,079,882 | $ | 6,748,670 | $ | 22,226,430 | ||||||
See accompanying notes to financial statements. | CRM Funds | |
68 | ||
CRM FUNDS STATEMENTS OF ASSETS AND LIABILITIES June 30, 2023 |
CRM All Cap | CRM Long/Short | |||||||
ASSETS: | ||||||||
Investments in securities | ||||||||
Investments in securities, at cost | $ | 21,167,639 | $ | 220,605,674 | ||||
Net unrealized appreciation | 3,402,019 | 33,701,036 | ||||||
Total investments in securities, at value1 | 24,569,658 | 254,306,710 | ||||||
Cash pledged with broker for securities sold short | — | 110,359,063 | ||||||
Foreign currencies held with broker for securities sold short (cost $0 and $4,820,018, respectively) | — | 5,085,474 | ||||||
Receivable for securities sold | 219,281 | 1,368,454 | ||||||
Receivable for fund shares sold | 18,155 | 389,818 | ||||||
Dividends and interest receivable | 9,532 | 192,095 | ||||||
Receivable for securities lending income | 70 | — | ||||||
Unrealized appreciation on swap agreements | — | 2,306,135 | ||||||
Due from Broker - Short Sales | — | 261,827 | ||||||
Other assets | 16,143 | 27,141 | ||||||
Total Assets | 24,832,839 | 374,296,717 | ||||||
LIABILITIES: | ||||||||
Obligation to return securities lending collateral | 1,076,267 | — | ||||||
Cash received from broker for swap agreements | — | 1,933,050 | ||||||
Securities sold short, at value (proceeds $0 and $121,486,068, respectively) | — | 115,498,861 | ||||||
Unrealized depreciation on swap agreements | — | 334,570 | ||||||
Payable for dividends on securities sold short | — | 143,848 | ||||||
Payable for securities purchased | 56,078 | 437,815 | ||||||
Payable for fund shares redeemed | 119 | 249,100 | ||||||
Accrued advisory fee | 13,375 | 277,338 | ||||||
Audit and tax fees | 9,964 | 23,157 | ||||||
Trustees fees payable | 115 | — | ||||||
Other accrued expenses | 8,792 | 58,416 | ||||||
Total Liabilities | 1,164,710 | 118,956,155 | ||||||
NET ASSETS | $ | 23,668,129 | $ | 255,340,562 | ||||
COMPONENTS OF NET ASSETS | ||||||||
Paid in capital | $ | 20,703,008 | $ | 228,890,938 | ||||
Total distributable earnings | 2,965,121 | 26,449,624 | ||||||
NET ASSETS | $ | 23,668,129 | $ | 255,340,562 | ||||
NET ASSET VALUE PER SHARE | ||||||||
INVESTOR CLASS SHARES | ||||||||
Net assets | $ | 7,609,061 | ||||||
Shares of Beneficial Interest Outstanding ($0.01 par value, unlimited authorized shares) | 1,200,292 | |||||||
Net asset value, offering and redemption price per share | $ | 6.34 | ||||||
INSTITUTIONAL CLASS SHARES | ||||||||
Net assets | $ | 16,059,068 | $ | 255,340,562 | ||||
Shares of Beneficial Interest Outstanding ($0.01 par value, unlimited authorized shares) | 2,445,135 | 21,080,099 | ||||||
Net asset value, offering and redemption price per share | $ | 6.57 | $ | 12.11 | ||||
1 Includes securities loaned of: | $ | 1,053,160 | $ | — | ||||
See accompanying notes to financial statements. | CRM Funds | |
69 | ||
CRM FUNDS STATEMENTS OF OPERATIONS FOR THE YEAR ENDED June 30, 2023 |
CRM Small Cap | CRM Small/Mid | CRM Mid Cap | ||||||||||
INVESTMENT INCOME: | ||||||||||||
Dividends and interest | $ | 2,379,350 | $ | 3,951,684 | $ | 9,582,288 | ||||||
Securities lending income, net | 352 | 3,013 | 5,693 | |||||||||
Foreign tax withheld | (1,943 | ) | (2,386 | ) | (8,791 | ) | ||||||
Total investment income | 2,377,759 | 3,952,311 | 9,579,190 | |||||||||
EXPENSES: | ||||||||||||
Investment advisory fees | 777,610 | 1,335,025 | 3,102,672 | |||||||||
Sub-Transfer agent fees - Institutional Shares | 38,675 | 128,233 | 215,735 | |||||||||
Shareholder Services - Investor Shares | 74,527 | 54,113 | 418,024 | |||||||||
Administration and accounting fees | 41,281 | 67,517 | 153,441 | |||||||||
Registration fees | 40,294 | 43,540 | 45,417 | |||||||||
Insurance fees | 25,815 | 26,219 | 64,754 | |||||||||
Transfer agent fees | 23,684 | 50,549 | 86,348 | |||||||||
Trustee fees and expenses | 20,656 | 30,795 | 76,964 | |||||||||
Custody fees | 14,984 | 14,970 | 14,993 | |||||||||
Audit and tax fees | 14,451 | 18,514 | 31,914 | |||||||||
Legal fees | 11,968 | 21,627 | 54,681 | |||||||||
Shareholder reports | 1,063 | 15,906 | 35,993 | |||||||||
Other expenses | 23,313 | 28,830 | 58,058 | |||||||||
Total expenses | 1,108,321 | 1,835,838 | 4,358,994 | |||||||||
NET INVESTMENT INCOME | 1,269,438 | 2,116,473 | 5,220,196 | |||||||||
NET REALIZED AND UNREALIZED GAIN ON INVESTMENTS | ||||||||||||
Net realized gain from: | ||||||||||||
Investments | 576,360 | 155,507 | 9,464,167 | |||||||||
Redemptions in kind | 3,394,000 | — | — | |||||||||
Foreign currency transactions | — | — | 139 | |||||||||
Net realized gain | 3,970,360 | 155,507 | 9,464,306 | |||||||||
Net change in unrealized appreciation on: | ||||||||||||
Investments | 7,709,116 | 9,686,921 | 7,872,626 | |||||||||
Net realized and unrealized gain on investments | 11,679,476 | 9,842,428 | 17,336,932 | |||||||||
NET INCREASE IN NET ASSETS RESULTING FROM OPERATIONS | $ | 12,948,914 | $ | 11,958,901 | $ | 22,557,128 | ||||||
See accompanying notes to financial statements. | CRM Funds | |
70 | ||
CRM FUNDS STATEMENTS OF OPERATIONS FOR THE YEAR ENDED June 30, 2023 |
CRM All Cap | CRM Long/Short | |||||||
INVESTMENT INCOME: | ||||||||
Dividends and interest | $ | 349,784 | $ | 5,382,214 | ||||
Securities lending income, net | 154 | — | ||||||
Foreign tax withheld | (469 | ) | (79,670 | ) | ||||
Total investment income | 349,469 | 5,302,544 | ||||||
EXPENSES: | ||||||||
Investment advisory fees | 169,442 | 3,246,963 | ||||||
Dividend expense on securities sold short | — | 1,894,607 | ||||||
Sub-Transfer agent fees - Institutional Shares | 2,593 | 104,368 | ||||||
Shareholder Services - Investor Shares | 19,776 | — | ||||||
Registration fees | 33,816 | 34,863 | ||||||
Custody fees | 14,974 | 14,943 | ||||||
Transfer agent fees | 13,150 | 48,235 | ||||||
Administration and accounting fees | 12,662 | 89,215 | ||||||
Audit and tax fees | 9,964 | 23,157 | ||||||
Trustee fees and expenses | 4,518 | 38,953 | ||||||
Insurance fees | 3,847 | 28,661 | ||||||
Legal fees | 3,210 | 27,594 | ||||||
Shareholder reports | 2,203 | 19,688 | ||||||
Other expenses | 13,565 | 43,319 | ||||||
Total expenses | 303,720 | 5,614,566 | ||||||
Expenses waived | — | (253,530 | ) | |||||
Net expenses | 303,720 | 5,361,036 | ||||||
NET INVESTMENT INCOME (LOSS) | 45,749 | (58,492 | ) | |||||
NET REALIZED AND UNREALIZED GAIN (LOSS) ON INVESTMENTS, DERIVATIVES AND FOREIGN CURRENCY | ||||||||
Net realized gain (loss) from: | ||||||||
Investments | 474,908 | (5,212,392 | ) | |||||
Securities sold short | — | 1,494,908 | ||||||
Swap agreements | — | (2,615,705 | ) | |||||
Purchased Options | — | 411,480 | ||||||
Written Options | — | 294,363 | ||||||
Foreign currency transactions | 8 | (96,366 | ) | |||||
Net realized gain (loss) | 474,916 | (5,723,712 | ) | |||||
Net change in unrealized appreciation (depreciation) on: | ||||||||
Investments | 659,221 | 31,859,785 | ||||||
Securities sold short | — | (7,825,397 | ) | |||||
Swap agreements | — | 2,928,357 | ||||||
Foreign currency transactions | — | 288,546 | ||||||
Net change in unrealized appreciation | 659,221 | 27,251,291 | ||||||
Net realized and unrealized gain on investments,derivatives and foreign currency | 1,134,137 | 21,527,579 | ||||||
NET INCREASE IN NET ASSETS RESULTING FROM OPERATIONS | $ | 1,179,886 | $ | 21,469,087 | ||||
See accompanying notes to financial statements. | CRM Funds | |
71 | ||
CRM FUNDS STATEMENTS OF CHANGES IN NET ASSETS |
CRM Small Cap Value Fund | ||||||||
Year Ended | Year Ended | |||||||
NET ASSETS - BEGINNING OF YEAR | $ | 118,775,543 | $ | 337,718,750 | ||||
OPERATIONS | ||||||||
Net investment income | 1,269,438 | 446,714 | ||||||
Net realized gain from investments | 3,970,300 | 41,694,551 | ||||||
Net change in unrealized appreciation (depreciation) on investments | 7,709,116 | (74,634,511 | ) | |||||
Net increase (decrease) in net assets resulting from operations | 12,948,914 | (32,493,246 | ) | |||||
DISTRIBUTIONS TO SHAREHOLDERS | ||||||||
Investor Class | (711,393 | ) | (7,929,406 | ) | ||||
Institutional Class | (1,651,048 | ) | (52,503,591 | ) | ||||
Total distributions to shareholders | (2,362,441 | ) | (60,432,997 | ) | ||||
CAPITAL SHARE TRANSACTIONS | ||||||||
Sale of shares - Investor Shares | 119,137 | 583,477 | ||||||
Sale of shares - Institutional Shares | 6,581,186 | 28,108,834 | ||||||
Reinvestment of distributions - Investor Class | 667,950 | 7,304,224 | ||||||
Reinvestment of distributions - Institutional Class | 1,285,743 | 47,663,292 | ||||||
Redemption of shares - Investor Class | (3,097,537 | ) | (4,681,308 | ) | ||||
Redemption of shares - Institutional Class | (57,492,934 | ) | (204,995,483 | ) | ||||
Net decrease from capital share transactions | (51,936,455 | ) | (126,016,964 | ) | ||||
Total decrease in net assets | (41,349,982 | ) | (218,943,207 | ) | ||||
NET ASSETS - END OF YEAR | $ | 77,425,561 | $ | 118,775,543 | ||||
SHARE ACTIVITY | ||||||||
Investor Class: | ||||||||
Sold | 9,584 | 38,168 | ||||||
Issued on reinvestment of distributions | 53,181 | 527,238 | ||||||
Redeemed | (253,170 | ) | (303,262 | ) | ||||
Net increase (decrease) | (190,405 | ) | 262,144 | |||||
Institutional Class: | ||||||||
Sold | 431,761 | 1,518,939 | ||||||
Issued on reinvestment of distributions | 82,419 | 2,799,683 | ||||||
Redeemed | (3,789,373 | ) | (12,462,492 | ) | ||||
Net decrease | (3,275,193 | ) | (8,143,870 | ) | ||||
See accompanying notes to financial statements. | CRM Funds | |
72 | ||
CRM FUNDS STATEMENTS OF CHANGES IN NET ASSETS |
CRM Small/Mid Cap Value Fund | ||||||||
Year Ended | Year Ended | |||||||
NET ASSETS - BEGINNING OF YEAR | $ | 140,297,796 | $ | 313,225,268 | ||||
OPERATIONS | ||||||||
Net investment income | 2,116,473 | 1,746,165 | ||||||
Net realized gain from investments | 155,507 | 54,043,235 | ||||||
Net change in unrealized appreciation (depreciation) on investments | 9,686,921 | (77,848,761 | ) | |||||
Net increase (decrease) in net assets resulting from operations | 11,958,901 | (22,059,361 | ) | |||||
DISTRIBUTIONS TO SHAREHOLDERS | ||||||||
Investor Class | (1,264,375 | ) | (10,028,969 | ) | ||||
Institutional Class | (8,541,502 | ) | (43,784,589 | ) | ||||
Total distributions to shareholders | (9,805,877 | ) | (53,813,558 | ) | ||||
CAPITAL SHARE TRANSACTIONS | ||||||||
Sale of shares - Investor Shares | 4,363,371 | 14,710,375 | ||||||
Sale of shares - Institutional Shares | 107,199,891 | 37,089,294 | ||||||
Reinvestment of distributions - Investor Class | 1,237,084 | 9,954,998 | ||||||
Reinvestment of distributions - Institutional Class | 8,354,636 | 42,756,724 | ||||||
Redemption of shares - Investor Class | (4,113,640 | ) | (17,399,666 | ) | ||||
Redemption of shares - Institutional Class | (39,233,010 | ) | (184,166,278 | ) | ||||
Net increase (decrease) from capital share transactions | 77,808,332 | (97,054,553 | ) | |||||
Total increase (decrease) in net assets | 79,961,356 | (172,927,472 | ) | |||||
NET ASSETS - END OF YEAR | $ | 220,259,152 | $ | 140,297,796 | ||||
SHARE ACTIVITY | ||||||||
Investor Class: | ||||||||
Sold | 440,007 | 1,043,459 | ||||||
Issued on reinvestment of distributions | 123,585 | 870,953 | ||||||
Redeemed | (412,134 | ) | (1,531,017 | ) | ||||
Net increase | 151,458 | 383,395 | ||||||
Institutional Class: | ||||||||
Sold | 9,892,422 | 3,036,191 | ||||||
Issued on reinvestment of distributions | 797,959 | 3,586,973 | ||||||
Redeemed | (3,725,029 | ) | (13,189,739 | ) | ||||
Net increase (decrease) | 6,965,352 | (6,566,575 | ) | |||||
See accompanying notes to financial statements. | CRM Funds | |
73 | ||
CRM FUNDS STATEMENTS OF CHANGES IN NET ASSETS |
CRM Mid Cap Value Fund | ||||||||
Year Ended | Year Ended | |||||||
NET ASSETS - BEGINNING OF YEAR | $ | 384,065,255 | $ | 439,057,786 | ||||
OPERATIONS | ||||||||
Net investment income | 5,220,196 | 4,842,362 | ||||||
Net realized gain from investments | 9,464,306 | 21,447,221 | ||||||
Net change in unrealized appreciation (depreciation) on investments | 7,872,626 | (53,252,573 | ) | |||||
Net increase (decrease) in net assets resulting from operations | 22,557,128 | (26,962,990 | ) | |||||
DISTRIBUTIONS TO SHAREHOLDERS | ||||||||
Investor Class | (7,142,897 | ) | (31,529,470 | ) | ||||
Institutional Class | (10,218,630 | ) | (41,057,815 | ) | ||||
Total distributions to shareholders | (17,361,527 | ) | (72,587,285 | ) | ||||
CAPITAL SHARE TRANSACTIONS | ||||||||
Sale of shares - Investor Shares | 18,136,050 | 21,210,975 | ||||||
Sale of shares - Institutional Shares | 72,113,783 | 28,351,424 | ||||||
Reinvestment of distributions - Investor Class | 7,031,109 | 30,961,960 | ||||||
Reinvestment of distributions - Institutional Class | 9,472,114 | 37,597,239 | ||||||
Redemption of shares - Investor Class | (32,173,398 | ) | (31,768,603 | ) | ||||
Redemption of shares - Institutional Class | (50,952,578 | ) | (41,795,251 | ) | ||||
Net increase from capital share transactions | 23,627,080 | 44,557,744 | ||||||
Total increase (decrease) in net assets | 28,822,681 | (54,992,531 | ) | |||||
NET ASSETS - END OF YEAR | $ | 412,887,936 | $ | 384,065,255 | ||||
SHARE ACTIVITY | ||||||||
Investor Class: | ||||||||
Sold | 823,806 | 887,875 | ||||||
Issued on reinvestment of distributions | 319,887 | 1,284,729 | ||||||
Redeemed | (1,478,388 | ) | (1,251,319 | ) | ||||
Net increase (decrease) | (334,695 | ) | 921,285 | |||||
Institutional Class: | ||||||||
Sold | 3,124,549 | 1,096,756 | ||||||
Issued on reinvestment of distributions | 407,578 | 1,479,042 | ||||||
Redeemed | (2,220,961 | ) | (1,553,490 | ) | ||||
Net increase | 1,311,166 | 1,022,308 | ||||||
See accompanying notes to financial statements. | CRM Funds | |
74 | ||
CRM FUNDS STATEMENTS OF CHANGES IN NET ASSETS |
CRM All Cap Value Fund | ||||||||
Year Ended | Year Ended | |||||||
NET ASSETS - BEGINNING OF YEAR | $ | 23,131,491 | $ | 27,309,419 | ||||
OPERATIONS | ||||||||
Net investment income | 45,749 | 124,195 | ||||||
Net realized gain from investments | 474,916 | 1,768,579 | ||||||
Net change in unrealized appreciation (depreciation) on investments | 659,221 | (4,444,658 | ) | |||||
Net increase (decrease) in net assets resulting from operations | 1,179,886 | (2,551,884 | ) | |||||
DISTRIBUTIONS TO SHAREHOLDERS | ||||||||
Investor Class | (543,588 | ) | (1,719,934 | ) | ||||
Institutional Class | (1,112,197 | ) | (3,399,568 | ) | ||||
Total distributions to shareholders | (1,655,785 | ) | (5,119,502 | ) | ||||
CAPITAL SHARE TRANSACTIONS | ||||||||
Sale of shares - Investor Shares | 79,155 | 151,705 | ||||||
Sale of shares - Institutional Shares | 634,169 | 620,494 | ||||||
Reinvestment of distributions - Investor Class | 515,831 | 1,623,939 | ||||||
Reinvestment of distributions - Institutional Class | 1,062,276 | 3,263,495 | ||||||
Redemption of shares - Investor Class | (438,501 | ) | (501,342 | ) | ||||
Redemption of shares - Institutional Class | (840,393 | ) | (1,664,833 | ) | ||||
Net increase from capital share transactions | 1,012,537 | 3,493,458 | ||||||
Total increase (decrease) in net assets | 536,638 | (4,177,928 | ) | |||||
NET ASSETS - END OF YEAR | $ | 23,668,129 | $ | 23,131,491 | ||||
SHARE ACTIVITY | ||||||||
Investor Class: | ||||||||
Sold | 11,555 | 19,329 | ||||||
Issued on reinvestment of distributions | 79,359 | 219,748 | ||||||
Redeemed | (68,924 | ) | (65,032 | ) | ||||
Net increase | 21,990 | 174,045 | ||||||
Institutional Class: | ||||||||
Sold | 94,716 | 78,011 | ||||||
Issued on reinvestment of distributions | 158,077 | 427,719 | ||||||
Redeemed | (126,864 | ) | (202,857 | ) | ||||
Net increase | 125,929 | 302,873 | ||||||
See accompanying notes to financial statements. | CRM Funds | |
75 | ||
CRM FUNDS STATEMENTS OF CHANGES IN NET ASSETS |
CRM Long/Short Opportunities Fund | ||||||||
Year Ended | Year Ended | |||||||
NET ASSETS - BEGINNING OF YEAR | $ | 185,463,235 | $ | 127,930,416 | ||||
OPERATIONS | ||||||||
Net investment loss | (58,492 | ) | (2,862,531 | ) | ||||
Net realized gain (loss) from investments and foreign currency | (5,723,712 | ) | 10,097,124 | |||||
Net change in unrealized appreciation (depreciation) on investments and foreign currency | 27,251,291 | (11,890,823 | ) | |||||
Net increase (decrease) in net assets resulting from operations | 21,469,087 | (4,656,230 | ) | |||||
DISTRIBUTIONS TO SHAREHOLDERS | ||||||||
Institutional Class | (3,277,664 | ) | (1,310,755 | ) | ||||
Total distributions to shareholders | (3,277,664 | ) | (1,310,755 | ) | ||||
CAPITAL SHARE TRANSACTIONS | ||||||||
Sale of shares - Institutional Shares | 107,097,037 | 192,936,504 | ||||||
Reinvestment of distributions - Institutional Class | 3,271,562 | 1,307,761 | ||||||
Redemption of shares - Institutional Class | (58,682,695 | ) | (130,744,461 | ) | ||||
Net increase from capital share transactions | 51,685,904 | 63,499,804 | ||||||
Total increase in net assets | 69,877,327 | 57,532,819 | ||||||
NET ASSETS - END OF YEAR | $ | 255,340,562 | $ | 185,463,235 | ||||
SHARE ACTIVITY | ||||||||
Institutional Class: | ||||||||
Sold | 9,251,123 | 16,603,125 | ||||||
Issued on reinvestment of distributions | 286,226 | 108,618 | ||||||
Redeemed | (5,096,169 | ) | (11,081,349 | ) | ||||
Net increase | 4,441,180 | 5,630,394 | ||||||
See accompanying notes to financial statements. | CRM Funds | |
76 | ||
CRM FUNDS FINANCIAL HIGHLIGHTS |
The following tables include selected data for a share outstanding throughout each year and other performance information derived from the financial statements. The total returns in the tables represent the rate an investor would have earned or lost on an investment in the funds (assuming reinvestment of all dividends and distributions). This information should be read in conjunction with the financial statements and notes thereto.
CRM Small Cap Value Fund — Investor Shares | ||||||||||||||||||||
For the Years Ended June 30, | ||||||||||||||||||||
2023 | 2022 | 2021 | 2020 | 2019 | ||||||||||||||||
Net Asset Value - Beginning of Year | $ | 11.40 | $ | 17.35 | $ | 11.22 | $ | 15.34 | $ | 17.15 | ||||||||||
Investment operations: | ||||||||||||||||||||
Net investment income1 | 0.14 | — | 2 | 0.04 | 0.04 | 0.02 | ||||||||||||||
Net realized and unrealized gain (loss) on investments | 1.24 | (2.26 | ) | 6.16 | (3.07 | ) | (0.22 | ) | ||||||||||||
Total from investment operations | 1.38 | (2.26 | ) | 6.20 | (3.03 | ) | (0.20 | ) | ||||||||||||
Distributions to shareholders: | ||||||||||||||||||||
From net investment income | (0.06 | ) | (0.01 | ) | (0.07 | ) | (0.03 | ) | (0.04 | ) | ||||||||||
From net realized gain on investments | (0.23 | ) | (3.68 | ) | — | (1.06 | ) | (1.57 | ) | |||||||||||
Total distributions to shareholders | (0.29 | ) | (3.69 | ) | (0.07 | ) | (1.09 | ) | (1.61 | ) | ||||||||||
Net Asset Value - End of Year | $ | 12.49 | $ | 11.40 | $ | 17.35 | $ | 11.22 | $ | 15.34 | ||||||||||
Total return | 12.09 | % | (15.73 | )% | 55.36 | % | (21.53 | )% | (0.17 | )% | ||||||||||
Ratios/Supplemental Data: | ||||||||||||||||||||
Ratios to average net assets: | ||||||||||||||||||||
Expenses | 1.21 | % | 1.16 | % | 1.15 | % | 1.16 | % | 1.15 | % | ||||||||||
Net investment income | 1.11 | % | 0.01 | % | 0.30 | % | 0.27 | % | 0.12 | % | ||||||||||
Portfolio turnover rate | 54 | % | 54 | % | 63 | % | 60 | % | 48 | % | ||||||||||
Net Assets at end of year (000’s omitted) | $ | 28,660 | $ | 28,325 | $ | 38,548 | $ | 33,526 | $ | 58,787 | ||||||||||
(1) | Calculated using the average shares method. |
(2) | Amount represents less than $0.005. |
See accompanying notes to financial statements. | CRM Funds | |
77 | ||
CRM FUNDS FINANCIAL HIGHLIGHTS |
CRM Small Cap Value Fund — Institutional Shares | ||||||||||||||||||||
For the Years Ended June 30, | ||||||||||||||||||||
2023 | 2022 | 2021 | 2020 | 2019 | ||||||||||||||||
Net Asset Value - Beginning of Year | $ | 14.10 | $ | 20.55 | $ | 13.28 | $ | 17.96 | $ | 19.77 | ||||||||||
Investment operations: | ||||||||||||||||||||
Net investment income1 | 0.19 | 0.03 | 0.09 | 0.08 | 0.07 | |||||||||||||||
Net realized and unrealized gain (loss) on investments | 1.55 | (2.75 | ) | 7.28 | (3.63 | ) | (0.23 | ) | ||||||||||||
Total from investment operations | 1.74 | (2.72 | ) | 7.37 | (3.55 | ) | (0.16 | ) | ||||||||||||
Distributions to shareholders: | ||||||||||||||||||||
From net investment income | (0.08 | ) | (0.05 | ) | (0.10 | ) | (0.07 | ) | (0.08 | ) | ||||||||||
From net realized gain on investments | (0.23 | ) | (3.68 | ) | — | (1.06 | ) | (1.57 | ) | |||||||||||
Total distributions to shareholders | (0.31 | ) | (3.73 | ) | (0.10 | ) | (1.13 | ) | (1.65 | ) | ||||||||||
Net Asset Value - End of Year | $ | 15.53 | $ | 14.10 | $ | 20.55 | $ | 13.28 | $ | 17.96 | ||||||||||
Total return | 12.33 | % | (15.53 | )% | 55.68 | % | (21.34 | )% | 0.11 | % | ||||||||||
Ratios/Supplemental Data: | ||||||||||||||||||||
Ratios to average net assets: | ||||||||||||||||||||
Expenses | 1.01 | % | 0.93 | % | 0.91 | % | 0.92 | % | 0.91 | % | ||||||||||
Net investment income | 1.27 | % | 0.18 | % | 0.54 | % | 0.52 | % | 0.38 | % | ||||||||||
Portfolio turnover rate | 54 | % | 54 | % | 63 | % | 60 | % | 48 | % | ||||||||||
Net Assets at end of year (000’s omitted) | $ | 48,766 | $ | 90,451 | $ | 299,170 | $ | 198,589 | $ | 266,562 | ||||||||||
(1) | Calculated using the average shares method. |
See accompanying notes to financial statements. | CRM Funds | |
78 | ||
CRM FUNDS FINANCIAL HIGHLIGHTS |
CRM Small/Mid Cap Value Fund — Investor Shares | ||||||||||||||||||||
For the Years Ended June 30, | ||||||||||||||||||||
2023 | 2022 | 2021 | 2020 | 2019 | ||||||||||||||||
Net Asset Value - Beginning of Year | $ | 9.94 | $ | 15.37 | $ | 9.71 | $ | 11.36 | $ | 13.09 | ||||||||||
Investment operations: | ||||||||||||||||||||
Net investment income1 | 0.10 | 0.10 | 0.11 | 0.02 | 0.03 | |||||||||||||||
Net realized and unrealized gain (loss) on investments | 0.79 | (1.39 | ) | 6.29 | (1.35 | ) | (0.01 | ) | ||||||||||||
Total from investment operations | 0.89 | (1.29 | ) | 6.40 | (1.33 | ) | 0.02 | |||||||||||||
Distributions to shareholders: | ||||||||||||||||||||
From net investment income | (0.06 | ) | (0.17 | ) | (0.03 | ) | (0.03 | ) | — | |||||||||||
From net realized gain on investments | (0.57 | ) | (3.97 | ) | (0.71 | ) | (0.29 | ) | (1.75 | ) | ||||||||||
Total distributions to shareholders | (0.63 | ) | (4.14 | ) | (0.74 | ) | (0.32 | ) | (1.75 | ) | ||||||||||
Net Asset Value - End of Year | $ | 10.20 | $ | 9.94 | $ | 15.37 | $ | 9.71 | $ | 11.36 | ||||||||||
Total return | 9.07 | % | (11.92 | )% | 67.80 | % | (12.18 | )% | 1.91 | % | ||||||||||
Ratios/Supplemental Data: | ||||||||||||||||||||
Ratios to average net assets: | ||||||||||||||||||||
Expenses | 1.18 | % | 1.18 | % | 1.15 | % | 1.17 | % | 1.15 | % | ||||||||||
Net investment income | 1.02 | % | 0.82 | % | 0.83 | % | 0.22 | % | 0.21 | % | ||||||||||
Portfolio turnover rate | 42 | % | 34 | % | 59 | % | 80 | % | 45 | % | ||||||||||
Net Assets at end of year (000’s omitted) | $ | 23,018 | $ | 20,914 | $ | 26,464 | $ | 16,259 | $ | 24,455 | ||||||||||
(1) | Calculated using the average shares method. |
See accompanying notes to financial statements. | CRM Funds | |
79 | ||
CRM FUNDS FINANCIAL HIGHLIGHTS |
CRM Small/Mid Cap Value Fund — | ||||||||||||||||||||
For the Years Ended June 30, | ||||||||||||||||||||
2023 | 2022 | 2021 | 2020 | 2019 | ||||||||||||||||
Net Asset Value - Beginning of Year | $ | 10.38 | $ | 15.87 | $ | 10.00 | $ | 11.70 | $ | 13.43 | ||||||||||
Investment operations: | ||||||||||||||||||||
Net investment income1 | 0.13 | 0.13 | 0.13 | 0.05 | 0.05 | |||||||||||||||
Net realized and unrealized gain (loss) on investments | 0.82 | (1.46 | ) | 6.50 | (1.41 | ) | — | 2 | ||||||||||||
Total from investment operations | 0.95 | (1.33 | ) | 6.63 | (1.36 | ) | 0.05 | |||||||||||||
Distributions to shareholders: | ||||||||||||||||||||
From net investment income | (0.08 | ) | (0.19 | ) | (0.05 | ) | (0.05 | ) | (0.03 | ) | ||||||||||
From net realized gain on investments | (0.57 | ) | (3.97 | ) | (0.71 | ) | (0.29 | ) | (1.75 | ) | ||||||||||
Total distributions to shareholders | (0.65 | ) | (4.16 | ) | (0.76 | ) | (0.34 | ) | (1.78 | ) | ||||||||||
Net Asset Value - End of Year | $ | 10.68 | $ | 10.38 | $ | 15.87 | $ | 10.00 | $ | 11.70 | ||||||||||
Total return | 9.28 | % | (11.78 | )% | 68.26 | % | (12.06 | )% | 2.13 | % | ||||||||||
Ratios/Supplemental Data: | ||||||||||||||||||||
Ratios to average net assets: | ||||||||||||||||||||
Expenses | 1.01 | % | 1.00 | % | 0.93 | % | 0.95 | % | 0.94 | % | ||||||||||
Net investment income | 1.21 | % | 0.98 | % | 0.99 | % | 0.44 | % | 0.42 | % | ||||||||||
Portfolio turnover rate | 42 | % | 34 | % | 59 | % | 80 | % | 45 | % | ||||||||||
Net Assets at end of year (000’s omitted) | $ | 197,242 | $ | 119,384 | $ | 286,762 | $ | 220,919 | $ | 253,964 | ||||||||||
(1) | Calculated using the average shares method. |
(2) | Amount represents less than $0.005. |
See accompanying notes to financial statements. | CRM Funds | |
80 | ||
CRM FUNDS FINANCIAL HIGHLIGHTS |
CRM Mid Cap Value Fund — Investor Shares | ||||||||||||||||||||
For the Years Ended June 30, | ||||||||||||||||||||
2023 | 2022 | 2021 | 2020 | 2019 | ||||||||||||||||
Net Asset Value - Beginning of Year | $ | 21.43 | $ | 27.71 | $ | 18.34 | $ | 21.22 | $ | 22.58 | ||||||||||
Investment operations: | ||||||||||||||||||||
Net investment income1 | 0.25 | 0.27 | 0.15 | 0.08 | 0.08 | |||||||||||||||
Net realized and unrealized gain (loss) on investments | 1.00 | (1.57 | ) | 9.67 | (2.33 | ) | 0.41 | |||||||||||||
Total from investment operations | 1.25 | (1.30 | ) | 9.82 | (2.25 | ) | 0.49 | |||||||||||||
Distributions to shareholders: | ||||||||||||||||||||
From net investment income | (0.26 | ) | (0.26 | ) | (0.09 | ) | (0.09 | ) | (0.04 | ) | ||||||||||
From net realized gain on investments | (0.69 | ) | (4.72 | ) | (0.36 | ) | (0.54 | ) | (1.81 | ) | ||||||||||
Total distributions to shareholders | (0.95 | ) | (4.98 | ) | (0.45 | ) | (0.63 | ) | (1.85 | ) | ||||||||||
Net Asset Value - End of Year | $ | 21.73 | $ | 21.43 | $ | 27.71 | $ | 18.34 | $ | 21.22 | ||||||||||
Total return | 5.78 | % | (6.68 | )% | 54.09 | % | (10.98 | )% | 3.39 | % | ||||||||||
Ratios/Supplemental Data: | ||||||||||||||||||||
Ratios to average net assets: | ||||||||||||||||||||
Expenses | 1.15 | % | 1.14 | % | 1.15 | % | 1.16 | % | 1.14 | % | ||||||||||
Net investment income | 1.16 | % | 1.06 | % | 0.66 | % | 0.42 | % | 0.37 | % | ||||||||||
Portfolio turnover rate | 43 | % | 23 | % | 63 | % | 37 | % | 40 | % | ||||||||||
Net Assets at end of year (000’s omitted) | $ | 159,797 | $ | 164,743 | $ | 187,541 | $ | 152,370 | $ | 220,014 | ||||||||||
(1) | Calculated using the average shares method. |
See accompanying notes to financial statements. | CRM Funds | |
81 | ||
CRM FUNDS FINANCIAL HIGHLIGHTS |
CRM Mid Cap Value Fund — Institutional Shares | ||||||||||||||||||||
For the Years Ended June 30, | ||||||||||||||||||||
2023 | 2022 | 2021 | 2020 | 2019 | ||||||||||||||||
Net Asset Value - Beginning of Year | $ | 22.62 | $ | 29.00 | $ | 19.17 | $ | 22.16 | $ | 23.49 | ||||||||||
Investment operations: | ||||||||||||||||||||
Net investment income1 | 0.31 | 0.33 | 0.20 | 0.12 | 0.13 | |||||||||||||||
Net realized and unrealized gain (loss) on investments | 1.06 | (1.67 | ) | 10.12 | (2.44 | ) | 0.43 | |||||||||||||
Total from investment operations | 1.37 | (1.34 | ) | 10.32 | (2.32 | ) | 0.56 | |||||||||||||
Distributions to shareholders: | ||||||||||||||||||||
From net investment income | (0.30 | ) | (0.32 | ) | (0.13 | ) | (0.13 | ) | (0.08 | ) | ||||||||||
From net realized gain on investments | (0.69 | ) | (4.72 | ) | (0.36 | ) | (0.54 | ) | (1.81 | ) | ||||||||||
Total distributions to shareholders | (0.99 | ) | (5.04 | ) | (0.49 | ) | (0.67 | ) | (1.89 | ) | ||||||||||
Net Asset Value - End of Year | $ | 23.00 | $ | 22.62 | $ | 29.00 | $ | 19.17 | $ | 22.16 | ||||||||||
Total return | 6.00 | % | (6.55 | )% | 54.44 | % | (10.83 | )% | 3.61 | % | ||||||||||
Ratios/Supplemental Data: | ||||||||||||||||||||
Ratios to average net assets: | ||||||||||||||||||||
Expenses | 0.99 | % | 0.97 | % | 0.94 | % | 0.96 | % | 0.94 | % | ||||||||||
Net investment income | 1.34 | % | 1.23 | % | 0.84 | % | 0.59 | % | 0.58 | % | ||||||||||
Portfolio turnover rate | 43 | % | 23 | % | 63 | % | 37 | % | 40 | % | ||||||||||
Net Assets at end of year (000’s omitted) | $ | 253,091 | $ | 219,322 | $ | 251,517 | $ | 202,989 | $ | 243,851 | ||||||||||
(1) | Calculated using the average shares method. |
See accompanying notes to financial statements. | CRM Funds | |
82 | ||
CRM FUNDS FINANCIAL HIGHLIGHTS |
CRM All Cap Value Fund — Investor Shares | ||||||||||||||||||||
For the Years Ended June 30, | ||||||||||||||||||||
2023 | 2022 | 2021 | 2020 | 2019 | ||||||||||||||||
Net Asset Value - Beginning of Year | $ | 6.47 | $ | 8.88 | $ | 5.91 | $ | 6.99 | $ | 8.81 | ||||||||||
Investment operations: | ||||||||||||||||||||
Net investment income1 | — | 2 | 0.02 | 0.02 | 0.01 | 0.01 | ||||||||||||||
Net realized and unrealized gain (loss) on investments | 0.33 | (0.70 | ) | 3.16 | (0.67 | ) | (0.26 | ) | ||||||||||||
Total from investment operations | 0.33 | (0.68 | ) | 3.18 | (0.66 | ) | (0.25 | ) | ||||||||||||
Distributions to shareholders: | ||||||||||||||||||||
From net investment income | (0.01 | ) | (0.04 | ) | (0.02 | ) | (0.01 | ) | — | |||||||||||
From net realized gain on investments | (0.45 | ) | (1.69 | ) | (0.19 | ) | (0.41 | ) | (1.57 | ) | ||||||||||
Total distributions to shareholders | (0.46 | ) | (1.73 | ) | (0.21 | ) | (0.42 | ) | (1.57 | ) | ||||||||||
Net Asset Value - End of Year | $ | 6.34 | $ | 6.47 | $ | 8.88 | $ | 5.91 | $ | 6.99 | ||||||||||
Total return | 4.94 | % | (10.09 | )% | 54.42 | % | (10.16 | )% | (0.72 | )% | ||||||||||
Ratios/Supplemental Data: | ||||||||||||||||||||
Ratios to average net assets: | ||||||||||||||||||||
Expenses, including waiver/reimbursement | 1.41 | % | 1.33 | % | 1.37 | % | 1.40 | % | 1.50 | % | ||||||||||
Expenses, excluding waiver/reimbursement | 1.41 | % | 1.33 | % | 1.39 | % | 1.50 | % | 2.20 | % | ||||||||||
Net investment income, including waiver/reimbursement | 0.03 | % | 0.32 | % | 0.31 | % | 0.22 | % | 0.12 | % | ||||||||||
Portfolio turnover rate | 51 | % | 38 | % | 87 | % | 65 | % | 112 | % | ||||||||||
Net Assets at end of year (000’s omitted) | $ | 7,609 | $ | 7,622 | $ | 8,916 | $ | 6,893 | $ | 9,256 | ||||||||||
(1) | Calculated using the average shares method. |
(2) | Amount represents less than $0.005. |
See accompanying notes to financial statements. | CRM Funds | |
83 | ||
CRM FUNDS FINANCIAL HIGHLIGHTS |
CRM All Cap Value Fund — Institutional Shares | ||||||||||||||||||||
For the Years Ended June 30, | ||||||||||||||||||||
2023 | 2022 | 2021 | 2020 | 2019 | ||||||||||||||||
Net Asset Value - Beginning of Year | $ | 6.69 | $ | 9.12 | $ | 6.07 | $ | 7.16 | $ | 8.98 | ||||||||||
Investment operations: | ||||||||||||||||||||
Net investment income1 | 0.02 | 0.04 | 0.04 | 0.03 | 0.03 | |||||||||||||||
Net realized and unrealized gain (loss) on investments | 0.34 | (0.72 | ) | 3.24 | (0.68 | ) | (0.27 | ) | ||||||||||||
Total from investment operations | 0.36 | (0.68 | ) | 3.28 | (0.65 | ) | (0.24 | ) | ||||||||||||
Distributions to shareholders: | ||||||||||||||||||||
From net investment income | (0.03 | ) | (0.06 | ) | (0.04 | ) | (0.03 | ) | (0.01 | ) | ||||||||||
From net realized gain on investments | (0.45 | ) | (1.69 | ) | (0.19 | ) | (0.41 | ) | (1.57 | ) | ||||||||||
Total distributions to shareholders | (0.48 | ) | (1.75 | ) | (0.23 | ) | (0.44 | ) | (1.58 | ) | ||||||||||
Net Asset Value - End of Year | $ | 6.57 | $ | 6.69 | $ | 9.12 | $ | 6.07 | $ | 7.16 | ||||||||||
Total return | 5.18 | % | (9.81 | )% | 54.66 | % | (9.87 | )% | (0.51 | )% | ||||||||||
Ratios/Supplemental Data: | ||||||||||||||||||||
Ratios to average net assets: | ||||||||||||||||||||
Expenses, including waiver/reimbursement | 1.18 | % | 1.09 | % | 1.11 | % | 1.15 | % | 1.25 | % | ||||||||||
Expenses, excluding waiver/reimbursement | 1.18 | % | 1.09 | % | 1.13 | % | 1.25 | % | 1.96 | % | ||||||||||
Net investment income, including waiver/reimbursement | 0.27 | % | 0.56 | % | 0.52 | % | 0.47 | % | 0.36 | % | ||||||||||
Portfolio turnover rate | 51 | % | 38 | % | 87 | % | 65 | % | 112 | % | ||||||||||
Net Assets at end of year (000’s omitted) | $ | 16,059 | $ | 15,509 | $ | 18,393 | $ | 18,307 | $ | 26,816 | ||||||||||
(1) | Calculated using the average shares method. |
See accompanying notes to financial statements. | CRM Funds | |
84 | ||
CRM FUNDS FINANCIAL HIGHLIGHTS |
CRM Long/Short Opportunities Fund — | ||||||||||||||||||||
For the Years Ended June 30, | ||||||||||||||||||||
2023 | 2022 | 2021 | 2020 | 2019 | ||||||||||||||||
Net Asset Value - Beginning of Year | $ | 11.15 | $ | 11.62 | $ | 10.23 | $ | 10.27 | $ | 10.68 | ||||||||||
Investment operations: | ||||||||||||||||||||
Net investment loss1 | — | 2 | (0.23 | ) | (0.25 | ) | (0.10 | ) | (0.11 | ) | ||||||||||
Net realized and unrealized gain (loss) on investments, derivatives and foreign currency | 1.14 | (0.15 | ) | 2.22 | 0.50 | (0.14 | ) | |||||||||||||
Total from investment operations | 1.14 | (0.38 | ) | 1.97 | 0.40 | (0.25 | ) | |||||||||||||
Distributions to shareholders: | ||||||||||||||||||||
From net realized gain on investments | (0.18 | ) | (0.09 | ) | (0.58 | ) | (0.44 | ) | (0.16 | ) | ||||||||||
Total distributions to shareholders | (0.18 | ) | (0.09 | ) | (0.58 | ) | (0.44 | ) | (0.16 | ) | ||||||||||
Net Asset Value - End of Year | $ | 12.11 | $ | 11.15 | $ | 11.62 | $ | 10.23 | $ | 10.27 | ||||||||||
Total return | 10.29 | % | (3.33 | )% | 19.49 | % | 3.93 | % | (2.18 | )% | ||||||||||
Ratios to average net assets: | ||||||||||||||||||||
Expenses, including waiver/reimbursement | 2.48 | % | 2.68 | % | 2.79 | % | 2.95 | % | 3.03 | % | ||||||||||
Expenses, including waiver/reimbursement and excluding interest and dividend expense relating to short sales | 1.60 | % | 1.60 | % | 1.60 | % | 1.59 | % | 1.60 | % | ||||||||||
Expenses, excluding waiver/reimbursement | 2.60 | % | 2.80 | % | 2.90 | % | 3.03 | % | 3.10 | % | ||||||||||
Expenses, excluding waiver/reimbursement and interest and dividend expense relating to short sales | 1.72 | % | 1.72 | % | 1.71 | % | 1.67 | % | 1.67 | % | ||||||||||
Net investment loss, including waiver/reimbursement | (0.03 | )% | (2.00 | )% | (2.18 | )% | (0.99 | )% | (1.03 | )% | ||||||||||
Portfolio turnover rate | 90 | % | 157 | % | 201 | % | 177 | % | 195 | % | ||||||||||
Net Assets at end of year (000’s omitted) | $ | 255,341 | $ | 185,463 | $ | 127,930 | $ | 56,540 | $ | 482,050 | ||||||||||
(1) | Calculated using the average shares method. |
(2) | Amount represents less than $(0.005). |
See accompanying notes to financial statements. | CRM Funds | |
85 | ||
CRM FUNDS NOTES TO FINANCIAL STATEMENTS — June 30, 2023 |
1. | Description of the Funds. CRM Small Cap Value Fund (“Small Cap Value Fund”), CRM Small/Mid Cap Value Fund (“Small/Mid Cap Value Fund”), CRM Mid Cap Value Fund (“Mid Cap Value Fund”), CRM All Cap Value Fund (“All Cap Value Fund”) and CRM Long/Short Opportunities Fund (“Long/Short Opportunities Fund”) (each, a “Fund” and collectively, the “Funds”) are series of the CRM Mutual Fund Trust (the “Trust”). The Trust consists of five funds. A shareholder of one series is not deemed to be a shareholder of any other series. The Trust is registered under the Investment Company Act of 1940, as amended (the “1940 Act”), as an open-end management investment company and was organized as a Delaware statutory trust on March 30, 2005. |
Small Cap Value Fund, Small/Mid Cap Value Fund, Mid Cap Value Fund, and All Cap Value Fund: Each Fund offers Investor and Institutional Shares. Each class has different minimum investment requirements, fees and expenses. All classes of shares have identical voting, dividend and liquidation rights. Investor Shares are available to all investors and are subject to a shareholder servicing fee. Institutional Shares are offered only to those investors who invest in a Fund through an intermediary (i.e. broker) or through a consultant and who invest $1,000,000 or more or where related accounts total $1,000,000 or more when combined.
Long/Short Opportunities Fund: The Fund offers Institutional Shares. Shares are generally available for purchase and sale by registered investment advisers acting in a fiduciary capacity on behalf of their clients and by or through other qualified intermediaries and programs sponsored by such qualified financial intermediaries. Initial investments in the Fund are subject to a $10,000 minimum per registered investment adviser or qualified financial intermediary.
2. | Significant Accounting Policies. The Funds’ financial statements have been prepared in conformity with U.S. generally accepted accounting principles (“U.S. GAAP”). The Funds are investment companies and follow the accounting and reporting requirements for investment companies under Financial Accounting Standards Board (“FASB”), Accounting Standards Codification Topic 946. The following is a summary of the significant accounting policies of the Funds: |
CRM Funds | ||
86 |
CRM FUNDS NOTES TO FINANCIAL STATEMENTS — June 30, 2023 (Continued) |
Security Valuation. The Funds value their investment securities based on current market values when such values are available. These prices normally are supplied by a pricing service.
In valuing a Fund’s investment securities, a security listed on the New York Stock Exchange (the “Exchange”) (and not subject to restrictions against sale by the Fund on the Exchange) will be valued at its last sale price on the Exchange on the day the security is valued. Lacking any sales on such day, the security will be valued at the mean between the closing asked price and the closing bid price. Securities listed on other exchanges (and not subject to restriction against sale by the Fund on such exchanges) will be similarly valued, using quotations on the exchange on which the security is traded most extensively. Securities that are quoted on the NASDAQ Stock Market, for which there have been sales of such securities on such day, shall be valued at the last sale price reported on such system on the day the security is valued. If there are no such sales on such day, the value shall be the mean between the closing asked price and the closing bid price. The value of such securities quoted on the stock market system, but not listed on the national market system, shall be valued at the mean between the closing asked price and the closing bid price. Unlisted securities that are not quoted on the NASDAQ Stock Market and for which over-the-counter market quotations are readily available will be valued at the mean between the current bid and asked prices for such security in the over-the-counter market.
Short-term investments with remaining maturities of less than 61 days are valued at amortized cost, provided such amount approximates fair value. A Fund’s currency valuations, if any, are also valued at the close of regular trading on the Exchange. Investments in other open-end investment companies are valued at such investment company’s current day closing net asset value per share. Swaps and forward foreign currency exchange contracts are valued utilizing market quotations provided by a third-party pricing service. Option contracts are generally valued at the mean between the last bid and ask prices on the principal exchange where they are traded.
Pursuant to Rule 2a-5 under the 1940 Act, the Board of Trustees of the Trust (the “Board” or “Trustees”) has designated Cramer Rosenthal McGlynn, LLC, the adviser, to serve as the Trust’s Valuation Designee, to perform any fair value determinations for securities and other assets held by the Funds for which market quotations are not readily available in accordance with the
CRM Funds | ||
87 |
CRM FUNDS NOTES TO FINANCIAL STATEMENTS — June 30, 2023 (Continued) |
Trust’s Securities Pricing Procedures. In addition, the Funds may use fair value methodologies if it is determined that a significant event has occurred between the time at which a market price is determined and the time at which the Fund’s net asset value (“NAV”) is calculated and that may materially affect the value of the security. In particular, the value of foreign securities may be materially affected by events occurring after the close of the market on which they are valued, but before a Fund prices its shares. Securities trading in overseas markets present time zone arbitrage opportunities when events affecting portfolio security values occur after the close of the overseas market but prior to the close of the U.S. market. In addition, arbitrage opportunities may exist when trading in a portfolio security or securities is halted and does not resume before a fund calculates its NAV. These arbitrage opportunities may enable short-term traders to profit at the expense of long-term investors. Valuing securities using fair value methodologies involves greater reliance on judgment than valuing securities based on readily available market quotations. A Fund, when using fair value methodologies to price securities, may value those securities higher or lower than another fund using market quotations or its own fair value methodologies to price the same securities. There can be no assurance that a Fund could obtain the fair value assigned to a security if it were to sell the security.
The Funds disclose the value of their investments in a hierarchy based on the inputs used to value the investments. The disclosure hierarchy consists of three broad levels:
● Level 1 — | quoted prices in active markets for identical securities |
Investments whose values are based on quoted market prices in active markets, and whose values are therefore classified as Level 1 prices, include active listed equity securities. The Funds do not adjust the quoted price for such investments, even in situations where the Funds hold a large position and a sale could reasonably impact the quoted price.
● Level 2 — | other significant observable inputs (including quoted prices for similar securities, interest rates, prepayment speeds, credit risk, etc.) |
Investments that trade in markets that are not considered to be active, but whose values are based on quoted market prices, dealer quotations or valuations
CRM Funds | ||
88 |
CRM FUNDS NOTES TO FINANCIAL STATEMENTS — June 30, 2023 (Continued) |
provided by alternative pricing sources supported by observable inputs are classified as Level 2 prices. These generally include certain U.S. government and sovereign obligations, most government agency securities, investment-grade corporate bonds and less liquid listed equity securities.
In addition, foreign securities may require revised valuations if the values of the securities are materially affected by events occurring after the close of the market on which they are valued, but before a Fund prices its shares. As investments whose values are classified as Level 2 prices may include positions that are not traded in active markets and/or are subject to transfer restrictions, valuations may be adjusted to reflect illiquidity and/or non-transferability, which are generally based on available market information.
● Level 3 — | significant unobservable inputs (including the Fund’s own assumptions in determining the fair value of investments) |
Investments whose values are classified as Level 3 prices have significant unobservable inputs, as they may trade infrequently or not at all. When observable prices are not available for these securities, the Funds use one or more valuation techniques for which sufficient and reliable data is available. The inputs used by the Funds in estimating the value of Level 3 prices may include the original transaction price, quoted prices for comparable companies or assets in active markets, completed or pending third-party transactions in the underlying investment or comparable issuers, and changes in financial ratios or cash flows. Level 3 prices may also be adjusted to reflect illiquidity and/or non-transferability, with the amount of such discount estimated by the Funds in the absence of market information. Assumptions used by the Funds due to the lack of observable inputs may significantly impact the resulting value and therefore the Funds’ results of operations.
The inputs or methodology used for valuing securities are not necessarily an indication of the risk associated with investing in those securities. A financial instrument’s level within the fair value hierarchy is based on the lowest level of any inputs both individually and in the aggregate that is significant to the fair value measurement. The Funds’ policy is to recognize transfers among levels as of the beginning of the reporting period. A summary of the inputs used to value the Funds’ investments as of June 30, 2023 is included with each Fund’s Schedule of Investments.
CRM Funds | ||
89 |
CRM FUNDS NOTES TO FINANCIAL STATEMENTS — June 30, 2023 (Continued) |
Foreign Currency Translations. The books and records of the Funds are maintained in U.S. dollars. Transactions denominated in foreign currencies are recorded at the prevailing exchange rates on the valuation date. The value of all assets and liabilities denominated in foreign currencies are translated into U.S. dollars at the exchange rate of such currencies against the U.S. dollar daily. The Funds do not isolate that portion of the results of operations resulting from changes in foreign exchange rates on investments from the fluctuations arising from changes in market prices of those investments. Such fluctuations are included with the net realized and unrealized gain or loss from investments that are disclosed within each Fund’s statement of operations, as applicable.
Federal Income Taxes. Each Fund is treated as a separate entity for federal income tax purposes and intends to continue to qualify as a “regulated investment company” (“RIC”) under Subchapter M of the Internal Revenue Code of 1986, as amended, and to distribute substantially all of its taxable income to its shareholders. Therefore, no Federal income tax provision has been made.
Accounting for Uncertainty in Income Taxes sets forth a minimum threshold for financial statement recognition of the benefit of a tax position taken or expected to be taken in a tax return. Management has analyzed each of the Fund’s tax positions and has concluded that no provision for U.S. income tax is required in each of the Fund’s financial statements. Each of the Fund’s federal tax returns for the prior three fiscal years remains subject to examination by the Internal Revenue Service. On an ongoing basis, management monitors the Funds’ tax positions to determine if any adjustments to its conclusions are necessary.
The Funds recognize interest and penalties, if any, related to unrecognized tax benefits as income tax expense on the Statements of Operations. During the year ended June 30, 2023, the Funds did not incur any interest or penalties.
Security Transactions and Investment Income. Investment security transactions are accounted for on a trade date basis for financial reporting purposes. Each Fund uses the specific identification method for determining realized gains and losses on investments for both financial and federal income tax reporting purposes. Interest income is recorded on the accrual basis and includes the amortization of premium and the accretion of discount. Dividend income
CRM Funds | ||
90 |
CRM FUNDS NOTES TO FINANCIAL STATEMENTS — June 30, 2023 (Continued) |
and expense are recorded on the ex-dividend date. Foreign dividends are also recorded on the ex-dividend date, net of all tax withholdings not eligible for rebates. Withholding taxes on foreign dividends are recorded in accordance with the Fund’s understanding of the applicable country’s tax rules and rates. Distributions received from investments in Real Estate Investment Trusts (“REITs”) are recorded as dividend income on the ex-dividend date, subject to reclassification upon notice of the character of the distributions by the issuer or management estimate. The Funds record expenses as incurred. Common expenses of the Trust are allocated on a pro-rata basis amongst the series of the Trust based on relative net assets.
The Funds’ investments in certain countries are subjected to additional capital gain taxes. Such taxes are due upon sale of individual securities. The Funds accrue for taxes on the capital gains throughout the holding period based on the unrealized gain of the underlying securities, as applicable. The Funds held no such securities during the year ended June 30, 2023.
Class Accounting. In calculating the NAV per share for each class, investment income, realized and unrealized gains and losses and expenses other than class specific expenses, are allocated daily to each class of shares based upon the proportion of net assets of each class at the beginning of each day.
Repurchase Agreements. Each Fund (except Long/Short Opportunities Fund) may, through its custodian, receive delivery of the underlying securities used to collateralize repurchase agreements, the market value of which is required to be in an amount at least equal to 101% of the resale price. The Funds’ investment adviser is responsible for determining that the market value of these underlying securities is maintained at all times at a level at least equal to 101% of the resale price. In event of default of the obligation to repurchase, each Fund has the right to liquidate the collateral and apply the proceeds in satisfaction of the obligation. Provisions of each agreement require that the market value of the collateral is sufficient in the event of default; however, in the event of default or bankruptcy by the other party to the agreement, realization and/or retention of the collateral may be subject to legal proceedings.
Repurchase agreements are entered into by the Funds under Master Repurchase Agreements (“MRA”) which permit the Funds, under certain circumstances including an event of default (such as bankruptcy or insolvency), to offset
CRM Funds | ||
91 |
CRM FUNDS NOTES TO FINANCIAL STATEMENTS — June 30, 2023 (Continued) |
payables and/or receivables under the MRA with collateral held and/or posted to the counterparty and create one single net payment due to or from the Fund.
At June 30, 2023, the open repurchase agreements by counterparty which are subject to a MRA on a net payment basis are as follows:
Repurchase | Fair Value | Cash | Net Amount2 | |||||||||||||
Small Cap Value Fund | ||||||||||||||||
BNP Paribas SA | $ | 168,959 | $ | 168,959 | $ | — | $ | — | ||||||||
Daiwa Capital Markets America | 1,000,000 | 1,000,000 | — | — | ||||||||||||
JP Morgan Securities LLC | 1,000,000 | 1,000,000 | — | — | ||||||||||||
| $ | 2,168,959 | $ | 2,168,959 | $ | — | $ | — | |||||||||
Small/Mid Cap Value Fund | ||||||||||||||||
BNP Paribas SA | $ | 1,728,610 | $ | 1,728,610 | $ | — | $ | — | ||||||||
Citigroup Global Markets, Inc. | 1,727,820 | 1,727,820 | — | — | ||||||||||||
Daiwa Capital Markets America | 1,728,610 | 1,728,610 | — | — | ||||||||||||
JP Morgan Securities LLC | 1,728,610 | 1,728,610 | — | — | ||||||||||||
| $ | 6,913,650 | $ | 6,913,650 | $ | — | $ | — | |||||||||
Mid Cap Value Fund | ||||||||||||||||
BNP Paribas SA | $ | 5,565,803 | $ | 5,565,803 | $ | — | $ | — | ||||||||
Citigroup Global Markets, Inc. | 394,168 | 394,168 | — | — | ||||||||||||
Daiwa Capital Markets America | 5,565,803 | 5,565,803 | — | — | ||||||||||||
JP Morgan Securities LLC | 5,565,803 | 5,565,803 | — | — | ||||||||||||
| $ | 17,091,577 | $ | 17,091,577 | $ | — | $ | — | |||||||||
All Cap Value Fund | ||||||||||||||||
Daiwa Capital Markets America | $ | 76,267 | $ | 76,267 | $ | — | $ | — | ||||||||
JP Morgan Securities LLC | 1,000,000 | 1,000,000 | — | — | ||||||||||||
| $ | 1,076,267 | $ | 1,076,267 | $ | — | $ | — | |||||||||
1 | The value of collateral shown in the table does not reflect value that exceeds the value of the repurchase agreement. Collateral with a value of $2,212,338, $7,051,924, $17,433,412, and $1,097,792, respectively, has been received in connection with open repurchase agreements. |
2 | Net exposure represents the receivable (payable) that would be due to (from) the counterparty in an event of default. |
CRM Funds | ||
92 |
CRM FUNDS NOTES TO FINANCIAL STATEMENTS — June 30, 2023 (Continued) |
Distributions to Shareholders. Dividends and distributions to shareholders are recorded on the ex-dividend date. Distributions from net investment income and net realized gains, if any, will be declared and paid annually.
Use of Estimates in the Preparation of Financial Statements. The preparation of financial statements in conformity with U.S. GAAP requires management to make estimates and assumptions that affect the reported amounts of assets and liabilities at the date of the financial statements and the reported amounts of revenues and expenses during the reporting period. Actual results could differ from those estimates.
3. | Transactions with Affiliates and Other Servicing Agreements. Cramer Rosenthal McGlynn, LLC (“CRM”) serves as investment adviser to the Funds. CRM receives an advisory fee from Small Cap Value Fund, Small/Mid Cap Value Fund, and Mid Cap Value Fund of 0.75% of each Fund’s first $1 billion of average daily net assets; 0.70% of each Fund’s next $1 billion of average daily net assets; and 0.65% of each Fund’s average daily net assets in excess of $2 billion. For its advisory services to All Cap Value Fund, CRM receives 0.70% of the Fund’s first $1 billion of average daily net assets; 0.65% of the Fund’s next $1 billion of average daily net assets; and 0.60% of the Fund’s average daily net assets in excess of $2 billion. |
CRM has contractually agreed to waive a portion of its fees and assume certain expenses of the Funds to the extent that total annual fund operating expenses (excluding taxes, extraordinary expenses, brokerage commissions, acquired fund fees and expenses and interest) exceeds the percentage of average daily net assets as follows:
Investor | Institutional | |
Small Cap Value Fund | 1.50% | 1.25% |
Small/Mid Cap Value Fund | 1.50% | 1.25% |
Mid Cap Value Fund | 1.50% | 1.25% |
All Cap Value Fund | 1.45% | 1.20% |
For its advisory services to Long/Short Opportunities Fund, CRM receives 1.50% of the Fund’s first $1 billion of average daily net assets; 1.45% of the Fund’s next $1 billion of average daily net assets; and 1.40% of the Fund’s average daily net assets in excess of $2 billion. CRM has contractually agreed
CRM Funds | ||
93 |
CRM FUNDS NOTES TO FINANCIAL STATEMENTS — June 30, 2023 (Continued) |
to waive a portion of its fees and assume certain expenses of Long/Short Opportunities Fund to the extent that total annual fund operating expenses (excluding taxes, extraordinary expenses, brokerage commissions, interest, dividend and interest expenses related to short sales, and acquired fund fees and expenses) exceeds the percentage of average daily net assets as follows:
Institutional | |
Long/Short Opportunities Fund | 1.60% |
The expense limitations are in effect until November 1, 2024. Prior to that date, the arrangement may be terminated for a class of a Fund only by the vote of the Board of Trustees of the Funds.
Compliance Services. Pursuant to an agreement, Northern Lights Compliance Services, LLC provides compliance services to the Trust, including the services of a Chief Compliance Officer. The fees payable to Northern Lights are included in the Statements of Operations under other expenses.
Compensation of Trustees and Officers. Trustees and officers of the Funds who are interested persons of CRM, as defined in the 1940 Act, receive no compensation from the Funds.
Trustees of the Funds who are not interested persons of CRM, as defined in the 1940 Act (each an “Independent Trustee”), receive compensation and reimbursement of expenses. Each Independent Trustee receives aggregate annual compensation from the Trust at an annual rate of $60,000 which is allocated on a pro-rata basis amongst the series of the Trust based on relative net assets. Under a Deferred Compensation Plan (the “Plan”) adopted August 12, 2005, an Independent Trustee may elect to defer receipt of all, or a portion, of his annual compensation. If an Independent Trustee opts for deferral, then the deferred amounts are credited to an Independent Trustee’s deferral account and invested and reinvested in Institutional Shares of one or more of the Funds in the series of the Trust until such amounts are distributed in accordance with the Plan. No Independent Trustee deferred their compensation earned for the year ended June 30, 2023. Trustees’ fees reflected in the accompanying financial statements include total compensation earned, which were paid in cash. Each trustee serves during the continued lifetime of the Funds, or the
CRM Funds | ||
94 |
CRM FUNDS NOTES TO FINANCIAL STATEMENTS — June 30, 2023 (Continued) |
earlier of when his or her successor is elected or qualified, the Trustee dies, resigns, is removed or becomes disqualified.
Shareholder Servicing Fees. The Board has adopted a Shareholder Servicing Plan which allows each Fund to obtain, for its Investor Shares, the services of CRM and other qualified financial institutions to act as shareholder servicing agents for its shareholders. Under the Shareholder Servicing Plan, each Fund may pay shareholder servicing agents, including CRM, monthly fees at an annual rate not to exceed 0.25% of the Fund’s average daily net assets attributable to its Investor Shares.
Sub-Transfer Agent Fees. Institutional Shares of each Fund are sold through certain intermediaries that provide accounting, recordkeeping, and/or other services to shareholders. The Board of Trustees has approved payment of the fees charged by these intermediaries for providing these sub-transfer agency services from the assets of the Institutional Shares of each Fund based on reasonable charges for similar services in the industry, subject to certain limitations. CRM, as the Funds’ agent, remits these payments to the intermediaries. In some cases, where the sub-transfer agency fees of an intermediary are greater than the amounts paid to CRM by the Funds for that intermediary, CRM will pay the balance of those fees itself.
4. | Investment Securities Transactions. The cost of investments purchased and the proceeds from investments sold (excluding in-kind transactions and short-term investments) for the year ended June 30, 2023, were as follows: |
Purchases | Sales | Short Sales | Purchases to | |||||||||||||
Small Cap Value Fund | $ | 53,375,358 | $ | 80,588,155 | $ | — | $ | — | ||||||||
Small/Mid Cap Value Fund | 141,464,603 | 73,013,784 | — | — | ||||||||||||
Mid Cap Value Fund | 183,909,139 | 171,219,904 | — | — | ||||||||||||
All Cap Value Fund | 11,761,347 | 12,432,329 | — | — | ||||||||||||
Long/Short Opportunities Fund | 150,365,096 | 111,414,675 | 142,887,432 | 112,111,914 | ||||||||||||
For the year ended June 30, 2023, the aggregate cost of purchases and proceeds from sales of portfolio securities for in-kind transactions was as follows:
Purchases | Sales | Short Sales | Purchases to | |||||||||||||
Small Cap Value Fund | $ | — | $ | 22,872,943 | $ | — | $ | — | ||||||||
CRM Funds | ||
95 |
CRM FUNDS NOTES TO FINANCIAL STATEMENTS — June 30, 2023 (Continued) |
5. | Securities Lending Agreement. Each Fund (except Long/Short Opportunities Fund) may lend their securities pursuant to a securities lending agreement (“Lending Agreement”) with The Bank of New York Mellon. Security loans made pursuant to the Lending Agreement are required at all times to be secured by cash collateral at least equal to 102% of the market value of the securities loaned. The market value of the loaned securities is determined at the close of business of the Fund and any additional required collateral is delivered to the Fund on the next business day. Cash collateral received, pursuant to investment guidelines established by the Funds and approved by the Board of Trustees, is invested in short-term fixed income securities rated in the highest rating category by nationally recognized statistical rating organizations (or of comparable quality if unrated) with a maturity date of 397 days or less, including corporate obligations and money market mutual funds. All such investments are made at the risk of the Funds and, as such, the Funds are liable for investment losses. The Bank of New York Mellon and the lender retain a portion of the earnings from the collateral investments, with the remainder being retained by the Fund. The Funds record securities lending income net of such allocations. In the event the borrower fails to return loaned securities and the collateral received is insufficient to cover the value of the loaned securities and provided such collateral shortfall is not the result of investment losses, The Bank of New York Mellon has agreed to pay the amount of the shortfall to the Funds, or at its discretion, replace the loaned securities. In the event of default or bankruptcy by The Bank of New York Mellon, realization and/or retention of the collateral may be subject to legal proceedings. |
At June 30, 2023, the following Funds had securities on loan:
Market | Cash | |||||||
Small Cap Value Fund | $ | 2,079,882 | $ | 2,168,959 | ||||
Small/Mid Cap Value Fund | 6,748,670 | 6,913,650 | ||||||
Mid Cap Value Fund | 22,226,430 | 22,261,577 | ||||||
All Cap Value Fund | 1,053,160 | 1,076,267 | ||||||
* | Please note any reported shortfall in required collateral coverage of 102% is based on closing market value of securities on loan as of the date of the report. Any required collateral adjustment needed in order to bring coverage to 102% is done on the next business day. |
6. | Short Sale Transactions. In short sale transactions, the Fund sells a security it does not hold in anticipation of a decline in the market price of that security. |
CRM Funds | ||
96 |
CRM FUNDS NOTES TO FINANCIAL STATEMENTS — June 30, 2023 (Continued) |
When the Fund makes a short sale, it will borrow the security sold short (borrowed bond) and deliver the security to the counterparty to which it sold the security short. An amount equal to the proceeds received by the Fund is reflected as an asset and an equivalent liability. The amount of the liability is subsequently marked-to-market to reflect the market value of the short sale. The Fund is required to repay the counterparty any dividends declared on the security sold short, which is shown as dividend expense in the Statements of Operations. The Fund is exposed to market risk based on the amount, if any, that the market value of the security increases beyond the market value at which the position was sold. Thus, a short sale of a security involves the risk that instead of declining, the price of the security sold short will rise. The short sale of securities involves the possibility of an unlimited loss since there is an unlimited potential for the market price of the security sold short to increase. A gain is limited to the price at which the Fund sold the security short. A realized gain or loss is recognized upon the termination of a short sale if the market price is either less than or greater than the proceeds originally received. There is no assurance that the Fund will be able to close out a short position at a particular time or at an acceptable price.
The Fund is required to pledge cash or securities to the broker as collateral for the securities sold short. Collateral requirements are calculated daily based on the current market value of the short positions. Cash that has been pledged to secure the Fund’s obligation to cover the short positions is reported separately on the Statements of Assets and Liabilities. The Fund may receive from or pay to the broker the net of the following amounts:
(i) income on cash collateral held at the broker and (ii) a financing charge to the extent the cash collateral is less than the margin requirement. The net amounts of income or fees are included as interest income or expense, as applicable, on securities sold short in the Statements of Operations.
During the year ended June 30, 2023, Long/Short Opportunities Fund participated in short sale transactions.
CRM Funds | ||
97 |
CRM FUNDS NOTES TO FINANCIAL STATEMENTS — June 30, 2023 (Continued) |
7. | Federal Tax Information. The tax character of distributions utilized during the fiscal years ended June 30, 2023 and June 30, 2022 was as follows: |
For the year ended June 30, 2023 | ||||||||||||||||
Fund | Ordinary | Long-Term | Return of | Total | ||||||||||||
Small Cap Value Fund | $ | 1,953,364 | $ | 409,077 | $ | — | $ | 2,362,441 | ||||||||
Small Mid Cap Value Fund | 1,677,117 | 8,128,760 | — | 9,805,877 | ||||||||||||
Mid Cap Value Fund | 7,523,543 | 9,837,984 | — | 17,361,527 | ||||||||||||
All Cap Value Fund | 292,912 | 1,362,873 | — | 1,655,785 | ||||||||||||
Long/Short Opportunities Fund | 3,277,664 | — | — | 3,277,664 | ||||||||||||
For the year ended June 30, 2022 | ||||||||||||||||
Fund | Ordinary | Long-Term | Return of | Total | ||||||||||||
Small Cap Value Fund | $ | 13,224,279 | $ | 47,208,718 | $ | — | $ | 60,432,997 | ||||||||
Small Mid Cap Value Fund | 29,374,070 | 24,439,488 | — | 53,813,558 | ||||||||||||
Mid Cap Value Fund | 14,344,299 | 58,242,986 | — | 72,587,285 | ||||||||||||
All Cap Value Fund | 2,866,771 | 2,252,731 | — | 5,119,502 | ||||||||||||
Long/Short Opportunities Fund | 27 | 1,310,728 | — | 1,310,755 | ||||||||||||
As of June 30, 2023, the components of accumulated earnings/ (deficit) on a tax basis were as follows:
Fund | Undistributed | Undistributed | Capital | Other | ||||||||||||
Small Cap Value Fund | $ | 1,217,517 | $ | 349,394 | $ | — | $ | — | ||||||||
Small Mid Cap Value Fund | 1,588,123 | 7,213 | — | — | ||||||||||||
Mid Cap Value Fund | 2,545,704 | 4,203,738 | — | — | ||||||||||||
All Cap Value Fund | 40,127 | 5,337 | — | — | ||||||||||||
Long/Short Opportunities Fund | 1,053,452 | — | (6,783,672 | ) | — | |||||||||||
CRM Funds | ||
98 |
CRM FUNDS NOTES TO FINANCIAL STATEMENTS — June 30, 2023 (Continued) |
Fund | Post | Unrealized | Total | |||||||||
Small Cap Value Fund | $ | — | $ | 9,562,306 | $ | 11,129,217 | ||||||
Small Mid Cap Value Fund | — | 31,750,924 | 33,346,260 | |||||||||
Mid Cap Value Fund | — | 90,185,208 | 96,934,650 | |||||||||
All Cap Value Fund | (308,553 | ) | 3,228,210 | 2,965,121 | ||||||||
Long/Short Opportunities Fund | — | 32,179,844 | 26,449,624 | |||||||||
The difference between book basis and tax basis unrealized appreciation, undistributed net investment income (loss) and accumulated net realized gains (losses) from investments is primarily attributable to the tax deferral of losses on wash sales, the mark-to-market on open Swaps, deferral of unsettled short sale losses, and C-Corporation return of capital distributions.
Capital losses incurred after October 31 within the fiscal year are deemed to arise on the first business day of the following fiscal year for tax purposes. All Cap Value Fund incurred and elected to defer such capital losses of $308,553.
At June 30, 2023, Long/Short Opportunities Fund had capital loss carryforwards for federal income tax purposes available to offset future capital gains, along with capital loss carryforwards utilized as follows:
Fund | Short-Term | Long-Term | Total | CLCF | ||||||||||||
Small Cap Value Fund | $ | — | $ | — | $ | — | $ | — | ||||||||
Small Mid Cap Value Fund | — | — | — | — | ||||||||||||
Mid Cap Value Fund | — | — | — | — | ||||||||||||
All Cap Value Fund | — | — | — | — | ||||||||||||
Long/Short Opportunities Fund | 5,397,296 | 1,386,376 | 6,783,672 | — | ||||||||||||
During the fiscal year ended June 30, 2023, certain of the Funds utilized tax equalization which is the use of earnings and profits distributions to shareholders on redemption of shares as part of the dividends paid deduction for income tax purposes. Permanent book and tax differences, primarily
CRM Funds | ||
99 |
CRM FUNDS NOTES TO FINANCIAL STATEMENTS — June 30, 2023 (Continued) |
attributable to tax adjustments for realized gain (loss) on in-kind redemptions, the book/tax basis treatment of equalization credits, resulted in reclassifications for the Funds for the fiscal year ended June 30, 2023 as follows:
Fund | Paid In | Accumulated | ||||||
Small Cap Value Fund | $ | 6,879,622 | $ | (6,879,622 | ) | |||
Small Mid Cap Value Fund | 7,823,715 | (7,823,715 | ) | |||||
Mid Cap Value Fund | 1,025,176 | (1,025,176 | ) | |||||
All Cap Value Fund | 4,191 | (4,191 | ) | |||||
Long/Short Opportunities Fund | — | — | ||||||
The total cost of investments and net unrealized appreciation or depreciation for federal income tax purposes were different from amounts reported for financial reporting purposes. The federal tax cost, and related gross unrealized appreciation and depreciation of securities held by the Funds as of June 30, 2023 were as follows:
Tax Cost of | Gross | Gross | Net Unrealized | |||||||||||||
Small Cap Value Fund | $ | 70,897,138 | $ | 14,468,970 | $ | (4,906,664 | ) | $ | 9,562,306 | |||||||
Small/Mid Cap Value Fund | 196,301,885 | 46,780,578 | (15,029,654 | ) | 31,750,924 | |||||||||||
Mid Cap Value Fund | 347,279,884 | 109,741,315 | (19,556,107 | ) | 90,185,208 | |||||||||||
All Cap Value Fund | 21,341,448 | 4,913,639 | (1,685,429 | ) | 3,228,210 | |||||||||||
Long/Short Opportunities Fund | 106,893,410 | 49,960,387 | (18,045,948 | ) | 31,914,439 | |||||||||||
8. | Derivative Financial Instruments. Each Fund may, but is not required to, invest in derivative contracts, such as swaps and options on securities and securities indices, for a variety of purposes, including: in an attempt to hedge against adverse changes in the market price of securities, interest rates or currency exchange rates; as a substitute for purchasing or selling securities, including short sales; to attempt to increase the Fund’s return as a non-hedging strategy that may be considered speculative; to manage portfolio characteristics; and as a cash flow management technique. Using swaps, options and other derivatives can increase Fund losses and reduce opportunities for gains when market prices, interest rates or the derivative instruments themselves behave in a way not anticipated by the Fund. Using derivatives may increase the volatility of the Fund’s net asset value and may not provide the |
CRM Funds | ||
100 |
CRM FUNDS NOTES TO FINANCIAL STATEMENTS — June 30, 2023 (Continued) |
result intended. Derivatives may have a leveraging effect on the Fund. Some derivatives have the potential for unlimited loss, regardless of the size of the Fund’s initial investment. Changes in a derivative’s value may not correlate well with the referenced asset or metric. The Fund also may have to sell assets at inopportune times to satisfy its obligations. Derivatives may be difficult to sell, unwind or value, and the counterparty may default on its obligations to the Fund.
Options. A Fund purchases and writes call and put options to increase or decrease its exposure to underlying instruments (including credit risk, equity risk, foreign currency exchange rate risk and/or interest rate risk) and/or, in the case of options written, to generate gains from options premiums.
A call option gives the purchaser (holder) of the option the right (but not the obligation) to buy, and obligates the seller (writer) to sell (when the option is exercised) the underlying instrument at the exercise or strike price at any time or at a specified time during the option period. A put option gives the holder the right to sell and obligates the writer to buy the underlying instrument at the exercise or strike price at any time or at a specified time during the option period.
Premiums paid on options purchased and premiums received on options written, as well as the daily fluctuation in market value, are included in the Statements of Assets and Liabilities. When an instrument is purchased or sold through the exercise of an option, the premium is offset against the cost or proceeds of the underlying instrument. When an option expires, a realized gain or loss is recorded in the Statements of Operations to the extent of the premiums received or paid. When an option is closed or sold, a gain or loss is recorded in the Statements of Operations to the extent the cost of the closing transaction exceeds the premiums received or paid). When the Fund writes an option, such option is covered by cash in an amount sufficient to cover the obligation. In purchasing and writing options, the Fund bears the risk of an unfavorable change in the value of the underlying instrument or the risk that the Fund may not be able to enter into a closing transaction due to an illiquid market. Exercise of a written option could result in the Fund purchasing or selling a security when it otherwise would not, or at a price different from the current market value.
CRM Funds | ||
101 |
CRM FUNDS NOTES TO FINANCIAL STATEMENTS — June 30, 2023 (Continued) |
As of June 30, 2023, the Funds did not hold any option contracts.
Forward Foreign Currency Exchange Contracts. A Fund enters into forward foreign currency exchange contracts to gain or reduce exposure, to foreign currencies (foreign currency exchange rate risk). A forward foreign currency exchange contract is an agreement between two parties to buy and sell a currency at a set exchange rate on a specified date. These contracts help to manage the overall exposure to the currencies in which some of the investments held by the Fund are denominated and, in some cases, may be used to obtain exposure to a particular market.
The contract is marked to market daily and the change in market value is recorded as unrealized appreciation (depreciation) in the Statements of Assets and Liabilities. When a contract is closed, a realized gain or loss is recorded in the Statements of Operations equal to the difference between the value at the time it was opened and the value at the time it was closed. Non-deliverable forward foreign currency exchange contracts are settled with the counterparty in cash without the delivery of foreign currency. The use of forward foreign currency exchange contracts involves the risk that the value of a forward foreign currency exchange contract changes unfavorably due to movements in the value of the referenced foreign currencies.
As of June 30, 2023, the Funds did not hold any forward foreign currency exchange contracts.
Swaps. A Fund enters into swap contracts to manage exposure to issuers, markets and securities. Such contracts are agreements between the Fund and a counterparty to make periodic net payments on a specified notional amount or a net payment upon termination. Swap agreements are privately negotiated in the OTC market and may be entered into as a bilateral contract (“OTC swaps”) or centrally cleared (“centrally cleared swaps”). For OTC swaps, any upfront premiums paid are recorded as assets and any upfront fees received are recorded as liabilities and are shown as swap premiums paid and swap premiums received, respectively, in the Statements of Assets and Liabilities and amortized over the term of the OTC swap. Payments received or made by the Fund for OTC swaps are recorded in the Statements of Operations as realized gains or losses, respectively. When an OTC swap is terminated, the Fund will record a realized gain or loss equal to the difference between the proceeds from
CRM Funds | ||
102 |
CRM FUNDS NOTES TO FINANCIAL STATEMENTS — June 30, 2023 (Continued) |
(or cost of) the closing transaction and the Fund’s basis in the contract, if any. Generally, the basis of the contract is the premium received or paid.
In a centrally cleared swap, immediately following execution of the swap agreement, the swap agreement is novated to a central counterparty (the “CCP”) and the Fund’s counterparty on the swap agreement becomes the CCP. The Fund is required to interface with the CCP through a broker. Upon entering into a centrally cleared swap, the Fund is required to deposit initial margin with the broker in the form of cash or securities in an amount that varies depending on the size and risk profile of the particular swap. The daily change in valuation of centrally cleared swaps is recorded as a receivable or payable for variation margin in the Statements of Assets and Liabilities. Payments received from (paid to) the counterparty, including at termination, are recorded as realized gain (loss) in the Statements of Operations.
Swap transactions involve, to varying degrees, elements of interest rate, credit and market risk. Such risks involve the possibility that there will be no liquid market for these agreements, that the counterparty to the agreements may default on its obligation to perform or disagree as to the meaning of the contractual terms in the agreements, and that there may be unfavorable changes in interest rates and/or market values associated with these transactions.
Collateral Requirements. For derivatives traded under an International Swaps and Derivatives Association, Inc. Master Agreement (“ISDA MA”), the collateral requirements are typically calculated by netting the mark-to-market amount for each transaction under such agreement and comparing that amount to the value of any collateral currently pledged by the Fund and the counterparty.
Generally, the amount of collateral due from or to a counterparty is subject to a certain minimum transfer amount threshold before a transfer is required, which is determined at the close of business of the Fund. Any additional required collateral is delivered to/pledged by the Fund on the next business day. Typically, the counterparty is not permitted to sell, re-pledge or use cash and non-cash collateral it receives. The Fund generally agrees not to use non-cash collateral that it receives but may, absent default or certain other circumstances defined in the underlying ISDA MA, be permitted to use cash collateral received. In such cases, interest may be paid pursuant to the collateral
CRM Funds | ||
103 |
CRM FUNDS NOTES TO FINANCIAL STATEMENTS — June 30, 2023 (Continued) |
arrangement with the counterparty. To the extent amounts due to the Fund from its counterparties are not fully collateralized, they bear the risk of loss from counterparty non-performance. Likewise, to the extent the Fund has delivered collateral to a counterparty and stands ready to perform under the terms of its agreement with such counterparty, they bear the risk of loss from a counterparty in the amount of the value of the collateral in the event the counterparty fails to return such collateral. Based on the terms of agreements, collateral may not be required for all derivative contracts.
The following is a summary of the location of derivatives on Long/Short Opportunities Fund’s Statement of Assets and Liabilities as of June 30, 2023:
Location on the Statement of Assets and Liabilities | ||
Derivative Type | Asset Derivatives | Liability Derivatives |
Equity Contracts | Unrealized appreciation on swap agreements | Unrealized depreciation on swap agreements |
Asset Derivative Value | ||
Total | Equity | |
Swap Agreements | $2,306,135 | $2,306,135 |
Liability Derivative Value | ||
Total | Equity | |
Swap Agreements | $334,570 | $334,570 |
The following is a summary of the location of derivatives on Long/Short Opportunities Fund’s Statement of Operations for the year ended June 30, 2023:
Location on the Statements of Operations | ||
Derivative Type | Net Realized Gain (Loss) | Net Change in Unrealized |
Equity Contracts | Net realized gain (loss) from: Swap Agreements, Purchased Option Contracts, and Written Option Contracts | Net change in unrealized appreciation (depreciation) on: Swap agreements |
CRM Funds | ||
104 |
CRM FUNDS NOTES TO FINANCIAL STATEMENTS — June 30, 2023 (Continued) |
Net Realized Gain (Loss) | ||
Total | Equity | |
Swap Agreements | $ (2,615,705) | $ (2,615,705) |
Purchased Option Contracts | 411,480 | 411,480 |
Written Option Contracts | 294,363 | 294,363 |
Net Change in Unrealized Appreciation (Depreciation) | ||
Total | Equity | |
Swap Agreements | $ 2,928,357 | $ 2,928,357 |
The table below summarizes the average balance of derivative holdings by Long/Short Opportunities Fund during the year ended June 30, 2023. The average balance of derivatives held is indicative of the trading volume of the Long/Short Opportunities Fund.
Derivative Volume |
Swap |
$813,120 |
In order to define its contractual rights and to secure rights that will help it mitigate its counterparty risk, a Fund may enter into an ISDA MA or similar agreement with its counterparties. An ISDA MA is a bilateral agreement between the Fund and a counterparty that governs certain OTC derivatives and typically contains, among other things, collateral posting terms and netting provisions in the event of a default and/or termination event. Under an ISDA MA, the Fund may, under certain circumstances, offset with the counterparty certain derivative financial instruments’ payables and/or receivables with collateral held and/or posted and create one single net payment. The provisions of the ISDA MA typically permit a single net payment in the event of default including the bankruptcy or insolvency of the counterparty. Bankruptcy or insolvency laws of a particular jurisdiction may restrict or prohibit the right of offset in bankruptcy, insolvency or other events. For example, notwithstanding
CRM Funds | ||
105 |
CRM FUNDS NOTES TO FINANCIAL STATEMENTS — June 30, 2023 (Continued) |
what contractual rights may be included in an ISDA MA, such laws may prohibit the Fund from setting off amounts owed to a defaulting counterparty under an ISDA MA against amounts owed to the Fund by affiliates of the defaulting counterparty. The insolvency regimes of many jurisdictions do, however, generally permit set-off of simultaneous payables and receivables under certain types of financial contracts between the same legal entity upon a default of the entity, regardless of the existence of a contractual set-off right in those contracts. In addition, certain ISDA MA allow counterparties to OTC derivatives to terminate derivative contracts prior to maturity in the event the Fund’s net assets decline by a stated percentage or the Fund fails to meet the terms of its ISDA MA, which would cause the Fund to accelerate payment of any net liability owed to the counterparty.
Offsetting of Financial and Derivative Assets and Liabilities. For financial reporting purposes, the Funds do not offset derivative assets and derivative liabilities that are subject to netting arrangements in the Statements of Assets and Liabilities.
The following table presents derivative assets and liabilities net of amounts available for offset under an ISDA MA or similar agreement and, as applicable, the related collateral and potential loss exposure to Long/Short Opportunities Fund as of June 30, 2023:
Assets | Liabilities | |||||||
Derivative Financial Instruments: | ||||||||
Swap Agreements | $ | 2,306,135 | $ | 334,570 | ||||
Total derivative assets and liabilities in the Statements of Assets and Liabilities | 2,306,135 | 334,570 | ||||||
Derivatives not subject to an ISDA MA or similar agreement | — | — | ||||||
Total assets and liabilities subject to an ISDA MA | $ | 2,306,135 | $ | 334,570 | ||||
CRM Funds | ||
106 |
CRM FUNDS NOTES TO FINANCIAL STATEMENTS — June 30, 2023 (Continued) |
At June 30, 2023, derivative assets and liabilities by counterparty net of amounts available for offset under an ISDA MA and net of the related collateral received by the Long/Short Opportunities Fund are as follows:
Counterparty | Derivative | Derivative | Value of | Collateral | Net |
Morgan Stanley | $2,306,135 | $(334,570) | $1,971,565 | $1,971,565 | $— |
1 | Net exposure represents the receivable (payable) that would be due to (from) the counterparty in an event of default. |
9. | Risks. In the normal course of business, the Funds invest in securities and enter into transactions where risks exist due to fluctuations in the market (market risk) or failure of the issuer to meet all its obligations, including the ability to pay principal and interest when due (issuer credit risk). The value of securities held by a Fund may decline in response to certain events, including those directly involving the issuers of securities owned by the Fund. The market values of securities or other assets will fluctuate, sometimes sharply and unpredictably, due to changes in general market conditions, overall economic trends or events, governmental actions or intervention, market disruptions caused by trade disputes or other factors, political developments, armed conflicts, economic sanctions, natural or environmental disasters, major cybersecurity events, investor sentiment, the global and domestic effects of a pandemic, inflationary pressures and other factors that may or may not be related to the issuer of the security or other asset. |
In addition to the risks discussed above, Long/Short Opportunities Fund may also be exposed to counterparty credit risk, or the risk that an entity may fail to or be unable to perform on its commitments related to unsettled or open transactions. The Fund manages counterparty credit risk by entering into transactions only with counterparties that CRM believes have the financial resources to honor its obligations and by monitoring the financial stability of those counterparties. Financial assets, which potentially expose a Fund to market, issuer and counterparty credit risks, consist principally of financial instruments and receivables due from counterparties. The extent of a Fund’s exposure to market, issuer and counterparty credit risks with respect to these
CRM Funds | ||
107 |
CRM FUNDS NOTES TO FINANCIAL STATEMENTS — June 30, 2023 (Continued) |
financial assets is approximately its value recorded in the Statements of Assets and Liabilities, less any collateral held by the Fund.
A derivative contract may suffer mark-to-market loss if the value of the contract decreases due to an unfavorable change in the market rates or values of the underlying instrument. Losses can also occur if the counterparty does not perform under the contract.
A Fund’s risk of loss from counterparty credit risk on OTC derivatives is generally limited to the aggregate unrealized gain less the value of any collateral held by the Fund.
For OTC options purchased, a Fund bears the risk of loss in the amount of the premiums paid plus the positive change in market values net of any collateral held by the Fund should the counterparty fail to perform under the contracts. Options written by a Fund do not typically give rise to counterparty credit risk, as options written generally obligate the Fund, and not the counterparty, to perform. A Fund may be exposed to counterparty credit risk with respect to options written to the extent the Fund deposits collateral with its counterparty to a written option. With exchange-traded options purchased and centrally cleared swaps, there is less counterparty credit risk to a Fund since the exchange or clearinghouse, as counterparty to such instruments, guarantees against possible default. The clearinghouse stands between the buyer and the seller of the contract; therefore, credit risk is limited to failure of the clearinghouse. While offset rights may exist under applicable law, the Fund does not have a contractual right of offset against a clearing broker or clearinghouse in event of a default (including the bankruptcy or insolvency). Additionally, credit risk exists in centrally cleared swaps with respect to initial and variation margin that is held in a clearing broker’s customer accounts. While clearing brokers are required to segregate customer margin from their own assets, in the event that a clearing broker becomes insolvent or goes into bankruptcy and at that time there is a shortfall in the aggregate amount of margin held by the clearing broker for all its clients, typically the shortfall would be allocated on a pro rata basis across all the clearing broker’s customers, potentially resulting in losses to the Fund.
10. | Contractual Obligations. The Funds enter into contracts in the normal course of business that contain a variety of indemnification obligations. The Funds’ |
CRM Funds | ||
108 |
CRM FUNDS NOTES TO FINANCIAL STATEMENTS — June 30, 2023 (Concluded) |
maximum exposure under these arrangements is unknown. However, the Funds have not had prior claims or losses pursuant to these contracts. Management has reviewed the Funds’ existing contracts and expects the risk of liability for indemnity claims to be remote.
11. | Subsequent Events. Management has evaluated the impact of all subsequent events on the Funds and has determined that no subsequent event currently requires recognition or disclosure in the financial statements. |
CRM Funds | ||
109 |
CRM FUNDS REPORT OF INDEPENDENT REGISTERED PUBLIC ACCOUNTING FIRM |
To the Shareholders and Board of Trustees of CRM Mutual Fund Trust
Opinion on the Financial Statements
We have audited the accompanying statements of assets and liabilities of CRM Small Cap Value Fund, CRM Small/Mid Cap Value Fund, CRM Mid Cap Value Fund, CRM All Cap Value Fund, and the CRM Long/Short Opportunities Fund (the “Funds”), each a series of CRM Mutual Fund Trust (the “Trust”), including the schedules of investments, as of June 30, 2023, the related statements of operations for the year then ended, the statements of changes in net assets for each of the two years in the period then ended, financial highlights for each of the four years in the period then ended, and the related notes (collectively referred to as the “financial statements”). In our opinion, the financial statements present fairly, in all material respects, the financial position of the Funds as of June 30, 2023, the results of their operations for the year then ended, the changes in their net assets for each of the two years in the period then ended and their financial highlights for each of the four years in the period then ended, in conformity with accounting principles generally accepted in the United States of America.
The financial highlights for the year ended June 30, 2019 have been audited by other auditors, whose report dated August 22, 2019 expressed unqualified opinions on such financial highlights.
Basis for Opinion
These financial statements are the responsibility of the Funds’ management. Our responsibility is to express an opinion on the Funds’ financial statements based on our audits. We are a public accounting firm registered with the Public Company Accounting Oversight Board (United States) (“PCAOB”) and are required to be independent with respect to the Funds in accordance with the U.S. federal securities laws and the applicable rules and regulations of the Securities and Exchange Commission and the PCAOB. We have served as the auditor of one or more of the funds in the Trust since 2020.
We conducted our audits in accordance with the standards of the PCAOB. Those standards require that we plan and perform the audits to obtain reasonable assurance about whether the financial statements are free of material misstatement, whether due to error or fraud. The Funds are not required to have, nor were we engaged to perform, an audit of the Funds’ internal control over financial reporting. As part of our audits we are required to obtain an understanding of internal control
CRM Funds | ||
110 |
CRM FUNDS REPORT OF INDEPENDENT REGISTERED PUBLIC ACCOUNTING FIRM (Concluded) |
over financial reporting, but not for the purpose of expressing an opinion on the effectiveness of the Funds’ internal control over financial reporting. Accordingly, we express no such opinion.
Our audits included performing procedures to assess the risks of material misstatement of the financial statements, whether due to error or fraud, and performing procedures that respond to those risks. Such procedures included examining, on a test basis, evidence regarding the amounts and disclosures in the financial statements. Our audits also included evaluating the accounting principles used and significant estimates made by management, as well as evaluating the overall presentation of the financial statements. Our procedures included confirmation of securities owned as of June 30, 2023 by correspondence with the custodian and brokers; when replies were not received from brokers, we performed other auditing procedures. We believe that our audits provide a reasonable basis for our opinion.

TAIT, WELLER & BAKER LLP
Philadelphia, Pennsylvania
August 29, 2023
CRM Funds | ||
111 |
CRM FUNDS TAX INFORMATION (Unaudited) |
For the fiscal year ended June 30, 2023, certain dividends may be subject to a maximum tax rate of 20%. For individual shareholders, a percentage of the ordinary income dividends (dividends from net investment income and short-term capital gains, if any) from the Funds qualifies for a maximum tax rate of 20%. Complete information is computed and reported in conjunction with your Form 1099-DIV.
For corporate shareholders, a percentage of the ordinary income dividends from the Funds qualify for the dividends-received deduction.
The percentages of ordinary income dividends which qualify for the maximum tax rate of 20% (“Qualified Dividends”) and the dividends-received deduction are as follows:
Qualified | Dividends | |
Small Cap Value Fund | 68.98% | 68.98% |
Small/Mid Cap Value Fund | 100.00% | 100.00% |
Mid Cap Value Fund | 81.77% | 81.77% |
All Cap Value Fund | 100.00% | 100.00% |
Long/Short Opportunities Fund | 68.19% | 68.19% |
In January 2024, shareholders of the Funds will receive Federal income tax information on all distributions paid to their accounts in calendar year 2023, including any distributions paid between July 1, 2023 and December 31, 2023.
CRM Funds | ||
112 |
CRM FUNDS STATEMENT REGARDING LIQUIDITY RISK MANAGEMENT PROGRAM (Unaudited) |
Rule 22e-4 (“Liquidity Rule”) under the Investment Company Act of 1940, as amended (“1940 Act”) requires registered open-end funds to establish and implement a written Liquidity Risk Management Program reasonably designed to assess and manage its liquidity risk. The Trust must also periodically review its liquidity risk. In addition, a written report is provided to the Trust’s Board of Trustees annually which details the operation of the Trust’s program.
The Board of Trustees of the Trust met on May 25, 2023 to review the liquidity risk management program (the “Program”) applicable to the funds of the Trust (the “Funds”) pursuant to the Liquidity Rule. The Board has appointed the investment adviser to the Funds as the Program Administrator for each Fund’s Program. The Program Administrator provided the Board with an annual report (the “Report”) that addressed the operations of the Program and assessed the adequacy and effectiveness of the Program. The Report noted that the Program complied with the key factors for consideration under the Liquidity Rule for assessing, managing and periodically reviewing a Fund’s liquidity risk, including the following points.
Pursuant to its program, each Fund classifies the liquidity of its portfolio investments into one of the four categories defined by the SEC: “Highly Liquid”, “Moderately Liquid”, “Less Liquid” or “Illiquid”. These classifications are reported to the SEC on Form N-PORT. The Liquidity Rule requires open-end funds that are not invested primarily in “Highly Liquid” investments to establish a “Highly Liquid Investment Minimum” (“HLIM”), which is the minimum percentage of net assets that must be invested in Highly Liquid investments (i.e., cash or investments that are reasonably expected to be convertible into cash within three business days without significantly changing the market value of the investment). It was determined through periodic reviews that the Funds’ portfolio holdings have been primarily Highly Liquid and, therefore, the Trust is not required to establish a HLIM at this time.
A Fund may not acquire an investment if, immediately after the acquisition, over 15% of the Fund’s net assets would consist of Illiquid investments (i.e., an investment that cannot reasonably be expected to be sold or disposed of in current market conditions in seven calendar days or less without the sale or disposition significantly changing the market value of the investment). A Fund is required to report to the SEC and the Fund’s Board of Trustees if the Fund holds illiquid investments in excess of the 15% limit. No such reporting was required during the past year. In addition, periodic stress testing confirmed that each Fund held sufficient liquid investments to cover all reasonably foreseeable levels of cash flow.
CRM Funds | ||
113 |
CRM FUNDS STATEMENT REGARDING LIQUIDITY RISK MANAGEMENT PROGRAM (Unaudited) (Concluded) |
There have been no material changes to the Program since its inception. The Report provided to the Board stated that the Program Administrator concluded that based on the operation of the Program during the reporting period, the Program is operating as intended and is effective in implementing the requirements of the Liquidity Rule.
CRM Funds | ||
114 |
CRM FUNDS TRUSTEES AND OFFICERS |
Name and Year | Position(s) | Length | Principal | Number of | Other Board |
INTERESTED TRUSTEE: | |||||
Ronald H. McGlynn | Trustee, President and Chief Executive Officer | Trustee since 2018; President and Chief Executive Officer since 2005. | Chairman, CRM (1973-2019); Chief Executive Officer (1998-2011). | 5 | None |
INDEPENDENT TRUSTEES: | |||||
F. Gregory Ahern | Trustee | Since 2017. | Advisory Director, Sard Verbinnen (since 2016); Chief of Public Communications, Financial Industry Regulatory Authority (2012-2016). | 5 | Chairman of Board, Westerly Hospital Foundation (since 2008); Vice Chairman of Board, Yale New Haven Westerly Hospital Foundation (since 2017). |
Rodney P. Wood | Trustee | Since 2017. | President and Chief Executive Officer, Detroit Lions, Inc. (since 2015); President, Ford Estates, LLC (2007-2015). | 5 | None |
CRM Funds | ||
115 |
CRM FUNDS TRUSTEES AND OFFICERS (Concluded) |
Name and Year | Position(s) | Length | Principal | Number of | Other Board |
OFFICERS: | |||||
Laura Szalyga | Treasurer and Principal Financial Officer | Since 2021. | Vice President, Fund Administration, Ultimus Fund Solutions, LLC (formerly Gemini Fund Services, LLC) (since 2015). | N/A | N/A |
Chad M. Bitterman | Chief Compliance Officer | Since 2021. | Compliance Officer, Northern Lights Compliance Services, LLC (since 2010). | N/A | N/A |
Karen Jacoppo-Wood | Secretary | Since 2022. | Senior Vice President and Associate General Counsel, Ultimus Fund Solutions, LLC (since 2022); Managing Director and Managing Counsel (2019-2022) and Vice President and Managing Counsel (2014-2019) of State Street Bank and Trust Company. | N/A | N/A |
# | Serves during the continued lifetime of the Funds or until he/she earlier dies, resigns or is removed, or if sooner, until the election and qualification of his or her successor. |
CRM Funds | ||
116 |
CRM FUNDS OTHER INFORMATION (Unaudited) |
Quarterly Portfolio Schedule
The Trust files a complete schedule of portfolio holdings for each Fund with the SEC for the first and third quarters of each fiscal year as an exhibit to its reports on Form N-PORT. Form N-PORT is available on the SEC’s website at http://www.sec.gov.
Voting Proxies on Fund Portfolio Securities
A description of the policies and procedures that the Trust used to determine how to vote proxies relating to securities held in the Trust’s portfolios is available, without charge and upon request, by calling 800-CRM-2883 and on the SEC’s website at http://www.sec.gov. Information regarding how the Trust voted proxies relating to portfolio securities during the most recent twelve month period ended June 30 is available without charge and upon request by calling 800-CRM-2883, and on the SEC’s website listed above.
Statement of Additional Information
The Statement of Additional Information (“SAI”) for the Funds includes additional information about the Trustees and is available upon request, without charge, by calling 800-CRM-2883 or by visiting the Funds’ website at http://www.crmfunds.com.
Tailored Shareholder Reports for Mutual Funds and ETFs
Effective January 24, 2023, the SEC adopted rule and form amendments to require mutual funds and ETFs to transmit concise and visually engaging streamlined annual and semiannual reports to shareholders that highlight key information. Other information, including financial statements, will no longer appear in a streamlined shareholder report but must be available online, delivered free of charge upon request, and filed on a semiannual basis on Form N-CSR. The rule and form amendments have a compliance date of July 24, 2024. At this time, management is evaluating the impact of these amendments on the shareholder reports for the Funds.
CRM Funds | ||
117 |
CRM FUNDS OTHER INFORMATION (Unaudited) (Continued) |
Discussion of Board Considerations in Approving Continuance and Renewal of the Investment Advisory Agreement with CRM
In order for Cramer Rosenthal McGlynn, LLC (“CRM”) to remain the Funds’ investment adviser, the Board of Trustees (the “Board”) of CRM Mutual Fund Trust (the “Trust”) must determine annually whether to renew the Investment Advisory Agreement between the Trust and CRM with respect to the Funds. The Board evaluates CRM’s services, performance, personnel, profitability, risk management, compliance programs and other relevant factors throughout the year. In addition, in connection with its review of the Investment Advisory Agreement, the Board reviewed and considered materials provided by CRM at a meeting held on May 25, 2023.
The materials and information reviewed and considered by the Board in connection with its review of the Investment Advisory Agreement included, among other items: (1) a memorandum from independent counsel setting forth the legal standards under the Investment Company Act of 1940, as amended, and the factors the Board could consider in its evaluation of the Investment Advisory Agreement; and (2) reports based on information provided by Morningstar comparing each Fund’s investment performance to the performance of the Fund’s benchmark indices and other mutual funds, and comparing each Fund’s investment advisory fee and net expenses to those of other mutual funds. The Board also discussed and considered, with the assistance of independent counsel, information provided by CRM that described: (i) the nature, extent and quality of CRM’s services provided to the Funds; (ii) the experience and qualifications of the personnel providing those services; (iii) CRM’s investment philosophies and processes; (iv) CRM’s assets under management (“AUM”); (v) the investment advisory fees charged by CRM to the Funds as compared with the fees charged by CRM to other advisory accounts with similar investment objectives and strategies managed by CRM; (vi) CRM’s compliance and risk management procedures; and (vii) an analysis of the profits of CRM related to its services to the Funds. In addition, the Board considered information related to the Funds and CRM previously provided at Board meetings or otherwise.
At the meeting held on May 25, 2023, the Board, including the Independent Trustees voting separately, in the exercise of the Trustees’ business judgment, approved the continuance and renewal of the Investment Advisory Agreement for another year with respect to each Fund.
CRM Funds | ||
118 |
CRM FUNDS OTHER INFORMATION (Unaudited) (Continued) |
In considering the continuance and renewal of the Investment Advisory Agreement, the Board considered the following factors, none of which was determinative or controlling, and reached the following conclusions:
Nature, Extent and Quality of Services Provided
The Board considered the nature, extent and quality of services provided by CRM to the Funds and expected to be provided in the future. The Board reviewed the quality, size and experience of CRM’s professional portfolio management team. The Board reviewed CRM’s investment approach and research process, including CRM’s capabilities and experience in the development and implementation of its value-oriented investment process. Additionally, the Board considered CRM’s compliance programs and compliance record, marketing strategies, CRM’s personnel and the Board’s dealings with CRM. Based on the foregoing, the Board concluded that CRM is able to provide investment and related services that are appropriate in nature, extent and quality in light of the Funds’ investment objectives, policies, strategies and operations, the competitive landscape of the investment company business and investor needs.
Performance Information
In reaching its conclusions, the Board considered the investment performance of each Fund. The Board considered CRM’s focus on achieving long-term performance in a manner consistent with each Fund’s investment objective and investment strategies, as well as CRM’s value-oriented, research driven investment philosophy. The Board considered CRM’s experience in implementing its investment philosophy and concluded that this, along with CRM’s overall approach to investing, supported approval of the continuance of the Investment Advisory Agreement. The Board also discussed the information presented in the Board materials which compared each Fund’s performance against its benchmark, an index and other mutual funds with similar investment objectives and strategies identified by CRM from data provided by Morningstar. Where the Funds had underperformed their peer groups or benchmark indices, the Board considered CRM’s explanations for such underperformance and, as applicable, measures CRM had taken or proposed to take to improve performance. In particular, because CRM pursues a value strategy with respect to the Funds, the Board noted CRM’s explanation regarding past underperformance of value strategies generally versus growth strategies. Further, the Board considered that, in order to provide a relevant sample size, the peer groups for the Funds (other than the Long/Short Opportunities
CRM Funds | ||
119 |
CRM FUNDS OTHER INFORMATION (Unaudited) (Continued) |
Fund) included both funds that pursue a “blend” strategy as well as those that pursue a “value” strategy. The Board considered the following factors in relation to the performance of particular Funds:
Small Cap Value Fund
The Board noted that Institutional Shares of Small Cap Value Fund had outperformed its benchmark, the Russell 2000 Value Index, as well as the Russell 2000 Index, for the one-year period ended December 31, 2022. Further, the Board noted that the Fund had underperformed both the Russell 2000 Value Index and Russell 2000 Index, respectively, for the three-year and five-year periods ended December 31, 2022. Further, the Board noted that the Fund had outperformed the Russell 2000 Value Index but underperformed the Russell 2000 Index for the ten-year period ended December 31, 2022. The Board noted that Institutional Shares of the Fund ranked in the top quartile of funds with similar investment objectives and strategies identified by CRM for the one-year period ended December 31, 2022, ranked in the bottom quartile of funds with similar investment objectives and strategies identified by CRM for the three-year period ended December 31, 2022 and ranked in the third quartile of funds with similar investment objectives and strategies identified by CRM for the five-year and ten-year periods ended December 31, 2022.
Small/Mid Cap Value Fund
The Board noted that Institutional Shares of Small/Mid Cap Value Fund had outperformed its benchmark, the Russell 2500 Value Index, and outperformed the Russell 2500 Index, for the one-year, three-year, five-year and ten-year periods ended December 31, 2022. The Board noted that Institutional Shares of the Fund ranked in the second quartile of funds with similar investment objectives and strategies identified by CRM for the one-year and ten-year periods ended December 31, 2022, and ranked in the top quartile of funds with similar investment objectives and strategies identified by CRM for the three-year and five-year periods ended December 31, 2022.
Mid Cap Value Fund
The Board noted that Institutional Shares of Mid Cap Value Fund had outperformed its benchmark, the Russell Midcap Value Index, as well as the Russell Midcap Index, for the one-year, three-year, five-year and ten-year periods ended December 31, 2022. The Board noted further that Institutional Shares of the Fund ranked in the
CRM Funds | ||
120 |
CRM FUNDS OTHER INFORMATION (Unaudited) (Continued) |
50th percentile of funds with similar investment objectives and strategies identified by CRM for the one-year period ended December 31, 2022 and in the top quartile of funds with similar investment objectives and strategies identified by CRM for the three-year, five-year and ten-year periods ended December 31, 2022.
All Cap Value Fund
The Board noted that Institutional Shares of All Cap Value Fund had underperformed its benchmark, the Russell 3000 Value Index, but outperformed the Russell 3000 Index, for the one-year period ended December 31, 2022. In addition, the Board observed that the Fund had outperformed the Russell 3000 Value Index, as well as the Russell 3000 Index, for the three-year period ended December 31, 2022. Further, the Board noted that the Fund had underperformed the Russell 3000 Value Index, as well as the Russell 3000 Index, for the five-year and ten-year periods ended December 31, 2022. The Board also noted that Institutional Shares of the Fund ranked at the 25th percentile for performance of funds with similar investment objectives and strategies identified by CRM for the one-year and three-year periods ended December 31, 2022, and at the 75th percentile for the five-year period and bottom quartile for the ten-year period ended December 31, 2022.
Long/Short Opportunities Fund
The Board noted that Institutional Shares of Long/Short Opportunities Fund had outperformed its benchmark, the S&P 500 Index, for the one-year period ended December 31, 2022, but underperformed the S&P 500 Index for the three-year and five-year periods ended December 31, 2022. The Board also noted that Institutional Shares of the Fund ranked in the second quartile of funds with similar investment objectives and strategies identified by CRM for the one-year and five-year periods ended December 31, 2022, and in the top quartile of funds with similar investment objectives and strategies identified by CRM for the three-year period ended December 31, 2022.
Conclusion as to Investment Performance
The Board determined that it would continue to monitor each Fund’s performance, but that the information it considered supported approval of the Investment Advisory Agreement.
CRM Funds | ||
121 |
CRM FUNDS OTHER INFORMATION (Unaudited) (Continued) |
Fees and Expenses
In reaching its conclusions, the Board considered the fees and expenses paid by each class of each Fund.
The Board considered the research and analysis conducted by CRM in order to identify investment opportunities for the Funds and attempt to distinguish itself from each Fund’s respective benchmark. The Board observed that CRM relies heavily on its own proprietary research to implement its value-oriented investment philosophy, and considered CRM’s experience in implementing its value-oriented investment philosophy. Further, the Board compared the management fee schedule for each Fund with the standard management fee schedule applicable to institutional separate accounts managed by CRM in a similar investment strategy to that of the applicable Fund. The Board noted the fee schedule for each Fund was lower than the standard management fee schedule applicable to the respective institutional separate accounts managed by CRM in a similar investment strategy up to an AUM size of $25 million. However, citing the fee schedule detailed in Item 5 of Part 2A of CRM’s Form ADV, the Board noted investors in a separate account may ultimately pay equal or lower fees than the fees paid by investors in a Fund with a similar investment strategy when such separate account investors have invested assets in amounts such that applicable breakpoints reduce the overall fees paid for their respective account or if the standard fee schedule applicable to such account is lower than the fee schedule disclosed in Form ADV. In comparing the overall expenses paid by the Funds to the overall expenses paid by institutional separate accounts, the Board considered that the costs associated with the management of the Funds generally are greater than those associated with providing investment advisory services to separately-managed accounts. The Board noted the additional complexities involved in the management of the Funds resulting from more frequent and less predictable cash flows and regulatory requirements, among other factors. The Board considered the additional services provided to the Funds that CRM does not perform for its separate account clients, or services that are broader in scope, including oversight of compliance with the regulatory and tax regimes to which the Funds are subject, oversight of third-party service providers, preparation of prospectuses, shareholder reports and other disclosure documents and preparation of materials for Board meetings. Additionally, the Board considered the business risks that CRM faces regarding the Funds, including regulatory and reputational risks with respect to CRM’s investment decisions and compliance oversight on behalf of the Funds, and the substantial entrepreneurial risks that CRM assumes
CRM Funds | ||
122 |
CRM FUNDS OTHER INFORMATION (Unaudited) (Continued) |
during the initial years of a Fund’s operations. The Board also considered that there may be historical reasons for certain separate account fees, and the element of negotiation with respect to the level of fees paid by CRM’s separate account clients.
The Board also discussed the information provided in the Board materials, which compared the fees and expenses paid by each Fund with the fees and expenses paid by other mutual funds with similar investment objectives and strategies identified by CRM from data provided by Morningstar. In comparing expenses, it was observed that the funds in the 1st percentile represented the most expensive funds, while the funds in the 99th percentile represented the least expensive funds.
Small Cap Value Fund
The Board noted that, based on the information provided, the investment advisory fee for Small Cap Value Fund ranked at the 75th percentile for funds with similar investment objectives and strategies. The Board noted that the Fund’s investment advisory fee was lower than both the median and average advisory fee paid by funds selected by CRM with similar investment objectives and strategies and assets of a comparable size. The Board noted that, based on the information provided, the total net annual operating expenses of Institutional Shares of Small Cap Value Fund ranked in the 75th percentile for funds selected by CRM with similar investment objectives and strategies and assets of a comparable size. The Board noted that the total net annual operating expenses of Institutional Shares of the Fund were lower than both the median and the average net expenses paid by funds selected by CRM with similar investment objectives and strategies.
Small/Mid Cap Value Fund
The Board noted that, based on the information provided, the investment advisory fee for Small/Mid Cap Value Fund ranked at the 50th percentile for funds selected by CRM with similar investment objectives and strategies. The Board noted that the Fund’s investment advisory fee was the same as the median and higher than the average advisory fee paid by funds selected by CRM with similar investment objectives and strategies and assets of a comparable size. The Board noted that, based on the information provided, the total net annual operating expenses of Institutional Shares of Small/Mid Cap Value Fund ranked in the 25th percentile in expenses of funds selected by CRM with similar investment objectives and strategies and assets of a comparable size. The Board noted that the total net annual operating expenses of Institutional Shares of the Fund were higher than both the
CRM Funds | ||
123 |
CRM FUNDS OTHER INFORMATION (Unaudited) (Continued) |
median and the average net expenses paid by funds selected by CRM with similar investment objectives and strategies and assets of a comparable size.
Mid Cap Value Fund
The Board noted that based on the information provided, the investment advisory fee for Mid Cap Value Fund ranked at the 25th percentile for funds selected by CRM with similar investment objectives and strategies. The Board noted that the Fund’s investment advisory fee was higher than both the median and the average advisory fee paid by mutual funds selected by CRM with similar investment objectives and strategies and assets of a comparable size. The Board noted that, based on the information provided, the total net annual operating expenses of Institutional Shares of Mid Cap Value Fund ranked in the first quartile for expenses of funds selected by CRM with similar investment objectives and strategies and assets of a comparable size. The Board noted that the total net annual operating expenses of Institutional Shares of the Fund were higher than both the median and the average net expenses paid by funds selected by CRM with similar investment objectives and strategies and assets of a comparable size.
All Cap Value Fund
The Board noted that, based on the information provided, the investment advisory fee for All Cap Value Fund ranked in the second quartile of funds selected by CRM with similar investment objectives and strategies. The Board noted that the Fund’s current investment advisory fee was equal to the median and higher than the average advisory fees paid by funds selected by CRM with similar investment objectives and strategies and assets of a comparable size. The Board noted that, based on the information provided, the total net annual operating expenses of Institutional Shares of All Cap Value Fund ranked the highest for expenses of funds selected by CRM with similar investment objectives and strategies and assets of a comparable size. The Board noted that the total net annual operating expenses of Institutional Shares of the Fund were higher than both the median and the average net expenses paid by funds selected by CRM with similar investment objectives and strategies and assets of a comparable size.
Long/Short Opportunities Fund
The Board noted that, based on the information provided, the investment advisory fee for Long/Short Opportunities Fund ranked at the 25th percentile for funds
CRM Funds | ||
124 |
CRM FUNDS OTHER INFORMATION (Unaudited) (Continued) |
selected by CRM with similar investment objectives and strategies. The Board noted that the Fund’s investment advisory fee was higher than both the median and average advisory fees paid by funds selected by CRM with similar investment objectives and strategies and assets of a comparable size. The Board noted that, based on the information provided, the total net annual operating expenses of Institutional Shares of Long/Short Opportunities Fund ranked in the first quartile in expenses of funds selected by CRM with similar investment objectives and strategies and assets of a comparable size. The Board noted that the total net annual operating expenses of Institutional Shares of the Fund were higher than both the median and the average net expenses paid by funds selected by CRM with similar investment objectives and strategies and assets of a comparable size.
Conclusion as to Fees and Expenses
In view of what it understood to be the costs of CRM’s proprietary research and CRM’s experience in implementing its value-oriented investment philosophy, the Board concluded that the investment advisory fee paid by each Fund was reasonable in relation to the nature and quality of the services provided by CRM. The Board also indicated it would continue to monitor the Funds’ fees and expenses.
Economies of Scale
The Board considered whether economies of scale would be realized by CRM as each Fund’s assets increased, and the extent to which such economies of scale were reflected in the fees charged under the Investment Advisory Agreement. The Board observed that the Investment Advisory Agreement contains breakpoints that reduce the investment advisory fee rate paid by each Fund on assets above specified levels, and that additional breakpoints had been introduced for certain of the Funds. The Board concluded that breakpoints were an effective way to share any economies of scale or other efficiencies with Fund shareholders as the Funds grow larger. In addition, the Board noted that expense subsidization, investment by CRM in proprietary research, and CRM’s commitment and resource allocation to the Funds may be relevant in considering the sharing of economies of scale, and that profitability also may be an indicator of the existence of any economies of scale. Accordingly, the Board determined that economies of scale, if any, were being appropriately shared with the Funds.
CRM Funds | ||
125 |
CRM FUNDS OTHER INFORMATION (Unaudited) (Continued) |
Profitability
The Board considered the information provided by CRM regarding CRM’s profitability in relation to the Funds and considered the methodology used by CRM in preparing the profitability information. The Board reviewed the financial results of CRM in relation to the Funds for the year ended December 31, 2022. The Board considered CRM’s profit margins with respect to the Funds. The Board also considered information regarding compensation provided to CRM personnel as a percentage of CRM’s net revenue. The Board indicated that the profitability of any adviser was affected by numerous factors, including its organizational structure, method for allocating expenses and the compensation to be paid to its employees, and, therefore, acknowledged the limitations inherent in any comparison of adviser profitability information. The Board concluded that, based on the information provided, the profit to CRM on the fees paid by the Funds was not excessive in view of the nature, quality and extent of services provided.
Other Benefits
The Board considered the other benefits which CRM receives from its relationship with the Funds. The Board noted that CRM acts as the shareholder servicing agent for Investor Shares of the Funds and receives fees under a shareholder service plan in connection with the services CRM provides or arranges as the Funds’ shareholder servicing agent. The Board considered the fees received by CRM under the shareholder service plan, and the amounts paid by CRM to third-party shareholder servicing agents. The Board noted that the amounts paid by CRM to the Funds’ third-party shareholder servicing agents since the inception of the Trust exceeded the amounts paid by Investor Shares of the Funds to CRM under the shareholder servicing plan. The Board considered how CRM uses “soft” commission dollars generated by the Funds to pay for research and brokerage services and the ways in which CRM conducts portfolio transactions for the Funds and selects brokers. The Board concluded that any other benefits derived by CRM from managing the Funds were reasonable.
General Conclusion
Based on the foregoing considerations, the Board, including the Independent Trustees voting separately, in the exercise of the Trustees’ business judgment, concluded that the terms of the Investment Advisory Agreement, including the fees payable thereunder, are fair and reasonable, and voted to approve the continuance and renewal of the Investment Advisory Agreement.
CRM Funds | ||
126 |
CRM FUNDS OTHER INFORMATION (Unaudited) (Continued) |
Privacy Notice
(THIS PRIVACY NOTICE IS BEING DELIVERED WITH THE FUNDS’ SHAREHOLDER REPORT BUT IS NOT DEEMED TO BE A PART OF THE FUNDS’ SHAREHOLDER REPORT)
Set forth below is the policy of CRM Mutual Fund Trust (the “Trust”) concerning the collection and disclosure of non-public personal information regarding investors and prospective investors in the CRM Funds (the “Fund”) who are individuals investing for personal, family, or household purposes. The words “we” and “us” refers to the Trust and the Fund. The words “you” and “your” refers to investors and prospective investors in the Fund who are covered by this policy.
We use administrators, investment managers, custodians, transfer agents, securities brokers, and other third party businesses to conduct many aspects of our business, including processing initial investments, additional investments, redemptions, share transfers, and other transactions that you request. We refer to these third parties below as our “Service Agents.”
As we work together to achieve your investment goals, we will often share with our Service Agents personal and financial information, including, for example, your name, address and telephone number, your e-mail address, your purchases and redemptions of shares of the Funds, your banking arrangements, information on your family members, and your social security number. Our Service Agents may also receive these types of information from other firms that assist us in conducting our business. This information is collected in order to properly handle your account.
To protect the security of your personal and financial information, our Service Agents maintain physical, electronic, and procedural safeguards that meet the standards of applicable laws and regulations.
We may, and we may authorize our Service Agents to, use your personal and financial information and share it with us, other Service Agents, and affiliates of Service Agents in order to provide you with investment services, improve our services, make our procedures more efficient, implement security measures, and fight fraud.
We will not sell your personal and financial information to any outside party. We obtain from our Service Agents confidentiality agreements that prohibit them from selling or improperly using your personal or financial information.
CRM Funds | ||
127 |
CRM FUNDS OTHER INFORMATION (Unaudited) (Concluded) |
On occasion, we and our Service Agents may be required to provide information about you and your transactions to governmental agencies, self-regulatory organizations, industry associations and similar bodies in order to fulfill legal and regulatory requirements. In addition, federal, state, and foreign laws give people involved in lawsuits and other legal proceedings the right under certain circumstances to obtain information from us and our Service Agents, including your personal and financial information. We and our Service Agents may make other disclosures to non-affiliated third parties as permitted by law.
CRM Funds | ||
128 |
[THIS PAGE INTENTIONALLY LEFT BLANK]

TRUSTEES
F. Gregory Ahern
Ronald H. McGlynn
Rodney P. Wood
INVESTMENT ADVISER
Cramer Rosenthal McGlynn, LLC
300 First Stamford Place, Suite 440
Stamford, CT 06902
DISTRIBUTOR
ALPS Distributors, Inc.
1290 Broadway, Suite 1000
Denver, CO 80203
ADMINISTRATOR & TRANSFER AGENT
Ultimus Fund Solutions, LLC
225 Pictoria Drive, Suite 450
Cincinnati, OH 45246
CUSTODIAN
The Bank of New York Mellon
2 Hanson Place, 7th Floor
Brooklyn, NY 11217
LEGAL COUNSEL
Morgan, Lewis & Bockius LLP
One Federal Street
Boston, MA 02110
Investor Information:
800-CRM-2883
www.crmfunds.com
This report is authorized for distribution only to shareholders and to others who have received current prospectuses of the CRM Funds.
CRM-AR-23
Item 2. Code of Ethics.
The Registrant has adopted a code of ethics that applies to the Registrant’s Principal Executive and Principal Financial Officers. For the fiscal year ended June 30, 2023, there were no amendments to a provision of its code of ethics, nor were there any waivers, including implicit waivers granted from a provision of the code of ethics. A copy of the Registrant’s code of ethics is filed with this Form N-CSR under Item 13(a)(1).
Item 3. Audit Committee Financial Expert.
The Registrant’s Board of Trustees has determined that the Registrant has at least one audit committee financial expert serving on its Trustees Committee. The audit committee financial experts serving on the Registrant’s Trustees Committee are F. Gregory Ahern and Rodney P. Wood, each of whom is “independent,” as defined in Item 3(a)(2) of Form N-CSR.
Item 4. Principal Accountant Fees and Services.
Audit Fees
| (a) | The aggregate fees billed for professional services rendered by the principal accountant for the audit of the registrant’s annual financial statements or services that are normally provided by the accountant in connection with statutory and regulatory filings or engagements for the fiscal years ended June 30, 2022 and June 30, 2023 were $80,000 and $80,000, respectively. |
Audit-Related Fees
| (b) | The aggregate fees billed in each of the last two fiscal years for assurance and related services by the principal accountant that are reasonably related to the performance of the audit of the registrant’s financial statements and are not reported under paragraph (a) of this Item were $0 for 2022, and $0 for 2023. |
Tax Fees
| (c) | The aggregate fees billed for professional services rendered by the principal accountant for tax compliance, tax advice, and tax planning during the fiscal years ended June 30, 2022 and June 30, 2023 were $18,000 and $18,000, respectively. These fees related to services consisting of the review of U.S. federal income tax returns, annual excise distribution calculations, India tax compliance services and tax advisory services with regard to foreign equity securities. |
All Other Fees
| (d) | The aggregate fees billed in each of the last two fiscal years for products and services provided by the principal accountant, other than the services reported in paragraphs (a) through (c) of this Item were $0 for 2022, and $0 for 2023. |
| (e)(1) | The Trustees Committee of the Board of Trustees of the Registrant is required to pre-approve the engagement of independent accountants to (i) conduct the annual audit of the series of the Registrant (the “Funds”) and provide their opinion of the Funds’ financial statements, (ii) provide (a) any audit services to the Funds in addition to those described in clause (i) above and (b) non-audit services to the Funds, Cramer Rosenthal McGlynn, LLC (“CRM”) or any entity controlling, controlled by, or under common control with CRM that provides ongoing services to the Funds, if the engagement relates directly to the operations and financial reporting of the Funds. Accordingly, the Registrant’s Trustees Committee pre-approves all audit and non-audit services to be performed by the Registrant’s independent accountant before the accountant is engaged by the Registrant to perform such services. |
| (e)(2) | There were no services described in paragraphs (b) through (d) of this Item (including services required to be approved by the Trustees Committee pursuant to paragraph (c)(7)(ii) of Rule 2-01 of Regulation S-X) that were approved by the Trustees Committee pursuant to paragraph (c)(7)(i)(C) of Rule 2-01 of Regulation S-X. |
| (f) | Not Applicable. |
| (g) | The aggregate non-audit fees billed by the registrant’s accountant for services rendered to the registrant, and rendered to the registrant’s investment adviser (not including any sub-adviser whose role is primarily portfolio management and is subcontracted with or overseen by another investment adviser), and any entity controlling, controlled by, or under common control with the adviser that provides ongoing services to the registrant for each of the last two fiscal years ended June 30, 2022 and June 30, 2023 were $0 and $0, respectively. |
| (h) | The registrant’s audit committee of the board of directors has considered whether the provision of non-audit services that were rendered to the registrant’s investment adviser (not including any sub-adviser whose role is primarily portfolio management and is subcontracted with or overseen by another investment adviser), and any entity controlling, controlled by, or under common control with the investment adviser that provides ongoing services to the registrant that were not pre-approved pursuant to paragraph (c)(7)(ii) of Rule 2-01 of Regulation S-X is compatible with maintaining the principal accountant’s independence. |
| (i) | Not Applicable. |
| (j) | Not Applicable. |
Item 5. Audit Committee of Listed Registrants.
Not applicable.
Item 6. Investments.
| (a) | Schedule of Investments in securities of unaffiliated issuers as of the close of the reporting period is included as part of the report to shareholders filed under Item 1 of this Form. |
| (b) | Not applicable. |
Item 7. Disclosure of Proxy Voting Policies and Procedures for Closed-End Management Investment Companies.
Not applicable.
Item 8. Portfolio Managers of Closed-End Management Investment Companies.
Not applicable.
Item 9. Purchases of Equity Securities by Closed-End Management Investment Company and Affiliated Purchasers.
Not applicable.
Item 10. Submission of Matters to a Vote of Security Holders.
There have been no material changes to the procedures by which shareholders may recommend nominees to the Registrant’s Board of Trustees, where those changes were implemented after the registrant last provided disclosure in response to the requirements of Item 407(c)(2)(iv) of Regulation S-K (17 CFR 229.407) (as required by Item 22(b)(15) of Schedule 14A (17 CFR 240.14a-101)), or this Item.
Item 11. Controls and Procedures.
| (a) | The Registrant’s Principal Executive and Principal Financial Officers have concluded that the Registrant’s disclosure controls and procedures (as defined in Rule 30a-3(c) under the Investment Company Act of 1940 (17 CFR 270.30a-3(c))) are effective based on their evaluation of these controls and procedures required by Rule 30a-3(b) under the Investment Company Act of 1940 (17 CFR 270.30a-3(b)) and Rules 13a-15(b) or 15d-15(b) under the Securities Exchange Act of 1934, as amended (17 CFR 240.13a-15(b) or 240.15d-15(b)). |
| (b) | There were no changes in the Registrant’s internal control over financial reporting (as defined in Rule 30a-3(d) under the Investment Company Act of 1940 (17 CFR 270.30a-3(d))) that occurred during the period covered by this report that has materially affected, or is reasonably likely to materially affect, the Registrant’s internal control over financial reporting. |
Item 12. Disclosure of Securities Lending Activities for Closed-End Management Investment Companies.
Not applicable.
Item 13. Exhibits.
| (a)(1) | Code of Ethics for the Registrant’s Principal Executive and Principal Financial Officers described in Item 2 is filed herewith. |
| (a)(2) | Certifications of the Principal Executive Officer and Principal Financial Officer of the Registrant as required by Rule 30a-2(a) under the Investment Company Act of 1940 are filed herewith. |
SIGNATURES
Pursuant to the requirements of the Securities Exchange Act of 1934 and the Investment Company Act of 1940, the registrant has duly caused this report to be signed on its behalf by the undersigned, thereunto duly authorized.
| (Registrant) | CRM Mutual Fund Trust | ||
| By (Signature and Title)* | /s/ Ronald H. McGlynn | ||
| Ronald H. McGlynn, President and Chief Executive Officer | |||
| (Principal Executive Officer) | |||
| Date: | 9/5/2023 |
Pursuant to the requirements of the Securities Exchange Act of 1934 and the Investment Company Act of 1940, this report has been signed below by the following persons on behalf of the registrant and in the capacities and on the dates indicated.
| By (Signature and Title)* | /s/ Ronald H. McGlynn | ||
| Ronald H. McGlynn, President and Chief Executive Officer | |||
| (Principal Executive Officer) | |||
| Date: | 9/5/2023 |
| By (Signature and Title)* | /s/ Laura Szalyga | ||
| Laura Szalyga, Treasurer | |||
| (Principal Financial Officer) | |||
| Date: | 9/5/2023 |
*Print the name and title of each signing officer under his or her signature.