

Management's Discussion and Analysis of
Results of Operations and Financial Condition
For the three and nine months ended
September 30, 2016
November 2, 2016
INTRODUCTION
This Management's Discussion and Analysis ("MD&A") dated November 2, 2016 is intended to supplement HudBay Minerals Inc.'s unaudited condensed consolidated interim financial statements and related notes for the three and nine months ended September 30, 2016 and 2015 (the "consolidated interim financial statements"). The consolidated interim financial statements have been prepared in accordance with International Financial Reporting Standards (“IFRS"), including International Accounting Standard 34,Interim Financial Reporting, as issued by the International Accounting Standards Board.
References to “Hudbay”, the “Company”, “we”, “us”, “our” or similar terms refer to HudBay Minerals Inc. and its direct and indirect subsidiaries as at September 30, 2016. "Hudbay Peru" refers to HudBay Peru S.A.C., our wholly-owned subsidiary which owns a 100% interest in the Constancia mine, and “Augusta” and “Hudbay Arizona” refer to HudBay Arizona Corporation (formerly named Augusta Resource Corporation), our wholly-owned subsidiary, which indirectly owns a 92.05% interest in the Rosemont project.
Readers should be aware that:
| | — | This MD&A contains certain “forward-looking statements” and “forward-looking information” (collectively, “forward-looking information”) that are subject to risk factors set out in a cautionary note contained in our MD&A. |
| | — | Effective July 1, 2015, we changed our presentation currency to US dollars from Canadian dollars. |
| | — | This MD&A has been prepared in accordance with the requirements of the securities laws in effect in Canada, which may differ materially from the requirements of United States securities laws applicable to US issuers. |
| | — | We use a number of non-IFRS financial performance measures in our MD&A. |
| | — | The technical and scientific information in this MD&A has been approved by qualified persons based on a variety of assumptions and estimates. |
For a discussion of each of the above matters, readers are urged to review the “Notes to Reader” discussion beginning on page 35 of this MD&A.
Additional information regarding Hudbay, including the risks related to our business and those that are reasonably likely to affect our financial statements in the future, is contained in our continuous disclosure materials, including our most recent Annual Information Form, audited consolidated financial statements and Management Information Circular available on SEDAR at www.sedar.com and on EDGAR at www.sec.gov.
All amounts are in US dollars unless otherwise noted.
OUR BUSINESS
We are an integrated mining company producing copper concentrate (containing copper, gold and silver) and zinc metal. With assets in North and South America, we are focused on the discovery, production and marketing of base and precious metals. Through our subsidiaries, we own four polymetallic mines, four ore concentrators and a zinc production facility in northern Manitoba and Saskatchewan (Canada) and Cusco (Peru), and a copper project in Arizona (United States). Our growth strategy is focused on the exploration and development of properties we already control, as well as other mineral assets we may acquire that fit our strategic criteria. Our vision is to become a top-tier operator of long-life, low-cost mines in the Americas. Our mission is to create sustainable value through the acquisition, development and operation of high-quality and growing long-life deposits in mining-friendly jurisdictions. We are governed by theCanada Business Corporations Actand our shares are listed under the symbol "HBM" on the Toronto Stock Exchange, New York Stock Exchange and Bolsa de Valores de Lima. We also have warrants listed under the symbol “HBM.WT” on the Toronto Stock Exchange and “HBM/WS” on the New York Stock Exchange.
1
SUMMARY
In the third quarter of 2016, cash generated from operating activities decreased to $95.9 million from $104.2 million in the same period of 2015. Operating cash flow before change in non-cash working capital increased to $124.2 million in the third quarter of 2016 from $79.0 million in the same quarter of 20151. The increase in operating cash flow is the result of growth in production and copper sales volumes, slightly higher realized sales prices and ongoing cost optimization initiatives at all sites. Offsetting the growth in operating cash flow were movements in non-cash working capital mainly related to receivables and payables that used cash in 2016 and released cash in 2015, leading to the overall reduction in cash generated from operating activities.
Net profit and earnings per share in the third quarter of 2016 were $33.6 million and $0.14, respectively, compared to net loss and loss per share of $11.8 million and $0.05, respectively, in the third quarter of 2015. In addition to the positive factors described above, profit in the third quarter of 2016 was higher than the same period in 2015 as a result of an asset impairment charge of $21.4 million after-tax in 2015 related to equipment inherited from the acquisition of Augusta.
Net profit and earnings per share in the third quarter of 2016 were affected by, among other things, the following items:
| | | Pre-tax gain | | | After-tax gain | | | Per share | |
| | | ($ millions) | | | ($ millions) | | | ($/share) | |
| Gain on mark-to-market of various financial instruments | | 10.5 | | | 10.5 | | | 0.04 | |
| Non-cash deferred tax adjustments | | - | | | 3.2 | | | 0.01 | |
Results at our operations were strong with record quarterly consolidated copper-equivalent production and continued low cash cost in both Peru and Manitoba. In the third quarter of 2016, consolidated cash cost per pound of copper produced, net of by-product credits, was $0.91, which is nearly unchanged compared to the same period last year when it was $0.901. Incorporating sustaining capital, capitalized exploration, royalties and corporate general and administrative (“G&A”) costs, consolidated all-in sustaining cash cost per pound of copper produced, net of by-product credits, in the third quarter of 2016 declined to $1.46 from $1.86 in the third quarter of 20151. The decline was driven by substantial declines in sustaining capital expenditures.
The cost reduction initiatives announced on February 24, 2016 are on track to meet our targets for 2016. Based on these efforts and operating results to date, we expect to meet all of our production and operating cost guidance. Sustaining capital spending is expected to be approximately 10% lower than initial guidance of $220 million as a result of cost savings and deferral of some spending to 2017 and subsequent years.

Production on a copper equivalent basis is calculated by converting contained metal in concentrate produced at realized prices.
________________________________________________
1Cash cost and all-in sustaining cash cost, net of by-product credits, per pound, operating cash flow before changes in non-cash working capital, and operating cash flow per share are not recognized under IFRS. For a detailed description of each of these non-IFRS financial performance measures used in this MD&A, please see the discussion under “Non-IFRS Financial Performance Measures” beginning on page 28 of this MD&A.
2
KEY FINANCIAL RESULTS
| Financial Condition | | | | | | |
| (in $ thousands) | | Sep. 30, 2016 | | | Dec. 31, 2015 | |
| Cash and cash equivalents | | 118,258 | | | 53,852 | |
| Total long-term debt | | 1,223,427 | | | 1,274,880 | |
| Net debt1 | | 1,105,169 | | | 1,221,028 | |
| Working capital | | 138,211 | | | 57,613 | |
| Total assets | | 4,484,805 | | | 4,479,585 | |
| Equity | | 1,797,470 | | | 1,787,290 | |
| Financial Performance | | Three months ended | | | Nine months ended | |
| (in $ thousands, except per share and | | Sep. 30, | | | Sep. 30, | | | Sep. 30, | | | Sep. 30, | |
| cash cost amounts) | | 2016 | | | 2015 | | | 2016 | | | 2015 | |
| Revenue | | 311,424 | | | 269,808 | | | 812,024 | | | 549,410 | |
| Cost of sales | | 242,965 | | | 227,779 | | | 667,351 | | | 489,849 | |
| Profit (loss) before tax | | 42,001 | | | (16,132 | ) | | 31,670 | | | (73,431 | ) |
| Profit (loss) | | 33,571 | | | (11,833 | ) | | 12,080 | | | (75,960 | ) |
| Basic and diluted earnings (loss) per share | | 0.14 | | | (0.05 | ) | | 0.05 | | | (0.32 | ) |
| Cash generated from operating activities | | 95,878 | | | 104,150 | | | 334,949 | | | 114,897 | |
| Operating cash flows before change in non-cash working capital1 | | 124,236 | | | 79,046 | | | 265,611 | | | 114,413 | |
| Operating cash flow per share1 | | 0.53 | | | 0.34 | | | 1.13 | | | 0.49 | |
1Net debt, operating cash flow before change in non-cash working capital and operating cash flow per share, are non-IFRS financial performance measures with no standardized definition under IFRS. For further information and a detailed reconciliation, please see the discussion under "Non-IFRS Financial Reporting Measures" beginning on page 28 of this MD&A.
3
KEY PRODUCTION RESULTS
| | | | Three months ended | | | Three months ended | |
| | | | Sep. 30, 2016 | | | Sep. 30, 2015 | |
| | | | Peru | | | Manitoba | | | Total | | | Peru | | | Manitoba | | | Total | |
| | | | | | | | | | | | | | | | | | | | |
| Contained metal in concentrate produced1 | | | | | | | | | | |
| Copper | tonnes | | 35,604 | | | 10,333 | | | 45,937 | | | 37,647 | | | 10,274 | | | 47,921 | |
| Gold | oz | | 6,867 | | | 22,998 | | | 29,865 | | | 6,712 | | | 19,829 | | | 26,541 | |
| Silver | oz | | 749,498 | | | 294,293 | | | 1,043,791 | | | 663,937 | | | 171,493 | | | 835,430 | |
| Zinc | tonnes | | - | | | 31,606 | | | 31,606 | | | - | | | 24,165 | | | 24,165 | |
| Payable metal in concentrate sold | | | | | | | | | | |
| Copper | tonnes | | 38,859 | | | 9,647 | | | 48,506 | | | 27,391 | | | 11,632 | | | 39,023 | |
| Gold | oz | | 6,479 | | | 19,235 | | | 25,714 | | | 4,758 | | | 29,612 | | | 34,370 | |
| Silver | oz | | 573,097 | | | 207,156 | | | 780,253 | | | 328,948 | | | 264,702 | | | 593,650 | |
| Refined zinc | tonnes | | - | | | 26,211 | | | 26,211 | | | - | | | 25,420 | | | 25,420 | |
| | | | | | | | | | | | | | | | | | | | |
| Cash cost2 | $ /lb | | 1.13 | | | 0.18 | | | 0.91 | | | 0.96 | | | 0.66 | | | 0.90 | |
| | | | | | | | | | | | | | | | | | | | |
| Sustaining cash cost2 | $ /lb | | 1.60 | | | 0.69 | | | | | | 1.82 | | | 1.88 | | | | |
| | | | | | | | | | | | | | | | | | | | |
| All-in sustaining cash cost2 | $ /lb | | | | | | | | 1.46 | | | | | | | | | 1.86 | |
| | | | Nine months ended | | | Nine months ended | |
| | | | Sep. 30, 2016 | | | Sep. 30, 2015 | |
| | | | Peru | | | Manitoba | | | Total | | | Peru | | | Manitoba | | | Total | |
| | | | | | | | | | | | | | | | | | | | |
| Contained metal in concentrate produced1 | | | | | | | | | | |
| Copper | tonnes | | 99,446 | | | 31,262 | | | 130,708 | | | 68,162 | | | 30,979 | | | 99,141 | |
| Gold | oz | | 21,243 | | | 65,571 | | | 86,814 | | | 12,279 | | | 61,154 | | | 73,433 | |
| Silver | oz | | 2,036,940 | | | 726,278 | | | 2,763,218 | | | 1,353,150 | | | 572,512 | | | 1,925,662 | |
| Zinc | tonnes | | - | | | 81,438 | | | 81,438 | | | - | | | 70,557 | | | 70,557 | |
| Payable metal in concentrate sold | | | | | | | | | | |
| Copper | tonnes | | 96,694 | | | 30,565 | | | 127,259 | | | 45,796 | | | 30,090 | | | 75,887 | |
| Gold | oz | | 18,016 | | | 52,170 | | | 70,186 | | | 7,981 | | | 53,914 | | | 61,895 | |
| Silver | oz | | 1,721,512 | | | 548,923 | | | 2,270,435 | | | 648,845 | | | 473,216 | | | 1,122,061 | |
| Refined zinc | tonnes | | - | | | 75,359 | | | 75,359 | | | - | | | 74,856 | | | 74,856 | |
| | | | | | | | | | | | | | | | | | | | |
| Cash cost2 | $ /lb | | 1.08 | | | 0.55 | | | 0.95 | | | 1.05 | | | 1.16 | | | 1.09 | |
| | | | | | | | | | | | | | | | | | | | |
| Sustaining cash cost2 | $ /lb | | 1.49 | | | 1.34 | | | | | | 1.91 | | | 2.11 | | | | |
| | | | | | | | | | | | | | | | | | | | |
| All-in sustaining cash cost2 | $ /lb | | | | | | | | 1.54 | | | | | | | | | 2.10 | |
1Metal reported in concentrate is prior to deductions associated with smelter contract terms.
2Cash cost, sustaining cash cost and all-in sustaining cash cost per pound of copper produced, net of by-product credits are non-IFRS financial performance measures with no standardized definition under IFRS. For further information and a detailed reconciliation, please see the discussion under "Non-IFRS Financial Reporting Measures" beginning on page 28 of this MD&A.
4
CONSTANCIA OPERATIONS REVIEW
| | | | Three months ended | | | Nine months ended | | | Guidance1 | |
| | | | Sep. 30, | | | Sep. 30, | | | Sep. 30, | | | Sep. 30, | | | Annual | |
| | | | 2016 | | | 2015 | | | 2016 | | | 2015 | | | 2016 | |
| Ore mined | tonnes | | 6,945,479 | | | 9,205,199 | | | 20,304,794 | | | 17,593,220 | | | | |
| Copper | % | | 0.67 | | | 0.74 | | | 0.63 | | | 0.68 | | | | |
| Gold | g/tonne | | 0.07 | | | 0.07 | | | 0.07 | | | 0.06 | | | | |
| Silver | g/tonne | | 4.30 | | | 4.82 | | | 4.26 | | | 5.09 | | | | |
| | | | | | | | | | | | | | | | | |
| Ore milled | tonnes | | 6,854,345 | | | 7,059,391 | | | 19,830,454 | | | 16,076,105 | | | | |
| Copper | % | | 0.62 | | | 0.70 | | | 0.61 | | | 0.62 | | | | |
| Gold | g/tonne | | 0.06 | | | 0.07 | | | 0.07 | | | 0.07 | | | | |
| Silver | g/tonne | | 4.76 | | | 6.22 | | | 4.98 | | | 6.04 | | | | |
| Copper concentrate | tonnes | | 140,272 | | | 140,363 | | | 394,555 | | | 250,207 | | | | |
| Concentrate grade | % Cu | | 25.38 | | | 26.82 | | | 25.20 | | | 27.24 | | | | |
| Copper recovery | % | | 83.6 | | | 76.6 | | | 82.7 | | | 68.4 | | | | |
| Gold recovery | % | | 50.5 | | | 42.5 | | | 49.5 | | | 34.6 | | | | |
| Silver recovery | % | | 71.5 | | | 47.0 | | | 64.1 | | | 43.3 | | | | |
| Combined unit operating costs1 | $/tonne | | 8.71 | | | 7.77 | | | 8.13 | | | 8.30 | | | 7.30 - 8.20 | |
1Reflects combined mine and mill costs per tonne of ore milled. Peru operations combined mine and mill unit costs include G&A, reflects the deduction of expected capitalized stripping costs and excludes costs and tonnes associated with pre-commercial production output.
Ore mined during the third quarter of 2016 decreased by 25% compared to the same period in 2015 as ore production rates were aligned to mill throughput rates. Mined and milled copper grades in the third quarter of 2016 were approximately 10% lower than the same period in 2015 as the mine plan continues to advance to lower levels in the pit. Mill throughput during the third quarter of 2016 was marginally affected by repairs to the power supply for one of the grinding circuits and to the process water pond liner. Both repairs arose from installation issues and steps have been taken to prevent future impacts from these issues.
Optimization of plant performance remains the primary focus for Constancia. Total copper recovery continues to improve and was 83.6% in the third quarter of 2016, compared to 76.6% in the same period in 2015, as oxidized copper in the ore feed was lower in the current quarter and the metallurgy associated with the varying ore types is better understood. Gold and silver recoveries also continue to improve.
The molybdenum plant was commissioned and began producing saleable concentrate in July of this year with grades over 50%. Molybdenum production quantities are expected to remain modest but steadily increase as a growing proportion of higher molybdenum grade hypogene ore is processed.
Combined unit operating costs in the third quarter of 2016 were affected by reduced capitalized stripping compared to prior quarters. Combined unit operating costs year-to-date in 2016 remain within guidance expectations.
5
| | | | Three months ended | | | Nine months ended | | | Guidance | |
| Contained metal in | | | Sep. 30, | | | Sep. 30, | | | Sep. 30, | | | Sep. 30, | | | Annual | |
| concentrate produced | | | 2016 | | | 2015 | | | 2016 | | | 2015 | | | 2016 | |
| Copper | tonnes | | 35,604 | | | 37,647 | | | 99,446 | | | 68,162 | | | 110,000 - 130,000 | |
| Gold | oz | | 6,867 | | | 6,712 | | | 21,243 | | | 12,279 | | | | |
| Silver | oz | | 749,498 | | | 663,937 | | | 2,036,940 | | | 1,353,150 | | | | |
| Precious metals1 | oz | | 17,574 | | | 16,197 | | | 50,342 | | | 31,610 | | | 50,000 - 65,000 | |
1Precious metals production includes gold and silver production on a gold-equivalent basis. Silver is converted to gold at a ratio of 70:1.
During the third quarter of 2016, production of copper, gold and silver remained relatively consistent compared to the same period in 2015. Year-to date production of copper, gold and silver were 46%, 73% and 51% higher, respectively, than the same period in 2015. Year-to-date growth reflects the ramp-up of Constancia to full production and the improvements in recoveries made in the last year.
Constancia's metal production and combined mine, mill and G&A unit operating costs are expected to be within guidance ranges for 2016.
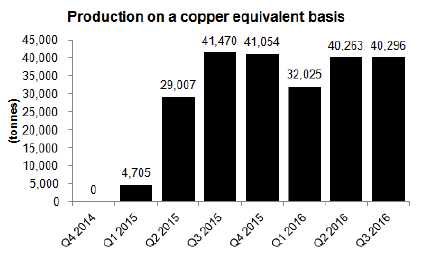
Constancia’s production of copper equivalent tonnes has seen a rapid ramp up in production from pre-commercial production in the first quarter of 2015 to commercial production, which began during the second quarter of 2015. Subsequent to commercial production being achieved, metal production has remained fairly consistent quarter over quarter with the exception of the first quarter of 2016 when the planned replacement of the damaged trunnions at the Constancia mill resulted in downtime of approximately 5 weeks.
6
Peru Cash Cost and Sustaining Cash Cost per Pound of Copper Produced
| | | | Three months ended | | | Nine months ended | |
| | | | Sep. 30, | | | Sep. 30, | | | Sep. 30, | | | Sep. 30, | |
| | | | 2016 | | | 2015 | | | 2016 | | | 2015 | |
| Cash cost per pound of copper produced, net of by-product credits1 | $/lb | | 1.13 | | | 0.96 | | | 1.08 | | | 1.05 | |
| | | | | | | | | | | | | | |
| Sustaining cash cost per pound of copper produced, net of by-product credits1 | $/lb | | 1.60 | | | 1.82 | | | 1.49 | | | 1.91 | |
1Cash cost and sustaining cash costs per pound of copper produced, net of by-product credits, are not recognized under IFRS. For more detail on this non-IFRS financial performance measure, please see the discussion under "Non-IFRS Financial Performance Measures" beginning on page 28 of this MD&A.
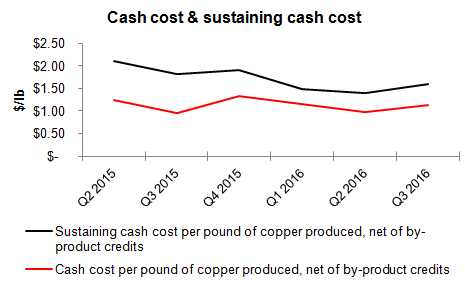
Cash cost per pound of copper produced, net of by-product credits, for the three and nine months ended September 30, 2016 was $1.13 and $1.08, respectively, an increase from the same periods in 2015 of 18% and 3%, respectively, which reflects routine maintenance activities ramping up as the plant matures.
Sustaining cash cost per pound of copper produced, net of by-product credits, for the three and nine months ended September 30, 2016 was $1.60 and $1.49, a decrease from the same period in 2015 of 12% and 22%, respectively, as a result of lower capital costs from tailings impoundment construction.
Metal Sold
| | | | Three months ended | | | Nine months ended | |
| | | | Sep. 30, | | | Sep. 30, | | | Sep. 30, | | | Sep. 30, | |
| | | | 2016 | | | 2015 | | | 2016 | | | 2015 | |
| Payable metal in concentrate | | | | | | | | | | | | | |
| Copper | tonnes | | 38,859 | | | 27,391 | | | 96,694 | | | 45,796 | |
| Gold | oz | | 6,479 | | | 4,758 | | | 18,016 | | | 7,981 | |
| Silver | oz | | 573,097 | | | 328,948 | | | 1,721,512 | | | 648,845 | |
7
MANITOBA OPERATIONS REVIEW
Mines
| | | | Three months ended | | | Nine months ended | |
| | | | Sep. 30, | | | Sep. 30, | | | Sep. 30, | | | Sep. 30, | |
| | | | 2016 | | | 2015 | | | 2016 | | | 2015 | |
| 777 | | | | | | | | | | | | | |
| Ore | tonnes | | 307,436 | | | 261,443 | | | 999,694 | | | 866,252 | |
| Copper | % | | 1.49 | | | 2.35 | | | 1.54 | | | 2.17 | |
| Zinc | % | | 4.73 | | | 2.69 | | | 3.37 | | | 2.89 | |
| Gold | g/tonne | | 1.76 | | | 1.46 | | | 1.48 | | | 1.58 | |
| Silver | g/tonne | | 27.49 | | | 18.86 | | | 20.53 | | | 19.17 | |
| Lalor | | | | | | | | | | | | | |
| Ore | tonnes | | 271,172 | | | 209,655 | | | 814,206 | | | 650,248 | |
| Copper | % | | 0.77 | | | 0.66 | | | 0.64 | | | 0.73 | |
| Zinc | % | | 7.04 | | | 8.06 | | | 6.88 | | | 7.94 | |
| Gold | g/tonne | | 2.21 | | | 2.88 | | | 2.30 | | | 2.69 | |
| Silver | g/tonne | | 24.71 | | | 19.49 | | | 21.60 | | | 20.91 | |
| Reed1 | | | | | | | | | | | | | |
| Ore | tonnes | | 112,929 | | | 113,043 | | | 338,842 | | | 344,192 | |
| Copper | % | | 3.59 | | | 3.18 | | | 4.28 | | | 3.03 | |
| Zinc | % | | 0.59 | | | 1.48 | | | 0.62 | | | 1.03 | |
| Gold | g/tonne | | 0.42 | | | 0.50 | | | 0.52 | | | 0.57 | |
| Silver | g/tonne | | 6.61 | | | 6.55 | | | 7.10 | | | 6.48 | |
| Total Mines | | | | | | | | | | | | | |
| Ore | tonnes | | 691,537 | | | 584,141 | | | 2,152,742 | | | 1,860,692 | |
| Copper | % | | 1.55 | | | 1.90 | | | 1.63 | | | 1.82 | |
| Zinc | % | | 4.96 | | | 4.39 | | | 4.26 | | | 4.31 | |
| Gold | g/tonne | | 1.71 | | | 1.78 | | | 1.64 | | | 1.78 | |
| Silver | g/tonne | | 22.99 | | | 16.71 | | | 18.82 | | | 17.43 | |
1Includes 100% of Reed mine production.
| | | | Three months ended | | | Nine months ended | |
| | | | Sep. 30, | | | Sep. 30, | | | Sep. 30, | | | Sep. 30, | |
| Unit Operating Costs | | | 2016 | | | 2015 | | | 2016 | | | 2015 | |
| Mines | | | | | | | | | | | | | |
| 777 | C$/tonne | | 54.47 | | | 68.55 | | | 51.93 | | | 61.48 | |
| Lalor | C$/tonne | | 64.08 | | | 78.28 | | | 65.50 | | | 75.05 | |
| Reed | C$/tonne | | 47.19 | | | 58.46 | | | 45.48 | | | 63.28 | |
| Total Mines | C$/tonne | | 57.56 | | | 70.81 | | | 56.57 | | | 66.75 | |
Ore mined at our Manitoba mines during the third quarter of 2016 increased by 18% compared to the same period in 2015 as a result of increased production at Lalor and 777. Overall copper grades were 18% lower in the third quarter of 2016 compared to the same quarter of 2015 as a result of lower copper grades at the 777 mine which were partially offset by higher copper grades at the Lalor and Reed mines as a result of the stopes mined. Gold grades in the third quarter of 2016 were in line with the same period in 2015, while zinc and silver grades were
8
higher than the third quarter of 2015 by 13% and 38%, respectively, as a result of higher silver grades at all mines and higher zinc grades at 777 as a result of planned stope sequencing. Unit operating costs for all Manitoba mines for the third quarter of 2016 declined by 19% compared to the same period in 2015, reflecting ongoing cost reduction efforts and increased production.
Year-to-date ore production at our Manitoba mines was 16% higher than the same period in 2015 as a result of higher production at our Lalor and 777 mines. Year-to-date copper and gold grades in 2016 were lower than the same period in 2015 by 10%, and 8%, respectively, primarily related to lower grades at our Lalor and 777 mines. 777 and Lalor grades are in line with mine plan expectations and quarter-to-quarter variances are due to stope sequencing. Year-to-date total mine unit costs were 15% lower than the same period in 2015, reflecting ongoing cost reduction efforts and increased production.
9
Processing Facilities
| | | | Three months ended | | | Nine months ended | |
| | | | Sep. 30, | | | Sep. 30, | | | Sep. 30, | | | Sep. 30, | |
| | | | 2016 | | | 2015 | | | 2016 | | | 2015 | |
| Flin Flon Concentrator | | | | | | | | | | | | | |
| Ore | tonnes | | 433,589 | | | 366,641 | | | 1,299,978 | | | 1,205,797 | |
| Copper | % | | 2.13 | | | 2.62 | | | 2.23 | | | 2.41 | |
| Zinc | % | | 3.42 | | | 2.30 | | | 2.67 | | | 2.34 | |
| Gold | g/tonne | | 1.36 | | | 1.17 | | | 1.24 | | | 1.29 | |
| Silver | g/tonne | | 20.95 | | | 15.10 | | | 17.07 | | | 15.48 | |
| Copper concentrate | tonnes | | 35,939 | | | 36,699 | | | 112,011 | | | 113,149 | |
| Concentrate grade | % Cu | | 23.62 | | | 24.20 | | | 23.94 | | | 23.75 | |
| Zinc concentrate | tonnes | | 23,638 | | | 13,326 | | | 54,212 | | | 45,315 | |
| Concentrate grade | % Zn | | 51.63 | | | 50.68 | | | 51.54 | | | 50.51 | |
| Copper recovery | % | | 92.0 | | | 92.6 | | | 92.7 | | | 92.6 | |
| Zinc recovery | % | | 82.3 | | | 80.1 | | | 80.5 | | | 81.2 | |
| Gold recovery | % | | 59.1 | | | 52.9 | | | 59.3 | | | 57.7 | |
| Silver recovery | % | | 56.3 | | | 53.5 | | | 56.3 | | | 54.3 | |
| Contained metal in concentrate produced | | | | | | | | | | | | | |
| Copper | tonnes | | 8,487 | | | 8,880 | | | 26,820 | | | 26,878 | |
| Zinc | tonnes | | 12,204 | | | 6,755 | | | 27,943 | | | 22,892 | |
| Precious metals1 | oz | | 13,554 | | | 8,659 | | | 36,518 | | | 33,457 | |
| Snow Lake Concentrator | | | | | | | | | | | | | |
| Ore | tonnes | | 289,237 | | | 239,845 | | | 831,771 | | | 664,158 | |
| Copper | % | | 0.76 | | | 0.67 | | | 0.65 | | | 0.73 | |
| Zinc | % | | 7.13 | | | 7.95 | | | 6.92 | | | 7.98 | |
| Gold | g/tonne | | 2.19 | | | 2.84 | | | 2.30 | | | 2.68 | |
| Silver | g/tonne | | 24.16 | | | 19.41 | | | 21.63 | | | 20.82 | |
| Copper concentrate | tonnes | | 8,754 | | | 6,349 | | | 21,347 | | | 19,698 | |
| Concentrate grade | % Cu | | 21.09 | | | 21.95 | | | 20.81 | | | 20.82 | |
| Zinc concentrate | tonnes | | 37,469 | | | 33,229 | | | 104,061 | | | 91,715 | |
| Concentrate grade | % Zn | | 51.78 | | | 52.39 | | | 51.41 | | | 51.97 | |
| Copper recovery | % | | 84.0 | | | 86.4 | | | 82.8 | | | 85.0 | |
| Zinc recovery | % | | 94.1 | | | 91.3 | | | 93.0 | | | 89.9 | |
| Gold recovery | % | | 58.0 | | | 57.2 | | | 56.6 | | | 56.6 | |
| Silver recovery | % | | 57.8 | | | 50.9 | | | 56.1 | | | 55.5 | |
| Contained metal in concentrate produced | | | | | | | | | | | | | |
| Copper | tonnes | | 1,846 | | | 1,394 | | | 4,442 | | | 4,101 | |
| Zinc | tonnes | | 19,402 | | | 17,410 | | | 53,495 | | | 47,665 | |
| Precious metals1 | oz | | 13,649 | | | 13,620 | | | 39,429 | | | 35,876 | |
1Precious metals production includes gold and silver production on a gold-equivalent basis. Silver is converted to gold at a ratio of 70:1.
10
| | | | Three months ended | | | Nine months ended | | | Guidance | |
| | | | Sep. 30, | | | Sep. 30, | | | Sep. 30, | | | Sep. 30, | | | Annual | |
| Unit Operating Costs | | | 2016 | | | 2015 | | | 2016 | | | 2015 | | | 2016 | |
| Concentrators | | | | | | | | | | | | | | | | |
| Flin Flon | C$/tonne | | 22.33 | | | 15.45 | | | 18.26 | | | 15.05 | | | | |
| Snow Lake | C$/tonne | | 24.30 | | | 27.54 | | | 22.39 | | | 27.90 | | | | |
| Combined mine/mill unit operating costs1 | | | | | | | | | | | | | | | | |
| Manitoba | C$/tonne | | 92.45 | | | 109.51 | | | 91.55 | | | 104.96 | | | 80 - 100 | |
1Reflects combined mine, mill and G&A costs per tonne of milled ore. Includes the cost of ore purchased from our joint venture partner at Reed mine. For 2015, combined mine and mill unit operating costs have been restated on the same basis for consistency.
Ore processed in the Flin Flon concentrator in the third quarter of 2016 was 18% higher than the same period in 2015 primarily as a result of higher production at our 777 mine. Zinc, gold and silver recoveries were higher in the third quarter of 2016 compared to the same period in 2015 as a result of higher head grades, while copper recovery was slightly lower due to lower copper head grades. Unit operating costs at the Flin Flon concentrator were 45% higher in the third quarter of 2016 compared to the same period in 2015 as a result of higher maintenance expenditures. Ore processed in the Snow Lake concentrator in the third quarter of 2016 was 21% higher than the same period in 2015 as a result of higher production at the Lalor mine. Unit operating costs at the Snow Lake concentrator were 12% lower in the third quarter of 2016 compared to the third quarter of 2015 as a result of increased production.
Ore processed year-to-date in 2016 in Flin Flon was 8% higher than the same period in 2015 as a result of higher mine production, partially offset by unscheduled maintenance. 2016 year-to-date recoveries of all metals were fairly consistent with the same period in 2015. 2016 year-to-date unit operating costs at the Flin Flon concentrator were 21% higher than the same period in 2015 as a result of lower production in the first quarter of 2016 due to unscheduled maintenance as well as increased maintenance costs. Ore processed year-to-date in Snow Lake was 25% higher than the same period in 2015 as a result of higher production at Lalor. 2016 year-to-date copper, zinc and gold recoveries were lower than the same period in 2015 as a result of lower copper grades. 2016 year-to-date unit operating costs at the Snow Lake concentrator were 20% lower than the same period in 2015 as a result of higher production throughout 2016.
Manitoba combined mine, mill and G&A unit operating costs in the third quarter and year-to-date in 2016 were 16% and 13% lower, respectively, than in the same periods in 2015 as a result of higher overall production and ongoing cost reduction initiatives, and were in line with full year guidance expectations.
| | | | Three months ended | | | Nine months ended | | | Guidance1 | |
| Manitoba contained metal in | | | Sep. 30, | | | Sep. 30, | | | Sep. 30, | | | Sep. 30, | | | Annual | |
| concentrate produced1,2 | | | 2016 | | | 2015 | | | 2016 | | | 2015 | | | 2016 | |
| Copper | tonnes | | 10,333 | | | 10,274 | | | 31,262 | | | 30,979 | | | 40,000 - 50,000 | |
| Zinc | tonnes | | 31,606 | | | 24,165 | | | 81,438 | | | 70,557 | | | 100,000 - 125,000 | |
| Gold | oz | | 22,998 | | | 19,829 | | | 65,571 | | | 61,154 | | | | |
| Silver | oz | | 294,293 | | | 171,493 | | | 726,278 | | | 572,512 | | | | |
| | | | | | | | | | | | | | | | | |
| Precious metals3 | oz | | 27,203 | | | 22,279 | | | 75,947 | | | 69,332 | | | 95,000 - 115,000 | |
1Includes 100% of Reed mine production.
2Metal reported in concentrate is prior to deductions associated with smelter terms.
3Precious metals production includes gold and silver production on a gold-equivalent basis. Silver is converted to gold at a ratio of 70:1.
During the third quarter of 2016, overall Manitoba production of copper, zinc, gold and silver was higher by 1%, 31%, 16% and 72%, respectively, as compared to the same period in 2015 mostly as a result of higher mill throughput.
11
Year-to-date in 2016, overall Manitoba production of copper, zinc, gold and silver was higher by 1%, 15%, 7% and 27%, respectively, as compared to the same period in 2015 as a result of the same factors that impacted third quarter production.
Manitoba’s metal production and combined mine, mill and G&A unit operating costs are expected to be within guidance ranges for 2016.

Manitoba’s metal production of copper equivalent tonnes has remained fairly consistent quarter over quarter.
Zinc Plant
| | | | Three months ended | | | Nine months ended | | | Guidance | |
| | | | Sep. 30, | | | Sep. 30, | | | Sep. 30, | | | Sep. 30, | | | Annual | |
| Zinc Production | | | 2016 | | | 2015 | | | 2016 | | | 2015 | | | 2016 | |
| Zinc Concentrate Treated | | | | | | | | | | | | | | | | |
| Domestic | tonnes | | 57,611 | | | 42,818 | | | 156,632 | | | 129,008 | | | | |
| Purchased | tonnes | | - | | | 5,754 | | | - | | | 22,161 | | | | |
| Total | tonnes | | 57,611 | | | 48,572 | | | 156,632 | | | 151,169 | | | 195,000-240,000 | |
| Refined Metal Produced | | | | | | | | | | | | | | | | |
| Domestic | tonnes | | 26,559 | | | 21,774 | | | 73,695 | | | 63,734 | | | | |
| Purchased | tonnes | | - | | | 3,015 | | | - | | | 11,358 | | | | |
| Total | tonnes | | 26,559 | | | 24,789 | | | 73,695 | | | 75,092 | | | 100,000-120,000 | |
| | | | Three months ended | | | Nine months ended | | | Guidance | |
| | | | Sep. 30, | | | Sep. 30, | | | Sep. 30, | | | Sep. 30, | | | Annual | |
| Unit Operating Costs | | | 2016 | | | 2015 | | | 2016 | | | 2015 | | | 2016 | |
| Zinc Plant1 | C$/lb | | 0.42 | | | 0.45 | | | 0.46 | | | 0.45 | | | 0.38 - 0.46 | |
1Zinc unit operating costs include G&A costs. For 2015, zinc unit operating costs have been restated to include G&A costs for consistency.
12
Production of cast zinc in the third quarter of 2016 was 7% higher than in the same quarter of 2015 as a result of increased production of domestic concentrate. Year-to-date production of cast zinc was 2% lower compared to the same period in 2015 due to limitations on zinc concentrate availability and the biennial maintenance shutdown, which was completed during the second quarter. Operating costs per pound of zinc metal produced in the third quarter of 2016 and year-to-date were 7% lower and 2% higher, respectively, compared to the same periods in 2015 for the same reasons. Refined zinc metal production and operating costs are expected to be within guidance ranges for 2016.
Manitoba Cash Cost and Sustaining Cash Cost per Pound of Copper Produced
| | | | Three months ended | | | Nine months ended | |
| | | | Sep. 30, | | | Sep. 30, | | | Sep. 30, | | | Sep. 30, | |
| | | | 2016 | | | 2015 | | | 2016 | | | 2015 | |
| Cash cost per pound of copper produced, net of by-product credits1 | $/lb | | 0.18 | | | 0.66 | | | 0.55 | | | 1.16 | |
| | | | | | | | | | | | | | |
| Sustaining cash cost per pound of copper produced, net of by-product credits1 | $/lb | | 0.69 | | | 1.88 | | | 1.34 | | | 2.11 | |
1Cash cost and sustaining cash cost per pound of copper produced, net of by-product credits, are not recognized under IFRS. For more detail on this non-IFRS financial performance measure, please see the discussion under "Non-IFRS Financial Performance Measures" beginning on page 28 of this MD&A.
In Manitoba, cash cost, net of by-product credits, in the third quarter of 2016 and year-to-date was $0.18 and $0.55 per pound of copper produced, a decrease of 73% and 53% per pound, respectively, compared to the same periods in 2015. The decrease is largely the effect of decreased purchases of zinc concentrate for processing, and a decrease in general support costs as a result of cost reduction initiatives. Cash cost was also positively impacted by increased sales of precious metals.
In Manitoba, sustaining cash cost, net of by-product credits, in the third quarter of 2016 and year-to-date was $0.69 and $1.34 per pound of copper produced, a decrease of 63% and 36% per pound, respectively, compared to the same periods in 2015, and was affected by the same factors impacting results in the third quarter as well as reduced capital expenditures.
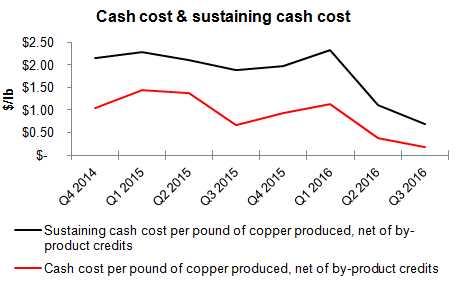
Manitoba cash cost and sustaining cash cost per pound of copper produced, net of by-product credits, in the past two quarters has declined due to reduced G&A costs compared to 2015 as well as increased by-product credits realized.
13
Metal Sold
| | | | Three months ended | | | Nine months ended | |
| | | | Sep. 30, | | | Sep. 30, | | | Sep. 30, | | | Sep. 30, | |
| | | | 2016 | | | 2015 | | | 2016 | | | 2015 | |
| Payable metal in concentrate | | | | | | | | | | | | | |
| Copper | tonnes | | 9,647 | | | 11,632 | | | 30,565 | | | 30,090 | |
| Gold | oz | | 19,235 | | | 29,612 | | | 52,170 | | | 53,914 | |
| Silver | oz | | 207,156 | | | 264,702 | | | 548,923 | | | 473,216 | |
| Refined zinc | tonnes | | 26,211 | | | 25,420 | | | 75,359 | | | 74,856 | |
FINANCIAL REVIEW
Financial Results
In the third quarter of 2016, we recorded a profit of $33.6 million compared to a loss of $11.8 million for the same period in 2015, an increase in profit of $45.4 million.
Year-to-date 2016, we recorded a profit of $12.1 million compared to a loss of $76.0 million in the same period in 2015, an increase in profit of $88.1 million.
The following table provides further details on these variances:
| | | Three months ended | | | Nine months ended | |
| (in $ millions) | | Sep. 30, 2016 | | | Sep. 30, 2016 | |
| Increase (decrease) in components of profit or loss: | | | | | | |
| Revenues | | 41.6 | | | 262.6 | |
| Cost of sales | | | | | | |
| Mine operating costs | | (1.8 | ) | | (81.8 | ) |
| Depreciation and amortization | | (13.4 | ) | | (95.7 | ) |
| Asset impairment | | 34.5 | | | 54.5 | |
| Finance expense | | (3.0 | ) | | (40.4 | ) |
| Other | | 0.2 | | | 6.0 | |
| Tax | | (12.7 | ) | | (17.1 | ) |
| | | | | | | |
| Increase in profit in 2016 compared to 2015 | | 45.4 | | | 88.1 | |
Revenue
Revenue for the third quarter of 2016 was $311.4 million, $41.6 million higher than the same period in 2015, primarily as a result of higher sales volumes resulting from the ramp up of production since last year at Constancia and slightly higher metal prices. This increase was partially offset by higher treatment and refining charges.
Year-to-date revenue was $812.0 million, $262.6 million higher than the same period in 2015, due to higher sales volumes at Constancia, partially offset by lower realized sales prices and higher treatment and refining charges. The following table provides further details of this variance:
14
| | | Three months ended | | | Nine months ended | |
| (in $ millions) | | Sep. 30, 2016 | | | Sep. 30, 2016 | |
| Metals prices1 | | | | | | |
| Higher (lower) copper prices | | 0.7 | | | (64.0 | ) |
| Higher (lower) zinc prices | | 7.2 | | | (12.2 | ) |
| Higher gold prices | | 4.1 | | | 10.5 | |
| Higher silver prices | | 2.7 | | | 3.2 | |
| Sales volumes | | | | | | |
| Higher copper sales volumes | | 45.0 | | | 265.4 | |
| Higher zinc sales volumes | | 1.7 | | | 1.1 | |
| (Lower) higher gold sales volumes | | (11.0 | ) | | 6.1 | |
| Higher silver sales volumes | | 2.2 | | | 16.1 | |
| Other | | | | | | |
| Derivative mark-to-market increase | | 4.1 | | | 12.2 | |
| Pre-production revenue (increase) decrease | | (7.7 | ) | | 57.8 | |
| Other volume and pricing differences | | (0.3 | ) | | (0.2 | ) |
| Effect of higher treatment and refining charges | | (7.1 | ) | | (33.4 | ) |
| | | | | | | |
| Increase in revenue in 2016 compared to 2015 | | 41.6 | | | 262.6 | |
1 See discussion below for further information regarding metals prices.
Our revenue by significant product type is summarized below:
| | | Three months ended | | | Nine months ended | |
| | | Sep. 30, | | | Sep. 30, | | | Sep. 30, | | | Sep. 30, | |
| (in $ millions) | | 2016 | | | 2015 | | | 2016 | | | 2015 | |
| Copper | | 234.8 | | | 189.2 | | | 604.8 | | | 402.6 | |
| Zinc | | 62.9 | | | 50.0 | | | 165.4 | | | 164.2 | |
| Gold | | 33.5 | | | 40.4 | | | 91.0 | | | 74.6 | |
| Silver | | 14.4 | | | 9.5 | | | 37.8 | | | 18.5 | |
| Other | | 0.8 | | | 0.9 | | | 2.0 | | | 2.9 | |
| Gross revenue1 | | 346.4 | | | 290.0 | | | 901.0 | | | 662.8 | |
| Treatment and refining charges | | (35.0 | ) | | (27.9 | ) | | (89.0 | ) | | (55.6 | ) |
| Pre-production revenue | | - | | | 7.7 | | | - | | | (57.8 | ) |
| Revenue | | 311.4 | | | 269.8 | | | 812.0 | | | 549.4 | |
1Copper, gold and silver revenues include unrealized gains and losses related to non-hedge derivative contracts including fixed for floating swaps, that are included in realized prices. Zinc revenues include unrealized gains and losses related to non-hedge derivative contracts that are not included in realized prices.
15
Realized sales prices This measure is intended to enable management and investors to understand the average realized price of metals sold to third parties in each reporting period. The average realized price per unit sold does not have any standardized meaning prescribed by IFRS, is unlikely to be comparable to similar measures presented by other issuers, and should not be considered in isolation or a substitute for measures of performance prepared in accordance with IFRS. Beginning with reporting for the three months and years ended December 31, 2015 and 2014, we have amended the methodology for determining realized prices. For sales of copper, gold and silver where there are outstanding non-hedge derivatives (“QP hedges”) which are intended to manage the provisional pricing risk arising from quotational period terms in concentrate sales agreements, we will no longer remove the impact of derivative mark-to-market adjustments on QP hedges included in revenues reported in the consolidated financial statements. We expect that gains and losses on QP hedges will partially offset provisional pricing adjustments on concentrate sales contracts, so this change is expected to result in a realized price that is better reflective of the proceeds we expect to receive. There has been no change in the realized price calculation methodology for zinc or where copper, gold and silver are being hedged using derivatives other than QP hedges.
Our realized prices for the third quarter and year-to-date 2016 and 2015 are summarized below:
| | | | | | | Realized prices1for the | | | | | | Realized prices1for the | |
| | | | | | | Three months ended | | | | | | Nine months ended | |
| | | | LME QTD | | | Sep. 30, | | | Sep. 30, | | | LME YTD | | | Sep. 30, | | | Sep. 30, | |
| | | | 20162 | | | 2016 | | | 2015 | | | 20162 | | | 2016 | | | 2015 | |
| Prices | | | | | | | | | | | | | | | | | | | |
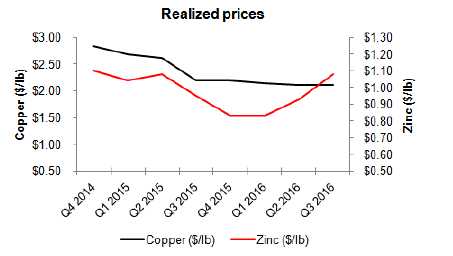
| Copper | $/lb | | 2.17 | | | 2.20 | | | 2.20 | | | 2.14 | | | 2.16 | | | 2.41 | |
| Zinc3 | $/lb | | 1.02 | | | 1.08 | | | 0.95 | | | 0.88 | | | 0.95 | | | 1.02 | |
| Gold4 | $/oz | | | | | 1,303 | | | 1,176 | | | | | | 1,297 | | | 1,203 | |
| Silver4 | $/oz | | | | | 18.43 | | | 16.04 | | | | | | 16.64 | | | 16.49 | |
| 1 | Realized prices exclude refining and treatment charges and are on the sale of finished metal or metal in concentrate. Realized prices include the effect of provisional pricing adjustments on prior period sales. |
| 2 | London Metal Exchange average for copper and zinc prices. |
| 3 | Zinc realized prices include premiums paid by customers for delivery of refined zinc metal, but exclude unrealized gains and losses related to non-hedge derivative contracts that are included in zinc revenues. For the three months ended September 30, 2016, the unrealized component of the zinc derivative resulted in a gain of $0.01/lb. For the three months ended September 30, 2015, the unrealized component of the zinc derivative resulted in a loss of $0.06/lb. |
| 4 | Sales of gold and silver from our 777 and Constancia mines are subject to our precious metals stream agreement with Silver Wheaton, pursuant to which we recognize deferred revenue for precious metals deliveries and also receive cash payments. Stream sales are included within realized prices and their respective deferred revenue and cash payment rates can be found on page 18. |
16
The following table provides a reconciliation of average realized price per unit sold, by metal, to revenues as shown in the consolidated financial statements:
| Three months ended September 30, 2016 | |
| (in $ millions)1 | | Copper | | | Zinc | | | Gold | | | Silver | | | Other | | | Total | |
| Revenue per financial statements | | 234.8 | | | 62.9 | | | 33.5 | | | 14.4 | | | 0.8 | | | 346.4 | |
| Derivative mark-to-market2 | | - | | | (0.7 | ) | | - | | | - | | | - | | | (0.7 | ) |
| Revenue, excluding mark-to-market on non-QP hedges | | 234.8 | | | 62.2 | | | 33.5 | | | 14.4 | | | 0.8 | | | 345.7 | |
| Payable metal in concentrate sold3 | | 48,506 | | | 26,211 | | | 25,714 | | | 780,253 | | | - | | | - | |
| Realized price4 | | 4,841 | | | 2,374 | | | 1,303 | | | 18 | | | - | | | - | |
| Realized price5 | | 2.20 | | | 1.08 | | | - | | | - | | | - | | | - | |
| Nine months ended September 30, 2016 | |
| (in $ millions)1 | | Copper | | | Zinc | | | Gold | | | Silver | | | Other | | | Total | |
| Revenue per financial statements | | 604.8 | | | 165.4 | | | 91.0 | | | 37.8 | | | 2.0 | | | 901.0 | |
| Derivative mark-to-market2 | | - | | | (7.8 | ) | | - | | | - | | | - | | | (7.8 | ) |
| Revenue, excluding mark-to-market on non-QP hedges | | 604.8 | | | 157.6 | | | 91.0 | | | 37.8 | | | 2.0 | | | 893.2 | |
| Payable metal in concentrate sold3 | | 127,259 | | | 75,359 | | | 70,186 | | | 2,270,435 | | | - | | | - | |
| Realized price4 | | 4,752 | | | 2,091 | | | 1,297 | | | 17 | | | - | | | - | |
| Realized price5 | | 2.16 | | | 0.95 | | | - | | | - | | | - | | | - | |
| Three months ended September 30, 2015 | |
| (in $ millions)1 | | Copper | | | Zinc | | | Gold | | | Silver | | | Other | | | Total | |
| Revenue per financial statements | | 189.2 | | | 50.0 | | | 40.4 | | | 9.5 | | | 0.9 | | | 290.0 | |
| Derivative mark-to-market2 | | - | | | 3.4 | | | - | | | - | | | - | | | 3.4 | |
| Revenue, excluding mark-to-market on non-QP hedges | | 189.2 | | | 53.4 | | | 40.4 | | | 9.5 | | | 0.9 | | | 293.4 | |
| Payable metal in concentrate sold3 | | 39,023 | | | 25,420 | | | 34,370 | | | 593,650 | | | - | | | - | |
| Realized price4 | | 4,848 | | | 2,100 | | | 1,176 | | | 16 | | | - | | | - | |
| Realized price5 | | 2.20 | | | 0.95 | | | - | | | - | | | - | | | - | |
| Nine months ended September 30, 2015 | |
| (in $ millions)1 | | Copper | | | Zinc | | | Gold | | | Silver | | | Other | | | Total | |
| Revenue per financial statements | | 402.6 | | | 164.2 | | | 74.6 | | | 18.5 | | | 2.9 | | | 662.8 | |
| Derivative mark-to-market2 | | - | | | 4.4 | | | - | | | - | | | - | | | 4.4 | |
| Difference in average versus realized exchange rate | | 0.7 | | | 0.3 | | | (0.2 | ) | | - | | | - | | | 0.8 | |
| Revenue, excluding mark-to-market on non-QP hedges | | 403.3 | | | 168.9 | | | 74.4 | | | 18.5 | | | 2.9 | | | 668.0 | |
| Payable metal in concentrate sold3 | | 75,887 | | | 74,856 | | | 61,895 | | | 1,122,061 | | | - | | | - | |
| Realized price4 | | 5,315 | | | 2,257 | | | 1,203 | | | 16 | | | - | | | - | |
| Realized price5 | | 2.41 | | | 1.02 | | | - | | | - | | | - | | | - | |
1Average realized price per unit sold may not calculate based on amounts presented in this table due to rounding.
2Derivative mark-to-market excludes mark-to-market on QP hedges.
3Copper and zinc shown in tonnes and gold and silver shown in ounces.
4Realized price for copper and zinc in $/metric tonne and realized price for gold and silver in $/oz.
5Realized price for copper and zinc in $/lb.
The price, quantity and mix of metals sold, along with movements in the Canadian dollar, affect our revenue, operating cash flow and profit. Revenue from metals sales can vary from quarter to quarter due to production levels, shipping volumes and transfer of risk and title to customers.
17
Stream Sales
The following table shows stream sales included within realized prices and their respective deferred revenue and cash payment rates:
| | | | Three months ended | | | Nine months ended | |
| | | | Sep. 30, 2016 | | | Sep. 30, 2016 | |
| | | | Manitoba | | | Peru | | | Manitoba | | | Peru | |
| Gold | oz | | 8,219 | | | 3,665 | | | 25,738 | | | 11,937 | |
| Silver | oz | | 96,016 | | | 573,097 | | | 311,886 | | | 1,721,512 | |
| Gold deferred revenue drawdown rate1 | $/oz | | 1,105 | | | 436 | | | 1,067 | | | 436 | |
| Gold cash rate2 | $/oz | | 407 | | | 400 | | | 405 | | | 400 | |
| Silver deferred revenue drawdown rate1 | $/oz | | 20.23 | | | 7.39 | | | 19.47 | | | 7.39 | |
| Silver cash rate2 | $/oz | | 6.00 | | | 5.90 | | | 5.97 | | | 5.90 | |
| | | | Three months ended | | | Nine months ended | |
| | | | Sep. 30, 2015 | | | Sep. 30, 2015 | |
| | | | Manitoba | | | Peru | | | Manitoba | | | Peru | |
| Gold | oz | | 10,608 | | | 2,701 | | | 26,727 | | | 5,924 | |
| Silver | oz | | 115,321 | | | 328,948 | | | 254,100 | | | 648,845 | |
| Gold deferred revenue drawdown rate1 | $/oz | | 946 | | | 436 | | | 978 | | | 436 | |
| Gold cash rate2 | $/oz | | 402 | | | 400 | | | 405 | | | 400 | |
| Silver deferred revenue drawdown rate1 | $/oz | | 19.17 | | | 7.63 | | | 19.76 | | | 7.63 | |
| Silver cash rate2 | $/oz | | 5.93 | | | 5.90 | | | 5.91 | | | 5.90 | |
1Deferred revenue amortization is recorded in Manitoba at C$1,382/oz and C$25.23/oz for gold and silver, respectively, (2015 - C$1,243/oz and C$25.18/oz) and converted to US dollars at the exchange rate in effect at the time of revenue recognition.
2The gold and silver cash rate for Manitoba increased by 1% from $400/oz and $5.90/oz effective August 1, 2015. Subsequently every year, on August 1, the cash rate will increase by 1% compounded. The weighted average cash rate is disclosed.
18
Cost of Sales
Our detailed cost of sales is summarized as follows:
| | | Three months ended | | | Nine months ended | |
| | | Sep. 30, | | | Sep. 30, | | | Sep. 30, | | | Sep. 30, | |
| (in $ thousands) | | 2016 | | | 2015 | | | 2016 | | | 2015 | |
| Manitoba | | | | | | | | | | | | |
| Manitoba mines | | 29,012 | | | 29,751 | | | 87,780 | | | 93,222 | |
| Manitoba concentrators | | 12,801 | | | 9,384 | | | 32,118 | | | 29,133 | |
| Zinc plant | | 16,284 | | | 14,398 | | | 48,474 | | | 46,836 | |
| Purchased ore and concentrate (before inventory changes) | | 3,985 | | | 4,713 | | | 12,204 | | | 28,163 | |
| Changes in product inventory | | (2,973 | ) | | 15,790 | | | 1,867 | | | (2,973 | ) |
| Depreciation and amortization | | 30,559 | | | 31,974 | | | 91,186 | | | 78,543 | |
| G&A | | 9,847 | | | 16,212 | | | 26,531 | | | 60,842 | |
| Freight, royalties and other charges | | 9,369 | | | 11,281 | | | 27,853 | | | 30,802 | |
| Total Manitoba cost of sales | | 108,884 | | | 133,503 | | | 328,013 | | | 364,568 | |
| | | | | | | | | | | | | |
| Peru | | | | | | | | | | | | |
| Mine | | 16,396 | | | 17,207 | | | 43,309 | | | 25,822 | |
| Concentrator | | 31,934 | | | 27,082 | | | 86,468 | | | 48,461 | |
| Changes in product inventory | | 7,793 | | | (11,965 | ) | | 5,006 | | | (35,725 | ) |
| Depreciation and amortization | | 51,720 | | | 36,869 | | | 129,252 | | | 46,159 | |
| G&A | | 11,387 | | | 10,563 | | | 31,444 | | | 17,853 | |
| Freight, royalties and other charges | | 14,851 | | | 14,520 | | | 43,859 | | | 22,711 | |
| Total Peru cost of sales | | 134,081 | | | 94,276 | | | 339,338 | | | 125,281 | |
| | | | | | | | | | | | | |
| | | | | | | | | | | | | |
| Cost of sales | | 242,965 | | | 227,779 | | | 667,351 | | | 489,849 | |
Total cost of sales for the third quarter of 2016 was $243.0 million, reflecting an increase of $15.2 million from the third quarter of 2015. Cost of sales related to Peru was $39.8 million higher primarily as a result of increased payable metal in concentrate sold during the third quarter of 2016 compared to the same period of 2015. Cost of sales related to Manitoba was $24.6 million lower than the same period in 2015. For Manitoba, the decline is a result of lower sales volumes mainly due to the timing of sales and production.
Year-to date cost of sales for 2016 was $667.4 million, an increase of $177.6 million compared to the same period in 2015. In addition to the above noted factors, Manitoba G&A declined as a result of cost reduction efforts and the fact that the prior year included $17.1 million associated with new collective bargaining agreements. Cost of sales related to Peru were higher as a result of the Constancia mine and concentrator achieving commercial production in the second quarter of 2015.
For details on unit operating costs refer to the respective tables in the “Operations Review” section beginning on page 5 of this MD&A.
19
For the third quarter of 2016, other significant variances in expenses from operations, compared to the same period in 2015, include the following:
| — | Selling and administrative expenses increased by $3.7 million, which was primarily the result of higher share based compensation expenses of $4.4 million from the impact of re-valuing these rewards to higher share prices during the current quarter compared to the same period last year. This was partially offset by a decrease in general support costs as a result of efforts to reduce discretionary spending. |
| | |
| — | Asset impairment expenses were $34.5 million in the third quarter of 2015 as a result an impairment charge associated with equipment related to the acquisition of Augusta. |
| | |
| — | Finance expenses increased by $3.0 million as a result of higher interest costs and amortization of finance fees on our senior secured revolving credit facilities in Canada (the “Canada Facility”) and Peru (the “Peru Facility” and, together with the Canada Facility, the “Credit Facilities”), which were a function of drawdowns on these Credit Facilities. |
| | |
| — | Other finance gains increased by $1.9 million primarily as a result of: |
| | — | A fair value adjustment on the embedded derivative related to the senior unsecured notes and our gold option liability related to the acquisition of the New Britannia mine and mill (“NBM Mill”) resulted in a gain of $7.7 million in the third quarter of 2016 compared to losses of $8.1 million in the third quarter of 2015; |
| | — | Foreign exchange expenses resulted in losses of $0.5 million in the third quarter of 2016 compared to gains of $4.0 million in the third quarter of 2015; and |
| | — | Mark-to-market adjustments on warrants resulted in decreases in gains of $10.7 million compared to the same period last year. |
For 2016 year-to-date, other significant variances in expenses from operations, compared to 2015, include the following:
| — | Selling and administrative expenses increased by $1.8 million, which was primarily the result of higher share based compensation expenses of $4.8 million from the impact of re-valuing these rewards to higher share prices during the current year-to-date period compared to the same period last year. This was partially offset by a decrease in general support costs as a result of efforts to reduce discretionary spending. |
| | |
| — | Asset impairment expenses were $54.5 million for year-to-date 2015. This resulted from an impairment of $34.5 million in the Arizona business unit in the third quarter of 2015, as described above, and an impairment charge of $19.9 million taken in the second quarter of 2015 as a result of the decision not to proceed with construction of the new concentrator at Lalor following the acquisition of the NBM Mill in May 2015. |
| | |
| — | Finance expenses increased by $40.4 million primarily as a result of the achievement of commercial production at Constancia. This triggered the cessation of capitalization of interest costs associated with our senior unsecured notes resulting in the recognition of approximately $27.2 million of additional interest costs on the consolidated interim income statements. In addition, we incurred higher interest costs and amortization of finance fees on our Credit Facilities, which were a function of drawdowns on these Credit Facilities. |
| | |
| — | Other finance gains increased by $4.1 million primarily as a result of: |
| | — | A fair value adjustment on the embedded derivative related to the senior unsecured notes and our gold option liability related to the acquisition of the NBM Mill resulted in gains of $7.4 million compared to the same period last year; |
| | — | Disposals, impairment and mark-to-market adjustments on held for trading and available-for-sale investments resulted in a net gain of $1.3 million during the current period of 2016 compared to a loss of $4.0 million during the same period last year; and |
20
— | Partially offsetting these impacts was a $2.0 million mark-to-market gain on warrants compared to a gain of $10.9 million in the comparative period in 2015. |
Tax Expense (Recovery)
For the three and nine months ended September 30, 2016, tax expense increased by $12.7 million and $17.1 million, respectively, compared to the same periods in 2015. The following table provides further details:
| | | Three months ended | | | Nine months ended | |
| | | Sep. 30, | | | Sep. 30, | | | Sep. 30, | | | Sep. 30, | |
| (in $ thousands) | | 2016 | | | 2015 | | | 2016 | | | 2015 | |
| Deferred tax expense (recovery) - income tax1 | | 7,857 | | | (7,361 | ) | | 8,874 | | | (11,932 | ) |
| Deferred tax (recovery) expense - mining tax1 | | (1,487 | ) | | 336 | | | 773 | | | 3,078 | |
| Total deferred tax expense (recovery) | | 6,370 | | | (7,025 | ) | | 9,647 | | | (8,854 | ) |
| Current tax expense - income tax | | 1,778 | | | 2,539 | | | 5,680 | | | 6,305 | |
| Current tax expense - mining tax | | 282 | | | 187 | | | 4,263 | | | 5,078 | |
| Total current tax expense | | 2,060 | | | 2,726 | | | 9,943 | | | 11,383 | |
| | | | | | | | | | | | | |
| Tax expense (recovery) | | 8,430 | | | (4,299 | ) | | 19,590 | | | 2,529 | |
1Deferred tax expense (recovery) represents our draw down/increase of non-cash deferred income and mining tax assets/liabilities.
Income Tax Expense
Our effective income tax rate on the income before tax for 2016 year-to-date was approximately 46.0% (2015 year-to-date - 7.7%) . Applying the estimated Canadian statutory income tax rate of 27.0% to our income before taxes of $31.7 million would have resulted in a tax expense of approximately $8.6 million; however, we recorded an income tax expense of $14.6 million (2015 year-to-date recovery - $5.6 million). The significant items causing our effective income tax rate to be different than the 27.0% estimated Manitoba statutory income tax rate include:
| — | Certain deductible temporary differences with respect to additional liabilities for Manitoba decommissioning and restoration and other employee benefit liabilities were not recognized, as it was not probable that we would realize the recovery based on the timing of the reversals of the deductible temporary differences and the future projected taxable profit of the Manitoba operations, adjusted for the average annual effective rate methodology, resulting in a decrease in deferred tax expense of approximately $1.0 million (2015 year-to-date increase - $6.0 million); |
| — | The tax benefit of certain Peruvian expenses was not recognized in the year since it was not considered probable that the benefit of these expenditures would be realized as the tax authorities in Peru would view them as non-deductible expenditures for income tax purposes, resulting in an increase in deferred tax expense of $5.7 million (2015 year-to-date - $3.7 million); |
| — | Certain deductible temporary differences with respect to our foreign operations are recorded using an income tax rate other than the Canadian statutory income tax rate of 27.0%, resulting in a decrease in deferred tax expense of $1.3 million (2015 year-to-date - $6.2 million); |
| — | A decrease in the deferred tax expense of $2.6 million (2015 year-to-date – increase $2.9 million) due to the fact that certain Canadian non-monetary assets are recognized at historical cost while the tax bases of the assets change as exchange rates fluctuate, which gives rise to taxable temporary differences; and |
| — | Increases to our decommissioning and restoration liabilities in Manitoba resulting from a decrease in discount rates required us to record a corresponding non-cash increase to property, plant, and equipment. We recognized a deferred tax expense of $4.1 million (2015 year-to-date - $1.6 million) related to the increase in property, plant and equipment; however, we did not recognize a deferred tax recovery related to the increase in the decommissioning and restoration liabilities because we determined it is not probable that we will realize the benefit of the recovery. |
21
Mining Tax Expense
Applying the estimated Manitoba mining tax rate of 10.0% to our income before taxes for 2016 year-to-date of $31.7 million would have resulted in a tax expense of approximately $3.2 million and we recorded a mining tax expense of $5.0 million (2015 year-to-date - $8.2 million). For year-to date 2016, our effective rate for mining taxes was approximately 15.9% (2015 year-to-date - 11.1%) . Effective mining tax rates can vary significantly based on the composition of our earnings and the expected amount of mining taxable profits. Corporate costs and other costs not related to mining operations are not deductible in computing mining profits. A brief description of how mining taxes are calculated in our various business units is discussed below.
Manitoba
The Province of Manitoba imposes mining tax on profit related to the sale of mineral products mined in the Province of Manitoba (mining taxable profit) at the following rates:
| — | 10% of total mining taxable profit if mining profit is $50 million or less; |
| — | 15% of total mining taxable profit if mining profits are between $55 million and $100 million; and |
| — | 17% of total mining taxable profit if mining profits exceed $105 million. |
We estimate that the tax rate that will be applicable when temporary differences reverse will be approximately 10.0% .
Peru
The Peruvian government imposes two parallel mining tax regimes, the Special Mining Tax and the Modified Royalty, on companies' operating mining income on a sliding scale, with progressive rates ranging from 2.0% to 8.4% and 1.0% to 12.0%, respectively. Based on financial forecasts, we have recorded a deferred tax liability as at September 30, 2016 at the tax rate we expect to apply when temporary differences reverse.
22
LIQUIDITY AND CAPITAL RESOURCES
Senior Secured Revolving Credit Facilities
On March 30, 2016, we amended and restated our Canadian and Peruvian Credit Facilities to consolidate the lender groups and restructure the two Credit Facilities to provide, among other things, more flexible financial covenants. During the second quarter, an additional commitment of $30.0 million was received, bringing total availability under the Credit Facilities to $530.0 million.
We have approximately $69 million in letters of credit issued to support Peruvian reclamation obligations; these letters of credit had previously been cash collateralized. During the third quarter of 2016, we reissued these letters of credit under our Peru Facility and released the associated restricted cash, which in turn was utilized to repay indebtedness under the Credit Facilities.
As at September 30, 2016, between our two Credit Facilities we have drawn $266.0 million in cash and $104.8 in letters of credit, leaving total undrawn availability of $159.2 million.
As at September 30, 2016, we were in compliance with our covenants under the Credit Facilities.
Equipment Finance Facility
As at September 30, 2016, we had approximately $58.5 million owing under the facility.
Financial Condition
Financial Condition as at September 30, 2016 compared to December 31, 2015
Cash and cash equivalents increased by $64.4 million from December 31, 2015 to $118.3 million as at September 30, 2016. This increase was mainly a result of cash generated from operating activities of $334.9 million, drawdowns on our Credit Facilities of $59.3 million and a net release of restricted cash of $45.9 million. These inflows were partly offset by $149.3 million of capital investments primarily at our Peru and Manitoba operations, debt principal repayments of $108.4 million and interest payments of $103.5 million. We hold the majority of our cash and cash equivalents in low-risk, liquid investments with major Canadian and Peruvian financial institutions. Working capital increased by $80.6 million to $138.2 million from December 31, 2015 to September 30, 2016. In addition to the increased cash and cash equivalents position:
| — | Current portion of long-term debt decreased by $53.4 million mainly as a result of amendments to the Peru Facility to defer scheduled amortization; |
| — | Prepaid expenses increased by $38.7 million mainly as a result of timing related to the payment of interest on long-term debt; |
| — | Trade and other payables decreased by $14.8 million primarily as a result of the timing of capital spending resulting in higher trade payables at December 31, 2015; and |
| — | Trade and other receivables decreased by $85.2 million primarily due to the timing of sales and receipts of statutory amounts owing. |
23
Cash Flows
The following table summarizes our cash flows for the three and nine months ended September 30, 2016 and September 30, 2015:
| | | Three months ended | | | Nine months ended | |
| | | Sep. 30, | | | Sep. 30, | | | Sep. 30, | | | Sep. 30, | |
| (in $ thousands) | | 2016 | | | 2015 | | | 2016 | | | 2015 | |
| Profit (loss) for the period | | 33,571 | | | (11,833 | ) | | 12,080 | | | (75,960 | ) |
| Tax expense (recovery) | | 8,430 | | | (4,299 | ) | | 19,590 | | | 2,529 | |
| Items not affecting cash | | 85,820 | | | 94,538 | | | 244,354 | | | 188,917 | |
| Taxes (paid) recovered | | (3,585 | ) | | 640 | | | (10,413 | ) | | (1,073 | ) |
| Operating cash flows before changes in non-cash working capital | | 124,236 | | | 79,046 | | | 265,611 | | | 114,413 | |
| Change in non-cash working capital | | (28,358 | ) | | 25,104 | | | 69,338 | | | 484 | |
| Cash generated from operating activities | | 95,878 | | | 104,150 | | | 334,949 | | | 114,897 | |
| Cash generated (used) in investing activities | | 17,640 | | | (97,533 | ) | | (103,186 | ) | | (396,001 | ) |
| Cash (used) generated in financing activities | | (137,029 | ) | | (6,262 | ) | | (167,613 | ) | | 218,420 | |
| Effect of movement in exchange rates on cash and cash equivalents | | (134 | ) | | (1,243 | ) | | 256 | | | (2,016 | ) |
| | | | | | | | | | | | | |
| (Decrease) increase in cash and cash equivalents | | (23,645 | ) | | (888 | ) | | 64,406 | | | (64,700 | ) |
Cash Flow from Operating Activities
Cash generated from operating activities was $95.9 million in the third quarter of 2016, a decrease of $8.3 million compared with the same period last year. Operating cash flows before change in non-cash working capital were $124.2 million during the third quarter of 2016, reflecting an increase of $45.2 million compared to the third quarter of 2015, mainly as a result of higher sales volumes and an improving gross margin following the ramp up of production at Constancia. Changes in non-cash working capital used $28.4 million of cash in the third quarter of 2016 mostly due to the timing of trade receivables and payables.
Year-to-date cash generated from operating activities was $334.9 million in 2016, an increase of $220.1 million compared with the same period last year. The changes are for the same reasons described above.
Cash Flow from Investing and Financing Activities
During the third quarter of 2016, we used $119.4 million in investing and financing activities primarily driven by principal payments of $80.1 million, interest and financing fee payments of $54.3 million, and capital expenditures of $50.6 million. This was partially offset by a release of restricted cash in the amount of $68.6 million.
Year-to-date, we used $270.8 million of cash in investing and financing activities primarily driven by capital expenditures, interest and finance fee payments, reclassifications to restricted cash and principal repayments.
24
Capital Expenditures
The following summarizes accrued and cash additions to capital assets for the periods indicated:
| | | Three months | | | | | | | | | | |
| | | ended | | | Nine months ended | | | Guidance | |
| | | Sep. 30, | | | Sep. 30, | | | Sep. 30, | | | Sep. 30, | | | Annual | |
| (in $ millions) | | 2016 | | | 2015 | | | 2016 | | | 2015 | | | 20161 | |
| Manitoba sustaining capital expenditures | | 9.1 | | | 22.2 | | | 47.8 | | | 52.3 | | | 80.0 | |
| Peru sustaining capital expenditures | | 35.2 | | | 67.0 | | | 86.3 | | | 135.0 | | | 140.0 | |
| Total sustaining capital expenditures | | 44.3 | | | 89.2 | | | 134.1 | | | 187.3 | | | 220.0 | |
| Arizona other capitalized costs | | 5.3 | | | 14.4 | | | 22.0 | | | 35.1 | | | 30.0 | |
| Peru other capitalized costs | | 1.5 | | | 14.3 | | | 17.7 | | | 56.3 | | | | |
| Manitoba other capitalized costs | | 1.8 | | | 13.8 | | | 15.8 | | | 20.7 | | | | |
| Capitalized exploration | | 0.6 | | | 0.3 | | | 1.9 | | | 3.3 | | | 3.0 | |
| Capitalized interest | | 3.7 | | | 3.7 | | | 11.0 | | | 38.3 | | | | |
| Other capitalized costs | | - | | | 0.1 | | | - | | | 0.1 | | | | |
| Total other capitalized costs | | 12.9 | | | 46.6 | | | 68.4 | | | 153.8 | | | | |
| Total accrued capital additions | | 57.2 | | | 135.8 | | | 202.5 | | | 341.1 | | | | |
| Reconciliation to cash capital additions: | | | | | | | | | | | | | | | |
Decommissioning and restoration
obligation | | (3.7 | ) | | (7.8 | ) | | (26.9 | ) | | (16.5 | ) | | | |
| Capitalized interest | | (3.7 | ) | | (3.7 | ) | | (11.0 | ) | | (38.3 | ) | | | |
| Changes in capital accruals and other | | 0.8 | | | 6.2 | | | (15.3 | ) | | 106.4 | | | | |
| | | | | | | | | | | | | | | | |
| Total cash capital additions | | 50.6 | | | 130.5 | | | 149.3 | | | 392.7 | | | | |
1Sustaining capital expenditure guidance excludes capitalized interest.
Sustaining capital expenditures in Manitoba for the three and nine months ended September 30, 2016 were $9.1 million and $47.8 million, respectively, a decrease of $13.1 and $4.5 million, compared to the same period in 2015. This decrease is primarily due to decreases in capitalized development and underground mine development.
Sustaining capital expenditures in Peru for the three and nine months ended September 30, 2016 were $35.2 million and $86.3 million, respectively, a decrease of $31.8 million and $48.7 million, compared to the same period in 2015. This decrease is the result of reduced capitalized stripping.
Sustaining capital expenditures for 2016 are expected to be approximately 10% lower than initial guidance of $220 million as a result of cost savings and deferral of some spending to 2017 and subsequent years.
Other Peru capitalized costs include capitalized pre-commercial production operating costs, net of pre-commercial production sales receipts for 2015, and capitalized stripping costs, as well as decommissioning and restoration adjustments. Other Manitoba capitalized costs include decommissioning and restoration adjustments.
25
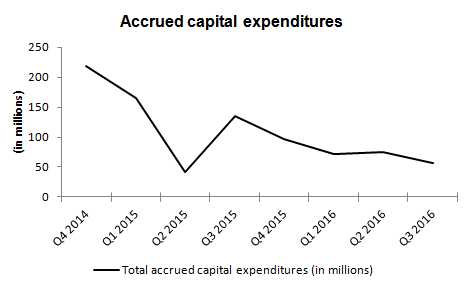
Accrued capital expenditures have significantly decreased quarter over quarter. The decrease is primarily due to decreased expenditures at our Constancia project due to the completion of the Constancia mine during the second quarter of 2015. In Peru capital expenditures include pre-production net revenues, which is the primary reason why there was a large decline in Q2 2015 accrued capital additions.
Capital Commitments
As at September 30, 2016, we had outstanding capital commitments in Canada of approximately $0.8 million primarily related to a committed mobile equipment purchase, of which approximately $0.2 million cannot be terminated by Hudbay; approximately $3.0 million in Peru related to sustaining capital costs, of which all can be terminated by Hudbay; and approximately $163.2 million in Arizona, primarily related to the Rosemont project and expected to be paid after the commencement of Rosemont construction, of which approximately $78.1 million cannot be terminated by Hudbay.
Contractual Obligations
The following table summarizes, as at September 30, 2016, our contractual obligations that have changed materially since our annual MD&A. Operating lease obligations and decommissioning and restoration obligations did not change materially since December 31, 2015.
| | | Less than | 1-3 | 4-5 | After 5 |
| Payment Schedule (in $ millions) | Total | 1 Year | Years | Years | Years |
| Long-term debt obligations | 1,771.8 | 123.8 | 631.3 | 1,016.7 | - |
| Capital lease obligations | 11.9 | 3.3 | 6.4 | 2.2 | - |
| Purchase obligation - capital commitments | 167.0 | 15.5 | 21.1 | 1.1 | 129.3 |
| Purchase obligation - other commitments1 | 792.4 | 72.7 | 247.2 | 388.0 | 84.5 |
1Primarily made up of a long-term agreement with operational suppliers, obligation for power purchase, concentrate, fleet and port services.
Liquidity
As at September 30, 2016, we had total liquidity of approximately $277.5 million, including $118.3 million in cash and cash equivalents, as well as $159.2 million in availability under our Credit Facilities. We expect that our current liquidity and future cash flows will be sufficient to meet our obligations in the coming year.
26
Outstanding Share Data
As of November 1, 2016, there were 236,231,688 common shares of Hudbay issued and outstanding. In addition, Hudbay warrants to acquire an aggregate of 21,830,490 common shares of Hudbay were outstanding and Augusta warrants to acquire an aggregate of 1,039,500 common shares of Hudbay and 561,000 warrants of Hudbay were outstanding; there were also options for an aggregate of 1,477,045 common shares outstanding.
TREND ANALYSIS AND QUARTERLY REVIEW
The following table sets forth selected consolidated financial information for each of our eight most recently completed quarters:
| | | 2016 | | | 2015 | | | 2014 | |
| | | | | | | | | | | | | | | | | | | | | | | | | |
| (in $ thousands) | | Q3 | | | Q2 | | | Q1 | | | Q4 | | | Q3 | | | Q2 | | | Q1 | | | Q4 | |
| Revenue | | 311,424 | | | 246,975 | | | 253,625 | | | 336,641 | | | 269,808 | | | 150,889 | | | 128,713 | | | 112,696 | |
| Profit (loss) before tax | | 42,001 | | | 6,557 | | | (16,888 | ) | | (325,611 | ) | | (16,132 | ) | | (45,818 | ) | | (11,480 | ) | | (24,392 | ) |
| Profit (loss) | | 33,571 | | | (5,703 | ) | | (15,788 | ) | | (255,468 | ) | | (11,833 | ) | | (44,290 | ) | | (19,837 | ) | | 43,594 | |
| Earnings (loss) per share: | | | | | | | | | | | | | | | | | | | | | | | | |
| Basic | | 0.14 | | | (0.02 | ) | | (0.07 | ) | | (1.09 | ) | | (0.05 | ) | | (0.19 | ) | | (0.08 | ) | | 0.19 | |
| Diluted | | 0.14 | | | (0.02 | ) | | (0.07 | ) | | (1.09 | ) | | (0.05 | ) | | (0.19 | ) | | (0.08 | ) | | 0.19 | |
| Operating cash flow per share1,2 | | 0.53 | | | 0.32 | | | 0.31 | | | 0.51 | | | 0.34 | | | 0.07 | | | 0.07 | | | (0.01 | ) |
| 1 | Operating cash flow per share is before precious metals stream deposit and change in non-cash working capital. It is a non-IFRS financial performance measure with no standardized definition under IFRS. For further information and a detailed reconciliation, refer to the discussion under "Non-IFRS Financial Reporting Measures" beginning on page 28 of this MD&A. |
| 2 | Operating cash flow per share has been restated to reflect the presentation changes with respect to receivable and payable balances associated with copper fixed for floating swaps. For more information on this change, refer to note 4b of our September 30, 2016 condensed consolidated interim financial statements. |
With the ramp up of Constancia since reaching commercial production in the second quarter of 2015, the increased production volumes have generally resulted in higher revenues and gross profit since the end of 2014, notwithstanding lower realized metals prices. Subsequent to Constancia reaching commercial production, we no longer capitalize interest costs associated with financing Constancia development and therefore those charges are recognized as finance expenses. In addition, mining costs have been favourably impacted in the Manitoba business unit with the weakening of the Canadian dollar versus the US dollar, which lowers costs denominated in Canadian dollars.
In the third quarter of 2016, the steady increase in production and sales has continued the trend of increasing revenues. The increase in production of concentrate in both Peru and Manitoba has resulted in lower unit costs as a result of the economies of scale achieved and the focus on cost optimization at all sites. The result of this production driven growth has been an increase in gross profits compared to the prior year and prior quarters. Despite volatility in commodity price markets, particularly precious metals, realized prices in the third quarter were marginally higher than the most recent quarters.
In the second quarter of 2016, revenues remained consistent with the first quarter of 2016 as higher realized prices for precious metals offset marginal declines in sales volumes due to the timing of production. Gross margins and cash generated from operating activities improved compared to the first quarter of 2016 as costs at Constancia benefited from continued site optimization and the Manitoba business unit benefited from cost reduction efforts as well as the weaker Canadian dollar.
In the first quarter of 2016, we continued to benefit from increased sales volumes following commercial production being attained at Constancia. Lower average realized prices of copper compared to the same quarter of 2015 partially offset the continued strong production volumes from the Peru operations and caused both gross profit and operating cash flow per share to be lower than in the fourth quarter of 2015.
27
In the fourth quarter of 2015, goodwill and asset impairments for the Peru and Arizona CGUs of $378.9 million were taken mainly as a result of lower expected copper prices and an expected delay in construction at Rosemont, which had a negative impact on profit.
For information on previous trends and quarterly reviews, refer to our MD&A dated February 24, 2016.
NON-IFRS FINANCIAL PERFORMANCE MEASURES
Operating cash flow before change in non-cash working capital and operating cash flow per share are included in this MD&A because we believe that they help investors and management to evaluate changes in cash flow generated from the various operations while, in the case of operating cash flow per share, taking into account changes in shares outstanding. Net debt is shown because it is a performance measure used by the Company to assess our financial position. Cash cost, sustaining and all-in sustaining cash cost per pound of copper produced are shown because we believe they help investors and management assess the performance of our operations, including the margin generated by the operations and the company. These measures do not have a meaning prescribed by IFRS and are therefore unlikely to be comparable to similar measures presented by other issuers. These measures should not be considered in isolation or as a substitute for measures prepared in accordance with IFRS and are not necessarily indicative of operating profit or cash flow from operations as determined under IFRS. Other companies may calculate these measures differently.
Operating Cash Flow per Share
The following table presents our calculation of operating cash flow per share for the three and nine months ended September 30, 2016 and September 30, 2015:
| | | Three months ended | | | Nine months ended | |
| (in $ thousands, except shares and | | Sep. 30, | | | Sep. 30, | | | Sep. 30, | | | Sep. 30, | |
| per share amounts) | | 2016 | | | 2015 | | | 2016 | | | 2015 | |
| Cash generated in operating activities | | 95,878 | | | 104,150 | | | 334,949 | | | 114,897 | |
| Change in non-cash working capital | | 28,358 | | | (25,104 | ) | | (69,338 | ) | | (484 | ) |
| Operating cash flows before change in non-cash working capital | | 124,236 | | | 79,046 | | | 265,611 | | | 114,413 | |
| Weighted average shares outstanding - basic | | 236,231,688 | | | 235,231,688 | | | 235,775,644 | | | 234,487,505 | |
| | | | | | | | | | | | | |
| Operating cash flows per share | $ | 0.53 | | $ | 0.34 | | $ | 1.13 | | $ | 0.49 | |
Net Debt
The following table presents our calculation of net debt as at September 30, 2016 and December 31, 2015:
| | | Sep. 30, | | | Dec. 31, | |
| (in $ thousands) | | 2016 | | | 2015 | |
| Total long-term debt | | 1,223,427 | | | 1,274,880 | |
| Cash and cash equivalents | | (118,258 | ) | | (53,852 | ) |
| | | | | | | |
| Net debt | | 1,105,169 | | | 1,221,028 | |
28
Cash Cost, Sustaining and All-in Sustaining Cash Cost
Cash cost per pound of copper produced (“cash cost”) is a non-IFRS measure that management uses as a key performance indicator to assess the performance of our operations. Our calculation designates copper as our primary metal of production as it has been, and is expected to be, the largest component of revenues. The calculation is presented in four manners:
| — | Cash cost, before by-product credits -This measure is gross of by-product revenues and is a function of the efforts and costs incurred to mine and process all ore mined. However, the measure divides this aggregate cost over only pounds of copper produced, our primary metal of production. This measure is generally less volatile from period to period, as it is not affected by changes in the price received for by-product metals. It is, however, significantly affected by the relative mix of copper concentrate and finished zinc production, and an increase in production of zinc metal will tend to result in an increase in cash cost under this measure. |
| | |
| — | Cash cost, net of by-product credits -In order to calculate the net cost to produce and sell copper, the net of by-product credits measure subtracts the revenues realized from the sale of the metals other than copper. The by-product revenues from zinc, gold, and silver are significant and are integral to the economics of our operations. The economics that support our decision to produce and sell copper would be different if we did not receive revenues from the other significant metals being extracted and processed. This measure provides management and investors with an indication of the minimum copper price consistent with positive operating cash flows and operating margins, assuming realized by-product metal prices are consistent with those prevailing during the reporting period. It also serves as an important operating statistic that management and investors utilize to measure our operating performance versus that of our competitors. However, it is important to understand that if by-product metal prices decline alongside copper prices, the cash cost net of by-product credits would increase, requiring a higher copper price than that reported to maintain positive cash flows and operating margins. |
| | |
| — | Sustaining cash cost, net of by-product credits -This measure is an extension of cash cost that includes sustaining capital expenditures, capitalized exploration and net smelter returns royalties. It does not include corporate G&A. It provides a more fulsome measurement of the cost of sustaining production than cash cost, which is focused on operating costs only. |
| | |
| — | All-in sustaining cash cost, net of by-product credits -This measure is an extension of sustaining cash cost that includes corporate G&A. Due to the inclusion of corporate G&A, all-in sustaining cash cost is presented on a consolidated basis only. |
The tables below present a detailed build-up of cash cost and sustaining cash cost, net of by-product credits, by business unit in addition to consolidated all-in sustaining cash cost, net of by-product credits, and reconciliations between cash cost, net of by-product credits, to the most comparable IFRS measures of cost of sales for the three and nine months ended September 30, 2016 and 2015. Cash cost, net of by-product credits may not calculate exactly based on amounts presented in the tables below due to rounding.
29
| Consolidated | | Three months ended | | | Nine months ended | |
| Net pounds of copper produced1 | | | | | | | | | | | | |
| (in thousands) | | Sep. 30, 2016 | | | Sep. 30, 2015 | | | Sep. 30, 2016 | | | Sep. 30, 2015 | |
| Peru | | 78,494 | | | 82,998 | | | 219,241 | | | 122,989 | |
| Manitoba | | 22,780 | | | 22,650 | | | 68,921 | | | 68,297 | |
| | | | | | | | | | | | | |
| Net pounds of copper produced1 | | 101,274 | | | 105,648 | | | 288,162 | | | 191,286 | |
1Contained copper in concentrate, exclusive of Constancia copper produced prior to the achievement of commercial production on May 1, 2015.
| Consolidated | | Three months ended | | | Nine months ended | |
| Cash cost per pound of | | Sep. 30, 2016 | | | Sep. 30, 2015 | | | Sep. 30, 2016 | | | Sep. 30, 2015 | |
| copper produced | | $000s | | | $/lb | | | $000s | | | $/lb | | | $000s | | | $/lb | | | $000s | | | $/lb | |
| Cash cost, before by-product credits | | 187,263 | | | 1.85 | | | 179,766 | | | 1.70 | | | 519,302 | | | 1.80 | | | 427,795 | | | 2.24 | |
| By-product credits | | (94,711 | ) | | (0.94 | ) | | (84,843 | ) | | (0.80 | ) | | (244,785 | ) | | (0.85 | ) | | (219,321 | ) | | (1.15 | ) |
| | | | | | | | | | | | | | | | | | | | | | | | | |
| Cash cost, net of by-product credits | | 92,552 | | | 0.91 | | | 94,923 | | | 0.90 | | | 274,517 | | | 0.95 | | | 208,474 | | | 1.09 | |
| Consolidated | | Three months ended | | | Nine months ended | |
| Supplementary cash cost | | Sep. 30, 2016 | | | Sep. 30, 2015 | | | Sep. 30, 2016 | | | Sep. 30, 2015 | |
| information | | $000s | | | $/lb1 | | | $000s | | | $/lb1 | | | $000s | | | $/lb1 | | | $000s | | | $/lb1 | |
| | | | | | | | | | | | | | | | | | | | | | | | | |
| By-product credits: | | | | | | | | | | | | | | | | | | | | | | | | |
| Zinc | | 62,932 | | | 0.62 | | | 50,030 | | | 0.47 | | | 165,383 | | | 0.57 | | | 164,215 | | | 0.86 | |
| Gold | | 33,500 | | | 0.33 | | | 40,420 | | | 0.38 | | | 91,000 | | | 0.32 | | | 74,633 | | | 0.39 | |
| Silver | | 14,380 | | | 0.14 | | | 9,525 | | | 0.09 | | | 37,781 | | | 0.13 | | | 18,518 | | | 0.10 | |
| Other | | 752 | | | 0.01 | | | 803 | | | 0.01 | | | 2,079 | | | 0.01 | | | 2,803 | | | 0.01 | |
| Total by-product credits | | 111,564 | | | 1.10 | | | 100,778 | | | 0.95 | | | 296,243 | | | 1.03 | | | 260,169 | | | 1.36 | |
| Less: deferred revenue | | (16,853 | ) | | (0.17 | ) | | (15,935 | ) | | (0.15 | ) | | (51,458 | ) | | (0.18 | ) | | (38,691 | ) | | (0.20 | ) |
| Less: pre-production credits | | - | | | - | | | - | | | - | | | - | | | - | | | (2,157 | ) | | (0.01 | ) |
| Total by-product credits, net of pre-production credits | | 94,711 | | | 0.94 | | | 84,843 | | | 0.80 | | | 244,785 | | | 0.85 | | | 219,321 | | | 1.15 | |
| | | | | | | | | | | | | | | | | | | | | | | | | |
| Reconciliation to IFRS: | | | | | | | | | | | | | | | | | | | | | | | | |
| Cash cost, net of by-product credits | | 92,552 | | | | | | 94,923 | | | | | | 274,517 | | | | | | 208,474 | | | | |
| By-product credits | | 111,564 | | | | | | 100,778 | | | | | | 296,243 | | | | | | 260,169 | | | | |
| Change in deferred revenues | | (16,853 | ) | | | | | (15,935 | ) | | | | | (51,458 | ) | | | | | (38,691 | ) | | | |
| Pre-production revenues | | - | | | | | | - | | | | | | - | | | | | | (2,157 | ) | | | |
| Treatment and refining charges2 | | (34,965 | ) | | | | | (27,909 | ) | | | | | (88,981 | ) | | | | | (47,836 | ) | | | |
| Share-based payment | | 97 | | | | | | (480 | ) | | | | | 323 | | | | | | 10 | | | | |
| Pension enhancement | | - | | | | | | - | | | | | | - | | | | | | 17,064 | | | | |
| Change in product inventory | | 4,820 | | | | | | 3,825 | | | | | | 6,873 | | | | | | (38,698 | ) | | | |
| Royalties | | 3,471 | | | | | | 3,734 | | | | | | 9,396 | | | | | | 6,812 | | | | |
| Depreciation and amortization3 | | 82,279 | | | | | | 68,843 | | | | | | 220,438 | | | | | | 124,702 | | | | |
| | | | | | | | | | | | | | | | | | | | | | | | | |
| Cost of sales | | 242,965 | | | | | | 227,779 | | | | | | 667,351 | | | | | | 489,849 | | | | |
1Per pound of copper produced.
2Excludes $7,739 of treatment and refining charges which were incurred prior to commercial production during the nine months ended September 30, 2015.
3Depreciation is based on copper sold.
30
| Peru | | Three months ended | | | Nine months ended | |
| (in thousands) | | Sep. 30, 2016 | | | Sep. 30, 2015 | | | Sep. 30, 2016 | | | Sep. 30, 2015 | |
| Pounds of copper produced1 | | 78,494 | | | 82,998 | | | 219,241 | | | 150,271 | |
| Less: pre-production production of copper produced1 | | - | | | - | | | - | | | (27,282 | ) |
| | | | | | | | | | | | | |
| Net pounds of copper produced1 | | 78,494 | | | 82,998 | | | 219,241 | | | 122,989 | |
1Contained copper in concentrate.
| Peru | | Three months ended | | | Nine months ended | |
| Cash cost per pound of copper | | Sep. 30, 2016 | | | Sep. 30, 2015 | | | Sep. 30, 2016 | | | Sep. 30, 2015 | |
| produced | | $000s | | | $/lb | | | $000s | | | $/lb | | | $000s | | | $/lb | | | $000s | | | $/lb | |
| Mining | | 16,396 | | | 0.21 | | | 17,207 | | | 0.21 | | | 43,309 | | | 0.20 | | | 25,822 | | | 0.21 | |
| Milling | | 31,934 | | | 0.41 | | | 27,082 | | | 0.33 | | | 86,468 | | | 0.39 | | | 48,461 | | | 0.39 | |
| G&A | | 11,318 | | | 0.14 | | | 10,563 | | | 0.13 | | | 31,375 | | | 0.14 | | | 17,853 | | | 0.15 | |
| Onsite costs | | 59,648 | | | 0.76 | | | 54,852 | | | 0.66 | | | 161,152 | | | 0.74 | | | 92,136 | | | 0.75 | |
| Treatment & refining | | 25,164 | | | 0.32 | | | 17,994 | | | 0.22 | | | 60,318 | | | 0.28 | | | 22,431 | | | 0.18 | |
| Freight & other | | 13,156 | | | 0.17 | | | 12,349 | | | 0.15 | | | 39,468 | | | 0.18 | | | 20,401 | | | 0.17 | |
| Cash cost, before by-product credits | | 97,968 | | | 1.25 | | | 85,195 | | | 1.03 | | | 260,938 | | | 1.19 | | | 134,968 | | | 1.10 | |
| By-product credits | | (9,560 | ) | | (0.12 | ) | | (5,145 | ) | | (0.06 | ) | | (24,354 | ) | | (0.11 | ) | | (5,603 | ) | | (0.05 | ) |
| | | | | | | | | | | | | | | | | | | | | | | | | |
| Cash cost, net of by-product credits | | 88,408 | | | 1.13 | | | 80,050 | | | 0.96 | | | 236,584 | | | 1.08 | | | 129,365 | | | 1.05 | |
31
| Peru | | Three months ended | | | Nine months ended | |
| Supplementary cash cost | | Sep. 30, 2016 | | | Sep. 30, 2015 | | | Sep. 30, 2016 | | | Sep. 30, 2015 | |
| information | | $000s | | | $/lb1 | | | $000s | | | $/lb1 | | | $000s | | | $/lb1 | | | $000s | | | $/lb1 | |
| | | | | | | | | | | | | | | | | | | | | | | | | |
| By-product credits: | | | | | | | | | | | | | | | | | | | | | | | | |
| Gold | | 5,996 | | | 0.08 | | | 4,478 | | | 0.05 | | | 16,925 | | | 0.08 | | | 6,578 | | | 0.05 | |
| Silver | | 9,397 | | | 0.12 | | | 4,356 | | | 0.05 | | | 25,223 | | | 0.12 | | | 8,718 | | | 0.07 | |
| Other | | - | | | - | | | - | | | - | | | 129 | | | - | | | - | | | - | |
| Total by-product credits | | 15,393 | | | 0.20 | | | 8,834 | | | 0.11 | | | 42,277 | | | 0.19 | | | 15,296 | | | 0.12 | |
| Less: deferred revenue | | (5,833 | ) | | (0.07 | ) | | (3,689 | ) | | (0.04 | ) | | (17,923 | ) | | (0.08 | ) | | (7,536 | ) | | (0.06 | ) |
| Less: pre-production credits | | - | | | - | | | - | | | - | | | - | | | - | | | (2,157 | ) | | (0.02 | ) |
| Total by-product credits, net of pre-production credits | | 9,560 | | | 0.12 | | | 5,145 | | | 0.06 | | | 24,354 | | | 0.11 | | | 5,603 | | | 0.05 | |
| | | | | | | | | | | | | | | | | | | | | | | | | |
| Reconciliation to IFRS: | | | | | | | | | | | | | | | | | | | | | | | | |
| Cash cost, net of by-product credits | | 88,408 | | | | | | 80,050 | | | | | | 236,584 | | | | | | 129,365 | | | | |
| By-product credits | | 15,393 | | | | | | 8,834 | | | | | | 42,277 | | | | | | 15,296 | | | | |
| Change in deferred revenues | | (5,833 | ) | | | | | (3,689 | ) | | | | | (17,923 | ) | | | | | (7,536 | ) | | | |
| Pre-production revenues | | - | | | | | | - | | | | | | - | | | | | | (2,157 | ) | | | |
| Treatment and refining charges2 | | (25,164 | ) | | | | | (17,994 | ) | | | | | (60,318 | ) | | | | | (22,431 | ) | | | |
| Share-based payment | | 69 | | | | | | - | | | | | | 69 | | | | | | - | | | | |
| Change in product inventory | | 7,793 | | | | | | (11,965 | ) | | | | | 5,006 | | | | | | (35,725 | ) | | | |
| Royalties | | 1,695 | | | | | | 2,171 | | | | | | 4,391 | | | | | | 2,310 | | | | |
| Depreciation and amortization3 | | 51,720 | | | | | | 36,869 | | | | | | 129,252 | | | | | | 46,159 | | | | |
| | | | | | | | | | | | | | | | | | | | | | | | | |
| Cost of sales | | 134,081 | | | | | | 94,276 | | | | | | 339,338 | | | | | | 125,281 | | | | |
1Per pound of copper produced.
2Excludes $7,739 of treatment and refining charges which were incurred prior to commercial production during the nine months ended September 30, 2015.
3Depreciation is based on copper sold.
| Manitoba | | Three months ended | | | Nine months ended | |
| (in thousands) | | Sep. 30, 2016 | | | Sep. 30, 2015 | | | Sep. 30, 2016 | | | Sep. 30, 2015 | |
| | | | | | | | | | | | | |
| Net pounds of copper produced1 | | 22,780 | | | 22,650 | | | 68,921 | | | 68,297 | |
1Contained copper in concentrate.
| Manitoba | | Three months ended | | | Nine months ended | |
| Cash cost per pound of | | Sep. 30, 2016 | | | Sep. 30, 2015 | | | Sep. 30, 2016 | | | Sep. 30, 2015 | |
| copper produced | | $000s | | | $/lb | | | $000s | | | $/lb | | | $000s | | | $/lb | | | $000s | | | $/lb | |
| | | | | | | | | | | | | | | | | | | | | | | | | |
| Mining | | 29,012 | | | 1.27 | | | 29,751 | | | 1.31 | | | 87,780 | | | 1.27 | | | 93,222 | | | 1.36 | |
| Milling | | 12,801 | | | 0.56 | | | 9,384 | | | 0.41 | | | 32,118 | | | 0.47 | | | 29,133 | | | 0.43 | |
| Refining (zinc) | | 16,284 | | | 0.71 | | | 14,398 | | | 0.64 | | | 48,474 | | | 0.70 | | | 46,836 | | | 0.69 | |
| G&A | | 9,819 | | | 0.43 | | | 16,692 | | | 0.74 | | | 26,277 | | | 0.38 | | | 43,768 | | | 0.64 | |
| Purchased ore and zinc concentrates | | 3,985 | | | 0.17 | | | 4,713 | | | 0.21 | | | 12,204 | | | 0.18 | | | 28,163 | | | 0.41 | |
| Onsite costs | | 71,901 | | | 3.16 | | | 74,938 | | | 3.31 | | | 206,853 | | | 3.00 | | | 241,122 | | | 3.53 | |
| Treatment & refining | | 9,801 | | | 0.43 | | | 9,915 | | | 0.44 | | | 28,663 | | | 0.42 | | | 25,405 | | | 0.37 | |
| Freight & other | | 7,593 | | | 0.33 | | | 9,718 | | | 0.43 | | | 22,848 | | | 0.33 | | | 26,300 | | | 0.39 | |
| Cash cost, before by-product credits | | 89,295 | | | 3.92 | | | 94,571 | | | 4.18 | | | 258,364 | | | 3.75 | | | 292,827 | | | 4.29 | |
| By-product credits | | (85,151 | ) | | (3.74 | ) | | (79,698 | ) | | (3.52 | ) | | (220,431 | ) | | (3.20 | ) | | (213,718 | ) | | (3.13 | ) |
| | | | | | | | | | | | | | | | | | | | | | | | | |
| Cash cost, net of by-product credits | | 4,144 | | | 0.18 | | | 14,873 | | | 0.66 | | | 37,933 | | | 0.55 | | | 79,109 | | | 1.16 | |
32
| Manitoba | | Three months ended | | | Nine months ended | |
| Supplementary cash cost | | Sep. 30, 2016 | | | Sep. 30, 2015 | | | Sep. 30, 2016 | | | Sep. 30, 2015 | |
| information | | $000s | | | $/lb1 | | | $000s | | | $/lb1 | | | $000s | | | $/lb1 | | | $000s | | | $/lb1 | |
| | | | | | | | | | | | | | | | | | | | | | | | | |
| By-product credits: | | | | | | | | | | | | | | | | | | | | | | | | |
| Zinc | | 62,932 | | | 2.76 | | | 50,030 | | | 2.21 | | | 165,383 | | | 2.40 | | | 164,215 | | | 2.40 | |
| Gold | | 27,504 | | | 1.21 | | | 35,942 | | | 1.59 | | | 74,075 | | | 1.07 | | | 68,055 | | | 1.00 | |
| Silver | | 4,983 | | | 0.22 | | | 5,169 | | | 0.23 | | | 12,558 | | | 0.18 | | | 9,800 | | | 0.14 | |
| Other | | 752 | | | 0.03 | | | 803 | | | 0.04 | | | 1,950 | | | 0.03 | | | 2,803 | | | 0.04 | |
| Total by-product credits | | 96,171 | | | 4.22 | | | 91,944 | | | 4.06 | | | 253,966 | | | 3.68 | | | 244,873 | | | 3.59 | |
| Less: deferred revenue | | (11,020 | ) | | (0.47 | ) | | (12,246 | ) | | (0.54 | ) | | (33,535 | ) | | (0.49 | ) | | (31,155 | ) | | (0.46 | ) |
| Total by-product credits, net | | | | | | | | | | | | | | | | | | | | | | | | |
| of pre-production credits | | 85,151 | | | 3.74 | | | 79,698 | | | 3.52 | | | 220,431 | | | 3.20 | | | 213,718 | | | 3.13 | |
| | | | | | | | | | | | | | | | | | | | | | | | | |
| Reconciliation to IFRS: | | | | | | | | | | | | | | | | | | | | | | | | |
| Cash cost, net of by-product credits | | 4,144 | | | | | | 14,873 | | | | | | 37,933 | | | | | | 79,109 | | | | |
| By-product credits | | 96,171 | | | | | | 91,944 | | | | | | 253,966 | | | | | | 244,873 | | | | |
| Change in deferred revenues | | (11,020 | ) | | | | | (12,246 | ) | | | | | (33,535 | ) | | | | | (31,155 | ) | | | |
| Treatment and refining charges | | (9,801 | ) | | | | | (9,915 | ) | | | | | (28,663 | ) | | | | | (25,405 | ) | | | |
| Share-based payment | | 28 | | | | | | (480 | ) | | | | | 254 | | | | | | 10 | | | | |
| Pension enhancement | | - | | | | | | - | | | | | | - | | | | | | 17,064 | | | | |
| Change in product inventory | | (2,973 | ) | | | | | 15,790 | | | | | | 1,867 | | | | | | (2,973 | ) | | | |
| Royalties | | 1,776 | | | | | | 1,563 | | | | | | 5,005 | | | | | | 4,502 | | | | |
| Depreciation and amortization2 | | 30,559 | | | | | | 31,974 | | | | | | 91,186 | | | | | | 78,543 | | | | |
| | | | | | | | | | | | | | | | | | | | | | | | | |
| Cost of sales | | 108,884 | | | | | | 133,503 | | | | | | 328,013 | | | | | | 364,568 | | | | |
1Per pound of copper produced.
2Depreciation is based on copper sold.
33
| Consolidated | | Three months ended | | | Nine months ended | |
| All-in sustaining cash cost per | | Sep. 30, 2016 | | | Sep. 30, 2015 | | | Sep. 30, 2016 | | | Sep. 30, 2015 | |
| pound of copper produced | | $000s | | | $/lb | | | $000s | | | $/lb | | | $000s | | | $/lb | | | $000s | | | $/lb | |
| Cash cost, net of by-product credits | | 92,552 | | | 0.91 | | | 94,923 | | | 0.90 | | | 274,517 | | | 0.95 | | | 208,474 | | | 1.09 | |
| Sustaining capital expenditures-cash1 | | 44,356 | | | 0.44 | | | 94,782 | | | 0.90 | | | 134,192 | | | 0.47 | | | 160,611 | | | 0.84 | |
| Capitalized exploration | | 571 | | | 0.01 | | | 274 | | | - | | | 1,898 | | | 0.01 | | | 3,265 | | | 0.02 | |
| Royalties | | 3,471 | | | 0.03 | | | 3,734 | | | 0.04 | | | 9,396 | | | 0.03 | | | 6,812 | | | 0.04 | |
| Sustaining cash cost, net ofby-product credits | | 140,950 | | | 1.39 | | | 193,713 | | | 1.83 | | | 420,003 | | | 1.46 | | | 379,162 | | | 1.98 | |
| Corporate G&A | | 6,783 | | | 0.07 | | | 3,087 | | | 0.03 | | | 25,151 | | | 0.09 | | | 23,365 | | | 0.12 | |
| All-in sustaining cash cost, net ofby-product credits | | 147,733 | | | 1.46 | | | 196,800 | | | 1.86 | | | 445,154 | | | 1.54 | | | 402,527 | | | 2.10 | |
1Excludes costs associated with pre-commercial production output.
| Peru | | Three months ended | | | Nine months ended | |
| Sustaining cash cost per pound | | Sep. 30, 2016 | | | Sep. 30, 2015 | | | Sep. 30, 2016 | | | Sep. 30, 2015 | |
| of copper produced | | $000s | | | $/lb | | | $000s | | | $/lb | | | $000s | | | $/lb | | | $000s | | | $/lb | |
| Cash cost, net of by-product credits | | 88,408 | | | 1.13 | | | 80,050 | | | 0.96 | | | 236,584 | | | 1.08 | | | 129,365 | | | 1.05 | |
| Sustaining capital expenditures-cash1 | | 35,236 | | | 0.45 | | | 68,940 | | | 0.83 | | | 86,361 | | | 0.39 | | | 103,639 | | | 0.84 | |
| Royalties | | 1,695 | | | 0.02 | | | 2,171 | | | 0.03 | | | 4,391 | | | 0.02 | | | 2,310 | | | 0.02 | |
| Sustaining cash cost per poundof copper produced | | 125,339 | | | 1.60 | | | 151,161 | | | 1.82 | | | 327,336 | | | 1.49 | | | 235,314 | | | 1.91 | |
1Excludes costs associated with pre-commercial production output.
| Manitoba | | Three months ended | | | Nine months ended | |
| Sustaining cash cost per pound | | Sep. 30, 2016 | | | Sep. 30, 2015 | | | Sep. 30, 2016 | | | Sep. 30, 2015 | |
| of copper produced | | $000s | | | $/lb | | | $000s | | | $/lb | | | $000s | | | $/lb | | | $000s | | | $/lb | |
| | | | | | | | | | | | | | | | | | | | | | | | | |
| Cash cost, net of by-product credits | | 4,144 | | | 0.18 | | | 14,873 | | | 0.66 | | | 37,933 | | | 0.55 | | | 79,109 | | | 1.16 | |
| Sustaining capital expenditures - cash | | 9,120 | | | 0.40 | | | 25,842 | | | 1.14 | | | 47,831 | | | 0.69 | | | 56,972 | | | 0.83 | |
| Capitalized exploration | | 571 | | | 0.03 | | | 274 | | | 0.01 | | | 1,898 | | | 0.03 | | | 3,265 | | | 0.05 | |
| Royalties | | 1,776 | | | 0.08 | | | 1,563 | | | 0.07 | | | 5,005 | | | 0.07 | | | 4,502 | | | 0.07 | |
| Sustaining cash cost per poundof copper produced | | 15,611 | | | 0.69 | | | 42,552 | | | 1.88 | | | 92,667 | | | 1.34 | | | 143,848 | | | 2.11 | |
34
ACCOUNTING CHANGES AND CRITICAL ESTIMATES
New standards and interpretations not yet adopted
For information on new standards and interpretations not yet adopted, refer to note 5 of our September 30, 2016 consolidated interim financial statements.
Estimates and judgements
For information on significant areas requiring us to make estimates and judgements, refer to note 2 of our September 30, 2016 consolidated interim financial statements.
CHANGES IN INTERNAL CONTROL OVER FINANCIAL REPORTING
Management is responsible for establishing and maintaining adequate internal control over financial reporting (“ICFR”). ICFR is designed to provide reasonable assurance regarding the reliability of financial reporting and the preparation of financial statements for external purposes in accordance with IFRS.
We did not make any changes to ICFR during the quarter ended September 30, 2016 that materially affected or are reasonably likely to materially affect our ICFR.
NOTES TO READER
Forward-Looking Information
This MD&A contains forward-looking information within the meaning of applicable Canadian and United States securities legislation. All information contained in this MD&A, other than statements of current and historical fact, is forward-looking information. Often, but not always, forward-looking information can be identified by the use of words such as “plans”, “expects”, “budget”, “guidance”, “scheduled”, “estimates”, “forecasts”, “strategy”, “target”, “intends”, “objective”, “goal”, “understands”, “anticipates” and “believes” (and variations of these or similar words) and statements that certain actions, events or results “may”, “could”, “would”, “should”, “might” “occur” or “be achieved” or “will be taken” (and variations of these or similar expressions). All of the forward-looking information in this MD&A is qualified by this cautionary note.
Forward-looking information includes, but is not limited to, production, cost and capital and exploration expenditure guidance, including anticipated capital and operating cost savings, anticipated production at our mines and processing facilities, events that may affect our operations and development projects, anticipated cash flows from operations and related liquidity requirements, the anticipated effect of external factors on revenue, such as commodity prices, economic outlook, government regulation of mining operations, and business and acquisition strategies. Forward-looking information is not, and cannot be, a guarantee of future results or events. Forward-looking information is based on, among other things, opinions, assumptions, estimates and analyses that, while considered reasonable by us at the date the forward-looking information is provided, inherently are subject to significant risks, uncertainties, contingencies and other factors that may cause actual results and events to be materially different from those expressed or implied by the forward-looking information.
The material factors or assumptions that we identified and were applied by us in drawing conclusions or making forecasts or projections set out in the forward-looking information include, but are not limited to:
| | — | the success of mining, processing, exploration and development activities; |
| | — | the success of Hudbay’s cost reduction initiatives; |
| | — | the accuracy of geological, mining and metallurgical estimates; |
| | — | anticipated metals prices and the costs of production; |
| | — | the supply and demand for metals we produce; |
35
| | — | the supply and availability of concentrate for our processing facilities; |
| | — | the supply and availability of third party processing facilities for our concentrate; |
| | — | the supply and availability of all forms of energy and fuels at reasonable prices; |
| | — | the availability of transportation services at reasonable prices; |
| | — | no significant unanticipated operational or technical difficulties; |
| | — | the execution of our business and growth strategies, including the success of our strategic investments and initiatives; |
| | — | the availability of additional financing, if needed; |
| | — | the ability to complete project targets on time and on budget and other events that may affect our ability to develop our projects; |
| | — | the timing and receipt of various regulatory and governmental approvals; |
| | — | the availability of personnel for our exploration, development and operational projects and ongoing employee relations; |
| | — | the ability to secure required land rights to develop the Pampacancha deposit; |
| | — | maintaining good relations with the communities in which we operate, including the communities surrounding our Constancia mine and Rosemont project and First Nations communities surrounding our Lalor and Reed mines; |
| | — | no significant unanticipated challenges with stakeholders at our various projects; |
| | — | no significant unanticipated events or changes relating to regulatory, environmental, health and safety matters; |
| | — | no contests over title to our properties, including as a result of rights or claimed rights of aboriginal peoples; |
| | — | the timing and possible outcome of pending litigation and no significant unanticipated litigation; |
| | — | certain tax matters, including, but not limited to current tax laws and regulations and the refund of certain value added taxes from the Canadian and Peruvian governments; and |
| | — | no significant and continuing adverse changes in general economic conditions or conditions in the financial markets (including commodity prices and foreign exchange rates). |
The risks, uncertainties, contingencies and other factors that may cause actual results to differ materially from those expressed or implied by the forward-looking information may include, but are not limited to, risks generally associated with the mining industry, such as economic factors (including future commodity prices, currency fluctuations, energy prices and general cost escalation), uncertainties related to the development and operation of our projects (including risks associated with the economics and permitting of the Rosemont project and related legal challenges), risks related to the maturing nature of our 777 mine and its impact on the related Flin Flon metallurgical complex, dependence on key personnel and employee and union relations, risks related to political or social unrest or change, risks in respect of aboriginal and community relations, rights and title claims, operational risks and hazards, including unanticipated environmental, industrial and geological events and developments and the inability to insure against all risks, failure of plant, equipment, processes, transportation and other infrastructure to operate as anticipated, planned infrastructure improvements in Peru not being completed on schedule or as planned, compliance with government and environmental regulations, including permitting requirements and anti-bribery legislation, depletion of our reserves, volatile financial markets that may affect our ability to obtain additional financing on acceptable terms, the permitting and development of the Rosemont project not occurring as planned, the failure to obtain required approvals or clearances from government authorities on a timely basis, uncertainties related to the geology, continuity, grade and estimates of mineral reserves and resources, and the potential for variations in grade and recovery rates, uncertain costs of reclamation activities, our ability to comply with our pension and other post-retirement obligations, our ability to abide by the covenants in our debt instruments and other material contracts, tax refunds, hedging transactions, as well as the risks discussed under the heading “Risk Factors” in our most recent Annual Information Form.
Should one or more risk, uncertainty, contingency or other factor materialize or should any factor or assumption prove incorrect, actual results could vary materially from those expressed or implied in the forward-looking information. Accordingly, you should not place undue reliance on forward-looking information. We do not assume any obligation to update or revise any forward-looking information after the date of this MD&A or to explain any material difference between subsequent actual events and any forward-looking information, except as required by applicable law.
36
Change in Functional and Presentation Currency
The functional currency of each of our subsidiaries is the currency of the primary economic environment in which the entity operates. We reconsider the functional currency of our entities if there is a change in events and conditions which determined the primary economic environment. Prior to July 1, 2015, our consolidated financial statements were presented in Canadian dollars, which was our and all our material subsidiaries' functional currency, except for Hudbay Peru, HudBay (BVI) Inc. and the Hudbay Arizona entities, which have a functional currency of US dollars.
The ability of Hudbay Peru to repatriate funds in US dollars, as a result of reaching commercial production in the first half of 2015, and the purchase of Hudbay Arizona have significantly increased our exposure to the US dollar as cash inflows are now predominantly in US dollars and revenue and costs related to Constancia operations and Rosemont development are denominated in US dollars. Consequently, effective July 1, 2015, the US dollar was adopted as our corporate entity’s functional currency on a prospective basis. All our subsidiaries continue to measure the items in their financial statements using their functional currencies.
Effective July 1, 2015, we changed our presentation currency to US dollars from Canadian dollars. This change in presentation currency was made to better reflect our business activities, comprised primarily of US dollar revenues as well as associated US dollar denominated financings, and is consistent with our peers. The consolidated financial statements for all years presented have been translated into the new presentation currency in accordance with International Accounting Standard 21,The Effects of Changes in Foreign Exchange Rates.
Note to United States Investors
This MD&A has been prepared in accordance with the requirements of the securities laws in effect in Canada, which may differ materially from the requirements of United States securities laws applicable to US issuers.
Qualified Person
The technical and scientific information in this MD&A related to the Constancia mine has been approved by Cashel Meagher, P. Geo, our Senior Vice President and Chief Operating Officer. The technical and scientific information related to all other sites and projects contained in this MD&A has been approved by Robert Carter, P. Eng, our Director, Business Development and Technical Services at our Manitoba Business Unit. Messrs. Meagher and Carter are qualified persons pursuant to NI 43-101. For a description of the key assumptions, parameters and methods used to estimate mineral reserves and resources, as well as data verification procedures and a general discussion of the extent to which the estimates of scientific and technical information may be affected by any known environmental, permitting, legal title, taxation, sociopolitical, marketing or other relevant factors, please see the Technical Reports for our material properties as filed by us on SEDAR at www.sedar.com.
37