![]()

| Management's Discussion and Analysis of |
| Results of Operations and Financial Condition |
| For the three and nine months ended |
| September 30, 2017 |
November 1, 2017
![]()
![]()
INTRODUCTION
This Management's Discussion and Analysis ("MD&A") dated November 1, 2017 is intended to supplement Hudbay Minerals Inc.'s unaudited condensed consolidated interim financial statements and related notes for the three and nine months ended September 30, 2017 and 2016 (the "consolidated interim financial statements"). The consolidated interim financial statements have been prepared in accordance with International Financial Reporting Standards (“IFRS"), including International Accounting Standard 34,Interim Financial Reporting, as issued by the International Accounting Standards Board.
References to “Hudbay”, the “Company”, “we”, “us”, “our” or similar terms refer to Hudbay Minerals Inc. and its direct and indirect subsidiaries as at September 30, 2017. "Hudbay Peru" refers to HudBay Peru S.A.C., our wholly-owned subsidiary which owns a 100% interest in the Constancia mine, and “Hudbay Arizona” refers to HudBay Arizona Corporation (formerly named Augusta Resource Corporation), our wholly-owned subsidiary, which indirectly owns a 92.05% interest in the Rosemont project.
Readers should be aware that:
| − | This MD&A contains certain “forward-looking statements” and “forward-looking information” (collectively, “forward-looking information”) that are subject to risk factors set out in a cautionary note contained in our MD&A. | |
| − | This MD&A has been prepared in accordance with the requirements of the securities laws in effect in Canada, which may differ materially from the requirements of United States securities laws applicable to US issuers. | |
| − | We use a number of non-IFRS financial performance measures in our MD&A. | |
| − | The technical and scientific information in this MD&A has been approved by qualified persons based on a variety of assumptions and estimates. |
For a discussion of each of the above matters, readers are urged to review the “Notes to Reader” discussion beginning on page 37 of this MD&A.
Additional information regarding Hudbay, including the risks related to our business and those that are reasonably likely to affect our financial statements in the future, is contained in our continuous disclosure materials, including our most recent Annual Information Form (“AIF”), consolidated financial statements and Management Information Circular available on SEDAR at www.sedar.com and on EDGAR at www.sec.gov.
All amounts are in US dollars unless otherwise noted.
OUR BUSINESS
We are an integrated mining company primarily producing copper concentrate (containing copper, gold and silver), zinc concentrate and zinc metal. With assets in North and South America, we are focused on the discovery, production and marketing of base and precious metals. Directly and through our subsidiaries, we own four polymetallic mines, four ore concentrators and a zinc production facility in northern Manitoba and Saskatchewan (Canada) and Cusco (Peru), and a copper project in Arizona (United States). Our growth strategy is focused on the exploration and development of properties we already control, as well as other mineral assets we may acquire that fit our strategic criteria. Our vision is to become a top-tier operator of long-life, low-cost mines in the Americas. Our mission is to create sustainable value through the acquisition, development and operation of high-quality and growing long-life deposits in mining-friendly jurisdictions. We are governed by theCanada Business Corporations Actand our shares are listed under the symbol "HBM" on the Toronto Stock Exchange, New York Stock Exchange and Bolsa de Valores de Lima. We also have warrants listed under the symbol “HBM.WT” on the Toronto Stock Exchange and “HBM/WS” on the New York Stock Exchange.
1
![]()
SUMMARY
Net profit and earnings per share in the third quarter of 2017 were $40.9 million and $0.17, respectively, compared to a net profit and earnings per share of $33.6 million and $0.14, respectively, in the third quarter of 2016.
In the third quarter of 2017, cash generated from operating activities was $167.9 million, up from $95.9 million in the same period of 2016. Operating cash flow before change in non-cash working capital increased to $153.9 million in the third quarter of 2017 from $124.2 million in the same quarter of 2016. The increase in net profit and operating cash flow is the result of growth in sales volumes of zinc and gold and higher realized copper and zinc prices, partially offset by decreases in the sales volumes of copper.
Net profit and earnings per share in the third quarter of 2017 were affected by, among other things, the following items:
(in $ millions, except per share amounts) | Pre-tax | After-tax | Per share | ||||||
| gain (loss) | gain (loss) | gain (loss) | ||||||
Foreign exchange loss | (6.5) | (6.0) | (0.02) | ||||||
Mark-to-market adjustments of various items | (9.4) | (8.4) | (0.04) | ||||||
Transaction costs written-off due to debt refinancing | (3.6) | (2.4) | (0.01) | ||||||
Recovery for damages during commissioning of Constancia mill | 4.2 | 2.7 | 0.01 | ||||||
Non-cash deferred tax adjustments | - | 4.2 | 0.02 |
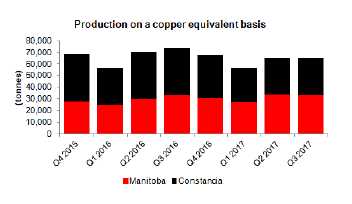
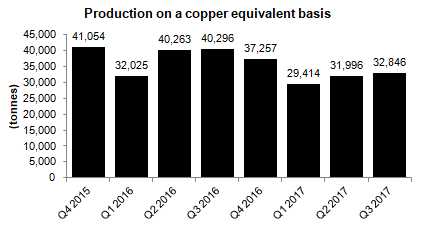
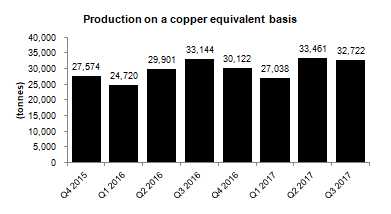
Compared to the same quarter of 2016, production of zinc in concentrate increased as a result of higher zinc grades in Manitoba, while copper production declined due to expected lower copper grades in Peru.
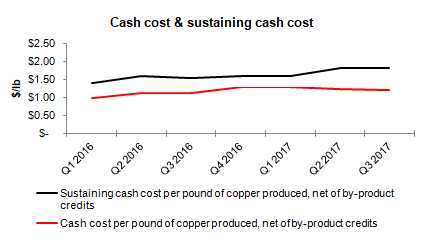
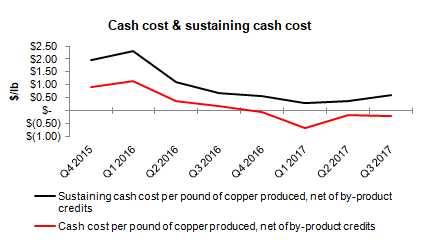
In the third quarter of 2017, consolidated cash cost per pound of copper produced, net of by-product credits, was $0.86, a decrease compared to $0.91 in the same period last year1. Incorporating sustaining capital, capitalized exploration, royalties and corporate selling and administrative expenses, consolidated all-in sustaining cash cost per pound of copper produced, net of by-product credits, in the third quarter of 2017 was $1.64, up from $1.46 in the third quarter of 20161. The increase in all-in sustaining cash cost was driven by higher planned sustaining capital expenditures in Peru and lower copper production compared to the third quarter of 2016.
1Cash cost and sustaining cash cost per pound of copper produced, net of by-product credits, and net debt are not recognized under IFRS. For more detail on this non-IFRS financial performance measure, please see the discussion under "Non-IFRS Financial Performance Measures" beginning on page 29 of this MD&A.
2
![]()
Net debt1declined by $300.2 million from June 30, 2017 to $649.6 million at September 30, 2017, as a result of cash flow from our operations and $187.4 million of net proceeds from an equity issuance. At September 30, 2017, total liquidity including cash and available credit facilities was $749.9 million, up from $496.8 million at June 30, 2017.
We are on track to meet previously issued 2017 guidance for production and capital costs in both Peru and Manitoba. Unit operating costs in Peru have declined and are tracking within the guidance range for 2017; however, Manitoba unit costs are expected to be moderately higher than 2017 guidance levels.
KEY FINANCIAL RESULTS
Financial Condition | ||||||
(in $ thousands) | Sep.30, 2017 | Dec. 31, 2016 | ||||
Cash and cash equivalents | 328,927 | 146,864 | ||||
Total long-term debt | 978,494 | 1,232,164 | ||||
Net debt1 | 649,567 | 1,085,300 | ||||
Working capital | 260,305 | 121,539 | ||||
Total assets | 4,591,631 | 4,456,556 | ||||
Equity | 2,047,615 | 1,763,212 |
Financial Performance | Three months ended | Nine months ended | ||||||||||
(in $ thousands, except per share amounts) | Sep. 30, | Sep. 30, | Sep. 30, | Sep. 30, | ||||||||
| 2017 | 2016 | 2017 | 2016 | ||||||||
Revenue | 370,356 | 311,424 | 948,410 | 812,024 | ||||||||
Cost of sales | 259,391 | 242,965 | 710,317 | 667,351 | ||||||||
Profit before tax | 58,681 | 42,001 | 113,188 | 31,670 | ||||||||
Profit | 40,942 | 33,571 | 64,223 | 12,080 | ||||||||
Basic and diluted earnings per share | 0.17 | 0.14 | 0.27 | 0.05 | ||||||||
Operating cash flow before change in non-cash working capital | 153,943 | 124,236 | 358,662 | 265,611 | ||||||||
1Net debt is a non-IFRS financial performance measures with no standardized definition under IFRS. For further information and a detailed reconciliation, please see the discussion under "Non-IFRS Financial Reporting Measures" beginning on page 29 of this MD&A.
3
![]()
KEY PRODUCTION RESULTS
| Three months ended | Three months ended | |||||||||||||||||||
| Sep. 30, 2017 | Sep. 30, 2016 | |||||||||||||||||||
| Peru | Manitoba | Total | Peru | Manitoba | Total | |||||||||||||||
| |||||||||||||||||||||
Contained metal in concentrate produced1 | |||||||||||||||||||||
Copper | tonnes | 30,936 | 9,509 | 40,445 | 35,604 | 10,333 | 45,937 | ||||||||||||||
Gold | oz | 4,702 | 23,975 | 28,677 | 6,867 | 22,998 | 29,865 | ||||||||||||||
Silver | oz | 617,959 | 317,567 | 935,526 | 749,498 | 294,293 | 1,043,791 | ||||||||||||||
Zinc | tonnes | - | 36,635 | 36,635 | - | 31,606 | 31,606 | ||||||||||||||
Payable metal sold | |||||||||||||||||||||
Copper | tonnes | 30,128 | 11,384 | 41,512 | 38,859 | 9,647 | 48,506 | ||||||||||||||
Gold | oz | 3,103 | 24,526 | 27,629 | 6,479 | 19,235 | 25,714 | ||||||||||||||
Silver | oz | 465,251 | 292,261 | 757,512 | 573,097 | 207,156 | 780,253 | ||||||||||||||
Zinc2 | tonnes | - | 27,804 | 27,804 | - | 26,211 | 26,211 | ||||||||||||||
| |||||||||||||||||||||
Cash cost3 | $/lb | 1.19 | (0.20) | 0.86 | 1.13 | 0.18 | 0.91 | ||||||||||||||
Sustaining cash cost3 | $/lb | 1.80 | 0.59 | 1.60 | 0.69 | ||||||||||||||||
| |||||||||||||||||||||
All-in sustaining cash cost2 | $/lb | 1.64 | 1.46 | ||||||||||||||||||
| Nine months ended | Nine months ended | |||||||||||||||||||
| Sep. 30, 2017 | Sep. 30, 2016 | |||||||||||||||||||
| Peru | Manitoba | Total | Peru | Manitoba | Total | |||||||||||||||
| |||||||||||||||||||||
Contained metal in concentrate produced1 | |||||||||||||||||||||
Copper | tonnes | 87,944 | 28,073 | 116,017 | 99,446 | 31,262 | 130,708 | ||||||||||||||
Gold | oz | 12,440 | 63,625 | 76,065 | 21,243 | 65,571 | 86,814 | ||||||||||||||
Silver | oz | 1,703,789 | 779,978 | 2,483,767 | 2,036,940 | 726,278 | 2,763,218 | ||||||||||||||
Zinc | tonnes | - | 102,101 | 102,101 | - | 81,438 | 81,438 | ||||||||||||||
Payable metal sold | |||||||||||||||||||||
Copper | tonnes | 77,175 | 30,001 | 107,176 | 96,694 | 30,565 | 127,259 | ||||||||||||||
Gold | oz | 8,022 | 70,527 | 78,549 | 18,016 | 52,170 | 70,186 | ||||||||||||||
Silver | oz | 1,407,130 | 817,653 | 2,224,783 | 1,721,512 | 548,923 | 2,270,435 | ||||||||||||||
Zinc2 | tonnes | - | 84,059 | 84,059 | - | 75,359 | 75,359 | ||||||||||||||
| |||||||||||||||||||||
Cash cost3 | $/lb | 1.24 | (0.31) | 0.86 | 1.08 | 0.55 | 0.95 | ||||||||||||||
Sustaining cash cost3 | $/lb | 1.74 | 0.42 | 1.49 | 1.34 | ||||||||||||||||
| |||||||||||||||||||||
All-in sustaining cash cost2 | $/lb | 1.53 | 1.54 | ||||||||||||||||||
1Metal reported in concentrate is prior to deductions associated with smelter contract terms.
2Includes refined zinc metal sold and payable zinc in concentrate sold.
3Cash cost, sustaining cash cost and all-in sustaining cash cost per pound of copper produced, net of by-product credits are non-IFRS financial performance measures with no standardized definition under IFRS. For further information and a detailed reconciliation, please see the discussion under "Non-IFRS Financial Reporting Measures" beginning on page 29 of this MD&A.
4
![]()
RECENT DEVELOPMENTS
Rosemont Developments
Work continues with the U.S. Forest Service on the draft Mine Plan of Operations, which is progressing as planned. The remaining key federal permit outstanding is the Section 404 Water Permit from the U.S. Army Corps of Engineers.
On September 25, 2017, an opponent of the Rosemont project filed a lawsuit against the U.S. Fish and Wildlife Service and U.S. Forest Service challenging, among other things, the issuance of the Final Record of Decision in respect of Rosemont. This lawsuit is one of many challenges against the Rosemont permitting process and Hudbay is confident the permits will be upheld.
Common Equity Issuance
On September 27, 2017, we completed an equity offering of 24,000,000 common shares of the company at a price of C$10.10 per share, for gross proceeds of C$242.4 million ($195.3 million).
We intend to use the net proceeds of the offering to advance our current growth projects, enhance our financial flexibility to pursue other growth opportunities, reduce debt and for general corporate purposes.
5
![]()
CONSTANCIA OPERATIONS REVIEW
| Three months ended | Nine months ended | Guidance1 | |||||||||||||||
| Sep. 30, | Sep. 30, | Sep. 30, | Sep. 30, | Annual | |||||||||||||
| 2017 | 2016 | 2017 | 2016 | 2017 | |||||||||||||
| ||||||||||||||||||
Ore mined | tonnes | 8,190,444 | 6,945,479 | 22,741,175 | 20,304,794 | |||||||||||||
Copper | % | 0.52 | 0.67 | 0.54 | 0.63 | |||||||||||||
Gold | g/tonne | 0.04 | 0.07 | 0.04 | 0.07 | |||||||||||||
Silver | g/tonne | 4.00 | 4.30 | 3.95 | 4.26 | |||||||||||||
| ||||||||||||||||||
Ore milled | tonnes | 7,828,430 | 6,854,345 | 21,077,729 | 19,830,454 | |||||||||||||
Copper | % | 0.49 | 0.62 | 0.52 | 0.61 | |||||||||||||
Gold | g/tonne | 0.04 | 0.06 | 0.04 | 0.07 | |||||||||||||
Silver | g/tonne | 3.70 | 4.76 | 3.94 | 4.98 | |||||||||||||
| ||||||||||||||||||
Copper concentrate | tonnes | 121,428 | 140,272 | 348,550 | 394,555 | |||||||||||||
Concentrate grade | % Cu | 25.48 | 25.38 | 25.23 | 25.20 | |||||||||||||
| ||||||||||||||||||
Copper recovery | % | 81.2 | 83.6 | 80.7 | 82.7 | |||||||||||||
Gold recovery | % | 51.8 | 50.5 | 47.1 | 49.5 | |||||||||||||
Silver recovery | % | 66.3 | 71.5 | 63.8 | 64.1 | |||||||||||||
| ||||||||||||||||||
Combined unit operating costs1 | $/tonne | 7.49 | 8.71 | 8.50 | 8.13 | 7.20 - 8.80 | ||||||||||||
1Reflects combined mine and mill costs per tonne of ore milled. Peru operations combined mine and mill unit costs include G&A, and reflects the deduction of expected capitalized stripping costs and excludes costs.
Ore mined at our Constancia mine during the third quarter of 2017 increased by 18% compared to the same period in 2016 as we continue to increase stockpiles to improve our ability to blend ore at the processing plant. As expected, milled copper grades in the third quarter were approximately 21% lower than the same period in 2016 as we entered lower grade phases of the mine plan. Mill throughput improved 14% due to increased plant availability as well as plant optimization initiatives during the third quarter of 2017.
Recoveries of copper, gold and silver were lower in the third quarter of 2017, compared to the same period in 2016 primarily due to expected lower head grades and normal ore type variability. Optimization in process recoveries continues to be implemented and evaluated along with consistent positive grade reconciliations.
Combined mine, mill and G&A unit operating costs in the third quarter of 2017 were 14% lower than the same period in 2016 as a result of increased throughput and lower operating costs.
Combined unit operating costs in Peru are expected to be within the guidance range for 2017.
6
![]()
| Three months ended | Nine months ended | Guidance | |||||||||||||||
Contained metal in | Sep. 30, | Sep. 30, | Sep. 30, | Sep. 30, | Annual | |||||||||||||
concentrate produced | 2017 | 2016 | 2017 | 2016 | 2017 | |||||||||||||
Copper | tonnes | 30,936 | 35,604 | 87,944 | 99,446 | 100,000 - 115,000 | ||||||||||||
Gold | oz | 4,702 | 6,867 | 12,440 | 21,243 | |||||||||||||
Silver | oz | 617,959 | 749,498 | 1,703,789 | 2,036,940 | |||||||||||||
Precious metals1 | oz | 13,530 | 17,574 | 36,780 | 50,342 | 55,000 - 65,000 | ||||||||||||
1Precious metals production includes gold and silver production on a gold-equivalent basis. Silver is converted to gold at a ratio of 70:1.
Production of copper, gold and silver in the third quarter of 2017 was lower than the same period in 2016 due to an expected decline in mined grades, while production increased from the second to third quarter of 2017 as a result of improved mill throughput. Production in Peru is expected to be within guidance ranges for 2017.
Peru Cash Cost and Sustaining Cash Cost
| Three months ended | Nine months ended | |||||||||||||
| Sep. 30, | Sep. 30, | Sep. 30, | Sep. 30, | |||||||||||
| 2017 | 2016 | 2017 | 2016 | |||||||||||
Cash cost per pound of copper produced, net of by-product credits1 | $/lb | 1.19 | 1.13 | 1.24 | 1.08 | ||||||||||
| |||||||||||||||
Sustaining cash cost per pound of copper produced, net of by-product credits1 | $/lb | 1.80 | 1.60 | 1.74 | 1.49 | ||||||||||
1Cash cost and sustaining cash costs per pound of copper produced, net of by-product credits, are not recognized under IFRS. For more detail on this non-IFRS financial performance measure, please see the discussion under "Non-IFRS Financial Performance Measures" beginning on page 29 of this MD&A.
Cash cost per pound of copper produced, net of by-product credits, for the three months ended September 30, 2017 was $1.19, an increase of 5% from the same period in 2016 mainly as a result of decreased copper grades.
Sustaining cash cost per pound of copper produced, net of by-product credits, for the three months ended September 30, 2017 was $1.80, an increase of 13% from the same period in 2016 as a result of the factors noted above, as well as expected higher sustaining capital.
7
![]()
Metal Sold
| Three months ended | Nine months ended | ||||||||||||||
| Sep. 30, | Sep. 30, | Sep. 30, | Sep. 30, | ||||||||||||
| 2017 | 2016 | 2017 | 2016 | ||||||||||||
| Payable metal in concentrate | |||||||||||||||
| Copper | tonnes | 30,128 | 38,859 | 77,175 | 96,694 | ||||||||||
| Gold | oz | 3,103 | 6,479 | 8,022 | 18,016 | ||||||||||
| Silver | oz | 465,251 | 573,097 | 1,407,130 | 1,721,512 | ||||||||||
8
![]()
MANITOBA OPERATIONS REVIEW
Mines
| Three months ended | Nine months ended | |||||||||||||
| Sep. 30, | Sep. 30, | Sep. 30, | Sep. 30, | |||||||||||
| 2017 | 2016 | 2017 | 2016 | |||||||||||
777 | |||||||||||||||
Ore | tonnes | 235,593 | 307,436 | 811,841 | 999,694 | ||||||||||
Copper | % | 1.58 | 1.49 | 1.60 | 1.54 | ||||||||||
Zinc | % | 5.87 | 4.73 | 5.12 | 3.37 | ||||||||||
Gold | g/tonne | 2.24 | 1.76 | 2.02 | 1.48 | ||||||||||
Silver | g/tonne | 33.18 | 27.49 | 25.88 | 20.53 | ||||||||||
| |||||||||||||||
Lalor | |||||||||||||||
Ore | tonnes | 342,184 | 271,172 | 959,189 | 814,206 | ||||||||||
Copper | % | 0.76 | 0.77 | 0.65 | 0.64 | ||||||||||
Zinc | % | 7.80 | 7.04 | 7.92 | 6.88 | ||||||||||
Gold | g/tonne | 2.06 | 2.21 | 1.81 | 2.30 | ||||||||||
Silver | g/tonne | 25.60 | 24.71 | 22.48 | 21.60 | ||||||||||
| |||||||||||||||
Reed1 | |||||||||||||||
Ore | tonnes | 117,536 | 112,929 | 358,184 | 338,842 | ||||||||||
Copper | % | 4.06 | 3.59 | 3.72 | 4.28 | ||||||||||
Zinc | % | 0.62 | 0.59 | 0.57 | 0.62 | ||||||||||
Gold | g/tonne | 0.48 | 0.42 | 0.46 | 0.52 | ||||||||||
Silver | g/tonne | 8.23 | 6.61 | 6.68 | 7.10 | ||||||||||
| |||||||||||||||
Total Mines | |||||||||||||||
Ore | tonnes | 695,313 | 691,537 | 2,129,214 | 2,152,742 | ||||||||||
Copper | % | 1.60 | 1.55 | 1.53 | 1.63 | ||||||||||
Zinc | % | 5.93 | 4.96 | 5.61 | 4.26 | ||||||||||
Gold | g/tonne | 1.86 | 1.71 | 1.67 | 1.64 | ||||||||||
Silver | g/tonne | 25.23 | 22.99 | 21.12 | 18.82 | ||||||||||
1Includes 100% of Reed mine production.
| Three months ended | Nine months ended | |||||||||||||
| Sep. 30, | Sep. 30, | Sep. 30, | Sep. 30, | |||||||||||
Unit Operating Costs | 2017 | 2016 | 2017 | 2016 | |||||||||||
Mines | |||||||||||||||
777 | C$/tonne | 72.11 | 54.47 | 63.04 | 51.93 | ||||||||||
Lalor | C$/tonne | 79.26 | 64.08 | 79.85 | 65.50 | ||||||||||
Reed | C$/tonne | 76.99 | 47.19 | 63.61 | 45.48 | ||||||||||
Total Mines | C$/tonne | 76.43 | 57.56 | 71.08 | 56.57 | ||||||||||
Ore mined at our Manitoba operations during the third quarter of 2017 was consistent with ore mined in the same period in 2016. Increased production at our Lalor and Reed mines was partially offset by decreased production at our 777 mine. Overall, copper, zinc, gold and silver grades were 3%, 20%, 9% and 10% higher, respectively, in the third quarter of 2017 compared to the same period of 2016. Grade variances were due to planned stope sequencing, including the re-sequencing of the 777 mine plan to prioritize higher grade zinc stopes in 2017. Unit operating costs for all Manitoba mines for the third quarter of 2017 increased by 33% compared to the same period in 2016.
9
![]()
We ceased capitalizing Reed development costs in the third quarter of 2017 as a result of the mine’s expected closure in the third quarter of 2018, resulting in higher Reed unit operating costs compared to prior periods. The 777 mine experienced a plugged paste backfill line at the start of the third quarter of 2017, which has since been restored; however the lack of paste backfill reduced the number of production stopes in the quarter, and 777 costs were affected by cleaning and re-drilling of backfill holes and the cost of cemented rock fill to mitigate the lack of paste. The impact on production rates is expected to continue to the fourth quarter of 2017, with the mine expected to return to normal production rates and expected costs towards the end of the year.
Consistent with our revised mine plan, Lalor’s unit costs reflect increased cement rock filling costs as well as substantial operating and capital development work that was undertaken to increase Lalor’s production rate to 4,500 tonnes per day. The strong ramp up of ore production from the Lalor mine in 2017 has resulted in the accumulation of an ore stockpile as Lalor’s mine production has exceeded the Stall concentrator’s current milling capacity. With intention to take advantage of higher metal prices and increase our revenues at a slightly higher unit cost, ore will be trucked to the Flin Flon mill for processing for the remainder of the year.
Year-to-date ore mined at our Manitoba operations was 1% lower than the same period in 2016 as a result of lower production at our 777 mine partially offset by higher production at our Reed and Lalor mines. Year-to-date copper grades in 2017 were lower than the same period in 2016 by 6%, while zinc, gold and silver grades were 32%, 2%, and 12% higher, respectively, which is in line with mine plan expectations. Year-to-date total mine unit costs were 26% higher than the same period in 2016 as a result of the same factors that impacted third quarter total mine unit costs.
10
![]()
Processing Facilities
| Three months ended | Nine months ended | |||||||||||||
| Sep. 30, | Sep. 30, | Sep. 30, | Sep. 30, | |||||||||||
| 2017 | 2016 | 2017 | 2016 | |||||||||||
Flin Flon Concentrator | |||||||||||||||
Ore | tonnes | 390,366 | 433,589 | 1,200,448 | 1,299,978 | ||||||||||
Copper | % | 2.13 | 2.13 | 2.14 | 2.23 | ||||||||||
Zinc | % | 4.67 | 3.42 | 3.94 | 2.67 | ||||||||||
Gold | g/tonne | 1.72 | 1.36 | 1.57 | 1.24 | ||||||||||
Silver | g/tonne | 25.20 | 20.95 | 20.32 | 17.07 | ||||||||||
| |||||||||||||||
Copper concentrate | tonnes | 31,179 | 35,939 | 97,970 | 112,011 | ||||||||||
Concentrate grade | % Cu | 24.95 | 23.62 | 24.25 | 23.94 | ||||||||||
| |||||||||||||||
Zinc concentrate | tonnes | 30,511 | 23,638 | 79,464 | 54,212 | ||||||||||
Concentrate grade | % Zn | 52.18 | 51.63 | 51.48 | 51.54 | ||||||||||
| |||||||||||||||
Copper recovery | % | 93.4 | 92.0 | 92.3 | 92.7 | ||||||||||
Zinc recovery | % | 87.3 | 82.3 | 86.5 | 80.5 | ||||||||||
Gold recovery | % | 63.2 | 59.1 | 60.9 | 59.3 | ||||||||||
Silver recovery | % | 60.9 | 56.3 | 57.6 | 56.3 | ||||||||||
| |||||||||||||||
Contained metal in concentrate produced | |||||||||||||||
Copper | tonnes | 7,778 | 8,487 | 23,754 | 26,820 | ||||||||||
Zinc | tonnes | 15,919 | 12,204 | 40,906 | 27,943 | ||||||||||
Precious metals1 | oz | 16,404 | 13,554 | 43,442 | 36,518 | ||||||||||
| |||||||||||||||
Stall Concentrator | |||||||||||||||
Ore | tonnes | 280,945 | 289,237 | 834,398 | 831,771 | ||||||||||
Copper | % | 0.74 | 0.76 | 0.63 | 0.65 | ||||||||||
Zinc | % | 7.88 | 7.13 | 7.91 | 6.92 | ||||||||||
Gold | g/tonne | 2.06 | 2.19 | 1.80 | 2.30 | ||||||||||
Silver | g/tonne | 25.28 | 24.16 | 22.12 | 21.63 | ||||||||||
| |||||||||||||||
Copper concentrate | tonnes | 8,014 | 8,754 | 20,870 | 21,347 | ||||||||||
Concentrate grade | % Cu | 21.61 | 21.09 | 20.70 | 20.81 | ||||||||||
| |||||||||||||||
Zinc concentrate | tonnes | 40,334 | 37,469 | 118,058 | 104,061 | ||||||||||
Concentrate grade | % Zn | 51.36 | 51.78 | 51.84 | 51.41 | ||||||||||
| |||||||||||||||
Copper recovery | % | 83.6 | 84.0 | 81.8 | 82.8 | ||||||||||
Zinc recovery | % | 93.6 | 94.1 | 92.7 | 93.0 | ||||||||||
Gold recovery | % | 55.4 | 58.0 | 55.3 | 56.6 | ||||||||||
Silver recovery | % | 54.7 | 57.8 | 55.3 | 56.1 | ||||||||||
| |||||||||||||||
Contained metal in concentrate produced | |||||||||||||||
Copper | tonnes | 1,731 | 1,846 | 4,319 | 4,442 | ||||||||||
Zinc | tonnes | 20,716 | 19,402 | 61,195 | 53,495 | ||||||||||
Precious metals1 | oz | 12,108 | 13,649 | 31,326 | 39,429 | ||||||||||
1Precious metals production includes gold and silver production on a gold-equivalent basis. Silver is converted to gold at a ratio of 70:1.
11
![]()
| Three months ended | Nine months ended | Guidance | |||||||||||||||
| Sep. 30, | Sep. 30, | Sep. 30, | Sep. 30, | Annual | |||||||||||||
Unit Operating Costs | 2017 | 2016 | 2017 | 2016 | 2017 | |||||||||||||
Concentrators | ||||||||||||||||||
Flin Flon | C$/tonne | 17.90 | 22.33 | 18.78 | 18.26 | |||||||||||||
Stall | C$/tonne | 27.31 | 24.30 | 29.81 | 22.39 | |||||||||||||
Combined mine/mill unit operating costs1 | ||||||||||||||||||
Manitoba | C$/tonne | 119.87 | 92.45 | 115.86 | 91.55 | 88 - 108 | ||||||||||||
1Reflects combined mine, mill and G&A costs per tonne of milled ore. Includes the cost of ore purchased from our joint venture partner at Reed mine.
Ore processed in Flin Flon in the third quarter of 2017 was 10% lower than the same period in 2016 as a result of lower production at our 777 mine, which was partially offset by processing 63,936 tonnes of ore from our Lalor mine. Copper recovery in the third quarter of 2017 was consistent with the same period in 2016, while zinc, gold, and silver recoveries were 6%, 7%, and 8% higher, respectively, due to higher head grades. Unit operating costs at the Flin Flon concentrator were 20% lower in the third quarter of 2017 compared to the same period in 2016 as a result of lower maintenance expenditures. Ore processed and recoveries at the Stall concentrator in the third quarter of 2017 were consistent with the same period in 2016. Unit operating costs at the Stall concentrator were 12% higher in the third quarter of 2017 compared to the same period in 2016 as a result of higher maintenance expenditures.
Ore processed year-to-date in 2017 in Flin Flon was 8% lower than the same period in 2016 as a result of lower production at our 777 mine. Year-to-date recoveries of copper, gold, and silver, were fairly consistent with the same period in 2016, while zinc recovery was 7% higher due to higher zinc head grades. Year-to-date unit operating costs at the Flin Flon concentrator were 3% higher than the same period in 2016 as a result of lower production as well as higher maintenance costs in the first half of 2017. Ore processed year-to-date and recoveries for all metals in 2017 at the Stall concentrator were consistent with the same period in 2016. Year-to-date unit operating costs at the Stall concentrator were 33% higher than the same period in 2016 as a result of higher maintenance expenditures and the use of higher-cost temporary crushing facilities primarily during the first quarter. Manitoba combined mine, mill and G&A unit operating costs in the third quarter and year-to-date in 2017 were 30%, and 27% higher, respectively, than in the same periods in 2016 due to the factors described above as well as higher 777, Reed and Lalor unit costs due to the factors described under “Mines”, above. In addition, the stockpiling of Lalor ore described above increases combined mine/mill unit costs as that metric is expressed as total costs during the period (irrespective of inventory changes), divided by the tonnes of ore milled. This factor should reverse as stockpiles reduce, although future costs will be affected by higher Reed mine unit costs as the capitalization of development costs has ceased, and additional costs will be incurred to truck Lalor ore to the Flin Flon mill. Processing the additional Lalor production in Flin Flon is expected to drive economies of scale and additional revenues through a faster ramp up.
As a result of all of these factors, Manitoba combined unit operating costs for the full year 2017 are expected to be moderately higher than the guidance range of C$88 – C$108 per tonne.
12
![]()
| Three months ended | Nine months ended | Guidance1 | |||||||||||||||
Manitoba contained metal in | Sep. 30, | Sep. 30, | Sep. 30, | Sep. 30, | Annual | |||||||||||||
concentrate produced1,2 | 2017 | 2016 | 2017 | 2016 | 2017 | |||||||||||||
Copper | tonnes | 9,509 | 10,333 | 28,073 | 31,262 | 32,500 - 42,500 | ||||||||||||
Gold | oz | 23,975 | 22,998 | 63,625 | 65,571 | |||||||||||||
Silver | oz | 317,567 | 294,293 | 779,978 | 726,278 | |||||||||||||
Zinc | tonnes | 36,635 | 31,606 | 102,101 | 81,438 | 125,000 - 150,000 | ||||||||||||
| ||||||||||||||||||
Precious metals3 | oz | 28,512 | 27,203 | 74,768 | 75,947 | 90,000 - 110,000 | ||||||||||||
1Includes 100% of Reed mine production.
2Metal reported in concentrate is prior to deductions associated with smelter terms.
3Precious metals production includes gold and silver production on a gold-equivalent basis. Silver is converted to gold at a ratio of 70:1.
In the third quarter of 2017, production of copper was 8% lower than the same period in 2016 as a result of lower production at 777, while zinc, gold, and silver production was 16%, 4%, and 8% higher, respectively, compared to the same period of 2016 as a result of higher grades at 777 and Lalor as well as higher production at Lalor. Production in Manitoba is expected to be within guidance ranges for 2017.
Zinc Plant
| Three months ended | Nine months ended | Guidance | |||||||||||||||
| Sep. 30, | Sep. 30, | Sep. 30, | Sep. 30, | Annual | |||||||||||||
Zinc Production | 2017 | 2016 | 2017 | 2016 | 2017 | |||||||||||||
Zinc Concentrate Treated | ||||||||||||||||||
Domestic | tonnes | 54,510 | 57,611 | 164,671 | 156,632 | |||||||||||||
| ||||||||||||||||||
Refined Metal Produced | ||||||||||||||||||
Domestic | tonnes | 25,858 | 26,559 | 80,152 | 73,695 | 95,000 - 115,000 | ||||||||||||
| Three months ended | Nine months ended | Guidance | |||||||||||||||
| Sep. 30, | Sep. 30, | Sep. 30, | Sep. 30, | Annual | |||||||||||||
Unit Operating Costs | 2017 | 2016 | 2017 | 2016 | 2017 | |||||||||||||
Zinc Plant1 | C$/lb | 0.44 | 0.42 | 0.43 | 0.46 | 0.40 - 0.50 | ||||||||||||
1Zinc unit operating costs include G&A costs.
13
![]()
Production of cast zinc in the third quarter of 2017 was 3% lower compared to the same period in 2016 and operating costs per pound of zinc metal produced were 5% higher as a result of lower production. Year-to-date production in 2017 was 9% higher compared to the same period in 2016 as a result of higher amperages in the zinc plant cell house due to improvements made in the operation of the cooling towers during the hotter summer months. Operating costs per pound of zinc metal produced year-to-date were 7% lower compared to the same period in 2016 as a result of increased production. Refined zinc metal production and zinc plant unit operating costs are expected to be within guidance ranges for 2017.
Manitoba Cash Cost and Sustaining Cash Cost
| Three months ended | Nine months ended | |||||||||||||
| Sep. 30, | Sep. 30, | Sep. 30, | Sep. 30, | |||||||||||
| 2017 | 2016 | 2017 | 2016 | |||||||||||
Cost per pound of copper produced | |||||||||||||||
| |||||||||||||||
Cash cost per pound of copper produced, net of by-product credits1 | $/lb | (0.20 | ) | 0.18 | (0.31 | ) | 0.55 | ||||||||
| |||||||||||||||
Sustaining cash cost per pound of copper produced, net of by-product credits1 | $/lb | 0.59 | 0.69 | 0.42 | 1.34 | ||||||||||
| |||||||||||||||
Cost per pound of zinc produced | |||||||||||||||
| |||||||||||||||
Cash cost per pound of zinc produced, net of by-product credits1 | $/lb | 0.05 | 0.30 | 0.18 | 0.31 | ||||||||||
| |||||||||||||||
Sustaining cash cost per pound of zinc produced, net of by-product credits1 | $/lb | 0.25 | 0.46 | 0.38 | 0.62 | ||||||||||
1Cash cost and sustaining cash cost per pound of copper & zinc produced, net of by-product credits, are not recognized under IFRS. For more detail on this non-IFRS financial performance measure, please see the discussion under "Non-IFRS Financial Performance Measures" beginning on page 29 of this MD&A.
In Manitoba, cash cost, net of by-product credits, in the third quarter of 2017 was negative $0.20 per pound of copper produced compared to $0.18 in the third quarter of 2016. The decrease is primarily a result of significantly increased by-product credits for all metals, which were partially offset by expected higher costs at our 777 and Reed mines during this part of their mine life. Sustaining cash cost, net of by-product credits, in the third quarter of 2017 decreased to $0.59 per pound of copper produced compared to $0.69 in the third quarter of 2016 as a result of the same factors described above which were partially offset by planned increased capital spending. On a year-to-date basis, the declines in cash cost, net of by-product credits and sustaining cash cost, net of by-product credits, were the result of the same factors impacting third quarter results.
Cash cost and sustaining cash cost per pound of zinc produced, net of by-product credits, was lower compared to the same period last year as a result of increased zinc production, and higher grades realized with the revised 777 mine plan, partially offset by the higher mining costs associated with the 777 and Reed mine at this stage of their mine lives.
14
![]()
Metal Sold
| Three months ended | Nine months ended | |||||||||||||
| Sep. 30, | Sep. 30, | Sep. 30, | Sep. 30, | |||||||||||
| 2017 | 2016 | 2017 | 2016 | |||||||||||
Payable metal in concentrate | |||||||||||||||
Copper | tonnes | 11,384 | 9,647 | 30,001 | 30,565 | ||||||||||
Gold | oz | 24,526 | 19,235 | 70,527 | 52,170 | ||||||||||
Silver | oz | 292,261 | 207,156 | 817,653 | 548,923 | ||||||||||
Zinc | tonnes | 3,803 | - | 5,563 | - | ||||||||||
| |||||||||||||||
Refined zinc | tonnes | 24,001 | 26,211 | 78,496 | 75,359 | ||||||||||
Due to increased Lalor mine throughput and higher zinc grades at 777, zinc concentrate production is exceeding the processing capacity of the Flin Flon zinc plant. As a result, sales of excess zinc concentrate inventory began in the second quarter of 2017 and will continue as long as concentrate production exceeds zinc plant processing capacity.
FINANCIAL REVIEW
Financial Results
In the third quarter of 2017, we recorded a profit of $40.9 million compared to a profit of $33.6 million for the same period in 2016, an increase in profit of $7.3 million.
Year-to-date in 2017, we recorded a profit of $64.2 million compared to a profit of $12.1 million in the same period in 2016, an increase in profit of $52.1 million.
15
![]()
The following table provides further details on these variances:
| Three months ended | Nine months ended | ||||
(in $ millions) | Sep. 30, 2017 | Sep. 30, 2017 | ||||
Increase (decrease) in components of profit or loss: | ||||||
Revenues | 58.9 | 136.4 | ||||
Cost of sales | ||||||
Mine operating costs | (19.2 | ) | (45.8 | ) | ||
Depreciation and amortization | 2.8 | 2.9 | ||||
Net Finance expense | (19.6 | ) | (16.0 | ) | ||
Other | (6.3 | ) | 4.0 | |||
Tax | (9.3 | ) | (29.4 | ) | ||
| ||||||
Increase in profit in 2017 compared to 2016 | 7.3 | 52.1 |
Revenue
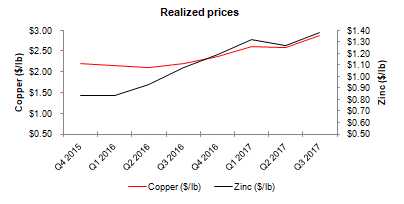
Revenue for the third quarter of 2017 was $370.4 million, $58.9 million higher than the same period in 2016, primarily as a result of higher metal prices for copper and zinc, and higher gold and zinc sales volumes, partially offset by lower copper sales volumes.
Year-to-date revenue was $948.4 million, $136.4 million higher than the same period in 2016, due to significantly higher realized sales prices for copper and zinc metals, and lower treatment and refining charges, partially offset by lower copper sales volumes.
| Three months ended | Nine months ended | ||||
(in $ millions) | Sep. 30, 2017 | Sep. 30, 2017 | ||||
Metals prices1 | ||||||
Higher copper prices | 62.0 | 130.3 | ||||
Higher zinc prices | 18.4 | 68.8 | ||||
Lower gold prices | (2.1 | ) | (12.1 | ) | ||
Lower silver prices | (3.1 | ) | (6.0 | ) | ||
| ||||||
Sales volumes | ||||||
Lower copper sales volumes | (33.4 | ) | (96.6 | ) | ||
Higher zinc sales volumes | 3.8 | 18.2 | ||||
Higher gold sales volumes | 4.4 | 16.7 | ||||
Higher silver sales volumes | 0.3 | 1.5 | ||||
| ||||||
Other | ||||||
Derivative mark-to-market decrease | (0.4 | ) | (7.6 | ) | ||
Other volume and pricing differences | 4.2 | 9.2 | ||||
Effect of lower treatment and refining charges | 4.8 | 14.0 | ||||
| ||||||
Increase in revenue in 2017 compared to 2016 | 58.9 | 136.4 |
1 See discussion below for further information regarding metals prices.
16
![]()
Our revenue by significant product type is summarized below:
| Three months ended | Nine months ended | ||||||||||
| Sep. 30, | Sep. 30, | Sep. 30, | Sep. 30, | ||||||||
(in $ millions) | 2017 | 2016 | 2017 | 2016 | ||||||||
Copper | 263.4 | 234.8 | 638.5 | 604.8 | ||||||||
Zinc | 84.7 | 62.9 | 244.8 | 165.4 | ||||||||
Gold | 35.8 | 33.5 | 95.6 | 91.0 | ||||||||
Silver | 11.6 | 14.4 | 33.4 | 37.8 | ||||||||
Other | 5.0 | 0.8 | 11.1 | 2.0 | ||||||||
Gross revenue1 | 400.5 | 346.4 | 1,023.4 | 901.0 | ||||||||
Treatment and refining charges | (30.1 | ) | (35.0 | ) | (75.0 | ) | (89.0 | ) | ||||
| ||||||||||||
Revenue | 370.4 | 311.4 | 948.4 | 812.0 | ||||||||
1Copper, gold and silver revenues include unrealized gains and losses related to non-hedge derivative contracts including fixed for floating swaps, that are included in realized prices. Zinc revenues include unrealized gains and losses related to non-hedge derivative contracts that are not included in realized prices.
17
![]()
Realized sales prices
This measure is intended to enable management and investors to understand the average realized price of metals sold to third parties in each reporting period. The average realized price per unit sold does not have any standardized meaning prescribed by IFRS, is unlikely to be comparable to similar measures presented by other issuers, and should not be considered in isolation or a substitute for measures of performance prepared in accordance with IFRS.
For sales of copper, gold and silver we may enter into non-hedge derivatives (“QP hedges”) which are intended to manage the provisional pricing risk arising from quotational period terms in concentrate sales agreements. The QP hedges are not removed from the calculation of realized prices. We expect that gains and losses on QP hedges will offset provisional pricing adjustments on concentrate sales contracts.
Our realized prices for the third quarter and year-to-date in 2017 and 2016, respectively, are summarized below:
| Realized prices1for the | Realized prices1for the | |||||||||||||||||||
| Three months ended | Nine months ended | |||||||||||||||||||
| LME QTD | Sep. 30, | Sep. 30, | LME YTD | Sep. 30, | Sep. 30, | |||||||||||||||
| 20172 | 2017 | 2016 | 20172 | 2017 | 2016 | |||||||||||||||
Prices | |||||||||||||||||||||
Copper | $/lb | 2.88 | 2.88 | 2.20 | 2.70 | 2.70 | 2.16 | ||||||||||||||
Zinc3 | $/lb | 1.34 | 1.38 | 1.08 | 1.26 | 1.32 | 0.95 | ||||||||||||||
Gold4 | $/oz | 1,296 | 1,303 | 1,217 | 1,297 | ||||||||||||||||
Silver4 | $/oz | 15.31 | 18.43 | 14.99 | 16.64 | ||||||||||||||||
1Realized prices exclude refining and treatment charges and are on the sale of finished metal or metal in concentrate. Realized prices include the effect of provisional pricing adjustments on prior period sales.
2London Metal Exchange average for copper and zinc prices.
3This amount includes a realized sales price of $1.37 for cast zinc metal and $1.42 for zinc concentrate sold for the three months ended September 30, 2017. Zinc realized prices include premiums paid by customers for delivery of refined zinc metal, but exclude unrealized gains and losses related to non-hedge derivative contracts that are included in zinc revenues. For the three months ended September 30, 2017, the unrealized component of the zinc derivative resulted in a gain of $0.01/lb. For the three months ended September 30, 2016, the unrealized component of the zinc derivative resulted in a gain of $0.01/lb.
4Sales of gold and silver from our 777 and Constancia mines are subject to our precious metals stream agreement with Wheaton Precious Metals, pursuant to which we recognize deferred revenue for precious metals deliveries and also receive cash payments. Stream sales are included within realized prices and their respective deferred revenue and cash payment rates can be found on page 20.
18
![]()
The following table provides a reconciliation of average realized price per unit sold, by metal, to revenues as shown in the consolidated financial statements:
Three months ended September 30, 2017 | ||||||||||||||||||
(in $ millions)1 | Copper | Zinc | Gold | Silver | Other | Total | ||||||||||||
| ||||||||||||||||||
Revenue per financial statements | 263.4 | 84.7 | 35.8 | 11.6 | 5.0 | 400.5 | ||||||||||||
Derivative mark-to-market2 | - | (0.3 | ) | - | - | - | (0.3 | ) | ||||||||||
Revenue, excluding mark-to-market on non-QP hedges | 263.4 | 84.4 | 35.8 | 11.6 | 5.0 | 400.2 | ||||||||||||
Payable metal in concentrate sold3 | 41,512 | 27,804 | 27,629 | 757,512 | - | - | ||||||||||||
Realized price4 | 6,346 | 3,036 | 1,296 | 15.31 | - | - | ||||||||||||
Realized price5 | 2.88 | 1.38 | - | - | - | - | ||||||||||||
Nine months ended September 30, 2017 | ||||||||||||||||||
(in $ millions)1 | Copper | Zinc | Gold | Silver | Other | Total | ||||||||||||
Revenue per financial statements | 638.5 | 244.8 | 95.6 | 33.4 | 11.1 | 1,023.4 | ||||||||||||
Derivative mark-to-market2 | - | (0.2 | ) | - | - | - | (0.2 | ) | ||||||||||
Revenue, excluding mark-to-market on non-QP hedges | 638.5 | 244.6 | 95.6 | 33.4 | 11.1 | 1,023.2 | ||||||||||||
Payable metal in concentrate sold3 | 107,176 | 84,059 | 78,549 | 2,224,783 | - | - | ||||||||||||
Realized price4 | 5,957 | 2,910 | 1,217 | 14.99 | - | - | ||||||||||||
Realized price5 | 2.70 | 1.32 | - | - | - | - | ||||||||||||
Three months ended September 30, 2016 | ||||||||||||||||||
(in $ millions)1 | Copper | Zinc | Gold | Silver | Other | Total | ||||||||||||
Revenue per financial statements | 234.8 | 62.9 | 33.5 | 14.4 | 0.8 | 346.4 | ||||||||||||
Derivative mark-to-market2 | - | (0.7 | ) | - | - | - | (0.7 | ) | ||||||||||
Revenue, excluding mark-to-market on non-QP hedges | 234.8 | 62.2 | 33.5 | 14.4 | 0.8 | 345.7 | ||||||||||||
Payable metal in concentrate sold3 | 48,506 | 26,211 | 25,714 | 780,253 | - | - | ||||||||||||
Realized price4 | 4,841 | 2,374 | 1,303 | 18.43 | - | - | ||||||||||||
Realized price5 | 2.20 | 1.08 | - | - | - | - | ||||||||||||
Nine months ended September 30, 2016 | ||||||||||||||||||
(in $ millions)1 | Copper | Zinc | Gold | Silver | Other | Total | ||||||||||||
Revenue per financial statements | 604.8 | 165.4 | 91.0 | 37.8 | 2.0 | 901.0 | ||||||||||||
Derivative mark-to-market2 | - | (7.8 | ) | - | - | - | (7.8 | ) | ||||||||||
Revenue, excluding mark-to-market on non-QP hedges | 604.8 | 157.6 | 91.0 | 37.8 | 2.0 | 893.2 | ||||||||||||
Payable metal in concentrate sold3 | 127,259 | 75,359 | 70,186 | 2,270,435 | - | - | ||||||||||||
Realized price4 | 4,752 | 2,091 | 1,297 | 16.64 | - | - | ||||||||||||
Realized price5 | 2.16 | 0.95 | - | - | - | - | ||||||||||||
1Average realized price per unit sold may not calculate based on amounts presented in this table due to rounding.
2Derivative mark-to-market excludes mark-to-market on QP hedges.
3Copper and zinc shown in tonnes and gold and silver shown in ounces.
4Realized price for copper and zinc in $/metric tonne and realized price for gold and silver in $/oz.5Realized price for copper and zinc in $/lb.
The price, quantity and mix of metals sold, affect our revenue, operating cash flow and profit. Revenue from metals sales can vary from quarter to quarter due to production levels, shipping volumes and transfer of risk and title to customers.
19
![]()
Stream Sales
The following table shows stream sales included within realized prices and their respective deferred revenue and cash payment rates:
| Three months ended | Nine months ended | |||||||||||||
| Sep. 30, 2017 | Sep. 30, 2017 | |||||||||||||
| Manitoba | Peru | Manitoba | Peru | |||||||||||
Gold | oz | 5,304 | 1,959 | 17,911 | 6,630 | ||||||||||
Silver | oz | 135,301 | 443,205 | 402,164 | 1,385,084 | ||||||||||
Gold deferred revenue drawdown rate1 | $/oz | 1,097 | 431 | 1,100 | 431 | ||||||||||
Gold cash rate2 | $/oz | 412 | 400 | 409 | 400 | ||||||||||
Silver deferred revenue drawdown rate1 | $/oz | 16.33 | 7.39 | 16.78 | 7.39 | ||||||||||
Silver cash rate2 | $/oz | 6.08 | 5.90 | 6.04 | 5.90 | ||||||||||
| Three months ended | Nine months ended | |||||||||||||
| Sep. 30, 2016 | Sep. 30, 2016 | |||||||||||||
| Manitoba | Peru | Manitoba | Peru | |||||||||||
Gold | oz | 8,219 | 3,665 | 25,738 | 11,937 | ||||||||||
Silver | oz | 96,016 | 573,097 | 311,886 | 1,721,512 | ||||||||||
Gold deferred revenue drawdown rate1 | $/oz | 1,105 | 436 | 1,067 | 436 | ||||||||||
Gold cash rate2 | $/oz | 407 | 400 | 405 | 400 | ||||||||||
Silver deferred revenue drawdown rate1 | $/oz | 20.23 | 7.39 | 19.47 | 7.39 | ||||||||||
Silver cash rate2 | $/oz | 6.00 | 5.90 | 5.97 | 5.90 | ||||||||||
1Deferred revenue amortization is recorded in Manitoba at C$1,368/oz and C$20.33/oz for gold and silver, respectively, (January 1, 2017 to June 30, 2017 - C$1,464/oz and C$22.60/oz; 2016 - C$1,382/oz and C$25.23/oz) and converted to US dollars at the exchange rate in effect at the time of revenue recognition.
2The gold and silver cash rate for Manitoba increased by 1% from $400/oz and $5.90/oz effective August 1, 2015. Subsequently every year, on August 1, the cash rate will increase by 1% compounded. The weighted average cash rate is disclosed.
20
![]()
Cost of Sales
Our detailed cost of sales is summarized as follows:
| Three months ended | Nine months ended | ||||||||||
| Sep. 30, | Sep. 30, | Sep. 30, | Sep. 30, | ||||||||
(in $ thousands) | 2017 | 2016 | 2017 | 2016 | ||||||||
| ||||||||||||
Peru | ||||||||||||
Mine | 14,225 | 16,396 | 40,125 | 43,309 | ||||||||
Concentrator | 30,730 | 31,934 | 98,799 | 86,468 | ||||||||
Changes in product inventory | 7,006 | 7,793 | (8,020 | ) | 5,006 | |||||||
Depreciation and amortization | 47,137 | 51,720 | 122,656 | 129,252 | ||||||||
G&A | 13,588 | 11,387 | 39,011 | 31,444 | ||||||||
Freight, royalties and other charges | 13,341 | 14,851 | 35,895 | 43,859 | ||||||||
Total Peru cost of sales | 126,027 | 134,081 | 328,466 | 339,338 | ||||||||
| ||||||||||||
Manitoba | ||||||||||||
Manitoba mines | 40,320 | 29,012 | 110,200 | 87,780 | ||||||||
Manitoba concentrators | 11,703 | 12,801 | 36,281 | 32,118 | ||||||||
Zinc plant | 17,312 | 16,284 | 49,508 | 48,474 | ||||||||
Purchased ore and concentrate (before inventory changes) | 6,457 | 3,985 | 15,725 | 12,204 | ||||||||
Changes in product inventory | (3,298 | ) | (2,973 | ) | (2,000 | ) | 1,867 | |||||
Depreciation and amortization | 32,374 | 30,559 | 94,927 | 91,186 | ||||||||
G&A | 15,076 | 9,847 | 40,379 | 26,531 | ||||||||
Freight, royalties and other charges | 13,420 | 9,369 | 36,831 | 27,853 | ||||||||
Total Manitoba cost of sales | 133,364 | 108,884 | 381,851 | 328,013 | ||||||||
| ||||||||||||
Cost of sales | 259,391 | 242,965 | 710,317 | 667,351 | ||||||||
Total cost of sales for the third quarter of 2017 was $259.4 million, reflecting an increase of $16.4 million from the third quarter of 2016. Cost of sales related to Peru was $8.1 million lower primarily due to lower depreciation. In Manitoba, cost of sales increased by $24.5 million compared to the third quarter of 2016 as a result of higher mining, freight and profit sharing costs.
Cost of sales year-to-date in 2017 was $710.3 million, an increase of $43.0 million compared to 2016. The increase is mostly attributable to Manitoba which had higher year-to-date costs of $53.8 million compared to the same period last year due to the reasons outlined above and additional costs due to utilization of temporary crushing facilities at the Stall mill primarily during the first quarter.
For details on unit operating costs refer to the respective tables in the “Operations Review” section beginning on page 6 of this MD&A.
For the third quarter of 2017, other significant variances in expenses from operations, compared to the same period in 2016, include the following:
− | Selling and administrative expenses increased by $5.1 million, which was mainly the result of increased share based compensation expenses resulting from the revaluation of previously issued share units to higher share prices during the current quarter compared to the same period last year. |
21
![]()
| − | Exploration and evaluation expenses increased by $5.3 million mainly as a result of mineral property farm-in agreement with Amarc Resources Ltd. that was entered into in July 2017. Under the terms of the agreement, Hudbay may acquire, through a staged investment process, up to a 60% ownership interest in Amarc's IKE copper porphyry district, located near Gold Bridge, British Columbia. |
| − | Other operating income increased by $4.2 million mainly as a result of a recovery from damages incurred pertaining to the Constancia grinding line 2 failure in 2015. |
| − | Finance expenses decreased by $2.0 million mainly as a result of lower interest costs on our senior unsecured notes after we completed our refinancing in December 2016. In addition, there were lower interest costs realized on our senior secured revolving credit facilities (the “Credit Facilities”), which was a function of reduced outstanding amounts on these Credit Facilities compared to the same period last year. |
| − | Other finance expenses increased by $21.5 million primarily as a result of: |
| − | Foreign exchange losses of $6.5 million in the third quarter of 2017 compared to losses of $0.6 million in the third quarter of 2016; | |
| − | Disposals, impairment and mark-to-market adjustments on held for trading and available-for-sale investments resulted in a net loss of $1.6 million during the current period of 2017 compared to a gain of $0.1 million during the same period last year; | |
| − | Fair value adjustments pertaining to the embedded derivative on the senior unsecured notes, our gold option liability related to the acquisition of the New Britannia mine and mill (“NBM Mill”) and an embedded derivative pertaining to purchase contracts resulted in a loss of $1.4 million in the third quarter of 2017 compared to gains of $7.7 million in the third quarter of 2016; and | |
| − | Mark-to-market losses on warrants of $2.0 million compared to a gain of $2.8 million in the same period last year. |
For 2017 year-to-date, other significant variances in expenses from operations, compared to 2016 year-to-date, include the following:
| − | The increase in selling and administrative expenses of $2.9 million and the increase in exploration and evaluation expenses of $6.8 million was generally caused by the same factors as previously mentioned for the quarterly movement. |
| − | The increase in other operating income of $13.7 million during the 2017 year-to-date period compared to same year-to-date period last year was primarily the result of various recoveries pertaining to the Constancia grinding line 2 failure in 2015. |
| − | Finance expenses decreased by $9.1 million mainly as a result of lower interest costs on our senior unsecured notes after we completed our refinancing in December 2016. In addition, there were lower interest costs realized on our Credit Facilities, which was a function of reduced outstanding amounts on these Credit Facilities compared to the same period last year. |
22
![]()
| − | Other finance expenses increased by $25.0 million primarily as a result of: |
| − | Foreign exchange losses of $14.5 million in 2017 year-to-date compared to losses of $0.7 million in the same period in 2016; | |
| − | Disposals, impairment and mark-to-market adjustments on held for trading and available-for-sale investments resulted in a net loss of $1.8 million during the current period of 2017 compared to a gain of $1.3 million during the same period last year; | |
| − | Fair value adjustments pertaining to the embedded derivative on the senior unsecured notes, our gold option liability related to the acquisition of the New Britannia mine and mill and an embedded derivative pertaining to purchase contracts resulted in a loss of $1.3 million in the current year-to-date period compared to gains of $6.6 million in the comparable period in 2016; and | |
| − | Mark-to-market adjustments on warrants resulted in a gain of $1.8 million compared to a gain of $2.0 million in the same period last year. |
Tax Expense (Recovery)
For the three and nine months ended September 30, 2017, tax expense increased by $9.3 million and $29.4 million, respectively, compared to the same periods in 2016. The following table provides further details:
| Three months ended | Nine months ended | ||||||||||
| Sep. 30, | Sep. 30, | Sep. 30, | Sep. 30, | ||||||||
(in $ thousands) | 2017 | 2016 | 2017 | 2016 | ||||||||
Deferred tax expense - income tax1 | 9,463 | 7,857 | 26,909 | 8,874 | ||||||||
Deferred tax (recovery) expense - mining tax1 | (652 | ) | (1,487 | ) | 310 | 773 | ||||||
Total deferred tax expense | 8,811 | 6,370 | 27,219 | 9,647 | ||||||||
Current tax expense - income tax | 7,422 | 1,778 | 10,849 | 5,680 | ||||||||
Current tax expense - mining tax | 1,506 | 282 | 10,897 | 4,263 | ||||||||
Total current tax expense | 8,928 | 2,060 | 21,746 | 9,943 | ||||||||
| ||||||||||||
Tax expense | 17,739 | 8,430 | 48,965 | 19,590 | ||||||||
1Deferred tax expense (recovery) represents our draw down/increase of non-cash deferred income and mining tax assets/liabilities.
Income Tax Expense
Applying the estimated Canadian statutory income tax rate of 27.0% to our income before taxes of $113.2 million for the year-to-date period in 2017 would have resulted in a tax expense of approximately $30.6 million; however, we recorded an income tax expense of $37.8 million. The significant items causing our effective income tax rate to be different than the 27.0% estimated Canadian statutory income tax rate include:
| − | Certain deductible temporary differences with respect to Peru mostly relating to decommissioning and restoration liabilities were not recognized as we have determined that it is not probable that we will realize the recovery based on the timing of the reversals of the deductible temporary differences and the future projected taxable profit of the Peru operations, resulting in an increase in deferred tax expense of approximately $8.3 million (2016 year-to-date - $5.7 million); |
| − | Certain deductible temporary differences with respect to Manitoba mostly relating to decommissioning and restoration liabilities were not recognized as we have determined that it is not probable that we will realize the recovery based on the timing of the reversals of the deductible temporary differences and the future projected taxable profit of the Manitoba operations, adjusted for the average annual effective rate methodology, resulting in an increase in deferred tax expense of approximately $2.8 million (2016 year-to-date - $3.1 million); |
| − | Certain deductible temporary differences with respect to our foreign operations are recorded using an income tax rate other than the Canadian statutory income tax of 27.0%, resulting in an increase in deferred tax expense of $2.5 million (2016 year-to-date – decrease $1.3 million); and |
23
![]()
| − | A decrease in the deferred tax expense of $7.8 million (2016 year-to-date - $2.6 million) due to the fact that certain Canadian non-monetary assets are recognized at historical cost while the tax bases of the assets change as exchange rates fluctuate, which gives rise to taxable temporary differences. |
Mining Tax Expense
Applying the estimated Manitoba mining tax rate of 10.0% to our income before taxes of $113.2 million for the year-to-date period in 2017, would have resulted in a tax expense of approximately $11.3 million and we recorded a mining tax expense of $11.2 million (2016 – $5.0 million). Effective mining tax rates can vary significantly based on the composition of our earnings and the expected amount of mining taxable profits. Corporate costs and other costs not related to mining operations are not deductible in computing mining profits. A brief description of how mining taxes are calculated in our various business units is discussed below.
Manitoba
The Province of Manitoba imposes mining tax on profit related to the sale of mineral products mined in the Province of Manitoba (mining taxable profit) at the following rates:
| − | 10% of total mining taxable profit if mining profit is C$50 million or less; |
| − | 15% of total mining taxable profit if mining profits are between C$55 million and C$100 million; and |
| − | 17% of total mining taxable profit if mining profits exceed C$105 million. |
We estimate that the tax rate that will be applicable when temporary differences reverse will be approximately 10.0% .
Peru
The Peruvian government imposes two parallel mining tax regimes, the Special Mining Tax and the Modified Royalty, on companies' operating mining income on a sliding scale, with progressive rates ranging from 2.0% to 8.4% and 1.0% to 12.0%, respectively. Based on financial forecasts, we have recorded a deferred tax liability as at September 30, 2017 at the tax rate we expect to apply when temporary differences reverse.
LIQUIDITY AND CAPITAL RESOURCES
Senior Unsecured Notes Refinancing
On December 12, 2016, we completed an offering of $1.0 billion aggregate principal amount of senior notes in two series: (i) a series of 7.250% senior notes due 2023 in an aggregate principal amount of $400 million and (ii) a series of 7.625% senior notes due 2025 in an aggregate principal amount of $600 million. The proceeds from this offering were used to redeem all US$920 million of our 9.50% senior unsecured notes due 2020.
Senior Secured Revolving Credit Facilities
As at September 30, 2017, between our Credit Facilities we have drawn $129.0 million in letters of credit, leaving total undrawn availability of $421.0 million. As at September 30, 2017, we were in compliance with our covenants under the Credit Facilities.
The Credit Facilities were amended on July 14, 2017 to secure both facilities with substantially all of our assets other than assets related to the Rosemont project, amend the financial covenants, extend the maturity dates from March 31, 2019 to July 14, 2021 and reduce the interest rate from LIBOR plus 4.50% to LIBOR plus 3.00%, based on financial results for the twelve months ended June 30, 2017. The revised covenants include maintaining gross total debt to EBITDA of less than 4.00 times in 2017, senior secured debt to EBITDA of less than 2.00 times, and interest coverage of more than 3.00 times.
24
![]()
Equipment Finance Facility
As at September 30, 2017, we had no amounts owing under the facility. The facility was repaid in full and extinguished during the third quarter of 2017 with the proceeds of a sale and leaseback transaction.
Financial Condition
Financial Condition as at September 30, 2017 compared to December 31, 2016
Cash and cash equivalents increased by $182.1 million from December 31, 2016 to $328.9 million as at September 30, 2017. This increase was a result of cash generated from operating activities of $410.1 million, net proceeds from an equity issuance of $187.4 million, and gross proceeds from a sale and leaseback equipment refinancing of $67.3 million. These inflows were partly offset by $161.7 million of capital investments primarily at our Peru and Manitoba operations, debt repayments of $256.4 million and interest payments of $52.7 million. We hold the majority of our cash and cash equivalents in low-risk, liquid investments with major Canadian and Peruvian financial institutions.
Working capital increased by $124.8 million to $246.3 million from December 31, 2016 to September 30, 2017. In addition to the increased cash and cash equivalents position:
| − | Current inventories increased by $29.8 million; |
| − | Trade and other payables increased by $33.3 million primarily as a result of the timing of capital spending resulting in higher trade payables at September 30 2017; and |
| − | Trade Receivables decreased by $40.6 million, mainly due to increasing payments received related to Peruvian sales tax; |
Cash Flows
The following table summarizes our cash flows for the three months and three and nine months ended September 30, 2017 and September 30, 2016:
| Three months ended | Nine months ended | ||||||||||
| Sep. 30, | Sep. 30, | Sep. 30, | Sep. 30, | ||||||||
(in $ thousands) | 2017 | 2016 | 2017 | 2016 | ||||||||
| ||||||||||||
Profit for the period | 40,942 | 33,571 | 64,223 | 12,080 | ||||||||
Tax expense | 17,739 | 8,430 | 48,965 | 19,590 | ||||||||
Items not affecting cash | 99,205 | 85,820 | 257,800 | 244,354 | ||||||||
Taxes paid | (3,943 | ) | (3,585 | ) | (12,326 | ) | (10,413 | ) | ||||
Operating cash flow before changes in non-cash working capital | 153,943 | 124,236 | 358,662 | 265,611 | ||||||||
Change in non-cash working capital | 13,954 | (28,358 | ) | 51,481 | 69,338 | |||||||
Cash generated from operating activities | 167,897 | 95,878 | 410,143 | 334,949 | ||||||||
Cash (used in) generated by investing activities | (69,886 | ) | 17,640 | (146,405 | ) | (103,186 | ) | |||||
Cash generated by (used in) financing activities | 77,807 | (137,029 | ) | (83,386 | ) | (167,613 | ) | |||||
Effect of movement in exchange rates on cash and cash equivalents | 437 | (134 | ) | 1,711 | 256 | |||||||
| ||||||||||||
Increase (decrease) in cash and cash equivalents | 176,255 | (23,645 | ) | 182,063 | 64,406 | |||||||
25
![]()
Cash Flow from Operating Activities
Cash generated from operating activities was $167.9 million during the third quarter of 2017, an increase of $72.0 million compared with the same period last year. Operating cash flow before change in non-cash working capital was $153.9 million during the third quarter of 2017, reflecting an increase of $29.7 million compared to the third quarter of 2016. Operating cash flow benefited from higher overall realized copper and zinc sales prices and higher gold and zinc sales volumes compared to the third quarter of 2016.
Year-to-date cash generated from operating activities was $410.1 million in 2017, an increase of $75.2 million compared to 2016. Operating cash flow before changes in non-cash working capital were $358.7 million, an increase of $93.1 million compared to the same year-to-date period in 2016. Operating cash flow benefited from the same factors mentioned above for the quarter.
Cash Flow from Investing and Financing Activities
During the third quarter of 2017, we generated $7.9 million in investing and financing activities, primarily driven by $187.4 million of net proceeds from an equity issuance, $67.3 million of cash inflows resulting from Hudbay Peru’s sale and leaseback of certain equipment and a $25.0 million advance under our senior secured credit facility, offset by the repayment of $104.1 million in principal on our senior secured credit facilities, capital expenditures of $67.7 million, repayment of $46.1 million under our equipment financing facility and $36.9 million of interest paid on long term debt.
Year-to-date, we used $229.8 million of cash in investing and financing activities, primarily driven by net principal repayments on our debt borrowings of $256.4 million, capital expenditures of $161.7 million and interest paid of $52.7 million, partially offset by $187.4 million of net proceeds from an equity issuance and $67.3 million of gross proceeds from a sale and leaseback transaction.
26
![]()
Capital Expenditures
The following summarizes accrued and cash additions to capital assets for the periods indicated:
| Three months | ||||||||||||||
| ended | Nine months ended | Guidance | ||||||||||||
| Sep. 30, | Sep. 30, | Sep. 30, | Sep. 30, | Annual | ||||||||||
(in $ millions) | 2017 | 2016 | 2017 | 2016 | 20171 | ||||||||||
| |||||||||||||||
Manitoba sustaining capital expenditures | 15.7 | 9.1 | 39.0 | 47.8 | 65.0 | ||||||||||
Peru sustaining capital expenditures | 40.2 | 35.2 | 93.6 | 86.3 | 120.0 | ||||||||||
Total sustaining capital expenditures | 55.9 | 44.3 | 132.6 | 134.1 | 185.0 | ||||||||||
Arizona capitalized costs | 4.2 | 5.3 | 13.5 | 22.0 | 20.0 | ||||||||||
Peru growth capitalized expenditures | 1.1 | - | 1.6 | - | 25.0 | ||||||||||
Manitoba growth capitalized expenditures | 16.9 | - | 24.3 | - | 55.0 | ||||||||||
Other capitalized costs2 | (1.8 | ) | 3.3 | 15.3 | 33.5 | ||||||||||
Capitalized exploration | - | 0.6 | 0.8 | 1.9 | 2.0 | ||||||||||
Capitalized interest | 3.3 | 3.7 | 9.9 | 11.0 | |||||||||||
Total other capitalized costs | 23.7 | 12.9 | 65.4 | 68.4 | |||||||||||
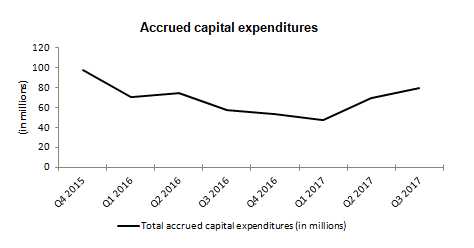
Total accrued capital additions | 79.6 | 57.2 | 198.0 | 202.5 | |||||||||||
Reconciliation to cash capital additions: | |||||||||||||||
Decommissioning and restoration obligation | 8.6 | (3.7 | ) | (4.4 | ) | (26.9 | ) | ||||||||
Capitalized interest | (3.3 | ) | (3.7 | ) | (9.9 | ) | (11.0 | ) | |||||||
Changes in capital accruals and other | (17.2 | ) | 0.8 | (22.0 | ) | (15.3 | ) | ||||||||
| |||||||||||||||
Total cash capital additions | 67.7 | 50.6 | 161.7 | 149.3 | |||||||||||
1Sustaining capital expenditure guidance excludes capitalized interest.
2Other capitalized costs include decommissioning and restoration adjustments.
Sustaining capital expenditures in Manitoba for the three and nine months ended September 30, 2017 were $15.7 million and $39.0 million, respectively, an increase of $6.6 million and a decrease of $8.8 million, respectively, compared to the same periods in 2016. The increase in Manitoba sustaining capital expenditures in the third quarter for 2017 compared to the same period last year is due to spending for the tailings management infrastructure. The decrease on a year-to-date basis is primarily due to decreases in capitalized underground mine development.
Sustaining capital expenditures in Peru for the three and nine months ended September 30, 2017 were $40.2 million and $93.6 million, respectively, an increase of $5.0 million and $7.3 million, respectively, compared to the same periods in 2016. The increase is mainly the result of higher capital costs for tailings impoundment construction.
27
![]()
Capital Commitments
As at September 30, 2017, we had outstanding capital commitments in Canada of approximately $23.0 million primarily related to committed long-lead orders for the paste plant, of which approximately $3.1 million cannot be terminated by Hudbay; approximately $42.6 million in Peru related to sustaining capital costs, of which all can be terminated by Hudbay; and approximately $160.8 million in Arizona, primarily related to the Rosemont project and expected to be paid after the commencement of Rosemont construction, of which approximately $77.3 million cannot be terminated by Hudbay.
Contractual Obligations
The following table summarizes our contractual obligations as at September 30, 2017:
| Less than | 1-3 | 4-5 | After 5 | |||||||||||
Payment Schedule (in $ millions) | Total | 1 Year | Years | Years | Years | ||||||||||
Long-term debt obligations1 | 1,480.2 | 75.5 | 155.7 | 154.4 | 1,094.6 | ||||||||||
Capital lease obligations | 93.9 | 20.7 | 40.7 | 32.5 | - | ||||||||||
Operating lease obligations | 17.2 | 4.5 | 6.6 | 3.7 | 2.4 | ||||||||||
Purchase obligation - capital commitments | 226.4 | 45.4 | 51.6 | - | 129.4 | ||||||||||
Purchase obligation - other commitments2 | 620.0 | 46.7 | 233.9 | 135.2 | 204.2 | ||||||||||
Pension and other employee future benefits obligations | 138.7 | 23.0 | 24.2 | 7.0 | 84.5 | ||||||||||
Decommissioning and restoration obligations3 | 202.3 | - | 4.2 | 8.6 | 189.5 |
1Long-term debt obligations include scheduled interest payments.
2Primarily made up of long-term agreements with operational suppliers, obligations for power purchase, concentrate handling, fleet and port services.
3Before inflation.
Liquidity
As at September 30, 2017, we had total liquidity of approximately $749.9 million, including $328.9 million in cash and cash equivalents, as well as $421.0 million in availability under our Credit Facilities. We expect that our current liquidity and future cash flows will be sufficient to meet our obligations in the coming year.
28
![]()
Outstanding Share Data
As of November 1, 2017, there were 261,271,188 common shares of Hudbay issued and outstanding. In addition, Hudbay warrants to acquire an aggregate of 22,391,490 common shares of Hudbay were outstanding and options for an aggregate of 583,352 common shares outstanding.
TREND ANALYSIS AND QUARTERLY REVIEW
The following table sets forth selected consolidated financial information for each of our eight most recently completed quarters:
| 2017 | 2016 | 2015 | |||||||||||||||||||||
| ||||||||||||||||||||||||
(in $ millions) | Q3 | Q2 | Q1 | Q4 | Q3 | Q2 | Q1 | Q4 | ||||||||||||||||
Revenue | 370.4 | 324.9 | 253.2 | 316.7 | 311.4 | 247.0 | 253.6 | 336.6 | ||||||||||||||||
Profit (loss) before tax | 58.7 | 41.8 | 12.7 | (26.1 | ) | 42.0 | 6.6 | (16.9 | ) | (325.6 | ) | |||||||||||||
Profit (loss) | 40.9 | 25.6 | (2.3 | ) | (47.3 | ) | 33.6 | (5.7 | ) | (15.8 | ) | (255.5 | ) | |||||||||||
Earnings (loss) per share: | ||||||||||||||||||||||||
Basic and Diluted | 0.17 | 0.11 | (0.01 | ) | (0.20 | ) | 0.14 | (0.02 | ) | (0.07 | ) | (1.09 | ) | |||||||||||
Operating cash flow1 | 153.9 | 124.1 | 80.6 | 122.3 | 124.2 | 69.5 | 71.9 | 117.4 | ||||||||||||||||
1Operating cash flow before changes in non-cash working capital
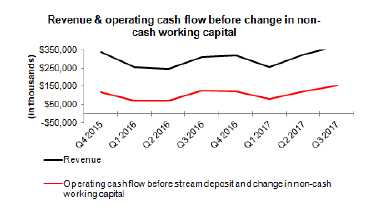
Copper and zinc prices increased during the third quarter of 2017, a key factor in the improvement in revenue, gross profit and operating cash flow before changes in non-cash working capital experienced in the quarter compared to prior quarters.
Revenue and operating cash flow before changes in non-cash working capital have been stable from the third quarter of 2016 to the second quarter of 2017, with the exception of the first quarter of 2017, which was affected by lower production due to planned and unplanned maintenance activities at our operations.
We incurred a $47.7 million call premium during the fourth quarter of 2016 to facilitate the early redemption of the previously outstanding $920 million notes, which affected profit in that period.
Results for the first and second quarters of 2016 reflected a cyclical low in copper prices, offset in part by cost containment initiatives.
For information on previous trends and quarterly reviews, refer to our MD&A dated August 3, 2017.
NON-IFRS FINANCIAL PERFORMANCE MEASURES
Net debt is shown because it is a performance measure used by the Company to assess our financial position. Cash cost, sustaining and all-in sustaining cash cost per pound of copper produced are shown because we believe they help investors and management assess the performance of our operations, including the margin generated by the operations and the company. Cash cost and sustaining cash cost per pound of zinc produced are shown because we believe they help investors and management assess the performance of our Manitoba operations. These measures do not have a meaning prescribed by IFRS and are therefore unlikely to be comparable to similar measures presented by other issuers. These measures should not be considered in isolation or as a substitute for measures prepared in accordance with IFRS and are not necessarily indicative of operating profit or cash flow from operations as determined under IFRS. Other companies may calculate these measures differently.
29
![]()
Net Debt
The following table presents our calculation of net debt as at September 30, 2017 and December 31, 2016:
| Sep. 30, | Dec. 31, | ||||
(in $ thousands) | 2017 | 2016 | ||||
Total long-term debt | 978,494 | 1,232,164 | ||||
Cash and cash equivalents | (328,927 | ) | (146,864 | ) | ||
| ||||||
Net debt | 649,567 | 1,085,300 |
Cash Cost, Sustaining and All-in Sustaining Cash Cost (Copper Basis)
Cash cost per pound of copper produced (“cash cost”) is a non-IFRS measure that management uses as a key performance indicator to assess the performance of our operations. Our calculation designates copper as our primary metal of production as it has been the largest component of revenues. The calculation is presented in four manners:
| − | Cash cost, before by-product credits -This measure is gross of by-product revenues and is a function of the efforts and costs incurred to mine and process all ore mined. However, the measure divides this aggregate cost over only pounds of copper produced, our primary metal of production. This measure is generally less volatile from period to period, as it is not affected by changes in the price received for by-product metals. It is, however, significantly affected by the relative mix of copper concentrate and finished zinc production, where the sale of the zinc will occur later, and an increase in production of zinc metal will tend to result in an increase in cash cost under this measure. |
| − | Cash cost, net of by-product credits -In order to calculate the net cost to produce and sell copper, the net of by-product credits measure subtracts the revenues realized from the sale of the metals other than copper. The by-product revenues from zinc, gold, and silver are significant and are integral to the economics of our operations. The economics that support our decision to produce and sell copper would be different if we did not receive revenues from the other significant metals being extracted and processed. This measure provides management and investors with an indication of the minimum copper price consistent with positive operating cash flow and operating margins, assuming realized by-product metal prices are consistent with those prevailing during the reporting period. It also serves as an important operating statistic that management and investors utilize to measure our operating performance versus that of our competitors. However, it is important to understand that if by-product metal prices decline alongside copper prices, the cash cost net of by-product credits would increase, requiring a higher copper price than that reported to maintain positive cash flows and operating margins. |
| − | Sustaining cash cost, net of by-product credits -This measure is an extension of cash cost that includes sustaining capital expenditures, capitalized exploration and net smelter returns royalties. It does not include corporate selling and administrative expenses. It provides a more fulsome measurement of the cost of sustaining production than cash cost, which is focused on operating costs only. |
| − | All-in sustaining cash cost, net of by-product credits -This measure is an extension of sustaining cash cost that includes corporate G&A. Due to the inclusion of corporate selling and administrative expenses, all-in sustaining cash cost is presented on a consolidated basis only. |
The tables below present a detailed build-up of cash cost and sustaining cash cost, net of by-product credits, by business unit in addition to consolidated all-in sustaining cash cost, net of by-product credits, and reconciliations between cash cost, net of by-product credits, to the most comparable IFRS measures of cost of sales for the three months and nine months ended September 30, 2017 and 2016. Cash cost, net of by-product credits may not calculate exactly based on amounts presented in the tables below due to rounding.
30
![]()
Consolidated | Three months ended | Nine months ended | ||||||||||
Net pounds of copper produced | ||||||||||||
(in thousands) | Sep. 30, 2017 | Sep. 30, 2016 | Sep. 30, 2017 | Sep. 30, 2016 | ||||||||
Peru | 68,201 | 78,494 | 193,884 | 219,241 | ||||||||
Manitoba | 20,964 | 22,780 | 61,890 | 68,921 | ||||||||
| ||||||||||||
Net pounds of copper produced | 89,165 | 101,274 | 255,774 | 288,162 | ||||||||
Consolidated | Three months ended | Nine months ended | ||||||||||||||||||||||
Cash cost per pound of | Sep. 30, 2017 | Sep. 30, 2016 | Sep. 30, 2017 | Sep. 30, 2016 | ||||||||||||||||||||
copper produced | $000s | $/lb | $000s | $/lb | 000s | $/lb | $ 000s | $ /lb | ||||||||||||||||
Cash cost, before by-product credits | 201,747 | 2.26 | 187,263 | 1.85 | 566,344 | 2.21 | 519,302 | 1.79 | ||||||||||||||||
By-product credits | (124,892 | ) | (1.40 | ) | (94,711 | ) | (0.94 | ) | (345,415 | ) | (1.35 | ) | (244,785 | ) | (0.85 | ) | ||||||||
| ||||||||||||||||||||||||
Cash cost, net of by-product credits | 76,855 | 0.86 | 92,552 | 0.91 | 220,929 | 0.86 | 274,517 | 0.95 | ||||||||||||||||
Consolidated | Three months ended | Nine months ended | ||||||||||||||||||||||
Supplementary cash cost | Sep. 30, 2017 | Sep. 30, 2016 | Sep. 30, 2017 | Sep. 30, 2016 | ||||||||||||||||||||
information | $000s | $/lb1 | $000s | $/lb1 | $000s | $/lb1 | $000s | $/lb1 | ||||||||||||||||
| ||||||||||||||||||||||||
By-product credits: | ||||||||||||||||||||||||
Zinc | 84,700 | 0.95 | 62,932 | 0.62 | 244,804 | 0.96 | 165,383 | 0.57 | ||||||||||||||||
Gold | 35,802 | 0.40 | 33,500 | 0.33 | 95,604 | 0.37 | 91,000 | 0.32 | ||||||||||||||||
Silver | 11,594 | 0.13 | 14,380 | 0.14 | 33,352 | 0.13 | 37,781 | 0.13 | ||||||||||||||||
Other | 4,946 | 0.06 | 752 | 0.01 | 11,196 | 0.04 | 2,079 | 0.01 | ||||||||||||||||
Total by-product credits | 137,042 | 1.54 | 111,564 | 1.10 | 384,956 | 1.50 | 296,243 | 1.03 | ||||||||||||||||
Less: deferred revenue | (12,150 | ) | (0.14 | ) | (16,853 | ) | (0.16 | ) | (39,541 | ) | (0.15 | ) | (51,458 | ) | (0.18 | ) | ||||||||
Total by-product credits, net of pre-production credits | 124,892 | 1.40 | 94,711 | 0.94 | 345,415 | 1.35 | 244,785 | 0.85 | ||||||||||||||||
| ||||||||||||||||||||||||
Reconciliation to IFRS: | ||||||||||||||||||||||||
Cash cost, net of by-product credits | 76,855 | 92,552 | 220,929 | 274,517 | ||||||||||||||||||||
By-product credits | 137,042 | 111,564 | 384,956 | 296,243 | ||||||||||||||||||||
Change in deferred revenues | (12,150 | ) | (16,853 | ) | (39,541 | ) | (51,458 | ) | ||||||||||||||||
Treatment and refining charges | (30,132 | ) | (34,965 | ) | (75,023 | ) | (88,981 | ) | ||||||||||||||||
Share-based payment | 635 | 97 | 1,233 | 323 | ||||||||||||||||||||
Inventory write-off (reversals) | (227 | ) | - | (1,503 | ) | - | ||||||||||||||||||
Change in product inventory | 3,708 | 4,820 | (10,020 | ) | 6,873 | |||||||||||||||||||
Royalties | 4,149 | 3,471 | 11,703 | 9,396 | ||||||||||||||||||||
Depreciation and amortization2 | 79,511 | 82,279 | 217,583 | 220,438 | ||||||||||||||||||||
| ||||||||||||||||||||||||
Cost of sales | 259,391 | 242,965 | 710,317 | 667,351 | ||||||||||||||||||||
1Per pound of copper produced.
2Depreciation is based on concentrate sold.
31
![]()
Peru | Three months ended | Nine months ended | ||||||||||
(in thousands) | Sep. 30, 2017 | Sep. 30, 2016 | Sep. 30, 2017 | Sep. 30, 2016 | ||||||||
Pounds of copper produced1 | 68,201 | 78,494 | 193,884 | 219,241 | ||||||||
Net pounds of copper produced1 | 68,201 | 78,494 | 193,884 | 219,241 | ||||||||
1Contained copper in concentrate.
Peru | Three months ended | Nine months ended | ||||||||||||||||||||||
Cash cost per pound of copper | Sep. 30, 2017 | Sep. 30, 2016 | Sep. 30, 2017 | Sep. 30, 2016 | ||||||||||||||||||||
produced | $000s | $/lb | $000s | $/lb | $000s | $/lb | $000s | $ /lb | ||||||||||||||||
Mining | 14,225 | 0.21 | 16,396 | 0.21 | 40,125 | 0.21 | 43,309 | 0.20 | ||||||||||||||||
Milling | 30,730 | 0.45 | 31,934 | 0.41 | 98,799 | 0.51 | 86,468 | 0.39 | ||||||||||||||||
G&A | 13,707 | 0.20 | 11,318 | 0.14 | 40,220 | 0.21 | 31,375 | 0.14 | ||||||||||||||||
Onsite costs | 58,662 | 0.86 | 59,648 | 0.76 | 179,144 | 0.92 | 161,152 | 0.74 | ||||||||||||||||
Treatment & refining | 18,340 | 0.27 | 25,164 | 0.32 | 45,962 | 0.24 | 60,318 | 0.28 | ||||||||||||||||
Freight & other | 11,890 | 0.17 | 13,156 | 0.17 | 31,878 | 0.16 | 39,468 | 0.18 | ||||||||||||||||
Cash cost, before by-product credits | 88,892 | 1.30 | 97,968 | 1.25 | 256,984 | 1.33 | 260,938 | 1.19 | ||||||||||||||||
By-product credits | (7,870 | ) | (0.12 | ) | (9,560 | ) | (0.12 | ) | (16,595 | ) | (0.09 | ) | (24,354 | ) | (0.11 | ) | ||||||||
| ||||||||||||||||||||||||
Cash cost, net of by-product credits | 81,022 | 1.19 | 88,408 | 1.13 | 240,389 | 1.24 | 236,584 | 1.08 | ||||||||||||||||
Peru | Three months ended | Nine months ended | ||||||||||||||||||||||
Supplementary cash cost | Sep. 30, 2017 | Sep. 30, 2016 | Sep. 30, 2017 | Sep. 30, 2016 | ||||||||||||||||||||
information | $000s | $/lb1 | $000s | $/lb1 | $000s | $/lb1 | $000s | $ | $/lb1 | |||||||||||||||
| ||||||||||||||||||||||||
By-product credits: | ||||||||||||||||||||||||
Gold | 2,395 | 0.04 | 5,996 | 0.08 | 4,206 | 0.02 | 16,925 | 0.08 | ||||||||||||||||
Silver | 5,983 | 0.09 | 9,397 | 0.12 | 17,997 | 0.09 | 25,223 | 0.12 | ||||||||||||||||
Other | 3,612 | 0.05 | - | - | 7,488 | 0.04 | 129 | - | ||||||||||||||||
Total by-product credits | 11,990 | 0.18 | 15,393 | 0.20 | 29,691 | 0.15 | 42,277 | 0.19 | ||||||||||||||||
Less: deferred revenue | (4,120 | ) | (0.06 | ) | (5,833 | ) | (0.07 | ) | (13,096 | ) | (0.07 | ) | (17,923 | ) | (0.08 | ) | ||||||||
Total by-product credits, net of pre-production credits | 7,870 | 0.12 | 9,560 | 0.12 | 16,595 | 0.09 | 24,354 | 0.11 | ||||||||||||||||
Reconciliation to IFRS: | ||||||||||||||||||||||||
Cash cost, net of by-product credits | 81,022 | 88,408 | 240,389 | 236,584 | ||||||||||||||||||||
By-product credits | 11,990 | 15,393 | 29,691 | 42,277 | ||||||||||||||||||||
Change in deferred revenues | (4,120 | ) | (5,833 | ) | (13,096 | ) | (17,923 | ) | ||||||||||||||||
Treatment and refining charges | (18,340 | ) | (25,164 | ) | (45,962 | ) | (60,318 | ) | ||||||||||||||||
Inventory write-off (reversals) | (227 | ) | (1,503 | ) | ||||||||||||||||||||
Share-based payment | 108 | 69 | 294 | 69 | ||||||||||||||||||||
Change in product inventory | 7,006 | 7,793 | (8,020 | ) | 5,006 | |||||||||||||||||||
Royalties | 1,451 | 1,695 | 4,017 | 4,391 | ||||||||||||||||||||
Depreciation and amortization2 | 47,137 | 51,720 | 122,656 | 129,252 | ||||||||||||||||||||
| ||||||||||||||||||||||||
Cost of sales | 126,027 | 134,081 | 328,466 | 339,338 | ||||||||||||||||||||
1Per pound of copper produced.
2Depreciation is based on concentrate sold.
32
![]()
Manitoba | Three months ended | Nine months ended | ||||||||||
(in thousands) | Sep. 30, 2017 | Sep. 30, 2016 | Sep. 30, 2017 | Sep. 30, 2016 | ||||||||
| ||||||||||||
Net pounds of copper produced1 | 20,964 | 22,780 | 61,890 | 68,921 | ||||||||
1Contained copper in concentrate.
Manitoba | Three months ended | Nine months ended | ||||||||||||||||||||||
Cash cost per pound of | Sep. 30, 2017 | Sep. 30, 2016 | Sep. 30, 2017 | Sep. 30, 2016 | ||||||||||||||||||||
copper produced | $000s | $/lb | $000s | $/lb | $000s | $/lb | $000s | $/lb | ||||||||||||||||
| ||||||||||||||||||||||||
Mining | 40,320 | 1.92 | 29,012 | 1.27 | 110,200 | 1.78 | 87,780 | 1.27 | ||||||||||||||||
Milling | 11,703 | 0.56 | 12,801 | 0.56 | 36,281 | 0.59 | 32,118 | 0.47 | ||||||||||||||||
Refining (zinc) | 17,312 | 0.83 | 16,284 | 0.71 | 49,508 | 0.80 | 48,474 | 0.70 | ||||||||||||||||
G&A | 14,549 | 0.69 | 9,819 | 0.43 | 39,440 | 0.64 | 26,277 | 0.38 | ||||||||||||||||
Purchased ore and zinc concentrates | 6,457 | 0.31 | 3,985 | 0.17 | 15,725 | 0.25 | 12,204 | 0.18 | ||||||||||||||||
Onsite costs | 90,341 | 4.31 | 71,901 | 3.16 | 251,154 | 4.06 | 206,853 | 3.00 | ||||||||||||||||
Treatment & refining | 11,792 | 0.56 | 9,801 | 0.43 | 29,061 | 0.47 | 28,663 | 0.42 | ||||||||||||||||
Freight & other | 10,722 | 0.51 | 7,593 | 0.33 | 29,145 | 0.47 | 22,848 | 0.33 | ||||||||||||||||
Cash cost, before by-product credits | 112,855 | 5.38 | 89,295 | 3.92 | 309,360 | 5.00 | 258,364 | 3.75 | ||||||||||||||||
By-product credits | (117,022 | ) | (5.58 | ) | (85,151 | ) | (3.74 | ) | (328,820 | ) | (5.31 | ) | (220,431 | ) | (3.20 | ) | ||||||||
| ||||||||||||||||||||||||
Cash cost, net of by-product credits | (4,167 | ) | (0.20 | ) | 4,144 | 0.18 | (19,460 | ) | (0.31 | ) | 37,933 | 0.55 | ||||||||||||
Manitoba | Three months ended | Nine months ended | ||||||||||||||||||||||
Supplementary cash cost | Sep. 30, 2017 | Sep. 30, 2016 | Sep. 30, 2017 | Sep. 30, 2016 | ||||||||||||||||||||
information | $000s | $/lb1 | $000s | $/lb1 | $000s | $/lb1 | $000s | $/lb1 | ||||||||||||||||
| ||||||||||||||||||||||||
By-product credits: | ||||||||||||||||||||||||
Zinc | 84,700 | 4.04 | 62,932 | 2.76 | 244,804 | 3.96 | 165,383 | 2.40 | ||||||||||||||||
Gold | 33,407 | 1.59 | 27,504 | 1.21 | 91,398 | 1.48 | 74,075 | 1.07 | ||||||||||||||||
Silver | 5,611 | 0.27 | 4,983 | 0.22 | 15,355 | 0.25 | 12,558 | 0.18 | ||||||||||||||||
Other | 1,334 | 0.06 | 752 | 0.03 | 3,708 | 0.06 | 1,950 | 0.03 | ||||||||||||||||
Total by-product credits | 125,052 | 5.97 | 96,171 | 4.22 | 355,265 | 5.74 | 253,966 | 3.68 | ||||||||||||||||
Less: deferred revenue | (8,030 | ) | (0.38 | ) | (11,020 | ) | (0.48 | ) | (26,445 | ) | (0.43 | ) | (33,535 | ) | (0.49 | ) | ||||||||
Total by-product credits, net of pre-production credits | 117,022 | 5.58 | 85,151 | 3.74 | 328,820 | 5.31 | 220,431 | 3.20 | ||||||||||||||||
| ||||||||||||||||||||||||
Reconciliation to IFRS: | ||||||||||||||||||||||||
Cash cost, net of by-product credits | (4,167 | ) | 4,144 | (19,460 | ) | 37,933 | ||||||||||||||||||
By-product credits | 125,052 | 96,171 | 355,265 | 253,966 | ||||||||||||||||||||
Change in deferred revenues | (8,030 | ) | (11,020 | ) | (26,445 | ) | (33,535 | ) | ||||||||||||||||
Treatment and refining charges | (11,792 | ) | (9,801 | ) | (29,061 | ) | (28,663 | ) | ||||||||||||||||
Share-based payment | 527 | 28 | 939 | 254 | ||||||||||||||||||||
Change in product inventory | (3,298 | ) | (2,973 | ) | (2,000 | ) | 1,867 | |||||||||||||||||
Royalties | 2,698 | 1,776 | 7,686 | 5,005 | ||||||||||||||||||||
Depreciation and amortization2 | 32,374 | 30,559 | 94,927 | 91,186 | ||||||||||||||||||||
| ||||||||||||||||||||||||
Cost of sales | 133,364 | 108,884 | 381,851 | 328,013 | ||||||||||||||||||||
1Per pound of copper produced.
2Depreciation is based on concentrate sold.
33
![]()
Consolidated | Three months ended | Nine months ended | ||||||||||||||||||||||
All-in Sustaining cash cost per | Sep. 30, 2017 | Sep. 30, 2016 | Sep. 30, 2017 | Sep. 30, 2016 | ||||||||||||||||||||
pound of copper produced | $000s | $/lb | $000s | $/lb | $000s | $/lb | $000s | $/lb | ||||||||||||||||
Cash cost, net of by-product credits | 76,855 | 0.86 | 92,552 | 0.91 | 220,929 | 0.86 | 274,517 | 0.95 | ||||||||||||||||
Sustaining capital expenditures | 53,999 | 0.61 | 44,356 | 0.44 | 130,719 | 0.51 | 134,192 | 0.47 | ||||||||||||||||
Capitalized exploration | (9 | ) | - | 571 | 0.01 | 833 | - | 1,898 | 0.01 | |||||||||||||||
Royalties | 4,149 | 0.05 | 3,471 | 0.03 | 11,703 | 0.05 | 9,396 | 0.03 | ||||||||||||||||
Sustaining cash cost, net ofby-product credits | 134,994 | 1.50 | 140,950 | 1.39 | 364,184 | 1.42 | 420,003 | 1.46 | ||||||||||||||||
Corporate selling and administrative expenses | 11,252 | 0.13 | 6,783 | 0.07 | 27,384 | 0.11 | 25,151 | 0.09 | ||||||||||||||||
All-in sustaining cash cost, net ofby-product credits | 146,246 | 1.64 | 147,733 | 1.46 | 391,568 | 1.53 | 445,154 | 1.54 | ||||||||||||||||
Peru | Three months ended | Nine months ended | ||||||||||||||||||||||
Sustaining cash cost per pound | Sep. 30, 2017 | Sep. 30, 2016 | Sep. 30, 2017 | Sep. 30, 2016 | ||||||||||||||||||||
of copper produced | $000s | $/lb | $000s | $/lb | 000s | $/lb | $000s | $/lb | ||||||||||||||||
Cash cost, net of by-product credits | 81,022 | 1.19 | 88,408 | 1.13 | 240,389 | 1.24 | 236,584 | 1.08 | ||||||||||||||||
Sustaining capital expenditures | 40,255 | 0.59 | 35,236 | 0.45 | 93,603 | 0.48 | 86,361 | 0.39 | ||||||||||||||||
Royalties | 1,451 | 0.02 | 1,695 | 0.02 | 4,017 | 0.02 | 4,391 | 0.02 | ||||||||||||||||
Sustaining cash cost per poundof copper produced | 122,728 | 1.80 | 125,339 | 1.60 | 338,009 | 1.74 | 327,336 | 1.49 | ||||||||||||||||
Manitoba | Three months ended | Nine months ended | ||||||||||||||||||||||
Sustaining cash cost per pound | Sep. 30, 2017 | Sep. 30, 2016 | Sep. 30, 2017 | Sep. 30, 2016 | ||||||||||||||||||||
of copper produced | $000s | $/lb | $000s | $/lb | $000s | $/lb | $000s | $/lb | ||||||||||||||||
| ||||||||||||||||||||||||
Cash cost, net of by-product credits | (4,167 | ) | (0.20 | ) | 4,144 | 0.18 | (19,460 | ) | (0.31 | ) | 37,933 | 0.55 | ||||||||||||
Sustaining capital expenditures | 13,744 | 0.66 | 9,120 | 0.40 | 37,116 | 0.60 | 47,831 | 0.69 | ||||||||||||||||
Capitalized exploration | (9 | ) | - | 571 | 0.03 | 833 | 0.01 | 1,898 | 0.03 | |||||||||||||||
Royalties | 2,698 | 0.13 | 1,776 | 0.08 | 7,686 | 0.12 | 5,005 | 0.07 | ||||||||||||||||
Sustaining cash cost per poundof copper produced | 12,266 | 0.59 | 15,611 | 0.69 | 26,175 | 0.42 | 92,667 | 1.34 | ||||||||||||||||
34
![]()
Zinc Cash Cost and Zinc Sustaining Cash Cost
Cash cost per pound of zinc produced (“zinc cash cost”) is a non-IFRS measure that management uses as a key performance indicator to assess the performance of our Manitoba operations. This alternative cash cost calculation designates zinc as our primary metal of production as it is becoming the largest component of revenues for our Manitoba business unit, and should therefore be less volatile over time than Manitoba cash cost per pound of copper. The calculation is presented in three manners:
| − | Zinc cash cost, before by-product credits -This measure is gross of by-product revenues and is a function of the efforts and costs incurred to mine and process all ore mined. However, the measure divides this aggregate cost over only pounds of zinc produced, our primary metal of production. This measure is generally less volatile from period to period, as it is not affected by changes in the price received for by-product metals. It is, however, significantly affected by the relative mix of copper concentrate and finished zinc production, where the sale of the copper will occur later, and an increase in production of copper metal will tend to result in an increase in zinc cash cost under this measure. |
| − | Zinc cash cost, net of by-product credits -In order to calculate the net cost to produce and sell zinc, the net of by-product credits measure subtracts the revenues realized from the sale of the metals other than zinc. The by-product revenues from copper, gold, and silver are significant and are integral to the economics of our Manitoba operation. The economics that support our decision to produce and sell zinc would be different if we did not receive revenues from the other significant metals being extracted and processed. This measure provides management and investors with an indication of the minimum zinc price consistent with positive operating cash flow and operating margins, assuming realized by-product metal prices are consistent with those prevailing during the reporting period. It also serves as an important operating statistic that management and investors utilize to measure our operating performance at Manitoba operation versus that of our competitors. However, it is important to understand that if by-product metal prices decline alongside zinc prices, the zinc cash cost net of by-product credits would increase, requiring a higher zinc price than that reported to maintain positive cash flows and operating margins. |
| − | Zinc sustaining cash cost, net of by-product credits -This measure is an extension of zinc cash cost that includes sustaining capital expenditures, capitalized exploration and net smelter returns royalties. It does not include corporate selling and administrative expenses. It provides a more fulsome measurement of the cost of sustaining production than zinc cash cost, which is focused on operating costs only. |
The tables below present a detailed build-up of zinc cash cost and zinc sustaining cash cost, net of by-product credits, for the Manitoba business unit, and reconciliations between zinc cash cost, net of by-product credits, to the most comparable IFRS measures of cost of sales for the three months and nine months ended September 30, 2017 and 2016. Zinc cash cost, net of by-product credits, may not calculate exactly based on amounts presented in the tables below due to rounding.
35
![]()
Manitoba | Three months ended | Nine months ended | ||||||||||
(in thousands) | Sep. 30, 2017 | Sep. 30, 2016 | Sep. 30, 2017 | Sep. 30, 2016 | ||||||||
| ||||||||||||
Pounds of zinc produced1 | 80,766 | 69,679 | 225,094 | 179,540 | ||||||||
Net pounds of zinc produced1 | 80,766 | 69,679 | 225,094 | 179,540 | ||||||||
1Contained zinc in concentrate.
Manitoba | Three months ended | Nine months ended | ||||||||||||||||||||||
Cash cost per pound of | Sep. 30, 2017 | Sep. 30, 2016 | Sep. 30, 2017 | Sep. 30, 2016 | ||||||||||||||||||||
zinc produced | $000s | $/lb | $000s | $/lb | $000s | $/lb | $000s | $/lb | ||||||||||||||||
| ||||||||||||||||||||||||
Cash cost, before by-product credits1 | 112,855 | 1.40 | 89,295 | 1.28 | 309,360 | 1.37 | 258,364 | 1.44 | ||||||||||||||||
By-product credits | (108,885 | ) | (1.35 | ) | (68,653 | ) | (0.99 | ) | (269,762 | ) | (1.20 | ) | (202,279 | ) | (1.13 | ) | ||||||||
Zinc cash cost, net of by-productcredits | 3,970 | 0.05 | 20,642 | 0.30 | 39,598 | 0.18 | 56,085 | 0.31 | ||||||||||||||||
1For additional detail on cash cost, before by-product credits please see page 33 of this MD&A.
Manitoba | Three months ended | Nine months ended | ||||||||||||||||||||||
Supplementary cash cost | Sep. 30, 2017 | Sep. 30, 2016 | Sep. 30, 2017 | Sep. 30, 2016 | ||||||||||||||||||||
information | $000s | $/lb1 | $000s | $/lb1 | $000s | $/lb1 | $000s | $/lb1 | ||||||||||||||||
| ||||||||||||||||||||||||
By-product credits: | ||||||||||||||||||||||||
Copper | 76,563 | 0.95 | 46,434 | 0.67 | 185,746 | 0.83 | 147,231 | 0.82 | ||||||||||||||||
Gold | 33,407 | 0.41 | 27,504 | 0.39 | 91,398 | 0.41 | 74,075 | 0.41 | ||||||||||||||||
Silver | 5,611 | 0.07 | 4,983 | 0.07 | 15,355 | 0.07 | 12,558 | 0.07 | ||||||||||||||||
Other | 1,334 | 0.02 | 752 | 0.01 | 3,708 | 0.02 | 1,950 | 0.01 | ||||||||||||||||
Total by-product credits | 116,915 | 1.45 | 79,673 | 1.14 | 296,207 | 1.32 | 235,814 | 1.31 | ||||||||||||||||
Less: deferred revenue | (8,030 | ) | (0.10 | ) | (11,020 | ) | (0.16 | ) | (26,445 | ) | (0.12 | ) | (33,535 | ) | (0.19 | ) | ||||||||
Total by-product credits, net of pre-production credits | 108,885 | 1.35 | 68,653 | 0.99 | 269,762 | 1.20 | 202,279 | 1.13 | ||||||||||||||||
| ||||||||||||||||||||||||
Reconciliation to IFRS: | ||||||||||||||||||||||||
Cash cost, net of by-product credits | 3,970 | 20,642 | 39,598 | 56,085 | ||||||||||||||||||||
By-product credits | 116,915 | 79,673 | 296,207 | 235,814 | ||||||||||||||||||||
Change in deferred revenues | (8,030 | ) | (11,020 | ) | (26,445 | ) | (33,535 | ) | ||||||||||||||||
Treatment and refining charges | (11,792 | ) | (9,801 | ) | (29,061 | ) | (28,663 | ) | ||||||||||||||||
Share-based payment | 527 | 28 | 939 | 254 | ||||||||||||||||||||
Change in product inventory | (3,298 | ) | (2,973 | ) | (2,000 | ) | 1,867 | |||||||||||||||||
Royalties | 2,698 | 1,776 | 7,686 | 5,005 | ||||||||||||||||||||
Depreciation and amortization2 | 32,374 | 30,559 | 94,927 | 91,186 | ||||||||||||||||||||
Cost of sales | 133,364 | 108,884 | 381,851 | 328,013 | ||||||||||||||||||||
1Per pound of zinc produced.
2Depreciation is based on concentrate sold.
Manitoba | Three months ended | Nine months ended | ||||||||||||||||||||||
Sustaining cash cost | Sep. 30, 2017 | Sep. 30, 2016 | Sep. 30, 2017 | Sep. 30, 2016 | ||||||||||||||||||||
per poundof zinc produced | $000s | $/lb | $000s | $/lb | $000s | $/lb | $000s | $/lb | ||||||||||||||||
| ||||||||||||||||||||||||
Zinc cash cost, net of by-product credits | 3,970 | 0.05 | 20,642 | 0.30 | 39,598 | 0.18 | 56,085 | 0.31 | ||||||||||||||||
Sustaining capital expenditures | 13,744 | 0.18 | 9,120 | 0.13 | 37,116 | 0.17 | 47,831 | 0.27 | ||||||||||||||||
Capitalized exploration | (9 | ) | - | 571 | 0.01 | 833 | - | 1,898 | 0.01 | |||||||||||||||
Royalties | 2,698 | 0.03 | 1,776 | 0.03 | 7,686 | 0.03 | 5,005 | 0.03 | ||||||||||||||||
Sustaining cash cost per poundof zinc produced | 20,403 | 0.25 | 32,109 | 0.46 | 85,233 | 0.38 | 110,819 | 0.62 | ||||||||||||||||
36
![]()
ACCOUNTING CHANGES AND CRITICAL ESTIMATES
New standards and interpretations not yet adopted
For information on new standards and interpretations not yet adopted, refer to note 4 of our September 30, 2017 consolidated interim financial statements.
Estimates and judgements
For information on significant areas requiring us to make estimates and judgements, refer to note 2 of our September 30, 2017 consolidated interim financial statements.
CHANGES IN INTERNAL CONTROL OVER FINANCIAL REPORTING
Management is responsible for establishing and maintaining adequate internal control over financial reporting (“ICFR”). ICFR is designed to provide reasonable assurance regarding the reliability of financial reporting and the preparation of financial statements for external purposes in accordance with IFRS.
We did not make any changes to ICFR during the quarter ended September 30, 2017 that materially affected or are reasonably likely to materially affect our ICFR.
NOTES TO READER
Forward-Looking Information
This MD&A contains forward-looking information within the meaning of applicable Canadian and United States securities legislation. All information contained in this MD&A, other than statements of current and historical fact, is forward-looking information. Often, but not always, forward-looking information can be identified by the use of words such as “plans”, “expects”, “budget”, “guidance”, “scheduled”, “estimates”, “forecasts”, “strategy”, “target”, “intends”, “objective”, “goal”, “understands”, “anticipates” and “believes” (and variations of these or similar words) and statements that certain actions, events or results “may”, “could”, “would”, “should”, “might” “occur” or “be achieved” or “will be taken” (and variations of these or similar expressions). All of the forward-looking information in this MD&A is qualified by this cautionary note.
Forward-looking information includes, but is not limited to, production, cost and capital and exploration expenditure guidance, anticipated production at our mines and processing facilities, the anticipated timing, cost and benefits of developing the Rosemont project, Pampacancha deposit and Lalor growth projects, anticipated exploration plans, anticipated mine plans, anticipated metals prices and the anticipated sensitivity of our financial performance to metals prices, the anticipated use of proceeds from our recent common equity offering, events that may affect our operations and development projects, the permitting, development and financing of the Rosemont project, the potential to increase throughput at the Stall mill and to refurbish the New Britannia mill, anticipated cash flows from operations and related liquidity requirements, the anticipated effect of external factors on revenue, such as commodity prices, estimation of mineral reserves and resources, mine life projections, reclamation costs, economic outlook, government regulation of mining operations, and business and acquisition strategies. Forward-looking information is not, and cannot be, a guarantee of future results or events. Forward-looking information is based on, among other things, opinions, assumptions, estimates and analyses that, while considered reasonable by us at the date the forward-looking information is provided, inherently are subject to significant risks, uncertainties, contingencies and other factors that may cause actual results and events to be materially different from those expressed or implied by the forward-looking information.
37
![]()
The material factors or assumptions that we identified and were applied by us in drawing conclusions or making forecasts or projections set out in the forward-looking information include, but are not limited to:
| − | the success of mining, processing, exploration and development activities; | |
| − | the scheduled maintenance and availability of our processing facilities; | |
| − | the sustainability and success of Hudbay’s cost reduction initiatives; | |
| − | the accuracy of geological, mining and metallurgical estimates; | |
| − | anticipated metals prices and the costs of production; | |
| − | the supply and demand for metals we produce; | |
| − | the supply and availability of all forms of energy and fuels at reasonable prices; | |
| − | no significant unanticipated operational or technical difficulties; | |
| − | the execution of our business and growth strategies, including the success of our strategic investments and initiatives; | |
| − | the availability of additional financing, if needed; | |
| − | the ability to complete project targets on time and on budget and other events that may affect our ability to develop our projects; | |
| − | the timing and receipt of various regulatory, governmental and joint venture partner approvals; | |
| − | the availability of personnel for our exploration, development and operational projects and ongoing employee relations; | |
| − | the ability to secure required land rights to develop the Pampacancha deposit; | |
| − | maintaining good relations with the communities in which we operate, including the communities surrounding our Constancia mine and Rosemont project and First Nations communities surrounding our Lalor and Reed mines; | |
| − | no significant unanticipated challenges with stakeholders at our various projects; | |
| − | no significant unanticipated events or changes relating to regulatory, environmental, health and safety matters; | |
| − | no contests over title to our properties, including as a result of rights or claimed rights of aboriginal peoples; | |
| − | the timing and possible outcome of pending litigation and no significant unanticipated litigation; | |
| − | certain tax matters, including, but not limited to current tax laws and regulations and the refund of certain value added taxes from the Canadian and Peruvian governments; and | |
| − | no significant and continuing adverse changes in general economic conditions or conditions in the financial markets (including commodity prices and foreign exchange rates). |
The risks, uncertainties, contingencies and other factors that may cause actual results to differ materially from those expressed or implied by the forward-looking information may include, but are not limited to, risks generally associated with the mining industry, such as economic factors (including future commodity prices, currency fluctuations, energy prices and general cost escalation), uncertainties related to the development and operation of our projects (including risks associated with the permitting, development and economics of the Rosemont project and related legal challenges), risks related to the maturing nature of our 777 and Reed mines and their impact on the related Flin Flon metallurgical complex, dependence on key personnel and employee and union relations, risks related to the schedule for mining the Pampacancha deposit (including the timing and cost of acquiring the required surface rights), risks related to the cost, schedule and economics of the capital projects intended to increase processing capacity for Lalor ore, risks related to political or social unrest or change, risks in respect of aboriginal and community relations, rights and title claims, operational risks and hazards, including unanticipated environmental, industrial and geological events and developments and the inability to insure against all risks, failure of plant, equipment, processes, transportation and other infrastructure to operate as anticipated, compliance with government and environmental regulations, including permitting requirements and anti-bribery legislation, depletion of our reserves, volatile financial markets that may affect our ability to obtain additional financing on acceptable terms, the failure to obtain required approvals or clearances from government authorities on a timely basis, uncertainties related to the geology, continuity, grade and estimates of mineral reserves and resources, and the potential for variations in grade and recovery rates, uncertain costs of reclamation activities, our ability to comply with our pension and other post-retirement obligations, our ability to abide by the covenants in our debt instruments and other material contracts, tax refunds, hedging transactions, as well as the risks discussed under the heading “Risk Factors” in our most recent Annual Information Form.
38
![]()
Should one or more risk, uncertainty, contingency or other factor materialize or should any factor or assumption prove incorrect, actual results could vary materially from those expressed or implied in the forward-looking information. Accordingly, you should not place undue reliance on forward-looking information. We do not assume any obligation to update or revise any forward-looking information after the date of this MD&A or to explain any material difference between subsequent actual events and any forward-looking information, except as required by applicable law.
Note to United States Investors
This MD&A has been prepared in accordance with the requirements of the securities laws in effect in Canada, which may differ materially from the requirements of United States securities laws applicable to US issuers.
Qualified Person
The technical and scientific information in this MD&A related to the Constancia mine and Rosemont project has been approved by Cashel Meagher, P. Geo, our Senior Vice President and Chief Operating Officer. The technical and scientific information related to our Manitoba sites and projects contained in this MD&A has been approved by Robert Carter, P. Eng, our Lalor Mine Manager. Messrs. Meagher and Carter are qualified persons pursuant to NI 43-101. For a description of the key assumptions, parameters and methods used to estimate mineral reserves and resources, as well as data verification procedures and a general discussion of the extent to which the estimates of scientific and technical information may be affected by any known environmental, permitting, legal title, taxation, sociopolitical, marketing or other relevant factors, please see the Technical Reports for our material properties as filed by us on SEDAR at www.sedar.com.
39