

Management's Discussion and Analysis of
Results of Operations and Financial Condition
For the three and nine months ended
September 30, 2018
October 31, 2018
INTRODUCTION
This Management's Discussion and Analysis ("MD&A") dated October 31, 2018 is intended to supplement Hudbay Minerals Inc.'s unaudited condensed consolidated interim financial statements and related notes for the three and nine months ended September 30, 2018 and 2017 (the "consolidated interim financial statements"). The consolidated interim financial statements have been prepared in accordance with International Financial Reporting Standards (“IFRS"), including International Accounting Standard 34,Interim Financial Reporting, as issued by the International Accounting Standards Board (“IASB”).
References to “Hudbay”, the “Company”, “we”, “us”, “our” or similar terms refer to Hudbay Minerals Inc. and its direct and indirect subsidiaries as at September 30, 2018. "Hudbay Peru" refers to HudBay Peru S.A.C., our wholly-owned subsidiary which owns a 100% interest in the Constancia mine, and “Hudbay Arizona” refers to Hudbay Arizona Inc., our wholly-owned subsidiary, which indirectly owns a 92.05% interest in the Rosemont project.
Readers should be aware that:
| – | This MD&A contains certain “forward-looking statements” and “forward-looking information” (collectively, “forward-looking information”) that are subject to risk factors set out in a cautionary note contained in our MD&A. |
| – | This MD&A has been prepared in accordance with the requirements of the securities laws in effect in Canada, which may differ materially from the requirements of United States securities laws applicable to US issuers. |
| – | We use a number of non-IFRS financial performance measures in our MD&A. |
| – | The technical and scientific information in this MD&A has been approved by qualified persons based on a variety of assumptions and estimates. |
For a discussion of each of the above matters, readers are urged to review the “Notes to Reader” discussion beginning on page 40 of this MD&A.
Additional information regarding Hudbay, including the risks related to our business and those that are reasonably likely to affect our financial statements in the future, is contained in our continuous disclosure materials, including our most recent Annual Information Form (“AIF”), consolidated financial statements and Management Information Circular available on SEDAR at www.sedar.com and on EDGAR at www.sec.gov.
As of January 1, 2018 we have adopted IFRS 9, Financial Instruments (“IFRS 9”) and IFRS 15, Revenue from Contracts with Customers (“IFRS 15”). The Group applied this amendment retrospectively. Changes to previously reported balances are disclosed in Note 4(c) of the consolidated interim financial statements. Disclosures in this MD&A are restated for the impacts of these accounting changes.
All amounts are in US dollars unless otherwise noted.
OUR BUSINESS
We are an integrated mining company primarily producing copper concentrate (containing copper, gold, and silver), zinc concentrate, molybdenum concentrate, and zinc metal. With assets in North and South America, we are focused on the discovery, production and marketing of base and precious metals. Directly and through our subsidiaries, we own four polymetallic mines, four ore concentrators and a zinc production facility in northern Manitoba and Saskatchewan (Canada) and Cusco (Peru), and a copper project in Arizona (United States). Our growth strategy is focused on the exploration and development of properties we already control, as well as other mineral assets we may acquire that fit our strategic criteria. Our vision is to be a responsible, top-tier operator of long-life, low-cost mines in the Americas. Our mission is to create sustainable value through the acquisition, development and operation of high-quality, long-life deposits with exploration potential in jurisdictions that support responsible mining, and to see the regions and communities in which we operate benefit from our presence. We are governed by theCanada Business Corporations Actand our shares are listed under the symbol "HBM" on the Toronto Stock Exchange, New York Stock Exchange and Bolsa de Valores de Lima.
1
SUMMARY
| – | Earnings per share of $0.09 and cash from operating activities of $113.8 million in the third quarter of 2018. |
| – | Achieved record mill throughput and copper recoveries at Constancia. |
| – | Trade-off studies have been completed and Hudbay believes the refurbishment of the New Britannia mill is the optimal processing scenario for the Lalor gold and copper-gold zones. |
| – | Entered into a friendly agreement to acquire Mason Resources Corp. ("Mason"), owner of one of the largest undeveloped copper porphyry resources in North America, for an enterprise value of approximately $15 million. |
Net profit and earnings per share in the third quarter of 2018 were $22.8 million and $0.09, respectively, compared to a net profit and earnings per share of $36.3 million and $0.15, respectively, in the third quarter of 2017.
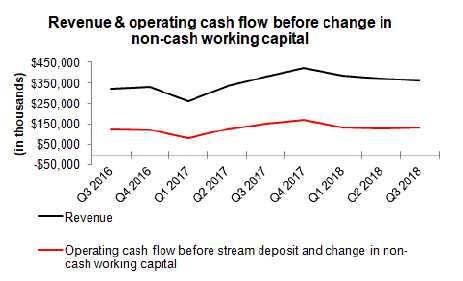
In the third quarter of 2018, cash generated from operating activities was $113.8 million, which decreased from $167.9 million in the same period of 2017 due to lower realized prices for all commodities, lower sales volumes of copper and higher operating costs, partially offset by increases in the sales volumes of precious metals and zinc. Operating cash flow before change in non-cash working capital decreased to $122.1 million in the third quarter of 2018 from $153.9 million in the same quarter of 2017. The decrease is due mainly to lower realized prices for all commodities, lower sales volumes of copper and working capital movements.
Net profit and earnings per share in the third quarter of 2018 were affected by, among other things, the following items:
| (in $ millions, except per share amounts) | | Pre-tax gain (loss) | | | After-tax gain (loss) | | | Per share gain (loss) | |
| Foreign exchange gain | | (1.2 | ) | | (0.8 | ) | | — | |
| Mark-to-market adjustments of various items | | 1.3 | | | 0.5 | | | — | |
| Non-cash deferred tax adjustments | | — | | | 1.3 | | | — | |
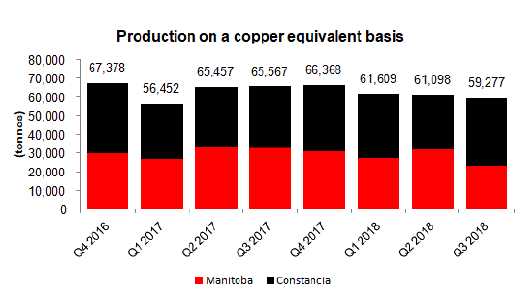
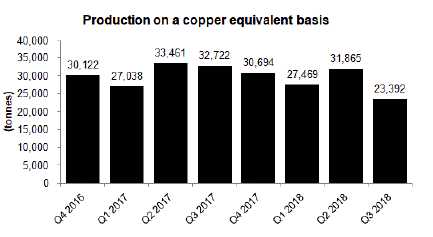
Compared to the same quarter in 2017, production of copper-equivalent contained metal in concentrate decreased by 10%, primarily as a result of lower production in Manitoba. The decrease in Manitoba production was partially offset by higher copper production at Constancia arising from improved mill throughput and recoveries.
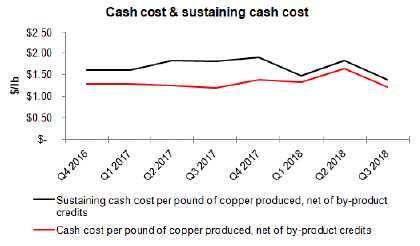
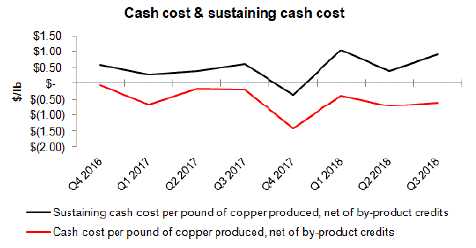
In the third quarter of 2018, consolidated cash cost per pound of copper produced, net of by-product credits, was $0.88, a marginal increase compared to $0.86 in the same period last year1. Cash costs, by–product credits and copper production in the third quarter of 2018 were all substantially similar to the equivalent values in the third quarter of 2017. Incorporating sustaining capital, capitalized exploration, royalties and corporate selling and administrative expenses, consolidated all-in sustaining cash cost per pound of copper produced, net of by-product credits, in the third quarter of 2018 was $1.43, which has decreased from $1.64 in the third quarter of 20171, as a result of reduced sustaining capital spending.
Net debt2decreased by $106.7 million from December 31, 2017 to $516.4 million at September 30, 2018, primarily due to free cash flow generation. At September 30, 2018, total liquidity, including cash and available credit facilities, was $878.4 million, up from $859.2 as at June 30, 2018.
Based on knowledge gained from test mining of the Lalor gold zones, infill drilling of the copper-gold zone and mineral processing trade-off studies on the Lalor gold and copper-gold zones, we believe that the optimal processing scenario is to refurbish the New Britannia mill, which is expected to have gold recoveries of approximately 90%, compared to gold recoveries of less than 65% in our existing facilities. Based on results to date, we are on track to meet all of our production and cost guidance expectations, as revised for Manitoba costs in the second quarter of 2018.
| 1 | Cash cost and sustaining cash cost per pound of copper produced, net of by-product credits, and net debt are non-IFRS financial performance measures with no standardized definition under IFRS. For further information and a detailed reconciliation, please see the discussion under the "Non-IFRS Financial Reporting Measures" section of this MD&A. |
| 2 | Net debt is a non-IFRS financial performance measures with no standardized definition under IFRS. For further information and a detailed reconciliation, please see discussion under the "Non-IFRS Financial Reporting Measures" section of this MD&A. |
2
3
KEY FINANCIAL RESULTS
| Financial Condition | | | | | Dec. 31, 2017 | |
| (in $ thousands) | | Sep. 30, 2018 | | | (Restated) | |
| Cash and cash equivalents | | 459,863 | | | 356,499 | |
| Total long-term debt | | 976,252 | | | 979,575 | |
| Net debt1 | | 516,389 | | | 623,076 | |
| Working capital | | 454,290 | | | 251,388 | |
| Total assets | | 4,682,172 | | | 4,728,016 | |
| Equity | | 2,195,269 | | | 2,112,345 | |
1Net debt is a non-IFRS financial performance measures with no standardized definition under IFRS. For further information and a detailed reconciliation, please see discussion under the "Non-IFRS Financial Reporting Measures" section of this MD&A.
| Financial Performance | | Three months ended | | | Nine months ended | |
| | | Sep. 30, | | | Sep. 30, | | | Sep. 30, | | | Sep. 30, | |
| (in $ thousands, except per share amounts) | | 2018 | | | 2017 | | | 2018 | | | 2017 | |
| Revenue | | 362,649 | | | 380,181 | | | 1,120,593 | | | 977,980 | |
| Cost of sales | | 277,367 | | | 260,624 | | | 822,079 | | | 713,792 | |
| Profit before tax | | 30,287 | | | 53,752 | | | 153,187 | | | 93,326 | |
| Profit | | 22,808 | | | 36,304 | | | 88,926 | | | 45,413 | |
| Basic and diluted earnings per share | | 0.09 | | | 0.15 | | | 0.34 | | | 0.19 | |
| Operating cash flow before change in non-cash working capital | | 122,097 | | | 153,943 | | | 385,524 | | | 358,662 | |
4
KEY PRODUCTION RESULTS
| | | | | | Three months ended | | | Three months ended | |
| | | | | | Sep. 30, 2018 | | | Sep. 30, 2017 | |
| | | | | | Peru | | | Manitoba | | | Total | | | Peru | | | Manitoba | | | Total | |
| Contained metal in concentrate produced1 | | | | | | | | | | | | | | | | | | | | | |
| Copper | | tonnes | | | 32,976 | | | 7,506 | | | 40,482 | | | 30,936 | | | 9,509 | | | 40,445 | |
| Gold | | oz | | | 6,059 | | | 22,199 | | | 28,258 | | | 4,702 | | | 23,975 | | | 28,677 | |
| Silver | | oz | | | 736,657 | | | 274,330 | | | 1,010,987 | | | 617,959 | | | 317,567 | | | 935,526 | |
| Zinc | | tonnes | | | - | | | 26,228 | | | 26,228 | | | - | | | 36,635 | | | 36,635 | |
| Molybdenum | | tonnes | | | 370 | | | - | | | 370 | | | 72 | | | - | | | 72 | |
| Payable metal sold | | | | | | | | | | | | | | | | | | | | | |
| Copper | | tonnes | | | 30,222 | | | 9,376 | | | 39,598 | | | 30,128 | | | 11,384 | | | 41,512 | |
| Gold | | oz | | | 4,486 | | | 26,996 | | | 31,482 | | | 3,103 | | | 24,526 | | | 27,629 | |
| Silver | | oz | | | 548,782 | | | 338,131 | | | 886,913 | | | 465,251 | | | 292,261 | | | 757,512 | |
| Zinc2 | | tonnes | | | - | | | 30,969 | | | 30,969 | | | - | | | 27,804 | | | 27,804 | |
| Molybdenum | | tonnes | | | 237 | | | - | | | 237 | | | 159 | | | - | | | 159 | |
| Cash cost3 | | $/lb | | | 1.22 | | | (0.61 | ) | | 0.88 | | | 1.19 | | | (0.20 | ) | | 0.86 | |
| Sustaining cash cost3 | | $/lb | | | 1.38 | | | 1.23 | | | | | | 1.80 | | | 0.59 | | | | |
| All-in sustaining cash cost3 | | $/lb | | | | | | | | | 1.43 | | | | | | | | | 1.64 | |
| | | | | | Nine months ended | | | Nine months ended | |
| | | | | | Sep. 30, 2018 | | | Sep. 30, 2017 | |
| | | | | | PeruManitobaTotal | | | Peru Manitoba Total | |
| Contained metal in concentrate produced1 | | | | | | | | | | | | | | | | | | | | | |
| Copper | | tonnes | | | 91,344 | | | 25,968 | | | 117,312 | | | 87,944 | | | 28,073 | | | 116,017 | |
| Gold | | oz | | | 16,667 | | | 75,164 | | | 91,831 | | | 12,440 | | | 63,625 | | | 76,065 | |
| Silver | | oz | | | 1,979,112 | | | 960,673 | | | 2,939,785 | | | 1,703,789 | | | 779,978 | | | 2,483,767 | |
| Zinc | | tonnes | | | - | | | 88,180 | | | 88,180 | | | - | | | 102,101 | | | 102,101 | |
| Molybdenum | | tonnes | | | 575 | | | - | | | 575 | | | 335 | | | - | | | 335 | |
| Payable metal sold | | | | | | | | | | | | | | | | | | | | | |
| Copper | | tonnes | | | 85,197 | | | 26,376 | | | 111,573 | | | 77,175 | | | 30,001 | | | 107,176 | |
| Gold | | oz | | | 13,158 | | | 74,078 | | | 87,236 | | | 8,022 | | | 70,527 | | | 78,549 | |
| Silver | | oz | | | 1,582,944 | | | 879,909 | | | 2,462,853 | | | 1,407,130 | | | 817,653 | | | 2,224,783 | |
| Zinc2 | | tonnes | | | - | | | 84,589 | | | 84,589 | | | - | | | 84,059 | | | 84,059 | |
| Molybdenum | | tonnes | | | 372 | | | - | | | 372 | | | 423 | | | - | | | 423 | |
| Cash cost3 | | $/lb | | | 1.38 | | | (0.58 | ) | | 0.94 | | | 1.24 | | | (0.31 | ) | | 0.86 | |
| Sustaining cash cost3 | | $/lb | | | 1.54 | | | 0.82 | | | | | | 1.74 | | | 0.42 | | | | |
| All-in sustaining cash cost3 | | $/lb | | | | | | | | | 1.45 | | | | | | | | | 1.53 | |
1Metal reported in concentrate is prior to deductions associated with smelter contract terms.
2Includes refined zinc metal sold and payable zinc in concentrate sold.
3Cash cost, sustaining cash cost and all-in sustaining cash cost per pound of copper produced, net of by-product credits are non-IFRS financial performance measures with no standardized definition under IFRS. For further information and a detailed reconciliation, please see the discussion under the "Non-IFRS Financial Reporting Measures" section of this MD&A.
5
RECENT DEVELOPMENTS
Rosemont Developments
Work continues with the U.S. Forest Service on the draft Mine Plan of Operations ("MPO"), which has been submitted and comments are under review. The remaining key federal permit outstanding is the Section 404 Water Permit from the U.S. Army Corps of Engineers.
Lalor Gold
A key area of focus at Lalor this year has been test mining in the gold zones, and additional infill drilling in the gold and copper-gold zones, both in support of trade-off studies to assess the mining and processing options for Lalor gold. The trade-off studies have been completed and we believe that the optimal processing scenario is to refurbish the New Britannia gold mill, with significant upside potential from nearby satellite deposits.
Over the past few months, we have continued drilling and test mining in the gold rich Lens 25, confirming the existence of a continuous high grade core of mineralization within the wider lower grade mineral resource estimates reported in the 2017 NI43-101 technical report for Lalor. In parallel, we have revised our geological model of the copper-gold rich Lens 27, which now better reflects the orientation of the mineralization observed during core logging. This reinterpretation indicates that there is a simpler and more consistent and reliable mineralized envelope that is expected to result in an increase in tonnage of this high grade mineralization.
Based on the detailed work completed in the last 12 months, we believe that the refurbishment of the New Britannia mill, including the addition of a copper flotation circuit, is the optimal processing scenario. We believe there is substantial additional upside potential from known mineral resources at nearby satellite deposits and other promising exploration targets, including the historical estimates of mineral resources at Hudbay’s New Britannia and Squall Lake deposits as well as the recently acquired Wim deposit1, and from other promising exploration targets in the Snow Lake region.
We are currently working on an updated mineral reserve and resource estimate and related technical work to confirm our assumptions and determine an optimal configuration of the New Britannia mil. We expect to provide more details in the first quarter of 2019 once we have advanced the engineering and mine planning work.
Acquisition of Mason
On October 31, 2018, we entered into an agreement pursuant to which Hudbay will acquire the remaining 86% of the issued and outstanding common shares of Mason that it does not already own. Under the agreement, Mason shareholders will receive C$0.40 in cash for each Mason common share owned. The transaction is expected to close in December 2018, subject to the approval of Mason's shareholders, court approval of a plan of arrangement and other customary conditions.
Mason's Ann Mason project is a large greenfield copper deposit located in the historic Yerington District of Nevada and is one of the largest undeveloped copper porphyry deposits in North America. Mason’s measured and indicated resources are comparable in size to Constancia and Rosemont, and we are acquiring the asset for an enterprise value (net of its current ownership) of approximately $15 million, a cost that is approximately 30% of our 2018 exploration budget.
| 1 | Refer to "Historical Estimates of Mineral Resources" in the Notes to Reader section of this MD&A. |
6
Table 1-1: Mineral Resource1 Statement for the Ann Mason Deposit based on a 0.20% Cu Cut-off
| | | Tonnage | | | Grade | | | | | | Contained Metal | |
| Classification | | (Mt) | | | Cu (%) | | | Mo (%) | | | Au (g/t) | | | Ag (g/t) | | | Cu (Mlb) | | | Mo (Mlb) | | | Au (Moz) | | | Ag (Moz) | |
| Measured | | 412 | | | 0.33 | | | 0.006 | | | 0.03 | | | 0.64 | | | 3,037.6 | | | 58.1 | | | 0.37 | | | 8.46 | |
| Indicated | | 988 | | | 0.31 | | | 0.006 | | | 0.03 | | | 0.66 | | | 6,853.3 | | | 128.5 | | | 0.97 | | | 21.00 | |
| Measured and Indicated | | 1,400 | | | 0.32 | | | 0.006 | | | 0.03 | | | 0.65 | | | 9,890.9 | | | 186.6 | | | 1.33 | | | 29.46 | |
| Inferred | | 623 | | | 0.29 | | | 0.007 | | | 0.03 | | | 0.66 | | | 3,897.2 | | | 96.2 | | | 0.58 | | | 13.16 | |
| 1 | For additional information, refer to the technical report dated March 3, 2017 filed by Mason on SEDAR at www.sedar.com. |
Table 1-2: Blue Hill Deposit2 Inferred Mineral Resources (effective date March 3, 2017)
| | | Cu Cut-off | | | Tonnes | | | Grade | | | Contained Cu | | | Mo | | | Au | | | Ag | |
| Zone | | (%) | | | (Mt) | | | Cu (%) | | | (Mlb) | | | (%) | | | (g/t) | | | (g/t) | |
| Oxide Zone | | 0.10 | | | 47.44 | | | 0.17 | | | 179.37 | | | — | | | — | | | — | |
| Mixed Zone | | 0.10 | | | 24.69 | | | 0.18 | | | 98.20 | | | — | | | — | | | — | |
| Oxide + Mixed Zone | | 0.10 | | | 72.13 | | | 0.17 | | | 277.49 | | | — | | | — | | | — | |
| Sulphide Zone | | 0.15 | | | 49.86 | | | 0.23 | | | 253.46 | | | 0.005 | | | 0.01 | | | 0.3 | |
| 2 | For additional information, refer to the technical report dated March 3, 2017 filed by Mason on SEDAR at www.sedar.com. |
We view Mason as a long-term option for potential future development after Rosemont, and a strong addition to our pipeline of long-term growth opportunities. The Ann Mason project will become one of our high priority exploration projects in North America. We plan to conduct geological mapping, geochemical sampling and geophysical surveys in 2019, as well as diamond drilling to identify potential sources of high grade mineralization that could enhance the feed grade in the early years of a future milling operation. High priority exploration targets include near-surface skarn showings as well as untested induced polarization (IP) anomalies. We are pleased to acquire a deposit of this scale at an early stage where we can apply our experience in exploration, engineering, construction and permitting to unlock the project’s potential and maximize value for our shareholders.
Other Matters
A requisition for a meeting of our common shareholders has been submitted by a shareholder for the purpose of considering an advisory resolution with respect to certain potential transactions. Per the Company’s October 23 press release, our Board is considering the requisition and will respond in due course.
7
CONSTANCIA OPERATIONS REVIEW
| | | | | | Three months ended | | | Nine months ended | | | Guidance | |
| | | | | | Sep. 30, | | | Sep. 30, | | | Sep. 30, | | | Sep. 30, | | | Annual | |
| | | | | | 2018 | | | 2017 | | | 2018 | | | 2017 | | | 2018 | |
| Ore mined1 | | tonnes | | | 8,808,764 | | | 8,190,444 | | | 27,042,733 | | | 22,741,175 | | | | |
| Copper | | % | | | 0.50 | | | 0.52 | | | 0.49 | | | 0.54 | | | | |
| Gold | | g/tonne | | | 0.05 | | | 0.04 | | | 0.05 | | | 0.04 | | | | |
| Silver | | g/tonne | | | 4.23 | | | 4.00 | | | 4.15 | | | 3.95 | | | | |
| | | | | | | | | | | | | | | | | | | |
| Ore milled | | tonnes | | | 8,046,891 | | | 7,828,430 | | | 23,624,667 | | | 21,077,729 | | | | |
| Copper | | % | | | 0.48 | | | 0.49 | | | 0.47 | | | 0.52 | | | | |
| Gold | | g/tonne | | | 0.05 | | | 0.04 | | | 0.05 | | | 0.04 | | | | |
| Silver | | g/tonne | | | 4.05 | | | 3.70 | | | 4.03 | | | 3.94 | | | | |
| | | | | | | | | | | | | | | | | | | |
| Copper concentrate | | tonnes | | | 139,621 | | | 121,428 | | | 381,908 | | | 348,550 | | | | |
| Concentrate grade | | % Cu | | | 23.62 | | | 25.48 | | | 23.92 | | | 25.23 | | | | |
| | | | | | | | | | | | | | | | | | | |
| Copper recovery | | % | | | 85.0 | | | 81.2 | | | 81.9 | | | 80.7 | | | | |
| Gold recovery | | % | | | 51.1 | | | 51.8 | | | 47.0 | | | 47.1 | | | | |
| Silver recovery | | % | | | 70.3 | | | 66.3 | | | 64.7 | | | 63.8 | | | | |
| | | | | | | | | | | | | | | | | | | |
| Combined unit operating costs2 | | $/tonne | | | 8.68 | | | 7.49 | | | 9.30 | | | 8.50 | | | 7.50 - 9.20 | |
| 1 | Reported tonnes and grade for ore mined are estimates based on mine plan assumptions and may not reconcile fully to ore milled. |
| 2 | Reflects combined mine, mill and general and administrative ("G&A") costs per tonne of ore milled. Reflects the deduction of expected capitalized stripping costs. |
Our Constancia mill achieved record throughput and record copper recoveries in the third quarter of 2018. Ore mined at our Constancia mine during the third quarter of 2018 increased by 8% compared to the same period in 2017 in line with improved mill availability. Milled copper grades in the third quarter were approximately 2% lower than the same period in 2017 as we entered lower grade phases of the mine plan. Mill throughput in the third quarter of 2018 improved 3% compared to the same period in 2017 to a record level due to increased plant availability as well as plant optimization initiatives.
Copper recoveries reached record levels in the third quarter of 2018 as a result of several metallurgical initiatives intended to improve copper recoveries, while gold recoveries remained consistent compared to the same period in 2017. While recoveries vary from quarter to quarter depending on the complexity of the ore feed, the Company is seeing results from recovery improvement initiatives and is on track to deliver the recoveries anticipated in the 43-101 technical report issued earlier in 2018.
Combined mine, mill and G&A unit operating costs in the third quarter of 2018 were 16% higher than the same period in 2017. The higher combined unit operating costs were due to a decrease in capitalized stripping and higher costs for diesel, steel and power, partially offset by higher mill throughput. Also, increased utilization of the molybdenum plant contributed to higher unit costs but reduced Peru cash costs due to higher by-product revenue. On a year-to-date basis, combined unit operating costs include accruals for signing bonuses for the three-year collective bargaining agreement agreed to earlier in 2018.
The year to date production variances were driven by the same factors as the third quarter variances versus prior year.
8
| | | | | | Three months ended | | | Nine months ended | | | Guidance | |
| Contained metal in | | | | | Sep. 30, | | | Sep. 30, | | | Sep. 30, | | | Sep. 30, | | | Annual | |
| concentrate produced | | | | | 2018 | | | 2017 | | | 2018 | | | 2017 | | | 2018 | |
| Copper | | tonnes | | | 32,976 | | | 30,936 | | | 91,344 | | | 87,944 | | | 95,000 - 115,000 | |
| Gold | | oz | | | 6,059 | | | 4,702 | | | 16,667 | | | 12,440 | | | | |
| Silver | | oz | | | 736,657 | | | 617,959 | | | 1,979,112 | | | 1,703,789 | | | | |
| Molybdenum | | tonnes | | | 370 | | | 72 | | | 575 | | | 335 | | | | |
Precious metals1 | | oz | | | 16,582 | | | 13,530 | | | 44,940 | | | 36,780 | | | 50,000 - 70,0002 | |
| 1 | Precious metals production includes gold and silver production on a gold-equivalent basis. Silver is converted to gold at a ratio of 70:1. |
| 2 | Initial 2018 guidance for Constancia precious metals production was 65,000 to 85,000 ounces. |
Production of copper, gold and silver during the third quarter of 2018 was higher than the same period in 2017 due to higher throughput and improved recoveries. The molybdenum plant continued to operate at higher rates during the quarter, resulting in the production of 370 tonnes of molybdenum. Production for the first three quarters of 2018 for all commodities increased due to improved mill throughput and higher recoveries, partially offset by lower copper grades in accordance with the mine plan.
Production results to date are on track to meet 2018 full year guidance.
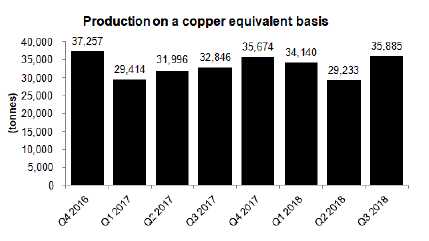
Copper equivalent production in the past three quarters has increased due to improved mill throughput and recoveries offset in part by lower copper grades in accordance with the mine plan.
Peru Cash Cost and Sustaining Cash Cost
| | | | | | Three months ended | | | Nine months ended | |
| | | | | | Sep. 30, | | | Sep. 30, | | | Sep. 30, | | | Sep. 30, | |
| | | | | | 2018 | | | 2017 | | | 2018 | | | 2017 | |
| Cash cost per pound of copper produced, net of by- product credits1 | | $/lb | | | 1.22 | | | 1.19 | | | 1.38 | | | 1.24 | |
| Sustaining cash cost per pound of copper produced, net of by-product credits1 | | $/lb | | | 1.38 | | | 1.80 | | | 1.54 | | | 1.74 | |
1Cash cost and sustaining cash costs per pound of copper produced, net of by-product credits, are not recognized under IFRS. For more detail on these non-IFRS financial performance measures, please see the discussion under the "Non-IFRS Financial Performance Measures" section of this MD&A.
9
Cash cost per pound of copper produced, net of by-product credits, for the three and nine months ended September 30, 2018 was $1.22 and $1.38, increasing by 3% and 11%, respectively, from the same periods in 2017. The increase for the first nine months is mainly as a result of higher consumable costs and lower capitalized stripping, partially offset by higher by-product credits.
Sustaining cash cost per pound of copper produced, net of by-product credits, for the three and nine months ended September 30, 2018 was $1.38 and $1.54, decreasing by 23% and 12%, respectively, from the same periods in 2017, as a result of reduced sustaining capital spending on heavy civil works, which more than offset the factors noted above.
Metal Sold
| | | | | | Three months ended | | | Nine months ended | |
| | | | | | Sep. 30, | | | Sep. 30, | | | Sep. 30, | | | Sep. 30, | |
| | | | | | 2018 | | | 2017 | | | 2018 | | | 2017 | |
| Payable metal in concentrate | | | | | | | | | | | | | | | |
| Copper | | tonnes | | | 30,222 | | | 30,128 | | | 85,197 | | | 77,175 | |
| Gold | | oz | | | 4,486 | | | 3,103 | | | 13,158 | | | 8,022 | |
| Silver | | oz | | | 548,782 | | | 465,251 | | | 1,582,944 | | | 1,407,130 | |
| Molybdenum | | tonnes | | | 237 | | | 159 | | | 372 | | | 423 | |
10
MANITOBA OPERATIONS REVIEW
Mines
| | | | | | Three months ended | | | Nine months ended | |
| | | | | | Sep. 30, | | | Sep. 30, | | | Sep. 30, | | | Sep. 30, | |
| | | | | | 2018 | | | 2017 | | | 2018 | | | 2017 | |
| 777 | | | | | | | | | | | | | | | |
| Ore | | tonnes | | | 250,434 | | | 235,593 | | | 721,954 | | | 811,841 | |
| Copper | | % | | | 1.38 | | | 1.58 | | | 1.37 | | | 1.60 | |
| Zinc | | % | | | 4.37 | | | 5.87 | | | 4.76 | | | 5.12 | |
| Gold | | g/tonne | | | 1.64 | | | 2.24 | | | 1.90 | | | 2.02 | |
| Silver | | g/tonne | | | 27.98 | | | 33.18 | | | 29.69 | | | 25.88 | |
| Lalor | | | | | | | | | | | | | | | |
| Ore | | tonnes | | | 281,007 | | | 342,184 | | | 942,625 | | | 959,189 | |
| Copper | | % | | | 0.66 | | | 0.76 | | | 0.72 | | | 0.65 | |
| Zinc | | % | | | 6.21 | | | 7.80 | | | 6.06 | | | 7.92 | |
| Gold | | g/tonne | | | 2.30 | | | 2.06 | | | 2.22 | | | 1.81 | |
| Silver | | g/tonne | | | 22.40 | | | 25.60 | | | 25.64 | | | 22.48 | |
| Reed1 | | | | | | | | | | | | | | | |
| Ore | | tonnes | | | 61,922 | | | 117,536 | | | 326,363 | | | 358,184 | |
| Copper | | % | | | 3.22 | | | 4.06 | | | 3.35 | | | 3.72 | |
| Zinc | | % | | | 1.19 | | | 0.62 | | | 0.90 | | | 0.57 | |
| Gold | | g/tonne | | | 0.86 | | | 0.48 | | | 0.77 | | | 0.46 | |
| Silver | | g/tonne | | | 10.07 | | | 8.23 | | | 9.08 | | | 6.68 | |
| Total Mines | | | | | | | | | | | | | | | |
| Ore | | tonnes | | | 593,363 | | | 695,313 | | | 1,990,942 | �� | | 2,129,214 | |
| Copper | | % | | | 1.23 | | | 1.60 | | | 1.39 | | | 1.53 | |
| Zinc | | % | | | 4.91 | | | 5.93 | | | 4.74 | | | 5.61 | |
| Gold | | g/tonne | | | 1.87 | | | 1.86 | | | 1.87 | | | 1.67 | |
| Silver | | g/tonne | | | 23.47 | | | 25.23 | | | 24.39 | | | 21.12 | |
| 1 | Includes 100% of Reed mine production. |
| | | | | | Three months ended | | | Nine months ended | |
| | | | | Sep. 30, | | | Sep. 30, | | | Sep. 30, | | | Sep. 30, | |
| Unit Operating Costs1 | | | | | 2018 | | | 2017 | | | 2018 | | | 2017 | |
| Mines | | | | | | | | | | | | | | | |
| 777 | | C$/tonne | | | 70.42 | | | 72.11 | | | 78.33 | | | 63.04 | |
| Lalor | | C$/tonne | | | 95.59 | | | 79.26 | | | 89.25 | | | 79.85 | |
| Reed | | C$/tonne | | | 44.88 | | | 76.99 | | | 72.62 | | | 63.61 | |
| Total Mines | | C$/tonne | | | 80.80 | | | 76.43 | | | 83.08 | | | 71.08 | |
| 1 | Reflects costs per tonne of ore mined. |
Ore mined at our Manitoba operations during the third quarter of 2018 decreased by 15% compared to the same period in 2017. Increased production at our 777 mine was offset by decreased production at Lalor and the closure of the Reed mine.
11
Overall, gold grades were 1% higher, while copper, zinc and silver grades were 23%, 17%, and 7% lower, respectively, in the third quarter of 2018 compared to the same period of 2017. Grade variances reflected anticipated declines in 777 and Lalor grades in accordance with their respective mine plans, together with reduced high–grade copper production from Reed due to its closure. Unit operating costs for all Manitoba mines for the third quarter of 2018 increased by 6% compared to the same period in 2017 for the reasons described below.
Ore mined at Lalor decreased by 18%, compared to the same period last year. Lower production tonnage is primarily attributed to the exhaust fan failure in June that constrained ventilation and production from areas of the mine until mid August. In addition, a fall of ground in August delayed the timing of a production stope, and the mine has been affected by a shortage of skilled workers. The Lalor paste plant was commissioned during the quarter, with backfill voids being managed within normal thresholds. Higher unit operating costs reflect the repairs to the exhaust fan failure and ground rehabilitation work completed in the quarter. The Lalor production ramp up to 4,500 tonnes per day is now expected in the first quarter of 2019.
Based on knowledge gained from test mining of the Lalor gold zones, infill drilling of the copper-gold zone and mineral processing trade-off studies on the Lalor gold and copper-gold zones, we believe that the optimal processing scenario is to refurbish the New Britannia mill, which is expected have gold recoveries of approximately 90%, compared to gold recoveries of less than 65% in our existing facilities.
Based on results to date, we are on track to meet all of our production and cost guidance expectations, as revised for Manitoba costs in the second quarter of 2018.
The Reed mine produced its last ore in August and processing of Reed ore was completed in early September. Production volumes and grades exceeded our expectations over the third quarter. The production costs were at a lower unit cost because the upfront development and longhole drilling activities were completed in the first half of the year. Reed closure costs are included in other operating expenses, and work was approximately 85% complete at September 30, 2018.
Ore mined at 777 in the third quarter of 2018 increased by 6%, as compared to the same period last year. The higher production is attributable to improved availability of mobile equipment and the truck fleet due to a focus on maintenance and rebuild programs in the quarter. Lower unit operating costs in the third quarter were driven by higher production. Year-to-date ore mined at our Manitoba operations was 6% lower than the same period in 2017 as a result of lower production at all of our mines.
Year-to-date copper and zinc grades in 2018 were lower than the same period in 2017 by 9% and 16%, respectively, while gold and silver grades were 12% and 15% higher, respectively, which is in line with mine plan expectations. Year-to-date total mine unit costs were 17% higher than the same period in 2017 as a result of higher costs in the first half of 2018 and the factors that impacted third quarter total mine unit costs.
12
Processing Facilities
| | | | | | Three months ended | | | Nine months ended | |
| | | | | | Sep. 30, | | | Sep. 30, | | | Sep. 30, | | | Sep. 30, | |
| | | | | | 2018 | | | 2017 | | | 2018 | | | 2017 | |
| Flin Flon Concentrator | | | | | | | | | | | | | | | |
| Ore | | tonnes | | | 333,221 | | | 390,366 | | | 1,164,175 | | | 1,200,448 | |
| Copper | | % | | | 1.91 | | | 2.13 | | | 1.94 | | | 2.14 | |
| Zinc | | % | | | 3.43 | | | 4.67 | | | 3.74 | | | 3.94 | |
| Gold | | g/tonne | | | 1.43 | | | 1.72 | | | 1.63 | | | 1.57 | |
| Silver | | g/tonne | | | 22.81 | | | 25.20 | | | 23.18 | | | 20.32 | |
| Copper concentrate | | tonnes | | | 25,794 | | | 31,179 | | | 91,354 | | | 97,970 | |
| Concentrate grade | | % Cu | | | 22.88 | | | 24.95 | | | 22.87 | | | 24.25 | |
| Zinc concentrate | | tonnes | | | 18,600 | | | 30,511 | | | 73,779 | | | 79,464 | |
| Concentrate grade | | % Zn | | | 50.27 | | | 52.18 | | | 49.74 | | | 51.48 | |
| Copper recovery | | % | | | 92.6 | | | 93.4 | | | 92.7 | | | 92.3 | |
| Zinc recovery | | % | | | 81.8 | | | 87.3 | | | 84.3 | | | 86.5 | |
| Gold recovery | | % | | | 64.2 | | | 63.2 | | | 64.8 | | | 60.9 | |
| Silver recovery | | % | | | 62.4 | | | 60.9 | | | 61.5 | | | 57.6 | |
| Contained metal in concentrate produced | | | | | | | | | | | | | | | |
| Copper | | tonnes | | | 5,902 | | | 7,778 | | | 20,888 | | | 23,754 | |
| Zinc | | tonnes | | | 9,351 | | | 15,919 | | | 36,698 | | | 40,906 | |
| Precious metals1 | | oz | | | 12,043 | | | 16,404 | | | 47,111 | | | 43,442 | |
| Stall Concentrator | | | | | | | | | | | | | | | |
| Ore | | tonnes | | | 292,454 | | | 280,945 | | | 887,471 | | | 834,398 | |
| Copper | | % | | | 0.66 | | | 0.74 | | | 0.68 | | | 0.63 | |
| Zinc | | % | | | 6.21 | | | 7.88 | | | 6.22 | | | 7.91 | |
| Gold | | g/tonne | | | 2.29 | | | 2.06 | | | 2.17 | | | 1.80 | |
| Silver | | g/tonne | | | 22.52 | | | 25.28 | | | 25.52 | | | 22.12 | |
| Copper concentrate | | tonnes | | | 8,107 | | | 8,014 | | | 25,549 | | | 20,870 | |
| Concentrate grade | | % Cu | | | 19.79 | | | 21.61 | | | 19.88 | | | 20.70 | |
| Zinc concentrate | | tonnes | | | 33,213 | | | 40,334 | | | 100,972 | | | 118,058 | |
| Concentrate grade | | % Zn | | | 50.81 | | | 51.36 | | | 50.99 | | | 51.84 | |
| Copper recovery | | % | | | 83.7 | | | 83.6 | | | 84.4 | | | 81.8 | |
| Zinc recovery | | % | | | 92.9 | | | 93.6 | | | 93.2 | | | 92.7 | |
| Gold recovery | | % | | | 57.4 | | | 55.4 | | | 57.7 | | | 55.3 | |
| Silver recovery | | % | | | 57.6 | | | 54.7 | | | 58.7 | | | 55.3 | |
| Contained metal in concentrate produced | | | | | | | | | | | | | | | |
| Copper | | tonnes | | | 1,604 | | | 1,731 | | | 5,080 | | | 4,319 | |
| Zinc | | tonnes | | | 16,877 | | | 20,716 | | | 51,482 | | | 61,195 | |
| Precious metals1 | | oz | | | 14,075 | | | 12,108 | | | 41,777 | | | 31,326 | |
| 1 | Precious metals production includes gold and silver production on a gold-equivalent basis. Silver is converted to gold at a ratio of 70:1. |
13
| | | | | | Three months ended | | | Nine months ended | | | Guidance | |
| | | | | | Sep. 30, | | | Sep. 30, | | | Sep. 30, | | | Sep. 30, | | | | |
| Unit Operating Costs1 | | | | | 2018 | | | 2017 | | | 2018 | | | 2017 | | | Annual 2018 | |
| Concentrators | | | | | | | | | | | | | | | | | | |
| Flin Flon | | C$/tonne | | | 27.37 | | | 17.90 | | | 23.09 | | | 18.78 | | | | |
| Stall | | C$/tonne | | | 26.93 | | | 27.31 | | | 26.53 | | | 29.81 | | | | |
| Combined mine/mill unit operatingcosts2 | | | | | | | | | | | | | | | | | | |
| Manitoba | | C$/tonne | | | 123.30 | | | 119.87 | | | 126.96 | | | 115.86 | | | 125 - 1353 | |
1Reflects costs per tonne of milled ore.
2Reflects combined mine, mill and G&A costs per tonne of milled ore. Includes the cost of ore purchased from our joint venture partner at Reed mine.
3Initial 2018 guidance for Manitoba unit operating costs was C$110 - 123 per tonne.
Ore processed in Flin Flon in the third quarter of 2018 was 15% lower than the same period in 2017. Lower production at our Lalor and Reed mines was offset partially by increased ore from our 777 mine. Copper and zinc recoveries in the third quarter of 2018 were 1% and 6% lower, respectively, compared with the same period in 2017 while gold and silver recoveries were each 2% higher. Unit operating costs at the Flin Flon concentrator were 53% higher in the third quarter of 2018 compared to the same period in 2017 as a result of higher maintenance expenditures driven by the timing of a scheduled shutdown and lower processed tonnages as a result of the Reed mine closure.
Ore processed was 4% higher and copper recoveries were consistent at the Stall concentrator in the third quarter of 2018 compared with the same period in 2017, as a result of ongoing operational and maintenance improvements and better metallurgical understanding of the Lalor ore. Unit operating costs at the Stall concentrator were 1% lower in the third quarter of 2018 compared to the same period in 2017 as a result of increased throughput, which has also resulted in reduced stockpile inventories.
Ore processed year-to-date in 2018 in Flin Flon was 3% lower than the same period in 2017 as a result of combined mine output. Year-to-date recoveries of copper were consistent and zinc recovery was 3% lower compared to the same period in 2017, as a result of lower head grades. Gold and silver recoveries were 6% and 7% higher, respectively, compared to 2017. Year-to-date unit operating costs at the Flin Flon concentrator were 23% higher than the same period in 2017 as a result of higher overall maintenance costs, driven by aging infrastructure and equipment, increased material handling costs realized in the first half of 2018 related to colder than typical weather, and lowered production. Ore processed year-to-date in 2018 at Stall was 6% higher, and recoveries for copper, zinc, gold and silver at the Stall concentrator were higher than the same period in 2017. Year-to-date unit operating costs at the Stall concentrator were 11% lower than the same period in 2017, primarily the result of higher production and improved mill reliability.
Manitoba combined mine, mill and G&A unit operating costs in the third quarter and year-to-date in 2018 were 3% and 10% higher, respectively, than in the same periods in 2017 due mainly to higher 777 and Lalor mining costs, Flin Flon mill maintenance and ore rehandling costs.
| | | | | | Three months ended | | | Nine months ended | | | Guidance1 | |
| Manitoba contained metal in | | | | | Sep. 30, | | | Sep. 30, | | | Sep. 30, | | | Sep. 30, | | | | |
| concentrate produced1,2 | | | | | 2018 | | | 2017 | | | 2018 | | | 2017 | | | Annual 2018 | |
| Copper | | tonnes | | | 7,506 | | | 9,509 | | | 25,968 | | | 28,073 | | | 27,500 - 32,500 | |
| Gold | | oz | | | 22,199 | | | 23,975 | | | 75,164 | | | 63,625 | | | | |
| Silver | | oz | | | 274,330 | | | 317,567 | | | 960,673 | | | 779,978 | | | | |
| Zinc | | tonnes | | | 26,228 | | | 36,635 | | | 88,180 | | | 102,101 | | | 105,000 - 130,000 | |
| | | | | | | | | | | | | | | | | | | |
| Precious metals3 | | oz | | | 26,118 | | | 28,512 | | | 88,888 | | | 74,768 | | | 120,000 - 145,000 | |
1Includes 100% of Reed mine production.
2Metal reported in concentrate is prior to deductions associated with smelter terms.
3Precious metals production includes gold and silver production on a gold-equivalent basis. Silver is converted to gold at a ratio of 70:1.
14
In the third quarter of 2018, copper, gold, and silver production was 21%, 7%, and 14% lower, respectively, compared to the same period in 2017. Zinc production was 28% lower compared to the same period in 2017 as a result of lower grades at Lalor and 777, in line with the mine plan. The Reed mine closure in August negatively affected contained copper production compared to Q3 2017.
Production of all metals is expected to be within full year guidance.
Zinc Plant
| | | | | | Three months ended | | | Nine months ended | | | Guidance | |
| | | | | | Sep. 30, | | | Sep. 30, | | | Sep. 30, | | | Sep. 30, | | | | |
| Zinc Production | | | | | 2018 | | | 2017 | | | 2018 | | | 2017 | | | Annual 2018 | |
| Zinc Concentrate Treated | | | | | | | | | | | | | | | | | | |
| Domestic | | tonnes | | | 52,849 | | | 54,510 | | | 161,122 | | | 164,671 | | | | |
| Refined Metal Produced | | | | | | | | | | | | | | | | | | |
| Domestic | | tonnes | | | 24,317 | | | 25,858 | | | 75,168 | | | 80,152 | | | 100,000 - 115,000 | |
| | | | | | Three months ended | | | Nine months ended | | | Guidance | |
| | | | | | Sep. 30, | | | Sep. 30, | | | Sep. 30, | | | Sep. 30, | | | | |
| Unit Operating Costs | | | | | 2018 | | | 2017 | | | 2018 | | | 2017 | | | Annual 2018 | |
| Zinc Plant1 | | C$/lb | | | 0.51 | | | 0.44 | | | 0.50 | | | 0.43 | | | 0.40 - 0.50 | |
1 Zinc unit operating costs include G&A costs.
Production of cast zinc in the third quarter of 2018 was consistent with the same period in 2017 and operating costs per pound of zinc metal produced were 16% higher as a result of higher costs due to a maintenance shutdown during the third quarter of 2018 which was not required in 2017. Operating costs per pound of zinc metal produced year-to-date were 16% higher compared to the same period in 2017 for the same reasons stated above. Refined zinc metal production and zinc plant unit operating costs are expected to be within guidance ranges for 2018.
15
Manitoba Cash Cost and Sustaining Cash Cost
| | | | | | Three months ended | | | Nine months ended | |
| | | | | | Sep. 30, | | | Sep. 30, | | | Sep. 30, | | | Sep. 30, | |
| | | | | | 2018 | | | 2017 | | | 2018 | | | 2017 | |
| Cost per pound of copper produced | | | | | | | | | | | | | | | |
| Cash cost per pound of copper produced, net of by- product credits1 | | $/lb | | | (0.61 | ) | | (0.20 | ) | | (0.58 | ) | | (0.31 | ) |
| Sustaining cash cost per pound of copper produced, net of by-product credits1 | | $/lb | | | 1.23 | | | 0.59 | | | 0.82 | | | 0.42 | |
| | | | | | | | | | | | | | | | |
| Cost per pound of zinc produced | | | | | | | | | | | | | | | |
| Cash cost per pound of zinc produced, net of by- product credits1 | | $/lb | | | 0.38 | | | 0.05 | | | 0.37 | | | 0.18 | |
| Sustaining cash cost per pound of zinc produced, net of by-product credits1 | | $/lb | | | 0.90 | | | 0.25 | | | 0.78 | | | 0.38 | |
| 1 | Cash cost and sustaining cash cost per pound of copper & zinc produced, net of by-product credits, are not recognized under IFRS. For more detail on this non-IFRS financial performance measure, please see the discussion under the "Non-IFRS Financial Performance Measures" section of this MD&A. |
In Manitoba, cash cost per pound of copper produced, net of by-product credits, in the third quarter of 2018 was negative $0.61 per pound of copper produced. These unit costs were lower compared to the same period in 2017, primarily as a result of lower mining and administrative costs, partially offset by lower copper production.
Sustaining cash cost per pound of copper produced, net of by-product credits, in the third quarter of 2018 was $1.23, which is higher than the prior year period as the lower cash cost was more than offset by higher sustaining capital expenditures. Sustaining cash cost per pound of copper produced, increased by $0.40 year-to-date, compared to the same period in 2017, as a result of increased capital development expenditures at Lalor and planned increased sustaining and exploration capital spending.
Cash cost and sustaining cash cost per pound of zinc produced, net of by-product credits, in the third quarter and year-to-date of 2018 were both higher compared to the same periods last year as a result of the same cost factors and capital spending described above, combined with decreased zinc production and lower copper by-product revenue.
16
Metal Sold
| | | | | | Three months ended | | | Nine months ended | |
| | | | | | Sep. 30, | | | Sep. 30, | | | Sep. 30, | | | Sep. 30, | |
| | | | | | 2018 | | | 2017 | | | 2018 | | | 2017 | |
| Payable metal in concentrate | | | | | | | | | | | | | | | |
| Copper | | tonnes | | | 9,376 | | | 11,384 | | | 26,376 | | | 30,001 | |
| Gold | | oz | | | 26,996 | | | 24,526 | | | 74,078 | | | 70,527 | |
| Silver | | oz | | | 338,131 | | | 292,261 | | | 879,909 | | | 817,653 | |
| Zinc | | tonnes | | | 4,659 | | | 3,803 | | | 7,334 | | | 5,563 | |
| | | | | | | | | | | | | | | | |
| Refined zinc | | tonnes | | | 26,310 | | | 24,001 | | | 77,255 | | | 78,496 | |
17
FINANCIAL REVIEW
Financial Results
In the third quarter of 2018, we recorded net profit of $22.8 million compared to net profit of $36.3 million for the same period in 2017, a decrease in profit of $13.5 million.
Year-to-date in 2018, we recorded net profit of $88.9 million compared to net profit of $45.4 million in the same period in 2017, an increase in profit of $43.5 million. The following table provides further details on these variances:
| | | | | | | |
| | | Three months ended | | | Nine months ended | |
| (in $ millions) | | September 30, 2018 | | | September 30, 2018 | |
| Increase (decrease) in components of profit or loss: | | | | | | |
| Revenues | | (17.6 | ) | | 142.6 | |
| Cost of sales | | | | | | |
| Mine operating costs | | (11.2 | ) | | (78.9 | ) |
| Depreciation and amortization | | (5.5 | ) | | (29.4 | ) |
| Net finance expense | | 16.4 | | | 49.4 | |
| Exploration | | (1.9 | ) | | (12.9 | ) |
| Other | | (3.7 | ) | | (11.0 | ) |
| Tax | | 10.0 | | | (16.3 | ) |
| (Decrease) increase in profit in 2018 compared to 2017 | | (13.5 | ) | | 43.5 | |
Revenue
Revenue for the third quarter of 2018 was $362.6 million, $17.6 million lower than the same period in 2017, primarily as a result of lower metal prices for all commodities, and lower copper sales volumes, partially offset by higher precious metals and zinc sales volumes.
Year-to-date revenue was $1,120.6 million, $142.6 million higher than the same period in 2017, due to significantly higher realized sales prices for all commodities and higher sales volumes for all commodities.
18
| | | | | | | |
| | | Three months ended | | | Nine months ended | |
| (in $ millions) | | September 30, 2018 | | | September 30, 2018 | |
| | | | | | | |
| Metals prices1 | | | | | | |
| (Lower) higher copper prices | | (10.4 | ) | | 68.9 | |
| (Lower) higher zinc prices | | (10.0 | ) | | 21.5 | |
| (Lower) higher gold prices | | (6.3 | ) | | 2.6 | |
| (Lower) higher silver prices | | (0.3 | ) | | 2.0 | |
| Sales volumes | | | | | | |
| (Lower) higher copper sales volumes | | (12.9 | ) | | 27.6 | |
| Higher zinc sales volumes | | 9.6 | | | 1.5 | |
| Higher gold sales volumes | | 5.1 | | | 9.9 | |
| Higher silver sales volumes | | 3.3 | | | 6.1 | |
| Other | | | | | | |
| Higher (lower) derivative mark-to-market gains | | 0.5 | | | (1.0 | ) |
| Other volume and pricing differences | | 1.8 | | | 3.0 | |
| Effect of lower treatment and refining charges | | 2.0 | | | 0.5 | |
| | | | | | | |
| (Decrease) increase in revenue in 2018 compared to 2017 | | (17.6 | ) | | 142.6 | |
1 See discussion below for further information regarding metals prices.
Our revenue by significant product type is summarized below:
| | | Three months ended | | | Nine months ended | |
| | | Sep. 30, | | | Sep. 30, | | | Sep. 30, | | | Sep. 30, | |
| (in $ millions) | | 2018 | | | 2017 | | | 2018 | | | 2017 | |
| Copper | | 237.6 | | | 264.0 | | | 737.2 | | | 646.1 | |
| Zinc | | 86.7 | | | 82.2 | | | 270.9 | | | 241.3 | |
| Gold | | 37.4 | | | 34.1 | | | 115.6 | | | 103.0 | |
| Silver | | 23.2 | | | 18.9 | | | 64.4 | | | 56.0 | |
| Other | | 6.6 | | | 4.3 | | | 12.4 | | | 11.6 | |
| Gross revenue | | 391.5 | | | 403.5 | | | 1,200.5 | | | 1,058.0 | |
| Adjustments from initial estimate1 | | (0.8 | ) | | 6.8 | | | (5.4 | ) | | (5.0 | ) |
| Treatment and refining charges | | (28.1 | ) | | (30.1 | ) | | (74.5 | ) | | (75.0 | ) |
| Revenue | | 362.6 | | | 380.2 | | | 1,120.6 | | | 978.0 | |
| 1 | Adjustments from initial estimate represents mark-to-market adjustments on provisionally prices sales, realized and unrealized changes to fair value for non-hedge derivative contracts and adjustments to originally invoiced weights and assays. |
19
Realized sales prices
This measure is intended to enable management and investors to understand the average realized price of metals sold to third parties in each reporting period. The average realized price per unit sold does not have any standardized meaning prescribed by IFRS, is unlikely to be comparable to similar measures presented by other issuers, and should not be considered in isolation or a substitute for measures of performance prepared in accordance with IFRS.
For sales of copper, gold and silver we may enter into non-hedge derivatives (“QP hedges”) which are intended to manage the provisional pricing risk arising from quotational period terms in concentrate sales agreements. The QP hedges are not removed from the calculation of realized prices. We expect that gains and losses on QP hedges will offset provisional pricing adjustments on concentrate sales contracts.
Our realized prices for the third quarter and year-to-date in 2018 and 2017, respectively, are summarized below:
| | | | | | | | | Realized prices1for the | | | | | | Realized prices1for the | |
| | | | | | | | | Three months ended | | | | | | Nine months ended | |
| | | | | | LME QTD | | | Sep. 30, | | | Sep. 30, | | | LME YTD | | | Sep. 30, | | | Sep. 30, | |
| | | | | | 20182 | | | 2018 | | | 20173 | | | 20182 | | | 2018 | | | 20173 | |
| Prices | | | | | | | | | | | | | | | | | | | | | |
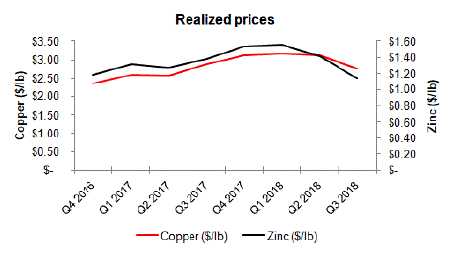
| Copper | | $/lb | | | 2.77 | | | 2.75 | | | 2.88 | | | 3.01 | | | 2.99 | | | 2.70 | |
| Zinc4 | | $/lb | | | 1.15 | | | 1.23 | | | 1.38 | | | 1.37 | | | 1.44 | | | 1.32 | |
| Gold5 | | $/oz | | | | | | 1,169 | | | 1,379 | | | | | | 1,301 | | | 1,305 | |
| Silver5 | | $/oz | | | | | | 24.96 | | | 25.25 | | | | | | 26.63 | | | 25.19 | |
| 1 | Realized prices exclude refining and treatment charges and are on the sale of finished metal or metal in concentrate. Realized prices include the effect of provisional pricing adjustments on prior period sales. |
| 2 | London Metal Exchange average for copper and zinc prices. |
| 3 | Gold and Silver realized prices for 2017 have been restated due to IFRS 15 impacts. Please refer to note 4 of the financial statements for further information. |
| 4 | This amount includes a realized sales price of $1.25 and $1.46 for cast zinc metal and $1.11 and $1.29 for zinc concentrate sold for the three and nine months ended September 30, 2018, respectively. Zinc realized prices include premiums paid by customers for delivery of refined zinc metal, but exclude unrealized gains and losses related to non-hedge derivative contracts that are included in zinc revenues. |
| 5 | Sales of gold and silver from our 777 and Constancia mines are subject to our precious metals stream agreement with Wheaton Precious Metals, pursuant to which we recognize deferred revenue for precious metals deliveries and also receive cash payments. Stream sales are included within realized prices and their respective deferred revenue and cash payment rates can be found on page 22. |
20
The following table provides a reconciliation of average realized price per unit sold, by metal, to revenues as shown in the consolidated financial statements:
| Three months ended September 30, 2018 |
| (in $ millions)1 | | Copper | | | Zinc | | | Gold | | | Silver | | | Other | | | Total | |
| Revenue per financial statements | | 237.6 | | | 86.7 | | | 37.4 | | | 23.2 | | | 6.6 | | | 391.5 | |
| Adjustments from initial estimate2 | | 2.5 | | | (1.8 | ) | | (0.6 | ) | | (1.1 | ) | | 0.2 | | | (0.8 | ) |
| Derivative mark-to-market and other3 | | — | | | (0.8 | ) | | — | | | — | | | — | | | (0.8 | ) |
| Revenue, excluding mark-to-market on non-QP hedges | | 240.1 | | | 84.1 | | | 36.8 | | | 22.1 | | | 6.8 | | | 389.9 | |
| Payable metal in concentrate sold4 | | 39,598 | | | 30,969 | | | 31,482 | | | 886,913 | | | — | | | — | |
| Realized price5,6 | | 6,065 | | | 2,714 | | | 1,169 | | | 24.96 | | | — | | | — | |
| Realized price7 | | 2.75 | | | 1.23 | | | — | | | — | | | — | | | — | |
| Nine months ended September 30, 2018 | |
| (in $ millions)1 | | Copper | | | Zinc | | | Gold | | | Silver | | | Other | | | Total | |
| Revenue per financial statements | | 737.2 | | | 270.9 | | | 115.6 | | | 64.4 | | | 12.4 | | | 1,200.5 | |
| Adjustments from initial estimate2 | | (2.2 | ) | | (3.2 | ) | | (0.5 | ) | | (0.2 | ) | | 0.7 | | | (5.4 | ) |
| Derivative mark-to-market and other3 | | — | | | 1.0 | | | (1.6 | ) | | 1.4 | | | — | | | 0.8 | |
| Revenue, excluding mark-to-market on non-QP hedges | | 735.0 | | | 268.7 | | | 113.5 | | | 65.6 | | | 13.1 | | | 1,195.9 | |
| Payable metal in concentrate sold4 | | 111,573 | | | 84,589 | | | 87,236 | | | 2,462,853 | | | — | | | — | |
| Realized price5,6 | | 6,588 | | | 3,177 | | | 1,301 | | | 26.63 | | | — | | | — | |
| Realized price7 | | 2.99 | | | 1.44 | | | — | | | — | | | — | | | — | |
| Three months ended September 30, 2017 | |
| (in $ millions)1 | | Copper | | | Zinc | | | Gold | | | Silver | | | Other | | | Total | |
| Revenue per financial statements | | 264.0 | | | 82.2 | | | 34.1 | | | 18.9 | | | 4.3 | | | 403.5 | |
| Adjustments from initial estimate2 | | (0.6 | ) | | 2.5 | | | 4.0 | | | 0.2 | | | 0.7 | | | 6.8 | |
| Derivative mark-to-market and other3 | | — | | | (0.3 | ) | | — | | | — | | | — | | | (0.3 | ) |
| Revenue, excluding mark-to-market on non-QP hedges | | 263.4 | | | 84.4 | | | 38.1 | | | 19.1 | | | 5.0 | | | 410.0 | |
| Payable metal in concentrate sold4 | | 41,512 | | | 27,804 | | | 27,629 | | | 757,512 | | | — | | | — | |
| Realized price5,6 | | 6,346 | | | 3,036 | | | 1,379 | | | 25.25 | | | — | | | — | |
| Realized price7 | | 2.88 | | | 1.38 | | | — | | | — | | | — | | | — | |
| Nine months ended September 30, 2017 | |
| (in $ millions)1 | | Copper | | | Zinc | | | Gold | | | Silver | | | Other | | | Total | |
| Revenue per financial statements | | 646.1 | | | 241.3 | | | 103.0 | | | 56.0 | | | 11.6 | | | 1,058.0 | |
| Adjustments from initial estimate2 | | (7.6 | ) | | 3.5 | | | (0.5 | ) | | 0.0 | | | (0.4 | ) | | (5.0 | ) |
| Derivative mark-to-market and other3 | | — | | | (0.2 | ) | | — | | | — | | | — | | | (0.2 | ) |
| Revenue, excluding mark-to-market on non-QP hedges | | 638.5 | | | 244.6 | | | 102.5 | | | 56.0 | | | 11.2 | | | 1,052.8 | |
| Payable metal in concentrate sold4 | | 107,176 | | | 84,059 | | | 78,549 | | | 2,224,783 | | | — | | | — | |
| Realized price5,6 | | 5,957 | | | 2,910 | | | 1,305 | | | 25.19 | | | — | | | — | |
| Realized price7 | | 2.70 | | | 1.32 | | | — | | | — | | | — | | | — | |
1Average realized price per unit sold may not calculate based on amounts presented in this table due to rounding.
2Adjustments from initial estimate not derived from contracts represents mark-to-market adjustments on provisionally priced sales, realized and unrealized changes to fair value for non-hedge derivative contracts and adjustments to originally invoiced weights and assays.
3Derivative mark-to-market excludes mark-to-market on QP hedges.
4Copper and zinc shown in metric tonnes and gold and silver shown in ounces.
5Realized price for copper and zinc in $/metric tonne and realized price for gold and silver in $/oz.
6Gold and Silver realized prices for 2017 have been restated due to IFRS 15 impacts. Please refer to note 4 of the financial statements for information.
7Realized price for copper and zinc in $/lb.
21
The price, quantity and mix of metals sold, affect our revenue, operating cash flow and profit. Revenue from metals sales can vary from quarter to quarter due to production levels, shipping volumes and transfer of risk and title to customers.
Stream Sales
The following table shows stream sales included within realized prices and their respective deferred revenue and cash payment rates:
| | | | | | Three months ended | | | Nine months ended | |
| | | | | | Sep. 30, 2018 | | | Sep. 30, 2018 | |
| | | | | | Manitoba | | | Peru | | | Manitoba | | | Peru | |
| Gold | | oz | | | 5,921 | | | 2,980 | | | 14,864 | | | 8,399 | |
| Silver | | oz | | | 163,444 | | | 566,968 | | | 385,915 | | | 1,551,162 | |
| Gold deferred revenue drawdown rate1 | | $/oz | | | 1,250 | | | 967 | | | 1,268 | | | 967 | |
| Gold cash rate2 | | $/oz | | | 413 | | | 400 | | | 412 | | | 400 | |
| Silver deferred revenue drawdown rate1 | | $/oz | | | 24.38 | | | 21.79 | | | 24.65 | | | 21.79 | |
| Silver cash rate2 | | $/oz | | | 6.12 | | | 5.90 | | | 6.09 | | | 5.90 | |
| | | | | | | | | | | | | | | | |
| | | | | | Three months ended | | | Nine months ended | |
| | | | | | Sep. 30, 2017 | | | Sep. 30, 2017 | |
| | | | | | Manitoba | | | Peru | | | Manitoba | | | Peru | |
| Gold | | oz | | | 5,304 | | | 1,959 | | | 17,911 | | | 6,630 | |
| Silver | | oz | | | 135,301 | | | 443,205 | | | 402,164 | | | 1,385,084 | |
| Gold deferred revenue drawdown rate1 | | $/oz | | | 1,314 | | | 1,013 | | | 1,269 | | | 1,013 | |
| Gold cash rate2 | | $/oz | | | 412 | | | 400 | | | 409 | | | 400 | |
| Silver deferred revenue drawdown rate1 | | $/oz | | | 25.71 | | | 21.53 | | | 24.48 | | | 21.53 | |
| Silver cash rate2 | | $/oz | | | 6.08 | | | 5.90 | | | 6.04 | | | 5.90 | |
| 1 | Deferred revenue amortization is recorded in Manitoba at C$1,635/oz and C$31.88/oz for gold and silver, respectively, and converted to US dollars at the exchange rate in effect at the time of revenue recognition. |
| 2 | The gold and silver cash rate for Manitoba increased by 1% from $400/oz and $5.90/oz effective August 1, 2015. Subsequently every year, on August 1, the cash rate will increase by 1% compounded. The weighted average cash rate is disclosed. |
22
Cost of Sales
Our detailed cost of sales is summarized as follows:
| | | Three months ended | | | Nine months ended | |
| | | Sep. 30, | | | Sep. 30, | | | Sep. 30, | | | Sep. 30, | |
| (in $ thousands) | | 2018 | | | 2017 | | | 2018 | | | 2017 | |
| Peru | | | | | | | | | | | | |
| Mine | | 22,252 | | | 14,225 | | | 69,603 | | | 40,125 | |
| Concentrator | | 35,783 | | | 30,730 | | | 110,426 | | | 98,799 | |
| Changes in product inventory | | (924 | ) | | 7,006 | | | (7,594 | ) | | (8,020 | ) |
| Depreciation and amortization | | 53,383 | | | 48,370 | | | 158,642 | | | 126,131 | |
| G&A | | 11,351 | | | 13,588 | | | 41,301 | | | 39,011 | |
| Freight, royalties and other charges | | 15,639 | | | 13,341 | | | 42,737 | | | 35,895 | |
| Total Peru cost of sales | | 137,484 | | | 127,260 | | | 415,115 | | | 331,941 | |
| Manitoba | | | | | | | | | | | | |
| Mines | | 35,533 | | | 40,320 | | | 122,283 | | | 110,200 | |
| Concentrators | | 13,005 | | | 11,703 | | | 39,172 | | | 36,281 | |
| Zinc plant | | 17,409 | | | 17,312 | | | 54,171 | | | 49,508 | |
| Purchased ore and concentrate (before inventory changes) | | 3,528 | | | 6,457 | | | 20,804 | | | 15,725 | |
| Changes in product inventory | | 14,192 | | | (3,298 | ) | | 8,460 | | | (2,000 | ) |
| Depreciation and amortization | | 32,881 | | | 32,374 | | | 91,782 | | | 94,927 | |
| G&A | | 11,604 | | | 15,076 | | | 36,747 | | | 40,379 | |
| Freight, royalties and other charges | | 11,731 | | | 13,420 | | | 33,545 | | | 36,831 | |
| Total Manitoba cost of sales | | 139,883 | | | 133,364 | | | 406,964 | | | 381,851 | |
| Cost of sales | | 277,367 | | | 260,624 | | | 822,079 | | | 713,792 | |
Total cost of sales for the third quarter of 2018 was $277.4 million, reflecting an increase of $16.7 million from the third quarter of 2017. Cost of sales related to Peru was $10.2 million higher compared to the third quarter of 2017 as a result of higher consumable costs due to higher production and concentrator maintenance. In Manitoba, cost of sales increased by $6.5 million compared to the third quarter of 2017 as a result of inventory drawdowns, offset in part by lower mining costs.
Cost of sales year-to-date in 2018 was $822.1 million, an increase of $108.3 million compared to 2017. The increase is mostly attributable to Peru, which increased by $83.2 million, due mainly to higher spending and depreciation arising from higher mine and mill production rates. Also contributing to the increased costs were the addition of a signing bonus paid in the first quarter of 2018, arising from a new three year collective agreement, costs associated with the move from three to four shifts as per the new collective agreement, and higher consumable costs.
For details on unit operating costs refer to the respective tables in the “Operations Review” section beginning on page 8 of this MD&A.
For the third quarter of 2018, other significant variances in expenses from operations, compared to the same period in 2017, include the following:
| – | Selling and administrative expensesdecreased by $5.1 million compared to the same period in 2017. The decrease was primarily due to lower stock based compensation charges as a result of the revaluation of previously issued shares to lower share prices during the current quarter compared to the same period last year. |
| | |
| – | Exploration expensesincreased by $1.9 million compared to the same period in 2017, reflecting our increased funding for brownfield and grassroots exploration in 2018. |
23
| – | Other operating expensesincreased by $8.9 million compare to the same period in 2017. This increase was due to a recovery of $4.2 million recorded in the third quarter of 2017 for insurance proceeds related to the Constancia grinding line 2 failure in 2015, which resulted in lower operating expenses in the prior period. In addition, there were write-offs of Reed mine related assets during the third quarter of 2018, following mine closure. |
| | |
| – | Finance expensesdecreased by $6.1 million compared to the same period in 2017. The reduction in costs reflects the full repayment of cash borrowings on our senior secured revolving credit facilities over the course of 2017. |
| | |
| – | Other finance gainincreased by $8.6 million compared to the same period in 2017. This increase is due to reduced foreign exchange losses of $5.3 million compared to the same period last year which is a function of fluctuations in the US dollar. In addition, there were increased gains of $2.8 million and $2.0 million arising mainly from a decrease in the fair value of our various financial instruments liabilities subject to fair value accounting and our Hudbay warrants, respectively. Partially offsetting these gains were reduced gains compared to the same period last year for investments in our junior mining portfolio for mark-to-market fair value adjustments of $1.5 million. |
For 2018 year-to-date, other significant variances in expenses from operations, compared to 2017 year-to-date, include the following:
| – | Selling and administrative expensesdecreased by $9.4 million compared to the same period in 2017. The decrease was primarily due to lower stock based compensation charges as a result of the revaluation of previously issued shares to lower share prices during the current year compared to the prior year. |
| | |
| – | Exploration expensesincreased by $12.9 million compared to the same period in 2017, for the same reason stated above. |
| | |
| – | Other operating expenseswere $13.2 million in the first nine months of 2018, an increase of $20.3 million compared to the same period in 2017. This is primarily due to $7.2 million recognized for an obligation to deliver additional precious metal credits to Wheaton as a result of our expectation that mining at the Pampacancha deposit will not begin until 2019. Additionally in the first nine months of 2017, Hudbay recorded a recovery of $12.9 million for insurance proceeds related to the Constancia grinding line 2 failure in 2015. |
| | |
| – | Finance incomeincreased by $3.9 million compared to the same period in 2017 as a result of higher interest earned in the period from comparably higher cash balances versus the same period in 2017. |
| | |
| – | Finance expensesdecreased by $16.3 million compared to the same period in 2017 for the reason stated above. |
| | |
| – | Other finance gainincreased by $29.2 million compared to the same period in 2017. This increase is due to foreign exchange gains of $8.5 million in 2018 year-to-date compared to foreign exchange losses of $14.5 million in 2017 year-to-date, an increase of $23.0 million which is a function of the strengthening US dollar benefiting certain US monetary assets in the Manitoba business unit. In addition, there were increased gains of $7.1 million and $5.0 million arising mainly from a decrease in the fair value of our various financial instruments liabilities subject to fair value accounting and our Hudbay warrants, respectively. Partially offsetting these gains was a loss compared to the same period last year for the investments in our junior mining portfolio for mark-to- market fair value adjustments of $5.9 million. |
Tax Expense (Recovery)
For the three and nine months ended September 30, 2018, tax expense decreased by $10.0 million and increased by $16.3 million, respectively, compared to the same periods in 2017. The following table provides further details:
24
| | | Three months ended | | | Nine months ended | |
| | | Sep. 30, | | | Sep. 30, | | | Sep. 30, | | | Sep. 30, | |
| (in $ thousands) | | 2018 | | | 2017 | | | 2018 | | | 2017 | |
| Deferred tax expense - income tax1 | $ | 3,302 | | $ | 9,185 | | $ | 28,384 | | $ | 25,893 | |
| Deferred tax (recovery) expense - mining tax1 | | (555 | ) | | (665 | ) | | (1,042 | ) | | 274 | |
| Total deferred tax expense | | 2,747 | | | 8,520 | | | 27,342 | | | 26,167 | |
| Current tax expense - income tax | | 2,462 | | | 7,422 | | | 20,123 | | | 10,849 | |
| Current tax expense - mining tax | | 2,270 | | | 1,506 | | | 16,796 | | | 10,897 | |
| Total current tax expense | | 4,732 | | | 8,928 | | | 36,919 | | | 21,746 | |
| | | | | | | | | | | | | |
| Tax expense | $ | 7,479 | | $ | 17,448 | | $ | 64,261 | | $ | 47,913 | |
1Deferred tax expense (recovery) represents our draw down/increase of non-cash deferred income and mining tax assets/liabilities.
Income Tax Expense
Applying the estimated Canadian statutory income tax rate of 27.0% to our income before taxes of $153.2 million for the year-to-date period in 2018 would have resulted in a tax expense of approximately $41.4 million; however, we recorded an income tax expense of $48.5 million. The significant items causing our effective income tax rate to be different than the 27.0% estimated Canadian statutory income tax rate include:
| – | Certain temporary differences with respect to our foreign operations are recorded using an income tax rate other than the Canadian statutory income tax of 27.0%, resulting in an increase in deferred tax expense of $7.3 million; |
| – | Increase in deferred tax expense of approximately $4.3 million since certain Canadian non-monetary assets are recognized at historical cost while the tax bases of the assets change as exchange rates fluctuate, which creates a taxable temporary difference, and; |
| – | Certain foreign exchange gains of $8.6 million are not taxable for local income tax purposes and therefore result in a decrease in deferred tax expense for the year of approximately $2.3 million. |
Mining Tax Expense
Applying the estimated Manitoba mining tax rate of 10.0% to our income before taxes of $153.2 million for the year-to-date period in 2018 would have resulted in a tax expense of approximately $15.3 million and we recorded a mining tax expense of $15.8 million. Effective mining tax rates can vary significantly based on the composition of our earnings and the expected amount of mining taxable profits. Corporate costs and other costs not related to mining operations are not deductible in computing mining profits. A brief description of how mining taxes are calculated in our various business units is discussed below.
Manitoba
The Province of Manitoba imposes mining tax on profit related to the sale of mineral products mined in the Province of Manitoba (mining taxable profit) at the following rates:
| – | 10% of total mining taxable profit if mining profit is C$50 million or less; |
| – | 15% of total mining taxable profit if mining profits are between C$55 million and C$100 million; and |
| – | 17% of total mining taxable profit if mining profits exceed C$105 million. |
We estimate that the tax rate that will be applicable when temporary differences reverse will be approximately 10.0% .
Peru
The Peruvian government imposes two parallel mining tax regimes, the Special Mining Tax and the Modified Royalty, on companies' operating mining income on a sliding scale, with progressive rates ranging from 2.0% to 8.4% and 1.0% to 12.0%, respectively. Based on financial forecasts, we have recorded a deferred tax liability as at September 30, 2018, at the tax rate we expect to apply when temporary differences reverse.
25
LIQUIDITY AND CAPITAL RESOURCES
Senior Secured Revolving Credit Facilities
We have two revolving credit facilities (the “Credit Facilities”) for our Canadian and Peruvian businesses, with combined total availability of $550 million and substantially similar terms and conditions. As at September 30, 2018, between our Credit Facilities we have drawn $131.5 million in letters of credit, leaving total undrawn availability of $418.5 million. As at September 30, 2018, we were in compliance with our covenants under the Credit Facilities.
Financial Condition
Financial Condition as at September 30, 2018 compared to December 31, 2017
Cash and cash equivalents increased by $103.4 million from December 31, 2017 to $459.9 million as at September 30, 2018. This increase was a result of cash generated from operating activities of $342.2 million. These inflows were partly offset by $133.5 million of capital investments primarily at our Peru and Manitoba operations and interest payments of $74.8 million. We hold the majority of our cash and cash equivalents in low-risk, liquid investments with major Canadian and Peruvian financial institutions.
In addition to the increased cash and cash equivalents position, working capital increased by $202.9 million to $454.3 million from December 31, 2017 to September 30, 2018, primarily due to:
| – | Trade and other payables decreased by $47.3 million primarily as a result of the timing of the interest payable on our senior unsecured notes and timing on spending on mine and mill supplies; |
| – | Other liabilities decreased by $19.7 million primarily as a result of lower stock-based compensation and current pension liabilities; |
| – | Deferred revenue liabilities decreased by $15.2 million as a result of timing of sales; |
| – | Other financial liabilities decreased by $16.1 million mainly due to more favourable positions for our derivative and warrant liabilities, and |
| – | Current inventories increased by $4.9 million as stockpile inventories in Peru increased. |
Cash Flows
The following table summarizes our cash flows for the three months and three and nine months ended September 30, 2018 and September 30, 2017:
| | | Three months ended | | | Nine months ended | |
| | | Sep. 30, | | | Sep. 30, | | | Sep. 30, | | | Sep. 30, | |
| (in $ thousands) | | 2018 | | | 2017 | | | 2018 | | | 2017 | |
| Operating cash flow before changes in non-cash working capital | | 122,097 | | | 153,943 | | | 385,524 | | | 358,662 | |
| Change in non-cash working capital | | (8,271 | ) | | 13,954 | | | (43,295 | ) | | 51,481 | |
| Cash generated from operating activities | | 113,826 | | | 167,897 | | | 342,229 | | | 410,143 | |
| Cash (used in) generated by investing activities | | (43,226 | ) | | (69,886 | ) | | (128,374 | ) | | (146,405 | ) |
| Cash (used in) generated by financing activities | | (50,510 | ) | | 77,807 | | | (110,762 | ) | | (83,386 | ) |
| Effect of movement in exchange rates on cash and cash equivalents | | 197 | | | 437 | | | 271 | | | 1,711 | |
| Increase in cash and cash equivalents | | 20,287 | | | 176,255 | | | 103,364 | | | 182,063 | |
Cash Flow from Operating Activities
Cash generated from operating activities was $113.8 million during the third quarter of 2018, a decrease of $54.1 million compared with the same period last year as a result of lower metal prices and movements in non-cash working capital. Operating cash flow before change in non-cash working capital was $122.1 million during the third quarter of 2018, reflecting a decrease of $31.8 million compared to the third quarter of 2017. The decrease in operating cash flow is the result of lower realized prices for all metals, lower sales volumes of copper and higher costs, offset partially by higher sales volumes of precious metals and zinc.
26
Year-to-date cash generated from operating activities was $342.2 million in 2018, a decrease of $67.9 million compared to 2017. Operating cash flow before changes in non-cash working capital was $385.5 million, an increase of $26.9 million compared to 2017. Operating cash flow benefited from higher overall realized metal prices and higher sales volumes for all metals, offset partially by higher costs.
Cash Flow from Investing and Financing Activities
During the third quarter of 2018, we used $93.7 million in investing and financing activities, primarily driven by $46.9 million of capital expenditures and $37.4 million of interest payments on our senior unsecured notes.
Year-to-date, we used $239.1 million of cash in investing and financing activities, primarily driven by $133.5 million of capital expenditures, $74.8 million of interest paid, $16.0 million of financing costs related mainly to our revolving credit facilities and $15.9 million of repayments made for our finance leases.
Capital Expenditures
The following summarizes accrued and cash additions to capital assets for the periods indicated:
| | | Three months ended | | | Nine months ended | | | Guidance | |
| | | Sep. 30, | | | Sep. 30, | | | Sep. 30, | | | Sep. 30, | | | Annual | |
| (in $ millions) | | 2018 | | | 2017 | | | 2018 | | | 2017 | | | 20181 | |
| Manitoba sustaining capital expenditures | | 28.7 | | | 15.7 | | | 72.5 | | | 39.0 | | | 85.0 | |
| Peru sustaining capital expenditures | | 10.0 | | | 40.2 | | | 27.8 | | | 93.6 | | | 50.0 | |
| Total sustaining capital expenditures | | 38.7 | | | 55.9 | | | 100.3 | | | 132.6 | | | 135.0 | |
| Arizona capitalized costs | | 4.2 | | | 4.2 | | | 14.6 | | | 13.5 | | | 35.0 | |
| Peru growth capitalized expenditures2 | | 0.2 | | | 1.1 | | | 2.0 | | | 1.6 | | | — | |
| Manitoba growth capitalized expenditures | | 0.9 | | | 16.9 | | | 17.9 | | | 24.3 | | | 20.0 | |
| Other capitalized costs3 | | (6.9 | ) | | (1.8 | ) | | (4.0 | ) | | 15.3 | | | | |
| Capitalized exploration | | 0.2 | | | 0.0 | | | 1.5 | | | 0.8 | | | 10.0 | |
| Capitalized interest | | 3.3 | | | 3.3 | | | 9.9 | | | 9.9 | | | | |
| Total other capitalized costs | | 1.9 | | | 23.7 | | | 41.9 | | | 65.4 | | | | |
| Total accrued capital additions | | 40.6 | | | 79.6 | | | 142.2 | | | 198.0 | | | | |
| Reconciliation to cash capital additions: | | | | | | | | | | | | | | | |
| Decommissioning and restoration obligation | | 7.2 | | | 8.6 | | | 6.4 | | | (4.4 | ) | | | |
| Capitalized interest | | (3.3 | ) | | (3.3 | ) | | (9.9 | ) | | (9.9 | ) | | | |
| Changes in capital accruals and other | | 2.4 | | | (17.2 | ) | | (5.2 | ) | | (22.0 | ) | | | |
| Total cash capital additions | | 46.9 | | | 67.7 | | | 133.5 | | | 161.7 | | | | |
| 1 | Sustaining capital expenditure guidance excludes capitalized interest. |
| 2 | Initial 2018 guidance for Peru growth capital expenditures was $45.0 million. This included expenditures for developing the Pampacancha deposit and acquiring surface rights from the local community, which is now expected to be deferred to 2019. |
| 3 | Other capitalized costs include decommissioning and restoration adjustments. |
Sustaining capital expenditures in Manitoba for the three and nine months ended September 30, 2018 were $28.7 million and $72.5 million, respectively, an increase of $13.0 million and an increase of $33.5 million, respectively, compared to the same periods in 2017. The increase in Manitoba sustaining capital expenditures compared to the same periods last year is due to increased spending on planned plant and mine equipment and increased exploration capital spending.
Sustaining capital expenditures in Peru for the three and nine months ended September 30, 2018 were $10.0 million and $27.8 million, respectively, a decrease of $30.2 million and a decrease of $65.8 million, respectively, compared to the same periods in 2017 as a result of reduced planned spending on civil works projects as well as reduced capitalized stripping expenditures.
Manitoba growth capital spending was mainly focused on completion of the Lalor paste fill plant.
27
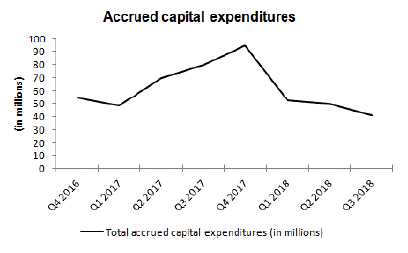
Capital Commitments
As at September 30, 2018, we had outstanding capital commitments in Canada of approximately $11.3 million primarily related to committed long-lead orders for the paste plant, of which approximately $0.9 million cannot be terminated by Hudbay; approximately $89.5 million in Peru related to sustaining capital costs, all of which can be terminated by Hudbay; and approximately $163.2 million in Arizona, primarily related to the Rosemont project and expected to be paid after the commencement of Rosemont construction, of which approximately $79.5 million cannot be terminated by Hudbay.
Contractual Obligations
The following table summarizes our contractual obligations as at September 30, 2018:
| | | | | | Less than | | | 13 - 36 | | | 37 - 60 | | | More than | |
| Payment Schedule (in $ millions) | | Total | | | 12 months | | | months | | | months | | | 60 months | |
| Long-term debt obligations1 | | 1,447.3 | | | 79.5 | | | 159.0 | | | 540.2 | | | 668.6 | |
| Capital lease obligations | | 83.2 | | | 22.2 | | | 41.3 | | | 19.7 | | | — | |
| Operating lease obligations | | 25.7 | | | 14.4 | | | 7.7 | | | 1.5 | | | 2.1 | |
| Purchase obligation - capital commitments | | 263.9 | | | 59.7 | | | 61.7 | | | 13.2 | | | 129.3 | |
| Purchase obligation - other commitments2 | | 581.4 | | | 188.1 | | | 198.0 | | | 110.4 | | | 84.9 | |
| Pension and other employee future benefits obligations | | 127.2 | | | 16.0 | | | 18.8 | | | 7.2 | | | 85.2 | |
| Decommissioning and restoration obligations3 | | 201.9 | | | 1.4 | | | 0.9 | | | 7.3 | | | 192.3 | |
| 1 | Long-term debt obligations include scheduled interest payments. |
| 2 | Primarily made up of long-term agreements with operational suppliers, obligations for power purchase, concentrate handling, fleet and port services. |
| 3 | Before inflation. |
28
Liquidity
As at September 30, 2018, we had total liquidity of approximately $878.4 million, including $459.9 million in cash and cash equivalents, as well as $418.5 million in availability under our Credit Facilities. We expect that our current liquidity and future cash flows will be sufficient to meet our obligations in the coming year.
Outstanding Share Data
As of October 30, 2018, there were 261,272,151 common shares of Hudbay issued and outstanding. The outstanding warrants to acquire an aggregate of 22,391,490 common shares of Hudbay expired on July 20, 2018.
TREND ANALYSIS AND QUARTERLY REVIEW
The following table sets forth selected consolidated financial information for each of our eight most recently completed quarters:
| | | | | | | | | | | | | | | 2017 | | | | | | 2016 | |
| | | | | | 2018 | | | | | | | | | (Restated) | | | | | | (Restated) | |
| (in $ millions) | | Q3 | | | Q2 | | | Q1 | | | Q4 | | | Q3 | | | Q2 | | | Q1 | | | Q4 | |
| Revenue | | 362.6 | | | 371.3 | | | 386.7 | | | 424.4 | | | 380.2 | | | 336.0 | | | 261.8 | | | 330.6 | |
| Gross margin | | 85.3 | | | 92.5 | | | 120.8 | | | 145.0 | | | 119.6 | | | 88.0 | | | 56.6 | | | 91.1 | |
| Profit (loss) before tax | | 30.3 | | | 49.8 | | | 73.1 | | | 79.6 | | | 53.8 | | | 34.9 | | | 4.6 | | | (31.9 | ) |
| Profit (loss) | | 22.8 | | | 24.7 | | | 41.4 | | | 94.3 | | | 36.3 | | | 19.1 | | | (10.0 | ) | | (52.6 | ) |
| Earnings (loss) per share: | | | | | | | | | | | | | | | | | | | | | | | | |
| Basic and Diluted | | 0.09 | | | 0.09 | | | 0.16 | | | 0.36 | | | 0.15 | | | 0.08 | | | (0.04 | ) | | (0.22 | ) |
| Operating cash flow1 | | 122.1 | | | 131.6 | | | 131.8 | | | 171.9 | | | 153.9 | | | 124.1 | | | 80.6 | | | 122.0 | |
| 1 | Operating cash flow before changes in non-cash working capital |
Revenue and operating cash flow have been relatively consistent in the first three quarters of 2018, following strong production and sales volumes in the fourth quarter of 2017.
For information on previous trends and quarterly reviews, refer to our MD&A dated February 21, 2018.
29
NON-IFRS FINANCIAL PERFORMANCE MEASURES
Net debt is shown because it is a performance measure used by the Company to assess our financial position. Cash cost, sustaining and all-in sustaining cash cost per pound of copper produced are shown because we believe they help investors and management assess the performance of our operations, including the margin generated by the operations and the Company. Cash cost and sustaining cash cost per pound of zinc produced are shown because we believe they help investors and management assess the performance of our Manitoba operations. These measures do not have a meaning prescribed by IFRS and are therefore unlikely to be comparable to similar measures presented by other issuers. These measures should not be considered in isolation or as a substitute for measures prepared in accordance with IFRS and are not necessarily indicative of operating profit or cash flow from operations as determined under IFRS. Other companies may calculate these measures differently.
Net Debt
The following table presents our calculation of net debt as at September 30, 2018 and December 31, 2017:
| | | | | | | |
| | | Sep. 30, | | | Dec. 31, | |
| (in $ thousands) | | 2018 | | | 2017 | |
| Total long-term debt | | 976,252 | | | 979,575 | |
| Cash and cash equivalents | | (459,863 | ) | | (356,499 | ) |
| Net debt | | 516,389 | | | 623,076 | |
Cash Cost, Sustaining and All-in Sustaining Cash Cost (Copper Basis)
Cash cost per pound of copper produced (“cash cost”) is a non-IFRS measure that management uses as a key performance indicator to assess the performance of our operations. Our calculation designates copper as our primary metal of production as it has been the largest component of revenues. The calculation is presented in four manners:
| – | Cash cost, before by-product credits- This measure is gross of by-product revenues and is a function of the efforts and costs incurred to mine and process all ore mined. However, the measure divides this aggregate cost over only pounds of copper produced, our primary metal of production. This measure is generally less volatile from period to period, as it is not affected by changes in the price received for by-product metals. It is, however, significantly affected by the relative mix of copper concentrate and finished zinc production, where the sale of the zinc will occur later, and an increase in production of zinc metal will tend to result in an increase in cash cost under this measure. |
| – | Cash cost, net of by-product credits- In order to calculate the net cost to produce and sell copper, the net of by-product credits measure subtracts the revenues realized from the sale of the metals other than copper. The by-product revenues from zinc, gold, and silver are significant and are integral to the economics of our operations. The economics that support our decision to produce and sell copper would be different if we did not receive revenues from the other significant metals being extracted and processed. This measure provides management and investors with an indication of the minimum copper price consistent with positive operating cash flow and operating margins, assuming realized by-product metal prices are consistent with those prevailing during the reporting period. It also serves as an important operating statistic that management and investors utilize to measure our operating performance versus that of our competitors. However, it is important to understand that if by-product metal prices decline alongside copper prices, the cash cost net of by-product credits would increase, requiring a higher copper price than that reported to maintain positive cash flows and operating margins. |
| – | Sustaining cash cost, net of by-product credits- This measure is an extension of cash cost that includes sustaining capital expenditures, capitalized exploration and net smelter returns royalties. It does not include corporate selling and administrative expenses. It provides a more fulsome measurement of the cost of sustaining production than cash cost, which is focused on operating costs only. |
30
| – | All-in sustaining cash cost, net of by-product credits- This measure is an extension of sustaining cash cost that includes corporate G&A. Due to the inclusion of corporate selling and administrative expenses, all-in sustaining cash cost is presented on a consolidated basis only. |
The tables below present a detailed build-up of cash cost and sustaining cash cost, net of by-product credits, by business unit in addition to consolidated all-in sustaining cash cost, net of by-product credits, and reconciliations between cash cost, net of by-product credits, to the most comparable IFRS measures of cost of sales for the three and nine months ended September 30, 2018 and 2017. Cash cost, net of by-product credits may not calculate exactly based on amounts presented in the tables below due to rounding.
| Consolidated | | Three months ended | | | Nine months ended | |
| Net pounds of copper produced | | | | | | | | | | | | |
| (in thousands) | | Sep. 30, 2018 | | | Sep. 30, 2017 | | | Sep. 30, 2018 | | | Sep. 30, 2017 | |
| Peru | | 72,699 | | | 68,201 | | | 201,380 | | | 193,884 | |
| Manitoba | | 16,548 | | | 20,964 | | | 57,250 | | | 61,890 | |
| Net pounds of copper produced | | 89,247 | | | 89,165 | | | 258,630 | | | 255,774 | |
| Consolidated | | Three months ended | | | Nine months ended | |
| | | Sep. 30, 2018 | | | Sep. 30, 2017 | | | Sep. 30, 2018 | | | Sep. 30, 2017 | |
| Cash cost per pound ofcopper produced | | $000s | | | $/lb | | | $000s | | | $/lb | | | $000s | | | $/lb | | | $000s | | | $/lb | |
| Cash cost, before by- product credits | | 202,622 | | | 2.27 | | | 201,747 | | | 2.26 | | | 633,418 | | | 2.45 | | | 566,344 | | | 2.21 | |
| By-product credits, net of deferred revenue | | (123,980 | ) | | (1.39 | ) | | (124,892 | ) | | (1.40 | ) | | (389,993 | ) | | (1.51 | ) | | (345,415 | ) | | (1.35 | ) |
| Cash cost, net of by-product credits | | 78,642 | | | 0.88 | | | 76,855 | | | 0.86 | | | 243,425 | | | 0.94 | | | 220,929 | | | 0.86 | |
31
| Consolidated | | Three months ended | | | Nine months ended | |
| | | Sep. 30, 2018 | | | Sep. 30, 2017 | | | Sep. 30, 2018 | | | Sep. 30, 2017 | |
| Supplementary cash costinformation | | $000s | | | $/lb1 | | | $000s | | | $/lb1 | | | $000s | | | $/lb1 | | | $000s | | | $/lb1 | |
| By-product credits: | | | | | | | | | | | | | | | | | | | | | | | | |
| Zinc | | 84,838 | | | 0.95 | | | 84,700 | | | 0.95 | | | 267,707 | | | 1.04 | | | 244,804 | | | 0.96 | |
| Gold | | 36,810 | | | 0.41 | | | 38,091 | | | 0.43 | | | 115,055 | | | 0.44 | | | 102,490 | | | 0.40 | |
| Silver | | 22,139 | | | 0.25 | | | 19,130 | | | 0.21 | | | 64,184 | | | 0.25 | | | 56,036 | | | 0.22 | |
| Other | | 6,817 | | | 0.08 | | | 4,946 | | | 0.06 | | | 13,169 | | | 0.05 | | | 11,196 | | | 0.04 | |
| Total by-product credits | | 150,604 | | | 1.69 | | | 146,867 | | | 1.65 | | | 460,115 | | | 1.78 | | | 414,526 | | | 1.62 | |
| Less: deferred revenue | | (26,624 | ) | | (0.30 | ) | | (21,975 | ) | | (0.25 | ) | | (70,122 | ) | | (0.27 | ) | | (69,111 | ) | | (0.27 | ) |
| Total by-product credits, net of deferred revenue | | 123,980 | | | 1.39 | | | 124,892 | | | 1.40 | | | 389,993 | | | 1.51 | | | 345,415 | | | 1.35 | |
| Reconciliation to IFRS: | | | | | | | | | | | | | | | | | | | | | | | | |
| Cash cost, net of by- product credits | | 78,642 | | | | | | 76,855 | | | | | | 243,425 | | | | | | 220,929 | | | | |
| By-product credits | | 150,604 | | | | | | 146,867 | | | | | | 460,115 | | | | | | 414,526 | | | | |
| Change in deferred revenues | | (26,624 | ) | | | | | (21,975 | ) | | | | | (70,122 | ) | | | | | (69,111 | ) | | | |
| Treatment and refining charges | | (28,126 | ) | | | | | (30,132 | ) | | | | | (74,557 | ) | | | | | (75,023 | ) | | | |
| Share-based payment | | 50 | | | | | | 635 | | | | | | (20 | ) | | | | | 1,233 | | | | |
| Inventory adjustments | | (54 | ) | | | | | (227 | ) | | | | | (202 | ) | | | | | (1,503 | ) | | | |
| Change in product inventory | | 13,268 | | | | | | 3,708 | | | | | | 866 | | | | | | (10,020 | ) | | | |
| Royalties | | 3,343 | | | | | | 4,149 | | | | | | 12,150 | | | | | | 11,703 | | | | |
| Depreciation and amortization2 | | 86,264 | | | | | | 80,744 | | | | | | 250,424 | | | | | | 221,058 | | | | |
| Cost of sales | | 277,367 | | | | | | 260,624 | | | | | | 822,079 | | | | | | 713,792 | | | | |
| 1 | Per pound of copper produced. |
| 2 | Depreciation is based on concentrate sold. |
| Peru | | Three months ended | | | Nine months ended | |
| (in thousands) | | Sep. 30, 2018 | | | Sep. 30, 2017 | | | Sep. 30, 2018 | | | Sep. 30, 2017 | |
| Net pounds of copper produced1 | | 72,699 | | | 68,201 | | | 201,380 | | | 193,884 | |
| 1 | Contained copper in concentrate. |
32
| Peru | | Three months ended | | | Nine months ended | |
| | | Sep. 30, 2018 | | | Sep. 30, 2017 | | | Sep. 30, 2018 | | | Sep. 30, 2017 | |
| Cash cost per pound ofcopper produced | | $000s | | | $/lb | | | $000s | | | $/lb | | | $000s | | | $/lb | | | $000s | | | $/lb | |
| Mining | | 22,252 | | | 0.31 | | | 14,225 | | | 0.21 | | | 69,603 | | | 0.35 | | | 40,125 | | | 0.21 | |
| Milling | | 35,783 | | | 0.49 | | | 30,730 | | | 0.45 | | | 110,426 | | | 0.55 | | | 98,799 | | | 0.51 | |
| G&A | | 11,391 | | | 0.16 | | | 13,707 | | | 0.20 | | | 41,497 | | | 0.21 | | | 40,220 | | | 0.21 | |
| Onsite costs | | 69,426 | | | 0.95 | | | 58,662 | | | 0.86 | | | 221,526 | | | 1.10 | | | 179,144 | | | 0.92 | |
| Treatment & refining | | 17,885 | | | 0.25 | | | 18,340 | | | 0.27 | | | 46,887 | | | 0.23 | | | 45,962 | | | 0.24 | |
| Freight & other | | 13,726 | | | 0.19 | | | 11,890 | | | 0.17 | | | 36,921 | | | 0.18 | | | 31,878 | | | 0.16 | |
| Cash cost, before by- product credits | | 101,037 | | | 1.39 | | | 88,892 | | | 1.30 | | | 305,334 | | | 1.52 | | | 256,984 | | | 1.33 | |
| By-product credits, net of deferred revenue | | (12,341 | ) | | (0.17 | ) | | (7,870 | ) | | (0.12 | ) | | (28,418 | ) | | (0.14 | ) | | (16,595 | ) | | (0.09 | ) |
| Cash cost, net of by-product credits | | 88,696 | | | 1.22 | | | 81,022 | | | 1.19 | | | 276,916 | | | 1.38 | | | 240,389 | | | 1.24 | |
| Peru | | Three months ended | | | Nine months ended | |
| | | Sep. 30, 2018 | | | Sep. 30, 2017 | | | Sep. 30, 2018 | | | Sep. 30, 2017 | |
| Supplementary cashcost information | | $000s | | | $/lb1 | | | $000s | | | $/lb1 | | | $000s | | | $/lb1 | | | $000s | | | $/lb1 | |
| By-product credits: | | | | | | | | | | | | | | | | | | | | | | | | |
| Gold | | 5,911 | | | 0.08 | | | 3,534 | | | 0.05 | | | 15,568 | | | 0.08 | | | 8,059 | | | 0.04 | |
| Silver | | 15,772 | | | 0.22 | | | 12,250 | | | 0.18 | | | 44,818 | | | 0.22 | | | 37,583 | | | 0.19 | |
| Other | | 5,895 | | | 0.08 | | | 3,612 | | | 0.05 | | | 9,801 | | | 0.05 | | | 7,488 | | | 0.04 | |
| Total by-product credits | | 27,578 | | | 0.38 | | | 19,396 | | | 0.28 | | | 70,187 | | | 0.35 | | | 53,130 | | | 0.27 | |
| Less: deferred revenue | | (15,237 | ) | | (0.21 | ) | | (11,526 | ) | | (0.17 | ) | | (41,769 | ) | | (0.21 | ) | | (36,535 | ) | | (0.19 | ) |
| | | | | | | | | | | | | | | | | | | | | | | | | |
| Total by-product credits, net of deferred revenue | | 12,341 | | | 0.17 | | | 7,870 | | | 0.12 | | | 28,418 | | | 0.14 | | | 16,595 | | | 0.09 | |
| Reconciliation to IFRS: | | | | | | | | | | | | | | | | | | | | | | | | |
| Cash cost, net of by- product credits | | 88,696 | | | | | | 81,022 | | | | | | 276,916 | | | | | | 240,389 | | | | |
| By-product credits | | 27,578 | | | | | | 19,396 | | | | | | 70,187 | | | | | | 53,130 | | | | |
| Change in deferred revenues | | (15,237 | ) | | | | | (11,526 | ) | | | | | (41,769 | ) | | | | | (36,535 | ) | | | |
| Treatment and refining charges | | (17,885 | ) | | | | | (18,340 | ) | | | | | (46,887 | ) | | | | | (45,962 | ) | | | |
| Inventory adjustments | | (54 | ) | | | | | (227 | ) | | | | | (202 | ) | | | | | (1,503 | ) | | | |
| Share-based payment | | 14 | | | | | | 108 | | | | | | 6 | | | | | | 294 | | | | |
| Change in product inventory | | (924 | ) | | | | | 7,006 | | | | | | (7,594 | ) | | | | | (8,020 | ) | | | |
| Royalties | | 1,913 | | | | | | 1,451 | | | | | | 5,816 | | | | | | 4,017 | | | | |
| Depreciation and amortization2 | | 53,383 | | | | | | 48,370 | | | | | | 158,642 | | | | | | 126,131 | | | | |
| Cost of sales | | 137,484 | | | | | | 127,260 | | | | | | 415,115 | | | | | | 331,941 | | | | |
| 1 | Per pound of copper produced. |
| 2 | Depreciation is based on concentrate sold. |
33
| Manitoba | | Three months ended | | | Nine months ended | |
| (in thousands) | | Sep. 30, 2018 | | | Sep. 30, 2017 | | | Sep. 30, 2018 | | | Sep. 30, 2017 | |
| Net pounds of copperproduced1 | | 16,548 | | | 20,964 | | | 57,250 | | | 61,890 | |
| 1 | Contained copper in concentrate. |
| Manitoba | | Three months ended | | | Nine months ended | |
| | | Sep. 30, 2018 | | | Sep. 30, 2017 | | | Sep. 30, 2018 | | | Sep. 30, 2017 | |
| Cash cost per pound ofcopper produced | | $000s | | | $/lb | | | $000s | | | $/lb | | | $000s | | | $/lb | | | $000s | | | $/lb | |
| Mining | | 35,533 | | | 2.15 | | | 40,320 | | | 1.92 | | | 122,283 | | | 2.14 | | | 110,200 | | | 1.78 | |
| Milling | | 13,005 | | | 0.79 | | | 11,703 | | | 0.56 | | | 39,172 | | | 0.68 | | | 36,281 | | | 0.59 | |
| Refining (zinc) | | 17,409 | | | 1.05 | | | 17,312 | | | 0.83 | | | 54,171 | | | 0.95 | | | 49,508 | | | 0.80 | |
| G&A | | 11,568 | | | 0.70 | | | 14,549 | | | 0.69 | | | 36,773 | | | 0.64 | | | 39,440 | | | 0.64 | |
| Purchased ore and zinc concentrates | | 3,528 | | | 0.21 | | | 6,457 | | | 0.31 | | | 20,804 | | | 0.36 | | | 15,725 | | | 0.25 | |
| Onsite costs | | 81,043 | | | 4.90 | | | 90,341 | | | 4.31 | | | 273,203 | | | 4.77 | | | 251,154 | | | 4.06 | |
| Treatment & refining | | 10,241 | | | 0.62 | | | 11,792 | | | 0.56 | | | 27,670 | | | 0.48 | | | 29,061 | | | 0.47 | |
| Freight & other | | 10,301 | | | 0.62 | | | 10,722 | | | 0.51 | | | 27,211 | | | 0.48 | | | 29,145 | | | 0.47 | |
| Cash cost, before by- product credits | | 101,585 | | | 6.14 | | | 112,855 | | | 5.38 | | | 328,084 | | | 5.73 | | | 309,360 | | | 5.00 | |
| By-product credits, net of deferred revenue | | (111,639 | ) | | (6.75 | ) | | (117,022 | ) | | (5.58 | ) | | (361,575 | ) | | (6.32 | ) | | (328,820 | ) | | (5.31 | ) |
| Cash cost, net of by-product credits | | (10,054 | ) | | (0.61 | ) | | (4,167 | ) | | (0.20 | ) | | (33,491 | ) | | (0.58 | ) | | (19,460 | ) | | (0.31 | ) |
34
| Manitoba | | Three months ended | | | Nine months ended | |
| | | Sep. 30, 2018 | | | Sep. 30, 2017 | | | Sep. 30, 2018 | | | Sep. 30, 2017 | |
| Supplementary cashcost information | | $000s | | | $/lb1 | | | $000s | | | $/lb1 | | | $000s | | | $/lb1 | | | $000s | | | $/lb1 | |
| By-product credits: | | | | | | | | | | | | | | | | | | | | | | | | |
| Zinc | | 84,838 | | | 5.13 | | | 84,700 | | | 4.04 | | | 267,707 | | | 4.68 | | | 244,804 | | | 3.96 | |
| Gold | | 30,899 | | | 1.87 | | | 34,557 | | | 1.65 | | | 99,487 | | | 1.74 | | | 94,431 | | | 1.53 | |
| Silver | | 6,367 | | | 0.38 | | | 6,880 | | | 0.33 | | | 19,366 | | | 0.34 | | | 18,453 | | | 0.30 | |
| Other | | 922 | | | 0.06 | | | 1,334 | | | 0.06 | | | 3,368 | | | 0.06 | | | 3,708 | | | 0.06 | |
| Total by-product credits | | 123,026 | | | 7.43 | | | 127,471 | | | 6.08 | | | 389,928 | | | 6.81 | | | 361,396 | | | 5.84 | |
| Less: deferred revenue | | (11,387 | ) | | (0.69 | ) | | (10,449 | ) | | (0.50 | ) | | (28,353 | ) | | (0.50 | ) | | (32,576 | ) | | (0.53 | ) |
| Total by-product credits, net of deferred revenue | | 111,639 | | | 6.75 | | | 117,022 | | | 5.58 | | | 361,575 | | | 6.32 | | | 328,820 | | | 5.31 | |
| Reconciliation to IFRS: | | | | | | | | | | | | | | | | | | | | | | | | |
| Cash cost, net of by- product credits | | (10,054 | ) | | | | | (4,167 | ) | | | | | (33,491 | ) | | | | | (19,460 | ) | | | |
| By-product credits | | 123,026 | | | | | | 127,471 | | | | | | 389,928 | | | | | | 361,396 | | | | |
| Change in deferred revenues | | (11,387 | ) | | | | | (10,449 | ) | | | | | (28,353 | ) | | | | | (32,576 | ) | | | |
| Treatment and refining charges | | (10,241 | ) | | | | | (11,792 | ) | | | | | (27,670 | ) | | | | | (29,061 | ) | | | |
| Share-based payment | | 36 | | | | | | 527 | | | | | | (26 | ) | | | | | 939 | | | | |
| Change in product inventory | | 14,192 | | | | | | (3,298 | ) | | | | | 8,460 | | | | | | (2,000 | ) | | | |
| Royalties | | 1,430 | | | | | | 2,698 | | | | | | 6,334 | | | | | | 7,686 | | | | |
| Depreciation and amortization2 | | 32,881 | | | | | | 32,374 | | | | | | 91,782 | | | | | | 94,927 | | | | |
| Cost of sales | | 139,883 | | | | | | 133,364 | | | | | | 406,964 | | | | | | 381,851 | | | | |
| 1 | Per pound of copper produced. |
| 2 | Depreciation is based on concentrate sold. |
35
| Consolidated | | Three months ended | | | Nine months ended | |
| | | Sep. 30, 2018 | | | Sep. 30, 2017 | | | Sep. 30, 2018 | | | Sep. 30, 2017 | |
| | | | | | | | | | | | | | | | | | | | | | | | | |
| All-in sustaining cash cost perpound of copper produced | | $000s | | | $/lb | | | $000s | | | $/lb | | | $000s | | | $/lb | | $ | $000s | | | $/lb | |
| Cash cost, net of by-product credits | | 78,642 | | | 0.88 | | | 76,855 | | | 0.86 | | | 243,425 | | | 0.94 | | | 220,929 | | | 0.86 | |
| Sustaining capital expenditures | | 38,728 | | | 0.43 | | | 53,999 | | | 0.61 | | | 100,273 | | | 0.39 | | | 130,719 | | | 0.51 | |
| Capitalized exploration | | 244 | | | — | | | (9 | ) | | 0.00 | | | 1,524 | | | 0.01 | | | 833 | | | 0.00 | |
| Royalties | | 3,343 | | | 0.04 | | | 4,149 | | | 0.05 | | | 12,150 | | | 0.05 | | | 11,703 | | | 0.05 | |
| Sustaining cash cost, net of by-product credits | | 120,957 | | | 1.36 | | | 134,994 | | | 1.51 | | | 357,373 | | | 1.38 | | | 364,184 | | | 1.42 | |
| Corporate selling and administrative expenses | | 6,786 | | | 0.07 | | | 11,252 | | | 0.13 | | | 18,605 | | | 0.07 | | | 27,384 | | | 0.11 | |
| All-in sustaining cash cost, net ofby-product credits | | 127,743 | | | 1.43 | | | 146,246 | | | 1.64 | | | 375,978 | | | 1.45 | | | 391,568 | | | 1.53 | |
| Peru | | Three months ended | | | Nine months ended | |
| | | Sep. 30, 2018 | | | Sep. 30, 2017 | | | Sep. 30, 2018 | | | Sep. 30, 2017 | |
| Sustaining cash cost per poundof copper produced | | $000s | | | $/lb | | | $000s | | | $/lb | | | $000s | | $ | $/lb | | | $000s | | | $/lb | |
| Cash cost, net of by-product credits | | 88,696 | | | 1.22 | | | 81,022 | | | 1.19 | | | 276,916 | | | 1.38 | | | 240,389 | | | 1.24 | |
| Sustaining capital expenditures | | 9,969 | | | 0.14 | | | 40,255 | | | 0.59 | | | 27,758 | | | 0.14 | | | 93,603 | | | 0.48 | |
| Royalties | | 1,913 | | | 0.03 | | | 1,451 | | | 0.02 | | | 5,816 | | | 0.03 | | | 4,017 | | | 0.02 | |
| Sustaining cash cost per poundof copper produced | | 100,578 | | | 1.38 | | | 122,728 | | | 1.80 | | | 310,490 | | | 1.54 | | | 338,009 | | | 1.74 | |
| Manitoba | | Three months ended | | | Nine months ended | |
| | | Sep. 30, 2018 | | | Sep. 30, 2017 | | | Sep. 30, 2018 | | | Sep. 30, 2017 | |
| Sustaining cash cost per poundof copper produced | | $000s | | | $/lb | | | $000s | | | $/lb | | | $000s | | | $/lb | | | $000s | | | $/lb | |
| Cash cost, net of by-product credits | | (10,054 | ) | | (0.61 | ) | | (4,167 | ) | | (0.20 | ) | | (33,491 | ) | | (0.58 | ) | | (19,460 | ) | | (0.31 | ) |
| Sustaining capital expenditures | | 28,759 | | | 1.74 | | | 13,744 | | | 0.66 | | | 72,515 | | | 1.27 | | | 37,116 | | | 0.60 | |
| Capitalized exploration | | 244 | | | 0.01 | | | (9 | ) | | 0.00 | | | 1,524 | | | 0.03 | | | 833 | | | 0.01 | |
| Royalties | | 1,430 | | | 0.09 | | | 2,698 | | | 0.13 | | | 6,334 | | | 0.11 | | | 7,686 | | | 0.12 | |
| Sustaining cash cost per poundof copper produced | | 20,379 | | | 1.23 | | | 12,266 | | | 0.59 | | | 46,882 | | | 0.82 | | | 26,175 | | | 0.42 | |
36
Zinc Cash Cost and Zinc Sustaining Cash Cost
Cash cost per pound of zinc produced (“zinc cash cost”) is a non-IFRS measure that management uses as a key performance indicator to assess the performance of our Manitoba operations. This alternative cash cost calculation designates zinc as our primary metal of production as it is becoming the largest component of revenues for our Manitoba business unit, and should therefore be less volatile over time than Manitoba cash cost per pound of copper. The calculation is presented in three manners:
| – | Zinc cash cost, before by-product credits- This measure is gross of by-product revenues and is a function of the efforts and costs incurred to mine and process all ore mined. However, the measure divides this aggregate cost over only pounds of zinc produced, our primary metal of production. This measure is generally less volatile from period to period, as it is not affected by changes in the price received for by-product metals. It is, however, significantly affected by the relative mix of copper concentrate and finished zinc production, where the sale of the copper will occur later, and an increase in production of copper metal will tend to result in an increase in zinc cash cost under this measure. |
| | |
| – | Zinc cash cost, net of by-product credits- In order to calculate the net cost to produce and sell zinc, the net of by-product credits measure subtracts the revenues realized from the sale of the metals other than zinc. The by-product revenues from copper, gold, and silver are significant and are integral to the economics of our Manitoba operation. The economics that support our decision to produce and sell zinc would be different if we did not receive revenues from the other significant metals being extracted and processed. This measure provides management and investors with an indication of the minimum zinc price consistent with positive operating cash flow and operating margins, assuming realized by-product metal prices are consistent with those prevailing during the reporting period. It also serves as an important operating statistic that management and investors utilize to measure our operating performance at Manitoba operation versus that of our competitors. However, it is important to understand that if by-product metal prices decline alongside zinc prices, the zinc cash cost net of by-product credits would increase, requiring a higher zinc price than that reported to maintain positive cash flows and operating margins. |
| | |
| – | Zinc sustaining cash cost, net of by-product credits- This measure is an extension of zinc cash cost that includes sustaining capital expenditures, capitalized exploration and net smelter returns royalties. It does not include corporate selling and administrative expenses. It provides a more fulsome measurement of the cost of sustaining production than zinc cash cost, which is focused on operating costs only. |
The tables below present a detailed build-up of zinc cash cost and zinc sustaining cash cost, net of by-product credits, for the Manitoba business unit, and reconciliations between zinc cash cost, net of by-product credits, to the most comparable IFRS measures of cost of sales for the three and nine months ended September 30, 2018 and 2017. Zinc cash cost, net of by-product credits, may not calculate exactly based on amounts presented in the tables below due to rounding.
| Manitoba | | Three months ended | | | Nine months ended | |
| | | Sep. 30, | | | Sep. 30, | | | Sep. 30, | | | Sep. 30, | |
| (in thousands) | | 2018 | | | 2017 | | | 2018 | | | 2017 | |
| Net pounds of zinc produced1 | | 57,823 | | | 80,766 | | | 194,403 | | | 225,094 | |
| 1 | Contained zinc in concentrate. |
| Manitoba | | Three months ended | | | Nine months ended | |
| | | Sep. 30, 2018 | | | Sep. 30, 2017 | | | Sep. 30, 2018 | | | Sep. 30, 2017 | |
| Cash cost per poundof zinc produced | | $000s | | | $/lb | | $ | $000s | | | $/lb | | | $000s | | | $/lb | | | $000s | | | $/lb | |
| Cash cost, before by- product credits1 | | 101,585 | | | 1.76 | | | 112,855 | | | 1.40 | | | 328,084 | | | 1.69 | | | 309,360 | | | 1.37 | |
| By-product credits | | (79,890 | ) | | (1.38 | ) | | (108,885 | ) | | (1.35 | ) | | (256,979 | ) | | (1.32 | ) | | (269,762 | ) | | (1.20 | ) |
| Zinc cash cost, net ofby-product credits | | 21,695 | | | 0.38 | | | 3,970 | | | 0.05 | | | 71,105 | | | 0.37 | | | 39,598 | | | 0.18 | |
37
| 1 | For additional detail on cash cost, before by-product credits please see page 34 of this MD&A. |
| Manitoba | | Three months ended | | | Nine months ended | |
| | | Sep. 30, 2018 | | | Sep. 30, 2017 | | | Sep. 30, 2018 | | | Sep. 30, 2017 | |
| Supplementary cashcost information | | $000s | | $ | $/lb1 | | $ | $000s | | $ | 1$/lb | | $ | $000s | | $ | $/lb1 | | $ | $000s | | $ | 1$/lb | |
| By-product credits: | | | | | | | | | | | | | | | | | | | | | | | | |
| Copper | | 53,089 | | | 0.92 | | | 76,563 | | | 0.95 | | | 163,111 | | | 0.84 | | | 185,746 | | | 0.83 | |
| Gold | | 30,899 | | | 0.53 | | | 34,557 | | | 0.43 | | | 99,487 | | | 0.51 | | | 94,431 | | | 0.42 | |
| Silver | | 6,367 | | | 0.11 | | | 6,880 | | | 0.09 | | | 19,366 | | | 0.10 | | | 18,453 | | | 0.08 | |
| Other | | 922 | | | 0.02 | | | 1,334 | | | 0.02 | | | 3,368 | | | 0.02 | | | 3,708 | | | 0.02 | |
| Total by-product credits | | 91,277 | | | 1.58 | | | 119,334 | | | 1.48 | | | 285,332 | | | 1.47 | | | 302,338 | | | 1.34 | |
| Less: deferred revenue | | (11,387 | ) | | (0.20 | ) | | (10,449 | ) | | (0.13 | ) | | (28,353 | ) | | (0.15 | ) | | (32,576 | ) | | (0.14 | ) |
| Total by-product credits, net of deferred revenue | | 79,890 | | | 1.38 | | | 108,885 | | | 1.35 | | | 256,979 | | | 1.32 | | | 269,762 | | | 1.20 | |
| Reconciliation to IFRS: | | | | | | | | | | | | | | | | | | | | | | | | |
| Cash cost, net of by- product credits | | 21,695 | | | | | | 3,970 | | | | | | 71,105 | | | | | | 39,598 | | | | |
| By-product credits | | 91,277 | | | | | | 119,334 | | | | | | 285,332 | | | | | | 302,338 | | | | |
| Change in deferred revenues | | (11,387 | ) | | | | | (10,449 | ) | | | | | (28,353 | ) | | | | | (32,576 | ) | | | |
| Treatment and refining charges | | (10,241 | ) | | | | | (11,792 | ) | | | | | (27,670 | ) | | | | | (29,061 | ) | | | |
| Share-based payment | | 36 | | | | | | 527 | | | | | | (26 | ) | | | | | 939 | | | | |
| Change in product inventory | | 14,192 | | | | | | (3,298 | ) | | | | | 8,460 | | | | | | (2,000 | ) | | | |
| Royalties | | 1,430 | | | | | | 2,698 | | | | | | 6,334 | | | | | | 7,686 | | | | |
| Depreciation and amortization2 | | 32,881 | | | | | | 32,374 | | | | | | 91,782 | | | | | | 94,927 | | | | |
| Cost of sales | | 139,883 | | | | | | 133,364 | | | | | | 406,964 | | | | | | 381,851 | | | | |
| 1 | Per pound of zinc produced. |
| 2 | Depreciation is based on concentrate sold. |
| Manitoba | | Three months ended | | | Nine months ended | |
| | | Sep. 30, 2018 | | | Sep. 30, 2017 | | | Sep. 30, 2018 | | | Sep. 30, 2017 | |
| Sustaining cash costper pound of zincproduced | | $000s | | | $/lb | | | $000s | | | $/lb | | | $000s | | | $/lb | | | $000s | | | $/lb | |
| Zinc cash cost, net of by-product credits | | 21,695 | | | 0.38 | | | 3,970 | | | 0.05 | | | 71,105 | | | 0.37 | | | 39,598 | | | 0.18 | |
| Sustaining capital expenditures | | 28,759 | | | 0.50 | | | 13,744 | | | 0.17 | | | 72,515 | | | 0.37 | | | 37,116 | | | 0.16 | |
| Capitalized exploration | | 244 | | | — | | | (9 | ) | | 0.00 | | | 1,524 | | | 0.01 | | | 833 | | | 0.00 | |
| Royalties | | 1,430 | | | 0.02 | | | 2,698 | | | 0.03 | | | 6,334 | | | 0.03 | | | 7,686 | | | 0.03 | |
| Sustaining cash costper pound of zincproduced | | 52,128 | | | 0.90 | | | 20,403 | | | 0.25 | | | 151,478 | | | 0.78 | | | 85,233 | | | 0.38 | |
38
ACCOUNTING CHANGES AND CRITICAL ESTIMATES
New standards and interpretations not yet adopted
As of January 1, 2018, we have adopted IFRS 9, Financial Instruments (“IFRS 9”) and IFRS 15, Revenue from Contracts with Customers (“IFRS 15”).
For information on new standards and interpretations not yet adopted, refer to note 4 of our September 30, 2018 condensed consolidated interim financial statements.
Estimates and judgements
For information on significant areas requiring us to make estimates and judgements, refer to note 2 of our September 30, 2018 condensed consolidated interim financial statements.
CHANGES IN INTERNAL CONTROL OVER FINANCIAL REPORTING
Management is responsible for establishing and maintaining adequate internal control over financial reporting (“ICFR”). ICFR is designed to provide reasonable assurance regarding the reliability of financial reporting and the preparation of financial statements for external purposes in accordance with IFRS.
We did not make any changes to ICFR during the three months ended September 30, 2018 that materially affected or are reasonably likely to materially affect our ICFR.
39
NOTES TO READER
Forward-Looking Information
This MD&A contains forward-looking information within the meaning of applicable Canadian and United States securities legislation. All information contained in this MD&A, other than statements of current and historical fact, is forward-looking information. Often, but not always, forward-looking information can be identified by the use of words such as “plans”, “expects”, “budget”, “guidance”, “scheduled”, “estimates”, “forecasts”, “strategy”, “target”, “intends”, “objective”, “goal”, “understands”, “anticipates” and “believes” (and variations of these or similar words) and statements that certain actions, events or results “may”, “could”, “would”, “should”, “might” “occur” or “be achieved” or “will be taken” (and variations of these or similar expressions). All of the forward-looking information in this MD&A is qualified by this cautionary note.
Forward-looking information includes, but is not limited to, production, cost and capital and exploration expenditure guidance, anticipated production at our mines and processing facilities, the expected benefits of implementing the metallurgical recovery and optimization initiatives at Constancia processing plant, the anticipated benefits of the Mason transaction, the anticipated timing, cost and benefits of developing the Rosemont project and the Pampacancha deposit, the anticipated impact of any delays to the start of mining the Pampacancha deposit, the permitting process for the Rosemont project and anticipated results of litigation challenging Rosemont's permits, anticipated exploration and development plans, including the exploration and development strategy for the Lalor gold zones, the possible refurbishment of the New Britannia mill and the possibility of optimizing the value of the company's gold resources in Manitoba, the possibility of converting inferred and historical mineral resource estimates to higher confidence categories, the potential and our anticipated plans for the Ann Mason project, anticipated mine plans, anticipated metals prices and the anticipated sensitivity of our financial performance to metals prices, events that may affect our operations and development projects, anticipated cash flows from operations and related liquidity requirements, the anticipated effect of external factors on revenue, such as commodity prices, estimation of mineral reserves and resources, mine life projections, reclamation costs, economic outlook, government regulation of mining operations, and business and acquisition strategies. Forward-looking information is not, and cannot be, a guarantee of future results or events. Forward-looking information is based on, among other things, opinions, assumptions, estimates and analyses that, while considered reasonable by us at the date the forward-looking information is provided, inherently are subject to significant risks, uncertainties, contingencies and other factors that may cause actual results and events to be materially different from those expressed or implied by the forward-looking information.
The material factors or assumptions that we identified and were applied by us in drawing conclusions or making forecasts or projections set out in the forward-looking information include, but are not limited to:
| – | the anticipated results of the planned technical and economic studies on the Lalor gold zone and New Britannia mill; |
| | – | the successful completion of the Mason transaction; |
| | – | the success of mining, processing, exploration and development activities; |
| | – | the scheduled maintenance and availability of our processing facilities; |
| | – | the accuracy of geological, mining and metallurgical estimates; |
| | – | anticipated metals prices and the costs of production; |
| | – | the supply and demand for metals we produce; |
| | – | the supply and availability of all forms of energy and fuels at reasonable prices; |
| | – | no significant unanticipated operational or technical difficulties; |
| – | the execution of our business and growth strategies, including the success of our strategic investments and initiatives; |
| | – | the availability of additional financing, if needed; |
| – | the ability to complete project targets on time and on budget and other events that may affect our ability to develop our projects; |
| | – | the timing and receipt of various regulatory, governmental and joint venture partner approvals; |
| – | the availability of personnel for our exploration, development and operational projects and ongoing employee relations; |
| | – | the ability to secure required land rights to develop the Pampacancha deposit; |
| – | maintaining good relations with the communities in which we operate, including the communities surrounding our Constancia mine and Rosemont project and First Nations communities surrounding our Lalor mine; |
40
| | – | no significant unanticipated challenges with stakeholders at our various projects; |
| – | no significant unanticipated events or changes relating to regulatory, environmental, health and safety matters; |
| – | no contests over title to our properties, including as a result of rights or claimed rights of aboriginal peoples; |
| | – | the timing and possible outcome of pending litigation and no significant unanticipated litigation; |
| – | certain tax matters, including, but not limited to current tax laws and regulations and the refund of certain value added taxes from the Canadian and Peruvian governments; and |
| – | no significant and continuing adverse changes in general economic conditions or conditions in the financial markets (including commodity prices and foreign exchange rates). |
The risks, uncertainties, contingencies and other factors that may cause actual results to differ materially from those expressed or implied by the forward-looking information may include, but are not limited to, risks generally associated with the mining industry, such as economic factors (including future commodity prices, currency fluctuations, energy prices and general cost escalation), uncertainties related to the development and operation of our projects (including risks associated with the permitting, development and economics of the Rosemont project and related legal challenges), risks related to the exploration and development strategy for the Lalor, including the ability to establish a business case for the refurbishment of the New Britannia mill and convert inferred and historical mineral resource estimates to higher confidence categories, risks related to the maturing nature of our 777 mine and its impact on the related Flin Flon metallurgical complex, dependence on key personnel and employee and union relations, risks related to the schedule for mining the Pampacancha deposit (including the timing and cost of acquiring the required surface rights and the impact of any schedule delays), risks related to political or social unrest or change, risks in respect of aboriginal and community relations, rights and title claims, operational risks and hazards, including unanticipated environmental, industrial and geological events and developments and the inability to insure against all risks, failure of plant, equipment, processes, transportation and other infrastructure to operate as anticipated, compliance with government and environmental regulations, including permitting requirements and anti-bribery legislation, depletion of our reserves, volatile financial markets that may affect our ability to obtain additional financing on acceptable terms, the failure to obtain required approvals or clearances from government authorities on a timely basis, uncertainties related to the geology, continuity, grade and estimates of mineral reserves and resources, and the potential for variations in grade and recovery rates, uncertain costs of reclamation activities, our ability to comply with our pension and other post-retirement obligations, our ability to abide by the covenants in our debt instruments and other material contracts, tax refunds, hedging transactions, as well as the risks discussed under the heading “Risk Factors” in our most recent Annual Information Form.
Should one or more risk, uncertainty, contingency or other factor materialize or should any factor or assumption prove incorrect, actual results could vary materially from those expressed or implied in the forward-looking information. Accordingly, you should not place undue reliance on forward-looking information. We do not assume any obligation to update or revise any forward-looking information after the date of this MD&A or to explain any material difference between subsequent actual events and any forward-looking information, except as required by applicable law.
Note to United States Investors
This MD&A has been prepared in accordance with the requirements of the securities laws in effect in Canada, which may differ materially from the requirements of United States securities laws applicable to US issuers.
41
Qualified Person
The technical and scientific information in this MD&A related to the Constancia mine and Rosemont project has been approved by Cashel Meagher, P. Geo, our Senior Vice President and Chief Operating Officer. The technical and scientific information related to our Manitoba sites and projects (including the Lalor gold zone) contained in this MD&A has been approved by Olivier Tavchandjian, P. Geo, our Vice President, Exploration and Geology. Messrs. Meagher and Tavchandjian are qualified persons pursuant to NI 43-101. For a description of the key assumptions, parameters and methods used to estimate mineral reserves and resources at Hudbay's material properties, as well as data verification procedures and a general discussion of the extent to which the estimates of scientific and technical information may be affected by any known environmental, permitting, legal title, taxation, sociopolitical, marketing or other relevant factors, please see the Technical Reports for our material properties as filed by us on SEDAR at www.sedar.com.
Historical Estimates of Mineral Resources
The mineral resource estimates for the New Britannia, Squall Lake and Wim deposits that have been included in this news release are “historical estimates” within the meaning of NI 43-101, and not current mineral resources, as a qualified person has not performed sufficient work for Hudbay to classify the historical estimates as current mineral resources.
In parallel with its technical work on Lalor, Hudbay plans to carry out the work required to verify the relevance and reliability of the historical estimates, including verification of the data, assumptions, parameters and methods used to estimate the mineral resources.
42