

Management's Discussion and Analysis of
Results of Operations and Financial Condition
For the three and six months ended
June 30, 2019
August8, 2019
INTRODUCTION
This Management's Discussion and Analysis ("MD&A") dated August 8, 2019 is intended to supplement Hudbay Minerals Inc.'s unaudited condensed consolidated interim financial statements and related notes for the three and six months ended June 30, 2019 and 2018 (the "consolidated interim financial statements"). The consolidated interim financial statements have been prepared in accordance with International Financial Reporting Standards (“IFRS"), including International Accounting Standard 34,Interim Financial Reporting, as issued by the International Accounting Standards Board (“IASB”).
References to “Hudbay”, the “Company”, “we”, “us”, “our” or similar terms refer to Hudbay Minerals Inc. and its direct and indirect subsidiaries as at June 30, 2019. "Hudbay Peru" refers to HudBay Peru S.A.C., our wholly-owned subsidiary which owns a 100% interest in the Constancia mine, and “Hudbay Arizona” refers to Hudbay Arizona Inc., our wholly-owned subsidiary, which indirectly owns a 100% interest in the Rosemont project.
Readers should be aware that:
| – | This MD&A contains certain “forward-looking statements” and “forward-looking information” (collectively, “forward-looking information”) that are subject to risk factors set out in a cautionary note contained in our MD&A. |
| – | This MD&A has been prepared in accordance with the requirements of the securities laws in effect in Canada, which may differ materially from the requirements of United States securities laws applicable to US issuers. |
| – | We use a number of non-IFRS financial performance measures in our MD&A. |
| – | The technical and scientific information in this MD&A has been approved by qualified persons based on a variety of assumptions and estimates. |
For a discussion of each of the above matters, readers are urged to review the “Notes to Reader” discussion beginning on page 43 of this MD&A.
Additional information regarding Hudbay, including the risks related to our business and those that are reasonably likely to affect our financial statements in the future, is contained in our continuous disclosure materials, including our most recent Annual Information Form (“AIF”), consolidated financial statements and Management Information Circular available on SEDAR at www.sedar.com and on EDGAR at www.sec.gov.
As of January 1, 2019 we have adopted IFRS 16, Leases (“IFRS 16”). The Company applied this amendment prospectively. A reconciliation from the December 31, 2018 previously reported balances to the revised January 1, 2019 opening balances is disclosed in Note 4(b) of the consolidated interim financial statements.
All amounts are in US dollars unless otherwise noted.
OUR BUSINESS
We are an integrated mining company primarily producing copper concentrate (containing copper, gold, and silver), molybdenum concentrate and zinc metal. With assets in North and South America, we are focused on the discovery, production and marketing of base and precious metals. Directly and through our subsidiaries, we own three polymetallic mines, four ore concentrators and a zinc production facility in northern Manitoba and Saskatchewan (Canada) and Cusco (Peru), and copper projects in Arizona and Nevada (United States). Our growth strategy is focused on the exploration and development of properties we already control, as well as other mineral assets we may acquire that fit our strategic criteria. Our vision is to be a responsible, top-tier operator of long-life, low-cost mines in the Americas. We are governed by theCanada Business Corporations Act and our shares are listed under the symbol "HBM" on the Toronto Stock Exchange, New York Stock Exchange and Bolsa de Valores de Lima.
1
SUMMARY
| – | Delivered a solid operating quarter, which included record mine production at Lalor and record throughput at the Stall concentrator. |
| – | 777 and Lalor ore mined increased by 35% and 21%, respectively, in the second quarter of 2019 compared to the same period in 2018. |
| – | Second quarter 2019 results are on track to meet all production and cost guidance for 2019. |
| – | Following the previously announced U.S. court decision suspending construction work at Rosemont, we intend to appeal the decision and evaluate options for advancing the project. |
| – | Announced an initial National Instrument ("NI") 43-101 resource estimate for the recently discovered zinc-rich 1901 deposit near Lalor. |
| – | Progressed other key strategic initiatives, including engineering and permitting for the Lalor Gold strategy and community negotiations near Constancia. |
| – | Cash generated from operating activities increased to $107.0 million in the second quarter of 2019 from $97.0 million in the same quarter of 2018, while operating cash flow before change in non-cash working capital decreased to $81.1 million in the quarter from $131.6 million in the same quarter of 2018 as a result of lower realized prices and sales volumes. |
| – | Cash and cash equivalents increased from $485.9 million at March 31, 2019 to $489.5 million at June 30, 2019, as free cash flow from our operations more than funded the $45.0 million upfront cost to acquire the Rosemont minority joint venture interest and $50.0 million of capital expenditures. |
Summary of Second Quarter Results
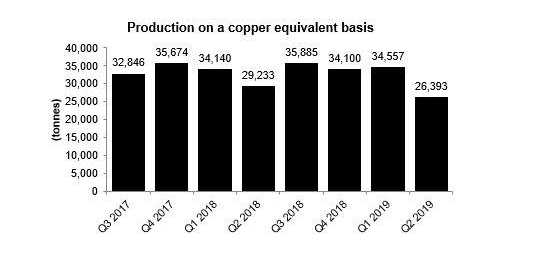
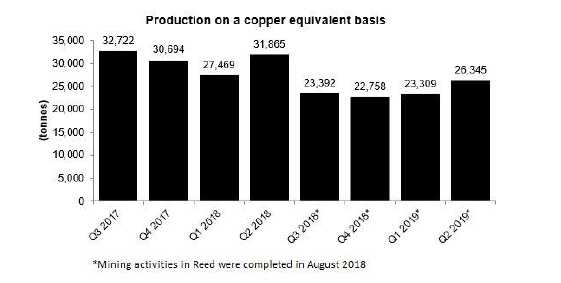
Cash generated from operating activities increased to $107.0 million in the second quarter of 2019 from $97.0 million in the same quarter of 2018. Operating cash flow before change in non-cash working capital was $81.1 million during the second quarter of 2019, reflecting a decrease of $50.5 million compared to the second quarter of 2018. The decrease in operating cash flow is primarily the result of lower realized copper and zinc prices and lower sales volumes of copper and zinc, compared to the second quarter of 2018. Copper-equivalent production in the second quarter of 2019 decreased by 14% compared to the same period in 2018, primarily as a result of lower mine grades at Constancia, as planned, and the closure of the Reed mine.
Net loss and loss per share in the second quarter of 2019 were $54.1 million and $0.21, respectively, compared to a net profit and earnings per share of $24.7 million and $0.09, respectively, in the second quarter of 2018.
Net loss and loss per share in the second quarter of 2019 were affected by, among other things, the following items:
| (in $ millions, except per share amounts) | Pre-tax gain (loss) | After-tax gain | Per share gain |
| | | (loss) | (loss) |
Non-cash deferred tax adjustments
Write down of UCM receivable
Costs associated with recent proxy contest | — | (15.1) | (0.06) |
| | | |
| (26.0) | (26.0) | (0.10) |
| | | |
| (3.0) | (2.2) | (0.01) |
As previously disclosed, as part of the orderly acquisition of the remaining interest in the Rosemont copper project on April 25, 2019, Hudbay, immediately prior to closing the acquisition, agreed to release United Copper & Moly LLC ("UCM") from its repayment obligations under the Rosemont project loan in exchange for an increase in equity interest in Rosemont. As a result, the loan receivable balance was written down in the income statement and other capital reserves, a component of shareholder's equity, was subsequently increased.
2
In the second quarter of 2019, consolidated cash cost per pound of copper produced, net of by-product credits1, was $1.27, an increase compared to $0.96 in the same period last year. Cash costs per pound of copper produced, net of by–product credits, increased as a result of lower copper and zinc production and lower realized zinc prices. Incorporating sustaining capital, capitalized exploration, royalties, selling, administrative and regional costs, consolidated all-in sustaining cash cost per pound of copper produced, net of by-product credits1, in the second quarter of 2019 was $2.26, which increased from $1.50 in the same period last year, driven mainly by higher cash costs and increased sustaining capital expenditures.
Net debt1decreased by $3.8 million from March 31, 2019 to $487.7 million at June 30, 2019, as the upfront payment to acquire the Rosemont minority joint venture interest and other capital expenditures was offset by free cash flow from our operations. At June 30, 2019, total liquidity, including cash and available credit facilities, was $910.7 million, down from $940.3 million as at March 31, 2019 due to additional letters of credit posted to support reclamation obligations.

3
Lower copper-equivalent production in the Manitoba business unit as compared to the second quarter of 2018 reflects the closure of the Reed mine in August 2018.
| |
1Cash cost, all-in sustaining cash cost per pound of copper produced, net of by-product credits, and net debt are non-IFRS financial performance measures with no standardized definition under IFRS. For further information and a detailed reconciliation, please see the discussion under the "Non-IFRS Financial Reporting Measures" section of this MD&A. |
4
KEY FINANCIAL RESULTS
Financial Condition
(in $ thousands) | Jun. 30, 2019
| Dec. 31, 2018
|
|
Cash and cash equivalents
Total long-term debt
Net debt1
Working capital
Total assets
Equity | 489,527 | 515,497 |
| 977,196 | 981,030 |
| 487,669 | 465,533 |
| 428,078 | 445,228 |
| 4,737,938 | 4,685,635 |
| 2,130,719 | 2,178,856 |
| 1 | Net debt is a non-IFRS financial performance measure with no standardized definition under IFRS. For further information and a detailed reconciliation, please see discussion under the "Non-IFRS Financial Reporting Measures" section of this MD&A. |
Financial Performance
(in $ thousands, except per share amounts) | Three months ended | Six months ended |
| Jun. 30, | Jun. 30, | Jun. 30, | Jun. 30, |
| 2019 | 2018 | 2019 | 2018 |
Revenue
Cost of sales
(Loss) profit before tax
(Loss) profit
Basic and diluted (loss) earnings per share
Operating cash flow before change in non-cash working capital | 329,414 | 371,288 | 621,672 | 757,944 |
| 286,271 | 278,827 | 526,718 | 544,712 |
| (43,931) | 49,797 | (62,044) | 122,900 |
| (54,145) | 24,673 | (67,562) | 66,118 |
| (0.21) | 0.09 | (0.26) | 0.25 |
| 81,146 | 131,635 | 170,740 | 263,428 |
5
KEY PRODUCTION RESULTS
| | | Three months ended | Three months ended |
| | | Jun. 30, 2019 | Jun. 30, 2018 |
| | | Peru | Manitoba | Total | Peru | Manitoba | Total |
| Contained metal in concentrate produced1 | | | | | |
Copper
Gold
Silver
Zinc
Molybdenum
Payable metal sold
Copper
Gold
Silver
Zinc2
Molybdenum
Cash cost3
Sustaining cash cost3
All-in sustaining cash cost3 | tonnes | 24,232 | 6,131 | 30,363 | 26,818 | 10,807 | 37,625 |
| oz | 3,794 | 24,305 | 28,099 | 5,190 | 27,290 | 32,480 |
| oz | 551,807 | 260,000 | 811,807 | 596,570 | 355,091 | 951,661 |
| tonnes | — | 31,838 | 31,838 | — | 33,170 | 33,170 |
| tonnes | 334 | — | 334 | 141 | — | 141 |
| | | | | | | |
| tonnes | 25,778 | 7,393 | 33,171 | 25,409 | 10,062 | 35,471 |
| oz | 4,056 | 26,482 | 30,538 | 3,764 | 25,932 | 29,696 |
| oz | 504,259 | 300,042 | 804,301 | 438,532 | 250,952 | 689,484 |
| tonnes | — | 24,224 | 24,224 | — | 28,168 | 28,168 |
| tonnes | 419 | — | 419 | — | — | — |
| $/lb | 1.63 | (0.15) | 1.27 | 1.64 | (0.71) | 0.96 |
| $/lb | 2.09 | 2.11 | | 1.82 | 0.38 | |
| $/lb | | | 2.26 | | | 1.50 |
| | Six months ended | Six months ended |
| | Jun. 30, 2019 | Jun. 30, 2018 |
| | Peru | Manitoba | Total | Peru | Manitoba | Total |
Contained metal in concentrate produced1
Copper
Gold
Silver
Zinc
Molybdenum
Payable metal sold
Copper
Gold
Silver
Zinc2
Molybdenum
Cash cost3
Sustaining cash cost3
All-in sustaining cash cost3 | | | | | | | |
| tonnes | 56,075 | 12,260 | 68,335 | 58,369 | 18,462 | 76,831 |
| oz | 9,151 | 44,510 | 53,661 | 10,608 | 52,965 | 63,573 |
| oz | 1,186,737 | 544,265 | 1,731,002 | 1,242,456 | 686,343 | 1,928,799 |
| tonnes | — | 59,875 | 59,875 | — | 61,952 | 61,952 |
| tonnes | 638 | — | 638 | 205 | — | 205 |
| | | | | | | |
| tonnes | 52,440 | 12,448 | 64,888 | 54,977 | 17,000 | 71,977 |
| oz | 10,274 | 42,893 | 53,167 | 8,671 | 47,082 | 55,753 |
| oz | 1,256,518 | 530,689 | 1,787,207 | 1,034,162 | 541,778 | 1,575,940 |
| tonnes | — | 47,178 | 47,178 | — | 53,620 | 53,620 |
| tonnes | 653 | — | 653 | 137 | — | 137 |
| $/lb | 1.38 | 0.31 | 1.19 | 1.46 | (0.58) | 0.97 |
| $/lb | 1.69 | 2.48 | | 1.63 | 0.65 | |
| $/lb | | | 2.01 | | | 1.48 |
1 | Metal reported in concentrate is prior to deductions associated with smelter contract terms. |
2 | Includes refined zinc metal sold and payable zinc in concentrate sold. |
3 | Cash cost, sustaining cash cost and all-in sustaining cash cost per pound of copper produced, net of by-product credits are non-IFRS financial performance measures with no standardized definition under IFRS. For further information and a detailed reconciliation, please see the discussion under the "Non-IFRS Financial Reporting Measures" section of this MD&A. |
6
7
RECENT DEVELOPMENTS
Settlement Agreement with Waterton
In May 2019, Hudbay and certain funds managed by Waterton Global Resource Management, Inc ("Waterton"). entered into a settlement agreement that resulted in the appointment of three of Waterton's proposed nominees to Hudbay’s eleven-person Board at our annual and special meeting of shareholders. A copy of the settlement agreement is available under Hudbay’s profile on SEDAR.
Senior Management Change
On July 10, 2019, we announced that Alan Hair stepped down as Hudbay's President and Chief Executive Officer and as a director of the Company. Peter Kukielski has been appointed Interim CEO. Mr. Kukielski has more than 30 years of extensive global experience within the base metals, precious metals and bulk materials sectors, having overseen operations across the globe.
The Board has commenced a search for a permanent CEO, which may include internal and external candidates.
Peru Logistics Update
The southern Peru copper mining corridor has seen heightened political activity over the past several months, including large protests related to the granting of a permit to another company’s mining project. These protests have blocked the entrance to the port of Matarani since mid-July. While the protests are unrelated to Constancia, we, as well as other copper miners, use the Matarani port to ship copper concentrates and import consumables. Mining and milling operations have continued at Constancia, but there has been a substantial concentrate inventory buildup at the Constancia site, costs for consumables such as diesel have increased, and Constancia’s molybdenum production has been affected due to the unavailability of necessary consumables.
The Peruvian government has taken recent steps to address the road blockages with some intermittent access currently available to the port of Matarani. We are continuing to work to manage the impact of these disruptions.
Rosemont Developments
On April 25, 2019, we completed the previously announced acquisition of UCM's 7.95% joint venture interest in Rosemont and paid UCM initial cash consideration of $45.0 million, plus three future expected annual installments of $10.0 million per year, commencing July 1, 2022. This provides us with 100% ownership of Rosemont, allowing greater strategic flexibility with respect to capital structure and project financing alternatives.
On July 31, 2019, the U.S. District Court for the District of Arizona (“Court”) issued a ruling in the lawsuits challenging the U.S. Forest Service’s issuance of the Final Record of Decision (“FROD”) for the Rosemont project in Arizona. The Court ruled to vacate and remand the FROD such that Rosemont cannot proceed with construction at this time. We strongly believe that the Court has misinterpreted federal mining laws and Forest Service regulations as they apply to Rosemont. As such we intend to appeal the Court’s decision to the U.S. Ninth Circuit Court of Appeals and are evaluating other options to advance Rosemont. We are also reassessing the optimal timeline for financing Rosemont, including the previously announced process to identify a joint venture partner for Rosemont.
8
We had previously initiated an early works program for Rosemont with anticipated 2019 project capital spending of $122 million. We have suspended most of the early works activities and now expect Rosemont project spending of approximately $30 million in 2019, including costs to demobilize engineering work and complete committed procurement. These costs are in addition to $20 million of Rosemont non-project costs that are still expected to be incurred in 2019.
Snow Lake Exploration Update
1901 Deposit Initial Resource Estimate
Since its discovery in February 2019, drilling has continued to define the extent and geometry of the 1901 deposit. This focused drill program, along with geological interpretation and resource modeling, has resulted in an initial resource estimate a mere six months from discovery. The deposit is located between the former producing Chisel North mine and Lalor mine, less than 1,000 metres from an active underground ramp at a depth ranging from 550 to 650 metres and within 15 kilometres trucking distance of the Stall concentrator. The property is 100% owned by us, free of any royalties or streams. The mineralization is interpreted as two zinc-rich volcanogenic massive sulphide lenses with locally high-grade gold and silver content. The mineralization occurs along the hanging wall contact of the stratigraphic horizon hosting the Chisel North deposit.
Based on these recent drilling results, we are pleased to announce an initial mineral resource estimate for the 1901 deposit:
1901 Deposit Mineral Resource Estimate1,2,3,4,5 | Tonnes
(millions) | Zn Grade
(%) | Au Grade
(g/t) | Ag Grade
(g/t) | Cu Grade
(%) |
|
| Inferred | 2.1 | 9.67 | 0.87 | 30.7 | 0.25 |
| 1 | CIM definitions were followed for the estimation of mineral resources. Mineral resources that are not mineral reserves do not have demonstrated economic viability. |
| 2 | Mineral resources are reported within an economic envelope defined by a mineral stope optimization algorithm assuming a selective mining method. |
| 3 | Long-term metal prices of $1,260/oz gold, $18.00/oz silver, $3.10/lb copper and $1.10/lb zinc were used for the estimation of the mineral resources. |
| 4 | Metal recovery estimates are based on the assumption that this mineralization would be processed at Hudbay’s Stall concentrator and would present a similar performance to those experienced historically for the Chisel and Lalor zinc-rich lenses. |
| 5 | Specific gravity measurements using industry standard techniques were completed on all assayed intervals. |
The methodology followed to estimate mineral resources at the 1901 deposit was identical to the approach used to recently update the mineral resource estimates for the Lalor mine (please refer to the NI 43-101 Technical Report for Lalor dated March 28, 2019 for more details) and constrains the resource within a stope optimization envelope that is expected to lead to a higher mineral resource to mineral reserve conversion factor.
There remain opportunities for extension of the mineralization discovered at the 1901 deposit. Exploration targets for new discrete lenses also exist in the immediate vicinity of 1901 and two drills are actively exploring in the area. We are studying alternatives to develop the 1901 deposit to optimize the net present value of the Manitoba business unit.
9
High-Grade Gold and Copper-Gold Intercepts
In addition to the initial resource estimate on the 1901 deposit, drilling has also identified several high-grade gold and copper-gold zones but drilling density is not yet at a level to establish a mineral resource estimate. Highlights of the drill hole intersections occurring in the footwall of the zinc rich lenses are summarized in the table below. Drill hole CH1916 assayed 29.8g/t Au and 401.8g/t Ag over 7.5 metres from 580.5 to 588.0 metres and drill hole CH1925 assayed 3.2g/t Au, 19.9g/t Ag and 2.83% Cu over 9 metres from 637.5 to 646.5 metres. Several other high-grade copper and gold intersections of less than 3 metres occur throughout the footwall zone in altered felsic units. As drilling progresses to an infill stage to convert the inferred zinc-rich resource estimates to an indicated category, we also expect to establish the continuity of the gold and copper-gold rich mineralization and report a mineral resource estimate for this portion of the mineralization. The gold and copper-gold rich mineralization is likely to constitute a suitable feed for the New Britannia gold mill after its refurbishment is completed in 2022 and could further enhance the gold production profile from the Snow Lake camp.
Hole ID | From
(m) | To
(m) | Intercept1
(m) | Depth
(m) |
Au (g/t) |
Ag (g/t) |
Cu (%) |
Zn (%) |
|
| CH1916 | 580.5 | 588.0 | 7.5 | 574 | 29.8 | 401.8 | 0.16 | 0.04 |
| CH1918 | 570.0 | 575.5 | 5.5 | 570 | 14.2 | 105.3 | 0.13 | 0.21 |
| CH1931 | 617.9 | 625.0 | 7.1 | 565 | 13.4 | 28.3 | 0.04 | 0.75 |
| CH1934 | 692.8 | 696.0 | 3.2 | 646 | 14.3 | 181.2 | 0.21 | 0.04 |
| CH1925 | 637.5 | 646.5 | 9.0 | 621 | 3.2 | 19.9 | 2.83 | 0.17 |
| Note: | all grade values are uncut. |
| 1 | True widths cannot be estimated at this stage as there is insufficient knowledge on the orientation of the gold and copper-gold mineralization. |
Hole ID | From (m) | To (m) | Azimuth at
Intercept | Dip at
Intercept |
| Easting | Northing | Elevation | Easting | Northing | Elevation |
| CH1916 | 427067 | 6078909 | -270 | 427068 | 6078909 | -278 | 087 | -85 |
| CH1918 | 427094 | 6078818 | -265 | 427094 | 6078818 | -271 | 052 | -83 |
| CH1931 | 427083 | 6078909 | -259 | 427081 | 6078908 | -266 | 247 | -65 |
| CH1934 | 427072 | 6078847 | -322 | 427070 | 6078846 | -326 | 237 | -64 |
| CH1925 | 427185 | 6078904 | -307 | 427183 | 6078903 | -315 | 229 | -75 |
Other Snow Lake Regional Exploration
During the second quarter of 2019, we have also continued in-mine exploration activities at the Lalor mine and progressed engineering studies for our other 100%-owned deposits in the Snow Lake area, including the WIM, Pen II and New Britannia mine properties. Drilling and studies will continue throughout the year and are expected to be incorporated in the annual mineral reserve and resource estimate.
Dividend Declared
A semi-annual dividend of C$0.01 per share was declared on August 8, 2019. The dividend will be paid on September 27, 2019 to shareholders of record as of September 6, 2019.
10
CONSTANCIA OPERATIONS REVIEW
| | | Three months ended | Six months ended | Guidance |
| | | Jun. 30, | | Jun. 30, | | Annual |
| | | 2019 | Jun. 30, 2018 | 2019 | Jun. 30, 2018 | 2019 |
| Ore mined1 | tonnes | 8,211,166 | 8,744,200 | 16,845,939 | 18,233,969 | |
| Copper | % | 0.39 | 0.47 | 0.43 | 0.49 | |
| Gold | g/tonne | 0.04 | 0.05 | 0.04 | 0.05 | |
| Silver | g/tonne | 3.68 | 4.03 | 3.61 | 4.11 | |
| Ore milled | tonnes | 7,679,739 | 7,726,606 | 15,672,801 | 15,577,775 | |
| Copper | % | 0.37 | 0.44 | 0.42 | 0.47 | |
| Gold | g/tonne | 0.04 | 0.05 | 0.04 | 0.05 | |
| Silver | g/tonne | 3.40 | 3.92 | 3.47 | 4.01 | |
| Copper concentrate | tonnes | 103,796 | 113,738 | 238,519 | 242,286 | |
| Concentrate grade | % Cu | 23.35 | 23.58 | 23.51 | 24.09 | |
| Copper recovery | % | 84.7 | 79.7 | 85.6 | 80.3 | |
| Gold recovery | % | 41.3 | 44.8 | 47.1 | 44.9 | |
| Silver recovery | % | 65.7 | 61.2 | 67.9 | 61.9 | |
| Combined unit operating costs2,3 | $/tonne | 10.39 | 10.33 | 9.62 | 9.62 | 7.90 - 9.70 |
1 | Reported tonnes and grade for ore mined are estimates based on mine plan assumptions and may not reconcile fully to ore milled. |
2 | Reflects combined mine, mill and general and administrative ("G&A") costs per tonne of ore milled. Reflects the deduction of expected capitalized stripping costs. |
3 | Combined unit costs is a non-IFRS financial performance measure with no standardized definition under IFRS. For further information and a detailed reconciliation, please see the discussion under the "Non-IFRS Financial Reporting Measures" section of this MD&A. |
Ore mined at our Constancia mine during the second quarter of 2019 was 6% lower compared to the same period in 2018 due to mining from areas with a higher stripping ratio than the areas mined in the second quarter of 2018, in line with the mine plan. Milled copper grades in the second quarter were approximately 16% lower than the same period in 2018 as lower grade phases continue to be mined, in line with the mine plan. Mill throughput in the second quarter of 2019 was consistent compared to the same period in 2018.
Copper recoveries in the second quarter of 2019 improved by 6% compared to the same period in 2018. The increased copper recoveries were a result of sustained metallurgical improvements initiated in 2018. While recoveries vary from quarter to quarter depending on the complexity and grade of the ore feed, the Company is seeing results from ongoing recovery improvement initiatives. These initiatives include those targeting flotation operating efficiencies (improvement at the washing station in column cells and water distribution in the processing plant), and the integration of an automated, advanced process control system in the grinding and bulk flotation circuits.
During the second quarter of 2019, a six-day scheduled maintenance shutdown of the Constancia mill was performed. Combined mine, mill and G&A unit operating costs in the second quarter of 2019 were consistent with the same period in 2018, reflecting correspondingly lower ore throughput and higher maintenance costs due to the plant shutdown. In addition, in line with the mine plan and our first quarter 2019 operations update, mined copper grades during the second quarter of 2019 were below the expected annual average. The maintenance shutdown and the variations in copper grade are consistent with the full year plan for Constancia, and we continue to expect production and cost guidance to be met for the full year 2019.
11
The year-to-date production variances were driven by the same factors as the second quarter variances versus prior year.
| | | Three months ended | Six months ended | Guidance |
| Contained metal in | | Jun. 30, | Jun. 30, | Jun. 30, | Jun. 30, | Annual |
| concentrate produced | | 2019 | 2018 | 2019 | 2018 | 2019 |
| Copper | tonnes | 24,232 | 26,818 | 56,075 | 58,369 | 100,000 - 125,000 |
| Gold | oz | 3,794 | 5,190 | 9,151 | 10,608 | |
| Silver | oz | 551,807 | 596,570 | 1,186,737 | 1,242,456 | |
| Molybdenum | tonnes | 334 | 141 | 638 | 205 | 1,100 - 1,200 |
| Precious metals1 | oz | 11,677 | 13,712 | 26,104 | 28,357 | 45,000 - 55,000 |
| 1 | Precious metals production includes gold and silver production on a gold-equivalent basis. Silver is converted to gold at a ratio of 70:1. |
In the second quarter of 2019 production of copper was lower than the same period in 2018, mainly due to lower copper grades, as per the mine plan, partially offset by higher copper recoveries from recent metallurgical initiatives. Production of gold and silver during the second quarter of 2019 was lower than the same period in 2018 due to lower grades. Production results for the first half of 2019 were driven by the same factors as the second quarter variances versus prior year, including the regularly scheduled mill maintenance shutdown occurring in the second quarter each year.
We expect production of all metals and costs at Constancia to be in line with the full year guidance for 2019.
Peru Cash Cost and Sustaining Cash Cost
12
| | | Three months ended | Six months ended |
| | | Jun. 30, | Jun. 30, | Jun. 30, | Jun. 30, |
| | | 2019 | 2018 | 2019 | 2018 |
| Cash cost per pound of copper produced, net of | | | | | |
| by-product credits1 | $/lb | 1.63 | 1.64 | 1.38 | 1.46 |
| Sustaining cash cost per pound of copper | | | | | |
| produced, net of by-product credits1 | $/lb | 2.09 | 1.82 | 1.69 | 1.63 |
| 1 | Cash cost and sustaining cash costs per pound of copper produced, net of by-product credits, are not recognized under IFRS. For more detail on these non-IFRS financial performance measures, please see the discussion under the "Non-IFRS Financial Performance Measures" section of this MD&A. |
Cash cost per pound of copper produced, net of by-product credits, for the second quarter of 2019 is in line with the same period in 2018 due to lower copper production being offset by higher by-product credits.
Sustaining cash cost per pound of copper produced, net of by-product credits, for the three and six months ended June 30, 2019 was $2.09 and $1.69, respectively. This represents an increase of 15% and 4%, respectively, from the same period in 2018, due to higher sustaining costs in heavy civil works, mine equipment overhauls and lower copper production.

Metal Sold
| | | Three months ended | Six months ended |
| | | Jun. 30, | | Jun. 30, | |
| | | 2019 | Jun. 30, 2018 | 2019 | Jun. 30, 2018 |
| Payable metal in concentrate | | | | | |
| Copper | tonnes | 25,778 | 25,409 | 52,440 | 54,977 |
| Gold | oz | 4,056 | 3,764 | 10,274 | 8,671 |
| Silver | oz | 504,259 | 438,532 | 1,256,518 | 1,034,162 |
| Molybdenum | tonnes | 419 | — | 653 | 137 |
13
MANITOBA OPERATIONS REVIEW
Mines
| | | Three months ended | Six months ended |
| | | Jun. 30, | | Jun. 30, | |
| | | 2019 | Jun. 30, 2018 | 2019 | Jun. 30, 2018 |
| 777 | | | | | |
| Ore | tonnes | 288,599 | 213,134 | 567,121 | 471,520 |
| Copper | % | 1.34 | 1.55 | 1.49 | 1.37 |
| Zinc | % | 3.37 | 5.09 | 3.28 | 4.96 |
| Gold | g/tonne | 1.60 | 1.99 | 1.65 | 2.04 |
| Silver | g/tonne | 18.92 | 31.18 | 20.31 | 30.60 |
| Lalor | | | | | |
| Ore | tonnes | 411,701 | 339,064 | 800,184 | 661,618 |
| Copper | % | 0.73 | 0.81 | 0.75 | 0.74 |
| Zinc | % | 6.34 | 6.30 | 6.51 | 5.99 |
| Gold | g/tonne | 2.12 | 2.30 | 1.90 | 2.18 |
| Silver | g/tonne | 22.32 | 26.79 | 24.09 | 27.01 |
| Reed1 | | | | | |
| Ore | tonnes | — | 142,132 | — | 264,441 |
| Copper | % | — | 3.25 | — | 3.39 |
| Zinc | % | — | 0.75 | — | 0.84 |
| Gold | g/tonne | — | 0.79 | — | 0.75 |
| Silver | g/tonne | — | 8.34 | — | 8.84 |
| Total Mines | | | | | |
| Ore | tonnes | 700,300 | 694,330 | 1,367,305 | 1,397,579 |
| Copper | % | 0.98 | 1.54 | 1.06 | 1.45 |
| Zinc | % | 5.12 | 4.79 | 5.17 | 4.67 |
| Gold | g/tonne | 1.90 | 1.89 | 1.80 | 1.86 |
| Silver | g/tonne | 20.92 | 24.36 | 22.52 | 24.78 |
| 1 | Mining activities at Reed were completed in August 2018. Comparable 2018 numbers include 100% of Reed mine production. Hudbay purchased 30% of the Reed ore production from its joint venture partner on market-based terms. |
| | | Three months ended | Six months ended |
| | | Jun. 30, | | Jun. 30, | |
| Unit Operating Costs1,2 | | 2019 | Jun. 30, 2018 | 2019 | Jun. 30, 2018 |
| Mines | | | | | |
| 777 | C$/tonne | 77.12 | 85.36 | 76.59 | 82.53 |
| Lalor | C$/tonne | 113.18 | 86.35 | 107.60 | 86.56 |
| Reed | C$/tonne | — | 67.48 | — | 79.11 |
| Total Mines | C$/tonne | 98.32 | 83.14 | 94.74 | 84.07 |
| 1 | Reflects costs per tonne of ore mined. |
| 2 | Unit costs is a non-IFRS financial performance measure with no standardized definition under IFRS. For further information and a detailed reconciliation, please see the discussion under the "Non-IFRS Financial Reporting Measures" section of this MD&A. |
14
Ore mined at our Manitoba operations during the second quarter of 2019 increased by 1% compared to the same period in 2018. This increase is due to higher production volumes at both 777 and Lalor, offset by the closure of the Reed mine in August 2018.
Overall, copper and silver grades were 36% and 14% lower, respectively, in the second quarter of 2019 compared to the same period of 2018 while zinc grades were 7% higher and gold grades were consistent over the period. Lower copper grades reflect the cessation of high-grade copper production from Reed following its closure, while grade variances for zinc and silver were due to planned stope sequencing at 777 and Lalor.
Ore mined at 777 in the second quarter of 2019 increased by 35%, compared to the same period last year. The higher production is attributable to implementation of management systems designed to improve mobile equipment availability and the key performance indicators for drilling, blasting and backfilling processes. Unit operating costs for 777 decreased by 10% for the second quarter of 2019 when compared to the same period in 2018 due to higher production volumes.
Ore mined at Lalor in the second quarter of 2019 increased by 21% compared to the same period last year. The higher production is attributable to a number of initiatives implemented as part of the production ramp up to 4,500 tonnes per day, including mine design changes, contract strategies, asset integrity and work management programs. Unit operating costs for Lalor for the second quarter of 2019 increased by 31% compared to the same period in 2018 due to the costs associated with some of these initiatives, together with increases to development metres required as part of the mine design changes.
Year-to-date ore mined at our Manitoba operations was 2% lower than the same period in 2018 due to the closure of the Reed mine, which was offset by higher year-to-date production volumes at both 777 and Lalor. Year-to-date copper, gold and silver grades were 27%, 3%, and 9% lower, respectively, compared to the same period of 2018. Zinc grade was 11% higher in the first half of 2019 compared to the same period of 2018. Year-to-date total mine unit costs were 13% higher than the same period in 2018 due to higher unit operating costs at Lalor, partially offset by lower unit operating costs for 777. The year-to-date operating variances were driven by the same factors that impacted second quarter operating variances.
15
Processing Facilities
| | | Three months ended | Six months ended |
| | | Jun. 30, | | Jun. 30, | |
| | | 2019 | Jun. 30, 2018 | 2019 | Jun. 30, 2018 |
| Flin Flon Concentrator | | | | | |
| Ore | tonnes | 367,017 | 439,327 | 656,261 | 830,954 |
| Copper | % | 1.26 | 2.14 | 1.39 | 1.95 |
| Zinc | % | 3.84 | 3.61 | 3.69 | 3.87 |
| Gold | g/tonne | 1.71 | 1.66 | 1.69 | 1.71 |
| Silver | g/tonne | 19.82 | 22.25 | 20.68 | 23.33 |
| Copper concentrate | tonnes | 18,081 | 38,384 | 34,825 | 65,560 |
| Concentrate grade | % Cu | 22.54 | 22.82 | 23.02 | 22.86 |
| Zinc concentrate | tonnes | 23,455 | 27,371 | 40,365 | 55,179 |
| Concentrate grade | % Zn | 51.71 | 49.55 | 50.74 | 49.56 |
| Copper recovery | % | 88.0 | 93.3 | 88.0 | 92.7 |
| Zinc recovery | % | 86.0 | 85.6 | 84.7 | 85.2 |
| Gold recovery | % | 61.3 | 65.3 | 61.5 | 65.0 |
| Silver recovery | % | 53.0 | 63.4 | 52.7 | 61.1 |
| Contained metal in concentrate produced | | | | |
| Copper | tonnes | 4,075 | 8,760 | 8,016 | 14,986 |
| Zinc | tonnes | 12,128 | 13,563 | 20,482 | 27,347 |
| Precious metals1 | oz | 14,162 | 18,131 | 25,195 | 35,069 |
| Stall Concentrator | | | | | |
| Ore | tonnes | 339,616 | 318,275 | 661,139 | 595,017 |
| Copper | % | 0.71 | 0.76 | 0.74 | 0.69 |
| Zinc | % | 6.36 | 6.56 | 6.55 | 6.23 |
| Gold | g/tonne | 2.08 | 2.14 | 1.92 | 2.11 |
| Silver | g/tonne | 22.03 | 26.35 | 24.39 | 26.99 |
| Copper concentrate | tonnes | 9,886 | 9,733 | 20,998 | 17,442 |
| Concentrate grade | % Cu | 20.79 | 21.03 | 20.21 | 19.93 |
| Zinc concentrate | tonnes | 38,122 | 38,356 | 76,615 | 67,759 |
| Concentrate grade | % Zn | 51.70 | 51.12 | 51.42 | 51.07 |
| Copper recovery | % | 85.6 | 84.5 | 86.4 | 84.8 |
| Zinc recovery | % | 91.2 | 94.0 | 91.0 | 93.4 |
| Gold recovery | % | 52.5 | 54.8 | 55.4 | 57.9 |
| Silver recovery | % | 56.5 | 57.8 | 60.6 | 59.1 |
| Contained metal in concentrate produced | | | | |
| Copper | tonnes | 2,056 | 2,047 | 4,244 | 3,476 |
| Zinc | tonnes | 19,710 | 19,607 | 39,393 | 34,605 |
| Precious metals1 | oz | 13,857 | 14,232 | 27,090 | 27,701 |
| 1 | Precious metals production includes gold and silver production on a gold-equivalent basis. Silver is converted to gold at a ratio of 70:1. |
16
| | | Three months ended | Six months ended | Guidance |
| | | Jun. 30, | Jun. 30, | Jun. 30, | Jun. 30, | Annual |
| Unit Operating Costs1 | | 2019 | 2018 | 2019 | 2018 | 2019 |
| Concentrators | | | | | | |
| Flin Flon | C$/tonne | 20.67 | 19.99 | 22.90 | 21.38 | |
| Stall | C$/tonne | 24.61 | 25.44 | 25.18 | 26.33 | |
| Combined mine/mill unit operating costs2,3 | | | | | |
| Manitoba | C$/tonne | 135 | 120 | 140 | 129 | 115 - 135 |
1 | Reflects costs per tonne of milled ore. |
2 | Reflects combined mine, mill and G&A costs per tonne of milled ore. Comparable 2018 numbers include the cost of ore purchased from our joint venture partner at Reed mine. |
3 | Combined unit costs is a non-IFRS financial performance measure with no standardized definition under IFRS. For further information and a detailed reconciliation, please see the discussion under the "Non-IFRS Financial Reporting Measures" section of this MD&A. |
Ore processed in Flin Flon in the second quarter of 2019 was 16% lower than the same period in 2018 due to the Reed mine closure, partially offset by increased production from the 777 mine. Copper, gold and silver recoveries in the second quarter of 2019 were 6%, 6%, and 16% lower, respectively, compared with the same period in 2018 due to lower head grades. Zinc recoveries were consistent quarter-over-quarter. Unit operating costs at the Flin Flon concentrator were higher in the second quarter of 2019 compared to the same period in 2018 as a result of lower processed volumes.
Ore processed for the first half of 2019 in Flin Flon was 21% lower than 2018 for the same reasons noted above. Copper, zinc, gold and silver recoveries for the year-to-date were 5%, 1%, 5% and 14% lower, respectively, compared to 2018 as a result of lower grades. Year-to-date unit operating costs at the Flin Flon concentrator were 7% higher when compared to 2018 as a result of lower production volumes from the mines.
The Stall concentrator achieved record ore throughput which was 7% higher than the same period in 2018 due to ongoing operational and maintenance improvements. Copper recoveries were 1% higher and zinc recoveries were 3% lower in the second quarter of 2019 compared with the same period in 2018. Unit operating costs at the Stall concentrator were 3% lower in the second quarter of 2019 compared to the same period in 2018 as a result of increased throughput. Ore processed for the first half of 2019 at Stall was 11% higher, and recoveries for copper at the Stall concentrator were higher than the comparative 2018 period. Year-to-date unit operating costs at the Stall concentrator were 4% lower than 2018, primarily as a result of higher production and improved mill reliability.
Manitoba combined mine, mill and G&A unit operating costs in the second quarter of 2019 were 13% higher than in the same period in 2018 due mainly to the Reed closure and higher mining costs at Lalor associated with the production ramp up. In addition, combined unit costs were negatively impacted due to the timing of batching the Lalor ore in the Flin Flon mill, as not all of the ore that was transported to Flin Flon was milled during the quarter. Manitoba combined unit costs are expected to be within guidance ranges for the full year 2019.
17
| | | Three months ended | Six months ended | Guidance |
| Manitoba contained metal in | Jun. 30, | Jun. 30, | Jun. 30, | Jun. 30, | Annual |
| concentrate produced1,2 | 2019 | 2018 | 2019 | 2018 | 2019 |
| Copper | tonnes | 6,131 | 10,807 | 12,260 | 18,462 | 22,000 - 25,000 |
| Gold | oz | 24,305 | 27,290 | 44,510 | 52,965 | |
| Silver | oz | 260,000 | 355,091 | 544,265 | 686,343 | |
| Zinc | tonnes | 31,838 | 33,170 | 59,875 | 61,952 | 100,000 - 115,000 |
| Precious metals3 | oz | 28,019 | 32,363 | 52,285 | 62,770 | 105,000 - 125,000 |
1 | Includes 100% of Reed mine production. |
2 | Metal reported in concentrate is prior to deductions associated with smelter terms. |
3 | Precious metals production includes gold and silver production on a gold-equivalent basis. Silver is converted to gold at a ratio of 70:1. |
In the second quarter of 2019, copper, gold, zinc, and silver production were 43%, 11%, 4% and 27% lower, respectively, compared to the same period in 2018 due to the closure of Reed mine, partially offset by increased production at 777 and Lalor. Precious metals production in the second quarter of 2019 was also affected by the stope sequencing of Lalor gold zone ores and the timing of processing as this material is currently transported to the Flin Flon mill and blended to achieve optimal recoveries. Full year production of all metals is expected to be within the annual guidance ranges.
Zinc Plant
| | | Three months ended | Six months ended | Guidance |
| | | Jun. 30, | Jun. 30, | Jun. 30, | Jun. 30, | Annual |
| Zinc Production | | 2019 | 2018 | 2019 | 2018 | 2019 |
| Zinc Concentrate Treated | | | | | |
| Domestic | tonnes | 57,929 | 53,865 | 108,023 | 108,273 | |
| Refined Metal Produced | | | | | | |
| Domestic | tonnes | 27,486 | 25,520 | 51,205 | 50,851 | 95,000 - 105,000 |
18
| | | Three months ended | Six months ended | Guidance |
| | | Jun. 30, | Jun. 30, | Jun. 30, | Jun. 30, | Annual |
| Unit Operating Costs | | 2019 | 2018 | 2019 | 2018 | 2019 |
| Zinc Plant1,2 | C$/lb | 0.44 | 0.49 | 0.48 | 0.50 | 0.47 - 0.55 |
1 | Zinc unit operating costs include G&A costs. |
2 | Zinc unit costs is a non-IFRS financial performance measure with no standardized definition under IFRS. For further information and a detailed reconciliation, please see the discussion under the "Non-IFRS Financial Reporting Measures" section of this MD&A. |
Production of cast zinc in the second quarter of 2019 was 8% higher compared with the same period in 2018 as a result of increased availability of zinc concentrate at the start of the quarter. Operating costs per pound of zinc metal produced were slightly lower compared with the same periods in 2018 due to higher production volume of refined zinc combined with lower zinc plant costs.
Manitoba Cash Cost and Sustaining Cash Cost
| | | Three months ended | Six months ended |
| | | Jun. 30, | Jun. 30, | Jun. 30, | Jun. 30, |
| | | 2019 | 2018 | 2019 | 2018 |
| Cost per pound of copper produced | | | | | |
| Cash cost per pound of copper produced, net | | | | | |
| of by-product credits1 | $/lb | (0.15) | (0.71) | 0.31 | (0.58) |
| Sustaining cash cost per pound of copper | | | | | |
| produced, net of by-product credits1 | $/lb | 2.11 | 0.38 | 2.48 | 0.65 |
| | | | | | |
| Cost per pound of zinc produced | | | | | |
| Cash cost per pound of zinc produced, net of | | | | | |
| by-product credits1 | $/lb | 0.38 | 0.11 | 0.52 | 0.36 |
| Sustaining cash cost per pound of zinc | | | | | |
| produced, net of by-product credits1 | $/lb | 0.82 | 0.46 | 0.97 | 0.73 |
| 1 | Cash cost and sustaining cash cost per pound of copper & zinc produced, net of by-product credits, are not recognized under IFRS. For more detail on this non-IFRS financial performance measure, please see the discussion under the "Non-IFRS Financial Performance Measures" section of this MD&A. |
Cash cost per pound of copper produced, net of by-product credits, in the second quarter of 2019 was negative $0.15 per pound of copper produced. These costs were higher compared to the same period in 2018, primarily as a result of lower copper production and zinc by-product revenue.
Sustaining cash cost per pound of copper produced, net of by-product credits, in the second quarter of 2019 was $2.11, which is higher than the prior year period due to higher cash costs and increased capital development expenditures at Lalor. Copper produced in the second quarter of 2019 was 43% lower than the same quarter in 2018 as a result of the closure of Reed mine, offset by increased production at 777 and Lalor.
Cash cost and sustaining cash cost per pound of zinc produced, net of by-product credits, in the second quarter of 2019 were higher compared to the same period last year as a result of lower copper and precious metals by-product revenue and higher capital spending.
Cash costs and sustaining cash costs were higher in the first half of 2019 compared to the corresponding period of 2018 due to the same factors that affected second quarter results.
19

Metal Sold
| | | Three months ended | Six months ended |
| | | Jun. 30, | Jun. 30, | Jun. 30, | Jun. 30, |
| | | 2019 | 2018 | 2019 | 2018 |
| Payable metal in concentrate | | | | | |
| Copper | tonnes | 7,393 | 10,062 | 12,448 | 17,000 |
| Gold | oz | 26,482 | 25,932 | 42,893 | 47,082 |
| Silver | oz | 300,042 | 250,952 | 530,689 | 541,778 |
| Zinc | tonnes | — | 975 | — | 2,675 |
| | | | | | |
| Refined zinc | tonnes | 24,224 | 27,193 | 47,178 | 50,945 |
20
FINANCIAL REVIEW
Financial Results
In the second quarter of 2019, we recorded a net loss of $54.1 million compared to a profit of $24.7 million for the same period in 2018, a decrease in profit of $78.8 million.
Year-to date in 2019, we recorded a net loss of $67.6 million compared to a profit of $66.1 million in the same period in 2018, a decrease in profit of $133.7 million.
The following table provides further details on these variances:
| | Three months ended | Six months ended |
| (in $ millions) | June 30, 2019 | June 30, 2019 |
| (Decrease) increase in components of profit or loss: | | |
| Revenues | (41.9) | (136.3) |
| Cost of sales | | |
| Mine operating costs | 0.2 | 22.2 |
| Depreciation and amortization | (7.6) | (4.2) |
| Selling and administrative expenses | (4.3) | (13.5) |
| Other operating expenses | (28.7) | (32.5) |
| Net finance expense | (10.9) | (22.1) |
| Other | (0.5) | 1.4 |
| Tax | 14.9 | 51.3 |
| (Decrease) increase in profit for the period | (78.8) | (133.7) |
Revenue
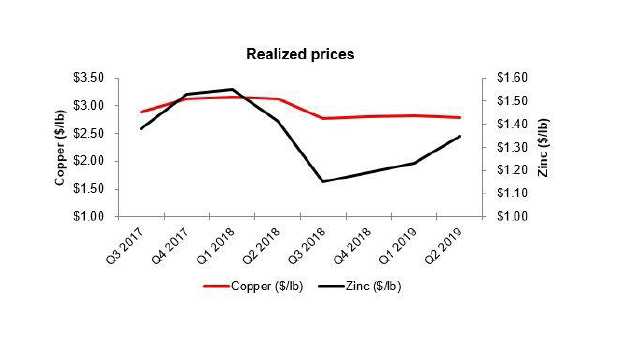
Revenue for the second quarter of 2019 was $329.4 million, $41.9 million lower than the same period in 2018, primarily as a result of lower metal prices for most commodities, and lower copper and zinc sales volumes.
Year-to-date revenue in 2019 was $621.7 million, $136.3 million lower than 2018, due to the same reasons as described for the quarterly variance above.
21
| | Three months ended | Six months ended |
| (in $ millions) | June 30, 2019 | June 30, 2019 |
| | | |
| Metals prices1 | | |
| Lower copper prices | (22.7) | (46.6) |
| Lower zinc prices | (7.7) | (26.2) |
| Higher gold prices | 1.2 | 0.3 |
| Lower silver prices | (1.0) | (1.3) |
| Sales volumes | | |
| Lower copper sales volumes | (15.2) | (46.3) |
| Lower zinc sales volumes | (13.0) | (22.2) |
| Higher (lower) gold sales volumes | 1.1 | (4.3) |
| Higher silver sales volumes | 3.0 | 6.0 |
| Other | | |
| Higher derivative mark-to-market gains | 0.7 | 2.1 |
| Molybdenum and other volume and pricing differences | 11.3 | 14.4 |
| Variable consideration adjustments | — | (16.5) |
| Effect of lower treatment and refining charges | 0.4 | 4.3 |
| Decrease in revenue in 2019 compared to 2018 | (41.9) | (136.3) |
| 1 | See discussion below for further information regarding metals prices. |
Our revenue by significant product type is summarized below:
| | Three months ended | Six months ended |
| (in $ millions) | Jun. 30, 2019 | Jun. 30, 2018 | Jun. 30,2019 | Jun. 30, 2018 |
| Copper | 205.3 | 242.8 | 407.6 | 499.6 |
| Zinc | 71.6 | 93.3 | 138.8 | 184.2 |
| Gold | 42.3 | 41.6 | 70.8 | 78.2 |
| Silver | 19.8 | 19.0 | 46.4 | 41.2 |
| Molybdenum | 11.2 | — | 17.6 | 3.3 |
| Other metals | 1.4 | 1.5 | 2.5 | 2.4 |
| Gross revenue | 351.6 | 398.2 | 683.7 | 808.9 |
| Variable consideration adjustments | — | — | (16.3) | 0.2 |
| Pricing and volume adjustments1 | (0.3) | (4.6) | (3.6) | (4.8) |
| Treatment and refining charges | (21.9) | (22.3) | (42.1) | (46.4) |
| Revenue | 329.4 | 371.3 | 621.7 | 757.9 |
1 Pricing and volume adjustments represents mark-to-market adjustments on provisionally prices sales, realized and unrealized changes to fair value for non-hedge derivative contracts and adjustments to originally invoiced weights and assays.
For further detail on variable consideration adjustments, refer to note 15 of our consolidated interim financial statements.
22
Realized sales prices
This measure is intended to enable management and investors to understand the average realized price of metals sold to third parties in each reporting period. The average realized price per unit sold does not have any standardized meaning prescribed by IFRS, is unlikely to be comparable to similar measures presented by other issuers, and should not be considered in isolation or a substitute for measures of performance prepared in accordance with IFRS.
For sales of copper, gold and silver we may enter into non-hedge derivatives (“QP hedges”) which are intended to manage the provisional pricing risk arising from quotational period terms in concentrate sales agreements. The QP hedges are not removed from the calculation of realized prices. We expect that gains and losses on QP hedges will offset provisional pricing adjustments on concentrate sales contracts.
Our realized prices for the second quarter in 2019 and 2018, respectively, are summarized below:
| | | | Realized prices1for the | | Realized prices1for the |
| | | | Three months ended | | Six months ended |
| | | LME QTD | | | LME YTD | | |
| | | 20192 | Jun. 30, 2019 | Jun. 30, 2018 | 20192 | Jun. 30, 2019 | Jun. 30, 2018 |
| Prices | | | | | | | |
| Copper | $/lb | 2.77 | 2.78 | 3.08 | 2.80 | 2.81 | 3.12 |
| Zinc | $/lb | 1.25 | 1.35 | 1.50 | 1.24 | 1.33 | 1.56 |
| Gold3 | $/oz | | 1,441 | 1,404 | | 1,401 | 1,375 |
| Silver3 | $/oz | | 24.60 | 25.81 | | 25.00 | 27.58 |
| Molybdenum | $/lb | | 12.24 | — | | 12.32 | 12.93 |
1 | Realized prices exclude refining and treatment charges and are on the sale of finished metal or metal in concentrate. Realized prices include the effect of provisional pricing adjustments on prior period sales. |
| |
2 | London Metal Exchange average for copper and zinc prices. |
| |
3 | Sales of gold and silver from our 777 and Constancia mines are subject to our precious metals stream agreement with Wheaton Precious Metals, pursuant to which we recognize deferred revenue for precious metals deliveries and also receive cash payments. Stream sales are included within realized prices and their respective deferred revenue and cash payment rates can be found on page 23. |
23
The following table provides a reconciliation of average realized price per unit sold, by metal, to revenues as shown in the consolidated financial statements.
| Three months ended June 30, 2019 |
| | | | | | | | |
| (in $ millions)1 | Copper | Zinc | Gold | Silver | Molybdenum | Other | Total |
| Revenue per financial statements | 205.3 | 71.6 | 42.3 | 19.8 | 11.2 | 1.4 | 351.6 |
| Pricing and volume adjustments2 | (2.1) | — | 1.7 | 0.0 | 0.1 | — | (0.3) |
| Derivative mark-to-market3 | — | 0.6 | — | — | — | — | 0.6 |
| Revenue, excluding mark-to-market | | | | | | | |
| on non-QP hedges | 203.2 | 72.2 | 44.0 | 19.8 | 11.3 | 1.4 | 351.9 |
| Payable metal in concentrate sold4 | 33,171 | 24,224 | 30,538 | 804,301 | 419 | — | — |
| Realized price5 | 6,128 | 2,981 | 1,441 | 24.60 | 26,987 | — | — |
| Realized price6 | 2.78 | 1.35 | — | — | 12.24 | — | — |
| Six Months Ended June 30, 2019 |
| | | | | | | | |
| (in $ millions)1 | Copper | Zinc | Gold | Silver | Molybdenum | Other | Total |
| Revenue per financial statements | 407.6 | 138.8 | 70.8 | 46.4 | 17.6 | 2.5 | 683.7 |
| Pricing and volume adjustments2 | (5.7) | (0.1) | 3.7 | (1.7) | 0.2 | — | (3.6) |
| Derivative mark-to-market3 | — | (0.3) | — | — | — | — | (0.3) |
| Revenue, excluding mark-to-market | | | | | | | |
| on non-QP hedges | 401.9 | 138.4 | 74.5 | 44.7 | 17.8 | 2.5 | 679.8 |
| Payable metal in concentrate sold4 | 64,888 | 47,178 | 53,167 | 1,787,207 | 653 | | |
| Realized price5 | 6,194 | 2,933 | 1,401 | 25.00 | 27,166 | | |
| Realized price6 | 2.81 | 1.33 | — | — | 12.32 | | |
| Three months ended June 30, 2018 |
| | | | | | | | |
| (in $ millions)1 | Copper | Zinc | Gold | Silver | Molybdenum | Other | Total |
| Revenue per financial statements | 242.8 | 93.3 | 41.6 | 19.0 | — | 1.5 | 398.2 |
| Pricing and volume adjustments2 | (1.7) | (1.7) | 0.1 | (1.2) | — | (0.1) | (4.6) |
| Derivative mark-to-market3 | — | 1.3 | — | — | — | — | 1.3 |
| Revenue, excluding mark-to-market | | | | | | | |
| on non-QP hedges | 241.1 | 92.9 | 41.7 | 17.8 | — | 1.4 | 394.9 |
| Payable metal in concentrate sold4 | 35,471 | 28,168 | 29,696 | 689,484 | — | — | — |
| Realized price5 | 6,798 | 3,299 | 1,404 | 25.81 | — | — | — |
| Realized price6 | 3.08 | 1.50 | — | — | — | — | — |
| Six months ended June 30, 2018 |
| | | | | | | | |
| (in $ millions)1 | Copper | Zinc | Gold | Silver | Molybdenum | Other | Total |
| Revenue per financial statements | 499.6 | 184.2 | 78.2 | 41.2 | 3.3 | 2.4 | 808.9 |
| Pricing and volume adjustments2 | (4.7) | (1.3) | (1.6) | 2.2 | 0.6 | — | (4.8) |
| Derivative mark-to-market3 | — | 1.8 | — | — | — | — | 1.8 |
| Revenue, excluding mark-to-market | | | | | | | |
| on non-QP hedges | 494.9 | 184.7 | 76.6 | 43.4 | 3.9 | 2.4 | 805.9 |
| Payable metal in concentrate sold4 | 71,977 | 53,620 | 55,753 | 1,575,940 | 137 | — | — |
| Realized price5 | 6,875 | 3,444 | 1,375 | 27.58 | 28,511 | — | — |
| Realized price6 | 3.12 | 1.56 | — | — | 12.93 | — | — |
1 | Average realized price per unit sold may not calculate based on amounts presented in this table due to rounding. |
2 | Pricing and volume adjustments represents mark-to-market adjustments on provisionally priced sales, realized and unrealized changes to fair value for non-hedge derivative contracts and adjustments to originally invoiced weights and assays. |
3 | Derivative mark-to-market excludes mark-to-market on QP hedges. |
4 | Copper and zinc shown in metric tonnes and gold and silver shown in ounces. |
5 | Realized price for copper, zinc and molybdenum in $/metric tonne and realized price for gold and silver in $/oz. |
| 6 | Realized price for copper, zinc and molybdenum in $/lb. |
24
The price, quantity and mix of metals sold, affect our revenue, operating cash flow and profit. Revenue from metals sales can vary from quarter to quarter due to production levels, shipping volumes and transfer of risk and title to customers.
Stream Sales
The following table shows stream sales included within realized prices and their respective deferred revenue and cash payment rates:
| | | Three months ended | Six months ended |
| | | Jun. 30, 2019 | Jun. 30, 2019 |
| | | Manitoba | Peru | Manitoba | Peru |
| Gold | oz | 5,294 | 2,404 | 8,908 | 5,910 |
| Silver | oz | 108,667 | 477,927 | 208,100 | 1,212,452 |
| Gold deferred revenue drawdown rate1,2 | $/oz | 1,168 | 948 | 1,172 | 948 |
| Gold cash rate3 | $/oz | 416 | 400 | 416 | 400 |
| Silver deferred revenue drawdown rate1,2 | $/oz | 22.34 | 21.77 | 22.42 | 21.77 |
| Silver cash rate3 | $/oz | 6.14 | 5.90 | 6.14 | 5.90 |
| | | Three months ended | Six months ended |
| | | Jun. 30, 2018 | Jun. 30, 2018 |
| | | Manitoba | Peru | Manitoba | Peru |
| Gold | oz | 3,812 | 2,172 | 8,944 | 5,419 |
| Silver | oz | 69,565 | 409,802 | 222,471 | 984,194 |
| Gold deferred revenue drawdown rate1 | $/oz | 1,265 | 967 | 1,279 | 967 |
| Gold cash rate3 | $/oz | 412 | 400 | 412 | 400 |
| Silver deferred revenue drawdown rate1 | $/oz | 24.60 | 21.79 | 24.84 | 21.79 |
| Silver cash rate3 | $/oz | 6.08 | 5.90 | 6.08 | 5.90 |
| 1 | For the three and six months ended June 30, 2019 deferred revenue amortization is recorded in Manitoba at C$1,562/oz and C$29.89/oz for gold and silver (June 30, 2018 - C$1,635/oz and C$31.88/oz for gold and silver), respectively, and converted to US dollars at the exchange rate in effect at the time of revenue recognition. |
| 2 | Deferred revenue drawdown rates for gold and silver do not include variable consideration adjustments. |
| 3 | The gold and silver cash rate for Manitoba increased by 1% from $400/oz and $5.90/oz effective August 1, 2015. Subsequently every year, on August 1, the cash rate will increase by 1% compounded. The weighted average cash rate is disclosed. |
25
Cost of Sales
Our detailed cost of sales is summarized as follows:
| | Three months ended | Six months ended |
| | Jun. 30, | | Jun. 30, | |
| (in thousands) | 2019 | Jun. 30, 2018 | 2019 | Jun. 30, 2018 |
| Peru | | | | |
| Mining | 21,725 | 23,513 | 45,611 | 47,351 |
| Milling | 42,953 | 42,193 | 77,989 | 74,644 |
| Changes in product inventory | 1,680 | (5,289) | (5,647) | (6,670) |
| Depreciation and amortization | 55,636 | 51,563 | 104,953 | 105,259 |
| G&A | 14,677 | 12,494 | 27,203 | 29,950 |
| Freight, royalties and other charges | 13,616 | 12,714 | 27,690 | 27,097 |
| Total Peru cost of sales | 150,287 | 137,188 | 277,799 | 277,631 |
| Manitoba | | | | |
| Mining | 51,466 | 42,007 | 97,112 | 86,750 |
| Milling | 11,918 | 13,080 | 23,755 | 26,167 |
| Zinc plant | 17,213 | 17,928 | 34,244 | 36,762 |
| ��Purchased ore and concentrate (before | | | | |
| inventory changes) | — | 9,747 | — | 17,275 |
| Changes in product inventory | (1,107) | 3,712 | (10,996) | (5,732) |
| Depreciation and amortization | 35,558 | 31,989 | 63,372 | 58,901 |
| G&A | 10,786 | 11,671 | 24,067 | 25,144 |
| Freight, royalties and other charges | 10,150 | 11,505 | 17,365 | 21,814 |
| Total Manitoba cost of sales | 135,984 | 141,639 | 248,919 | 267,081 |
| Cost of sales | 286,271 | 278,827 | 526,718 | 544,712 |
Total cost of sales for the second quarter of 2019 was $286.3 million, reflecting an increase of $7.4 million from the second quarter of 2018. Cost of sales related to Peru increased for the second quarter of 2019 compared to the same period of 2018 by $13.1 million. The increase is primarily the result of an increase in product inventory in the second quarter of 2018 and higher depreciation. In Manitoba, cost of sales decreased by $5.7 million compared to the second quarter of 2018 primarily as a result of the closure of the Reed mine and the associated elimination of Reed ore purchases, as well as lower milling, freight, royalties and other charges. This decrease was partially offset by higher depreciation costs and mining costs.
For details on unit operating costs refer to the respective tables in the “Operations Review” section of this MD&A.
For the second quarter of 2019, other significant variances in expenses from operations, compared to the same period in 2018, include the following:
| – | Selling and administrative expensesincreased by $4.3 million compared to the same period in 2018. This increase was mainly due to costs of $3.0 million associated with the recent proxy contest as well as fees associated with the purchase of UCM's remaining interest in the Rosemont project. |
| |
| – | Other operating expensesincreased by $28.7 million compared to the second quarter of 2018 primarily as a result of the write down of the UCM receivable for $26.0 million and other regional costs. |
| |
| – | Other finance lossesincreased by $11.0 million compared to the same period in 2018 as a result of: |
| |
| | – | decreased foreign exchange gains of $6.6 million when compared to the same period last year, related to foreign exchange rate movements impacting certain monetary assets in the Manitoba business unit; and |
| | – | net gains on the Company's financial assets and liabilities recognized at fair value through profit or loss decreased by $4.4 million when compared to the same period last year. |
26
For 2019 year-to-date, other significant variances in expenses from operations, compared to 2018, include the following:
– | Selling and administrative expensesincreased by $13.5 million compared to the same period in 2018. This increase was due mainly to higher stock based compensation charges as a result of the revaluation of previously issued shares to higher share prices during the current year compared to the prior year, as well as costs associated with the recent proxy contest. |
| | |
– | Other operating expensesincreased by $32.5 million primarily as a result of the write down of the UCM receivable for $26.0 million, as well as losses on disposition of certain fixed assets and other regional costs. |
| | |
– | Finance expensesincreased by $7.0 million primarily due to an increase in non-cash financing charges for our precious metals steam contracts in 2019. This charge was the result of the deferred revenue adjustments for the 777 stream arrangement driven by an increase in 777's reserve and resource estimates. |
| | |
– | Other finance gainsdecreased by $16.6 million as a result of: |
| | |
| – | decreased foreign exchange gains of $11.5 million when compared to the same period last year, related to foreign exchange rate movements impacting certain monetary assets in the Manitoba business unit; and |
| | | |
| – | net gains on the Company's financial assets and liabilities recognized at fair value through profit or loss decreased by $5.1 million when compared to the same period last year. |
Tax Expense (Recovery)
For the three and six months ended June 30, 2019, tax expense decreased by $14.9 million and 51.3 million compared to the same period in 2018. The following table provides further details:
| | | Three months ended | | | Six months ended |
| | | Jun. 30, | | | | | | Jun. 30, | | | |
| (in $ thousands) | | 2019 | | | Jun. 30, 2018 | | | 2019 | | | Jun. 30, 2018 |
| Deferred tax (recovery) expense - income tax1 | $ | 9,358 | | $ | 16,048 | | $ | (3,020) | | $ | 25,084 |
| Deferred tax (recovery) expense - mining tax1 | | (5,340) | | | (188) | | | (2,331) | | | (488) |
| Total deferred tax (recovery) expense | | 4,018 | | | 15,860 | | | (5,351) | | | 24,596 |
| Current tax expense - income tax | | (1,417) | | | 1,682 | | | 4,591 | | | 17,661 |
| Current tax (recovery) expense - mining tax | | 7,613 | | | 7,582 | | | 6,278 | | | 14,525 |
| Total current tax expense | | 6,196 | | | 9,264 | | | 10,869 | | | 32,186 |
| | | | | | | | | | | | |
| Tax (recovery) expense | $ | 10,214 | | $ | 25,124 | | $ | 5,518 | | $ | 56,782 |
| 1 | Deferred tax expense (recovery) represents our draw down/increase of non-cash deferred income and mining tax assets/liabilities. |
27
Income Tax Expense
Applying the estimated Canadian statutory income tax rate of 27.0% to our loss before taxes of $62.0 million for the year-to-date period in 2019 would have resulted in a tax recovery of approximately $16.7 million; however, we recorded an income tax expense of $1.6 million. The significant items causing our effective income tax rate to be different than the 27.0% estimated Canadian statutory income tax rate include:
| – | Certain deductible temporary differences with respect to Manitoba, mostly relating to decommissioning and restoration liabilities, were not recognized as we have determined that it is not probable that we will realize the recovery of these deferred tax assets based on the timing of the reversals of the deductible temporary differences and the future projected taxable profit of the Manitoba operations. Adjusted for the average annual effective tax rate methodology, this resulted in an increase in deferred tax expense of approximately $12.2 million; |
| – | The write down of the UCM receivable of $26.0 million is not deductible for local income tax purposes and therefore results in an increase in deferred tax expense of approximately $7.0 million; |
| – | Certain deductible temporary differences with respect to Peru, mostly relating to decommissioning and restoration liabilities, were not recognized as we have determined that it is not probable that we will realize the recovery of these deferred tax assets based on the timing of the reversals of the deductible temporary differences and the future projected taxable profit of the Peru operations. This resulted in an increase in deferred tax expense of approximately $3.3 million; and |
| – | A decrease in the deferred tax expense of $5.3 million is due to the fact that certain Canadian non-monetary assets are recognized at historical cost while the tax bases of the underlying assets change as exchange rates fluctuate, giving rise to temporary differences. |
Mining Tax Expense
Applying the estimated Manitoba mining tax rate of 10.0% to our loss before taxes of $62.0 million for the year-to-date period in 2019 would have resulted in a tax recovery of approximately $6.2 million and we recorded a mining tax expense of $4.0 million. Effective mining tax rates can vary significantly based on the composition of our earnings and the expected amount of mining taxable profits. Corporate costs and other costs not related to mining operations are not deductible in computing mining profits. A brief description of how mining taxes are calculated in our various business units is discussed below.
Manitoba
The Province of Manitoba imposes mining tax on profit related to the sale of mineral products mined in the Province of Manitoba (mining taxable profit) at the following rates:
| – | 10% of total mining taxable profit if mining profit is C$50 million or less; |
| – | 15% of total mining taxable profit if mining profits are between C$55 million and C$100 million; and |
| – | 17% of total mining taxable profit if mining profits exceed C$105 million. |
We estimate that the tax rate that will be applicable when temporary differences reverse will be approximately 10.0% .
Peru
The Peruvian government imposes two parallel mining tax regimes, the Special Mining Tax and the Modified Royalty, on companies' operating mining income on a sliding scale, with progressive rates ranging from 2.0% to 8.4% and 1.0% to 12.0%, respectively. Based on financial forecasts, we have recorded a deferred tax liability as at June 30, 2019, at the tax rate we expect to apply when temporary differences reverse.
28
LIQUIDITY AND CAPITAL RESOURCES
Senior Secured Revolving Credit Facilities
We have two revolving credit facilities (the “Credit Facilities”) for our Canadian and Peruvian businesses, with combined total availability of $550 million and substantially similar terms and conditions. As at June 30, 2019, between our Credit Facilities we have drawn $128.8 million in letters of credit, leaving total undrawn availability of $421.2 million. As at June 30, 2019, we were in compliance with our covenants under the Credit Facilities.
Financial Condition
Financial Condition as at June30, 2019 compared to December31, 2018
Cash and cash equivalents decreased by $26.0 million during the first half of the year to $489.5 million as at June 30, 2019. This decrease was mainly a result of $92.3 million of funding for capital investments primarily at our Peru and Manitoba operations, our acquisition of the remaining interest in the Rosemont project for $45.0 million and cash used in financing activities of $64.3 million. This decrease was partially offset by cash flow from operating activities of $168.7 million. We hold the majority of our cash and cash equivalents in low-risk, liquid investments with major Canadian and Peruvian financial institutions.
Working capital decreased by $17.2 million to $428.1 million from December 31, 2018 to June 30, 2019, primarily due to the decrease in our cash and cash equivalents position by $26.0 million, as well as a decrease in our current receivables by $31.3 million primarily as a result of a reduction in trade receivables. This decrease in working capital was partially offset by an increase in current inventories of $29.4 million as a result of the timing of zinc and copper metal and concentrate shipments, as well as an increase in zinc and copper concentrate work in progress and stockpile inventories during 2019.
Cash Flows
The following table summarizes our cash flows for the three and six months ended June 30, 2019 and June 30, 2018:
| | Three months ended | Six months ended |
| | Jun. 30, | Jun. 30, | Jun. 30, | Jun. 30, |
| (in $ thousands) | 2019 | 2018 | 2019 | 2018 |
| Operating cash flow before changes in non-cash working capital | 81,146 | 131,635 | 170,740 | 263,428 |
| Change in non-cash working capital | 25,863 | (34,595) | (2,032) | (35,024) |
| Cash generated from operating activities | 107,009 | 97,040 | 168,708 | 228,404 |
| Cash (used in) generated by investing activities | (90,881) | (39,175) | (130,144) | (85,149) |
| Cash (used in) generated by financing activities | (12,089) | (11,514) | (64,342) | (60,253) |
| Effect of movement in exchange rates on cash and cash equivalents | (379) | 429 | (192) | 75 |
| (Decrease) increase in cash and cash equivalents | 3,660 | 46,780 | (25,970) | 83,077 |
29
Cash Flow from Operating Activities
Cash generated from operating activities was $107.0 million during the second quarter of 2019, an increase of $10.0 million compared with the same period last year. Operating cash flow before change in non-cash working capital was $81.1 million during the second quarter of 2019, reflecting a decrease of $50.5 million compared to the second quarter of 2018, which was offset by favourable working capital movements in the second quarter of 2019 compared to the same quarter of 2018. The decrease in operating cash flow is the result of lower realized prices and lower sales volumes of copper and zinc, as well as higher cash costs when compared to the second quarter of 2018. The decrease is partially offset by higher realized prices and higher sales volumes for gold.
Year-to-date cash generated from operating activities was $168.7 million in the first half of 2019, a decrease of $59.7 million compared to 2018. Operating cash flow before changes in non-cash working capital was $170.7 million year-to-date in 2019, a decrease of $92.7 million compared to 2018. The year-to-date decrease in operating cash flow is due to the same reasons described above for the quarter over quarter change.
Cash Flow from Investing and Financing Activities
During the second quarter of 2019, we used $103.0 million in investing and financing activities, primarily driven by $50.0 million of capital expenditures, $44.7 million net paid for the acquisition of the remaining interest in the Rosemont project, finance lease payments of $7.4 million and net financing fees paid of $4.7 million.
Year-to-date, we used $194.5 million of cash in investing and financing activities, primarily driven by $92.3 million of capital expenditures, $44.7 million paid for the acquisition of the remaining interest in the Rosemont project, interest payments of $37.4 million, finance lease payments of $14.8 million and net financing fees paid of $10.2 million.
30
Capital Expenditures
The following summarizes accrued and cash additions to capital assets for the periods indicated:
| | Three months ended | Six months ended | Guidance |
| | Jun. 30, | Jun. 30, | Jun. 30, | Jun. 30, | Annual1 |
| (in $ millions) | 2019 | 2018 | 2019 | 2018 | 2019 |
| Manitoba sustaining capital expenditures | 27.1 | 23.6 | 51.2 | 43.8 | 100.0 |
| Peru sustaining capital expenditures2 | 18.1 | 8.5 | 28.5 | 17.8 | 95.0 |
| Total sustaining capital expenditures | 45.2 | 32.1 | 79.7 | 61.6 | 195.0 |
| Arizona capitalized costs3 | 8.8 | 5.0 | 13.4 | 10.4 | 50.0 |
| Peru growth capitalized expenditures | 0.3 | 0.4 | 0.6 | 1.8 | 45.0 |
| Manitoba growth capitalized expenditures | 3.1 | 8.4 | 3.2 | 17.0 | 10.0 |
| Other capitalized costs4 | 12.2 | 0.1 | 23.1 | 3.3 | |
| Capitalized exploration | 1.1 | 0.1 | 2.0 | 1.3 | 15.0 |
| Capitalized interest | 3.3 | 3.3 | 6.6 | 6.6 | |
| Total other capitalized costs | 28.8 | 17.3 | 48.9 | 40.4 | |
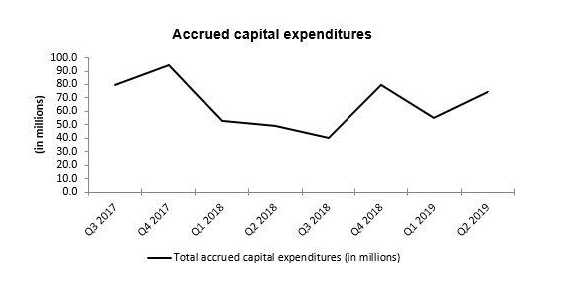
| Total accrued capital additions | 74.0 | 49.4 | 128.6 | 102.0 | |
| Reconciliation to cash capital additions: | | | | | |
| Decommissioning and restoration obligation | (11.8) | 0.3 | (26.5) | (0.8) | |
| Capitalized interest | (3.3) | (3.3) | (6.6) | (6.6) | |
| ROU asset additions | (2.1) | — | (4.6) | — | |
| Changes in capital accruals and other | (6.8) | (6.3) | 1.4 | (8.0) | |
| Total cash capital additions | 50.0 | 40.1 | 92.3 | 86.6 | |
| 1 | Sustaining capital expenditure guidance excludes capitalized interest. |
| 2 | Peru sustaining capital expenditures includes capitalized stripping costs. |
| 3 | Initial guidance of $20.0 million. |
| 4 | Other capitalized costs include decommissioning and restoration adjustments. |
Sustaining capital expenditures in Manitoba for the three and six months ended June 30, 2019 were $27.1 million and $51.2 million, respectively, an increase of $3.5 million and $7.4 million compared to the same periods in 2018. The increase in Manitoba sustaining capital expenditures compared to the same periods last year was due to increased capital development expenditures at Lalor.
Sustaining capital expenditures in Peru for the three and six months ended June 30, 2019 were $18.1 million and $28.5 million, respectively, which is an increase of $9.6 million and $10.7 million compared to the same periods in 2018. The increase in Peru sustaining capital expenditures compared to the same periods last year was the result of increased civil works projects.
As disclosed in March 2019, the Board approved a $122 million early works program for Rosemont in addition to the $20 million of initial guidance for Arizona capitalized costs. As a result of the Court's ruling issued on July 31, 2019, we have suspended most of the early works activities and now expect Rosemont project spending of approximately $30 million in 2019, together with $20 million of non-project spending.
31
Capital Commitments
As at June 30, 2019, we had outstanding capital commitments in Canada of approximately $5.1 million primarily related to Lalor mine equipment, all of which can be terminated, approximately $37.0 million in Peru primarily related to exploration option agreements, all of which can be terminated, and approximately $207.5 million in Arizona, primarily related to our Rosemont project, of which approximately $87.3 million cannot be terminated.
Contractual Obligations
The following table summarizes our significant contractual obligations as at June 30, 2019:
| | | Less than | 13 - 36 | 37 - 60 | More than |
| Payment Schedule (in $ millions) | Total | 12 months | months | months | 60 months |
| Long-term debt obligations1 | 1,400.8 | 79.6 | 154.9 | 520.5 | 645.8 |
| Lease obligations | 138.1 | 45.2 | 77.2 | 11.4 | 4.3 |
| Purchase obligation - capital commitments | 249.6 | 47.7 | 51.7 | 4.9 | 145.3 |
| Purchase obligation - other commitments2 | 687.4 | 247.6 | 221.3 | 131.1 | 87.4 |
| Pension and other employee future benefits obligations3 | 135.0 | 14.9 | 31.2 | 6.8 | 82.1 |
| Decommissioning and restoration obligations4 | 206.9 | 1.4 | 0.9 | 8.8 | 195.8 |
| Total | 2,817.8 | 436.4 | 537.2 | 683.5 | 1,160.7 |
| 1 | Long-term debt obligations include scheduled interest payments, as well as principal repayments. |
| 2 | Primarily made up of long-term agreements with operational suppliers, obligations for power purchase, concentrate handling, fleet and port |
| | services, as well as deferred consideration arising from the acquisition of Rosemont's minority interest. |
| 3 | Discounted. |
| 4 | Before inflation. |
In addition to the contractual obligations included in the above payment schedule, we also have the following commitments which impact our financial position:
| – | A profit-sharing plan with most Manitoba employees; |
| – | A profit-sharing plan with all Peru employees; |
| – | Wheaton Precious Metals precious metals stream agreements for the 777 mine and Constancia mines; |
| – | A net smelter returns royalty agreement related to the 777 mine; and, |
| – | Various royalty agreements related to the Constancia mine. |
32
Liquidity
As at June 30, 2019, we had total liquidity of approximately $910.7 million, including $489.5 million in cash and cash equivalents, as well as $421.2 million in availability under our Credit Facilities. We expect that our current liquidity and future cash flows will be sufficient to meet our obligations in the coming year.
Outstanding Share Data
As of August 7, 2019, there were 261,272,151 common shares of Hudbay issued and outstanding.
TREND ANALYSIS AND QUARTERLY REVIEW
The following table sets forth selected consolidated financial information for each of our eight most recently completed quarters:
| | | | | | | | |
| | 2019 | | 2018 | | | 2017 | |
| (in $ millions) | Q2 | Q1 | Q4 | Q3 | Q2 | Q1 | Q4 | Q3 |
| Revenue | 329.4 | 292.3 | 351.8 | 362.6 | 371.3 | 386.7 | 424.4 | 380.2 |
| Gross margin | 43.1 | 51.8 | 75.2 | 85.3 | 92.5 | 120.8 | 145.0 | 119.6 |
| Profit (loss) before tax | (43.9) | (18.1) | 17.7 | 30.3 | 49.8 | 73.1 | 79.6 | 53.8 |
| (Loss) profit | (54.1) | (13.4) | (3.5) | 22.8 | 24.7 | 41.4 | 94.3 | 36.3 |
| (Loss) earnings per share: | | | | | | | | |
| Basic and Diluted | (0.21) | (0.05) | (0.01) | 0.09 | 0.09 | 0.16 | 0.36 | 0.15 |
| Operating cash flow1 | 81.1 | 89.6 | 107.9 | 122.1 | 131.6 | 131.8 | 171.9 | 153.9 |
| 1 | Operating cash flow before changes in non-cash working capital |
Revenues were higher in the second quarter of 2019 compared to the first quarter of 2019 mostly as a result of a deferred revenue adjustment in the first quarter of 2019. 2019 revenues are lower than previous years as a result of lower sales volumes of copper and zinc metal mainly due to lower grades of copper and lower base metal prices compared to 2018 and 2017. Earnings in the second quarter of 2019 were impacted by a write down of $26.0 million related to the UCM receivable which was exchanged for higher ownership in the Rosemont project prior to purchasing the remaining interest from UCM on April 25, 2019. Operating cash flow before changes in non-cash working capital compared to prior periods was also lower given the lower revenues. In the first quarter of 2019, pre-tax revenue and finance expenses were negatively impacted by a $22.3 million charge due to a deferred revenue adjustment arising from higher reserves and resources. In addition, in the first quarter of 2019, there was an additional delivery obligation of $7.5 million related to the expectation that mining of the Pampacancha deposit will not begin until 2020.
Revenue and operating cash flow were relatively consistent in 2018, following strong production and sales volumes in the fourth quarter of 2017.
For information on previous trends and quarterly reviews, refer to our MD&A dated for the year ended December 31, 2018 dated February 19, 2019.
33
NON-IFRS FINANCIAL PERFORMANCE MEASURES
Net debt is shown because it is a performance measure used by the Company to assess our financial position. Cash cost, sustaining and all-in sustaining cash cost per pound of copper produced are shown because we believe they help investors and management assess the performance of our operations, including the margin generated by the operations and the Company. Cash cost and sustaining cash cost per pound of zinc produced are shown because we believe they help investors and management assess the performance of our Manitoba operations. These measures do not have a meaning prescribed by IFRS and are therefore unlikely to be comparable to similar measures presented by other issuers. These measures should not be considered in isolation or as a substitute for measures prepared in accordance with IFRS and are not necessarily indicative of operating profit or cash flow from operations as determined under IFRS. Other companies may calculate these measures differently.
Net Debt
The following table presents our calculation of net debt as at June 30, 2019 and December 31, 2018:
| | Jun. 30, | Dec. 31, |
| (in $ thousands) | 2019 | 2018 |
| Total long-term debt | 977,196 | 981,030 |
| Cash and cash equivalents | (489,527) | (515,497) |
| Net debt | 487,669 | 465,533 |
Cash Cost, Sustaining and All-in Sustaining Cash Cost (Copper Basis)
Cash cost per pound of copper produced (“cash cost”) is a non-IFRS measure that management uses as a key performance indicator to assess the performance of our operations. Our calculation designates copper as our primary metal of production as it has been the largest component of revenues. The calculation is presented in four manners:
– | Cash cost, before by-product credits- This measure is gross of by-product revenues and is a function of the efforts and costs incurred to mine and process all ore mined. However, the measure divides this aggregate cost over only pounds of copper produced, our primary metal of production. This measure is generally less volatile from period to period, as it is not affected by changes in the price received for by- product metals. It is, however, significantly affected by the relative mix of copper concentrate and finished zinc production, where the sale of the zinc will occur later, and an increase in production of zinc metal will tend to result in an increase in cash cost under this measure. |
| | |
– | Cash cost, net of by-product credits- In order to calculate the net cost to produce and sell copper, the net of by-product credits measure subtracts the revenues realized from the sale of the metals other than copper. The by-product revenues from zinc, gold, and silver are significant and are integral to the economics of our operations. The economics that support our decision to produce and sell copper would be different if we did not receive revenues from the other significant metals being extracted and processed. This measure provides management and investors with an indication of the minimum copper price consistent with positive operating cash flow and operating margins, assuming realized by-product metal prices are consistent with those prevailing during the reporting period. It also serves as an important operating statistic that management and investors utilize to measure our operating performance versus that of our competitors. However, it is important to understand that if by-product metal prices decline alongside copper prices, the cash cost net of by-product credits would increase, requiring a higher copper price than that reported to maintain positive cash flows and operating margins. |
| |
– | Sustaining cash cost, net of by-product credits- This measure is an extension of cash cost that includes sustaining capital expenditures, capitalized exploration and net smelter returns royalties. It does not include corporate selling and administrative expenses. It provides a more fulsome measurement of the cost of sustaining production than cash cost, which is focused on operating costs only. |
| | |
– | All-in sustaining cash cost, net of by-product credits- This measure is an extension of sustaining cash cost that includes corporate G&A and regional costs. Due to the inclusion of corporate selling and administrative expenses, all-in sustaining cash cost is presented on a consolidated basis only. |
34
The tables below present a detailed build-up of cash cost and sustaining cash cost, net of by-product credits, by business unit in addition to consolidated all-in sustaining cash cost, net of by-product credits, and reconciliations between cash cost, net of by-product credits, to the most comparable IFRS measures of cost of sales for the three and six months ended June 30, 2019 and 2018. Cash cost, net of by-product credits may not calculate exactly based on amounts presented in the tables below due to rounding.
| Consolidated | Three months ended | Six months ended |
| Net pounds of copper produced | | | | |
| (in thousands) | Jun. 30, 2019 | Jun. 30, 2018 | Jun. 30, 2019 | Jun. 30, 2018 |
| Peru | 53,423 | 59,122 | 123,624 | 128,681 |
| Manitoba | 13,517 | 23,825 | 27,029 | 40,702 |
| Net pounds of copper produced | 66,940 | 82,947 | 150,653 | 169,383 |
| Consolidated | | Three months ended | | | Six months ended | |
| | Jun. 30, 2019 | Jun. 30, 2018 | Jun. 30, 2019 | Jun. 30, 2018 |
| Cash cost per pound of | | | | | | | |
| copper produced | $000s | $/lb | $000s | $/lb | $000s | $/lb | $000s | $/lb |
| Cash cost, before | | | | | | | | |
| by-product credits | 212,067 | 3.17 | 214,636 | 2.59 | 409,626 | 2.72 | 430,795 | 2.54 |
| By-product credits, net of | | | | | | | |
| deferred revenue | (126,795) | (1.89) | (134,932) | (1.63) | (231,024) | (1.53) | (266,009) | (1.57) |
| Cash cost, net of by- | | | | | | | | |
| product credits | 85,272 | 1.27 | 79,704 | 0.96 | 178,602 | 1.19 | 164,786 | 0.97 |
35
| Consolidated | | | Three months ended | | | Six months ended | |
| | | Jun. 30, 2019 | Jun. 30, 2018 | Jun. 30, 2019 | Jun. 30, 2018 |
| Supplementary cash | | | | | | | | | |
| cost information | | $000s | $/lb1 | $000s | $/lb1 | $000s | $/lb1 | $000s | $/lb1 |
| By-product credits: | | | | | | | | |
| Zinc | | 71,561 | 1.07 | 91,605 | 1.10 | 138,713 | 0.92 | 182,866 | 1.08 |
| Gold3 | | 43,993 | 0.66 | 41,683 | 0.50 | 61,031 | 0.41 | 78,246 | 0.46 |
| Silver3 | | 19,785 | 0.30 | 17,793 | 0.21 | 41,844 | 0.28 | 42,043 | 0.25 |
| Molybdenum & other | 12,754 | 0.19 | 1,413 | 0.02 | 20,245 | 0.13 | 6,352 | 0.04 |
| Total by-product credits | 148,093 | 2.21 | 152,494 | 1.83 | 261,833 | 1.74 | 309,507 | 1.83 |
| Less: deferred revenue3 | (21,298) | (0.32) | (17,562) | (0.20) | (30,809) | (0.20) | (43,498) | (0.26) |
| Total by-product credits, | | | | | | | | |
| net of deferred | | | | | | | | |
| revenue | | 126,795 | 1.89 | 134,932 | 1.63 | 231,024 | 1.53 | 266,009 | 1.57 |
| Reconciliation to IFRS: | | | | | | | | |
| Cash cost, net of by- | | | | | | | | |
| product credits | | 85,272 | | 79,704 | | 178,602 | | 164,786 | |
| By-product credits | | 148,093 | | 152,494 | | 261,833 | | 309,507 | |
| Change in deferred | | | | | | | | |
| revenues | | (21,298) | | (17,562) | | (30,809) | | (43,498) | |
| Treatment and refining | | | | | | | | |
| charges | | (21,940) | | (22,328) | | (42,083) | | (46,431) | |
| Share-based payment | (62) | | (86) | | 365 | | (69) | |
| Inventory adjustments | 219 | | (308) | | 219 | | (147) | |
| Change in product | | | | | | | | |
| inventory | | 573 | | (1,577) | | (16,643) | | (12,402) | |
| Royalties | | 4,220 | | 4,938 | | 6,909 | | 8,806 | |
| Depreciation and | | | | | | | | | |
| amortization2 | | 91,194 | | 83,552 | | 168,325 | | 164,160 | |
| Cost of sales | | 286,271 | | 278,827 | | 526,718 | | 544,712 | |
| 1 | Per pound of copper produced. |
| 2 | Depreciation is based on concentrate sold. |
| 3 | Six months ended June 30, 2019 gold and silver by-product credits and deferred revenue both reflect the $16.3 million revenue adjustment primarily associated with the increase in reserves and resources at the 777 mine. |
| Peru | Three months ended | Six months ended |
| (in thousands) | Jun. 30, 2019 | Jun. 30, 2018 | Jun. 30, 2019 | Jun.30, 2018 |
| Net pounds of copper produced1 | 53,423 | 59,122 | 123,624 | 128,681 |
| 1 | Contained copper in concentrate. |
36
| Peru | | Three months ended | | | Six months ended | |
| | Jun. 30, 2019 | Jun. 30, 2018 | Jun. 30, 2019 | Jun. 30, 2018 |
| Cash cost per pound of | | | | | | | |
| copper produced | $000s | $/lb | $000s | $/lb | $000s | $/lb | $000s | $/lb |
| Mining | 21,725 | 0.41 | 23,513 | 0.40 | 45,611 | 0.37 | 47,351 | 0.37 |
| Milling | 42,953 | 0.80 | 42,193 | 0.71 | 77,989 | 0.63 | 74,644 | 0.58 |
| G&A | 14,468 | 0.27 | 12,821 | 0.22 | 26,908 | 0.22 | 30,106 | 0.23 |
| Onsite costs | 79,146 | 1.48 | 78,527 | 1.33 | 150,508 | 1.22 | 152,101 | 1.18 |
| Treatment & refining | 14,020 | 0.26 | 12,751 | 0.22 | 29,038 | 0.23 | 29,002 | 0.23 |
| Freight & other | 11,765 | 0.22 | 10,251 | 0.17 | 24,519 | 0.20 | 23,195 | 0.18 |
| Cash cost, before | | | | | | | | |
| by-product credits | 104,931 | 1.96 | 101,529 | 1.72 | 204,065 | 1.65 | 204,298 | 1.59 |
| By-product credits, net of | | | | | | | |
| deferred revenue | (17,682) | (0.33) | (4,835) | (0.08) | (33,906) | (0.27) | (16,076) | (0.13) |
| Cash cost, net of by- | | | | | | | | |
| product credits | 87,249 | 1.63 | 96,694 | 1.64 | 170,159 | 1.38 | 188,222 | 1.46 |
| Peru | | Three months ended | | | Six months ended | |
| | Jun. 30, 2019 | Jun. 30, 2018 | Jun. 30, 2019 | Jun. 30, 2018 |
| Supplementary cash | | | | | | | | |
cost information | $000s | $/lb1 | $000s | $/lb1 | $000s | $/lb1 | $000s | $/lb1 |
| By-product credits: | | | | | | | | |
| Gold | 5,364 | 0.10 | 4,363 | 0.07 | 13,768 | 0.11 | 9,657 | 0.07 |
| Silver | 13,692 | 0.26 | 11,540 | 0.20 | 35,873 | 0.29 | 29,045 | 0.23 |
| Molybdenum | 11,310 | 0.21 | (38) | — | 17,736 | 0.14 | 3,906 | 0.03 |
| Total by-product credits | 30,366 | 0.57 | 15,865 | 0.27 | 67,377 | 0.55 | 42,608 | 0.33 |
| Less: deferred revenue | (12,684) | (0.24) | (11,030) | (0.19) | (33,471) | (0.27) | (26,532) | (0.21) |
| Total by-product credits, | | | | | | | | |
net of deferred | | | | | | | | |
| revenue | 17,682 | 0.33 | 4,835 | 0.08 | 33,906 | 0.27 | 16,076 | 0.12 |
| Reconciliation to IFRS: | | | | | | | | |
| Cash cost, net of by- | | | | | | | | |
| product credits | 87,249 | | 96,694 | | 170,159 | | 188,222 | |
| By-product credits | 30,366 | | 15,865 | | 67,377 | | 42,608 | |
| Change in deferred | | | | | | | | |
| revenues | (12,684) | | (11,030) | | (33,471) | | (26,532) | |
| Treatment and refining | | | | | | | | |
| charges | (14,020) | | (12,751) | | (29,038) | | (29,002) | |
| Inventory adjustments | 219 | | (308) | | 219 | | (147) | |
| Share-based payment | (10) | | (19) | | 76 | | (9) | |
| Change in product | | | | | | | | |
| inventory | 1,680 | | (5,289) | | (5,647) | | (6,670) | |
| Royalties | 1,851 | | 2,463 | | 3,171 | | 3,902 | |
| Depreciation and | | | | | | | | |
| amortization2 | 55,636 | | 51,563 | | 104,953 | | 105,259 | |
| Cost of sales | 150,287 | | 137,188 | | 277,799 | | 277,631 | |
| 1 Per pound of copper produced. |
| 2 Depreciation is based on concentrate sold. |
37
| Manitoba | Three months ended | | Six months ended | |
| (in thousands) | Jun. 30, 2019 | Jun. | 30, 2018 | Jun. 30, 2019 | Jun. | 30, 2018 |
| Net pounds of copper produced1 | 13,517 | | 23,825 | 27,029 | | 40,702 |
Contained copper in concentrate.
| Manitoba | | Three months ended | | | Six months ended | |
| | Jun. 30, 2019 | Jun. 30, 2018 | Jun. 30, 2019 | Jun. 30, 2018 |
| Cash cost per pound of | | | | | | | | |
| copper produced | $000s | $/lb | $000s | $/lb | $000s | $/lb | $000s | $/lb |
| Mining | 51,466 | 3.81 | 42,007 | 1.77 | 97,112 | 3.59 | 86,750 | 2.14 |
| Milling | 11,918 | 0.88 | 13,080 | 0.55 | 23,755 | 0.88 | 26,167 | 0.64 |
| Refining (zinc) | 17,213 | 1.27 | 17,928 | 0.75 | 34,244 | 1.27 | 36,762 | 0.90 |
| G&A | 10,838 | 0.80 | 11,738 | 0.49 | 23,778 | 0.88 | 25,204 | 0.62 |
| Purchased ore and zinc | | | | | | | | |
| concentrates | — | 0.00 | 9,747 | 0.41 | — | 0.00 | 17,275 | 0.42 |
| Onsite costs | 91,435 | 6.76 | 94,500 | 3.97 | 178,889 | 6.62 | 192,158 | 4.72 |
| Treatment & refining | 7,920 | 0.59 | 9,577 | 0.40 | 13,045 | 0.48 | 17,429 | 0.43 |
| Freight & other | 7,781 | 0.58 | 9,030 | 0.38 | 13,627 | 0.50 | 16,910 | 0.42 |
| Cash cost, before by- | | | | | | | | |
| product credits | 107,136 | 7.93 | 113,107 | 4.75 | 205,561 | 7.61 | 226,497 | 5.56 |
| By-product credits, net of | | | | | | | | |
| deferred revenue | (109,113) | (8.07) | (130,097) | (5.46) | (197,118) | (7.29) | (249,933) | (6.14) |
| Cash cost, net of by- | | | | | | | | |
| product credits | (1,977) | (0.15) | (16,990) | (0.71) | 8,443 | 0.31 | (23,436) | (0.58) |
38
| Manitoba | | Three months ended | | | Six months ended | |
| | Jun. 30, 2019 | Jun. 30, 2018 | Jun. 30, 2019 | Jun. 30, 2018 |
| Supplementary cash | $000s | $/lb1 | $000s | $/lb1 | $000s | $/lb1 | $000s | $/lb1 |
| cost information | | | | | | | | |
| By-product credits: | | | | | | | | |
| Zinc | 71,561 | 5.29 | 91,605 | 3.84 | 138,713 | 5.13 | 182,866 | 4.49 |
| Gold | 38,629 | 2.86 | 37,320 | 1.57 | 47,263 | 1.75 | 68,589 | 1.69 |
| Silver | 6,093 | 0.45 | 6,253 | 0.26 | 5,971 | 0.22 | 12,998 | 0.32 |
| Other | 1,444 | 0.11 | 1,451 | 0.06 | 2,509 | 0.09 | 2,446 | 0.06 |
| Total by-product credits | 117,727 | 8.71 | 136,629 | 5.73 | 194,456 | 7.19 | 266,899 | 6.56 |
| Less: deferred revenue | (8,614) | (0.64) | (6,532) | (0.27) | 2,662 | 0.10 | (16,966) | (0.42) |
| Total by-product credits, | | | | | | | | |
| net of deferred revenue | 109,113 | 8.07 | 130,097 | 5.46 | 197,118 | 7.29 | 249,933 | 6.14 |
| Reconciliation to IFRS: | | | | | | | | |
| Cash cost, net of by- | | | | | | | | |
| product credits | (1,977) | | (16,990) | | 8,443 | | (23,436) | |
| By-product credits | 117,727 | | 136,629 | | 194,456 | | 266,899 | |
| Change in deferred | | | | | | | | |
| revenues | (8,614) | | (6,532) | | 2,662 | | (16,966) | |
| Treatment and refining | | | | | | | | |
| charges | (7,920) | | (9,577) | | (13,045) | | (17,429) | |
| Share-based payment | (52) | | (67) | | 289 | | (60) | |
| Change in product | | | | | | | | |
| inventory | (1,107 ) | | 3,712 | | (10,996) | | (5,732) | |
| Royalties | 2,369 | | 2,475 | | 3,738 | | 4,904 | |
| Depreciation and | | | | | | | | |
| amortization2 | 35,558 | | 31,989 | | 63,372 | | 58,901 | |
| Cost of sales | 135,984 | | 141,639 | | 248,919 | | 267,081 | |
1 Per pound of copper produced.
2Depreciation is based on concentrate sold.
| Consolidated | | Three months ended | | | Six months ended | |
| | Jun. 30, 2019 | Jun. 30, 2018 | Jun. 30, 2019 | Jun. 30, 2018 |
| All-in sustaining cash cost per | | | | | | | | |
| pound of copper produced | $000s | $/lb | $000s | $/lb | $000s | $/lb | $000s | $/lb |
| | | | | | | | | |
| Cash cost, net of by-product credits | 85,272 | 1.27 | 79,704 | 0.96 | 178,602 | 1.19 | 164,786 | 0.97 |
| Sustaining capital expenditures | 49,566 | 0.74 | 32,119 | 0.39 | 88,686 | 0.59 | 61,545 | 0.36 |
| Capitalized exploration1 | 1,090 | 0.02 | 69 | — | 1,995 | 0.01 | 1,280 | 0.01 |
| Royalties | 4,220 | 0.06 | 4,938 | 0.06 | 6,909 | 0.05 | 8,806 | 0.05 |
| Sustaining cash cost, net of by- | | | | | | | | |
| product credits | 140,148 | 2.09 | 116,830 | 1.41 | 276,192 | 1.83 | 236,417 | 1.40 |
| Corporate selling and | | | | | | | | |
| administrative expenses & | | | | | | | | |
| regional costs | 11,146 | 0.15 | 7,256 | 0.09 | 27,263 | 0.18 | 13,732 | 0.08 |
| All-in sustaining cash cost, net | | | | | | | | |
| of by-product credits | 151,294 | 2.26 | 124,086 | 1.50 | 303,455 | 2.01 | 250,149 | 1.48 |
1Only includes exploration costs incurred for locations near existing mines
39
| Peru | | Three months ended | | | Six months ended | |
| | Jun. 30, 2019 | Jun. 30, 2018 | Jun. 30, 2019 | Jun. 30, 2018 |
| Sustaining cash cost per pound | | | | | | | | |
| of copper produced | $000s | $/lb | $000s | $/lb | $000s | $/lb | $000s | $/lb |
| Cash cost, net of by-product credits | 87,249 | 1.63 | 96,694 | 1.64 | 170,159 | 1.38 | 188,222 | 1.46 |
| Sustaining capital expenditures | 22,490 | 0.42 | 8,525 | 0.14 | 35,860 | 0.29 | 17,789 | 0.14 |
| Royalties | 1,851 | 0.03 | 2,463 | 0.04 | 3,171 | 0.03 | 3,902 | 0.03 |
| Sustaining cash cost per pound | | | | | | | | |
| of copper produced | 111,590 | 2.09 | 107,682 | 1.82 | 209,190 | 1.69 | 209,913 | 1.63 |
| Manitoba | | Three months ended | | | Six months ended | |
| | Jun. 30, 2019 | Jun. 30, 2018 | Jun. 30, 2019 | Jun. 30, 2018 |
| Sustaining cash cost per pound | | | | | | | | |
| of copper produced | $000s | $/lb | $000s | $/lb | $000s | $/lb | $000s | $/lb |
| Cash cost, net of by-product credits | (1,977) | (0.15) | (16,990) | (0.71 ) | 8,443 | 0.31 | (23,436) | (0.58) |
| Sustaining capital expenditures | 27,076 | 2.00 | 23,594 | 0.99 | 52,826 | 1.95 | 43,756 | 1.09 |
| Capitalized exploration | 1,090 | 0.08 | 69 | — | 1,995 | 0.07 | 1,280 | 0.03 |
| Royalties | 2,369 | 0.18 | 2,475 | 0.10 | 3,738 | 0.14 | 4,904 | 0.11 |
| Sustaining cash cost per pound | | | | | | | | |
| of copper produced | 28,558 | 2.11 | 9,148 | 0.38 | 67,002 | 2.48 | 26,504 | 0.65 |
Zinc Cash Cost and Zinc Sustaining Cash Cost
Cash cost per pound of zinc produced (“zinc cash cost”) is a non-IFRS measure that management uses as a key performance indicator to assess the performance of our Manitoba operations. This alternative cash cost calculation designates zinc as the primary metal of production as it is the largest component of revenues for our Manitoba business unit and should therefore be less volatile over time than Manitoba cash cost per pound of copper. The calculation is presented in three manners:
| – | Zinc cash cost, before by-product credits- This measure is gross of by-product revenues and is a function of the efforts and costs incurred to mine and process all ore mined. However, the measure divides this aggregate cost over only pounds of zinc produced, our primary metal of production. This measure is generally less volatile from period to period, as it is not affected by changes in the price received for by- product metals. It is, however, significantly affected by the relative mix of copper concentrate and finished zinc production, where the sale of the copper will occur later, and an increase in production of copper metal will tend to result in an increase in zinc cash cost under this measure. |
| – | Zinc cash cost, net of by-product credits- In order to calculate the net cost to produce and sell zinc, the net of by-product credits measure subtracts the revenues realized from the sale of the metals other than zinc. The by-product revenues from copper, gold, and silver are significant and are integral to the economics of our Manitoba operation. The economics that support our decision to produce and sell zinc would be different if we did not receive revenues from the other significant metals being extracted and processed. This measure provides management and investors with an indication of the minimum zinc price consistent with positive operating cash flow and operating margins, assuming realized by-product metal prices are consistent with those prevailing during the reporting period. It also serves as an important operating statistic that management and investors utilize to measure our operating performance at our Manitoba operation versus that of our competitors. However, it is important to understand that if by-product metal prices decline alongside zinc prices, the zinc cash cost net of by-product credits would increase, requiring a higher zinc price than that reported to maintain positive cash flows and operating margins. |
40
| – | Zinc sustaining cash cost, net of by-product credits- This measure is an extension of zinc cash cost that includes sustaining capital expenditures, capitalized exploration and net smelter returns royalties. It does not include corporate selling and administrative expenses. It provides a more fulsome measurement of the cost of sustaining production than zinc cash cost, which is focused on operating costs only. |
The tables below present a detailed build-up of zinc cash cost and zinc sustaining cash cost, net of by-product credits, for the Manitoba business unit, and reconciliations between zinc cash cost, net of by-product credits, to the most comparable IFRS measures of cost of sales for the three months ended June 30, 2019 and 2018. Zinc cash cost, net of by-product credits, may not calculate exactly based on amounts presented in the tables below due to rounding.
| Manitoba | Three months ended | Six months ended |
| (in thousands) | Jun. 30, 2019 | Jun.30, 2018 | Jun. 30, 2019 | Jun. 30, 2018 |
| Net pounds of zinc produced1 | 70,191 | 73,127 | 132,002 | 136,581 |
| 1 | Contained zinc in concentrate. |
| Manitoba | | Three months ended | | | Six months ended | |
| | Jun. 30, 2019 | Jun. 30, 2018 | Jun. 30, 2019 | Jun. 30, 2018 |
| Cash cost per pound of | | | | | | | | |
| zinc produced | $000s | $/lb | $000s | $/lb | $000s | $/lb | $000s | $/lb |
| Cash cost, before by- | | | | | | | | |
| product credits1 | 107,136 | 1.53 | 113,107 | 1.55 | 205,561 | 1.56 | 226,497 | 1.66 |
| By-product credits | (80,306) | (1.14) | (105,256) | (1.44) | (136,687) | (1.04) | (177,087) | (1.30) |
| Zinc cash cost, net of | | | | | | | | |
| by-product credits | 26,830 | 0.38 | 7,851 | 0.11 | 68,874 | 0.52 | 49,410 | 0.36 |
1For additional detail on cash cost, before by-product credits please see page 35 of this MD&A.
41
| | | |
| Manitoba | Three months ended | Six months ended |
| | Jun. 30, 2019 | Jun. 30, 2018 | Jun. 30, 2019 | Jun. 30, 2018 |
| Supplementary cash | $000s | $/lb1 | $000s | $/lb1 | $000s | $/lb1 | $000s | $/lb1 |
| cost information | | | | | | | | |
| By-product credits: | | | | | | | | |
| Copper | 42,754 | 0.61 | 66,764 | 0.91 | 78,282 | 0.59 | 110,020 | 0.81 |
| Gold | 38,629 | 0.55 | 37,320 | 0.51 | 47,263 | 0.36 | 68,589 | 0.50 |
| Silver | 6,093 | 0.09 | 6,253 | 0.09 | 5,971 | 0.05 | 12,998 | 0.10 |
| Other | 1,444 | 0.02 | 1,451 | 0.02 | 2,509 | 0.02 | 2,446 | 0.02 |
| Total by-product credits | 88,920 | 1.27 | 111,788 | 1.53 | 134,025 | 1.02 | 194,053 | 1.42 |
| Less: deferred revenue | (8,614) | (0.12) | (6,532) | (0.09) | 2,662 | 0.02 | (16,966) | (0.12) |
| Total by-product credits, | | | | | | | | |
| net of deferred revenue | 80,306 | 1.14 | 105,256 | 1.44 | 136,687 | 1.04 | 177,087 | 1.30 |
| Reconciliation to IFRS: | | | | | | | | |
| Cash cost, net of by- | | | | | | | | |
| product credits | 26,830 | | 7,851 | | 68,874 | | 49,410 | |
| By-product credits | 88,920 | | 111,788 | | 134,025 | | 194,053 | |
| Change in deferred | | | | | | | | |
| revenues | (8,614) | | (6,532) | | 2,662 | | (16,966) | |
| Treatment and refining | | | | | | | | |
| charges | (7,920) | | (9,577) | | (13,045) | | (17,429) | |
| Share-based payment | (52 ) | | (67) | | 289 | | (60) | |
| Change in product | | | | | | | | |
| inventory | (1,107 ) | | 3,712 | | (10,996) | | (5,732) | |
| Royalties | 2,369 | | 2,475 | | 3,738 | | 4,904 | |
| Depreciation and | | | | | | | | |
| amortization2 | 35,558 | | 31,989 | | 63,372 | | 58,901 | |
| Cost of sales | 135,984 | | 141,639 | | 248,919 | | 267,081 | |
1Per pound of zinc produced.
2Depreciation is based on concentrate sold.
| Manitoba | Three months ended | Six months ended |
| | Jun. 30, 2019 | Jun. 30, 2018 | Jun. 30, 2019 | Jun. 30, 2018 |
| Sustaining cash cost per | | | | | | | | |
| pound of zinc | | | | | | | | |
| produced | $000s | $/lb | $000s | $/lb | $000s | $/lb | $000s | $/lb |
| Zinc cash cost, net of by- | | | | | | | | |
| product credits | 26,830 | 0.38 | 7,851 | 0.11 | 68,874 | 0.52 | 49,410 | 0.36 |
| Sustaining capital | | | | | | | | |
| expenditures | 27,076 | 0.39 | 23,594 | 0.32 | 52,826 | 0.40 | 43,756 | 0.32 |
| Capitalized exploration | 1,090 | 0.02 | 69 | — | 1,995 | 0.02 | 1,280 | 0.01 |
| Royalties | 2,369 | 0.03 | 2,475 | 0.03 | 3,738 | 0.03 | 4,904 | 0.04 |
| Sustaining cash cost per | | | | | | | | |
| pound of zinc | | | | | | | | |
| produced | 57,365 | 0.82 | 33,989 | 0.46 | 127,433 | 0.97 | 99,350 | 0.73 |
Combined Unit Cost & Zinc Plant Unit Cost Reconciliation
Combined unit cost (“unit cost”) and zinc plant unit cost is a non-IFRS measure that management uses as a key performance indicator to assess the performance of our mining and milling operations. Combined unit cost and zinc plant unit cost are calculated by dividing the cost of sales by mill throughput. This measure is utilized by management and investors to assess our cost structure and margins and compare it to similar information provided by other companies in our industry. Unlike cash cost, this measure is not impacted by variability in by-product commodity prices since there are no by-product deductions; costs associated with profit-sharing and similar costs are excluded because of their correlation to external metal prices. In addition, the unit costs are reported in the functional currency of the operation which minimizes the impact of foreign currency fluctuations. In all, the unit cost measures provide an alternative perspective on operating cost performance with minimal impact from external market prices.
42
The tables below present a detailed combined unit cost and zinc plant unit costs for the Manitoba business unit and combined unit cost for the Peru business unit, and reconciliations between these measures to the most comparable IFRS measures of cost of sales for the three months ended June 30, 2019 and 2018.
| | | |
| Peru | Three months ended | Six months ended |
| (in thousands except unit cost per tonne) | Jun. 30, | Jun. 30, | Jun. 30, | Jun. 30, |
| Combined unit cost per tonne processed | 2019 | 2018 | 2019 | 2018 |
| Mining | 21,725 | 23,513 | 45,611 | 47,351 |
| Milling | 42,953 | 42,193 | 77,989 | 74,644 |
| G&A1 | 14,468 | 12,821 | 26,908 | 30,106 |
| Less: Other G&A2 | 618 | 1,256 | 192 | (2,273) |
| Unit cost | 79,764 | 79,783 | 150,700 | 149,828 |
| Tonnes ore milled | 7,680 | 7,727 | 15,673 | 15,578 |
| Combined unit cost per tonne | 10.39 | 10.33 | 9.62 | 9.62 |
| | | | | |
| Reconciliation to IFRS: | | | | |
| Unit cost | 79,764 | 79,783 | 150,700 | 149,828 |
| Freight & other | 11,765 | 10,251 | 24,519 | 23,195 |
| Other G&A | (618) | (1,256) | (192) | 2,273 |
| Share-based payment | (10) | (19) | 76 | (9) |
| Inventory adjustments | 219 | (308) | 219 | (147) |
| Change in product inventory | 1,680 | (5,289) | (5,647) | (6,670) |
| Royalties | 1,851 | 2,463 | 3,171 | 3,902 |
| Depreciation and amortization | 55,636 | 51,563 | 104,953 | 105,259 |
| Cost of sales | 150,287 | 137,188 | 277,799 | 277,631 |
G&A as per cash cost reconciliation above.|
2 Other G&A primarily includes profit sharing costs.
43
| | | |
| Manitoba | Three months ended | Six months ended |
| (in thousands except tonnes ore milled and unit cost per tonne) | Jun. 30, | Jun. 30, | Jun. 30, | Jun. 30, |
| Combined unit cost per tonne processed | 2019 | 2018 | 2019 | 2018 |
| Mining | 51,466 | 42,007 | 97,112 | 86,750 |
| Milling | 11,918 | 13,080 | 23,755 | 26,167 |
| G&A1 | 10,838 | 11,738 | 23,778 | 25,204 |
| Less: G&A allocated to zinc metal production | (2,856) | (3,298) | (6,079) | (7,145) |
| Less: Other G&A related to profit sharing costs | (98) | (2,781) | (98) | (4,795) |
| Purchased ore and zinc concentrates | — | 9,747 | — | 17,275 |
| Unit cost | 71,268 | 70,493 | 138,468 | 143,456 |
| USD/CAD implicit exchange rate | 1.34 | 1.29 | 1.33 | 1.28 |
| Unit cost - C$ | 95,342 | 90,941 | 184,670 | 183,323 |
| Tonnes ore milled | 706,633 | 757,602 | 1,317,400 | 1,425,971 |
| Combined unit cost per tonne - C$ | 135 | 120 | 140 | 129 |
| | | | | |
| Reconciliation to IFRS: | | | | |
| Unit cost | 71,268 | 70,493 | 138,468 | 143,456 |
| Freight & other | 7,781 | 9,030 | 13,627 | 16,910 |
| Refined (zinc) | 17,213 | 17,928 | 34,244 | 36,762 |
| G&A allocated to zinc metal production | 2,856 | 3,298 | 6,079 | 7,145 |
| Other G&A related to profit sharing | 98 | 2,781 | 98 | 4,795 |
| Share-based payment | (52 ) | (67) | 289 | (60) |
| Change in product inventory | (1,107 ) | 3,712 | (10,996) | (5,732) |
| Royalties | 2,369 | 2,475 | 3,738 | 4,904 |
| Depreciation and amortization | 35,558 | 31,989 | 63,372 | 58,901 |
| Cost of sales | 135,984 | 141,639 | 248,919 | 267,081 |
G&A as per cash cost reconciliation above.
44
| |
| Manitoba | Three months ended | Six months ended |
| (in thousands except zinc plant unit cost per pound) | Jun. 30, | Jun. 30, | Jun. 30, | Jun. 30, |
| Zinc plant unit cost | 2019 | 2018 | 2019 | 2018 |
| Zinc plant costs | 17,213 | 17,928 | 34,244 | 36,762 |
| G&A1 | 10,838 | 11,738 | 23,778 | 25,204 |
| Less: G&A allocated to other areas | (7,884) | (5,659) | (17,601) | (13,264) |
| Less: Other G&A related to profit sharing | (98) | (2,781) | (98) | (4,795) |
| Zinc plant unit cost | 20,069 | 21,226 | 40,323 | 43,907 |
| USD/CAD implicit exchange rate | 1.34 | 1.29 | 1.33 | 1.28 |
| Zinc plant unit cost - C$ | 26,847 | 27,385 | 53,762 | 56,047 |
| Refined metal produced (in pounds) | 60,598 | 56,262 | 112,890 | 112,107 |
| Zinc plant unit cost per pound - C$ | 0.44 | 0.49 | 0.48 | 0.50 |
| Reconciliation to IFRS: | | | | |
| Zinc plant unit cost | 20,069 | 21,226 | 40,323 | 43,907 |
| Freight & other | 7,781 | 9,030 | 13,627 | 16,910 |
| Mining | 51,466 | 42,007 | 97,112 | 86,750 |
| Milling | 11,918 | 13,080 | 23,755 | 26,167 |
| Purchased ore and zinc concentrates | — | 9,747 | — | 17,275 |
| G&A allocated to other areas | 7,884 | 5,659 | 17,601 | 13,264 |
| Other G&A related to profit sharing | 98 | 2,781 | 98 | 4,795 |
| Share-based payment | (52 ) | (67) | 289 | (60) |
| Change in product inventory | (1,107 ) | 3,712 | (10,996) | (5,732) |
| Royalties | 2,369 | 2,475 | 3,738 | 4,904 |
| Depreciation and amortization | 35,558 | 31,989 | 63,372 | 58,901 |
| Cost of sales | 135,984 | 141,639 | 248,919 | 267,081 |
| 1G&A as per cash cost reconciliation above. |
ACCOUNTING CHANGES AND CRITICAL ESTIMATES
New standards and interpretations not yet adopted
As of January 1, 2019, we have adopted IFRS 16, Leases (“IFRS 16”).
For information on new standards and interpretations not yet adopted, refer to note 4 of our June 30, 2019 consolidated interim financial statements.
Estimates and judgements
For information on significant areas requiring us to make estimates and judgements, refer to note 2 of our June 30, 2019 condensed consolidated interim financial statements.
CHANGES IN INTERNAL CONTROL OVER FINANCIAL REPORTING
Management is responsible for establishing and maintaining adequate internal control over financial reporting (“ICFR”). ICFR is designed to provide reasonable assurance regarding the reliability of financial reporting and the preparation of financial statements for external purposes in accordance with IFRS.
We did not make any changes to ICFR during the three months ended June 30, 2019 that materially affected or are reasonably likely to materially affect our ICFR.
45
NOTES TO READER
Forward-Looking Information
This MD&A contains forward-looking information within the meaning of applicable Canadian and United States securities legislation. All information contained in this MD&A, other than statements of current and historical fact, is forward-looking information. Often, but not always, forward-looking information can be identified by the use of words such as “plans”, “expects”, “budget”, “guidance”, “scheduled”, “estimates”, “forecasts”, “strategy”, “target”, “intends”, “objective”, “goal”, “understands”, “anticipates” and “believes” (and variations of these or similar words) and statements that certain actions, events or results “may”, “could”, “would”, “should”, “might” “occur” or “be achieved” or “will be taken” (and variations of these or similar expressions). All of the forward-looking information in this MD&A is qualified by this cautionary note.
Forward-looking information includes, but is not limited to, production, cost and capital and exploration expenditure guidance, anticipated production at our mines and processing facilities, the anticipated impact of the recent blockades affecting access to the Port of Matarani, expectations regarding the Company's CEO transition, the expected benefits of implementing the metallurgical recovery and optimization initiatives at Constancia processing plant and expectations regarding the schedule for acquiring the Pampacancha surface rights and mining the Pampacancha deposit, the anticipated timing, cost and benefits of developing the Rosemont project and the outcome of litigation challenging Rosemont's permits, our intention to appeal the recent U.S. district court decision overturning the U.S. Forest Service's FROD for Rosemont and to evaluate other options available to advance the project, expectations regarding the financing, sanctioning and schedule for developing the Rosemont project, expectations regarding the Lalor gold strategy, including the refurbishment of the New Britannia mill, and the possibility of optimizing the value of our gold resources in Manitoba, the future potential of the 1901 deposit, including the possibility of identifying additional gold resources, the possibility of converting inferred mineral resource estimates to higher confidence categories, the potential and our anticipated plans for advancing our mining properties surrounding Constancia and the Ann Mason project, anticipated mine plans, anticipated metals prices and the anticipated sensitivity of our financial performance to metals prices, events that may affect our operations and development projects, anticipated cash flows from operations and related liquidity requirements, the anticipated effect of external factors on revenue, such as commodity prices, estimation of mineral reserves and resources, mine life projections, reclamation costs, economic outlook, government regulation of mining operations, and business and acquisition strategies. Forward-looking information is not, and cannot be, a guarantee of future results or events. Forward-looking information is based on, among other things, opinions, assumptions, estimates and analyses that, while considered reasonable by us at the date the forward-looking information is provided, inherently are subject to significant risks, uncertainties, contingencies and other factors that may cause actual results and events to be materially different from those expressed or implied by the forward-looking information.
The material factors or assumptions that we identified and were applied by us in drawing conclusions or making forecasts or projections set out in the forward-looking information include, but are not limited to:
| – | the schedule for the refurbishment and commissioning of the New Britannia mill; |
| – | the success of the Lalor gold strategy; |
| – | the ability to appeal the U.S. district court's decision setting aside the U.S. Forest Service's FROD for Rosemont; |
| – | the availability of other options to advance Rosemont notwithstanding the U.S. district court's recent decision; |
| – | the successful resolution of the recent blockades affecting access to the Port of Matarani; |
| – | the ability to secure required land rights to develop and commence mining the Pampacancha deposit; |
| – | the success of mining, processing, exploration and development activities; |
| – | the scheduled maintenance and availability of our processing facilities; |
46
| – | the accuracy of geological, mining and metallurgical estimates; |
| – | anticipated metals prices and the costs of production; |
| – | the supply and demand for metals we produce; |
| – | the supply and availability of all forms of energy and fuels at reasonable prices; |
| – | no significant unanticipated operational or technical difficulties; |
| – | the execution of our business and growth strategies, including the success of our strategic investments and initiatives; |
| – | the availability of additional financing, if needed; |
| – | the ability to complete project targets on time and on budget and other events that may affect our ability to develop our projects; |
| – | the timing and receipt of various regulatory and governmental approvals; |
| – | the availability of personnel for our exploration, development and operational projects and ongoing employee relations; |
| – | maintaining good relations with the communities in which we operate, including the communities surrounding our Constancia mine and Rosemont project and First Nations communities surrounding our Lalor mine; |
| – | no significant unanticipated challenges with stakeholders at our various projects; |
| – | no significant unanticipated events or changes relating to regulatory, environmental, health and safety matters; |
| – | no contests over title to our properties, including as a result of rights or claimed rights of aboriginal peoples or challenges to the validity of our unpatented mining claims; |
| – | the timing and possible outcome of pending litigation and no significant unanticipated litigation; |
| – | certain tax matters, including, but not limited to current tax laws and regulations and the refund of certain value added taxes from the Canadian and Peruvian governments; and |
| – | no significant and continuing adverse changes in general economic conditions or conditions in the financial markets (including commodity prices and foreign exchange rates). |
The risks, uncertainties, contingencies and other factors that may cause actual results to differ materially from those expressed or implied by the forward-looking information may include, but are not limited to, risks generally associated with the mining industry, such as economic factors (including future commodity prices, currency fluctuations, energy prices and general cost escalation), the appointment of a permanent CEO and any changes related thereto, uncertainties related to the development and operation of our projects (including risks associated with the permitting, development and financing of the Rosemont project), risks related to the U.S. district court's recent decision to set aside the U.S. Forest Service's FROD for Rosemont and other legal challenges related to Rosemont's permits, risks related to the new Lalor mine plan, including the schedule and cost for the refurbishment of the New Britannia mill and the ability to convert inferred mineral resource estimates to higher confidence categories, risks related to the schedule for mining the Pampacancha deposit (including the timing and cost of acquiring the required surface rights and the impact of any schedule delays), dependence on key personnel and employee and union relations, risks related to political or social unrest or change, risks in respect of aboriginal and community relations, rights and title claims, operational risks and hazards, including unanticipated environmental, industrial and geological events and developments and the inability to insure against all risks, failure of plant, equipment, processes, transportation and other infrastructure to operate as anticipated, compliance with government and environmental regulations, including permitting requirements and anti-bribery legislation, depletion of our reserves, volatile financial markets that may affect our ability to obtain additional financing on acceptable terms, the failure to obtain required approvals or clearances from government authorities on a timely basis, uncertainties related to the geology, continuity, grade and estimates of mineral reserves and resources, and the potential for variations in grade and recovery rates, uncertain costs of reclamation activities, our ability to comply with our pension and other post-retirement obligations, our ability to abide by the covenants in our debt instruments and other material contracts, tax refunds, hedging transactions, as well as the risks discussed under the heading “Risk Factors” in our most recent Annual Information Form.
47
Should one or more risk, uncertainty, contingency or other factor materialize or should any factor or assumption prove incorrect, actual results could vary materially from those expressed or implied in the forward-looking information. Accordingly, you should not place undue reliance on forward-looking information. We do not assume any obligation to update or revise any forward-looking information after the date of this MD&A or to explain any material difference between subsequent actual events and any forward-looking information, except as required by applicable law.
Note to United States Investors
This MD&A has been prepared in accordance with the requirements of the securities laws in effect in Canada, which may differ materially from the requirements of United States securities laws applicable to US issuers.
Qualified Person
The technical and scientific information in this MD&A related to the Constancia mine and Rosemont project has been approved by Cashel Meagher, P. Geo, our Senior Vice President and Chief Operating Officer. The technical and scientific information related to our other material mineral projects contained in this MD&A has been approved by Olivier Tavchandjian, P. Geo, our Vice President, Exploration and Geology. Messrs. Meagher and Tavchandjian are qualified persons pursuant to NI 43-101. For a description of the key assumptions, parameters and methods used to estimate mineral reserves and resources at Hudbay's material properties, as well as data verification procedures and a general discussion of the extent to which the estimates of scientific and technical information may be affected by any known environmental, permitting, legal title, taxation, sociopolitical, marketing or other relevant factors, please see the technical reports for our material properties as filed by us on SEDAR at www.sedar.com.
48