

Management's Discussion and Analysis of
Results of Operations and Financial Condition
For the three and nine months ended
September 30, 2019
November 11, 2019
INTRODUCTION
This Management's Discussion and Analysis ("MD&A") dated November 11, 2019 is intended to supplement Hudbay Minerals Inc.'s unaudited condensed consolidated interim financial statements and related notes for the three and nine months ended September 30, 2019 and 2018 (the "consolidated interim financial statements"). The consolidated interim financial statements have been prepared in accordance with International Financial Reporting Standards (“IFRS"), including International Accounting Standard 34,Interim Financial Reporting, as issued by the International Accounting Standards Board (“IASB”).
References to “Hudbay”, the “Company”, “we”, “us”, “our” or similar terms refer to Hudbay Minerals Inc. and its direct and indirect subsidiaries as at September 30, 2019.
Readers should be aware that:
| – | This MD&A contains certain “forward-looking statements” and “forward-looking information” (collectively, “forward-looking information”) that are subject to risk factors set out in a cautionary note contained in our MD&A. |
| – | This MD&A has been prepared in accordance with the requirements of the securities laws in effect in Canada, which may differ materially from the requirements of United States securities laws applicable to US issuers. |
| – | We use a number of non-IFRS financial performance measures in our MD&A. |
| – | The technical and scientific information in this MD&A has been approved by qualified persons based on a variety of assumptions and estimates. |
For a discussion of each of the above matters, readers are urged to review the “Notes to Reader” discussion beginning on page 43 of this MD&A.
Additional information regarding Hudbay, including the risks related to our business and those that are reasonably likely to affect our financial statements in the future, is contained in our continuous disclosure materials, including our most recent Annual Information Form (“AIF”), consolidated financial statements and Management Information Circular available on SEDAR at www.sedar.com and on EDGAR at www.sec.gov.
As of January 1, 2019 we have adopted IFRS 16, Leases (“IFRS 16”). The Company applied this amendment prospectively. A reconciliation from the December 31, 2018 previously reported balances to the revised January 1, 2019 opening balances is disclosed in Note 4(b) of the consolidated interim financial statements.
All amounts are in US dollars unless otherwise noted.
OUR BUSINESS
We are an integrated mining company primarily producing copper concentrate (containing copper, gold, and silver), molybdenum concentrate and zinc metal. With assets in North and South America, we are focused on the discovery, production and marketing of base and precious metals. Directly and through our subsidiaries, we own three polymetallic mines, four ore concentrators and a zinc production facility in northern Manitoba and Saskatchewan (Canada) and Cusco (Peru), and copper projects in Arizona and Nevada (United States). Our growth strategy is focused on the exploration and development of properties we already control, as well as other mineral assets we may acquire that fit our strategic criteria. Our vision is to be a responsible, top-tier operator of long-life, low-cost mines in the Americas. We are governed by theCanada Business Corporations Actand our shares are listed under the symbol "HBM" on the Toronto Stock Exchange, New York Stock Exchange and Bolsa de Valores de Lima.
1
SUMMARY
| – | Delivered a solid operating quarter, which included record quarterly ore throughput at the Constancia mill and increased ore mined at 777 and Lalor by 9% and 23%, respectively, compared to the same period in 2018. |
| – | Strong quarterly cost performance in both Peru and Manitoba, with Peru achieving its lowest unit costs in the last eight quarters and Manitoba unit costs stabilizing at a lower level following the ramp up of Lalor during the first half of the year. |
| – | Consolidated copper production of 36,422 tonnes at a cash cost of $0.98 per pound of copper produced, net of by-product credits. |
| – | Net loss of $274.8 million reflects an after-tax impairment loss of $242.1 million on Hudbay's carrying value of the Rosemont copper project, following a U.S. District Court decision on July 31, 2019 vacating and remanding Rosemont's permits. We intend to appeal and continue to evaluate next steps for Rosemont. |
| – | Results are on track to meet production, consolidated sustaining capital expenditures and Peru unit cost guidance for 2019. Manitoba full year unit costs are expected to be at or slightly above the upper end of the 2019 guidance range. |
| – | Progressed other key strategic initiatives, including engineering and permitting for the New Britannia mill refurbishment, community negotiations near Constancia, and feasibility and drilling activities on the Snow Lake exploration properties. |
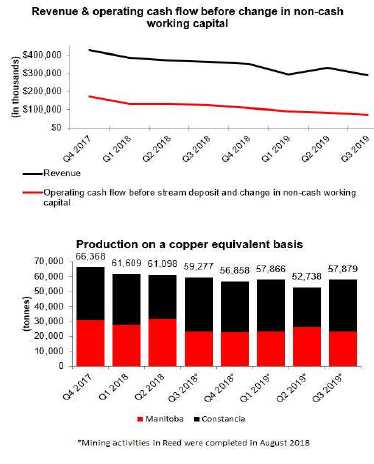
| – | Cash generated from operating activities decreased to $43.5 million in the third quarter of 2019 from $113.8 million in the same quarter of 2018, while operating cash flow before change in non-cash working capital decreased to $69.9 million in the quarter from $122.1 million in the same quarter of 2018. |
| – | Appointed Stephen A. Lang as Hudbay's Board Chair, and advanced the search for a permanent Chief Executive Officer. |
Summary of Third Quarter Results
Cash generated from operating activities decreased to $43.5 million in the third quarter of 2019 from $113.8 million in the same quarter of 2018. Operating cash flow before change in non-cash working capital was $69.9 million during the third quarter of 2019, reflecting a decrease of $52.2 million compared to the third quarter of 2018. The decrease in operating cash flow is primarily the result of lower realized prices and sales volumes compared to the third quarter of 2018. Sales volumes in the third quarter of 2019 reflected the temporary buildup of copper concentrate inventory in Peru as a result of previously disclosed community protests against another company's mining project that restricted access to the port of Matarani in July and August. However, Constancia continued to operate at full capacity during this period and the team actively managed concentrate logistics to overcome these challenges, resulting in only slightly elevated concentrate inventory levels as of September 30, 2019.
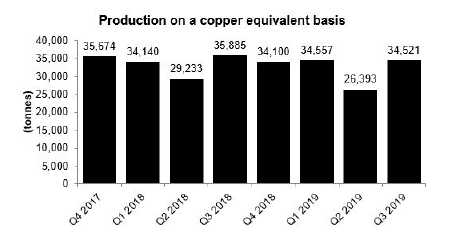
Copper-equivalent production in the third quarter of 2019 decreased by 2% compared to the same period in 2018, primarily as a result of lower grades at Constancia, as planned, and the closure of the Reed mine.
Net loss and loss per share in the third quarter of 2019 were $274.8 million and $1.05, respectively, compared to a net profit and earnings per share of $22.8 million and $0.09, respectively, in the third quarter of 2018.
Net loss and loss per share in the third quarter of 2019 were affected by, among other things, the following items:
| (in $ millions, except per share amounts) | Pre-tax gain | After-tax gain | Per share gain |
| | (loss) | (loss) | (loss) |
| Rosemont impairment | (322.2) | (242.1) | (0.93) |
| Non-cash deferred tax adjustments | — | (2.2) | (0.01) |
| Dividend withholding tax | — | (6.9) | (0.03) |
2
On July 31, 2019, the U.S District Court for the District of Arizona ("Court") issued a ruling in the lawsuits challenging the U.S. Forest Service's issuance of the Final Record of Decision ("FROD") for the Rosemont project in Arizona. The Court ruled to vacate and remand the FROD thereby delaying the expected start of construction of Rosemont.
Although Hudbay intends on appealing the Court's decision, the July 31st ruling and the subsequent impact to the Company's market capitalization gave rise to an indicator of impairment. Following an impairment test conducted as of September 30, 2019, it was determined that the recoverable amount of the Arizona cash generating unit was lower than its carrying value, causing us to recognize an after-tax impairment loss of $242.1 million related to these assets.
During the third quarter of 2019, we incurred $6.9 million in withholding tax associated with the repatriation of $137.5 million by way of an intercompany dividend. Cash and cash equivalents decreased from $489.5 million at June 30, 2019 to $398.4 million at September 30, 2019, due to seasonally elevated sustaining capital expenditures and interest payments on long-term debt.
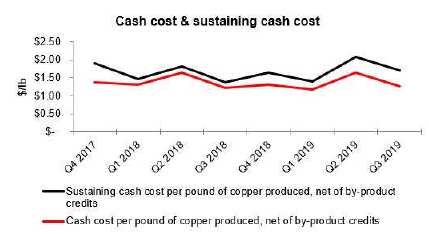
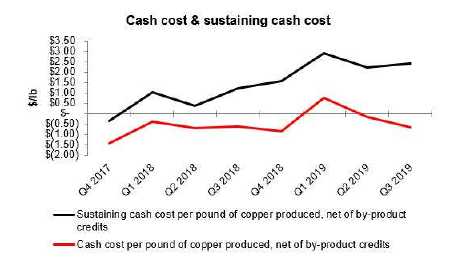
In the third quarter of 2019, consolidated cash cost per pound of copper produced, net of by-product credits1, was $0.98, an increase compared to $0.88 in the same period last year. This increase was a result of lower copper and precious metal production and lower realized zinc prices. Incorporating sustaining capital, capitalized exploration, royalties, selling, administrative and regional costs, consolidated all-in sustaining cash cost per pound of copper produced, net of by-product credits1, in the third quarter of 2019 was $1.90, which increased from $1.45 in the same period last year, driven mainly by increased sustaining capital expenditures.
| |
1Cash cost, all-in sustaining cash cost per pound of copper produced, net of by-product credits, and net debt are non-IFRS financial performance measures with no standardized definition under IFRS. For further information and a detailed reconciliation, please see the discussion under the "Non-IFRS Financial Reporting Measures" section of this MD&A. |
3
KEY FINANCIAL RESULTS
| Financial Condition | Sep. 30, 2019 | Dec. 31, 2018 |
| (in $ thousands) | | |
| Cash and cash equivalents | 398,438 | 515,497 |
| Total long-term debt | 976,272 | 981,030 |
| Net debt1 | 577,834 | 465,533 |
| Working capital | 367,856 | 445,228 |
| Total assets | 4,386,546 | 4,685,635 |
| Equity | 1,857,481 | 2,178,856 |
1Net debt is a non-IFRS financial performance measure with no standardized definition under IFRS. For further information and a detailed reconciliation, please see discussion under the "Non-IFRS Financial Reporting Measures" section of this MD&A.
| Financial Performance | | Three months ended | | | Nine months ended | |
| | | Sep. 30, | | | Sep. 30, | | | Sep. 30, | | | Sep. 30, | |
| (in $ thousands, except per share amounts) | | 2019 | | | 2018 | | | 2019 | | | 2018 | |
| Revenue | | 291,282 | | | 362,649 | | | 912,953 | | | 1,120,593 | |
| Cost of sales | | 260,327 | | | 277,367 | | | 787,045 | | | 822,079 | |
| (Loss) profit before tax | | (348,367 | ) | | 30,287 | | | (410,409 | ) | | 153,187 | |
| (Loss) profit | | (274,796 | ) | | 22,808 | | | (342,355 | ) | | 88,926 | |
| Basic and diluted (loss) earnings per share | | (1.05 | ) | | 0.09 | | | (1.31 | ) | | 0.34 | |
| | | | | | | | | | | | | |
| Operating cash flow before change in non-cash working capital | | 69,910 | | | 122,097 | | | 240,649 | | | 385,524 | |
4
KEY PRODUCTION RESULTS
| | | Three months ended | Three months ended |
| | | Sep. 30, 2019 | Sep. 30, 2018 |
| | | Peru | Manitoba | Total | Peru | Manitoba | Total |
| Contained metal in concentrate produced1 | | | | | | | |
| Copper | tonnes | 31,091 | 5,331 | 36,422 | 32,976 | 7,506 | 40,482 |
| Gold | oz | 5,565 | 22,754 | 28,319 | 6,059 | 22,199 | 28,258 |
| Silver | oz | 686,258 | 237,933 | 924,191 | 736,657 | 274,330 | 1,010,987 |
| Zinc | tonnes | — | 28,639 | 28,639 | — | 26,228 | 26,228 |
| Molybdenum | tonnes | 262 | — | 262 | 370 | — | 370 |
| Payable metal sold | | | | | | | |
| Copper | tonnes | 25,314 | 4,602 | 29,916 | 30,222 | 9,376 | 39,598 |
| Gold | oz | 3,858 | 21,630 | 25,488 | 4,486 | 26,996 | 31,482 |
| Silver | oz | 529,139 | 227,157 | 756,296 | 548,782 | 338,131 | 886,913 |
| Zinc2 | tonnes | — | 29,140 | 29,140 | — | 30,969 | 30,969 |
| Molybdenum | tonnes | 334 | — | 334 | 237 | — | 237 |
| Cash cost3 | $/lb | 1.26 | (0.68) | 0.98 | 1.22 | (0.61) | 0.88 |
| Sustaining cash cost3 | $/lb | 1.73 | 2.40 | | 1.38 | 1.23 | |
| All-in sustaining cash cost3 | $/lb | | | 1.90 | | | 1.45 |
| | | Nine months ended | Nine months ended |
| | | Sep. 30, 2019 | Sep. 30, 2018 |
| | | Peru | Manitoba | Total | Peru | Manitoba | Total |
| Contained metal in concentrate produced1 | | | | | | | |
| Copper | tonnes | 87,166 | 17,591 | 104,757 | 91,344 | 25,968 | 117,312 |
| Gold | oz | 14,716 | 67,264 | 81,980 | 16,667 | 75,164 | 91,831 |
| Silver | oz | 1,872,995 | 782,198 | 2,655,193 | 1,979,112 | 960,673 | 2,939,785 |
| Zinc | tonnes | — | 88,514 | 88,514 | — | 88,180 | 88,180 |
| Molybdenum | tonnes | 900 | — | 900 | 575 | — | 575 |
| Payable metal sold | | | | | | | |
| Copper | tonnes | 77,754 | 17,050 | 94,804 | 85,197 | 26,376 | 111,573 |
| Gold | oz | 14,132 | 64,523 | 78,655 | 13,158 | 74,078 | 87,236 |
| Silver | oz | 1,785,657 | 757,846 | 2,543,503 | 1,582,944 | 879,909 | 2,462,853 |
| Zinc2 | tonnes | — | 76,318 | 76,318 | — | 84,589 | 84,589 |
| Molybdenum | tonnes | 987 | — | 987 | 372 | — | 372 |
| Cash cost3 | $/lb | 1.33 | 0.01 | 1.11 | 1.38 | (0.58) | 0.94 |
| Sustaining cash cost3 | $/lb | 1.71 | 2.46 | | 1.54 | 0.82 | |
| All-in sustaining cash cost3 | $/lb | | | 1.98 | | | 1.47 |
1 Metal reported in concentrate is prior to deductions associated with smelter contract terms.
2 Includes refined zinc metal sold and payable zinc in concentrate sold.
3 Cash cost, sustaining cash cost and all-in sustaining cash cost per pound of copper produced, net of by-product credits are non-IFRS financial performance measures with no standardized definition under IFRS. For further information and a detailed reconciliation, please see the discussion under the "Non-IFRS Financial Reporting Measures" section of this MD&A.
5
RECENT DEVELOPMENTS
Appointment of Chair of the Board of Directors
On October 3, 2019, Stephen A. Lang was appointed as Chair of Hudbay's Board of Directors. Mr. Lang has over 40 years of experience in the mining industry, including engineering, development and production at gold, copper, coal and platinum group metals operations. In connection with the appointment, Alan Hibben has stepped down as Chair of Hudbay's Board of Directors.
The Board continues to advance its search for a permanent CEO, which includes internal and external candidates. Peter Kukielski was appointed Interim CEO on July 10, 2019 after Alan Hair stepped down as Hudbay's President and CEO and as a director of the Company.
Rosemont Developments
On July 31, 2019, the Court issued a ruling in the lawsuits challenging the U.S. Forest Service’s issuance of the FROD for the Rosemont project in Arizona. The Court ruled to vacate and remand the FROD such that Rosemont cannot proceed with construction at this time. We strongly believe that the Court has misinterpreted federal mining laws and Forest Service regulations as they apply to Rosemont. As such, we filed a motion for reconsideration of certain issues in the Court's decision, which has since been denied. We intend to appeal the Court's decision to the U.S. Ninth Circuit Court of Appeals as we evaluate next steps for the project. We have deferred the previously announced process to identify a joint venture partner for Rosemont.
As announced in August, we have suspended most of the early works activities at Rosemont and, at that time, expected a decrease of our Rosemont project capital spending in 2019 to $30 million. We now expect Rosemont project spending to further be reduced to $20 million in 2019, including costs to demobilize engineering work and complete committed procurement. These costs are in addition to $20 million of Rosemont non-project costs that are expected to be incurred in 2019, for a total of $40 million expected to be spent at Rosemont in 2019.
Peru Logistics Update
The southern Peru copper mining corridor continued to see heightened political activity around other companies' mining projects and operations during the quarter. This included large protests against the granting of a permit for another company’s mining project. These protests blocked the entrance to the port of Matarani in July and August, and while unrelated to Constancia, they impacted our ability to ship copper concentrates. Constancia continued to operate at full capacity during this period and the team actively managed concentrate logistics to overcome these challenges, drawing down inventory levels at a higher rate than normal once access to the port was restored. As a result, concentrate inventory levels remained only slightly elevated at September 30, 2019. Since the end of October, these protests have reinitiated but haven’t affected access to the port of Matarani. We will continue to monitor the situation and actively manage logistics around any potential impacts.
Other Key Strategic Initiatives
We continue to advance discussions with the community of Chilloroya on a land access agreement for the Pampacancha satellite deposit. The discussions are progressing and we expect to be mining ore at Pampacancha in 2020.
6
New Britannia mill refurbishment activities are progressing in line with the development schedule laid out in the February 2019 mine plan. Detailed engineering is on track to be completed in the first quarter of 2020 and environmental permits are expected in the second quarter of 2020. Construction activities are expected to commence mid-2020 and continue until the third quarter of 2021, with plant commissioning and ramp-up during the fourth quarter of 2021. Once the New Britannia mill is commissioned, average annual gold production from Snow Lake is expected to be approximately 140,000 ounces during the first five years at a sustaining cash cost, net of by-product credits, of approximately $450 per ounce of gold.
Exploration activities on the regional deposits in Snow Lake continue to progress, including feasibility studies on the recently discovered 1901 Deposit, which contains an initial inferred resource of 2.1 million tonnes at 9.67% zinc, as announced in August 2019. Drilling on the 1901 Deposit continues to test the size of the deposit, with the intention to confirm the presence of gold and copper-gold mineralization and upgrade the mineral resource estimate to a higher category. Exploration and engineering studies are also progressing at Lalor in-mine exploration targets and other 100%-owned deposits in the Snow Lake area, with results expected to be incorporated in the annual mineral reserve and resource estimate in March 2020.
7
CONSTANCIA OPERATIONS REVIEW
| | | Three months ended | Nine months ended | Guidance |
| | | Sep. 30, | Sep. 30, | Sep. 30, | Sep. 30, | Annual |
| | | 2019 | 2018 | 2019 | 2018 | 2019 |
| Ore mined1 | tonnes | 8,413,367 | 8,808,764 | 25,259,306 | 27,042,733 | |
| Copper | % | 0.44 | 0.50 | 0.44 | 0.49 | |
| Gold | g/tonne | 0.05 | 0.05 | 0.04 | 0.05 | |
| Silver | g/tonne | 3.93 | 4.23 | 3.72 | 4.15 | |
| | | | | | | |
| Ore milled | tonnes | 8,240,344 | 8,046,891 | 23,913,145 | 23,624,667 | |
| Copper | % | 0.44 | 0.48 | 0.43 | 0.47 | |
| Gold | g/tonne | 0.04 | 0.05 | 0.04 | 0.05 | |
| Silver | g/tonne | 3.76 | 4.05 | 3.57 | 4.03 | |
| | | | | | | |
| Copper concentrate | tonnes | 135,052 | 139,621 | 373,571 | 381,908 | |
| Concentrate grade | % Cu | 23.02 | 23.62 | 23.33 | 23.92 | |
| | | | | | | |
| Copper recovery | % | 86.0 | 85.0 | 85.7 | 81.9 | |
| Gold recovery | % | 48.3 | 51.1 | 47.5 | 47.0 | |
| Silver recovery | % | 68.9 | 70.3 | 68.3 | 64.7 | |
| | | | | | | |
| Combined unit operating costs2,3 | $/tonne | 8.63 | 8.68 | 9.28 | 9.30 | 7.90 - 9.70 |
1 Reported tonnes and grade for ore mined are estimates based on mine plan assumptions and may not reconcile fully to ore milled.
2Reflects combined mine, mill and general and administrative ("G&A") costs per tonne of ore milled. Reflects the deduction of expected capitalized stripping costs.
3 Combined unit costs is a non-IFRS financial performance measure with no standardized definition under IFRS. For further information and a detailed reconciliation, please see the discussion under the "Non-IFRS Financial Reporting Measures" section of this MD&A.
Ore mined at our Constancia mine during the third quarter of 2019 was 4% lower compared to the same period in 2018 due to mining from areas with a higher stripping ratio than the areas mined in the third quarter of 2018, in line with the mine plan. Milled copper grades in the third quarter were approximately 8% lower than the same period in 2018 as lower grade phases continue to be mined, in line with the mine plan. Mill throughput in the third quarter of 2019 was 2% higher compared to the same period in 2018, a quarterly throughput record, due to higher plant availability through the continued successful implementation of optimization initiatives.
Copper recoveries in the third quarter of 2019 improved by 1% compared to the same period in 2018. The increased copper recoveries were a result of sustained metallurgical improvements initiated in 2018. While recoveries vary from quarter to quarter depending on the complexity and grade of the ore feed, the Company is seeing results from ongoing recovery optimization initiatives. Highlights of the initiatives include the continued integration of an automated, advanced process control system in the grinding and bulk flotation circuits, and flotation improvements such as optimizing the water recovery in the tailings thickener and the installation of enhanced equipment in the rougher circuit.
Year-to-date mill throughput, copper grades and copper recoveries are achieving mine plan expectations for 2019.
Combined mine, mill and G&A unit operating costs in the third quarter of 2019 were slightly lower than the same period in 2018, reflecting higher ore throughput and lower expensed stripping costs (higher capitalized stripping), offset by higher mine, plant and administrative costs. Due to our focus on cost control and throughput optimization initiatives, combined unit costs in the third quarter of 2019 were the lowest quarterly unit costs reported in the past eight quarters.
8
During the fourth quarter of 2019, a four-day regularly scheduled maintenance shutdown of the Constancia mill is planned, and production and combined unit costs in the fourth quarter of 2019 are expected to reflect correspondingly lower ore throughput. In addition to regular semi-annual maintenance work, we plan to install new equipment relating to the ongoing throughput and recovery optimization initiatives at Constancia. The maintenance shutdown is consistent with the full year plan for Constancia, and we continue to expect production and cost guidance to be met for the full year 2019.
| | | Three months ended | Nine months ended | Guidance |
| Contained metal in | | Sep. 30, | Sep. 30, | Sep. 30, | Sep. 30, | Annual |
| concentrate produced | | 2019 | 2018 | 2019 | 2018 | 2019 |
| Copper | tonnes | 31,091 | 32,976 | 87,166 | 91,344 | 100,000 - 125,000 |
| Gold | oz | 5,565 | 6,059 | 14,716 | 16,667 | |
| Silver | oz | 686,258 | 736,657 | 1,872,995 | 1,979,112 | |
| Molybdenum | tonnes | 262 | 370 | 900 | 575 | 1,100 - 1,200 |
| Precious metals1 | oz | 15,369 | 16,582 | 41,473 | 44,940 | 45,000 - 55,000 |
1Precious metals production includes gold and silver production on a gold-equivalent basis. Silver is converted to gold at a ratio of 70:1.
In the third quarter of 2019 production of copper was lower than the same period in 2018, mainly due to lower copper grade mined and milled, as per the mine plan, partially offset by higher mill throughput and copper recoveries as discussed above. Production of gold and silver during the third quarter of 2019 was lower than the same period in 2018 due to lower grades. Year-to-date production variances in 2019 were driven by the same factors as the third quarter variances versus prior year.
We expect production of all metals and costs at Constancia to be in line with the full year guidance for 2019.
9
Peru Cash Cost and Sustaining Cash Cost
| | | Three months ended | Nine months ended |
| | | Sep. 30, | Sep. 30, | Sep. 30, | Sep. 30, |
| | | 2019 | 2018 | 2019 | 2018 |
| Cash cost per pound of copper produced, net of by-product credits1 | $/lb | 1.26 | 1.22 | 1.33 | 1.38 |
| Sustaining cash cost per pound of copper produced, net of by-product credits1 | $/lb | 1.73 | 1.38 | 1.71 | 1.54 |
1Cash cost and sustaining cash costs per pound of copper produced, net of by-product credits, are not recognized under IFRS. For more detail on these non-IFRS financial performance measures, please see the discussion under the "Non-IFRS Financial Performance Measures" section of this MD&A.
Cash cost per pound of copper produced, net of by-product credits, for the third quarter of 2019 was $1.26, slightly higher than the same period in 2018 due to lower copper production, as per the mine plan, partially offset by higher by-product credits.
Sustaining cash cost per pound of copper produced, net of by-product credits, for the three and nine months ended September 30, 2019 was $1.73 and $1.71, respectively. This represents an increase of 25% and 11%, respectively, from the same period in 2018, due to timing of payments on long-term community agreements and leases, as well as higher sustaining costs in heavy civil works and capitalized stripping costs.
Metal Sold
| | | Three months ended | Nine months ended |
| | | Sep. 30, | Sep. 30, | Sep. 30, | Sep. 30, |
| | | 2019 | 2018 | 2019 | 2018 |
| Payable metal in concentrate | | | | | |
| Copper | tonnes | 25,314 | 30,222 | 77,754 | 85,197 |
| Gold | oz | 3,858 | 4,486 | 14,132 | 13,158 |
| Silver | oz | 529,139 | 548,782 | 1,785,657 | 1,582,944 |
| Molybdenum | tonnes | 334 | 237 | 987 | 372 |
10
MANITOBA OPERATIONS REVIEW
Mines
| | | Three months ended | Nine months ended |
| | | Sep. 30, | Sep. 30, | Sep. 30, | Sep. 30, |
| | | 2019 | 2018 | 2019 | 2018 |
| 777 | | | | | |
| Ore | tonnes | 273,319 | 250,434 | 840,440 | 721,954 |
| Copper | % | 1.33 | 1.38 | 1.44 | 1.37 |
| Zinc | % | 3.01 | 4.37 | 3.19 | 4.76 |
| Gold | g/tonne | 1.63 | 1.64 | 1.64 | 1.90 |
| Silver | g/tonne | 15.42 | 27.98 | 18.72 | 29.69 |
| Lalor | | | | | |
| Ore | tonnes | 346,456 | 281,007 | 1,146,640 | 942,625 |
| Copper | % | 0.68 | 0.66 | 0.73 | 0.72 |
| Zinc | % | 6.16 | 6.21 | 6.41 | 6.06 |
| Gold | g/tonne | 2.21 | 2.30 | 2.00 | 2.22 |
| Silver | g/tonne | 25.56 | 22.40 | 24.54 | 25.64 |
| Reed1 | | | | | |
| Ore | tonnes | — | 61,922 | — | 326,363 |
| Copper | % | — | 3.22 | — | 3.35 |
| Zinc | % | — | 1.19 | — | 0.90 |
| Gold | g/tonne | — | 0.86 | — | 0.77 |
| Silver | g/tonne | — | 10.07 | — | 9.08 |
| Total Mines | | | | | |
| Ore | tonnes | 619,775 | 593,363 | 1,987,080 | 1,990,942 |
| Copper | % | 0.97 | 1.23 | 1.03 | 1.39 |
| Zinc | % | 4.77 | 4.91 | 5.05 | 4.74 |
| Gold | g/tonne | 1.95 | 1.87 | 1.85 | 1.87 |
| Silver | g/tonne | 21.09 | 23.47 | 22.08 | 24.39 |
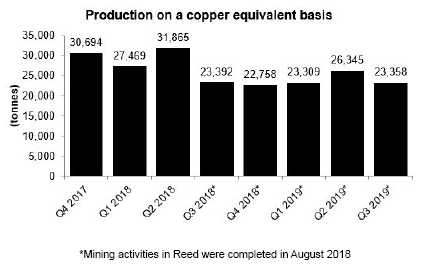
1Mining activities at Reed were completed in August 2018. Comparable 2018 numbers include 100% of Reed mine production. Hudbay purchased 30% of the Reed ore production from its joint venture partner on market-based terms.
| | | Three months ended | Nine months ended |
| | | Sep. 30, | Sep. 30, | Sep. 30, | Sep. 30, |
| Unit Operating Costs1,2 | | 2019 | 2018 | 2019 | 2018 |
| Mines | | | | | |
| 777 | C$/tonne | 80.78 | 70.42 | 77.95 | 78.33 |
| Lalor | C$/tonne | 102.16 | 95.59 | 105.96 | 89.25 |
| Reed | C$/tonne | — | 44.88 | — | 72.62 |
| Total Mines | C$/tonne | 92.74 | 80.80 | 94.11 | 83.08 |
1Reflects costs per tonne of ore mined.
2Unit costs is a non-IFRS financial performance measure with no standardized definition under IFRS. For further information and a detailed reconciliation, please see the discussion under the "Non-IFRS Financial Reporting Measures" section of this MD&A.
11
Ore mined at our Manitoba operations during the third quarter of 2019 increased by 4% compared to the same period in 2018. This increase is due to higher production volumes at both 777 and Lalor, partially offset by the closure of the Reed mine in August 2018.
Overall, copper, zinc, and silver grades were 21%, 3%, and 10%, lower, respectively, in the third quarter of 2019 compared to the same period of 2018 while gold grades were 4% higher. Lower copper grades reflect the cessation of high-grade copper production from Reed following its closure, while grade variances for zinc and silver were due to planned stope sequencing based on life of mine production schedules at 777 and Lalor.
Ore mined at 777 in the third quarter of 2019 increased by 9%, compared to the same period last year. The higher production is attributable to implementation of management systems designed to improve mobile equipment availability and key performance indicators for drilling, blasting and backfilling processes. Unit operating costs for 777 increased by 15% for the third quarter of 2019 when compared to the same period in 2018 due to higher development metres and increased paste backfill quantities.
Ore mined at Lalor in the third quarter of 2019 increased by 23% compared to the same period last year. The higher production is attributable to a number of initiatives implemented as part of the production ramp up to 4,500 tonnes per day, including mine design changes, contract strategies, asset integrity and work management programs. Unit operating costs for Lalor for the third quarter of 2019 increased by 7% compared to the same period in 2018 due to the costs associated with developing the Lalor gold zones in preparation for mining in 2020.
Year-to-date ore mined at our Manitoba operations was consistent with the same period in 2018 as the closure of the Reed mine in August 2018 was offset by higher year-to-date production volumes at both 777 and Lalor. Year-to-date copper, gold and silver grades were 26%, 1%, and 9% lower, respectively, compared to the same period of 2018. Zinc grade was 7% higher year-to-date in 2019 compared to the same period of 2018. Year-to-date total mine unit costs were 13% higher than the same period in 2018 due to higher unit operating costs at Lalor and 777. The year-to-date operating variances were driven by the same factors that impacted third quarter operating variances.
12
Processing Facilities
| | | Three months ended | Nine months ended |
| | | Sep. 30, | Sep. 30, | Sep. 30, | Sep. 30, |
| | | 2019 | 2018 | 2019 | 2018 |
| Flin Flon Concentrator | | | | | |
| Ore | tonnes | 331,216 | 333,221 | 987,477 | 1,164,175 |
| Copper | % | 1.22 | 1.91 | 1.33 | 1.94 |
| Zinc | % | 3.64 | 3.43 | 3.67 | 3.74 |
| Gold | g/tonne | 1.74 | 1.43 | 1.71 | 1.63 |
| Silver | g/tonne | 17.36 | 22.81 | 19.57 | 23.18 |
| Copper concentrate | tonnes | 15,043 | 25,794 | 49,868 | 91,354 |
| Concentrate grade | % Cu | 23.92 | 22.88 | 23.29 | 22.87 |
| Zinc concentrate | tonnes | 20,482 | 18,600 | 60,847 | 73,779 |
| Concentrate grade | % Zn | 51.07 | 50.27 | 50.86 | 49.74 |
| Copper recovery | % | 89.1 | 92.6 | 88.4 | 92.7 |
| Zinc recovery | % | 86.7 | 81.8 | 85.4 | 84.3 |
| Gold recovery | % | 59.1 | 64.2 | 60.6 | 64.8 |
| Silver recovery | % | 48.7 | 62.4 | 51.5 | 61.5 |
Contained metal in concentrate produced | | | | | |
| Copper | tonnes | 3,599 | 5,902 | 11,616 | 20,888 |
| Zinc | tonnes | 10,461 | 9,351 | 30,944 | 36,698 |
| Precious metals1 | oz | 12,243 | 12,043 | 37,438 | 47,111 |
| Stall Concentrator | | | | | |
| Ore | tonnes | 318,539 | 292,454 | 979,678 | 887,471 |
| Copper | % | 0.64 | 0.66 | 0.71 | 0.68 |
| Zinc | % | 6.22 | 6.21 | 6.44 | 6.22 |
| Gold | g/tonne | 2.12 | 2.29 | 1.99 | 2.17 |
| Silver | g/tonne | 25.16 | 22.52 | 24.64 | 25.52 |
| Copper concentrate | tonnes | 8,928 | 8,107 | 29,926 | 25,549 |
| Concentrate grade | % Cu | 19.40 | 19.79 | 19.97 | 19.88 |
| Zinc concentrate | tonnes | 35,439 | 33,213 | 112,054 | 100,972 |
| Concentrate grade | % Zn | 51.29 | 50.81 | 51.38 | 50.99 |
| Copper recovery | % | 84.4 | 83.7 | 85.8 | 84.4 |
| Zinc recovery | % | 91.8 | 92.9 | 91.2 | 93.2 |
| Gold recovery | % | 54.3 | 57.4 | 55.0 | 57.7 |
| Silver recovery | % | 57.4 | 57.6 | 59.6 | 58.7 |
| Contained metal in concentrate produced | | | | | |
| Copper | tonnes | 1,732 | 1,604 | 5,975 | 5,080 |
| Zinc | tonnes | 18,178 | 16,877 | 57,570 | 51,482 |
| Precious metals1 | oz | 13,910 | 14,075 | 41,000 | 41,777 |
1Precious metals production includes gold and silver production on a gold-equivalent basis. Silver is converted to gold at a ratio of 70:1.
13
| | | Three months ended | Nine months ended | Guidance |
| | | Sep. 30, | Sep. 30, | Sep. 30, | Sep. 30, | Annual |
| Unit Operating Costs1 | | 2019 | 2018 | 2019 | 2018 | 2019 |
| Concentrators | | | | | | |
| Flin Flon | C$/tonne | 22.93 | 27.37 | 22.91 | 23.09 | |
| Stall | C$/tonne | 26.38 | 26.93 | 25.57 | 26.53 | |
| Combined mine/mill unit operating costs2,3 | | | | | | |
| Manitoba | C$/tonne | 130 | 123 | 137 | 127 | 115 - 135 |
1 Reflects costs per tonne of milled ore.
2Reflects combined mine, mill and G&A costs per tonne of milled ore. Comparable 2018 numbers include the cost of ore purchased from our joint venture partner at Reed mine.
3Combined unit costs is a non-IFRS financial performance measure with no standardized definition under IFRS. For further information and a detailed reconciliation, please see the discussion under the "Non-IFRS Financial Reporting Measures" section of this MD&A.
Ore processed in Flin Flon in the third quarter of 2019 was consistent with the same period of 2018 as the Reed mine closure in August 2018 was offset by increased production from the 777 mine and zinc ore feed from Lalor. Copper, gold and silver recoveries in the third quarter of 2019 were 4%, 8%, and 22% lower, respectively, compared with the same period in 2018 due to lower head grades. Zinc recoveries were 6% higher quarter-over-quarter. Unit operating costs at the Flin Flon concentrator were 16% lower in the third quarter of 2019 compared to the same period in 2018 due to improved plant reliability and labour efficiencies.
Ore processed year-to-date in 2019 in Flin Flon was 15% lower than the same period in 2018 due to the Reed mine closure, partially offset by increased production from the 777 mine. Copper, gold and silver recoveries for the year-to-date were 5%, 6% and 16% lower, respectively, compared to 2018 as a result of lower head grades. Year-to-date unit operating costs at the Flin Flon concentrator were consistent with those of 2018.
The Stall concentrator ore throughput was 9% higher than the same period in 2018 due to ongoing operational and maintenance improvements. Unit operating costs and metal recoveries were consistent compared to the same period in 2018. Ore processed year-to-date in 2019 at Stall was 10% higher and recoveries for copper at the Stall concentrator were 2% higher than the comparative 2018 period. Year-to-date unit operating costs at the Stall concentrator were 4% lower than 2018, primarily as a result of higher production and improved mill reliability.
Manitoba combined mine, mill and G&A unit operating costs in the third quarter of 2019 were 6% higher than in the same period in 2018 mainly due to the Reed closure and higher mining costs at 777 and Lalor. However, combined unit costs have been trending lower following Lalor's ramp up, with third quarter unit costs well below the levels reported in the first half of 2019. Manitoba combined unit costs are expected to be at or slightly above the upper range of guidance for the full year 2019.
| | | Three months ended | Nine months ended | Guidance |
| Manitoba contained metal in | | Sep. 30, | Sep. 30, | Sep. 30, | Sep. 30, | Annual |
| concentrate produced1,2 | | 2019 | 2018 | 2019 | 2018 | 2019 |
| Copper | tonnes | 5,331 | 7,506 | 17,591 | 25,968 | 22,000 - 25,000 |
| Gold | oz | 22,754 | 22,199 | 67,264 | 75,164 | |
| Silver | oz | 237,933 | 274,330 | 782,198 | 960,673 | |
| Zinc | tonnes | 28,639 | 26,228 | 88,514 | 88,180 | 100,000 - 115,000 |
| Precious metals3 | oz | 26,153 | 26,118 | 78,438 | 88,888 | 105,000 - 125,000 |
1Includes 100% of Reed mine production.
2Metal reported in concentrate is prior to deductions associated with smelter terms.
3Precious metals production includes gold and silver production on a gold-equivalent basis. Silver is converted to gold at a ratio of 70:1.
14
In the third quarter of 2019, copper and silver production were 29% and 13% lower, respectively, compared to the same period in 2018 due to the closure of Reed mine, partially offset by increased production at 777 and Lalor. Gold production was consistent over the period, while zinc production increased by 9%. Full year production of all metals is expected to be within the annual guidance ranges.
Zinc Plant
| | | Three months ended | Nine months ended | Guidance |
| | | Sep. 30, | Sep. 30, | Sep. 30, | Sep. 30, | Annual |
| Zinc Production | | 2019 | 2018 | 2019 | 2018 | 2019 |
| Zinc Concentrate Treated | | | | | | |
| Domestic | tonnes | 50,577 | 52,849 | 158,600 | 161,122 | |
| Refined Metal Produced | | | | | | |
| Domestic | tonnes | 24,319 | 24,317 | 75,524 | 75,168 | 95,000 - 105,000 |
| | | Three months ended | Nine months ended | Guidance |
| | | Sep. 30, | Sep. 30, | Sep. 30, | Sep. 30, | Annual |
| Unit Operating Costs | | 2019 | 2018 | 2019 | 2018 | 2019 |
| Zinc Plant1,2 | C$/lb | 0.54 | 0.51 | 0.50 | 0.50 | 0.47 - 0.55 |
1 Zinc unit operating costs include G&A costs.
2 Zinc unit costs is a non-IFRS financial performance measure with no standardized definition under IFRS. For further information and a detailed reconciliation, please see the discussion under the "Non-IFRS Financial Reporting Measures" section of this MD&A.
Production of cast zinc in the third quarter of 2019 was consistent compared with the same period in 2018. Operating costs per pound of zinc metal produced were slightly higher compared with the same periods in 2018 as a result of a scheduled bi-annual maintenance shutdown in September 2019.
15
Manitoba Cash Cost and Sustaining Cash Cost
| | | Three months ended | Nine months ended |
| | | Sep. 30, | Sep. 30, | Sep. 30, | Sep. 30, |
| | | 2019 | 2018 | 2019 | 2018 |
| Cost per pound of copper produced | | | | | |
| Cash cost per pound of copper produced, net of by-product credits1 | $/lb | (0.68) | (0.61) | 0.01 | (0.58) |
| Sustaining cash cost per pound of copper produced, net of by-product credits1 | $/lb | 2.40 | 1.23 | 2.46 | 0.82 |
| | | | | | |
| Cost per pound of zinc produced | | | | | |
| Cash cost per pound of zinc produced, net of by-product credits1 | $/lb | 0.65 | 0.38 | 0.56 | 0.37 |
| Sustaining cash cost per pound of zinc produced, net of by-product credits1 | $/lb | 1.22 | 0.90 | 1.05 | 0.78 |
1Cash cost and sustaining cash cost per pound of copper & zinc produced, net of by-product credits, are not recognized under IFRS. For more detail on this non-IFRS financial performance measure, please see the discussion under the "Non-IFRS Financial Performance Measures" section of this MD&A.
Cash cost per pound of copper produced, net of by-product credits, in the third quarter of 2019 was negative $0.68. These costs were lower compared to the same period in 2018, primarily as a result of lower copper production associated with the closure of the Reed mine, partially offset by lower treatment, refining and freight costs and higher by-product credits on a per pound of copper basis.
Sustaining cash cost per pound of copper produced, net of by-product credits, in the third quarter of 2019 was $2.40, which is higher than the prior year period due to increased capital development expenditures at Lalor and lower copper production. Copper produced in the third quarter of 2019 was 29% lower than the same quarter in 2018 as a result of the closure of Reed mine, partially offset by increased production at 777 and Lalor.
Cash cost and sustaining cash cost per pound of zinc produced, net of by-product credits, in the third quarter of 2019 were higher than the same period last year as a result of lower copper and precious metals by-product revenue and higher sustaining capital spending.
Cash costs and sustaining cash costs were higher year-to-date 2019 compared to the corresponding period of 2018 as a result of lower copper production and precious metals by-product revenue and higher sustaining capital expenditures.
16
Metal Sold
| | | Three months ended | Nine months ended |
| | | Sep. 30, | Sep. 30, | Sep. 30, | Sep. 30, |
| | | 2019 | 2018 | 2019 | 2018 |
| Payable metal in concentrate | | | | | |
| Copper | tonnes | 4,602 | 9,376 | 17,050 | 26,376 |
| Gold | oz | 21,630 | 26,996 | 64,523 | 74,078 |
| Silver | oz | 227,157 | 338,131 | 757,846 | 879,909 |
| Zinc | tonnes | — | 4,659 | — | 7,334 |
| | | | | | |
| Refined zinc | tonnes | 29,140 | 26,310 | 76,318 | 77,255 |
17
FINANCIAL REVIEW
Financial Results
In the third quarter of 2019, we recorded a net loss of $274.8 million compared to a profit of $22.8 million for the same period in 2018, a decrease in profit of $297.6 million.
Year-to date in 2019, we recorded a net loss of $342.4 million compared to a profit of $88.9 million in the same period in 2018, a decrease in profit of $431.3 million.
The following table provides further details on these variances:
| | Three months ended | Nine months ended |
| (in $ millions) | September 30, 2019 | September 30, 2019 |
| (Decrease) increase in components of profit or loss: | | |
| Revenues | (71.3) | (207.6) |
| Cost of sales | | |
| Mine operating costs | 13.1 | 35.0 |
| Depreciation and amortization | 4.0 | (0.2) |
| Selling and administrative expenses | 1.6 | (11.9) |
| Other operating expenses | (1.4) | (34.0) |
| Impairment | (322.2) | (322.2) |
| Net finance expense | (2.3) | (24.4) |
| Other | (0.2) | 1.7 |
| Tax | 81.1 | 132.3 |
| (Decrease) increase in profit for the period | (297.6) | (431.3) |
Revenue
Revenue for the third quarter of 2019 was $291.3 million, $71.3 million lower than the same period in 2018, primarily as a result of lower metal prices and sales volumes for copper and zinc.
Year-to-date revenue in 2019 was $913.0 million, $207.6 million lower than 2018, due to the same reasons as described for the quarterly variance above.
18
| | Three months ended | Nine months ended |
| (in $ millions) | September 30, 2019 | September 30, 2019 |
| | | |
| Metals prices1 | | |
| Lower copper prices | (12.3) | (56.2) |
| Lower zinc prices | (4.8) | (29.7) |
| Higher gold prices | 7.4 | 8.5 |
| Lower silver prices | (0.3) | (3.4) |
| Sales volumes | | |
| Lower copper sales volumes | (56.2) | (105.3) |
| Lower zinc sales volumes | (5.0) | (26.3) |
| Lower gold sales volumes | (7.0) | (11.7) |
| (Lower) higher silver sales volumes | (2.7) | 3.1 |
| Other | | |
| (Lower) higher derivative mark-to-market gains | (0.8) | 1.3 |
| Molybdenum and other volume and pricing differences | 2.5 | 16.4 |
| Variable consideration adjustments | — | (16.5) |
| Effect of lower treatment and refining charges | 7.9 | 12.2 |
| Decrease in revenue in 2019 compared to 2018 | (71.3) | (207.6) |
1 See discussion below for further information regarding metals prices.
Our revenue by significant product type is summarized below:
| | Three months ended | Nine months ended |
| | | | Sep. 30, | Sep. 30, |
| (in $ millions) | Sep. 30, 2019 | Sep. 30, 2018 | 2019 | 2018 |
| Copper | 177.0 | 237.6 | 584.7 | 737.2 |
| Zinc | 75.0 | 86.7 | 212.8 | 270.9 |
| Gold | 36.5 | 37.4 | 107.3 | 115.6 |
| Silver | 18.8 | 23.2 | 65.2 | 64.4 |
| Molybdenum | 9.0 | 5.8 | 26.6 | 9.1 |
| Other metals | 1.0 | 0.8 | 3.5 | 3.3 |
| Gross revenue | 317.3 | 391.5 | 1,000.1 | 1,200.5 |
| Variable consideration adjustments | — | — | (16.3) | 0.2 |
| Pricing and volume adjustments1 | (5.8) | (0.8) | (8.5) | (5.6) |
| Treatment and refining charges | (20.2) | (28.1) | (62.3) | (74.5) |
| Revenue | 291.3 | 362.6 | 913.0 | 1,120.6 |
1Pricing and volume adjustments represents mark-to-market adjustments on provisionally prices sales, realized and unrealized changes to fair value for non-hedge derivative contracts and adjustments to originally invoiced weights and assays.
For further detail on variable consideration adjustments, refer to note 16 of our consolidated interim financial statements.
19
Realized sales prices
This measure is intended to enable management and investors to understand the average realized price of metals sold to third parties in each reporting period. The average realized price per unit sold does not have any standardized meaning prescribed by IFRS, is unlikely to be comparable to similar measures presented by other issuers, and should not be considered in isolation or a substitute for measures of performance prepared in accordance with IFRS.
For sales of copper, gold and silver we may enter into non-hedge derivatives (“QP hedges”) which are intended to manage the provisional pricing risk arising from quotational period terms in concentrate sales agreements. The QP hedges are not removed from the calculation of realized prices. We expect that gains and losses on QP hedges will offset provisional pricing adjustments on concentrate sales contracts.
Our realized prices for the third quarter in 2019 and 2018, respectively, are summarized below:
| | | | Realized prices1for the | | Realized prices1for the |
| | | | Three months ended | | Nine months ended |
| | | LME QTD | | | LME YTD | | |
| | 20192 | Sep. 30, 2019 | Sep. 30, 2018 | 20192 | Sep. 30, 2019 | Sep. 30, 2018 |
| Prices | | | | | | | |
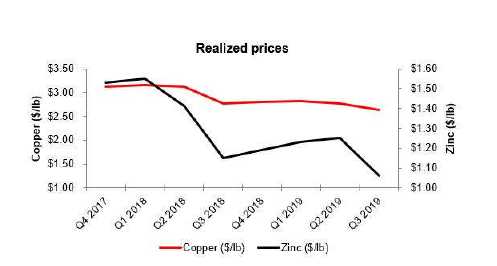
| Copper | $/lb | 2.63 | 2.60 | 2.75 | 2.74 | 2.74 | 2.99 |
| Zinc4 | $/lb | 1.06 | 1.16 | 1.23 | 1.18 | 1.26 | 1.44 |
| Gold3 | $/oz | | 1,460 | 1,169 | | 1,421 | 1,301 |
| Silver3 | $/oz | | 25.28 | 24.96 | | 25.08 | 26.63 |
| Molybdenum | $/lb | | 11.30 | 11.28 | | 11.97 | 11.96 |
1Realized prices exclude refining and treatment charges and are on the sale of finished metal or metal in concentrate. Realized prices include the effect of provisional pricing adjustments on prior period sales.
2London Metal Exchange average for copper and zinc prices.
3Sales of gold and silver from our 777 and Constancia mines are subject to our precious metals stream agreement with Wheaton Precious Metals, pursuant to which we recognize deferred revenue for precious metals deliveries and also receive cash payments. Stream sales are included within realized prices and their respective deferred revenue and cash payment rates can be found on page 22.
4This amount includes a realized sales price of $1.25 and $1.46 for cast zinc metal and $1.11 and $1.29 for zinc concentrate sold for the three and nine months ended September 30, 2018, respectively. Zinc realized prices include premiums paid by customers for delivery of refined zinc metal, but exclude unrealized gains and losses related to non-hedge derivative contracts that are included in zinc revenues.
20
The following table provides a reconciliation of average realized price per unit sold, by metal, to revenues as shown in the consolidated financial statements.
| Three months ended September 30, 2019 |
| | | | | | | | |
| (in $ millions)1 | Copper | Zinc | Gold | Silver | Molybdenum | Other | Total |
| Revenue per financial statements | 177.0 | 75.0 | 36.5 | 18.8 | 9.0 | 1.0 | 317.3 |
| Pricing and volume adjustments2 | (5.5) | (0.6) | 0.7 | 0.3 | (0.7) | — | (5.8) |
| Derivative mark-to-market3 | — | — | — | — | — | — | — |
| Revenue, excluding mark-to-market on non-QP hedges | 171.5 | 74.4 | 37.2 | 19.1 | 8.3 | 1.0 | 311.5 |
| Payable metal in concentrate sold4 | 29,916 | 29,140 | 25,488 | 756,296 | 334 | — | — |
| Realized price5 | 5,735 | 2,551 | 1,460 | 25.28 | 24,901 | — | — |
| Realized price6 | 2.60 | 1.16 | — | — | 11.30 | — | — |
| Nine Months Ended September 30, 2019 |
| | | | | | | | |
| (in $ millions)1 | Copper | Zinc | Gold | Silver | Molybdenum | Other | Total |
| Revenue per financial statements | 584.7 | 212.8 | 107.3 | 65.2 | 26.6 | 3.5 | 1,000.1 |
| Pricing and volume adjustments2 | (11.2) | 0.2 | 4.4 | (1.4) | (0.5) | — | (8.5) |
| Derivative mark-to-market3 | — | (0.3) | — | — | — | — | (0.3) |
| Revenue, excluding mark-to-market on non-QP hedges | 573.5 | 212.7 | 111.7 | 63.8 | 26.1 | 3.5 | 991.3 |
| Payable metal in concentrate sold4 | 94,804 | 76,318 | 78,655 | 2,543,503 | 987 | | |
| Realized price5 | 6,049 | 2,788 | 1,421 | 25.08 | 26,386 | | |
| Realized price6 | 2.74 | 1.26 | — | — | 11.97 | | |
| Three months ended September 30, 2018 |
| | | | | | | | |
| (in $ millions)1 | Copper | Zinc | Gold | Silver | Molybdenum | Other | Total |
| Revenue per financial statements | 237.6 | 86.7 | 37.4 | 23.2 | 5.8 | 0.8 | 391.5 |
| Pricing and volume adjustments2 | 2.5 | (1.8) | (0.6) | (1.1) | 0.1 | 0.1 | (0.8) |
| Derivative mark-to-market3 | — | (0.8) | — | — | — | — | (0.8) |
| Revenue, excluding mark-to-market | | | | | | | |
| on non-QP hedges | 240.1 | 84.1 | 36.8 | 22.1 | 5.9 | 0.9 | 389.9 |
| Payable metal in concentrate sold4 | 39,598 | 30,969 | 31,482 | 886,913 | 237 | — | — |
| Realized price5 | 6,065 | 2,714 | 1,169 | 24.96 | 24,869 | — | — |
| Realized price6 | 2.75 | 1.23 | — | — | 11.28 | — | — |
| Nine months ended September 30, 2018 |
| | | | | | | | |
| (in $ millions)1 | Copper | Zinc | Gold | Silver | Molybdenum | Other | Total |
| Revenue per financial statements | 737.2 | 270.9 | 115.6 | 64.4 | 9.1 | 3.3 | 1,200.5 |
| Pricing and volume adjustments2 | (2.2) | (3.1) | (2.2) | 1.1 | 0.7 | 0.1 | (5.6) |
| Derivative mark-to-market3 | — | 1.0 | — | — | — | — | 1.0 |
| Revenue, excluding mark-to-market on non-QP hedges | 735.0 | 268.8 | 113.4 | 65.5 | 9.8 | 3.4 | 1,195.9 |
| Payable metal in concentrate sold4 | 111,573 | 84,589 | 87,236 | 2,462,853 | 372 | — | — |
| Realized price5 | 6,588 | 3,177 | 1,301 | 26.63 | 26,374 | — | — |
| Realized price6 | 2.99 | 1.44 | — | — | 11.96 | — | — |
1Average realized price per unit sold may not calculate based on amounts presented in this table due to rounding.
2Pricing and volume adjustments represents mark-to-market adjustments on provisionally priced sales, realized and unrealized changes to fair value for non-hedge derivative contracts and adjustments to originally invoiced weights and assays.
3Derivative mark-to-market excludes mark-to-market on QP hedges.
4Copper and zinc shown in metric tonnes and gold and silver shown in ounces.
5Realized price for copper, zinc and molybdenum in $/metric tonne and realized price for gold and silver in $/oz.
6Realized price for copper, zinc and molybdenum in $/lb.
21
The price, quantity and mix of metals sold, affect our revenue, operating cash flow and profit. Revenue from metals sales can vary from quarter to quarter due to production levels, shipping volumes and transfer of risk and title to customers.
Stream Sales
The following table shows stream sales included within realized prices and their respective deferred revenue and cash payment rates:
| | | Three months ended | Nine months ended |
| | | Sep. 30, 2019 | Sep. 30, 2019 |
| | | Manitoba | Peru | Manitoba | Peru |
| Gold | oz | 4,672 | 2,737 | 13,580 | 8,647 |
| Silver | oz | 85,881 | 521,360 | 293,981 | 1,733,812 |
| Gold deferred revenue drawdown rate1,2 | $/oz | 1,183 | 948 | 1,176 | 948 |
| Gold cash rate3 | $/oz | 419 | 404 | 417 | 401 |
| Silver deferred revenue drawdown rate1,2 | $/oz | 22.63 | 21.77 | 22.48 | 21.77 |
| Silver cash rate3 | $/oz | 6.18 | 5.96 | 6.15 | 5.92 |
| | | Three months ended | Nine months ended |
| | | Sep. 30, 2018 | Sep. 30, 2018 |
| | | Manitoba | Peru | Manitoba | Peru |
| Gold | oz | 5,921 | 2,980 | 14,864 | 8,399 |
| Silver | oz | 163,444 | 566,968 | 385,915 | 1,551,162 |
| Gold deferred revenue drawdown rate1 | $/oz | 1,250 | 967 | 1,268 | 967 |
| Gold cash rate3 | $/oz | 413 | 400 | 412 | 400 |
| Silver deferred revenue drawdown rate1 | $/oz | 24.38 | 21.79 | 24.65 | 21.79 |
| Silver cash rate3 | $/oz | 6.12 | 5.90 | 6.09 | 5.90 |
1For the three months ended September 30, 2019 deferred revenue amortization is recorded in Manitoba at C$1,589/oz and C$30.40/oz for gold and silver (September 30, 2018 - C$1,635/oz and C$31.88/oz for gold and silver), respectively, and converted to US dollars at the exchange rate in effect at the time of revenue recognition.
2Deferred revenue drawdown rates for gold and silver do not include variable consideration adjustments.
3The gold and silver cash rate for Manitoba increased by 1% from $400/oz and $5.90/oz effective August 1, 2015. Subsequently every year, on August 1, the cash rate will increase by 1% compounded. The weighted average cash rate is disclosed.
22
Cost of Sales
Our detailed cost of sales is summarized as follows:
| | Three months ended | Nine months ended |
| | Sep. 30, | Sep. 30, | Sep. 30, | Sep. 30, |
| (in thousands) | 2019 | 2018 | 2019 | 2018 |
| Peru | | | | |
| Mining | 18,274 | 22,252 | 63,884 | 69,603 |
| Milling | 38,064 | 35,783 | 116,053 | 110,426 |
| Changes in product inventory | (5,075) | (924) | (10,723) | (7,594) |
| Depreciation and amortization | 47,236 | 53,383 | 152,188 | 158,642 |
| G&A | 15,148 | 11,351 | 42,352 | 41,301 |
| Freight, royalties and other charges | 14,776 | 15,639 | 42,467 | 42,737 |
| Total Peru cost of sales | 128,423 | 137,484 | 406,221 | 415,115 |
| Manitoba | | | | |
| Mining | 43,525 | 35,533 | 140,637 | 122,283 |
| Milling | 12,118 | 13,005 | 35,873 | 39,172 |
| Zinc plant | 18,552 | 17,409 | 52,795 | 54,171 |
| Purchased ore and concentrate (before inventory changes) | — | 3,528 | — | 20,804 |
| Changes in product inventory | 3,317 | 14,192 | (7,680) | 8,460 |
| Depreciation and amortization | 35,050 | 32,881 | 98,422 | 91,782 |
| G&A | 11,552 | 11,604 | 35,619 | 36,747 |
| Freight, royalties and other charges | 7,790 | 11,731 | 25,158 | 33,545 |
| Total Manitoba cost of sales | 131,904 | 139,883 | 380,824 | 406,964 |
| Cost of sales | 260,327 | 277,367 | 787,045 | 822,079 |
Total cost of sales for the third quarter of 2019 was $260.3 million, reflecting a decrease of $17.0 million from the third quarter of 2018. Cost of sales related to Peru decreased for the third quarter of 2019 compared to the same period of 2018 by $9.1 million. The decrease is primarily the result of a decrease in mining costs, depreciation and product inventory changes in the third quarter of 2019. In Manitoba, cost of sales decreased by $8.0 million compared to the third quarter of 2018 primarily as a result of the closure of the Reed mine and the associated elimination of Reed ore purchases, as well as lower changes in product inventory and freight, royalties and other charges. This decrease was partially offset by higher depreciation costs and mining costs.
For details on unit operating costs refer to the respective tables in the “Operations Review” section of this MD&A.
For the third quarter of 2019, other significant variances in expenses from operations, compared to the same period in 2018, include the following:
| – | Selling and administrative expensesdecreased by $1.6 million compared to the same period in 2018. This decrease was mainly due to lower stock compensation charges as a result of the revaluation of previously issued share units. |
| | |
| – | Other operating expensesincreased by $1.4 million compared to the third quarter of 2018 primarily as a result of changes in closure cost estimates for Manitoba's non-operating mines and costs pertaining to community agreements. |
| | |
| – | Impairment lossesincreased by $322.2 million compared to the third quarter of 2018 as a result of an impairment charge recorded in the third quarter of 2019 relating to the Arizona business unit. |
23
– | Net finance expenseincreased by $2.3 million compared to the same period in 2018 principally as a result of net losses on investments recognized at fair value through profit or loss, partially offset by increased foreign exchange gains. |
For 2019 year-to-date, other significant variances in expenses from operations, compared to 2018, include the following:
| – | Selling and administrative expensesincreased by $11.9 million compared to the same period in 2018. This increase was due mainly to costs associated with the proxy contest earlier in the year and acquisition costs associated with consolidating a 100% ownership interest in the Rosemont copper project, as well as higher stock based compensation charges as a result of the relative impact of the revaluation of previously issued shares. |
| | |
| – | Other operating expensesincreased by $34.0 million primarily as a result of the write down of the receivable from United Copper & Moly LLC ("UCM") for $26.0 million in the second quarter of 2019 as part of the acquisition of the remaining interest in the Rosemont copper project, as well as losses on disposition of certain fixed assets, changes in closure cost estimates related to Manitoba's non-operating mines and certain allocated costs pertaining to community agreements in Peru. |
| | |
| – | Impairment lossesincreased by $322.2 million as a result of an impairment charge recorded in the third quarter of 2019 relating to the Arizona business unit. |
| | |
| – | Finance expensesincreased by $6.7 million primarily due to an increase in non-cash financing charges for our precious metals steam contracts in 2019. This charge was the result of the deferred revenue adjustments for the 777 stream arrangement driven by an increase in 777's reserve and resource estimates. |
| | |
| – | Other finance gainsdecreased by $19.0 million as a result of: |
| | – | decreased foreign exchange gains of $10.2 million when compared to the same period last year, related to foreign exchange rate movements impacting certain monetary assets in the Manitoba business unit; |
| | | |
| | – | net gains on our embedded derivatives and investments recognized at fair value through profit or loss which decreased by $2.1 million when compared to the same period last year; and, |
| | | |
| | – | mark-to-market gains on warrants, which expired in July 2018, were $6.7 million in 2018, compared to nil in the corresponding period of 2019. |
Tax Expense (Recovery)
For the three and nine months ended September 30, 2019, tax expense decreased by $81.1 million and $132.3 million compared to the same period in 2018. The following table provides further details:
24
| | Three months ended | Nine months ended |
| | Sep. 30, | Sep. 30, | Sep. 30, | Sep. 30, |
| (in $ thousands) | 2019 | 2018 | 2019 | 2018 |
| Deferred tax expense (recovery) - income tax1 | $ (80,982) | $3,302 | $ (84,004) | $ 28,384 |
| Deferred tax expense (recovery) - mining tax1 | 2,442 | (555) | 112 | (1,042) |
| Total deferred tax expense (recovery) | (78,540) | 2,747 | (83,892) | 27,342 |
| Current tax expense - income tax | 6,542 | 2,462 | 11,134 | 20,123 |
| Current tax (recovery) expense - mining tax | (1,573) | 2,270 | 4,704 | 16,796 |
| Total current tax expense | 4,969 | 4,732 | 15,838 | 36,919 |
| | | | | |
| Tax expense | $ (73,571) | $7,479 | $ (68,054) | $ 64,261 |
1Deferred tax expense (recovery) represents our draw down/increase of non-cash deferred income and mining tax assets/liabilities.
Income Tax Expense
Applying the estimated Canadian statutory income tax rate of 27.0% to our loss before taxes of $410.4 million for the year-to-date period in 2019 would have resulted in a tax recovery of approximately $110.8 million; however, we recorded an income tax recovery of $72.9 million. The significant items causing our effective income tax rate to be different than the 27.0% estimated Canadian statutory income tax rate include:
| – | Certain deductible temporary differences with respect to Manitoba, mostly relating to decommissioning and restoration liabilities, were not recognized as we have determined that it is not probable that we will realize the recovery of these deferred tax assets based on the timing of the reversals of the deductible temporary differences and the future projected taxable profit of the Manitoba operations. Adjusted for the average annual effective tax rate methodology, this resulted in an increase in deferred tax expense of approximately $12.2 million; |
| | |
| – | Certain deductible temporary differences with respect to our foreign operations are recorded using an income tax rate other than the Canadian statutory income tax rate of 27%, resulting in an increased in deferred tax expense of $12.7 million; |
| | |
| – | The write down of the UCM receivable of $26.0 million is not deductible for local income tax purposes and therefore results in an increase in deferred tax expense of approximately $7.0 million; |
| | |
| – | An intercompany dividend payment being subject to withholding tax that is classified as current income tax of $6.9 million; |
| | |
| – | Certain deductible temporary differences with respect to Peru, mostly relating to decommissioning and restoration liabilities, were not recognized as we have determined that it is not probable that we will realize the recovery of these deferred tax assets based on the timing of the reversals of the deductible temporary differences and the future projected taxable profit of the Peru operations. This resulted in an increase in deferred tax expense of approximately $5.6 million; and |
| | |
| – | A decrease in the deferred tax expense of $3.0 million is due to the fact that certain Canadian non-monetary assets are recognized at historical cost while the tax bases of the underlying assets change as exchange rates fluctuate, giving rise to temporary differences. |
25
Mining Tax Expense
Applying the estimated Manitoba mining tax rate of 10.0% to our loss before taxes of $410.4 million for the year-to-date period in 2019 would have resulted in a tax recovery of approximately $41.0 million and we recorded a mining tax expense of $4.8 million. Effective mining tax rates can vary significantly based on the composition of our earnings and the expected amount of mining taxable profits. Corporate costs and other costs not related to mining operations are not deductible in computing mining profits. A brief description of how mining taxes are calculated in our various business units is discussed below.
Manitoba
The Province of Manitoba imposes mining tax on profit related to the sale of mineral products mined in the Province of Manitoba (mining taxable profit) at the following rates:
| – | 10% of total mining taxable profit if mining profit is C$50 million or less; |
| – | 15% of total mining taxable profit if mining profits are between C$55 million and C$100 million; and |
| – | 17% of total mining taxable profit if mining profits exceed C$105 million. |
We estimate that the tax rate that will be applicable when temporary differences reverse will be approximately 10.0% .
Peru
The Peruvian government imposes two parallel mining tax regimes, the Special Mining Tax and the Modified Royalty, on companies' operating mining income on a sliding scale, with progressive rates ranging from 2.0% to 8.4% and 1.0% to 12.0%, respectively. Based on financial forecasts, we have recorded a deferred tax liability as at September 30, 2019, at the tax rate we expect to apply when temporary differences reverse.
LIQUIDITY AND CAPITAL RESOURCES
Senior Secured Revolving Credit Facilities and Surety Bonds
We have two revolving credit facilities (the “Credit Facilities”) for our Canadian and Peruvian businesses, with combined total availability of $550 million and substantially similar terms and conditions. As at September 30, 2019, between our Credit Facilities we have drawn $127.8 million in letters of credit, leaving total undrawn availability of $422.2 million. As at September 30, 2019, we were in compliance with our covenants under the Credit Facilities.
As at September 30, 2019, the Arizona business unit had $58.9 million in surety bonds and the Peru business unit had $40.0 million in surety bonds, issued to support future reclamation and closure obligations. The Arizona surety bonds outstanding have been reduced to $8.6 million since September 30, 2019.
No cash collateral is required to be posted.
Financial Condition
Financial Condition as at September 30, 2019 compared to December 31, 2018
Cash and cash equivalents decreased by $117.1 million year-to-date to $398.4 million as at September 30, 2019. This decrease was mainly a result of $170.5 million of funding for capital investments primarily at our Peru and Manitoba operations, interest payments and financing activities of $123.4 million and our acquisition of the remaining interest in the Rosemont project for $45 million. This decrease was partially offset by cash flow from operating activities of $212.2 million. We hold the majority of our cash and cash equivalents in low-risk, liquid investments with major Canadian and Peruvian financial institutions.
26
Working capital decreased by $77.4 million to $367.9 million from December 31, 2018 to September 30, 2019, primarily due to the decrease in our cash and cash equivalents position by $117.1 million. This decrease in working capital was partially offset by an increase in current inventories of $43.0 million as a result of the timing of zinc metal and copper concentrate shipments, as well as an increase in zinc concentrate work in progress and stockpile inventories during 2019.
Cash Flows
The following table summarizes our cash flows for the three and nine months ended September 30, 2019 and September 30, 2018:
| | Three months ended | Nine months ended |
| | Sep. 30, | Sep. 30, | Sep. 30, | Sep. 30, |
| (in $ thousands) | 2019 | 2018 | 2019 | 2018 |
| Operating cash flow before changes in non-cash working capital | 69,910 | 122,097 | 240,649 | 385,524 |
| Change in non-cash working capital | (26,427) | (8,271) | (28,459) | (43,295) |
| Cash generated from operating activities | 43,483 | 113,826 | 212,190 | 342,229 |
| Cash (used in) generated by investing activities | (75,535) | (43,226) | (205,679) | (128,374) |
| Cash (used in) generated by financing activities | (59,050) | (50,510) | (123,392) | (110,762) |
| Effect of movement in exchange rates on cash and cash equivalents | 13 | 197 | (178) | 271 |
| (Decrease) increase in cash and cash equivalents | (91,089) | 20,287 | (117,059) | 103,364 |
Cash Flow from Operating Activities
Cash generated from operating activities was $43.5 million during the third quarter of 2019, a decrease of $70.3 million compared with the same period last year. Operating cash flow before change in non-cash working capital was $69.9 million during the third quarter of 2019, reflecting a decrease of $52.2 million compared to the third quarter of 2018, which was further negatively impacted by unfavourable working capital movements during the third quarter of 2019 compared to the same quarter of 2018. The decrease in operating cash flow is the result of lower realized prices and lower sales volumes of copper and zinc when compared to the third quarter of 2018.
Year-to-date cash generated from operating activities was $212.2 million, a decrease of $130.0 million compared to 2018. Operating cash flow before changes in non-cash working capital was $240.6 million year-to-date in 2019, a decrease of $144.9 million compared to 2018. The year-to-date decrease in operating cash flow is primarily due to the same reasons described above for the quarter over quarter change.
Cash Flow from Investing and Financing Activities
During the third quarter of 2019, we used $134.6 million in investing and financing activities, primarily driven by $78.1 million of capital expenditures, interest payments on our long-term debt of $37.4 million, finance lease payments of $9.0 million and net financing fees paid of $10.7 million.
Year-to-date, we used $329.1 million of cash in investing and financing activities, primarily driven by $170.5 million of capital expenditures, interest payments of $74.8 million, $44.7 million paid for the acquisition of the remaining interest in the Rosemont project, finance lease payments of $23.8 million and net financing fees paid of $20.9 million.
27
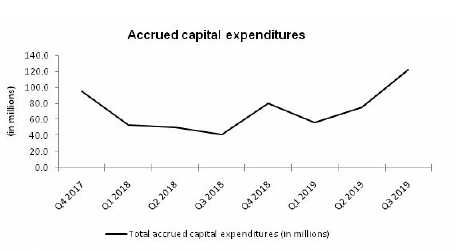
Capital Expenditures
The following summarizes accrued and cash additions to capital assets for the periods indicated:
| | Three months ended | Nine months ended | Guidance |
| | Sep. 30, | Sep. 30, | Sep. 30, | Sep. 30, | Annual1 |
| (in $ millions) | 2019 | 2018 | 2019 | 2018 | 2019 |
| Manitoba sustaining capital expenditures2 | 44.5 | 28.7 | 95.7 | 72.5 | 100.0 |
| Peru sustaining capital expenditures3 | 25.0 | 10.0 | 53.5 | 27.8 | 95.0 |
| Total sustaining capital expenditures | 69.5 | 38.7 | 149.2 | 100.3 | 195.0 |
| Arizona capitalized costs4 | 16.0 | 4.2 | 29.4 | 14.6 | 40.0 |
| Peru growth capitalized expenditures | 0.3 | 0.2 | 0.9 | 2.0 | 45.0 |
| Manitoba growth capitalized expenditures | 3.7 | 0.9 | 6.9 | 17.9 | 10.0 |
| Other capitalized costs5 | 18.1 | (6.9) | 41.6 | (4.0) | |
| Capitalized exploration | 4.8 | 0.2 | 6.8 | 1.5 | 15.0 |
| Capitalized interest | 3.3 | 3.3 | 9.9 | 9.9 | |
| Total other capitalized costs | 46.2 | 1.9 | 95.5 | 41.9 | |
| Total accrued capital additions | 115.7 | 40.6 | 244.7 | 142.2 | |
| Reconciliation to cash capital additions: | | | | | |
| Decommissioning and restoration obligation | (16.4) | 7.2 | (42.8) | 6.4 | |
| Capitalized interest | (3.3) | (3.3) | (9.9) | (9.9) | |
| Right-of-use asset additions | (15.2) | — | (19.8) | — | |
| Changes in capital accruals and other | (2.7) | 2.4 | (1.7) | (5.2) | |
| Total cash capital additions | 78.1 | 46.9 | 170.5 | 133.5 | |
1 Sustaining capital expenditure guidance excludes capitalized interest.
2 Manitoba sustaining capital expenditures for the three and nine months ended September 30, 2019 include a new capitalized lease related to sustaining capital expenditures of $14.3 million not included in annual guidance.
3Peru sustaining capital expenditures includes capitalized stripping costs.
4Initial guidance of $20.0 million.
5Other capitalized costs include decommissioning and restoration adjustments.
Sustaining capital expenditures in Manitoba for the three and nine months ended September 30, 2019 were $44.5 million and $95.7 million, respectively, an increase of $15.8 million and $23.2 million compared to the same periods in 2018. The increase in Manitoba sustaining capital expenditures compared to the same periods last year was due to negotiated amendments to a contract with an existing Lalor mine contractor as the contractor's equipment is now accounted for as a capitalized lease under IFRS, resulting in additional reported sustaining capital expenditures of $14.3 million.
Sustaining capital expenditures in Peru for the three and nine months ended September 30, 2019 were $25.0 million and $53.5 million, respectively, which is an increase of $15.0 million and $25.7 million compared to the same periods in 2018. The increase in Peru sustaining capital expenditures compared to the same periods last year was the result of increased civil works projects.
As disclosed in March 2019, the Board approved a $122 million early works program for Rosemont in addition to the $20 million of initial guidance for Arizona capitalized costs. As a result of the Court's ruling issued on July 31, 2019, we have suspended most of the early works activities and now expect Rosemont project spending of approximately $20 million in 2019, together with $20 million of non-project spending.
The timing of growth capital expenditures in Peru depends on progress in community negotiations to acquire surface rights to the Pampacancha deposit.
28
We expect consolidated sustaining capital expenditures in 2019 to be in line with full year guidance, with lower spending in Peru offsetting higher spending in Manitoba.
Capital Commitments
As at September 30, 2019, we had outstanding capital commitments in Canada of approximately $5.7 million primarily related to Lalor mine equipment, all of which can be terminated, approximately $37.2 million in Peru primarily related to exploration option agreements, all of which can be terminated, and approximately $180.0 million in Arizona, primarily related to our Rosemont project, of which approximately $90.6 million cannot be terminated.
Contractual Obligations
The following table summarizes our significant contractual obligations as at September 30, 2019:
| | | Less than | 13 - 36 | 37 - 60 | More than |
| Payment Schedule (in $ millions) | Total | 12 months | months | months | 60 months |
| Long-term debt obligations1 | 1,367.1 | 79.6 | 158.6 | 506.0 | 622.9 |
| Lease obligations | 144.0 | 52.7 | 80.2 | 6.8 | 4.3 |
| Purchase obligation - capital commitments | 222.9 | 29.5 | 45.4 | 2.6 | 145.4 |
| Purchase obligation - other commitments2 | 639.9 | 219.4 | 228.8 | 127.0 | 64.7 |
| Pension and other employee future benefits obligations3 | 133.4 | 14.8 | 30.8 | 6.7 | 81.1 |
| Decommissioning and restoration obligations4 | 211.5 | 9.2 | 1.8 | 9.5 | 191.0 |
| Total | 2,718.8 | 405.2 | 545.6 | 658.6 | 1,109.4 |
1Long-term debt obligations include scheduled interest payments, as well as principal repayments.
2Primarily made up of long-term agreements with operational suppliers, obligations for power purchase, concentrate handling, fleet and port services, as well as deferred consideration arising from the acquisition of Rosemont's minority interest.
3Discounted.
4 Before inflation.
In addition to the contractual obligations included in the above payment schedule, we also have the following commitments which impact our financial position:
| – | A profit-sharing plan with most Manitoba employees; |
| – | A profit-sharing plan with all Peru employees; |
29
| – | Wheaton Precious Metals precious metals stream agreements for the 777 mine and Constancia mines; |
| – | A net smelter returns royalty agreement related to the 777 mine; and, |
| – | Various royalty agreements related to the Constancia mine. |
Liquidity
As at September 30, 2019, we had total liquidity of approximately $820.6 million, including $398.4 million in cash and cash equivalents, as well as $422.2 million in availability under our Credit Facilities. We expect that our current liquidity and future cash flows will be sufficient to meet our obligations in the coming year.
Outstanding Share Data
As of November 8, 2019, there were 261,272,151 common shares of Hudbay issued and outstanding.
TREND ANALYSIS AND QUARTERLY REVIEW
The following table sets forth selected consolidated financial information for each of our eight most recently completed quarters:
| | | | | | | | | (Restated) |
| | | 2019 | | | 2018 | | 2017 |
| (in $ millions) | Q3 | Q2 | Q1 | Q4 | Q3 | Q2 | Q1 | Q4 |
| Revenue | 291.3 | 329.4 | 292.3 | 351.8 | 362.6 | 371.3 | 386.7 | 424.4 |
| Gross margin | 31.0 | 43.1 | 51.8 | 75.2 | 85.3 | 92.5 | 120.8 | 145.0 |
| Profit (loss) before tax | (348.4) | (43.9) | (18.1) | 17.7 | 30.3 | 49.8 | 73.1 | 79.6 |
| (Loss) profit | (274.8) | (54.1) | (13.4) | (3.5) | 22.8 | 24.7 | 41.4 | 94.3 |
| (Loss) earnings per share: | | | | | | | | |
| Basic and Diluted | (1.05) | (0.21) | (0.05) | (0.01) | 0.09 | 0.09 | 0.16 | 0.36 |
| Operating cash flow1 | 69.9 | 81.1 | 89.6 | 107.9 | 122.1 | 131.6 | 131.8 | 171.9 |
1Operating cash flow before changes in non-cash working capital
Revenues were lower in the third quarter of 2019 compared to the prior quarters of 2019 and all of 2018 as a result of declining base metal prices as well as lower sales volumes of copper, zinc and precious metals mainly due to the closure of the Reed mine in August 2018 and lower grades as compared to prior periods. Earnings in the third quarter of 2019 also included an after-tax impairment charge of $242.1 million, net of tax for the Arizona business unit as a result of the Court's decision related to the Rosemont project permits. Operating cash flow before changes in non-cash working capital during the third quarter of 2019 was also lower compared to prior periods given the lower revenues. Earnings in the second quarter of 2019 were impacted by a write down of $26.0 million related to the UCM receivable which was exchanged for higher ownership in the Rosemont project prior to purchasing the remaining interest from UCM on April 25, 2019. In the first quarter of 2019, pre-tax revenue and finance expenses were negatively impacted by a $22.3 million charge due to a deferred revenue adjustment arising from higher reserves and resources. In addition, in the first quarter of 2019, an additional delivery obligation of $7.5 million was recognized related to the expectation that mining of the Pampacancha deposit will not begin until 2020.
Revenue and operating cash flow were relatively consistent in 2018, following strong production and sales volumes in the fourth quarter of 2017.
30
For information on previous trends and quarterly reviews, refer to our MD&A dated for the year ended December 31, 2018 dated February 19, 2019.
NON-IFRS FINANCIAL PERFORMANCE MEASURES
Net debt is shown because it is a performance measure used by the Company to assess our financial position. Cash cost, sustaining and all-in sustaining cash cost per pound of copper produced are shown because we believe they help investors and management assess the performance of our operations, including the margin generated by the operations and the Company. Cash cost and sustaining cash cost per pound of zinc produced are shown because we believe they help investors and management assess the performance of our Manitoba operations. These measures do not have a meaning prescribed by IFRS and are therefore unlikely to be comparable to similar measures presented by other issuers. These measures should not be considered in isolation or as a substitute for measures prepared in accordance with IFRS and are not necessarily indicative of operating profit or cash flow from operations as determined under IFRS. Other companies may calculate these measures differently.
Net Debt
The following table presents our calculation of net debt as at September 30, 2019 and December 31, 2018:
| | Sep. 30, | Dec. 31, |
| (in $ thousands) | 2019 | 2018 |
| Total long-term debt | 976,272 | 981,030 |
| Cash and cash equivalents | (398,438) | (515,497) |
| Net debt | 577,834 | 465,533 |
Cash Cost, Sustaining and All-in Sustaining Cash Cost (Copper Basis)
Cash cost per pound of copper produced (“cash cost”) is a non-IFRS measure that management uses as a key performance indicator to assess the performance of our operations. Our calculation designates copper as our primary metal of production as it has been the largest component of revenues. The calculation is presented in four manners:
| – | Cash cost, before by-product credits- This measure is gross of by-product revenues and is a function of the efforts and costs incurred to mine and process all ore mined. However, the measure divides this aggregate cost over only pounds of copper produced, our primary metal of production. This measure is generally less volatile from period to period, as it is not affected by changes in the price received for by- product metals. It is, however, significantly affected by the relative mix of copper concentrate and finished zinc production, where the sale of the zinc will occur later, and an increase in production of zinc metal will tend to result in an increase in cash cost under this measure. |
| | |
| – | Cash cost, net of by-product credits- In order to calculate the net cost to produce and sell copper, the net of by-product credits measure subtracts the revenues realized from the sale of the metals other than copper. The by-product revenues from zinc, gold, and silver are significant and are integral to the economics of our operations. The economics that support our decision to produce and sell copper would be different if we did not receive revenues from the other significant metals being extracted and processed. This measure provides management and investors with an indication of the minimum copper price consistent with positive operating cash flow and operating margins, assuming realized by-product metal prices are consistent with those prevailing during the reporting period. It also serves as an important operating statistic that management and investors utilize to measure our operating performance versus that of our competitors. However, it is important to understand that if by-product metal prices decline alongside copper prices, the cash cost net of by-product credits would increase, requiring a higher copper price than that reported to maintain positive cash flows and operating margins. |
31
| – | Sustaining cash cost, net of by-product credits- This measure is an extension of cash cost that includes cash sustaining capital expenditures, capitalized exploration and net smelter returns royalties. It does not include corporate selling and administrative expenses. It provides a more fulsome measurement of the cost of sustaining production than cash cost, which is focused on operating costs only. |
| | |
| – | All-in sustaining cash cost, net of by-product credits- This measure is an extension of sustaining cash cost that includes corporate G&A and regional costs. Due to the inclusion of corporate selling and administrative expenses, all-in sustaining cash cost is presented on a consolidated basis only. |
The tables below present a detailed build-up of cash cost and sustaining cash cost, net of by-product credits, by business unit in addition to consolidated all-in sustaining cash cost, net of by-product credits, and reconciliations between cash cost, net of by-product credits, to the most comparable IFRS measures of cost of sales for the three and nine months ended September 30, 2019 and 2018. Cash cost, net of by-product credits may not calculate exactly based on amounts presented in the tables below due to rounding.
| Consolidated | Three months ended | Nine months ended |
| Net pounds of copper produced | | |
| (in thousands) | Sep. 30, 2019 | Sep. 30, 2018 | Sep. 30, 2019 | Sep. 30, 2018 |
| Peru | 68,544 | 72,699 | 192,167 | 201,380 |
| Manitoba | 11,753 | 16,548 | 38,781 | 57,250 |
| Net pounds of copper produced | 80,297 | 89,247 | 230,948 | 258,630 |
| Consolidated | Three months ended | Nine months ended |
| | Sep.30, 2019 | Sep. 30, 2018 | Sep.30, 2019 | Sep. 30, 2018 |
| Cash cost per pound ofcopper produced | $000s | $/lb | $000s | $/lb | $000s | $/lb | $000s | $/lb |
| Cash cost, before by- product credits | 196,889 | 2.46 | 202,622 | 2.27 | 606,515 | 2.62 | 633,418 | 2.45 |
| By-product credits, net of deferred revenue | (118,515) | (1.48) | (123,980) | (1.39) | (349,538) | (1.51) | (389,993) | (1.51) |
| Cash cost, net of by-product credits | 78,374 | 0.98 | 78,642 | 0.88 | 256,977 | 1.11 | 243,425 | 0.94 |
32
| Consolidated | Three months ended | Nine months ended |
| | Sep.30, 2019 | Sep. 30, 2018 | Sep.30, 2019 | Sep. 30, 2018 |
| Supplementarycash | | | | | | | | |
| cost information | $000s | $/lb1 | $000s | $/lb1 | $000s | $/lb1 | $000s | $/lb1 |
| By-product credits: | | | | | | | | |
| Zinc | 74,321 | 0.93 | 84,838 | 0.95 | 213,034 | 0.92 | 267,707 | 1.04 |
| Gold3 | 37,202 | 0.46 | 36,810 | 0.41 | 98,234 | 0.43 | 115,055 | 0.44 |
| Silver3 | 19,116 | 0.24 | 22,139 | 0.25 | 60,959 | 0.26 | 64,184 | 0.25 |
| Molybdenum & other | 9,291 | 0.12 | 6,817 | 0.08 | 29,536 | 0.13 | 13,169 | 0.05 |
| Total by-product credits | 139,930 | 1.74 | 150,604 | 1.69 | 401,763 | 1.74 | 460,115 | 1.78 |
| Less: deferred revenue3 | (21,415) | (0.27) | (26,624) | (0.30) | (52,225) | (0.23) | (70,122) | (0.27) |
| Total by-product credits, net of deferred revenue | 118,515 | 1.48 | 123,980 | 1.39 | 349,538 | 1.51 | 389,993 | 1.51 |
| Reconciliation to IFRS: | | | | | | | | |
| Cash cost, net of by- product credits | 78,374 | | 78,642 | | 256,977 | | 243,425 | |
| By-product credits | 139,930 | | 150,604 | | 401,763 | | 460,115 | |
| Change in deferred revenues | (21,415) | | (26,624) | | (52,225) | | (70,122) | |
| Treatment and refining charges | (20,221) | | (28,126) | | (62,303) | | (74,557) | |
| Share-based payment | (173) | | 50 | | 192 | | (20) | |
| Inventory adjustments | 385 | | (54) | | 604 | | (202) | |
| Change in product inventory | (1,758) | | 13,268 | | (18,403) | | 866 | |
| Royalties | 2,919 | | 3,343 | | 9,830 | | 12,150 | |
| Depreciation and amortization2 | 82,286 | | 86,264 | | 250,610 | | 250,424 | |
| Cost of sales | 260,327 | | 277,367 | | 787,045 | | 822,079 | |
1Per pound of copper produced.
2Depreciation is based on concentrate sold.
3Nine months ended September 30, 2019 gold and silver by-product credits and deferred revenue both reflect the $16.3 million revenue adjustment primarily associated with the increase in reserves and resources at the 777 mine.
| Peru | Three months ended | Nine months ended |
| (in thousands) | Sep. 30, 2019 | Sep. 30, 2018 | Sep. 30, 2019 | Sep. 30, 2018 |
| Net pounds of copper produced1 | 68,544 | 72,699 | 192,167 | 201,380 |
1Contained copper in concentrate.
33
| Peru | Three months ended | | Nine months ended | |
| | Sep.30, 2019 | Sep. 30, 2018 | Sep.30, 2019 | Sep. 30, 2018 |
| Cash cost per pound of | | | | | | | |
| copper produced | $000s | $/lb | $000s | $/lb | $000s | $/lb | $000s | $/lb |
| Mining | 18,274 | 0.27 | 22,252 | 0.31 | 63,884 | 0.33 | 69,603 | 0.35 |
| Milling | 38,064 | 0.56 | 35,783 | 0.49 | 116,053 | 0.60 | 110,426 | 0.55 |
| G&A | 14,791 | 0.22 | 11,391 | 0.16 | 41,700 | 0.22 | 41,497 | 0.21 |
| Onsite costs | 71,129 | 1.04 | 69,426 | 0.95 | 221,637 | 1.15 | 221,526 | 1.10 |
| Treatment & refining | 15,409 | 0.22 | 17,885 | 0.25 | 44,446 | 0.23 | 46,887 | 0.23 |
| Freight & other | 13,375 | 0.20 | 13,726 | 0.19 | 37,895 | 0.20 | 36,921 | 0.18 |
| Cash cost, before by- product credits | 99,913 | 1.46 | 101,037 | 1.39 | 303,978 | 1.58 | 305,334 | 1.52 |
| By-product credits, net of deferred revenue | (13,563) | (0.20) | (12,341) | (0.17) | (47,470) | (0.25) | (28,418) | (0.14) |
| Cash cost, net of by-product credits | 86,350 | 1.26 | 88,696 | 1.22 | 256,508 | 1.33 | 276,916 | 1.38 |
| Peru | Three months ended | | Nine months ended | |
| | Sep. 30,2019 | Sep. 30, 2018 | Sep. 30,2019 | Sep. 30, 2018 |
| Supplementary cash | | | | | | | | |
| cost information | $000s | $/lb1 | $000s | $/lb1 | $000s | $/lb1 | $000s | $/lb1 |
| By-product credits: | | | | | | | | |
| Gold | 4,848 | 0.07 | 5,911 | 0.08 | 18,617 | 0.10 | 15,568 | 0.08 |
| Silver | 14,354 | 0.21 | 15,772 | 0.22 | 50,227 | 0.26 | 44,818 | 0.22 |
| Molybdenum | 8,307 | 0.12 | 5,895 | 0.08 | 26,043 | 0.14 | 9,801 | 0.05 |
| Total by-product credits | 27,509 | 0.40 | 27,578 | 0.38 | 94,887 | 0.49 | 70,187 | 0.35 |
| Less: deferred revenue | (13,946) | (0.20) | (15,237) | (0.21) | (47,417) | (0.25) | (41,769) | (0.21) |
| Total by-product credits, net of deferred revenue | 13,563 | 0.20 | 12,341 | 0.17 | 47,470 | 0.25 | 28,418 | 0.14 |
| Reconciliation to IFRS: | | | | | | | | |
| Cash cost, net of by- product credits | 86,350 | | 88,696 | | 256,508 | | 276,916 | |
| By-product credits | 27,509 | | 27,578 | | 94,887 | | 70,187 | |
| Change in deferred revenues | (13,946) | | (15,237) | | (47,417) | | (41,769) | |
| Treatment and refining charges | (15,409) | | (17,885) | | (44,446) | | (46,887) | |
| Inventory adjustments | 385 | | (54) | | 604 | | (202) | |
| Share-based payment | (28) | | 14 | | 48 | | 6 | |
| Change in product inventory | (5,075) | | (924) | | (10,723) | | (7,594) | |
| Royalties | 1,401 | | 1,913 | | 4,572 | | 5,816 | |
| Depreciation and amortization2 | 47,236 | | 53,383 | | 152,188 | | 158,642 | |
| Cost of sales | 128,423 | | 137,484 | | 406,221 | | 415,115 | |
1Per pound of copper produced.
2Depreciation is based on concentrate sold.
34
| Manitoba | Three months ended | Nine months ended |
| (in thousands) | Sep. 30, 2019 | Sep. 30, 2018 | Sep. 30, 2019 | Sep. 30, 2018 |
| Net pounds of copper produced1 | 11,753 | 16,548 | 38,781 | 57,250 |
1Contained copper in concentrate.
| Manitoba | | Three months ended | | | Nine months ended | |
| | Sep.30, 2019 | Sep. 30, 2018 | Sep.30, 2019 | Sep. 30, 2018 |
| Cash cost per pound of | | | | | | | | |
| copper produced | $000s | $/lb | $000s | $/lb | $000s | $/lb | $000s | $/lb |
| Mining | 43,525 | 3.70 | 35,533 | 2.15 | 140,637 | 3.63 | 122,283 | 2.14 |
| Milling | 12,118 | 1.03 | 13,005 | 0.79 | 35,873 | 0.93 | 39,172 | 0.68 |
| Refining (zinc) | 18,552 | 1.58 | 17,409 | 1.05 | 52,795 | 1.36 | 54,171 | 0.95 |
| G&A | 11,697 | 1.00 | 11,568 | 0.70 | 35,475 | 0.91 | 36,773 | 0.64 |
| Purchased ore and zinc concentrates | — | — | 3,528 | 0.21 | — | — | 20,804 | 0.36 |
| Onsite costs | 85,892 | 7.31 | 81,043 | 4.90 | 264,780 | 6.83 | 273,203 | 4.77 |
| Treatment & refining | 4,812 | 0.41 | 10,241 | 0.62 | 17,857 | 0.46 | 27,670 | 0.48 |
| Freight & other | 6,272 | 0.53 | 10,301 | 0.62 | 19,900 | 0.51 | 27,211 | 0.48 |
| Cash cost, before by- product credits | 96,976 | 8.25 | 101,585 | 6.14 | 302,537 | 7.80 | 328,084 | 5.73 |
| By-product credits, net of deferred revenue | (104,952) | (8.93) | (111,639) | (6.75) | (302,068) | (7.79) | (361,575) | (6.32) |
| Cash cost, net of by-product credits | (7,976) | (0.68) | (10,054) | (0.61) | 469 | 0.01 | (33,491) | (0.58) |
35
| Manitoba | Three months ended | | Nine months ended | |
| | Sep.30, 2019 | Sep. 30, 2018 | Sep.30, 2019 | Sep. 30, 2018 |
| Supplementary cash | | | | | | | | |
| cost information | $000s | $/lb1 | $000s | $/lb1 | $000s | $/lb1 | $000s | $/lb1 |
| By-product credits: | | | | | | | | |
| Zinc | 74,321 | 6.32 | 84,838 | 5.13 | 213,034 | 5.49 | 267,707 | 4.68 |
| Gold | 32,354 | 2.75 | 30,899 | 1.87 | 79,617 | 2.05 | 99,487 | 1.74 |
| Silver | 4,762 | 0.41 | 6,367 | 0.38 | 10,732 | 0.28 | 19,366 | 0.34 |
| Other | 984 | 0.08 | 922 | 0.06 | 3,493 | 0.09 | 3,368 | 0.06 |
| Total by-product credits | 112,421 | 9.57 | 123,026 | 7.43 | 306,876 | 7.91 | 389,928 | 6.81 |
| Less: deferred revenue | (7,469) | (0.64) | (11,387) | (0.69) | (4,808) | (0.12) | (28,353) | (0.50) |
| Total by-product credits, net of deferred revenue | 104,952 | 8.93 | 111,639 | 6.75 | 302,068 | 7.79 | 361,575 | 6.32 |
| Reconciliation to IFRS: | | | | | | | | |
| Cash cost, net of by- product credits | (7,976) | | (10,054) | | 469 | | (33,491) | |
| By-product credits | 112,421 | | 123,026 | | 306,876 | | 389,928 | |
| Change in deferred revenues | (7,469) | | (11,387) | | (4,808) | | (28,353) | |
| Treatment and refining charges | (4,812) | | (10,241) | | (17,857) | | (27,670) | |
| Share-based payment | (145) | | 36 | | 144 | | (26) | |
| Change in product inventory | 3,317 | | 14,192 | | (7,680) | | 8,460 | |
| Royalties | 1,518 | | 1,430 | | 5,258 | | 6,334 | |
| Depreciation and amortization2 | 35,050 | | 32,881 | | 98,422 | | 91,782 | |
| Cost of sales | 131,904 | | 139,883 | | 380,824 | | 406,964 | |
1Per pound of copper produced.
2Depreciation is based on concentrate sold.
| Consolidated | Three months ended | | Nine months ended | |
| | Sep.30, 2019 | Sep. 30, 2018 | Sep.30, 2019 | Sep. 30, 2018 |
| All-in sustaining cash cost per pound of copper produced | $000s | $/lb | $000s | $/lb | $000s | $/lb | $000s | $/lb |
| | | | | | | | | |
| Cash cost, net of by-product credits | 78,374 | 0.98 | 78,642 | 0.88 | 256,977 | 1.11 | 243,425 | 0.94 |
| Sustaining capital expenditures | 64,000 | 0.80 | 38,728 | 0.43 | 152,685 | 0.66 | 100,273 | 0.39 |
| Capitalized exploration1 | 1,589 | 0.02 | 244 | — | 3,585 | 0.02 | 1,524 | 0.01 |
| Royalties | 2,919 | 0.04 | 3,343 | 0.04 | 9,830 | 0.04 | 12,150 | 0.05 |
| Sustaining cash cost, net of by-product credits | 146,882 | 1.83 | 120,957 | 1.36 | 423,077 | 1.84 | 357,372 | 1.38 |
| Corporate selling and administrative expenses & regional costs | 5,984 | 0.07 | 8,584 | 0.10 | 33,247 | 0.14 | 22,316 | 0.09 |
| All-in sustaining cash cost, netof by-product credits | 152,866 | 1.90 | 129,541 | 1.45 | 456,324 | 1.98 | 379,688 | 1.47 |
1Only includes exploration costs incurred for locations near existing mines
36
| Peru | Three months ended | | Nine months ended | |
| | Sep.30, 2019 | Sep. 30, 2018 | Sep.30, 2019 | Sep. 30, 2018 |
| Sustaining cash cost per pound of copper produced | $000s | $/lb | $000s | $/lb | $000s | $/lb | $000s | $/lb |
| Cash cost, net of by-product credits | 86,350 | 1.26 | 88,696 | 1.22 | 256,508 | 1.33 | 276,916 | 1.38 |
| Sustaining capital expenditures | 30,927 | 0.45 | 9,969 | 0.14 | 66,786 | 0.35 | 27,758 | 0.14 |
| Royalties | 1,401 | 0.02 | 1,913 | 0.03 | 4,572 | 0.02 | 5,816 | 0.03 |
| Sustaining cash cost per poundof copper produced | 118,678 | 1.73 | 100,578 | 1.38 | 327,866 | 1.71 | 310,490 | 1.54 |
| Manitoba | Three months ended | | Nine months ended | |
| | Sep.30, 2019 | Sep. 30, 2018 | Sep.30, 2019 | Sep. 30, 2018 |
| | | | | | | | | |
| Sustaining cash cost per pound of copper produced | $000s | $/lb | $000s | $/lb | $000s | $/lb | $000s | $/lb |
| Cash cost, net of by-product credits | (7,976) | (0.68) | (10,054) | (0.61) | 469 | 0.01 | (33,491) | (0.58) |
| Sustaining capital expenditures | 33,073 | 2.81 | 28,759 | 1.74 | 85,899 | 2.21 | 72,515 | 1.27 |
| Capitalized exploration | 1,589 | 0.14 | 244 | 0.01 | 3,585 | 0.09 | 1,524 | 0.03 |
| Royalties | 1,518 | 0.13 | 1,430 | 0.09 | 5,258 | 0.14 | 6,334 | 0.11 |
| Sustaining cash cost per poundof copper produced | 28,204 | 2.40 | 20,379 | 1.23 | 95,211 | 2.46 | 46,882 | 0.82 |
Zinc Cash Cost and Zinc Sustaining Cash Cost
Cash cost per pound of zinc produced (“zinc cash cost”) is a non-IFRS measure that management uses as a key performance indicator to assess the performance of our Manitoba operations. This alternative cash cost calculation designates zinc as the primary metal of production as it is the largest component of revenues for our Manitoba business unit and should therefore be less volatile over time than Manitoba cash cost per pound of copper. The calculation is presented in three manners:
| – | Zinc cash cost, before by-product credits- This measure is gross of by-product revenues and is a function of the efforts and costs incurred to mine and process all ore mined. However, the measure divides this aggregate cost over only pounds of zinc produced, our primary metal of production. This measure is generally less volatile from period to period, as it is not affected by changes in the price received for by- product metals. It is, however, significantly affected by the relative mix of copper concentrate and finished zinc production, where the sale of the copper will occur later, and an increase in production of copper metal will tend to result in an increase in zinc cash cost under this measure. |
| | |
| – | Zinc cash cost, net of by-product credits- In order to calculate the net cost to produce and sell zinc, the net of by-product credits measure subtracts the revenues realized from the sale of the metals other than zinc. The by-product revenues from copper, gold, and silver are significant and are integral to the economics of our Manitoba operation. The economics that support our decision to produce and sell zinc would be different if we did not receive revenues from the other significant metals being extracted and processed. This measure provides management and investors with an indication of the minimum zinc price consistent with positive operating cash flow and operating margins, assuming realized by-product metal prices are consistent with those prevailing during the reporting period. It also serves as an important operating statistic that management and investors utilize to measure our operating performance at our Manitoba operation versus that of our competitors. However, it is important to understand that if by-product metal prices decline alongside zinc prices, the zinc cash cost net of by-product credits would increase, requiring a higher zinc price than that reported to maintain positive cash flows and operating margins. |
37
– | Zinc sustaining cash cost, net of by-product credits- This measure is an extension of zinc cash cost that includes cash sustaining capital expenditures, capitalized exploration and net smelter returns royalties. It does not include corporate selling and administrative expenses. It provides a more fulsome measurement of the cost of sustaining production than zinc cash cost, which is focused on operating costs only. |
The tables below present a detailed build-up of zinc cash cost and zinc sustaining cash cost, net of by-product credits, for the Manitoba business unit, and reconciliations between zinc cash cost, net of by-product credits, to the most comparable IFRS measures of cost of sales for the three and nine months ended September 30, 2019 and 2018. Zinc cash cost, net of by-product credits, may not calculate exactly based on amounts presented in the tables below due to rounding.
| Manitoba | Three months ended | Nine months ended |
| (in thousands) | Sep. 30, 2019 | Sep. 30, 2018 | Sep. 30, 2019 | Sep. 30, 2018 |
| Net pounds of zinc produced1 | 63,138 | 57,823 | 195,140 | 194,403 |
1Contained zinc in concentrate.
| Manitoba | Three months ended | | Nine months ended | |
| | Sep.30, 2019 | Sep. 30, 2018 | Sep.30, 2019 | Sep. 30, 2018 |
| Cash cost per pound of | | | | | | | | |
| zinc produced | $000s | $/lb | $000s | $/lb | $000s | $/lb | $000s | $/lb |
| Cash cost, before by- product credits1 | 96,976 | 1.54 | 101,585 | 1.76 | 302,537 | 1.55 | 328,084 | 1.69 |
| By-product credits | (56,003) | (0.89) | (79,890) | (1.38) | (192,687) | (0.99) | (256,979) | (1.32) |
| Zinc cash cost, net ofby-product credits | 40,973 | 0.65 | 21,695 | 0.38 | 109,850 | 0.56 | 71,105 | 0.37 |
1For additional detail on cash cost, before by-product credits please see page 35 of this MD&A.
38
| Manitoba | Three months ended | | Nine months ended | |
| | Sep.30, 2019 | Sep. 30, 2018 | Sep.30, 2019 | Sep. 30, 2018 |
| Supplementary cash cost information | $000s | $/lb1 | $000s | $/lb1 | $000s | $/lb1 | $000s | $/lb1 |
| By-product credits: | | | | | | | | |
| Copper | 25,372 | 0.40 | 53,089 | 0.92 | 103,653 | 0.53 | 163,111 | 0.84 |
| Gold | 32,354 | 0.51 | 30,899 | 0.53 | 79,617 | 0.41 | 99,487 | 0.51 |
| Silver | 4,762 | 0.08 | 6,367 | 0.11 | 10,732 | 0.05 | 19,366 | 0.10 |
| Other | 984 | 0.02 | 922 | 0.02 | 3,493 | 0.02 | 3,368 | 0.02 |
| Total by-product credits | 63,472 | 1.01 | 91,277 | 1.58 | 197,495 | 1.01 | 285,332 | 1.47 |
| Less: deferred revenue | (7,469) | (0.12) | (11,387) | (0.20) | (4,808) | (0.02) | (28,353) | (0.15) |
| Total by-product credits, net of deferred revenue | 56,003 | 0.89 | 79,890 | 1.38 | 192,687 | 0.99 | 256,979 | 1.32 |
| Reconciliation to IFRS: | | | | | | | | |
| Cash cost, net of by- product credits | 40,973 | | 21,695 | | 109,850 | | 71,105 | |
| By-product credits | 63,472 | | 91,277 | | 197,495 | | 285,332 | |
| Change in deferred revenues | (7,469) | | (11,387) | | (4,808) | | (28,353) | |
| Treatment and refining charges | (4,812) | | (10,241) | | (17,857) | | (27,670) | |
| Share-based payment | (145 ) | | 36 | | 144 | | (26) | |
| Change in product inventory | 3,317 | | 14,192 | | (7,680) | | 8,460 | |
| Royalties | 1,518 | | 1,430 | | 5,258 | | 6,334 | |
| Depreciation and amortization2 | 35,050 | | 32,881 | | 98,422 | | 91,782 | |
| Cost of sales | 131,904 | | 139,883 | | 380,824 | | 406,964 | |
1Per pound of zinc produced.
2Depreciation is based on concentrate sold.
| Manitoba | | | Three months ended | | Nine months ended | |
| | Sep.30, 2019 | Sep. 30, 2018 | Sep.30, 2019 | Sep. 30, 2018 |
| Sustaining cash cost per | | | | | | | | |
| pound of zinc | | | | | | | | |
| produced | $000s | $/lb | $000s | $/lb | $000s | $/lb | $000s | $/lb |
| Zinc cash cost, net of by- product credits | 40,973 | 0.65 | 21,695 | 0.38 | 109,850 | 0.56 | 71,105 | 0.37 |
| Sustaining capital expenditures | 33,073 | 0.52 | 28,759 | 0.50 | 85,899 | 0.44 | 72,515 | 0.37 |
| Capitalized exploration | 1,589 | 0.03 | 244 | — | 3,585 | 0.02 | 1,524 | 0.01 |
| Royalties | 1,518 | 0.02 | 1,430 | 0.02 | 5,258 | 0.03 | 6,334 | 0.03 |
| Sustaining cash cost perpound of zincproduced | 77,153 | 1.22 | 52,128 | 0.90 | 204,592 | 1.05 | 151,478 | 0.78 |
Combined Unit Cost & Zinc Plant Unit Cost Reconciliation
Combined unit cost (“unit cost”) and zinc plant unit cost is a non-IFRS measure that management uses as a key performance indicator to assess the performance of our mining and milling operations. Combined unit cost and zinc plant unit cost are calculated by dividing the cost of sales by mill throughput. This measure is utilized by management and investors to assess our cost structure and margins and compare it to similar information provided by other companies in our industry. Unlike cash cost, this measure is not impacted by variability in by-product commodity prices since there are no by-product deductions; costs associated with profit-sharing and similar costs are excluded because of their correlation to external metal prices. In addition, the unit costs are reported in the functional currency of the operation which minimizes the impact of foreign currency fluctuations. In all, the unit cost measures provide an alternative perspective on operating cost performance with minimal impact from external market prices.
39
The tables below present a detailed combined unit cost and zinc plant unit costs for the Manitoba business unit and combined unit cost for the Peru business unit, and reconciliations between these measures to the most comparable IFRS measures of cost of sales for the three and nine months ended September 30, 2019 and 2018.
| Peru | Three months ended | Nine months ended |
| (in thousands except unit cost per tonne) | Sep. 30, | Sep. 30, | Sep. 30, | Sep. 30, |
| Combined unit cost per tonne processed | 2019 | 2018 | 2019 | 2018 |
| Mining | 18,274 | 22,252 | 63,884 | 69,603 |
| Milling | 38,064 | 35,783 | 116,053 | 110,426 |
| G&A1 | 14,791 | 11,391 | 41,700 | 41,497 |
| Other G&A2 | 13 | 439 | 288 | (1,835) |
| Unit cost | 71,142 | 69,865 | 221,925 | 219,691 |
| Tonnes ore milled | 8,240 | 8,047 | 23,913 | 23,625 |
| Combined unit cost per tonne | 8.63 | 8.68 | 9.28 | 9.30 |
| | | | | |
| Reconciliation to IFRS: | | | | |
| Unit cost | 71,142 | 69,865 | 221,925 | 219,691 |
| Freight & other | 13,375 | 13,726 | 37,895 | 36,921 |
| Other G&A | (13) | (439) | (288) | 1,835 |
| Share-based payment | (28) | 14 | 48 | 6 |
| Inventory adjustments | 385 | (54) | 604 | (202) |
| Change in product inventory | (5,075) | (924) | (10,723) | (7,594) |
| Royalties | 1,401 | 1,913 | 4,572 | 5,816 |
| Depreciation and amortization | 47,236 | 53,383 | 152,188 | 158,642 |
| Cost of sales | 128,423 | 137,484 | 406,221 | 415,115 |
1G&A as per cash cost reconciliation above.
2Other G&A primarily includes profit sharing costs.
40
| Manitoba | Three months ended | Nine months ended |
| (in thousands except tonnes ore milled and unit cost per tonne) | Sep. 30, | Sep. 30, | Sep. 30, | Sep. 30, |
| Combined unit cost per tonne processed | 2019 | 2018 | 2019 | 2018 |
| Mining | 43,525 | 35,533 | 140,637 | 122,283 |
| Milling | 12,118 | 13,005 | 35,873 | 39,172 |
| G&A1 | 11,697 | 11,568 | 35,475 | 36,773 |
| Less: G&A allocated to zinc metal production | (3,462) | (3,351) | (9,541) | (10,496) |
| Less: Other G&A related to profit sharing costs | 12 | (1,265) | (85) | (6,048) |
| Purchased ore and zinc concentrates | — | 3,528 | — | 20,804 |
| Unit cost | 63,890 | 59,018 | 202,359 | 202,488 |
| USD/CAD implicit exchange rate | 1.32 | 1.31 | 1.33 | 1.29 |
| Unit cost - C$ | 84,364 | 77,145 | 269,034 | 260,467 |
| Tonnes ore milled | 649,755 | 625,675 | 1,967,155 | 2,051,646 |
| Combined unit cost per tonne - C$ | 130 | 123 | 137 | 127 |
| | | | | |
| Reconciliation to IFRS: | | | | |
| Unit cost | 63,890 | 59,018 | 202,359 | 202,488 |
| Freight & other | 6,272 | 10,301 | 19,900 | 27,211 |
| Refined (zinc) | 18,552 | 17,409 | 52,795 | 54,171 |
| G&A allocated to zinc metal production | 3,462 | 3,351 | 9,541 | 10,496 |
| Other G&A related to profit sharing | (12) | 1,265 | 85 | 6,048 |
| Share-based payment | (145) | 36 | 144 | (26) |
| Change in product inventory | 3,317 | 14,192 | (7,680) | 8,460 |
| Royalties | 1,518 | 1,430 | 5,258 | 6,334 |
| Depreciation and amortization | 35,050 | 32,881 | 98,422 | 91,782 |
| Cost of sales | 131,904 | 139,883 | 380,824 | 406,964 |
1 G&A as per cash cost reconciliation above.
41
| Manitoba | Three months ended | Nine months ended |
| (in thousands except zinc plant unit cost per pound) | Sep. 30, | Sep. 30, | Sep. 30, | Sep. 30, |
| Zinc plant unit cost | 2019 | 2018 | 2019 | 2018 |
| Zinc plant costs | 18,552 | 17,409 | 52,795 | 54,171 |
| G&A1 | 11,697 | 11,568 | 35,475 | 36,773 |
| Less: G&A allocated to other areas | (8,247) | (6,952) | (25,849) | (20,229) |
| Less: Other G&A related to profit sharing | 12 | (1,265) | (85) | (6,048) |
| Zinc plant unit cost | 22,014 | 20,760 | 62,336 | 64,667 |
| USD/CAD implicit exchange rate | 1.32 | 1.31 | 1.33 | 1.29 |
| Zinc plant unit cost - C$ | 29,077 | 27,129 | 82,839 | 83,175 |
| Refined metal produced (in pounds) | 53,614 | 53,610 | 166,504 | 165,717 |
| Zinc plant unit cost per pound - C$ | 0.54 | 0.51 | 0.50 | 0.50 |
| Reconciliation to IFRS: | | | | |
| Zinc plant unit cost | 22,014 | 20,760 | 62,336 | 64,667 |
| Freight & other | 6,272 | 10,301 | 19,900 | 27,211 |
| Mining | 43,525 | 35,533 | 140,637 | 122,283 |
| Milling | 12,118 | 13,005 | 35,873 | 39,172 |
| Purchased ore and zinc concentrates | — | 3,528 | — | 20,804 |
| G&A allocated to other areas | 8,247 | 6,952 | 25,849 | 20,229 |
| Other G&A related to profit sharing | (12) | 1,265 | 85 | 6,048 |
| Share-based payment | (145 ) | 36 | 144 | (26) |
| Change in product inventory | 3,317 | 14,192 | (7,680) | 8,460 |
| Royalties | 1,518 | 1,430 | 5,258 | 6,334 |
| Depreciation and amortization | 35,050 | 32,881 | 98,422 | 91,782 |
| Cost of sales | 131,904 | 139,883 | 380,824 | 406,964 |
1G&A as per cash cost reconciliation above.
ACCOUNTING CHANGES AND CRITICAL ESTIMATES
New standards and interpretations not yet adopted
As of January 1, 2019, we have adopted IFRS 16, Leases (“IFRS 16”).
For information on new standards and interpretations not yet adopted, refer to note 4 of our September 30, 2019 condensed consolidated interim financial statements.
Estimates and judgements
For information on significant areas requiringus to make estimates and judgements, refer to note 2 of our September 30, 2019 condensed consolidated interim financial statements.
CHANGES IN INTERNAL CONTROL OVER FINANCIAL REPORTING
Management is responsible for establishing and maintaining adequate internal control over financial reporting (“ICFR”). ICFR is designed to provide reasonable assurance regarding the reliability of financial reporting and the preparation of financial statements for external purposes in accordance with IFRS.
We did not make any changes to ICFR during the three months ended September 30, 2019 that materially affected or are reasonably likely to materially affect our ICFR.
42
NOTES TO READER
Forward-Looking Information
This MD&A contains forward-looking information within the meaning of applicable Canadian and United States securities legislation. All information contained in this MD&A, other than statements of current and historical fact, is forward-looking information. Often, but not always, forward-looking information can be identified by the use of words such as “plans”, “expects”, “budget”, “guidance”, “scheduled”, “estimates”, “forecasts”, “strategy”, “target”, “intends”, “objective”, “goal”, “understands”, “anticipates” and “believes” (and variations of these or similar words) and statements that certain actions, events or results “may”, “could”, “would”, “should”, “might” “occur” or “be achieved” or “will be taken” (and variations of these or similar expressions). All of the forward-looking information in this MD&A is qualified by this cautionary note.
Forward-looking information includes, but is not limited to, production, cost and capital and exploration expenditure guidance, anticipated production at our mines and processing facilities, expectations regarding the Company's CEO transition, expectations regarding the schedule for acquiring the Pampacancha surface rights and mining the Pampacancha deposit, the anticipated timing, cost and benefits of developing the Rosemont project and the outcome of litigation challenging Rosemont's permits, our intention to appeal the recent U.S. district court decision overturning the U.S. Forest Service's FROD for Rosemont and to evaluate other options available to advance the project, expectations regarding the Lalor gold strategy, including the refurbishment of the New Britannia mill, and the possibility of optimizing the value of our gold resources in Manitoba, the future potential of the 1901 deposit, including the possibility of identifying additional gold resources, the possibility of converting inferred mineral resource estimates to higher confidence categories, the potential and our anticipated plans for advancing our mining properties surrounding Constancia and the Ann Mason project, anticipated mine plans, anticipated metals prices and the anticipated sensitivity of our financial performance to metals prices, events that may affect our operations and development projects, anticipated cash flows from operations and related liquidity requirements, the anticipated effect of external factors on revenue, such as commodity prices, estimation of mineral reserves and resources, mine life projections, reclamation costs, economic outlook, government regulation of mining operations, and business and acquisition strategies. Forward-looking information is not, and cannot be, a guarantee of future results or events. Forward-looking information is based on, among other things, opinions, assumptions, estimates and analyses that, while considered reasonable by us at the date the forward-looking information is provided, inherently are subject to significant risks, uncertainties, contingencies and other factors that may cause actual results and events to be materially different from those expressed or implied by the forward-looking information.
The material factors or assumptions that we identified and were applied by us in drawing conclusions or making forecasts or projections set out in the forward-looking information include, but are not limited to:
| – | the ability to appeal the U.S. district court's decision setting aside the U.S. Forest Service's FROD for Rosemont; |
| – | the availability of other options to advance Rosemont notwithstanding the U.S. district court's recent decision; |
| – | the ability to continue to access the Port of Matarani and ship Constancia copper concentrate production in the ordinary course of business; |
| – | the ability to secure required land rights to develop and commence mining the Pampacancha deposit; |
| – | the success of mining, processing, exploration and development activities; |
| – | the scheduled maintenance and availability of our processing facilities; |
| – | the accuracy of geological, mining and metallurgical estimates; |
| – | anticipated metals prices and the costs of production; |
| – | the supply and demand for metals we produce; |
| – | the supply and availability of all forms of energy and fuels at reasonable prices; |
43
| – | no significant unanticipated operational or technical difficulties; |
| – | the execution of our business and growth strategies, including the success of our strategic investments and initiatives; |
| – | the availability of additional financing, if needed; |
| – | the ability to complete project targets on time and on budget and other events that may affect our ability to develop our projects; |
| – | the timing and receipt of various regulatory and governmental approvals; |
| – | the availability of personnel for our exploration, development and operational projects and ongoing employee relations; |
| – | maintaining good relations with the communities in which we operate, including the communities surrounding our Constancia mine and Rosemont project and First Nations communities surrounding our Lalor mine; |
| – | no significant unanticipated challenges with stakeholders at our various projects; |
| – | no significant unanticipated events or changes relating to regulatory, environmental, health and safety matters; |
| – | no contests over title to our properties, including as a result of rights or claimed rights of aboriginal peoples or challenges to the validity of our unpatented mining claims; |
| – | the timing and possible outcome of pending litigation and no significant unanticipated litigation; |
| – | certain tax matters, including, but not limited to current tax laws and regulations and the refund of certain value added taxes from the Canadian and Peruvian governments; and |
| – | no significant and continuing adverse changes in general economic conditions or conditions in the financial markets (including commodity prices and foreign exchange rates). |
The risks, uncertainties, contingencies and other factors that may cause actual results to differ materially from those expressed or implied by the forward-looking information may include, but are not limited to, risks generally associated with the mining industry, such as economic factors (including future commodity prices, currency fluctuations, energy prices and general cost escalation), the appointment of a permanent CEO and any changes related thereto, uncertainties related to the development and operation of our projects (including risks associated with the permitting, development and financing of the Rosemont project), risks related to the U.S. district court's recent decision to set aside the U.S. Forest Service's FROD for Rosemont and other legal challenges related to Rosemont's permits, risks related to the new Lalor mine plan, including the schedule and cost for the refurbishment of the New Britannia mill and the ability to convert inferred mineral resource estimates to higher confidence categories, risks related to the schedule for mining the Pampacancha deposit (including the timing and cost of acquiring the required surface rights and the impact of any schedule delays), dependence on key personnel and employee and union relations, risks related to political or social unrest or change, risks in respect of aboriginal and community relations, rights and title claims, operational risks and hazards, including the cost of maintaining and upgrading the company's tailings management facilities and any unanticipated environmental, industrial and geological events, the inability to insure against all risks, failure of plant, equipment, processes, transportation and other infrastructure to operate as anticipated, compliance with government and environmental regulations, including permitting requirements and anti-bribery legislation, depletion of our reserves, volatile financial markets that may affect our ability to obtain additional financing on acceptable terms, the failure to obtain required approvals or clearances from government authorities on a timely basis, uncertainties related to the geology, continuity, grade and estimates of mineral reserves and resources, and the potential for variations in grade and recovery rates, uncertain costs of reclamation activities, our ability to comply with our pension and other post-retirement obligations, our ability to abide by the covenants in our debt instruments and other material contracts, tax refunds, hedging transactions, as well as the risks discussed under the heading “Risk Factors” in our most recent Annual Information Form.
Should one or more risk, uncertainty, contingency or other factor materialize or should any factor or assumption prove incorrect, actual results could vary materially from those expressed or implied in the forward-looking information. Accordingly, you should not place undue reliance on forward-looking information. We do not assume any obligation to update or revise any forward-looking information after the date of this MD&A or to explain any material difference between subsequent actual events and any forward-looking information, except as required by applicable law.
44
Note to United States Investors
This MD&A has been prepared in accordance with the requirements of the securities laws in effect in Canada, which may differ materially from the requirements of United States securities laws applicable to US issuers.
Qualified Person
The technical and scientific information in this MD&A related to the Constancia mine and Rosemont project has been approved by Cashel Meagher, P. Geo, our Senior Vice President and Chief Operating Officer. The technical and scientific information related to our other material mineral projects contained in this MD&A has been approved by Olivier Tavchandjian, P. Geo, our Vice President, Exploration and Geology. Messrs. Meagher and Tavchandjian are qualified persons pursuant to NI 43-101. For a description of the key assumptions, parameters and methods used to estimate mineral reserves and resources at Hudbay's material properties, as well as data verification procedures and a general discussion of the extent to which the estimates of scientific and technical information may be affected by any known environmental, permitting, legal title, taxation, sociopolitical, marketing or other relevant factors, please see the technical reports for our material properties as filed by us on SEDAR at www.sedar.com.
45