![]()

Management's Discussion and Analysis of
Results of Operations and Financial Condition
For the three and nine months ended
September 30, 2020
November 3, 2020
INTRODUCTION
This Management's Discussion and Analysis ("MD&A") dated November 3, 2020 is intended to supplement Hudbay Minerals Inc.'s unaudited condensed consolidated interim financial statements and related notes for the three and nine months ended September 30, 2020 and 2019 (the "consolidated interim financial statements"). The consolidated interim financial statements have been prepared in accordance with International Financial Reporting Standards ("IFRS"), including International Accounting Standard 34, Interim Financial Reporting, as issued by the International Accounting Standards Board ("IASB").
References to "Hudbay", the "Company", "we", "us", "our" or similar terms refer to Hudbay Minerals Inc. and its direct and indirect subsidiaries as at September 30, 2020.
Readers should be aware that:
- This MD&A contains certain "forward-looking statements" and "forward-looking information" (collectively, "forward-looking information") that are subject to risk factors set out in a cautionary note contained in our MD&A.
- This MD&A includes an updated discussion of the risks associated with the COVID-19 pandemic and its effect on our operations, financial condition, projects and prospects, and supplements the discussion of these risks in our most recent Annual Information Form ("AIF").
- This MD&A has been prepared in accordance with the requirements of the securities laws in effect in Canada, which may differ materially from the requirements of United States securities laws applicable to US issuers.
- We use a number of non-IFRS financial performance measures in our MD&A.
- The technical and scientific information in this MD&A has been approved by qualified persons based on a variety of assumptions and estimates.
For a discussion of each of the above matters, readers are urged to review the "Notes to Reader" discussion beginning on page 57 of this MD&A and to carefully review the risks associated with the COVID-19 pandemic that are discussed throughout this MD&A.
Additional information regarding Hudbay, including the risks related to our business and those that are reasonably likely to affect our financial statements in the future, is contained in our continuous disclosure materials, including our most recent AIF, consolidated interim financial statements and Management Information Circular available on SEDAR at www.sedar.com and on EDGAR at www.sec.gov.
All amounts are in US dollars unless otherwise noted.
OUR BUSINESS
We are a diversified mining company primarily producing copper concentrate (containing copper, gold, and silver) and zinc metal. Directly and through our subsidiaries, we own three polymetallic mines, four ore concentrators and a zinc production facility in northern Manitoba and Saskatchewan (Canada) and Cusco (Peru), and copper projects in Arizona and Nevada (United States). Our growth strategy is focused on the exploration, development, operation and optimization of properties we already control, as well as other mineral assets we may acquire that fit our strategic criteria. Our vision is to be a responsible, top-tier operator of long-life, low-cost mines in the Americas. We are governed by the Canada Business Corporations Act and our shares are listed under the symbol "HBM" on the Toronto Stock Exchange, New York Stock Exchange and Bolsa de Valores de Lima.
SUMMARY
Third Quarter Operating and Financial Results
- Delivered a solid operating quarter with steady production and cost performance from the Manitoba and Peru operations, including an increase in copper production over the first two quarters of 2020 and strong gold production driven by increased gold grades at Lalor.
- Third quarter net loss was $24.0 million or $0.09 per share. Third quarter adjusted net loss1 per share was $0.10 and adjusted EBITDA1 was $96.1 million.
- Operating cash flow before change in non-cash working capital increased to $84.4 million in the third quarter of 2020, from $71.2 million in the same quarter of 2019, due to higher realized copper and precious metals prices and higher gold sales volumes, partially offset by lower sales volumes of copper and zinc.
- Cash and cash equivalents increased during the third quarter to $449.0 million as at September 30, 2020 as a result of the receipt of $191.8 million, net of transaction costs, from the refinancing of our 2023 notes and cash generated from operations, partially offset by capital investments in the New Britannia refurbishment project and our Peru business.
On Track to Achieve Annual Guidance
- Owing to the performance from the Manitoba operations during the first three quarters of 2020, and the steady operations at Constancia since our eight-week suspension earlier this year, we continue to expect to meet all production, consolidated sustaining capital expenditures and unit cost guidance for 2020, despite ongoing COVID-19 operating challenges.
- Fourth quarter 2020 production and sales volumes in Manitoba will be impacted by the production interruption at the 777 mine. With the implementation of production mitigation plans, we continue to expect to achieve full year guidance for Manitoba.
Executing on Growth Initiatives
- The New Britannia gold mill refurbishment project is ahead of schedule and within budget, with detailed engineering approximately 99% complete and construction activities approximately 45% complete. Commissioning of the gold plant is expected in mid-2021, three months earlier than originally planned.
- Early mining of the gold zone at Lalor is well-underway with underground development in the gold rich lenses advancing ahead of schedule in preparation for the mid-2021 ramp-up of New Britannia. The New Britannia gold mill is expected to increase average annual gold production from Lalor to over 150,000 ounces commencing in 2022.
- Successfully advanced individual land-user agreements at Pampacancha with 79% of the land turned over to Hudbay as of September 30, 2020 (as compared to approximately 33% as of June 30, 2020).
- Constancia North follow-up drilling continues to intersect porphyry and skarn mineralization north of the Constancia pit, including one intersection of 78.6 metres grading 1.39% copper, 305 grams per tonne molybdenum, 0.43 grams per tonne gold and 16.0 grams per tonne silver.
- Completed offering of $600.0 million of 6.125% senior notes due 2029 and redeemed all of our outstanding $400.0 million of 7.250% senior notes due 2023.
Summary of Third Quarter Results
Cash generated from operating activities in the third quarter of 2020 increased to $77.9 million compared to $43.5 million in the same quarter of 2019. Operating cash flow before change in non-cash working capital was $84.4 million during the third quarter of 2020, reflecting an increase of $13.2 million compared to the same period of 2019. The increase in operating cash flow is primarily the result of higher realized copper and precious metals prices and higher gold sales volume, partially offset by lower sales volumes of copper and zinc.
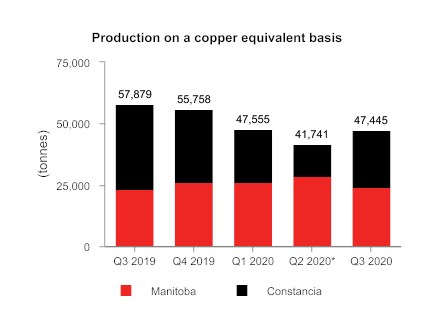
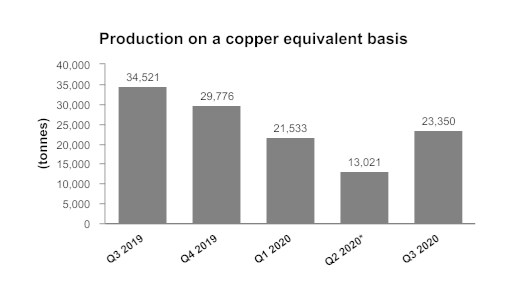
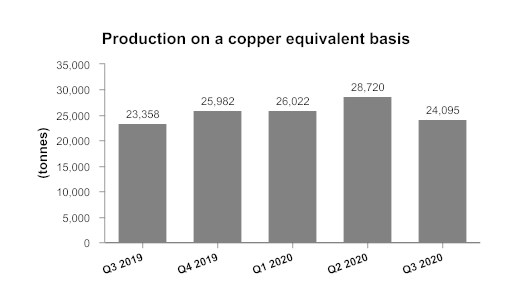
Copper-equivalent production in the third quarter of 2020 decreased by 18% compared to the same period in 2019 primarily as a result of lower copper grades at Constancia, in line with the mine plan, and lower ore production at Constancia due to a scheduled plant maintenance shutdown. However, copper-equivalent production in Manitoba increased by 3% in the third quarter over the same quarter in 2019 primarily due to a 14% increase in gold production from increased gold head grades and sustained throughput improvements at the Stall mill.
Net loss and loss per share in the third quarter of 2020 were $24.0 million and $0.09, respectively, compared to a net loss and loss per share of $274.8 million and $1.05, respectively, in the third quarter of 2019. The prior period loss was mainly caused by an after-tax impairment charge of $242.1 million recorded in our investment in the Rosemont project. During the third quarter of 2020, we recorded a non-cash adjustment on our streaming revenues due to an amendment to the 777 mine plan leading to fewer inferred resources expected to be mined than originally planned as the mine nears its expected closure in 2022. The increased deferred revenue drawdown rate, which is recalculated back to the inception of the stream, resulted in a positive pre-tax non-cash earnings impact of approximately $14.1 million. This was partially offset by $7.3 million in costs primarily relating to the call premium paid to redeem all of our outstanding $400.0 million of 7.25% senior unsecured notes due 2023 (the "Redeemed Notes") and a $3.8 million write-down of unamortized transaction costs related to the Redeemed Notes and our revolving credit facilities, which were restructured during the quarter.
Adjusted net loss1 and adjusted EBITDA1 in the third quarter of 2020 were $25.4 million, or $0.10 per share, and $96.1 million, respectively. This compares to an adjusted net loss and adjusted EBITDA of $23.3 million, or $0.09 per share, and $76.2 million, respectively, in the same period of 2019. The increase in adjusted EBITDA in the third quarter of 2020 was primarily due to higher realized copper and precious metals prices and higher gold sales volume, partially offset by lower sales volumes of copper and zinc.
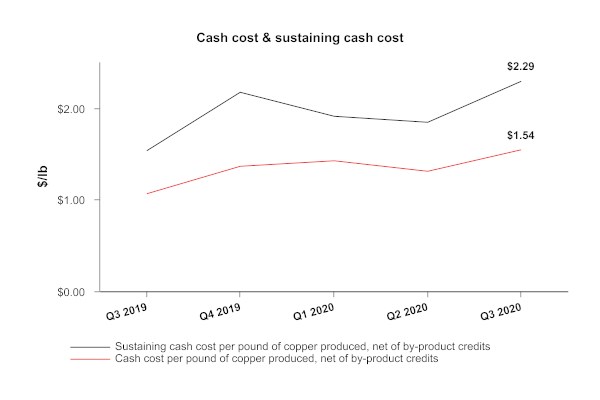
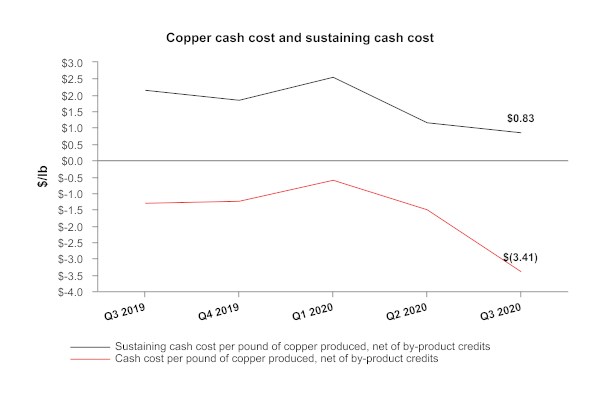
In the third quarter of 2020, consolidated cash cost per pound of copper produced, net of by-product credits1, was $0.65, compared to $0.71 in the same period last year. The overall decrease in this measure was a result of increased by-product credit revenues mainly driven by a significant increase in Manitoba's precious metal revenue compared to the same period in 2019, which was partially offset by a decline in copper production at Constancia due to lower grades and a planned August plant maintenance shutdown. Incorporating sustaining capital, capitalized exploration, royalties, selling, administrative and regional costs, consolidated all-in sustaining cash cost per pound of copper produced, net of by-product credits1, in the third quarter of 2020 was $2.25, which increased from $1.69 in the same period last year, primarily as a result of higher sustaining capital expenditures and lower copper production at Constancia as mentioned above.
*Reflects Constancia temporary suspension of operations in April and May.
1 Adjusted net loss and adjusted net loss per share, adjusted EBITDA, cash cost, all-in sustaining cash cost per pound of copper produced, net of by-product credits, and net debt are non-IFRS financial performance measures with no standardized definition under IFRS. For further information and a detailed reconciliation, please see the discussion under the "Non-IFRS Financial Reporting Measures" section of this MD&A.
KEY FINANCIAL RESULTS
Financial Condition | Sep. 30, 2020 | Dec. 31, 2019 |
(in $ thousands) | ||
Cash and cash equivalents | 449,014 | 396,146 |
Total long-term debt | 1,175,104 | 985,255 |
Net debt1 | 726,090 | 589,109 |
Working capital | 403,441 | 271,284 |
Total assets | 4,590,688 | 4,461,057 |
Equity | 1,684,464 | 1,848,123 |
1 Net debt is a non-IFRS financial performance measure with no standardized definition under IFRS. For further information and a detailed reconciliation, please see discussion under the "Non-IFRS Financial Reporting Measures" section of this MD&A. | ||
Financial Performance | Three months ended | Nine months ended | ||||||||||||
(in $ thousands, except per share amounts) | Sep. 30, 2020 |
| Sep. 30, 2019 | Sep. 30, 2020 |
| Sep. 30, 2019 | ||||||||
Revenue | $ | 316,108 |
|
| $ | 291,282 |
| $ | 770,128 |
|
| $ | 912,953 |
|
Cost of sales | 276,830 |
|
| 260,327 |
| 765,495 |
|
| 787,045 |
| ||||
Loss before tax | (23,944 | ) |
| (348,367 | ) | (180,000 | ) |
| (410,409 | ) | ||||
Loss | (23,955 | ) |
| (274,796 | ) | (151,990 | ) |
| (342,355 | ) | ||||
Basic and diluted loss per share | (0.09 | ) |
| (1.05 | ) | (0.58 | ) |
| (1.31 | ) | ||||
Adjusted loss per share1 | (0.10 | ) |
| (0.09 | ) | (0.40 | ) |
| (0.09 | ) | ||||
Operating cash flow before change in non-cash working capital2 | 84.4 |
|
| 71.2 |
| 155.8 |
|
| 238.1 |
| ||||
Adjusted EBITDA1,2 | 96.1 |
|
| 76.2 |
| 200.1 |
|
| 276.2 |
| ||||
1 Adjusted loss per share and adjusted EBITDA are non-IFRS financial performance measures with no standardized definition under IFRS. For further information and a detailed reconciliation, please see discussion under the "Non-IFRS Financial Reporting Measures" section of this MD&A. | ||||||||||||||
2 In millions. | ||||||||||||||
KEY PRODUCTION RESULTS
| Three months ended |
| Three months ended | ||||||||||||
Sep. 30, 2020 |
| Sep. 30, 2019 | |||||||||||||
Peru | Manitoba | Total |
| Peru | Manitoba | Total | |||||||||
Contained metal in concentrate produced 1 |
|
|
|
|
|
| |||||||||
Copper |
| tonnes | 20,803 |
| 4,592 |
| 25,395 |
|
| 31,091 |
| 5,331 |
| 36,422 |
|
Gold |
| oz | 3,333 |
| 25,944 |
| 29,277 |
|
| 5,565 |
| 22,754 |
| 28,319 |
|
Silver |
| oz | 430,208 |
| 241,477 |
| 671,685 |
|
| 686,258 |
| 237,933 |
| 924,191 |
|
Zinc |
| tonnes | - |
| 30,570 |
| 30,570 |
|
| - |
| 28,639 |
| 28,639 |
|
Molybdenum |
| tonnes | 392 |
| - |
| 392 |
|
| 262 |
| - |
| 262 |
|
Payable metal sold |
|
|
|
|
|
|
| ||||||||
Copper |
| tonnes | 21,654 |
| 4,249 |
| 25,903 |
|
| 25,314 |
| 4,602 |
| 29,916 |
|
Gold |
| oz | 3,753 |
| 26,852 |
| 30,605 |
|
| 3,858 |
| 21,630 |
| 25,488 |
|
Silver |
| oz | 433,595 |
| 271,900 |
| 705,495 |
|
| 529,139 |
| 227,157 |
| 756,296 |
|
Zinc 2 |
| tonnes | - |
| 26,520 |
| 26,520 |
|
| - |
| 29,140 |
| 29,140 |
|
Molybdenum |
| tonnes | 313 |
| - |
| 313 |
|
| 334 |
| - |
| 334 |
|
|
|
|
|
|
|
|
|
|
| ||||||
Cash cost 3 |
| $/lb | 1.54 |
| (3.41 | ) | 0.65 |
|
| 1.06 |
| (1.31 | ) | 0.71 |
|
Sustaining cash cost 3 |
| $/lb | 2.29 |
| 0.83 |
|
|
| 1.53 |
| 2.15 |
|
| ||
All-in sustaining cash cost3 |
| $/lb |
|
| 2.25 |
|
|
|
| 1.69 |
| ||||
| Nine months ended |
| Nine months ended | ||||||||||||
Sep. 30, 2020 |
| Sep. 30, 2019 | |||||||||||||
Peru | Manitoba | Total |
| Peru | Manitoba | Total | |||||||||
Contained metal in concentrate produced 1 |
|
|
|
|
|
| |||||||||
Copper |
| tonnes | 51,596 |
| 16,459 |
| 68,055 |
|
| 87,166 |
| 17,591 |
| 104,757 |
|
Gold |
| oz | 8,705 |
| 83,540 |
| 92,245 |
|
| 14,716 |
| 67,264 |
| 81,980 |
|
Silver |
| oz | 1,145,197 |
| 874,997 |
| 2,020,194 |
|
| 1,872,995 |
| 782,198 |
| 2,655,193 |
|
Zinc |
| tonnes | - |
| 92,287 |
| 92,287 |
|
| - |
| 88,514 |
| 88,514 |
|
Molybdenum |
| tonnes | 870 |
| - |
| 870 |
|
| 900 |
| - |
| 900 |
|
Payable metal sold |
|
|
|
|
|
|
| ||||||||
Copper |
| tonnes | 49,924 |
| 16,002 |
| 65,926 |
|
| 77,754 |
| 17,050 |
| 94,804 |
|
Gold |
| oz | 7,689 |
| 80,081 |
| 87,770 |
|
| 14,132 |
| 64,523 |
| 78,655 |
|
Silver |
| oz | 1,037,705 |
| 785,497 |
| 1,823,202 |
|
| 1,785,657 |
| 757,846 |
| 2,543,503 |
|
Zinc 2 |
| tonnes | - |
| 80,916 |
| 80,916 |
|
| - |
| 76,318 |
| 76,318 |
|
Molybdenum |
| tonnes | 864 |
| - |
| 864 |
|
| 987 |
| - |
| 987 |
|
|
|
|
|
|
|
|
|
|
| ||||||
Cash cost 3 |
| $/lb | 1.45 |
| (1.75 | ) | 0.67 |
|
| 1.10 |
| (0.57 | ) | 0.82 |
|
Sustaining cash cost 3 |
| $/lb | 2.05 |
| 1.51 |
|
|
| 1.48 |
| 2.13 |
|
| ||
All-in sustaining cash cost3 |
| $/lb |
|
| 2.13 |
|
|
|
| 1.73 |
| ||||
1 Metal reported in concentrate is prior to deductions associated with smelter contract terms. | |||||||||||||||
2 Includes refined zinc metal sold. | |||||||||||||||
3 Cash cost, sustaining cash cost and all-in sustaining cash cost per pound of copper produced, net of by-product credits are non-IFRS financial performance measures with no standardized definition under IFRS. For further information and a detailed reconciliation, please see the discussion under the "Non-IFRS Financial Reporting Measures" section of this MD&A. | |||||||||||||||
RECENT DEVELOPMENTS
COVID-19 Business Update
Amidst the COVID-19 pandemic, our business response plan continued to be executed throughout the quarter, as we adapt to this fluid environment. We remain focused on the health and safety of our workforce, their families, and the communities in which we operate. We closely monitor the evolution of the pandemic in each of our regions and are continuously reviewing and adapting our procedures based on the latest local situation. Peru currently ranks in the top fifteen countries worldwide in terms of the total number of infections. Arequipa and Cusco, where 80% of our Constancia workforce resides, continue to see a high COVID-19 case count. The province of Manitoba has seen a recent increase in COVID-19 cases, including a growing number of cases in northern Manitoba.
Each of our business units has developed site-specific measures intended to identify and limit COVID-19 exposure and transmission and maintain a safe environment for our workers and our communities. Site-specific measures include testing of incoming workers prior to their travel to site, pre-screening protocols, quarantine periods for incoming workers, workplace physical distancing protocols, and adjustment of work rotation schedules. These measures continue to evolve as the status of the pandemic changes in each of our operating regions and our measures are adapted to the regional health authorities' latest restrictions and guidelines.
We believe the most important way we can support the communities in which we operate is to manage safe operations, which provide income for local employees, businesses, and communities. While we have had members of our workforce contract COVID-19, to date we have not identified cases of transmission within our workplaces, or transmission between rotational employees and local communities. We believe that our diligence in screening and testing, and workplace protocols has been effective in achieving our objective of being a safe employer and neighbour. In addition to our efforts to maintain safe operations, we have been supporting public health efforts and providing COVID-19 relief funding, supplies and services to our neighbouring communities.
777 Operations Update
Production at the 777 mine was temporarily suspended due to an incident that occurred on October 9th during routine maintenance of the hoist rope and skip. The hoist rope detached from the skip, causing the skip to fall to the bottom of the shaft. All underground personnel were safely evacuated from the mine using the secondary ramp access.
A preliminary video inspection of the mine shaft indicates that damage is limited to the headframe and the bottom of the shaft in the skip compartment. It does not appear that the cage compartments or the ore loading area were damaged, and the structural integrity of the shaft does not appear to have been compromised by the incident. A full inspection of the shaft and skip compartment will require an in-person inspection, which is underway.
Underground mining activity has resumed at 777 with limited production from the mine's ramp access. If it is confirmed there is no further damage beyond what has been identified to date, it is expected that the 777 shaft could resume full production in December at a repair cost that is not expected to exceed $5.0 million.
While fourth quarter production and sales volumes will be impacted, we are implementing production mitigation plans. Based on the preliminary video inspection and mitigation plans, we continue to expect the Manitoba business unit to achieve its full year production and unit cost guidance for 2020.
Lalor Mine and the New Britannia Mill Refurbishment Update
The New Britannia refurbishment project is ahead of schedule and on budget. Overall project progress is approximately 64% complete, which includes the completion of 99% of detailed engineering, 98% of project procurement and 45% of construction. Commissioning of the gold plant is expected in mid-2021, three months earlier than planned. Construction of the new copper flotation building continues to advance as planned and is on track to have the external structure fully enclosed before winter. Construction of the pipeline between the New Britannia and Stall mills also continues as planned.
As previously disclosed, we have identified the potential to produce gold from the New Britannia mill earlier in 2021 than originally expected. The refurbishment activities at the gold plant are ahead of schedule and commissioning of the gold plant is now expected in mid-2021, followed by ramp-up and first production in the third quarter of 2021. Copper flotation building construction activities continue to be on track for completion in August 2021, with commissioning and ramp-up expected during the second half of 2021. While the copper flotation building is being constructed, we plan to install modular flotation cells at the gold plant to optimize copper recoveries as we start the early processing of gold and copper-gold ores. The impact of this early gold production from the New Britannia mill continues to be evaluated and will be reflected in our annual production guidance update in early 2021.
We continue with the early mining of the gold zone at Lalor as part of stope sequencing in preparation for the start of the New Britannia gold mill. Once the New Britannia mill is ramped-up, average annual gold production from Lalor is expected to increase to over 150,000 ounces commencing in 2022 at cash costs and sustaining cash costs, net of by-product credits, of approximately $480 and $655 per ounce, respectively, during the first eight years of the gold plant's operation.
Pampacancha Update
We completed the Pampacancha surface rights agreement with the local community of Chilloroya in February 2020. Since that time, we have made significant progress on completing the Pampacancha individual land-user agreements and as of September 30, 2020, approximately 79% of the land has been vacated and turned over to Hudbay (as compared to approximately one third as of June 30, 2020). During the first nine months of 2020, we accrued approximately $95.9 million in growth spending in Peru relating to obligations under the local community surface rights agreement and the individual land-user agreements. As previously disclosed, our initial growth capital guidance for Peru of $70.0 million did not include the cost of the individual land user agreements due to the ongoing nature of the negotiations and, as indicated by accrued expenditures to date, full year growth capital spending for Peru will exceed that initial guidance once all the land user agreements are concluded. As stated in our second quarter results, the Consulta Previa consultation process has been impacted by the Peruvian government declared state of emergency, and as a result, the company expects a Pampacancha production start date of early 2021.
Constancia Regional Exploration
Constancia North Drilling
We have recently completed a follow-up drill program at Constancia North to continue to test a possible extension of copper porphyry and high-grade skarn mineralization occurring within 300 metres of the northern edge of the current Constancia pit. The drill program was a follow-up to the drill intersections announced on March 30, 2020 and continued to intersect both skarn and porphyry mineralization as shown in the table below. Most of the drill holes intersected mineralization located along a southeast-northwest trending regional fault. The results will be evaluated and integrated into the annual mineral reserve and resource estimate update for Constancia at the end of the first quarter of 2021.
Hole ID1 | From | To | Intercept | Estimated True Thickness1 | Cu2 | Mo2 | Au2,3 | Ag2 | Mineralization Type |
(m) | (m) | (m) | (m) | (%) | (g/t) | (g/t) | (g/t) | ||
CO-19-306 | 368.0 | 408.6 | 40.6 | 39.3 | 0.52 | 42.4 | 0.79 | 17.9 | Porphyry |
CO-19-307 (top) | 42.0 | 64.0 | 22.0 | 20.5 | 0.19 | 26.1 | 0.03 | 3.5 | Porphyry |
CO-19-307 (bottom) | 400.0 | 408.0 | 8.0 | 7.3 | 0.60 | 10.8 | 0.08 | 6.9 | Porphyry |
CO-19-308 | 35.0 | 57.0 | 22.0 | 21.3 | 0.24 | 23.7 | 0.07 | 2.0 | Porphyry |
CO-19-309 | 70.0 | 92.3 | 22.3 | 21.0 | 0.27 | 9.0 | 0.19 | 9.7 | Porphyry |
CO-19-310 | 263.0 | 361.0 | 98.0 | 91.9 | 1.10 | 27.9 | 0.08 | 5.9 | Skarn |
CO-19-311 | 90.3 | 118.0 | 27.7 | 23.6 | 0.54 | 4.3 | 0.45 | 11.8 | Porphyry |
CO-20-313 | 116.5 | 125.0 | 8.5 | 7.6 | 0.63 | 4.5 | 1.04 | 11.5 | Porphyry |
CO-20-314 | 7.3 | 100.0 | 92.7 | 89.4 | 0.16 | 89.9 | 0.02 | 1.2 | Porphyry |
CO-20-315 | 19.0 | 87.9 | 68.9 | 67.1 | 0.30 | 99.2 | 0.02 | 3.9 | Porphyry |
CO-20-316 (top) | 136.0 | 187.0 | 51.0 | 48.0 | 0.22 | 363.7 | 0.02 | 2.4 | Skarn |
CO-20-316 (bottom) | 208.1 | 291.7 | 83.6 | 78.6 | 1.39 | 305.0 | 0.43 | 16.0 | Skarn |
CO-20-319 | 193.0 | 252.0 | 59.0 | 58.7 | 0.21 | 52.2 | 0.35 | 9.9 | Skarn |
CO-20-320 (top) | 19.3 | 103.9 | 84.6 | 79.7 | 0.19 | 39.0 | 0.03 | 2.8 | Skarn |
CO-20-320 (bottom) | 143.5 | 231.0 | 87.5 | 81.8 | 0.29 | 30.5 | 0.03 | 2.9 | Skarn |
CO-20-321 (top) | 118.0 | 151.0 | 33.0 | 30.9 | 0.21 | 84.3 | 0.02 | 2.6 | Skarn |
CO-20-321 (bottom) | 181.0 | 234.0 | 53.0 | 49.5 | 0.61 | 42.9 | 0.05 | 7.4 | Skarn |
CO-20-322 (top) | 0.0 | 65.0 | 65.0 | 62.9 | 0.25 | 171.9 | 0.02 | 1.8 | Porphyry |
CO-20-322 (bottom) | 99.0 | 197.0 | 98.0 | 94.1 | 0.31 | 103.9 | 0.03 | 6.1 | Porphyry |
CO-20-324 | 4.0 | 175.6 | 171.6 | 165.1 | 0.29 | 61.8 | 0.03 | 2.9 | Porphyry |
CO-20-325 | 0.0 | 15.0 | 15.0 | 14.5 | 0.80 | 38.2 | 0.09 | 4.3 | Skarn |
CO-20-326 | 0.0 | 16.3 | 16.3 | 15.9 | 0.85 | 24.9 | 0.10 | 4.8 | Skarn |
CO-07-1094 | 305.0 | 348.0 | 43.0 | 37.2 | 1.54 | 59.7 | 0.23 | 9.1 | Skarn |
CO-08-2154 (top) | 20.1 | 59.8 | 39.7 | 37.2 | 0.24 | 4.5 | 0.24 | 12.6 | Porphyry |
CO-08-2154 (bottom) | 217.3 | 346.0 | 128.7 | 123.3 | 0.82 | 37.0 | 0.05 | 13.6 | Skarn |
1 True width estimates are based on the current knowledge and interpretation of skarn mineralization geometry.
2 Specific gravity results are pending - assay results are length weighted.
3 Gold values capped at 10 g/t.
4 Historical drill results from 2007 and 2008.
Hole ID | From (m) | To (m) | Azimuth at Intercept | Dip at Intercept | Core Size | ||||
Easting | Northing | Elevation | Easting | Northing | Elevation | ||||
CO-19-306 | 200,773 | 8,400,165 | 3,924 | 200,763 | 8,400,163 | 3,885 | 261 | -76 | HQ |
CO-19-307 (top) | 200,841 | 8,400,370 | 4,236 | 200,835 | 8,400,364 | 4,215 | 228 | -69 | HQ |
CO-19-307 (bottom) | 200,733 | 8,400,290 | 3,904 | 200,730 | 8,400,288 | 3,897 | 236 | -67 | HQ |
CO-19-308 | 200,849 | 8,400,385 | 4,241 | 200,845 | 8,400,389 | 4,220 | 316 | -75 | HQ |
CO-19-309 | 200,657 | 8,400,579 | 4,218 | 200,661 | 8,400,573 | 4,197 | 150 | -70 | HQ |
CO-19-310 | 200,767 | 8,400,674 | 4,086 | 200,783 | 8,400,644 | 3,994 | 153 | -70 | HQ |
CO-19-311 | 200,620 | 8,400,635 | 4,227 | 200,630 | 8,400,624 | 4,203 | 138 | -58 | HQ |
CO-20-313 | 200,608 | 8,400,525 | 4,164 | 200,611 | 8,400,523 | 4,157 | 124 | -64 | HQ |
CO-20-314 | 200,811 | 8,400,101 | 4,255 | 200,833 | 8,400,100 | 4,173 | 92 | -75 | HQ |
CO-20-315 | 200,883 | 8,400,328 | 4,259 | 200,873 | 8,400,316 | 4,192 | 219 | -77 | HQ |
CO-20-316 (top) | 200,879 | 8,400,146 | 4,152 | 200,885 | 8,400,130 | 4,104 | 159 | -70 | HQ |
CO-20-316 (bottom) | 200,888 | 8,400,123 | 4,084 | 200,897 | 8,400,096 | 4,006 | 161 | -70 | HQ |
CO-20-319 | 200,847 | 8,400,179 | 4,088 | 200,842 | 8,400,176 | 4,029 | 236 | -85 | HQ |
CO-20-320 (top) | 200,911 | 8,400,092 | 4,270 | 200,923 | 8,400,066 | 4,190 | 155 | -70 | HQ |
CO-20-320 (bottom) | 200,928 | 8,400,054 | 4,153 | 200,940 | 8,400,025 | 4,071 | 158 | -69 | HQ |
CO-20-321 (top) | 200,908 | 8,400,110 | 4,176 | 200,912 | 8,400,099 | 4,145 | 158 | -69 | HQ |
CO-20-321 (bottom) | 200,916 | 8,400,089 | 4,117 | 200,923 | 8,400,071 | 4,067 | 158 | -69 | HQ |
CO-20-322 (top) | 200,961 | 8,400,108 | 4,290 | 200,952 | 8,400,122 | 4,227 | 326 | -75 | HQ |
CO-20-322 (bottom) | 200,947 | 8,400,129 | 4,194 | 200,931 | 8,400,151 | 4,100 | 325 | -74 | HQ |
CO-20-324 | 200,944 | 8,400,144 | 4,291 | 200,913 | 8,400,179 | 4,126 | 319 | -74 | HQ |
CO-20-325 | 200,981 | 8,400,065 | 4,275 | 200,979 | 8,400,069 | 4,260 | 335 | -75 | HQ |
CO-20-326 | 200,981 | 8,400,065 | 4,275 | 200,982 | 8,400,061 | 4,259 | 170 | -78 | HQ |
CO-07-1094 | 200,762 | 8,400,618 | 4,055 | 200,777 | 8,400,602 | 4,018 | 135 | -60 | HQ |
CO-08-215 (top) | 200,891 | 8,400,237 | 4,260 | 200,877 | 8,400,237 | 4,222 | 271 | -70 | HQ |
CO-08-215 (bottom) | 200,827 | 8,400,238 | 4,073 | 200,790 | 8,400,237 | 3,950 | 268 | -73 | HQ |
Other Regional Exploration
Our patient and consistent approach to community negotiations has proven successful, demonstrating our strong relationships with the neighbouring communities near Constancia and positioning us well to gain access to other regional growth targets in Peru. After reaching an exploration agreement with the Quehuincha community in early 2019 and subsequently completing the Consulta Previa process, we have commenced site preparation work and expect to start our drill program on the Quehuincha North high-grade skarn target in November.
Rosemont Update
The appeal of the unprecedented Rosemont court decision continues to advance. After Hudbay and the U.S. government filed their respective initial briefs in June 2020 with the U.S. Court of Appeals for the Ninth Circuit in relation to the U.S. District Court for the District of Arizona's decision in July 2019, the plaintiffs filed their briefs in September. Hudbay and the U.S. government expect to file their final briefs in November. A final decision in the appeal process is expected in late 2021.
In October 2020, Hudbay commenced a drilling program on its wholly owned private land located in a historic mining district, called Helvetia, near its Rosemont project in Arizona. The focus of the program is two-fold: to complete condemnation drilling in the areas planned for power and water lines for Rosemont, and to test the Helvetia copper district for future exploration potential. We will provide further updates as appropriate.
Senior Unsecured Notes Refinancing
On September 23, 2020, we completed the offering of $600.0 million aggregate principal amount of 6.125% senior notes due April 2029 (the "New Notes"). The New Notes are governed by an indenture, dated as of September 23, 2020, among the Company, the subsidiaries of the Company party thereto as guarantors and U.S. Bank National Association, as trustee.
The proceeds from this offering were primarily used to redeem all $400.0 million of our outstanding 7.250% Redeemed Notes, including the payment of accrued and unpaid interest, a call premium of $7.3 million, and transaction costs associated with the New Notes.
CONSTANCIA OPERATIONS REVIEW
|
| Three months ended |
| Nine months ended |
| Guidance | |||||
| Sep. 30, |
| Sep. 30, |
| Sep. 30, |
| Sep. 30, |
| Annual | ||
| 2020 1 | ||||||||||
Ore mined 2 | tonnes |
| 8,455,668 |
| 8,413,367 |
| 18,216,166 |
| 25,259,306 |
|
|
Copper | % |
| 0.31 |
| 0.44 |
| 0.33 |
| 0.44 |
|
|
Gold | g/tonne |
| 0.03 |
| 0.05 |
| 0.03 |
| 0.04 |
|
|
Silver | g/tonne |
| 2.55 |
| 3.93 |
| 2.81 |
| 3.72 |
|
|
Molybdenum | % |
| 0.02 |
| 0.02 |
| 0.02 |
| 0.01 |
|
|
|
|
|
|
|
|
|
|
|
|
|
|
Ore milled | tonnes |
| 7,480,655 |
| 8,240,344 |
| 18,555,604 |
| 23,913,145 |
|
|
Copper | % |
| 0.33 |
| 0.44 |
| 0.34 |
| 0.43 |
|
|
Gold | g/tonne |
| 0.03 |
| 0.04 |
| 0.03 |
| 0.04 |
|
|
Silver | g/tonne |
| 2.68 |
| 3.76 |
| 2.93 |
| 3.57 |
|
|
Molybdenum | % |
| 0.02 |
| 0.02 |
| 0.02 |
| 0.02 |
|
|
|
|
|
|
|
|
|
|
|
|
|
|
Copper concentrate | tonnes |
| 91,496 |
| 135,052 |
| 226,843 |
| 373,571 |
|
|
Concentrate grade | % Cu |
| 22.74 |
| 23.02 |
| 22.75 |
| 23.33 |
|
|
|
|
|
|
|
|
|
|
|
|
|
|
Copper recovery | % |
| 83.3 |
| 86.0 |
| 82.1 |
| 85.7 |
|
|
Gold recovery | % |
| 51.6 |
| 48.3 |
| 48.7 |
| 47.5 |
|
|
Silver recovery | % |
| 66.7 |
| 68.9 |
| 65.6 |
| 68.3 |
|
|
Molybdenum recovery | % |
| 30.4 |
| 20.2 |
| 29.7 |
| 25.1 |
|
|
|
|
|
|
|
|
|
|
|
|
|
|
Combined unit operating costs3,4 | $/tonne |
| 9.85 |
| 8.63 |
| 9.16 |
| 9.28 |
| 8.30 - 10.00 |
1 Updated Peru guidance issued August 11, 2020. | |||||||||||
2 Reported tonnes and grade for ore mined are estimates based on mine plan assumptions and may not reconcile fully to ore milled. | |||||||||||
3 Reflects combined mine, mill and general and administrative ("G&A") costs per tonne of ore milled. Reflects the deduction of expected capitalized stripping costs. | |||||||||||
4 Combined unit costs is a non-IFRS financial performance measure with no standardized definition under IFRS. For further information and a detailed reconciliation, please see the discussion under the "Non-IFRS Financial Reporting Measures" section of this MD&A. | |||||||||||
The Constancia team has demonstrated strong operating performance in an environment of strict COVID-19 measures and controls. We work collaboratively with the health authorities to ensure our workforce and partners adhere to our COVID-19 protocols while continuing to operate safely and efficiently.
Ore milled at our Constancia mine during the third quarter of 2020 was 9% lower compared to the same period in 2019 due to a deferred plant maintenance shutdown in August which typically occurs in the second and fourth quarters, as previously disclosed, as well as lower throughput caused by increased ore hardness. Milled gold, silver and copper grades in the third quarter were approximately 25%, 29% and 25% lower, respectively, than the same period in 2019 in line with the mine plan. Copper recoveries in the third quarter of 2020 decreased by 3% compared to the same period in 2019 due to the decrease in milled grade and higher contaminants in the current mining phase of the pit.
Combined mine, mill and G&A unit operating costs in the third quarter of 2020 were 14% higher than the same period in 2019, primarily due to fewer tonnes of ore milled as a result of the plant maintenance in August, which also led to increased operating costs. Unit operating costs in the quarter were within the guidance range for 2020.
Year-to-date combined unit operating costs were generally in line with the same period in 2019, as lower production caused by an eight-week suspension of Constancia mine operations was offset by a corresponding decrease in mine, mill and general and administration costs. We expect cost guidance to be met for the full year 2020.
Contained metal in concentrate produced | Three months ended |
| Nine months ended |
| Guidance | |||||
Sep. 30, |
| Sep. 30, |
| Sep. 30, |
| Sep. 30, |
| Annual | ||
| 2020 1 | |||||||||
Copper | tonnes | 20,803 |
| 31,091 |
| 51,596 |
| 87,166 |
| 65,000 - 75,000 |
Gold | oz | 3,333 |
| 5,565 |
| 8,705 |
| 14,716 |
|
|
Silver | oz | 430,208 |
| 686,258 |
| 1,145,197 |
| 1,872,995 |
|
|
Molybdenum | tonnes | 392 |
| 262 |
| 870 |
| 900 |
| 1,100- 1,300 |
Precious metals2 | oz | 8,167 |
| 15,369 |
| 21,573 |
| 41,473 |
| 25,000 - 35,000 |
1 Updated Peru guidance issued August 11, 2020. | ||||||||||
2 Precious metals production includes gold and silver production on a gold-equivalent basis. For 2019, silver is converted to gold at a ratio of 70:1. For 2020, silver is converted to gold at a ratio of 89:1. | ||||||||||
In the third quarter of 2020, production of copper, gold and silver were 33%, 40%, and 37% lower, respectively, than the same period in 2019 due to lower grades in line with the mine plan and reduced production caused by the August plant maintenance shutdown. Year-to-date 2020 production of copper, gold and silver were 41%, 41%, and 39% lower, respectively, compared to the same period of 2019, due to the same reasons as the third quarter variances as well as the suspension of Constancia operations in the second quarter.
Molybdenum production in the third quarter of 2020 was higher than the same period in 2019 due to higher recovery and slightly higher grade. Year-to-date molybdenum production is in line with the same period in 2019.
We expect production of all metals and unit operating costs at Constancia to be in line with the revised full year guidance for 2020 that was released with our second quarter results.
*Reflects Constancia temporary suspension of operations in April and May.
Peru Cash Cost and Sustaining Cash Cost
|
| Three months ended |
| Nine months ended | |||||
| Sep. 30, 2020 |
| Sep. 30, 2019 |
| Sep. 30, 2020 |
| Sep. 30, 2019 | ||
Cash cost per pound of copper produced, net of by-product credits1 | $/lb |
| 1.54 |
| 1.06 |
| 1.45 |
| 1.10 |
Sustaining cash cost per pound of copper produced, net of by-product credits1 | $/lb |
| 2.29 |
| 1.53 |
| 2.05 |
| 1.48 |
1 Cash cost and sustaining cash costs per pound of copper produced, net of by-product credits, are not recognized under IFRS. For more detail on these non-IFRS financial performance measures, please see the discussion under the "Non-IFRS Financial Performance Measures" section of this MD&A. | |||||||||
Cash cost per pound of copper produced, net of by-product credits, for the three and nine months ended September 30, 2020 were $1.54 and $1.45, respectively. Cash cost increased 45% and 32%, respectively, compared to the same periods in 2019. The overall increase is primarily due to lower copper production caused by lower grades and increasing ore hardness as we progress through the mine plan and lower by-product credits.
Sustaining cash cost per pound of copper produced, net of by-product credits increased by 50% compared to the third quarter of 2019, mainly due to the same factors noted above, affecting cash costs as well as accelerated sustaining capital spending following a full ramp up of operations to normal levels in early July 2020 at Constancia. Sustaining cash cost increased 39% on a year-to-date basis, primarily due to the same factors noted above, offset by lower sustaining capital spending due to a curtailment of activity during the eight-week shutdown at Constancia in the second quarter of 2020.
Metal Sold
|
| Three months ended |
| Nine months ended | ||||||
| Sep. 30, 2020 |
| Sep. 30, 2019 |
| Sep. 30, 2020 |
| Sep. 30, 2019 | |||
Payable metal in concentrate |
|
|
|
|
|
|
|
|
| |
Copper | tonnes |
| 21,654 |
| 25,314 |
|
| 49,924 |
| 77,754 |
Gold | oz |
| 3,753 |
| 3,858 |
| 7,689 |
| 14,132 | |
Silver | oz |
| 433,595 |
| 529,139 |
| 1,037,705 |
| 1,785,657 | |
Molybdenum | tonnes |
| 313 |
| 334 |
|
| 864 |
| 987 |
Quantities of payable metal sold for the three and nine months ended September 30, 2020 were lower than the same period in 2019 primarily for the same reasons that affected contained metal production.
MANITOBA OPERATIONS REVIEW
Mines
|
| Three months ended |
| Nine months ended | |||||
| Sep. 30, 2020 |
| Sep. 30, 2019 |
| Sep. 30, 2020 |
| Sep. 30, 2019 | ||
Lalor |
|
|
|
|
|
|
|
|
|
Ore | tonnes |
| 357,213 |
| 346,456 |
| 1,186,139 |
| 1,146,640 |
Copper | % |
| 0.66 |
| 0.68 |
| 0.71 |
| 0.73 |
Zinc | % |
| 5.98 |
| 6.16 |
| 5.81 |
| 6.41 |
Gold | g/tonne |
| 2.28 |
| 2.21 |
| 2.40 |
| 2.00 |
Silver | g/tonne |
| 21.23 |
| 25.56 |
| 25.45 |
| 24.54 |
777 |
|
|
|
|
|
|
|
| |
Ore | tonnes |
| 264,905 |
| 273,319 |
| 826,720 |
| 840,440 |
Copper | % |
| 0.98 |
| 1.33 |
| 1.30 |
| 1.44 |
Zinc | % |
| 3.95 |
| 3.01 |
| 4.06 |
| 3.19 |
Gold | g/tonne |
| 2.01 |
| 1.63 |
| 1.91 |
| 1.64 |
Silver | g/tonne |
| 24.25 |
| 15.42 |
| 24.62 |
| 18.72 |
Total Mines |
|
|
|
|
|
|
|
|
|
Ore | tonnes |
| 622,118 |
| 619,775 |
| 2,012,859 |
| 1,987,080 |
Copper | % |
| 0.80 |
| 0.97 |
| 0.95 |
| 1.03 |
Zinc | % |
| 5.11 |
| 4.77 |
| 5.09 |
| 5.05 |
Gold | g/tonne |
| 2.17 |
| 1.95 |
| 2.20 |
| 1.85 |
Silver | g/tonne |
| 22.52 |
| 21.09 |
| 25.11 |
| 22.08 |
Unit Operating Costs1,2 |
| Three months ended |
| Nine months ended | |||||
| Sep. 30, 2020 |
| Sep. 30, 2019 |
| Sep. 30, 2020 |
| Sep. 30, 2019 | ||
Mines |
|
|
|
|
|
|
|
|
|
Lalor | C$/tonne |
| 97.38 |
| 102.16 |
| 95.63 |
| 105.96 |
777 | C$/tonne |
| 80.84 |
| 80.78 |
| 78.50 |
| 77.95 |
Total Mines | C$/tonne |
| 90.34 |
| 92.74 |
| 88.60 |
| 94.11 |
1 Reflects costs per tonne of ore mined. |
|
|
|
|
|
|
|
|
|
2 Unit costs is a non-IFRS financial performance measure with no standardized definition under IFRS. For further information and a detailed reconciliation, please see the discussion under the "Non-IFRS Financial Reporting Measures" section of this MD&A. | |||||||||
The Manitoba business unit had solid operating performance across the mines, mills and zinc plant during the third quarter. In the face of the ongoing COVID-19 pandemic, we have maintained the controls that were developed in the early part of the year and our health and safety committees have continued to work collaboratively with local health units with a focus on keeping our employees and communities safe.
Operational performance during the third quarter at both Lalor and 777 was strong, with ore production generally in line with the same period in 2019 and grades at both mines remaining in line with the mine plan. At Lalor, we completed a two-week planned maintenance program, on schedule and achieved a third quarter production rate averaging 4,600 tonnes per day outside of the maintenance period. The 777 mine maintained consistent and stable performance during the third quarter as it approaches its planned closure in 2022.
Operational readiness activities in support of the early start-up of New Britannia are on track, including ensuring that a sufficient and consistent volume of gold ore will be available. Underground development at Lalor in gold-rich lenses 25 and 27 is advancing ahead of schedule in preparation for the mid-2021 start-up of New Britannia, which is three months earlier than previously planned. Mining of the first stope in lens 27 was completed in September and the trend of increased precious metal production from Lalor is expected to continue.
Total unit operating costs for the mines during the third quarter of 2020 decreased by 3% compared to the same period in 2019 mainly due to lower unit costs at Lalor. Year-to-date total unit operating costs for the mines decreased by 6% for the same reason.
Processing Facilities
|
| Three months ended |
| Nine months ended | |||||
| Sep. 30, 2020 |
| Sep. 30, 2019 |
| Sep. 30, 2020 |
| Sep. 30, 2019 | ||
Stall Concentrator |
|
|
|
|
|
|
|
|
|
Ore | tonnes |
| 335,739 |
| 318,539 |
| 1,040,127 |
| 979,678 |
Copper | % |
| 0.68 |
| 0.64 |
| 0.71 |
| 0.71 |
Zinc | % |
| 6.11 |
| 6.22 |
| 5.87 |
| 6.44 |
Gold | g/tonne |
| 2.35 |
| 2.12 |
| 2.44 |
| 1.99 |
Silver | g/tonne |
| 22.08 |
| 25.16 |
| 25.71 |
| 24.64 |
|
|
|
|
|
|
|
|
|
|
Copper concentrate | tonnes |
| 10,459 |
| 8,928 |
| 33,409 |
| 29,926 |
Concentrate grade | % Cu |
| 18.22 |
| 19.40 |
| 19.04 |
| 19.97 |
|
|
|
|
|
|
|
|
|
|
Zinc concentrate | tonnes |
| 38,070 |
| 35,439 |
| 111,467 |
| 112,054 |
Concentrate grade | % Zn |
| 49.99 |
| 51.29 |
| 50.47 |
| 51.38 |
|
|
|
|
|
|
|
|
|
|
Copper recovery | % |
| 84.0 |
| 84.4 |
| 85.8 |
| 85.8 |
Zinc recovery | % |
| 92.7 |
| 91.8 |
| 92.2 |
| 91.2 |
Gold recovery | % |
| 57.4 |
| 54.3 |
| 60.3 |
| 55.0 |
Silver recovery | % |
| 57.5 |
| 57.4 |
| 60.5 |
| 59.6 |
|
|
|
|
|
|
|
|
|
|
Contained metal in concentrate produced |
|
|
|
|
|
| |||
Copper | tonnes |
| 1,906 |
| 1,732 |
| 6,362 |
| 5,975 |
Zinc | tonnes |
| 19,030 |
| 18,178 |
| 56,256 |
| 57,570 |
Precious metals1 | oz |
| 16,063 |
| 13,910 |
| 54,991 |
| 41,000 |
|
|
|
|
|
|
|
|
|
|
Flin Flon Concentrator |
|
|
|
|
|
|
|
|
|
Ore | tonnes |
| 322,156 |
| 331,216 |
| 979,651 |
| 987,477 |
Copper | % |
| 0.99 |
| 1.22 |
| 1.21 |
| 1.33 |
Zinc | % |
| 4.07 |
| 3.64 |
| 4.28 |
| 3.67 |
Gold | g/tonne |
| 1.99 |
| 1.74 |
| 1.96 |
| 1.71 |
Silver | g/tonne |
| 24.01 |
| 17.36 |
| 24.63 |
| 19.57 |
|
|
|
|
|
|
|
|
|
|
Copper concentrate | tonnes |
| 11,116 |
| 15,043 |
| 43,758 |
| 49,868 |
Concentrate grade | % Cu |
| 24.16 |
| 23.92 |
| 23.07 |
| 23.29 |
|
|
|
|
|
|
|
|
|
|
Zinc concentrate | tonnes |
| 22,590 |
| 20,482 |
| 71,154 |
| 60,847 |
Concentrate grade | % Zn |
| 51.08 |
| 51.07 |
| 50.64 |
| 50.86 |
|
|
|
|
|
|
|
|
|
|
Copper recovery | % |
| 83.9 |
| 89.1 |
| 85.4 |
| 88.4 |
Zinc recovery | % |
| 87.9 |
| 86.7 |
| 85.9 |
| 85.4 |
Gold recovery | % |
| 55.3 |
| 59.1 |
| 55.8 |
| 60.6 |
Silver recovery | % |
| 42.0 |
| 48.7 |
| 45.8 |
| 51.5 |
|
|
|
|
|
|
|
|
|
|
Contained metal in concentrate produced |
|
|
|
|
|
| |||
Copper | tonnes |
| 2,686 |
| 3,599 |
| 10,097 |
| 11,616 |
Zinc | tonnes |
| 11,540 |
| 10,461 |
| 36,031 |
| 30,944 |
Precious metals1 | oz |
| 12,594 |
| 12,243 |
| 38,380 |
| 37,438 |
1 Precious metals production includes gold and silver production on a gold-equivalent basis. For 2019, silver is converted to gold at a ratio of 70:1. For 2020, silver is converted to gold at a ratio of 89:1. | |||||||||
Unit Operating Costs1 |
| Three months ended |
| Nine months ended |
| Guidance | |||||
| Sep. 30, |
| Sep. 30, |
| Sep. 30, |
| Sep. 30, |
| Annual | ||
| 2020 | ||||||||||
Concentrators |
|
|
|
|
|
|
|
|
|
|
|
Stall | C$/tonne |
| 24.28 |
| 26.38 |
| 23.58 |
| 25.57 |
|
|
Flin Flon | C$/tonne |
| 23.89 |
| 22.93 |
| 23.19 |
| 22.91 |
|
|
Combined mine/mill unit operating costs 2,3 |
|
|
|
|
|
|
|
| |||
Manitoba | C$/tonne |
| 126 |
| 130 |
| 129 |
| 137 |
| 130 - 140 |
1 Reflects costs per tonne of milled ore. |
| ||||||||||
2 Reflects combined mine, mill and G&A costs per tonne of milled ore. | |||||||||||
3 Combined unit costs is a non-IFRS financial performance measure with no standardized definition under IFRS. For further information and a detailed reconciliation, please see the discussion under the "Non-IFRS Financial Reporting Measures" section of this MD&A. | |||||||||||
At the Stall concentrator, ore processed during the third quarter of 2020 was 5% higher than the same period in 2019, despite a planned one-week outage on one of the grinding lines for capital upgrades. Year-to-date ore processed at Stall increased by 6% as a result of several continuous improvement initiatives and higher ore availability from the Lalor mine. Although lower than the first half of 2020, the trend of improved gold recoveries has continued compared to the same periods in 2019 due to improved ore characteristics and numerous operational improvement projects implemented at the Stall mill.
Ore processed in the Flin Flon concentrator in the third quarter of 2020 decreased by 3% compared to the same period in 2019 due to less Lalor ore required to be processed in Flin Flon as a result of higher throughput at the Stall mill. Metal recoveries at the Flin Flon concentrator during the third quarter of 2020 decreased slightly compared with the same period in 2019, which was in line with metallurgical models. Year-to-date ore processed at the Flin Flon mill remained largely unchanged from the same period in 2019.
Unit operating costs at Stall decreased by 8% in the third quarter of 2020 compared to the same period in 2019, due to increased throughput, whereas unit operating costs at Flin Flon were 4% higher over the same period because of reduced ore throughput. Manitoba combined mine, mill and G&A unit operating costs in the third quarter of 2020 decreased by 3% compared to the same period in 2019. Year-to-date combined mine, mill and G&A unit operating costs were 6% lower as the mines and mills delivered efficient results. Manitoba combined unit costs are expected to be within the guidance range for the full year 2020.
Manitoba contained metal in concentrate produced1 | Three months ended |
| Nine months ended |
| Guidance | |||||
Sep. 30, 2020 |
| Sep. 30, 2019 |
| Sep. 30, 2020 |
| Sep. 30, 2019 |
| Annual | ||
| 2020 | |||||||||
Copper | tonnes | 4,592 |
| 5,331 |
| 16,459 |
| 17,591 |
| 18,000 - 22,000 |
Gold | oz | 25,944 |
| 22,754 |
| 83,540 |
| 67,264 |
|
|
Silver | oz | 241,477 |
| 237,933 |
| 874,997 |
| 782,198 |
|
|
Zinc | tonnes | 30,570 |
| 28,639 |
| 92,287 |
| 88,514 |
| 105,000 - 125,000 |
|
|
|
|
|
|
|
|
|
|
|
Precious metals2 | oz | 28,657 |
| 26,153 |
| 93,371 |
| 78,438 |
| 110,000 - 135,000 |
1 Metal reported in concentrate is prior to deductions associated with smelter terms. | ||||||||||
3 Precious metals production includes gold and silver production on a gold-equivalent basis. For 2019, silver is converted to gold at a ratio of 70:1. For 2020, silver is converted to gold at a ratio of 89:1. | ||||||||||
In the third quarter of 2020, gold, silver and zinc production was 14%, 1%, and 7% higher, compared to the same period in 2019, due to higher head grades and higher gold and zinc recoveries. Copper production declined by 14% in the third quarter of 2020 due to lower head grades. Year-to-date, gold, silver and zinc production increased by 24%, 12% and 4%, respectively, due to higher throughput and higher gold and silver head grades. Year-to-date copper production decreased by 6% as head grades and recoveries decreased compared to the same period in 2019.
Fourth quarter 2020 production and sales volumes in Manitoba will be impacted by the production interruption at the 777 mine. With the implementation of production mitigation plans, we continue to expect to achieve full year guidance for Manitoba.
Zinc Plant
Zinc Production |
| Three months ended |
| Nine months ended |
| Guidance | |||||
| Sep. 30, |
| Sep. 30, |
| Sep. 30, |
| Sep. 30, |
| Annual | ||
| 2020 | ||||||||||
Zinc Concentrate Treated |
|
|
|
|
|
|
|
| |||
Domestic | tonnes |
| 54,993 |
| 50,577 |
| 179,694 |
| 158,600 |
|
|
Refined Metal Produced |
|
|
|
|
|
|
|
|
|
| |
Domestic | tonnes |
| 26,818 |
| 24,319 |
| 82,819 |
| 75,524 |
| 100,000 - 112,000 |
Unit Operating Costs |
| Three months ended |
| Nine months ended |
| Guidance | |||||
| Sep. 30, |
| Sep. 30, |
| Sep. 30, |
| Sep. 30, |
| Annual | ||
| 2020 | ||||||||||
Zinc Plant 1,2 | C$/lb |
| 0.48 |
| 0.54 |
| 0.47 |
| 0.50 |
| 0.45 - 0.52 |
1 Zinc unit operating costs include G&A costs. |
| ||||||||||
2 Zinc unit costs is a non-IFRS financial performance measure with no standardized definition under IFRS. For further information and a detailed reconciliation, please see the discussion under the "Non-IFRS Financial Reporting Measures" section of this MD&A. | |||||||||||
Production of cast zinc in the third quarter of 2020 was 10% higher than the same period in 2019 while operating costs per pound of zinc metal produced were 11% lower over the same period. Year-to-date refined zinc metal production increased by 10% compared to the same period in 2019 due to higher equipment availability coupled with higher concentrate availability.
Full year production of cast zinc and zinc plant unit operating cost are expected to be within guidance ranges for 2020.
Manitoba Cash Cost and Sustaining Cash Cost
|
| Three months ended |
| Nine months ended | |||||||||
| Sep. 30, |
| Sep. 30, |
| Sep. 30, |
| Sep. 30, | ||||||
Cost per pound of copper produced |
|
|
|
|
|
|
|
|
| ||||
Cash cost per pound of copper produced, net of by-product credits 1 | $/lb |
| (3.41 | ) |
| (1.31 | ) |
| (1.75 | ) |
| (0.57) | |
Sustaining cash cost per pound of copper produced, net of by-product credits 1 | $/lb |
| 0.83 |
|
| 2.15 |
|
| 1.51 |
|
| 2.13 |
|
|
|
|
|
|
|
|
|
|
| ||||
Cost per pound of zinc produced |
|
|
|
|
|
|
|
|
| ||||
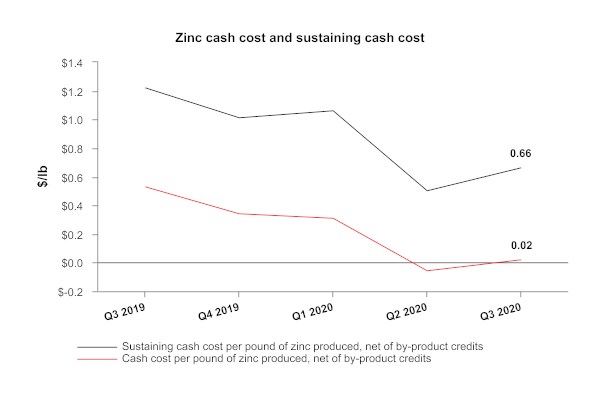
Cash cost per pound of zinc produced, net of by-product credits 1 | $/lb |
| 0.02 |
|
| 0.53 |
|
| 0.14 |
|
| 0.45 |
|
Sustaining cash cost per pound of zinc produced, net of by-product credits 1 | $/lb |
| 0.66 |
|
| 1.18 |
|
| 0.72 |
|
| 0.98 |
|
1 Cash cost and sustaining cash cost per pound of copper & zinc produced, net of by-product credits, are not recognized under IFRS. For more detail on this non-IFRS financial performance measure, please see the discussion under the "Non-IFRS Financial Performance Measures" section of this MD&A. | |||||||||||||
Cash cost per pound of copper produced, net of by-product credits, in the third quarter of 2020 was negative $3.41. These costs were lower compared to the same period in 2019, primarily as a result of higher by-product credits and lower mining costs, partially offset by lower copper production. Cash cost per pound of copper produced, net of by-product credits, for the first nine months of 2020 were lower compared to the same period, primarily due to the same reasons.
Sustaining cash cost per pound of copper produced, net of by-product credits, in the third quarter of 2020 was $0.83. These costs were lower compared to the same period in 2019, primarily due to the reasons listed above slightly offset by increased sustaining capital expenditures. Sustaining cash cost per pound of copper produced, net of by-product credits, for the first nine months of 2020 were lower compared to the same period in 2019, primarily due to the same reasons.
Cash cost and sustaining cash cost per pound of zinc produced, net of by-product credits, in the third quarter of 2020 were lower than the same period last year as a result of significantly higher by-product credits, lower mining costs and higher zinc production, partially offset by higher sustaining capital expenditures.
Cash cost and sustaining cash cost per pound of zinc produced, net of by-product credits, were lower in the first nine months of 2020 compared to the same period in 2019 due to increased zinc production, significantly higher by-product credits and lower mining costs, partially offset by higher sustaining capital expenditures.
Metal Sold
|
| Three months ended |
| Nine months ended | |||||
| Sep. 30, |
| Sep. 30, |
| Sep. 30, |
| Sep. 30, | ||
Payable metal in concentrate |
|
|
|
|
|
|
|
|
|
Copper | tonnes |
| 4,249 |
| 4,602 |
| 16,002 |
| 17,050 |
Gold | oz |
| 26,852 |
| 21,630 |
| 80,081 |
| 64,523 |
Silver | oz |
| 271,900 |
| 227,157 |
| 785,497 |
| 757,846 |
Refined zinc | tonnes |
| 26,520 |
| 29,140 |
| 80,916 |
| 76,318 |
FINANCIAL REVIEW
Financial Results
In the third quarter of 2020, we recorded a net loss of $24.0 million compared to a loss of $274.8 million for the same period in 2019, representing a reduction in loss of $250.8 million. Year-to date in 2020, we recorded a loss of $152.0 million compared to a loss of $342.4 million in the same period in 2019, reducing net loss by $190.4 million.
The following table provides further details on these variances:
(in $ millions) | Three months ended | Nine months ended |
| ||
| |||||
Increase (decrease) in components of profit or loss: |
|
|
| ||
Revenues | 24.8 |
| (142.8 | ) |
|
Cost of sales |
|
|
| ||
Mine operating costs | (2.8 | ) | 34.2 |
|
|
Depreciation and amortization | (13.7 | ) | (12.6 | ) |
|
Selling and administrative expenses | (5.7 | ) | 3.8 |
|
|
Exploration and evaluation expenses | 4.9 |
| 10.3 |
|
|
Other expenses | 1.8 |
| 35.6 |
|
|
Impairment | 322.2 |
| 322.2 |
|
|
Net finance expense | (7.1 | ) | (20.2 | ) |
|
Tax | (73.6 | ) | (40.1 | ) |
|
Reduction in loss for the period | 250.8 |
| 190.4 |
|
|
Revenue
Revenue for the third quarter of 2020 was $316.1 million, $24.8 million or 9% higher than the same period in 2019, primarily as a result of higher realized copper and precious metals prices and higher gold sales volume as well as a variable consideration adjustment on our Manitoba stream revenue and lower comparative treatment and refining charges. This was partially offset by lower sales volumes of copper and zinc.
Year-to-date revenue in 2020 was $770.1 million, $142.8 million or 16% lower than the same period in 2019, primarily as a result of significantly lower copper sales volumes in Peru as a result of an eight-week suspension of Constancia operations in the second quarter and lower copper grades as well as lower realized base metal prices and silver sales volumes. This was partially offset by higher realized gold prices, a variable consideration adjustment on stream revenue as well as lower comparative treatment and refining charges.
(in $ millions) | Three months ended | Nine months ended |
|
|
|
Metals prices1 |
|
|
Higher (lower) copper prices | 20.7 | (5.4) |
Lower zinc prices | (2.1) | (39.0) |
Higher gold prices | 13.4 | 33.6 |
Higher silver prices | 1.8 | 1.0 |
Sales volumes |
|
|
Lower copper sales volumes | (23.0) | (174.7) |
(Lower) higher zinc sales volumes | (6.8) | 12.9 |
Higher gold sales volumes | 7.5 | 12.9 |
Lower silver sales volumes | (1.3) | (18.1) |
Other |
|
|
Change in derivative mark-to-market on zinc | 1.4 | 0.6 |
Molybdenum and other volume and pricing differences | (1.5) | (9.8) |
Variable consideration adjustments | 9.5 | 23.0 |
Effect of lower treatment and refining charges | 5.2 | 20.2 |
Increase (decrease) in revenue in 2020 compared to 2019 | 24.8 | (142.8) |
1 See discussion below for further information regarding metals prices. |
|
|
Our revenue by significant product type is summarized below:
| Three months ended |
| Nine months ended | |||||||
(in $ millions) | Sep. 30, 2020 | Sep. 30, 2019 |
| Sep. 30, 2020 |
| Sep. 30, 2019 | ||||
Copper | 169.5 |
| 177.0 |
|
| 396.9 |
|
| 584.7 |
|
Zinc | 65.0 |
| 75.0 |
|
| 187.5 |
|
| 212.8 |
|
Gold | 44.9 |
| 28.4 |
|
| 131.7 |
|
| 83.1 |
|
Silver | 6.9 |
| 5.5 |
|
| 18.0 |
|
| 20.8 |
|
Molybdenum | 5.3 |
| 9.0 |
|
| 16.8 |
|
| 26.6 |
|
Other metals | 2.2 |
| 1.0 |
|
| 4.0 |
|
| 3.5 |
|
Revenue from contracts | 293.8 | 295.9 |
| 754.9 |
| 931.5 | ||||
Amortization of deferred revenue - gold | 9.0 |
| 8.1 |
|
| 19.4 |
|
| 24.2 | |
Amortization of deferred revenue - silver | 11.7 |
| 13.3 |
|
| 27.7 |
|
| 44.4 | |
Amortization of deferred revenue - variable consideration adjustments - prior periods | 9.5 |
| - |
|
| 6.7 |
|
| (16.3) | |
Pricing and volume adjustments1 | 7.1 |
| (5.8) |
| 3.5 |
|
| (8.5) | ||
Treatment and refining charges | (15.0 | ) | (20.2) |
| (42.1 | ) |
| (62.3) | ||
Revenue | 316.1 | 291.3 |
| 770.1 |
| 913.0 | ||||
1 Pricing and volume adjustments represents mark-to-market adjustments on provisionally prices sales, realized and unrealized changes to fair value for non-hedge derivative contracts and adjustments to originally invoiced weights and assays. | ||||||||||
For further detail on variable consideration adjustments, refer to note 15 of our consolidated interim financial statements.
Realized sales prices
This measure is intended to enable management and investors to understand the average realized price of metals sold to third parties in each reporting period. The average realized price per unit sold does not have any standardized meaning prescribed by IFRS, is unlikely to be comparable to similar measures presented by other issuers and should not be considered in isolation or a substitute for measures of performance prepared in accordance with IFRS.
For sales of copper, gold and silver we may enter into non-hedge derivatives ("QP hedges") which are intended to manage the provisional pricing risk arising from quotational period terms in concentrate sales agreements. The QP hedges are not removed from the calculation of realized prices. We expect that gains and losses on QP hedges will offset provisional pricing adjustments on concentrate sales contracts.
Our realized prices for the third quarter in 2020 and 2019, respectively, are summarized below:
| Realized prices1 for the | LME YTD 20202 |
| Realized prices1 for the | |||||||||
Three months ended |
| Nine months ended | |||||||||||
| LME QTD 20202 | Sep. 30, 2020 | Sep. 30, 2019 |
| Sep. 30, 2020 |
| Sep. 30, 2019 | ||||||
Prices |
|
|
|
|
|
|
|
|
| ||||
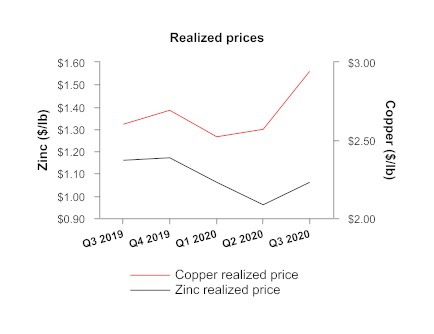
Copper | $/lb | 2.94 | 2.96 |
| 2.60 | 2.64 |
| 2.71 |
|
| 2.74 | ||
Zinc3 | $/lb | 1.06 | 1.12 |
| 1.16 | 0.97 |
| 1.05 |
|
| 1.26 | ||
Gold4 | $/oz |
| 1,898 |
| 1,460 |
|
| 1,803 |
|
| 1,421 | ||
Silver4 | $/oz |
| 27.86 |
| 25.28 |
|
|
| 25.62 |
|
| 25.08 |
|
1 Realized prices exclude refining and treatment charges and are on the sale of finished metal or metal in concentrate. Realized prices include the effect of provisional pricing adjustments on prior period sales. | |||||||||||||
2 London Metal Exchange average for copper and zinc prices. | |||||||||||||
3 All sales for the three and nine months ended September 30, 2020 and 2019 were cast zinc metal. Zinc realized prices include premiums paid by customers for delivery of refined zinc metal, but exclude unrealized gains and losses related to non-hedge derivative contracts that are included in zinc revenues. | |||||||||||||
4 Sales of gold and silver from our 777 and Constancia mines are subject to our precious metals stream agreement with Wheaton Precious Metals, pursuant to which we recognize deferred revenue for precious metals deliveries and also receive cash payments. Stream sales are included within realized prices and their respective deferred revenue and cash payment rates can be found on page 29. | |||||||||||||
The following tables provide a reconciliation of average realized price per unit sold, by metal, to revenues as shown in the consolidated interim financial statements.
Three months ended September 30, 2020 | ||||||||||||||
(in $ millions) 1 | Copper | Zinc | Gold | Silver | Molybdenum | Other | Total | |||||||
Revenue per financial statements | 169.5 |
| 65.0 |
| 44.9 |
| 6.9 |
| 5.3 |
| 2.2 |
| 293.8 |
|
Amortization of deferred revenue | - |
| - |
| 9.0 |
| 11.7 |
| - |
| - |
| 20.7 |
|
Pricing and volume adjustments2 | (0.3 | ) | 1.9 |
| 4.2 |
| 1.0 |
| 0.3 |
| - |
| 7.1 |
|
By-product credits 3 | 169.2 |
| 66.9 |
| 58.1 |
| 19.6 |
| 5.6 |
| 2.2 |
| 321.6 |
|
Derivative mark-to-market 4 | - |
| (1.4 | ) | - |
| - |
| - |
| - |
| (1.4 | ) |
Revenue, excluding mark-to-market on non-QP hedges | 169.2 |
| 65.5 |
| 58.1 |
| 19.6 |
| 5.6 |
| 2.2 |
| 320.2 |
|
Payable metal in concentrate sold 5 | 25,903 |
| 26,520 |
| 30,605 |
| 705,495 |
| 313 |
| - |
| - |
|
Realized price 6 | 6,533 |
| 2,472 |
| 1,898 |
| 27.86 |
| - |
| - |
| - |
|
Realized price 7 | 2.96 |
| 1.12 |
| - |
| - |
| - |
| - |
| - |
|
Nine Months Ended September 30, 2020 | ||||||||||||||
(in $ millions) 1 | Copper | Zinc | Gold | Silver | Molybdenum | Other | Total | |||||||
Revenue per financial statements | 396.9 |
| 187.5 |
| 131.7 |
| 18.0 |
| 16.8 |
| 4.0 |
| 754.9 |
|
Amortization of deferred revenue | - |
| - |
| 19.4 |
| 27.7 |
| - |
| - |
| 47.1 |
|
Pricing and volume adjustments2 | (3.5 | ) | - |
| 7.1 |
| 1.0 |
| (1.1 | ) | - |
| 3.5 |
|
By-product credits 3 | 393.4 |
| 187.5 |
| 158.2 |
| 46.7 |
| 15.7 |
| 4.0 |
| 805.5 |
|
Derivative mark-to-market 4 | - |
| (0.9 | ) | - |
| - |
| - |
| - |
| (0.9 | ) |
Revenue, excluding mark-to-market on non-QP hedges | 393.4 |
| 186.6 |
| 158.2 |
| 46.7 |
| 15.7 |
| 4.0 |
| 804.6 |
|
Payable metal in concentrate sold 5 | 65,926 |
| 80,916 |
| 87,770 |
| 1,823,202 |
| 864 |
| - |
| - |
|
Realized price 6 | 5,967 |
| 2,306 |
| 1,803 |
| 25.62 |
| - |
| - |
| - |
|
Realized price 7 | 2.71 |
| 1.05 |
| - |
| - |
| - |
| - |
| - |
|
1 Average realized price per unit sold may not calculate based on amounts presented in this table due to rounding. | ||||||||||||||
2 Pricing and volume adjustments represents mark-to-market adjustments on provisionally priced sales, realized and unrealized changes to fair value for non-hedge derivative contracts and adjustments to originally invoiced weights and assays. | ||||||||||||||
3 By-product credits subtotal is used in the calculated of cash cost per pound of copper and zinc produced, net of by-product credits. Cash cost per pound of copper and zinc produced, net of by-product credits, are non-IFRS financial performance measures with no standardized definition under IFRS. For further information and a detailed reconciliation, please see the discussion under the "Non-IFRS Financial Reporting Measures" section of this MD&A. | ||||||||||||||
4 Derivative mark-to-market excludes mark-to-market on QP hedges. | ||||||||||||||
5 Copper and zinc shown in metric tonnes and gold and silver shown in ounces. | ||||||||||||||
6 Realized price for copper, zinc and molybdenum in $/metric tonne and realized price for gold and silver in $/oz. | ||||||||||||||
7 Realized price for copper, zinc and molybdenum in $/lb. | ||||||||||||||
Three months ended September 30, 2019 | ||||||||||||||
(in $ millions) 1 | Copper | Zinc | Gold | Silver | Molybdenum | Other | Total | |||||||
Revenue per financial statements | 177.0 |
| 75.0 |
| 28.4 |
| 5.5 |
| 9.0 |
| 1.0 |
| 295.9 |
|
Amortization of deferred revenue | - |
| - |
| 8.1 |
| 13.3 |
| - |
| - |
| 21.4 |
|
Pricing and volume adjustments2 | (5.5 | ) | (0.6 | ) | 0.7 |
| 0.3 |
| (0.7 | ) | - |
| (5.8 | ) |
By-product credits 3 | 171.5 |
| 74.4 |
| 37.2 |
| 19.1 |
| 8.3 |
| 1.0 |
| 311.5 |
|
Derivative mark-to-market 4 | - |
| - |
| - |
| - |
| - |
| - |
| - |
|
Revenue, excluding mark-to-market on non-QP hedges | 171.5 |
| 74.4 |
| 37.2 |
| 19.1 |
| 8.3 |
| 1.0 |
| 311.5 |
|
Payable metal in concentrate sold 5 | 29,916 |
| 29,140 |
| 25,488 |
| 756,296 |
| 334 |
| - |
| - |
|
Realized price 6 | 5,735 |
| 2,551 |
| 1,460 |
| 25.28 |
| - |
| - |
| - |
|
Realized price 7 | 2.60 |
| 1.16 |
| - |
| - |
| - |
| - |
| - |
|
Nine months ended September 30, 2019 | ||||||||||||||
(in $ millions) 1 | Copper | Zinc | Gold | Silver | Molybdenum | Other | Total | |||||||
Revenue per financial statements | 584.7 |
| 212.8 |
| 83.1 |
| 20.8 |
| 26.6 |
| 3.5 |
| 931.5 |
|
Amortization of deferred revenue | - |
| - |
| 24.2 |
| 44.4 |
| - |
| - |
| 68.6 |
|
Pricing and volume adjustments2 | (11.2 | ) | 0.2 |
| 4.4 |
| (1.4 | ) | (0.5 | ) | - |
| (8.5 | ) |
By-product credits 3 | 573.5 |
| 213.0 |
| 111.7 |
| 63.8 |
| 26.1 |
| 3.5 |
| 991.6 |
|
Derivative mark-to-market4 | - |
| (0.3 | ) | - |
| - |
| - |
| - |
| (0.3 | ) |
Revenue, excluding mark-to-market on non-QP hedges | 573.5 |
| 212.7 |
| 111.7 |
| 63.8 |
| 26.1 |
| 3.5 |
| 991.3 |
|
Payable metal in concentrate sold 5 | 94,804 |
| 76,318 |
| 78,655 |
| 2,543,503 |
| 987 |
| - |
| - |
|
Realized price 6 | 6,049 |
| 2,788 |
| 1,421 |
| 25.08 |
| - |
| - |
| - |
|
Realized price 7 | 2.74 |
| 1.26 |
| - |
| - |
| - |
| - |
| - |
|
1 Average realized price per unit sold may not calculate based on amounts presented in this table due to rounding. | ||||||||||||||
2 Pricing and volume adjustments represents mark-to-market adjustments on provisionally priced sales, realized and unrealized changes to fair value for non-hedge derivative contracts and adjustments to originally invoiced weights and assays. | ||||||||||||||
3 By-product credits subtotal is used in the calculated of cash cost per pound of copper and zinc produced, net of by-product credits. Cash cost per pound of copper and zinc produced, net of by-product credits, are non-IFRS financial performance measures with no standardized definition under IFRS. For further information and a detailed reconciliation, please see the discussion under the "Non-IFRS Financial Reporting Measures" section of this MD&A. | ||||||||||||||
4 Derivative mark-to-market excludes mark-to-market on QP hedges. | ||||||||||||||
5 Copper and zinc shown in metric tonnes and gold and silver shown in ounces. | ||||||||||||||
6 Realized price for copper, zinc and molybdenum in $/metric tonne and realized price for gold and silver in $/oz. | ||||||||||||||
7 Realized price for copper, zinc and molybdenum in $/lb. | ||||||||||||||
The price, quantity and mix of metals sold, affect our revenue, operating cash flow and profit. Revenue from metals sales can vary from quarter to quarter due to production levels, shipping volumes and transfer of risk and title to customers.
Stream Sales
The following table shows stream sales included within realized prices and their respective deferred revenue and cash payment rates:
|
| Three months ended | Nine months ended | ||
|
| Sep. 30, 2020 | Sep. 30, 2020 | ||
|
| Manitoba | Peru | Manitoba | Peru |
Gold | oz | 5,845 | 2,107 | 13,067 | 4,451 |
Silver | oz | 121,042 | 415,069 | 262,484 | 1,018,687 |
|
|
|
|
|
|
Gold deferred revenue drawdown rate1,2 | $/oz | 1,185 | 976 | 1,155 | 976 |
Gold cash rate3 | $/oz | 423 | 408 | 421 | 405 |
Total gold stream realized price | $/oz | 1,608 | 1,384 | 1,576 | 1,381 |
|
|
|
|
|
|
Silver deferred revenue drawdown rate1,2 | $/oz | 22.81 | 21.52 | 22.07 | 21.52 |
Silver cash rate3 | $/oz | 6.24 | 6.02 | 6.21 | 5.98 |
Total silver stream realized price | $/oz | 29.05 | 27.54 | 28.28 | 27.50 |
|
|
|
|
| |
| Three months ended | Nine months ended | |||
Sep. 30, 2019 | Sep. 30, 2019 | ||||
Manitoba | Peru | Manitoba | Peru | ||
Gold | oz | 4,672 | 2,737 | 13,580 | 8,647 |
Silver | oz | 85,881 | 521,360 | 293,981 | 1,733,812 |
|
|
|
|
|
|
Gold deferred revenue drawdown rate1,2 | $/oz | 1,183 | 948 | 1,176 | 948 |
Gold cash rate 3 | $/oz | 419 | 404 | 417 | 401 |
Total gold stream realized price | $/oz | 1,602 | 1,352 | 1,593 | 1,349 |
|
|
|
|
|
|
Silver deferred revenue drawdown rate1,2 | $/oz | 22.63 | 21.77 | 22.48 | 21.77 |
Silver cash rate 3 | $/oz | 6.18 | 5.96 | 6.15 | 5.92 |
Total silver stream realized price | $/oz | 28.81 | 27.73 | 28.63 | 27.69 |
1Subsequent to the variable consideration adjustment recorded on August 1, 2020 the deferred revenue amortization is recorded in Manitoba at C$1,589/oz and C$30.63/oz for gold and silver (for the three and nine months ended September 30, 2019 - C$1,589/oz and C$30.40/oz for gold and silver), respectively, and converted to US dollars at the exchange rate in effect at the time of revenue recognition. | |||||
2 Deferred revenue drawdown rates for gold and silver do not include variable consideration adjustments. | |||||
3 The gold and silver cash rate for Manitoba increased by 1% from $400/oz and $5.90/oz effective August 1, 2015. Subsequently every year, on August 1, the cash rate will increase by 1% compounded. The weighted average cash rate is disclosed. The gold and silver cash rate for Peru increased by 1% from $400/oz and $5.90/oz effective July 1, 2019. Subsequently every year, on July 1, the cash rate will increase by 1% compounded. The weighted average cash rate is disclosed. | |||||
Cost of Sales
Our detailed cost of sales is summarized as follows:
(in thousands) | Three months ended |
| Nine months ended |
| ||||||||
Sep. 30, 2020 |
| Sep. 30, 2019 |
| Sep. 30, 2020 |
| Sep. 30, 2019 |
| |||||
Peru |
|
|
|
|
|
|
|
| ||||
Mining | 18,220 |
|
| 18,274 |
|
| 45,757 |
|
| 63,884 |
|
|
Milling | 42,836 |
|
| 38,064 |
|
| 94,877 |
|
| 116,053 |
|
|
Changes in product inventory | 4,824 |
|
| (5,075 | ) |
| 2,666 |
|
| (10,723 | ) |
|
Depreciation and amortization | 53,021 |
|
| 47,236 |
|
| 133,414 |
|
| 152,188 |
|
|
G&A | 12,627 |
|
| 14,763 |
|
| 28,852 |
|
| 41,748 |
|
|
Overhead costs related to suspension of activities (cash) | - |
|
| - |
|
| 15,810 |
|
| - |
|
|
Inventory adjustments | - |
|
| 385 |
|
| 2,221 |
|
| 604 |
|
|
Freight, royalties and other charges | 11,865 |
|
| 14,776 |
|
| 28,527 |
|
| 42,467 |
|
|
Total Peru cost of sales | 143,393 |
|
| 128,423 |
|
| 352,124 |
|
| 406,221 |
|
|
Manitoba |
|
|
|
|
|
|
|
| ||||
Mining | 42,224 |
|
| 43,525 |
|
| 131,711 |
|
| 140,637 |
|
|
Milling | 11,901 |
|
| 12,118 |
|
| 34,910 |
|
| 35,873 |
|
|
Zinc plant | 17,504 |
|
| 18,552 |
|
| 53,063 |
|
| 52,795 |
|
|
Changes in product inventory | (2,595 | ) |
| 3,317 |
|
| 25 |
|
| (7,680 | ) |
|
Depreciation and amortization | 42,977 |
|
| 35,050 |
|
| 129,830 |
|
| 98,422 |
|
|
G&A | 12,231 |
|
| 11,552 |
|
| 37,439 |
|
| 35,619 |
|
|
Freight, royalties and other charges | 9,195 |
|
| 7,790 |
|
| 26,393 |
|
| 25,158 |
|
|
Total Manitoba cost of sales | 133,437 |
|
| 131,904 |
|
| 413,371 |
|
| 380,824 |
|
|
Cost of sales | 276,830 |
|
| 260,327 |
|
| 765,495 |
|
| 787,045 |
|
|
Total cost of sales for the third quarter of 2020 was $276.8 million, reflecting an increase of $16.5 million from the third quarter of 2019. Cost of sales related to Peru increased in the third quarter of 2020, compared to the same period of 2019, by $15.0 million. The increase is primarily the result of changes in product inventory, increased depreciation charges and increased milling costs. In Manitoba, cost of sales increased by $1.5 million, compared to the third quarter of 2019, primarily as a result of higher depreciation costs from an increase to our decommissioning and restoration assets offset by changes in product inventory.
Year-to-date, cost of sales was $765.5 million, which was $21.6 million less than the same period in 2019. The decrease is principally related to lower production costs from an eight-week suspension of Constancia operations in the second quarter of 2020. During the shut-down, an adjustment to cost of sales was recorded for $31.9 million of fixed overhead costs (cash: $15.8 million, non-cash: $16.1 million included in depreciation) that would ordinarily have been capitalized to inventories and property, plant, and equipment. In Manitoba, depreciation increased by $31.4 million as a result of increases to our decommissioning and restoration obligation assets that were recorded in the fourth quarter of 2019 and are being depreciated straight-line through to the end of the mine life in 2022.
For details on unit operating costs refer to the respective tables in the "Operations Review" section of this MD&A.
For the third quarter of 2020, other significant variances in expenses from operations, compared to the same period in 2019, include the following:
- Selling and administrative expense increased by $5.7 million compared to the same period in 2019. This increase was mainly due to higher stock-based compensation charges as a result of the relative impact of the revaluation of previously issued share units to higher share prices, partially offset by a general reduction in consulting and travel costs.
- Exploration and evaluation expenses decreased by $4.9 million compared to the third quarter of 2019, in line with the reduced 2020 exploration budget compared to 2019.
- Impairment losses decreased by $322.2 million as a result of an impairment charge recorded in the third quarter of 2019 in our investment in the Rosemont project.
For 2020 year-to-date, other significant variances in expenses from operations, compared to 2019, include the following:
- Selling and administrative expense decreased by $3.8 million compared to the same period in 2019. This decrease was mainly due to a general reduction in consulting, legal and travel costs, partially offset by higher stock-based compensation charges as a result of the relative impact of revaluation of previously issued share units to higher share prices.
- Other expenses decreased by $35.6 million due to the write down of a joint venture receivable from prior year of $26.0 million as well as the recognition of a delivery obligation related to the Pampacancha deposit from prior year of $7.5 million, neither of which reoccurred in the current year.
- Exploration and evaluation expenses decreased by $10.3 million in line with the reduced 2020 exploration budget compared to 2019.
- Impairment losses decreased by $322.2 million as a result of an impairment charge recorded in the third quarter of 2019 in our investment in the Rosemont project.
Net finance expense
(in $ thousands) |
| Three months ended | Nine months ended | |||||||
| Sep. 30, 2020 | Sep. 30, 2019 |
| Sep. 30, 2020 | Sep. 30, 2019 | |||||
|
|
|
|
|
|
| ||||
Finance costs - accrued or payable: |
|
|
|
|
|
| ||||
Interest expense on long-term debt |
| 21,738 |
| 19,584 |
|
| 61,102 |
| 58,674 |
|
Withholding taxes |
| 2,142 |
| 1,980 |
|
| 6,172 |
| 6,248 |
|
Tender premium on 7.25% senior unsecured notes |
| 7,252 |
| - |
|
| 7,252 |
| - |
|
Other accrued/payable costs (income)1 |
| 1,541 |
| 105 |
|
| 4,789 |
| 369 |
|
Total finance costs - accrued or payable |
| 32,673 |
| 21,669 |
|
| 79,315 |
| 65,291 |
|
|
|
|
|
|
|
| ||||
Finance costs - non-cash: |
|
|
|
|
|
| ||||
Accretion on streaming agreements2 |
| 10,785 |
| 15,944 |
|
| 42,816 |
| 53,827 |
|
Interest capitalized |
| - |
| (3,298) |
|
| - |
| (9,890) |
|
Change in fair value of financial assets and liabilities at fair value through profit or loss |
| (2,750 | ) | 2,072 |
|
| 8,150 |
| 212 |
|
Write off unamortized transaction costs |
| 3,817 |
| - |
|
| 3,817 |
| - |
|
Other non-cash costs3 |
| 247 |
| 1,271 |
|
| 1,536 |
| 5,943 |
|
Total finance costs - non-cash |
| 12,099 |
| 15,989 |
|
| 56,319 |
| 50,092 |
|
Net finance expense |
| 44,772 |
| 37,658 |
|
| 135,634 |
| 115,383 |
|
1 Includes interest income and other finance expense. | ||||||||||
2 Includes variable consideration adjustment (prior periods). | ||||||||||
3 Includes accretion on community agreements, unwinding of discount on provisions, and net foreign exchange losses (gains). | ||||||||||
Compared to the three months ended September 30, 2019, net finance expense increased by $7.1 million. Accrued finance costs increased by $11.0 million mostly due to a $7.3 million early redemption premium paid to holders of our Redeemed Notes. Non-cash finance costs decreased by $3.9 million primarily as a result of a net increase of $6.3 million in the market value of our investments measured through profit or loss consisting of securities in Canadian metals and mining companies as well as a $4.7 million variable consideration adjustment reducing the accretion expense on our stream arrangements. Offsetting these gains was a $3.8 million write-down of unamortized transaction costs and a $3.3 million increase in net interest charges as we no longer capitalize interest costs on the Rosemont project effective October 1, 2019, due to its delay in development.
On a year-to-date basis, net finance expense increased by $20.2 million compared to the same period in 2019 mainly for the reasons as described above and due to $16.7 million in losses from the non-cash revaluation of our gold prepayment liability measured through profit or loss.
Tax Recovery
For the three and nine months ended September 30, 2020, tax recovery decreased by $73.6 million and $40.1 million, respectively, compared to the same period in 2019. The following table provides further details:
| Three months ended |
| Nine months ended | |||||
Sep. 30, | Sep. 30, |
| Sep. 30, |
| Sep. 30, | |||
(in $ thousands) |
|
| ||||||
Deferred tax recovery - income tax 1 | (669) |
| (80,892) |
| (28,194) |
| (84,004) | |
Deferred tax (recovery) expense - mining tax 1 | (2,245) |
| 2,442 |
| (3,075) |
| 112 | |
Total deferred tax recovery | (2,914) |
| (78,450) |
| (31,269) |
| (83,892) | |
Current tax expense - income tax | 9 |
| 6,542 |
| 360 |
| 11,134 | |
Current tax expense (recovery) - mining tax | 2,916 |
| (1,573) |
| 2,899 |
| 4,704 | |
Total current tax expense | 2,925 |
| 4,969 |
| 3,259 |
| 15,838 | |
Tax expense (recovery) | 11 |
| (73,571) |
| (28,010) |
| (68,054) | |
1 Deferred tax expense (recovery) represents our draw down/increase of non-cash deferred income and mining tax assets/liabilities. | ||||||||
Income Tax Recovery
Applying the estimated Canadian statutory income tax rate of 27.0% to our loss before taxes of $180.0 million for the year-to-date period in 2020 would have resulted in a tax recovery of approximately $48.6 million; however, we recorded an income tax recovery of $27.8 million. The significant items causing our effective income tax rate to be different than the 27.0% estimated Canadian statutory income tax rate include:
- Deferred tax expense of approximately $5.5 million as certain non-monetary assets are recognized at historical cost while the tax bases of the assets change as the exchange rates fluctuates, which creates taxable temporary differences.
- Certain deductible temporary differences mostly with respect to Peru, and mostly relating to the decommissioning and restoration liabilities, were not recognized as we have determined that it is not probable that we will realize the recovery of these deferred tax assets based on the timing of the reversals of the deductible temporary differences and the future projected taxable profit of the Peruvian operations. This has resulted in deferred tax expense of $7.9 million.
- Certain deductible temporary differences with respect to Manitoba, and mostly relating to the decommissioning and restoration liabilities, were not recognized as we have determined that it is not probable that we will realize the recovery of these deferred tax assets based on the timing of the reversals of the deductible temporary differences and the future projected taxable profit of the Manitoba operations. Adjusted for the average annual effective tax rate methodology, this resulted in deferred tax expense of $4.5 million.
- Certain deductible temporary differences with respect to our foreign operations are recorded using an income tax rate other than the Canadian statutory income tax rate of 27%, resulting in a deferred tax expense of $4.3 million.
- Certain foreign exchange gains and other items are not taxable for local income tax purposes and therefore result in a deferred tax recovery of approximately $1.5 million.
Mining Tax Recovery
Applying the estimated Manitoba mining tax rate of 10.0% to our loss before taxes of $180.0 million for the year-to-date period in 2020 would have resulted in a tax recovery of approximately $18.0 million; however, we recorded a mining tax recovery of $0.2 million. Effective mining tax rates can vary significantly based on the composition of our earnings and the expected amount of mining taxable profits. Corporate costs and other costs not related to mining operations are not deductible in computing mining profits. A brief description of how mining taxes are calculated in our various business units is discussed below.
Manitoba
The Province of Manitoba imposes mining tax on profit related to the sale of mineral products mined in the Province of Manitoba (mining taxable profit) at the following rates:
- 10% of total mining taxable profit if mining profit is C$50 million or less;
- 15% of total mining taxable profit if mining profits are between C$55 million and C$100 million; and
- 17% of total mining taxable profit if mining profits exceed C$105 million.
We estimate that the tax rate that will be applicable when temporary differences reverse will be approximately 10.0%.
Peru
The Peruvian government imposes two parallel mining tax regimes, the Special Mining Tax and the Modified Royalty, on companies' operating mining income on a sliding scale, with progressive rates ranging from 2.0% to 8.4% and 1.0% to 12.0%, respectively. Based on financial forecasts, we have recorded a deferred tax liability as at September 30, 2020, at the tax rate we expect to apply when temporary differences reverse.
LIQUIDITY AND CAPITAL RESOURCES
Senior Unsecured Notes Refinancing
On September 23, 2020, we completed the offering of $600.0 million aggregate principal amount of 6.125% senior notes due April 2029. The New Notes are governed by an indenture, dated as of September 23, 2020, among the Company, the subsidiaries of the Company party thereto as guarantors and U.S. Bank National Association, as trustee.
The proceeds from this offering were primarily used to redeem all $400.0 million of our outstanding 7.250% Redeemed Notes, including the payment of accrued and unpaid interest and a call premium of $7.3 million, and to pay transaction costs associated with the New Notes.
Senior Secured Revolving Credit Facilities
On August 31, 2020, we completed an amendment to our senior secured revolving credit facilities (the "Credit Facilities"). As a result of the amendment, the total available borrowings under the Credit Facilities has decreased to $400.0 million from $550.0 million to reflect our anticipated business requirements until June 2022 when the Credit Facilities mature. We also revised various financial covenants as follows:
- Maintaining net debt to EBITDA ratio of less than:
• 5.25:1 from September 30, 2020 to December 31, 2021; and,
• 3.50:1 from January 1, 2022 to maturity.
- Maintaining an interest coverage ratio of greater than:
• 2.50:1 from September 30, 2020 to December 31, 2021; and,
• 3.00:1 from January 1, 2022 to maturity.
- Maintaining a minimum liquidity of greater than $50 million to December 31, 2021.
The EBITDA calculation for the purposes of the covenants may differ from the non-IFRS measure of adjusted EBITDA shown in this MD&A. As at September 30, 2020, our liquidity includes $449.0 million in cash and cash equivalents as well as undrawn availability of $291.4 million under our Credit Facilities. As at September 30, 2020, we are in compliance with our covenants under the Credit Facilities and have drawn $108.6 million in letters of credit under the Credit Facilities.
As at September 30, 2020, the Arizona business unit had $8.6 million in surety bonds and the Peru business unit had $20.0 million in surety bonds issued to support future reclamation and closure obligations. The Peru business unit also had $45.0 million in letters of credit issued with various Peruvian financial institutions. No cash collateral is required to be posted under these letters of credit or surety bonds.
Financial Condition
Financial Condition as at September 30, 2020 compared to December 31, 2019
Cash and cash equivalents increased by $52.9 million during the first nine months of the year to $449.0 million as at September 30, 2020. This increase was mainly the result of cash flow from operating activities of $118.4 million, $115.0 million of proceeds from the gold prepay transaction and approximately $191.8 million in net proceeds raised from our New Notes offering. Offsetting these cash inflows was $243.3 million of capital investments primarily at our Peru and Manitoba operations, interest payments of $81.5 million, other leasing and financing costs of $39.0 million, a $7.3 million premium paid to redeem our 2023 Notes and paid dividends of $3.8 million. We hold the majority of our cash and cash equivalents in low-risk, liquid investments with major Canadian and Peruvian financial institutions.
Working capital increased by $132.2 million to $403.4 million from December 31, 2019 to September 30, 2020, primarily due to the cash and cash equivalent increase of $52.9 million, a decrease in our trade and other payables of $35.2 million arising mainly from timing of interest payments on our senior unsecured notes, an increase of $23.0 in accounts receivable due to timing of cash receipts, a reduction of the current portion of deferred revenue by $13.6 million based on changes in expected future stream deliveries, and a decrease in other current financial liabilities of $9.5 million mainly as a result of a reduction in the fair value of certain provisionally priced sales receivables and other embedded derivatives.
Cash Flows
The following table summarizes our cash flows for the three and nine months ended September 30, 2020 and September 30, 2019:
(in $ thousands) |
| Three months ended |
| Nine months ended | |||||
| Sep. 30, |
| Sep. 30, |
| Sep. 30, |
| Sep. 30, | ||
Operating cash flow before changes in non-cash working capital |
| 84,383 |
| 71,204 |
| 155,792 |
| 238,143 | |
Change in non-cash working capital |
| (6,448) |
| (27,721) |
| (37,402) |
| (25,953) | |
Cash generated from operating activities |
| 77,935 |
| 43,483 |
| 118,390 |
| 212,190 | |
Cash (used in) generated by investing activities |
| (144,164) |
| (75,535) |
| (241,520) |
| (205,679) | |
Cash generated by (used in) financing activities |
| 124,845 |
| (59,050) |
| 175,285 |
| (123,392) | |
Effect of movement in exchange rates on cash and cash equivalents |
| (738) |
| 13 |
|
| 713 |
| (178) |
Increase (decrease) in cash and cash equivalents |
| 57,878 |
| (91,089) |
| 52,868 |
| (117,059) | |
Cash Flow from Operating Activities
Cash generated from operating activities was $77.9 million during the third quarter of 2020, an increase of $34.5 million compared with the same period in 2019. Operating cash flow before change in non-cash working capital was $84.4 million during the third quarter of 2020, reflecting an increase of $13.2 million compared to the third quarter of 2019. The increase in operating cash flow is primarily the result of higher realized copper and precious metals prices and higher gold sales volume. This was partially offset by lower sales volumes of copper and zinc compared to the third quarter of 2019.
Year-to-date cash generated from operating activities was $118.4 million, representing a decrease of $93.8 million compared to the same period in 2019. Operating cash flow before change in non-cash working capital was $155.8 million during the first nine months of 2020, compared to $238.1 million during the same period in 2019. The year-to-date decrease in operating cash flow is due to significantly lower copper sales volumes in Peru as a result of an eight-week suspension of Constancia operations in the second quarter and lower copper grades as well as lower realized base metal prices and silver sales volumes. This was partially offset by higher realized gold prices.
Cash Flow from Investing and Financing Activities
During the third quarter of 2020, we used $19.3 million in investing and financing activities, primarily driven by $144.5 million of capital expenditures, interest payments of $44.1 million, capitalized lease payments of $9.4 million and other financing payments of $11.5 million. Offsetting these payments was net proceeds of $191.8 million from our New Notes offering, net of transaction costs.
Year-to-date, we used $66.2 million in investing and financing activities, composed primarily of $243.3 million of capital investments, interest payments of $81.5 million, capitalized lease payments of $26.6 million and other financing payments of $19.6 million, partially offset by net proceeds of $191.8 million from our New Notes offering, and $115.0 million of proceeds from the gold prepay transaction.
Capital Expenditures
The following summarizes accrued and cash additions to capital assets for the periods indicated:
| Three months ended | Nine months ended | Guidance | ||||||
Sep. 30, | Sep. 30, | Sep. 30, | Sep. 30, | Annual | |||||
(in $ millions) | 2020 1 | ||||||||
Manitoba sustaining capital expenditures | 23.3 |
| 44.5 |
| 74.3 |
| 95.7 |
| 100.0 |
Peru sustaining capital expenditures 2 | 35.0 |
| 25.0 |
| 54.2 |
| 53.5 |
| 80.0 |
Total sustaining capital expenditures | 58.3 |
| 69.5 |
| 128.5 |
| 149.2 |
| 180.0 |
Arizona capitalized costs | 2.0 |
| 16.0 |
| 9.7 |
| 29.4 |
| 20.0 |
Peru growth capitalized expenditures 3 | 25.7 |
| 0.3 |
| 95.9 |
| 0.9 |
| 70.0 |
Manitoba growth capitalized expenditures | 15.7 |
| 3.7 |
| 30.4 |
| 6.9 |
| 80.0 |
Other capitalized costs 4 | (6.5 | ) | 18.1 |
| 53.3 |
| 41.6 |
|
|
Capitalized exploration | 1.0 |
| 4.8 |
| 3.3 |
| 6.8 |
| 15.0 |
Capitalized interest | - |
| 3.3 |
| - |
| 9.9 |
|
|
Total other capitalized costs | 37.9 |
| 46.2 |
| 192.6 |
| 95.5 |
|
|
Total capital additions | 96.2 |
| 115.7 |
| 321.1 |
| 244.7 |
|
|
Reconciliation to cash capital additions: |
|
|
|
|
| ||||
Decommissioning and restoration obligation | 7.7 |
| (16.4 | ) | (50.8 | ) | (42.8 | ) |
|
Capitalized interest | - |
| (3.3 | ) | - |
| (9.9 | ) |
|
Right-of-use asset additions | (10.2 | ) | (15.2 | ) | (17.4 | ) | (19.8 | ) |
|
Change in community agreement accruals | 55.3 |
| - |
| (7.1 | ) | - |
|
|
Change in capital accruals and other | (4.5 | ) | (2.7 | ) | (2.5 | ) | (1.8 | ) |
|
Total cash capital additions | 144.5 |
| 78.1 |
| 243.3 |
| 170.4 |
|
|
1 Reflects Manitoba guidance issued February 20, 2020 and updated Peru guidance issued August 11, 2020. | |||||||||
2 Peru sustaining capital expenditures includes capitalized stripping costs. | |||||||||
3 Hudbay's initial growth capital guidance for Peru of $70 million did not include the cost of the individual land user agreements due to the ongoing nature of the negotiations and, as indicated by accrued expenditures to date, full year growth capital spending for Peru will exceed that initial guidance once all land user agreements are concluded. | |||||||||
4 Other capitalized costs include decommissioning and restoration adjustments. | |||||||||
Sustaining capital expenditures in Manitoba for the three and nine months ended September 30, 2020 were $23.3 million and $74.3 million respectively, representing a decrease of $21.2 million and a decrease of $21.4 million compared to the same period in 2019. The decrease is due to a reduction in capital development at the 777 mine as it nears the end of its mine life in 2022.
Sustaining capital expenditures in Peru for the three and nine months ended September 30, 2020 were $35.0 million and $54.2 million respectively, representing increases of $10.0 million and $0.7 million, respectively, from the same period in 2019. The increase in Peru sustaining capital expenditures compared to the same period last year was mainly due to the shifting of costs from the second quarter to the third quarter due to a temporary suspension of operations at Constancia earlier this year. Increased expenditures in the current quarter primarily relate to additions to in mine and plant equipment capitalized leases.
We expect consolidated sustaining capital expenditures in 2020 to be in line with full year guidance.
Year-to-date Peru growth capital of $95.9 million includes the recognition of future spending obligations arising from the execution of the surface rights agreement with the local community and agreements related to current uses of the land by certain community members. During the first nine months of 2020, we made payments of approximately $84.3 million, representing the majority of expenditures under these agreements. As previously disclosed, the company's initial growth capital guidance for Peru of $70.0 million did not include the cost of the individual land user agreements due to the ongoing nature of the negotiations and, as indicated by accrued expenditures to date, full year growth capital spending for Peru will exceed that initial guidance once all land user agreements are concluded.
Year-to-date Manitoba growth capital of $30.4 million includes spending for the New Britannia refurbishment project which includes construction of the new copper flotation building and construction of a pipeline between the New Britannia and Stall mills. The project is currently approximately 64% complete and is tracking ahead of schedule while remaining on budget. Full year growth capital spending for Manitoba is expected to be lower than guidance as some anticipated 2020 capital spend is forecast to be incurred in 2021.
Other capitalized costs for the three and nine months ended September 30, 2020 were negative $6.5 million and $53.3 million, respectively, and relate primarily to the remeasurement of previously recognized decommissioning and restoration liabilities at our Peru and Manitoba operations.
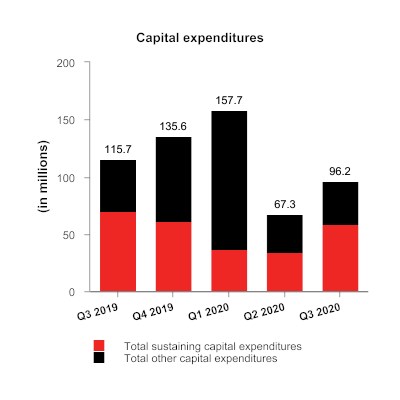
Capital Commitments
As at September 30, 2020, we had outstanding capital commitments in Canada of approximately $42.9 million of which $37.7 million can be terminated, approximately $34.7 million in Peru primarily related to exploration option agreements, all of which can be terminated, and approximately $179.8 million in Arizona, primarily related to our Rosemont project, of which approximately $89.2 million can be terminated.
Contractual Obligations
The following table summarizes our significant contractual obligations as at September 30, 2020:
| Less than | 13 - 36 | 37 - 60 | More than | ||||||
Payment Schedule (in $ millions) | Total | |||||||||
Long-term debt obligations1 | 1,728.1 |
| 69.5 |
| 169.5 |
| 742.1 |
| 747.0 |
|
Gold prepayment obligation3 | 132.0 |
| - |
| 116.4 |
| 15.6 |
| - |
|
Lease obligations | 146.0 |
| 96.4 |
| 42.8 |
| 2.5 |
| 4.3 |
|
Purchase obligation - capital commitments | 257.4 |
| 58.3 |
| 24.5 |
| 27.4 |
| 147.2 |
|
Purchase obligation - other commitments2 | 912.4 |
| 366.8 |
| 322.0 |
| 166.6 |
| 57.0 |
|
Pension and other employee future benefits obligations3 | 205.6 |
| 20.1 |
| 34.7 |
| 9.4 |
| 141.4 |
|
Community agreement obligations | 59.9 |
| 11.5 |
| 9.9 |
| 7.0 |
| 31.5 |
|
Decommissioning and restoration obligations4 | 261.6 |
| 21.7 |
| 27.8 |
| 5.7 |
| 206.4 |
|
Total | 3,703.0 |
| 644.3 |
| 747.6 |
| 976.3 |
| 1,334.8 |
|
1 Long-term debt obligations include scheduled interest payments, as well as principal repayments. | ||||||||||
2 Primarily made up of long-term agreements with operational suppliers, obligations for power purchase, Pampacancha delivery obligation, concentrate handling, fleet and port services, as well as deferred consideration arising from the acquisition of Rosemont's minority interest. | ||||||||||
3 Discounted. | ||||||||||
4 Undiscounted before inflation. | ||||||||||
In addition to the contractual obligations included in the above payment schedule, we also have the following commitments which impact our financial position:
- A profit-sharing plan with most Manitoba employees;
- A profit-sharing plan with all Peru employees;
- Wheaton precious metals stream agreements for the 777 mine and Constancia mines;
- A net smelter returns royalty agreement related to the 777 mine; and,
- Government royalty payments related to the Constancia mine.
Outstanding Share Data
As of November 2, 2020, there were 261,272,151 common shares of Hudbay issued and outstanding. In addition, there were 1,567,593 stock options outstanding.
TREND ANALYSIS AND QUARTERLY REVIEW
A detailed quarterly and annual summary of financial and operating performance can be found in the "Summary of Results" section at the end of this MD&A. The following table sets forth selected consolidated financial information for each of our eight most recently completed quarters:
|
| 2020 |
| 2019 |
| 2018 | ||||||
|
| |||||||||||
(in $ millions) |
| Q3 | Q2 | Q1 |
| Q4 | Q3 |
| Q2 | Q1 |
| Q4 |
Revenue |
| 316.1 | 208.9 | 245.1 |
| 324.5 | 291.3 |
| 329.4 | 292.3 |
| 351.8 |
Gross margin |
| 39.3 | (12.7) | (22.0) |
| 25.6 | 31.0 |
| 43.1 | 51.8 |
| 75.2 |
(Loss) profit before tax |
| (23.9) | (74.6) | (81.5) |
| (42.4) | (348.4) |
| (43.9) | (18.1) |
| 17.7 |
(Loss) profit |
| (24.0) | (51.9) | (76.1) |
| (1.5) | (274.8) |
| (54.1) | (13.4) |
| (3.5) |
Adjusted net (loss) earnings1 |
| (25.4) | (39.7) | (39.4) |
| (24.6) | (23.2) |
| (8.1) | 7.3 |
| 13.3 |
(Loss) earnings per share: |
|
|
|
|
|
|
|
|
|
|
|
|
Basic and Diluted |
| (0.09) | (0.20) | (0.29) |
| (0.01) | (1.05) |
| (0.21) | (0.05) |
| (0.01) |
Adjusted net (loss) earnings1 per share |
| (0.10) | (0.15) | (0.15) |
| (0.09) | (0.09) |
| (0.03) | 0.03 |
| 0.05 |
Operating cash flow2 |
| 84.4 | 29.5 | 42.0 |
| 69.1 | 71.2 |
| 81.3 | 85.7 |
| 104.3 |
Adjusted EBITDA1 |
| 96.1 | 49.1 | 55.0 |
| 82.2 | 76.2 |
| 95.9 | 104.2 |
| 120.7 |
1 Adjusted net (loss) earnings, adjusted net (loss) earnings per share, and adjusted EBITDA are non-IFRS financial performance measure with no standardized definition under IFRS. For further information and a detailed reconciliation, please see the discussion under the "Non-IFRS Financial Reporting Measures" section of this MD&A. | ||||||||||||
2 Operating cash flow before changes in non-cash working capital. | ||||||||||||
During the third quarter of 2020, our business was able to adapt to the global impact of the evolving COVID-19 pandemic. We benefited from increasing commodity prices and consistent, uninterrupted operations in Manitoba and Peru while adhering to established health and safety protocols. During the quarter, we redeemed our 2023 senior unsecured notes and issued new senior unsecured notes maturing in 2029 raising incremental gross proceeds of $200 million. Our third quarter results were impacted by a $7.3 million premium paid to redeem the 2023 notes as well as a $3.8 million write-down of unamortized transaction costs offset by an after-tax non-cash adjustment of $9.0 million on our streaming revenues.
Due to the temporary suspension of operations at Constancia throughout April and into mid-May 2020, we had lower second quarter production and sales volumes and higher production costs by $25.6 million as a result of the immediate recognition of fixed overhead production costs incurred during the suspension. The first quarter results were less impacted by the shutdown and reflected $6.3 million of shutdown-related production costs as well as an inventory write-down of $10.4 million triggered by lower copper prices.
In 2019, the lower realized prices for copper and zinc, combined with a trend towards lower copper grades in the Constancia mine plan and the closure of the Reed copper mine in August 2018 resulted in lower revenues and gross margin, despite the lower Constancia grades being partially offset by higher mill throughput and recoveries. Earnings in 2019 were also impacted by an after-tax impairment charge of $242.1 million in the third quarter of 2019, as well as a UCM receivable write down of $26.0 million in the second quarter of 2019. In the first quarter of 2019, pre-tax revenue and finance expenses were negatively impacted by a $22.3 million charge due to a deferred revenue adjustment arising from higher net mineral reserves and resources.
NON-IFRS FINANCIAL PERFORMANCE MEASURES
Adjusted net earnings (loss), adjusted net earnings (loss) per share, adjusted EBITDA, net debt, cash cost, sustaining and all-in sustaining cash cost per pound of copper produced, cash cost and sustaining cash cost per pound of zinc produced and combined unit cost and zinc plant unit cost are non-IFRS performance measures. These measures do not have a meaning prescribed by IFRS and are therefore unlikely to be comparable to similar measures presented by other issuers. These measures should not be considered in isolation or as a substitute for measures prepared in accordance with IFRS and are not necessarily indicative of operating profit or cash flow from operations as determined under IFRS. Other companies may calculate these measures differently.
Management believes adjusted net earnings (loss) and adjusted net earnings (loss) per share better reflect the Company's performance for the current period and are better indications of its expected performance in future periods. These measures are used internally by the Company to evaluate the performance of its underlying operations and to assist with its planning and forecasting of future operating results. As such, the Company believes these measures are useful to investors in assessing the Company's underlying performance. We provide adjusted EBITDA to help users analyze our results and to provide additional information about our ongoing cash generating potential in order to assess our capacity to service and repay debt, carry out investments and cover working capital needs. Net debt is shown because it is a performance measure used by the Company to assess our financial position. Cash cost, sustaining and all-in sustaining cash cost per pound of copper produced are shown because we believe they help investors and management assess the performance of our operations, including the margin generated by the operations and the Company. Cash cost and sustaining cash cost per pound of zinc produced are shown because we believe they help investors and management assess the performance of our Manitoba operations. Combined unit cost and zinc plant unit cost is shown because we believe they help investors and management assess our cost structure and margins that are not impacted by variability in by-product commodity prices.
In the first half of 2020, a government-imposed shutdown of non-essential businesses led to a temporary suspension of our Constancia mining operations. As such, fixed overhead production costs incurred during the suspension were directly charged to cost of sales. These costs did not contribute to production of inventory and were therefore excluded from the calculations of adjusted net earnings (loss), adjusted EBITDA and cash costs.
Adjusted Net Earnings (Loss)
Adjusted net earnings (loss) represents net earnings (loss) excluding certain impacts, net of taxes, such as changes in estimates of asset retirement obligations at closed sites, mark-to-market adjustments, impairment charges and reversal of impairment charges, write-down of assets, and foreign exchange (gain) loss. These measures are not necessarily indicative of net earnings (loss) or cash flows as determined under IFRS.
The following table provides a reconciliation of earnings (loss) per the consolidated interim income statements, to adjusted net earnings (loss) for the three and nine months ended September 30, 2020 and 2019.
| Three months ended |
| Nine months ended | |||||||
(in $ millions) | Sep. 30, | Sep. 30, |
| Sep. 30, |
| Sep. 30, | ||||
Loss for the period | (24.0 | ) | (274.8 | ) |
| (152.0 | ) |
| (342.4 | ) |
Tax expense (recovery) | 0.1 |
| (73.6 | ) |
| (28.0 | ) |
| (68.0 | ) |
Loss before tax | (23.9 | ) | (348.4 | ) |
| (180.0 | ) |
| (410.4 | ) |
Adjusting items: |
|
|
|
|
|
| ||||
Mark-to-market adjustments1 | 1.9 |
| (0.8 | ) |
| 13.7 |
|
| 0.8 |
|
Rosemont impairment | - |
| 322.2 |
|
| - |
|
| 322.2 |
|
Peru inventory write-down | - |
| - |
|
| 2.2 |
|
| - |
|
Peru cost of sales direct charge from temporary shutdown | - |
| - |
|
| 31.9 |
|
| - |
|
Write down of UCM receivable | - |
| - |
|
| - |
|
| 26.0 |
|
Costs associated with proxy contest | - |
| - |
|
| - |
|
| 3.0 |
|
Variable consideration adjustment - stream revenue | (14.1 | ) | - |
|
| (10.4 | ) |
| 22.3 |
|
Pampacancha delivery obligation | - |
| - |
|
| - |
|
| 7.5 |
|
Foreign exchange gain | (1.2 | ) | (0.1 | ) |
| (4.2 | ) |
| 1.7 |
|
Write-down of unamortized transaction costs | 3.8 |
| - |
|
| 3.8 |
|
| - |
|
Premium paid on redemption of notes | 7.3 |
| - |
|
| 7.3 |
|
| - |
|
Adjusted loss before income taxes | (26.2 | ) | (27.1 | ) |
| (135.7 | ) |
| (26.9 | ) |
Tax expense (recovery) | (0.1 | ) | 73.6 |
|
| 28.0 |
|
| 68.0 |
|
Tax impact of adjusting items | 0.1 |
| (78.9 | ) |
| (14.2 | ) |
| (86.2 | ) |
Dividend withholding tax | - |
| 6.9 |
|
| - |
|
| 6.9 |
|
Non-cash deferred tax adjustments | 0.8 |
| 2.2 |
|
| 17.9 |
|
| 14.1 |
|
|
|
|
|
|
|
| ||||
Adjusted net loss | (25.4 | ) | (23.3 | ) |
| (104.0 | ) |
| (24.1 | ) |
Adjusted net loss ($/share) | (0.10 | ) | (0.09 | ) |
| (0.40 | ) |
| (0.09 | ) |
Basic weighted average number of common shares outstanding (millions) | 261.3 |
| 261.3 |
|
| 261.3 |
|
| 261.3 |
|
1 Includes changes in fair value of financial assets and liabilities at fair value through profit or loss and share-based compensation expenses. | ||||||||||
After adjusting reported net loss for those items not considered representative of the Company's core business or indicative of future operations, the Company had an adjusted net loss in the third quarter 2020 of $25.4 million or $0.10 loss per share.
Adjusted EBITDA
Adjusted EBITDA is profit or loss before net finance expense/income, tax expense/recoveries, depreciation and amortization of property, plant and equipment and deferred revenue, as well as certain other adjustments. We calculate adjusted EBITDA by excluding certain adjustments included within our adjusted net earnings measure which we believe reflects the underlying performance of our core operating activities. The measure also removes the impact of non-cash items and financing costs that are not associated with measuring the underlying performance of our operations. However, our adjusted EBITDA is not the measure defined as EBITDA under our senior notes or revolving credit facilities and may not be comparable with performance measures with the same name reported by other companies. Adjusted EBITDA should not be considered as a substitute for profit or loss or as a better measure of liquidity than operating cash flow, which are calculated in accordance with IFRS. We provide adjusted EBITDA to help users analyze our results and to provide additional information about our ongoing cash generating potential in order to assess our capacity to service and repay debt, carry out investments and cover working capital needs.
The following table presents the reconciliation of earnings (loss) per the consolidated interim income statements, to adjusted EBITDA for the three and nine months ended September 30, 2020 and 2019:
| Three months ended |
| Nine months ended | |||||||||
(in $ millions) | Sep. 30, | Sep. 30, | Sep. 30, | Sep. 30, | ||||||||
Loss for the period | (24.0 | ) |
| (274.8 | ) |
| (152.0 | ) |
| (342.4 | ) |
|
|
|
|
|
|
|
|
|
| ||||
Add back: tax expense (recovery) | 0.1 |
|
| (73.6 | ) |
| (28.0 | ) |
| (68.0 | ) |
|
Add back: Net finance expense | 44.8 |
|
| 37.7 |
|
| 135.6 |
|
| 115.4 |
|
|
Add back: Other expenses | 4.8 |
|
| 6.6 |
|
| 11.6 |
|
| 47.2 |
|
|
Add back: Depreciation and amortization1 | 96.0 |
|
| 82.3 |
|
| 263.2 |
|
| 250.6 |
|
|
Less: Amortization of deferred revenue and variable consideration adjustment | (30.2 | ) |
| (21.4 | ) |
| (53.8 | ) |
| (52.2 | ) |
|
| 91.5 |
|
| (243.2 | ) |
| 176.6 |
|
| (49.4 | ) |
|
Adjusting items (pre-tax): |
|
|
|
|
|
| ||||||
Peru inventory write-down | - |
|
| - |
|
| 2.2 |
|
| - |
|
|
Cash portion of Peru cost of sales direct charge from temporary shutdown | - |
|
| - |
|
| 15.8 |
|
| - |
|
|
Costs associated with proxy contest | - |
|
| - |
|
| - |
|
| 3.0 |
|
|
Share-based compensation expenses (recoveries)2 | 4.6 |
|
| (2.8) |
|
| 5.5 |
|
| 0.4 |
|
|
Rosemont impairment | - |
|
| 322.2 |
|
| - |
|
| 322.2 |
|
|
Adjusted EBITDA | 96.1 |
|
| 76.2 |
|
| 200.1 |
|
| 276.2 |
|
|
1 Includes the non-cash portion of the Peru cost of sales direct charge from the temporary shutdown of $16.1 million for the nine months ended September 30, 2020. | ||||||||||||
2 Share-based compensation expenses (recoveries) reflected in cost of sales and selling and administrative expenses. |
| |||||||||||
Net Debt
The following table presents our calculation of net debt as at September 30, 2020 and December 31, 2019:
| |||||
(in $ thousands) | Sep. 30, |
| Dec. 31, | ||
Total long-term debt as per IFRS financial statements | 1,175,104 |
|
| 985,255 |
|
Cash and cash equivalents as per IFRS financial statements | (449,014 | ) |
| (396,146 | ) |
Net debt | 726,090 |
|
| 589,109 |
|
Cash Cost, Sustaining and All-in Sustaining Cash Cost (Copper Basis)
Cash cost per pound of copper produced ("cash cost") is a non-IFRS measure that management uses as a key performance indicator to assess the performance of our operations. Our calculation designates copper as our primary metal of production as it has been the largest component of revenues. The calculation is presented in four manners:
- Cash cost, before by-product credits - This measure is gross of by-product revenues and is a function of the efforts and costs incurred to mine and process all ore mined. However, the measure divides this aggregate cost over only pounds of copper produced, our primary metal of production. This measure is generally less volatile from period to period, as it is not affected by changes in the price received for by-product metals. It is, however, significantly affected by the relative mix of copper concentrate and finished zinc production, where the sale of the zinc will occur later, and an increase in production of zinc metal will tend to result in an increase in cash cost under this measure.
- Cash cost, net of by-product credits - In order to calculate the net cost to produce and sell copper, the net of by-product credits measure subtracts the revenues realized from the sale of the metals other than copper. The by-product revenues from zinc, gold, and silver are significant and are integral to the economics of our operations. The economics that support our decision to produce and sell copper would be different if we did not receive revenues from the other significant metals being extracted and processed. This measure provides management and investors with an indication of the minimum copper price consistent with positive operating margins, assuming realized by-product metal prices are consistent with those prevailing during the reporting period. It also serves as an important operating statistic that management and investors utilize to measure our operating performance versus that of our competitors. However, it is important to understand that if by-product metal prices decline alongside copper prices, the cash cost net of by-product credits would increase, requiring a higher copper price than that reported to maintain positive cash flows and operating margins.
- Sustaining cash cost, net of by-product credits - This measure is an extension of cash cost that includes cash sustaining capital expenditures, including payments on capitalized leases, capitalized sustaining exploration, net smelter returns royalties, payments on certain long-term community agreements, as well as accretion and amortization for expected decommissioning activities for producing assets. It does not include corporate selling and administrative expenses. It provides a more fulsome measurement of the cost of sustaining production than cash cost, which is focused on operating costs only.
- All-in sustaining cash cost, net of by-product credits - This measure is an extension of sustaining cash cost that includes corporate G&A, regional costs, accretion and amortization for community agreements relating to current operations, and accretion for expected decommissioning activities for non-producing assets. Due to the inclusion of corporate selling and administrative expenses, all-in sustaining cash cost is presented on a consolidated basis only.
Effective September 30, 2020 and for all comparably disclosed periods, we have included the period's deferred revenue amortization as a by-product credit to reflect the net cost of producing and selling the period's precious metals under our streaming arrangements as we believe doing so allows management and our investors to better evaluate the operating performance of the underlying operations. The variable consideration adjustment required under IFRS 15 related to prior periods is not included as a by-product credit in the current period and hence is disclosed as an adjustment in the non-IFRS cash cost measure reconciliation.
The tables below present a detailed build-up of cash cost and sustaining cash cost, net of by-product credits, by business unit in addition to consolidated all-in sustaining cash cost, net of by-product credits, and reconciliations between cash cost, net of by-product credits, to the most comparable IFRS measures of cost of sales for the three and nine months ended September 30, 2020 and 2019. Cash cost, net of by-product credits may not calculate exactly based on amounts presented in the tables below due to rounding.
Consolidated |
| Three months ended |
| Nine months ended | ||||
Net pounds of copper produced |
|
|
|
| ||||
(in thousands) |
| Sep. 30, 2020 |
| Sep. 30, 2019 |
| Sep. 30, 2020 |
| Sep. 30, 2019 |
Peru |
| 45,862 |
| 68,544 |
| 113,750 |
| 192,167 |
Manitoba |
| 10,124 |
| 11,753 |
| 36,286 |
| 38,781 |
Net pounds of copper produced |
| 55,986 |
| 80,297 |
| 150,036 |
| 230,948 |
Consolidated |
| Three months ended |
| Nine months ended | ||||||||||||
|
| Sep. 30, 2020 |
| Sep. 30, 2019 |
| Sep. 30, 2020 |
| Sep. 30, 2019 | ||||||||
Cash cost per pound of copper produced |
| $000s |
| $/lb |
| $000s |
| $/lb |
| $000s |
| $/lb |
| $000s |
| $/lb |
Cash cost, before by-product credits |
| 188,699 |
| 3.37 |
| 196,889 |
| 2.46 |
| 513,225 |
| 3.42 |
| 606,515 |
| 2.63 |
By-product credits |
| (152,403) |
| (2.72) |
| (139,930) |
| (1.75) |
| (412,235) |
| (2.75) |
| (418,058) |
| (1.81) |
Cash cost, net of by-product credits |
| 36,296 |
| 0.65 |
| 56,959 |
| 0.71 |
| 100,990 |
| 0.67 |
| 188,457 |
| 0.82 |
Consolidated |
| Three months ended |
| Nine months ended | ||||||||||||||
|
| Sep. 30, 2020 |
| Sep. 30, 2019 |
| Sep. 30, 2020 |
| Sep. 30, 2019 | ||||||||||
Supplementary cash cost information |
| $000s |
| $/lb 1 |
| $000s |
| $/lb 1 |
| $000s |
| $/lb 1 |
| $000s |
| $/lb 1 | ||
By-product credits2: |
|
|
|
|
|
|
|
|
|
|
|
|
|
|
|
| ||
Zinc |
| 66,918 |
| 1.20 |
| 74,321 |
| 0.93 |
| 187,512 |
| 1.25 |
| 213,034 |
| 0.92 | ||
Gold 3 |
| 58,093 |
| 1.04 |
| 37,202 |
| 0.46 |
| 158,235 |
| 1.05 |
| 111,685 |
| 0.48 | ||
Silver 3 |
| 19,656 |
| 0.35 |
| 19,116 |
| 0.24 |
| 46,718 |
| 0.31 |
| 63,803 |
| 0.28 | ||
Molybdenum & other |
| 7,736 |
| 0.14 |
| 9,291 |
| 0.12 |
| 19,770 |
| 0.13 |
| 29,536 |
| 0.13 | ||
Total by-product credits |
| 152,403 |
| 2.72 |
| 139,930 |
| 1.75 |
| 412,235 |
| 2.75 |
| 418,058 |
| 1.81 | ||
Reconciliation to IFRS: |
|
|
|
|
|
|
|
|
|
|
|
|
|
|
|
| ||
Cash cost, net of by-product credits |
| 36,296 |
|
|
| 56,959 |
|
|
| 100,990 |
|
|
| 188,457 |
|
| ||
By-product credits |
| 152,403 |
|
|
| 139,930 |
|
|
| 412,235 |
|
|
| 418,058 |
|
| ||
Treatment and refining charges |
| (15,006) |
|
|
| (20,221) |
|
|
| (42,165) |
|
|
| (62,303) |
|
| ||
Share-based compensation expense |
| 411 |
|
|
| (173) |
|
|
| 480 |
|
|
| 192 |
|
| ||
Inventory adjustments |
| - |
|
|
| 385 |
|
|
|
| 2,221 |
|
|
| 604 |
|
| |
Change in product inventory |
| 2,229 |
|
|
| (1,758) |
|
|
| 2,691 |
|
|
| (18,403) |
|
| ||
Royalties |
| 4,499 |
|
|
| 2,919 |
|
|
| 9,989 |
|
|
| 9,830 |
|
| ||
Overhead costs related to suspension of activities (cash) |
| - |
|
|
| - |
|
|
|
| 15,810 |
|
|
| - |
|
|
|
Depreciation and amortization4 |
| 95,998 |
|
|
| 82,286 |
|
|
| 263,244 |
|
|
| 250,610 |
|
| ||
Cost of sales5 |
| 276,830 |
|
|
| 260,327 |
|
|
| 765,495 |
|
|
| 787,045 |
|
| ||
1 Per pound of copper produced. | ||||||||||||||||||
2 By-product credits are computed as revenue per financial statements, amortization of deferred revenue and pricing and volume adjustments. For more information please see the realized price reconciliation table on page 27 for these figures. | ||||||||||||||||||
3 Gold and silver by-product credits do not include variable consideration adjustments with respect to stream arrangements. Variable consideration adjustments are cumulative adjustments to gold and silver stream deferred revenue primarily associated with the net change in mineral reserves and resources or amendments to the mine plan that would change the total expected deliverable ounces under the precious metal streaming arrangement. For the three and nine months ended September 30, 2020 the variable consideration adjustments amounted to revenue of $9,482 and $6,668, respectively. For the three and nine months ended September 30, 2019 - $nil and an expense of $16,295. | ||||||||||||||||||
4 Depreciation is based on concentrate sold. | ||||||||||||||||||
5 As per IFRS financial statements. | ||||||||||||||||||
Peru |
| Three months ended |
| Nine months ended | ||||
(in thousands) |
| Sep. 30, 2020 |
| Sep. 30, 2019 |
| Sep. 30, 2020 |
| Sep. 30, 2019 |
Net pounds of copper produced1 |
| 45,862 |
| 68,544 |
| 113,750 |
| 192,167 |
1 Contained copper in concentrate. | ||||||||
Peru |
| Three months ended |
| Nine months ended | ||||||||||||
|
| Sep. 30, 2020 |
| Sep. 30, 2019 |
| Sep. 30, 2020 |
| Sep. 30, 2019 | ||||||||
Cash cost per pound of copper produced |
| $000s |
| $/lb |
| $000s |
| $/lb |
| $000s |
| $/lb |
| $000s |
| $/lb |
Mining |
| 18,220 |
| 0.40 |
| 18,274 |
| 0.27 |
| 45,757 |
| 0.40 |
| 63,884 |
| 0.33 |
Milling |
| 42,836 |
| 0.93 |
| 38,064 |
| 0.56 |
| 94,877 |
| 0.83 |
| 116,053 |
| 0.60 |
G&A |
| 12,538 |
| 0.27 |
| 14,791 |
| 0.22 |
| 28,778 |
| 0.25 |
| 41,700 |
| 0.22 |
Onsite costs |
| 73,594 |
| 1.60 |
| 71,129 |
| 1.04 |
| 169,412 |
| 1.49 |
| 221,637 |
| 1.15 |
Treatment & refining |
| 10,694 |
| 0.23 |
| 15,409 |
| 0.22 |
| 26,573 |
| 0.23 |
| 44,446 |
| 0.23 |
Freight & other |
| 10,201 |
| 0.22 |
| 13,375 |
| 0.20 |
| 24,805 |
| 0.22 |
| 37,895 |
| 0.20 |
Cash cost, before by-product credits |
| 94,489 |
| 2.06 |
| 99,913 |
| 1.46 |
| 220,790 |
| 1.94 |
| 303,978 |
| 1.58 |
By-product credits |
| (23,675) |
| (0.52) |
| (27,509) |
| (0.40) |
| (56,265) |
| (0.49) |
| (93,417) |
| (0.49) |
Cash cost, net of by-product credits |
| 70,814 |
| 1.54 |
| 72,404 |
| 1.06 |
| 164,525 |
| 1.45 |
| 210,561 |
| 1.10 |
Peru |
| Three months ended |
| Nine months ended | ||||||||||||||||
|
| Sep. 30, 2020 |
| Sep. 30, 2019 |
| Sep. 30, 2020 |
| Sep. 30, 2019 | ||||||||||||
Supplementary cash cost information |
| $000s |
| $/lb 1 |
| $000s |
| $/lb 1 |
| $000s |
| $/lb 1 |
| $000s |
| $/lb 1 | ||||
By-product credits2: |
|
|
|
|
|
|
|
|
|
|
|
|
|
|
|
| ||||
Gold3 |
| 6,099 |
| 0.13 |
| 4,848 |
| 0.07 |
| 12,232 |
| 0.11 |
| 18,856 |
| 0.10 | ||||
Silver3 |
| 12,006 |
| 0.26 |
| 14,354 |
| 0.21 |
| 28,286 |
| 0.25 |
| 48,518 |
| 0.25 | ||||
Molybdenum |
| 5,570 |
| 0.12 |
| 8,307 |
| 0.12 |
| 15,747 |
| 0.14 |
| 26,043 |
| 0.14 | ||||
Total by-product credits |
| 23,675 |
| 0.52 |
| 27,509 |
| 0.40 |
| 56,265 |
| 0.49 |
| 93,417 |
| 0.48 | ||||
Reconciliation to IFRS: |
|
|
|
|
|
|
|
|
|
|
|
|
|
|
|
| ||||
Cash cost, net of by-product credits |
| 70,814 |
|
|
| 72,404 |
|
|
| 164,525 |
|
|
| 210,561 |
|
| ||||
By-product credits |
| 23,675 |
|
|
| 27,509 |
|
|
| 56,265 |
|
|
| 93,417 |
|
| ||||
Treatment and refining charges |
| (10,694) |
|
|
| (15,409) |
|
|
| (26,573) |
|
|
| (44,446) |
|
| ||||
Inventory adjustments |
| - |
|
|
| 385 |
|
|
|
| 2,221 |
|
|
|
| 604 |
|
| ||
Share-based compensation expenses |
| 89 |
|
|
| (28) |
|
|
| 74 |
|
|
| 48 |
|
| ||||
Change in product inventory |
| 4,824 |
|
|
| (5,075) |
|
|
| 2,666 |
|
|
| (10,723) |
|
| ||||
Royalties |
| 1,664 |
|
|
| 1,401 |
|
|
| 3,722 |
|
|
| 4,572 |
|
| ||||
Overhead costs related to suspension of activities (cash |
| - |
|
|
| - |
|
|
|
| 15,810 |
|
|
| - |
|
|
| ||
Depreciation and amortization4 |
| 53,021 |
|
|
| 47,236 |
|
|
| 133,414 |
|
|
| 152,188 |
|
| ||||
Cost of sales5 |
| 143,393 |
|
|
| 128,423 |
|
|
| 352,124 |
|
|
| 406,221 |
|
| ||||
1 Per pound of copper produced. | ||||||||||||||||||||
2 By-product credits are computed as revenue per financial statements, amortization of deferred revenue and pricing and volume adjustments. For more information please see the realized price reconciliation table on page 27. | ||||||||||||||||||||
3 Gold and silver by-product credits do not include variable consideration adjustments with respect to stream arrangements. | ||||||||||||||||||||
4 Depreciation is based on concentrate sold. | ||||||||||||||||||||
5 As per IFRS financial statements. | ||||||||||||||||||||
Manitoba |
| Three months ended |
| Nine months ended | ||||
(in thousands) |
| Sep. 30, 2020 |
| Sep. 30, 2019 |
| Sep. 30, 2020 |
| Sep. 30, 2019 |
Net pounds of copper produced1 |
| 10,124 |
| 11,753 |
| 36,286 |
| 38,781 |
1 Contained copper in concentrate. | ||||||||
Manitoba |
| Three months ended |
| Nine months ended | ||||||||||||
|
| Sep. 30, 2020 |
| Sep. 30, 2019 |
| Sep. 30, 2020 |
| Sep. 30, 2019 | ||||||||
Cash cost per pound of copper produced |
| $000s |
| $/lb |
| $000s |
| $/lb |
| $000s |
| $/lb |
| $000s |
| $/lb |
Mining |
| 42,224 |
| 4.17 |
| 43,525 |
| 3.70 |
| 131,711 |
| 3.63 |
| 140,637 |
| 3.63 |
Milling |
| 11,901 |
| 1.18 |
| 12,118 |
| 1.03 |
| 34,910 |
| 0.96 |
| 35,873 |
| 0.93 |
Refining (zinc) |
| 17,504 |
| 1.73 |
| 18,552 |
| 1.58 |
| 53,063 |
| 1.46 |
| 52,795 |
| 1.36 |
G&A |
| 11,909 |
| 1.18 |
| 11,697 |
| 1.00 |
| 37,033 |
| 1.02 |
| 35,475 |
| 0.91 |
Onsite costs |
| 83,538 |
| 8.25 |
| 85,892 |
| 7.31 |
| 256,717 |
| 7.07 |
| 264,780 |
| 6.83 |
Treatment & refining |
| 4,312 |
| 0.43 |
| 4,812 |
| 0.41 |
| 15,592 |
| 0.43 |
| 17,857 |
| 0.46 |
Freight & other |
| 6,360 |
| 0.63 |
| 6,272 |
| 0.53 |
| 20,126 |
| 0.55 |
| 19,900 |
| 0.51 |
Cash cost, before by-product credits |
| 94,210 |
| 9.31 |
| 96,976 |
| 8.25 |
| 292,435 |
| 8.06 |
| 302,537 |
| 7.80 |
By-product credits |
| (128,728) |
| (12.72) |
| (112,421) |
| (9.56) |
| (355,970) |
| (9.81) |
| (324,641) |
| (8.37) |
Cash cost, net of by-product credits |
| (34,518) |
| (3.41) |
| (15,445) |
| (1.31) |
| (63,535) |
| (1.75) |
| (22,104) |
| (0.57) |
Manitoba |
| Three months ended |
| Nine months ended | ||||||||||||||||
|
| Sep. 30, 2020 |
| Sep. 30, 2019 |
| Sep. 30, 2020 |
| Sep. 30, 2019 | ||||||||||||
Supplementary cash cost information |
| $000s |
| $/lb 1 |
| $000s |
| $/lb 1 |
| $000s |
| $/lb 1 |
| $000s |
| $/lb 1 | ||||
By-product credits2: |
|
|
|
|
|
|
|
|
|
|
|
|
|
|
|
| ||||
Zinc |
| 66,918 |
| 6.61 |
| 74,321 |
| 6.32 |
| 187,512 |
| 5.17 |
| 213,034 |
| 5.49 | ||||
Gold3 |
| 51,994 |
| 5.14 |
| 32,354 |
| 2.75 |
| 146,003 |
| 4.02 |
| 92,829 |
| 2.39 | ||||
Silver3 |
| 7,650 |
| 0.76 |
| 4,762 |
| 0.41 |
| 18,432 |
|
| 0.51 |
|
| 15,285 |
| 0.39 | ||
Other |
| 2,166 |
| 0.21 |
| 984 |
| 0.08 |
| 4,023 |
| 0.11 |
| 3,493 |
| 0.09 | ||||
Total by-product credits |
| 128,728 |
| 12.72 |
| 112,421 |
| 9.56 |
| 355,970 |
| 9.81 |
| 324,641 |
| 8.37 | ||||
Reconciliation to IFRS: |
|
|
|
|
|
|
|
|
|
|
|
|
|
|
|
| ||||
Cash cost, net of by-product credits |
| (34,518) |
|
|
| (15,445) |
|
|
| (63,535) |
|
|
| (22,104) |
|
| ||||
By-product credits |
| 128,728 |
|
|
| 112,421 |
|
|
| 355,970 |
|
|
| 324,641 |
|
| ||||
Treatment and refining charges |
| (4,312) |
|
|
| (4,812) |
|
|
| (15,592) |
|
|
| (17,857) |
|
| ||||
Share-based compensation expenses |
| 322 |
|
|
| (145) |
|
|
| 406 |
|
|
| 144 |
|
| ||||
Change in product inventory |
| (2,595) |
|
|
| 3,317 |
|
|
| 25 |
|
|
| (7,680) |
|
| ||||
Royalties |
| 2,835 |
|
|
| 1,518 |
|
|
| 6,267 |
|
|
| 5,258 |
|
| ||||
Depreciation and amortization4 |
| 42,977 |
|
|
| 35,050 |
|
|
| 129,830 |
|
|
| 98,422 |
|
| ||||
Cost of sales5 |
| 133,437 |
|
|
| 131,904 |
|
|
|
| 413,371 |
|
|
| 380,824 |
|
|
| ||
1 Per pound of copper produced. |
|
| ||||||||||||||||||
2 By-product credits are computed as revenue per financial statements, amortization of deferred revenue and pricing and volume adjustments. For more information please see the realized price reconciliation table on page 27. | ||||||||||||||||||||
3 Gold and silver by-product credits do not include variable consideration adjustments with respect to stream arrangements. | ||||||||||||||||||||
4 Depreciation is based on concentrate sold. |
|
| ||||||||||||||||||
5 As per IFRS financial statements. | ||||||||||||||||||||
Consolidated |
| Three months ended |
| Nine months ended | ||||||||||||||||||||
|
| Sep. 30, 2020 |
| Sep. 30, 2019 |
| Sep. 30, 2020 |
| Sep. 30, 2019 | ||||||||||||||||
All-in sustaining cash cost per pound of copper produced |
| $000s |
| $/lb |
| $000s |
| $/lb |
| $000s |
| $/lb |
| $000s |
| $/lb | ||||||||
Cash cost, net of by-product credits |
| 36,296 |
| 0.65 |
|
| 56,959 |
| 0.71 |
|
| 100,990 |
| 0.67 |
|
| 188,457 |
| 0.82 |
| ||||
Cash sustaining capital expenditures |
| 72,461 |
| 1.29 |
|
| 68,372 |
| 0.85 |
|
| 176,658 |
| 1.18 |
|
| 165,355 |
| 0.72 |
| ||||
Capitalized exploration1 |
| - |
|
| 0.00 |
|
| 1,589 |
|
| 0.02 |
|
| - |
|
| 0.00 |
|
| 3,585 |
|
| 0.02 |
|
Royalties |
| 4,499 |
| 0.08 |
|
| 2,919 |
| 0.04 |
|
| 9,989 |
| 0.07 |
|
| 9,830 |
| 0.04 |
| ||||
Sustaining cash cost, net of by-product credits |
| 113,256 |
| 2.02 |
|
| 129,839 |
| 1.62 |
|
| 287,637 |
| 1.92 |
|
| 367,227 |
| 1.59 |
| ||||
Corporate selling and administrative expenses & regional costs |
| 11,705 |
| 0.21 |
|
| 5,984 |
| 0.07 |
|
| 29,301 |
| 0.20 |
|
| 33,247 |
| 0.14 |
| ||||
Accretion and amortization of decommissioning and community agreements2 |
| 995 |
| 0.02 |
|
| 56 |
| - |
|
| 3,110 |
| 0.02 |
|
| 188 |
| - |
| ||||
All-in sustaining cash cost, net of by-product credits |
| 125,956 |
| 2.25 |
|
| 135,879 |
| 1.69 |
|
| 320,048 |
| 2.13 |
|
| 400,662 |
| 1.73 |
| ||||
1 Only includes exploration costs incurred for locations near existing mines. | ||||||||||||||||||||||||
2 Includes accretion of decommissioning relating to non-productive sites, and accretion and amortization of current community agreements. | ||||||||||||||||||||||||
Peru |
| Three months ended |
| Nine months ended | ||||||||||||||||
|
| Sep. 30, 2020 |
| Sep. 30, 2019 |
| Sep. 30, 2020 |
| Sep. 30, 2019 | ||||||||||||
Sustaining cash cost per pound of copper produced |
| $000s |
| $/lb |
| $000s |
| $/lb |
| $000s |
| $/lb |
| $000s |
| $/lb | ||||
Cash cost, net of by-product credits |
| 70,814 |
| 1.54 |
|
| 72,404 |
| 1.06 |
|
| 164,525 |
| 1.45 |
|
| 210,561 |
| 1.10 |
|
Cash sustaining capital expenditures |
| 32,354 |
| 0.71 |
|
| 30,781 |
| 0.45 |
|
| 64,453 |
| 0.57 |
|
| 69,322 |
| 0.36 |
|
Royalties |
| 1,664 |
| 0.04 |
|
| 1,401 |
| 0.02 |
|
| 3,722 |
| 0.03 |
|
| 4,572 |
| 0.02 |
|
Sustaining cash cost per pound of copper produced |
| 104,832 |
| 2.29 |
|
| 104,586 |
| 1.53 |
|
| 232,700 |
| 2.05 |
|
| 284,455 |
| 1.48 |
|
Manitoba |
| Three months ended |
| Nine months ended | ||||||||||||||||||||
|
| Sep. 30, 2020 |
| Sep. 30, 2019 |
| Sep. 30, 2020 |
| Sep. 30, 2019 | ||||||||||||||||
Sustaining cash cost per pound of copper produced |
| $000s |
| $/lb |
| $000s |
| $/lb |
| $000s |
| $/lb |
| $000s |
| $/lb | ||||||||
Cash cost, net of by-product credits |
| (34,518 | ) |
| (3.41 | ) |
| (15,445 | ) |
| (1.31 | ) |
| (63,535 | ) |
| (1.75 | ) |
| (22,104 | ) |
| (0.57) |
|
Cash sustaining capital expenditures |
| 40,107 |
|
| 3.96 |
|
| 37,591 |
|
| 3.20 |
|
| 112,205 |
|
| 3.09 |
|
| 96,033 |
|
| 2.48 |
|
Capitalized exploration |
| - |
|
| 0.00 |
|
| 1,589 |
|
| 0.14 |
|
| - |
|
| 0.00 |
|
| 3,585 |
|
| 0.09 |
|
Royalties |
| 2,835 |
|
| 0.28 |
|
| 1,518 |
|
| 0.13 |
|
| 6,267 |
|
| 0.17 |
|
| 5,258 |
|
| 0.14 |
|
Sustaining cash cost per pound of copper produced |
| 8,424 |
|
| 0.83 |
|
| 25,253 |
|
| 2.15 |
|
| 54,937 |
|
| 1.51 |
|
| 82,772 |
|
| 2.13 |
|
Zinc Cash Cost and Zinc Sustaining Cash Cost
Cash cost per pound of zinc produced ("zinc cash cost") is a non-IFRS measure that management uses as a key performance indicator to assess the performance of our Manitoba operations. This alternative cash cost calculation designates zinc as the primary metal of production as it is the largest component of revenues for our Manitoba business unit and should therefore be less volatile over time than Manitoba cash cost per pound of copper. The calculation is presented in three manners:
- Zinc cash cost, before by-product credits - This measure is gross of by-product revenues and is a function of the efforts and costs incurred to mine and process all ore mined. However, the measure divides this aggregate cost over only pounds of zinc produced, our primary metal of production. This measure is generally less volatile from period to period, as it is not affected by changes in the price received for by-product metals. It is, however, significantly affected by the relative mix of copper concentrate and finished zinc production, where the sale of the copper will occur later, and an increase in production of copper metal will tend to result in an increase in zinc cash cost under this measure.
- Zinc cash cost, net of by-product credits - In order to calculate the net cost to produce and sell zinc, the net of by-product credits measure subtracts the revenues realized from the sale of the metals other than zinc. The by-product revenues from copper, gold, and silver are significant and are integral to the economics of our Manitoba operation. The economics that support our decision to produce and sell zinc would be different if we did not receive revenues from the other significant metals being extracted and processed. This measure provides management and investors with an indication of the minimum zinc price consistent with positive operating margins, assuming realized by-product metal prices are consistent with those prevailing during the reporting period. It also serves as an important operating statistic that management and investors utilize to measure our operating performance at our Manitoba operation versus that of our competitors. However, it is important to understand that if by-product metal prices decline alongside zinc prices, the zinc cash cost net of by-product credits would increase, requiring a higher zinc price than that reported to maintain positive cash flows and operating margins.
- Zinc sustaining cash cost, net of by-product credits - This measure is an extension of zinc cash cost that includes cash sustaining capital expenditures, capitalized exploration, net smelter returns royalties, as well as accretion and amortization for expected decommissioning activities for producing assets. It does not include corporate selling and administrative expenses. It provides a more fulsome measurement of the cost of sustaining production than zinc cash cost, which is focused on operating costs only.
Effective September 30, 2020 and for all comparably disclosed periods, we have included the period's deferred revenue amortization as a by-product credit to reflect the net cost of producing and selling the period's precious metals under our streaming arrangements as we believe doing so allows management and our investors to better evaluate the operating performance of the underlying operations. The variable consideration adjustment required under IFRS 15 related to prior periods is not included as a by-product credit in the current period and hence is disclosed as an adjustment in the non-IFRS cash cost measure reconciliation.
The tables below present a detailed build-up of zinc cash cost and zinc sustaining cash cost, net of by-product credits, for the Manitoba business unit, and reconciliations between zinc cash cost, net of by-product credits, to the most comparable IFRS measures of cost of sales for the three and nine months ended September 30, 2020 and 2019. Zinc cash cost, net of by-product credits, may not calculate exactly based on amounts presented in the tables below due to rounding.
Manitoba |
| Three months ended |
| Nine months ended | ||||
(in thousands) |
| Sep. 30, 2020 |
| Sep. 30, 2019 |
| Sep. 30, 2020 |
| Sep. 30, 2019 |
Net pounds of zinc produced1 |
| 67,395 |
| 63,138 |
| 203,458 |
| 195,140 |
1 Contained zinc in concentrate. |
|
|
|
|
|
|
|
|
Manitoba |
| Three months ended |
| Nine months ended | |||||||||||||
|
| Sep. 30, 2020 |
| Sep. 30, 2019 |
| Sep. 30, 2020 |
| Sep. 30, 2019 | |||||||||
Cash cost per pound of zinc produced |
| $000s |
| $/lb |
| $000s |
| $/lb |
| $000s |
| $/lb |
| $000s |
| $/lb | |
Cash cost, before by-product credits1 |
| 94,210 |
| 1.39 |
| 96,976 |
| 1.54 |
| 292,435 |
| 1.44 |
| 302,537 |
| 1.55 | |
By-product credits |
| (92,630) |
| (1.37) |
| (63,472) |
| (1.01) |
| (264,397) |
| (1.30) |
| (215,260) |
| (1.10) |
|
Zinc cash cost, net of by-product credits |
| 1,580 |
| 0.02 |
| 33,504 |
| 0.53 |
| 28,038 |
| 0.14 |
| 87,277 |
| 0.45 | |
1 For additional detail on cash cost, before by-product credits please see page 49 of this MD&A. | |||||||||||||||||
Manitoba |
| Three months ended |
| Nine months ended | ||||||||||||||||||||
|
| Sep. 30, 2020 |
| Sep. 30, 2019 |
| Sep. 30, 2020 |
| Sep. 30, 2019 | ||||||||||||||||
Supplementary cash cost information |
| $000s |
| $/lb 1 |
| $000s |
| $/lb 1 |
| $000s |
| $/lb 1 |
| $000s |
| $/lb 1 | ||||||||
By-product credits2: |
|
|
|
|
|
|
|
|
|
|
|
|
|
|
|
| ||||||||
Copper |
| 30,820 |
|
| 0.46 |
|
| 25,372 |
|
| 0.40 |
|
| 95,939 |
|
| 0.47 |
|
| 103,653 |
|
| 0.53 |
|
Gold3 |
| 51,994 |
|
| 0.77 |
|
| 32,354 |
|
| 0.51 |
|
| 146,003 |
|
| 0.72 |
|
| 92,829 |
|
| 0.48 |
|
Silver3 |
| 7,650 |
|
| 0.11 |
|
| 4,762 |
|
| 0.08 |
|
| 18,432 |
|
| 0.09 |
|
| 15,285 |
|
| 0.08 |
|
Other |
| 2,166 |
|
| 0.03 |
|
| 984 |
|
| 0.02 |
|
| 4,023 |
|
| 0.02 |
|
| 3,493 |
|
| 0.02 |
|
Total by-product credits |
| 92,630 |
|
| 1.37 |
|
| 63,472 |
|
| 1.01 |
|
| 264,397 |
|
| 1.30 |
|
| 215,260 |
|
| 1.10 |
|
Reconciliation to IFRS: |
|
|
|
|
|
|
|
|
|
|
|
|
|
|
|
| ||||||||
Cash cost, net of by-product credits |
| 1,580 |
|
|
|
| 33,504 |
|
|
|
| 28,038 |
|
|
|
| 87,277 |
|
|
| ||||
By-product credits |
| 92,630 |
|
|
|
| 63,472 |
|
|
|
| 264,397 |
|
|
|
| 215,260 |
|
|
| ||||
Treatment and refining charges |
| (4,312 | ) |
|
|
| (4,812 | ) |
|
|
| (15,592 | ) |
|
|
| (17,857 | ) |
|
| ||||
Share-based compensation expenses |
| 322 |
|
|
|
| (145 | ) |
|
|
| 406 |
|
|
|
| 144 |
|
|
| ||||
Change in product inventory |
| (2,595 | ) |
|
|
| 3,317 |
|
|
|
| 25 |
|
|
|
| (7,680 | ) |
|
| ||||
Royalties |
| 2,835 |
|
|
|
| 1,518 |
|
|
|
| 6,267 |
|
|
|
| 5,258 |
|
|
| ||||
Depreciation and amortization4 |
| 42,977 |
|
|
|
| 35,050 |
|
|
|
| 129,830 |
|
|
|
| 98,422 |
|
|
| ||||
Cost of sales5 |
| 133,437 |
|
|
|
| 131,904 |
|
|
|
| 413,371 |
|
|
|
| 380,824 |
|
|
| ||||
1 Per pound of zinc produced. | ||||||||||||||||||||||||
2 By-product credits are computed as revenue per financial statements, amortization of deferred revenue and pricing and volume adjustments. For more information please see the realized price reconciliation table on page 27. | ||||||||||||||||||||||||
3 Gold and silver by-product credits do not include variable consideration adjustments with respect to stream arrangements. | ||||||||||||||||||||||||
4 Depreciation is based on concentrate sold. | ||||||||||||||||||||||||
5 As per IFRS financial statements. | ||||||||||||||||||||||||
Manitoba |
| Three months ended |
| Nine months ended | ||||||||||||||||||
|
| Sep. 30, 2020 |
| Sep. 30, 2019 |
| Sep. 30, 2020 |
| Sep. 30, 2019 | ||||||||||||||
Sustaining cash cost per pound of zinc produced |
| $000s |
| $/lb |
| $000s |
| $/lb |
| $000s |
| $/lb |
| $000s |
| $/lb | ||||||
Zinc cash cost, net of by-product credits |
| 1,580 |
| 0.02 |
|
| 33,504 |
| 0.53 |
|
| 28,038 |
| 0.14 |
|
| 87,277 |
| 0.45 |
| ||
Cash sustaining capital expenditures |
| 40,107 |
| 0.60 |
|
| 37,591 |
| 0.60 |
|
| 112,205 |
| 0.55 |
|
| 96,033 |
| 0.49 |
| ||
Capitalized exploration |
| - |
| - |
|
| 1,589 |
|
| 0.03 |
|
| - |
| - |
|
| 3,585 |
|
| 0.02 |
|
Royalties |
| 2,835 |
| 0.04 |
|
| 1,518 |
| 0.02 |
|
| 6,267 |
| 0.03 |
|
| 5,258 |
| 0.03 |
| ||
Sustaining cash cost per pound of zinc produced |
| 44,522 |
| 0.66 |
|
| 74,202 |
| 1.18 |
|
| 146,510 |
| 0.72 |
|
| 192,152 |
| 0.98 |
| ||
Combined Unit Cost & Zinc Plant Unit Cost Reconciliation
Combined unit cost ("unit cost") and zinc plant unit cost is a non-IFRS measure that management uses as a key performance indicator to assess the performance of our mining and milling operations. Combined unit cost and zinc plant unit cost are calculated by dividing the cost of sales by mill throughput and refined zinc metal produced, respectively. This measure is utilized by management and investors to assess our cost structure and margins and compare it to similar information provided by other companies in our industry. Unlike cash cost, this measure is not impacted by variability in by-product commodity prices since there are no by-product deductions; costs associated with profit-sharing and similar costs are excluded because of their correlation to external metal prices. In addition, the unit costs are reported in the functional currency of the operation which minimizes the impact of foreign currency fluctuations. In all, the unit cost measures provide an alternative perspective on operating cost performance with minimal impact from external market prices. In the first half of 2020, as a result of the temporary suspension of operations in Peru, fixed overhead production costs incurred during the suspension were directly charged to cost of sales. These costs did not contribute to production of inventory and were therefore excluded from the calculation of combined unit costs.
The tables below present a detailed combined unit cost and zinc plant unit costs for the Manitoba business unit and combined unit cost for the Peru business unit, and reconciliations between these measures to the most comparable IFRS measures of cost of sales for the three and nine months ended September 30, 2020 and 2019.
Peru |
| Three months ended |
| Nine months ended | |||||
(in thousands except unit cost per tonne) |
| Sep. 30, 2020 |
| Sep. 30, 2019 |
| Sep. 30, 2020 |
| Sep. 30, 2019 | |
Combined unit cost per tonne processed |
|
|
|
| |||||
|
|
|
|
|
|
|
|
| |
Mining |
| 18,220 |
| 18,274 |
| 45,757 |
| 63,884 | |
Milling |
| 42,836 |
| 38,064 |
| 94,877 |
| 116,053 | |
G&A 1 |
| 12,538 |
| 14,791 |
| 28,778 |
| 41,700 | |
Other G&A 2 |
| 89 |
| 13 |
|
| 651 |
| 288 |
Unit cost |
| 73,683 |
| 71,142 |
|
| 170,063 |
| 221,925 |
Tonnes ore milled |
| 7,481 |
| 8,240 |
|
| 18,556 |
| 23,913 |
Combined unit cost per tonne |
| 9.85 |
| 8.63 |
|
| 9.16 |
| 9.28 |
Reconciliation to IFRS: |
|
|
|
|
|
|
|
| |
Unit cost |
| 73,683 |
| 71,142 |
|
| 170,063 |
| 221,925 |
Freight & other |
| 10,201 |
| 13,375 |
| 24,805 |
| 37,895 | |
Other G&A |
| (89) |
| (13) |
| (651) |
| (288) | |
Share-based compensation expenses |
| 89 |
| (28) |
|
| 74 |
| 48 |
Inventory adjustments |
| - |
| 385 |
|
| 2,221 |
| 604 |
Change in product inventory |
| 4,824 |
| (5,075) |
|
| 2,666 |
| (10,723) |
Royalties |
| 1,664 |
| 1,401 |
|
| 3,722 |
| 4,572 |
Overhead costs related to suspension of activities (cash) |
| - |
| - |
|
| 15,810 |
| - |
Depreciation and amortization |
| 53,021 |
| 47,236 |
|
| 133,414 |
| 152,188 |
Cost of sales3 |
| 143,393 |
| 128,423 |
| 352,124 |
| 406,221 | |
1 G&A as per cash cost reconciliation above. | |||||||||
2 Other G&A primarily includes profit sharing costs. | |||||||||
3 As per IFRS financial statements. | |||||||||
Manitoba |
| Three months ended |
| Nine months ended | ||||||||
(in thousands except tonnes ore milled and unit cost per tonne) |
| Sep. 30, |
| Sep. 30, |
| Sep. 30, |
| Sep. 30, | ||||
Combined unit cost per tonne processed |
|
|
|
| ||||||||
|
|
|
|
|
|
|
|
| ||||
Mining |
| 42,224 |
|
| 43,525 |
|
| 131,711 |
|
| 140,637 |
|
Milling |
| 11,901 |
|
| 12,118 |
|
| 34,910 |
|
| 35,873 |
|
G&A 1 |
| 11,909 |
|
| 11,697 |
|
| 37,033 |
|
| 35,475 |
|
Less: G&A allocated to zinc metal production |
| (3,707 | ) |
| (3,462 | ) |
| (11,130 | ) |
| (9,541 | ) |
Less: Other G&A related to profit sharing costs |
| (10 | ) |
| 12 |
|
| (10 | ) |
| (85 | ) |
Unit cost |
| 62,317 |
|
| 63,890 |
|
| 192,514 |
|
| 202,359 |
|
|
|
|
|
|
|
|
|
| ||||
USD/CAD implicit exchange rate |
| 1.33 |
|
| 1.32 |
|
| 1.35 |
|
| 1.33 |
|
Unit cost - C$ |
| 82,962 |
|
| 84,364 |
|
| 260,410 |
|
| 269,034 |
|
Tonnes ore milled |
| 657,895 |
|
| 649,755 |
|
| 2,019,778 |
|
| 1,967,155 |
|
Combined unit cost per tonne - C$ |
| 126 |
|
| 130 |
|
| 129 |
|
| 137 |
|
Reconciliation to IFRS: |
|
|
|
|
|
|
|
| ||||
Unit cost |
| 62,317 |
|
| 63,890 |
|
| 192,514 |
|
| 202,359 |
|
Freight & other |
| 6,360 |
|
| 6,272 |
|
| 20,126 |
|
| 19,900 |
|
Refined (zinc) |
| 17,504 |
|
| 18,552 |
|
| 53,063 |
|
| 52,795 |
|
G&A allocated to zinc metal production |
| 3,707 |
|
| 3,462 |
|
| 11,130 |
|
| 9,541 |
|
Other G&A related to profit sharing |
| 10 |
|
| (12 | ) |
| 10 |
|
| 85 |
|
Share-based compensation expenses |
| 322 |
|
| (145 | ) |
| 406 |
|
| 144 |
|
Change in product inventory |
| (2,595 | ) |
| 3,317 |
|
| 25 |
|
| (7,680 | ) |
Royalties |
| 2,835 |
|
| 1,518 |
|
| 6,267 |
|
| 5,258 |
|
Depreciation and amortization |
| 42,977 |
|
| 35,050 |
|
| 129,830 |
|
| 98,422 |
|
Cost of sales2 |
| 133,437 |
| 131,904 |
| 413,371 |
| 380,824 | ||||
1 G&A as per cash cost reconciliation above. | ||||||||||||
2 As per IFRS financial statements. | ||||||||||||
Manitoba |
| Three months ended |
| Nine months ended | ||||||||
(in thousands except zinc plant unit cost per pound) |
| Sep. 30, |
| Sep. 30, |
| Sep. 30, |
| Sep. 30, | ||||
Zinc plant unit cost |
|
|
|
| ||||||||
|
|
|
|
|
|
|
|
| ||||
Zinc plant costs |
| 17,504 |
| 18,552 |
| 53,063 |
| 52,795 | ||||
G&A 1 |
| 11,909 |
|
| 11,697 |
|
| 37,033 |
|
| 35,475 |
|
Less: G&A allocated to other areas |
| (8,192 | ) |
| (8,247 | ) |
| (25,893 | ) |
| (25,849 | ) |
Less: Other G&A related to profit sharing |
| (10 | ) |
| 12 |
|
| (10 | ) |
| (85 | ) |
Zinc plant unit cost |
| 21,211 |
|
| 22,014 |
|
| 64,193 |
|
| 62,336 |
|
|
|
|
|
|
|
|
|
| ||||
USD/CAD implicit exchange rate |
| 1.33 |
|
| 1.32 |
|
| 1.35 |
|
| 1.33 |
|
Zinc plant unit cost - C$ |
| 28,246 |
|
| 29,077 |
|
| 86,701 |
|
| 82,839 |
|
Refined metal produced (in pounds) |
| 59,123 |
|
| 53,614 |
|
| 182,584 |
|
| 166,504 |
|
Zinc plant unit cost per pound - C$ |
| 0.48 |
|
| 0.54 |
|
| 0.47 |
|
| 0.50 |
|
|
|
|
|
|
|
|
|
| ||||
Reconciliation to IFRS: |
|
|
|
|
|
|
|
| ||||
Zinc plant unit cost |
| 21,211 |
|
| 22,014 |
|
| 64,193 |
|
| 62,336 |
|
Freight & other |
| 6,360 |
|
| 6,272 |
|
| 20,126 |
|
| 19,900 |
|
Mining |
| 42,224 |
|
| 43,525 |
|
| 131,711 |
|
| 140,637 |
|
Milling |
| 11,901 |
|
| 12,118 |
|
| 34,910 |
|
| 35,873 |
|
G&A allocated to other areas |
| 8,192 |
|
| 8,247 |
|
| 25,893 |
|
| 25,849 |
|
Other G&A related to profit sharing |
| 10 |
|
| (12 | ) |
| 10 |
|
| 85 |
|
Share-based compensation expenses |
| 322 |
|
| (145 | ) |
| 406 |
|
| 144 |
|
Change in product inventory |
| (2,595 | ) |
| 3,317 |
|
| 25 |
|
| (7,680 | ) |
Royalties |
| 2,835 |
|
| 1,518 |
|
| 6,267 |
|
| 5,258 |
|
Depreciation and amortization |
| 42,977 |
|
| 35,050 |
|
| 129,830 |
|
| 98,422 |
|
Cost of sales2 |
| 133,437 |
|
| 131,904 |
|
| 413,371 |
|
| 380,824 |
|
1 G&A as per cash cost reconciliation above. | ||||||||||||
2 As per IFRS financial statements. | ||||||||||||
ACCOUNTING CHANGES AND CRITICAL ESTIMATES
New standards and interpretations adopted
For information on new standards and interpretations adopted, refer to note 4 of our September 30, 2020 consolidated interim financial statements.
Estimates and judgements
The preparation of the consolidated interim financial statements in conformity with IFRS requires us to make judgements, estimates and assumptions that affect the application of accounting policies, reported amounts of assets and liabilities, disclosure of contingent assets and liabilities at the date of the consolidated interim financial statements, and reported amounts of revenue and expenses during the reporting period. Actual results may differ from these estimates.
We review these estimates and underlying assumptions on an ongoing basis based on our experience and other factors, including expectations of future events that we believe to be reasonable under the circumstances. Revisions to accounting estimates are recognized in the period in which the estimates are revised and in any future periods affected. Certain accounting estimates and judgements have been identified as being "critical" to the presentation of our financial condition and results of operations because they require us to make subjective and/or complex judgments about matters that are inherently uncertain; or there is a reasonable likelihood that materially different amounts could be reported under different conditions or using different assumptions and estimates.
For more information on judgements and estimates, refer to note 2 of our September 30, 2020 consolidated interim financial statements.
CHANGES IN INTERNAL CONTROL OVER FINANCIAL REPORTING
Management is responsible for establishing and maintaining adequate internal control over financial reporting ("ICFR"). ICFR is designed to provide reasonable assurance regarding the reliability of financial reporting and the preparation of financial statements for external purposes in accordance with IFRS.
We did not make any changes to ICFR during the three months ended September 30, 2020 that materially affected or are reasonably likely to materially affect our ICFR.
NOTES TO READER
Forward-Looking Information
This MD&A contains forward-looking information within the meaning of applicable Canadian and United States securities legislation. All information contained in this MD&A, other than statements of current and historical fact, is forward-looking information. Often, but not always, forward-looking information can be identified by the use of words such as "plans", "expects", "budget", "guidance", "scheduled", "estimates", "forecasts", "strategy", "target", "intends", "objective", "goal", "understands", "anticipates" and "believes" (and variations of these or similar words) and statements that certain actions, events or results "may", "could", "would", "should", "might" "occur" or "be achieved" or "will be taken" (and variations of these or similar expressions). All of the forward-looking information in this MD&A is qualified by this cautionary note.
Forward-looking information includes, but is not limited to, production, cost and capital and exploration expenditure guidance and potential revisions to such guidance, anticipated production at our mines and processing facilities, expectations regarding the impact of the COVID-19 pandemic on our operations, financial condition and prospects, the ability to complete the shaft inspection activities at 777 in the anticipated timeframe, the ability to identify the extent of any damage to the 777 mine shaft, the expected timeline and costs to complete repairs at the 777 mine, the ability to continue production and use of the 777 mine′s ramp access as a temporary substitute to the shaft, the expected timeline to resume full production at 777, expectations regarding the timing of mining activities at the Pampacancha deposit and the related capital expenditures, the anticipated timing, cost and benefits of developing the Rosemont project and the outcome of litigation challenging Rosemont's permits, expectations regarding the Lalor gold strategy, including the refurbishment of the New Britannia mill and the potential to increase 2021 gold production, the possibility of converting inferred mineral resource estimates to higher confidence categories, the potential and our anticipated plans for advancing our mining properties surrounding Constancia and the Mason project, anticipated mine plans, anticipated metals prices and the anticipated sensitivity of our financial performance to metals prices, events that may affect our operations and development projects, anticipated cash flows from operations and related liquidity requirements, the anticipated effect of external factors on revenue, such as commodity prices, estimation of mineral reserves and resources, mine life projections, reclamation costs, economic outlook, government regulation of mining operations, and business and acquisition strategies. Forward-looking information is not, and cannot be, a guarantee of future results or events. Forward-looking information is based on, among other things, opinions, assumptions, estimates and analyses that, while considered reasonable by us at the date the forward-looking information is provided, inherently are subject to significant risks, uncertainties, contingencies and other factors that may cause actual results and events to be materially different from those expressed or implied by the forward-looking information.
The material factors or assumptions that we identified and were applied by us in drawing conclusions or making forecasts or projections set out in the forward-looking information include, but are not limited to:
- our ability to continue to operate safely and at full capacity during the COVID-19 pandemic;
- the outcome of the inspections at the 777 mine, the ability and cost to remedy the damage and resume production at the 777 mine and the ability to mitigate production while the 777 shaft is not operating;
- the ability to achieve production and unit cost guidance;
- no significant interruptions to our operations or significant delays to our development projects in Manitoba and Peru due to the COVID-19 pandemic;
- the timing of development and production activities on the Pampacancha deposit;
- the timing of the Consulta Previa and permitting process for mining the Pampacancha deposit;
- the timing for reaching additional agreements with individual community members and no significant unanticipated delays to the development of Pampacancha;
- the successful completion of the New Britannia project on budget and on schedule;
- the successful outcome of the Rosemont litigation;
- the success of mining, processing, exploration and development activities;
- the scheduled maintenance and availability of our processing facilities;
- the accuracy of geological, mining and metallurgical estimates;
- anticipated metals prices and the costs of production;
- the supply and demand for metals we produce;
- the supply and availability of all forms of energy and fuels at reasonable prices;
- no significant unanticipated operational or technical difficulties;
- the execution of our business and growth strategies, including the success of our strategic investments and initiatives;
- the availability of additional financing, if needed;
- the ability to complete project targets on time and on budget and other events that may affect our ability to develop our projects;
- the timing and receipt of various regulatory and governmental approvals;
- the availability of personnel for our exploration, development and operational projects and ongoing employee relations;
- maintaining good relations with the labour unions that represent certain of our employees in Manitoba and Peru;
- maintaining good relations with the communities in which we operate, including the neighbouring Indigenous communities;
- no significant unanticipated challenges with stakeholders at our various projects;
- no significant unanticipated events or changes relating to regulatory, environmental, health and safety matters;
- no contests over title to our properties, including as a result of rights or claimed rights of Indigenous peoples or challenges to the validity of our unpatented mining claims;
- the timing and possible outcome of pending litigation and no significant unanticipated litigation;
- certain tax matters, including, but not limited to current tax laws and regulations and the refund of certain value added taxes from the Canadian and Peruvian governments; and
- no significant and continuing adverse changes in general economic conditions or conditions in the financial markets (including commodity prices and foreign exchange rates).
The risks, uncertainties, contingencies and other factors that may cause actual results to differ materially from those expressed or implied by the forward-looking information may include, but are not limited to, risks associated with the COVID-19 pandemic and its effect on our operations, financial condition, projects and prospects, the possibility of a global recession arising from the COVID-19 pandemic and attempts to control it, the political situation in Peru, risks generally associated with the mining industry, such as economic factors (including future commodity prices, currency fluctuations, energy prices and general cost escalation), uncertainties related to the development and operation of our projects (including risks associated with the litigation affecting the Rosemont project), risks related to the U.S. district court's recent decisions to set aside the U.S. Forest Service's FROD and the Biological Opinion for Rosemont and related appeals and other legal challenges, risks related to the new Lalor mine plan, including the schedule for the refurbishment of the New Britannia mill and the ability to convert inferred mineral resource estimates to higher confidence categories, risks related to the schedule for mining the Pampacancha deposit (including risks associated with COVID-19, the Consulta Previa process, risks associated with reaching additional agreements with individual community members and risks associated with the rainy season in Peru and the impact of any schedule delays), dependence on key personnel and employee and union relations, risks related to political or social unrest or change, risks in respect of Indigenous and community relations, rights and title claims, operational risks and hazards, including the cost of maintaining and upgrading the Company's tailings management facilities and any unanticipated environmental, industrial and geological events and developments and the inability to insure against all risks, failure of plant, equipment, processes, transportation and other infrastructure to operate as anticipated, compliance with government and environmental regulations, including permitting requirements and anti-bribery legislation, depletion of our reserves, volatile financial markets that may affect our ability to obtain additional financing on acceptable terms, the failure to obtain required approvals or clearances from government authorities on a timely basis, uncertainties related to the geology, continuity, grade and estimates of mineral reserves and resources, and the potential for variations in grade and recovery rates, uncertain costs of reclamation activities, our ability to comply with our pension and other post-retirement obligations, our ability to abide by the covenants in our debt instruments and other material contracts, tax refunds, hedging transactions, as well as the risks discussed under the heading "Risk Factors" in our most recent Annual Information Form.
Should one or more risk, uncertainty, contingency or other factor materialize or should any factor or assumption prove incorrect, actual results could vary materially from those expressed or implied in the forward-looking information. Accordingly, you should not place undue reliance on forward-looking information. We do not assume any obligation to update or revise any forward-looking information after the date of this MD&A or to explain any material difference between subsequent actual events and any forward-looking information, except as required by applicable law.
Note to United States Investors
This MD&A has been prepared in accordance with the requirements of the securities laws in effect in Canada, which may differ materially from the requirements of United States securities laws applicable to U.S. issuers.
Qualified Person
The technical and scientific information in this MD&A related to the Constancia mine and Rosemont project has been approved by Cashel Meagher, P. Geo, our Senior Vice President and Chief Operating Officer. The technical and scientific information related to our other material mineral projects contained in this MD&A has been approved by Olivier Tavchandjian, P. Geo, our Vice President, Exploration and Geology. Messrs. Meagher and Tavchandjian are qualified persons pursuant to NI 43-101. For a description of the key assumptions, parameters and methods used to estimate mineral reserves and resources at Hudbay's material properties, as well as data verification procedures and a general discussion of the extent to which the estimates of scientific and technical information may be affected by any known environmental, permitting, legal title, taxation, sociopolitical, marketing or other relevant factors, please see the technical reports for our material properties as filed by us on SEDAR at www.sedar.com.
SUMMARY OF RESULTS
The following unaudited tables set out a summary of quarterly and annual results for the Company:
|
| 2020 | 2019 | 2018 | |||||||||||||||||||||||||||
|
| Q3 | Q2 | Q1 | 2019 | Q4 | Q3 | Q2 | Q1 | 2018 | Q4 | ||||||||||||||||||||
Consolidated Financial Condition ($000s) |
|
|
|
|
|
|
|
|
|
| |||||||||||||||||||||
Cash and cash equivalents |
| $ | 449,014 |
| $ | 391,136 |
| $ | 305,997 |
| $ | 396,146 |
| $ | 396,146 |
| $ | 398,438 |
| $ | 489,527 |
| $ | 485,867 |
| $ | 515,497 |
| $ | 515,497 |
|
Total long-term debt |
| 1,175,104 |
| 988,418 |
| 988,074 |
| 985,255 |
| 985,255 |
| 976,272 |
| 977,196 |
| 977,413 |
| 981,030 |
| 981,030 |
| ||||||||||
Net debt1 |
| 726,090 |
| 597,282 |
| 682,077 |
| 589,109 |
| 589,109 |
| 577,834 |
| 487,669 |
| 491,546 |
| 465,533 |
| 465,533 |
| ||||||||||
Consolidated Financial Performance ($000s except per share amounts) |
|
|
|
|
|
|
|
|
|
|
| ||||||||||||||||||||
Revenue |
| $ | 316,108 |
| $ | 208,913 |
| $ | 245,105 |
| $ | 1,237,439 |
| $ | 324,485 |
| $ | 291,282 |
| $ | 329,414 |
| $ | 292,258 |
| $ | 1,472,366 |
| $ | 351,773 |
|
Cost of sales |
| 276,830 |
| 221,567 |
| 267,096 |
| 1,085,897 |
| 298,852 |
| 260,327 |
| 286,271 |
| 240,446 |
| 1,098,626 |
| 276,547 |
| ||||||||||
Earnings (loss) before tax |
| (23,944) |
| (74,604) |
| (81,452) |
| (452,763) |
| (42,352) |
| (348,367) |
| (43,931) |
| (18,108) |
| 170,837 |
| 17,650 |
| ||||||||||
Earnings (loss) |
| (23,955) |
| (51,901) |
| (76,134) |
| (343,810) |
| (1,455) |
| (274,796) |
| (54,145) |
| (13,412) |
| 85,416 |
| (3,510) |
| ||||||||||
Basic and diluted (loss) earnings per share |
| $ | (0.09) |
| $ | (0.20) |
| $ | (0.29) |
| $ | (1.32) |
| $ | (0.01) |
| $ | (1.05) |
| $ | (0.21) |
| $ | (0.05) |
| $ | 0.33 |
| $ | (0.01) |
|
Adjusted (loss) earnings per share 1 |
| $ | (0.10) |
| $ | (0.15) |
| $ | (0.15) |
| $ | (0.18) |
| $ | (0.09) |
| $ | (0.09) |
| $ | (0.03) |
| $ | 0.03 |
| $ | 0.40 |
| $ | 0.05 |
|
Operating cash flow before change in non-cash working capital 1 |
| 84,383 |
| 29,457 |
| 41,951 |
| 307,284 |
| 69,141 |
| 71,204 |
| 81,259 |
| 85,684 |
| 501,352 |
| 104,264 |
| ||||||||||
Adjusted EBITDA 1, 2 |
| 96.1 |
| 49.1 |
| 55.0 |
| 358.5 |
| 82.2 |
| 76.2 |
| 95.9 |
| 104.2 |
| 554.8 |
| 120.7 |
| ||||||||||
Consolidated Operational Performance |
|
|
|
|
|
|
|
|
| ||||||||||||||||||||||
Contained metal in concentrate produced 3 |
|
|
|
|
|
|
|
|
|
|
| ||||||||||||||||||||
Copper | tonnes | 25,395 |
| 18,026 |
| 24,635 |
| 137,719 |
| 32,422 |
| 36,422 |
| 30,363 |
| 37,972 |
| 154,550 |
| 37,238 |
| ||||||||||
Gold | ounces | 29,277 |
| 32,614 |
| 30,355 |
| 114,692 |
| 32,712 |
| 28,319 |
| 28,099 |
| 25,562 |
| 119,882 |
| 28,051 |
| ||||||||||
Silver | ounces | 671,685 |
| 580,817 |
| 767,692 |
| 3,585,330 |
| 930,137 |
| 924,191 |
| 811,807 |
| 919,195 |
| 3,954,469 |
| 1,014,684 |
| ||||||||||
Zinc | tonnes | 30,570 |
| 31,222 |
| 30,495 |
| 119,106 |
| 30,592 |
| 28,639 |
| 31,838 |
| 28,037 |
| 115,588 |
| 27,408 |
| ||||||||||
Molybdenum | tonnes | 392 |
| 124 |
| 354 |
| 1,272 |
| 372 |
| 262 |
| 334 |
| 304 |
| 904 |
| 329 |
| ||||||||||
Payable metal in concentrate sold |
|
|
|
|
|
|
|
|
|
|
| ||||||||||||||||||||
Copper | tonnes | 25,903 |
| 15,951 |
| 24,072 |
| 128,519 |
| 33,715 |
| 29,916 |
| 33,171 |
| 31,717 |
| 147,923 |
| 36,350 |
| ||||||||||
Gold | ounces | 30,605 |
| 30,590 |
| 26,574 |
| 108,999 |
| 30,344 |
| 25,488 |
| 30,538 |
| 22,629 |
| 113,097 |
| 25,861 |
| ||||||||||
Silver | ounces | 705,495 |
| 541,785 |
| 575,922 |
| 3,452,926 |
| 909,423 |
| 756,296 |
| 804,301 |
| 982,906 |
| 3,372,353 |
| 909,500 |
| ||||||||||
Zinc 4 | tonnes | 26,520 |
| 27,604 |
| 26,792 |
| 104,319 |
| 28,001 |
| 29,140 |
| 24,224 |
| 22,954 |
| 115,723 |
| 31,134 |
| ||||||||||
Molybdenum | tonnes | 313 |
| 120 |
| 431 |
| 1,186 |
| 199 |
| 334 |
| 419 |
| 234 |
| 819 |
| 447 |
| ||||||||||
Cash cost 1 | $/lb | $ | 0.65 |
| $ | 0.29 |
| $ | 0.98 |
| $ | 0.83 |
| $ | 0.90 |
| $ | 0.71 |
| $ | 0.95 |
| $ | 0.81 |
| $ | 0.66 |
| $ | 0.63 |
|
All-in sustaining cash cost 1 | $/lb | $ | 2.25 |
| $ | 1.91 |
| $ | 2.17 |
| $ | 1.86 |
| $ | 2.22 |
| $ | 1.69 |
| $ | 1.98 |
| $ | 1.58 |
| $ | 1.32 |
| $ | 1.49 |
|
1 Net debt, adjusted (loss) earnings per share, adjusted EBITDA, cash cost, and all-in sustaining cash cost per pound of copper produced, net of by-product credits, are non-IFRS financial performance measures with no standardized definition under IFRS. For further information and a detailed reconciliation, please see discussion under the "Non-IFRS Financial Reporting Measures" section of this MD&A. All comparative cash cost and all-in sustaining cash cost per pound of copper produced, net of by-product credits figures have been restated as indicated on page 45. | |||||||||||||||||||||||||||||||
2 In millions. | |||||||||||||||||||||||||||||||
3 Metal reported in concentrate is prior to deductions associated with smelter contract terms. | |||||||||||||||||||||||||||||||
4 Includes refined zinc metal sold. | |||||||||||||||||||||||||||||||
|
| 2020 | 2019 | 2018 | |||||||||||||||||||||||||||
|
| Q3 | Q2 | Q1 | 2019 | Q4 | Q3 | Q2 | Q1 | 2018 | Q4 | ||||||||||||||||||||
Peru Operations |
|
|
|
|
|
|
|
|
|
|
| ||||||||||||||||||||
Ore mined1 | tonnes | 8,455,668 |
| 2,775,286 |
| 6,985,212 |
| 33,308,369 |
| 8,049,063 |
| 8,413,367 |
| 8,211,166 |
| 8,634,773 |
| 34,372,156 |
| 7,329,423 |
| ||||||||||
Copper | % | 0.31 | 0.34 | 0.34 | 0.43 | 0.41 | 0.44 | 0.39 | 0.47 | 0.49 | 0.47 | ||||||||||||||||||||
Gold | g/tonne | 0.03 | 0.04 | 0.03 | 0.04 | 0.04 | 0.05 | 0.04 | 0.04 | 0.05 | 0.05 | ||||||||||||||||||||
Silver | g/tonne | 2.55 | 2.90 | 3.10 | 3.76 | 3.87 | 3.93 | 3.68 | 3.55 | 4.15 | 4.16 | ||||||||||||||||||||
Molybdenum | % | 0.02 |
| 0.02 |
| 0.01 |
| 0.02 |
| 0.02 |
| 0.02 |
| 0.01 |
| 0.01 |
| 0.01 |
| 0.01 |
| ||||||||||
Ore milled | tonnes | 7,480,655 |
| 4,355,482 |
| 6,719,466 |
| 31,387,281 |
| 7,474,136 |
| 8,240,344 |
| 7,679,739 |
| 7,993,062 |
| 31,282,610 |
| 7,657,943 |
| ||||||||||
Copper | % | 0.33 | 0.34 | 0.34 | 0.42 | 0.42 | 0.44 | 0.37 | 0.46 | 0.47 | 0.48 | ||||||||||||||||||||
Gold | g/tonne | 0.03 | 0.04 | 0.03 | 0.04 | 0.04 | 0.04 | 0.04 | 0.04 | 0.05 | 0.06 | ||||||||||||||||||||
Silver | g/tonne | 2.68 | 3.04 | 3.13 | 3.64 | 3.86 | 3.76 | 3.40 | 3.53 | 4.08 | 4.26 | ||||||||||||||||||||
Molybdenum | % | 0.02 | 0.01 | 0.02 | 0.01 | 0.00 | 0.02 | 0.01 | 0.01 | 0.01 | 0.01 | ||||||||||||||||||||
Copper recovery | % | 83.3 | 76.6 | 84.3 | 85.7 | 85.6 | 86.0 | 84.7 | 86.2 | 82.6 | 84.8 | ||||||||||||||||||||
Gold recovery | % | 51.6 | 43.4 | 50.2 | 48.1 | 50.0 | 48.3 | 41.3 | 52.2 | 47.4 | 48.5 | ||||||||||||||||||||
Silver recovery | % | 66.7 | 59.6 | 68.2 | 68.2 | 68.2 | 68.9 | 65.7 | 69.9 | 66.5 | 71.6 | ||||||||||||||||||||
Molybdenum recovery | % | 30.4 | 19.9 | 35.0 | 26.5 | 30.8 | 20.2 | 28.9 | 26.8 | 21.6 | 30.5 | ||||||||||||||||||||
Contained metal in concentrate |
|
|
|
|
|
|
|
|
|
|
| ||||||||||||||||||||
Copper | tonnes | 20,803 |
| 11,504 |
| 19,290 |
| 113,825 |
| 26,659 |
| 31,091 |
| 24,232 |
| 31,843 |
| 122,178 |
| 30,834 |
| ||||||||||
Gold | ounces | 3,333 |
| 2,311 |
| 3,062 |
| 19,723 |
| 5,007 |
| 5,565 |
| 3,794 |
| 5,357 |
| 24,189 |
| 7,522 |
| ||||||||||
Silver | ounces | 430,208 |
| 253,687 |
| 461,302 |
| 2,504,769 |
| 631,774 |
| 686,258 |
| 551,807 |
| 634,930 |
| 2,729,859 |
| 750,747 |
| ||||||||||
Molybdenum | tonnes | 392 |
| 124 |
| 354 |
| 1,272 |
| 372 |
| 262 |
| 334 |
| 304 |
| 904 |
| 329 |
| ||||||||||
Precious metals2 | ounces | 8,167 |
| 5,161 |
| 8,245 |
| 55,506 |
| 14,033 |
| 15,369 |
| 11,677 |
| 14,427 |
| 63,187 |
| 18,247 |
| ||||||||||
Payable metal sold |
|
|
|
|
|
|
|
|
|
|
| ||||||||||||||||||||
Copper | tonnes | 21,654 |
| 9,023 |
| 19,247 |
| 106,184 |
| 28,430 |
| 25,314 |
| 25,778 |
| 26,662 |
| 116,449 |
| 31,252 |
| ||||||||||
Gold | ounces | 3,753 |
| 1,317 |
| 2,618 |
| 18,956 |
| 4,824 |
| 3,858 |
| 4,056 |
| 6,218 |
| 20,420 |
| 7,262 |
| ||||||||||
Silver | ounces | 433,595 |
| 242,519 |
| 361,591 |
| 2,452,496 |
| 666,839 |
| 529,139 |
| 504,259 |
| 752,259 |
| 2,255,700 |
| 672,756 |
| ||||||||||
Molybdenum | tonnes | 313 |
| 120 |
| 431 |
| 1,186 |
| 199 |
| 334 |
| 419 |
| 234 |
| 819 |
| 447 |
| ||||||||||
Peru combined unit operating cost,3, 4 | $/tonne | $ | 9.85 |
| $ | 7.77 |
| $ | 9.31 |
| $ | 9.50 |
| $ | 10.20 |
| $ | 8.63 |
| $ | 10.39 |
| $ | 8.87 |
| $ | 9.44 |
| $ | 9.88 |
|
Peru cash cost4 | $/lb | $ | 1.54 |
| $ | 1.31 |
| $ | 1.42 |
| $ | 1.16 |
| $ | 1.36 |
| $ | 1.06 |
| $ | 1.39 |
| $ | 0.90 |
| $ | 1.14 |
| $ | 1.05 |
|
Peru sustaining cash cost4 | $/lb | $ | 2.29 |
| $ | 1.84 |
| $ | 1.91 |
| $ | 1.65 |
| $ | 2.17 |
| $ | 1.53 |
| $ | 1.87 |
| $ | 1.13 |
| $ | 1.37 |
| $ | 1.40 |
|
1 Reported tonnes and grade for ore mined are estimates based on mine plan assumptions and may not fully reconcile to ore milled. | |||||||||||||||||||||||||||||||
2 Precious metals production includes gold and silver production on a gold-equivalent basis. For 2018 and 2019, silver is converted to gold at a ratio of 70:1. For 2020, silver is converted to gold at a ratio of 89:1. | |||||||||||||||||||||||||||||||
3 Reflects combined mine, mill and general and administrative ("G&A") costs per tonne of ore milled. Reflects the deduction of expected capitalized stripping costs. | |||||||||||||||||||||||||||||||
4 Combined unit costs, cash cost, and sustaining cash cost per pound of copper produced, net of by-product credits, are non-IFRS financial performance measures with no standardized definition under IFRS. For further information and a detailed reconciliation, please see the discussion under the "Non-IFRS Financial Reporting Measures" section of this MD&A. All comparative cash cost and all-in sustaining cash cost per pound of copper produced, net of by-product credits figures have been restated as indicated on page 45. | |||||||||||||||||||||||||||||||
|
| 2020 | 2019 | 2018 | |||||||||||||||||
|
| Q3 | Q2 | Q1 | 2019 | Q4 | Q3 | Q2 | Q1 | 2018 1 | Q4 | ||||||||||
Manitoba Operations |
|
|
|
|
|
|
|
|
|
|
| ||||||||||
Lalor ore mined | tonnes | 357,213 |
| 407,408 |
| 421,518 |
| 1,536,780 |
| 390,140 |
| 346,456 |
| 411,701 |
| 388,483 |
| 1,260,241 |
| 317,616 |
|
Copper | % | 0.66 | 0.77 | 0.70 | 0.75 | 0.80 | 0.68 | 0.73 | 0.76 | 0.74 | 0.82 | ||||||||||
Zinc | % | 5.98 | 6.05 | 5.43 | 6.36 | 6.20 | 6.16 | 6.34 | 6.70 | 6.25 | 6.80 | ||||||||||
Gold | g/tonne | 2.28 | 2.64 | 2.27 | 2.16 | 2.63 | 2.21 | 2.12 | 1.68 | 2.19 | 2.09 | ||||||||||
Silver | g/tonne | 21.23 | 28.4 | 26.18 | 25.51 | 28.38 | 25.56 | 22.32 | 25.96 | 25.39 | 24.66 | ||||||||||
777 ore mined | tonnes | 264,905 |
| 281,890 |
| 279,925 |
| 1,109,782 |
| 269,342 |
| 273,319 |
| 288,599 |
| 278,522 |
| 966,567 |
| 244,613 |
|
Copper | % | 0.98 | 1.72 | 1.18 | 1.37 | 1.17 | 1.33 | 1.34 | 1.65 | 1.47 | 1.76 | ||||||||||
Zinc | % | 3.95 | 4.13 | 4.11 | 3.22 | 3.33 | 3.01 | 3.37 | 3.18 | 4.43 | 3.46 | ||||||||||
Gold | g/tonne | 2.01 | 1.91 | 1.82 | 1.61 | 1.52 | 1.63 | 1.60 | 1.70 | 1.83 | 1.61 | ||||||||||
Silver | g/tonne | 24.25 | 25.73 | 23.86 | 18.67 | 18.52 | 15.42 | 18.92 | 21.75 | 28.34 | 24.37 | ||||||||||
Reed ore mined | tonnes | - |
| - |
| - |
| - |
| - |
| - |
| - |
| - |
| 326,363 |
| - |
|
Copper | % | - |
| - |
| - |
| - |
| - |
| - |
| - |
| - |
| 3.35 | - |
| |
Zinc | % | - |
| - |
| - |
| - |
| - |
| - |
| - |
| - |
| 0.90 | - |
| |
Gold | g/tonne | - |
| - |
| - |
| - |
| - |
| - |
| - |
| - |
| 0.77 | - |
| |
Silver | g/tonne | - |
| - |
| - |
| - |
| - |
| - |
| - |
| - |
| 9.08 | - |
| |
Stall Concentrator: |
|
|
|
|
|
|
|
|
|
| |||||||||||
Ore milled | tonnes | 335,739 |
| 334,601 |
| 369,787 |
| 1,290,300 |
| 310,622 |
| 318,539 |
| 339,616 |
| 321,523 |
| 1,201,466 |
| 313,995 |
|
Copper | % | 0.68 | 0.76 | 0.70 | 0.73 | 0.80 | 0.64 | 0.71 | 0.78 | 0.72 | 0.84 | ||||||||||
Zinc | % | 6.11 | 6.16 | 5.38 | 6.39 | 6.24 | 6.22 | 6.36 | 6.75 | 6.38 | 6.83 | ||||||||||
Gold | g/tonne | 2.35 | 2.70 | 2.28 | 2.13 | 2.60 | 2.12 | 2.08 | 1.75 | 2.15 | 2.09 | ||||||||||
Silver | g/tonne | 22.08 | 28.72 | 26.28 | 25.48 | 28.12 | 25.16 | 22.03 | 26.89 | 25.27 | 24.58 | ||||||||||
Copper recovery | % | 84.0 | 86.6 | 86.5 | 85.9 | 85.9 | 84.4 | 85.6 | 87.2 | 85.7 | 88.6 | ||||||||||
Zinc recovery | % | 92.7 | 92.4 | 91.4 | 91.1 | 90.7 | 91.8 | 91.2 | 90.7 | 92.8 | 91.9 | ||||||||||
Gold recovery | % | 57.4 | 62.3 | 60.9 | 56.8 | 61.1 | 54.3 | 52.5 | 59.1 | 57.6 | 57.1 | ||||||||||
Silver recovery | % | 57.5 | 62.1 | 61.1 | 60.4 | 62.9 | 57.4 | 56.5 | 64.2 | 59.2 | 60.7 | ||||||||||
Flin Flon Concentrator: |
|
|
|
|
|
|
|
|
|
| |||||||||||
Ore milled | tonnes | 322,156 |
| 324,906 |
| 332,589 |
| 1,362,006 |
| 374,529 |
| 331,216 |
| 367,017 |
| 289,244 |
| 1,423,744 |
| 259,569 |
|
Copper | % | 0.99 | 1.52 | 1.11 | 1.27 | 1.11 | 1.22 | 1.26 | 1.55 | 1.90 | 1.73 | ||||||||||
Zinc | % | 4.07 | 4.41 | 4.36 | 3.78 | 4.05 | 3.64 | 3.84 | 3.49 | 3.71 | 3.55 | ||||||||||
Gold | g/tonne | 1.99 | 1.99 | 1.88 | 1.72 | 1.75 | 1.74 | 1.71 | 1.66 | 1.63 | 1.62 | ||||||||||
Silver | g/tonne | 24.01 | 25.56 | 24.33 | 19.84 | 20.56 | 17.36 | 19.82 | 21.78 | 23.48 | 24.79 | ||||||||||
Copper recovery | % | 83.9 | 87.3 | 84.1 | 88.0 | 86.9 | 89.1 | 88.0 | 88.1 | 92.3 | 90.4 | ||||||||||
Zinc recovery | % | 87.9 | 84.9 | 85.0 | 85.5 | 85.8 | 86.7 | 86.0 | 82.9 | 84.2 | 83.7 | ||||||||||
Gold recovery | % | 55.3 | 58.6 | 53.5 | 59.4 | 56.1 | 59.1 | 61.3 | 61.8 | 64.5 | 62.8 | ||||||||||
Silver recovery | % | 42.0 | 50.7 | 44.3 | 50.8 | 49.2 | 48.7 | 53.0 | 52.3 | 60.2 | 54.8 | ||||||||||
1 Mining activities at Reed were completed in August 2018. | |||||||||||||||||||||
|
| 2020 | 2019 | 2018 | |||||||||||||||||||||||||||
|
| Q3 | Q2 | Q1 | 2019 | Q4 | Q3 | Q2 | Q1 | 2018 | Q4 | ||||||||||||||||||||
Manitoba Operations (continued) |
|
|
|
|
|
|
|
|
|
| |||||||||||||||||||||
Total Manitoba contained metal in concentrate produced |
|
|
|
|
|
|
|
|
| ||||||||||||||||||||||
Copper | tonnes | 4,592 |
| 6,522 |
| 5,345 |
| 23,354 |
| 5,763 |
| 5,331 |
| 6,131 |
| 6,129 |
| 32,272 |
| 6,404 |
| ||||||||||
Zinc | tonnes | 30,570 |
| 31,222 |
| 30,495 |
| 119,106 |
| 30,592 |
| 28,639 |
| 31,838 |
| 28,037 |
| 115,588 |
| 27,408 |
| ||||||||||
Gold | ounces | 25,944 |
| 30,303 |
| 27,293 |
| 94,969 |
| 27,705 |
| 22,754 |
| 24,305 |
| 20,205 |
| 95,693 |
| 20,529 |
| ||||||||||
Silver | ounces | 241,477 |
| 327,130 |
| 306,390 |
| 1,080,561 |
| 298,363 |
| 237,933 |
| 260,000 |
| 284,265 |
| 1,224,610 |
| 263,937 |
| ||||||||||
Precious metals1 | ounces | 28,657 |
| 33,979 |
| 30,736 |
| 110,406 |
| 31,967 |
| 26,153 |
| 28,019 |
| 24,266 |
| 113,188 |
| 24,300 |
| ||||||||||
Total Manitoba payable metal sold |
|
|
|
|
|
|
|
|
|
| |||||||||||||||||||||
Copper | tonnes | 4,249 |
| 6,928 |
| 4,825 |
| 22,335 |
| 5,285 |
| 4,602 |
| 7,393 |
| 5,055 |
| 31,474 |
| 5,098 |
| ||||||||||
Zinc2 | tonnes | 26,520 |
| 27,604 |
| 26,792 |
| 104,346 |
| 28,001 |
| 29,140 |
| 24,224 |
| 22,954 |
| 115,723 |
| 31,134 |
| ||||||||||
Gold | ounces | 26,852 |
| 29,273 |
| 23,956 |
| 90,043 |
| 25,520 |
| 21,630 |
| 26,482 |
| 16,411 |
| 92,677 |
| 18,599 |
| ||||||||||
Silver | ounces | 271,900 |
| 299,266 |
| 214,331 |
| 1,000,430 |
| 242,584 |
| 227,157 |
| 300,042 |
| 230,647 |
| 1,116,653 |
| 236,744 |
| ||||||||||
Manitoba combined unit operating cost3,4 | C$/tonne | $ | 126 |
| $ | 135 |
| $ | 127 |
| $ | 134 |
| $ | 128 |
| $ | 130 |
| $ | 135 |
| $ | 146 |
| $ | 130 |
| $ | 143 |
|
Manitoba cash cost4 | $/lb | $ | (3.41) |
| $ | (1.52) |
| $ | (0.62) |
| $ | (0.75) |
| $ | (1.26) |
| $ | (1.31) |
| $ | (0.79) |
| $ | 0.29 |
| $ | (1.16) |
| $ | (1.47) |
|
Manitoba sustaining cash cost4 | $/lb | $ | 0.83 |
| $ | 1.15 |
| $ | 2.53 |
| $ | 2.06 |
| $ | 1.83 |
| $ | 2.15 |
| $ | 1.55 |
| $ | 2.68 |
| $ | 0.66 |
| $ | 1.16 |
|
1 Precious metals production includes gold and silver production on a gold-equivalent basis. For 2018 and 2019, silver is converted to gold at a ratio of 70:1. For 2020, silver is converted to gold at a ratio of 89:1. | |||||||||||||||||||||||||||||||
2 Includes refined zinc metal sold. | |||||||||||||||||||||||||||||||
3 Reflects combined mine, mill and G&A costs per tonne of milled ore. | |||||||||||||||||||||||||||||||
4 Combined unit costs, cash cost, and sustaining cash cost per pound of copper produced, net of by-product credits, are non-IFRS financial performance measures with no standardized definition under IFRS. For further information and a detailed reconciliation, please see the discussion under the "Non-IFRS Financial Reporting Measures" section of this MD&A. All comparative cash cost and all-in sustaining cash cost per pound of copper produced, net of by-product credits figures have been restated as indicated on page 45. | |||||||||||||||||||||||||||||||