
Management's Discussion and Analysis of
Results of Operations and Financial Condition
For the year ended
December 31, 2020
February 18, 2021
INTRODUCTION
This Management's Discussion and Analysis ("MD&A") dated February 18, 2021 is intended to supplement Hudbay Minerals Inc.'s audited consolidated financial statements and related notes for the year ended December 31, 2020 (the "consolidated financial statements"). The consolidated financial statements have been prepared in accordance with International Financial Reporting Standards ("IFRS") as issued by the International Accounting Standards Board ("IASB").
References to "Hudbay", the "Company", "we", "us", "our" or similar terms refer to Hudbay Minerals Inc. and its direct and indirect subsidiaries as at December 31, 2020.
Readers should be aware that:
- This MD&A contains certain "forward-looking statements" and "forward-looking information" (collectively, "forward-looking information") that are subject to risk factors set out in a cautionary note contained in our MD&A. Please also refer to the risks discussed under the heading "Financial Risk Management" in this MD&A.
- This MD&A has been prepared in accordance with the requirements of the securities laws in effect in Canada, which may differ materially from the requirements of United States securities laws applicable to US issuers.
- We use a number of non-IFRS financial performance measures in our MD&A.
- The technical and scientific information in this MD&A has been approved by qualified persons based on a variety of assumptions and estimates.
For a discussion of each of the above matters, readers are urged to review the "Notes to Reader" discussion beginning on page 71 of this MD&A.
Additional information regarding Hudbay, including the risks related to our business and those that are reasonably likely to affect our consolidated financial statements in the future, is contained in our continuous disclosure materials, including our most recent Annual Information Form ("AIF"), consolidated financial statements and Management Information Circular available on SEDAR at www.sedar.com and on EDGAR at www.sec.gov.
All amounts are in US dollars unless otherwise noted.
OUR BUSINESS
We are a diversified mining company primarily producing copper concentrate (containing copper, gold, and silver) and zinc metal. Directly and through our subsidiaries, we own three polymetallic mines, four ore concentrators and a zinc production facility in northern Manitoba and Saskatchewan (Canada) and Cusco (Peru), and copper projects in Arizona and Nevada (United States). Our growth strategy is focused on the exploration, development, operation and optimization of properties we already control, as well as other mineral assets we may acquire that fit our strategic criteria. Our vision is to be a responsible, top-tier operator of long-life, low-cost mines in the Americas. We are governed by the Canada Business Corporations Act and our shares are listed under the symbol "HBM" on the Toronto Stock Exchange, New York Stock Exchange and Bolsa de Valores de Lima.
STRATEGY
Our mission is to create sustainable value through acquisition, development and operation of high quality, long life deposits with exploration potential in jurisdictions that support responsible mining, and to see the regions and communities in which we operate benefit from our presence.
We believe that the greatest opportunities for shareholder value creation in the mining industry are in the discovery and successful development of new mineral deposits, and through highly efficient low-cost operations to profitably extract ore from those deposits. We also believe that our successful development, ramp-up and operation of the Constancia open-pit mine in Peru, along with our long history of underground mining and full life-cycle experience in northern Manitoba provide us with a competitive advantage in these respects relative to other mining companies of similar scale.
Over the past decade, we have built a world-class asset base by employing a consistent long-term growth strategy. We intend to sustainably grow Hudbay through exploration and development of our robust project pipeline, as well as through the acquisition of other properties that fit our stringent strategic criteria. Furthermore, we continuously work to generate strong free cash flow and optimize the value of our producing asset portfolio through exploration, brownfield expansion projects, and efficient and safe operations.
To ensure that any capital allocation or acquisition we undertake creates sustainable value for stakeholders, we have established a number of criteria for evaluating mineral property opportunities. These include the following:
- Geography: Potential acquisitions should be located in jurisdictions that support responsible mining activity and have acceptable levels of political and social risk. Given our current scale and geographic footprint, our current geographic focus is on select investment grade countries in the Americas, with strong rule of law and respect for human rights consistent with our long-standing focus on environmental, social and governance ("ESG") principles;
- Commodity: Among the metals we produce, we believe copper has the best long-term supply/demand fundamentals and the greatest opportunities for sustained risk-adjusted returns. While our primary focus is on copper, we appreciate the polymetallic nature of deposits and, in particular, the counter-cyclical nature of gold production in our portfolio;
- Quality: We are focused on adding long-life, low-cost assets to our existing portfolio of high quality assets. Long life assets can capture peak pricing of multiple commodity price cycles and low cost assets can generate free cash flow even through the trough of price cycles;
- Potential: We consider the full spectrum of acquisition and investment opportunities from early-stage exploration to producing assets, but they must meet our stringent risk-adjusted criteria for growth and value creation. Regardless of the stage of development, we look for mineral assets that we believe offer significant incremental potential for exploration, development and optimization beyond the stated resources and mine plan;
- Process: Through a robust due diligence and capital allocation process, we develop a clear understanding of how we can create value from the investment or the acquired property through the application of our technical, social, operational and project execution expertise, as well as through the provision of necessary financial capacity and other operational optimization opportunities;
- Operatorship: We believe real value is created through leading efficient project development and operations. Hudbay's leadership team is well positioned to drive value and deliver effective capital allocation with our proven track record of successful project development and operational excellence.
- Financial: Investments and acquisitions should be accretive to Hudbay on a per share basis. Given that our strategic focus includes capital allocation to non-producing assets at various stages of development, when evaluating accretion, we will consider measures such as internal rate of return ("IRR"), return on invested capital ("ROIC"), net asset value per share and the contained value of reserves and resources per share.
Our key objectives for 2021 are to:
- Focus on operational efficiencies and maintain our low-costs of production to continue to generate positive cash flow and strong returns on invested capital;
- Execute development and commence mining activities at the high-grade Pampacancha satellite deposit, further enhancing Constancia's production and cost profile;
- Deliver the refurbishment of the New Britannia gold mill to significantly increase gold production from Lalor, completing the second phase of the Snow Lake gold strategy;
- Advance the appeals process and alternative options to unlock value at Rosemont;
- Progress the third phase of our Snow Lake gold strategy to further increase annual production scale by advancing studies to optimize recoveries, throughput, resource conversion and exploration;
- Maintain Constancia's industry-leading efficiency metrics by identifying areas of upside through continuous improvement initiatives at the mill and ongoing near-mine exploration;
- Drill regional copper exploration targets near Constancia, in northern Peru, and at Rosemont while continuing to advance exploration programs in the Snow Lake region, Peru and Nevada;
- Support our workforce, their families and the communities in which we operate through continuing to make health and safety a priority and providing ongoing COVID-19 support; and,
- Evaluate exploration, organic growth and acquisition opportunities that meet our stringent strategic criteria and allocate capital to pursue those opportunities that create sustainable value for the Company and our stakeholders.
SUMMARY
Fourth Quarter and Full Year Operating and Financial Results
- Achieved 2020 production and unit cost guidance in Peru and Manitoba; Manitoba copper production exceeded the top end of the guidance range and refined zinc metal production was higher than it has been in over ten years.
- Capitalized on higher gold prices as Manitoba annual gold sales volumes increased by 24% in 2020 compared to the prior year.
- Full production resumed at 777 on November 25 following a skip hoist incident in early October; shaft repair activities were completed well ahead of schedule and below expected costs.
- The Lalor mine and Stall concentrator both achieved record quarterly and annual production as 777 employees and equipment were redeployed to Lalor during the 777 shaft repair period.
- Constancia mine achieved excellent operational efficiencies during the quarter with a 16% increase in ore mined compared to the same quarter in 2019.
- Fourth quarter net earnings were $7.4 million or $0.03 per share. Fourth quarter adjusted net loss1 per share was $0.06 and adjusted EBITDA1 was $106.9 million.
- Operating cash flow before change in non-cash working capital increased to $86.1 million in the fourth quarter of 2020, from $69.1 million in the same quarter of 2019, due to higher realized copper and gold prices and higher gold sales volumes, partially offset by lower sales volumes of copper.
2021 Annual Guidance and Outlook
- Consolidated copper production is forecast to increase by 7%2 in 2021, compared to 2020, with a further increase expected in 2022 with higher grades at the Pampacancha deposit in Peru.
- Consolidated gold production is forecast to increase by 62%2 in 2021, compared to 2020, with a further increase expected in 2022 due to the first full year of production at the New Britannia mill and Pampacancha.
- 2021 unit operating costs are expected to be modestly higher than 2020 with the inclusion of the New Britannia mill in Manitoba and higher input costs in Peru. Introduced new 2021 consolidated cash cost guidance of $0.65 to $0.80 and consolidated sustaining cash cost guidance of $2.05 to $2.30, in each case, per pound of copper produced, net of by-product credits1.
- Updated mine plans will be issued for each of the Constancia and Snow Lake operations with our annual mineral reserve and resource update at the end of March 2021, incorporating the results from various optimization studies. The company will issue new three-year production guidance once the new mine plans are published.
- Total capital expenditures are expected to decline by 11%2 year-over-year as a majority of the Peru growth spending was completed in 2020, while a portion of Manitoba growth spending was deferred from 2020 to 2021.
- Increased exploration spending in 2021 to drill promising targets in Arizona, Peru and Snow Lake.
Executing on Growth Initiatives
- Advanced the New Britannia gold mill refurbishment project to approximately 73% completion and the project continues to track ahead of the original schedule. Total project capital is tracking approximately $13.0 million over budget due to additions to the project scope and the impact of COVID-related costs. Commissioning of the gold plant is expected in mid-2021, three months earlier than originally planned. The new copper flotation facility is on track for commissioning and ramp-up in the fourth quarter of 2021. Operational readiness activities are progressing as planned with underground development of Lalor's gold-rich lenses well-advanced in preparation for the start-up of New Britannia.
- Successfully completed the Consulta Previa consultation process for Pampacancha and received the final mining permit for the development and operation of the mine. Pre-development activities commenced in early January and pre-stripping activities are expected to begin once the remaining individual land user agreement has been completed.
- Advanced the appeal of the unprecedented Rosemont court decision with oral arguments presented on February 1st and continued to evaluate next steps for the project and advance drilling activities on our land package.
Summary of Fourth Quarter Results
Cash generated from operating activities in the fourth quarter of 2020 increased to $121.1 million compared to $98.7 million in the same quarter of 2019. Operating cash flow before change in non-cash working capital was $86.1 million during the fourth quarter of 2020, reflecting an increase of $17.0 million compared to the same period of 2019. The increase in operating cash flow is primarily the result of higher realized copper and gold prices and higher gold sales volume, partially offset by lower sales volumes of copper.
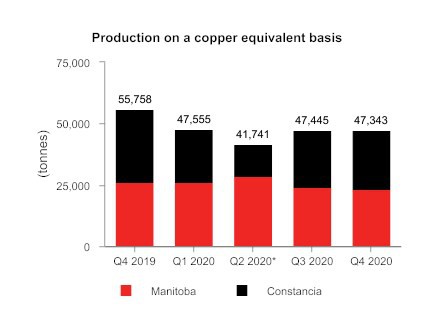
Copper-equivalent production in the fourth quarter of 2020 decreased by 15% compared to the same period in 2019 primarily as a result of lower copper grades at Constancia and lower production at 777 due to a shaft incident in October 2020 that resulted in a six-week suspension of hoisting operations.
Net earnings and earnings per share in the fourth quarter of 2020 were $7.4 million and $0.03, respectively, compared to a net loss and loss per share of $1.5 million and $0.01, respectively, in the fourth quarter of 2019. Fourth quarter earnings benefited from higher realized prices for base metals and gold which was partially offset by lower sales volumes of copper due to lower Constancia grades. In addition, we recorded a $28.0 million mark-to-market net gain on certain financial instruments, including a $40.3 million non-cash gain on the revaluation of the embedded derivative on our senior notes due in 2025. Partially offsetting these gains was the accounting effect related to the 777 production interruption. This resulted in fixed overhead production costs of $11.7 million, which would normally be capitalized to inventories, being immediately expensed as part of our cost of sales with no corresponding revenue benefit.
After adjusting for the 777 fixed overhead costs and the net mark-to-market gain on financial instruments, among other items, adjusted net loss1 and adjusted EBITDA1 in the fourth quarter of 2020 were $16.4 million, or $0.06 per share, and $106.9 million, respectively. This compares to an adjusted net loss and adjusted EBITDA of $24.6 million, or $0.09 per share, and $82.2 million, respectively, in the same period of 2019. The favourable movements in adjusted EBITDA and adjusted net loss, as compared to the fourth quarter of 2019, primarily included the same factors that benefited net earnings.
In the fourth quarter of 2020, consolidated cash cost per pound of copper produced, net of by-product credits1, was $0.43, compared to $0.90 in the same period last year. The overall decrease in this measure was a result of higher by-product credit revenues mainly driven by a significant increase in Manitoba's gold revenue compared to the same period in 2019; this was partially offset by a decline in copper production at Constancia due to lower grades. Incorporating sustaining capital, capitalized exploration, royalties, selling, administrative and regional costs, consolidated all-in sustaining cash cost per pound of copper produced, net of by-product credits1, in the fourth quarter of 2020 was $2.24, which increased slightly from $2.22 in the same period last year. The marginal increase in consolidated all-in sustaining cash cost was mostly a result of higher sustaining capital expenditures, as well as increased corporate selling and administrative costs due to higher stock-based compensation expense.
Summary of Full Year Results
Cash generated from operating activities decreased to $239.5 million in 2020 from $310.9 million in 2019. Operating cash flow before change in non-cash working capital decreased to $241.9 million from $307.3 million in 2019. The decrease is the result of significantly lower copper sales volumes due to an eight-week suspension of Constancia operations in Peru following a government declared state of emergency and a six-week production interruption at the 777 mine in Manitoba. The lower copper sales volumes were only partially offset by higher realized sales prices for copper and precious metals.
Net loss and loss per share for 2020 were $144.6 million and $0.55, respectively, compared to a net loss and loss per share of $343.8 million and $1.32, respectively, in 2019. The 2019 loss was mainly caused by an after-tax impairment charge of $242.1 million recorded in our investment in the Rosemont project. Gross margins declined in 2020 in part due to multi-week operational suspensions at Constancia and 777 causing certain fixed overhead production costs to be immediately expensed as part of our cost of sales with no corresponding revenue benefit. Consolidated cash costs per pound of copper produced, net of by-product credits, were 28% lower, mainly as a result of increased by-product credit revenues, partially offset by lower copper production from lower grades at Constancia and reduced Constancia production from the eight-week suspension of operations.
On a consolidated basis, our copper, zinc and precious metals production met 2020 guidance ranges. Production of copper in Manitoba exceeded the top end of the guidance range, while copper production in Peru was within the revised guidance range. When compared to 2019 production levels, 2020 copper production in Peru was lower due to lower copper grades, as well as an eight-week suspension of Constancia operations due to a government declared state of emergency at the onset of the COVID-19 pandemic (which caused us to update our Peru guidance with our second quarter results). Combined unit costs in Peru and Manitoba were within 2020 guidance ranges. Total capital expenditures were above 2020 guidance in large part due to costs associated with individual land user agreements that were not included in the Company's initial growth capital guidance for Peru, as previously disclosed, due to the ongoing nature of the negotiations.
*Reflects Constancia temporary suspension of operations in April and May.
1 Adjusted net loss and adjusted net loss per share, adjusted EBITDA, cash cost, all-in sustaining cash cost per pound of copper produced, net of by-product credits, and net debt are non-IFRS financial performance measures with no standardized definition under IFRS. For further information and a detailed reconciliation, please see the discussion under the "Non-IFRS Financial Reporting Measures" section of this MD&A.
2 Year-over-year forecast changes assume the mid-point of the respective guidance range is achieved.
KEY FINANCIAL RESULTS
Financial Condition | Dec. 31, 2020 | Dec. 31, 2019 |
(in $ thousands) |
Cash and cash equivalents | 439,135 | 396,146 |
Total long-term debt | 1,135,675 | 985,255 |
Net debt1 | 696,540 | 589,109 |
Working capital | 306,888 | 271,284 |
Total assets | 4,666,645 | 4,461,057 |
Equity | 1,699,806 | 1,848,123 |
1 Net debt is a non-IFRS financial performance measure with no standardized definition under IFRS. For further information and a detailed reconciliation, please see discussion under the "Non-IFRS Financial Reporting Measures" section of this MD&A. |
Financial Performance | Three months ended | Year ended |
(in $ thousands, except per share amounts) | Dec. 31, 2020 | | Dec. 31, 2019 | Dec. 31, 2020 | | Dec. 31, 2019 |
Revenue | $ | 322,290 | | | $ | 324,485 | | $ | 1,092,418 | | | $ | 1,237,439 | |
Cost of sales | 287,923 | | | 298,852 | | 1,053,418 | | | 1,085,897 | |
Profit (loss) before tax | 911 | | | (42,352) | | (179,089) | | | (452,763) | |
Net profit (loss) | 7,406 | | | (1,455) | | (144,584) | | | (343,810) | |
Basic and diluted loss per share | 0.03 | | | (0.01) | | (0.55) | | | (1.32) | |
Adjusted loss per share1 | (0.06) | | | (0.09) | | (0.46) | | | (0.18) | |
Operating cash flow before change in non-cash working capital2 | 86.1 | | | 69.1 | | 241.9 | | | 307.3 | |
Adjusted EBITDA1,2 | 106.9 | | | 82.2 | | 306.7 | | | 358.5 | |
1 Adjusted loss per share and adjusted EBITDA are non-IFRS financial performance measures with no standardized definition under IFRS. For further information and a detailed reconciliation, please see discussion under the "Non-IFRS Financial Reporting Measures" section of this MD&A. |
2 In millions. |
KEY PRODUCTION RESULTS
| Three months ended | | Three months ended |
Dec. 31, 2020 | | Dec. 31, 2019 |
Peru | Manitoba | Total | | Peru | Manitoba | Total |
Contained metal in concentrate produced 1 | | | | | | |
Copper | | tonnes | 21,554 | | 5,724 | | 27,278 | | | 26,659 | | 5,763 | | 32,422 | |
Gold | | oz | 3,689 | | 28,687 | | 32,376 | | | 5,007 | | 27,705 | | 32,712 | |
Silver | | oz | 477,775 | | 252,904 | | 730,679 | | | 631,774 | | 298,363 | | 930,137 | |
Zinc | | tonnes | - | | 25,843 | | 25,843 | | | - | | 30,592 | | 30,592 | |
Molybdenum | | tonnes | 333 | | - | | 333 | | | 372 | | - | | 372 | |
Payable metal sold | | | | | | | |
Copper | | tonnes | 18,583 | | 4,380 | | 22,963 | | | 28,430 | | 5,285 | | 33,715 | |
Gold | | oz | 3,297 | | 31,882 | | 35,179 | | | 4,824 | | 25,520 | | 30,344 | |
Silver | | oz | 480,843 | | 281,541 | | 762,384 | | | 666,839 | | 242,584 | | 909,423 | |
Zinc 2 | | tonnes | - | | 28,431 | | 28,431 | | | - | | 28,001 | | 28,001 | |
Molybdenum | | tonnes | 457 | | - | | 457 | | | 199 | | - | | 199 | |
| | | | | | | | | |
Cash cost 3 | | $/lb | 1.47 | | (3.48) | | 0.43 | | | 1.36 | | (1.26) | | 0.90 | |
Sustaining cash cost 3 | | $/lb | 2.58 | | (0.36) | | 1.97 | | | 2.17 | | 1.83 | | 2.11 | |
All-in sustaining cash cost3 | | $/lb | | | 2.24 | | | | | 2.22 | |
| Year ended | | Year ended |
Dec. 31, 2020 | | Dec. 31, 2019 |
Peru | Manitoba | Total | | Peru | Manitoba | Total |
Contained metal in concentrate produced 1 | | | | | | |
Copper | | tonnes | 73,150 | | 22,183 | | 95,333 | | | 113,825 | | 23,354 | | 137,179 | |
Gold | | oz | 12,395 | | 112,227 | | 124,622 | | | 19,723 | | 94,969 | | 114,692 | |
Silver | | oz | 1,622,972 | | 1,127,901 | | 2,750,873 | | | 2,504,769 | | 1,080,561 | | 3,585,330 | |
Zinc | | tonnes | - | | 118,130 | | 118,130 | | | - | | 119,106 | | 119,106 | |
Molybdenum | | tonnes | 1,204 | | - | | 1,204 | | | 1,272 | | - | | 1,272 | |
Payable metal sold | | | | | | | |
Copper | | tonnes | 68,506 | | 20,382 | | 88,888 | | | 106,184 | | 22,335 | | 128,519 | |
Gold | | oz | 10,986 | | 111,963 | | 122,949 | | | 18,956 | | 90,043 | | 108,999 | |
Silver | | oz | 1,518,548 | | 1,067,038 | | 2,585,586 | | | 2,452,496 | | 1,000,430 | | 3,452,926 | |
Zinc 2 | | tonnes | - | | 109,347 | | 109,347 | | | - | | 104,319 | | 104,319 | |
Molybdenum | | tonnes | 1,321 | | - | | 1,321 | | | 1,186 | | - | | 1,186 | |
| | | | | | | | | |
Cash cost 3 | | $/lb | 1.45 | | (2.20) | | 0.60 | | | 1.16 | | (0.75) | | 0.83 | |
Sustaining cash cost 3 | | $/lb | 2.20 | | 1.02 | | 1.93 | | | 1.65 | | 2.07 | | 1.72 | |
All-in sustaining cash cost3 | | $/lb | | | 2.16 | | | | | 1.86 | |
1 Metal reported in concentrate is prior to deductions associated with smelter contract terms. |
2 Includes refined zinc metal sold. |
3 Cash cost, sustaining cash cost and all-in sustaining cash cost per pound of copper produced, net of by-product credits are non-IFRS financial performance measures with no standardized definition under IFRS. For further information and a detailed reconciliation, please see the discussion under the "Non-IFRS Financial Reporting Measures" section of this MD&A. |
RECENT DEVELOPMENTS
COVID-19 Business Update
The Company continues to manage and respond to the COVID-19 pandemic and has implemented preventative measures to ensure the safety of our workforce, their families, and the communities in which we operate. During the fourth quarter, production disruptions due to COVID-19 were minimal and there was no material impact on the delivery of goods to or from our operations. We continue to closely monitor the evolution of the pandemic in each of our operating regions and are reviewing and adapting our procedures based on the latest local situation. While we have had members of our workforce contract COVID-19, to date we have not identified cases of transmission within our workplaces, or transmission between rotational employees and local communities.
On January 26, 2021, the Peruvian government announced heightened restrictions in order to help mitigate the spread of COVID-19. Under these new measures, all provinces of Peru are categorized as High, Very High, or Extreme, with corresponding levels of restrictions, including daily curfews and restrictions on domestic travel. Parts of Lima and Cusco, two regions where we operate, are currently classified as Extreme and Very High, respectively. The new measures are expected to remain in place at least until February 28, 2021, at which point the government of Peru is expected to reevaluate the classifications and the associated restrictions.
On January 28, 2021, in an effort to continue to reduce the COVID-19 cases in the province, the Manitoba government issued a public health order mandating a 14-day self-isolation period for anyone returning or coming to Manitoba from all jurisdictions. This order provides certain allowances for workers travelling to work and is not expected to impact Hudbay's ability to maintain required workforce levels. Our protocols of testing and pre-screening incoming workers continue to be in effect.
Lalor Mine and the New Britannia Mill Refurbishment Update
The New Britannia refurbishment project is ahead of the original schedule. Overall project progress is approximately 73% complete. Construction of the new copper flotation building continues to advance as planned and construction of the pipeline between the New Britannia and Stall mills has been completed.
Total project spending on the New Britannia refurbishment project is forecast to be approximately $13.0 million higher than budget due to project scope additions and COVID-19 related costs, identified through a higher classification of the project capital estimate as the project nears completion. The additions to the project scope were as a result of changes to the Stall tailings pipeline configuration due to processing considerations, in addition to the implemented scope changes relating to the installation of temporary modular copper flotation cells to achieve early gold production at the gold plant. COVID-19 related costs are as a result of the additional costs associated with remote project management and pandemic safety protocols.
Refurbishment activities at the gold plant continue to remain ahead of the original schedule with commissioning expected to be completed in mid-2021. Ramp-up and first production at the gold plant is expected early in the third quarter of 2021. Copper flotation building construction activities are on track for commissioning and ramp-up during the fourth quarter of 2021.
Operational readiness activities in support of the early start-up of New Britannia are on track. Lalor continues to exceed underground development rates in gold-rich lenses 25 and 27, and in preparation for the mid-year startup of New Britannia, a stockpile of 12,000 tonnes of gold ore was established on surface during the fourth quarter of 2020. The gold ore stockpile is expected to grow over the first half of 2021 and supply sufficient feed to facilitate a quick ramp up of the gold plant.
Once the New Britannia mill is fully ramped-up, average annual gold production from Lalor is expected to increase to over 150,000 ounces commencing in 2022 at cash costs and sustaining cash costs, net of by-product credits, of approximately $480 and $655 per ounce, respectively, during the first eight years of the gold plant's operation.
Pampacancha Update
We completed the Pampacancha surface rights agreement with the local community of Chilloroya in February 2020. Throughout the remainder of the year, we focused on advancing the consultation process between the government and the Chilloroya community as per Peru's Consulta Previa law. Despite challenges presented by the pandemic, the Consulta Previa process was completed at the end of the year, and in early January 2021, we received the final mining permit for the development and operation of Pampacancha.
In January 2021, Hudbay commenced limited pre-development activities for Pampacancha, including haul road construction and site preparation work. The company continues to advance discussions with the remaining land user family at Pampacancha. Pre-stripping activities are expected to commence once the remaining land user agreement has been completed.
In late January 2021, new COVID-19 restrictions were announced by the government of Peru. As a result of these restrictions and the need to complete the remaining land user agreements, we no longer expect to mine four million tonnes of ore from the Pampacancha deposit by June 30, 2021. If we fail to meet this milestone, we will be required to deliver an additional 8,020 ounces of gold to Wheaton Precious Metals ("Wheaton") in equal quarterly installments, at prevailing market prices, starting September 30, 2021. Hudbay and Wheaton are currently in discussions about, among other things, alternatives to defer the additional gold deliveries over the Pampacancha mine life.
Rosemont Update
The appeal of the unprecedented Rosemont court decision with the U.S. Court of Appeals for the Ninth Circuit ("Ninth Circuit") continues to advance with final briefs filed in November 2020 and the oral hearing completed in early February 2021. A decision from the Ninth Circuit is expected in the second half of 2021.
We have completed the initial drill program on our wholly owned private land located near Rosemont in a historic mining district called Helvetia. The focus of the program was to complete condemnation drilling for Rosemont and to test the Helvetia copper district for future exploration potential. The drill program consisted of 60 holes with several intersecting sulphide or oxide mineralization. Full assay results are pending.
Other Key Strategic Initiatives
Snow Lake Expansion Potential
We continue to advance various studies as part of phase three of our Snow Lake gold strategy. We expect to publish an updated mine plan for our Snow Lake operations with our annual mineral reserves and resources update at the end of March 2021. The updated mine plan is expected to incorporate the following upside opportunities:
• Increased Lalor Mine Production Rate - At the Lalor mine, we were pleased with the production increase achieved during the fourth quarter as a result of the allocation of additional mining resources from 777 to Lalor while the 777 shaft repairs were being completed. During this period, Lalor's mine output increased by an average of 650 tonnes per day above the normal level. The updated mine plan will contemplate a higher production rate at the Lalor mine after the 777 mine closes in mid-2022.
• 1901 Deposit Prefeasibility Study - After releasing an upgraded resource estimate for the 1901 deposit in August 2020, we initiated engineering activities to develop a viable mine plan for the 1901 deposit that could supplement production from Lalor to take advantage of the future processing capacity of our mills in the Snow Lake region. The study will initially focus on the base metal zones with the gold zone in the inferred category remaining as future upside potential for the deposit. The results will be reflected in our updated mine plan for Snow Lake.
• Stall Recovery Improvement Study - We are exploring various technological enhancements at the Stall mill to potentially increase gold and copper recoveries, which could create further value for Lalor and the other deposits in the Snow Lake region.
We believe the updated mine plan will optimize our milling capacity in Snow Lake with an expected higher production rate at Lalor and the incorporation of the 1901 deposit into the operations. There remains the potential to expand the New Britannia mill capacity beyond the currently planned 1,500 tonnes per day and this opportunity is expected to be examined in the future once the updated mine plan enhancements have been implemented.
Constancia Regional Exploration
We are evaluating and integrating the results from the recent drill programs at Constancia North into our annual mineral reserve and resource estimate update for Constancia at the end of March 2021. The drill program intersected copper porphyry and high-grade skarn mineralization within 300 metres of the northern edge of the current Constancia pit. The mineralization remains open to the north.
We continue to advance the regional exploration programs in Peru. In early 2021, we commenced drilling on the Quehuincha North high-grade skarn target located approximately 10 kilometres from Constancia's processing facilities. Exploration agreement discussions with the community of Uchucarcco on the Maria Reyna and Caballito properties are progressing. Maria Reyna is a prospective copper skarn-porphyry target and Caballito is a past-producing copper oxide mine, both of which are located within 10 kilometers north of Constancia. We also expect to commence drilling at our Llaguen property in the second quarter of 2021, after receiving all required drill permits in 2020. Llaguen is a copper porphyry target located in northern Peru, near the city of Trujillo and in close proximity to existing infrastructure.
Collective Bargaining Agreements
The three-year collective bargaining agreements with Hudbay's unionized workforces at each of our Peru and Manitoba operations expired on or about December 31, 2020. We are engaged in discussions with the labour unions in each jurisdiction as we work toward renewing the collective agreements.
Dividend Declared
A semi-annual dividend of C$0.01 per share was declared on February 18, 2021. The dividend will be paid out on March 26, 2021 to shareholders of record as of March 9, 2021.
CONSTANCIA OPERATIONS REVIEW
| | Three months ended | | Year ended | | Guidance |
| Dec. 31, 2020 | | Dec. 31, 2019 | | Dec. 31, 2020 | | Dec. 31, 2019 | | Annual |
| 2020 1 | 2021 |
Ore mined 2 | tonnes | | 9,313,784 | | 8,049,063 | | 27,529,950 | | 33,308,369 | | | |
Copper | % | | 0.31 | | 0.41 | | 0.32 | | 0.43 | | | |
Gold | g/tonne | | 0.03 | | 0.04 | | 0.03 | | 0.04 | | | |
Silver | g/tonne | | 2.61 | | 3.87 | | 2.75 | | 3.76 | | | |
Molybdenum | % | | 0.01 | | 0.02 | | 0.02 | | 0.02 | | | |
| | | | | | | | | | | | |
Ore milled | tonnes | | 7,741,714 | | 7,474,136 | | 26,297,318 | | 31,387,281 | | | |
Copper | % | | 0.33 | | 0.42 | | 0.34 | | 0.42 | | | |
Gold | g/tonne | | 0.03 | | 0.04 | | 0.03 | | 0.04 | | | |
Silver | g/tonne | | 2.74 | | 3.86 | | 2.87 | | 3.64 | | | |
Molybdenum | % | | 0.02 | | 0.02 | | 0.02 | | 0.02 | | | |
| | | | | | | | | | | | |
Copper concentrate | tonnes | | 94,552 | | 114,201 | | 321,395 | | 487,772 | | | |
Concentrate grade | % Cu | | 22.80 | | 23.34 | | 22.76 | | 23.34 | | | |
| | | | | | | | | | | | |
Copper recovery | % | | 85.3 | | 85.6 | | 83.0 | | 85.7 | | | |
Gold recovery | % | | 52.7 | | 50.0 | | 49.8 | | 48.1 | | | |
Silver recovery | % | | 70.1 | | 68.2 | | 66.9 | | 68.2 | | | |
Molybdenum recovery | % | | 28.4 | | 30.8 | | 29.4 | | 26.5 | | | |
| | | | | | | | | | | | |
Combined unit operating costs3,4 | $/tonne | | 10.17 | | 10.20 | | 9.46 | | 9.50 | | 8.30 - 10.00 | 8.90 - 10.90 |
1 Updated Peru guidance issued August 11, 2020. | |
2 Reported tonnes and grade for ore mined are estimates based on mine plan assumptions and may not reconcile fully to ore milled. |
3 Reflects combined mine, mill and general and administrative ("G&A") costs per tonne of ore milled. Reflects the deduction of expected capitalized stripping costs. |
4 Combined unit costs is a non-IFRS financial performance measure with no standardized definition under IFRS. For further information and a detailed reconciliation, please see the discussion under the "Non-IFRS Financial Reporting Measures" section of this MD&A. |
The Constancia team continues to deliver strong operating performance despite the environment of strict ongoing COVID-19 measures and controls. We continue to work collaboratively with the local health authorities to ensure our workforce and partners adhere to our COVID-19 protocols while continuing to operate safely and efficiently.
The Constancia mine achieved excellent operational efficiencies during the quarter with a 16% increase in ore mined compared to the fourth quarter of 2019.
Ore milled during the fourth quarter of 2020 was 4% higher compared to the same period in 2019 due to the deferral of a fourth quarter plant maintenance shutdown to January 2021. This was partially offset by increased ore hardness that limited throughput, as compared to the same period in 2019. Milled gold, silver and copper grades in the fourth quarter were approximately 25%, 29% and 21% lower, respectively, than the same period in 2019. Copper recoveries in the fourth quarter of 2020 remained consistent with the same period in 2019 as the impact of lower grades was offset by lower contaminants in the current mining phase of the pit and flotation process improvements.
Combined mine, mill and G&A unit operating costs in the fourth quarter of 2020 were in line with the same period in 2019, primarily due to a higher volume of ore milled as a result of the delayed plant maintenance which led to reduced operating costs at the mill. This was partially offset by higher mining costs and lower capitalized stripping expenditures.
Full year combined unit operating costs were in line with 2019 as lower production, caused by an eight-week suspension of operations, was offset by a corresponding decrease in mine, mill and general and administrative costs.
Contained metal in concentrate produced | Three months ended | | Year ended | | Guidance |
Dec. 31, 2020 | | Dec. 31, 2019 | | Dec. 31, 2020 | | Dec. 31, 2019 | | Annual |
| 2020 1 | 2021 |
Copper | tonnes | 21,554 | | 26,659 | | 73,150 | | 113,825 | | 65,000 - 75,000 | 72,000 - 88,000 |
Gold | oz | 3,689 | | 5,007 | | 12,395 | | 19,723 | | - | 40,000 - 50,000 |
Silver | oz | 477,775 | | 631,774 | | 1,622,972 | | 2,504,769 | | - | 1,800,000 - 2,170,000 |
Molybdenum | tonnes | 333 | | 372 | | 1,204 | | 1,272 | | 1,100- 1,300 | 1,400 - 1,700 |
Precious metals2 | oz | 9,058 | | 14,033 | | 30,630 | | 55,506 | | 25,000 - 35,000 | - |
1 Updated Peru guidance issued August 11, 2020. | |
2 Precious metals production includes gold and silver production on a gold-equivalent basis. For 2019, silver is converted to gold at a ratio of 70:1. For 2020, silver is converted to gold at a ratio of 89:1. |
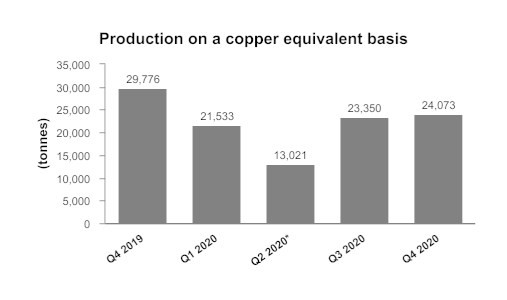
In the fourth quarter of 2020, production of copper, gold and silver were 19%, 26%, and 24% lower, respectively, than the same period in 2019 due to lower grades. Full year 2020 production of copper, gold and silver were 36%, 37%, and 35% lower, respectively, compared to 2019, due to the same reasons as the fourth quarter variances as well as the suspension of operations in the second quarter of 2020.
Molybdenum production in the fourth quarter of 2020 was lower than the same period in 2019 due to lower ore grades and recoveries. Full year 2020 molybdenum production was also lower than the same period in 2019 due to the eight-week suspension of operations as well as lower grades, partially offset by higher recoveries.
Full year production of all metals and unit operating costs at Constancia achieved the revised full year guidance ranges for 2020.
*Reflects Constancia temporary suspension of operations in April and May.
Peru Cash Cost and Sustaining Cash Cost
| | Three months ended | | Year ended |
| Dec. 31, 2020 | | Dec. 31, 2019 | | Dec. 31, 2020 | | Dec. 31, 2019 |
Cash cost per pound of copper produced, net of by-product credits1 | $/lb | | 1.47 | | 1.36 | | 1.45 | | 1.16 |
Sustaining cash cost per pound of copper produced, net of by-product credits1 | $/lb | | 2.58 | | 2.17 | | 2.20 | | 1.65 |
1 Cash cost and sustaining cash costs per pound of copper produced, net of by-product credits, are not recognized under IFRS. For more detail on these non-IFRS financial performance measures, please see the discussion under the "Non-IFRS Financial Performance Measures" section of this MD&A. |
Cash cost per pound of copper produced, net of by-product credits, for the three months and year ended December 31, 2020 were $1.47 and $1.45, respectively. Cash cost increased 8% and 25%, respectively, compared to the same periods in 2019. The overall increase is primarily due to lower copper production caused by lower grades as we progress through the mine plan, and, in the case of full year 2020 copper production, an eight-week suspension of Constancia operations during the second quarter.
Sustaining cash cost per pound of copper produced, net of by-product credits increased by 19% compared to the fourth quarter of 2019, mainly due to the same factors noted above affecting cash costs as well as elevated sustaining capital spending in the fourth quarter of 2020 following a full ramp up of Constancia operations to normal levels in the second half of 2020. Sustaining cash cost increased 33% on a year-to-date basis, primarily due to the same factors noted above.

Metal Sold
| | Three months ended | | Year ended |
| Dec. 31, 2020 | | Dec. 31, 2019 | | Dec. 31, 2020 | | Dec. 31, 2019 |
Payable metal in concentrate | | | | | | | | | |
Copper | tonnes | | 18,583 | | 28,430 | | | 68,506 | | 106,184 |
Gold | oz | | 3,297 | | 4,824 | | 10,986 | | 18,956 |
Silver | oz | | 480,843 | | 666,839 | | 1,518,548 | | 2,452,496 |
Molybdenum | tonnes | | 457 | | 199 | | | 1,321 | | 1,186 |
Quantities of payable metal sold for the year ended December 31, 2020 were lower than the same period in 2019 primarily for the same reasons that affected contained metal production as well as the relative timing of shipments.
MANITOBA OPERATIONS REVIEW
Mines
| | Three months ended | | Year ended |
| Dec. 31, 2020 | Dec. 31, 2019 | | Dec. 31, 2020 | | Dec. 31, 2019 |
Lalor | | | | | | | | |
Ore | tonnes | | 468,101 | 390,140 | | 1,654,240 | | 1,536,780 |
Copper | % | | 0.80 | 0.80 | | 0.74 | | 0.75 |
Zinc | % | | 5.54 | 6.20 | | 5.73 | | 6.36 |
Gold | g/tonne | | 2.79 | 2.63 | | 2.51 | | 2.16 |
Silver | g/tonne | | 24.96 | 28.38 | | 25.31 | | 25.51 |
777 | | | | | | | |
Ore | tonnes | | 164,856 | 269,342 | | 991,576 | | 1,109,782 |
Copper | % | | 1.89 | 1.17 | | 1.40 | | 1.37 |
Zinc | % | | 2.98 | 3.33 | | 3.88 | | 3.22 |
Gold | g/tonne | | 1.85 | 1.52 | | 1.90 | | 1.61 |
Silver | g/tonne | | 21.64 | 18.52 | | 24.13 | | 18.67 |
Total Mines | | | | | | | | |
Ore | tonnes | | 632,957 | 659,482 | | 2,645,816 | | 2,646,562 |
Copper | % | | 1.08 | 0.95 | | 0.98 | | 1.01 |
Zinc | % | | 4.87 | 5.03 | | 5.04 | | 5.04 |
Gold | g/tonne | | 2.55 | 2.18 | | 2.29 | | 1.93 |
Silver | g/tonne | | 24.10 | 24.35 | | 24.87 | | 22.64 |
Unit Operating Costs1,2 | | Three months ended | | Year ended |
| Dec. 31, 2020 | Dec. 31, 2019 | | Dec. 31, 2020 | | Dec. 31, 2019 |
Mines | | | | | | | | |
Lalor | C$/tonne | | 98.74 | | 99.90 | | | 96.51 | | | 104.42 | |
777 | C$/tonne | | 87.17 | | 82.35 | | | 79.94 | | | 79.02 | |
Total Mines | C$/tonne | | 95.73 | | 92.73 | | | 90.30 | | | 93.77 | |
1 Reflects costs per tonne of ore mined. | | | | | | | | |
2 Unit costs is a non-IFRS financial performance measure with no standardized definition under IFRS. For further information and a detailed reconciliation, please see the discussion under the "Non-IFRS Financial Reporting Measures" section of this MD&A. |
The Manitoba business unit had strong operating performance across the mines, mills and zinc plant during the fourth quarter despite the 777 shaft incident, which resulted in the suspension of hoisting operations for six weeks. In the face of the growing COVID-19 pandemic, we added new controls at the Snow Lake camp by introducing point of care PCR testing while maintaining the existing controls that were developed in the early part of the year. Our health and safety committees have continued to work collaboratively with local health units with a focus on keeping our employees and communities safe.
The coordinated business unit response to the 777 shaft incident focused on mitigating production losses by efficiently completing the repairs in the shaft, allowing the mine to return to normal operations quicker than expected. A business continuity plan was established that relocated employees and equipment from 777 to Lalor and utilized Lalor's ramp to truck additional ore to surface from the upper parts of the mine at a rate of approximately 650 tonnes per day. This plan was successfully executed allowing Lalor to achieve record quarterly production, averaging over 5,000 tonnes per day in the quarter. Lalor continued to produce at a higher tonnage rate through the month of December mainly due to ongoing continuous improvement initiatives.
Total unit operating costs for the mines during the fourth quarter of 2020 increased by 3% compared to the same period in 2019 mainly due to higher unit costs at 777 due to lower tonnage in the quarter. Full year total unit operating costs for the mines decreased by 4% due to lower Lalor unit costs.
Processing Facilities
| | Three months ended | | Year ended |
| Dec. 31, 2020 | Dec. 31, 2019 | | Dec. 31, 2020 | | Dec. 31, 2019 |
Stall Concentrator | | | | | | | | |
Ore | tonnes | | 372,624 | 310,622 | | 1,412,751 | | 1,290,300 |
Copper | % | | 0.79 | 0.80 | | 0.73 | | 0.73 |
Zinc | % | | 5.47 | 6.24 | | 5.76 | | 6.39 |
Gold | g/tonne | | 2.88 | 2.60 | | 2.55 | | 2.13 |
Silver | g/tonne | | 24.43 | 28.12 | | 25.37 | | 25.48 |
| | | | | | | | |
Copper concentrate | tonnes | | 14,271 | 10,930 | | 47,680 | | 40,856 |
Concentrate grade | % Cu | | 18.03 | 19.56 | | 18.74 | | 19.86 |
| | | | | | | | |
Zinc concentrate | tonnes | | 36,395 | 35,173 | | 147,862 | | 147,227 |
Concentrate grade | % Zn | | 50.89 | 49.96 | | 50.57 | | 51.04 |
| | | | | | | | |
Copper recovery | % | | 87.1 | 85.9 | | 86.2 | | 85.9 |
Zinc recovery | % | | 90.9 | 90.7 | | 91.9 | | 91.1 |
Gold recovery | % | | 59.5 | 61.1 | | 60.0 | | 56.8 |
Silver recovery | % | | 60.3 | 62.9 | | 60.4 | | 60.4 |
| | | | | | | | |
Contained metal in concentrate produced | | | | | |
Copper | tonnes | | 2,572 | 2,138 | | 8,934 | | 8,113 |
Zinc | tonnes | | 18,520 | 17,574 | | 74,776 | | 75,144 |
Precious metals1 | oz | | 22,491 | 18,394 | | 77,482 | | 59,394 |
| | | | | | | | |
Flin Flon Concentrator | | | | | | | | |
Ore | tonnes | | 225,663 | 374,529 | | 1,205,314 | | 1,362,006 |
Copper | % | | 1.59 | 1.11 | | 1.28 | | 1.27 |
Zinc | % | | 3.87 | 4.05 | | 4.21 | | 3.78 |
Gold | g/tonne | | 1.99 | 1.75 | | 1.96 | | 1.72 |
Silver | g/tonne | | 22.65 | 20.56 | | 24.26 | | 19.84 |
| | | | | | | | |
Copper concentrate | tonnes | | 13,900 | 15,640 | | 57,658 | | 65,508 |
Concentrate grade | % Cu | | 22.68 | 23.18 | | 22.98 | | 23.27 |
| | | | | | | | |
Zinc concentrate | tonnes | | 14,078 | 25,482 | | 85,232 | | 86,329 |
Concentrate grade | % Zn | | 52.02 | 51.09 | | 50.87 | | 50.92 |
| | | | | | | | |
Copper recovery | % | | 88.1 | 86.9 | | 86.0 | | 88.0 |
Zinc recovery | % | | 83.9 | 85.8 | | 85.5 | | 85.5 |
Gold recovery | % | | 56.6 | 56.1 | | 56.0 | | 59.4 |
Silver recovery | % | | 46.5 | 49.2 | | 45.9 | | 50.8 |
| | | | | | | | |
Contained metal in concentrate produced | | | | | |
Copper | tonnes | | 3,152 | 3,625 | | 13,249 | | 15,241 |
Zinc | tonnes | | 7,323 | 13,018 | | 43,354 | | 43,962 |
Precious metals1 | oz | | 9,038 | 13,573 | | 47,418 | | 51,012 |
1 Precious metals production includes gold and silver production on a gold-equivalent basis. For 2019, silver is converted to gold at a ratio of 70:1. For 2020, silver is converted to gold at a ratio of 89:1. |
Unit Operating Costs1 | | Three months ended | | Year ended | | Guidance |
| Dec. 31, 2020 | Dec. 31, 2019 | | Dec. 31, 2020 | | Dec. 31, 2019 | | Annual |
| 2020 | 2021 |
Concentrators | | | | | | | | | | | |
Stall | C$/tonne | | 23.52 | 29.31 | | 23.56 | | 26.47 | | | |
Flin Flon | C$/tonne | | 25.31 | 22.90 | | 23.59 | | 22.91 | | | |
Combined mine/mill unit operating costs 2,3 | | | | | | | |
Manitoba | C$/tonne | | 140 | 128 | | 132 | | 134 | | 130 - 140 | 145 - 155 |
1 Reflects costs per tonne of milled ore. | | |
2 Reflects combined mine, mill and G&A costs per tonne of milled ore. | |
3 Combined unit costs is a non-IFRS financial performance measure with no standardized definition under IFRS. For further information and a detailed reconciliation, please see the discussion under the "Non-IFRS Financial Reporting Measures" section of this MD&A. |
The Stall concentrator achieved record throughput of 4,050 tonnes per day during the fourth quarter and approximately 3,870 tonnes per day on an annual basis. Ore processed during the fourth quarter of 2020 was 20% higher than the same period of 2019 as additional resources from 777 were deployed to Lalor and incremental ore mined was sent to Stall. Full year ore processed at Stall increased by 9% as a result of ongoing continuous improvement initiatives and higher ore availability from the Lalor mine as indicated above. Although Stall recoveries were generally below levels experienced during the first half of 2020, the trend of improving gold recoveries has continued when compared to the same periods in 2019 due to improved ore characteristics and numerous operational improvement projects implemented at the Stall mill.
Ore processed at the Flin Flon concentrator in the fourth quarter of 2020 decreased by 40% compared to the same period in 2019. This was due to the production interruption at 777, which resulted in less ore mined and available to feed the mill. Full year ore processed at the Flin Flon concentrator was 12% lower than 2019 primarily for the same reason as noted above. Metal recoveries at the Flin Flon concentrator during 2020 were lower for all metals other than zinc, which was in line with prior year recoveries and metallurgical models given the head grades processed.
As a result of the increased ore availability from Lalor during the quarter, unit operating costs at Stall decreased by 20% compared to the same period in 2019, whereas unit operating costs at Flin Flon were 11% higher over the same period because of reduced ore mined from 777.
Manitoba combined mine, mill and G&A unit operating costs in the fourth quarter of 2020 increased by 9% compared to the same period in 2019, but remained within the annual guidance range despite the 777 production interruption. The increase was primarily due to less ore milled in Flin Flon during the fourth quarter. Full year combined mine, mill and G&A unit operating costs in 2020 were slightly lower than 2019 levels as the mines and mills continued to deliver efficient results despite the production interruption at 777.
Manitoba contained metal in concentrate produced1 | Three months ended | Year ended | Guidance |
Dec. 31, 2020 | Dec. 31, 2019 | Dec. 31, 2020 | Dec. 31, 2019 | Annual |
2020 | 2021 |
Copper | tonnes | 5,724 | 5,763 | 22,183 | 23,354 | 18,000 - 22,000 | 20,000 - 24,000 |
Gold | oz | 28,687 | 27,705 | 112,227 | 94,969 | - | 150,000 - 165,000 |
Silver | oz | 252,904 | 298,363 | 1,127,901 | 1,080,561 | - | 1,200,000 - 1,400,000 |
Zinc | tonnes | 25,843 | 30,592 | 118,130 | 119,106 | 105,000 - 125,000 | 96,000 - 107,000 |
| | | | | | | |
Precious metals2 | oz | 31,529 | 31,967 | 124,900 | 110,406 | 110,000 - 135,000 | - |
1 Metal reported in concentrate is prior to deductions associated with smelter terms. | |
2 Precious metals production includes gold and silver production on a gold-equivalent basis. For 2019, silver is converted to gold at a ratio of 70:1. For 2020, silver is converted to gold at a ratio of 89:1. |
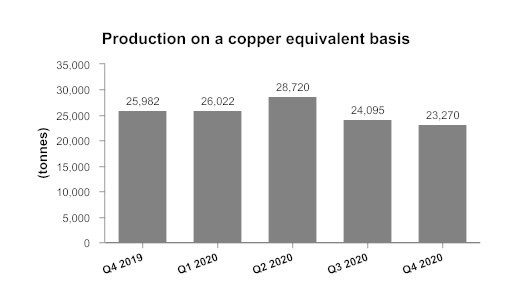
Gold production was 4% higher in the fourth quarter of 2020 due to higher head grades at Lalor as compared to the same period in 2019. Copper production during the quarter was consistent with prior year levels as the lost production during the 777 shaft repair period was offset by the mining of higher grade copper stopes when the mine was operating at normal levels. Silver and zinc production declined by 15% and 16%, respectively, in the fourth quarter of 2020 compared to the same quarter in 2019 primarily due to the 777 production interruption and lower head grades at Lalor.
Full year 2020 gold and silver production increased by 18% and 4%, respectively, due to higher gold and silver head grades and higher recoveries at Stall compared to prior year. Full year copper production decreased by 5% as reduced production at 777 was not fully offset by the higher throughput at Stall.
Despite the fourth quarter production interruption at the 777 mine, annual guidance for all metals and unit costs was achieved in Manitoba, with copper production exceeding the upper end of the guidance range.
Zinc Plant
Zinc Production | Three months ended | | Year ended | | Guidance |
Dec. 31, 2020 | Dec. 31, 2019 | | Dec. 31, 2020 | | Dec. 31, 2019 | | Annual |
| 2020 | 2021 |
Zinc Concentrate Treated | | | | | | | | |
Domestic | tonnes | 61,395 | 58,884 | | 241,089 | | 217,484 | | | |
Refined Metal Produced | | | | | | | | |
Domestic | tonnes | 28,818 | 27,816 | | 111,637 | | 103,340 | | 100,000 - 112,000 | 96,000 - 103,000 |
Unit Operating Costs | Three months ended | | Year ended | | Guidance |
Dec. 31, 2020 | Dec. 31, 2019 | | Dec. 31, 2020 | | Dec. 31, 2019 | | Annual |
| 2020 | 2021 |
Zinc Plant 1,2 | C$/lb | 0.45 | 0.48 | | 0.47 | | 0.49 | | 0.45 - 0.52 | 0.50 - 0.55 |
1 Zinc unit operating costs include G&A costs. | | |
2 Zinc unit costs is a non-IFRS financial performance measure with no standardized definition under IFRS. For further information and a detailed reconciliation, please see the discussion under the "Non-IFRS Financial Reporting Measures" section of this MD&A. |
Production of cast zinc in the fourth quarter of 2020 was 4% higher than the same period in 2019 while operating costs per pound of zinc metal produced were 6% lower over the same period. Refined zinc metal production in the fourth quarter was not materially impacted by the 777 production interruption due to the processing of available zinc concentrate inventories. Full year 2020 refined zinc metal production increased by 8% compared to the same period in 2019 due to higher equipment availability coupled with higher concentrate availability. The 2020 refined zinc metal production was the highest level achieved in over 10 years.
Full year production of cast zinc and zinc plant unit operating cost were within guidance ranges for 2020.
Manitoba Cash Cost and Sustaining Cash Cost
| | Three months ended | | Year ended |
| Dec. 31, 2020 | | Dec. 31, 2019 | | Dec. 31, 2020 | | Dec. 31, 2019 |
Cost per pound of copper produced | | | | | | | | | |
Cash cost per pound of copper produced, net of by-product credits 1 | $/lb | | (3.48) | | | (1.26) | | | (2.20) | | | (0.75) |
Sustaining cash cost per pound of copper produced, net of by-product credits 1 | $/lb | | (0.36) | | | 1.83 | | | 1.02 | | | 2.07 | |
| | | | | | | | | |
Cost per pound of zinc produced | | | | | | | | | |
Cash cost per pound of zinc produced, net of by-product credits 1 | $/lb | | (0.02) | | | 0.34 | | | 0.10 | | | 0.42 | |
Sustaining cash cost per pound of zinc produced, net of by-product credits 1 | $/lb | | 0.67 | | | 0.92 | | | 0.71 | | | 0.97 | |
1 Cash cost and sustaining cash cost per pound of copper & zinc produced, net of by-product credits, are not recognized under IFRS. For more detail on this non-IFRS financial performance measure, please see the discussion under the "Non-IFRS Financial Performance Measures" section of this MD&A. |
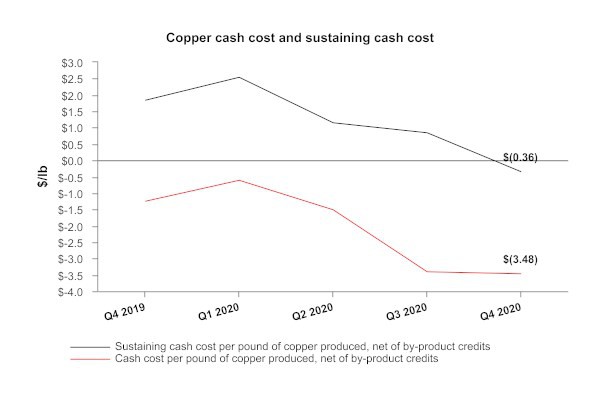
Cash cost per pound of copper produced, net of by-product credits, in the fourth quarter of 2020 was negative $3.48. These costs were lower compared to the same period in 2019, primarily as a result of higher by-product credit revenues and lower milling costs. Cash cost per pound of copper produced, net of by-product credits was lower in 2020 compared to 2019 for the same reasons as noted above, but was partially offset by lower copper production.
Sustaining cash cost per pound of copper produced, net of by-product credits, in the fourth quarter of 2020 was negative $0.36. These costs were lower compared to the same period in 2019, primarily due to the reasons listed above offset by increased sustaining capital expenditures. Sustaining cash cost per pound of copper produced, net of by-product credits, were lower in 2020 compared to 2019, primarily due to the same reasons.
Cash cost and sustaining cash cost per pound of zinc produced, net of by-product credits, in the fourth quarter of 2020 were lower than the same period last year as a result of significantly higher by-product credits, lower milling costs, partially offset by lower production and higher sustaining capital expenditures.
Cash cost and sustaining cash cost per pound of zinc produced, net of by-product credits, were lower in 2020 compared to 2019 due to significantly higher by-product credits, partially offset by higher sustaining capital expenditures.

Metal Sold
| | Three months ended | | Year ended |
| Dec. 31, 2020 | | Dec. 31, 2019 | | Dec. 31, 2020 | | Dec. 31, 2019 |
Payable metal in concentrate | | | | | | | | | |
Copper | tonnes | | 4,380 | | 5,285 | | 20,382 | | 22,335 |
Gold | oz | | 31,882 | | 25,520 | | 111,963 | | 90,043 |
Silver | oz | | 281,541 | | 242,584 | | 1,067,038 | | 1,000,430 |
Refined zinc | tonnes | | 28,431 | | 28,001 | | 109,347 | | 104,319 |
OUTLOOK
This outlook includes forward-looking information about our operations and financial expectations based on our expectations and outlook as of February 18, 2021. As a result of the COVID-19 global pandemic, we have experienced operational, supply chain, travel, labour and shipping disruptions, and we may continue to experience similar disruptions in the future. Given the uncertainty of the duration and magnitude of the impact of COVID-19, including its impact on the development timeline for Pampacancha, our 2021 production and cost guidance are subject to a higher-than-normal degree of uncertainty. The guidance below does not reflect any potential for additional suspensions or other significant disruption to operations or delays to development activities.
This outlook, including expected results and targets, is subject to various risks, uncertainties and assumptions, which may impact future performance and our achievement of the results and targets discussed in this section. For additional information on forward-looking information, refer to the "Forward-Looking Information" section of this MD&A. We may update our outlook depending on changes in metals prices and other factors, as per our "Commodity Markets" and "Sensitivity Analysis" discussions below. In addition to this section, refer to the "Operations Review", "Financial Review" and "Liquidity and Capital Resources" sections for additional details on our outlook for 2021.
Material Assumptions
Our annual production and operating cost guidance, along with our annual capital and exploration expenditure forecasts are discussed in detail below.
Production Guidance
Contained Metal in Concentrate1 | 2021 Guidance | Year ended
Dec. 31, 2020 | 2020 Guidance2 |
Peru | | | | |
Copper | tonnes | 72,000 - 88,000 | 73,150 | 65,000 - 75,000 |
Gold3 | oz | 40,000 - 50,000 | 12,395 | - |
Silver3 | oz | 1,800,000 - 2,170,000 | 1,622,972 | - |
Molybdenum | tonnes | 1,400 - 1,700 | 1,204 | 1,100 - 1,300 |
Precious metals3 | oz | - | 30,630 | 25,000 - 35,000 |
| | | | |
Manitoba | | | | |
Zinc | tonnes | 96,000 - 107,000 | 118,130 | 105,000 - 125,000 |
Gold3 | oz | 150,000 - 165,000 | 112,227 | - |
Copper | tonnes | 20,000 - 24,000 | 22,183 | 18,000 - 22,000 |
Silver3 | oz | 1,200,000 - 1,400,000 | 1,127,901 | - |
Precious metals3 | oz | - | 124,900 | 110,000 - 135,000 |
| | | | |
Total | | | | |
Copper | tonnes | 92,000 - 112,000 | 95,333 | 83,000 - 97,000 |
Gold3 | oz | 190,000 - 215,000 | 124,622 | - |
Zinc | tonnes | 96,000 - 107,000 | 118,130 | 105,000 - 125,000 |
Silver3 | oz | 3,000,000 - 3,570,000 | 2,750,873 | - |
Molybdenum | tonnes | 1,400 - 1,700 | 1,204 | 1,100 - 1,300 |
Precious metals3 | oz | - | 155,530 | 135,000 - 170,000 |
1 Metal reported in concentrate is prior to refining losses or deductions associated with smelter terms. |
2 Original 2020 guidance for Peru was revised on August 11, 2020 to account for a government-mandated temporary mine closure. |
3 Precious metals production includes gold and silver production on a gold-equivalent basis and is only reported for 2020 since separate guidance for each of gold and silver was introduced in 2021. For 2020, silver is converted to gold at a ratio of 89:1. |
On a consolidated basis, we met 2020 production guidance for all metals, and copper production exceeded the guidance range in Manitoba. Consolidated copper production was 6% higher than the mid-point of the guidance range due to strong performance at the Constancia operations in the second half of the year and the mining of higher copper grade stopes at 777.
In 2021, consolidated copper production is forecast to increase by 7%1 compared to 2020 production primarily as a result of higher expected copper production in Peru, given 2020 production was impacted by an eight-week temporary mine interruption related to a government-declared state of emergency. Consolidated gold production in 2021 is expected to increase by 62%1 year-over-year due to higher gold production in both Manitoba and Peru. In Manitoba, gold production is expected to increase by 40%1 in 2021 due to the planned early startup of the New Britannia gold mill. In Peru, gold production is expected to more than triple in 2021 as we expect to see the benefits from the higher grades at the Pampacancha satellite deposit. Zinc production is expected to decline by 14%1 year-over-year as a result of prioritizing the mining of the gold-rich zones at Lalor in connection with the early startup of the New Britannia mill, which will result in mining less of the zinc-rich base metal zones at Lalor.
__________________________________
1 Year-over-year forecast changes assume the mid-point of the respective guidance range is achieved.
Peru's 2021 production guidance assumes mining of Pampacancha will begin in the second quarter, with the initial phase of lower copper grades, but higher gold grades, expected to continue for the balance of the year before higher copper grades are forecast to enter the mine plan in 2022. Manitoba's 2021 production guidance reflects an increase in Lalor's mine throughput to 4,650 tonnes per day, from the previous 4,500 tonnes per day, as the recent trend of stronger production from the mine is expected to continue.
We expect to publish updated mine plans for each of our Constancia and Snow Lake operations with our annual mineral reserve and resource update at the end of March 2021, as discussed in the "Strategy" section in this MD&A. The new Constancia mine plan is expected to reflect an increase in copper and gold production from 2022 to 2025 as the higher grades from the Pampacancha deposit enter the mine plan. This is expected to offset the lost copper production from the 777 closure in mid-2022 and enable a steady state in Hudbay's consolidated copper production. The new Constancia mine plan will incorporate new reserves from the Constancia North property, which will extend the Constancia pit. The new mine plan will also include updated unit cost assumptions based on recent operational and business activities. The new Snow Lake mine plan is expected to reflect an increase in Lalor's mine production rate beyond 4,650 tonnes per day, and incorporate the results of the 1901 prefeasibility study and the Stall mill recovery improvement study. Given the pending mine plan updates, we expect to issue our new three-year production outlook once the updated mine plans have been released.
Capital Expenditure Guidance
Capital Expenditures1 (in $ millions) | 2021 Guidance | Year ended Dec. 31, 2020 | 2020 Guidance2 |
Sustaining capital | | | |
Peru3 | 135.0 | 91.1 | 80.0 |
Manitoba | 90.0 | 95.3 | 100.0 |
Total sustaining capital | 225.0 | 186.4 | 180.0 |
Growth capital | | | |
Peru4 | 5.0 | 107.0 | 70.0 |
Manitoba | 75.0 | 61.4 | 80.0 |
Arizona5 | 20.0 | 15.6 | 20.0 |
Total growth capital | 100.0 | 184.0 | 170.0 |
Capitalized exploration | 15.0 | 11.9 | 15.0 |
Total capital expenditures | 340.0 | 382.3 | 365.0 |
1 Excludes capitalized costs not considered to be sustaining or growth capital expenditures. Capital expenditures are converted into U.S. dollars using the following rates: 1.30 Canadian dollars and 3.45 Peruvian soles. |
2 Original 2020 guidance for Peru was revised on August 11, 2020 to account for a government-mandated temporary mine closure. |
3 Includes capitalized stripping costs and Pampacancha capital after pre-stripping. |
4 Peru growth capital expenditures guidance of $70.0 million in 2020 related to expected expenditures for developing the Pampacancha deposit and acquiring surface rights, but excluded any costs related to the individual land user agreements due to the ongoing nature of the negotiations. The actual costs incurred in 2020 included the costs for acquiring the surface rights and amounts committed under the land user agreements completed during 2020. A portion of the development expenditures was deferred to 2021. Peru growth capital guidance of $5.0 million includes the project development expenditures but excludes the additional costs related to the remaining individual land user agreements. |
5 Arizona spending includes capitalized costs associated with the Rosemont project. |
Total capital expenditures are expected to decline by 11% year-over-year primarily due to lower expected growth spending in Peru in 2021.
Total sustaining capital expenditures in 2021 are expected to increase from 2020 levels primarily due to the deferral of heavy civil works and capitalized stripping expenditures in Peru from 2020 into 2021, partially offset by expected lower sustaining spending in Manitoba. A tailings dam raise is underway at Constancia and the associated heavy civil works accounts for a significant portion of the 2021 sustaining costs in Peru. Also, a portion of the Pampacancha heavy civil works, previously classified as growth capital, has been reclassified to sustaining capital expenditures in 2021. It is expected that Peru sustaining capital expenditures will begin to decline in 2022.
In Manitoba, we continue to implement improvements on the legacy Flin Flon tailings impoundment area, in line with the higher industry-wide standards for tailings dam safety. Spending under the tailings upgrade program is expected to average approximately $20.0 million per year from 2020 to 2022. These expenditures will not impact sustaining capital expenditures since they are associated with the decommissioning and restoration liability, and therefore, will be accounted for as a drawdown of the liability through operating cash flow.
Manitoba growth capital spending of $75.0 million in 2021 includes approximately $70.0 million for the completion of the New Britannia mill refurbishment project and approximately $5.0 million for the construction of a new long-term camp facility in Snow Lake. Manitoba growth capital spending in 2020 was lower than expected due to the deferral of approximately $20.0 million into 2021, despite the New Britannia refurbishment project continuing to track ahead of the original schedule. Total project spending on the New Britannia refurbishment project in 2021 includes an approximate $13.0 million increase in project costs as a result of the completion of a definitive estimate that incorporates project scope additions and COVID-19 related costs.
Peru growth capital spending of $5.0 million in 2021 includes a portion of the Pampacancha project development expenditures that was deferred from 2020, but excludes the costs associated with completing the remaining individual land user agreement due to the ongoing nature of the negotiations. As stated previously, the 2020 Peru growth capital guidance similarly excluded the land user agreement costs; however, a significant portion of the actual growth expenditures incurred in 2020 related to costs associated with land user agreements completed during the year.
Exploration Guidance
Exploration Expenditures (in $ millions) | | Year ended | |
2021 Guidance | Dec. 31, 2020 | 2020 Guidance |
Peru | 20.0 | 14.3 | 15.0 |
Manitoba | 10.0 | 10.1 | 10.0 |
Arizona and other | 10.0 | 4.7 | - |
Total exploration expenditures | 40.0 | 29.1 | 25.0 |
Capitalized spending | (15.0) | (11.9) | (15.0) |
Total exploration expense | 25.0 | 17.2 | 10.0 |
Our total exploration spending in 2021 is expected to be higher than 2020 levels as we plan to conduct additional drilling activities in Peru and Arizona.
In Peru, 2021 drilling activities will be focused on the Quehuincha North skarn target property located approximately 10 kilometres north of Constancia, and on the Llaguen greenfield project located near the city of Trujillo in northern Peru. In Manitoba, we expect to complete a winter drill program focused on expanding the 1901 deposit and testing drill targets identified between 1901 and the Lalor mine. In Arizona, we plan to continue the drilling activities in the Helvetia copper region, in addition to a portion of exploration expenditures allocated for generative purposes.
Unit Operating Cost Guidance
Combined Mine/Mill Unit Operating Cost1,2 | 2021 Guidance | Year ended Dec. 31, 2020 | 2020 Guidance3 |
Peru | $/tonne | 8.90 - 10.90 | 9.46 | 8.30 - 10.00 |
Manitoba | C$/tonne | 145 - 155 | 132 | 130 - 140 |
1 Reflects combined mine, mill and G&A costs per tonne of milled ore. Peru costs reflect the deduction of expected capitalized stripping costs. |
2 Combined unit costs are non-IFRS financial performance measures with no standardized definition under IFRS. For further information and a detailed reconciliation, please see the discussion under the "Non-IFRS Financial Reporting Measures" section of this MD&A. |
3 Original 2020 guidance for Peru was revised on August 11, 2020 to account for a government-mandated temporary mine closure. |
Combined unit costs for Manitoba in 2021 are forecast to be modestly higher than 2020 levels due to the reduction in capitalized underground development at both 777 and Lalor, which increases the portion of mining costs that are expensed and included in unit costs. In addition, combined unit costs in Manitoba are expected to trend higher with the inclusion of the New Britannia mill given the New Britannia milling unit costs are higher than the Flin Flon and Stall milling costs as disclosed in our Snow Lake operations mine plan released in March 2020. Combined unit costs for Peru in 2021 are approximately 5%1 higher than 2020 as a result of higher consumable and mill maintenance costs and the impact of blasting harder ore in the Constancia pit.
Flin Flon Zinc Plant Guidance | | 2021 Guidance | Year ended Dec. 31, 2020 | 2020 Guidance |
Zinc metal produced | tonnes | 96,000 - 103,000 | 111,637 | 100,000 - 112,000 |
Unit operating costs1 | C$/lb | 0.50 - 0.55 | 0.47 | 0.45 - 0.52 |
1 Unit costs are non-IFRS financial performance measures with no standardized definition under IFRS. For further information and a detailed reconciliation, please see the discussion under the "Non-IFRS Financial Reporting Measures" section of this MD&A. |
Cash Cost and Sustaining Cash Cost Guidance
Consolidated Cash Cost per pound of copper produced1,2 | 2021 Guidance | Year ended Dec. 31, 2020 | 2020 Guidance3 |
Cash cost | $/lb | 0.65 - 0.80 | 0.60 | - |
Sustaining cash cost | $/lb | 2.05 - 2.30 | 1.93 | - |
1 Cash cost and sustaining cash cost, net of by-product credits, per pound of copper contained in concentrate. By-product credits are calculated using the gold and silver deferred revenue drawdown rates in effect on December 31, 2020 and the following commodity prices: $1.07 per pound zinc (includes premium), $1,800 per ounce gold, $21.00 per ounce silver, $8.00 per pound molybdenum and an exchange rate of 1.30 C$/US$. |
2 Cash cost and sustaining cash cost are non-IFRS financial performance measures with no standardized definition under IFRS. For further information and a detailed reconciliation, please see the discussion under the "Non-IFRS Financial Reporting Measures" section of this MD&A. |
3 Cash cost and sustaining cash cost guidance was introduced in 2021 and is not available for 2020. |
We are introducing consolidated cash cost and sustaining cash cost guidance in 2021. Consolidated cash cost per pound of copper produced, net of by-product credits, is expected to slightly increase from 2020 levels due to the expected increase in unit costs as described above, partially offset by expected higher copper production and higher by-product credits. Consolidated sustaining cash cost per pound of copper produced, net of by-product credits, is expected to be consistent with 2020 as lower sustaining capital expenditures are expected to offset the increase in cash costs.
Metal production in any particular quarter may vary from the implied annual guidance rate based on variations in grades and recoveries due to the areas mined in that quarter, the timing of planned maintenance, and other factors. Mining and processing costs in any particular quarter can vary from the annual guidance rate above based on a variety of factors, including the scheduling of maintenance events and seasonal heating requirements, particularly in Manitoba. Cash cost and sustaining cash cost may also vary based on changes in commodity prices affecting by-product credits. In Peru, the regularly scheduled semi-annual mill maintenance shutdowns at Constancia are expected to occur during the first and third quarters of 2021.
Commodity Markets
Our 2021 operational and financial performance will be influenced by a number of factors. At the macro-level, the general performance of the Chinese, North American and global economies as they recover from the COVID-19 related shutdowns will influence the demand for copper and zinc, while interest rates, investor expectations of future inflation, the performance of financial markets and the level of economic uncertainty will influence the investment demand for gold. The realized prices we achieve in the commodity markets significantly affect our financial performance. Our general expectations regarding metals prices and foreign exchange rates are included below and in the "Sensitivity Analysis" section of this MD&A.
In addition to our production volumes, our financial performance is directly affected by a number of factors, including metals prices, foreign exchange rates, and input costs, including energy prices. Average prices for copper and zinc were far more volatile in 2020 than they were in 2019 due to the adverse effect of the COVID-19 pandemic on the world economy. Government mandated lockdowns and a rapid decline in the value of all assets drove copper and zinc prices to multiyear lows in the first quarter of 2020 before temporary supply side disruptions and scrap shortages, central bank liquidity injections and improved market sentiment propelled prices, especially copper, to levels significantly higher than prior to the pandemic. Gold prices, except for a brief decline in March 2020 when all asset prices suffered steep declines, moved higher through the last three quarters of the year due to the COVID-19 crisis and the world's response to it.
We have developed the following market analysis from various information sources including analyst and industry experts.
Copper
In 2020, the London Metal Exchange ("LME") copper price averaged $2.80 per pound ("/lb"), with prices ranging from a low of $2.09/lb during the depths of the initial COVID-19 crisis in March 2020 to a high of $3.61/lb in December 2020. Both the supply and the demand for copper declined significantly in 2020 due to government mandated lockdowns globally. Many mines in the world, especially those in Latin America, were forced to temporarily suspend operations for one to two months resulting in a production loss of over 500 thousand tonnes of copper in concentrate. In addition, the supply of scrap copper, which typically accounts for 16% of annual refined copper production, declined by approximately 980 thousand tonnes. At the same time, the pandemic temporarily reduced the fundamental demand for copper but the Chinese government's purchases of copper for their strategic stockpile combined with a unexpectedly robust recovery in fundamental demand in China in the second half of 2020, brought the market into relative balance, supporting a strong price recovery in the second half of the year. Copper smelters and refineries were generally less affected by COVID-19 related shutdowns than other segments of the copper market, which kept spot treatment and refining costs for copper concentrate below annual benchmark levels for most of the year. This led to further decreases in annual benchmark terms to $59.50/tonne and ¢5.95/lb for 2021.
Early in 2021, the price of copper has been in excess of $3.50/lb and market sentiment has been quite positive. However, the outlook for global refined copper markets and copper prices in 2021 is uncertain due to the continued threat of interruptions to both copper supply and demand posed by the ongoing COVID-19 pandemic. What is relatively certain is that the economic disruption caused by the pandemic has caused governments around the world to commit to massive spending on a wide variety of "green" recovery plans, all of which involve copper intensive technologies. Over the next decade, the world economy is expected to move towards renewable energy sources (wind, hydro, solar), carbon neutrality and the adoption of electric vehicles, which is projected to drive significant additional demand for copper.
Strong future demand for copper will necessitate the development of new mines from the world's existing inventory of undeveloped deposits, which are inherently higher cost than those mines currently in production due to their lower grades, higher strip ratios and higher development costs. The result of having to bring on higher cost mines to meet increasing demand, in conjunction with the long timelines associated with permitting and obtaining social license for new greenfield mines, should lead to a prolonged period of higher copper prices.
Zinc
In 2020, the LME zinc price averaged $1.03/lb, with prices ranging from $0.80/lb to $1.29/lb. Zinc demand declined by an estimated 5.5% due to the effects of COVID-19 induced consumption disruptions but mine production declined by only 3.5% during the year. As a result, after recording an average deficit of approximately 370 thousand tonnes per year over the previous eight years prior to 2020, the zinc metal market recorded a surplus of approximately 460 thousand tonnes in 2020 and total exchange stocks rose in early 2021.
As world economies recover from COVID-19 in 2021, demand for zinc is projected to rebound with the help of significant government stimulus spending on infrastructure which is expected to spur demand for zinc used in the galvanizing of steel. For the next several years, the zinc metal market is anticipated to be in relative balance and zinc metal prices over the next few years are expected to be supported in the range of $1.00/lb to $1.25/lb.
After recording a small, unexpected zinc concentrate market deficit versus demand in 2020, which kept spot treatment charges during the year well below the annual benchmark of $300 per tonne, the zinc concentrate market is expected to return to surplus over the next several years. Negotiations for the 2021 annual benchmark are still ongoing with a large gap between the positions of miners and smelters.
Gold
In 2020, the London Gold Bullion Market price for gold averaged $1,772 per ounce ("/oz"), compared with an average of $1,394/oz in 2019. Prices ranged from a low of $1,461/oz, set during March 2020 when all asset classes suffered steep declines during the onset of the COVID-19 crisis, to a high of $2,064/oz at its peak in early August. The dramatic escalation in gold prices during the year was driven by the economic uncertainty surrounding the COVID-19 pandemic as well as the response to the crisis from governments and central banks globally who engaged in massive deficit spending to support their citizens, reducing interest rates to near zero, and injecting massive liquidity into the financial system, all of which are expected to lead to future inflation.
The physical supply and demand for gold is not an arbitrator of future prices as it is with base metals because most of the gold ever mined is stored in bank vaults. Gold is an investment that has traditionally provided a safe haven for investors during uncertain economic times, as well as a hedge against inflation, future currency devaluation and declining values of other riskier asset classes. The current economic environment, with a perception of "lower for longer" interest rates, high government deficits and continued economic uncertainly due to the COVID-19 pandemic, is expected to be supportive for gold prices over the next few years.
Sensitivity Analysis
The following table displays the estimated impact of changes in metals prices and foreign exchange rates on our 2021 net profit, earnings per share and operating cash flow, assuming that our operational performance is consistent with our guidance for 20211. The effects of a given change in an assumption are calculated in isolation.
| 2021 | Change of 10% | Impact on | Impact on | Impact on Operating CF |
| Base | represented by: | Profit | EPS1 | before WC changes |
Metals Prices | | | | | |
Copper price2 | $3.00/lb | +/- $0.30/lb | +/- $43M | +/- 0.17 | +/- $63M |
Zinc price | $1.00/lb | +/- $0.10/lb | +/- $17M | +/- 0.06 | +/- $22M |
Gold price3 | $1,800/oz | +/- $180/oz | +/- $19M | +/- 0.07 | +/- $26M |
Exchange Rates 4 | | | | | |
US$/C$ | 1.30 | +/- 0.13 | +/- $49M | +/- 0.19 | +/- $35M |
1 Based on 261.3 million common shares outstanding as at December 31, 2020. |
2 Quotational period hedging program neutralizes provisional pricing adjustments. |
3 Gold price sensitivity also includes an impact of a +/- 10% change in the silver price (2021 assumption: $21.00/oz of silver). |
4 Change in profit from operational performance only, does not include change in profit arising from translation of balance sheet accounts. |
___________________________
1 Year-over-year forecasted changes to unit costs assume the mid-point of the respective guidance range is achieved.
FINANCIAL REVIEW
Financial Results
In the fourth quarter of 2020, we recorded a net profit of $7.4 million compared to a net loss of $1.5 million for the same period in 2019, representing an increase in profit of $8.9 million. For the full year, we recorded a loss of $144.6 million compared to a loss of $343.8 million in 2019, representing an increase in profit for the period of $199.2 million.
The following table provides further details on these variances:
(in $ millions) | Three months ended
December 31, 2020 | Year ended
December 31, 2020 | |
|
Increase (decrease) in components of profit or loss: | | | |
Revenues | (2.2) | | (145.0) | | |
Cost of sales | | | |
Mine operating costs | 15.6 | | 49.8 | | |
Depreciation and amortization | (4.6) | | (17.3) | | |
Selling and administrative expenses | (9.0) | | (5.2) | | |
Exploration and evaluation expenses | 3.3 | | 13.6 | | |
Other expenses | (2.1) | | 33.5 | | |
Impairment | - | | 322.2 | | |
Net finance expense | 42.3 | | 22.1 | | |
Tax | (34.4) | | (74.5) | | |
Increase in profit for the period | 8.9 | | 199.2 | | |
Revenue
Revenue for the fourth quarter of 2020 was $322.3 million, $2.2 million lower than the same period in 2019, due mostly to lower sales volumes of copper primarily from lower copper production at Constancia, partially offset by higher realized copper, gold and zinc prices as well as higher sales volumes of gold.
Full year revenue in 2020 was $1,092.4 million, $145.0 million or 12% lower than 2019, primarily as a result of significantly lower copper sales volumes in Peru as a result of an eight-week suspension of Constancia operations in the second quarter and lower copper grades as well as lower realized zinc prices. This was partially offset by higher realized gold and copper prices, a variable consideration adjustment on stream revenue as well as lower comparative treatment and refining charges.
(in $ millions) | Three months ended
December 31, 2020 | Year ended
December 31, 2020 |
| |
| | |
Metals prices1 | | |
Higher copper prices | 30.3 | 24.8 |
Higher (lower) zinc prices | 4.5 | (32.7) |
Higher gold prices | 8.6 | 42.3 |
(Lower) higher silver prices | (0.1) | 1.0 |
Sales volumes | | |
Lower copper sales volumes | (63.9) | (238.5) |
Higher zinc sales volumes | 1.3 | 12.3 |
Higher gold sales volumes | 7.2 | 20.1 |
Lower silver sales volumes | (4.0) | (22.2) |
Other | | |
Change in derivative mark-to-market on zinc | 0.1 | 0.7 |
Molybdenum and other volume and pricing differences | 7.3 | (2.5) |
Variable consideration adjustments | - | 23.0 |
Effect of lower treatment and refining charges | 6.5 | 26.7 |
Decrease in revenue in 2020 compared to 2019 | (2.2) | (145.0) |
1 See discussion below for further information regarding metals prices. | | |
Our revenue by significant product type is summarized below:
| Three months ended | | Year ended |
(in $ millions) | Dec. 31, 2020 | | Dec. 31, 2019 | | | Dec. 31, 2020 | | | Dec. 31, 2019 | |
Copper | 167.0 | | 201.7 | | | 563.9 | | | 786.3 | |
Zinc | 76.6 | | 72.1 | | | 264.1 | | | 284.9 | |
Gold | 49.2 | | 37.2 | | | 181.0 | | | 120.4 | |
Silver | 8.0 | | 8.5 | | | 26.0 | | | 29.3 | |
Molybdenum | 8.8 | | 4.7 | | | 25.6 | | | 31.3 | |
Other metals | 1.6 | | 1.3 | | | 5.6 | | | 4.8 | |
Revenue from contracts | 311.2 | 325.5 | | 1,066.2 | | 1,257.0 |
Amortization of deferred revenue - gold | 8.4 | | 7.9 | | | 27.9 | | | 32.0 |
Amortization of deferred revenue - silver | 11.7 | | 16.0 | | | 39.4 | | | 60.4 |
Amortization of deferred revenue - variable consideration adjustments - prior periods | - | | - | | | 6.7 | | | (16.3) |
Pricing and volume adjustments1 | 5.7 | | (3.7) | | 9.1 | | | (12.1) |
Treatment and refining charges | (14.7) | | (21.2) | | (56.9) | | | (83.6) |
Revenue | 322.3 | | 324.5 | | 1,092.4 | | | 1,237.4 |
1 Pricing and volume adjustments represents mark-to-market adjustments on provisionally prices sales, realized and unrealized changes to fair value for non-hedge derivative contracts and adjustments to originally invoiced weights and assays. |
For further detail on variable consideration adjustments, refer to note 18 of our consolidated financial statements.
Realized sales prices
This measure is intended to enable management and investors to understand the average realized price of metals sold to third parties in each reporting period. The average realized price per unit sold does not have any standardized meaning prescribed by IFRS, is unlikely to be comparable to similar measures presented by other issuers and should not be considered in isolation or a substitute for measures of performance prepared in accordance with IFRS.
For sales of copper, gold and silver we may enter into non-hedge derivatives ("QP hedges") which are intended to manage the provisional pricing risk arising from quotational period terms in concentrate sales agreements. The QP hedges are not removed from the calculation of realized prices. We expect that gains and losses on QP hedges will offset provisional pricing adjustments on concentrate sales contracts.
Our realized prices for the fourth quarter and full year 2020 and 2019, respectively, are summarized below:
| Realized prices1 for the | LME YTD 20202 | | Realized prices1 for the |
Three months ended | | Year ended |
| LME QTD 20202 | Dec. 31, 2020 | Dec. 31, 2019 | | Dec. 31, 2020 | | Dec. 31, 2019 |
Prices | | | | | | | | | |
Copper | $/lb | 3.25 | 3.29 | 2.69 | 2.80 | | 2.86 | | 2.73 |
Zinc3 | $/lb | 1.19 | 1.24 | 1.17 | 1.03 | | 1.10 | | 1.24 |
Gold4 | $/oz | | 1,734 | 1,490 | | | 1,783 | | 1,439 |
Silver4 | $/oz | | 27.05 | 27.19 | | | 26.04 | | 25.64 |
1 Realized prices exclude refining and treatment charges and are on the sale of finished metal or metal in concentrate. Realized prices include the effect of provisional pricing adjustments on prior period sales. |
2 London Metal Exchange average for copper and zinc prices. |
3 All sales for the three months and year ended December 31, 2020 and 2019 were cast zinc metal. Zinc realized prices include premiums paid by customers for delivery of refined zinc metal, but exclude unrealized gains and losses related to non-hedge derivative contracts that are included in zinc revenues. |
4 Sales of gold and silver from our 777 and Constancia mines are subject to our precious metals stream agreement with Wheaton Precious Metals, pursuant to which we recognize deferred revenue for precious metals deliveries and also receive cash payments. Stream sales are included within realized prices and their respective deferred revenue and cash payment rates can be found on page 36. |
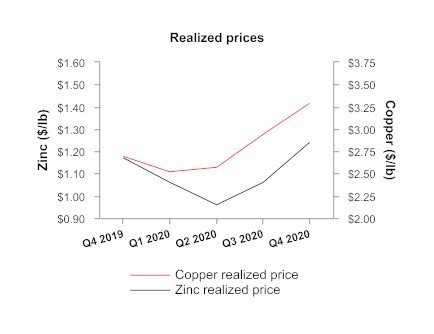
The following tables provide a reconciliation of average realized price per unit sold, by metal, to revenues as shown in the consolidated financial statements.
Three months ended December 31, 2020 |
(in $ millions) 1 | Copper | Zinc | Gold | Silver | Molybdenum | Other | Total |
Revenue per financial statements | 167.0 | | 76.6 | | 49.2 | | 8.0 | | 8.8 | | 1.6 | | 311.2 | |
Amortization of deferred revenue | - | | - | | 8.4 | | 11.7 | | - | | - | | 20.1 | |
Pricing and volume adjustments2 | (0.6) | | 1.0 | | 3.4 | | 0.9 | | 1.0 | | - | | 5.7 | |
By-product credits 3 | 166.4 | | 77.6 | | 61.0 | | 20.6 | | 9.8 | | 1.6 | | 337.0 | |
Derivative mark-to-market 4 | - | | 0.2 | | - | | - | | - | | - | | 0.2 | |
Revenue, excluding mark-to-market on non-QP hedges | 166.4 | | 77.8 | | 61.0 | | 20.6 | | 9.8 | | 1.6 | | 337.2 | |
Payable metal in concentrate sold 5 | 22,963 | | 28,431 | | 35,179 | | 762,384 | | 457 | | - | | - | |
Realized price 6 | 7,245 | | 2,737 | | 1,734 | | 27.05 | | - | | - | | - | |
Realized price 7 | 3.29 | | 1.24 | | - | | - | | - | | - | | - | |
Year ended December 31, 2020 |
(in $ millions) 1 | Copper | Zinc | Gold | Silver | Molybdenum | Other | Total |
Revenue per financial statements | 563.9 | | 264.1 | | 181.0 | | 26.0 | | 25.6 | | 5.6 | | 1,066.2 | |
Amortization of deferred revenue | - | | - | | 27.9 | | 39.4 | | - | | - | | 67.3 | |
Pricing and volume adjustments2 | (4.2) | | 1.0 | | 10.4 | | 1.9 | | 0.0 | | - | | 9.1 | |
By-product credits 3 | 559.7 | | 265.1 | | 219.3 | | 67.3 | | 25.6 | | 5.6 | | 1,142.6 | |
Derivative mark-to-market 4 | - | | (0.7) | | - | | - | | - | | - | | (0.7) | |
Revenue, excluding mark-to-market on non-QP hedges | 559.7 | | 264.4 | | 219.3 | | 67.3 | | 25.6 | | 5.6 | | 1,141.9 | |
Payable metal in concentrate sold 5 | 88,888 | | 109,347 | | 122,949 | | 2,585,586 | | 1,321 | | - | | - | |
Realized price 6 | 6,297 | | 2,418 | | 1,783 | | 26.04 | | - | | - | | - | |
Realized price 7 | 2.86 | | 1.10 | | - | | - | | - | | - | | - | |
1 Average realized price per unit sold may not calculate based on amounts presented in this table due to rounding. |
2 Pricing and volume adjustments represents mark-to-market adjustments on provisionally priced sales, realized and unrealized changes to fair value for non-hedge derivative contracts and adjustments to originally invoiced weights and assays. |
3 By-product credits subtotal is used in the calculated of cash cost per pound of copper and zinc produced, net of by-product credits. Cash cost per pound of copper and zinc produced, net of by-product credits, are non-IFRS financial performance measures with no standardized definition under IFRS. For further information and a detailed reconciliation, please see the discussion under the "Non-IFRS Financial Reporting Measures" section of this MD&A. |
4 Derivative mark-to-market excludes mark-to-market on QP hedges. |
5 Copper, zinc and molybdenum shown in metric tonnes and gold and silver shown in ounces. |
6 Realized price for copper, zinc and molybdenum in $/metric tonne and realized price for gold and silver in $/oz. |
7 Realized price for copper, zinc and molybdenum in $/lb. |
Three months ended December 31, 2019 |
(in $ millions) 1 | Copper | Zinc | Gold | Silver | Molybdenum | Other | Total |
Revenue per financial statements | 201.7 | | 72.1 | | 37.2 | | 8.5 | | 4.7 | | 1.3 | | 325.5 | |
Amortization of deferred revenue | - | | - | | 7.9 | | 16.0 | | - | | - | | 23.9 | |
Pricing and volume adjustments2 | (1.7) | | (0.4) | | 0.1 | | 0.2 | | (1.9) | | - | | (3.7) | |
By-product credits 3 | 200.0 | | 71.7 | | 45.2 | | 24.7 | | 2.8 | | 1.3 | | 345.7 | |
Derivative mark-to-market 4 | - | | 0.3 | | - | | - | | - | | - | | 0.3 | |
Revenue, excluding mark-to-market on non-QP hedges | 200.0 | | 72.0 | | 45.2 | | 24.7 | | 2.8 | | 1.3 | | 346.0 | |
Payable metal in concentrate sold 5 | 33,715 | | 28,001 | | 30,344 | | 909,423 | | 199 | | - | | - | |
Realized price 6 | 5,930 | | 2,573 | | 1,490 | | 27.19 | | - | | - | | - | |
Realized price 7 | 2.69 | | 1.17 | | - | | - | | - | | - | | - | |
Year ended December 31, 2019 |
(in $ millions) 1 | Copper | Zinc | Gold | Silver | Molybdenum | Other | Total |
Revenue per financial statements | 786.3 | | 284.9 | | 120.4 | | 29.3 | | 31.3 | | 4.8 | | 1,257.0 | |
Amortization of deferred revenue | - | | - | | 32.0 | | 60.4 | | - | | - | | 92.4 | |
Pricing and volume adjustments2 | (12.9) | | (0.1) | | 4.5 | | (1.2) | | (2.4) | | - | | (12.1) | |
By-product credits 3 | 773.4 | | 284.8 | | 156.9 | | 88.5 | | 28.9 | | 4.8 | | 1,337.3 | |
Derivative mark-to-market4 | - | | - | | - | | - | | - | | - | | - | |
Revenue, excluding mark-to-market on non-QP hedges | 773.4 | | 284.8 | | 156.9 | | 88.5 | | 28.9 | | 4.8 | | 1,337.3 | |
Payable metal in concentrate sold 5 | 128,519 | | 104,319 | | 108,999 | | 3,452,926 | | 1,186 | | - | | - | |
Realized price 6 | 6,018 | | 2,730 | | 1,439 | | 25.64 | | - | | - | | - | |
Realized price 7 | 2.73 | | 1.24 | | - | | - | | - | | - | | - | |
1 Average realized price per unit sold may not calculate based on amounts presented in this table due to rounding. |
2 Pricing and volume adjustments represents mark-to-market adjustments on provisionally priced sales, realized and unrealized changes to fair value for non-hedge derivative contracts and adjustments to originally invoiced weights and assays. |
3 By-product credits subtotal is used in the calculated of cash cost per pound of copper and zinc produced, net of by-product credits. Cash cost per pound of copper and zinc produced, net of by-product credits, are non-IFRS financial performance measures with no standardized definition under IFRS. For further information and a detailed reconciliation, please see the discussion under the "Non-IFRS Financial Reporting Measures" section of this MD&A. |
4 Derivative mark-to-market excludes mark-to-market on QP hedges. |
5 Copper, zinc and molybdenum shown in metric tonnes and gold and silver shown in ounces. |
6 Realized price for copper, zinc and molybdenum in $/metric tonne and realized price for gold and silver in $/oz. |
7 Realized price for copper, zinc and molybdenum in $/lb. |
The price, quantity and mix of metals sold, affect our revenue, operating cash flow and profit. Revenue from metals sales can vary from quarter to quarter due to production levels, shipping volumes and transfer of risk and title to customers.
Stream Sales
The following table shows stream sales included within realized prices and their respective deferred revenue and cash payment rates:
| | Three months ended | Year ended |
| | Dec. 31, 2020 | Dec. 31, 2020 |
| | Manitoba | Peru | Manitoba | Peru |
Gold | oz | 5,435 | 1,848 | 18,503 | 6,299 |
Silver | oz | 92,834 | 442,199 | 355,318 | 1,460,886 |
| | | | | |
Gold deferred revenue drawdown rate1,2 | $/oz | 1,217 | 976 | 1,173 | 976 |
Gold cash rate3 | $/oz | 424 | 408 | 422 | 406 |
Total gold stream realized price | $/oz | 1,641 | 1,384 | 1,595 | 1,382 |
| | | | | |
Silver deferred revenue drawdown rate1,2 | $/oz | 23.47 | 21.52 | 22.43 | 21.52 |
Silver cash rate3 | $/oz | 6.26 | 6.02 | 6.23 | 5.99 |
Total silver stream realized price | $/oz | 29.73 | 27.54 | 28.66 | 27.51 |
| | | | |
| Three months ended | Year ended |
Dec. 31, 2019 | Dec. 31, 2019 |
Manitoba | Peru | Manitoba | Peru |
Gold | oz | 4,160 | 3,103 | 17,740 | 11,750 |
Silver | oz | 61,487 | 671,742 | 355,468 | 2,405,554 |
| | | | | |
Gold deferred revenue drawdown rate1,2 | $/oz | 1,183 | 948 | 1,177 | 948 |
Gold cash rate 3 | $/oz | 420 | 404 | 418 | 402 |
Total gold stream realized price | $/oz | 1,603 | 1,352 | 1,595 | 1,350 |
| | | | | |
Silver deferred revenue drawdown rate1,2 | $/oz | 22.63 | 21.77 | 22.51 | 21.77 |
Silver cash rate 3 | $/oz | 6.20 | 5.96 | 6.17 | 5.93 |
Total silver stream realized price | $/oz | 28.83 | 27.73 | 28.68 | 27.70 |
1Subsequent to the variable consideration adjustment recorded on August 1, 2020, the deferred revenue amortization is recorded in Manitoba at C$1,589/oz gold and C$30.63/oz silver (December 31, 2019 - C$1,562/oz gold and C$29.89/oz silver) and converted to US dollars at the exchange rate in effect at the time of revenue recognition. |
2 Deferred revenue drawdown rates for gold and silver do not include variable consideration adjustments. |
3 The gold and silver cash rate for Manitoba increased by 1% from $400/oz and $5.90/oz effective August 1, 2015. Subsequently every year, on August 1, the cash rate will increase by 1% compounded. The weighted average cash rate is disclosed. The gold and silver cash rate for Peru increased by 1% from $400/oz and $5.90/oz effective July 1, 2019. Subsequently every year, on July 1, the cash rate will increase by 1% compounded. The weighted average cash rate is disclosed. |
Cost of Sales
Our detailed cost of sales is summarized as follows:
(in thousands) | Three months ended | | Year ended | |
Dec. 31, 2020 | | | Dec. 31, 2019 | | | Dec. 31, 2020 | | | Dec. 31, 2019 | | |
Peru | | | | | | | | |
Mining | 24,967 | | | 18,533 | | | 70,724 | | | 82,417 | | |
Milling | 39,219 | | | 43,860 | | | 134,096 | | | 159,913 | | |
Changes in product inventory | (6,550) | | | 7,410 | | | (3,883) | | | (3,313) | | |
Depreciation and amortization | 50,861 | | | 56,938 | | | 184,275 | | | 209,126 | | |
G&A | 14,540 | | | 15,174 | | | 43,393 | | | 56,922 | | |
Overhead costs related to suspension of activities (cash) | - | | | - | | | 15,810 | | | - | | |
Inventory adjustments | (2,188) | | | (100) | | | 32 | | | 504 | | |
Freight, royalties and other charges | 11,388 | | | 17,273 | | | 39,915 | | | 59,740 | | |
Total Peru cost of sales | 132,237 | | | 159,088 | | | 484,362 | | | 565,309 | | |
Manitoba | | | | | | | | |
Mining | 46,598 | | | 46,335 | | | 178,308 | | | 186,972 | | |
Milling | 11,147 | | | 13,396 | | | 46,057 | | | 49,269 | | |
Zinc plant | 18,736 | | | 19,464 | | | 71,799 | | | 72,259 | | |
Changes in product inventory | 2,029 | | | 3,267 | | | 2,054 | | | (4,413) | | |
Depreciation and amortization | 47,722 | | | 37,007 | | | 177,552 | | | 135,429 | | |
G&A | 12,874 | | | 11,500 | | | 50,312 | | | 47,119 | | |
Overhead costs related to suspension of activities (cash) | 8,232 | | | - | | | 8,232 | | | - | | |
Freight, royalties and other charges | 8,348 | | | 8,795 | | | 34,742 | | | 33,953 | | |
Total Manitoba cost of sales | 155,686 | | | 139,764 | | | 569,056 | | | 520,588 | | |
Cost of sales | 287,923 | | | 298,852 | | | 1,053,418 | | | 1,085,897 | | |
Total cost of sales for the fourth quarter of 2020 was $287.9 million, reflecting a decrease of $11.0 million from the fourth quarter of 2019. Cost of sales related to Peru decreased in the fourth quarter of 2020, compared to the same period of 2019, by $26.9 million. The decrease is primarily the result of changes in product inventory due to an inventory buildup in the fourth quarter of 2020 and lower mining and milling costs which is a function of lower production volumes as well as reduced freight and other charges compared to the same period in 2019. In Manitoba, cost of sales increased by $15.9 million, compared to the fourth quarter of 2019, primarily as a result of the production interruption at 777 mine during the fourth quarter of 2020 which resulted in a $11.7 million fixed overhead charge (cash: $8.2 million; non-cash: $3.5 million included in depreciation) that would have been capitalized to inventories. The depreciation also increased during the fourth quarter of 2020 compared to the same period in 2019 as a result of increases to our decommissioning and restoration obligation assets that were recorded in the fourth quarter of 2019 and are being depreciated through to the end of the mine life in 2022.
For the full year, cost of sales was $1,053.4 million, which was $32.5 million less than in 2019. The decrease is principally related to lower production costs from an eight-week suspension of Constancia operations in the second quarter of 2020 partially offset by an accounting charge for $31.9 million of fixed overhead costs (cash: $15.8 million; non-cash: $16.1 million included in depreciation) that would ordinarily have been capitalized to inventories and property, plant, and equipment. In Manitoba, cost of sales increased by $48.5 million compared to 2019 for the same reasons described above.
For details on unit operating costs refer to the respective tables in the "Operations Review" section of this MD&A.
For the fourth quarter of 2020, other significant variances in expenses from operations, compared to the same period in 2019, include the following:
- Selling and administrative expense increased by $9.0 million compared to the same period in 2019. This increase was mainly due to higher stock-based compensation charges as a result of the relative impact of the revaluation of previously issued share units to higher share prices.
- Exploration and evaluation expenses decreased by $3.3 million compared to the fourth quarter of 2019, in line with the reduced 2020 exploration budget compared to 2019.
For full year 2020, other significant variances in expenses from operations, compared to 2019, include the following:
- Selling and administrative expense increased by $5.2 million compared to the same period in 2019. This increase was mainly due to higher stock-based compensation charges as a result of the relative impact of the revaluation of previously issued share units to higher share prices. This was partially offset by a general reduction in consulting, legal and travel costs.
- Exploration and evaluation expenses decreased by $13.6 million in line with the reduced 2020 exploration budget compared to 2019.
- Other expenses decreased by $33.5 million due to the write down of a joint venture receivable (the "UCM Receivable") from prior year of $26.0 million as well as the recognition of a delivery obligation related to the Pampacancha deposit from prior year of $7.5 million, neither of which reoccurred in the current year.
- Impairment losses decreased by $322.2 million as a result of an impairment charge recorded in the third quarter of 2019 in our investment in the Rosemont project.
Net finance expense
(in $ thousands) | | Three months ended | Year ended |
| Dec. 31, 2020 | | Dec. 31, 2019 | | | Dec. 31, 2020 | | Dec. 31, 2019 | |
| | | | | | |
Finance costs - accrued or payable: | | | | | | |
Interest expense on long-term debt | | 21,610 | | 19,591 | | | 82,712 | | 78,265 | |
Withholding taxes | | 2,095 | | 1,849 | | | 8,267 | | 8,100 | |
Tender premium on 7.25% senior unsecured notes | | - | | - | | | 7,252 | | - | |
Other accrued/payable costs (income)1 | | 2,225 | | 2,131 | | | 7,014 | | 2,500 | |
Total finance costs - accrued or payable | | 25,930 | | 23,571 | | | 105,245 | | 88,865 | |
| | | | | | |
Finance costs - non-cash: | | | | | | |
Accretion on streaming agreements2 | | 13,854 | | 15,945 | | | 56,670 | | 69,772 | |
Interest capitalized | | - | | - | | | - | | (9,890) | |
Change in fair value of financial assets and liabilities at fair value through profit or loss | | (37,520) | | 8,035 | | | (29,370) | | 8,247 | |
Write off unamortized transaction costs | | - | | - | | | 3,817 | | - | |
Other non-cash costs3 | | 4,004 | | 1,059 | | | 5,540 | | 7,002 | |
Total finance costs - non-cash | | (19,662) | | 25,039 | | | 36,657 | | 75,131 | |
Net finance expense | | 6,268 | | 48,610 | | | 141,902 | | 163,996 | |
1 Includes interest income and other finance expense. |
2 Includes variable consideration adjustment (prior periods). |
3 Includes accretion on community agreements, unwinding of discount on provisions, and net foreign exchange losses (gains). |
Compared to the three months ended December 31, 2019, net finance expense decreased by $42.3 million mainly due to a $44.7 million decrease in non-cash finance costs. This was principally caused by a $48.4 million relative increase in the fair value of the embedded derivative on the early redemption option associated with our senior unsecured notes due in 2025 in the fourth quarter of 2020 compared to the same period in 2019. This increase was partially offset by a $3.4 million non-cash revaluation of our gold prepayment liability measured through profit or loss.
On a year-to-date basis, net finance expense decreased by $22.1 million compared to the same period in 2019. The decline was mainly caused by a $48.2 relative increase in the fair value of the embedded derivative as described above, a $9.7 million relative change in variable consideration adjustment reducing the accretion expense on our stream arrangements as well as an $8.7 million relative increase in the market value of our investments measured through profit or loss. These increases were partially offset by a $20.1 million non-cash revaluation of our gold prepayment liability, a $9.9 million increase in net interest charges (as, effective October 1, 2019, we no longer capitalize interest costs on the Rosemont project, due to its delay in development), a one-time payment of $7.3 million to satisfy the early redemption premium paid to holders of our Redeemed Notes, a decline of $6.7 million for interest earned on our cash balances as well as a $3.8 million charge for the write-down of unamortized transaction costs related to the Redeemed Notes.
Tax Recovery
For the three months and year ended December 31, 2020, tax recovery decreased by $34.4 million and $74.5 million, respectively, compared to the same period in 2019. The following table provides further details:
| Three months ended | | Year ended |
Dec. 31, 2020 | Dec. 31, 2019 | | Dec. 31, 2020 | | Dec. 31, 2019 |
(in $ thousands) | | |
Deferred tax recovery - income tax 1 | (11,711) | | (48,476) | | (39,904) | | | (132,479) |
Deferred tax recovery - mining tax 1 | (256) | | (12,498) | | (3,332) | | | (12,386) |
Total deferred tax recovery | (11,967) | | (60,974) | | (43,236) | | | (144,865) | |
Current tax expense - income tax | 3,749 | | 19,067 | | 4,109 | | 30,201 |
Current tax expense - mining tax | 1,723 | | 1,010 | | 4,622 | | 5,711 |
Total current tax expense | 5,472 | | 20,077 | | 8,731 | | 35,912 |
Tax recovery | (6,495) | | (40,897) | | (34,505) | | (108,953) |
1 Deferred tax expense (recovery) represents our draw down/increase of non-cash deferred income and mining tax assets/liabilities. |
Income Tax Recovery
Applying the estimated Canadian statutory income tax rate of 26.3% to our loss before taxes of $179.1 million for the full year in 2020 would have resulted in a tax recovery of approximately $47.0 million; however, we recorded an income tax recovery of $35.8 million. The significant items causing our effective income tax rate to be different than the 26.3% estimated Canadian statutory income tax rate include:
- Deferred tax recovery of approximately $3.6 million as certain non-monetary assets are recognized at historical cost while the tax bases of the assets change as the exchange rates fluctuates, which creates taxable temporary differences.
- Certain deductible temporary differences mostly with respect to Peru, and mostly relating to the decommissioning and restoration liabilities, were not recognized as we have determined that it is not probable that we will realize the recovery of these deferred tax assets based on the timing of the reversals of the deductible temporary differences and the future projected taxable profit of the Peruvian operations. This has resulted in deferred tax expense of $8.5 million.
- Certain deductible temporary differences with respect to Manitoba, and mostly relating to the decommissioning and restoration liabilities, were not recognized as we have determined that it is not probable that we will realize the recovery of these deferred tax assets based on the timing of the reversals of the deductible temporary differences and the future projected taxable profit of the Manitoba operations. Adjusted for the average annual effective tax rate methodology, this resulted in deferred tax expense of $1.5 million.
- Certain deductible temporary differences with respect to our foreign operations are recorded using an income tax rate other than the Canadian statutory income tax rate of 26.3%, resulting in a deferred tax expense of $5.5 million.
- Certain foreign exchange gains and other items are not taxable for local income tax purposes and therefore result in a deferred tax recovery of approximately $1.8 million.
- We revised our computation of deferred tax assets related to deductible temporary differences in Canada for changes in statutory tax rates taking into account the relevant provincial allocation factors based on income earned in different Canadian jurisdictions. This resulted in a decrease to the Canadian statutory rate from 27.0% to 26.3% during the fiscal year. The result was a deferred tax expense of approximately $2.4 million.
A decrease in the statutory tax rate in 2020 mainly reflects a reduction in the Canadian statutory tax rate which is the result of the changes to the relevant provincial allocation factors based on income earned and expenses incurred in different Canadian jurisdictions.
Applying the estimated Canadian statutory income tax rate of 27.0% to our loss before taxes of $452.8 million for the full year in 2019 would have resulted in a tax recovery of approximately $122.2 million; however, we recorded an income tax recovery of $102.3 million. The significant items causing our effective income tax rate to be different than the 27.0% estimated Canadian statutory income tax rate include:
- Certain previously unrecognized deductible temporary differences with respect to Manitoba, and mostly relating to the decommissioning and restoration liabilities, were recognized in the current year as we have determined that it is probable that we will realize the recovery of these deferred tax assets through the reversals of temporary differences and future projected taxable profit of the Manitoba operations. This results in a decrease in deferred tax expense of approximately $16.3 million;
- Certain deductible temporary differences with respect to our foreign operations are recorded using an income tax rate other than the Canadian statutory income tax rate of 27.0%, resulting in a deferred tax expense of $20.3 million;
- The write down of the UCM Receivable of $26.0 million is not deductible for local income tax purposes and therefore results in an increase in deferred tax expense of approximately $7.0 million; and
- An intercompany dividend payment being subject to withholding tax that is classified as current income tax of $6.8 million.
Mining Tax Recovery
Applying the estimated Manitoba mining tax rate of 10.0% to our loss before taxes of $179.1 million for the full year in 2020 would have resulted in a tax recovery of approximately $17.9 million; however, we recorded a mining tax expense of $1.3 million. Effective mining tax rates can vary significantly based on the composition of our earnings and the expected amount of mining taxable profits. Corporate costs and other costs not related to mining operations are not deductible in computing mining profits. A brief description of how mining taxes are calculated in our various business units is discussed below.
Manitoba
The Province of Manitoba imposes mining tax on profit related to the sale of mineral products mined in the Province of Manitoba (mining taxable profit) at the following rates:
- 10% of total mining taxable profit if mining profit is C$50 million or less;
- 15% of total mining taxable profit if mining profits are between C$55 million and C$100 million; and
- 17% of total mining taxable profit if mining profits exceed C$105 million.
We estimate that the tax rate that will be applicable when temporary differences reverse will be approximately 10.0%.
Peru
The Peruvian government imposes two parallel mining tax regimes, the Special Mining Tax and the Modified Royalty, on companies' operating mining income on a sliding scale, with progressive rates ranging from 2.0% to 8.4% and 1.0% to 12.0%, respectively. Based on financial forecasts, we have recorded a deferred tax liability as at December 31, 2020, at the tax rate we expect to apply when temporary differences reverse.
LIQUIDITY AND CAPITAL RESOURCES
Senior Unsecured Notes Refinancing
On September 23, 2020, we completed the offering of $600.0 million aggregate principal amount of 6.125% senior notes due April 2029 (the "New Notes"). The New Notes are governed by an indenture, dated as of September 23, 2020, among the Company, the subsidiaries of the Company party thereto as guarantors and U.S. Bank National Association, as trustee.
The proceeds from this offering were primarily used to redeem all $400.0 million of our outstanding 7.25% senior unsecured notes due 2023 (the "Redeemed Notes"), including the payment of accrued and unpaid interest and a call premium of $7.3 million, and to pay transaction costs associated with the New Notes.
Senior Secured Revolving Credit Facilities
On August 31, 2020, we completed an amendment to our senior secured revolving credit facilities (the "Credit Facilities"). As a result of the amendment, the total available borrowings under the Credit Facilities decreased to $400.0 million from $550.0 million to reflect our anticipated business requirements until June 2022 when the Credit Facilities mature. We also revised various financial covenants as follows:
- Maintaining net debt to EBITDA ratio of less than:
◦ 5.25:1 from September 30, 2020 to December 31, 2021; and,
◦ 3.50:1 from January 1, 2022 to maturity.
- Maintaining an interest coverage ratio of greater than:
◦ 2.50:1 from September 30, 2020 to December 31, 2021; and,
◦ 3.00:1 from January 1, 2022 to maturity.
- Maintaining a minimum liquidity of greater than $50 million to December 31, 2021.
The EBITDA calculation for the purposes of the covenants may differ from the non-IFRS measure of adjusted EBITDA shown in this MD&A. As at December 31, 2020, our liquidity includes $439.1 million in cash and cash equivalents as well as undrawn availability of $284.9 million under our Credit Facilities. As at December 31, 2020, we are in compliance with our covenants under the Credit Facilities and have drawn $115.1 million in letters of credit under the Credit Facilities.
As at December 31, 2020, the Arizona business unit had $8.6 million in surety bonds and the Peru business unit had $20.0 million in surety bonds issued to support future reclamation and closure obligations. The Peru business unit also had $45.0 million in letters of credit issued with various Peruvian financial institutions. No cash collateral is required to be posted under these letters of credit or surety bonds.
Financial Condition
Financial Condition as at December 31, 2020 compared to December 31, 2019
Cash and cash equivalents increased by $43.0 million during the year to $439.1 million as at December 31, 2020. This increase was mainly the result of cash flow from operating activities of $239.5 million, $115.0 million of proceeds from the gold prepay transaction and approximately $191.8 million in net proceeds raised from our New Notes offering. Offsetting these cash inflows was $361.2 million of capital investments primarily at our Peru and Manitoba operations, interest payments of $81.5 million, leasing and financing payments of $52.2 million, a $7.3 million premium paid to redeem our 2023 Notes and dividends of $3.8 million. We hold the majority of our cash and cash equivalents in low-risk, liquid investments with major Canadian and Peruvian financial institutions.
Working capital increased by $35.6 million to $306.9 million from December 31, 2019 to December 31, 2020, primarily due to the cash and cash equivalent increase of $43.0 million and an increase of $35.2 million in trade receivables due to timing of cash receipts, partially offset by an increase in trade and other payables of $40.7 million arising mainly from timing of payments.
Cash Flows
The following table summarizes our cash flows for the three months and year ended December 31, 2020 and December 31, 2019:
(in $ thousands) | | Three months ended | | Year ended |
| Dec. 31, 2020 | | Dec. 31, 2019 | | Dec. 31, 2020 | | Dec. 31, 2019 |
Operating cash flow before changes in non-cash working capital | | 86,071 | | 69,141 | | 241,863 | | 307,284 |
Change in non-cash working capital | | 35,019 | | 29,524 | | (2,383) | | 3,572 |
Cash generated from operating activities | | 121,090 | | 98,665 | | 239,480 | | 310,856 |
Cash (used in) generated by investing activities | | (117,498) | | (86,689) | | (359,018) | | (292,370) |
Cash (used in) generated by financing activities | | (13,192) | | (14,386) | | 162,093 | | (137,778) |
Effect of movement in exchange rates on cash and cash equivalents | | (279) | | 118 | | | 434 | | (59) |
(Decrease) increase in cash and cash equivalents | | (9,879) | | (2,292) | | 42,989 | | (119,351) |
Cash Flow from Operating Activities
Cash generated from operating activities was $121.1 million during the fourth quarter of 2020, an increase of $22.4 million compared with the same period in 2019. Operating cash flow before change in non-cash working capital was $86.1 million during the fourth quarter of 2020, reflecting an increase of $17.0 million compared to the fourth quarter of 2019. The increase in operating cash flow is primarily the result of higher realized copper and gold prices, higher gold sales volume as well as lower cash costs when compared to the fourth quarter of 2019. This was partially offset by lower sales volumes of copper compared to the fourth quarter of 2019.
Cash generated from operating activities for the full year was $239.5 million, representing a decrease of $71.4 million compared to 2019. Operating cash flow before change in non-cash working capital was $241.9 million for the year, compared to $307.3 million during 2019. The decrease in operating cash flow for the full year is due to significantly lower copper sales volumes in Peru as a result of an eight-week suspension of Constancia operations in the second quarter and lower copper grades as well as lower realized zinc prices and silver sales volumes. This was partially offset by higher realized copper and gold prices and higher gold sales volumes.
Cash Flow from Investing and Financing Activities
During the fourth quarter of 2020, we used $130.7 million in investing and financing activities, primarily driven by $117.9 million of capital expenditures, capitalized lease payments of $9.4 million and other financing payments of $3.8 million.
For the full year in 2020, we used $196.9 million of cash in investing and financing activities, composed primarily of $361.2 million of capital investments, interest payments of $81.5 million, capitalized lease payments of $36.0 million and other financing payments of $16.2 million, partially offset by net proceeds of $191.8 million from our New Notes offering, and $115.0 million of proceeds from the gold prepay transaction.
Capital Expenditures
The following summarizes accrued and cash additions to capital assets for the periods indicated:
(in $ millions) | Three months ended | Year ended | Guidance |
Dec. 31, 2020 | Dec. 31, 2019 | Dec. 31, 2020 | Dec. 31, 2019 | Annual |
2020 1 | 2021 |
Manitoba sustaining capital expenditures | 21.7 | | 30.0 | | 95.3 | | 126.3 | | 100.0 | 90.0 |
Peru sustaining capital expenditures 2 | 37.0 | | 31.4 | | 91.1 | | 84.9 | | 80.0 | 135.0 |
Total sustaining capital expenditures | 58.7 | | 61.4 | | 186.4 | | 211.2 | | 180.0 | 225.0 |
Arizona capitalized costs | 5.9 | | 7.0 | | 15.6 | | 36.4 | | 20.0 | 20.0 |
Peru growth capitalized expenditures 3 | 11.3 | | 1.2 | | 107.0 | | 2.1 | | 70.0 | 5.0 |
Manitoba growth capitalized expenditures | 30.4 | | 7.8 | | 61.4 | | 14.1 | | 80.0 | 75.0 |
Other capitalized costs 4 | 5.8 | | 49.3 | | 52.3 | | 91.9 | | | |
Capitalized exploration | 8.6 | | 8.9 | | 11.9 | | 15.7 | | 15.0 | 15.0 |
Capitalized interest | - | | - | | - | | 9.9 | | | |
Total other capitalized costs | 62.0 | | 74.2 | | 248.2 | | 170.1 | | | |
Total capital additions | 120.7 | | 135.6 | | 434.6 | | 381.3 | | | |
Reconciliation to cash capital additions: | | | | | | |
Decommissioning and restoration obligation | (3.6) | | (46.6) | | (46.8) | | (89.4) | | | |
Capitalized interest | - | | - | | - | | (9.9) | | | |
Right-of-use asset additions | (0.3) | | (2.4) | | (17.8) | | (22.2) | | | |
Change in community agreement accruals | 0.6 | | - | | (6.7) | | - | | | |
Change in capital accruals and other | 0.5 | | 2.1 | | (2.1) | | (0.6) | | | |
Total cash capital additions | 117.9 | | 88.7 | | 361.2 | | 259.2 | | | |
1 Reflects Manitoba guidance issued February 20, 2020 and updated Peru guidance issued August 11, 2020. | |
2 Peru sustaining capital expenditures includes capitalized stripping costs. | |
3 Hudbay's initial growth capital guidance for Peru of $70 million did not include the cost of the individual land user agreements due to the ongoing nature of the negotiations. |
4 Other capitalized costs include decommissioning and restoration adjustments. | |
Sustaining capital expenditures in Manitoba for the three months and year ended December 31, 2020 were $21.7 million and $95.3 million respectively, representing decreases of $8.3 million and $31.0 million, respectively, compared to the same periods in 2019. The decrease is mostly due to a reduction in capital development at the 777 mine as it nears the end of its mine life in 2022. Planned equipment purchases that are designated for 777 will ultimately be transferred to Lalor once 777 closes and capital development spending at 777 is expected to be further reduced into 2021.
Sustaining capital expenditures in Peru for the three months and year ended December 31, 2020 were $37.0 million and $91.1 million respectively, representing increases of $5.6 million and $6.2 million, respectively, from the same periods in 2019. The increase in Peru sustaining capital expenditures compared to the same period last year was mainly due to higher mine maintenance and tailings management construction costs, partially offset by decreased capitalized stripping costs.
Peru's 2020 growth capital of $107.0 million includes costs associated with the surface rights acquisition agreement with the local community and the individual agreements related to certain community members who were using the land. For the full year, growth capital spending for Peru has exceeded the initial guidance as a result of the commitments under the individual land-user agreements. As previously disclosed, the Company's initial growth capital guidance for Peru of $70.0 million did not include the cost of the individual land user agreements due to the ongoing nature of the negotiations.
Manitoba's 2020 growth capital of $61.4 million includes spending for the New Britannia refurbishment project which includes construction of the new copper flotation building and construction of a pipeline between the New Britannia and Stall mills. The project is currently approximately 73% complete and is tracking ahead of the original schedule. Despite tracking ahead of schedule, the project spending in 2020 was lower than expected with the difference expected to be spent in 2021.
Other capitalized costs for the three months and year ended December 31, 2020 were $5.8 million and $52.3 million, respectively, and relate primarily to the remeasurement of previously recognized decommissioning and restoration liabilities at our Peru and Manitoba operations.
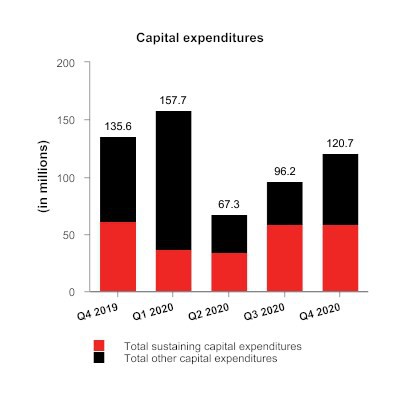
Capital Commitments
As at December 31, 2020, we had outstanding capital commitments in Canada of approximately $22.5 million of which $19.0 million can be terminated, approximately $39.1 million in Peru primarily related to exploration option agreements, all of which can be terminated, and approximately $179.7 million in Arizona, primarily related to our Rosemont project, of which approximately $89.3 million can be terminated.
Contractual Obligations
The following table summarizes our significant contractual obligations as at December 31, 2020:
| Less than
12 months | 13 - 36
months | 37 - 60
months | More than
60 months |
Payment Schedule (in $ millions) | Total |
Long-term debt obligations1 | 1,726.9 | | 88.0 | | 168.2 | | 742.1 | | 728.6 | |
Gold prepayment obligation3 | 137.0 | | - | | 137.0 | | - | | - | |
Lease obligations | 129.0 | | 93.3 | | 29.5 | | 2.0 | | 4.2 | |
Purchase obligation - capital commitments | 241.3 | | 38.7 | | 20.0 | | 28.0 | | 154.6 | |
Purchase obligation - other commitments2 | 953.3 | | 397.9 | | 327.1 | | 158.4 | | 69.9 | |
Pension and other employee future benefits obligations3 | 166.5 | | 16.7 | | 30.2 | | 7.6 | | 112.0 | |
Community agreement obligations4 | 58.8 | | 12.1 | | 9.5 | | 6.6 | | 30.6 | |
Decommissioning and restoration obligations4 | 268.6 | | 19.6 | | 25.6 | | 7.6 | | 215.8 | |
Total | 3,681.4 | | 666.3 | | 747.1 | | 952.3 | | 1,315.7 | |
1 Long-term debt obligations include scheduled interest payments, as well as principal repayments. |
2 Primarily made up of long-term agreements with operational suppliers, obligations for power purchase, Pampacancha delivery obligation, concentrate handling, fleet and port services, as well as deferred consideration arising from the acquisition of Rosemont's minority interest. |
3 Discounted. |
4 Represents the Peru community agreement obligations, excluding interest. |
5 Undiscounted before inflation. |
In addition to the contractual obligations included in the above payment schedule, we also have the following commitments which impact our financial position:
- A profit-sharing plan with most Manitoba employees;
- A profit-sharing plan with all Peru employees;
- Wheaton precious metals stream agreements for the 777 mine and Constancia mines;
- A net smelter returns royalty agreement related to the 777 mine; and,
- Government royalty payments related to the Constancia mine.
Outstanding Share Data
As of February 17, 2021, there were 261,272,151 common shares of Hudbay issued and outstanding. In addition, there were 1,563,189 stock options outstanding.
FINANCIAL RISK MANAGEMENT
Impact of COVID-19
As a result of the COVID-19 global pandemic, we have experienced operational, supply chain, travel, labour and shipping disruptions, as well as delays to our community engagement efforts in Peru, and we may continue to experience similar disruptions in the future. As a result, our financial results may remain volatile as COVID-19 continues to affect production, operating costs and the prices we receive for our products, as well as the development timeline for Pampacancha. The resumption of normal operating activities is highly dependent on the global response and impact of the COVID-19 global pandemic and, at a local level, the expected development timeline for Pampacancha depends upon our ability to effectively engage and negotiate with individual land users as well as the communities that are affected by our Constancia project in Peru. We expect that our current liquidity together with cash flows from operations will be sufficient to meet our liquidity needs in 2021.
Given the uncertainty of the duration and magnitude of the impact of COVID-19, including its impact on the development timeline for Pampacancha, our 2021 production and cost guidance are subject to a higher than normal degree of uncertainty.
Political and Social Risks
Peru has recently undergone a period of heightened political instability. A general election is scheduled to be held in April 2021 in which a record number of candidates are presently running for President. A change in government, government policy, the declaration of a state of emergency or the implementation of new, or the modification of existing, laws and regulations affecting our operations and other mineral properties could have a material adverse impact on us and our projects. The risk exists that further government limitations, restrictions or requirements, not presently foreseen, will be implemented. In addition, changes in policy that alter laws regulating the mining industry could have a material adverse effect on us. We are at a heightened risk of having this occur whenever there is a change in government in the countries or regions in which we operate and, in the current environment, due to the COVID-19 pandemic.
Political or social unrest in Peru or instability could adversely affect our ability to operate the Constancia mine and develop the Pampacancha deposit. Such adverse effects could result from positions or actions that may be taken by the national government or at the regional, community or local levels by government or non-government actors, including demanding payments, encroaching on our land, challenging the boundaries of such land or our rights to possess and operate on such land, protesting against our operation, impeding project activities through roadblocks or other public manifestations and attacking project assets or personnel. The risk of disruptions from such opposition tends to increase with national, regional and local elections in Peru as well as with change to the general political and social climate in the area in which we operate. While we continue to seek to constructively engage with all our stakeholders in the Constancia region, we've experienced an increase in disruptive activity in the Province of Chumbivilcas in recent weeks.
We continue to actively monitor the political and social risks in Peru during this elevated period of instability.
Reclamation and Mine Closure Costs
The ultimate timing of, and costs for, future removal and site restoration could differ from current estimates. Our estimates for this future liability are subject to change based on updated closure plans, amendments to applicable laws and legislation, the nature of ongoing operations and technological innovations. In addition, regulatory authorities in various jurisdictions require us to post financial assurances to secure, in whole or in part, future reclamation and restoration obligations in such jurisdictions based on the approved closure plans. Changes to the amounts required, as well as the nature of the collateral to be provided, including as a result of updated closure plans, could significantly increase our costs, making the maintenance and development of existing and new mines less economically feasible, and any capital resources we utilize for this purpose will reduce the resources available for our other operations and commitments. Although we accrue for future closure costs based on current disturbance, we do not necessarily reserve cash in respect of these obligations or otherwise fund these obligations in advance. As a result, we will have significant cash expenditures when we are required to close and restore mine sites, including our 777 mine and Flin Flon operations. Our estimate of this future liability may increase as a result of a new closure plan for the 777 mine and Flin Flon operations. We expect our new Flin Flon closure plan to be submitted to the Manitoba and Saskatchewan governments for approval later in 2021.
Carrying Values and Mine Plan Updates
At the end of each reporting period, Hudbay reviews its groups of non-financial assets to determine whether there are any indicators of impairment or impairment reversal. If any such indicator exists, the Company estimates the recoverable amount of the non-financial asset group in order to determine the extent of the impairment loss or reversal, if any. At December 31, 2020, the Company assessed whether there were impairment or impairment reversal indicators associated with the general business environment and known changes to business planning (including any arising from the potential impacts of COVID-19 on our business) and determined there were none.
There are a number of potential indicators that could trigger non-financial asset impairment or reversal of impairment in the future. One such potential indicator is a change to the life of mine ("LOM") plan for an asset. LOM plans incorporate management's best estimates of key assumptions which include future commodity prices, the value of mineral resources not included in the LOM plan, production based on current estimates of recoverable reserves, discount rates, future operating and capital costs and future foreign exchange rates.
There is a risk that certain assumptions in the updated LOM plans for the Snow Lake operations and Constancia that are planned to be completed by the end of March 2021 could give rise to an indicator of impairment or impairment reversal and cause an adjustment to the carrying value of the relevant assets and/or impact our financial statements.
Metals Price Strategic Risk Management
From time to time, we maintain price protection programs and conduct commodity price risk management to reduce risk through the use of financial instruments.
Commodity prices are a key driver of our financial and operational results. Our strategic objective is to provide our investors with exposure to base metals prices, unless a reason exists to implement a hedging arrangement.
In the normal course, we typically consider base metal price hedging:
- In conjunction with a major capital commitment to a growth opportunity for which operating cash flow is a key funding source;
- To ensure the viability of a shorter life and/or higher cost mine;
- To manage the risk associated with provisional pricing terms in concentrate purchase and sale agreements; or,
- To offset fixed price zinc sales contracts with customers.
During 2020, we entered into copper hedging transactions intended to manage the risk associated with provisional pricing terms in concentrate sales agreements.
As at December 31, 2020, we had 43.4 million pounds of net copper fixed for floating swaps outstanding at an average fixed receivable price of $3.22/lb associated with provisional pricing risk in concentrate sales agreements. These swaps settle across January to April 2021.
During the second quarter of 2020, we entered into a gold forward sale and prepay transaction which generated $115.0 million in cash proceeds to pre-fund the full capital budget of the New Britannia gold mill refurbishment. The transaction valued the future gold ounce delivery obligation for 79,954 gold ounces in 2022 and 2023 at forward curve prices averaging approximately $1,682 per ounce. The gold delivery obligation is to be satisfied with a monthly delivery of 3,331 gold ounces over a 24-month period from January 2022 to December 2023.
To provide a service to customers who purchase zinc from our plants and require known future prices, we enter into fixed price sales contracts. To ensure that we continue to receive a floating or unhedged realized zinc price, we enter into forward zinc purchase contracts that effectively offset the fixed price sales contracts with our customers.
From time to time, we enter into gold and silver forward sales contracts to hedge the commodity price risk associated with the future settlement of provisionally priced deliveries. We are generally obligated to deliver gold and silver to Wheaton prior to the determination of final settlement prices. These forward sales contracts are entered into at the time we deliver gold and silver to Wheaton, and are intended to mitigate the risk of subsequent adverse gold and silver price changes. Gains and losses resulting from the settlement of these derivatives are recorded directly to revenue, as the forward sales contracts do not achieve hedge accounting, and the associated cash flows are classified in operating activities. Our swap agreements are with counterparties we believe to be creditworthy and do not require us to provide collateral.
Interest Rate and Foreign Exchange Risk Management
To the extent that we incur indebtedness at variable interest rates to fund our growth objectives, we may enter into interest rate hedging arrangements to manage our exposure to short-term interest rates. To the extent that we make commitments to capital expenditures denominated in foreign currencies, we may enter into foreign exchange forwards or acquire foreign currency outright, which may result in foreign exchange gains or losses in our consolidated income statements.
At December 31, 2020, approximately $408.3 million of our cash and cash equivalents was held in US dollars, approximately $26.7 million of our cash and cash equivalents was held in Canadian dollars, and approximately $4.1 million of our cash and cash equivalents was held in Peruvian soles.
TREND ANALYSIS AND QUARTERLY REVIEW
A detailed quarterly and annual summary of financial and operating performance can be found in the "Summary of Results" section at the end of this MD&A. The following table sets forth selected consolidated financial information for each of our eight most recently completed quarters:
| | | | |
| 2020 | | 2019 |
(in $ millions) | Q4 | Q3 | Q2 | Q1 | | Q4 | Q3 | | Q2 | Q1 |
Revenue | 322.3 | 316.1 | 208.9 | 245.1 | | 324.5 | 291.3 | | 329.4 | 292.3 |
Gross profit | 34.4 | 39.3 | (12.7) | (22.0) | | 25.6 | 31.0 | | 43.1 | 51.8 |
Profit (loss) profit before tax | 0.9 | (23.9) | (74.6) | (81.5) | | (42.4) | (348.4) | | (43.9) | (18.1) |
Profit (loss) | 7.4 | (24.0) | (51.9) | (76.1) | | (1.5) | (274.8) | | (54.1) | (13.4) |
Adjusted net (loss) earnings1 | (16.4) | (25.4) | (39.7) | (39.4) | | (24.6) | (23.2) | | (8.1) | 7.3 |
Earnings (loss) per share: | | | | | | | | | | |
Basic and diluted | 0.03 | (0.09) | (0.20) | (0.29) | | (0.01) | (1.05) | | (0.21) | (0.05) |
Adjusted net (loss) earnings1 per share | (0.06) | (0.10) | (0.15) | (0.15) | | (0.09) | (0.09) | | (0.03) | 0.03 |
Operating cash flow2 | 86.1 | 84.4 | 29.5 | 42.0 | | 69.1 | 71.2 | | 81.3 | 85.7 |
Adjusted EBITDA1 | 106.9 | 96.1 | 49.1 | 55.0 | | 82.2 | 76.2 | | 95.9 | 104.2 |
1 Adjusted net (loss) earnings, adjusted net (loss) earnings per share, and adjusted EBITDA are non-IFRS financial performance measure with no standardized definition under IFRS. For further information and a detailed reconciliation, please see the discussion under the "Non-IFRS Financial Reporting Measures" section of this MD&A. |
2 Operating cash flow before changes in non-cash working capital. |
The year 2020 closed off with momentum for increasing commodity prices. An eight-week suspension of Constancia operations in Peru due to a government declared state of emergency during the first half of 2020 and a six-week production interruption at the 777 mine during the fourth quarter of 2020 impacted our production and sales volumes for the full year; however, the shift in sales from Constancia allowed us to benefit from the increasing commodity prices throughout the second half of 2020. The reduced copper production from Constancia and 777 was partially offset by increased production from Lalor.
Earnings in the fourth quarter benefited from $28.0 million in mark-to-market adjustments on certain financial instruments and were negatively impacted by the 777 production interruption which resulted in $11.7 million in certain overhead costs being expensed. Earnings in the third quarter of 2020 were negatively impacted by a $7.3 million premium paid to redeem the 2023 senior notes as well as a $3.8 million write-down of unamortized transaction costs. This was partially offset by an after-tax non-cash adjustment of $9.0 million on our streaming revenues.
Earnings in the second quarter of 2020 were impacted by the temporary suspension of operations at Constancia, which resulted in $25.6 million in certain overhead costs being expensed. The results in the first quarter of 2020 were less impacted by the Constancia shutdown and reflected $6.3 million of shutdown-related overhead costs as well as an inventory write-down of $10.4 million triggered by lower copper prices.
Earnings in 2019 were impacted by an after-tax impairment charge of $242.1 million in the third quarter of 2019, as well as the UCM Receivable write down of $26.0 million in the second quarter of 2019. In the first quarter of 2019, pre-tax revenue and finance expenses were negatively impacted by a $22.3 million charge due to a deferred revenue adjustment arising from higher net mineral reserves and resources.
The following table sets forth selected consolidated financial information for each of the three most recently completed years:
(in $ millions, except for earnings (loss) per share and dividends declared per share) | 2020 | | 2019 | | 2018 | |
Revenue | 1,092.4 | | 1,237.4 | | 1,472.4 | |
Gross profit | 39.0 | | 151.5 | | 373.7 | |
(Loss) profit before tax | (179.1) | | (452.8) | | 170.8 | |
(Loss) profit | (144.6) | | (343.8) | | 85.4 | |
Adjusted (loss) earnings 1 | (121.0) | | (48.6) | | 104.1 | |
(Loss) earnings per share: | | | |
Basic and diluted | (0.55) | | (1.32) | | 0.33 | |
Adjusted (loss) earnings1 per share | (0.46) | | (0.18) | | 0.40 | |
Total assets | 4,666.6 | | 4,461.1 | | 4,685.6 | |
Operating cash flow2 | 241.9 | | 307.3 | | 501.4 | |
Adjusted EBITDA1 | 306.7 | | 358.5 | | 554.8 | |
Total non-current financial liabilities3 | 1,360.1 | | 1,074.2 | | 1,053.6 | |
Dividends declared per share - C$4 | 0.02 | | 0.02 | | 0.02 | |
1 Adjusted net (loss) earnings, adjusted net (loss) earnings per share, and adjusted EBITDA are non-IFRS financial performance measure with no standardized definition under IFRS. For further information and a detailed reconciliation, please see the discussion under the "Non-IFRS Financial Reporting Measures" section of this MD&A. |
2 Operating cash flow before change in non-cash working capital. |
3 Total long-term financial liabilities include non-current portions of net long-term debt, other financial liabilities and finance lease obligations. |
4 Dividend paid during March and September of each year. |
Although realized prices for copper and gold rose by 5% and 24%, respectively compared to 2019, current year revenues declined by 12% due to lower sales volumes for copper. Sales volumes of copper declined by 31% in 2020 as compared to 2019 as a result of the temporary suspension of Constancia operations. Gross profit declined by 74% in 2020 as compared to 2019 as we expensed certain fixed overhead production costs of $31.9 million during the temporary suspension of operations at Constancia and $11.7 million during the production interruption at 777. Adjusted net loss in 2020 increased by $72.4 million compared to 2019 as a result of the same factors described above.
In 2019, realized prices for copper and zinc decreased by 7% and 11% respectively, compared to prices in 2018. Realized prices for gold increased by 6% compared to prices in 2018. Mill throughput at Constancia reached annual record levels, contributing to higher milling costs, however milled grades dropped in accordance with the mine plan and these factors drove the overall reduction in operating cash flow before changes in non-cash working capital. Revenues decreased by 16% due to lower metals prices and sales volumes for copper and zinc. Profit before tax decreased $623.6 million mainly due to a $322.2 million impairment charge recorded in the third quarter of 2019 relating to the Arizona business unit, as well as a write down of the UCM Receivable for $26.0 million in the second quarter of 2019.
In addition to the items noted above which impacted gross profit, net profit (loss) was impacted by the following items:
Year | Significant non-recurring items affecting net income | After tax net income impact (in $ millions) |
| | | | |
2018 | Non-cash deferred tax adjustments | (21.7) | |
2019 | Non-cash deferred tax adjustments | 16.3 | |
2019 | Write-down on UCM receivable | (26.0) | |
2019 | Rosemont impairment | (242.1) | |
2020 | Non-cash deferred tax adjustments | (6.4) | |
2020 | Peru overhead direct charge | (20.8) | |
2020 | Manitoba overhead direct charge | (7.8) | |
NON-IFRS FINANCIAL PERFORMANCE MEASURES
Adjusted net earnings (loss), adjusted net earnings (loss) per share, adjusted EBITDA, net debt, cash cost, sustaining and all-in sustaining cash cost per pound of copper produced, cash cost and sustaining cash cost per pound of zinc produced and combined unit cost and zinc plant unit cost are non-IFRS performance measures. These measures do not have a meaning prescribed by IFRS and are therefore unlikely to be comparable to similar measures presented by other issuers. These measures should not be considered in isolation or as a substitute for measures prepared in accordance with IFRS and are not necessarily indicative of operating profit or cash flow from operations as determined under IFRS. Other companies may calculate these measures differently.
Management believes adjusted net earnings (loss) and adjusted net earnings (loss) per share better reflect the Company's performance for the current period and are better indications of its expected performance in future periods. These measures are used internally by the Company to evaluate the performance of its underlying operations and to assist with its planning and forecasting of future operating results. As such, the Company believes these measures are useful to investors in assessing the Company's underlying performance. We provide adjusted EBITDA to help users analyze our results and to provide additional information about our ongoing cash generating potential in order to assess our capacity to service and repay debt, carry out investments and cover working capital needs. Net debt is shown because it is a performance measure used by the Company to assess our financial position. Cash cost, sustaining and all-in sustaining cash cost per pound of copper produced are shown because we believe they help investors and management assess the performance of our operations, including the margin generated by the operations and the Company. Cash cost and sustaining cash cost per pound of zinc produced are shown because we believe they help investors and management assess the performance of our Manitoba operations. Combined unit cost and zinc plant unit cost is shown because we believe they help investors and management assess our cost structure and margins that are not impacted by variability in by-product commodity prices.
In the first half of 2020, a government-imposed shutdown of non-essential businesses led to a temporary suspension of our Constancia mining operations. Similarly, in the fourth quarter, a shaft incident led to a production interruption at 777 in Manitoba. Fixed overhead production costs incurred during these temporary production disruptions were directly charged to cost of sales. These costs did not contribute to production of inventory and were therefore excluded from the calculations of adjusted net earnings (loss), adjusted EBITDA and cash costs.
Adjusted Net Earnings (Loss)
Adjusted net earnings (loss) represents net earnings (loss) excluding certain impacts, net of taxes, such as mark-to-market adjustments, impairment charges and reversal of impairment charges, write-down of assets, and foreign exchange (gain) loss. These measures are not necessarily indicative of net earnings (loss) or cash flows as determined under IFRS.
The following table provides a reconciliation of earnings (loss) per the consolidated income statements, to adjusted net earnings (loss) for the three months and year ended December 31, 2020 and 2019.
| Three months ended | | Year ended |
(in $ millions) | Dec. 31, 2020 | | Dec. 31, 2019 | | | Dec. 31, 2020 | | | Dec. 31, 2019 | |
Profit (loss) for the period | 7.4 | | (1.5) | | | (144.6) | | | (343.8) | |
Tax recovery | (6.5) | | (40.9) | | | (34.5) | | | (109.0) | |
Profit (loss) before tax | 0.9 | | (42.4) | | | (179.1) | | | (452.8) | |
Adjusting items: | | | | | | |
Mark-to-market adjustments1 | (28.0) | | 10.2 | | | (14.4) | | | 11.0 | |
Rosemont impairment | - | | - | | | - | | | 322.2 | |
Peru inventory write-down (reversal) | (2.2) | | - | | | - | | | - | |
Peru cost of sales direct charge from temporary shutdown | - | | - | | | 31.9 | | | - | |
Manitoba cost of sales direct charge from temporary shutdown | 11.7 | | - | | | 11.7 | | | - | |
Write down of UCM receivable | - | | - | | | - | | | 26.0 | |
Costs associated with proxy contest | - | | - | | | - | | | 3.0 | |
Variable consideration adjustment - stream revenue | - | | - | | | (10.4) | | | 22.3 | |
Pampacancha delivery obligation | - | | - | | | - | | | 7.5 | |
Foreign exchange loss (gain) | 2.6 | | (0.3) | | | (1.6) | | | 1.4 | |
Write-down of unamortized transaction costs | - | | - | | | 3.8 | | | - | |
Premium paid on redemption of notes | - | | - | | | 7.3 | | | - | |
Adjusted loss before income taxes | (15.0) | | (32.5) | | | (150.8) | | | (59.4) | |
Tax expense (recovery) | 6.5 | | 40.9 | | | 34.5 | | | 109.0 | |
Tax impact of adjusting items | 3.6 | | (2.6) | | | (11.1) | | | (88.8) | |
Dividend withholding tax | - | | - | | | - | | | 6.9 | |
Non-cash deferred tax adjustments | (11.5) | | (30.4) | | | 6.4 | | | (16.3) | |
| | | | | | |
Adjusted net loss | (16.4) | | (24.6) | | | (121.0) | | | (48.6) | |
Adjusted net loss ($/share) | (0.06) | | (0.09) | | | (0.46) | | | (0.18) | |
Basic weighted average number of common shares outstanding (millions) | 261.3 | | 261.3 | | | 261.3 | | | 261.3 | |
1 Includes changes in fair value of the embedded derivative on 2025 senior unsecured notes, gold prepayment liability, Canadian junior mining investments, other financial assets and liabilities at fair value through profit or loss and share-based compensation expenses. |
After adjusting reported net loss for those items not considered representative of the Company's core business or indicative of future operations, the Company had an adjusted net loss in the fourth quarter 2020 of $16.4 million or $0.06 loss per share.
Adjusted EBITDA
Adjusted EBITDA is profit or loss before net finance expense/income, tax expense/recoveries, depreciation and amortization of property, plant and equipment and deferred revenue, as well as certain other adjustments. We calculate adjusted EBITDA by excluding certain adjustments included within our adjusted net earnings measure which we believe reflects the underlying performance of our core operating activities. The measure also removes the impact of non-cash items and financing costs that are not associated with measuring the underlying performance of our operations. However, our adjusted EBITDA is not the measure defined as EBITDA under our senior notes or revolving credit facilities and may not be comparable with performance measures with the same name reported by other companies. Adjusted EBITDA should not be considered as a substitute for profit or loss or as a better measure of liquidity than operating cash flow, which are calculated in accordance with IFRS. We provide adjusted EBITDA to help users analyze our results and to provide additional information about our ongoing cash generating potential in order to assess our capacity to service and repay debt, carry out investments and cover working capital needs.
The following table presents the reconciliation of earnings (loss) per the consolidated income statements, to adjusted EBITDA for the three months and year ended December 31, 2020 and 2019:
| Three months ended | | Year ended |
(in $ millions) | Dec. 31, 2020 | | | Dec. 31, 2019 | | | Dec. 31, 2020 | | | Dec. 31, 2019 | | |
Profit (loss) for the period | 7.4 | | | (1.5) | | | (144.6) | | | (343.8) | | |
| | | | | | | | |
Add back: tax recovery | (6.5) | | | (40.9) | | | (34.5) | | | (109.0) | | |
Add back: Net finance expense | 6.3 | | | 48.6 | | | 141.9 | | | 164.0 | | |
Add back: Other expenses | 6.0 | | | 3.9 | | | 17.6 | | | 51.1 | | |
Add back: Depreciation and amortization1 | 98.6 | | | 93.9 | | | 361.8 | | | 344.5 | | |
Less: Amortization of deferred revenue and variable consideration adjustment | (20.1) | | | (23.9) | | | (74.0) | | | (76.1) | | |
| 91.7 | | | 80.1 | | | 268.2 | | | 30.7 | | |
Adjusting items (pre-tax): | | | | | | |
Peru inventory write-down (reversal) | (2.2) | | | - | | | - | | | - | | |
Cash portion of Peru cost of sales direct charge from temporary shutdown | - | | | - | | | 15.8 | | | - | | |
Cash portion of Manitoba cost of sales direct charge from temporary shutdown | 8.2 | | | - | | | 8.2 | | | - | | |
Costs associated with proxy contest | - | | | - | | | - | | | 3.0 | | |
Share-based compensation expenses (recoveries)2 | 9.2 | | | 2.1 | | | 14.5 | | | 2.6 | | |
Rosemont impairment | - | | | - | | | - | | | 322.2 | | |
Adjusted EBITDA | 106.9 | | | 82.2 | | | 306.7 | | | 358.5 | | |
1 Includes the non-cash portion of the Peru cost of sales direct charge from the temporary shutdown of $16.1 million and the non-cash portion of the Manitoba cost of sales direct charge from the temporary shutdown of $3.5 million for the year ended December 31, 2020. |
2 Share-based compensation expenses (recoveries) reflected in cost of sales and selling and administrative expenses. | |
Net Debt
The following table presents our calculation of net debt as at December 31, 2020 and December 31, 2019:
|
(in $ thousands) | Dec. 31, 2020 | | | Dec. 31,
2019 | |
Total long-term debt as per IFRS financial statements | | 1,135,675 | | | 985,255 | |
Cash and cash equivalents as per IFRS financial statements | | (439,135) | | | (396,146) | |
Net debt | | 696,540 | | | 589,109 | |
Cash Cost, Sustaining and All-in Sustaining Cash Cost (Copper Basis)
Cash cost per pound of copper produced ("cash cost") is a non-IFRS measure that management uses as a key performance indicator to assess the performance of our operations. Our calculation designates copper as our primary metal of production as it has been the largest component of revenues. The calculation is presented in four manners:
- Cash cost, before by-product credits - This measure is gross of by-product revenues and is a function of the efforts and costs incurred to mine and process all ore mined. However, the measure divides this aggregate cost over only pounds of copper produced, our primary metal of production. This measure is generally less volatile from period to period, as it is not affected by changes in the price received for by-product metals. It is, however, significantly affected by the relative mix of copper concentrate and finished zinc production, where the sale of the zinc will occur later, and an increase in production of zinc metal will tend to result in an increase in cash cost under this measure.
- Cash cost, net of by-product credits - In order to calculate the net cost to produce and sell copper, the net of by-product credits measure subtracts the revenues realized from the sale of the metals other than copper. The by-product revenues from zinc, gold, and silver are significant and are integral to the economics of our operations. The economics that support our decision to produce and sell copper would be different if we did not receive revenues from the other significant metals being extracted and processed. This measure provides management and investors with an indication of the minimum copper price consistent with positive operating margins, assuming realized by-product metal prices are consistent with those prevailing during the reporting period. It also serves as an important operating statistic that management and investors utilize to measure our operating performance versus that of our competitors. However, it is important to understand that if by-product metal prices decline alongside copper prices, the cash cost net of by-product credits would increase, requiring a higher copper price than that reported to maintain positive cash flows and operating margins.
- Sustaining cash cost, net of by-product credits - This measure is an extension of cash cost that includes cash sustaining capital expenditures, including payments on capitalized leases, capitalized sustaining exploration, net smelter returns royalties, payments on certain long-term community agreements, as well as accretion and amortization for expected decommissioning activities for producing assets. It does not include corporate selling and administrative expenses. It provides a more fulsome measurement of the cost of sustaining production than cash cost, which is focused on operating costs only.
- All-in sustaining cash cost, net of by-product credits - This measure is an extension of sustaining cash cost that includes corporate G&A, regional costs, accretion and amortization for community agreements relating to current operations, and accretion for expected decommissioning activities for non-producing assets. Due to the inclusion of corporate selling and administrative expenses, all-in sustaining cash cost is presented on a consolidated basis only.
Effective September 30, 2020 and for all comparably disclosed periods, we have included the period's deferred revenue amortization as a by-product credit to reflect the net cost of producing and selling the period's precious metals under our streaming arrangements as we believe doing so allows management and our investors to better evaluate the operating performance of the underlying operations. The variable consideration adjustment required under IFRS 15 related to prior periods is not included as a by-product credit in the current period and hence is disclosed as an adjustment in the non-IFRS cash cost measure reconciliation.
The tables below present a detailed build-up of cash cost and sustaining cash cost, net of by-product credits, by business unit in addition to consolidated all-in sustaining cash cost, net of by-product credits, and reconciliations between cash cost, net of by-product credits, to the most comparable IFRS measures of cost of sales for the three months and year ended December 31, 2020 and 2019. Cash cost, net of by-product credits may not calculate exactly based on amounts presented in the tables below due to rounding.
Consolidated | | Three months ended | | Year ended |
Net pounds of copper produced | | | | |
(in thousands) | | Dec. 31, 2020 | | Dec. 31, 2019 | | Dec. 31, 2020 | | Dec. 31, 2019 |
Peru | | 47,519 | | 58,773 | | 161,269 | | 250,940 |
Manitoba | | 12,619 | | 12,705 | | 48,905 | | 51,487 |
Net pounds of copper produced | | 60,138 | | 71,478 | | 210,174 | | 302,427 |
Consolidated | | Three months ended | | Year ended |
| | Dec. 31, 2020 | | Dec. 31, 2019 | | Dec. 31, 2020 | | Dec. 31, 2019 |
Cash cost per pound of copper produced | | $000s | | $/lb | | $000s | | $/lb | | $000s | | $/lb | | $000s | | $/lb |
Cash cost, before by-product credits | | 196,533 | | 3.27 | | 209,597 | | 2.94 | | 709,757 | | 3.38 | | 816,115 | | 2.70 |
By-product credits | | (170,646) | | (2.84) | | (145,726) | | (2.04) | | (582,882) | | (2.77) | | (563,784) | | (1.86) |
Cash cost, net of by-product credits | | 25,887 | | 0.43 | | 63,871 | | 0.90 | | 126,875 | | 0.60 | | 252,331 | | 0.83 |
Consolidated | | Three months ended | | Year ended |
| | Dec. 31, 2020 | | Dec. 31, 2019 | | Dec. 31, 2020 | | Dec. 31, 2019 |
Supplementary cash cost information | | $000s | | $/lb 1 | | $000s | | $/lb 1 | | $000s | | $/lb 1 | | $000s | | $/lb 1 |
By-product credits2: | | | | | | | | | | | | | | | | |
Zinc | | 77,593 | | 1.29 | | 71,732 | | 1.00 | | 265,105 | | 1.26 | | 284,766 | | 0.94 |
Gold 3 | | 61,010 | | 1.01 | | 45,214 | | 0.63 | | 219,245 | | 1.04 | | 156,899 | | 0.52 |
Silver 3 | | 20,624 | | 0.34 | | 24,723 | | 0.35 | | 67,342 | | 0.32 | | 88,525 | | 0.29 |
Molybdenum & other | | 11,419 | | 0.19 | | 4,057 | | 0.06 | | 31,190 | | 0.15 | | 33,594 | | 0.11 |
Total by-product credits | | 170,646 | | 2.84 | | 145,726 | | 2.04 | | 582,882 | | 2.77 | | 563,784 | | 1.86 |
Reconciliation to IFRS: | | | | | | | | | | | | | | | | |
Cash cost, net of by-product credits | | 25,887 | | | | 63,871 | | | | 126,875 | | | | 252,331 | | |
By-product credits | | 170,646 | | | | 145,726 | | | | 582,882 | | | | 563,784 | | |
Treatment and refining charges | | (14,723) | | | | (21,176) | | | | (56,888) | | | | (83,481) | | |
Share-based compensation expense | | 919 | | | | 208 | | | | 1,400 | | | | 400 | | |
Inventory adjustments | | 82 | | | | 1,668 | | | | | 2,302 | | | | 2,272 | | |
Change in product inventory | | (4,521) | | | | 10,677 | | | | (1,829) | | | | (7,726) | | |
Royalties | | 2,818 | | | | 3,933 | | | | 12,807 | | | | 13,762 | | |
Overhead costs related to suspension of activities (cash) - Peru | | - | | | | - | | | | | 15,810 | | | | - | | | |
Overhead costs related to suspension of activities (cash) - Manitoba | | 8,232 | | | | - | | | | | 8,232 | | | | - | | | |
Depreciation and amortization4 | | 98,583 | | | | 93,945 | | | | 361,827 | | | | 344,555 | | |
Cost of sales5 | | 287,923 | | | | 298,852 | | | | 1,053,418 | | | | 1,085,897 | | |
1 Per pound of copper produced. |
2 By-product credits are computed as revenue per financial statements, amortization of deferred revenue and pricing and volume adjustments. For more information please see the realized price reconciliation table on page 34 for these figures. |
3 Gold and silver by-product credits do not include variable consideration adjustments with respect to stream arrangements. Variable consideration adjustments are cumulative adjustments to gold and silver stream deferred revenue primarily associated with the net change in mineral reserves and resources or amendments to the mine plan that would change the total expected deliverable ounces under the precious metal streaming arrangement. For the three months and year ended December 31, 2020 the variable consideration adjustments amounted to revenue of $nil and $6,668, respectively. For the three months and year ended December 31, 2019 - $nil and an expense of $16,295, respectively. |
4 Depreciation is based on concentrate sold. |
5 As per IFRS financial statements. |
Peru | | Three months ended | | Year ended |
(in thousands) | | Dec. 31, 2020 | | Dec. 31, 2019 | | Dec. 31, 2020 | | Dec. 31, 2019 |
Net pounds of copper produced1 | | 47,519 | | 58,773 | | 161,269 | | 250,940 |
1 Contained copper in concentrate. |
Peru | | Three months ended | | Year ended |
| | Dec. 31, 2020 | | Dec. 31, 2019 | | Dec. 31, 2020 | | Dec. 31, 2019 |
Cash cost per pound of copper produced | | $000s | | $/lb | | $000s | | $/lb | | $000s | | $/lb | | $000s | | $/lb |
Mining | | 24,967 | | 0.53 | | 18,533 | | 0.32 | | 70,724 | | 0.44 | | 82,417 | | 0.33 |
Milling | | 39,219 | | 0.83 | | 43,860 | | 0.75 | | 134,096 | | 0.83 | | 159,913 | | 0.64 |
G&A | | 14,327 | | 0.30 | | 15,147 | | 0.26 | | 43,105 | | 0.27 | | 56,847 | | 0.23 |
Onsite costs | | 78,513 | | 1.66 | | 77,540 | | 1.32 | | 247,925 | | 1.54 | | 299,177 | | 1.19 |
Treatment & refining | | 10,082 | | 0.21 | | 15,361 | | 0.26 | | 36,655 | | 0.23 | | 59,809 | | 0.24 |
Freight & other | | 9,989 | | 0.21 | | 15,121 | | 0.26 | | 34,794 | | 0.21 | | 53,016 | | 0.21 |
Cash cost, before by-product credits | | 98,584 | | 2.08 | | 108,022 | | 1.84 | | 319,374 | | 1.98 | | 412,002 | | 1.64 |
By-product credits | | (28,802) | | (0.61) | | (28,149) | | (0.48) | | (85,067) | | (0.53) | | (121,565) | | (0.48) |
Cash cost, net of by-product credits | | 69,782 | | 1.47 | | 79,873 | | 1.36 | | 234,307 | | 1.45 | | 290,437 | | 1.16 |
Peru | | Three months ended | | Year ended |
| | Dec. 31, 2020 | | Dec. 31, 2019 | | Dec. 31, 2020 | | Dec. 31, 2019 |
Supplementary cash cost information | | $000s | | $/lb 1 | | $000s | | $/lb 1 | | $000s | | $/lb 1 | | $000s | | $/lb 1 |
By-product credits2: | | | | | | | | | | | | | | | | |
Gold3 | | 5,394 | | 0.11 | | 5,782 | | 0.10 | | 17,626 | | 0.11 | | 24,637 | | 0.10 |
Silver3 | | 13,584 | | 0.29 | | 19,576 | | 0.33 | | 41,870 | | 0.26 | | 68,093 | | 0.27 |
Molybdenum | | 9,824 | | 0.21 | | | 2,791 | | | 0.05 | | 25,571 | | 0.16 | | 28,835 | | 0.11 |
Total by-product credits | | 28,802 | | 0.61 | | 28,149 | | 0.48 | | 85,067 | | 0.53 | | 121,565 | | 0.47 |
Reconciliation to IFRS: | | | | | | | | | | | | | | | | |
Cash cost, net of by-product credits | | 69,782 | | | | 79,873 | | | | 234,307 | | | | 290,437 | | |
By-product credits | | 28,802 | | | | 28,149 | | | | 85,067 | | | | 121,565 | | |
Treatment and refining charges | | (10,082) | | | | (15,361) | | | | (36,655) | | | | (59,809) | | |
Inventory adjustments | | (2,188) | | | | (100) | | | | | 32 | | | | | 504 | | |
Share-based compensation expenses | | 213 | | | | 27 | | | | 288 | | | | 75 | | |
Change in product inventory | | (6,550) | | | | 7,410 | | | | (3,883) | | | | (3,313) | | |
Royalties | | 1,399 | | | | 2,152 | | | | 5,121 | | | | 6,724 | | |
Overhead costs related to suspension of activities (cash) | | - | | | | - | | | | | 15,810 | | | | - | | | |
Depreciation and amortization4 | | 50,861 | | | | 56,938 | | | | 184,275 | | | | 209,126 | | |
Cost of sales5 | | 132,237 | | | | 159,088 | | | | 484,362 | | | | 565,309 | | |
1 Per pound of copper produced. |
2 By-product credits are computed as revenue per financial statements, amortization of deferred revenue and pricing and volume adjustments. For more information, please see the realized price reconciliation table on page 34. |
3 Gold and silver by-product credits do not include variable consideration adjustments with respect to stream arrangements. |
4 Depreciation is based on concentrate sold. |
5 As per IFRS financial statements. |
| | | | | | | | | | | | | | | | | | | | | |
Manitoba | | Three months ended | | Year ended |
(in thousands) | | Dec. 31, 2020 | | Dec. 31, 2019 | | Dec. 31, 2020 | | Dec. 31, 2019 |
Net pounds of copper produced1 | | 12,619 | | 12,705 | | 48,905 | | 51,487 |
1 Contained copper in concentrate. |
Manitoba | | Three months ended | | Year ended |
| | Dec. 31, 2020 | | Dec. 31, 2019 | | Dec. 31, 2020 | | Dec. 31, 2019 |
Cash cost per pound of copper produced | | $000s | | $/lb | | $000s | | $/lb | | $000s | | $/lb | | $000s | | $/lb |
Mining | | 46,598 | | 3.69 | | 46,335 | | 3.65 | | 178,308 | | 3.65 | | 186,972 | | 3.63 |
Milling | | 11,147 | | 0.88 | | 13,396 | | 1.05 | | 46,057 | | 0.94 | | 49,269 | | 0.96 |
Refining (zinc) | | 18,736 | | 1.48 | | 19,464 | | 1.53 | | 71,799 | | 1.47 | | 72,259 | | 1.40 |
G&A | | 9,898 | | 0.78 | | 9,551 | | 0.75 | | 46,930 | | 0.96 | | 45,026 | | 0.87 |
Onsite costs | | 86,379 | | 6.85 | | 88,746 | | 6.99 | | 343,094 | | 7.02 | | 353,526 | | 6.87 |
Treatment & refining | | 4,641 | | 0.37 | | 5,815 | | 0.46 | | 20,233 | | 0.41 | | 23,672 | | 0.46 |
Freight & other | | 6,929 | | 0.55 | | 7,014 | | 0.55 | | 27,056 | | 0.55 | | 26,915 | | 0.52 |
Cash cost, before by-product credits | | 97,949 | | 7.76 | | 101,575 | | 7.99 | | 390,383 | | 7.98 | | 404,113 | | 7.85 |
By-product credits | | (141,844) | | (11.24) | | (117,577) | | (9.24) | | (497,815) | | (10.18) | | (442,219) | | (8.59) |
Cash cost, net of by-product credits | | (43,895) | | (3.48) | | (16,002) | | (1.26) | | (107,432) | | (2.20) | | (38,106) | | (0.75) |
Manitoba | | Three months ended | | Year ended |
| | Dec. 31, 2020 | | Dec. 31, 2019 | | Dec. 31, 2020 | | Dec. 31, 2019 |
Supplementary cash cost information | | $000s | | $/lb 1 | | $000s | | $/lb 1 | | $000s | | $/lb 1 | | $000s | | $/lb 1 |
By-product credits2: | | | | | | | | | | | | | | | | |
Zinc | | 77,593 | | 6.15 | | 71,732 | | 5.65 | | 265,105 | | 5.42 | | 284,766 | | 5.53 |
Gold3 | | 55,616 | | 4.41 | | 39,432 | | 3.10 | | 201,619 | | 4.12 | | 132,262 | | 2.57 |
Silver3 | | 7,040 | | 0.56 | | 5,147 | | 0.41 | | 25,472 | | | 0.52 | | | 20,432 | | 0.40 |
Other | | 1,595 | | 0.13 | | 1,266 | | 0.10 | | 5,619 | | 0.11 | | 4,759 | | 0.09 |
Total by-product credits | | 141,844 | | 11.24 | | 117,577 | | 9.24 | | 497,815 | | 10.18 | | 442,219 | | 8.59 |
Reconciliation to IFRS: | | | | | | | | | | | | | | | | |
Cash cost, net of by-product credits | | (43,895) | | | | (16,002) | | | | (107,432) | | | | (38,106) | | |
By-product credits | | 141,844 | | | | 117,577 | | | | 497,815 | | | | 442,219 | | |
Treatment and refining charges | | (4,641) | | | | (5,815) | | | | (20,233) | | | | (23,672) | | |
Inventory adjustments | | 2,270 | | | | | 1,768 | | | | | 2,270 | | | | | 1,768 | | | |
Share-based compensation expenses | | 706 | | | | 181 | | | | 1,112 | | | | 325 | | |
Change in product inventory | | 2,029 | | | | 3,267 | | | | 2,054 | | | | (4,413) | | |
Royalties | | 1,419 | | | | 1,781 | | | | 7,686 | | | | 7,038 | | |
Overhead costs related to suspension of activities (cash) | | 8,232 | | | | - | | | | 8,232 | | | | - | | |
Depreciation and amortization4 | | 47,722 | | | | 37,007 | | | | 177,552 | | | | 135,429 | | |
Cost of sales5 | | 155,686 | | | | 139,764 | | | | | 569,056 | | | | 520,588 | | | |
1 Per pound of copper produced. | | |
2 By-product credits are computed as revenue per financial statements, amortization of deferred revenue and pricing and volume adjustments. For more information please see the realized price reconciliation table on page 34. |
3 Gold and silver by-product credits do not include variable consideration adjustments with respect to stream arrangements. |
4 Depreciation is based on concentrate sold. | | |
5 As per IFRS financial statements. |
| | | | | | | | | | | | | | | | | | | | | | |
Consolidated | | Three months ended | | Year ended |
| | Dec. 31, 2020 | | Dec. 31, 2019 | | Dec. 31, 2020 | | Dec. 31, 2019 |
All-in sustaining cash cost per pound of copper produced | | $000s | | $/lb | | $000s | | $/lb | | $000s | | $/lb | | $000s | | $/lb |
Cash cost, net of by-product credits | | 25,887 | | 0.43 | | | 63,871 | | 0.90 | | | 126,875 | | 0.60 | | | 252,331 | | 0.83 | |
Cash sustaining capital expenditures | | 81,523 | | 1.36 | | | 74,361 | | 1.04 | | | 257,558 | | 1.23 | | | 241,461 | | 0.80 | |
Capitalized exploration1 | | 8,040 | | | 0.13 | | | 8,807 | | | 0.12 | | | 8,040 | | | 0.04 | | | 12,391 | | | 0.04 | |
Royalties | | 2,818 | | 0.05 | | | 3,933 | | 0.06 | | | 12,807 | | 0.06 | | | 13,762 | | 0.05 | |
Sustaining cash cost, net of by-product credits | | 118,268 | | 1.97 | | | 150,972 | | 2.11 | | | 405,280 | | 1.93 | | | 519,945 | | 1.72 | |
Corporate selling and administrative expenses & regional costs | | 15,709 | | 0.26 | | | 6,702 | | 0.09 | | | 45,010 | | 0.21 | | | 39,950 | | 0.13 | |
Accretion and amortization of decommissioning and community agreements2 | | 1,006 | | 0.02 | | | 677 | | 0.01 | | | 4,115 | | 0.02 | | | 2,521 | | 0.01 | |
All-in sustaining cash cost, net of by-product credits | | 134,983 | | 2.24 | | | 158,351 | | 2.22 | | | 454,405 | | 2.16 | | | 562,416 | | 1.86 | |
1 Only includes exploration costs incurred for locations near existing mines. |
2 Includes accretion of decommissioning relating to non-productive sites, and accretion and amortization of current community agreements. |
Peru | | Three months ended | | Year ended |
| | Dec. 31, 2020 | | Dec. 31, 2019 | | Dec. 31, 2020 | | Dec. 31, 2019 |
Sustaining cash cost per pound of copper produced | | $000s | | $/lb | | $000s | | $/lb | | $000s | | $/lb | | $000s | | $/lb |
Cash cost, net of by-product credits | | 69,782 | | 1.47 | | | 79,873 | | 1.36 | | | 234,307 | | 1.45 | | | 290,437 | | 1.16 | |
Cash sustaining capital expenditures | | 43,542 | | 0.92 | | | 37,676 | | 0.64 | | | 107,994 | | 0.67 | | | 108,420 | | 0.43 | |
Capitalized exploration | | 8,040 | | 0.17 | | | 8,000 | | | 0.14 | | | 8,040 | | 0.05 | | | 8,000 | | | 0.03 | |
Royalties | | 1,399 | | 0.03 | | | 2,152 | | 0.04 | | | 5,121 | | 0.03 | | | 6,724 | | 0.03 | |
Sustaining cash cost per pound of copper produced | | 122,763 | | 2.58 | | | 127,701 | | 2.17 | | | 355,462 | | 2.20 | | | 413,581 | | 1.65 | |
Manitoba | | Three months ended | | Year ended |
| | Dec. 31, 2020 | | Dec. 31, 2019 | | Dec. 31, 2020 | | Dec. 31, 2019 |
Sustaining cash cost per pound of copper produced | | $000s | | $/lb | | $000s | | $/lb | | $000s | | $/lb | | $000s | | $/lb |
Cash cost, net of by-product credits | | (43,895) | | | (3.48) | | | (16,002) | | | (1.26) | | | (107,432) | | | (2.20) | | | (38,106) | | | (0.75) | |
Cash sustaining capital expenditures | | 37,981 | | | 3.01 | | | 36,686 | | | 2.89 | | | 149,564 | | | 3.06 | | | 133,041 | | | 2.58 | |
Capitalized exploration | | - | | | - | | | 807 | | | 0.06 | | | - | | | - | | | 4,391 | | | 0.09 | |
Royalties | | 1,419 | | | 0.11 | | | 1,781 | | | 0.14 | | | 7,686 | | | 0.16 | | | 7,038 | | | 0.14 | |
Sustaining cash cost per pound of copper produced | | (4,495) | | | (0.36) | | | 23,272 | | | 1.83 | | | 49,818 | | | 1.02 | | | 106,364 | | | 2.07 | |
Zinc Cash Cost and Zinc Sustaining Cash Cost
Cash cost per pound of zinc produced ("zinc cash cost") is a non-IFRS measure that management uses as a key performance indicator to assess the performance of our Manitoba operations. This alternative cash cost calculation designates zinc as the primary metal of production as it is the largest component of revenues for our Manitoba business unit and should therefore be less volatile over time than Manitoba cash cost per pound of copper. The calculation is presented in three manners:
- Zinc cash cost, before by-product credits - This measure is gross of by-product revenues and is a function of the efforts and costs incurred to mine and process all ore mined. However, the measure divides this aggregate cost over only pounds of zinc produced, our primary metal of production. This measure is generally less volatile from period to period, as it is not affected by changes in the price received for by-product metals. It is, however, significantly affected by the relative mix of copper concentrate and finished zinc production, where the sale of the copper will occur later, and an increase in production of copper metal will tend to result in an increase in zinc cash cost under this measure.
- Zinc cash cost, net of by-product credits - In order to calculate the net cost to produce and sell zinc, the net of by-product credits measure subtracts the revenues realized from the sale of the metals other than zinc. The by-product revenues from copper, gold, and silver are significant and are integral to the economics of our Manitoba operation. The economics that support our decision to produce and sell zinc would be different if we did not receive revenues from the other significant metals being extracted and processed. This measure provides management and investors with an indication of the minimum zinc price consistent with positive operating margins, assuming realized by-product metal prices are consistent with those prevailing during the reporting period. It also serves as an important operating statistic that management and investors utilize to measure our operating performance at our Manitoba operation versus that of our competitors. However, it is important to understand that if by-product metal prices decline alongside zinc prices, the zinc cash cost net of by-product credits would increase, requiring a higher zinc price than that reported to maintain positive cash flows and operating margins.
- Zinc sustaining cash cost, net of by-product credits - This measure is an extension of zinc cash cost that includes cash sustaining capital expenditures, capitalized exploration, net smelter returns royalties, as well as accretion and amortization for expected decommissioning activities for producing assets. It does not include corporate selling and administrative expenses. It provides a more fulsome measurement of the cost of sustaining production than zinc cash cost, which is focused on operating costs only.
Effective September 30, 2020 and for all comparably disclosed periods, we have included the period's deferred revenue amortization as a by-product credit to reflect the net cost of producing and selling the period's precious metals under our streaming arrangements as we believe doing so allows management and our investors to better evaluate the operating performance of the underlying operations. The variable consideration adjustment required under IFRS 15 related to prior periods is not included as a by-product credit in the current period and hence is disclosed as an adjustment in the non-IFRS cash cost measure reconciliation.
The tables below present a detailed build-up of zinc cash cost and zinc sustaining cash cost, net of by-product credits, for the Manitoba business unit, and reconciliations between zinc cash cost, net of by-product credits, to the most comparable IFRS measures of cost of sales for the three months and year ended December 31, 2020 and 2019. Zinc cash cost, net of by-product credits, may not calculate exactly based on amounts presented in the tables below due to rounding.
Manitoba | | Three months ended | | Year ended |
(in thousands) | | Dec. 31, 2020 | | Dec. 31, 2019 | | Dec. 31, 2020 | | Dec. 31, 2019 |
Net pounds of zinc produced1 | | 56,974 | | 67,444 | | 260,432 | | 262,585 |
1 Contained zinc in concentrate. | | | | | | | | |
Manitoba | | Three months ended | | Year ended |
| | Dec. 31, 2020 | | Dec. 31, 2019 | | Dec. 31, 2020 | | Dec. 31, 2019 |
Cash cost per pound of zinc produced | | $000s | | $/lb | | $000s | | $/lb | | $000s | | $/lb | | $000s | | $/lb |
Cash cost, before by-product credits1 | | 97,949 | | 1.72 | | 101,575 | | 1.51 | | 390,383 | | 1.50 | | 404,113 | | 1.54 |
By-product credits | | (98,915) | | | (1.74) | | | (78,830) | | | (1.17) | | | (363,312) | | | (1.40) | | | (294,091) | | | (1.12) | |
Zinc cash cost, net of by-product credits | | (966) | | | (0.02) | | 22,745 | | 0.34 | | 27,071 | | 0.10 | | 110,022 | | 0.42 |
1 For additional detail on cash cost, before by-product credits please see page 62 of this MD&A. |
Manitoba | | Three months ended | | Year ended |
| | Dec. 31, 2020 | | Dec. 31, 2019 | | Dec. 31, 2020 | | Dec. 31, 2019 |
Supplementary cash cost information | | $000s | | $/lb 1 | | $000s | | $/lb 1 | | $000s | | $/lb 1 | | $000s | | $/lb 1 |
By-product credits2: | | | | | | | | | | | | | | | | |
Copper | | 34,664 | | | 0.61 | | | 32,985 | | | 0.49 | | | 130,602 | | | 0.50 | | | 136,638 | | | 0.52 | |
Gold3 | | 55,616 | | | 0.98 | | | 39,432 | | | 0.58 | | | 201,619 | | | 0.77 | | | 132,262 | | | 0.50 | |
Silver3 | | 7,040 | | | 0.12 | | | 5,147 | | | 0.08 | | | 25,472 | | | 0.11 | | | 20,432 | | | 0.08 | |
Other | | 1,595 | | | 0.03 | | | 1,266 | | | 0.02 | | | 5,619 | | | 0.02 | | | 4,759 | | | 0.02 | |
Total by-product credits | | 98,915 | | | 1.74 | | | 78,830 | | | 1.17 | | | 363,312 | | | 1.40 | | | 294,091 | | | 1.12 | |
Reconciliation to IFRS: | | | | | | | | | | | | | | | | |
Cash cost, net of by-product credits | | (966) | | | | | 22,745 | | | | | 27,071 | | | | | 110,022 | | | |
By-product credits | | 98,915 | | | | | 78,830 | | | | | 363,312 | | | | | 294,091 | | | |
Treatment and refining charges | | (4,641) | | | | | (5,815) | | | | | (20,233) | | | | | (23,672) | | | |
Share-based compensation expenses | | 706 | | | | | 181 | | | | | 1,112 | | | | | 325 | | | |
Inventory adjustments | | 2,270 | | | | | 1,768 | | | | | 2,270 | | | | | 1,768 | | | |
Change in product inventory | | 2,029 | | | | | 3,267 | | | | | 2,054 | | | | | (4,413) | | | |
Royalties | | 1,419 | | | | | 1,781 | | | | | 7,686 | | | | | 7,038 | | | |
Overhead costs related to suspension of activities (cash) | | 8,232 | | | | | - | | | | | 8,232 | | | | | - | | | |
Depreciation and amortization4 | | 47,722 | | | | | 37,007 | | | | | 177,552 | | | | | 135,429 | | | |
Cost of sales5 | | 155,686 | | | | | 139,764 | | | | | 569,056 | | | | | 520,588 | | | |
1 Per pound of zinc produced. |
2 By-product credits are computed as revenue per financial statements, amortization of deferred revenue and pricing and volume adjustments. For more information please see the realized price reconciliation table on page 34. |
3 Gold and silver by-product credits do not include variable consideration adjustments with respect to stream arrangements. |
4 Depreciation is based on concentrate sold. |
5 As per IFRS financial statements. |
Manitoba | | Three months ended | | Year ended |
| | Dec. 31, 2020 | | Dec. 31, 2019 | | Dec. 31, 2020 | | Dec. 31, 2019 |
Sustaining cash cost per pound of zinc produced | | $000s | | $/lb | | $000s | | $/lb | | $000s | | $/lb | | $000s | | $/lb |
Zinc cash cost, net of by-product credits | | (966) | | (0.02) | | | 22,745 | | 0.34 | | | 27,071 | | 0.10 | | | 110,022 | | 0.42 | |
Cash sustaining capital expenditures | | 37,981 | | 0.67 | | | 36,686 | | 0.54 | | | 149,564 | | 0.57 | | | 133,041 | | 0.51 | |
Capitalized exploration | | - | | - | | | 807 | | | 0.01 | | | - | | - | | | 4,391 | | | 0.02 | |
Royalties | | 1,419 | | 0.02 | | | 1,781 | | 0.03 | | | 7,686 | | 0.03 | | | 7,038 | | 0.03 | |
Sustaining cash cost per pound of zinc produced | | 38,434 | | 0.67 | | | 62,019 | | 0.92 | | | 184,321 | | 0.71 | | | 254,492 | | 0.97 | |
Combined Unit Cost & Zinc Plant Unit Cost Reconciliation
Combined unit cost ("unit cost") and zinc plant unit cost is a non-IFRS measure that management uses as a key performance indicator to assess the performance of our mining and milling operations. Combined unit cost and zinc plant unit cost are calculated by dividing the cost of sales by mill throughput and refined zinc metal produced, respectively. This measure is utilized by management and investors to assess our cost structure and margins and compare it to similar information provided by other companies in our industry. Unlike cash cost, this measure is not impacted by variability in by-product commodity prices since there are no by-product deductions; costs associated with profit-sharing and similar costs are excluded because of their correlation to external metal prices. In addition, the unit costs are reported in the functional currency of the operation which minimizes the impact of foreign currency fluctuations. In all, the unit cost measures provide an alternative perspective on operating cost performance with minimal impact from external market prices. In the first half of 2020, as a result of the temporary suspension of operations in Peru, fixed overhead production costs incurred during the suspension were directly charged to cost of sales. These costs did not contribute to production of inventory and were therefore excluded from the calculation of combined unit costs.
The tables below present a detailed combined unit cost and zinc plant unit costs for the Manitoba business unit and combined unit cost for the Peru business unit, and reconciliations between these measures to the most comparable IFRS measures of cost of sales for the three months and year ended December 31, 2020 and 2019.
Peru | | Three months ended | | Year ended |
(in thousands except unit cost per tonne) | | Dec. 31, 2020 | | Dec. 31, 2019 | | Dec. 31, 2020 | | Dec. 31, 2019 |
Combined unit cost per tonne processed | | | | |
| | | | | | | | |
Mining | | 24,967 | | 18,533 | | 70,724 | | 82,417 |
Milling | | 39,219 | | 43,860 | | 134,096 | | 159,913 |
G&A 1 | | 14,327 | | 15,147 | | 43,105 | | 56,847 |
Other G&A 2 | | 213 | | | (1,339) | | | 865 | | | (1,051) | |
Unit cost | | 78,726 | | | 76,201 | | | 248,790 | | | 298,126 | |
Tonnes ore milled | | 7,742 | | | 7,474 | | | 26,297 | | | 31,387 | |
Combined unit cost per tonne | | 10.17 | | | 10.20 | | | 9.46 | | | 9.50 | |
Reconciliation to IFRS: | | | | | | | | |
Unit cost | | 78,726 | | 76,201 | | | 248,790 | | 298,126 | |
Freight & other | | 9,989 | | 15,121 | | 34,794 | | 53,016 |
Other G&A | | (213) | | 1,339 | | (865) | | 1,051 |
Share-based compensation expenses | | 213 | | 27 | | | 288 | | 75 | |
Inventory adjustments | | (2,188) | | (100) | | | 32 | | 504 | |
Change in product inventory | | (6,550) | | 7,410 | | | (3,883) | | (3,313) | |
Royalties | | 1,399 | | 2,152 | | | 5,121 | | 6,724 | |
Overhead costs related to suspension of activities (cash) | | - | | - | | | 15,810 | | - | |
Depreciation and amortization | | 50,861 | | 56,938 | | | 184,275 | | 209,126 | |
Cost of sales3 | | 132,237 | | 159,088 | | 484,362 | | 565,309 |
1 G&A as per cash cost reconciliation above. |
2 Other G&A primarily includes profit sharing costs. |
3 As per IFRS financial statements. |
Manitoba | | Three months ended | | Year ended |
(in thousands except tonnes ore milled and unit cost per tonne) | | Dec. 31, 2020 | | Dec. 31, 2019 | | Dec. 31, 2020 | | Dec. 31, 2019 |
Combined unit cost per tonne processed | | | | |
| | | | | | | | |
Mining | | 46,598 | | | 46,335 | | | 178,308 | | | 186,972 | |
Milling | | 11,147 | | | 13,396 | | | 46,057 | | | 49,269 | |
G&A 1 | | 9,898 | | | 9,551 | | | 46,930 | | | 45,026 | |
Less: G&A allocated to zinc metal production | | (3,301) | | | (2,966) | | | (14,431) | | | (12,507) | |
Less: Other G&A related to profit sharing costs | | - | | | - | | | (10) | | | (85) | |
Unit cost | | 64,342 | | | 66,316 | | | 256,854 | | | 268,675 | |
| | | | | | | | |
USD/CAD implicit exchange rate | | 1.30 | | | 1.32 | | | 1.34 | | | 1.33 | |
Unit cost - C$ | | 83,669 | | | 87,528 | | | 344,672 | | | 356,562 | |
Tonnes ore milled | | 598,287 | | | 685,151 | | | 2,618,065 | | | 2,652,306 | |
Combined unit cost per tonne - C$ | | 140 | | | 128 | | | 132 | | | 134 | |
Reconciliation to IFRS: | | | | | | | | |
Unit cost | | 64,342 | | | 66,316 | | | 256,854 | | | 268,675 | |
Freight & other | | 6,929 | | | 7,014 | | | 27,056 | | | 26,915 | |
Refined (zinc) | | 18,736 | | | 19,464 | | | 71,799 | | | 72,259 | |
G&A allocated to zinc metal production | | 3,301 | | | 2,966 | | | 14,431 | | | 12,507 | |
Other G&A related to profit sharing | | - | | | - | | | 10 | | | 85 | |
Share-based compensation expenses | | 706 | | | 181 | | | 1,112 | | | 325 | |
Inventory adjustments | | 2,270 | | | 1,768 | | | 2,270 | | | 1,768 | |
Change in product inventory | | 2,029 | | | 3,267 | | | 2,054 | | | (4,413) | |
Royalties | | 1,419 | | | 1,781 | | | 7,686 | | | 7,038 | |
Overhead costs related to suspension of activities (cash) | | 8,232 | | | - | | | 8,232 | | | - | |
Depreciation and amortization | | 47,722 | | | 37,007 | | | 177,552 | | | 135,429 | |
Cost of sales2 | | 155,686 | | 139,764 | | 569,056 | | 520,588 |
1 G&A as per cash cost reconciliation above. |
2 As per IFRS financial statements. |
Manitoba | | Three months ended | | Year ended |
(in thousands except zinc plant unit cost per pound) | | Dec. 31, 2020 | | Dec. 31, 2019 | | Dec. 31, 2020 | | Dec. 31, 2019 |
Zinc plant unit cost | | | | |
| | | | | | | | |
Zinc plant costs | | 18,736 | | 19,464 | | 71,799 | | 72,259 |
G&A 1 | | 9,898 | | | 9,551 | | | 46,930 | | | 45,026 | |
Less: G&A allocated to other areas | | (6,597) | | | (6,585) | | | (32,489) | | | (32,434) | |
Less: Other G&A related to profit sharing | | - | | | - | | | (10) | | | (85) | |
Zinc plant unit cost | | 22,037 | | | 22,430 | | | 86,230 | | | 84,766 | |
| | | | | | | | |
USD/CAD implicit exchange rate | | 1.30 | | | 1.32 | | | 1.34 | | | 1.33 | |
Zinc plant unit cost - C$ | | 28,700 | | | 29,608 | | | 115,400 | | | 112,447 | |
Refined metal produced (in pounds) | | 63,533 | | | 61,324 | | | 246,117 | | | 227,828 | |
Zinc plant unit cost per pound - C$ | | 0.45 | | | 0.48 | | | 0.47 | | | 0.49 | |
| | | | | | | | |
Reconciliation to IFRS: | | | | | | | | |
Zinc plant unit cost | | 22,037 | | | 22,430 | | | 86,230 | | | 84,766 | |
Freight & other | | 6,929 | | | 7,014 | | | 27,056 | | | 26,915 | |
Mining | | 46,598 | | | 46,335 | | | 178,308 | | | 186,972 | |
Milling | | 11,147 | | | 13,396 | | | 46,057 | | | 49,269 | |
G&A allocated to other areas | | 6,597 | | | 6,585 | | | 32,489 | | | 32,434 | |
Other G&A related to profit sharing | | - | | | - | | | 10 | | | 85 | |
Share-based compensation expenses | | 706 | | | 181 | | | 1,112 | | | 325 | |
Inventory adjustments | | 2,270 | | | 1,768 | | | 2,270 | | | 1,768 | |
Change in product inventory | | 2,029 | | | 3,267 | | | 2,054 | | | (4,413) | |
Royalties | | 1,419 | | | 1,781 | | | 7,686 | | | 7,038 | |
Overhead costs related to suspension of activities (cash) | | 8,232 | | | - | | | 8,232 | | | - | |
Depreciation and amortization | | 47,722 | | | 37,007 | | | 177,552 | | | 135,429 | |
Cost of sales2 | | 155,686 | | | 139,764 | | | 569,056 | | | 520,588 | |
1 G&A as per cash cost reconciliation above. |
2 As per IFRS financial statements. |
ACCOUNTING CHANGES
New standards and interpretations not yet adopted
For information on new standards and interpretations not yet adopted, refer to note 4 of our audited consolidated financial statements for the year ended December 31, 2020.
CRITICAL ACCOUNTING JUDGEMENTS AND ESTIMATES
The preparation of the consolidated financial statements in conformity with IFRS requires us to make judgements, estimates and assumptions that affect the application of accounting policies, reported amounts of assets and liabilities, disclosure of contingent assets and liabilities at the date of the consolidated financial statements, and reported amounts of revenue and expenses during the reporting period. Actual results may differ from these estimates.
We review these estimates and underlying assumptions on an ongoing basis based on our experience and other factors, including expectations of future events that we believe to be reasonable under the circumstances. Revisions to accounting estimates are recognized in the period in which the estimates are revised and in any future periods affected. Certain accounting estimates and judgements have been identified as being "critical" to the presentation of our financial condition and results of operations because they require us to make subjective and/or complex judgments about matters that are inherently uncertain; or there is a reasonable likelihood that materially different amounts could be reported under different conditions or using different assumptions and estimates.
The following are significant judgements and estimates impacting the consolidated financial statements:
- Judgements and estimates that affect multiple areas of the consolidated financial statements:
- Mineral reserves and resources which form the basis of life of mine plans which are utilized in impairment testing, timing of payments related to decommissioning obligations and depreciation of capital assets. We estimate our mineral reserves and resources based on information compiled by qualified persons as defined in accordance with NI 43-101;
- Identification of a business combination and acquisition method accounting;
- IFRS 15 - Revenue - adoption for stream transactions
- Determination of functional currency;
- Income and mining taxes, including estimates of future taxable profit which impacts the ability to realize deferred tax assets on our balance sheet; and
- In respect of the outcome of uncertain future events as it concerns recognizing contingent liabilities.
- Judgements and estimates that relate mainly to assets (these judgements may also affect other areas of the consolidated financial statements):
- Property, plant and equipment:
- Cost allocations for mine development;
- Mining properties expenditures capitalized;
- Classification of supply costs as related to capital development or inventory acquisition;
- Determining when exploration and evaluation assets should be transferred to capital works in progress within property, plant and equipment;
- Determination of when an asset or group of assets is in the condition and location to be ready for use as intended by management for the purposes of commencing depreciation;
- Componentization;
- Assessment of impairment, including determination of cash generating units and assessing for indicators of impairment;
- Recoverability of exploration and evaluation assets, including determination of cash generating units and assessing for indications of impairment;
- Determining whether assets meet criteria for classification as held for sale;
- Units of production depreciation;
- Plant and equipment estimated useful lives and residual values;
- Capitalized stripping costs; and
- Finite life intangible assets.
- Impairment (and reversal of impairment) of non-financial assets:
- Future production levels and timing;
- Operating and capital costs;
- Future commodity prices;
- Foreign exchange rates; and
- Risk adjusted discount rates.
- Valuation of acquired assets; and
- In process inventory quantities, inventory cost allocations and inventory valuation.
- Judgements and estimates that relate mainly to liabilities (these judgements may also affect other areas of the consolidated financial statements):
- Determining the accounting classification of the precious metals stream deposit;
- Determination of deferred revenue per unit related to the precious metals stream transactions and determination of current portion of deferred revenue, which is based on timing of future sales, and adjustments of the expected conversion of resource to reserves;
- Pensions and other employee benefits;
- Decommissioning, restoration and similar liabilities including estimated future costs and timing of spending;
- Contingent liabilities; and
- Capital commitments.
- Estimates that relate mainly to the consolidated income statements:
- Assaying used to determine revenues and recoverability of inventories.
For more information on judgements and estimates, refer to note 2 of our consolidated financial statements for the year ended December 31, 2020.
DISCLOSURE CONTROLS AND PROCEDURES AND INTERNAL CONTROL OVER FINANCIAL REPORTING
Disclosure controls and procedures ("DC&P")
Management is responsible for establishing and maintaining adequate DC&P. As of December 31, 2020, we have evaluated the effectiveness of the design and operation of our DC&P in accordance with requirements of National Instrument 52-109 of the Canadian Securities Commission ("NI 52-109") and the Sarbanes Oxley Act of 2002 (as adopted by the US Securities and Exchange Commission). Our Chief Executive Officer ("CEO") and Chief Financial Officer ("CFO") supervised and participated in this evaluation.
As of December 31, 2020, based on management's evaluation, our CEO and CFO concluded that our DC&P were effective to ensure that information required to be disclosed by us in reports we file or submit is recorded, processed, summarized and reported within the time periods specified in securities legislation and is accumulated and communicated to our management, including our CEO and CFO, to allow timely decisions regarding required disclosure.
Internal control over financial reporting ("ICFR")
Management of Hudbay is responsible for establishing and maintaining adequate ICFR. Under the supervision and with the participation of our Chief Executive Officer and Chief Financial Officer, we evaluated the effectiveness of our ICFR as of December 31, 2020 based upon the Internal Control - Integrated Framework (2013) issued by the Committee of Sponsoring Organizations of the Treadway Commission. Based on management's evaluation, our CEO and CFO concluded that our ICFR was effective as of December 31, 2020.
The effectiveness of the Company's ICFR as of December 31, 2020 has been audited by Deloitte LLP, Independent Registered Public Accounting Firm as stated in their report immediately preceding the Company's audited consolidated financial statements for the year ended December 31, 2020.
Changes in ICFR
We did not make any changes to ICFR during the year ended December 31, 2020 that materially affected, or are reasonably likely to materially affect, our ICFR.
Inherent limitations of controls and procedures
All internal control systems, no matter how well designed, have inherent limitations. As a result, even systems determined to be effective may not prevent or detect misstatements on a timely basis, as systems can provide only reasonable assurance that the objectives of the control system are met. In addition, projections of any evaluation of the effectiveness of ICFR to future periods are subject to the risk that controls may become inadequate because of changes in conditions, or that the degree of compliance with the policies or procedures may change.
NOTES TO READER
Forward-Looking Information
This MD&A contains forward-looking information within the meaning of applicable Canadian and United States securities legislation. All information contained in this MD&A, other than statements of current and historical fact, is forward-looking information. Often, but not always, forward-looking information can be identified by the use of words such as "plans", "expects", "budget", "guidance", "scheduled", "estimates", "forecasts", "strategy", "target", "intends", "objective", "goal", "understands", "anticipates" and "believes" (and variations of these or similar words) and statements that certain actions, events or results "may", "could", "would", "should", "might" "occur" or "be achieved" or "will be taken" (and variations of these or similar expressions). All of the forward-looking information in this MD&A is qualified by this cautionary note.
Forward-looking information includes, but is not limited to, production, cost and capital and exploration expenditure guidance and potential revisions to such guidance, anticipated production at our mines and processing facilities, expectations regarding the impact of the COVID-19 pandemic on our operations, financial condition and prospects and our ability to effectively engage with local communities in Peru and other stakeholders, expectations regarding the timing of mining activities at the Pampacancha deposit and any additional delivery obligations under the Constancia stream agreement, the anticipated timing, cost and benefits of developing the Rosemont project and the outcome of litigation challenging Rosemont's permits, expectations regarding the Helvetia exploration program, expectations regarding the Lalor gold strategy, including the refurbishment, commissioning and ramp-up of the New Britannia mill and expectations regarding the mine plan for the 1901 deposit, increasing the mining rate at Lalor and optimizing the Stall and New Britannia mills, the possibility of converting inferred mineral resource estimates to higher confidence categories, the potential and our anticipated plans for advancing our mining properties surrounding Constancia and elsewhere in Peru, anticipated mine plans, anticipated metals prices and the anticipated sensitivity of our financial performance to metals prices, events that may affect our operations and development projects, anticipated cash flows from operations and related liquidity requirements, the anticipated effect of external factors on revenue, such as commodity prices, estimation of mineral reserves and resources, mine life projections, reclamation costs, economic outlook, government regulation of mining operations, and business and acquisition strategies. Forward-looking information is not, and cannot be, a guarantee of future results or events. Forward-looking information is based on, among other things, opinions, assumptions, estimates and analyses that, while considered reasonable by us at the date the forward-looking information is provided, inherently are subject to significant risks, uncertainties, contingencies and other factors that may cause actual results and events to be materially different from those expressed or implied by the forward-looking information.
The material factors or assumptions that we identified and were applied by us in drawing conclusions or making forecasts or projections set out in the forward-looking information include, but are not limited to:
- our ability to continue to operate safely and at full capacity during the COVID-19 pandemic;
- the ability to achieve production and unit cost guidance;
- no significant interruptions to our operations or significant delays to our development projects in Manitoba and Peru due to the COVID-19 pandemic;
- the timing of development and production activities on the Pampacancha deposit;
- the timing for reaching additional agreements with individual community members and no significant unanticipated delays to the development of Pampacancha;
- the successful completion of the New Britannia project on budget and on schedule;
- the successful outcome of the Rosemont litigation;
- the successful renegotiation of collective agreements with the labour unions that represent certain of our employees in Manitoba and Peru;
- the success of mining, processing, exploration and development activities;
- the scheduled maintenance and availability of our processing facilities;
- the accuracy of geological, mining and metallurgical estimates;
- anticipated metals prices and the costs of production;
- the supply and demand for metals we produce;
- the supply and availability of all forms of energy and fuels at reasonable prices;
- no significant unanticipated operational or technical difficulties;
- the execution of our business and growth strategies, including the success of our strategic investments and initiatives;
- the availability of additional financing, if needed;
- the ability to complete project targets on time and on budget and other events that may affect our ability to develop our projects;
- the timing and receipt of various regulatory and governmental approvals;
- the availability of personnel for our exploration, development and operational projects and ongoing employee relations;
- maintaining good relations with the labour unions that represent certain of our employees in Manitoba and Peru;
- maintaining good relations with the communities in which we operate, including the neighbouring Indigenous communities and local governments;
- no significant unanticipated challenges with stakeholders at our various projects;
- no significant unanticipated events or changes relating to regulatory, environmental, health and safety matters;
- no contests over title to our properties, including as a result of rights or claimed rights of Indigenous peoples or challenges to the validity of our unpatented mining claims;
- the timing and possible outcome of pending litigation and no significant unanticipated litigation;
- certain tax matters, including, but not limited to current tax laws and regulations and the refund of certain value added taxes from the Canadian and Peruvian governments; and
- no significant and continuing adverse changes in general economic conditions or conditions in the financial markets (including commodity prices and foreign exchange rates).
The risks, uncertainties, contingencies and other factors that may cause actual results to differ materially from those expressed or implied by the forward-looking information may include, but are not limited to, risks associated with the COVID-19 pandemic and its effect on our operations, financial condition, projects and prospects, the possibility of a global recession arising from the COVID-19 pandemic and attempts to control it, the political situation in Peru, risks generally associated with the mining industry, such as economic factors (including future commodity prices, currency fluctuations, energy prices and general cost escalation), uncertainties related to the development and operation of our projects, risks related to the U.S. district court's recent decisions to set aside the U.S. Forest Service's FROD and the Biological Opinion for Rosemont and related appeals and other legal challenges, risks related to the new Lalor mine plan, including the schedule for the refurbishment of the New Britannia mill and the ability to convert inferred mineral resource estimates to higher confidence categories, risks related to the schedule for mining the Pampacancha deposit (including risks associated with COVID-19 and risks associated with reaching additional agreements with individual community members and the impact of any schedule delays), dependence on key personnel and employee and union relations, risks related to political or social unrest or change, risks in respect of Indigenous and community relations, rights and title claims, operational risks and hazards, including the cost of maintaining and upgrading the Company's tailings management facilities and any unanticipated environmental, industrial and geological events and developments and the inability to insure against all risks, failure of plant, equipment, processes, transportation and other infrastructure to operate as anticipated, compliance with government and environmental regulations, including permitting requirements and anti-bribery legislation, depletion of our reserves, volatile financial markets that may affect our ability to obtain additional financing on acceptable terms, the failure to obtain required approvals or clearances from government authorities on a timely basis, uncertainties related to the geology, continuity, grade and estimates of mineral reserves and resources, and the potential for variations in grade and recovery rates, uncertain costs of reclamation activities, our ability to comply with our pension and other post-retirement obligations, our ability to abide by the covenants in our debt instruments and other material contracts, tax refunds, hedging transactions, as well as the risks discussed under the heading "Financial Risk Management" in this MD&A and under the heading "Risk Factors" in our most recent Annual Information Form.
Should one or more risk, uncertainty, contingency or other factor materialize or should any factor or assumption prove incorrect, actual results could vary materially from those expressed or implied in the forward-looking information. Accordingly, you should not place undue reliance on forward-looking information. We do not assume any obligation to update or revise any forward-looking information after the date of this MD&A or to explain any material difference between subsequent actual events and any forward-looking information, except as required by applicable law.
Note to United States Investors
This MD&A has been prepared in accordance with the requirements of the securities laws in effect in Canada, which may differ materially from the requirements of United States securities laws applicable to U.S. issuers.
Qualified Person
The technical and scientific information in this MD&A related to the Constancia mine and Rosemont project has been approved by Cashel Meagher, P. Geo, our Senior Vice President and Chief Operating Officer. The technical and scientific information related to our other material mineral projects contained in this MD&A has been approved by Olivier Tavchandjian, P. Geo, our Vice President, Exploration and Geology. Messrs. Meagher and Tavchandjian are qualified persons pursuant to NI 43-101. For a description of the key assumptions, parameters and methods used to estimate mineral reserves and resources at Hudbay's material properties, as well as data verification procedures and a general discussion of the extent to which the estimates of scientific and technical information may be affected by any known environmental, permitting, legal title, taxation, sociopolitical, marketing or other relevant factors, please see the technical reports for our material properties as filed by us on SEDAR at www.sedar.com.
SUMMARY OF RESULTS
The following unaudited tables set out a summary of quarterly and annual results for the Company:
| | 2020 | 2019 | 2018 |
| | 2020 | Q4 | Q3 | Q2 | Q1 | 2019 | Q4 | Q3 | Q2 | Q1 | 2018 | Q4 |
Consolidated Financial Condition ($000s) | | | | | | | | | | | | |
Cash and cash equivalents | | $ | 439,135 | | $ | 439,135 | | $ | 449,014 | | $ | 391,136 | | $ | 305,997 | | $ | 396,146 | | $ | 396,146 | | $ | 398,438 | | $ | 489,527 | | $ | 485,867 | | $ | 515,497 | | $ | 515,497 | |
Total long-term debt | | $ | 1,135,675 | | 1,135,675 | | 1,175,104 | | 988,418 | | 988,074 | | 985,255 | | 985,255 | | 976,272 | | 977,196 | | 977,413 | | 981,030 | | 981,030 | |
Net debt1 | | $ | 696,540 | | 696,540 | | 726,090 | | 597,282 | | 682,077 | | 589,109 | | 589,109 | | 577,834 | | 487,669 | | 491,546 | | 465,533 | | 465,533 | |
Consolidated Financial Performance ($000s except per share amounts) | | | | | | | | | |
Revenue | | $ | 1,092,418 | | $ | 322,290 | | $ | 316,108 | | $ | 208,913 | | $ | 245,105 | | $ | 1,237,439 | | $ | 324,485 | | $ | 291,282 | | $ | 329,414 | | $ | 292,258 | | $ | 1,472,366 | | $ | 351,773 | |
Cost of sales | | $ | 1,053,418 | | 287,923 | | 276,830 | | 221,567 | | 267,096 | | 1,085,897 | | 298,852 | | 260,327 | | 286,272 | | 240,446 | | 1,098,626 | | 276,547 | |
Earnings (loss) before tax | | $ | (179,089) | | 911 | | (23,944) | | (74,604) | | (81,452) | | (452,763) | | (42,352) | | (348,367) | | (43,931) | | (18,108) | | 170,837 | | 17,650 | |
Earnings (loss) | | $ | (144,584) | | 7,406 | | (23,955) | | (51,901) | | (76,134) | | (343,810) | | (1,455) | | (274,796) | | (54,145) | | (13,412) | | 85,416 | | (3,510) | |
Basic and diluted (loss) earnings per share | | $ | (0.55) | | $ | 0.03 | | $ | (0.09) | | $ | (0.20) | | $ | (0.29) | | $ | (1.32) | | $ | (0.01) | | $ | (1.05) | | $ | (0.21) | | $ | (0.05) | | $ | 0.33 | | $ | (0.01) | |
Adjusted (loss) earnings per share 1 | | $ | (0.46) | | $ | (0.06) | | $ | (0.10) | | $ | (0.15) | | $ | (0.15) | | $ | (0.18) | | $ | (0.09) | | $ | (0.09) | | $ | (0.03) | | $ | 0.03 | | $ | 0.40 | | $ | 0.05 | |
Operating cash flow before change in non-cash working capital 1 | | $ | 241,863 | | 86,071 | | 84,383 | | 29,457 | | 41,951 | | 307,284 | | 69,141 | | 71,204 | | 81,259 | | 85,684 | | 501,352 | | 104,264 | |
Adjusted EBITDA 1, 2 | | $ | 306.7 | | 106.9 | | 96.1 | | 49.1 | | 55.0 | | 358.5 | | 82.2 | | 76.2 | | 95.9 | | 104.2 | | 554.8 | | 120.7 | |
Consolidated Operational Performance | | | | | | | | | |
Contained metal in concentrate produced 3 | | | | | | | | | | | | | |
Copper | tonnes | 95,333 | | 27,278 | | 25,395 | | 18,026 | | 24,635 | | 137,179 | | 32,422 | | 36,422 | | 30,363 | | 37,972 | | 154,550 | | 37,238 | |
Gold | ounces | 124,622 | | 32,376 | | 29,277 | | 32,614 | | 30,355 | | 114,692 | | 32,712 | | 28,319 | | 28,099 | | 25,562 | | 119,882 | | 28,051 | |
Silver | ounces | 2,750,873 | | 730,679 | | 671,685 | | 580,817 | | 767,692 | | 3,585,330 | | 930,137 | | 924,191 | | 811,807 | | 919,195 | | 3,954,469 | | 1,014,684 | |
Zinc | tonnes | 118,130 | | 25,843 | | 30,570 | | 31,222 | | 30,495 | | 119,106 | | 30,592 | | 28,639 | | 31,838 | | 28,037 | | 115,588 | | 27,408 | |
Molybdenum | tonnes | 1,204 | | 333 | | 392 | | 124 | | 354 | | 1,272 | | 372 | | 262 | | 334 | | 304 | | 904 | | 329 | |
Payable metal in concentrate sold | | | | | | | | | | | | |
Copper | tonnes | 88,888 | | 22,963 | | 25,903 | | 15,951 | | 24,072 | | 128,519 | | 33,715 | | 29,916 | | 33,171 | | 31,717 | | 147,923 | | 36,350 | |
Gold | ounces | 122,949 | | 35,179 | | 30,605 | | 30,590 | | 26,574 | | 108,999 | | 30,344 | | 25,488 | | 30,538 | | 22,629 | | 113,097 | | 25,861 | |
Silver | ounces | 2,585,586 | | 762,384 | | 705,495 | | 541,785 | | 575,922 | | 3,452,926 | | 909,423 | | 756,296 | | 804,301 | | 982,906 | | 3,372,353 | | 909,500 | |
Zinc 4 | tonnes | 109,347 | | 28,431 | | 26,520 | | 27,604 | | 26,792 | | 104,319 | | 28,001 | | 29,140 | | 24,224 | | 22,954 | | 115,723 | | 31,134 | |
Molybdenum | tonnes | 1,321 | | 457 | | 313 | | 120 | | 431 | | 1,186 | | 199 | | 334 | | 419 | | 234 | | 819 | | 447 | |
Cash cost 1 | $/lb | 0.60 | | $ | 0.43 | | $ | 0.65 | | $ | 0.29 | | $ | 0.98 | | $ | 0.83 | | $ | 0.90 | | $ | 0.71 | | $ | 0.95 | | $ | 0.81 | | $ | 0.66 | | $ | 0.63 | |
All-in sustaining cash cost 1 | $/lb | 2.16 | | $ | 2.24 | | $ | 2.25 | | $ | 1.91 | | $ | 2.17 | | $ | 1.86 | | $ | 2.22 | | $ | 1.69 | | $ | 1.98 | | $ | 1.58 | | $ | 1.32 | | $ | 1.49 | |
1 Net debt, adjusted (loss) earnings per share, adjusted EBITDA, cash cost, and all-in sustaining cash cost per pound of copper produced, net of by-product credits, are non-IFRS financial performance measures with no standardized definition under IFRS. For further information and a detailed reconciliation, please see discussion under the "Non-IFRS Financial Reporting Measures" section of this MD&A. All comparative cash cost and all-in sustaining cash cost per pound of copper produced, net of by-product credits figures have been restated as indicated on page 57. |
2 In millions. |
3 Metal reported in concentrate is prior to deductions associated with smelter contract terms. |
4 Includes refined zinc metal sold. |
| | 2020 | 2019 | 2018 |
| | 2020 | Q4 | Q3 | Q2 | Q1 | 2019 | Q4 | Q3 | Q2 | Q1 | 2018 | Q4 |
Peru Operations | | | | | | | | | | | | | |
Ore mined1 | tonnes | 27,529,950 | | 9,313,784 | | 8,455,668 | | 2,775,286 | | 6,985,212 | | 33,308,369 | | 8,049,063 | | 8,413,367 | | 8,211,166 | | 8,634,773 | | 34,372,156 | | 7,329,423 | |
Copper | % | 0.32 | 0.31 | 0.31 | 0.34 | 0.34 | 0.43 | 0.41 | 0.44 | 0.39 | 0.47 | 0.49 | 0.47 |
Gold | g/tonne | 0.03 | 0.03 | 0.03 | 0.04 | 0.03 | 0.04 | 0.04 | 0.05 | 0.04 | 0.04 | 0.05 | 0.05 |
Silver | g/tonne | 2.75 | 2.61 | 2.55 | 2.90 | 3.10 | 3.76 | 3.87 | 3.93 | 3.68 | 3.55 | 4.15 | 4.16 |
Molybdenum | % | 0.02 | | 0.01 | | 0.02 | | 0.02 | | 0.01 | | 0.02 | | 0.02 | | 0.02 | | 0.01 | | 0.01 | | 0.01 | | 0.01 | |
Ore milled | tonnes | 26,297,318 | | 7,741,714 | | 7,480,655 | | 4,355,482 | | 6,719,466 | | 31,387,281 | | 7,474,136 | | 8,240,344 | | 7,679,739 | | 7,993,062 | | 31,282,610 | | 7,657,943 | |
Copper | % | 0.34 | 0.33 | 0.33 | 0.34 | 0.34 | 0.42 | 0.42 | 0.44 | 0.37 | 0.46 | 0.47 | 0.48 |
Gold | g/tonne | 0.03 | 0.03 | 0.03 | 0.04 | 0.03 | 0.04 | 0.04 | 0.04 | 0.04 | 0.04 | 0.05 | 0.06 |
Silver | g/tonne | 2.87 | 2.74 | 2.68 | 3.04 | 3.13 | 3.64 | 3.86 | 3.76 | 3.40 | 3.53 | 4.08 | 4.26 |
Molybdenum | % | 0.02 | 0.02 | 0.02 | 0.01 | 0.02 | 0.02 | 0.02 | 0.02 | 0.01 | 0.01 | 0.01 | 0.01 |
Copper recovery | % | 83.0 | 85.3 | 83.3 | 76.6 | 84.3 | 85.7 | 85.6 | 86.0 | 84.7 | 86.2 | 82.6 | 84.8 |
Gold recovery | % | 49.8 | 52.7 | 51.6 | 43.4 | 50.2 | 48.1 | 50.0 | 48.3 | 41.3 | 52.2 | 47.4 | 48.5 |
Silver recovery | % | 66.9 | 70.1 | 66.7 | 59.6 | 68.2 | 68.2 | 68.2 | 68.9 | 65.7 | 69.9 | 66.5 | 71.6 |
Molybdenum recovery | % | 29.4 | 28.4 | 30.4 | 19.9 | 35.0 | 26.5 | 30.8 | 20.2 | 28.9 | 26.8 | 21.6 | 30.5 |
Contained metal in concentrate | | | | | | | | | | | | | |
Copper | tonnes | 73,150 | | 21,554 | | 20,803 | | 11,504 | | 19,290 | | 113,825 | | 26,659 | | 31,091 | | 24,232 | | 31,843 | | 122,178 | | 30,834 | |
Gold | ounces | 12,395 | | 3,689 | | 3,333 | | 2,311 | | 3,062 | | 19,723 | | 5,007 | | 5,565 | | 3,794 | | 5,357 | | 24,189 | | 7,522 | |
Silver | ounces | 1,622,972 | | 477,775 | | 430,208 | | 253,687 | | 461,302 | | 2,504,769 | | 631,774 | | 686,258 | | 551,807 | | 634,930 | | 2,729,859 | | 750,747 | |
Molybdenum | tonnes | 1,204 | | 333 | | 392 | | 124 | | 354 | | 1,272 | | 372 | | 262 | | 334 | | 304 | | 904 | | 329 | |
Precious metals2 | ounces | 30,630 | | 9,058 | | 8,167 | | 5,161 | | 8,245 | | 55,506 | | 14,033 | | 15,369 | | 11,677 | | 14,427 | | 63,187 | | 18,247 | |
Payable metal sold | | | | | | | | | | | | | |
Copper | tonnes | 68,506 | | 18,583 | | 21,654 | | 9,023 | | 19,247 | | 106,184 | | 28,430 | | 25,314 | | 25,778 | | 26,662 | | 116,449 | | 31,252 | |
Gold | ounces | 10,986 | | 3,297 | | 3,753 | | 1,317 | | 2,618 | | 18,956 | | 4,824 | | 3,858 | | 4,056 | | 6,218 | | 20,420 | | 7,262 | |
Silver | ounces | 1,518,548 | | 480,843 | | 433,595 | | 242,519 | | 361,591 | | 2,452,496 | | 666,839 | | 529,139 | | 504,259 | | 752,259 | | 2,255,700 | | 672,756 | |
Molybdenum | tonnes | 1,321 | | 457 | | 313 | | 120 | | 431 | | 1,186 | | 199 | | 334 | | 419 | | 234 | | 819 | | 447 | |
Peru combined unit operating cost,3, 4 | $/tonne | $ | 9.46 | | $ | 10.17 | | $ | 9.85 | | $ | 7.77 | | $ | 9.31 | | $ | 9.50 | | $ | 10.20 | | $ | 8.63 | | $ | 10.39 | | $ | 8.87 | | $ | 9.44 | | $ | 9.88 | |
Peru cash cost4 | $/lb | $ | 1.45 | | $ | 1.47 | | $ | 1.54 | | $ | 1.31 | | $ | 1.42 | | $ | 1.16 | | $ | 1.36 | | $ | 1.06 | | $ | 1.39 | | $ | 0.90 | | $ | 1.14 | | $ | 1.05 | |
Peru sustaining cash cost4 | $/lb | $ | 2.20 | | $ | 2.58 | | $ | 2.29 | | $ | 1.84 | | $ | 1.91 | | $ | 1.65 | | $ | 2.17 | | $ | 1.53 | | $ | 1.87 | | $ | 1.13 | | $ | 1.37 | | $ | 1.40 | |
1 Reported tonnes and grade for ore mined are estimates based on mine plan assumptions and may not fully reconcile to ore milled. |
2 Precious metals production includes gold and silver production on a gold-equivalent basis. For 2018 and 2019, silver is converted to gold at a ratio of 70:1. For 2020, silver is converted to gold at a ratio of 89:1. |
3 Reflects combined mine, mill and general and administrative ("G&A") costs per tonne of ore milled. Reflects the deduction of expected capitalized stripping costs. |
4 Combined unit costs, cash cost, and sustaining cash cost per pound of copper produced, net of by-product credits, are non-IFRS financial performance measures with no standardized definition under IFRS. For further information and a detailed reconciliation, please see the discussion under the "Non-IFRS Financial Reporting Measures" section of this MD&A .All comparative cash cost and all-in sustaining cash cost per pound of copper produced, net of by-product credits figures have been restated as indicated on page 57. |
| | 2020 | 2019 | 2018 |
| | 2020 | Q4 | Q3 | Q2 | Q1 | 2019 | Q4 | Q3 | Q2 | Q1 | 2018 1 | Q4 |
Manitoba Operations | | | | | | | | | | | | | |
Lalor ore mined | tonnes | 1,654,240 | | 468,101 | | 357,213 | | 407,408 | | 421,518 | | 1,536,780 | | 390,140 | | 346,456 | | 411,701 | | 388,483 | | 1,260,241 | | 317,616 | |
Copper | % | 0.74 | 0.80 | 0.66 | 0.77 | 0.70 | 0.75 | 0.80 | 0.68 | 0.73 | 0.76 | 0.74 | 0.82 |
Zinc | % | 5.73 | 5.54 | 5.98 | 6.05 | 5.43 | 6.36 | 6.20 | 6.16 | 6.34 | 6.70 | 6.25 | 6.80 |
Gold | g/tonne | 2.51 | 2.79 | 2.28 | 2.64 | 2.27 | 2.16 | 2.63 | 2.21 | 2.12 | 1.68 | 2.19 | 2.09 |
Silver | g/tonne | 25.31 | 24.96 | 21.23 | 28.4 | 26.18 | 25.51 | 28.38 | 25.56 | 22.32 | 25.96 | 25.39 | 24.66 |
777 ore mined | tonnes | 991,576 | | 164,856 | | 264,905 | | 281,890 | | 279,925 | | 1,109,782 | | 269,342 | | 273,319 | | 288,599 | | 278,522 | | 966,567 | | 244,613 | |
Copper | % | 1.40 | 1.89 | 0.98 | 1.72 | 1.18 | 1.37 | 1.17 | 1.33 | 1.34 | 1.65 | 1.47 | 1.76 |
Zinc | % | 3.88 | 2.98 | 3.95 | 4.13 | 4.11 | 3.22 | 3.33 | 3.01 | 3.37 | 3.18 | 4.43 | 3.46 |
Gold | g/tonne | 1.90 | 1.85 | 2.01 | 1.91 | 1.82 | 1.61 | 1.52 | 1.63 | 1.60 | 1.70 | 1.83 | 1.61 |
Silver | g/tonne | 24.13 | 21.64 | 24.25 | 25.73 | 23.86 | 18.67 | 18.52 | 15.42 | 18.92 | 21.75 | 28.34 | 24.37 |
Reed ore mined | tonnes | - | | - | | - | | - | | - | | - | | - | | - | | - | | - | | 326,363 | | - | |
Copper | % | - | | - | | - | | - | | - | | - | | - | | - | | - | | - | | 3.35 | - | |
Zinc | % | - | | - | | - | | - | | - | | - | | - | | - | | - | | - | | 0.90 | - | |
Gold | g/tonne | - | | - | | - | | - | | - | | - | | - | | - | | - | | - | | 0.77 | - | |
Silver | g/tonne | - | | - | | - | | - | | - | | - | | - | | - | | - | | - | | 9.08 | - | |
Stall Concentrator: | | | | | | | | | | | | |
Ore milled | tonnes | 1,412,751 | | 372,624 | | 335,739 | | 334,601 | | 369,787 | | 1,290,300 | | 310,622 | | 318,539 | | 339,616 | | 321,523 | | 1,201,466 | | 313,995 | |
Copper | % | 0.73 | 0.79 | 0.68 | 0.76 | 0.70 | 0.73 | 0.80 | 0.64 | 0.71 | 0.78 | 0.72 | 0.84 |
Zinc | % | 5.76 | 5.47 | 6.11 | 6.16 | 5.38 | 6.39 | 6.24 | 6.22 | 6.36 | 6.75 | 6.38 | 6.83 |
Gold | g/tonne | 2.55 | 2.88 | 2.35 | 2.70 | 2.28 | 2.13 | 2.60 | 2.12 | 2.08 | 1.75 | 2.15 | 2.09 |
Silver | g/tonne | 25.37 | 24.43 | 22.08 | 28.72 | 26.28 | 25.48 | 28.12 | 25.16 | 22.03 | 26.89 | 25.27 | 24.58 |
Copper recovery | % | 86.2 | 87.1 | 84.0 | 86.6 | 86.5 | 85.9 | 85.9 | 84.4 | 85.6 | 87.2 | 85.7 | 88.6 |
Zinc recovery | % | 91.9 | 90.9 | 92.7 | 92.4 | 91.4 | 91.1 | 90.7 | 91.8 | 91.2 | 90.7 | 92.8 | 91.9 |
Gold recovery | % | 60.0 | 59.5 | 57.4 | 62.3 | 60.9 | 56.8 | 61.1 | 54.3 | 52.5 | 59.1 | 57.6 | 57.1 |
Silver recovery | % | 60.4 | 60.3 | 57.5 | 62.1 | 61.1 | 60.4 | 62.9 | 57.4 | 56.5 | 64.2 | 59.2 | 60.7 |
Flin Flon Concentrator: | | | | | | | | | | | | |
Ore milled | tonnes | 1,205,314 | | 225,663 | | 322,156 | | 324,906 | | 332,589 | | 1,362,006 | | 374,529 | | 331,216 | | 367,017 | | 289,244 | | 1,423,744 | | 259,569 | |
Copper | % | 1.28 | 1.59 | 0.99 | 1.52 | 1.11 | 1.27 | 1.11 | 1.22 | 1.26 | 1.55 | 1.90 | 1.73 |
Zinc | % | 4.21 | 3.87 | 4.07 | 4.41 | 4.36 | 3.78 | 4.05 | 3.64 | 3.84 | 3.49 | 3.71 | 3.55 |
Gold | g/tonne | 1.96 | 1.99 | 1.99 | 1.99 | 1.88 | 1.72 | 1.75 | 1.74 | 1.71 | 1.66 | 1.63 | 1.62 |
Silver | g/tonne | 24.26 | 22.65 | 24.01 | 25.56 | 24.33 | 19.84 | 20.56 | 17.36 | 19.82 | 21.78 | 23.48 | 24.79 |
Copper recovery | % | 86.0 | 88.1 | 83.9 | 87.3 | 84.1 | 88.0 | 86.9 | 89.1 | 88.0 | 88.1 | 92.3 | 90.4 |
Zinc recovery | % | 85.5 | 83.9 | 87.9 | 84.9 | 85.0 | 85.5 | 85.8 | 86.7 | 86.0 | 82.9 | 84.2 | 83.7 |
Gold recovery | % | 56.0 | 56.6 | 55.3 | 58.6 | 53.5 | 59.4 | 56.1 | 59.1 | 61.3 | 61.8 | 64.5 | 62.8 |
Silver recovery | % | 45.9 | 46.5 | 42.0 | 50.7 | 44.3 | 50.8 | 49.2 | 48.7 | 53.0 | 52.3 | 60.2 | 54.8 |
1 Mining activities at Reed were completed in August 2018. |
| | 2020 | 2019 | 2018 |
| | 2020 | Q4 | Q3 | Q2 | Q1 | 2019 | Q4 | Q3 | Q2 | Q1 | 2018 | Q4 |
Manitoba Operations (continued) | | | | | | | | | | | | |
Total Manitoba contained metal in concentrate produced | | | | | | | | | | |
Copper | tonnes | 22,183 | | 5,724 | | 4,592 | | 6,522 | | 5,345 | | 23,354 | | 5,763 | | 5,331 | | 6,131 | | 6,129 | | 32,272 | | 6,404 | |
Zinc | tonnes | 118,130 | | 25,843 | | 30,570 | | 31,222 | | 30,495 | | 119,106 | | 30,592 | | 28,639 | | 31,838 | | 28,037 | | 115,588 | | 27,408 | |
Gold | ounces | 112,227 | | 28,687 | | 25,944 | | 30,303 | | 27,293 | | 94,969 | | 27,705 | | 22,754 | | 24,305 | | 20,205 | | 95,693 | | 20,529 | |
Silver | ounces | 1,127,901 | | 252,904 | | 241,477 | | 327,130 | | 306,390 | | 1,080,561 | | 298,363 | | 237,933 | | 260,000 | | 284,265 | | 1,224,610 | | 263,937 | |
Precious metals1 | ounces | 124,900 | | 31,529 | | 28,657 | | 33,979 | | 30,736 | | 110,406 | | 31,967 | | 26,153 | | 28,019 | | 24,266 | | 113,188 | | 24,300 | |
Total Manitoba payable metal sold | | | | | | | | | | | | |
Copper | tonnes | 20,382 | | 4,380 | | 4,249 | | 6,928 | | 4,825 | | 22,335 | | 5,285 | | 4,602 | | 7,393 | | 5,055 | | 31,474 | | 5,098 | |
Zinc2 | tonnes | 109,347 | | 28,431 | | 26,520 | | 27,604 | | 26,792 | | 104,346 | | 28,001 | | 29,140 | | 24,224 | | 22,954 | | 115,723 | | 31,134 | |
Gold | ounces | 111,963 | | 31,882 | | 26,852 | | 29,273 | | 23,956 | | 90,043 | | 25,520 | | 21,630 | | 26,482 | | 16,411 | | 92,677 | | 18,599 | |
Silver | ounces | 1,067,038 | | 281,541 | | 271,900 | | 299,266 | | 214,331 | | 1,000,430 | | 242,584 | | 227,157 | | 300,042 | | 230,647 | | 1,116,653 | | 236,744 | |
Manitoba combined unit operating cost3,4 | C$/tonne | $ | 132 | | $ | 140 | | $ | 126 | | $ | 135 | | $ | 127 | | $ | 134 | | $ | 128 | | $ | 130 | | $ | 135 | | $ | 146 | | $ | 130 | | $ | 143 | |
Manitoba cash cost4 | $/lb | $ | (2.20) | | $ | (3.48) | | $ | (3.41) | | $ | (1.52) | | $ | (0.62) | | $ | (0.75) | | $ | (1.26) | | $ | (1.31) | | $ | (0.79) | | $ | 0.29 | | $ | (1.16) | | $ | (1.47) | |
Manitoba sustaining cash cost4 | $/lb | $ | 1.02 | | $ | (0.36) | | $ | 0.83 | | $ | 1.15 | | $ | 2.53 | | $ | 2.07 | | $ | 1.83 | | $ | 2.15 | | $ | 1.55 | | $ | 2.68 | | $ | 0.66 | | $ | 1.16 | |
1 Precious metals production includes gold and silver production on a gold-equivalent basis. For 2018 and 2019, silver is converted to gold at a ratio of 70:1. For 2020, silver is converted to gold at a ratio of 89:1. |
2 Includes refined zinc metal sold. |
3 Reflects combined mine, mill and G&A costs per tonne of milled ore. |