
Management's Discussion and Analysis of
Results of Operations and Financial Condition
For the three months ended
March 31, 2021
May 11, 2021
INTRODUCTION
This Management's Discussion and Analysis ("MD&A") dated May 11, 2021 is intended to supplement Hudbay Minerals Inc.'s unaudited condensed consolidated interim financial statements and related notes for the three months ended March 31, 2021 and 2020 (the "consolidated interim financial statements"). The consolidated interim financial statements have been prepared in accordance with International Financial Reporting Standards ("IFRS"), including International Accounting Standard 34, Interim Financial Reporting, as issued by the International Accounting Standards Board ("IASB").
References to "Hudbay", the "Company", "we", "us", "our" or similar terms refer to Hudbay Minerals Inc. and its direct and indirect subsidiaries as at March 31, 2021.
Readers should be aware that:
- This MD&A contains certain "forward-looking statements" and "forward-looking information" (collectively, "forward-looking information") that are subject to risk factors set out in a cautionary note contained in our MD&A.
- This MD&A includes an updated discussion of the risks associated with the COVID-19 pandemic and its effect on our operations, financial condition, projects and prospects, and supplements the discussion of these risks in our most recent Annual Information Form ("AIF").
- This MD&A has been prepared in accordance with the requirements of the securities laws in effect in Canada, which may differ materially from the requirements of United States securities laws applicable to US issuers.
- We use a number of non-IFRS financial performance measures in our MD&A.
- The technical and scientific information in this MD&A has been approved by qualified persons based on a variety of assumptions and estimates.
- This MD&A includes the results of Hudbay's preliminary economic assessment of the Mason project, which includes inferred mineral resources and is subject to the cautionary note contained in our MD&A.
For a discussion of each of the above matters, readers are urged to review the "Notes to Reader" discussion beginning on page 52 of this MD&A and to carefully review the risks associated with the COVID-19 pandemic that are discussed throughout this MD&A.
Additional information regarding Hudbay, including the risks related to our business and those that are reasonably likely to affect our financial statements in the future, is contained in our continuous disclosure materials, including our most recent AIF, consolidated interim financial statements and Management Information Circular available on SEDAR at www.sedar.com and on EDGAR at www.sec.gov.
All amounts are in US dollars unless otherwise noted.
OUR BUSINESS
We are a diversified mining company primarily producing copper concentrate (containing copper, gold, and silver), molybdenum concentrate and zinc metal. Directly and through our subsidiaries, we own three polymetallic mines, four ore concentrators and a zinc production facility in northern Manitoba and Saskatchewan (Canada) and Cusco (Peru), and copper projects in Arizona and Nevada (United States). Our growth strategy is focused on the exploration, development, operation, and optimization of properties we already control, as well as other mineral assets we may acquire that fit our strategic criteria. Our vision is to be a responsible, top-tier operator of long-life, low-cost mines in the Americas. We are governed by the Canada Business Corporations Act and our shares are listed under the symbol "HBM" on the Toronto Stock Exchange, New York Stock Exchange and Bolsa de Valores de Lima.
SUMMARY
First Quarter Operating and Financial Results
- Consolidated copper production in the first quarter was 24,553 tonnes at cash cost and sustaining cash cost per pound of copper produced, net of by-product credits, of $1.04 and $2.16, respectively. Consolidated gold production in the first quarter was 35,500 ounces, a record for Hudbay.
- Full year 2021 production and operating cost guidance reaffirmed; Pampacancha production commenced in April 2021, in line with guidance.
- First quarter Manitoba copper production significantly increased from 2020 levels primarily due to higher grades at 777 and higher recoveries at the Flin Flon concentrator; sales volumes were impacted by the availability of railcars during the quarter with 5,000 tonnes of copper concentrate inventory in excess of normal operating levels, valued at approximately $18 million.
- First quarter Peru sales impacted by a 10,000 tonne shipment of copper concentrate, valued at approximately $21 million, for which a payment was received but not recorded as revenue due to the timing of the shipment being delayed to early April. Peru's production in the first quarter was impacted by increased ore hardness as well as a semi-annual scheduled plant shutdown in January.
- First quarter net loss and loss per share were $60.1 million and $0.23, respectively. After adjusting for one-time financing charges mainly related to the redemption of the 2025 senior notes and a revaluation of the gold prepayment liability, first quarter adjusted net loss1 per share was $0.06. First quarter adjusted EBITDA1 was $104.2 million.
- Operating cash flow before change in non-cash working capital increased to $90.7 million in the first quarter of 2021, from $42.0 million in the same quarter of 2020 due to higher realized metal prices and higher zinc sales volumes, partially offset by lower sales volumes of copper and precious metals.
- Cash and cash equivalents decreased during the first quarter to $310.6 million, as at March 31, 2021 mainly as a result of $83.0 million of capital investments primarily for the New Britannia project and Pampacancha development activities, $50.8 million of interest payments and $31.0 million in net transaction and early redemption costs related to the refinancing of our 2025 notes, partially offset by cash generated from operations.
Executing on Growth Initiatives
- Announced three-year production guidance; consolidated copper and gold production are expected to increase by 36% and 125%2, respectively, by 2023 from 2020 levels as we bring the Pampacancha and New Britannia growth projects into production.
- Finalized the remaining land user agreement for Pampacancha in early April 2021. This provided us with full access to the site to complete pit development and commence first ore production in late April, in line with timelines assumed in our updated mine plan. Total 2021 growth capital guidance for Peru has increased to $25 million to include the final land user costs.
- New Britannia project continues to track ahead of the original schedule and is nearing completion, with approximately 82% of the project completed at the end of April; first gold production continues to be expected early in the third quarter and the new copper flotation facility remains on track for commissioning and ramp-up in the fourth quarter of 2021.
- Announced a year-over-year increase to total mineral reserves of approximately 170,000 tonnes of contained copper and 360,000 ounces of contained gold, after adjusting for 2020 mining depletion.
- Announced an updated Constancia mine plan resulting in an increase in average annual copper production to approximately 102,000 tonnes over the next eight years at an average cash cost of $1.18 per pound of copper produced, net of by-product credits.
- Announced an updated Lalor and Snow Lake mine plan resulting in an increase in annual gold production to over 180,000 ounces during the first six years of New Britannia's operation at an average cash cost of $412 per ounce of gold produced, net of by-product credits.
- Announced a significant new discovery at our Copper World properties adjacent to Rosemont on wholly-owned private land. Four deposits have been identified to date with a combined strike length of over five kilometres consisting of high-grade copper sulphide and oxide mineralization at shallow depth. The follow-up 2021 exploration program has been expanded to further test the potential for additional mineralization, develop an initial inferred resource estimate and complete a preliminary economic assessment. As a result, we have increased our 2021 spending on Copper World by approximately $24 million.
- Announced a preliminary economic assessment ("PEA") for our Mason copper project with a 27-year mine life and average annual copper production of approximately 140,000 tonnes over the first ten years of full production. The PEA indicates an after-tax net present value3 of $519 million and approximately 14% internal rate of return at $3.10 per pound copper, which increases to $773 million and approximately 15%, respectively, at $3.25 per pound copper.
- Issued $600.0 million of 4.5% senior notes due 2026 and redeemed all of our outstanding $600.0 million of 7.625% senior notes due 2025, thereby reducing our annual cash interest payments.
- On May 10, 2021, an amendment to the Constancia streaming agreement was signed with Wheaton Precious Metals ("Wheaton"). The amendment eliminates the requirement to deliver an additional 8,020 ounces of gold to Wheaton for not mining four million tonnes of ore from the Pampacancha deposit by June 30, 2021, while increasing the fixed gold recovery applied to Constancia ore processed during the reserve life of Pampacancha and introduces an additional potential future deposit of $4 million from Wheaton.
Summary of First Quarter Results
Cash generated from operating activities in the first quarter of 2021 increased to $51.8 million compared to $9.1 million in the same quarter of 2020. Operating cash flow before change in non-cash working capital was $90.7 million during the first quarter of 2021, reflecting an increase of $48.7 million compared to the same period of 2020. The increase in operating cash flow is primarily the result of higher realized metal prices and higher zinc sales volumes, partially offset by lower sales volumes of copper and precious metals.
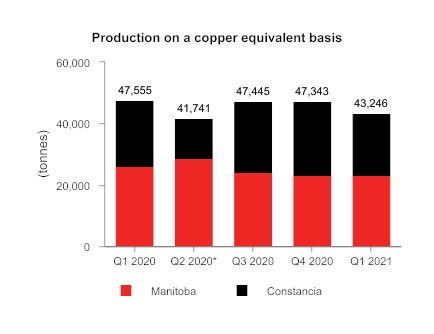
Consolidated copper-equivalent production in the first quarter of 2021 decreased by 9% compared to the same period in 2020 primarily as a result of lower copper grades and a scheduled semi-annual mill maintenance shutdown at Constancia, partially offset by higher copper and gold grades and recoveries in Manitoba during the quarter.
Net loss and loss per share in the first quarter of 2021 were $60.1 million and $0.23, respectively, compared to a net loss and loss per share of $76.1 million and $0.29, respectively, in the first quarter of 2020. First quarter earnings benefited from higher realized prices for all metals, combined with higher sales volumes of zinc which was partially offset by lower sales volumes of copper and precious metals due to the timing of sales in Peru and a buildup of copper concentrate in Manitoba caused by limited railcar availability. First quarter results included a $12.5 million non-cash gain on the revaluation of the gold prepayment liability but were negatively impacted by charges related to the refinancing of the 2025 senior notes, including a non-cash write off of $49.8 million connected with the exercise of the redemption option, a call premium payment of $22.9 million and a non-cash expense of unamortized transaction costs of $2.5 million in relation to the 2025 notes that were redeemed. A variable consideration adjustment to deferred gold and silver revenue resulted in a net increase to revenue of $1.6 million.
Adjusted net loss1 and adjusted net loss per share1 in the first quarter of 2021 were $16.1 million and $0.06 per share after adjusting for the finance charges and the net mark-to-market loss on financial instruments, among other items. This compares to an adjusted net loss and adjusted net loss per share of $39.3 million, and $0.15 per share in the same period of 2020. First quarter adjusted EBITDA1 was $104.2 million, compared to $55.0 million in the same period of 2020.
First quarter Peru sales were impacted by a 10,000 tonne shipment of copper concentrate valued at approximately $21 million for which a payment was received but did not meet the revenue recognition criteria due to the delayed timing of the shipment into early April. First quarter Manitoba sales were impacted by a delay in accessing additional railcars after a strong copper production quarter resulting in approximately 5,000 tonnes of copper concentrate inventory in excess of normal operating levels, valued at approximately $18 million. Had both parcels of copper concentrate been sold during the first quarter, we would have realized approximately $39 million of incremental revenue, assuming end of quarter commodity prices. The above quantities have been recognized as revenue in the second quarter of 2021. First quarter results were also negatively impacted by the realized copper price hedging of our provisionally priced copper sales.
As at March 31, 2021, our liquidity includes $310.6 million in cash and cash equivalents as well as undrawn availability of $293.9 million under our Credit Facilities. We expect that our current liquidity together with cash flows from operations will be sufficient to meet our liquidity needs for 2021.
*Reflects Constancia temporary suspension of operations in April and May of 2020.
1 Adjusted net loss and adjusted net loss per share, adjusted EBITDA, cash cost, all-in sustaining cash cost per pound of copper produced, net of by-product credits, and net debt are non-IFRS financial performance measures with no standardized definition under IFRS. For further information and a detailed reconciliation, please see the discussion under the "Non-IFRS Financial Reporting Measures" section of this MD&A.
2 Copper and gold production growth based on mid-point of 2023 guidance ranges and 2020 actual production of 95,333 tonnes of copper and 124,622 ounces of gold. 2020 levels were partially impacted by an eight-week temporary mine interruption related to a government-declared state of emergency.
3 Based on a 10% discount rate.
KEY FINANCIAL RESULTS
| Financial Condition | | Mar. 31, 2021 | | | Dec. 31, 2020 | |
| (in $ thousands) |
| Cash and cash equivalents | $ | 310,564 | | $ | 439,135 | |
| Total long-term debt | | 1,180,798 | | | 1,135,675 | |
| Net debt1 | | 870,234 | | | 696,540 | |
| Working capital | | 236,281 | | | 306,888 | |
| Total assets | | 4,549,196 | | | 4,666,645 | |
| Equity | | 1,660,250 | | | 1,699,806 | |
| 1 Net debt is a non-IFRS financial performance measure with no standardized definition under IFRS. For further information and a detailed reconciliation, please see discussion under the "Non-IFRS Financial Reporting Measures" section of this MD&A. | |
| Financial Performance | | Three months ended | |
| (in $ thousands, except per share amounts) | | Mar. 31, 2021 | | Mar. 31, 2020 | |
| Revenue | $ | 313,624 | | $ | 245,105 | |
| Cost of sales | | 261,112 | | | 267,096 | |
| Loss before tax | | (69,592 | ) | | (81,452 | ) |
| Net (loss) profit | | (60,102 | ) | | (76,134 | ) |
| Basic and diluted loss per share | | (0.23 | ) | | (0.29 | ) |
| Adjusted loss per share1 | | (0.06 | ) | | (0.15 | ) |
| Operating cash flow before change in non-cash working capital2 | | 90.7 | | | 42.0 | |
| Adjusted EBITDA1,2 | | 104.2 | | | 55.0 | |
| 1 Adjusted loss per share and adjusted EBITDA are non-IFRS financial performance measures with no standardized definition under IFRS. For further information and a detailed reconciliation, please see discussion under the "Non-IFRS Financial Reporting Measures" section of this MD&A. |
| 2 In millions. |
In the first quarter of 2021, consolidated cash cost per pound of copper produced, net of by-product credits1, was $1.04, compared to $0.98 in the same period in 2020. This increase was a result of higher Peru milling costs related to a scheduled January 2021 plant shutdown, thus resulting in lower production in Peru, and higher mining costs in Manitoba due to stockpiling of gold ore in preparation for the mid-year startup of New Britannia, partially offset by higher zinc by-product credits. We expect our consolidated cash cost per pound of copper produced, net of by-product credits to decline in subsequent quarters in line with our 2021 guidance.
Sustaining cash cost per pound of copper produced, net of by-product credits1 increased to $2.16 in the first quarter of 2021 from $2.05 in the same period in 2020 primarily due to the same reasons. Incorporating sustaining capital, capitalized exploration, royalties, selling, administrative and regional costs, consolidated all-in sustaining cash cost per pound of copper produced, net of by-product credits1, in the first quarter of 2021 was $2.37, which increased from $2.17 in the same period last year primarily due to the same reasons and higher corporate general and administrative costs due to higher stock-based compensation expense.
KEY PRODUCTION RESULTS
| Three months ended | Three months ended |
Mar. 31, 2021 | Mar. 31, 2020 |
Peru | Manitoba | Total | Peru | Manitoba | Total |
Contained metal in concentrate produced 1 | | | | | |
Copper | tonnes | 17,827 | | 6,726 | | 24,553 | | 19,290 | | 5,345 | | 24,635 | |
Gold | oz | 4,638 | | 30,862 | | 35,500 | | 3,062 | | 27,293 | | 30,355 | |
Silver | oz | 405,714 | | 290,959 | | 696,673 | | 461,302 | | 306,390 | | 767,692 | |
Zinc | tonnes | - | | 27,940 | | 27,940 | | - | | 30,495 | | 30,495 | |
Molybdenum | tonnes | 294 | | - | | 294 | | 354 | | - | | 354 | |
Payable metal sold | | | | | | |
Copper | tonnes | 14,836 | | 6,093 | | 20,929 | | 19,247 | | 4,825 | | 24,072 | |
Gold | oz | 2,963 | | 22,420 | | 25,383 | | 2,618 | | 23,956 | | 26,574 | |
Silver | oz | 337,612 | | 172,148 | | 509,760 | | 361,591 | | 214,331 | | 575,922 | |
Zinc 2 | tonnes | - | | 28,343 | | 28,343 | | - | | 26,792 | | 26,792 | |
Molybdenum | tonnes | 284 | | - | | 284 | | 431 | | - | | 431 | |
1 Metal reported in concentrate is prior to deductions associated with smelter contract terms. |
2 Includes refined zinc metal sold and payable zinc in concentrate sold. |
KEY COST RESULTS
| | Three months ended | Three months ended | Guidance |
| | Mar. 31, 2021 | Mar. 31, 2020 | Annual 2021 |
Consolidated cash cost per pound of copper produced1 | | |
Cash cost 1 | $/lb | 1.04 | 0.98 | 0.65 - 0.80 |
Peru | $/lb | 1.82 | 1.42 | |
Manitoba | $/lb | (1.04) | (0.62) | |
Sustaining cash cost 1 | $/lb | 2.16 | 2.05 | 2.05 - 2.30 |
Peru | $/lb | 2.36 | 1.91 | |
Manitoba | $/lb | 1.62 | 2.54 | |
All-in sustaining cash cost1 | $/lb | 2.37 | 2.17 | |
Combined mine/mill unit operating cost per tonne of copper processed1,2 | |
Peru3 | $/tonne | 12.46 | 9.31 | 8.90 - 10.90 |
Manitoba | C$/tonne | 151 | 127 | 145 - 155 |
Zinc Plant unit operating cost per tonne of zinc processed1,2 | |
Unit operating costs | C$/lb | 0.51 | 0.49 | 0.50 - 0.55 |
1 Cash cost, sustaining cash cost, all-in sustaining cash cost per pound of copper produced, net of by-product credits and unit operating cost are non-IFRS financial performance measures with no standardized definition under IFRS. For further information and a detailed reconciliation, please see the discussion under the "Non-IFRS Financial Reporting Measures" section of this MD&A. |
2 Reflects combined mine, mill and G&A costs per tonne of milled ore. Peru costs reflect the deduction of expected capitalized stripping costs. |
3 Includes approximately $4.6 million, or $0.72 per tonne, of COVID-related costs during the first quarter of 2021. |
4 Zinc plant unit operating costs include G&A costs per pound of zinc processed. |
RECENT DEVELOPMENTS
COVID-19 Business Update
The COVID-19 pandemic continues to have a significant global impact as we mark the one-year anniversary of the global outbreak. Throughout this time, we have prioritized the health and safety of our people by adapting our processes and procedures based on the local situation and taking proactive measures to prevent or minimize the spread of COVID-19 within our workplaces.
As cases of COVID-19 remain elevated in Peru and continue to rise near our operations in Manitoba, we have experienced limited transmission at both of our operations. We have responded to these events quickly and have worked collaboratively with local health authorities to contain outbreaks while strengthening preventative measures at the workplace with negligible production or financial impacts. We believe we are appropriately enhancing our preventative and monitoring activities as the challenges of the pandemic evolve, but we remain at increased operational risk. We continue to monitor the risks of the pandemic at each of our locations to ensure the safety of our workforce, their families, and the communities in which we operate.
Increased Constancia Reserves and Updated Mine Plan
On March 29, 2021, we released an updated mine plan for our Constancia operations that reflects an increase in copper and gold production from 2022 to 2025 as the higher grades from the Pampacancha deposit enter the mine plan. The updated mine plan incorporates higher-grade reserves from the Constancia North pit extension, which contributed to an increase in reserves of 33 million tonnes at a grade of 0.48% copper and 0.115 grams per tonne gold and extends the higher grade profile to 2028. This resulted in an increase of approximately 11% in contained copper and 12% in contained gold over the prior year's reserves, after adjusting for mining depletion in 2020.
With the incorporation of Pampacancha and Constancia North, annual production at Constancia is expected to average approximately 102,000 tonnes of copper and 58,000 ounces of gold over the next eight years, an increase of 40% and 367%, respectively, from 2020 levels, which were partially impacted by an eight-week temporary mine interruption related to a government-declared state of emergency. Constancia's total copper and gold production increases by 12% and 9%, respectively, compared to the same period in the Company's previous technical report. Constancia maintains its low-cost profile with average cash cost and sustaining cash cost of $1.18 and $1.71, respectively, per pound of copper produced, net of by-product credits, over the next eight years.
New Britannia Mill Refurbishment Update and Snow Lake Updated Mine Plan
The New Britannia project continues to track ahead of the original schedule and is nearing completion with approximately 82% of the project completed at the end of April. Commissioning of the gold plant is expected in mid-2021 with first gold production expected early in the third quarter. The new copper flotation facility is on track for commissioning and ramp-up in the fourth quarter of 2021. Operational readiness activities are progressing as planned with underground development of Lalor's gold-rich lenses well-advanced in preparation for the start-up of New Britannia. We continue to see some COVID-related cost pressures on the project capital estimate at New Britannia.
On March 29, 2021, we announced that we have advanced the third phase of our Snow Lake gold strategy focusing on expansion and further optimization of operations. Various mining and milling optimization opportunities have been incorporated into an updated mine plan, which contemplates an increase in annual gold production from Lalor and the Snow Lake operations from approximately 150,000 ounces to over 180,000 ounces during the first six years of New Britannia's operation at cash cost and sustaining cash cost, net of by-product credits, of $412 and $788 per ounce of gold, respectively. Mineral reserves increased year-over-year, which resulted in no change to Snow Lake's mine life (to 2037) as we accelerated future reserves with a higher production rate at Lalor and Stall. This enhanced mine plan incorporates the results from several optimization initiatives, including:
• Early gold production at New Britannia expected in the third quarter of 2021, ahead of the original schedule;
• Increasing the Lalor mining rate to 5,300 tonnes per day from 4,500 tonnes per day in the previous mine plan, which is expected to begin after the 777 mine closes in mid-2022;
• Adding the 1901 deposit to the mine plan to include 1.58 million tonnes of reserves at a grade of 7.9% zinc, with production expected to commence in 2026 at a rate of approximately 1,000 tonnes per day;
• Higher throughput at Stall to achieve a rate of 3,800 tonnes per day compared to 3,500 tonnes per day in the previous mine plan; and
• Starting in 2023, increased copper and precious metal recoveries at Stall, where capital upgrades of $19 million are expected to increase Stall's copper recoveries to between 91% and 95%, gold recoveries to between 64% and 70%, and silver recoveries to between 65% and 74%, a significant increase from the assumed recoveries in the previous mine plan of 84% copper, 53% gold and 53% silver.
These mine plan enhancements optimize the processing capacity of the Snow Lake operations in a manner that maximizes the net present value of the operations. As a result of these initiatives, the production of gold, copper and silver are expected to increase by 18%, 35% and 27%, respectively, from 2022 to 2027 compared to the previous mine plan.
Pampacancha First Production Achieved
In early April 2021, the Company finalized the remaining land user agreement for Pampacancha and gained full access to the site to complete pit development activities. Blasting began in mid-April and first production from Pampacancha was achieved at the end of April, which is consistent with Hudbay's previous 2021 guidance and recently published mine plan. As a result of the completion of the individual land user agreements, revised growth capital expenditure guidance for Peru has increased to approximately $25 million in 2021.
Growing Near-term Production Outlook
On March 29, 2021, we announced our updated three-year production outlook. Consolidated copper and gold production are expected to increase to 129,500 tonnes and 280,000 ounces, respectively, in 2023, which represents an increase of 36% and 125%, respectively, from 2020 levels as we bring the Pampacancha and New Britannia projects into production. These growth projects more than offset the lost copper and gold production from 777 after its closure in mid-2022.
Rosemont Update
The appeal of the unprecedented Rosemont court decision with the U.S. Court of Appeals for the Ninth Circuit continues with a decision expected in the second half of 2021. In March 2021, the U.S. Army Corps of Engineers (the "Corps") granted an approved jurisdictional determination whereby the Corps determined there are no waters of the United States on the Rosemont property, and therefore, Rosemont does not require a Section 404 Water Permit.
Expanded Exploration Program at Copper World Discovery
On March 29, 2021, we announced the intersection of high-grade copper sulphide and oxide mineralization at shallow depth on our wholly-owned private land located within seven kilometres of our Rosemont copper project in Arizona. A 40,000-foot drill program was initiated in 2020 to confirm historical drilling in this past-producing copper region formerly known as Helvetia. After receiving encouraging initial results in February 2021, we launched a larger 70,000-foot drill program and increased the number of drill rigs at site to further test the four deposits at Copper World and the potential for additional mineralization.
Our 2020 drill program confirmed the discovery of the Broad Top Butte, Copper World, Peach and Elgin deposits, with a combined strike length of over five kilometres and opportunities to discover additional mineralization between the deposits. The program intersected significant volumes of high-grade copper sulphide and oxide mineralization starting, in most cases, near surface or at shallow depth. Drilling at Broad Top Butte included intersections of 440 feet of 1.38% copper and 246 feet of 0.70% copper starting at surface. Drilling at the Peach and Eglin deposits included intersections of 500 feet of 0.82% copper and 300 feet of 0.64% copper, both starting from surface. The mineralization at the Copper World deposits is located closer to surface than at Rosemont and remains open at depth.
Given the continued success from the Copper World exploration program, in April 2021, we increased the 2021 budget by approximately $24 million, which includes approximately $14 million for additional exploration expenditures and approximately $10 million of operational expenses related to further studies, none of which will be capitalized.
The additional exploration activities are expected to include resource definition drilling and testing targets on our private land. The additional studies relate to planned hydrogeological, geotechnical and other studies to potentially support future economic assessments and mine plans. Mineralogical studies and metallurgical testing have also been initiated and are expected to continue in the coming months. Geophysical surveys have been completed and are being analyzed to identify further targets on our private land package. Depending on the exploration program results, we expect to complete an initial inferred resource estimate before the end of the year and a preliminary economic assessment in the first half of 2022.
Increased Resource Estimate and Positive Preliminary Economic Assessment at Mason
The Mason project is our 100%-owned greenfield copper deposit located in the historic Yerington District of Nevada and is one of the largest undeveloped copper porphyry deposits in North America. In March 2021, we announced our first compiled resource estimate for the Mason project based on a resource model constructed using the same methods applied at Constancia. This resulted in a measured and indicated resource estimate of 2.2 billion tonnes at 0.29% copper, which increased from 1.4 billion tonnes at 0.32% copper previously.
The recently completed PEA contemplates a 27-year mine life with average annual copper production of approximately 140,000 tonnes over the first ten years of full production. The mine plan assumes the construction of a 120,000 tonnes per day conventional flotation concentrator and an initial capital cost estimate of approximately $2.1 billion. At a copper price of $3.10 per pound, the after-tax net present value using a 10% discount rate is $519 million and the internal rate of return is approximately 14%. The valuation metrics are highly sensitive to the copper price and at a price of $3.25 per pound, the after-tax net present value using a 10% discount rate increases to $773 million and the internal rate of return increases to approximately 15%.
There remain opportunities to further enhance the project economics through exploration for higher grade satellite deposits on our prospective land package in Nevada, including the Mason Valley properties. Much of the Mason Valley property is located on our wholly owned private lands and contains highly prospective skarn mineralization in an area that hosts several historical underground copper mines. Historical drilling and production records from the past producing mines at Mason Valley indicate the mineralization is high grade and starts at or near surface, similar to our Copper World property in Arizona. The Company expects to continue to compile and interpret historical data on its land package near Mason, to be followed by a geophysical survey to refine the exploration targets in preparation for a future drilling campaign.
Other Exploration Update
Constancia Regional Exploration
In addition to increasing Constancia's reserves, the Constancia North discovery also contributed to an improvement in the head grade of the Constancia mine mineral resource estimates: measured and indicated copper grades increased to 0.22% from 0.19% and inferred copper grades increased to 0.30% from 0.18%. A significant portion of the Constancia North resource estimate is classified as inferred due to wide drill spacing but there remains the opportunity to upgrade these inferred resources to a higher classification as we complete infill drilling. There also remains further opportunity to extend the Constancia North resources by incorporating steeply dipping high-grade skarn mineralization through a potential underground operation and a trade-off study between open pit versus underground development is expected to be completed in 2021. The mineralization remains open down plunge to the north.
We continue to advance regional exploration programs in Peru. In February 2021, we commenced drilling on the Quehuincha North high-grade skarn target located approximately 10 kilometres from Constancia, and drilling continues with five holes completed to-date. Discussions continue to progress with the community of Uchucarcco on the Maria Reyna and Caballito properties, both of which are located within ten kilometres of Constancia, and we expect to reach an agreement this year. We also expect to commence drilling activities at the Llaguen property in the coming weeks. Llaguen is a copper porphyry target located in northern Peru, near the city of Trujillo and in close proximity to existing infrastructure.
Snow Lake Regional Exploration
Exploration efforts at the Lalor mine in 2020 continued to be successful with the definition of an additional 1.8 million tonnes of mineral resources, increasing total inferred mineral resources at Lalor to 6.2 million tonnes. The inferred resources have the potential to extend the Lalor mine life beyond the current estimate of ten years and maintain the 5,300 tonnes per day production level beyond 2027.
Preliminary results from our 2021 winter drill program in the Chisel Basin in Snow Lake indicate that a potential copper-gold feeder zone to the 1901 deposit exists with one hole intersecting 11.6 metres at 2.7% copper and 3.4 grams per tonne gold, which is similar to the known geology at the Lalor deposit. A review is underway to determine next steps for exploration at 1901 and whether it will be best conducted from surface or from underground once development of the deposit has commenced and suitable drill platforms can be established. We also continue to test other targets within the Chisel Basin.
Senior Unsecured Notes Refinancing
On March 8, 2021, we completed the offering of $600.0 million aggregate principal amount of 4.5% senior notes due April 2026 (the "New Notes"). The New Notes are governed by an indenture, dated as of March 8, 2021, among the Company, the subsidiaries of the Company party thereto as guarantors and U.S. Bank National Association, as trustee.
The proceeds from this offering, together with available cash on hand, were used to redeem all $600.0 million of our outstanding 7.625% senior notes due 2025 (the "Redeemed Notes"), including the payment of accrued and unpaid interest and $31.0 million in net transaction and early redemption costs associated with the New Notes. The lower interest rate on the New Notes, versus the rate on the Redeemed Notes, will result in reduced cash interest payments of almost $19 million annually.
Collective Bargaining Agreements
The collective bargaining agreements with the unionized workforces at each of our Peru and Manitoba operations expired on or about December 31, 2020. We continue to advance the collective bargaining process with the labour unions in each jurisdiction as we work toward renewing the collective agreements.
Wheaton Agreement Amendment related to Pampacancha Delivery Obligation
On May 10, 2021, an amendment to the Constancia streaming agreement was signed with Wheaton. The amendment eliminates the requirement to deliver an additional 8,020 ounces of gold to Wheaton for not mining four million tonnes of ore from the Pampacancha deposit by June 30, 2021. As part of this amendment, Hudbay has agreed to increase the fixed gold recoveries that apply to Constancia ore production from 55% to 70% during the reserve life of Pampacancha, which matches the fixed rate of recovery that applies to Pampacancha production. In addition, if Hudbay mines and processes four million tonnes of ore from the Pampacancha deposit by December 31, 2021, Wheaton will make an additional deposit payment of $4 million.
CONSTANCIA OPERATIONS REVIEW
| Three months ended | Guidance |
Mar. 31, 2021 | Mar. 31, 2020 | Annual |
2021 |
Ore mined 1 | tonnes | 7,747,466 | 6,985,212 | |
Copper | % | 0.30 | 0.34 | |
Gold | g/tonne | 0.04 | 0.03 | |
Silver | g/tonne | 2.90 | 3.10 | |
Molybdenum | % | 0.01 | 0.02 | |
| | | | |
Ore milled | tonnes | 6,362,752 | 6,719,466 | |
Copper | % | 0.33 | 0.34 | |
Gold | g/tonne | 0.04 | 0.03 | |
Silver | g/tonne | 2.84 | 3.13 | |
Molybdenum | % | 0.01 | 0.02 | |
| | | | |
Copper concentrate | tonnes | 77,960 | 84,015 | |
Concentrate grade | % Cu | 22.87 | 22.96 | |
| | | | |
Copper recovery | % | 84.1 | 84.3 | |
Gold recovery | % | 52.0 | 50.2 | |
Silver recovery | % | 69.9 | 68.2 | |
Molybdenum recovery | % | 33.4 | 35.0 | |
| | | | |
Combined unit operating costs2.3,4 | $/tonne | 12.46 | 9.31 | 8.90 - 10.90 |
1 Reported tonnes and grade for ore mined are estimates based on mine plan assumptions and may not reconcile fully to ore milled. |
2 Reflects combined mine, mill and general and administrative ("G&A") costs per tonne of ore milled. Reflects the deduction of expected capitalized stripping costs. |
3 Combined unit costs is a non-IFRS financial performance measure with no standardized definition under IFRS. For further information and a detailed reconciliation, please see the discussion under the "Non-IFRS Financial Reporting Measures" section of this MD&A. |
4 Includes approximately $4.6 million, or $0.72 per tonne, of COVID-related costs during the first quarter of 2021. |
The Constancia team continues to effectively operate in an environment of strict COVID-19 measures and controls. We continue to work collaboratively with the local health authorities to ensure our workforce and partners adhere to COVID-19 protocols while continuing to operate safely and efficiently. Full year production of all metals and unit operating costs at Constancia are on track to achieve the guidance ranges for 2021.
Ore mined at Constancia increased 11% in the first quarter of 2021 compared to the first quarter of 2020 resulting in a stockpile build up while managing the level of contaminants and hardness of the ore being sent to the mill. Furthermore, activity during the comparative 2020 period was impacted by a temporary suspension of operations at Constancia during the last two weeks of March 2020 following the government declared state of emergency in response to the COVID-19 pandemic.
Ore milled during the first quarter of 2021 was 5% lower compared to the same period in 2020 due to increased ore hardness that limited throughput as well as a scheduled semi-annual maintenance shutdown in January 2021 that did not occur in the prior period. Compared to the same period in 2020, milled gold grades in the first quarter significantly increased, by 33%, as we accessed higher grade ore from the deeper banks of the pit, while silver and copper grades declined by 9% and 3%, respectively. Copper recoveries in the first quarter of 2021 remained consistent with the same period in 2020.
Combined mine, mill and G&A unit operating costs in the first quarter of 2021 were 34% higher than the same period in 2020 and is higher than the upper end of our 2021 guidance range, primarily due to fewer tonnes of ore milled and increased operating costs related to the planned plant maintenance shutdown and enhanced COVID-19 protocols. Excluding COVID-related costs in Peru of $4.6 million, the unit operating costs in the first quarter were $11.74 per tonne. We expect full year operating costs to decline and be in line with the 2021 guidance range.
Contained metal in concentrate produced | Three months ended | Guidance |
Mar. 31, 2021 | Mar. 31, 2020 | Annual |
2021 |
Copper | tonnes | 17,827 | 19,290 | 72,000 - 88,000 |
Gold | oz | 4,638 | 3,062 | 40,000 - 50,000 |
Silver | oz | 405,714 | 461,302 | 1,800,000 - 2,170,000 |
Molybdenum | tonnes | 294 | 354 | 1,400 - 1,700 |
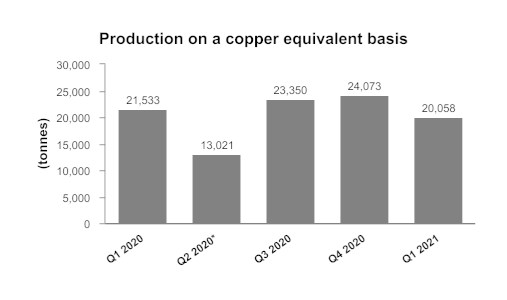
In the first quarter of 2021, production of copper and silver were 8%, and 12% lower, respectively, than the same period in 2020 due to lower ore grades and lower throughput. Molybdenum production in the first quarter of 2021 was lower than the same period in 2020 due to the same reasons as well as lower recoveries. Production of gold in the first quarter of 2021 was 51% higher than the same period in 2020 due to higher grades, partially offset by lower mill throughput.
*Reflects Constancia temporary suspension of operations in April and May.
Peru Cash Cost and Sustaining Cash Cost
| Three months ended |
Mar. 31, 2021 | Mar. 31, 2020 |
Cash cost per pound of copper produced, net of by-product credits1 | $/lb | 1.82 | 1.42 |
Sustaining cash cost per pound of copper produced, net of by-product credits1 | $/lb | 2.36 | 1.91 |
1 Cash cost and sustaining cash costs per pound of copper produced, net of by-product credits, are not recognized under IFRS. For more detail on these non-IFRS financial performance measures, please see the discussion under the "Non-IFRS Financial Performance Measures" section of this MD&A. |
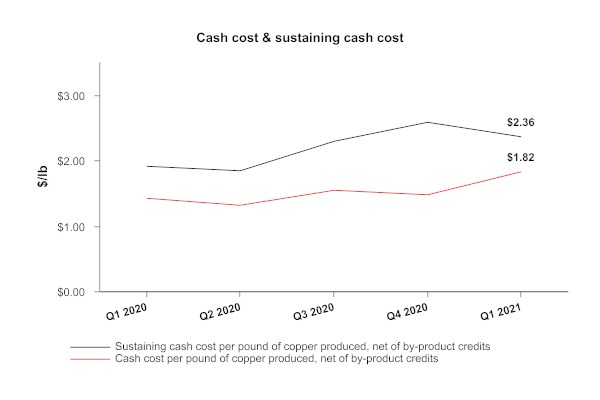
Cash cost per pound of copper produced, net of by-product credits, for the three months ended March 31, 2021 was $1.82. Cash cost increased 28%, compared to the same period in 2020. The overall increase is primarily due to higher milling costs related to the planned plant maintenance shutdown, higher general and administrative costs due to higher COVID-19 related costs and lower copper production caused by lower throughput and lower copper grades as we progress through the mine plan.
Sustaining cash cost per pound of copper produced, net of by-product credits increased by 24% compared to the first quarter of 2020, mainly due to the same factors noted above affecting cash costs, with no meaningful change in sustaining capital expenditures.
Metal Sold
| Three months ended |
Mar. 31, 2021 | Mar. 31, 2020 |
Payable metal in concentrate | | | |
Copper | tonnes | 14,836 | 19,247 | |
Gold | oz | 2,963 | 2,618 |
Silver | oz | 337,612 | 361,591 |
Molybdenum | tonnes | 284 | 431 | |
Compared to the same period in 2020, quantities of payable metal sold for the three months ended March 31, 2021 for copper, silver and molybdenum were lower while gold was higher, primarily for the same reasons that affected contained metal production as well as the relative timing of shipments. First quarter sales were negatively impacted by a ten thousand tonne shipment of copper concentrate for which a payment was received but which did not otherwise meet the revenue recognition criteria. Revenue related to this transaction has been recorded in the second quarter of 2021.
MANITOBA OPERATIONS REVIEW
Mines
| Three months ended |
Mar. 31, 2021 | Mar. 31, 2020 |
Lalor | | | |
Ore | tonnes | 421,602 | 421,518 |
Copper | % | 0.57 | 0.70 |
Zinc | % | 5.20 | 5.43 |
Gold | g/tonne | 2.67 | 2.27 |
Silver | g/tonne | 22.75 | 26.18 |
777 | | | |
Ore | tonnes | 275,260 | 279,925 |
Copper | % | 2.06 | 1.18 |
Zinc | % | 4.00 | 4.11 |
Gold | g/tonne | 2.39 | 1.82 |
Silver | g/tonne | 29.32 | 23.86 |
Total Mines | | | |
Ore | tonnes | 696,862 | 701,443 |
Copper | % | 1.16 | 0.89 |
Zinc | % | 4.73 | 4.90 |
Gold | g/tonne | 2.56 | 2.09 |
Silver | g/tonne | 25.34 | 25.26 |
Unit Operating Costs1,2 | Three months ended |
Mar. 31, 2021 | Mar. 31, 2020 |
Mines | | | |
Lalor | C$/tonne | 109.55 | 93.16 | |
777 | C$/tonne | 82.59 | 74.21 | |
Total Mines | C$/tonne | 98.90 | 85.60 | |
1 Reflects costs per tonne of ore mined. | | | |
The Manitoba business unit had stable operating performance across the mines, mills and zinc plant during the first quarter while facing increasing COVID-19 related logistical challenges. Late in 2020, we added new controls at the Snow Lake camp by introducing point of care PCR testing. Similar testing is being introduced in Flin Flon during the second quarter. COVID-19 vaccinations are currently being rolled out throughout the Snow Lake and Flin Flon communities and workforce. Full year production of all metals and unit operating costs in Manitoba are on track to achieve the guidance ranges for 2021.
Ore mined at our Manitoba operations during the first quarter of 2021 was generally in line with the same period in 2020. Copper and gold grades mined during the three months ended March 31, 2021 were 30% and 22% higher, respectively, compared to the same period in 2020, consistent with the life of mine production schedules at Lalor and 777 which includes mining out higher grade remnant stopes from 777 as it nears the end of its mine life. Silver and zinc grades mined during the three months ended March 31, 2021 were generally in line with the same period in 2020.
Development and underground construction activities continue in the lower part of the Lalor mine in order to ensure we maintain consistent gold and copper-gold production for the start-up and ongoing operation of the New Britannia mill, scheduled for early in the third quarter of 2021. As at the end of the first quarter, approximately 26,000 tonnes of gold ore had been stockpiled as initial feed for the New Britannia mill, up from 12,000 tonnes at the end of the fourth quarter of 2020. The incremental mining activity associated with growing the gold ore stockpile has contributed to elevated combined mine, mill and G&A unit operating costs during the first quarter of 2021. The gold ore stockpile is expected to continue to grow during the second quarter of 2021.
At 777, the focus is mining out the remaining reserves by executing the mine production sequence and completing the necessary ground rehabilitation in order to access old workings and remnant stopes.
Total unit operating costs for the mines during the first quarter of 2021 increased by 16% compared to the same period in 2020 mainly due to lower capitalized development at both Lalor and 777.
Processing Facilities
| Three months ended |
Mar. 31, 2021 | Mar. 31, 2020 |
Stall Concentrator | | | |
Ore | tonnes | 361,344 | 369,787 |
Copper | % | 0.60 | 0.70 |
Zinc | % | 5.53 | 5.38 |
Gold | g/tonne | 2.57 | 2.28 |
Silver | g/tonne | 23.40 | 26.28 |
Copper concentrate | tonnes | 10,347 | 11,638 |
Concentrate grade | % Cu | 18.09 | 19.31 |
Zinc concentrate | tonnes | 35,694 | 36,130 |
Concentrate grade | % Zn | 50.98 | 50.28 |
Copper recovery | % | 85.7 | 86.5 |
Zinc recovery | % | 91.1 | 91.4 |
Gold recovery | % | 57.5 | 60.9 |
Silver recovery | % | 56.2 | 61.1 |
Contained metal in concentrate produced | | |
Copper | tonnes | 1,872 | 2,247 |
Zinc | tonnes | 18,196 | 18,168 |
Gold | oz | 17,207 | 16,530 |
Silver | oz | 152,906 | 191,019 |
| | | |
Flin Flon Concentrator | | | |
Ore | tonnes | 283,386 | 332,589 |
Copper | % | 1.88 | 1.11 |
Zinc | % | 4.20 | 4.36 |
Gold | g/tonne | 2.34 | 1.88 |
Silver | g/tonne | 28.01 | 24.33 |
Copper concentrate | tonnes | 22,312 | 13,522 |
Concentrate grade | % Cu | 21.75 | 22.91 |
Zinc concentrate | tonnes | 19,113 | 24,372 |
Concentrate grade | % Zn | 50.98 | 50.58 |
Copper recovery | % | 91.3 | 84.1 |
Zinc recovery | % | 81.8 | 85.0 |
Gold recovery | % | 64.0 | 53.5 |
Silver recovery | % | 54.1 | 44.3 |
Contained metal in concentrate produced | | |
Copper | tonnes | 4,854 | 3,098 |
Zinc | tonnes | 9,744 | 12,327 |
Gold | oz | 13,655 | 10,763 |
Silver | oz | 138,053 | 115,371 |
Unit Operating Costs1 | Three months ended | Guidance |
Mar. 31, 2021 | Mar. 31, 2020 | Annual |
2021 |
Concentrators | | | | |
Stall | C$/tonne | 23.12 | 22.38 | |
Flin Flon | C$/tonne | 27.08 | 21.75 | |
Combined mine/mill unit operating costs 2,3 | | | |
Manitoba | C$/tonne | 151 | 127 | 145 - 155 |
1 Reflects costs per tonne of milled ore. |
2 Reflects combined mine, mill and G&A costs per tonne of milled ore. |
3 Combined unit costs is a non-IFRS financial performance measure with no standardized definition under IFRS. For further information and a detailed reconciliation, please see the discussion under the "Non-IFRS Financial Reporting Measures" section of this MD&A. |
At the Stall concentrator, ore processed during the first quarter of 2021 was only 2% lower than the same period in 2020, despite an incremental 14,000 tonnes of Lalor gold ore being stockpiled during the quarter as initial feed for the New Britannia mill. Stall recoveries during the first quarter of 2021 were consistent with the metallurgical model. In early April, production at the Stall mill was suspended for four days as a precaution due to COVID related absenteeism. We do not expect any material impact to second quarter financial results related to the Stall mill production suspension.
Ore processed at the Flin Flon concentrator in the first quarter of 2021 decreased by 15% compared to the same period in 2020, as operations were negatively impacted at the end of March by the spring thaw and less Lalor ore being processed in Flin Flon in order to grow the gold ore stockpile as initial feed for the New Britannia mill. As a result of decreased milling in the first quarter of 2021, unit operating costs increased by 25% at the Flin Flon concentrator compared to the same period in 2020.
Recoveries of copper, gold and silver at the Flin Flon concentrator during the first quarter of 2021 were higher by 9%, 20% and 22%, respectively, compared to the same period in 2020 due to higher head grades from the mining out of higher grade remnant stopes at 777.
Combined mine, mill and G&A unit operating costs in the first quarter of 2021 increased by 19% compared to the same period in 2020, due to lower mill throughput as well higher unit operating costs at the mines for the reasons described above.
Manitoba contained metal in concentrate produced1 | Three months ended | Guidance |
Mar. 31, 2021 | Mar. 31, 2020 | Annual |
2021 |
Copper | tonnes | 6,726 | 5,345 | 20,000 - 24,000 |
Gold | oz | 30,862 | 27,293 | 150,000 - 165,000 |
Silver | oz | 290,959 | 306,390 | 1,200,000 - 1,400,000 |
Zinc | tonnes | 27,940 | 30,495 | 96,000 - 107,000 |
1 Metal reported in concentrate is prior to deductions associated with smelter terms. |
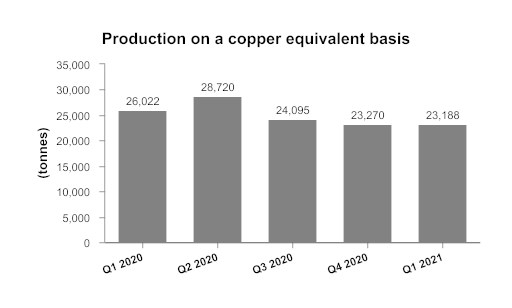
Gold production was 13% higher in the first quarter of 2021 due to higher head grades at 777 and Lalor and better recoveries at the Flin Flon concentrator as compared to the same period in 2020. Copper production during the quarter was 26% higher in the first quarter of 2021 compared to the same quarter in 2020 mainly due to higher copper head grades at 777. Silver and zinc production declined by 5% and 8%, respectively, in the first quarter of 2021 compared to the same quarter in 2020 primarily due to lower milled throughout with generally consistent grades.
Zinc Plant
Zinc Production | Three months ended | | Guidance |
Mar. 31,
2021 | Mar. 31,
2020 | | Annual |
| 2021 |
Zinc Concentrate Treated | | | | |
Domestic | tonnes | 54,489 | 61,351 | | |
Refined Metal Produced | | | | |
Domestic | tonnes | 26,508 | 28,466 | | 96,000 - 103,000 |
Unit Operating Costs | Three months ended | | Guidance |
Mar. 31,
2021 | Mar. 31,
2020 | | Annual |
| 2021 |
Zinc Plant 1,2 | C$/lb | 0.51 | 0.49 | | 0.50 - 0.55 |
1 Zinc unit operating costs include G&A costs. |
2 Zinc unit costs is a non-IFRS financial performance measure with no standardized definition under IFRS. For further information and a detailed reconciliation, please see the discussion under the "Non-IFRS Financial Reporting Measures" section of this MD&A. |
Production of refined cast zinc in the first quarter of 2021 was 7% lower than the same period in 2020 while operating costs per pound of zinc metal produced was 4% higher over the same period.
Manitoba Cash Cost and Sustaining Cash Cost
| Three months ended |
Mar. 31,
2021 | Mar. 31,
2020 |
Cost per pound of copper produced | | | |
Cash cost per pound of copper produced, net of by-product credits 1 | $/lb | (1.04) | (0.62) |
Sustaining cash cost per pound of copper produced, net of by-product credits 1 | $/lb | 1.62 | 2.54 | |
| | | |
Cost per pound of zinc produced | | | |
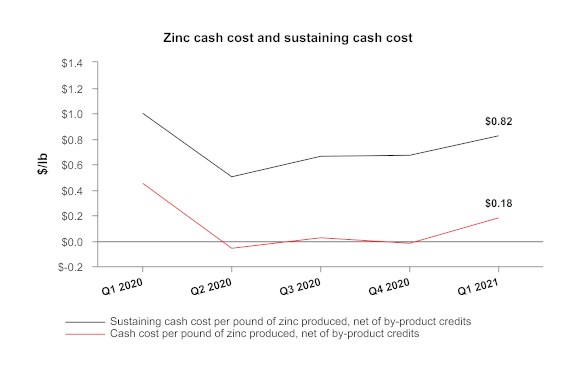
Cash cost per pound of zinc produced, net of by-product credits 1 | $/lb | 0.18 | 0.45 | |
Sustaining cash cost per pound of zinc produced, net of by-product credits 1 | $/lb | 0.82 | 1.00 | |
1 Cash cost and sustaining cash cost per pound of copper & zinc produced, net of by-product credits, are not recognized under IFRS. For more detail on this non-IFRS financial performance measure, please see the discussion under the "Non-IFRS Financial Performance Measures" section of this MD&A. |
Cash cost per pound of copper produced, net of by-product credits, in the first quarter of 2021 was negative $1.04. These costs were lower compared to the same period in 2020, primarily as a result of higher by-product credit revenues and higher copper production partially offset by higher mining costs related to growing the New Britannia mill ore stockpile.
Sustaining cash cost per pound of copper produced, net of by-product credits, in the first quarter of 2021 was $1.62. These costs were lower compared to the same period in 2020, primarily due to the reasons listed above with no meaningful change in sustaining capital expenditures.
Cash cost and sustaining cash cost per pound of zinc produced, net of by-product credits, in the first quarter of 2021 were lower than the same period last year as a result of significantly higher by-product credits, partially offset by higher mining costs and lower zinc production.

Metal Sold
| Three months ended |
Mar. 31,
2021 | Mar. 31,
2020 |
Payable metal in concentrate | | | |
Copper | tonnes | 6,093 | 4,825 |
Gold | oz | 22,420 | 23,956 |
Silver | oz | 172,148 | 214,331 |
Refined zinc | tonnes | 28,343 | 26,792 |
First quarter Manitoba sales were impacted by limited rail car availability resulting in lower sales in the first quarter. The resulting excess copper concentrate buildup has since been reduced to normal operating levels through sales recorded in the second quarter of 2021.
OUTLOOK
Peru has recently undergone a period of heightened political instability. A general presidential election was held on April 11, 2021 with a record number of candidates resulting in a runoff election expected to take place on June 6, 2021 between the top two candidates. The risk exists that, following the presidential election, the new government could make changes to the constitution or government policies that alter laws regulating the mining industry. A change in government, government policy, the declaration of a state of emergency or the implementation of new, or the modification of existing, laws and regulations affecting our operations and other mineral properties could have a material adverse impact on the outlook for our Constancia mine and the Pampacancha satellite deposit.
This outlook includes forward-looking information about our operations and financial expectations based on our expectations and outlook as of May 11, 2021. As a result of the COVID-19 global pandemic, we have experienced operational, supply chain, travel, labour and shipping disruptions, and we may continue to experience similar disruptions in the future. Given the uncertainty of the duration and magnitude of the impact of COVID-19 as well as the upcoming Peru presidential election in June 2021 and the corresponding risks described above, our 2021 production and cost guidance and three-year production guidance are subject to a higher-than-normal degree of uncertainty. The guidance below does not reflect any potential for additional suspensions or other significant disruption to operations or delays to development activities.
This outlook, including expected results and targets, is subject to various risks, uncertainties and assumptions, which may impact future performance and our achievement of the results and targets discussed in this section. For additional information on forward-looking information, refer to the "Forward-Looking Information" section of this MD&A. In addition to this section, refer to the "Operations Review" sections for additional details on our outlook for 2021.
3-Year Production Outlook Contained Metal in Concentrate1 | 2021 Guidance | 2022 Guidance | 2023 Guidance |
Peru | | | | |
Copper | tonnes | 72,000 - 88,000 | 95,000 - 120,000 | 105,000 - 130,000 |
Gold | oz | 40,000 - 50,000 | 85,000 - 105,000 | 85,000 - 105,000 |
Silver | oz | 1,800,000 - 2,170,000 | 1,700,000 - 2,100,000 | 2,300,000 - 2,800,000 |
Molybdenum | tonnes | 1,400 - 1,700 | 1,200 - 1,500 | 2,200 - 2,800 |
| | | | |
Manitoba | | | | |
Gold | oz | 150,000 - 165,000 | 160,000 - 180,000 | 175,000 - 195,000 |
Zinc | tonnes | 96,000 - 107,000 | 60,000 - 70,000 | 40,000 - 47,000 |
Copper | tonnes | 20,000 - 24,000 | 14,000 - 16,000 | 11,000 - 13,000 |
Silver | oz | 1,200,000 - 1,400,000 | 1,000,000 - 1,200,000 | 1,000,000 - 1,200,000 |
| | | | |
Total | | | | |
Copper | tonnes | 92,000 - 112,000 | 109,000 - 136,000 | 116,000 - 143,000 |
Gold | oz | 190,000 - 215,000 | 245,000 - 285,000 | 260,000 - 300,000 |
Zinc | tonnes | 96,000 - 107,000 | 60,000 - 70,000 | 40,000 - 47,000 |
Silver | oz | 3,000,000 - 3,570,000 | 2,700,000 - 3,300,000 | 3,300,000 - 4,000,000 |
Molybdenum | tonnes | 1,400 - 1,700 | 1,200 - 1,500 | 2,200 - 2,800 |
1 Metal reported in concentrate is prior to treatment or refining losses or deductions associated with smelter terms. |
2 Manitoba production guidance assumes the 777 mine is depleted at the end of the second quarter of 2022, resulting in lower copper and zinc production after its closure. |
Using the mid-point of the guidance ranges, consolidated copper and gold production are expected to increase to 129,500 tonnes and 280,000 ounces, respectively, in 2023, which represents an increase of 36% and 125%, respectively, from 2020 levels as Hudbay brings online its Pampacancha and New Britannia growth projects. These growth projects more than offset the lost copper and gold production from 777 after its closure in mid-2022.
Peru's 2021 production guidance reflects the commencement of Pampacancha mining in the second quarter, with the initial phase of lower copper grades, but higher gold grades, expected to continue for the balance of the year before higher copper grades are forecast to enter the mine plan in 2022 and beyond.
Manitoba's 2021 production guidance reflects an increase in Lalor's mine throughput to 4,650 tonnes per day, from the previous 4,500 tonnes per day, as the recent trend of stronger production from the mine is expected to continue. Lalor's mine throughput is expected to further increase to 5,300 tonnes per day starting in 2023 due to technical and operational improvements and the allocation of mining resources from the 777 mine after its closure in 2022. Manitoba's 2023 production reflects higher copper, gold and silver recoveries at the Stall mill as a result of the implementation of various mill flowsheet enhancements in 2022.
FINANCIAL REVIEW
Financial Results
In the first quarter of 2021, we recorded a net loss of $60.1 million compared to a net loss of $76.1 million for the same period in 2020, representing an increase in profit of $16.0 million.
The following table provides further details on these variances:
(in $ millions) | Three months ended March 31, 2021 | |
|
Increase (decrease) in components of profit or loss: | | |
Revenues | 68.5 | |
Cost of sales | | |
Mine operating costs | 2.2 | |
Depreciation and amortization | 3.8 | |
Selling and administrative expenses | (4.8) | |
Exploration and evaluation expenses | (1.3) | |
Other expenses | 8.8 | |
Net finance expense | (65.3) | |
Tax | 4.1 | |
Increase in profit for the period | 16.0 | |
Revenue
Revenue for the first quarter of 2021 was $313.6 million, $68.5 million higher than the same period in 2020, mainly due to higher realized metal prices as well as higher sales volumes of zinc and a higher relative variable consideration adjustment. Offsetting this increase were lower sales volumes of copper and precious metals due to lower Constancia throughput and a shipment of copper concentrate for which a payment was received as of March 31, 2021, but which did not otherwise meet the revenue recognition criteria.
(in $ millions) | Three months ended March 31, 2021 |
| |
Metals prices1 | |
Higher copper prices | 54.2 |
Higher zinc prices | 16.1 |
Higher gold prices | 0.4 |
Higher silver prices | 2.8 |
Sales volumes | |
Lower copper sales volumes | (17.5) |
Higher zinc sales volumes | 3.6 |
Lower gold sales volumes | (1.2) |
Lower silver sales volumes | (1.6) |
Other | |
Change in derivative mark-to-market on zinc | 2.0 |
Molybdenum and other volume and pricing differences | 1.6 |
Variable consideration adjustments | 4.4 |
Effect of lower treatment and refining charges | 3.7 |
Increase in revenue in 2021 compared to 2020 | 68.5 |
1 See discussion below for further information regarding metals prices. |
Our revenue by significant product type is summarized below:
| Three months ended |
(in $ millions) | Mar. 31,
2021 | Mar. 31,
2020 |
Copper | 173.7 | 139.2 |
Zinc | 82.1 | 63.6 |
Gold | 42.2 | 44.4 |
Silver | 6.4 | 3.6 |
Molybdenum | 7.0 | 9.2 |
Other metals | 1.6 | 0.9 |
Revenue from contracts | 313.0 | 260.9 |
Amortization of deferred revenue - gold | 4.9 | 4.1 |
Amortization of deferred revenue - silver | 8.7 | 8.4 |
Amortization of deferred revenue - variable consideration adjustments - prior periods | 1.6 | (2.8) |
Pricing and volume adjustments1 | (2.6) | (9.8) |
Treatment and refining charges | (12.0) | (15.7) |
Revenue | 313.6 | 245.1 |
1 Pricing and volume adjustments represents mark-to-market adjustments on provisionally prices sales, realized and unrealized changes to fair value for non-hedge derivative contracts and adjustments to originally invoiced weights and assays. |
For further detail on variable consideration adjustments, refer to note 15 of our consolidated interim financial statements.
Realized sales prices
This measure is intended to enable management and investors to understand the average realized price of metals sold to third parties in each reporting period. The average realized price per unit sold does not have any standardized meaning prescribed by IFRS, is unlikely to be comparable to similar measures presented by other issuers and should not be considered in isolation or a substitute for measures of performance prepared in accordance with IFRS.
For sales of copper, gold and silver we may enter into non-hedge derivatives ("QP hedges") which are intended to manage the provisional pricing risk arising from quotational period terms in concentrate sales agreements. The QP hedges are not removed from the calculation of realized prices. We expect that gains and losses on QP hedges will offset provisional pricing adjustments on concentrate sales contracts.
Our realized prices for the first quarter of 2021 and 2020, respectively, are summarized below:
| Realized prices1 for the |
Three months ended |
| LME QTD 20212 | Mar. 31,
2021 | Mar. 31,
2020 |
Prices | | | | |
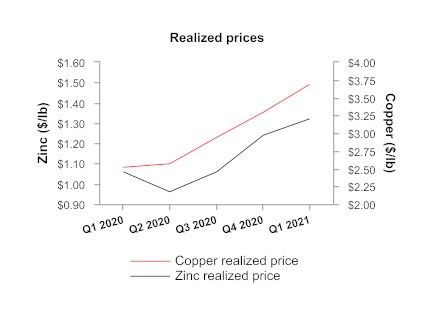
Copper | $/lb | 3.86 | 3.69 | 2.52 |
Zinc3 | $/lb | 1.25 | 1.32 | 1.06 |
Gold4 | $/oz | | 1,778 | 1,730 |
Silver4 | $/oz | | 29.69 | 24.23 |
1 Realized prices exclude refining and treatment charges and are on the sale of finished metal or metal in concentrate. Realized prices include the effect of provisional pricing adjustments on prior period sales. |
2 London Metal Exchange average for copper and zinc prices. |
3 All sales for the three months ended March 31, 2021 and 2020 were cast zinc metal. Zinc realized prices include premiums paid by customers for delivery of refined zinc metal, but exclude unrealized gains and losses related to non-hedge derivative contracts that are included in zinc revenues. |
4 Sales of gold and silver from our 777 and Constancia mines are subject to our precious metals stream agreement with Wheaton Precious Metals, pursuant to which we recognize deferred revenue for precious metals deliveries and also receive cash payments. Stream sales are included within realized prices and their respective deferred revenue and cash payment rates can be found on page 29. |
At March 31, 2021, the LME copper spot price increased by 14% compared to the fourth quarter of 2020. The first quarter realized copper price was 4% below the LME quarterly average price as certain hedges were entered into at copper prices below the monthly average copper price.
The following tables provide a reconciliation of average realized price per unit sold, by metal, to revenues as shown in the consolidated interim financial statements.
Three months ended March 31, 2021 |
(in $ millions) 1 | Copper | Zinc | Gold | Silver | Molybdenum | Other | Total |
Revenue per financial statements | 173.7 | 82.1 | 42.2 | 6.4 | 7.0 | 1.6 | 313.0 |
Amortization of deferred revenue | - | - | 4.9 | 8.7 | - | - | 13.6 |
Pricing and volume adjustments2 | (3.3) | 0.2 | (1.9) | - | 2.4 | - | (2.6) |
By-product credits 3 | 170.4 | 82.3 | 45.2 | 15.1 | 9.4 | 1.6 | 324.0 |
Derivative mark-to-market 4 | - | 0.2 | - | - | - | - | 0.2 |
Revenue, excluding mark-to-market on non-QP hedges | 170.4 | 82.5 | 45.2 | 15.1 | 9.4 | 1.6 | 324.2 |
Payable metal in concentrate sold 5 | 20,929 | 28,343 | 25,383 | 509,760 | 284 | - | - |
Realized price 6 | 8,143 | 2,910 | 1,778 | 29.69 | 33,040 | - | - |
Realized price 7 | 3.69 | 1.32 | - | - | - | - | - |
Three months ended March 31, 2020 |
(in $ millions) 1 | Copper | Zinc | Gold | Silver | Molybdenum | Other | Total |
Revenue per financial statements | 139.2 | 63.6 | 44.4 | 3.6 | 9.1 | 0.9 | 260.8 |
Amortization of deferred revenue | - | - | 4.1 | 8.4 | - | - | 12.5 |
Pricing and volume adjustments2 | (5.5) | (3.0) | (2.5) | 1.9 | (0.6) | - | (9.7) |
By-product credits 3 | 133.7 | 60.6 | 46.0 | 13.9 | 8.5 | 0.9 | 263.6 |
Derivative mark-to-market4 | - | 2.2 | - | - | - | - | 2.2 |
Revenue, excluding mark-to-market on non-QP hedges | 133.7 | 62.8 | 46.0 | 13.9 | 8.5 | 0.9 | 265.8 |
Payable metal in concentrate sold 5 | 24,072 | 26,792 | 26,574 | 575,922 | 431 | - | - |
Realized price 6 | 5,555 | 2,342 | 1,730 | 24.23 | 19,870 | - | - |
Realized price 7 | 2.52 | 1.06 | - | - | - | - | - |
1 Average realized price per unit sold may not calculate based on amounts presented in this table due to rounding. |
2 Pricing and volume adjustments represents mark-to-market adjustments on provisionally priced sales, realized and unrealized changes to fair value for non-hedge derivative contracts and adjustments to originally invoiced weights and assays. |
3 By-product credits subtotal is used in the calculated of cash cost per pound of copper and zinc produced, net of by-product credits. Cash cost per pound of copper and zinc produced, net of by-product credits, are non-IFRS financial performance measures with no standardized definition under IFRS. For further information and a detailed reconciliation, please see the discussion under the "Non-IFRS Financial Reporting Measures" section of this MD&A. |
4 Derivative mark-to-market excludes mark-to-market on QP hedges. |
5 Copper, zinc and molybdenum shown in metric tonnes and gold and silver shown in ounces. |
6 Realized price for copper, zinc and molybdenum in $/metric tonne and realized price for gold and silver in $/oz. |
7 Realized price for copper and zinc in $/lb. |
The price, quantity and mix of metals sold, affect our revenue, operating cash flow and profit. Revenue from metals sales can vary from quarter to quarter due to production levels, shipping volumes and transfer of risk and title to customers.
Stream Sales
The following table shows stream sales included within realized prices and their respective deferred revenue and cash payment rates:
| | Three months ended |
| | Mar. 31, 2021 |
| | Manitoba | Peru |
Gold | oz | 2,577 | 1,676 |
Silver | oz | 48,763 | 346,138 |
Gold deferred revenue drawdown rate1,2 | $/oz | 1,248 | 990 |
Gold cash rate3 | $/oz | 425 | 408 |
Total gold stream realized price | $/oz | 1,673 | 1,398 |
Silver deferred revenue drawdown rate1,2 | $/oz | 23.99 | 21.86 |
Silver cash rate3 | $/oz | 6.26 | 6.02 |
Total silver stream realized price | $/oz | 30.25 | 27.88 |
| | |
| Three months ended |
Mar. 31, 2020 |
Manitoba | Peru |
Gold | oz | 2,440 | 1,326 |
Silver | oz | 41,400 | 349,622 |
Gold deferred revenue drawdown rate1,2 | $/oz | 1,164 | 976 |
Gold cash rate 3 | $/oz | 420 | 404 |
Total gold stream realized price | $/oz | 1,584 | 1,380 |
Silver deferred revenue drawdown rate1,2 | $/oz | 22.09 | 21.52 |
Silver cash rate 3 | $/oz | 6.20 | 5.96 |
Total silver stream realized price | $/oz | 28.29 | 27.48 |
1Subsequent to the variable consideration adjustment recorded on January 1, 2021, the deferred revenue amortization is recorded in Manitoba at C$1,578/oz gold and C$30.38/oz silver (March 31, 2020- C$1,556/oz gold and C$29.58/oz silver) and converted to US dollars at the exchange rate in effect at the time of revenue recognition. |
2 Deferred revenue drawdown rates for gold and silver do not include variable consideration adjustments. |
3 The gold and silver cash rate for Manitoba increased by 1% from $400/oz and $5.90/oz effective August 1, 2015. Subsequently every year, on August 1, the cash rate will increase by 1% compounded. The weighted average cash rate is disclosed. The gold and silver cash rate for Peru increased by 1% from $400/oz and $5.90/oz effective July 1, 2019. Subsequently every year, on July 1, the cash rate will increase by 1% compounded. The weighted average cash rate is disclosed. |
Cost of Sales
Our detailed cost of sales is summarized as follows:
(in $ thousands) | | Three months ended | |
| Mar. 31,
2021 | | Mar. 31,
2020 | |
Peru | | | | | |
Mining | | 21,539 | | 19,942 | |
Milling | | 43,320 | | 33,338 | |
Changes in product inventory | | (10,575) | | (243) | |
Depreciation and amortization - DRO assets | | 1,202 | | 939 | |
Depreciation and amortization - Other PP&E1 | | 39,233 | | 46,303 | |
G&A | | 14,439 | | 8,683 | |
Overhead costs related to suspension of activities (cash) | | - | | 3,454 | |
Inventory adjustments | | (723) | | 10,375 | |
Freight, royalties and other charges | | 9,853 | | 11,264 | |
Total Peru cost of sales | | 118,288 | | 134,055 | |
Manitoba | | | | | |
Mining | | 54,420 | | 44,666 | |
Milling | | 12,662 | | 11,543 | |
Zinc plant | | 19,607 | | 18,942 | |
Changes in product inventory | | (12,289) | | (3,296) | |
Depreciation and amortization - DRO assets | | 12,521 | | 9,061 | |
Depreciation and amortization - Other PP&E1 | | 29,726 | | 30,136 | |
G&A | | 15,952 | | 13,932 | |
Freight, royalties and other charges | | 10,225 | | 8,057 | |
Total Manitoba cost of sales | | 142,824 | | 133,041 | |
Cost of sales | | 261,112 | | 267,096 | |
1 Includes depreciation and amortization from property, plant, and equipment, excluding decommissioning and restoration assets. |
Total cost of sales for the first quarter of 2021 was $261.1 million, reflecting a decrease of $6.0 million from the first quarter of 2020. Cost of sales related to Peru decreased in the first quarter of 2021, compared to the same period of 2020, by $15.8 million. Compared to the same period in 2020, the decrease is primarily the result of lower relative changes in product inventory as well as a comparative period net realizable value of inventory adjustment and a reduction in depreciation and amortization. Partially offsetting these costs were higher milling costs related to the scheduled plant maintenance during the quarter and higher general and administrative costs mainly related to comparatively higher COVID-related costs. In Manitoba, cost of sales increased by $9.8 million, compared to the first quarter of 2020 as a result of higher mining costs partially offset by lower relative changes in product inventory related to a buildup of finished goods inventory during the quarter as a result of a lack of rail car availability.
For details on unit operating costs refer to the respective tables in the "Operations Review" section of this MD&A.
For the first quarter of 2021, other significant variances in expenses from operations, compared to the same period in 2020, include the following:
- Other operating expenses decreased by $8.8 million, compared to the same period in 2020 primarily due to a reversal of DRO expenses on non-producing properties in Manitoba as a result of increasing discount rates and a reduction in losses on disposal of property, plant and equipment in the current quarter.
- Selling and administrative expenses increased by $4.8 million compared to the same period in 2020. This increase was mainly due to higher stock-based compensation charges as a result of the relative impact of the revaluation of previously issued share units to higher share prices.
- Exploration and evaluation expenses increased by $1.3 million compared to the first quarter in 2020, as drilling programs in Arizona ramped up in the first quarter of 2021.
Net finance expense
(in $ thousands) | Three months ended |
Mar. 31,
2021 | Mar. 31,
2020 |
| | |
Finance costs - accrued or payable: | | |
Interest expense on long-term debt | 21,232 | 19,635 |
Withholding taxes | 2,023 | 1,893 |
Tender premium on 7.625% senior unsecured notes | 22,878 | - |
Other accrued/payable costs (income)1 | 2,121 | 1,397 |
Total finance costs - accrued or payable | 48,254 | 22,925 |
| | |
Finance costs - non-cash: | | |
Accretion on streaming agreements2 | 15,528 | 16,299 |
Change in fair value of financial assets and liabilities at fair value through profit or loss | 39,007 | 6,244 |
Write off unamortized transaction costs | 2,480 | - |
Other non-cash costs3 | 3,184 | (2,375) |
Total finance costs - non-cash | 60,199 | 20,168 |
Net finance expense | 108,453 | 43,093 |
1 Includes interest income and other finance expense. |
2 Includes variable consideration adjustment (prior periods). |
3 Includes accretion on community agreements, unwinding of discount on provisions, and net foreign exchange losses (gains). |
Compared to the three months ended March 31, 2020, net finance expense increased by $65.3 million due to a $40.0 million increase in non-cash finance costs as well as a $25.3 million increase in accrued finance costs both of which were primarily related to the refinancing of our 2025 senior notes. The early redemption of these notes in the current quarter resulted in a $49.8 million write off of the non-cash embedded derivative related to the exercise of the prepayment option, expensing of a call premium of $22.9 million and a write off of unamortized transaction costs of $2.5 million. Offsetting these expenses was a $12.5 million non-cash gain on the revaluation of the gold prepayment liability due to increasing discount rates and lower gold forward prices relative to the fourth quarter of 2020.
Tax Recovery
For the three months ended March 31, 2021, tax recovery increased by $4.1 million compared to the same period in 2020. The following table provides further details:
| Three months ended |
Mar. 31, 2021 | Mar. 31, 2020 |
(in $ thousands) |
Deferred tax recovery - income tax 1 | (26,400) | (3,804) |
Deferred tax expense (recovery) - mining tax 1 | 11,699 | (1,161) |
Total deferred tax recovery | (14,701) | (4,965) |
Current tax expense (recovery) - income tax | 967 | (336) |
Current tax expense (recovery) - mining tax | 4,244 | (17) |
Total current tax expense (recovery) | 5,211 | (353) |
Tax recovery | (9,490) | (5,318) |
1 Deferred tax expense (recovery) represents our draw down/increase of non-cash deferred income and mining tax assets/liabilities. |
Income Tax Recovery
Applying the estimated Canadian statutory income tax rate of 26.3% to our loss before taxes of $69.6 million for the first quarter in 2021 would have resulted in a tax recovery of approximately $18.3 million; however, we recorded an income tax recovery of $25.4 million. The significant items causing our effective income tax rate to be different than the 26.3% estimated Canadian statutory income tax rate include:
- Certain deductible temporary differences mostly with respect to Peru, and mostly relating to the decommissioning and restoration liabilities, were recognized as we have determined that it is probable that we will realize the recovery of these deferred tax assets based on the timing of the reversals of the deductible temporary differences and the future projected taxable profit of the Peruvian operations. This has resulted in a deferred tax recovery of $8.9 million.
- Certain deductible temporary differences with respect to Manitoba, and mostly relating to the decommissioning and restoration liabilities, were not recognized as we have determined that it is not probable that we will realize the recovery of these deferred tax assets based on the timing of the reversals of the deductible temporary differences and the future projected taxable profit of the Manitoba operations. Adjusted for the average annual effective tax rate methodology, this resulted in deferred tax expense of $1.10 million.
Mining Tax Recovery
Applying the estimated Manitoba mining tax rate of 10.0% to our loss before taxes of $69.6 million for the first quarter in 2021 would have resulted in a tax recovery of approximately $7.0 million; however, we recorded a mining tax expense of $15.9 million. Effective mining tax rates can vary significantly based on the composition of our earnings and the expected amount of mining taxable profits. Corporate costs and other costs not related to mining operations are not deductible in computing mining profits. A brief description of how mining taxes are calculated in our various business units is discussed below.
Manitoba
The Province of Manitoba imposes mining tax on profit related to the sale of mineral products mined in the Province of Manitoba (mining taxable profit) at the following rates:
- 10% of total mining taxable profit if mining profit is C$50 million or less;
- 15% of total mining taxable profit if mining profits are between C$55 million and C$100 million; and
- 17% of total mining taxable profit if mining profits exceed C$105 million.
We estimate that the tax rate that will be applicable when temporary differences reverse will be approximately 10.0%.
Peru
The Peruvian government imposes two parallel mining tax regimes, the Special Mining Tax and the Modified Royalty, on companies' operating mining income on a sliding scale, with progressive rates ranging from 2.0% to 8.4% and 1.0% to 12.0%, respectively. Based on financial forecasts, we have recorded a deferred tax liability as at March 31, 2021, at the tax rate we expect to apply when temporary differences reverse.
LIQUIDITY AND CAPITAL RESOURCES
Senior Unsecured Notes Refinancing
On March 8, 2021, we completed the offering of $600.0 million aggregate principal amount of 4.5% senior notes due April 2026. The New Notes are governed by an indenture, dated as of March 8, 2021, among the Company, the subsidiaries of the Company party thereto as guarantors and U.S. Bank National Association, as trustee.
The proceeds from this offering, together with available cash on hand, were used to redeem all $600.0 million of our outstanding 7.625% senior unsecured notes due 2025, including the payment of accrued and unpaid interest, a call premium of $22.9 million on the Redeemed Notes, and to pay transaction costs associated with the New Notes. The lower interest rate on the New Notes, versus the rate on the Redeemed Notes, will result in reduced cash interest payments of almost $19 million annually.
Senior Secured Revolving Credit Facilities
We have two senior secured revolving credit facilities (the "Credit Facilities") for our Canadian and Peruvian businesses, with combined total availability of $400.0 million and substantially similar terms and conditions. As at March 31, 2021, our liquidity includes $310.6 million in cash and cash equivalents as well as undrawn availability of $293.9 million under our Credit Facilities. As at March 31, 2021, we were in compliance with our covenants under the Credit Facilities and had drawn $106.1 million in letters of credit under the Credit Facilities.
As at March 31, 2021, the Arizona business unit had $8.6 million in surety bonds issued to support future reclamation and closure obligations. The Peru business unit also had $85.0 million in letters of credit issued with various Peruvian financial institutions. No cash collateral is required to be posted under these letters of credit or surety bonds.
Financial Condition
Financial Condition as at March 31, 2021 compared to December 31, 2020
Cash and cash equivalents decreased by $128.6 million during the first quarter to $310.6 million as at March 31, 2021. This decrease was mainly the result of $83.0 million of capital investments primarily at our Peru and Manitoba operations, interest payments and other financing and leasing payments of $50.8 million and $44.3 million, respectively, and paid dividends of $2.1 million. Offsetting these cash outflows was cash flow from operating activities of $51.8 million. We hold the majority of our cash and cash equivalents in low-risk, liquid investments with major Canadian and Peruvian financial institutions.
Working capital decreased by $70.6 million to $236.3 million from December 31, 2020 to March 31, 2021, primarily due to the cash and cash equivalent decrease of $128.6 million and an increase of $30.6 million in other financial liabilities due to a partial reclassification of the gold prepayment liability to current, partially offset by a decrease in trade and other payables of $47.9 million arising mainly from timing of interest payments on our senior notes and an increase of $39.3 million in finished goods and stockpile inventories.
Cash Flows
The following table summarizes our cash flows for the three months ended March 31, 2021 and March 31, 2020:
(in $ thousands) | Three months ended |
Mar. 31,
2021 | Mar. 31,
2020 |
Operating cash flow before changes in non-cash working capital | 90,656 | 41,951 |
Change in non-cash working capital | (38,859) | (32,865) |
Cash generated from operating activities | 51,797 | 9,086 |
Cash used in investing activities | (82,512) | (49,947) |
Cash used in financing activities | (96,791) | (51,932) |
Effect of movement in exchange rates on cash and cash equivalents | (1,065) | 2,644 |
Decrease in cash and cash equivalents | (128,571) | (90,149) |
Cash Flow from Operating Activities
Cash generated from operating activities was $51.8 million during the first quarter of 2021, an increase of $42.7 million compared with the same period in 2020. Operating cash flow before change in non-cash working capital was $90.7 million during the first quarter of 2021, reflecting an increase of $48.7 million compared to the first quarter of 2020. The increase in operating cash flow is primarily the result of higher realized prices for all metals, and higher zinc sales volume. This was partially offset by lower sales volumes of copper compared to the first quarter of 2020.
Cash Flow from Investing and Financing Activities
During the first quarter of 2021, we used $179.3 million in investing and financing activities, primarily driven by $83.0 million of capital expenditures, interest payments of $50.8 million, other financing payments of $34.5 million, capitalized lease payments of $9.8 million and dividends paid of $2.1 million.
Capital Expenditures
The following summarizes accrued and cash additions to capital assets for the periods indicated:
| Three months ended | Guidance |
Mar. 31,
2021 | Mar. 31,
2020 | Annual |
(in $ millions) | 2021 |
Manitoba sustaining capital expenditures | 20.9 | 23.8 | 90.0 |
Peru sustaining capital expenditures 1 | 12.9 | 12.5 | 135.0 |
Total sustaining capital expenditures | 33.8 | 36.3 | 225.0 |
Arizona capitalized costs | 3.2 | 3.1 | 20.0 |
Peru growth capitalized expenditures 2 | 19.9 | 70.2 | 25.0 |
Manitoba growth capitalized expenditures | 42.0 | 3.6 | 75.0 |
Other capitalized costs 3 | (63.5) | 43.4 | |
Capitalized exploration | 1.1 | 1.4 | 15.0 |
Total other capitalized costs | 2.7 | 121.7 | |
Total capital additions | 36.5 | 158.0 | |
| | | |
Reconciliation to cash capital additions: | | | |
Decommissioning and restoration obligation | 64.5 | (41.8) | |
Right-of-use asset additions | (1.3) | (2.4) | |
Change in community agreement accruals | (12.6) | (68.5) | |
Change in capital accruals and other | (4.1) | 6.1 | |
Total cash capital additions | 83.0 | 51.4 | |
1 Peru sustaining capital expenditures includes capitalized stripping costs. |
2 Hudbay's revised growth capital guidance for Peru of $25.0 million includes the cost of individual land user agreements. |
3 Other capitalized costs include decommissioning and restoration adjustments. |
Sustaining capital expenditures in Manitoba for the three months ended March 31, 2021 were $20.9 million, a decrease of $2.9 million compared to the same period in 2020. The decrease was mainly due to a reduction in capital development at the 777 mine as it approaches the end of its mine life as well as less capital development at Lalor, partially offset by increased tailings stability costs as we continue to the next phase of the project plan. Sustaining capital expenditures in Peru for the three months ended March 31, 2021 were $12.9 million and were relatively consistent with the same period in 2020. Variances between the periods were mainly caused by higher mine maintenance and tailings management construction costs, partially offset by decreased capitalized stripping costs.
Growth capital expenditures in Manitoba of $42.0 million included significant spending for the New Britannia refurbishment project as construction of the new copper flotation building and construction of a concentrate/tailings pipeline between the New Britannia and Stall mills nears completion. The project was approximately 82% complete at the end of April and is tracking ahead of the original schedule.
Growth capital expenditures in Peru of $19.9 million included costs associated with the individual agreements related to current uses of the land by certain community members as well as civil works related to the development of Pampacancha. As previously disclosed, the Company's growth capital guidance for Peru of $5.0 million did not include the cost of the individual land user agreements due to the ongoing nature of the negotiations. In early April 2021, the Company finalized the remaining land user agreement for Pampacancha and gained full access to the site to begin pit development activities. Blasting began in mid-April and development activities are well-advanced given the progress made on pre-development activities since January. First production from Pampacancha was achieved at the end of April, which is consistent with Hudbay's previous 2021 guidance and recently published mine plan disclosure. As a result of the completion of the individual land user agreements, revised growth capital expenditures guidance for Peru is expected to be approximately $24 million in 2021.
Other capitalized costs for the three months March 31, 2021 were negative $63.5 million and relate primarily to the remeasurement of previously recognized decommissioning and restoration liabilities at our Peru and Manitoba operations as a result of higher discount rates, which reduce the overall liability and the corresponding property, plant and equipment decommissioning assets.
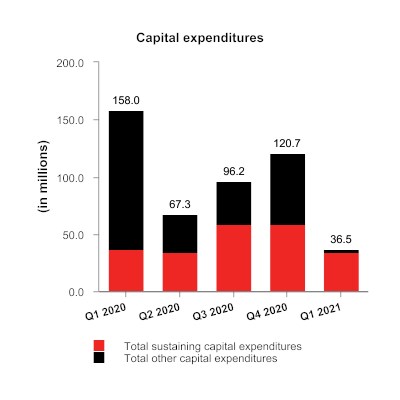
Capital Commitments
As at March 31, 2021, we had outstanding capital commitments in Canada of approximately $52.0 million of which $49.8 million can be terminated, approximately $42.4 million in Peru primarily related to exploration option agreements, all of which can be terminated, and approximately $179.6 million in Arizona, primarily related to our Rosemont project, of which approximately $89.3 million can be terminated.
Contractual Obligations
The following table summarizes our significant contractual obligations as at March 31, 2021:
| Less than 12 months | 13 - 36 months | 37 - 60 months | More than 60 months |
Payment Schedule (in $ millions) | Total |
Long-term debt obligations1 | 1,636.4 | 37.7 | 129.1 | 127.5 | 1,342.1 |
Gold prepayment obligation2 | 126.1 | 16.4 | 109.7 | - | - |
Lease obligations | 116.7 | 87.7 | 23.1 | 1.8 | 4.1 |
Purchase obligation - capital commitments | 274.0 | 67.2 | 26.0 | 28.6 | 152.2 |
Purchase obligation - other commitments3 | 945.5 | 427.9 | 314.3 | 146.5 | 56.8 |
Pension and other employee future benefits obligations2 | 168.5 | 16.8 | 27.4 | 7.7 | 116.6 |
Community agreement obligations4 | 68.3 | 22.7 | 8.3 | 5.4 | 31.9 |
Decommissioning and restoration obligations5 | 267.8 | 20.5 | 21.3 | 8.2 | 217.8 |
Total | 3,603.3 | 696.9 | 659.2 | 325.7 | 1,921.5 |
1 Long-term debt obligations include scheduled interest payments, as well as principal repayments. |
2 Discounted. |
3 Primarily made up of long-term agreements with operational suppliers, obligations for power purchase, Pampacancha delivery obligation, concentrate handling, fleet and port services, as well as deferred consideration arising from the acquisition of Rosemont's minority interest. |
4 Represents the Peru community agreement obligations, excluding interest. |
5 Undiscounted before inflation. |
In addition to the contractual obligations included in the above payment schedule, we also have the following commitments which impact our financial position:
- A profit-sharing plan with most Manitoba employees;
- A profit-sharing plan with all Peru employees;
- Wheaton precious metals stream agreements for the 777 mine and Constancia mines;
- A net smelter returns royalty agreement related to the 777 mine; and,
- Government royalty payments related to the Constancia mine.
Outstanding Share Data
As of May 10, 2021, there were 261,420,227 common shares of Hudbay issued and outstanding. In addition, there were 1,917,779 stock options outstanding.
TREND ANALYSIS AND QUARTERLY REVIEW
A detailed quarterly and annual summary of financial and operating performance can be found in the "Summary of Results" section at the end of this MD&A. The following table sets forth selected consolidated financial information for each of our eight most recently completed quarters:
(in $ millions, except per share amounts) | | 2020 | 2019 |
2021 |
Q1 | Q4 | Q3 | Q2 | Q1 | Q4 | Q3 | Q2 |
Revenue | 313.6 | 322.3 | 316.1 | 208.9 | 245.1 | 324.5 | 291.3 | 329.4 |
Gross profit | 52.5 | 34.4 | 39.3 | (12.7) | (22.0) | 25.6 | 31.0 | 43.1 |
Profit (loss) profit before tax | (69.6) | 0.9 | (23.9) | (74.6) | (81.5) | (42.4) | (348.4) | (43.9) |
Profit (loss) | (60.1) | 7.4 | (24.0) | (51.9) | (76.1) | (1.5) | (274.8) | (54.1) |
Adjusted net (loss) earnings1 | (16.1) | (16.4) | (25.4) | (39.7) | (39.3) | (24.6) | (23.2) | (8.1) |
Earnings (loss) per share: | | | | | | | | |
Basic and diluted | (0.23) | 0.03 | (0.09) | (0.20) | (0.29) | (0.01) | (1.05) | (0.21) |
Adjusted net (loss) earnings1 per share | (0.06) | (0.06) | (0.10) | (0.15) | (0.15) | (0.09) | (0.09) | (0.03) |
Operating cash flow2 | 90.7 | 86.1 | 84.4 | 29.5 | 42.0 | 69.1 | 71.2 | 81.3 |
Adjusted EBITDA1 | 104.2 | 106.9 | 96.1 | 49.1 | 55.0 | 82.2 | 76.2 | 95.9 |
1 Adjusted net (loss) earnings, adjusted net (loss) earnings per share, and adjusted EBITDA are non-IFRS financial performance measure with no standardized definition under IFRS. For further information and a detailed reconciliation, please see the discussion under the "Non-IFRS Financial Reporting Measures" section of this MD&A. |
2 Operating cash flow before changes in non-cash working capital. |
Lower revenues in the first quarter of 2021 compared to the fourth quarter of 2020 were a function of lower sales volumes of copper from Peru due to lower throughput and grades and a delayed shipment for which revenue could not be recognized, and lower sales volumes from Manitoba related to a buildup of finished goods inventory during the quarter as a result of a lack of rail car availability. Results were negatively impacted by $75.2 million of various finance expenses related to the issuance of New Notes and a simultaneous early redemption of our Redeemed Notes. Increasing metal prices since March 2020 has resulted in steadily increasing gross profit and operating cash flows over the last four quarters.
The year 2020 saw increasing commodity prices after an initial sharp decline into mid-March with the onset of the COVID-19 pandemic. An eight-week suspension of Constancia operations in Peru due to a government declared state of emergency during the first half of 2020 and a six-week production interruption at the 777 mine during the fourth quarter of 2020 impacted our production and sales volumes for the full year; however, the shift in sales from Constancia to the second half of 2020 allowed us to benefit from the increasing commodity prices. The reduced copper production from Constancia and 777 was partially offset by increased production from Lalor.
Earnings in the fourth quarter of 2020 were negatively impacted by the 777 production interruption which resulted in $11.7 million in certain overhead costs being expensed. Earnings in the second quarter of 2020 were impacted by the temporary suspension of operations at Constancia, which resulted in $25.6 million in certain overhead costs being expensed.
For information on previous trends and quarterly reviews, refer to our MD&A for the year ended December 31, 2020, dated February 18, 2021.
NON-IFRS FINANCIAL PERFORMANCE MEASURES
Adjusted net earnings (loss), adjusted net earnings (loss) per share, adjusted EBITDA, net debt, cash cost, sustaining and all-in sustaining cash cost per pound of copper produced, cash cost and sustaining cash cost per pound of zinc produced and combined unit cost and zinc plant unit cost are non-IFRS performance measures. These measures do not have a meaning prescribed by IFRS and are therefore unlikely to be comparable to similar measures presented by other issuers. These measures should not be considered in isolation or as a substitute for measures prepared in accordance with IFRS and are not necessarily indicative of operating profit or cash flow from operations as determined under IFRS. Other companies may calculate these measures differently.
Management believes adjusted net earnings (loss) and adjusted net earnings (loss) per share better reflect the Company's performance for the current period and are better indications of its expected performance in future periods. These measures are used internally by the Company to evaluate the performance of its underlying operations and to assist with its planning and forecasting of future operating results. As such, the Company believes these measures are useful to investors in assessing the Company's underlying performance. We provide adjusted EBITDA to help users analyze our results and to provide additional information about our ongoing cash generating potential in order to assess our capacity to service and repay debt, carry out investments and cover working capital needs. Net debt is shown because it is a performance measure used by the Company to assess our financial position. Cash cost, sustaining and all-in sustaining cash cost per pound of copper produced are shown because we believe they help investors and management assess the performance of our operations, including the margin generated by the operations and the Company. Cash cost and sustaining cash cost per pound of zinc produced are shown because we believe they help investors and management assess the performance of our Manitoba operations. Combined unit cost and zinc plant unit cost is shown because we believe they help investors and management assess our cost structure and margins that are not impacted by variability in by-product commodity prices.
In the first half of 2020, a government-imposed shutdown of non-essential businesses led to a temporary suspension of our Constancia mining operations. Similarly, in the fourth quarter of 2020, a shaft incident led to a production interruption at 777 in Manitoba. Fixed overhead production costs incurred during these temporary production disruptions were directly charged to cost of sales. These costs did not contribute to production of inventory and were therefore excluded from the calculations of adjusted net earnings (loss), adjusted EBITDA and cash costs.
Adjusted Net Earnings (Loss)
Adjusted net earnings (loss) represents net earnings (loss) excluding certain impacts, net of taxes, such as mark-to-market adjustments, impairment charges and reversal of impairment charges, write-down of assets, and foreign exchange (gain) loss. These measures are not necessarily indicative of net earnings (loss) or cash flows as determined under IFRS.
The following table provides a reconciliation of earnings (loss) per the consolidated interim income statements, to adjusted net earnings (loss) for the three months ended March 31, 2021 and 2020.
| Three months ended |
(in $ millions) | Mar. 31,
2021 | Mar. 31,
2020 |
Loss for the period | (60.1) | (76.1) |
Tax recovery | (9.5) | (5.4) |
Loss before tax | (69.6) | (81.5) |
Adjusting items: | | |
Mark-to-market adjustments1 | 40.8 | 3.5 |
Peru inventory (reversal)/write-down | (0.7) | 10.4 |
Peru cost of sales direct charge from temporary shutdown | - | 6.3 |
Variable consideration adjustment - stream revenue and accretion | (1.0) | 3.8 |
Foreign exchange loss (gain) | 1.7 | (4.9) |
Write-down of unamortized transaction costs | 2.5 | - |
Premium paid on redemption of notes | 22.9 | - |
Adjusted loss before income taxes | (3.4) | (62.4) |
Tax recovery | 9.5 | 5.4 |
Tax impact of adjusting items | (18.9) | (4.8) |
Non-cash deferred tax adjustments | (3.3) | 22.5 |
| | |
Adjusted net loss | (16.1) | (39.3) |
Adjusted net loss ($/share) | (0.06) | (0.15) |
Basic weighted average number of common shares outstanding (millions) | 261.3 | 261.3 |
1 Includes changes in fair value of the embedded derivative on our Redeemed Notes, gold prepayment liability, Canadian junior mining investments, other financial assets and liabilities at fair value through profit or loss and share-based compensation expenses. |
After adjusting reported net loss for those items not considered representative of the Company's core business or indicative of future operations, the Company had an adjusted net loss in the first quarter 2021 of $16.1 million or $0.06 loss per share.
Adjusted EBITDA
Adjusted EBITDA is profit or loss before net finance expense/income, tax expense/recoveries, depreciation and amortization of property, plant and equipment and deferred revenue, as well as certain other adjustments. We calculate adjusted EBITDA by excluding certain adjustments included within our adjusted net earnings measure which we believe reflects the underlying performance of our core operating activities. The measure also removes the impact of non-cash items and financing costs that are not associated with measuring the underlying performance of our operations. However, our adjusted EBITDA is not the measure defined as EBITDA under our senior notes or revolving credit facilities and may not be comparable with performance measures with the same name reported by other companies. Adjusted EBITDA should not be considered as a substitute for profit or loss or as a better measure of liquidity than operating cash flow, which are calculated in accordance with IFRS. We provide adjusted EBITDA to help users analyze our results and to provide additional information about our ongoing cash generating potential in order to assess our capacity to service and repay debt, carry out investments and cover working capital needs.
The following table presents the reconciliation of earnings (loss) per the consolidated interim income statements, to adjusted EBITDA for the three months ended March 31, 2021 and 2020:
| Three months ended |
(in $ millions) | Mar. 31,
2021 | Mar. 31,
2020 |
Loss for the period | (60.1) | (76.1) |
| | |
Add back: Tax recovery | (9.5) | (5.4) |
Add back: Net finance expense | 108.5 | 43.1 |
Add back: Other (income) expenses | (3.3) | 5.5 |
Add back: Depreciation and amortization1 | 82.7 | 86.4 |
Less: Amortization of deferred revenue and variable consideration adjustment | (15.2) | (9.8) |
| 103.1 | 43.7 |
Adjusting items (pre-tax): | | |
Peru inventory (reversal) / write-down | (0.7) | 10.4 |
Cash portion of Peru cost of sales direct charge from temporary shutdown | - | 3.5 |
Share-based compensation expenses (recoveries)2 | 1.8 | (2.6) |
Adjusted EBITDA | 104.2 | 55.0 |
1 Includes the non-cash portion of the Peru cost of sales direct charge from the temporary shutdown of $2.8 million for the three months ended March 31, 2020. |
2 Share-based compensation expenses (recoveries) reflected in cost of sales and selling and administrative expenses. |
Net Debt
The following table presents our calculation of net debt as at March 31, 2021 and December 31, 2020:
|
(in $ thousands) | Mar. 31,
2021 | Dec. 31,
2020 |
Total long-term debt | 1,180,798 | 1,135,675 |
Cash and cash equivalents | (310,564) | (439,135) |
Net debt | 870,234 | 696,540 |
Cash Cost, Sustaining and All-in Sustaining Cash Cost (Copper Basis)
Cash cost per pound of copper produced ("cash cost") is a non-IFRS measure that management uses as a key performance indicator to assess the performance of our operations. Our calculation designates copper as our primary metal of production as it has been the largest component of revenues. The calculation is presented in four manners:
- Cash cost, before by-product credits - This measure is gross of by-product revenues and is a function of the efforts and costs incurred to mine and process all ore mined. However, the measure divides this aggregate cost over only pounds of copper produced, our primary metal of production. This measure is generally less volatile from period to period, as it is not affected by changes in the price received for by-product metals. It is, however, significantly affected by the relative mix of copper concentrate and finished zinc production, where the sale of the zinc will occur later, and an increase in production of zinc metal will tend to result in an increase in cash cost under this measure.
- Cash cost, net of by-product credits - In order to calculate the net cost to produce and sell copper, the net of by-product credits measure subtracts the revenues realized from the sale of the metals other than copper. The by-product revenues from zinc, gold, and silver are significant and are integral to the economics of our operations. The economics that support our decision to produce and sell copper would be different if we did not receive revenues from the other significant metals being extracted and processed. This measure provides management and investors with an indication of the minimum copper price consistent with positive operating margins, assuming realized by-product metal prices are consistent with those prevailing during the reporting period. It also serves as an important operating statistic that management and investors utilize to measure our operating performance versus that of our competitors. However, it is important to understand that if by-product metal prices decline alongside copper prices, the cash cost net of by-product credits would increase, requiring a higher copper price than that reported to maintain positive cash flows and operating margins.
- Sustaining cash cost, net of by-product credits - This measure is an extension of cash cost that includes cash sustaining capital expenditures, including payments on capitalized leases, capitalized sustaining exploration, net smelter returns royalties, payments on certain long-term community agreements, as well as accretion and amortization for expected decommissioning activities for producing assets. It does not include corporate selling and administrative expenses. It provides a more fulsome measurement of the cost of sustaining production than cash cost, which is focused on operating costs only.
- All-in sustaining cash cost, net of by-product credits - This measure is an extension of sustaining cash cost that includes corporate G&A, regional costs, accretion and amortization for community agreements relating to current operations, and accretion for expected decommissioning activities for non-producing assets. Due to the inclusion of corporate selling and administrative expenses, all-in sustaining cash cost is presented on a consolidated basis only.
The tables below present a detailed build-up of cash cost and sustaining cash cost, net of by-product credits, by business unit in addition to consolidated all-in sustaining cash cost, net of by-product credits, and reconciliations between cash cost, net of by-product credits, to the most comparable IFRS measures of cost of sales for the three months ended March 31, 2021 and 2020. Cash cost, net of by-product credits may not calculate exactly based on amounts presented in the tables below due to rounding.
Consolidated | Three months ended |
Net pounds of copper produced | |
(in thousands) | Mar. 31, 2021 | Mar. 31, 2020 |
Peru | 39,302 | 42,527 |
Manitoba | 14,828 | 11,784 |
Net pounds of copper produced | 54,130 | 54,311 |
Consolidated | Three months ended |
| Mar. 31, 2021 | | Mar. 31, 2020 |
Cash cost per pound of copper produced | $000s | | $/lb | | $000s | | $/lb |
Cash cost, before by-product credits | 209,866 | | 3.88 | | 183,151 | | 3.37 |
By-product credits | (153,515) | | (2.84) | | (129,892) | | (2.39) |
Cash cost, net of by-product credits | 56,351 | | 1.04 | | 53,259 | | 0.98 |
Consolidated | Three months ended |
| Mar. 31, 2021 | | Mar. 31, 2020 |
Supplementary cash cost information | $000s | | $/lb 1 | | $000s | | $/lb 1 |
By-product credits2: | | | | | | | |
Zinc | 82,315 | | 1.52 | | 60,500 | | 1.11 |
Gold 3 | 45,134 | | 0.83 | | 45,980 | | 0.85 |
Silver 3 | 15,135 | | 0.28 | | 13,952 | | 0.26 |
Molybdenum & other | 10,931 | | 0.20 | | 9,460 | | 0.17 |
Total by-product credits | 153,515 | | 2.84 | | 129,892 | | 2.39 |
Reconciliation to IFRS: | | | | | | | |
Cash cost, net of by-product credits | 56,351 | | | | 53,259 | | |
By-product credits | 153,515 | | | | 129,892 | | |
Treatment and refining charges | (11,936) | | | | (15,696) | | |
Share-based compensation expense | 184 | | | | (215) | | |
Inventory adjustments | (723) | | | | 10,375 | | |
Change in product inventory | (22,864) | | | | (3,539) | | |
Royalties | 3,903 | | | | 3,127 | | |
Overhead costs related to suspension of activities (cash) - Peru | - | | | | 3,454 | | |
Depreciation and amortization4 | 82,682 | | | | 86,439 | | |
Cost of sales5 | 261,112 | | | | 267,096 | | |
1 Per pound of copper produced. |
2 By-product credits are computed as revenue per financial statements, amortization of deferred revenue and pricing and volume adjustments. For more information, please see the realized price reconciliation table on page 28 for these figures. |
3 Gold and silver by-product credits do not include variable consideration adjustments with respect to stream arrangements. Variable consideration adjustments are cumulative adjustments to gold and silver stream deferred revenue primarily associated with the net change in mineral reserves and resources or amendments to the mine plan that would change the total expected deliverable ounces under the precious metal streaming arrangement. For the three months ended March 31, 2021 the variable consideration adjustments amounted to net income of $1,617. For the three months ended March 31, 2020 - a net expense of $2,813. |
4 Depreciation is based on concentrate sold. |
5 As per IFRS financial statements. |
Peru | Three months ended |
(in thousands) | Mar. 31, 2021 | Mar. 31, 2020 |
Net pounds of copper produced1 | 39,302 | 42,527 |
1 Contained copper in concentrate. |
Peru | | Three months ended |
| | Mar. 31, 2021 | | Mar. 31, 2020 |
Cash cost per pound of copper produced | | $000s | | $/lb | | $000s | | $/lb |
Mining | | 21,539 | | 0.55 | | 19,942 | | 0.47 |
Milling | | 43,320 | | 1.10 | | 33,338 | | 0.78 |
G&A | | 14,420 | | 0.37 | | 8,747 | | 0.21 |
Onsite costs | | 79,279 | | 2.02 | | 62,027 | | 1.46 |
Treatment & refining | | 6,614 | | 0.17 | | 10,714 | | 0.25 |
Freight & other | | 8,688 | | 0.22 | | 9,784 | | 0.23 |
Cash cost, before by-product credits | | 94,581 | | 2.41 | | 82,525 | | 1.94 |
By-product credits | | (22,864) | | (0.58) | | (22,015) | | (0.52) |
Cash cost, net of by-product credits | | 71,717 | | 1.82 | | 60,510 | | 1.42 |
Peru | | Three months ended |
| | Mar. 31, 2021 | | Mar. 31, 2020 |
Supplementary cash cost information | | $000s | | $/lb 1 | | $000s | | $/lb 1 |
By-product credits2: | | | | | | | | |
Gold3 | | 4,155 | | 0.11 | | 4,004 | | 0.09 |
Silver3 | | 9,337 | | 0.24 | | 9,453 | | 0.22 |
Molybdenum | | 9,372 | | 0.24 | | 8,558 | | 0.20 |
Total by-product credits | | 22,864 | | 0.58 | | 22,015 | | 0.52 |
Reconciliation to IFRS: | | | | | | | | |
Cash cost, net of by-product credits | | 71,717 | | | | 60,510 | | |
By-product credits | | 22,864 | | | | 22,015 | | |
Treatment and refining charges | | (6,614) | | | | (10,714) | | |
Inventory adjustments | | (723) | | | | 10,375 | | |
Share-based compensation expenses | | 19 | | | | (64) | | |
Change in product inventory | | (10,575) | | | | (243) | | |
Royalties | | 1,165 | | | | 1,480 | | |
Overhead costs related to suspension of activities (cash) | | - | | | | 3,454 | | |
Depreciation and amortization4 | | 40,435 | | | | 47,242 | | |
Cost of sales5 | | 118,288 | | | | 134,055 | | |
1 Per pound of copper produced. |
2 By-product credits are computed as revenue per financial statements, amortization of deferred revenue and pricing and volume adjustments. For more information, please see the realized price reconciliation table on page 28. |
3 Gold and silver by-product credits do not include variable consideration adjustments with respect to stream arrangements. |
4 Depreciation is based on concentrate sold. |
5 As per IFRS financial statements. |
Manitoba | | Three months ended |
(in thousands) | | Mar. 31, 2021 | | Mar. 31, 2020 |
Net pounds of copper produced1 | | 14,828 | | 11,784 |
1 Contained copper in concentrate. |
Manitoba | | Three months ended |
| | Mar. 31, 2021 | | Mar. 31, 2020 |
Cash cost per pound of copper produced | | $000s | | $/lb | | $000s | | $/lb |
Mining | | 54,420 | | 3.67 | | 44,666 | | 3.79 |
Milling | | 12,662 | | 0.85 | | 11,543 | | 0.98 |
Refining (zinc) | | 19,607 | | 1.32 | | 18,942 | | 1.61 |
G&A | | 15,787 | | 1.06 | | 14,083 | | 1.20 |
Onsite costs | | 102,476 | | 6.91 | | 89,234 | | 7.57 |
Treatment & refining | | 5,322 | | 0.36 | | 4,982 | | 0.42 |
Freight & other | | 7,487 | | 0.50 | | 6,410 | | 0.54 |
Cash cost, before by-product credits | | 115,285 | | 7.77 | | 100,626 | | 8.54 |
By-product credits | | (130,651) | | (8.81) | | (107,877) | | (9.15) |
Cash cost, net of by-product credits | | (15,366) | | (1.04) | | (7,251) | | (0.62) |
Manitoba | | Three months ended |
| | Mar. 31, 2021 | | Mar. 31, 2020 |
Supplementary cash cost information | | $000s | | $/lb 1 | | $000s | | $/lb 1 |
By-product credits2: | | | | | | | | |
Zinc | | 82,315 | | 5.55 | | 60,500 | | 5.13 |
Gold3 | | 40,979 | | 2.76 | | 41,976 | | 3.56 |
Silver3 | | 5,798 | | 0.39 | | 4,499 | | 0.38 |
Other | | 1,559 | | 0.11 | | 902 | | 0.08 |
Total by-product credits | | 130,651 | | 8.81 | | 107,877 | | 9.15 |
Reconciliation to IFRS: | | | | | | | | |
Cash cost, net of by-product credits | | (15,366) | | | | (7,251) | | |
By-product credits | | 130,651 | | | | 107,877 | | |
Treatment and refining charges | | (5,322) | | | | (4,982) | | |
Share-based compensation expenses | | 165 | | | | (151) | | |
Change in product inventory | | (12,289) | | | | (3,296) | | |
Royalties | | 2,738 | | | | 1,647 | | |
Depreciation and amortization4 | | 42,247 | | | | 39,197 | | |
Cost of sales5 | | 142,824 | | | | 133,041 | | |
1 Per pound of copper produced. | | |
2 By-product credits are computed as revenue per financial statements, amortization of deferred revenue and pricing and volume adjustments. For more information, please see the realized price reconciliation table on page 28. |
3 Gold and silver by-product credits do not include variable consideration adjustments with respect to stream arrangements. |
4 Depreciation is based on concentrate sold. |
5 As per IFRS financial statements. |
Consolidated | | Three months ended |
| | Mar. 31, 2021 | Mar. 31, 2020 |
All-in sustaining cash cost per pound of copper produced | | $000s | | $/lb | $000s | | $/lb |
Cash cost, net of by-product credits | | 56,351 | | 1.04 | 53,259 | | 0.98 |
Cash sustaining capital expenditures | | 56,456 | | 1.04 | 54,729 | | 1.01 |
Royalties | | 3,903 | | 0.07 | 3,127 | | 0.06 |
Sustaining cash cost, net of by-product credits | | 116,710 | | 2.16 | 111,115 | | 2.05 |
Corporate selling and administrative expenses & regional costs | | 10,765 | | 0.20 | 5,988 | | 0.11 |
Accretion and amortization of decommissioning and community agreements1 | | 579 | | 0.01 | 801 | | 0.01 |
All-in sustaining cash cost, net of by-product credits | | 128,054 | | 2.37 | 117,904 | | 2.17 |
Reconciliation to property, plant and equipment additions: | | | | | | | |
Property, plant and equipment additions | | 82,378 | | | 91,764 | | |
Capitalized stripping net additions | | 18,625 | | | 24,222 | | |
Decommissioning and restoration obligation net additions | | (64,504) | | | 41,759 | | |
Total accrued capital additions | | 36,499 | | | 157,745 | | |
Less other non-sustaining capital costs2 | | 2,655 | | | 121,420 | | |
Total sustaining capital costs | | 33,844 | | | 36,325 | | |
Right of use leased assets | | (1,321) | | | (2,369) | | |
Capitalized lease cash payments - operating sites | | 9,188 | | | 8,371 | | |
Community agreement cash payments | | 235 | | | 939 | | |
Accretion and amortization of decommissioning and restoration obligations | | 14,510 | | | 11,463 | | |
Cash sustaining capital expenditures | | 56,456 | | | 54,729 | | |
1 Includes accretion of decommissioning relating to non-productive sites, and accretion and amortization of current community agreements. |
2 Other non-sustaining capital costs include Arizona capitalized costs, capitalized interest, capitalized exploration, growth capital expenditures and decommissioning and restoration obligation adjustments. |
Peru | | Three months ended |
| | Mar. 31, 2021 | | Mar. 31, 2020 |
Sustaining cash cost per pound of copper produced | | $000s | | $/lb | | $000s | | $/lb |
Cash cost, net of by-product credits | | 71,717 | | 1.82 | | 60,510 | | 1.42 |
Cash sustaining capital expenditures | | 19,802 | | 0.50 | | 19,244 | | 0.45 |
Royalties | | 1,165 | | 0.03 | | 1,480 | | 0.03 |
Sustaining cash cost per pound of copper produced | | 92,684 | | 2.36 | | 81,234 | | 1.91 |
Manitoba | | Three months ended |
| | Mar. 31, 2021 | | Mar. 31, 2020 |
Sustaining cash cost per pound of copper produced | | $000s | | $/lb | | $000s | | $/lb |
Cash cost, net of by-product credits | | (15,366) | | (1.04) | | (7,251) | | (0.62) |
Cash sustaining capital expenditures | | 36,654 | | 2.47 | | 35,485 | | 3.01 |
Royalties | | 2,738 | | 0.18 | | 1,647 | | 0.14 |
Sustaining cash cost per pound of copper produced | | 24,026 | | 1.62 | | 29,881 | | 2.54 |
Zinc Cash Cost and Zinc Sustaining Cash Cost
Cash cost per pound of zinc produced ("zinc cash cost") is a non-IFRS measure that management uses as a key performance indicator to assess the performance of our Manitoba operations. This alternative cash cost calculation designates zinc as the primary metal of production as it is the largest component of revenues for our Manitoba business unit and should therefore be less volatile over time than Manitoba cash cost per pound of copper. The calculation is presented in three manners:
- Zinc cash cost, before by-product credits - This measure is gross of by-product revenues and is a function of the efforts and costs incurred to mine and process all ore mined. However, the measure divides this aggregate cost over only pounds of zinc produced, our primary metal of production. This measure is generally less volatile from period to period, as it is not affected by changes in the price received for by-product metals. It is, however, significantly affected by the relative mix of copper concentrate and finished zinc production, where the sale of the copper will occur later, and an increase in production of copper metal will tend to result in an increase in zinc cash cost under this measure.
- Zinc cash cost, net of by-product credits - In order to calculate the net cost to produce and sell zinc, the net of by-product credits measure subtracts the revenues realized from the sale of the metals other than zinc. The by-product revenues from copper, gold, and silver are significant and are integral to the economics of our Manitoba operation. The economics that support our decision to produce and sell zinc would be different if we did not receive revenues from the other significant metals being extracted and processed. This measure provides management and investors with an indication of the minimum zinc price consistent with positive operating margins, assuming realized by-product metal prices are consistent with those prevailing during the reporting period. It also serves as an important operating statistic that management and investors utilize to measure our operating performance at our Manitoba operation versus that of our competitors. However, it is important to understand that if by-product metal prices decline alongside zinc prices, the zinc cash cost net of by-product credits would increase, requiring a higher zinc price than that reported to maintain positive cash flows and operating margins.
- Zinc sustaining cash cost, net of by-product credits - This measure is an extension of zinc cash cost that includes cash sustaining capital expenditures, capitalized exploration, net smelter returns royalties, as well as accretion and amortization for expected decommissioning activities for producing assets. It does not include corporate selling and administrative expenses. It provides a more fulsome measurement of the cost of sustaining production than zinc cash cost, which is focused on operating costs only.
The tables below present a detailed build-up of zinc cash cost and zinc sustaining cash cost, net of by-product credits, for the Manitoba business unit, and reconciliations between zinc cash cost, net of by-product credits, to the most comparable IFRS measures of cost of sales for the three months ended March 31, 2021 and 2020. Zinc cash cost, net of by-product credits, may not calculate exactly based on amounts presented in the tables below due to rounding.
Manitoba | | Three months ended |
(in thousands) | | Mar. 31, 2021 | | Mar. 31, 2020 |
Net pounds of zinc produced1 | | 61,597 | | 67,230 |
1 Contained zinc in concentrate. | | | | |
Manitoba | Three months ended |
| Mar. 31, 2021 | | Mar. 31, 2020 |
Cash cost per pound of zinc produced | $000s | | $/lb | | $000s | | $/lb |
Cash cost, before by-product credits1 | 115,285 | | 1.87 | | 100,626 | | 1.50 |
By-product credits | (104,079) | | (1.69) | | (70,279) | | (1.05) |
Zinc cash cost, net of by-product credits | 11,206 | | 0.18 | | 30,347 | | 0.45 |
1 For additional detail on cash cost, before by-product credits please see page 45 of this MD&A. |
Manitoba | | Three months ended |
| | Mar. 31, 2021 | | Mar. 31, 2020 |
Supplementary cash cost information | | $000s | | $/lb 1 | | $000s | | $/lb 1 |
By-product credits2: | | | | | | | | |
Copper | | 55,743 | | 0.90 | | 22,902 | | 0.34 |
Gold3 | | 40,979 | | 0.67 | | 41,976 | | 0.62 |
Silver3 | | 5,798 | | 0.09 | | 4,499 | | 0.07 |
Other | | 1,559 | | 0.03 | | 902 | | 0.01 |
Total by-product credits | | 104,079 | | 1.69 | | 70,279 | | 1.05 |
Reconciliation to IFRS: | | | | | | | | |
Cash cost, net of by-product credits | | 11,206 | | | | 30,347 | | |
By-product credits | | 104,079 | | | | 70,279 | | |
Treatment and refining charges | | (5,322) | | | | (4,982) | | |
Share-based compensation expenses | | 165 | | | | (151) | | |
Change in product inventory | | (12,289) | | | | (3,296) | | |
Royalties | | 2,738 | | | | 1,647 | | |
Depreciation and amortization4 | | 42,247 | | | | 39,197 | | |
Cost of sales5 | | 142,824 | | | | 133,041 | | |
1 Per pound of zinc produced. |
2 By-product credits are computed as revenue per financial statements, amortization of deferred revenue and pricing and volume adjustments. For more information, please see the realized price reconciliation table on page 28. |
3 Gold and silver by-product credits do not include variable consideration adjustments with respect to stream arrangements. |
4 Depreciation is based on concentrate sold. |
5 As per IFRS financial statements. |
Manitoba | | Three months ended |
| | Mar. 31, 2021 | | Mar. 31, 2020 |
Sustaining cash cost per pound of zinc produced | | $000s | | $/lb | | $000s | | $/lb |
Zinc cash cost, net of by-product credits | | 11,206 | | 0.18 | | | 30,347 | | 0.45 | |
Cash sustaining capital expenditures | | 36,654 | | 0.60 | | | 35,485 | | 0.53 | |
Royalties | | 2,738 | | 0.04 | | | 1,647 | | 0.02 | |
Sustaining cash cost per pound of zinc produced | | 50,598 | | 0.82 | | | 67,479 | | 1.00 | |
Combined Unit Cost & Zinc Plant Unit Cost Reconciliation
Combined unit cost ("unit cost") and zinc plant unit cost is a non-IFRS measure that management uses as a key performance indicator to assess the performance of our mining and milling operations. Combined unit cost and zinc plant unit cost are calculated by dividing the cost of sales by mill throughput and refined zinc metal produced, respectively. This measure is utilized by management and investors to assess our cost structure and margins and compare it to similar information provided by other companies in our industry. Unlike cash cost, this measure is not impacted by variability in by-product commodity prices since there are no by-product deductions; costs associated with profit-sharing and similar costs are excluded because of their correlation to external metal prices. In addition, the unit costs are reported in the functional currency of the operation which minimizes the impact of foreign currency fluctuations. In all, the unit cost measures provide an alternative perspective on operating cost performance with minimal impact from external market prices. In the first half of 2020, as a result of the temporary suspension of operations in Peru, fixed overhead production costs incurred during the suspension were directly charged to cost of sales. These costs did not contribute to production of inventory and were therefore excluded from the calculation of combined unit costs.
The tables below present a detailed combined unit cost and zinc plant unit costs for the Manitoba business unit and combined unit cost for the Peru business unit, and reconciliations between these measures to the most comparable IFRS measures of cost of sales for the three months ended March 31, 2021 and 2020.
Peru | | Three months ended |
(in thousands except unit cost per tonne) | | Mar. 31,
2021 | | Mar. 31,
2020 |
Combined unit cost per tonne processed | | |
Mining | | 21,539 | | 19,942 |
Milling | | 43,320 | | 33,338 |
G&A 1 | | 14,420 | | 8,747 |
Other G&A 2 | | 19 | | 513 |
Unit cost | | 79,298 | | 62,540 |
Tonnes ore milled | | 6,363 | | 6,719 |
Combined unit cost per tonne | | 12.46 | | 9.31 |
Reconciliation to IFRS: | | | | |
Unit cost | | 79,298 | | 62,540 |
Freight & other | | 8,688 | | 9,784 |
Other G&A | | (19) | | (513) |
Share-based compensation expenses | | 19 | | (64) |
Inventory adjustments | | (723) | | 10,375 |
Change in product inventory | | (10,575) | | (243) |
Royalties | | 1,165 | | 1,480 |
Overhead costs related to suspension of activities (cash) | | - | | 3,454 |
Depreciation and amortization | | 40,435 | | 47,242 |
Cost of sales3 | | 118,288 | | 134,055 |
1 G&A as per cash cost reconciliation above. |
2 Other G&A primarily includes profit sharing costs. |
3 As per IFRS financial statements. |
Manitoba | | Three months ended |
(in thousands except tonnes ore milled and unit cost per tonne) | | Mar. 31,
2021 | | Mar. 31,
2020 |
Combined unit cost per tonne processed | | |
Mining | | 54,420 | | 44,666 |
Milling | | 12,662 | | 11,543 |
G&A 1 | | 15,787 | | 14,083 |
Less: G&A allocated to zinc metal production | | (3,818) | | (4,159) |
Less: Other G&A related to profit sharing costs | | (2,179) | | - |
Unit cost | | 76,872 | | 66,133 |
USD/CAD implicit exchange rate | | 1.27 | | 1.34 |
Unit cost - C$ | | 97,341 | | 88,875 |
Tonnes ore milled | | 644,730 | | 702,376 |
Combined unit cost per tonne - C$ | | 151 | | 127 |
Reconciliation to IFRS: | | | | |
Unit cost | | 76,872 | | 66,133 |
Freight & other | | 7,487 | | 6,410 |
Refined (zinc) | | 19,607 | | 18,942 |
G&A allocated to zinc metal production | | 3,818 | | 4,159 |
Other G&A related to profit sharing | | 2,179 | | - |
Share-based compensation expenses | | 165 | | (151) |
Change in product inventory | | (12,289) | | (3,296) |
Royalties | | 2,738 | | 1,647 |
Depreciation and amortization | | 42,247 | | 39,197 |
Cost of sales2 | | 142,824 | | 133,041 |
1 G&A as per cash cost reconciliation above. |
2 As per IFRS financial statements. |
Manitoba | | Three months ended |
(in thousands except zinc plant unit cost per pound) | | Mar. 31,
2021 | | Mar. 31,
2020 |
Zinc plant unit cost | | |
Zinc plant costs | | 19,607 | | 18,942 |
G&A 1 | | 15,787 | | 14,083 |
Less: G&A allocated to other areas | | (9,790) | | (9,924) |
Less: Other G&A related to profit sharing | | (2,179) | | - |
Zinc plant unit cost | | 23,425 | | 23,101 |
USD/CAD implicit exchange rate | | 1.27 | | 1.34 |
Zinc plant unit cost - C$ | | 29,663 | | 30,911 |
Refined metal produced (in pounds) | | 58,440 | | 62,757 |
Zinc plant unit cost per pound - C$ | | 0.51 | | 0.49 |
Reconciliation to IFRS: | | | | |
Zinc plant unit cost | | 23,425 | | 23,101 |
Freight & other | | 7,487 | | 6,410 |
Mining | | 54,420 | | 44,666 |
Milling | | 12,662 | | 11,543 |
G&A allocated to other areas | | 9,790 | | 9,924 |
Other G&A related to profit sharing | | 2,179 | | - |
Share-based compensation expenses | | 165 | | (151) |
Change in product inventory | | (12,289) | | (3,296) |
Royalties | | 2,738 | | 1,647 |
Depreciation and amortization | | 42,247 | | 39,197 |
Cost of sales2 | | 142,824 | | 133,041 |
1 G&A as per cash cost reconciliation above. |
2 As per IFRS financial statements. |
ACCOUNTING CHANGES AND CRITICAL ESTIMATES
New standards and interpretations adopted
As of January 1, 2021, we have adopted an amendment to IAS 16, Property, Plant and Equipment ("IAS 16").
For information on new standards and interpretations adopted, refer to note 4 of our March 31, 2021 consolidated interim financial statements.
Estimates and judgements
The preparation of the consolidated interim financial statements in conformity with IFRS requires us to make judgements, estimates and assumptions that affect the application of accounting policies, reported amounts of assets and liabilities, disclosure of contingent assets and liabilities at the date of the consolidated interim financial statements, and reported amounts of revenue and expenses during the reporting period. Actual results may differ from these estimates.
We review these estimates and underlying assumptions on an ongoing basis based on our experience and other factors, including expectations of future events that we believe to be reasonable under the circumstances. Revisions to accounting estimates are recognized in the period in which the estimates are revised and in any future periods affected. Certain accounting estimates and judgements have been identified as being "critical" to the presentation of our financial condition and results of operations because they require us to make subjective and/or complex judgments about matters that are inherently uncertain; or there is a reasonable likelihood that materially different amounts could be reported under different conditions or using different assumptions and estimates.
For more information on judgements and estimates, refer to note 2 of our March 31, 2021 consolidated interim financial statements.
CHANGES IN INTERNAL CONTROL OVER FINANCIAL REPORTING
Management is responsible for establishing and maintaining adequate internal control over financial reporting ("ICFR"). ICFR is designed to provide reasonable assurance regarding the reliability of financial reporting and the preparation of financial statements for external purposes in accordance with IFRS.
We did not make any changes to ICFR during the three months ended March 31, 2021 that materially affected or are reasonably likely to materially affect our ICFR.
NOTES TO READER
Forward-Looking Information
This MD&A contains forward-looking information within the meaning of applicable Canadian and United States securities legislation. All information contained in this MD&A, other than statements of current and historical fact, is forward-looking information. Often, but not always, forward-looking information can be identified by the use of words such as "plans", "expects", "budget", "guidance", "scheduled", "estimates", "forecasts", "strategy", "target", "intends", "objective", "goal", "understands", "anticipates" and "believes" (and variations of these or similar words) and statements that certain actions, events or results "may", "could", "would", "should", "might" "occur" or "be achieved" or "will be taken" (and variations of these or similar expressions). All of the forward-looking information in this MD&A is qualified by this cautionary note.
Forward-looking information includes, but is not limited to, production, cost and capital and exploration expenditure guidance and potential revisions to such guidance, anticipated production at our mines and processing facilities, expectations regarding the impact of the COVID-19 pandemic on our operations, financial condition and prospects, and our ability to effectively engage with local communities in Peru and other stakeholders, expectations regarding the timing of mining activities at the Pampacancha deposit and any additional delivery obligations under the Constancia stream agreement, the anticipated timing, cost and benefits of developing the Rosemont project and the outcome of litigation challenging Rosemont's permits, expectations regarding the Copper World exploration program, expectations regarding the Lalor gold strategy, including the refurbishment, commissioning and ramp-up of the New Britannia mill and the expectations regarding the mine plan for the 1901 deposit, increasing the mining rate at Lalor and optimizing the Stall and New Britannia mills, the possibility of converting inferred mineral resource estimates to higher confidence categories, the potential and our anticipated plans for advancing our mining properties surrounding Constancia and elsewhere in Peru, anticipated mine plans, anticipated metals prices and the anticipated sensitivity of our financial performance to metals prices, events that may affect our operations and development projects, anticipated cash flows from operations and related liquidity requirements, the anticipated effect of external factors on revenue, such as commodity prices, estimation of mineral reserves and resources, mine life projections, reclamation costs, economic outlook, government regulation of mining operations, and business and acquisition strategies. Forward-looking information is not, and cannot be, a guarantee of future results or events. Forward-looking information is based on, among other things, opinions, assumptions, estimates and analyses that, while considered reasonable by us at the date the forward-looking information is provided, inherently are subject to significant risks, uncertainties, contingencies and other factors that may cause actual results and events to be materially different from those expressed or implied by the forward-looking information.
The material factors or assumptions that we identified and were applied by us in drawing conclusions or making forecasts or projections set out in the forward-looking information include, but are not limited to:
- our ability to continue to operate safely and at full capacity during the COVID-19 pandemic;
- the availability, global supply and effectiveness of COVID-19 vaccines, the effective distribution of such vaccines in the countries in which we operate, the lessening of restrictions related to COVID-19, and the anticipated rate and timing for each of the foregoing;
- the ability to achieve production and unit cost guidance;
- no significant interruptions to our operations or significant delays to our development projects in Manitoba and Peru due to the COVID-19 pandemic;
- the timing of development and production activities on the Pampacancha deposit;
- the availability of spending reductions and liquidity options;
- no significant unanticipated delays to the development of Pampacancha;
- the successful completion of the New Britannia project on budget and on schedule;
- the successful outcome of the Rosemont litigation;
- the successful renegotiation of collective agreements with the labour unions that represent certain of our employees in Manitoba and Peru;
- the success of mining, processing, exploration and development activities;
- the scheduled maintenance and availability of our processing facilities;
- the accuracy of geological, mining and metallurgical estimates;
- anticipated metals prices and the costs of production;
- the supply and demand for metals we produce;
- the supply and availability of all forms of energy and fuels at reasonable prices;
- no significant unanticipated operational or technical difficulties;
- the execution of our business and growth strategies, including the success of our strategic investments and initiatives;
- the availability of additional financing, if needed;
- the ability to complete project targets on time and on budget and other events that may affect our ability to develop our projects;
- the timing and receipt of various regulatory and governmental approvals;
- the availability of personnel for our exploration, development and operational projects and ongoing employee relations;
- maintaining good relations with the labour unions that represent certain of our employees in Manitoba and Peru;
- maintaining good relations with the communities in which we operate, including the neighbouring Indigenous communities and local governments;
- no significant unanticipated challenges with stakeholders at our various projects;
- no significant unanticipated events or changes relating to regulatory, environmental, health and safety matters;
- no contests over title to our properties, including as a result of rights or claimed rights of Indigenous peoples or challenges to the validity of our unpatented mining claims;
- the timing and possible outcome of pending litigation and no significant unanticipated litigation;
- certain tax matters, including, but not limited to current tax laws and regulations and the refund of certain value added taxes from the Canadian and Peruvian governments; and
- no significant and continuing adverse changes in general economic conditions or conditions in the financial markets (including commodity prices and foreign exchange rates).
The risks, uncertainties, contingencies and other factors that may cause actual results to differ materially from those expressed or implied by the forward-looking information may include, but are not limited to, risks associated with the COVID-19 pandemic and its effect on our operations, financial condition, projects and prospects, the possibility of a global recession arising from the COVID-19 pandemic and attempts to control it, the political situation in Peru, risks generally associated with the mining industry, such as economic factors (including future commodity prices, currency fluctuations, energy prices and general cost escalation), uncertainties related to the development and operation of our projects, risks related to the U.S. district court's recent decisions to set aside the U.S. Forest Service's FROD and the Biological Opinion for Rosemont and related appeals and other legal challenges, risks related to the new Lalor mine plan, including the schedule for the refurbishment, commissioning and ramp-up of the New Britannia mill and the ability to convert inferred mineral resource estimates to higher confidence categories, risks related to the schedule for mining the Pampacancha deposit (including risks associated with COVID-19 and risks associated with the impact of any schedule delays), dependence on key personnel and employee and union relations, risks related to political or social unrest or change, risks in respect of Indigenous and community relations, rights and title claims, operational risks and hazards, including the cost of maintaining and upgrading the Company's tailings management facilities and any unanticipated environmental, industrial and geological events and developments and the inability to insure against all risks, failure of plant, equipment, processes, transportation and other infrastructure to operate as anticipated, compliance with government and environmental regulations, including permitting requirements and anti-bribery legislation, depletion of our reserves, volatile financial markets that may affect our ability to obtain additional financing on acceptable terms, the failure to obtain required approvals or clearances from government authorities on a timely basis, uncertainties related to the geology, continuity, grade and estimates of mineral reserves and resources, and the potential for variations in grade and recovery rates, uncertain costs of reclamation activities, our ability to comply with our pension and other post-retirement obligations, our ability to abide by the covenants in our debt instruments and other material contracts, tax refunds, hedging transactions, as well as the risks discussed under the heading "Financial Risk Management" in this MD&A and under the heading "Risk Factors" in our most recent Annual Information Form.
Should one or more risk, uncertainty, contingency or other factor materialize or should any factor or assumption prove incorrect, actual results could vary materially from those expressed or implied in the forward-looking information. Accordingly, you should not place undue reliance on forward-looking information. We do not assume any obligation to update or revise any forward-looking information after the date of this MD&A or to explain any material difference between subsequent actual events and any forward-looking information, except as required by applicable law.
Note to United States Investors
This MD&A has been prepared in accordance with the requirements of the securities laws in effect in Canada, which may differ materially from the requirements of United States securities laws applicable to U.S. issuers.
Qualified Person and NI 43-101
The technical and scientific information in this MD&A related to the Rosemont project has been approved by Cashel Meagher, P. Geo, our Senior Vice President and Chief Operating Officer. The technical and scientific information related to our other material mineral projects contained in this MD&A has been approved by Olivier Tavchandjian, P. Geo, our Vice President, Exploration and Geology. Messrs. Meagher and Tavchandjian are qualified persons pursuant to NI 43-101. For a description of the key assumptions, parameters and methods used to estimate mineral reserves and resources at Hudbay's material properties, as well as data verification procedures and a general discussion of the extent to which the estimates of scientific and technical information may be affected by any known environmental, permitting, legal title, taxation, sociopolitical, marketing or other relevant factors, please see the technical reports for our material properties as filed by us on SEDAR at www.sedar.com.
Readers should be aware that the Mason PEA referred to in this MD&A is preliminary in nature, includes inferred resources that are considered too speculative to have the economic considerations applied to them that would enable them to be categorized as mineral reserves and there is no certainty the preliminary economic assessment for Mason will be realized. For further information on the Mason PEA, please refer to the news release dated April 6, 2021.
SUMMARY OF RESULTS
The following unaudited tables set out a summary of quarterly and annual results for the Company.
| | 2021 | 2020 | 2019 |
| | Q1 | 2020 | Q4 | Q3 | Q2 | Q1 | 2019 | Q4 | Q3 | Q2 |
Consolidated Financial Condition ($000s) | | | | | | | | | |
Cash and cash equivalents | | $ | 310,564 | | $ | 439,135 | | $ | 439,135 | | $ | 449,014 | | $ | 391,136 | | $ | 305,997 | | $ | 396,146 | | $ | 396,146 | | $ | 398,438 | | $ | 489,527 | |
Total long-term debt | | 1,180,798 | | 1,135,675 | | 1,135,675 | | 1,175,104 | | 988,418 | | 988,074 | | 985,255 | | 985,255 | | 976,272 | | 977,196 | |
Net debt1 | | 870,234 | | 696,540 | | 696,540 | | 726,090 | | 597,282 | | 682,077 | | 589,109 | | 589,109 | | 577,834 | | 487,669 | |
Consolidated Financial Performance ($000s except per share amounts) | | | | | | | | | | |
Revenue | | $ | 313,624 | | $ | 1,092,418 | | $ | 322,290 | | $ | 316,108 | | $ | 208,913 | | $ | 245,105 | | $ | 1,237,439 | | $ | 324,485 | | $ | 291,282 | | $ | 329,414 | |
Cost of sales | | 261,112 | | 1,053,418 | | 287,923 | | 276,830 | | 221,567 | | 267,096 | | 1,085,897 | | 298,852 | | 260,327 | | 286,272 | |
Earnings (loss) before tax | | (69,592) | | (179,089) | | 911 | | (23,944) | | (74,604) | | (81,452) | | (452,763) | | (42,352) | | (348,367) | | (43,931) | |
Earnings (loss) | | (60,102) | | (144,584) | | 7,406 | | (23,955) | | (51,901) | | (76,134) | | (343,810) | | (1,455) | | (274,796) | | (54,145) | |
Basic and diluted (loss) earnings per share | | $ | (0.23) | | $ | (0.55) | | $ | 0.03 | | $ | (0.09) | | $ | (0.20) | | $ | (0.29) | | $ | (1.32) | | $ | (0.01) | | $ | (1.05) | | $ | (0.21) | |
Adjusted (loss) earnings per share 1 | $ | (0.06) | | $ | (0.46) | | $ | (0.06) | | $ | (0.10) | | $ | (0.15) | | $ | (0.15) | | $ | (0.18) | | $ | (0.09) | | $ | (0.09) | | $ | (0.03) | |
Operating cash flow before change in non-cash working capital 1 | 90,656 | | 241,863 | | 86,071 | | 84,383 | | 29,457 | | 41,951 | | 307,284 | | 69,141 | | 71,204 | | 81,259 | |
Adjusted EBITDA 1, 2 | | 104.2 | | 306.7 | | 106.9 | | 96.1 | | 49.1 | | 55.0 | | 358.5 | | 82.2 | | 76.2 | | 95.9 | |
Consolidated Operational Performance | | | | | | | | | | |
Contained metal in concentrate produced 3 | | | | | | | | | | | |
Copper | tonnes | 24,553 | | 95,333 | | 27,278 | | 25,395 | | 18,026 | | 24,635 | | 137,179 | | 32,422 | | 36,422 | | 30,363 | |
Gold | ounces | 35,500 | | 124,622 | | 32,376 | | 29,277 | | 32,614 | | 30,355 | | 114,692 | | 32,712 | | 28,319 | | 28,099 | |
Silver | ounces | 696,673 | | 2,750,873 | | 730,679 | | 671,685 | | 580,817 | | 767,692 | | 3,585,330 | | 930,137 | | 924,191 | | 811,807 | |
Zinc | tonnes | 27,940 | | 118,130 | | 25,843 | | 30,570 | | 31,222 | | 30,495 | | 119,106 | | 30,592 | | 28,639 | | 31,838 | |
Molybdenum | tonnes | 294 | | 1,204 | | 333 | | 392 | | 124 | | 354 | | 1,272 | | 372 | | 262 | | 334 | |
Payable metal in concentrate sold | | | | | | | | | | | |
Copper | tonnes | 20,929 | | 88,888 | | 22,963 | | 25,903 | | 15,951 | | 24,072 | | 128,519 | | 33,715 | | 29,916 | | 33,171 | |
Gold | ounces | 25,383 | | 122,949 | | 35,179 | | 30,605 | | 30,590 | | 26,574 | | 108,999 | | 30,344 | | 25,488 | | 30,538 | |
Silver | ounces | 509,760 | | 2,585,586 | | 762,384 | | 705,495 | | 541,785 | | 575,922 | | 3,452,926 | | 909,423 | | 756,296 | | 804,301 | |
Zinc 4 | tonnes | 28,343 | | 109,347 | | 28,431 | | 26,520 | | 27,604 | | 26,792 | | 104,319 | | 28,001 | | 29,140 | | 24,224 | |
Molybdenum | tonnes | 284 | | 1,321 | | 457 | | 313 | | 120 | | 431 | | 1,186 | | 199 | | 334 | | 419 | |
Cash cost 1 | $/lb | $ | 1.04 | | $ | 0.60 | | $ | 0.43 | | $ | 0.65 | | $ | 0.29 | | $ | 0.98 | | $ | 0.83 | | $ | 0.90 | | $ | 0.71 | | $ | 0.95 | |
Sustaining cash cost | $/lb | $ | 2.16 | | $ | 1.93 | | $ | 1.97 | | $ | 2.02 | | $ | 1.59 | | $ | 2.05 | | $ | 1.72 | | $ | 2.11 | | $ | 1.62 | | $ | 1.81 | |
All-in sustaining cash cost 1 | $/lb | $ | 2.37 | | $ | 2.16 | | $ | 2.24 | | $ | 2.25 | | $ | 1.91 | | $ | 2.17 | | $ | 1.86 | | $ | 2.22 | | $ | 1.69 | | $ | 1.98 | |
1 Net debt, adjusted (loss) earnings per share, adjusted EBITDA, cash cost, sustaining cash cost and all-in sustaining cash cost per pound of copper produced, net of by-product credits, are non-IFRS financial performance measures with no standardized definition under IFRS. For further information and a detailed reconciliation, please see discussion under the "Non-IFRS Financial Reporting Measures" section of this MD&A. |
2 In millions. |
3 Metal reported in concentrate is prior to deductions associated with smelter contract terms. |
4 Includes refined zinc metal sold. |
| | 2021 | 2020 | 2019 |
| | Q1 | 2020 | Q4 | Q3 | Q2 | Q1 | 2019 | Q4 | Q3 | Q2 |
Peru Operations | | | | | | | | | | | |
Ore mined1 | tonnes | 7,747,466 | 27,529,950 | 9,313,784 | 8,455,668 | 2,775,286 | 6,985,212 | 33,308,369 | 8,049,063 | 8,413,367 | 8,211,166 |
Copper | % | 0.30 | 0.32 | 0.31 | 0.31 | 0.34 | 0.34 | 0.43 | 0.41 | 0.44 | 0.39 |
Gold | g/tonne | 0.04 | 0.03 | 0.03 | 0.03 | 0.04 | 0.03 | 0.04 | 0.04 | 0.05 | 0.04 |
Silver | g/tonne | 2.90 | 2.75 | 2.61 | 2.55 | 2.90 | 3.10 | 3.76 | 3.87 | 3.93 | 3.68 |
Molybdenum | % | 0.01 | 0.02 | 0.01 | 0.02 | 0.02 | 0.02 | 0.02 | 0.02 | 0.02 | 0.01 |
Ore milled | tonnes | 6,362,752 | 26,297,318 | 7,741,714 | 7,480,655 | 4,355,482 | 6,719,466 | 31,387,281 | 7,474,136 | 8,240,344 | 7,679,739 |
Copper | % | 0.33 | 0.34 | 0.33 | 0.33 | 0.34 | 0.34 | 0.42 | 0.42 | 0.44 | 0.37 |
Gold | g/tonne | 0.04 | 0.03 | 0.03 | 0.03 | 0.04 | 0.03 | 0.04 | 0.04 | 0.04 | 0.04 |
Silver | g/tonne | 2.84 | 2.87 | 2.74 | 2.68 | 3.04 | 3.13 | 3.64 | 3.86 | 3.76 | 3.40 |
Molybdenum | % | 0.01 | 0.02 | 0.02 | 0.02 | 0.01 | 0.02 | 0.02 | 0.02 | 0.02 | 0.01 |
Copper recovery | % | 84.1 | 83.0 | 85.3 | 83.3 | 76.6 | 84.3 | 85.7 | 85.6 | 86.0 | 84.7 |
Gold recovery | % | 52.0 | 49.8 | 52.7 | 51.6 | 43.4 | 50.2 | 48.1 | 50.0 | 48.3 | 41.3 |
Silver recovery | % | 69.9 | 66.9 | 70.1 | 66.7 | 59.6 | 68.2 | 68.2 | 68.2 | 68.9 | 65.7 |
Molybdenum recovery | % | 33.4 | 29.4 | 28.4 | 30.4 | 19.9 | 35.0 | 26.5 | 30.8 | 20.2 | 28.9 |
Contained metal in concentrate | | | | | | | | | | | |
Copper | tonnes | 17,827 | 73,150 | 21,554 | 20,803 | 11,504 | 19,290 | 113,825 | 26,659 | 31,091 | 24,232 |
Gold | ounces | 4,638 | 12,395 | 3,689 | 3,333 | 2,311 | 3,062 | 19,723 | 5,007 | 5,565 | 3,794 |
Silver | ounces | 405,714 | 1,622,972 | 477,775 | 430,208 | 253,687 | 461,302 | 2,504,769 | 631,774 | 686,258 | 551,807 |
Molybdenum | tonnes | 294 | 1,204 | 333 | 392 | 124 | 354 | 1,272 | 372 | 262 | 334 |
Payable metal sold | | | | | | | | | | | |
Copper | tonnes | 14,836 | 68,506 | 18,583 | 21,654 | 9,023 | 19,247 | 106,184 | 28,430 | 25,314 | 25,778 |
Gold | ounces | 2,963 | 10,986 | 3,297 | 3,753 | 1,317 | 2,618 | 18,956 | 4,824 | 3,858 | 4,056 |
Silver | ounces | 337,612 | 1,518,548 | 480,843 | 433,595 | 242,519 | 361,591 | 2,452,496 | 666,839 | 529,139 | 504,259 |
Molybdenum | tonnes | 284 | 1,321 | 457 | 313 | 120 | 431 | 1,186 | 199 | 334 | 419 |
Peru combined unit operating cost,2, 3 | $/tonne | $ | 12.46 | $ | 9.46 | $ | 10.17 | $ | 9.85 | $ | 7.77 | $ | 9.31 | $ | 9.50 | $ | 10.20 | $ | 8.63 | $ | 10.39 |
Peru cash cost3 | $/lb | $ | 1.82 | $ | 1.45 | $ | 1.47 | $ | 1.54 | $ | 1.31 | $ | 1.42 | $ | 1.16 | $ | 1.36 | $ | 1.06 | $ | 1.39 |
Peru sustaining cash cost3 | $/lb | $ | 2.36 | $ | 2.20 | $ | 2.58 | $ | 2.29 | $ | 1.84 | $ | 1.91 | $ | 1.65 | $ | 2.17 | $ | 1.53 | $ | 1.87 |
1 Reported tonnes and grade for ore mined are estimates based on mine plan assumptions and may not fully reconcile to ore milled. |
2 Reflects combined mine, mill and general and administrative ("G&A") costs per tonne of ore milled. Reflects the deduction of expected capitalized stripping costs. |
3 Combined unit costs, cash cost, and sustaining cash cost per pound of copper produced, net of by-product credits, are non-IFRS financial performance measures with no standardized definition under IFRS. For further information and a detailed reconciliation, please see the discussion under the "Non-IFRS Financial Reporting Measures" section of this MD&A |
| | | 2021 | 2020 | 2019 |
| | Q1 | 2020 | Q4 | Q3 | Q2 | Q1 | 2019 | Q4 | Q3 | Q2 |
Manitoba Operations | | | | | | | | | | | |
Lalor ore mined | tonnes | 421,602 | 1,654,240 | | 468,101 | 357,213 | 407,408 | 421,518 | 1,536,780 | 390,140 | 346,456 | 411,701 |
Copper | % | 0.57 | 0.74 | 0.80 | 0.66 | 0.77 | 0.70 | 0.75 | 0.80 | 0.68 | 0.73 |
Zinc | % | 5.20 | 5.73 | 5.54 | 5.98 | 6.05 | 5.43 | 6.36 | 6.20 | 6.16 | 6.34 |
Gold | g/tonne | 2.67 | 2.51 | 2.79 | 2.28 | 2.64 | 2.27 | 2.16 | 2.63 | 2.21 | 2.12 |
Silver | g/tonne | 22.75 | 25.31 | 24.96 | 21.23 | 28.4 | 26.18 | 25.51 | 28.38 | 25.56 | 22.32 |
777 ore mined | tonnes | 275,260 | 991,576 | | 164,856 | 264,905 | 281,890 | 279,925 | 1,109,782 | 269,342 | 273,319 | 288,599 |
Copper | % | 2.06 | 1.40 | 1.89 | 0.98 | 1.72 | 1.18 | 1.37 | 1.17 | 1.33 | 1.34 |
Zinc | % | 4.00 | 3.88 | 2.98 | 3.95 | 4.13 | 4.11 | 3.22 | 3.33 | 3.01 | 3.37 |
Gold | g/tonne | 2.39 | 1.90 | 1.85 | 2.01 | 1.91 | 1.82 | 1.61 | 1.52 | 1.63 | 1.60 |
Silver | g/tonne | 29.32 | 24.13 | 21.64 | 24.25 | 25.73 | 23.86 | 18.67 | 18.52 | 15.42 | 18.92 |
Stall Concentrator: | | | | | | | | | | |
Ore milled | tonnes | 361,344 | 1,412,751 | | 372,624 | 335,739 | 334,601 | 369,787 | 1,290,300 | 310,622 | 318,539 | 339,616 |
Copper | % | 0.60 | 0.73 | 0.79 | 0.68 | 0.76 | 0.70 | 0.73 | 0.80 | 0.64 | 0.71 |
Zinc | % | 5.53 | 5.76 | 5.47 | 6.11 | 6.16 | 5.38 | 6.39 | 6.24 | 6.22 | 6.36 |
Gold | g/tonne | 2.57 | 2.55 | 2.88 | 2.35 | 2.70 | 2.28 | 2.13 | 2.60 | 2.12 | 2.08 |
Silver | g/tonne | 23.40 | 25.37 | 24.43 | 22.08 | 28.72 | 26.28 | 25.48 | 28.12 | 25.16 | 22.03 |
Copper recovery | % | 85.7 | 86.2 | 87.1 | 84.0 | 86.6 | 86.5 | 85.9 | 85.9 | 84.4 | 85.6 |
Zinc recovery | % | 91.1 | 91.9 | 90.9 | 92.7 | 92.4 | 91.4 | 91.1 | 90.7 | 91.8 | 91.2 |
Gold recovery | % | 57.5 | 60.0 | 59.5 | 57.4 | 62.3 | 60.9 | 56.8 | 61.1 | 54.3 | 52.5 |
Silver recovery | % | 56.2 | 60.4 | 60.3 | 57.5 | 62.1 | 61.1 | 60.4 | 62.9 | 57.4 | 56.5 |
Flin Flon Concentrator: | | | | | | | | | | |
Ore milled | tonnes | 283,386 | 1,205,314 | | 225,663 | 322,156 | 324,906 | 332,589 | 1,362,006 | 374,529 | 331,216 | 367,017 |
Copper | % | 1.88 | 1.28 | 1.59 | 0.99 | 1.52 | 1.11 | 1.27 | 1.11 | 1.22 | 1.26 |
Zinc | % | 4.20 | 4.21 | 3.87 | 4.07 | 4.41 | 4.36 | 3.78 | 4.05 | 3.64 | 3.84 |
Gold | g/tonne | 2.34 | 1.96 | 1.99 | 1.99 | 1.99 | 1.88 | 1.72 | 1.75 | 1.74 | 1.71 |
Silver | g/tonne | 28.01 | 24.26 | 22.65 | 24.01 | 25.56 | 24.33 | 19.84 | 20.56 | 17.36 | 19.82 |
Copper recovery | % | 91.3 | 86.0 | 88.1 | 83.9 | 87.3 | 84.1 | 88.0 | 86.9 | 89.1 | 88.0 |
Zinc recovery | % | 81.8 | 85.5 | 83.9 | 87.9 | 84.9 | 85.0 | 85.5 | 85.8 | 86.7 | 86.0 |
Gold recovery | % | 64.0 | 56.0 | 56.6 | 55.3 | 58.6 | 53.5 | 59.4 | 56.1 | 59.1 | 61.3 |
Silver recovery | % | 54.1 | 45.9 | 46.5 | 42.0 | 50.7 | 44.3 | 50.8 | 49.2 | 48.7 | 53.0 |
| | 2021 | 2020 | 2019 |
| | Q1 | 2020 | Q4 | Q3 | Q2 | Q1 | 2019 | Q4 | Q3 | Q2 |
Manitoba Operations (continued) | | | | | | | | | | |
Total Manitoba contained metal in concentrate produced | | | | | | | | | |
Copper | tonnes | 6,726 | | 22,183 | | 5,724 | | 4,592 | | 6,522 | | 5,345 | | 23,354 | | 5,763 | | 5,331 | | 6,131 | |
Zinc | tonnes | 27,940 | | 118,130 | | 25,843 | | 30,570 | | 31,222 | | 30,495 | | 119,106 | | 30,592 | | 28,639 | | 31,838 | |
Gold | ounces | 30,862 | | 112,227 | | 28,687 | | 25,944 | | 30,303 | | 27,293 | | 94,969 | | 27,705 | | 22,754 | | 24,305 | |
Silver | ounces | 290,959 | | 1,127,901 | | 252,904 | | 241,477 | | 327,130 | | 306,390 | | 1,080,561 | | 298,363 | | 237,933 | | 260,000 | |
Total Manitoba payable metal sold | | | | | | | | | | |
Copper | tonnes | 6,093 | | 20,382 | | 4,380 | | 4,249 | | 6,928 | | 4,825 | | 22,335 | | 5,285 | | 4,602 | | 7,393 | |
Zinc1 | tonnes | 28,343 | | 109,347 | | 28,431 | | 26,520 | | 27,604 | | 26,792 | | 104,346 | | 28,001 | | 29,140 | | 24,224 | |
Gold | ounces | 22,420 | | 111,963 | | 31,882 | | 26,852 | | 29,273 | | 23,956 | | 90,043 | | 25,520 | | 21,630 | | 26,482 | |
Silver | ounces | 172,148 | | 1,067,038 | | 281,541 | | 271,900 | | 299,266 | | 214,331 | | 1,000,430 | | 242,584 | | 227,157 | | 300,042 | |
Manitoba combined unit operating cost2,3 | C$/tonne | $ | 151 | | $ | 132 | | $ | 140 | | $ | 126 | | $ | 135 | | $ | 127 | | $ | 134 | | $ | 128 | | $ | 130 | | $ | 135 | |
Manitoba cash cost3 | $/lb | $ | (1.04) | | $ | (2.20) | | $ | (3.48) | | $ | (3.41) | | $ | (1.52) | | $ | (0.62) | | $ | (0.75) | | $ | (1.26) | | $ | (1.31) | | $ | (0.79) | |
Manitoba sustaining cash cost3 | $/lb | $ | 1.62 | | $ | 1.02 | | $ | (0.36) | | $ | 0.83 | | $ | 1.15 | | $ | 2.54 | | $ | 2.07 | | $ | 1.83 | | $ | 2.15 | | $ | 1.55 | |
1 Includes refined zinc metal sold. |
2 Reflects combined mine, mill and G&A costs per tonne of milled ore. |
3 Combined unit costs, cash cost, and sustaining cash cost per pound of copper produced, net of by-product credits, are non-IFRS financial performance measures with no standardized definition under IFRS. For further information and a detailed reconciliation, please see the discussion under the "Non-IFRS Financial Reporting Measures" section of this MD&A. |