
Management's Discussion and Analysis of
Results of Operations and Financial Condition
For the three and six months ended
June 30, 2022
August 8, 2022
INTRODUCTION
This Management's Discussion and Analysis ("MD&A") dated August 8, 2022 is intended to supplement Hudbay Minerals Inc.'s unaudited condensed consolidated interim financial statements and related notes for the three and six months ended June 30, 2022 (the "consolidated interim financial statements"). The consolidated interim financial statements have been prepared in accordance with International Financial Reporting Standards ("IFRS"), including International Accounting Standard 34, Interim Financial Reporting, as issued by the International Accounting Standards Board ("IASB").
References to "Hudbay", the "Company", "we", "us", "our" or similar terms refer to Hudbay Minerals Inc. and its direct and indirect subsidiaries as at June 30, 2022.
Readers should be aware that:
- This MD&A contains certain "forward-looking statements" and "forward-looking information" (collectively, "forward-looking information") that are subject to risk factors set out in a cautionary note contained in our MD&A.
- This MD&A has been prepared in accordance with the requirements of the securities laws in effect in Canada, which may differ materially from the requirements of United States securities laws applicable to US issuers.
- We use a number of non-IFRS financial performance measures in our MD&A.
- This MD&A includes a discussion of the results of a preliminary economic assessment of the Copper World Complex. The preliminary economic assessment is preliminary in nature, includes inferred resources that are considered too speculative geologically to have the economic considerations applied to them that would enable them to be categorized as mineral reserves and there is no certainty the preliminary economic assessment will be realized.
- The technical and scientific information in this MD&A has been approved by qualified persons based on a variety of assumptions and estimates.
For a discussion of each of the above matters, readers are urged to review the "Notes to Reader" discussion beginning on page 56 of this MD&A.
Additional information regarding Hudbay, including the risks related to our business and those that are reasonably likely to affect our consolidated financial statements in the future, is contained in our continuous disclosure materials, including our most recent Annual Information Form ("AIF"), consolidated interim financial statements and Management Information Circular available on SEDAR at www.sedar.com and on EDGAR at www.sec.gov.
All amounts are in US dollars unless otherwise noted.
OUR BUSINESS
We are a diversified mining company with long-life assets in North and South America. Our operations in Cusco (Peru) produce copper with gold, silver and molybdenum by-products. Our operations in Manitoba (Canada) produce gold with copper, zinc and silver by-products. We have an organic pipeline that includes copper development projects in Arizona and Nevada (United States), and our growth strategy is focused on the exploration, development, operation, and optimization of properties we already control, as well as other mineral assets we may acquire that fit our strategic criteria. We are governed by the Canada Business Corporations Act and our shares are listed under the symbol "HBM" on the Toronto Stock Exchange, New York Stock Exchange and Bolsa de Valores de Lima.
SUMMARY
Strong Operating and Financial Results
- Full year 2022 production and operating cost guidance is reaffirmed as second quarter production was in line with expectations and Hudbay achieved strong unit operating cost performance despite inflationary pressures from higher input prices for many services and consumables.
- Second quarter net earnings and earnings per share were $32.1 million and $0.12, respectively. After adjusting for a non-cash gain of $60.7 million primarily related to a quarterly revaluation of our Flin Flon environmental provision given higher long-term risk-free discount rates, and a $95.0 million pre-tax impairment loss related to certain specific capitalized costs and assets associated with the previous stand-alone development plan for the Rosemont deposit, among other items, second quarter adjusted net earnings1 per share were $0.12.
- Operating cash flow before change in non-cash working capital was $123.9 million and adjusted EBITDA1 was $141.4 million in the second quarter of 2022, benefiting from strong realized zinc prices and higher gold sales volumes, compared to the same period in 2021.
- Consolidated production in the second quarter included 25,668 tonnes of copper and 58,645 ounces of gold, an increase from the first quarter of 2022. Consolidated cash cost and all-in sustaining cash cost per pound of copper produced, net of by-product credits1, were $0.65 and $1.93, respectively, a significant decrease from the first quarter of 2022.
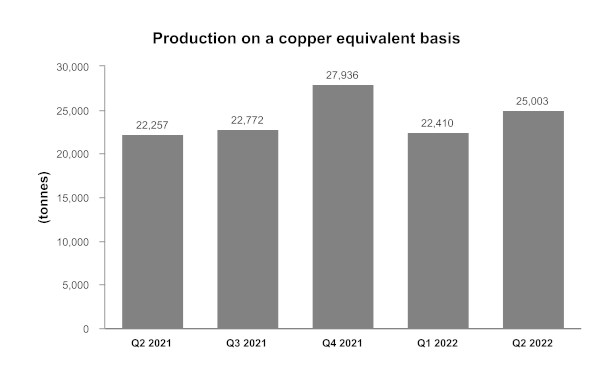
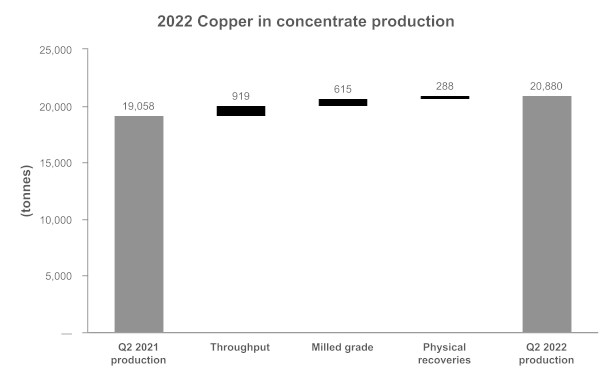
- Peru delivered strong operating performance in the second quarter with copper production of 20,880 tonnes as mill throughput and copper grades improved over the first quarter of 2022.
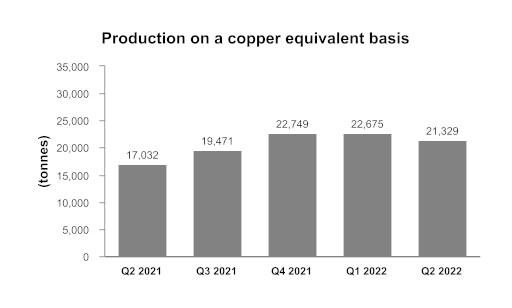
- Manitoba achieved second quarter gold production of 44,787 ounces at a cash cost per ounce of gold produced, net of by-product credits1, of negative $207 as New Britannia achieved higher than targeted throughput rates and gold recoveries continue to improve.
- After 18 years of steady production at our 777 mine in Manitoba, the final reserves were depleted in June 2022, consistent with the mine plan. Closure activities to safely decommission the 777 mine, the Flin Flon concentrator and the zinc plant commenced in the second quarter and are advancing ahead of schedule.
- Cash increased by $45.2 million during the second quarter to $258.6 million, as at June 30, 2022, mainly as a result of $165.6 million of cash generated from operations, partially offset by $78.9 million of mostly sustaining capital investments, an $18.6 million payment toward the gold prepayment liability and a $10.0 million scheduled deferred payment related to the acquisition of the former minority partner's interest in Rosemont.
Executing on Growth Initiatives
- Recently released the results of the Copper World Complex preliminary economic assessment ("PEA") which entails a two-phase mine plan that has an after-tax net present value (10%) of $1,296 million and generates an 18% internal rate of return at $3.50 per pound copper.2
- Advancing a pre-feasibility study for Phase I of the Copper World Complex, which will focus on converting the remaining inferred mineral resources to measured and indicated and evaluating many of the project optimization and upside opportunities.
- Exploration agreement on the Maria Reyna and Caballito satellite properties in Peru is nearing completion.
- Released our 19th Annual Sustainability Report in June 2022 discussing our key accomplishments and initiatives in 2021, and the Company is currently working toward specific emission reduction targets to align with the global 2030 and 2050 climate change goals.
1 Adjusted net earnings (loss) and adjusted net earnings (loss) per share, adjusted EBITDA, cash cost, sustaining cash cost, all-in sustaining cash cost per pound of copper produced, net of by-product credits, cash cost, sustaining cash cost per ounce of gold produced, net of by-product credits, and net debt are non-IFRS financial performance measures with no standardized definition under IFRS. For further information and a detailed reconciliation, please see the discussion under the "Non-IFRS Financial Reporting Measures" section of this MD&A.
2 The preliminary economic assessment for the Copper World Complex is preliminary in nature, includes inferred resources that are considered too speculative geologically to have the economic considerations applied to them that would enable them to be categorized as mineral reserves and there is no certainty the preliminary economic assessment will be realized.
Summary of Second Quarter Results
Cash generated from operating activities in the second quarter of 2022 increased to $165.6 million compared to $96.4 million in the same quarter of 2021. The increase is primarily the result of an increase in our non-cash working capital, higher realized zinc metal prices and higher gold sales volumes partially offset by lower base metal sales volumes, higher mine operating costs due to inflationary pressures and higher profit sharing. Operating cash flow before change in non-cash working capital was $123.9 million during the second quarter of 2022, reflecting a decrease of $8.9 million compared to the same period of 2021. The lower operating cash flow before changes in non-cash working capital in the second quarter of 2022 was largely due to higher mine operating costs and higher profit sharing partially offset by higher zinc prices.
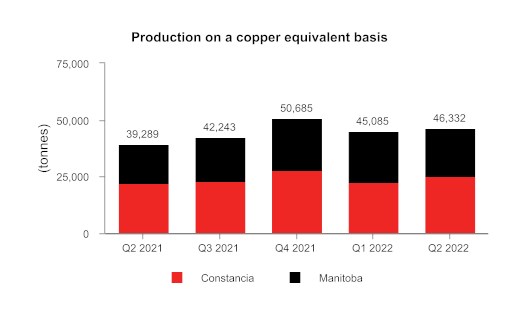
Consolidated copper production in the second quarter of 2022 increased by 9% compared to the same period in 2021 primarily as a result of higher throughput, grades and recoveries in Peru and Manitoba. Consolidated gold production in the second quarter of 2022 increased by 47% compared to the second quarter of 2021, due to higher gold grades from Pampacancha and higher gold grades at Lalor coupled with significantly higher gold recoveries at New Britannia. Consolidated zinc production in the quarter decreased by 21%, versus the comparative quarter in 2021, primarily due to the continued transition toward mining the gold lenses at Lalor and a corresponding decrease of production from the base metal zones. Consolidated silver production in the second quarter increased by 26% compared to the same period in 2021, as a result of higher grades from Lalor and Constancia offset by lower recoveries in Peru.
Net earnings and earnings per share in the second quarter of 2022 were $32.1 million and $0.12, respectively, compared to a net loss and loss per share of $3.4 million and $0.01, respectively, in the second quarter of 2021. Second quarter earnings benefited from a non-cash gain of $60.7 million mostly related to the quarterly revaluation of our Flin Flon environmental provision, which was impacted by rising long-term risk-free discount rates. Given the long term nature of the reclamation cash flows, the related environmental provision is highly sensitive to changes in long-term risk-free discount rates and, as such, we may continue to experience quarterly environmental provision revaluations. The quarterly financial results were also negatively impacted by a $95.0 million pre-tax impairment loss related to certain specific capitalized costs and assets associated with the previous stand-alone development plan for the Rosemont deposit, which were determined to no longer be recoverable.
Adjusted net earnings1 and adjusted net earnings per share1 in the second quarter of 2022 were $30.5 million and $0.12 per share, respectively, after adjusting for the non-cash gain related to the revaluation of our environmental provision and the specific asset impairment loss, among other items. This compares to an adjusted net earnings and adjusted net earnings per share of $5.4 million, and $0.02 in the same period of 2021. Second quarter adjusted EBITDA1 was $141.4 million, compared to $143.2 million in the same period of 2021.
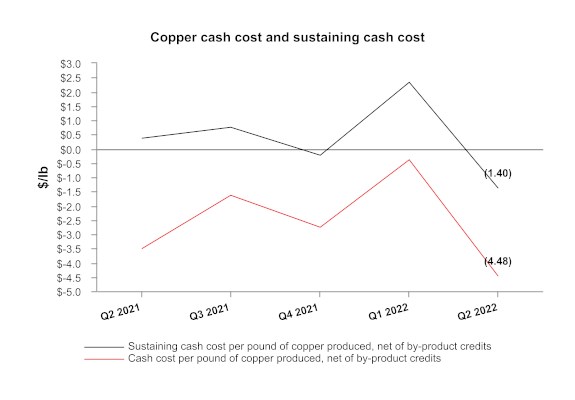
In the second quarter of 2022, consolidated cash cost per pound of copper produced, net of by-product credits1, was $0.65, compared to $0.84 in the same period in 2021. This decrease was a result of higher zinc and precious metal by-product credits and higher copper production, partially offset by higher milling and profit sharing costs. Consolidated sustaining cash cost per pound of copper produced, net of by-product credits1, was $1.87 in the second quarter of 2022 compared to $2.25 in the same period in 2021. This decrease was primarily due to the same reasons outlined above along with lower cash sustaining capital expenditures in Manitoba. Both measures were within our 2022 guidance ranges and we are reaffirming our full year consolidated cash cost guidance.
Consolidated all-in sustaining cash cost per pound of copper produced, net of by-product credits1, was $1.93 in the second quarter of 2022, lower than $2.48 in the same period in 2021, due to the same reasons outlined above along with lower corporate selling and administrative expenses.
As at June 30, 2022, our liquidity includes $258.6 million in cash as well as undrawn availability of $363.6 million under our revolving credit facilities. We expect that our current liquidity combined with cash flow from operations, particularly in the fourth quarter when production in Peru is expected to benefit from higher grades, will be sufficient to meet our liquidity needs for the foreseeable future. As such, we are well positioned to weather the volatility in commodity prices experienced during the second quarter.

1 Adjusted net earnings (loss) and adjusted net earnings (loss) per share, adjusted EBITDA, cash cost, sustaining cash cost, all-in sustaining cash cost per pound of copper produced, net of by-product credits, cash cost, sustaining cash cost per ounce of gold produced, net of by-product credits, and net debt are non-IFRS financial performance measures with no standardized definition under IFRS. For further information and a detailed reconciliation, please see the discussion under the "Non-IFRS Financial Reporting Measures" section of this MD&A.
KEY FINANCIAL RESULTS
| Financial Condition | | Jun. 30, 2022 | | | Dec. 31, 2021 | |
| (in $ thousands) |
| Cash | $ | 258,556 | | $ | 270,989 | |
| Total long-term debt | | 1,182,143 | | | 1,180,274 | |
| Net debt1 | | 923,587 | | | 909,285 | |
| Working capital2 | | 180,371 | | | 147,512 | |
| Total assets | | 4,382,727 | | | 4,616,231 | |
| Equity | | 1,601,123 | | | 1,476,828 | |
| 1 Net debt is a non-IFRS financial performance measure with no standardized definition under IFRS. For further information and a detailed reconciliation, please see discussion under the "Non-IFRS Financial Reporting Measures" section of this MD&A. |
| 2 Working capital is determined as total current assets less total current liabilities as defined under IFRS and disclosed on the consolidated financial statements. |
| Financial Performance | | Three months ended | | | Six months ended | |
| (in $ thousands, except per share amounts) | | Jun. 30, 2022 | | | Jun. 30, 2021 | | | Jun. 30, 2022 | | | Jun. 30, 2021 | |
| Revenue | $ | 415,454 | | $ | 404,242 | | $ | 794,073 | | $ | 717,866 | |
| Cost of sales | | 325,940 | | | 322,060 | | | 619,291 | | | 583,173 | |
| Earnings (loss) before tax | | 21,504 | | | 14,819 | | | 110,365 | | | (54,773 | ) |
| Net earnings (loss) | | 32,143 | | | (3,395 | ) | | 95,958 | | | (63,497 | ) |
| Basic and diluted earnings (loss) per share | | 0.12 | | | (0.01 | ) | | 0.37 | | | (0.24 | ) |
| Adjusted earnings (loss) per share1 | | 0.12 | | | 0.02 | | | 0.14 | | | (0.04 | ) |
| Operating cash flow before changes in non-cash working capital2 | | 123.9 | | | 132.8 | | | 201.0 | | | 223.4 | |
| Adjusted EBITDA1,2 | | 141.4 | | | 143.2 | | | 251.9 | | | 247.7 | |
| 1 Adjusted earnings (loss) per share and adjusted EBITDA are non-IFRS financial performance measures with no standardized definition under IFRS. For further information and a detailed reconciliation, please see discussion under the "Non-IFRS Financial Reporting Measures" section of this MD&A. |
| 2 In millions. |
KEY PRODUCTION RESULTS
| | | Three months ended | | | Three months ended | |
| | Jun. 30, 2022 | | | Jun. 30, 2021 | |
| | Peru | | | Manitoba | | | Total | | | Peru | | | Manitoba | | | Total | |
| Contained metal in concentrate and doré produced 1 | | | | | | | | | | | | | |
| Copper | tonnes | | 20,880 | | | 4,788 | | | 25,668 | | | 19,058 | | | 4,416 | | | 23,474 | |
| Gold | oz | | 13,858 | | | 44,787 | | | 58,645 | | | 10,220 | | | 29,628 | | | 39,848 | |
| Silver | oz | | 584,228 | | | 280,625 | | | 864,853 | | | 468,057 | | | 217,859 | | | 685,916 | |
| Zinc | tonnes | | - | | | 17,053 | | | 17,053 | | | - | | | 21,538 | | | 21,538 | |
| Molybdenum | tonnes | | 390 | | | - | | | 390 | | | 295 | | | - | | | 295 | |
| Payable metal sold | | | | | | | | | | | | | | | | | | |
| Copper | tonnes | | 18,473 | | | 5,177 | | | 23,650 | | | 19,946 | | | 5,230 | | | 25,176 | |
| Gold2 | oz | | 8,430 | | | 42,454 | | | 50,884 | | | 5,638 | | | 32,567 | | | 38,205 | |
| Silver2 | oz | | 484,946 | | | 253,225 | | | 738,171 | | | 315,064 | | | 262,443 | | | 577,507 | |
| Zinc3 | tonnes | | - | | | 20,793 | | | 20,793 | | | - | | | 25,361 | | | 25,361 | |
| Molybdenum | tonnes | | 208 | | | - | | | 208 | | | 265 | | | - | | | 265 | |
| 1 Metal reported in concentrate is prior to deductions associated with smelter contract terms. | |
| 2 Includes total payable gold and silver in concentrate and in doré sold. | |
| 3 Includes refined zinc metal and payable zinc in concentrate sold. | |
| | | Six months ended | | | Six months ended | |
| | Jun. 30, 2022 | | | Jun. 30, 2021 | |
| | Peru | | | Manitoba | | | Total | | | Peru | | | Manitoba | | | Total | |
| Contained metal in concentrate produced 1 | | | | | | | | | | | | | | | | |
| Copper | tonnes | | 40,046 | | | 10,324 | | | 50,370 | | | 36,885 | | | 11,142 | | | 48,027 | |
| Gold | oz | | 24,647 | | | 87,954 | | | 112,601 | | | 14,858 | | | 60,490 | | | 75,348 | |
| Silver | oz | | 1,089,796 | | | 559,414 | | | 1,649,210 | | | 873,771 | | | 508,818 | | | 1,382,589 | |
| Zinc | tonnes | | - | | | 39,305 | | | 39,305 | | | - | | | 49,478 | | | 49,478 | |
| Molybdenum | tonnes | | 596 | | | - | | | 596 | | | 589 | | | - | | | 589 | |
| Payable metal sold | | | | | | | | | | | | | | | | | | |
| Copper | tonnes | | 35,298 | | | 8,961 | | | 44,259 | | | 34,782 | | | 11,323 | | | 46,105 | |
| Gold | oz | | 22,882 | | | 76,345 | | | 99,227 | | | 8,601 | | | 54,987 | | | 63,588 | |
| Silver | oz | | 1,121,079 | | | 481,684 | | | 1,602,763 | | | 652,676 | | | 434,591 | | | 1,087,267 | |
| Zinc 2 | tonnes | | - | | | 38,099 | | | 38,099 | | | - | | | 53,704 | | | 53,704 | |
| Molybdenum | tonnes | | 421 | | | - | | | 421 | | | 549 | | | - | | | 549 | |
| | | | | | | | | | | | | | | | | | | | |
| 1 Metal reported in concentrate is prior to deductions associated with smelter contract terms. | |
| 2 Includes refined zinc metal sold and payable zinc in concentrate sold. | |
KEY COST RESULTS
| | | | Three months ended | | | Six months ended | | | Guidance | |
| | | | Jun. 30,
2022 | | | Jun. 30,
2021 | | | Jun. 30,
2022 | | | Jun. 30,
2021 | | | Annual
2022 | |
| Consolidated copper cash cost per pound of copper produced | | | | | | | | | | |
| Cash cost 1 | $/lb | | 0.65 | | | 0.84 | | | 0.87 | | | 0.94 | | | 0.60 - 1.05 | |
| Peru | $/lb | | 1.82 | | | 1.85 | | | 1.69 | | | 1.84 | | | 1.10 - 1.40 | |
| Manitoba | $/lb | | (4.48 | ) | | (3.51 | ) | | (2.29 | ) | | (2.02 | ) | | - | |
| Sustaining cash cost 1 | $/lb | | 1.87 | | | 2.25 | | | 2.07 | | | 2.20 | | | 1.60 - 2.25 | |
| Peru | $/lb | | 2.62 | | | 2.69 | | | 2.45 | | | 2.53 | | | | |
| Manitoba | $/lb | | (1.40 | ) | | 0.36 | | | 0.60 | | | 1.12 | | | | |
| All-in sustaining cash cost1 | $/lb | | 1.93 | | | 2.48 | | | 2.23 | | | 2.42 | | | | |
| Manitoba gold cash cost per ounce of gold produced | | | | | | | | | | |
| Cash cost 1,4 | $/oz | | (207 | ) | | - | | | 99 | | | - | | | 300 - 550 | |
| Sustaining cash cost 1,4 | $/oz | | 519 | | | - | | | 847 | | | - | | | | |
| Combined mine/mill unit operating cost per tonne of copper processed 1,2 | | | | |
| Peru 3 | $/tonne | | 12.02 | | | 10.40 | | | 12.19 | | | 11.02 | | | 10.10 - 12.90 | 5 |
| Manitoba | C$/tonne | | 168 | | | 148 | | | 172 | | | 150 | | | 170 - 185 | |
| 1 Cash cost, sustaining cash cost, all-in sustaining cash cost per pound of copper produced, net of by-product credits, gold cash cost, sustaining cash cost per ounce of gold produced, net of by-product credits, and unit operating cost are non-IFRS financial performance measures with no standardized definition under IFRS. For further information and a detailed reconciliation, please see the discussion under the "Non-IFRS Financial Reporting Measures" section of this MD&A. |
| 2 Reflects combined mine, mill and G&A costs per tonne of milled ore. Peru costs reflect the deduction of expected capitalized stripping costs. |
| 3 Excludes approximately $1.3 million, or $0.16 per tonne and $3.6 million, or $0.24 per tonne, of COVID-related costs during the three and six months ended June 30, 2022, respectively and $6.3 million, or $0.85 and $10.9 million or $0.79 per tonne during the three and six months ended June 30, 2021. |
| 4 Cash cost and sustaining cash cost per ounce of gold produced, net of by-product credits were introduced in 2022 and do not have a published comparative. |
| 5 Combined unit cost guidance for 2022 excludes COVID-19 related costs. |
RECENT DEVELOPMENTS
Robust Preliminary Economic Assessment Released for Copper World Complex
In June, we released the results of the PEA of our 100%-owned Copper World Complex in Arizona, which includes the recently discovered Copper World deposits along with the Rosemont deposit. Highlights of the PEA include:
- Two-phase mine plan has an after-tax net present value (10%) of $1,296 million and generates an 18% internal rate of return at $3.50 per pound copper1.
- The processing facilities are planned to have annual production capacity of 100,000 tonnes of copper cathode during Phase I and 125,000 tonnes of copper cathode during Phase II, and have been designed to reduce the project's carbon footprint to produce "Made in America" copper.
- Supports U.S. copper supply through onshore production of copper cathode expected to be sold entirely to domestic customers and eliminates greenhouse gas ("GHG") and sulfur emissions associated with overseas shipping and processing.
- Phase I reflects a stand-alone operation on private land and patented mining claims over a 16-year mine life with average annual copper production of approximately 86,000 tonnes from mined resources at cash costs and sustaining cash costs of $1.15 and $1.44 per pound of copper2, respectively, generating an after-tax net present value (10%) of $741 million and an internal rate of return of 17%1.
- Phase I of the Copper World Complex includes a 60,000 ton per day sulfide concentrator, a 20,000 ton per day oxide heap leach, an SX/EW facility and a concentrate leach facility with an initial capital cost estimate of approximately $1.9 billion. The concentrator is intended to expand to 90,000 tons per day in Phase II.
- Phase II expands mining activities onto federal land and extends the mine life to 44 years with average annual copper production of approximately 101,000 tonnes from mined resources at cash costs and sustaining cash costs of $1.11 and $1.42 per pound of copper2, respectively. Phase II provides additional optionality with an after-tax net present value (10%) of $555 million and an internal rate of return of 49% (and a projected after-tax net present value (10%) of $2,806 million at the time of Phase II sanctioning)1.
- Significant increase in copper contained in all mineral resource categories.
- Hudbay is evaluating several opportunities to optimize the project, including processing and initial capital optimizations, the potential to expand Phase I beyond 16 years with additions to the Company's private land package for tailings and waste rock storage and the potential to accelerate Phase II if federal permits are received earlier than as outlined in the PEA.
The preliminary economic assessment for the Copper World Complex is preliminary in nature, includes inferred resources that are considered too speculative geologically to have the economic considerations applied to them that would enable them to be categorized as mineral reserves and there is no certainty the preliminary economic assessment will be realized. For additional details on the Copper World Complex PEA, please refer to the news release dated June 8, 2022 and the NI 43-101 technical report filed on July 14, 2022.
Hudbay is advancing a pre-feasibility study for Phase I of the Copper World Complex during the second half of 2022, which will focus on converting the remaining inferred mineral resources to measured and indicated and evaluating many of the project optimization and upside opportunities.
____________________________________________
1 The valuation metrics are based on a preliminary economic assessment that includes an economic analysis of the potential viability of mineral resources. Mineral resources that are not mineral reserves do not have demonstrated economic viability.
2 Cash cost and sustaining cash cost are non-IFRS financial performance measures with no standardized definition under IFRS. For further details on why Hudbay believes cash costs are a useful performance indicator, please refer to the section titled "Non-IFRS Financial Performance Measures".
Arizona Permitting and Litigation Update
The permitting process for the Copper World Complex is expected to require state and local permits for Phase I and federal permits for Phase II. On May 23, 2022, the U.S. District Court for the District of Arizona issued a favourable ruling effectively stating that there is no obligation for the Army Corps of Engineers ("ACOE") to include Phase I of the project as part its NEPA federal review of the previous stand-alone Rosemont project design. Furthermore, on May 12, 2022, a decision from the 9th Circuit Court of Appeals clarified the permitting path for Phase II, including the requirements to receive federal permits for the second phase under existing mining regulations. Hudbay expects it will be able to pursue and obtain federal permits for Phase II within the constraints imposed by the Court's decision.
On July 27, 2022, Hudbay received approval from the Arizona State Mine Inspector for its amended Mined Land Reclamation Plan ("MLRP") for the Copper World Complex. The MLRP was initially approved in October 2021 and was subsequently amended to reflect a larger private land project footprint. Hudbay expects to submit applications for the other key state-level permits for Phase I of the Copper World Complex in the second half of 2022.
777 Mine Closure
On June 17, 2022, mining activities at our 777 mine in Flin Flon, Manitoba concluded after the reserves were depleted following 18 years of steady production. The 777 deposit was a large and rich orebody and for many years was the flagship mine of Hudbay's Manitoba operations. The mine commenced production in 2004 with an initial ten-year mine life, operated steadily and successfully expanded reserves by an additional eight years. After extensive drilling in and around the mine in recent years, no new deposits were identified. Our hydrometallurgical zinc facility in Flin Flon will also be closed after more than 25 years of successful operations. The 777 mine and the zinc plant are scheduled to be safely decommissioned by September 2022. The Flin Flon concentrator and tailings impoundment area will be shifted to care and maintenance to provide optionality should another mineral discovery occur in the Flin Flon area. Hudbay strives to achieve closure practices that align with leading standards and has developed stringent and detailed environmental plans to manage water and the remaining infrastructure and processing plants in Flin Flon.
Closure activities at the 777 mine and zinc plant have commenced and employees and equipment are transitioning to our operations in Snow Lake, Manitoba as part of our Lalor mine ramp-up strategy.
19th Annual Sustainability Report
In June, we released our annual sustainability report, which provides transparency and progress on key accomplishments and initiatives in 2021 along with goals for the upcoming year and long-term future. Hudbay believes global demand for the metals that we mine will continue to rise alongside the need for green technology that will play an essential role in meeting the challenge of climate change.
We are committed to a reduced GHG emissions future. We are currently working toward specific emissions reduction targets to align with the global 2030 and 2050 climate change goals. We are also designing the Copper World Complex in Arizona in compliance with 2030 and 2050 GHG objectives. In 2021, to better understand the nature of our GHG footprint and the best options for approaching and achieving sustainable GHG reductions, we began work on a 10-year Greenhouse Gas Reduction Roadmap. The roadmap will identify key sources of emissions, including Scope 3 emissions, and the nature of the changes - operational or technical - that will be required to make full or significant changes in each source area.
As a member of the Mining Association of Canada, we implement the Towards Sustainable Mining ("TSM") Protocols at all of our operations, with the goal to maintain a score of "A" or higher for all protocols. In 2021, we achieved a rating of "AA" across all TSM tailings management protocol indicators in both Manitoba and Peru. We also saw a 7% decrease in energy intensity per tonne of ore processed, and over 50% of our indirect energy consumption was from renewable sources.
Exploration Update
Peru Regional Exploration
Hudbay controls a large, contiguous block of mineral rights with the potential to host mineral deposits within trucking distance of the Constancia processing facility, including the past producing Caballito property and the highly prospective Maria Reyna property. Discussions with the community of Uchucarcco related to a surface rights exploration agreement on the Maria Reyna and Caballito properties are progressing well. The Company expects to finalize an agreement in the coming weeks before commencing field exploration activities. Finalization of the Uchucarcco agreement is expected to increase community investment costs in the second half of 2022.
The Company is compiling results from recent drilling at the Llaguen copper porphyry target in northern Peru and remains on track to complete an initial inferred mineral resource estimate in the third quarter of 2022.
Manitoba Regional Exploration
We have been actively conducting drilling activities in the Manitoba area with success in identifying extensions of the copper-gold rich feeder zone at the 1901 deposit and compiling results from ongoing infill drilling at Lalor.
Arizona Regional Exploration
A majority of the infill drilling to support the pre-feasibility study for the Copper World Complex has been completed, and in July, we reduced the number of drill rigs at site to three. Ongoing drilling will focus on continued confirmatory drilling in support of future feasibility studies.
Nevada Regional Exploration
A conductivity-resistivity IP ground survey will be conducted in the second half of 2022 at the Mason Valley properties located on private land claims near the Mason project. This work, in combination with a re-interpretation of geological data from past operating mines and previous exploration data, will be used to finalize a drill plan to test high grade skarn targets. The drilling program initially planned for late 2022 has been postponed to a later date considering the recent changes in the metal price environment.
Dividend Declared
A semi-annual dividend of C$0.01 per share was declared on August 8, 2022. The dividend will be paid out on September 23, 2022 to shareholders of record as of September 2, 2022.
PERU OPERATIONS REVIEW
| | | Three months ended | | | Six months ended | | | Guidance | |
| | Jun. 30,
2022 | | | Jun. 30,
2021 | | | Jun. 30,
2022 | | | Jun. 30,
2021 | | | Annual | |
| | 2022 | |
| Constancia ore mined 1 | tonnes | | 7,017,114 | | | 8,016,373 | | | 13,925,265 | | | 15,763,839 | | | | |
| Copper | % | | 0.33 | | | 0.30 | | | 0.32 | | | 0.30 | | | | |
| Gold | g/tonne | | 0.04 | | | 0.04 | | | 0.04 | | | 0.04 | | | | |
| Silver | g/tonne | | 3.53 | | | 3.02 | | | 3.37 | | | 2.96 | | | | |
| Molybdenum | % | | 0.01 | | | 0.01 | | | 0.01 | | | 0.01 | | | | |
| Pampacancha ore mined 1 | tonnes | | 1,211,387 | | | 982,992 | | | 2,058,693 | | | 982,992 | | | | |
| Copper | % | | 0.29 | | | 0.26 | | | 0.28 | | | 0.26 | | | | |
| Gold | g/tonne | | 0.28 | | | 0.27 | | | 0.35 | | | 0.27 | | | | |
| Silver | g/tonne | | 4.25 | | | 4.43 | | | 4.17 | | | 4.43 | | | | |
| Molybdenum | % | | 0.01 | | | 0.01 | | | 0.01 | | | 0.01 | | | | |
| Total ore mined | tonnes | | 8,228,501 | | | 8,999,365 | | | 15,983,958 | | | 16,746,831 | | | | |
| Strip ratio 2 | | | 1.22 | | | 0.83 | | | 1.16 | | | 0.83 | | | | |
| Ore milled | tonnes | | 7,770,706 | | | 7,413,043 | | | 14,984,539 | | | 13,775,795 | | | | |
| Copper | % | | 0.32 | | | 0.31 | | | 0.31 | | | 0.32 | | | | |
| Gold | g/tonne | | 0.09 | | | 0.07 | | | 0.09 | | | 0.06 | | | | |
| Silver | g/tonne | | 3.64 | | | 2.88 | | | 3.46 | | | 2.86 | | | | |
| Molybdenum | % | | 0.01 | | | 0.01 | | | 0.01 | | | 0.01 | | | | |
| Copper concentrate | tonnes | | 93,122 | | | 82,696 | | | 174,730 | | | 160,656 | | | | |
| Concentrate grade | % Cu | | 22.42 | | | 23.05 | | | 22.92 | | | 22.96 | | | | |
| Copper recovery | % | | 85.0 | | | 83.3 | | | 85.2 | | | 83.7 | | | | |
| Gold recovery | % | | 60.3 | | | 62.2 | | | 60.1 | | | 58.6 | | | | |
| Silver recovery | % | | 64.2 | | | 68.2 | | | 65.4 | | | 69.0 | | | | |
| Molybdenum recovery | % | | 38.8 | | | 33.3 | | | 30.1 | | | 33.3 | | | | |
| Combined unit operating costs 3,4,5 | $/tonne | | 12.02 | | | 10.40 | | | 12.19 | | | 11.02 | | | 10.10 - 12.90 6 | |
| 1 Reported tonnes and grade for ore mined are estimates based on mine plan assumptions and may not reconcile fully to ore milled. |
| 2 Strip ratio is calculated as waste mined divided by ore mined. |
| 3 Reflects combined mine, mill and general and administrative ("G&A") costs per tonne of ore milled. Reflects the deduction of expected capitalized stripping costs. |
| 4 Combined unit costs is a non-IFRS financial performance measure with no standardized definition under IFRS. For further information and a detailed reconciliation, please see the discussion under the "Non-IFRS Financial Reporting Measures" section of this MD&A. |
| 5 Excludes approximately $1.3 million, or $0.16 per tonne and $3.6 million, or $0.24 per tonne , of COVID-19 related costs during the three and six months ended June 30, 2022 respectively and $6.3 million, or $0.85 per tonne and $10.9 million or $0.79 per tonne, of COVID-19 related costs during the three and six months ended June 30, 2021. |
| 6 Combined unit cost guidance for 2022 excludes COVID-19 related costs. |
Total ore mined declined by 9% in the second quarter of 2022 compared to the same period in 2021 due to higher amounts of waste being mined. Ore milled during the second quarter of 2022 was 5% higher than the same period in 2021. Milled copper grades increased in the second quarter of 2022 in comparison to the same period in 2021 due to higher head grades from both Constancia and Pampacancha. Milled gold grades increased significantly in the second quarter of 2022 mainly due to higher volumes and gold grades from Pampacancha.
Copper recoveries in the second quarter increased marginally over the comparative 2021 period due to operational improvements in the cleaning circuit and lower oxide levels of the Constancia ore. Gold recoveries in the second quarter of 2022 were 3% lower than the comparative 2021 period and silver recoveries decreased by 6% over the same time frame due to higher levels of contaminants impacting the metallurgy of the Pampacancha ores.
Year-to-date ore mined was 5% lower than the same period in 2021 due to the same factors as the quarterly variance. Recoveries of copper and gold in the first half of 2022 were marginally higher than the same period in 2021. Recoveries of copper increased due to the same factors as described above for the quarter-over-quarter variance. Recoveries of gold increased due to higher gold grades at Pampacancha.
Combined mine, mill and G&A unit operating costs in the second quarter of 2022 were 16% higher than the same period in 2021 primarily due to inflationary pressures on fuel, consumables and energy costs, partially offset by additional tonnes milled. Combined mine, mill and G&A unit operating costs in the first half of 2022 were 11% higher than the same period in 2021 due to the same factors as the quarterly variance. As a result of inflationary cost pressures, full year unit operating costs in Peru are expected to be closer to the top end of the 2022 guidance range.
Contained metal in
concentrate produced | | Three months ended | | | Six months ended | | | Guidance | |
| | Jun. 30,
2022 | | | Jun. 30,
2021 | | | Jun. 30,
2022 | | | Jun. 30,
2021 | | | Annual | |
| | 2022 | |
| Copper | tonnes | | 20,880 | | | 19,058 | | | 40,046 | | | 36,885 | | | 89,000 - 115,000 | |
| Gold | oz | | 13,858 | | | 10,220 | | | 24,647 | | | 14,858 | | | 70,000 - 90,000 | |
| Silver | oz | | 584,228 | | | 468,057 | | | 1,089,796 | | | 873,771 | | | 1,620,000 - 2,100,000 | |
| Molybdenum | tonnes | | 390 | | | 295 | | | 596 | | | 589 | | | 1,100 - 1,400 | |
Production of all metals, and especially gold and silver, was higher in the second quarter of 2022 and year-to-date compared to the same periods in 2021 due to an increase in throughput, grade and recovery in the case of copper and molybdenum, and, in the case of gold and silver, due to increases in grade and throughput. As previously disclosed, full year production in Peru is expected to benefit from higher grades in the fourth quarter of 2022. As such, full year production of all metals in Peru remains on track to achieve the guidance ranges for 2022.
Peru Cash Cost and Sustaining Cash Cost
| | | Three months ended | | | Six months ended | | | Guidance | |
| | Jun. 30,
2022 | | | Jun. 30,
2021 | | | Jun. 30,
2022 | | | Jun. 30,
2021 | | | Annual
2022 | |
| Cash cost per pound of copper produced, net of by-product credits1 | $/lb | | 1.82 | | | 1.85 | | | 1.69 | | | 1.84 | | | 1.10 - 1.40 | |
| Sustaining cash cost per pound of copper produced, net of by-product credits1 | $/lb | | 2.62 | | | 2.69 | | | 2.45 | | | 2.53 | | | | |
| 1 Cash cost and sustaining cash costs per pound of copper produced, net of by-product credits, are not recognized under IFRS. For more detail on these non-IFRS financial performance measures, please see the discussion under the "Non-IFRS Financial Performance Measures" section of this MD&A. |
Cash cost per pound of copper produced, net of by-product credits, in the second quarter of 2022 was $1.82, a slight decrease compared to the same period in 2021 due to higher copper production and higher precious metal by-product credits, partially offset by higher overall mining, milling and general and administrative costs. Cash cost per pound of copper produced, net of by-product credits, is expected to decline with higher expected copper production and contributions from precious metal by-product in the fourth quarter. However, full year cash cost is expected to trend towards the upper end of the 2022 guidance range, reflecting the current inflationary cost environment. Cash cost per pound of copper produced, net of by-product credits, for the first half of 2022 was $1.69, a decrease of 8% compared to the same period in 2021 due to the same factors as outlined above.
Sustaining cash cost per pound of copper produced, net of by-product credits, for the second quarter and for the first half of 2022 both decreased by 3% compared to the same period of 2021 mainly due to the same factors affecting cash costs noted above, partially offset by higher sustaining capital expenditures.

Metal Sold
| | | Three months ended | | | Six months ended | |
| | Jun. 30, 2022 | | | Jun. 30, 2021 | | | Jun. 30, 2022 | | | Jun. 30, 2021 | |
| Payable metal in concentrate | | | | | | | | | | | | | |
| Copper | tonnes | | 18,473 | | | 19,946 | | | 35,298 | | | 34,782 | |
| Gold | oz | | 8,430 | | | 5,638 | | | 22,882 | | | 8,601 | |
| Silver | oz | | 484,946 | | | 315,064 | | | 1,121,079 | | | 652,676 | |
| Molybdenum | tonnes | | 208 | | | 265 | | | 421 | | | 549 | |
Quantities of payable metal sold for the three and six months ended June 30, 2022 were primarily affected by the same factors as contained metal production but were negatively impacted by elevated closing copper and molybdenum concentrate inventories at the end of June 2022.
MANITOBA OPERATIONS REVIEW
Mines
| | | Three months ended | | | Six months ended | |
| | Jun. 30, 2022 | | | Jun. 30, 2021 | | | Jun. 30, 2022 | | | Jun. 30, 2021 | |
| Lalor | | | | | | | | | | | | | |
| Ore | tonnes | | 412,653 | | | 356,951 | | | 799,405 | | | 778,553 | |
| Copper | % | | 0.70 | | | 0.64 | | | 0.75 | | | 0.60 | |
| Zinc | % | | 3.06 | | | 3.81 | | | 3.54 | | | 4.56 | |
| Gold | g/tonne | | 3.73 | | | 3.19 | | | 3.74 | | | 2.91 | |
| Silver | g/tonne | | 23.95 | | | 22.98 | | | 23.46 | | | 22.86 | |
| 777 | | | | | | | | | | | | | |
| Ore | tonnes | | 226,286 | | | 255,170 | | | 484,355 | | | 530,430 | |
| Copper | % | | 1.03 | | | 0.82 | | | 1.12 | | | 1.46 | |
| Zinc | % | | 3.51 | | | 3.57 | | | 3.83 | | | 3.79 | |
| Gold | g/tonne | | 1.62 | | | 1.97 | | | 1.66 | | | 2.18 | |
| Silver | g/tonne | | 20.63 | | | 23.35 | | | 20.85 | | | 26.45 | |
| Total Mines | | | | | | | | | | | | | |
| Ore | tonnes | | 638,939 | | | 612,121 | | | 1,283,760 | | | 1,308,983 | |
| Copper | % | | 0.82 | | | 0.72 | | | 0.89 | | | 0.95 | |
| Zinc | % | | 3.22 | | | 3.71 | | | 3.65 | | | 4.25 | |
| Gold | g/tonne | | 2.98 | | | 2.68 | | | 2.95 | | | 2.63 | |
| Silver | g/tonne | | 22.77 | | | 23.14 | | | 22.48 | | | 24.31 | |
| Unit Operating Costs 1,2 | | Three months ended | | | Six months ended | |
| | Jun. 30, 2022 | | | Jun. 30, 2021 | | | Jun. 30, 2022 | | | Jun. 30, 2021 | |
| Mines | | | | | | | | | | | | | |
| Lalor | C$/tonne | | 129.74 | | | 123.44 | | | 128.14 | | | 115.92 | |
| 777 | C$/tonne | | 70.78 | | | 90.61 | | | 87.50 | | | 86.45 | |
| Total Mines | C$/tonne | | 108.86 | | | 109.75 | | | 112.81 | | | 103.98 | |
| 1 Reflects costs per tonne of ore mined. |
2 Unit costs is a non-IFRS financial performance measure with no standardized definition under IFRS. For further information and a detailed
reconciliation, please see the discussion under the "Non-IFRS Financial Reporting Measures" section of this MD&A. |
After 18 years of steady production at our 777 mine in Manitoba, the final reserves were depleted with the last ore hoisted on June 17, 2022, consistent with the mine plan. Closure activities to safely decommission the mine commenced in the second quarter and are advancing ahead of schedule. As 777 mining activities wound down, our employees and equipment transitioned from 777 to Lalor to support Lalor's ramp-up strategy.
We continued to advance the Lalor ramp-up strategy and remain on track to achieve 5,300 tonnes per day by the end of 2022. We also further refined the processes to separate gold and base metal ores from Lalor to optimize feed for the New Britannia and Stall mills. Metal grades form the basis of separating higher gold content ore for processing at New Britannia from base metal ore which is directed towards Stall. Lalor successfully completed planned maintenance in the second quarter to allow for increased availability in the third quarter.
Ore mined at our Manitoba operations during the second quarter of 2022 was 4% higher than the same period in 2021 due to increased Lalor production, partially offset by lower production at 777 as it approached closure in June 2022. Copper, gold and silver grades mined at Lalor during the second quarter of 2022 were 9%, 17% and 4% higher, respectively, compared to the same period in 2021, mainly due to increased mining of gold and copper-gold stopes. Zinc grades mined during the second quarter of 2022 were 20% lower than the same period in 2021, in line with the mine plan. Zinc, gold and silver grades at 777 were 2%, 18% and 12% lower, respectively, than the same period in 2021, while copper grades were 26% higher consistent with expectations of remnant mining of final stopes.
Ore mined at our Manitoba operations during the first half of 2022 was 2% lower than the same period in 2021 due to lower production at 777, offset by increased Lalor production for the reasons listed above. Copper, gold and silver grades mined at Lalor during the first half of 2022 were 25%, 29% and 3% higher, respectively, compared to the same period in 2021, mainly due to increased mining of gold and copper-gold stopes. Zinc grades mined at Lalor during the first half of 2022 were 22% lower than the same period in 2021, in line with the mine plan. Copper, gold and silver grades at 777 were 23%, 24% and 21% lower than the same period in 2021 as challenging ground conditions resulted in excessive dilution during remnant stope mining as the mine approached the end of life. Zinc grades mined at 777 during the first half of 2022 were 1% higher than the same period in 2021.
Total mine unit operating costs during the second quarter of 2022 decreased by 1% compared to the same period in 2021 mainly due to lower costs at 777 as the mine ceased operations during the quarter, partially offset by higher inflationary cost pressures for bulk commodities, fuel, and Lalor contractor costs.
Total mine unit operating costs during the first half of 2022 increased by 8% compared to the same period in 2021 due to higher propane usage early in the year caused by a colder winter coupled with inflationary cost pressures for bulk commodities, fuel, and Lalor contractor costs.
Processing Facilities
| | | Three months ended | | | Six months ended | |
| | Jun. 30, 2022 | | | Jun. 30, 2021 | | | Jun. 30, 2022 | | | Jun. 30, 2021 | |
| Stall & New Britannia Concentrator Combined | | | | | | | | | | |
| Ore | tonnes | | 406,006 | | | 317,484 | | | 803,307 | | | 678,828 | |
| Copper | % | | 0.73 | | | 0.68 | | | 0.78 | | | 0.64 | |
| Zinc | % | | 3.20 | | | 4.06 | | | 3.71 | | | 4.84 | |
| Gold | g/tonne | | 3.93 | | | 3.19 | | | 3.90 | | | 2.86 | |
| Silver | g/tonne | | 23.98 | | | 22.02 | | | 23.57 | | | 22.76 | |
| Copper concentrate | tonnes | | 15,384 | | | 11,028 | | | 31,664 | | | 21,375 | |
| Concentrate grade | % Cu | | 17.26 | | | 17.40 | | | 17.44 | | | 17.74 | |
| Zinc concentrate | tonnes | | 19,189 | | | 22,575 | | | 45,658 | | | 58,269 | |
| Concentrate grade | % Zn | | 51.08 | | | 50.29 | | | 51.07 | | | 50.71 | |
| Copper recovery - concentrate | % | | 89.5 | | | 88.8 | | | 88.5 | | | 87.3 | |
| Zinc recovery - concentrate (Stall) | % | | 84.3 | | | 88.1 | | | 85.1 | | | 89.9 | |
| Gold recovery - concentrate | % | | 58.8 | | | 55.5 | | | 58.6 | | | 56.5 | |
| Silver recovery - concentrate | % | | 58.1 | | | 55.1 | | | 59.0 | | | 55.7 | |
| Contained metal in concentrate produced | | | | | | | | | | |
| Copper | tonnes | | 2,656 | | | 1,919 | | | 5,523 | | | 3,791 | |
| Zinc | tonnes | | 9,803 | | | 11,352 | | | 23,319 | | | 29,548 | |
| Gold | oz | | 30,113 | | | 18,078 | | | 58,995 | | | 35,285 | |
| Silver | oz | | 181,786 | | | 123,844 | | | 359,431 | | | 276,750 | |
| Metal in doré produced | | | | | | | | | | | | | |
| Gold | oz | | 7,441 | | | - | | | 13,721 | | | - | |
| Silver | oz | | 15,974 | | | - | | | 26,020 | | | - | |
| Flin Flon Concentrator | | | | | | | | | | | | | |
| Ore | tonnes | | 243,312 | | | 329,503 | | | 497,344 | | | 612,889 | |
| Copper | % | | 1.02 | | | 0.89 | | | 1.11 | | | 1.35 | |
| Zinc | % | | 3.60 | | | 3.65 | | | 3.87 | | | 3.90 | |
| Gold | g/tonne | | 1.64 | | | 2.06 | | | 1.67 | | | 2.19 | |
| Silver | g/tonne | | 20.76 | | | 23.65 | | | 21.00 | | | 25.67 | |
| Copper concentrate | tonnes | | 9,498 | | | 11,504 | | | 22,602 | | | 33,816 | |
| Concentrate grade | % Cu | | 22.44 | | | 21.70 | | | 21.24 | | | 21.74 | |
| Zinc concentrate | tonnes | | 14,335 | | | 20,096 | | | 31,602 | | | 39,209 | |
| Concentrate grade | % Zn | | 50.58 | | | 50.69 | | | 50.59 | | | 50.83 | |
| Copper recovery | % | | 85.5 | | | 84.8 | | | 86.7 | | | 89.0 | |
| Zinc recovery | % | | 82.9 | | | 84.8 | | | 83.0 | | | 83.3 | |
| Gold recovery | % | | 56.4 | | | 52.9 | | | 57.1 | | | 58.4 | |
| Silver recovery | % | | 51.0 | | | 37.5 | | | 51.8 | | | 45.9 | |
| Contained metal in concentrate produced | | | | | | | | | | |
| Copper | tonnes | | 2,132 | | | 2,497 | | | 4,801 | | | 7,351 | |
| Zinc | tonnes | | 7,250 | | | 10,186 | | | 15,986 | | | 19,930 | |
| Gold | oz | | 7,233 | | | 11,550 | | | 15,238 | | | 25,205 | |
| Silver | oz | | 82,865 | | | 94,015 | | | 173,963 | | | 232,068 | |
| Unit Operating Costs 1 | | Three months ended | | | Six months ended | | | Guidance | |
| | Jun. 30,
2022 | | | Jun. 30,
2021 | | | Jun. 30,
2022 | | | Jun. 30,
2021 | | | Annual | |
| | 2022 | |
| Concentrators | | | | | | | | | | | | | | | | |
| Stall & New Britannia | C$/tonne | | 49.46 | | | 24.80 | | | 49.76 | | | 23.90 | | | | |
| Flin Flon | C$/tonne | | 27.36 | | | 26.95 | | | 28.14 | | | 27.01 | | | | |
| Combined mine/mill unit operating costs 2,3 | | | | | | | | | | | | | | | | |
| Manitoba | C$/tonne | | 168 | | | 148 | | | 172 | | | 150 | | | 170 - 185 | |
| 1 Reflects costs per tonne of milled ore. |
| 2 Reflects combined mine, mill and G&A costs per tonne of milled ore. |
| 3 Combined unit costs is a non-IFRS financial performance measure with no standardized definition under IFRS. For further information and a detailed reconciliation, please see the discussion under the "Non-IFRS Financial Reporting Measures" section of this MD&A. |
The combined Snow Lake mills processed 28% more ore in the second quarter of 2022 compared to the same period in 2021, tracking the increase in Lalor's production over the same period. Stall recoveries were consistent with the metallurgical model for the head grades delivered. Compared to the same period in 2021, unit operating costs at the Snow Lake mills were higher in the second quarter of 2022 as a result of the higher costs at New Britannia.
The combined Snow Lake mills processed 18% more ore in the first half of 2022 compared to the same period in 2021. Stall recoveries were consistent with the metallurgical model for the head grades delivered. Compared to the same period in 2021, unit operating costs at the Snow Lake mills were higher in first six months of 2022 for the same reasons outlined in the second quarter variance as well as scheduled mill maintenance at New Britannia early in the year.
The New Britannia mill achieved higher than targeted throughput in the second quarter of 2022 averaging approximately 1,590 tonnes per day, due to a number of improvement initiatives aimed at increasing throughput and further improving recoveries. With the inclusion of doré, the gold and silver recoveries at the New Britannia mill have also improved significantly in relation to previous quarters. Additional improvement initiatives will continue to be advanced in the second half of 2022 to further improve gold and silver recoveries.
The Flin Flon concentrator consumed all available ore feed from the 777 mine in the second quarter of 2022. Last ore from 777 was processed on June 21, 2022 and closure activities to safely place the concentrator on long-term care and maintenance are ahead of schedule. Recoveries at the Flin Flon concentrator were consistent with the metallurgical model for the head grades delivered. Unit operating costs at the Flin Flon concentrator increased by 2% during the second quarter compared to the same period in 2021 primarily as a result of increased grinding media used to fulfill paste requirements at the 777 mine.
Unit costs at the Snow Lake mills increased by 108% in the first six months of 2022 compared to the same period in 2021 due to higher than expected milling costs at New Britannia, baseline effects as New Britannia was not yet operational in the comparative period, as well as higher inflationary cost pressures. Flin Flon concentrator unit costs increased by 4% over the same timeframe.
Combined unit operating costs in the second quarter of 2022 and year-to-date increased by 14% and 15%, respectively, compared to the same periods in 2021 for the same reasons as outlined above. Looking ahead to the second half of 2022, we expect combined unit operating costs to increase due to ongoing inflationary cost pressures and the removal of the lower-cost Flin Flon operations. As such, we expect the full year combined unit costs to trend towards the upper end of the 2022 guidance range.
| | | | Three months ended | | | Six months ended | | | Guidance | |
| Contained metal in concentrate produced 1 | | Jun. 30,
2022 | | | Jun. 30,
2021 | | | Jun. 30,
2022 | | | Jun. 30,
2021 | | | Annual | |
| | 2022 | |
| Copper | tonnes | | 4,788 | | | 4,416 | | | 10,324 | | | 11,142 | | | 12,000 - 16,000 | |
| Gold 2 | oz | | 37,346 | | | 29,628 | | | 74,233 | | | 60,490 | | | - | |
| Silver 3 | oz | | 264,651 | | | 217,859 | | | 533,394 | | | 508,818 | | | - | |
| Zinc | tonnes | | 17,053 | | | 21,538 | | | 39,305 | | | 49,478 | | | 50,000 - 70,000 | |
| Metal in doré produced 1 | | | | | | | | | | | | | | | | |
| Gold 2 | oz | | 7,441 | | | - | | | 13,721 | | | - | | | - | |
| Silver 3 | oz | | 15,974 | | | - | | | 26,020 | | | - | | | - | |
| Contained metal in concentrate and doré produced | | | | | | | | | | | | | |
| Gold 2 | oz | | 44,787 | | | 29,628 | | | 87,954 | | | 60,490 | | | 150,000 - 185,000 | |
| Silver 3 | oz | | 280,625 | | | 217,859 | | | 559,414 | | | 508,818 | | | 800,000 - 1,100,000 | |
| 1 Metal reported in concentrate is prior to deductions associated with smelter terms. |
| 2 Gold production guidance includes gold contained in concentrate produced and gold in doré. |
| 3 Silver production guidance includes silver contained in concentrate produced and silver in doré. |
Compared to the same period in 2021, gold and silver production in the second quarter of 2022 increased by 51% and 29%, respectively. This increase is primarily due to the processing of higher volumes of gold ore from Lalor at the New Britannia mill, offset by lower gold and silver grades at the 777 mine. Copper production increased by 8% in the second quarter of 2022 compared to the same period in 2021 due to significantly higher copper grades at 777 from the mining of remnant stopes, partially offset by lower volume of 777 ore mined. Zinc production in the second quarter decreased by 21% primarily due to lower head grades at Lalor consistent with the mine plan.
Compared to the same period in 2021, gold and silver production in the first half of 2022 increased by 45% and 10%, respectively. This increase is primarily due to the same reasons noted above. Copper and zinc production decreased by 8% and 21%, respectively, in the first half of 2022 due to lower zinc head grades at Lalor and lower 777 volumes as the mine fully depleted its reserves and ceased production in June 2022.
Full year production of all metals are on track to achieve guidance ranges for 2022.

Zinc Plant
| Zinc Production | | Three months ended | | | Six months ended | |
| | Jun. 30,
2022 | | | Jun. 30,
2021 | | | Jun. 30,
2022 | | | Jun. 30,
2021 | |
| Zinc Concentrate Treated | | | | | | | | | | | | | |
| Domestic | tonnes | | 34,500 | | | 47,376 | | | 76,223 | | | 101,865 | |
| Refined Metal Produced | | | | | | | | | | | | | |
| Domestic | tonnes | | 17,831 | | | 22,419 | | | 37,894 | | | 48,927 | |
| Unit Operating Costs | | Three months ended | | | Six months ended | |
| | Jun. 30,
2022 | | | Jun. 30,
2021 | | | Jun. 30,
2022 | | | Jun. 30,
2021 | |
| Zinc Plant 1,2 | C$/lb | | 0.57 | | | 0.54 | | | 0.60 | | | 0.52 | |
1 Zinc unit operating costs include G&A costs.
2 Zinc unit costs is a non-IFRS financial performance measure with no standardized definition under IFRS. For further information and a detailed reconciliation, please see the discussion under the "Non-IFRS Financial Reporting Measures" section of this MD&A. |
The zinc plant production remained constrained by the availability of concentrate for processing through to its last day of operation on June 30, 2022. Closure activities to safely decommission the zinc plant are underway and are advancing ahead of schedule.
Manitoba Cash Cost and Sustaining Cash Cost
| | | Three months ended | | | Six months ended | | | Guidance | |
| | Jun. 30,
2022 | | | Jun. 30,
2021 | | | Jun. 30,
2022 | | | Jun. 30,
2021 | | | Annual
2022 | |
| Cost per pound of copper produced | | | | | | | | | | | | | | | | |
| Cash cost per pound of copper produced, net of by-product credits 1 | $/lb | | (4.48 | ) | | (3.51 | ) | | (2.29 | ) | | (2.02 | ) | | | |
| Sustaining cash cost per pound of copper produced, net of by-product credits 1 | $/lb | | (1.40 | ) | | 0.36 | | | 0.60 | | | 1.12 | | | | |
| | | | | | | | | | | | | | | | | |
| Cost per ounce of gold produced | | | | | | | | | | | | | | | | |
| Cash cost per ounce of gold produced, net of by-product credits 1 | $/oz | | (207 | ) | | - | | | 99 | | | - | | | 300 - 550 | |
| Sustaining cash cost per ounce of gold produced, net of by-product credits 1 | $/oz | | 519 | | | - | | | 847 | | | - | | | | |
| 1 Cash cost and sustaining cash cost per pound of copper and per ounce of gold produced, net of by-product credits, are not recognized under IFRS. For more detail on this non-IFRS financial performance measure, please see the discussion under the "Non-IFRS Financial Performance Measures" section of this MD&A. |
| 2 Cash cost and sustaining cash cost per ounce of gold produced, net of by-product credits were introduced in 2022 and do not have a published comparative. |
Cash cost per pound of copper produced, net of by-product credits, in the second quarter of 2022 was negative $4.48. These costs were lower compared to the same period in 2021, as a result of higher zinc and gold by-product revenues offset by higher milling and profit sharing costs and slightly higher copper production.
Sustaining cash cost per pound of copper produced, net of by-product credits, in the second quarter of 2022 was negative $1.40. These costs were lower compared to the same period in 2021, primarily due to the reasons listed above and lower cash sustaining capital expenditures compared to the same period in 2021.
Cash cost per pound of copper produced, net of by-product credits, in the first half of 2022 was negative $2.29. These costs were lower compared to the same period in 2021, as a result of higher gold by-product revenues and slightly lower copper production offset by higher mining, milling and profit sharing costs.
Sustaining cash cost per pound of copper produced, net of by-product credits, in the first half of 2022 was $0.60. These costs were lower compared to the same period in 2021, due to the same reasons provided above and lower cash sustaining capital expenditures compared to the same period in 2021.
Cash cost per ounce of gold produced, net of by-product credits, in the second quarter and for the first half of 2022 were well below our 2022 guidance range.
Metal Sold
| | | Three months ended | | | Six months ended | |
| | Jun. 30,
2022 | | | Jun. 30,
2021 | | | Jun. 30,
2022 | | | Jun. 30,
2021 | |
| Payable metal in concentrate and doré | | | | | | | | | | | | | |
| Copper | tonnes | | 5,177 | | | 5,230 | | | 8,961 | | | 11,323 | |
| Gold | oz | | 42,454 | | | 32,567 | | | 76,345 | | | 54,987 | |
| Silver | oz | | 253,225 | | | 262,443 | | | 481,684 | | | 434,591 | |
| Zinc 1 | tonnes | | 20,793 | | | 25,361 | | | 38,099 | | | 53,704 | |
| 1 Includes refined zinc metal and payable zinc in concentrate sold. |
Sales of copper and silver in the second quarter of 2022 were lower than the comparable period in 2021 but higher than the first quarter of 2022 as approximately 60% excess copper concentrate inventory from the first quarter of 2022 has been drawn down during the second quarter of 2022 with improving railcar availability. Quantities of payable gold and zinc sold for the three and six months ended June 30, 2022 were primarily affected by the same factors as contained metal production.
FINANCIAL REVIEW
Financial Results
In the second quarter of 2022, we recorded a net profit of $32.1 million compared to a net loss of $3.4 million in the second quarter of 2021. Year-to-date in 2022, we recorded a net profit of $95.9 million compared to a net loss of $63.5 million for the same period in 2021, representing an increase in profit of $159.4 million.
The following table provides further details on these variances:
| (in $ millions) | | Three months ended
June 30, 2022 | | | Six months ended
June 30, 2022 | |
| Increase (decrease) in components of profit or loss: | | | | | | |
| Revenues | | 11.3 | | | 76.2 | |
| Cost of sales | | | | | | |
| Mine operating costs | | (15.9 | ) | | (49.7 | ) |
| Depreciation and amortization | | 12.0 | | | 13.7 | |
| Selling and administrative expenses | | 8.4 | | | 6.5 | |
| Exploration expenses | | 3.5 | | | (8.3 | ) |
| Environmental obligation adjustment | | 60.2 | | | 135.5 | |
| Other expenses | | 2.8 | | | (4.8 | ) |
| Impairment loss | | (95.0 | ) | | (95.0 | ) |
| Net finance expense | | 19.3 | | | 91.0 | |
| Tax | | 28.9 | | | (5.7 | ) |
| Decrease in loss for the period | | 35.5 | | | 159.4 | |
Revenue
Revenue for the second quarter of 2022 was $415.5 million, $11.3 million higher than the same period in 2021, primarily as a result of higher zinc prices and higher gold sales volumes, partially offset by lower copper and zinc sales volumes and lower copper prices. We continue to see higher sales volumes of gold as a result of the commencement of operations at the high-grade Pampacancha deposit in Peru and the copper-gold circuit at New Britannia mill in Manitoba. Copper sales volumes declined in the second quarter of 2022, relative to the prior year, despite higher copper production, primarily due to general timing of shipments. Lower zinc sales volumes are a result of a reduction in overall zinc production due to the closure of the 777 mine in Manitoba in June of 2022, as well as lower zinc grades from Lalor as we continue to transition to mining of the gold lenses and away from base metal zones.
Revenue for the first half of 2022 was $794.1 million, $76.2 million higher than the same period in 2021, mainly due to higher realized base metal prices as well as higher precious metal sales volumes. Offsetting these increases were lower zinc sales, due to the same reasons as the quarter-to-date variances described above.
The following table provides further details on these variances:
| (in $ millions) | | Three months ended
June 30, 2022 | | | Six months ended
June 30, 2022 | |
| | | | | | | |
| Metals prices1 | | | | | | |
| (Lower) higher copper prices | | (5.9 | ) | | 31.2 | |
| Higher zinc prices | | 25.3 | | | 42.5 | |
| Lower gold prices | | (0.4 | ) | | (2.4 | ) |
| Lower silver prices | | (1.8 | ) | | (8.5 | ) |
| Sales volumes | | | | | | |
| Lower copper sales volumes | | (14.8 | ) | | (16.6 | ) |
| Lower zinc sales volumes | | (14.0 | ) | | (46.5 | ) |
| Higher gold sales volumes | | 22.9 | | | 63.9 | |
| Higher silver sales volumes | | 4.3 | | | 14.6 | |
| Other | | | | | | |
| Change in derivative mark-to-market on zinc | | (0.5 | ) | | (0.3 | ) |
| Molybdenum and other volume and pricing differences | | (4.0 | ) | | (3.4 | ) |
| Variable consideration adjustments | | - | | | 1.6 | |
| Effect of lower treatment and refining charges | | 0.2 | | | 0.1 | |
| Increase in revenue in 2022 compared to 2021 | | 11.3 | | | 76.2 | |
| 1 See discussion below for further information regarding metals prices. |
Our revenue by significant product type is summarized below:
| | | Three months ended | | | Six months ended | |
| (in $ millions) | | Jun. 30, 2022 | | | Jun. 30, 2021 | | | Jun. 30, 2022 | | | Jun. 30, 2021 | |
| Copper | | 230.8 | | | 250.2 | | | 439.7 | | | 423.9 | |
| Zinc | | 88.7 | | | 77.4 | | | 155.2 | | | 159.5 | |
| Gold | | 90.3 | | | 57.9 | | | 157.9 | | | 100.1 | |
| Silver | | 8.9 | | | 7.2 | | | 15.5 | | | 13.6 | |
| Molybdenum | | 9.0 | | | 7.1 | | | 18.2 | | | 14.2 | |
| Other metals | | 2.0 | | | 2.6 | | | 4.4 | | | 4.2 | |
| Revenue from contracts | | 429.7 | | | 402.4 | | | 790.9 | | | 715.5 | |
| Amortization of deferred revenue - gold | | 10.0 | | | 9.2 | | | 23.2 | | | 14.1 | |
| Amortization of deferred revenue - silver | | 9.2 | | | 7.9 | | | 21.0 | | | 16.6 | |
| Amortization of deferred revenue - variable consideration adjustments - prior periods | | - | | | - | | | 3.2 | | | 1.6 | |
| Pricing and volume adjustments1 | | (18.4 | ) | | (0.1 | ) | | (17.1 | ) | | (2.7 | ) |
| Treatment and refining charges | | (15.0 | ) | | (15.2 | ) | | (27.1 | ) | | (27.2 | ) |
| Revenue | | 415.5 | | | 404.2 | | | 794.1 | | | 717.9 | |
| 1 Pricing and volume adjustments represents mark-to-market adjustments on provisionally prices sales, realized and unrealized changes to fair value for non-hedge derivative contracts and adjustments to originally invoiced weights and assays. |
For further detail on variable consideration adjustments, refer to note 16 of our consolidated interim financial statements.
Realized sales prices
This measure is intended to enable management and investors to understand the average realized price of metals sold to third parties in each reporting period. The average realized price per unit sold does not have any standardized meaning prescribed by IFRS, is unlikely to be comparable to similar measures presented by other issuers and should not be considered in isolation or a substitute for measures of performance prepared in accordance with IFRS.
For sales of copper, gold and silver we may enter into non-hedge derivatives ("QP hedges") which are intended to manage the provisional pricing risk arising from quotational period terms in concentrate sales agreements. The QP hedges are not removed from the calculation of realized prices. We expect that gains and losses on QP hedges will offset provisional pricing adjustments on concentrate sales contracts.
Our realized prices for the second quarter of 2022 and 2021, respectively, are summarized below:
| | | | | | Realized prices1 for the | | | LME YTD
20222 | | | Realized prices1 for the | |
| | LME
QTD
20222 | | Three months ended | | | Six months ended | |
| | | | Jun. 30,
2022 | | | Jun. 30,
2021 | | | Jun. 30,
2022 | | | Jun. 30,
2021 | |
| Prices | | | | | | | | | | | | | | | | | | | |
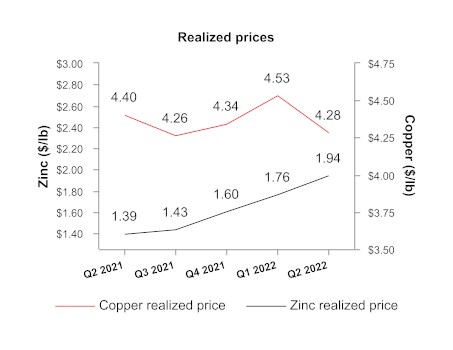
| Copper | $/lb | | 4.31 | | | 4.28 | | | 4.40 | | | 4.42 | | | 4.40 | | | 4.08 | |
| Zinc3 | $/lb | | 1.78 | | | 1.94 | | | 1.39 | | | 1.74 | | | 1.86 | | | 1.35 | |
| Gold4 | $/oz | | | | | 1,795 | | | 1,803 | | | | | | 1,769 | | | 1,793 | |
| Silver4 | $/oz | | | | | 24.32 | | | 26.74 | | | | | | 22.83 | | | 28.12 | |
| 1 Realized prices exclude refining and treatment charges and are on the sale of finished metal or metal in concentrate. Realized prices include the effect of provisional pricing adjustments on prior period sales. |
| 2 London Metal Exchange average for copper and zinc prices. |
| 3 All sales for the three and six months ended June 30, 2022 and 2021 were cast zinc metal. Zinc realized prices include premiums paid by customers for delivery of refined zinc metal, but exclude unrealized gains and losses related to non-hedge derivative contracts that are included in zinc revenues. |
| 4 Sales of gold and silver from our 777 and Constancia mines are subject to our precious metals stream agreement with Wheaton, pursuant to which we recognize deferred revenue for precious metals deliveries and also receive cash payments. Stream sales are included within realized prices and their respective deferred revenue and cash payment rates can be found on page 29. |
The following tables provide a reconciliation of average realized price per unit sold, by metal, to revenues as shown in the consolidated financial statements.
| Three months ended June 30, 2022 | |
| (in $ millions) 1 | | Copper | | | Zinc | | | Gold | | | Silver | | | Molybdenum | | | Other | | | Total | |
| Revenue from contracts 2 | | 230.8 | | | 88.7 | | | 90.3 | | | 8.9 | | | 9.0 | | | 2.0 | | | 429.7 | |
| Amortization of deferred revenue | | - | | | - | | | 10.0 | | | 9.2 | | | - | | | - | | | 19.2 | |
| Pricing and volume adjustments 3 | | (7.5 | ) | | (0.2 | ) | | (8.9 | ) | | (0.2 | ) | | (1.6 | ) | | - | | | (18.4 | ) |
| By-product credits 4 | | 223.3 | | | 88.5 | | | 91.4 | | | 17.9 | | | 7.4 | | | 2.0 | | | 430.5 | |
| Derivative mark-to-market 5 | | - | | | 0.5 | | | - | | | - | | | - | | | - | | | 0.5 | |
| Revenue, excluding mark-to-market on non-QP hedges | | 223.3 | | | 89.0 | | | 91.4 | | | 17.9 | | | 7.4 | | | 2.0 | | | 431.0 | |
| Payable metal in concentrate sold 6 | | 23,650 | | | 20,793 | | | 50,884 | | | 738,171 | | | 208 | | | - | | | - | |
| Realized price 7 | | 9,442 | | | 4,282 | | | 1,795 | | | 24.32 | | | - | | | - | | | - | |
| Realized price 8 | | 4.28 | | | 1.94 | | | - | | | - | | | - | | | - | | | - | |
| Six months ended June 30, 2022 | |
| (in $ millions) 1 | | Copper | | | Zinc | | | Gold | | | Silver | | | Molybdenum | | | Other | | | Total | |
| Revenue from contracts 2 | | 439.7 | | | 155.2 | | | 157.9 | | | 15.5 | | | 18.2 | | | 4.4 | | | 790.9 | |
| Amortization of deferred revenue | | - | | | - | | | 23.2 | | | 21.0 | | | - | | | - | | | 44.2 | |
| Pricing and volume adjustments 3 | | (10.7 | ) | | 0.5 | | | (5.6 | ) | | 0.1 | | | (1.4 | ) | | - | | | (17.1 | ) |
| By-product credits 4 | | 429.0 | | | 155.7 | | | 175.5 | | | 36.6 | | | 16.8 | | | 4.4 | | | 818.0 | |
| Derivative mark-to-market 5 | | - | | | 0.4 | | | - | | | - | | | - | | | - | | | 0.4 | |
| Revenue, excluding mark-to-market on non-QP hedges | | 429.0 | | | 156.1 | | | 175.5 | | | 36.6 | | | 16.8 | | | 4.4 | | | 818.4 | |
| Payable metal in concentrate sold 6 | | 44,259 | | | 38,099 | | | 99,227 | | | 1,602,763 | | | 421 | | | - | | | - | |
| Realized price 7 | | 9,695 | | | 4,097 | | | 1,769 | | | 22.83 | | | - | | | - | | | - | |
| Realized price 8 | | 4.40 | | | 1.86 | | | - | | | - | | | - | | | - | | | - | |
| 1 Average realized price per unit sold may not calculate based on amounts presented in this table due to rounding. |
| 2 As per financial statements. |
| 3 Pricing and volume adjustments represents mark-to-market adjustments on provisionally priced sales, realized and unrealized changes to fair value for non-hedge derivative contracts and adjustments to originally invoiced weights and assays. |
| 4 By-product credits subtotal is used in the calculated of cash cost per pound of copper and zinc produced, net of by-product credits. Cash cost per pound of copper and per ounce of gold produced, net of by-product credits, are non-IFRS financial performance measures with no standardized definition under IFRS. For further information and a detailed reconciliation, please see the discussion under the "Non-IFRS Financial Reporting Measures" section of this MD&A. |
| 5 Derivative mark-to-market excludes mark-to-market on QP hedges. |
| 6 Copper, zinc and molybdenum shown in metric tonnes and gold and silver shown in ounces. |
| 7 Realized price for copper, zinc and molybdenum in $/metric tonne and realized price for gold and silver in $/oz. |
| 8 Realized price for copper and zinc in $/lb. |
The price, quantity and mix of metals sold, affect our revenue, operating cash flow and profit. Revenue from metals sales can vary from quarter to quarter due to production levels, shipping volumes and transfer of risk and title to customers.
| Three months ended June 30, 2021 | |
| (in $ millions) 1 | | Copper | | | Zinc | | | Gold | | | Silver | | | Molybdenum | | | Other | | | Total | |
| Revenue from contracts 2 | | 250.2 | | | 77.4 | | | 57.9 | | | 7.2 | | | 7.1 | | | 2.6 | | | 402.4 | |
| Amortization of deferred revenue | | - | | | - | | | 9.2 | | | 7.9 | | | - | | | - | | | 17.1 | |
| Pricing and volume adjustments 3 | | (6.2 | ) | | 0.3 | | | 1.8 | | | 0.3 | | | 3.7 | | | - | | | (0.1 | ) |
| By-product credits 4 | | 244.0 | | | 77.7 | | | 68.9 | | | 15.4 | | | 10.8 | | | 2.6 | | | 419.4 | |
| Derivative mark-to-market 5 | | - | | | - | | | - | | | - | | | - | | | - | | | - | |
| Revenue, excluding mark-to-market on non-QP hedges | | 244.0 | | | 77.7 | | | 68.9 | | | 15.4 | | | 10.8 | | | 2.6 | | | 419.4 | |
| Payable metal in concentrate sold 6 | | 25,176 | | | 25,361 | | | 38,205 | | | 577,507 | | | 265 | | | - | | | - | |
| Realized price 7 | | 9,692 | | | 3,063 | | | 1,803 | | | 26.74 | | | - | | | - | | | - | |
| Realized price 8 | | 4.40 | | | 1.39 | | | - | | | - | | | - | | | - | | | - | |
| Six months ended June 30, 2021 | |
| (in $ millions) 1 | | Copper | | | Zinc | | | Gold | | | Silver | | | Molybdenum | | | Other | | | Total | |
| Revenue from contracts 2 | | 423.9 | | | 159.5 | | | 100.1 | | | 13.6 | | | 14.2 | | | 4.2 | | | 715.5 | |
| Amortization of deferred revenue | | - | | | - | | | 14.1 | | | 16.6 | | | - | | | - | | | 30.7 | |
| Pricing and volume adjustments 3 | | (9.5 | ) | | 0.5 | | | (0.2 | ) | | 0.3 | | | 6.2 | | | - | | | (2.7 | ) |
| By-product credits 4 | | 414.4 | | | 160.0 | | | 114.0 | | | 30.5 | | | 20.4 | | | 4.2 | | | 743.5 | |
| Derivative mark-to-market 5 | | - | | | 0.1 | | | - | | | - | | | - | | | - | | | 0.1 | |
| Revenue, excluding mark-to-market on non-QP hedges | | 414.4 | | | 160.1 | | | 114.0 | | | 30.5 | | | 20.4 | | | 4.2 | | | 743.6 | |
| Payable metal in concentrate sold 6 | | 46,105 | | | 53,704 | | | 63,588 | | | 1,087,267 | | | 549 | | | - | | | - | |
| Realized price 7 | | 8,989 | | | 2,982 | | | 1,793 | | | 28.12 | | | - | | | - | | | - | |
| Realized price 8 | | 4.08 | | | 1.35 | | | - | | | - | | | - | | | - | | | - | |
| | | | | | | | | | | | | | | | | | | | | | |
| 1 Average realized price per unit sold may not calculate based on amounts presented in this table due to rounding. |
| 2 As per financial statements. |
| 3 Pricing and volume adjustments represents mark-to-market adjustments on provisionally priced sales, realized and unrealized changes to fair value for non-hedge derivative contracts and adjustments to originally invoiced weights and assays. |
| 4 By-product credits subtotal is used in the calculated of cash cost per pound of copper and zinc produced, net of by-product credits. Cash cost per pound of copper and per ounce of gold produced, net of by-product credits, are non-IFRS financial performance measures with no standardized definition under IFRS. For further information and a detailed reconciliation, please see the discussion under the "Non-IFRS Financial Reporting Measures" section of this MD&A. |
| 5 Derivative mark-to-market excludes mark-to-market on QP hedges. |
| 6 Copper, zinc and molybdenum shown in metric tonnes and gold and silver shown in ounces. |
| 7 Realized price for copper, zinc and molybdenum in $/metric tonne and realized price for gold and silver in $/oz. |
| 8 Realized price for copper and zinc in $/lb. |
Stream Sales
The following table shows stream sales included within realized prices and their respective deferred revenue and cash payment rates:
| | | | Three months ended | | | Six months ended | |
| | | | Jun. 30, 2022 | | | Jun. 30, 2022 | |
| | | | Manitoba | | | Peru 4 | | | Manitoba | | | Peru 4 | |
| Gold | oz | | 3,629 | | | 7,431 | | | 8,017 | | | 17,926 | |
| Silver | oz | | 75,367 | | | 494,029 | | | 162,279 | | | 1,137,665 | |
| Gold deferred revenue drawdown rate1,2 | $/oz | | 1,241 | | | 734 | | | 1,247 | | | 734 | |
| Gold cash rate3 | $/oz | | 429 | | | 412 | | | 429 | | | 412 | |
| Total gold stream realized price | $/oz | | 1,670 | | | 1,146 | | | 1,676 | | | 1,146 | |
| Silver deferred revenue drawdown rate1,2 | $/oz | | 24.49 | | | 14.95 | | | 24.62 | | | 14.95 | |
| Silver cash rate3 | $/oz | | 6.33 | | | 6.08 | | | 6.33 | | | 6.08 | |
| Total silver stream realized price | $/oz | | 30.82 | | | 21.03 | | | 30.95 | | | 21.03 | |
| | | | | | | | | | | | | |
| | | Three months ended | | | Six months ended | |
| | Jun. 30, 2021 | | | Jun. 30, 2021 | |
| | Manitoba | | | Peru | | | Manitoba | | | Peru | |
| Gold | oz | | 5,694 | | | 2,321 | | | 8,271 | | | 3,997 | |
| Silver | oz | | 109,381 | | | 295,116 | | | 158,143 | | | 641,254 | |
| Gold deferred revenue drawdown rate1,2 | $/oz | | 1,284 | | | 824 | | | 1,273 | | | 894 | |
| Gold cash rate 3 | $/oz | | 425 | | | 408 | | | 425 | | | 408 | |
| Total gold stream realized price | $/oz | | 1,709 | | | 1,232 | | | 1,698 | | | 1,302 | |
| Silver deferred revenue drawdown rate1,2 | $/oz | | 24.73 | | | 17.54 | | | 24.50 | | | 19.87 | |
| Silver cash rate 3 | $/oz | | 6.26 | | | 6.02 | | | 6.26 | | | 6.02 | |
| Total silver stream realized price | $/oz | | 30.99 | | | 23.56 | | | 30.76 | | | 25.89 | |
| 1Subsequent to the variable consideration adjustment recorded on January 1, 2022, the deferred revenue amortization is recorded in Manitoba at C$1,584/oz gold and C$31.28/oz silver (June 30, 2021 - C$1,578/oz gold and C$30.38/oz silver) and converted to US dollars at the exchange rate in effect at the time of revenue recognition. |
| 2 Deferred revenue drawdown rates for gold and silver do not include variable consideration adjustments. |
| 3 The gold and silver cash rate for Manitoba increased by 1% from $400/oz and $5.90/oz effective August 1, 2015. Subsequently every year, on August 1, the cash rate will increase by 1% compounded. The weighted average cash rate is disclosed. The gold and silver cash rate for Peru increased by 1% from $400/oz and $5.90/oz effective August 4, 2019. Subsequently every year, on August 4, the cash rate will increase by 1% compounded. The weighted average cash rate is disclosed. |
| 4 Subsequent to the variable consideration adjustment recorded on January 1, 2022, the deferred revenue amortization is recorded in Peru at $734/oz gold and $14.95/oz silver. Effective May 1, 2021, the drawdown rate for the Peru stream agreement for gold was $762/oz and prior to May 1, 2021, the drawdown rate for Peru gold was $990/oz. Effective May 1, 2021, the drawdown rate for the Peru stream agreement for silver was $15.64/oz and prior to May 1, 2021 the drawdown rate for Peru silver was $21.86/oz. |
Cost of Sales
Our detailed cost of sales is summarized as follows:
| (in $ thousands) | | Three months ended | | | Six months ended | |
| | Jun. 30,
2022 | | | Jun. 30,
2021 | | | Jun. 30,
2022 | | | Jun. 30,
2021 | |
| Peru | | | | | | | | | | | | |
| Mining | | 32,300 | | | 26,133 | | | 60,702 | | | 47,672 | |
| Milling | | 44,731 | | | 40,286 | | | 92,386 | | | 83,606 | |
| Changes in product inventory | | (8,394 | ) | | 4,465 | | | (13,166 | ) | | (6,110 | ) |
| Depreciation and amortization | | 47,811 | | | 52,710 | | | 96,173 | | | 93,145 | |
| G&A | | 18,577 | | | 16,962 | | | 34,775 | | | 31,401 | |
| Inventory adjustments | | (97 | ) | | (723 | ) | | (558 | ) | | (1,446 | ) |
| Freight, royalties and other charges | | 13,414 | | | 12,133 | | | 23,745 | | | 21,986 | |
| Total Peru cost of sales | | 148,342 | | | 151,966 | | | 294,057 | | | 270,254 | |
| Manitoba | | | | | | | | | | | | |
| Mining | | 54,500 | | | 54,714 | | | 113,933 | | | 109,134 | |
| Milling | | 20,953 | | | 13,655 | | | 42,462 | | | 26,317 | |
| Zinc plant | | 14,379 | | | 17,908 | | | 32,755 | | | 37,515 | |
| Changes in product inventory | | 12,888 | | | 10,795 | | | (3,260 | ) | | (1,495 | ) |
| Depreciation and amortization | | 39,494 | | | 46,595 | | | 72,223 | | | 88,842 | |
| Inventory adjustments | | 2,030 | | | - | | | 2,030 | | | - | |
| G&A | | 22,721 | | | 14,971 | | | 45,964 | | | 30,923 | |
| Freight, royalties and other charges | | 10,633 | | | 11,456 | | | 19,127 | | | 21,683 | |
| Total Manitoba cost of sales | | 177,598 | | | 170,094 | | | 325,234 | | | 312,919 | |
| Cost of sales | | 325,940 | | | 322,060 | | | 619,291 | | | 583,173 | |
Total cost of sales for the second quarter of 2022 was $325.9 million, reflecting an increase of $3.9 million from the second quarter of 2021. Peru cost of sales were relatively consistent, decreasing by $3.6 million in the second quarter of 2022, compared to the same period of 2021. Increases in mining, milling and general and administrative costs were offset by a relative buildup in product inventory. The increases in mining and milling costs were mainly driven by higher throughput as well as higher consumable costs. Manitoba cost of sales increased by $7.5 million in the second quarter of 2022, compared to the same period of 2021. Manitoba incurred higher milling and general and administrative costs, mostly related to higher volume of ore milled at New Britannia, more than offsetting a decline in milling costs at Flin Flon mill, as well as an increase in accrued employee profit sharing. These increases were partially offset by lower zinc plant costs and a relative drawdown in product inventory.
Total cost of sales for the first half of 2022 was $619.3 million, reflecting an increase of $36.1 million from the same period in 2021. Peru cost of sales increased by $23.8 million mainly driven by higher mining and milling costs due to higher diesel and power prices as well as higher throughput with the ramp-up of Pampacancha operations. Manitoba cost of sales increased by $12.3 million as a result of higher mining costs due to higher production at Lalor offsetting declines in production at 777 mine, and higher milling and general and administrative costs for the same reasons outlined in the second quarter variance. Partially offsetting these increases was a decrease in depreciation of the decommissioning and restoration assets, as increasing discount rates have reduced the overall provision and corresponding asset.
For details on unit operating costs refer to the respective tables in the "Operations Review" section of this MD&A.
For the second quarter of 2022, other significant variances in expenses from operations, compared to the same period in 2021, include the following:
- Impairment loss of $95.0 million, related to certain capitalized costs and assets associated with the previous stand-alone development plan for the Rosemont deposit, which were determined to no longer be recoverable.
- Environmental obligation adjustments increased by $60.2 million, largely as a result of gains on the revaluation of the environmental obligation on our non-producing sites in Manitoba. Specifically, an increase in long term risk-free discount rates resulted in a large decline in the closure cost provision.
Given the long term nature of the reclamation cash flows, the related environmental provision is highly sensitive to changes in long-term risk-free discount rates and, as such, we may continue to experience significant quarterly closure cost provision revaluations.
- Selling and administrative expenses decreased by $8.4 million compared to the same period in 2021, reflecting a reduction in share based compensation expense as a result of a decline in share prices compared to the same period in 2021.
For the year-to-date 2022, other significant variances in expenses from operations, compared to 2021, include the following:
- Environmental obligation adjustments increased by $135.5 million, largely as a result of gains on the revaluation of the environmental obligation on our non-producing sites in Manitoba for the same reasons outlined in the second quarter variance analysis.
- Impairment loss of $95.0 million, as outlined in the second quarter variance analysis.
- Exploration expenses increased by $8.3 million compared to the same period in 2021, reflecting new drilling programs in Peru and over the Flin Flon tailings area.
- Selling and administrative expenses decreased by $6.5 million compared to the same period in 2021. The decrease was primarily due to lower share based compensation expense as a result of the relative revaluation of previously issued share units to lower share prices during the current year compared to the prior year.
Net finance expense
| (in $ thousands) | | Three months ended | | | Six months ended | |
| | Jun. 30,
2022 | | | Jun. 30,
2021 | | | Jun. 30,
2022 | | | Jun. 30,
2021 | |
| | | | | | | | | | | | | |
| Finance costs - accrued or payable: | | | | | | | | | | | | |
| Interest expense on long-term debt | | 16,911 | | | 17,305 | | | 33,809 | | | 38,538 | |
| Withholding taxes | | 1,457 | | | 1,944 | | | 3,020 | | | 3,967 | |
| Tender premium on senior unsecured notes | | - | | | - | | | - | | | 22,878 | |
| Loss (gain) on disposal of investments | | 3,132 | | | (515 | ) | | 3,132 | | | (515 | ) |
| Other accrued/payable costs (income)1 | | 1,531 | | | 1,932 | | | 3,632 | | | 4,051 | |
| Total finance costs - accrued or payable | | 23,031 | | | 20,666 | | | 43,593 | | | 68,919 | |
| | | | | | | | | | | | | |
| Finance costs - non-cash: | | | | | | | | | | | | |
| Accretion on streaming agreements2 | | 7,357 | | | 10,536 | | | 12,193 | | | 26,064 | |
| Change in fair value of financial assets and liabilities at fair value through profit or loss | | (6,418 | ) | | 8,566 | | | 798 | | | 47,573 | |
| Write off unamortized transaction costs | | - | | | - | | | - | | | 2,480 | |
| Other non-cash costs3 | | 457 | | | 3,943 | | | 4,587 | | | 7,128 | |
| Total finance costs - non-cash | | 1,396 | | | 23,045 | | | 17,578 | | | 83,245 | |
| Net finance expense | | 24,427 | | | 43,711 | | | 61,171 | | | 152,164 | |
| 1 Includes interest income and other finance expense. |
| 2 Includes variable consideration adjustment (prior periods). |
| 3 Includes accretion on community agreements, accretion on Wheaton refund liability, unwinding of discount on provisions, and net foreign exchange losses (gains). |
Net finance expense during the second quarter ended June 30, 2022, decreased by $19.3 million compared to the second quarter of 2021 due to a $2.3 million increase in accrued finance costs and a $21.6 million decrease in non-cash finance costs.
This overall decrease was primarily driven by a $13.0 million increase in non-cash gains on the revaluation of the gold prepayment liability due to lower gold forward prices, a $4.0 million relative gain on foreign exchange, a decrease in revaluation losses of $2.0 million on our investments consisting of securities in Canadian metals and mining companies, and a $3.2 million reduction in the accretion on streaming arrangements due to a lower interest rate following the amended Peru streaming arrangement in the second quarter of 2021. This decrease was partially offset by a $3.6 million increase in losses on the disposal of certain public investments.
Net finance expense during the first half of 2022, decreased by $91.0 million compared to the same period in 2021 due to a $25.3 million decrease in accrued finance costs and a $65.7 million decrease in non-cash finance costs.
The reduction in net finance expense was primarily driven by the refinancing of senior unsecured notes in the first quarter of 2021. The prior year refinancing included a $49.8 million write-off of a non-cash embedded derivative on the early redemption option associated with our extinguished senior unsecured notes as well as a call premium of $22.9 million, with no corresponding charges recorded in 2022. In addition, we also incurred a $10.8 million reduction in the accretion on streaming arrangements due to a lower interest rate following the amended Peru streaming arrangement in the second quarter of 2021 and a decrease of $5.7 million in revaluation losses on our equity investments. Offsetting these increases was an $8.7 million increase in non-cash losses on the relative revaluation of the gold prepayment liability due to higher gold forward prices relative to the same period in 2021.
Tax (Recovery)/Expense
For the three and six months ended June 30, 2022, tax expense decreased by $28.9 million and increased by $5.7 million, respectively, compared to the same periods in 2021. The following table provides further details:
| | | Three months ended | | | Six months ended | |
| | Jun. 30, 2022 | | | Jun. 30, 2021 | | | Jun. 30, 2022 | | | Jun. 30, 2021 | |
| (in $ thousands) |
| Deferred tax (recovery) expense - income tax 1 | | (21,463 | ) | | 6,773 | | | (11,862 | ) | | (19,627 | ) |
| Deferred tax expense - mining tax 1 | | 127 | | | 93 | | | 5,117 | | | 11,792 | |
| Total deferred tax (recovery) expense | | (21,336 | ) | | 6,866 | | | (6,745 | ) | | (7,835 | ) |
| Current tax expense - income tax | | 7,477 | | | 1,916 | | | 12,954 | | | 2,883 | |
| Current tax expense - mining tax | | 3,220 | | | 9,432 | | | 8,198 | | | 13,676 | |
| Total current tax expense | | 10,697 | | | 11,348 | | | 21,152 | | | 16,559 | |
| Tax (recovery) expense | | (10,639 | ) | | 18,214 | | | 14,407 | | | 8,724 | |
| 1 Deferred tax expense (recovery) represents our draw down/increase of non-cash deferred income and mining tax assets/liabilities. |
Income Tax Expense/Recovery
Applying the estimated Canadian statutory income tax rate of 26.4% to our profit before taxes of $110.3 million for the year-to-date of 2022 would have resulted in a tax expense of approximately $29.1 million; however, we recorded an income tax expense of $1.1 million. The significant items causing our effective income tax rate to be different than the 26.4% estimated Canadian statutory income tax rate include:
- Deductible temporary differences with respect to Peru and Manitoba, relating to the decommissioning and restoration liabilities, were recognized as we have determined that it is probable that we will realize the recovery of these deferred tax assets based on the timing of the reversals of the deductible temporary differences and the future projected taxable profit of the Manitoba operations. This resulted in a combined deferred tax recovery of $36.8 million.
- Temporary income tax differences not recognized as we have determined that it is not probable that we will realize the recovery of these deferred tax assets. This resulted in a deferred tax expense of $3.7 million.
- Foreign exchange on the translation of deferred tax balances to group currency resulted in a deferred tax expense of $2.4 million.
- The tax expense with respect to our foreign operations are recorded using an income tax rate other than the Canadian statutory income tax rate of 26.4%, resulting in a tax expense of $5.1million.
Mining Tax Expense
Applying the estimated Manitoba mining tax rate of 10.0% to our profit before taxes of $110.3 million for the first quarter of 2022 would have resulted in a tax expense of approximately $11.0 million; however, we recorded a mining tax expense of $13.3 million. Effective mining tax rates can vary significantly based on the composition of our earnings and the expected amount of mining taxable profits. Corporate costs and other costs not related to mining operations are not deductible in computing mining profits. A brief description of how mining taxes are calculated in our various business units is discussed below.
Manitoba
The Province of Manitoba imposes mining tax on profit related to the sale of mineral products mined in the Province of Manitoba (mining taxable profit) at the following rates:
- 10% of total mining taxable profit if mining profit is C$50 million or less;
- Between mining profit of C$50 and $C55 million, mining tax is equal to a minimum of C$5 million plus mining profit less C$50 million multiplied by 65%;
- 15% of total mining taxable profit if mining profits are between C$55 million and C$100 million;
- Between mining profit of C$100 million and C$105 million, mining tax is equal to a minimum of C$15 million plus mining profit less C$100 million multiplied by 57%; and
- 17% of total mining taxable profit if mining profits exceed C$105 million.
We estimate that the tax rate that will be applicable when temporary differences reverse will be approximately 10.0%.
Peru
The Peruvian government imposes two parallel mining tax regimes, the Special Mining Tax and the Modified Royalty, on companies' operating mining income on a sliding scale, with progressive rates ranging from 2.0% to 8.4% and 1.0% to 12.0%, respectively. Based on financial forecasts, we have recorded a deferred tax liability as at June 30, 2022, at the tax rate we expect to apply when temporary differences reverse.
LIQUIDITY AND CAPITAL RESOURCES
Senior Unsecured Notes
We have $600.0 million aggregate principal amount of 4.5% senior notes due April 2026 and $600.0 million aggregate principal amount of 6.125% senior notes due April 2029.
Senior Secured Revolving Credit Facilities and Surety Bonds
We have two senior secured revolving credit facilities ("the Credit Facilities") for our Canadian and Peruvian businesses, with combined total availability of $450.0 million and substantially similar terms and conditions. As at June 30, 2022, our liquidity includes $258.6 million in cash as well as undrawn availability of $363.6 million under our Credit Facilities. As at June 30, 2022, we were in compliance with our covenants under the Credit Facilities and had drawn $86.4 million in letters of credit under the Credit Facilities.
As at June 30, 2022, the Arizona business unit had $28.3 million in surety bonds issued to support future reclamation and closure obligations. The Peru business unit also had $108.3 million in letters of credit issued with various Peruvian financial institutions to support future reclamation and other operating matters. No cash collateral is required to be posted under these letters of credit or surety bonds.
Financial Condition
Financial Condition as at June 30, 2022 compared to December 31, 2021
Cash decreased by $12.4 million during the first six months of the year to $258.6 million as at June 30, 2022. This decrease was mainly the result of $134.8 million of capital investments primarily at our Peru and Manitoba operations, interest payments of $31.9 million, partial repayment of our gold prepayment liability of $37.2 million, lease payments of $19.8 million, $10.0 million for a scheduled payment related to the Rosemont acquisition, other finance payments of $6.1 million as well as dividends of $2.1 million. Offsetting these cash outflows was cash flow from operating activities of $228.9 million. We hold the majority of our cash in low-risk, liquid investments with major Canadian and Peruvian financial institutions.
Working capital increased by $32.9 million to $180.4 million from December 31, 2021 to June 30, 2022, primarily due to an increase in other financial assets of $43.2 million due to an increase in the fair value of our outstanding fixed for floating copper hedges, an increase in inventories of $34.2 million mainly due to an increase in stockpile inventory as well as a buildup of finished goods inventory at our Peru operations, a decrease in deferred revenue liabilities of $23.0 million due to the closure of the 777 mine, a decrease in other financial liabilities of $18.0 million mainly due to payment of $10.0 million in deferred Rosemont acquisition consideration and declines in the valuation of derivative liabilities, and a decrease in other liabilities of $20.2 million due to changes in decommissioning and restoration liabilities as well as reductions in the provision for stock based compensation. Offsetting these items was a decrease in trade and other receivables of $102.6 million mainly due to timing of sales deliveries and a decrease in cash of $12.4 million.
Cash Flows
The following table summarizes our cash flows for the three and six months ended June 30, 2022 and June 30, 2021:
| (in $ thousands) | | Three months ended | | | Six months ended | |
| | Jun. 30,
2022 | | | Jun. 30,
2021 | | | Jun. 30,
2022 | | | Jun. 30,
2021 | |
| Operating cash flow before change in non-cash working capital | | 123,911 | | | 132,786 | | | 200,964 | | | 223,439 | |
| Change in non-cash working capital | | 41,695 | | | (36,408 | ) | | 27,949 | | | (75,267 | ) |
| Cash generated from operating activities | | 165,606 | | | 96,378 | | | 228,913 | | | 148,172 | |
| Cash used in investing activities | | (78,854 | ) | | (99,249 | ) | | (134,586 | ) | | (181,761 | ) |
| Cash used in financing activities | | (41,470 | ) | | (12,826 | ) | | (106,189 | ) | | (109,617 | ) |
| Effect of movement in exchange rates on cash | | (85 | ) | | (580 | ) | | (571 | ) | | (1,642 | ) |
| Increase (decrease) in cash | | 45,197 | | | (16,277 | ) | | (12,433 | ) | | (144,848 | ) |
Cash Flow from Operating Activities
Cash generated from operating activities was $165.6 million during the second quarter of 2022, an increase of $69.2 million compared with the same period in 2021. Operating cash flow before change in non-cash working capital was $123.9 million during the second quarter of 2022, reflecting a decrease of $8.9 million compared to the second quarter of 2021. The slight decrease in operating cash flows before changes in working capital is mostly attributable to higher mine operating costs due to inflationary pressures on input costs and higher profit sharing partially offset by higher zinc prices.
Year-to-date cash generated from operating activities was $228.9 million in 2022, an increase of $80.7 million compared to 2021. Operating cash flow before changes in non-cash working capital for the first half of 2022 was $201.0 million, a decrease of $22.5 million compared to 2021. The decrease in operating cash flow before changes in working capital is mostly attributable to the timing of current tax payments, which increased by $15.7 million compared to the first half of 2021, higher mine operating costs due to inflationary pressures on input costs and higher profit sharing partially offset by higher base metal prices.
Cash Flow from Investing and Financing Activities
During the second quarter of 2022, we spent $120.3 million in investing and financing activities, primarily driven by $78.9 million in capital expenditures, $18.6 million in partial settlement of our gold prepayment liability, $10.0 million in capitalized lease payments, $10.0 million for a scheduled deferred payment related to the acquisition of the remaining interest in Rosemont, and $3.0 million in other finance payments.
Year-to-date, we used $240.8 million of cash in investing and financing activities, primarily driven by $134.8 million of capital expenditures, $37.2 million in partial settlement of our gold prepayment liability, $31.9 million of interest payments, $19.8 million in capitalized lease payments, $10.0 million for a scheduled payment related to the Rosemont acquisition, $6.1 million of financing costs mainly related to withholding taxes on our debt obligations and our revolving credit facilities and $2.1 million in dividend payments.
Capital Expenditures
The following summarizes accrued and cash additions to capital assets for the periods indicated:
| | Three months ended | Six months ended | Guidance |
Jun. 30,
2022 | Jun. 30,
2021 | Jun. 30,
2022 | Jun. 30,
2021 | Annual |
| (in $ millions) | 2022 |
| Manitoba sustaining capital expenditures | 36.9 | 33.8 | 67.5 | 54.7 | 115.0 |
| Peru sustaining capital expenditures 1 | 28.1 | 32.2 | 48.2 | 45.0 | 105.0 |
| Total sustaining capital expenditures | 65.0 | 66.0 | 115.7 | 99.7 | 220.0 |
| Arizona capitalized costs 2 | 12.4 | 3.3 | 15.5 | 6.5 | 40.0 |
| Peru growth capitalized expenditures | 0.1 | 1.3 | 0.2 | 21.2 | 10.0 |
| Manitoba growth capitalized expenditures | 12.6 | 34.2 | 17.5 | 76.1 | 50.0 |
| Other capitalized costs | 0.9 | 12.7 | 2.5 | 14.0 | - |
| Capitalized exploration 2 | 7.0 | 1.1 | 10.1 | 2.1 | 40.0 |
| Total other capitalized expenditures | 33.0 | 52.6 | 45.8 | 119.9 | |
| Total capital additions | 98.0 | 118.6 | 161.5 | 219.6 | |
| | | | | | |
| Reconciliation to cash capital additions: | | | | | |
| Right-of-use asset additions | (12.5) | (21.4) | (20.3) | (22.7) | |
| Change in community agreement accruals | 0.1 | 14.4 | (0.8) | 1.3 | |
| Change in capital accruals and other | (6.7) | (11.0) | (5.6) | (14.7) | |
| Total cash capital additions | 78.9 | 100.6 | 134.8 | 183.5 | |
| 1 Peru sustaining capital expenditures includes capitalized stripping costs. |
| 2 Arizona capital expenditure guidance has increased by $20 million, which includes an additional $15 million in capitalized exploration and $5 million in capitalized costs. |
For the three and six months ended June 30, 2022, total capital additions declined by 17% and 26%, respectively, compared to the same periods in 2021 as a result of lower growth spending partially offset by higher sustaining capital expenditures in both Peru and Manitoba for the six months ended June 30, 2022.
Sustaining capital expenditures in Manitoba for the three and six months ended June 30, 2022 were $36.9 million and $67.5 million, respectively, representing increases of $3.1 million and $12.8 million compared to the same period in 2021. The increases were mainly due to higher planned capital development and lease additions at Snow Lake, partially offset by reduced spending on the Anderson tailings facility upgrades as the project nears completion and the cessation of capitalizing development costs at 777 given its closure.
Sustaining capital expenditures in Peru for the three months ended June 30, 2022 were $28.1 million, representing a decrease of $4.1 million compared to the same period in 2021. The decreased expenditures mainly relate to lower spending on the tailings management facility expansion during the second quarter. Sustaining capital expenditures in Peru for the six months ended June 30, 2022 were $48.2 million, representing an increase of $3.2 million compared to the same period in 2021. The increased expenditures are primarily due to increased deferred stripping at Pampacancha.
Growth capital spending in Manitoba for the three and six months ended June 30, 2022 were $12.6 million and $17.5 million, respectively, reflecting expenditures for the Lalor expansion and recovery improvement projects at both New Britannia and Stall. Compared to the same quarter of 2021, growth capital expenditures decreased by $21.6 million and $58.6 million, respectively, as the comparative period included significant costs related to the New Britannia refurbishment project, which was completed in the fourth quarter of 2021.
Growth capital expenditures in Peru for the three and six months ended June 30, 2022 were $0.1 million and $0.2 million, respectively, representing decreases of $1.2 million and $21.0 million compared to the same periods in 2021. The decrease in year-to-date growth capital expenditures was caused by significant costs incurred in the comparative period to bring Pampacancha to commercial production in the second quarter of 2021.
Arizona's growth capital expenditures for the three and six months ended June 30, 2022 were $12.4 million and $15.5 million, respectively, and relate primarily to pre-feasibility study costs associated with Copper World Complex. Following our announcement of the Copper World Complex PEA during the second quarter, we have increased our full year 2022 spending for Arizona by $30 million, a majority of which is expected to be capitalized. Also, with the release of the Copper Word Complex PEA, we have capitalized future exploration expenditures as well as pre-feasibility study costs starting in May 2022.
Other capitalized costs for the three and six months ended June 30, 2022 were $0.9 million and $2.5 million, respectively, which are mostly made up of non-cash capitalized costs.
We expect consolidated sustaining and growth capital expenditures in 2022 to be in line with our full year guidance.
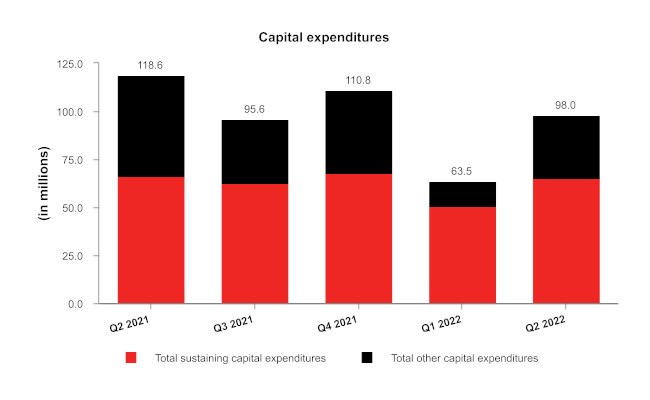
Capital Commitments
As at June 30, 2022, we had outstanding capital commitments in Canada of approximately $51.0 million, of which $49.5 million can be terminated, approximately $32.9 million in Peru primarily related to exploration option agreements, all of which can be terminated, and approximately $34.4 million in Arizona, primarily related to our Copper World Complex, of which approximately $8.2 million can be terminated.
We expect that our financing costs will increase as we anticipate increasing the letters of credit and/or surety bonds required to support recently updated closure plans.
Contractual Obligations
The following table summarizes our significant contractual obligations as at June 30, 2022:
| | Less than
12 months | 13 - 36
months | 37 - 60
months | More than
60 months |
| Payment Schedule (in $ millions) | Total |
| Long-term debt obligations1 | 1,579.1 | 67.4 | 134.7 | 703.5 | 673.5 |
| Gold prepayment obligation2 | 103.7 | 69.9 | 33.8 | - | - |
| Lease obligations | 142.6 | 54.0 | 54.1 | 17.0 | 17.5 |
| Purchase obligation - capital commitments | 118.3 | 70.7 | 18.0 | 26.0 | 3.6 |
| Purchase obligation - other commitments3 | 994.5 | 335.6 | 347.4 | 139.3 | 172.2 |
| Pension and other employee future benefits obligations2 | 136.9 | 11.8 | 11.3 | 6.3 | 107.5 |
| Community agreement obligations4, 5 | 52.6 | 7.0 | 10.1 | 4.4 | 31.1 |
| Decommissioning and restoration obligations5 | 427.6 | 11.5 | 7.4 | 8.0 | 400.7 |
| Total | 3,555.3 | 627.9 | 616.8 | 904.5 | 1,406.1 |
| 1 Long-term debt obligations include scheduled interest payments, as well as principal repayments. |
| 2 Discounted. |
| 3 Primarily made up of long-term agreements with operational suppliers, obligations for power purchase, concentrate handling, fleet and port services, as well as deferred consideration arising from the acquisition of Rosemont's minority interest. |
| 4 Represents community agreement obligations and various finalized land user agreements, including Pampacancha. |
| 5 Undiscounted before inflation. |
In addition to the contractual obligations included in the above payment schedule, we also have the following commitments which impact our financial position:
- A profit-sharing plan with most Manitoba employees;
- A profit-sharing plan with all Peru employees;
- Wheaton precious metals stream agreements for the 777 mine and Constancia mines;
- A net smelter returns royalty agreement related to the 777 mine; and,
- Government royalty payments related to the Constancia mine.
Outstanding Share Data
As of August 7, 2022, there were 261,890,008 common shares of Hudbay issued and outstanding. In addition, there were 1,795,419 stock options outstanding.
TREND ANALYSIS AND QUARTERLY REVIEW
A detailed quarterly and annual summary of financial and operating performance can be found in the "Summary of Results" section at the end of this MD&A. The following table sets forth selected consolidated financial information for each of our eight most recently completed quarters:
(in $ millions, except per share amounts,
production on a copper equivalent basis
and average realized copper price) | | 2021 | 2020 |
| 2022 |
| Q2 | Q1 | Q4 | Q33 | Q2 | Q1 | Q4 | Q3 |
| Production on a copper equivalent basis (tonnes) | 46,332 | 45,085 | 50,685 | 42,243 | 39,289 | 43,246 | 47,343 | 47,445 |
| Average realized copper price ($/lb) | 4.28 | 4.53 | 4.34 | 4.26 | 4.40 | 3.69 | 3.29 | 2.96 |
| Revenue | 415.5 | 378.6 | 425.2 | 359.0 | 404.2 | 313.6 | 322.3 | 316.1 |
| Gross earnings (loss) | 89.5 | 85.3 | 81.7 | (85.4) | 82.2 | 52.5 | 34.4 | 39.3 |
| Profit (loss) before tax | 21.5 | 88.9 | (0.2) | (147.8) | 14.8 | (69.6) | 0.9 | (23.9) |
| Profit (loss) | 32.1 | 63.8 | (10.5) | (170.4) | (3.4) | (60.1) | 7.4 | (24.0) |
| Adjusted net earnings (loss)1,3 | 30.5 | 5.2 | 32.7 | 0.9 | 5.4 | (16.1) | (16.4) | (25.4) |
| Earnings (loss) per share: | | | | | | | | |
| Basic and diluted | 0.12 | 0.24 | (0.04) | (0.65) | (0.01) | (0.23) | 0.03 | (0.09) |
Adjusted net earnings (loss)1,3
per share | 0.12 | 0.02 | 0.13 | 0.00 | 0.02 | (0.06) | (0.06) | (0.10) |
| Operating cash flow2 | 123.9 | 77.1 | 156.9 | 103.5 | 132.8 | 90.7 | 86.1 | 84.4 |
| Adjusted EBITDA1 | 141.4 | 110.2 | 180.3 | 119.3 | 143.2 | 104.2 | 106.9 | 96.1 |
| 1 Adjusted net earnings (loss), adjusted net earnings (loss) per share, and adjusted EBITDA are non-IFRS financial performance measure with no standardized definition under IFRS. For further information and a detailed reconciliation, please see the discussion under the "Non-IFRS Financial Reporting Measures" section of this MD&A. |
| 2 Operating cash flow before changes in non-cash working capital. |
| 3 The adjusted net earnings (loss) and adjusted net earnings (loss) per share in respect of the third quarter of 2021 were adjusted in our management's discussion and analysis of financial results for the year ended December 31, 2021 due to a change in the computed tax effect on certain adjustments. The adjusted net earnings changed from $38.2 million to an adjusted net earnings of $0.9 million and the adjusted net earnings per share changed from $0.15/share to an adjusted net earnings per share of $0.00/share. |
Commodity prices have experienced sizable declines during the second quarter of 2022 impacting our operating results during the quarter. The second quarter results were also impacted by a revaluation gain of $60.7 million pertaining mostly to the environmental obligation on our Flin Flon site due to increases in long-term risk-free interest rates. A pre-tax impairment loss of $95.0 million was recorded following the release of the Copper World Complex PEA as certain assets associated with the previous, stand-alone development plan for the Rosemont deposit are no longer expected to be recoverable.
Results in the first quarter of 2022 benefited from a trend of higher realized base metal prices, but were also impacted by rising operating costs caused by inflation. While we have achieved increased gold production from the higher grade Pampacancha deposit and the higher recovery New Britannia gold mill, we experienced increased levels of COVID-related absenteeism in the workforce, impacting production, and also experienced limited availability of rail cars leading to reduced sales and an inventory build-up. The first quarter results were also impacted by a revaluation gain of $78.2 million pertaining mostly to the environmental obligation on our Flin Flon site and $1.7 million for our non-producing sites in Manitoba caused by an increase in long-term risk-free interest rates.
Results for the fourth quarter of 2021 benefited from higher realized metal prices. This strength in commodity prices combined with higher gold production following the commencement of commercial production at New Britannia and improving copper recoveries led to record revenue of $425.2 million during the quarter. Adjusted EBITDA and operating cash flow both reached record highs. Notwithstanding these records, continued inflationary pressures along with lower copper grades caused operating costs to climb and put pressure on gross margins, compared to earlier quarters. A revaluation of our environmental obligation for the Flin Flon closure plan resulted in a $46.2 million non-cash charge, which negatively impacted net income for the quarter.
During the third quarter of 2021, increasing base metal prices contributed to strong revenues and operating cash flow. Mining at Pampacancha continued to ramp-up, contributing significantly to gold production during the quarter. As a result of the planned closure of Flin Flon operations in mid-2022 and an updated Flin Flon closure plan, non-cash charges totaling $156.3 million were incurred, which negatively impacted gross profit for the quarter. In Peru, ongoing COVID-19 costs, along with lower copper grades, put pressure on operating costs.
Financial results in the second quarter of 2021 benefited from initial production at the Pampacancha pit but were negatively impacted by higher operating costs in Peru and lower Manitoba metal production caused by COVID-19 related impacts as well as lower copper and zinc grades and lower precious metal recoveries.
The first quarter of 2021 saw lower revenues compared to the fourth quarter of 2020 due to a delayed Peru shipment for which revenue could not be recognized, and lower sales volumes from Manitoba related to a buildup of finished goods inventory during the quarter as a result of a lack of rail car availability. First quarter results were negatively impacted by $75.2 million of various finance expenses related to the refinancing of our senior notes.
Following the sharp correction in commodity prices after the initial outbreak of the COVID-19 pandemic in early 2020, commodity prices rose steadily into 2021 providing a tailwind to our operating results. Earnings in the fourth quarter of 2020 were negatively impacted by the 777 production interruption which resulted in $11.7 million in certain overhead costs being expensed through cost of sales.
For information on previous trends and quarterly reviews, refer to our MD&A for the year ended December 31, 2021, dated February 23, 2022.
NON-IFRS FINANCIAL PERFORMANCE MEASURES
Adjusted net earnings (loss), adjusted net earnings (loss) per share, adjusted EBITDA, net debt, cash cost, sustaining and all-in sustaining cash cost per pound of copper produced, cash cost and sustaining cash cost per ounce of gold produced and combined unit cost are non-IFRS performance measures. These measures do not have a meaning prescribed by IFRS and are therefore unlikely to be comparable to similar measures presented by other issuers. These measures should not be considered in isolation or as a substitute for measures prepared in accordance with IFRS and are not necessarily indicative of operating profit or cash flow from operations as determined under IFRS. Other companies may calculate these measures differently.
Management believes adjusted net earnings (loss) and adjusted net earnings (loss) per share provides an alternate measure of the Company's performance for the current period and gives insight into its expected performance in future periods. These measures are used internally by the Company to evaluate the performance of its underlying operations and to assist with its planning and forecasting of future operating results. As such, the Company believes these measures are useful to investors in assessing the Company's underlying performance. We provide adjusted EBITDA to help users analyze our results and to provide additional information about our ongoing cash generating potential in order to assess our capacity to service and repay debt, carry out investments and cover working capital needs. Net debt is shown because it is a performance measure used by the Company to assess our financial position. Cash cost, sustaining and all-in sustaining cash cost per pound of copper produced are shown because we believe they help investors and management assess the performance of our operations, including the margin generated by the operations and the Company. Cash cost and sustaining cash cost per ounce of gold produced are shown because we believe they help investors and management assess the performance of our Manitoba operations. Combined unit cost is shown because we believe it helps investors and management assess our cost structure and margins that are not impacted by variability in by-product commodity prices.
During 2021, there were non-recurring adjustments for Manitoba operations, including severance, past service pension costs, write-downs of certain machinery and equipment, and inventory supplies write-downs as well as non-cash impairment charges related to an updated Flin Flon closure plan and lower long-term discount rates in the fourth quarter, none of which management believes are indicative of ongoing operating performance and therefore are adjusting items in the calculations of adjusted net earnings (loss) and adjusted EBITDA.
Cash cost and sustaining cash cost per pound of zinc produced was a previously disclosed non-IFRS measure, most recently published in our MD&A for the year ended December 31, 2021, dated February 23, 2022. With the closure of 777 mine and Flin Flon operations, including the zinc plant, in the second quarter of 2022, the production profile of Manitoba has shifted from zinc to gold and therefore we have ceased providing this measure on a go forward basis.
In the first and second quarter of 2022, we recorded a non-cash gain of $79.9 million and $60.7 million, respectively, mostly related to the quarterly revaluation of our Flin Flon environmental provision, which was impacted by rising long-term risk-free discount rates. With closure of 777 mine and Flin Flon operations in the second quarter of 2022 and given the long-term nature of the reclamation cash flows, quarterly revaluation of the corresponding environmental provision remains highly sensitive to changes in long-term risk-free discount rates and, as such, we expect to continue to experience quarterly environmental provision revaluations, which is not indicative of our ongoing operating performance. This item has been included prospectively in our calculation of adjusted earnings.
Adjusted Net Earnings (Loss)
Adjusted net earnings (loss) represents net earnings (loss) excluding certain impacts, net of taxes, such as mark-to-market adjustments, impairment charges and reversal of impairment charges, write-down of assets, and foreign exchange (gain) loss. These measures are not necessarily indicative of net earnings (loss) or cash flows as determined under IFRS.
The following table provides a reconciliation of earnings (loss) per the consolidated interim income statements, to adjusted net earnings (loss) for the three and six months ended June 30, 2022 and 2021.
| | | Three months ended | | | Six months ended | |
| (in $ millions) | | Jun. 30,
2022 | | | Jun. 30,
2021 | | | Jun. 30,
2022 | | | Jun. 30,
2021 | |
| Profit (loss) for the period | | 32.1 | | | (3.4 | ) | | 95.9 | | | (63.5 | ) |
| Tax (recovery) expense | | (10.6 | ) | | 18.2 | | | 14.4 | | | 8.7 | |
| Profit (loss) before tax | | 21.5 | | | 14.8 | | | 110.3 | | | (54.8 | ) |
| Adjusting items: | | | | | | | | | | | | |
| Mark-to-market adjustments 1 | | (14.0 | ) | | 10.9 | | | (3.5 | ) | | 51.7 | |
| Foreign exchange (gain) loss | | (2.2 | ) | | 1.7 | | | (0.7 | ) | | 3.4 | |
| Inventory adjustments | | 1.9 | | | (0.7 | ) | | 1.5 | | | (1.4 | ) |
| Variable consideration adjustment - stream revenue and accretion | | - | | | - | | | (5.8 | ) | | (1.0 | ) |
| Impairment loss | | 95.0 | | | - | | | 95.0 | | | - | |
| Environmental obligation adjustments 2 | | (60.7 | ) | | - | | | (140.5 | ) | | - | |
| Evaluation expenses | | 0.7 | | | - | | | 7.7 | | | - | |
| Insurance recovery | | (5.7 | ) | | - | | | (5.7 | ) | | - | |
| Write-down of unamortized transaction costs | | - | | | - | | | - | | | 2.5 | |
| Premium paid on redemption of notes | | - | | | - | | | - | | | 22.9 | |
| Restructuring charges - Manitoba 3 | | 3.7 | | | - | | | 4.4 | | | - | |
| Loss on disposal of investments | | 3.1 | | | - | | | 3.1 | | | - | |
| Adjusted earnings before income taxes | | 43.3 | | | 26.7 | | | 65.8 | | | 23.3 | |
| Tax recovery (expense) | | 10.6 | | | (18.2 | ) | | (14.4 | ) | | (8.7 | ) |
| Tax impact of adjusting items | | (23.4 | ) | | (3.1 | ) | | (15.4 | ) | | (25.3 | ) |
| Adjusted net earnings (loss) | | 30.5 | | | 5.4 | | | 36.0 | | | (10.7 | ) |
| Adjusted net earnings (loss) ($/share) | | 0.12 | | | 0.02 | | | 0.14 | | | (0.04 | ) |
| Basic weighted average number of common shares outstanding (millions) | | 261.9 | | | 261.5 | | | 261.8 | | | 261.4 | |
| 1 Includes changes in fair value of the gold prepayment liability, Canadian junior mining investments, other financial assets and liabilities at fair value through profit or loss and share-based compensation expenses. |
| 2 Changes from movements to environmental obligation closure estimates are primarily related to the Flin Flon operations, which were fully depreciated as of June 30, 2022, as well as other Manitoba non-operating sites. |
| 3 Includes closure costs for Flin Flon operations. |
After adjusting reported net earnings for those items not considered representative of the Company's core business or indicative of future operations, the Company had an adjusted net earnings in the second quarter of 2022 of $30.5 million or $0.12 earnings per share.
Adjusted EBITDA
Adjusted EBITDA is profit or loss before net finance expense/income, tax expense/recoveries, depreciation and amortization of property, plant and equipment and deferred revenue, as well as certain other adjustments. We calculate adjusted EBITDA by excluding certain adjustments included within our adjusted net earnings measure which we believe reflects the underlying performance of our core operating activities. The measure also removes the impact of non-cash items and financing costs that are not associated with measuring the underlying performance of our operations. However, our adjusted EBITDA is not the measure defined as EBITDA under our senior notes or revolving credit facilities and may not be comparable with performance measures with the same name reported by other companies. Adjusted EBITDA should not be considered as a substitute for profit or loss or as a better measure of liquidity than operating cash flow, which are calculated in accordance with IFRS. We provide adjusted EBITDA to help users analyze our results and to provide additional information about our ongoing cash generating potential in order to assess our capacity to service and repay debt, carry out investments and cover working capital needs.
The following table presents the reconciliation of earnings (loss) per the consolidated interim income statements, to adjusted EBITDA for the three and six months ended June 30, 2022 and 2021:
| | | Three months ended | | | Six months ended | |
| (in $ millions) | | Jun. 30,
2022 | | | Jun. 30,
2021 | | | Jun. 30,
2022 | | | Jun. 30,
2021 | |
| Profit (loss) for the period | | 32.1 | | | (3.4 | ) | | 95.9 | | | (63.5 | ) |
| | | | | | | | | | | | | |
| Add back: | | | | | | | | | | | | |
| Tax (recovery) expense | | (10.6 | ) | | 18.2 | | | 14.4 | | | 8.7 | |
| Net finance expense | | 24.4 | | | 43.7 | | | 61.2 | | | 152.2 | |
| Other (income) expense | | (1.3 | ) | | 1.6 | | | 7.7 | | | 3.0 | |
| Depreciation and amortization | | 87.3 | | | 99.3 | | | 168.4 | | | 182.0 | |
| Amortization of deferred revenue and variable consideration adjustment | | (19.2 | ) | | (17.1 | ) | | (47.4 | ) | | (32.3 | ) |
| | | 112.7 | | | 142.3 | | | 300.2 | | | 250.1 | |
| Adjusting items (pre-tax): | | | | | | | | | | | | |
| Environmental obligation adjustments 1 | | (60.7 | ) | | (0.6 | ) | | (140.5 | ) | | (5.0 | ) |
| Impairment loss | | 95.0 | | | - | | | 95.0 | | | - | |
| Inventory adjustments | | 1.9 | | | (0.7 | ) | | 1.5 | | | (1.4 | ) |
| Share-based compensation (recovery) expense 2 | | (7.5 | ) | | 2.2 | | | (4.3 | ) | | 4.0 | |
| Adjusted EBITDA | | 141.4 | | | 143.2 | | | 251.9 | | | 247.7 | |
| 1 Environmental obligation adjustments were presented within other (income) expense for 2021 periods. |
| 2 Share-based compensation expenses reflected in cost of sales and selling and administrative expenses. |
Net Debt
The following table presents our calculation of net debt as at June 30, 2022 and December 31, 2021:
| | |
| (in $ thousands) | | Jun. 30, 2022 | | | Dec. 31,
2021 | |
| Total long-term debt | | 1,182,143 | | | 1,180,274 | |
| Cash | | (258,556 | ) | | (270,989 | ) |
| Net debt | | 923,587 | | | 909,285 | |
Cash Cost, Sustaining and All-in Sustaining Cash Cost (Copper Basis)
Cash cost per pound of copper produced ("cash cost") is a non-IFRS measure that management uses as a key performance indicator to assess the performance of our operations. Our calculation designates copper as our primary metal of production as it has been the largest component of revenues. The calculation is presented in four manners:
- Cash cost, before by-product credits - This measure is gross of by-product revenues and is a function of the efforts and costs incurred to mine and process all ore mined. However, the measure divides this aggregate cost over only pounds of copper produced, our primary metal of production. This measure is generally less volatile from period to period, as it is not affected by changes in the price received for by-product metals. It is, however, significantly affected by the relative mix of copper concentrate and finished zinc production, where the sale of the zinc will occur later, and an increase in production of zinc metal will tend to result in an increase in cash cost under this measure.
- Cash cost, net of by-product credits - In order to calculate the net cost to produce and sell copper, the net of by-product credits measure subtracts the revenues realized from the sale of the metals other than copper. The by-product revenues from zinc, gold, and silver are significant and are integral to the economics of our operations. The economics that support our decision to produce and sell copper would be different if we did not receive revenues from the other significant metals being extracted and processed. This measure provides management and investors with an indication of the minimum copper price consistent with positive operating margins, assuming realized by-product metal prices are consistent with those prevailing during the reporting period. It also serves as an important operating statistic that management and investors utilize to measure our operating performance versus that of our competitors. However, it is important to understand that if by-product metal prices decline alongside copper prices, the cash cost net of by-product credits would increase, requiring a higher copper price than that reported to maintain positive cash flows and operating margins.
- Sustaining cash cost, net of by-product credits - This measure is an extension of cash cost that includes cash sustaining capital expenditures, including payments on capitalized leases, capitalized sustaining exploration, net smelter returns royalties, payments on certain long-term community agreements, as well as accretion and amortization for expected decommissioning activities for producing assets. It does not include corporate selling and administrative expenses. It provides a more fulsome measurement of the cost of sustaining production than cash cost, which is focused on operating costs only.
- All-in sustaining cash cost, net of by-product credits - This measure is an extension of sustaining cash cost that includes corporate G&A, regional costs, accretion and amortization for community agreements relating to current operations, and accretion for expected decommissioning activities for non-producing assets. Due to the inclusion of corporate selling and administrative expenses, all-in sustaining cash cost is presented on a consolidated basis only.
The tables below present a detailed build-up of cash cost and sustaining cash cost, net of by-product credits, by business unit in addition to consolidated all-in sustaining cash cost, net of by-product credits, and reconciliations between cash cost, net of by-product credits, to the most comparable IFRS measures of cost of sales for the three and six months ended June 30, 2022 and 2021. Cash cost, net of by-product credits may not calculate exactly based on amounts presented in the tables below due to rounding.
| Consolidated | | Three months ended | | | Six months ended | |
| Net pounds of copper produced | | | | | | |
| (in thousands) | | Jun. 30, 2022 | | | Jun. 30, 2021 | | | Jun. 30, 2022 | | | Jun. 30, 2021 | |
| Peru | | 46,032 | | | 42,015 | | | 88,286 | | | 81,317 | |
| Manitoba | | 10,556 | | | 9,736 | | | 22,761 | | | 24,564 | |
| Net pounds of copper produced | | 56,588 | | | 51,751 | | | 111,047 | | | 105,881 | |
| Consolidated | | Three months ended | | | Six months ended | |
| | | Jun. 30, 2022 | | | Jun. 30, 2021 | | | Jun. 30, 2022 | | | Jun. 30, 2021 | |
| Cash cost per pound of copper produced | | $000s | | | $/lb | | | $000s | | | $/lb | | | $000s | | | $/lb | | | $000s | | | $/lb | |
| Cash cost, before by-product credits | | 243,902 | | | 4.31 | | | 218,899 | | | 4.23 | | | 485,960 | | | 4.37 | | | 428,764 | | | 4.05 | |
| By-product credits | | (207,191 | ) | | (3.66 | ) | | (175,470 | ) | | (3.39 | ) | | (388,864 | ) | | (3.50 | ) | | (328,983 | ) | | (3.11 | ) |
| Cash cost, net of by-product credits | | 36,711 | | | 0.65 | | | 43,429 | | | 0.84 | | | 97,096 | | | 0.87 | | | 99,781 | | | 0.94 | |
| Consolidated | | Three months ended | | | Six months ended | |
| | | Jun. 30, 2022 | | | Jun. 30, 2021 | | | Jun. 30, 2022 | | | Jun. 30, 2021 | |
| Supplementary cash cost information | | $000s | | | $/lb 1 | | | $000s | | | $/lb 1 | | | $000s | | | $/lb 1 | | | $000s | | | $/lb 1 | |
| By-product credits2: | | | | | | | | | | | | | | | | | | | | | | | | |
| Zinc | | 88,548 | | | 1.56 | | | 77,707 | | | 1.50 | | | 155,677 | | | 1.40 | | | 160,021 | | | 1.51 | |
| Gold 3 | | 91,317 | | | 1.61 | | | 68,880 | | | 1.33 | | | 175,491 | | | 1.58 | | | 114,012 | | | 1.08 | |
| Silver 3 | | 17,956 | | | 0.32 | | | 15,443 | | | 0.30 | | | 36,595 | | | 0.33 | | | 30,579 | | | 0.29 | |
| Molybdenum & other | | 9,370 | | | 0.17 | | | 13,440 | | | 0.26 | | | 21,101 | | | 0.19 | | | 24,371 | | | 0.23 | |
| Total by-product credits | | 207,191 | | | 3.66 | | | 175,470 | | | 3.39 | | | 388,864 | | | 3.50 | | | 328,983 | | | 3.11 | |
| Reconciliation to IFRS: | | | | | | | | | | | | | | | | | | | | | | | | |
| Cash cost, net of by-product credits | | 36,711 | | | | | | 43,429 | | | | | | 97,096 | | | | | | 99,781 | | | | |
| By-product credits | | 207,191 | | | | | | 175,470 | | | | | | 388,864 | | | | | | 328,983 | | | | |
| Treatment and refining charges | | (15,033 | ) | | | | | (15,243 | ) | | | | | (27,116 | ) | | | | | (27,178 | ) | | | |
| Inventory adjustments | | 1,933 | | | | | | (723 | ) | | | | | 1,472 | | | | | | (1,446 | ) | | | |
| Share-based compensation expense | | (632 | ) | | | | | 274 | | | | | | (184 | ) | | | | | 458 | | | | |
| Change in product inventory | | 4,494 | | | | | | 15,260 | | | | | | (16,426 | ) | | | | | (7,605 | ) | | | |
| Royalties | | 3,971 | | | | | | 4,288 | | | | | | 7,189 | | | | | | 8,193 | | | | |
| Depreciation and amortization4 | | 87,305 | | | | | | 99,305 | | | | | | 168,396 | | | | | | 181,987 | | | | |
| Cost of sales5 | | 325,940 | | | | | | 322,060 | | | | | | 619,291 | | | | | | 583,173 | | | | |
| 1 Per pound of copper produced. |
| 2 By-product credits are computed as revenue per financial statements, including amortization of deferred revenue and pricing and volume adjustments. For more information, please see the realized price reconciliation table on page 27 for these figures. |
| 3 Gold and silver by-product credits do not include variable consideration adjustments with respect to stream arrangements. Variable consideration adjustments are cumulative adjustments to gold and silver stream deferred revenue primarily associated with the net change in mineral reserves and resources or amendments to the mine plan that would change the total expected deliverable ounces under the precious metal streaming arrangement. For the six months ended June 30, 2022 the variable consideration adjustments amounted to income $3,245 (six months ended June 30, 2021 - income of $1,617). |
| 4 Depreciation is based on concentrate sold. |
| 5 As per IFRS financial statements. |
| Peru | | Three months ended | | | Six months ended | |
| (in thousands) | | Jun. 30, 2022 | | | Jun. 30, 2021 | | | Jun. 30, 2022 | | | Jun. 30, 2021 | |
| Net pounds of copper produced1 | | 46,032 | | | 42,015 | | | 88,286 | | | 81,317 | |
| 1 Contained copper in concentrate. | |
| Peru | | Three months ended | | Six months ended |
| | | Jun. 30, 2022 | | Jun. 30, 2021 | | Jun. 30, 2022 | | Jun. 30, 2021 |
Cash cost per pound of
copper produced | | $000s | | $/lb | | $000s | | $/lb | | $000s | | $/lb | | $000s | | $/lb |
| Mining | | 32,300 | | 0.70 | | 26,133 | | 0.62 | | 60,702 | | 0.69 | | 47,672 | | 0.59 |
| Milling | | 44,731 | | 0.97 | | 40,286 | | 0.96 | | 92,386 | | 1.05 | | 83,606 | | 1.02 |
| G&A | | 18,677 | | 0.41 | | 16,910 | | 0.40 | | 34,777 | | 0.39 | | 31,330 | | 0.39 |
| Onsite costs | | 95,708 | | 2.08 | | 83,329 | | 1.98 | | 187,865 | | 2.13 | | 162,608 | | 2.00 |
| Treatment & refining | | 9,226 | | 0.20 | | 9,824 | | 0.23 | | 16,811 | | 0.19 | | 16,437 | | 0.20 |
| Freight & other | | 12,297 | | 0.26 | | 11,555 | | 0.29 | | 21,774 | | 0.25 | | 20,242 | | 0.25 |
| Cash cost, before by-product credits | | 117,231 | | 2.54 | | 104,708 | | 2.50 | | 226,450 | | 2.57 | | 199,287 | | 2.45 |
| By-product credits | | (33,268) | | (0.72) | | (27,137) | | (0.65) | | (77,265) | | (0.88) | | (50,001) | | (0.61) |
| Cash cost, net of by-product credits | | 83,963 | | 1.82 | | 77,571 | | 1.85 | | 149,185 | | 1.69 | | 149,286 | | 1.84 |
| Peru | | Three months ended | | | Six months ended | |
| | | Jun. 30, 2022 | | | Jun. 30, 2021 | | | Jun. 30, 2022 | | | Jun. 30, 2021 | |
Supplementary cash cost
information | | $000s | | | $/lb 1 | | | $000s | | | $/lb 1 | | | $000s | | | $/lb 1 | | | $000s | | | $/lb 1 | |
| By-product credits2: | | | | | | | | | | | | | | | | | | | | | | | | |
| Gold3 | | 14,191 | | | 0.31 | | | 8,835 | | | 0.21 | | | 35,903 | | | 0.41 | | | 12,989 | | | 0.16 | |
| Silver3 | | 11,687 | | | 0.25 | | | 7,466 | | | 0.18 | | | 24,678 | | | 0.28 | | | 16,804 | | | 0.21 | |
| Molybdenum | | 7,390 | | | 0.16 | | | 10,836 | | | 0.26 | | | 16,684 | | | 0.19 | | | 20,208 | | | 0.25 | |
| Total by-product credits | | 33,268 | | | 0.72 | | | 27,137 | | | 0.65 | | | 77,265 | | | 0.88 | | | 50,001 | | | 0.61 | |
| Reconciliation to IFRS: | | | | | | | | | | | | | | | | | | | | | | | | |
| Cash cost, net of by-product credits | | 83,963 | | | | | | 77,571 | | | | | | 149,185 | | | | | | 149,286 | | | | |
| By-product credits | | 33,268 | | | | | | 27,137 | | | | | | 77,265 | | | | | | 50,001 | | | | |
| Treatment and refining charges | | (9,226 | ) | | | | | (9,824 | ) | | | | | (16,811 | ) | | | | | (16,437 | ) | | | |
| Inventory adjustments | | (97 | ) | | | | | (723 | ) | | | | | (558 | ) | | | | | (1,446 | ) | | | |
| Share-based compensation expenses | | (100 | ) | | | | | 52 | | | | | | (2 | ) | | | | | 71 | | | | |
| Change in product inventory | | (8,394 | ) | | | | | 4,465 | | | | | | (13,166 | ) | | | | | (6,110 | ) | | | |
| Royalties | | 1,117 | | | | | | 578 | | | | | | 1,971 | | | | | | 1,744 | | | | |
| Depreciation and amortization4 | | 47,811 | | | | | | 52,710 | | | | | | 96,173 | | | | | | 93,145 | | | | |
| Cost of sales5 | | 148,342 | | | | | | 151,966 | | | | | | 294,057 | | | | | | 270,254 | | | | |
| 1 Per pound of copper produced. |
| 2 By-product credits are computed as revenue per financial statements, including amortization of deferred revenue and pricing and volume adjustments. For more information, please see the realized price reconciliation table on page 27. |
| 3 Gold and silver by-product credits do not include variable consideration adjustments with respect to stream arrangements. |
| 4 Depreciation is based on concentrate sold. |
| 5 As per IFRS financial statements. |
| Manitoba | | Three months ended | | | Six months ended | |
| (in thousands) | | Jun. 30, 2022 | | | Jun. 30, 2021 | | | Jun. 30, 2022 | | | Jun. 30, 2021 | |
| Net pounds of copper produced1 | | 10,556 | | | 9,736 | | | 22,761 | | | 24,564 | |
| 1 Contained copper in concentrate. | |
| Manitoba | | Three months ended | | | Six months ended | |
| | | Jun. 30, 2022 | | | Jun. 30, 2021 | | | Jun. 30, 2022 | | | Jun. 30, 2021 | |
Cash cost per pound of
copper produced | | $000s | | | $/lb | | | $000s | | | $/lb | | | $000s | | | $/lb | | | $000s | | | $/lb | |
| Mining | | 54,500 | | | 5.16 | | | 54,714 | | | 5.62 | | | 113,933 | | | 5.01 | | | 109,134 | | | 4.44 | |
| Milling | | 20,953 | | | 1.98 | | | 13,655 | | | 1.40 | | | 42,462 | | | 1.87 | | | 26,317 | | | 1.07 | |
| Refining (zinc) | | 14,379 | | | 1.36 | | | 17,908 | | | 1.84 | | | 32,755 | | | 1.44 | | | 37,515 | | | 1.53 | |
| G&A | | 23,253 | | | 2.21 | | | 14,749 | | | 1.51 | | | 46,146 | | | 2.02 | | | 30,536 | | | 1.24 | |
| Onsite costs | | 113,085 | | | 10.71 | | | 101,026 | | | 10.38 | | | 235,296 | | | 10.34 | | | 203,502 | | | 8.28 | |
| Treatment & refining | | 5,807 | | | 0.55 | | | 5,419 | | | 0.56 | | | 10,305 | | | 0.45 | | | 10,741 | | | 0.44 | |
| Freight & other | | 7,779 | | | 0.74 | | | 7,746 | | | 0.80 | | | 13,909 | | | 0.61 | | | 15,234 | | | 0.62 | |
| Cash cost, before by-product credits | | 126,671 | | | 12.00 | | | 114,191 | | | 11.73 | | | 259,510 | | | 11.40 | | | 229,477 | | | 9.34 | |
| By-product credits | | (173,923 | ) | | (16.48 | ) | | (148,333 | ) | | (15.24 | ) | | (311,599 | ) | | (13.69 | ) | | (278,982 | ) | | (11.36 | ) |
| Cash cost, net of by-product credits | | (47,252 | ) | | (4.48 | ) | | (34,142 | ) | | (3.51 | ) | | (52,089 | ) | | (2.29 | ) | | (49,505 | ) | | (2.02 | ) |
| Manitoba | | Three months ended | | | Six months ended | |
| | | Jun. 30, 2022 | | | Jun. 30, 2021 | | | Jun. 30, 2022 | | | Jun. 30, 2021 | |
Supplementary cash cost
information | | $000s | | | $/lb 1 | | | $000s | | | $/lb 1 | | | $000s | | | $/lb 1 | | | $000s | | | $/lb 1 | |
| By-product credits2: | | | | | | | | | | | | | | | | | | | | | | | | |
| Zinc | | 88,548 | | | 8.39 | | | 77,707 | | | 7.98 | | | 155,677 | | | 6.84 | | | 160,021 | | | 6.51 | |
| Gold3 | | 77,126 | | | 7.31 | | | 60,045 | | | 6.17 | | | 139,588 | | | 6.13 | | | 101,023 | | | 4.11 | |
| Silver3 | | 6,269 | | | 0.59 | | | 7,977 | | | 0.82 | | | 11,917 | | | 0.52 | | | 13,775 | | | 0.56 | |
| Other | | 1,980 | | | 0.19 | | | 2,604 | | | 0.27 | | | 4,417 | | | 0.19 | | | 4,163 | | | 0.17 | |
| Total by-product credits | | 173,923 | | | 16.48 | | | 148,333 | | | 15.24 | | | 311,599 | | | 13.69 | | | 278,982 | | | 11.36 | |
| Reconciliation to IFRS: | | | | | | | | | | | | | | | | | | | | | | | | |
| Cash cost, net of by-product credits | | (47,252 | ) | | | | | (34,142 | ) | | | | | (52,089 | ) | | | | | (49,505 | ) | | | |
| By-product credits | | 173,923 | | | | | | 148,333 | | | | | | 311,599 | | | | | | 278,982 | | | | |
| Treatment and refining charges | | (5,807 | ) | | | | | (5,419 | ) | | | | | (10,305 | ) | | | | | (10,741 | ) | | | |
| Inventory adjustments | | 2,030 | | | | | | - | | | | | | 2,030 | | | | | | - | | | | |
| Share-based compensation expenses | | (532 | ) | | | | | 222 | | | | | | (182 | ) | | | | | 387 | | | | |
| Change in product inventory | | 12,888 | | | | | | 10,795 | | | | | | (3,260 | ) | | | | | (1,495 | ) | | | |
| Royalties | | 2,854 | | | | | | 3,710 | | | | | | 5,218 | | | | | | 6,449 | | | | |
| Depreciation and amortization4 | | 39,494 | | | | | | 46,595 | | | | | | 72,223 | | | | | | 88,842 | | | | |
| Cost of sales5 | | 177,598 | | | | | | 170,094 | | | | | | 325,234 | | | | | | 312,919 | | | | |
| 1 Per pound of copper produced. |
| 2 By-product credits are computed as revenue per financial statements, including amortization of deferred revenue and pricing and volume adjustments. For more information, please see the realized price reconciliation table on page 27. |
| 3 Gold and silver by-product credits do not include variable consideration adjustments with respect to stream arrangements. |
| 4 Depreciation is based on concentrate sold. |
| 5 As per IFRS financial statements. |
| Consolidated | | Three months ended | | | Six months ended | |
| | | Jun. 30, 2022 | | | Jun. 30, 2021 | | | Jun. 30, 2022 | | | Jun. 30, 2021 | |
All-in sustaining cash cost
per pound of copper
produced | | $000s | | | $/lb | | | $000s | | | $/lb | | | $000s | | | $/lb | | | $000s | | | $/lb | |
| Cash cost, net of by-product credits | | 36,711 | | | 0.65 | | | 43,429 | | | 0.84 | | | 97,096 | | | 0.87 | | | 99,781 | | | 0.94 | |
| Cash sustaining capital expenditures | | 65,173 | | | 1.15 | | | 68,803 | | | 1.33 | | | 126,136 | | | 1.14 | | | 125,257 | | | 1.18 | |
| Royalties | | 3,971 | | | 0.07 | | | 4,288 | | | 0.08 | | | 7,189 | | | 0.06 | | | 8,193 | | | 0.08 | |
| Sustaining cash cost, net of by-product credits | | 105,855 | | | 1.87 | | | 116,520 | | | 2.25 | | | 230,421 | | | 2.07 | | | 233,231 | | | 2.20 | |
| Corporate selling and administrative expenses & regional costs | | 2,479 | | | 0.04 | | | 10,995 | | | 0.22 | | | 15,539 | | | 0.15 | | | 21,759 | | | 0.21 | |
| Accretion and amortization of decommissioning and community agreements1 | | 874 | | | 0.02 | | | 705 | | | 0.01 | | | 1,595 | | | 0.01 | | | 1,284 | | | 0.01 | |
| All-in sustaining cash cost, net of by-product credits | | 109,208 | | | 1.93 | | | 128,220 | | | 2.48 | | | 247,555 | | | 2.23 | | | 256,274 | | | 2.42 | |
| Reconciliation to property, plant and equipment additions: | | | | | | | | | | | | | | | | | | | | | | | | |
| Property, plant and equipment additions | | 70,712 | | | | | | 96,090 | | | | | | 110,111 | | | | | | 178,468 | | | | |
| Capitalized stripping net additions | | 27,302 | | | | | | 22,506 | | | | | | 51,448 | | | | | | 41,131 | | | | |
| Total accrued capital additions | | 98,014 | | | | | | 118,596 | | | | | | 161,559 | | | | | | 219,599 | | | | |
Less other non-sustaining
capital costs2 | | 32,988 | | | | | | 52,655 | | | | | | 45,820 | | | | | | 119,860 | | | | |
| Total sustaining capital costs | | 65,026 | | | | | | 65,941 | | | | | | 115,739 | | | | | | 99,739 | | | | |
| Right of use leased assets | | (12,501 | ) | | | | | (9,101 | ) | | | | | (20,273 | ) | | | | | (10,422 | ) | | | |
| Capitalized lease cash payments - operating sites | | 9,313 | | | | | | 8,331 | | | | | | 18,572 | | | | | | 17,519 | | | | |
| Community agreement cash payments | | 370 | | | | | | 108 | | | | | | 4,142 | | | | | | 343 | | | | |
| Accretion and amortization of decommissioning and restoration obligations | | 2,965 | | | | | | 3,524 | | | | | | 7,956 | | | | | | 18,078 | | | | |
| Cash sustaining capital expenditures | | 65,173 | | | | | | 68,803 | | | | | | 126,136 | | | | | | 125,257 | | | | |
| 1 Includes accretion of decommissioning relating to non-productive sites, and accretion and amortization of current community agreements. | |
| 2 Other non-sustaining capital costs include Arizona capitalized costs, capitalized interest, capitalized exploration, and growth capital expenditures. | |
| Peru | | Three months ended | | | Six months ended | |
| | | Jun. 30, 2022 | | | Jun. 30, 2021 | | | Jun. 30, 2022 | | | Jun. 30, 2021 | |
| Sustaining cash cost per pound of copper produced | | $000s | | | $/lb | | | $000s | | | $/lb | | | $000s | | | $/lb | | | $000s | | | $/lb | |
| Cash cost, net of by-product credits | | 83,963 | | | 1.82 | | | 77,571 | | | 1.85 | | | 149,185 | | | 1.69 | | | 149,286 | | | 1.84 | |
| Cash sustaining capital expenditures | | 35,527 | | | 0.78 | | | 34,898 | | | 0.83 | | | 65,566 | | | 0.74 | | | 54,698 | | | 0.67 | |
| Royalties | | 1,117 | | | 0.02 | | | 578 | | | 0.01 | | | 1,971 | | | 0.02 | | | 1,744 | | | 0.02 | |
| Sustaining cash cost per pound of copper produced | | 120,607 | | | 2.62 | | | 113,047 | | | 2.69 | | | 216,722 | | | 2.45 | | | 205,728 | | | 2.53 | |
| 1 Only includes exploration costs incurred for locations near to existing mine operations. | |
| Manitoba | | Three months ended | | | Six months ended | |
| | | Jun. 30, 2022 | | | Jun. 30, 2021 | | | Jun. 30, 2022 | | | Jun. 30, 2021 | |
| Sustaining cash cost per pound of copper produced | | $000s | | | $/lb | | | $000s | | | $/lb | | | $000s | | | $/lb | | | $000s | | | $/lb | |
| Cash cost, net of by-product credits | | (47,252 | ) | | (4.48 | ) | | (34,142 | ) | | (3.51 | ) | | (52,089 | ) | | (2.29 | ) | | (49,505 | ) | | (2.02 | ) |
| Cash sustaining capital expenditures | | 29,646 | | | 2.81 | | | 33,905 | | | 3.49 | | | 60,570 | | | 2.66 | | | 70,559 | | | 2.88 | |
| Royalties | | 2,854 | | | 0.27 | | | 3,710 | | | 0.38 | | | 5,218 | | | 0.23 | | | 6,449 | | | 0.26 | |
| Sustaining cash cost per pound of copper produced | | (14,752 | ) | | (1.40 | ) | | 3,473 | | | 0.36 | | | 13,699 | | | 0.60 | | | 27,503 | | | 1.12 | |
Gold Cash Cost and Gold Sustaining Cash Cost
Cash cost per ounce of gold produced ("gold cash cost") is a non-IFRS measure that management uses as a key performance indicator to assess the performance of our Manitoba operations. This alternative cash cost calculation designates gold as the primary metal of production as it represents a substantial component of revenues for our Manitoba business unit and should therefore be less volatile over time than Manitoba cash cost per pound of copper. The calculation is presented in three manners:
- Gold cash cost, before by-product credits - This measure is gross of by-product revenues and is a function of the efforts and costs incurred to mine and process all ore mined. However, the measure divides this aggregate cost over only ounces of gold produced, the assumed primary metal of production. This measure is generally less volatile from period to period, as it is not affected by changes in the price received for by-product metals.
- Gold cash cost, net of by-product credits - In order to calculate the net cost to produce and sell gold, the net of by-product credits measure subtracts the revenues realized from the sale of the metals other than gold. The by-product revenues from copper, zinc, and silver are significant and are integral to the economics of our Manitoba operation. The economics that support our decision to produce and sell gold would be different if we did not receive revenues from the other significant metals being extracted and processed. This measure provides management and investors with an indication of the minimum gold price consistent with positive operating margins, assuming realized by-product metal prices are consistent with those prevailing during the reporting period. It also serves as an important operating statistic that management and investors utilize to measure our operating performance at our Manitoba operation versus that of our competitors. However, it is important to understand that if by-product metal prices decline alongside gold prices, the gold cash cost net of by-product credits would increase, requiring a higher gold price than that reported to maintain positive cash flows and operating margins.
- Gold sustaining cash cost, net of by-product credits - This measure is an extension of gold cash cost that includes cash sustaining capital expenditures, capitalized exploration, net smelter returns royalties, as well as accretion and amortization for expected decommissioning activities for producing assets. It does not include corporate selling and administrative expenses. It provides a more fulsome measurement of the cost of sustaining production than gold cash cost, which is focused on operating costs only.
The tables below present a detailed build-up of gold cash cost and gold sustaining cash cost, net of by-product credits, for the Manitoba business unit, and reconciliations between gold cash cost, net of by-product credits, to the most comparable IFRS measures of cost of sales for the three and six months ended June 30, 2022. The introduction of gold cash cost was made in 2022, as gold replaced zinc as the major output within Manitoba's production profile. No comparatives have been disclosed for this metric as Manitoba gold production in 2021 was not considered meaningful. Gold cash cost, net of by-product credits, may not calculate exactly based on amounts presented in the tables below due to rounding.
| Manitoba | | Three months ended | | | Six months ended | |
| (in thousands) | | Jun. 30, 2022 | | | Jun. 30, 2022 | |
| Net ounces of gold produced | | 44,787 | | | 87,954 | |
| Manitoba | | Three months ended | | Six months ended |
| | | Jun. 30, 2022 | | Jun. 30, 2022 |
| Cash cost per ounce of gold produced | | $000s | | $/oz | | $000s | | $/oz |
| Cash cost, before by-product credits1 | | 126,671 | | 2,828 | | 259,510 | | 2,950 |
| By-product credits | | (135,924) | | (3,035) | | (250,797) | | (2,851) |
| Gold cash cost, net of by-product credits | | (9,253) | | (207) | | 8,713 | | 99 |
| 1 For additional detail on cash cost, before by-product credits please see page 47 of this MD&A. |
| Manitoba | | Three months ended | | | Six months ended | |
| | | Jun. 30, 2022 | | | Jun. 30, 2022 | |
| Supplementary cash cost information | | $000s | | | $/oz 1 | | | $000s | | | $/oz1 | |
| By-product credits2: | | | | | | | | | | | | |
| Copper | | 39,127 | | | 874 | | | 78,786 | | | 896 | |
| Zinc | | 88,548 | | | 1,977 | | | 155,677 | | | 1,770 | |
| Silver3 | | 6,269 | | | 140 | | | 11,917 | | | 135 | |
| Other | | 1,980 | | | 44 | | | 4,417 | | | 50 | |
| Total by-product credits | | 135,924 | | | 3,035 | | | 250,797 | | | 2,851 | |
| Reconciliation to IFRS: | | | | | | | | | | | | |
| Cash cost, net of by-product credits | | (9,253 | ) | | | | | 8,713 | | | | |
| By-product credits | | 135,924 | | | | | | 250,797 | | | | |
| Treatment and refining charges | | (5,807 | ) | | | | | (10,305 | ) | | | |
| Share-based compensation expenses | | (532 | ) | | | | | (182 | ) | | | |
| Inventory adjustments | | 2,030 | | | | | | 2,030 | | | | |
| Change in product inventory | | 12,888 | | | | | | (3,260 | ) | | | |
| Royalties | | 2,854 | | | | | | 5,218 | | | | |
| Depreciation and amortization4 | | 39,494 | | | | | | 72,223 | | | | |
| Cost of sales5 | | 177,598 | | | | | | 325,234 | | | | |
| 1 Per ounce of gold produced. | |
| 2 By-product credits are computed as revenue per financial statements, amortization of deferred revenue and pricing and volume adjustments. For more information, please see the realized price reconciliation table on page 27. |
| 3 Silver by-product credits do not include variable consideration adjustments with respect to stream arrangements. | |
| 4 Depreciation is based on concentrate sold. | |
| 5 As per IFRS financial statements. | |
| Manitoba | | Three months ended | | | Six months ended | |
| | | Jun. 30, 2022 | | | Jun. 30, 2022 | |
| Sustaining cash cost per ounce of gold produced | | $000s | | | $/oz | | | $000s | | | $/oz | |
| Gold cash cost, net of by-product credits | | (9,253 | ) | | (207 | ) | | 8,713 | | | 99 | |
| Cash sustaining capital expenditures | | 29,646 | | | 662 | | | 60,570 | | | 689 | |
| Royalties | | 2,854 | | | 64 | | | 5,218 | | | 59 | |
| Sustaining cash cost per ounce of gold produced | | 23,247 | | | 519 | | | 74,501 | | | 847 | |
Combined Unit Cost and Zinc Plant Unit Cost Reconciliation
Combined unit cost ("unit cost") and zinc plant unit cost is a non-IFRS measure that management uses as a key performance indicator to assess the performance of our mining and milling operations. Combined unit cost and zinc plant unit cost are calculated by dividing the cost of sales by mill throughput and refined zinc metal produced, respectively. This measure is utilized by management and investors to assess our cost structure and margins and compare it to similar information provided by other companies in our industry. Unlike cash cost, this measure is not impacted by variability in by-product commodity prices since there are no by-product deductions; costs associated with profit-sharing and similar costs are excluded because of their correlation to external metal prices. In addition, the unit costs are reported in the functional currency of the operation which minimizes the impact of foreign currency fluctuations. In all, the unit cost measures provide an alternative perspective on operating cost performance with minimal impact from external market prices.
The tables below present a detailed combined unit cost and zinc plant unit costs for the Manitoba business unit and combined unit cost for the Peru business unit, and reconciliations between these measures to the most comparable IFRS measures of cost of sales for the three and six months ended June 30, 2022 and 2021.
| Peru | | Three months ended | | | Six months ended | |
| (in thousands except unit cost per tonne) | | Jun. 30,
2022 | | | Jun. 30,
2021 | | | Jun. 30,
2022 | | | Jun. 30,
2021 | |
| Combined unit cost per tonne processed |
| Mining | | 32,300 | | | 26,133 | | | 60,702 | | | 47,672 | |
| Milling | | 44,731 | | | 40,286 | | | 92,386 | | | 83,606 | |
| G&A 1 | | 18,677 | | | 16,910 | | | 34,777 | | | 31,330 | |
| Other G&A 2 | | (1,050 | ) | | 52 | | | (1,621 | ) | | 71 | |
| | | 94,658 | | | 83,381 | | | 186,244 | | | 162,679 | |
| Less: COVID-19 related costs | | 1,275 | | | 6,293 | | | 3,596 | | | 10,894 | |
| Unit cost | | 93,383 | | | 77,088 | | | 182,648 | | | 151,785 | |
| Tonnes ore milled | | 7,771 | | | 7,413 | | | 14,985 | | | 13,776 | |
| Combined unit cost per tonne | | 12.02 | | | 10.40 | | | 12.19 | | | 11.02 | |
| Reconciliation to IFRS: | | | | | | | | | | | | |
| Unit cost | | 93,383 | | | 77,088 | | | 182,648 | | | 151,785 | |
| Freight & other | | 12,297 | | | 11,555 | | | 21,774 | | | 20,242 | |
| COVID-19 related costs | | 1,275 | | | 6,293 | | | 3,596 | | | 10,894 | |
| Other G&A | | 1,050 | | | (52 | ) | | 1,621 | | | (71 | ) |
| Share-based compensation expenses | | (100 | ) | | 52 | | | (2 | ) | | 71 | |
| Inventory adjustments | | (97 | ) | | (723 | ) | | (558 | ) | | (1,446 | ) |
| Change in product inventory | | (8,394 | ) | | 4,465 | | | (13,166 | ) | | (6,110 | ) |
| Royalties | | 1,117 | | | 578 | | | 1,971 | | | 1,744 | |
| Depreciation and amortization | | 47,811 | | | 52,710 | | | 96,173 | | | 93,145 | |
| Cost of sales3 | | 148,342 | | | 151,966 | | | 294,057 | | | 270,254 | |
| 1 G&A as per cash cost reconciliation above. | |
| 2 Other G&A primarily includes profit sharing costs. | |
| 3 As per IFRS financial statements. | |
| Manitoba | | Three months ended | | | Six months ended | |
| (in thousands except tonnes ore milled and unit cost per tonne) | | Jun. 30,
2022 | | | Jun. 30,
2021 | | | Jun. 30,
2022 | | | Jun. 30,
2021 | |
| Combined unit cost per tonne processed |
| Mining | | 54,500 | | | 54,714 | | | 113,933 | | | 109,134 | |
| Milling | | 20,953 | | | 13,655 | | | 42,462 | | | 26,317 | |
| G&A 1 | | 23,253 | | | 14,749 | | | 46,146 | | | 30,536 | |
| Less: G&A allocated to zinc metal production and other areas | | (3,141 | ) | | (3,724 | ) | | (6,523 | ) | | (8,320 | ) |
| Less: Other G&A related to profit sharing costs | | (10,206 | ) | | (1,274 | ) | | (20,230 | ) | | (640 | ) |
| Unit cost | | 85,359 | | | 78,120 | | | 175,788 | | | 157,027 | |
| USD/CAD implicit exchange rate | | 1.27 | | | 1.23 | | | 1.27 | | | 1.23 | |
| Unit cost - C$ | | 108,806 | | | 95,927 | | | 223,310 | | | 193,267 | |
| Tonnes ore milled | | 649,318 | | | 646,987 | | | 1,300,651 | | | 1,291,717 | |
| Combined unit cost per tonne - C$ | | 168 | | | 148 | | | 172 | | | 150 | |
| Reconciliation to IFRS: | | | | | | | | | | | | |
| Unit cost | | 85,359 | | | 78,120 | | | 175,788 | | | 157,027 | |
| Freight & other | | 7,779 | | | 7,746 | | | 13,909 | | | 15,234 | |
| Refined (zinc) | | 14,379 | | | 17,908 | | | 32,755 | | | 37,515 | |
| G&A allocated to zinc metal production | | 3,141 | | | 3,724 | | | 6,523 | | | 8,320 | |
| Other G&A related to profit sharing | | 10,206 | | | 1,274 | | | 20,230 | | | 640 | |
| Share-based compensation expenses | | (532 | ) | | 222 | | | (182 | ) | | 387 | |
| Inventory adjustments | | 2,030 | | | - | | | 2,030 | | | - | |
| Change in product inventory | | 12,888 | | | 10,795 | | | (3,260 | ) | | (1,495 | ) |
| Royalties | | 2,854 | | | 3,710 | | | 5,218 | | | 6,449 | |
| Depreciation and amortization | | 39,494 | | | 46,595 | | | 72,223 | | | 88,842 | |
| Cost of sales2 | | 177,598 | | | 170,094 | | | 325,234 | | | 312,919 | |
| 1 G&A as per cash cost reconciliation above. | |
| 2 As per IFRS financial statements. | |
| Manitoba | | Three months ended | | | Three months ended | |
| (in thousands except zinc plant unit cost per pound) | | June 30,
2022 | | | June 30,
2021 | | | June 30,
2022 | | | June 30,
2021 | |
| Zinc plant unit cost |
| | | | | | | | | | | | | |
| Zinc plant costs | | 14,379 | | | 17,908 | | | 32,755 | | | 37,515 | |
| G&A 1 | | 23,253 | | | 14,749 | | | 46,146 | | | 30,536 | |
| Less: G&A allocated to other areas | | (9,906 | ) | | (9,751 | ) | | (19,393 | ) | | (21,577 | ) |
| Less: Other G&A related to profit sharing | | (10,206 | ) | | (1,274 | ) | | (20,230 | ) | | (640 | ) |
| Zinc plant unit cost | | 17,520 | | | 21,632 | | | 39,278 | | | 45,834 | |
| | | | | | | | | | | | | |
| USD/CAD implicit exchange rate | | 1.28 | | | 1.23 | | | 1.27 | | | 1.23 | |
| Zinc plant unit cost - C$ | | 22,475 | | | 26,585 | | | 50,036 | | | 56,249 | |
| Refined metal produced (in pounds) | | 39,311 | | | 49,425 | | | 83,542 | | | 107,863 | |
| Zinc plant unit cost per pound - C$ | | 0.57 | | | 0.54 | | | 0.60 | | | 0.52 | |
| | | | | | | | | | | | | |
| Reconciliation to IFRS: | | | | | | | | | | | | |
| Zinc plant unit cost | | 17,520 | | | 21,632 | | | 39,278 | | | 45,834 | |
| Freight & other | | 7,779 | | | 7,746 | | | 13,909 | | | 15,234 | |
| Mining | | 54,500 | | | 54,714 | | | 113,933 | | | 109,134 | |
| Milling | | 20,953 | | | 13,655 | | | 42,462 | | | 26,317 | |
| G&A allocated to other areas | | 9,906 | | | 9,751 | | | 19,393 | | | 21,577 | |
| Other G&A related to profit sharing | | 10,206 | | | 1,274 | | | 20,230 | | | 640 | |
| Share-based payment | | (532 | ) | | 222 | | | (182 | ) | | 387 | |
| Inventory adjustments | | 2,030 | | | 0 | | | 2,030 | | | - | |
| Change in product inventory | | 12,888 | | | 10,795 | | | (3,260 | ) | | (1,495 | ) |
| Royalties | | 2,854 | | | 3,710 | | | 5,218 | | | 6,449 | |
| Depreciation and amortization | | 39,494 | | | 46,595 | | | 72,223 | | | 88,842 | |
| Cost of sales2 | | 177,598 | | | 170,094 | | | 325,234 | | | 312,919 | |
| 1 G&A as per cash cost reconciliation above. | |
| 2 As per IFRS financial statements. | |
ACCOUNTING CHANGES AND CRITICAL ESTIMATES
New standards and interpretations not yet adopted
For information on new standards and interpretations not yet adopted, refer to note 4 of our June 30, 2022 consolidated interim financial statements.
Estimates and judgements
The preparation of the consolidated financial statements in accordance with IFRS requires us to make judgements, estimates and assumptions that affect the application of accounting policies, reported amounts of assets and liabilities, disclosure of contingent assets and liabilities at the date of the consolidated financial statements, and reported amounts of revenue and expenses during the reporting period. Actual results may differ from these estimates.
We review these estimates and underlying assumptions on an ongoing basis based on our experience and other factors, including expectations of future events that we believe to be reasonable under the circumstances. Revisions to accounting estimates are recognized in the period in which the estimates are revised and in any future periods affected. Certain accounting estimates and judgements have been identified as being "critical" to the presentation of our financial condition and results of operations because they require us to make subjective and/or complex judgments about matters that are inherently uncertain; or there is a reasonable likelihood that materially different amounts could be reported under different conditions or using different assumptions and estimates.
For more information on judgements and estimates, refer to note 2 of our June 30, 2022 consolidated interim financial statements.
CHANGES IN INTERNAL CONTROL OVER FINANCIAL REPORTING
Management is responsible for establishing and maintaining adequate internal control over financial reporting ("ICFR"). ICFR is designed to provide reasonable assurance regarding the reliability of financial reporting and the preparation of financial statements for external purposes in accordance with IFRS.
We did not make any changes to ICFR during the three months ended June 30, 2022 that materially affected or are reasonably likely to materially affect our ICFR.
NOTES TO READER
Forward-Looking Information
This MD&A contains forward-looking information within the meaning of applicable Canadian and United States securities legislation. All information contained in this MD&A, other than statements of current and historical fact, is forward-looking information. Often, but not always, forward-looking information can be identified by the use of words such as "plans", "expects", "budget", "guidance", "scheduled", "estimates", "forecasts", "strategy", "target", "intends", "objective", "goal", "understands", "anticipates" and "believes" (and variations of these or similar words) and statements that certain actions, events or results "may", "could", "would", "should", "might" "occur" or "be achieved" or "will be taken" (and variations of these or similar expressions). All of the forward-looking information in this MD&A is qualified by this cautionary note.
Forward-looking information includes, but is not limited to, production, cost and capital and exploration expenditure guidance, expectations regarding an increase in community investments following formalization of an agreement with the community of Uchucarcco, expectations regarding the impact of COVID-19 and inflationary pressures on the cost of operations, financial condition and prospects, expectations regarding our cash balance and liquidity for the remainder of the year, expectations regarding the Copper World Complex project, including our plans for a pre-feasibility study and potential optimization work, expectations regarding the permitting requirements for the Copper World Complex and permitting related litigation, expectations regarding the Snow Lake transition, including anticipated timelines for achieving target throughput and recoveries at the New Britannia mill, increasing the mining rate at Lalor to 5,300 tonnes per day and implementing the Stall mill recovery improvement program, expectations regarding the Flin Flon closure process and the transition of personnel and equipment to Snow Lake, expectations regarding an agreement with the community of Uchucarcco and the ability to commence exploration work on the Maria Reyna and Caballito properties, anticipated mine plans, anticipated metals prices and the anticipated sensitivity of our financial performance to metals prices, events that may affect our operations and development projects, anticipated cash flows from operations and related liquidity requirements, the anticipated effect of external factors on revenue, such as commodity prices, estimation of mineral reserves and resources, mine life projections, reclamation costs, economic outlook, government regulation of mining operations, and business and acquisition strategies. Forward-looking information is not, and cannot be, a guarantee of future results or events. Forward-looking information is based on, among other things, opinions, assumptions, estimates and analyses that, while considered reasonable by us at the date the forward-looking information is provided, inherently are subject to significant risks, uncertainties, contingencies and other factors that may cause actual results and events to be materially different from those expressed or implied by the forward-looking information.
The material factors or assumptions that we identified and were applied by us in drawing conclusions or making forecasts or projections set out in the forward-looking information include, but are not limited to:
- our ability to continue to operate safely and at full capacity despite COVID-19 related challenges;
- the availability, global supply and effectiveness of COVID-19 vaccines, the effective distribution of such vaccines in the countries in which we operate, the lessening of restrictions related to COVID-19, and the anticipated rate and timing for each of the foregoing;
- the ability to achieve production and cost guidance;
- no significant interruptions to our operations due to COVID-19 or social or political unrest in the regions Hudbay operates;
- no interruptions to our plans for advancing the Copper World Complex project;
- formalization of an exploration agreement with the community of Uchucarcco in respect of the Maria Reyna and Caballito properties
- the ability to ramp-up the New Britannia mill to target throughput and recoveries and achieve the anticipated production;
- the ability to ramp up the Lalor mine to 5,300 tonnes per day;
- the success of mining, processing, exploration and development activities;
- the scheduled maintenance and availability of our processing facilities;
- the accuracy of geological, mining and metallurgical estimates;
- anticipated metals prices and the costs of production;
- the supply and demand for metals we produce;
- the supply and availability of all forms of energy and fuels at reasonable prices;
- no significant unanticipated operational or technical difficulties;
- the execution of our business and growth strategies, including the success of our strategic investments and initiatives;
- the availability of additional financing, if needed;
- the ability to complete project targets on time and on budget and other events that may affect our ability to develop our projects;
- the timing and receipt of various regulatory and governmental approvals;
- the availability of personnel for our exploration, development and operational projects and ongoing employee relations;
- maintaining good relations with the labour unions that represent certain of our employees in Manitoba and Peru;
- maintaining good relations with the communities in which we operate, including the neighbouring Indigenous communities and local governments;
- no significant unanticipated challenges with stakeholders at our various projects;
- no significant unanticipated events or changes relating to regulatory, environmental, health and safety matters;
- no contests over title to our properties, including as a result of rights or claimed rights of Indigenous peoples or challenges to the validity of our unpatented mining claims;
- the timing and possible outcome of pending litigation and no significant unanticipated litigation;
- certain tax matters, including, but not limited to current tax laws and regulations, changes in taxation policies and the refund of certain value added taxes from the Canadian and Peruvian governments; and
- no significant and continuing adverse changes in general economic conditions or conditions in the financial markets (including commodity prices and foreign exchange rates).
The risks, uncertainties, contingencies and other factors that may cause actual results to differ materially from those expressed or implied by the forward-looking information may include, but are not limited to, risks associated with COVID-19 and its effect on our operations, financial condition, projects and prospects, uncertainty with respect to the political and social environment in Peru and its potential impact on our mining operations, risks generally associated with the mining industry and the current geopolitical environment, including future commodity prices, currency and interest rate fluctuations, energy and consumable prices, supply chain constraints and general cost escalation in the current inflationary environment, uncertainties related to the development and operation of our projects, risks related to the preliminary economic assessment of the Copper World Complex project, including in relation to permitting, litigation, project delivery and financing risks, risks related to the new Lalor mine plan, including the continuing ramp-up of the New Britannia mill and the ability to convert inferred mineral resource estimates to higher confidence categories, the potential that additional financial assurance will be required to support the updated Flin Flon closure plan, dependence on key personnel and employee and union relations, risks related to political or social instability, unrest or change, risks in respect of Indigenous and community relations, rights and title claims, operational risks and hazards, including the cost of maintaining and upgrading the Company's tailings management facilities and any unanticipated environmental, industrial and geological events and developments and the inability to insure against all risks, failure of plant, equipment, processes, transportation and other infrastructure to operate as anticipated, compliance with government and environmental regulations, including permitting requirements and anti-bribery legislation, depletion of our reserves, volatile financial markets and interest rates that may affect our ability to obtain additional financing on acceptable terms, the failure to obtain required approvals or clearances from government authorities on a timely basis, uncertainties related to the geology, continuity, grade and estimates of mineral reserves and resources, and the potential for variations in grade and recovery rates, uncertain costs of reclamation activities, our ability to comply with our pension and other post-retirement obligations, our ability to abide by the covenants in our debt instruments and other material contracts, tax refunds, hedging transactions, as well as the risks discussed under the heading "Risk Factors" in our most recent Annual Information Form.
Should one or more risk, uncertainty, contingency or other factor materialize or should any factor or assumption prove incorrect, actual results could vary materially from those expressed or implied in the forward-looking information. Accordingly, you should not place undue reliance on forward-looking information. We do not assume any obligation to update or revise any forward-looking information after the date of this MD&A or to explain any material difference between subsequent actual events and any forward-looking information, except as required by applicable law.
Note to United States Investors
This MD&A has been prepared in accordance with the requirements of the securities laws in effect in Canada, which may differ materially from the requirements of United States securities laws applicable to U.S. issuers.
Qualified Person and NI 43-101
The technical and scientific information in this MD&A related to our material mineral projects has been approved by Olivier Tavchandjian, P. Geo, our Vice President, Exploration and Technical Services. Mr. Tavchandjian is a qualified person pursuant to NI 43-101.
Mineral resources that are not mineral reserves do not have demonstrated economic viability. The Copper World Complex PEA is preliminary in nature, includes inferred resources that are considered too speculative geologically to have the economic considerations applied to them that would enable them to be categorized as mineral reserves and there is no certainty the PEA will be realized.
For a description of the key assumptions, parameters and methods used to estimate mineral reserves and resources at Hudbay's material properties, as well as data verification procedures and a general discussion of the extent to which the estimates of scientific and technical information may be affected by any known environmental, permitting, legal title, taxation, sociopolitical, marketing or other relevant factors, please see the technical reports for our material properties as filed by us on SEDAR at www.sedar.com.
SUMMARY OF RESULTS
The following unaudited tables set out a summary of quarterly and annual results for the Company.
| | | Q2 2022 | | | Q1 2022 | | | 2021 4 | | | Q4 2021 | | | Q3 20215 | | | Q2 2021 | | | Q1 2021 | | | 2020 4 | | | Q4 2020 | | | Q3 2020 | | | Q2 2020 | |
| Consolidated Financial Condition ($000s) | |
| Cash | $ | 258,556 | | $ | 213,359 | | $ | 270,989 | | $ | 270,989 | | $ | 297,451 | | $ | 294,287 | | $ | 310,564 | | $ | 439,135 | | $ | 439,135 | | $ | 449,014 | | $ | 391,136 | |
| Total long-term debt | | 1,182,143 | | | 1,181,119 | | | 1,180,274 | | | 1,180,274 | | | 1,182,612 | | | 1,181,195 | | | 1,180,798 | | | 1,135,675 | | | 1,135,675 | | | 1,175,104 | | | 988,418 | |
| Net debt1 | | 923,587 | | | 967,760 | | | 909,285 | | | 909,285 | | | 885,161 | | | 886,908 | | | 870,234 | | | 696,540 | | | 696,540 | | | 726,090 | | | 597,282 | |
| Consolidated Financial Performance ($000s except per share amounts) | | | | | | | | | | | | | | | | |
| Revenue | $ | 415,454 | | $ | 378,619 | | $ | 1,501,998 | | $ | 425,170 | | $ | 358,961 | | $ | 404,242 | | $ | 313,624 | | $ | 1,092,418 | | $ | 322,290 | | $ | 316,108 | | $ | 208,913 | |
| Cost of sales | | 325,940 | | | 293,351 | | | 1,370,979 | | | 343,426 | | | 444,379 | | | 322,060 | | | 261,112 | | | 1,053,418 | | | 287,923 | | | 276,830 | | | 221,567 | |
| Earnings (loss) before tax | | 21,504 | | | 88,861 | | | (202,751 | ) | | (149 | ) | | (147,830 | ) | | 14,819 | | | (69,592 | ) | | (179,089 | ) | | 911 | | | (23,944 | ) | | (74,604 | ) |
| Earnings (loss) | | 32,143 | | | 63,815 | | | (244,358 | ) | | (10,453 | ) | | (170,411 | ) | | (3,395 | ) | | (60,102 | ) | | (144,584 | ) | | 7,406 | | | (23,955 | ) | | (51,901 | ) |
| Basic and diluted earnings (loss) per share | $ | 0.12 | | $ | 0.24 | | $ | (0.93 | ) | $ | (0.04 | ) | $ | (0.65 | ) | $ | (0.01 | ) | $ | (0.23 | ) | $ | (0.55 | ) | $ | 0.03 | | $ | (0.09 | ) | $ | (0.20 | ) |
| Adjusted earnings (loss) per share 1 | $ | 0.12 | | $ | 0.02 | | $ | 0.09 | | $ | 0.13 | | $ | - | | $ | 0.02 | | $ | (0.06 | ) | $ | (0.46 | ) | $ | (0.06 | ) | $ | (0.10 | ) | $ | (0.15 | ) |
| Operating cash flow before change in non-cash working capital 1 | | 123,911 | | | 77,053 | | | 483,862 | | | 156,917 | | | 103,509 | | | 132,786 | | | 90,656 | | | 241,863 | | | 86,071 | | | 84,383 | | | 29,457 | |
| Adjusted EBITDA (in $ millions) 1 | | 141.4 | | | 110.2 | | | 547.1 | | | 180.3 | | | 119.3 | | | 143.2 | | | 104.2 | | | 306.7 | | | 106.9 | | | 96.1 | | | 49.1 | |
| Consolidated Operational Performance |
| Contained metal in concentrate and doré produced 2 | | | | | | | | | | | | | | | | | | | | | | |
| Copper | | 25,668 | | | 24,702 | | | 99,470 | | | 28,198 | | | 23,245 | | | 23,474 | | | 24,553 | | | 95,333 | | | 27,278 | | | 25,395 | | | 18,026 | |
| Gold | | 58,645 | | | 53,956 | | | 193,783 | | | 64,159 | | | 54,276 | | | 39,848 | | | 35,500 | | | 124,622 | | | 32,376 | | | 29,277 | | | 32,614 | |
| Silver | | 864,853 | | | 784,357 | | | 3,045,481 | | | 899,713 | | | 763,177 | | | 685,916 | | | 696,673 | | | 2,750,873 | | | 730,679 | | | 671,685 | | | 580,817 | |
| Zinc | | 17,053 | | | 22,252 | | | 93,529 | | | 23,207 | | | 20,844 | | | 21,538 | | | 27,940 | | | 118,130 | | | 25,843 | | | 30,570 | | | 31,222 | |
| Molybdenum | | 390 | | | 207 | | | 1,146 | | | 275 | | | 282 | | | 295 | | | 294 | | | 1,204 | | | 333 | | | 392 | | | 124 | |
| Payable metal in concentrate and doré sold | | | | | | | | | | | | | | | | | | | | | | | | | | | | |
| Copper | | 23,650 | | | 20,609 | | | 92,200 | | | 24,959 | | | 21,136 | | | 25,176 | | | 20,929 | | | 88,888 | | | 22,963 | | | 25,903 | | | 15,951 | |
| Gold | | 50,884 | | | 48,343 | | | 168,358 | | | 56,927 | | | 47,843 | | | 38,205 | | | 25,383 | | | 122,949 | | | 35,179 | | | 30,605 | | | 30,590 | |
| Silver | | 738,171 | | | 864,591 | | | 2,427,508 | | | 638,640 | | | 701,601 | | | 577,507 | | | 509,760 | | | 2,585,586 | | | 762,384 | | | 705,495 | | | 541,785 | |
| Zinc 3 | | 20,793 | | | 17,306 | | | 96,435 | | | 21,112 | | | 21,619 | | | 25,361 | | | 28,343 | | | 109,347 | | | 28,431 | | | 26,520 | | | 27,604 | |
| Molybdenum | | 208 | | | 213 | | | 1,098 | | | 245 | | | 304 | | | 265 | | | 284 | | | 1,321 | | | 457 | | | 313 | | | 120 | |
| Cash cost 1 | $ | 0.65 | | $ | 1.11 | | $ | 0.74 | | $ | 0.51 | | $ | 0.62 | | $ | 0.84 | | $ | 1.04 | | $ | 0.60 | | $ | 0.43 | | $ | 0.65 | | $ | 0.29 | |
| Sustaining cash cost | $ | 1.87 | | $ | 2.29 | | $ | 2.07 | | $ | 1.95 | | $ | 1.97 | | $ | 2.25 | | $ | 2.16 | | $ | 1.93 | | $ | 1.97 | | $ | 2.02 | | $ | 1.59 | |
| All-in sustaining cash cost 1 | $ | 1.93 | | $ | 2.54 | | $ | 2.30 | | $ | 2.20 | | $ | 2.18 | | $ | 2.48 | | $ | 2.37 | | $ | 2.16 | | $ | 2.24 | | $ | 2.25 | | $ | 1.91 | |
1Net debt, adjusted earnings (loss) per share, adjusted EBITDA, cash cost, sustaining cash cost and all-in sustaining cash cost per pound of copper produced, net of by-product credits, are non-IFRS financial performance measures with no standardized definition under IFRS. For further information and a detailed reconciliation, please see discussion under the "Non-IFRS Financial Reporting Measures" section of this MD&A.
2 Metal reported in concentrate is prior to deductions associated with smelter contract terms.
3 Includes refined zinc metal sold.
4 Annual consolidated results may not calculate based on amounts presented in this table due to rounding.
5 The Q3 2021 adjusted net earnings (loss) and adjusted net earnings (loss) per share have been adjusted for changes made in the computation of tax impacts on certain adjusting items. The adjusted net earnings per share changed from $ 0.15/share to adjusted net earnings of $0.00/share. See the "Trend Analysis and Quarterly Review" section of this MD&A for further details.
| | | | Q2 2022 | | | Q1 2022 | | | 2021 5 | | | Q4 2021 | | | Q3 2021 | | | Q2 2021 | | | Q1 2021 | | | 2020 5 | | | Q4 2020 | | | Q3 2020 | | | Q2 2020 | |
| Peru Operations | | | | | | | | | | | | | | | | | | | | | | | | | | | | | | | | | | |
| Constancia ore mined1 | tonnes | | 7,017,114 | | | 6,908,151 | | | 29,714,327 | | | 7,742,469 | | | 6,208,019 | | | 8,016,373 | | | 7,747,466 | | | 27,529,950 | | | 9,313,784 | | | 8,455,668 | | | 2,775,286 | |
| Copper | % | | 0.33 | | | 0.32 | | | 0.31 | | | 0.33 | | | 0.30 | | | 0.30 | | | 0.30 | | | 0.32 | | | 0.31 | | | 0.31 | | | 0.34 | |
| Gold | g/tonne | | 0.04 | | | 0.04 | | | 0.04 | | | 0.04 | | | 0.04 | | | 0.04 | | | 0.04 | | | 0.03 | | | 0.03 | | | 0.03 | | | 0.04 | |
| Silver | g/tonne | | 3.53 | | | 3.22 | | | 2.88 | | | 2.81 | | | 2.76 | | | 3.02 | | | 2.90 | | | 2.75 | | | 2.61 | | | 2.55 | | | 2.90 | |
| Molybdenum | % | | 0.01 | | | 0.01 | | | 0.01 | | | 0.01 | | | 0.01 | | | 0.01 | | | 0.01 | | | 0.02 | | | 0.01 | | | 0.02 | | | 0.02 | |
| Pampacancha ore mined1 | tonnes | | 1,211,387 | | | 847,306 | | | 5,141,001 | | | 2,107,196 | | | 2,050,813 | | | 982,992 | | | - | | | - | | | - | | | - | | | - | |
| Copper | % | | 0.29 | | | 0.27 | | | 0.27 | | | 0.27 | | | 0.27 | | | 0.26 | | | - | | | - | | | - | | | - | | | - | |
| Gold | g/tonne | | 0.28 | | | 0.43 | | | 0.30 | | | 0.34 | | | 0.27 | | | 0.27 | | | - | | | - | | | - | | | - | | | - | |
| Silver | g/tonne | | 4.25 | | | 4.06 | | | 4.02 | | | 4.26 | | | 3.58 | | | 4.43 | | | - | | | - | | | - | | | - | | | - | |
| Molybdenum | % | | 0.01 | | | 0.01 | | | 0.01 | | | 0.01 | | | 0.01 | | | 0.01 | | | - | | | - | | | - | | | - | | | - | |
| Ore milled | tonnes | | 7,770,706 | | | 7,213,833 | | | 28,809,755 | | | 8,048,925 | | | 6,985,035 | | | 7,413,043 | | | 6,362,752 | | | 26,297,318 | | | 7,741,714 | | | 7,480,655 | | | 4,355,482 | |
| Copper | % | | 0.32 | | | 0.31 | | | 0.32 | | | 0.33 | | | 0.30 | | | 0.31 | | | 0.33 | | | 0.34 | | | 0.33 | | | 0.33 | | | 0.34 | |
| Gold | g/tonne | | 0.09 | | | 0.08 | | | 0.08 | | | 0.11 | | | 0.11 | | | 0.07 | | | 0.04 | | | 0.03 | | | 0.03 | | | 0.03 | | | 0.04 | |
| Silver | g/tonne | | 3.64 | | | 3.26 | | | 3.35 | | | 3.67 | | | 3.93 | | | 2.88 | | | 2.84 | | | 2.87 | | | 2.74 | | | 2.68 | | | 3.04 | |
| Molybdenum | % | | 0.01 | | | 0.01 | | | 0.01 | | | 0.01 | | | 0.01 | | | 0.01 | | | 0.01 | | | 0.02 | | | 0.02 | | | 0.02 | | | 0.01 | |
| Copper recovery | % | | 85.0 | | | 85.3 | | | 84.6 | | | 86.0 | | | 84.9 | | | 83.3 | | | 84.1 | | | 83.0 | | | 85.3 | | | 83.3 | | | 76.6 | |
| Gold recovery | % | | 60.3 | | | 59.8 | | | 64.6 | | | 63.6 | | | 71.9 | | | 62.2 | | | 52.0 | | | 49.8 | | | 52.7 | | | 51.6 | | | 43.4 | |
| Silver recovery | % | | 64.2 | | | 66.9 | | | 63.7 | | | 60.8 | | | 59.1 | | | 68.2 | | | 69.9 | | | 66.9 | | | 70.1 | | | 66.7 | | | 59.6 | |
| Molybdenum recovery | % | | 38.8 | | | 21.1 | | | 31.5 | | | 26.7 | | | 33.5 | | | 33.3 | | | 33.4 | | | 29.4 | | | 28.4 | | | 30.4 | | | 19.9 | |
| Contained metal in concentrate | | | | | | | | | | | | | | | | | | | | | | | | | | | | | | | | | | |
| Copper | tonnes | | 20,880 | | | 19,166 | | | 77,813 | | | 22,856 | | | 18,072 | | | 19,058 | | | 17,827 | | | 73,150 | | | 21,554 | | | 20,803 | | | 11,504 | |
| Gold | ounces | | 13,858 | | | 10,789 | | | 50,306 | | | 17,917 | | | 17,531 | | | 10,220 | | | 4,638 | | | 12,395 | | | 3,689 | | | 3,333 | | | 2,311 | |
| Silver | ounces | | 584,228 | | | 505,568 | | | 1,972,949 | | | 578,140 | | | 521,036 | | | 468,057 | | | 405,714 | | | 1,622,972 | | | 477,775 | | | 430,208 | | | 253,687 | |
| Molybdenum | tonnes | | 390 | | | 207 | | | 1,146 | | | 275 | | | 282 | | | 295 | | | 294 | | | 1,204 | | | 333 | | | 392 | | | 124 | |
| Payable metal sold | | | | | | | | | | | | | | | | | | | | | | | | | | | | | | | | | | |
| Copper | tonnes | | 18,473 | | | 16,825 | | | 71,398 | | | 20,551 | | | 16,065 | | | 19,946 | | | 14,836 | | | 68,506 | | | 18,583 | | | 21,654 | | | 9,023 | |
| Gold | ounces | | 8,430 | | | 14,452 | | | 41,807 | | | 16,304 | | | 16,902 | | | 5,638 | | | 2,963 | | | 10,986 | | | 3,297 | | | 3,753 | | | 1,317 | |
| Silver | ounces | | 484,946 | | | 636,133 | | | 1,490,651 | | | 380,712 | | | 457,263 | | | 315,064 | | | 337,612 | | | 1,518,548 | | | 480,843 | | | 433,595 | | | 242,519 | |
| Molybdenum | tonnes | | 208 | | | 213 | | | 1,098 | | | 245 | | | 304 | | | 265 | | | 284 | | | 1,321 | | | 457 | | | 313 | | | 120 | |
| Peru combined unit operating cost 2,3,4 | $/tonne | $ | 12.02 | | $ | 12.37 | | $ | 10.70 | | $ | 9.96 | | $ | 10.93 | | $ | 10.40 | | $ | 11.74 | | $ | 9.46 | | $ | 10.17 | | $ | 9.85 | | $ | 7.77 | |
| Peru cash cost3 | $/lb | $ | 1.82 | | $ | 1.54 | | $ | 1.54 | | $ | 1.28 | | $ | 1.26 | | $ | 1.85 | | $ | 1.82 | | $ | 1.45 | | $ | 1.47 | | $ | 1.54 | | $ | 1.31 | |
| Peru sustaining cash cost3 | $/lb | $ | 2.62 | | $ | 2.27 | | $ | 2.46 | | $ | 2.46 | | $ | 2.31 | | $ | 2.69 | | $ | 2.36 | | $ | 2.20 | | $ | 2.58 | | $ | 2.29 | | $ | 1.84 | |
| 1 Reported tonnes and grade for ore mined are estimates based on mine plan assumptions and may not fully reconcile to ore milled. | |
| 2 Reflects combined mine, mill and general and administrative ("G&A") costs per tonne of ore milled. Reflects the deduction of expected capitalized stripping costs. | |
| 3 Combined unit costs, cash cost, and sustaining cash cost per pound of copper produced, net of by-product credits, are non-IFRS financial performance measures with no standardized definition under IFRS. For further information and a detailed reconciliation, please see the discussion under the "Non-IFRS Financial Reporting Measures" section of this MD&A | |
| 4 2022 and 2021 combined unit costs exclude COVID-19 related costs. | |
| 5 Annual consolidated results may not calculate based on amounts presented in this table due to rounding. | |
| | | Q2 2022 | Q1 2022 | 2021 1 | Q4 2021 | Q3 2021 | Q2 2021 | Q1 2021 | 2020 1 | Q4 2020 | Q3 2020 | Q2 2020 |
| Manitoba Operations | | | | | | | | | | | | |
| Lalor ore mined | tonnes | 412,653 | 386,752 | 1,593,141 | 422,208 | 392,380 | 356,951 | 421,602 | 1,654,240 | 468,101 | 357,213 | 407,408 |
| Copper | % | 0.70 | 0.80 | 0.71 | 0.78 | 0.86 | 0.64 | 0.57 | 0.74 | 0.80 | 0.66 | 0.77 |
| Zinc | % | 3.06 | 4.06 | 4.23 | 4.19 | 3.60 | 3.81 | 5.20 | 5.73 | 5.54 | 5.98 | 6.05 |
| Gold | g/tonne | 3.73 | 3.76 | 3.41 | 3.92 | 3.85 | 3.19 | 2.67 | 2.51 | 2.79 | 2.28 | 2.64 |
| Silver | g/tonne | 23.95 | 22.94 | 24.66 | 30.35 | 22.13 | 22.98 | 22.75 | 25.31 | 24.96 | 21.23 | 28.4 |
| 777 ore mined | tonnes | 226,286 | 258,069 | 1,053,710 | 266,744 | 256,536 | 255,170 | 275,260 | 991,576 | 164,856 | 264,905 | 281,890 |
| Copper | % | 1.03 | 1.19 | 1.28 | 1.13 | 1.06 | 0.82 | 2.06 | 1.40 | 1.89 | 0.98 | 1.72 |
| Zinc | % | 3.51 | 4.12 | 3.91 | 4.16 | 3.88 | 3.57 | 4.00 | 3.88 | 2.98 | 3.95 | 4.13 |
| Gold | g/tonne | 1.62 | 1.69 | 2.03 | 1.80 | 1.96 | 1.97 | 2.39 | 1.90 | 1.85 | 2.01 | 1.91 |
| Silver | g/tonne | 20.63 | 21.05 | 25.25 | 25.02 | 22.99 | 23.35 | 29.32 | 24.13 | 21.64 | 24.25 | 25.73 |
| Stall & New Britannia Concentrator Combined: | | | | | | | | | |
| Ore milled | tonnes | 406,006 | 397,301 | 1,506,756 | 419,727 | 408,201 | 317,484 | 361,344 | 1,412,751 | 372,624 | 335,739 | 334,601 |
| Copper | % | 0.73 | 0.82 | 0.72 | 0.75 | 0.82 | 0.68 | 0.60 | 0.73 | 0.79 | 0.68 | 0.76 |
| Zinc | % | 3.20 | 4.24 | 4.30 | 4.12 | 3.58 | 4.06 | 5.53 | 5.76 | 5.47 | 6.11 | 6.16 |
| Gold | g/tonne | 3.93 | 3.87 | 3.42 | 3.90 | 3.84 | 3.19 | 2.57 | 2.55 | 2.88 | 2.35 | 2.70 |
| Silver | g/tonne | 23.98 | 23.16 | 24.95 | 30.07 | 23.32 | 22.02 | 23.40 | 25.37 | 24.43 | 22.08 | 28.72 |
| Copper recovery | % | 89.5 | 87.5 | 86.8 | 88.7 | 84.3 | 88.8 | 85.7 | 86.2 | 87.1 | 84.0 | 86.6 |
| Zinc recovery | % | 75.5 | 85.7 | 88.9 | 87.4 | 88.2 | 88.1 | 91.1 | 91.9 | 90.9 | 92.7 | 92.4 |
| Gold recovery | % | 58.8 | 58.4 | 54.9 | 54.6 | 53.4 | 55.5 | 57.5 | 60.0 | 59.5 | 57.4 | 62.3 |
| Silver recovery | % | 58.1 | 60.0 | 54.4 | 53.9 | 52.7 | 55.1 | 56.2 | 60.4 | 60.3 | 57.5 | 62.1 |
| Flin Flon Concentrator: | | | | | | | | | | | |
| Ore milled | tonnes | 243,312 | 254,032 | 1,133,516 | 262,565 | 258,062 | 329,503 | 283,386 | 1,205,314 | 225,663 | 322,156 | 324,906 |
| Copper | % | 1.02 | 1.20 | 1.23 | 1.12 | 1.06 | 0.89 | 1.88 | 1.28 | 1.59 | 0.99 | 1.52 |
| Zinc | % | 3.60 | 4.13 | 3.95 | 4.16 | 3.86 | 3.65 | 4.20 | 4.21 | 3.87 | 4.07 | 4.41 |
| Gold | g/tonne | 1.64 | 1.70 | 2.04 | 1.78 | 1.96 | 2.06 | 2.34 | 1.96 | 1.99 | 1.99 | 1.99 |
| Silver | g/tonne | 20.76 | 21.23 | 24.90 | 25.04 | 22.93 | 23.65 | 28.01 | 24.26 | 22.65 | 24.01 | 25.56 |
| Copper recovery | % | 85.5 | 87.6 | 87.7 | 86.7 | 85.2 | 84.8 | 91.3 | 86.0 | 88.1 | 83.9 | 87.3 |
| Zinc recovery | % | 82.9 | 83.2 | 83.0 | 83.1 | 82.2 | 84.8 | 81.8 | 85.5 | 83.9 | 87.9 | 84.9 |
| Gold recovery | % | 56.4 | 57.7 | 58.5 | 59.2 | 58.1 | 52.9 | 64.0 | 56.0 | 56.6 | 55.3 | 58.6 |
| Silver recovery | % | 51.0 | 52.5 | 45.1 | 45.6 | 42.4 | 37.5 | 54.1 | 45.9 | 46.5 | 42.0 | 50.7 |
| 1 Annual consolidated results may not calculate based on amounts presented in this table due to rounding. |
| | | Q2 2022 | Q1 2022 | 2021 4 | Q4 2021 | Q3 2021 | Q2 2021 | Q1 2021 | 2020 4 | Q4 2020 | Q3 2020 | Q2 2020 |
| Manitoba Operations (continued) | |
| Total Manitoba contained metal in concentrate produced | | | | | | | | | | | | | | | | | | | | | | |
| Copper | tonnes | | 4,788 | | | 5,536 | | | 21,657 | | | 5,342 | | | 5,173 | | | 4,416 | | | 6,726 | | | 22,183 | | | 5,724 | | | 4,592 | | | 6,522 | |
| Zinc | tonnes | | 17,053 | | | 22,252 | | | 93,529 | | | 23,207 | | | 20,844 | | | 21,538 | | | 27,940 | | | 118,130 | | | 25,843 | | | 30,570 | | | 31,222 | |
| Gold | ounces | | 37,346 | | | 36,887 | | | 134,475 | | | 37,644 | | | 36,341 | | | 29,628 | | | 30,862 | | | 112,227 | | | 28,687 | | | 25,944 | | | 30,303 | |
| Silver | ounces | | 264,651 | | | 268,743 | | | 1,066,003 | | | 315,054 | | | 242,131 | | | 217,859 | | | 290,959 | | | 1,127,901 | | | 252,904 | | | 241,477 | | | 327,130 | |
| Precious metal in doré produced | | | | | | | | | | | | | | | | | | | | | | | | | | | | | | | |
| Gold | ounces | | 7,441 | | | 6,280 | | | 9,002 | | | 8,598 | | | 404 | | | - | | | - | | | - | | | - | | | - | | | - | |
| Silver | ounces | | 15,974 | | | 10,046 | | | 6,529 | | | 6,519 | | | 10 | | | - | | | - | | | - | | | - | | | - | | | - | |
| Total Manitoba payable metal sold and doré | | | | | | | | | | | | | | | | | | | | | | | | | | | | | | | |
| Copper | tonnes | | 5,177 | | | 3,784 | | | 20,802 | | | 4,408 | | | 5,071 | | | 5,230 | | | 6,093 | | | 20,382 | | | 4,380 | | | 4,249 | | | 6,928 | |
| Zinc1 | tonnes | | 20,793 | | | 17,306 | | | 96,435 | | | 21,112 | | | 21,619 | | | 25,361 | | | 28,343 | | | 109,347 | | | 28,431 | | | 26,520 | | | 27,604 | |
| Gold | ounces | | 42,454 | | | 33,891 | | | 126,551 | | | 40,623 | | | 30,941 | | | 32,567 | | | 22,420 | | | 111,963 | | | 31,882 | | | 26,852 | | | 29,273 | |
| Silver | ounces | | 253,225 | | | 228,458 | | | 936,857 | | | 257,928 | | | 244,338 | | | 262,443 | | | 172,148 | | | 1,067,038 | | | 281,541 | | | 271,900 | | | 299,266 | |
| Manitoba combined unit operating cost2,3 | C$/tonne | | $168 | | | 176 | | | $154 | | | $168 | | | $147 | | | $148 | | | $151 | | | $132 | | | $140 | | | $126 | | | $135 | |
| Manitoba copper cash cost3 | $/lb | $ | (4.48 | ) | | (0.40 | ) | $ | (2.11 | ) | $ | (2.77 | ) | $ | (1.64 | ) | $ | (3.51 | ) | $ | (1.04 | ) | $ | (2.20 | ) | $ | (3.48 | ) | $ | (3.41 | ) | $ | (1.51 | ) |
| Manitoba sustaining copper cash cost3 | $/lb | $ | (1.40 | ) | | 2.33 | | $ | 0.69 | | $ | (0.23 | ) | $ | 0.75 | | $ | 0.36 | | $ | 1.62 | | $ | 1.02 | | $ | (0.36 | ) | $ | 0.83 | | $ | 1.16 | |
| Manitoba gold cash cost 3, 5 | $/oz | $ | (207 | ) | | 416 | | $ | - | | $ | - | | $ | - | | $ | - | | $ | - | | $ | - | | $ | - | | $ | - | | $ | - | |
| Manitoba sustaining gold cash cost 3,5 | $/oz | $ | 519 | | | 1,187 | | $ | - | | $ | - | | $ | - | | $ | - | | $ | - | | $ | - | | $ | - | | $ | - | | $ | - | |
| 1 Includes refined zinc metal sold. | |
| 2 Reflects combined mine, mill and G&A costs per tonne of milled ore. | |
| 3 Combined unit costs, cash cost, and sustaining cash cost per pound of copper produced, cash cost, and sustaining cash cost per ounce of gold produced, net of by-product credits, are non-IFRS financial performance measures with no standardized definition under IFRS. For further information and a detailed reconciliation, please see the discussion under the "Non-IFRS Financial Reporting Measures" section of this MD&A. | |
| 4 Annual consolidated results may not calculate based on amounts presented in this table due to rounding. | |
| 5 Cash cost and sustaining cash cost per ounce of gold produced, net of by-product credits were introduced in 2022 and do not have a published comparative. | |