
Management's Discussion and Analysis of
Results of Operations and Financial Condition
For the three and nine months ended
September 30, 2022
November 2, 2022
INTRODUCTION
This Management's Discussion and Analysis ("MD&A") dated November 2, 2022 is intended to supplement Hudbay Minerals Inc.'s unaudited condensed consolidated interim financial statements and related notes for the three and nine months ended September 30, 2022 and 2021(the "consolidated interim financial statements"). The consolidated interim financial statements have been prepared in accordance with International Financial Reporting Standards ("IFRS"), including International Accounting Standard 34, Interim Financial Reporting, as issued by the International Accounting Standards Board ("IASB").
References to "Hudbay", the "Company", "we", "us", "our" or similar terms refer to Hudbay Minerals Inc. and its direct and indirect subsidiaries as at September 30, 2022.
Readers should be aware that:
- This MD&A contains certain "forward-looking statements" and "forward-looking information" (collectively, "forward-looking information") that are subject to risk factors set out in a cautionary note contained in this MD&A.
- This MD&A has been prepared in accordance with the requirements of the securities laws in effect in Canada, which may differ materially from the requirements of United States securities laws applicable to US issuers.
- We use a number of non-IFRS financial performance measures in this MD&A. Please see the discussion under the "Non-IFRS Financial Performance Measures" section herein.
- The technical and scientific information in this MD&A has been approved by qualified persons based on a variety of assumptions and estimates.
For a discussion of each of the above matters, readers are urged to review the "Notes to Reader" discussion beginning on page 58 of this MD&A.
Additional information regarding Hudbay, including the risks related to our business and those that are reasonably likely to affect our consolidated financial statements in the future, is contained in our continuous disclosure materials, including our most recent Annual Information Form ("AIF"), consolidated interim financial statements and Management Information Circular available on SEDAR at www.sedar.com and on EDGAR at www.sec.gov.
All amounts are in US dollars unless otherwise noted.
OUR BUSINESS
We are a diversified mining company with long-life assets in North and South America. Our operations in Cusco (Peru) produce copper with gold, silver and molybdenum by-products. Our operations in Manitoba (Canada) produce gold with copper, zinc and silver by-products. We have an organic pipeline that includes copper development projects in Arizona and Nevada (United States), and our growth strategy is focused on the exploration, development, operation, and optimization of properties we already control, as well as other mineral assets we may acquire that fit our strategic criteria. We are governed by the Canada Business Corporations Act and our shares are listed under the symbol "HBM" on the Toronto Stock Exchange, New York Stock Exchange and Bolsa de Valores de Lima.
SUMMARY
Third Quarter Operating and Financial Results; Production Guidance Reaffirmed
- Full year 2022 consolidated production, cash cost and sustaining cash cost guidance is reaffirmed.
- Third quarter net loss and loss per share were $8.1 million and $0.03, respectively. After adjusting for a non-cash gain of $6.4 million related to a quarterly revaluation of the Flin Flon environmental provision due to changes in real, long-term risk-free discount rates, and a $6.0 million gain on disposal of plant and equipment and non-current assets, among other items, third quarter adjusted net loss1 per share was $0.05.
- Operating cash flow before change in non-cash working capital was $81.6 million and adjusted EBITDA1 was $99.3 million in the third quarter of 2022, benefiting from higher copper and gold sales volumes, compared to the same period in 2021.
- Consolidated production in the third quarter included 24,498 tonnes of copper and 53,179 ounces of gold.
- Consolidated cash cost per pound of copper produced, net of by-product credits1, was $0.58 in the third quarter, an 11% improvement from the second quarter of 2022. Consolidated sustaining cash cost per pound of copper produced, net of by-product credits1, was $1.91 in the third quarter, a 2% increase from the second quarter of 2022, but within the guidance range.
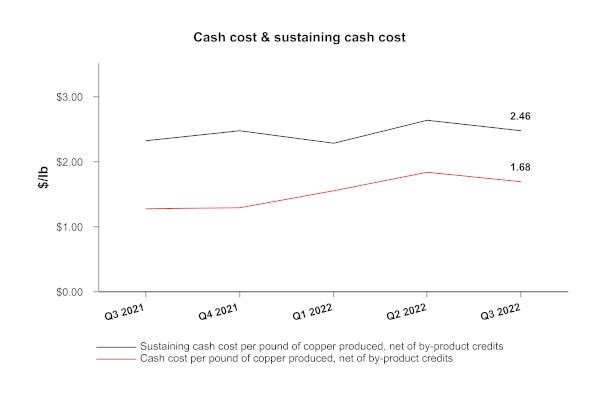
- Peru delivered strong operating performance in the third quarter with 7% higher copper production of 22,302 tonnes and 8% lower cash cost per pound of copper produced, net of by-product credits1, of $1.68 as copper grades improved over the second quarter of 2022.
- Despite being focused on transition activities and overcoming one-off production interruptions, Manitoba achieved third quarter gold production of 40,457 ounces at a cash cost per ounce of gold produced, net of by-product credits1, of $216 as New Britannia continued to deliver strong throughput and gold recoveries.
- Closure activities to safely decommission the 777 mine ("777"), the Flin Flon concentrator and the zinc plant were substantially completed in the third quarter, ahead of schedule. A majority of Flin Flon employees and equipment of value have transitioned to Snow Lake to support Lalor's ramp-up strategy of 5,300 tonnes per day in early 2023.
- Cash increased by $27.6 million during the third quarter to $286.1 million, as at September 30, 2022, mainly as a result of $172.5 million of cash generated from operations, partially offset by $119.0 million of capital investments and a $17.1 million payment toward the gold prepayment liability.
Executing on Growth Initiatives
- The company is realizing benefits from recent brownfield growth investments including the successful ramp-up of the high grade Pampacancha satellite deposit and the achievement of higher throughput and gold recoveries at the New Britannia mill as evidenced by the successive quarterly increases in copper production in Peru and higher gold production in Snow Lake.
- Pre-feasibility study for Phase I of the Copper World Complex ("Copper World") is well-advanced with the process plant pre-feasibility level engineering at 85% completion and geotechnical and hydrogeological site investigation activities completed. The focus remains on converting remaining inferred mineral resources to measured and indicated and evaluating many of the project optimization and upside opportunities.
- Submitted remaining state permit applications for Phase I of Copper World in September and October 2022.
- Executed an exploration agreement on the Maria Reyna and Caballito satellite properties in Peru in August 2022 and early exploration activities on the prospective properties are underway.
- Announced an initial mineral resource estimate for the Llaguen copper-molybdenum porphyry deposit in northern Peru, including 271 million tonnes of indicated resources at 0.42% copper-equivalent2 and 83 million tonnes of inferred resources at 0.30% copper-equivalent2.
- Assays from the confirmatory drill program at the Flin Flon tailings facility indicate higher grades than predicted from historical mill records.
Focus on Deleveraging and Disciplined Capital Allocation
- Reduced net debt1 to $897.1 million, a reduction of $70.7 million since the completion of the brownfield investment program in the first quarter ended March 31, 2022.
- Repaid 38% of the gold prepayment liability to date in 2022 with the balance to be repaid by the end of 2023.
- Reduced 2022 discretionary spending by $30 million, reflecting lower expenditures in Arizona, Manitoba and Peru, and the company is targeting 2023 discretionary spending reductions of more than $50 million.
- Divested non-core assets with the sale of our Lordsburg property during the third quarter of 2022 and the sale of our equity interest in Fireweed Metals Corp. in November 2022.
- Prioritized Copper World activities to focus on completion of the pre-feasibility study, receipt of state level permits and conducting a bulk sample program to de-risk the project in 2023, while deferring the definitive feasibility study to 2024.
- Announced disciplined capital allocation approach with the introduction of three prerequisites for sanctioning Copper World, including a prudent financing strategy with multi-faceted financial targets focused on a minimum cash balance, a stated maximum leverage, limited non-recourse project level debt and committed financial partners.
Summary of Third Quarter Results
Cash generated from operating activities in the third quarter of 2022 increased to $172.5 million compared to $139.8 million in the same quarter of 2021. The increase is primarily the result of an increase in our non-cash working capital. Operating cash flow before change in non-cash working capital was $81.6 million during the third quarter of 2022, reflecting a decrease of $21.9 million compared to the same period of 2021. The decrease in operating cash flow before changes in non-cash working capital was primarily the result of lower zinc sales volumes, lower realized copper prices and inflationary cost pressures on mine operating costs, offset by higher copper and gold sales volumes.
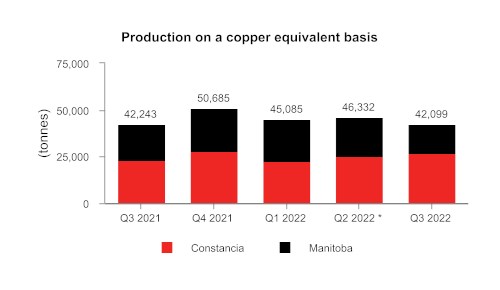
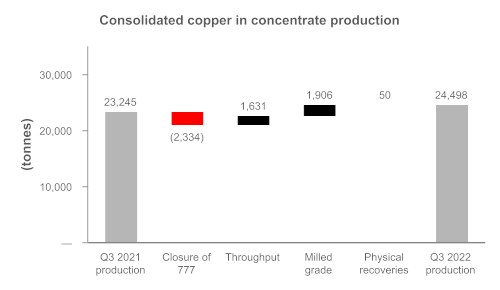
Consolidated copper production in the third quarter of 2022 increased by 5% compared to the same period in 2021 primarily due to increased throughput and higher copper grades in Peru, partially offset by lower production in Manitoba due to the planned closure of 777. Consolidated gold production in the third quarter of 2022 decreased by 2% compared to the third quarter of 2021, due to lower throughput in Manitoba, lower gold grades at Pampacancha and lower recoveries in Peru, partially offset by higher Lalor gold grades and higher recoveries at New Britannia. Consolidated zinc production in the quarter decreased by 53%, versus the comparative quarter in 2021, primarily due to lower milled throughput as a result of the closure of 777 and one-off production interruptions in Snow Lake during the quarter. Hudbay anticipates stronger production in fourth quarter and has reaffirmed its 2022 production guidance for all metals.
Net loss and loss per share in the third quarter of 2022 were $8.1 million and $0.03, respectively, compared to a net loss and loss per share of $170.4 million and $0.65, respectively, in the third quarter of 2021. The prior period loss was mainly caused by an updated Flin Flon closure plan and a corresponding impairment charge of $147.3 million. During the third quarter of 2022, we recorded a non-cash gain of $6.4 million related to the quarterly revaluation of our Flin Flon environmental provision in response to changes in real, long-term discount rates, a $6.7 million revaluation gain of the gold prepayment liability and a $6.0 million gain on the disposal of plant and equipment and non-current assets. These costs were offset by a $5.1 million charge related to the restructuring of the Manitoba operations due to the closure of the Flin Flon operations.
Adjusted net loss1 and adjusted net loss per share1 in the third quarter of 2022 were $12.4 million and $0.05 per share, respectively, after adjusting for the non-cash gain related to the revaluation of our environmental provision and the revaluation gain on the gold prepayment liability, among other items. This compares to adjusted net earnings and adjusted net earnings per share of $0.9 million, and $0.00 in the same period of 2021. Third quarter adjusted EBITDA1 was $99.3 million, compared to $119.2 million in the same period of 2021.
In the third quarter of 2022, consolidated cash cost per pound of copper produced, net of by-product credits1, was $0.58, compared to $0.62 in the same period in 2021. This decrease was a result of higher precious metal by-product credits and higher copper production, partially offset by higher milling costs, treatment and refining charges and freight costs. Consolidated sustaining cash cost per pound of copper produced, net of by-product credits1, was $1.91 in the third quarter of 2022 compared to $1.97 in the same period in 2021. This decrease was primarily due to the same reasons outlined above, slightly offset by higher cash sustaining capital expenditures in Manitoba. Both measures are tracking well with respect to our 2022 guidance ranges and we are reaffirming our full year consolidated cash cost guidance.
Consolidated all-in sustaining cash cost per pound of copper produced, net of by-product credits1, was $2.16 in the third quarter of 2022, lower than $2.18 in the same period in 2021, due to the same reasons outlined above partially offset with higher corporate selling and administrative expenses and accretion and amortization of decommissioning and community agreements.
As at September 30, 2022, our liquidity includes $286.1 million in cash as well as undrawn availability of $368.7 million under our revolving credit facilities. We expect that our current liquidity combined with cash flow from operations, will be sufficient to meet our liquidity needs for the foreseeable future.
* Mining activities at 777 were completed in June 2022
1 Adjusted net earnings (loss) and adjusted net earnings (loss) per share, adjusted EBITDA, cash cost, sustaining cash cost, all-in sustaining cash cost per pound of copper produced, net of by-product credits, cash cost, sustaining cash cost per ounce of gold produced, net of by-product credits, combined unit cost and net debt are non-IFRS financial performance measures with no standardized definition under IFRS. For further information and a detailed reconciliation, please see the discussion under the "Non-IFRS Financial Performance Measures" section of this MD&A.
2 For further information on the mineral resource estimate and assumptions underlying the copper-equivalent grades, please refer to the table on page 10 of this MD&A.
KEY FINANCIAL RESULTS
| Financial Condition | Sep. 30, 2022 | Dec. 31, 2021 | ||||
| (in $ thousands) | ||||||
| Cash | $ | 286,117 | $ | 270,989 | ||
| Total long-term debt | 1,183,237 | 1,180,274 | ||||
| Net debt1 | 897,120 | 909,285 | ||||
| Working capital2 | 99,807 | 147,512 | ||||
| Total assets | 4,287,794 | 4,616,231 | ||||
| Equity | 1,570,889 | 1,476,828 | ||||
| 1 Net debt is a non-IFRS financial performance measure with no standardized definition under IFRS. For further information and a detailed reconciliation, please see discussion under the "Non-IFRS Financial Performance Measures" section of this MD&A. | ||||||
| 2 Working capital is determined as total current assets less total current liabilities as defined under IFRS and disclosed on the consolidated financial statements. | ||||||
| Financial Performance | Three months ended | Nine months ended | ||||||||||
| (in $ thousands, except per share amounts or as noted below) | Sep. 30, 2022 | Sep. 30, 2021 | Sep. 30, 2022 | Sep. 30, 2021 | ||||||||
| Revenue | $ | 346,171 | $ | 358,961 | $ | 1,140,244 | $ | 1,076,828 | ||||
| Cost of sales | 313,741 | 444,379 | 933,032 | 1,027,553 | ||||||||
| (Loss) earnings before tax | (263 | ) | (147,830 | ) | 110,102 | (202,602 | ) | |||||
| Net (loss) earnings | (8,135 | ) | (170,411 | ) | 87,823 | (233,905 | ) | |||||
| Basic and diluted (loss) earnings per share | (0.03 | ) | (0.65 | ) | 0.34 | (0.89 | ) | |||||
| Adjusted (loss) earnings per share1 | (0.05 | ) | - | 0.09 | (0.04 | ) | ||||||
| Operating cash flow before changes in non-cash working capital2 | 81.6 | 103.5 | 282.6 | 326.9 | ||||||||
| Adjusted EBITDA1,2 | 99.3 | 119.2 | 351.1 | 366.8 | ||||||||
| 1 Adjusted earnings (loss) per share and adjusted EBITDA are non-IFRS financial performance measures with no standardized definition under IFRS. For further information and a detailed reconciliation, please see discussion under the "Non-IFRS Financial Performance Measures" section of this MD&A. | ||||||||||||
| 2 In $ millions. | ||||||||||||
KEY PRODUCTION RESULTS
| Three months ended | Three months ended | |||||
Sep. 30, 2022 | Sep. 30, 2021 | ||||||
Peru | Manitoba | Total | Peru | Manitoba | Total | ||
Contained metal in concentrate and doré produced 1 |
|
|
|
| |||
Copper | tonnes | 22,302 | 2,196 | 24,498 | 18,072 | 5,173 | 23,245 |
Gold | oz | 12,722 | 40,457 | 53,179 | 17,531 | 36,745 | 54,276 |
Silver | oz | 564,299 | 152,770 | 717,069 | 521,036 | 242,141 | 763,177 |
Zinc | tonnes | - | 9,750 | 9,750 | - | 20,844 | 20,844 |
Molybdenum | tonnes | 437 | - | 437 | 282 | - | 282 |
Payable metal sold |
|
|
|
|
|
| |
Copper | tonnes | 20,718 | 4,081 | 24,799 | 16,065 | 5,071 | 21,136 |
Gold2 | oz | 11,970 | 54,962 | 66,932 | 16,902 | 30,941 | 47,843 |
Silver2 | oz | 513,470 | 302,946 | 816,416 | 457,263 | 244,338 | 701,601 |
Zinc3 | tonnes | - | 12,714 | 12,714 | - | 21,619 | 21,619 |
Molybdenum | tonnes | 511 | - | 511 | 304 | - | 304 |
1 Metal reported in concentrate is prior to deductions associated with smelter contract terms. | |||||||
2 Includes total payable gold and silver in concentrate and in doré sold. | |||||||
3 Includes refined zinc metal and payable zinc in concentrate sold. | |||||||
| Nine months ended | Nine months ended | |||||
Sep. 30, 2022 | Sep. 30, 2021 | ||||||
Peru | Manitoba | Total | Peru | Manitoba | Total | ||
Contained metal in concentrate produced 1 |
|
|
|
|
| ||
Copper | tonnes | 62,348 | 12,520 | 74,868 | 54,957 | 16,315 | 71,272 |
Gold | oz | 37,369 | 128,411 | 165,780 | 32,389 | 97,235 | 129,624 |
Silver | oz | 1,654,095 | 712,184 | 2,366,279 | 1,394,809 | 750,959 | 2,145,768 |
Zinc | tonnes | - | 49,055 | 49,055 | - | 70,322 | 70,322 |
Molybdenum | tonnes | 1,033 | - | 1,033 | 871 | - | 871 |
Payable metal sold |
|
|
|
|
|
| |
Copper | tonnes | 56,016 | 13,042 | 69,058 | 50,847 | 16,394 | 67,241 |
Gold | oz | 34,852 | 131,307 | 166,159 | 25,503 | 85,928 | 111,431 |
Silver | oz | 1,634,549 | 784,630 | 2,419,179 | 1,109,939 | 678,929 | 1,788,868 |
Zinc 2 | tonnes | - | 50,813 | 50,813 | - | 75,323 | 75,323 |
Molybdenum | tonnes | 931 | - | 931 | 853 | - | 853 |
|
|
|
|
|
|
|
|
1 Metal reported in concentrate is prior to deductions associated with smelter contract terms. | |||||||
2 Includes refined zinc metal sold and payable zinc in concentrate sold. | |||||||
KEY COST RESULTS
| Three months ended | Nine months ended | Guidance | |||||||||||
| Sep. 30, 2022 | Sep. 30, 2021 | Sep. 30, 2022 | Sep. 30, 2021 | Annual 2022 | |||||||||
| Consolidated copper cash cost per pound of copper produced | |||||||||||||
| Cash cost 1 | $/lb | 0.58 | 0.62 | 0.78 | 0.84 | 0.60 - 1.05 | |||||||
| Peru | $/lb | 1.68 | 1.26 | 1.69 | 1.65 | 1.10 - 1.40 | |||||||
| Manitoba | $/lb | (10.64 | ) | (1.64 | ) | (3.75 | ) | (1.90 | ) | - | |||
| Sustaining cash cost 1 | $/lb | 1.91 | 1.97 | 2.02 | 2.12 | 1.60 - 2.25 | |||||||
| Peru | $/lb | 2.46 | 2.31 | 2.46 | 2.46 | ||||||||
| Manitoba | $/lb | (3.71 | ) | 0.75 | (0.15 | ) | 0.99 | ||||||
| All-in sustaining cash cost1 | $/lb | 2.16 | 2.18 | 2.21 | 2.33 | ||||||||
| Manitoba gold cash cost per ounce of gold produced | |||||||||||||
| Cash cost 1,4 | $/oz | 216 | - | 136 | - | 300 - 550 | |||||||
| Sustaining cash cost 1,4 | $/oz | 1,045 | - | 909 | - | ||||||||
| Combined mine/mill unit operating cost per tonne of copper processed 1,2 | |||||||||||||
| Peru 3 | $/tonne | 13.06 | 10.93 | 12.48 | 10.99 | 10.10 - 12.90 | 5 | ||||||
| Manitoba | C$/tonne | 235 | 147 | 185 | 149 | 170 - 185 | |||||||
| 1 Cash cost, sustaining cash cost, all-in sustaining cash cost per pound of copper produced, net of by-product credits, gold cash cost, sustaining cash cost per ounce of gold produced, net of by-product credits, and unit operating cost are non-IFRS financial performance measures with no standardized definition under IFRS. For further information and a detailed reconciliation, please see the discussion under the "Non-IFRS Financial Performance Measures" section of this MD&A. | |||||||||||||
| 2 Reflects combined mine, mill and G&A costs per tonne of milled ore. Peru costs reflect the deduction of expected capitalized stripping costs. | |||||||||||||
| 3 Excludes approximately $0.9 million, or $0.12 per tonne and $4.5 million, or $0.20 per tonne, of COVID-19 related costs during the three and nine months ended September 30, 2022, respectively and $4.8 million, or $0.69 and $15.7 million or $0.76 per tonne during the three and nine months ended September 30, 2021. | |||||||||||||
| 4 Cash cost and sustaining cash cost per ounce of gold produced, net of by-product credits were introduced in 2022 and do not have a published comparative. | |||||||||||||
| 5 Combined unit cost guidance for 2022 excludes COVID-19 related costs. | |||||||||||||
RECENT DEVELOPMENTS
Focused on Operating Efficiencies and Cost Reductions
We continue to believe that long-term supply and demand fundamentals for copper remain strong as global mine supply will be unable to meet demand from global decarbonization initiatives. However, in 2022, we have faced higher input prices in a period of declining copper prices, significantly squeezing margins. While we benefit from our consolidated cash costs being positioned in the first quartile of the global cash cost curve, we continue to focus on maximizing operating efficiencies and discretionary cost reductions in this challenging environment.
In light of this environment, Hudbay has taken several steps to reduce discretionary spending by $30 million for the remainder of 2022 and is targeting more than $50 million in discretionary spending cuts as part of the 2023 budget process, including:
- Reducing 2022 Arizona spending by $10 million with lower exploration, evaluation and growth expenditures.
- Deferring plans for early development of the 1901 deposit, resulting in savings of $5 million of Manitoba growth spending in 2022 and additional amounts that were previously planned to be accelerated into 2023 without impacting the ability to achieve the 2026 production start as laid out in the current mine plan.
- Deferring $15 million of 2022 growth spending in Peru and Manitoba relating to mill recovery improvement programs and other capital projects.
- Evaluating low capital alternatives to installing a pebble crusher in Peru, saving approximately $22 million of growth capital in 2023.
- Delaying the expected completion of the Copper World definitive feasibility study to 2024 in order to reduce expected Arizona growth expenditures in 2023 and prioritize the completion of the pre-feasibility study and state permits in 2023, as mentioned in more detail below.
- Rationalizing our non-core asset portfolio with the divestment of our 100% interest in the Lordsburg property in New Mexico, which was acquired through the Mason acquisition in 2018, to American Copper Development Corporation, and the sale of our equity investment in Fireweed Metals Corp., which was received in 2018 in exchange for the sale of our Tom and Jason project in the Yukon Territory.
Committed to Deleveraging and Disciplined Capital Allocation
With a focus on generating positive cash flow and strong returns on invested capital, Hudbay is committed to deleveraging and disciplined capital allocation. We have improved our net debt position by $70.7 million over the past two quarters to $897.1 million at the end of September 30, 2022. We have repaid 38% of the gold prepayment liability during 2022 and the remaining $80.3 million, valued at gold forward prices as at quarter end, will be repaid before the end of 2023.
As part of our disciplined financial planning approach to Copper World, we have introduced a three prerequisites plan ("3-P"), including specific leverage targets that we would need to achieve prior to making an investment decision in the project:
1. Permits - receipt of all state level permits required for Phase I
2. Plan - completion of a definitive feasibility study with an internal rate of return of greater than 15%
3. Prudent Financing Strategy - multi-faceted financing strategy including
- a committed minority joint venture partner;
- a renegotiated precious metals stream agreement optimized for the current project;
- net debt to EBITDA ratio of less than 1.2 times;
- a minimum cash balance of $600 million; and,
- limited non-recourse project level debt of up to $500 million.
The opportunity to sanction Copper World is not expected until late 2024 based on current estimated timelines. The decision to sanction Copper World will ultimately be evaluated against other competing investment opportunities as part of Hudbay's capital allocation process.
Advancing Several Initiatives to De-risk Copper World
Hudbay continues to advance pre-feasibility activities for Phase I of the Copper World project, which is expected to include conversion of the remaining inferred mineral resources to measured and indicated and optimization of the layout and sequencing of the processing facilities, in addition to evaluating other upside opportunities. The process plant pre-feasibility level engineering is at 85% completion and geotechnical and hydrogeological site investigation activities have been completed. Pre-feasibility engineering design and metallurgical test work activities are on track to be completed before the end of 2022 with the results expected to be published in a study in the first half of 2023.
Copper World requires state and local permits for Phase I, which consists of a 16-year operation on private land claims. On September 21, 2022, we submitted the application for an Aquifer Protection Permit to the Arizona Department of Environmental Quality ("ADEQ") and on October 21, 2022, we submitted the application for an Air Quality Permit to the ADEQ. We expect to receive these two remaining state permits by mid-2023. The other key state permit, the Mined Land Reclamation Plan, was received in July 2022.
Upon receipt of the state permits for Phase I, we expect to conduct a bulk sampling program at Copper World in the second half of 2023 to continue to de-risk the project by testing grade continuity, variable cut-off effectiveness and metallurgical strategies in high-grade, near-surface areas of the Peach-Elgin and West pits.
We have re-evaluated the timing of the definitive feasibility study for Copper World and intend to prioritize the completion of the pre-feasibility study, state level permits, bulk sampling program and a minority joint venture partner process in 2023 to significantly de-risk the project and defer the definitive feasibility study activities and expenditures to 2024.
Exploration Update
Initial Mineral Resource Estimate for Llaguen
On November 2, 2022, Hudbay announced an NI 43-101 initial mineral resource estimate for the Llaguen copper-molybdenum porphyry deposit in the Otuzco province in northern Peru. The Llaguen project is 100% owned by Hudbay and is near the highly populated city of Trujillo, in close proximity to existing infrastructure, water and power supply. The company optioned the property from Vale in 2017 and has since completed an exploration agreement with the local community, conducted additional geological mapping and geochemical sampling, and completed a 28-hole confirmatory drill program during 2021 and 2022. The initial resource estimate was developed based on Hudbay's confirmatory drill program and a 23-hole historical drill program completed by Vale from 2006 to 2008.
The initial mineral resource estimate at Llaguen includes 271 million tonnes of indicated resources at 0.42% copper-equivalent1 and 83 million tonnes of inferred resources at 0.30% copper-equivalent1. The global mineral resource estimate contains a higher-grade portion of 113 million tonnes of indicated resources at 0.60% copper-equivalent1 and 16 million tonnes of inferred resources at 0.52% copper-equivalent1. The methodology followed to estimate the mineral resources at Llaguen is identical to the approach used by Hudbay to estimate mineral resources at its Constancia mine in Peru.
1 For further information on the mineral resource estimate and assumptions underlying the copper-equivalent grades, please refer to table on page 10 of this MD&A.
Llaguen Project Mineral Resource Estimate as at November 1, 2022
Category | Metric Tonnes | Cu (%) | Mo (g/t) | Au (g/t) | Ag (g/t) | CuEq (%) |
Indicated Global | 271,000,000 | 0.33 | 218 | 0.033 | 2.04 | 0.42 |
(>= 0.14% Cu) | ||||||
Including Indicated | 113,000,000 | 0.49 | 261 | 0.046 | 2.73 | 0.60 |
(>= 0.30% Cu) | ||||||
Inferred Global | 83,000,000 | 0.24 | 127 | 0.024 | 1.47 | 0.30 |
(>= 0.14% Cu) | ||||||
Including Inferred | 16,000,000 | 0.45 | 141 | 0.038 | 2.60 | 0.52 |
(>= 0.30% Cu) | ||||||
Notes: | ||||||
- CIM definitions were followed for the estimation of mineral resources. Mineral resources that are not mineral reserves do not have demonstrated economic viability. | ||||||
- Mineral resources are reported within an economic envelope defined by a pit shell optimization algorithm. This pit shell is defined by a revenue factor of 0.33 assuming operating costs adjusted from Hudbay's Constancia open pit operation. | ||||||
- Long-term metal prices of $3.60 per pound copper, $11.00 per pound molybdenum, $1,650 per ounce gold and $22.00 per ounce silver were used for the estimation of mineral resources. | ||||||
- Metal recovery estimates assume that this mineralization would be processed at a combination of facilities, including copper and molybdenum flotation. | ||||||
- Copper-equivalent ("CuEq") grade is calculated assuming 85% copper recovery, 80% molybdenum recovery, 60% gold recovery and 60% silver recovery. | ||||||
- Specific gravity measurements were estimated by industry standard laboratory measurements. | ||||||
Hudbay has initiated preliminary technical studies at Llaguen, including metallurgical test work as well as geotechnical and hydrogeological studies, which are expected to be incorporated into a future preliminary economic assessment for the Llaguen project. The mineralization at Llaguen remains open to the northeast, northwest and at depth and several untested geophysical targets exist in the region, which could add to the mineral resource estimate in the future.
Peru Regional Exploration
Hudbay controls a large, contiguous block of mineral rights with the potential to host mineral deposits within trucking distance of the Constancia processing facility, including the past producing Caballito property and the highly prospective Maria Reyna property. In August 2022, we executed a surface rights exploration agreement with the community of Uchucarcco that allows for exploration of the Maria Reyna and Caballito properties. Shortly after the agreement was completed, the Company commenced baseline environmental and archaeological activities and our geological team commenced surface investigation activities. Field evidence confirms that both Caballito and Maria Reyna host sulfide and oxide rich copper mineralization in skarns, hydrothermal breccias and large porphyry intrusive bodies.
Manitoba Regional Exploration
We continue to conduct drilling activities in the Snow Lake area and compile results from ongoing infill drilling at Lalor and 1901, which will be incorporated into the annual mineral resource and reserve estimate update in the first quarter of 2023. Assay results from recent confirmatory drilling at the tailings facility in Flin Flon indicate higher zinc, copper and silver grades than predicted from historical mill records while confirming the historical gold grade. We plan to complete metallurgical test work on the Flin Flon tailings to assess the processing viability. We also intend to evaluate the opportunity to reprocess the tailings at the Anderson facility in Snow Lake given significant amounts of gold have been deposited over many decades.
We are in the process of planning a winter drill program to test the down-dip gold and copper extensions of the Lalor deposit in 2023, which will be the first time Hudbay has completed step-out drilling in the deeper zones at Lalor since 2009.
Arizona Regional Exploration
Following the substantial completion of the infill drilling to support the pre-feasibility study for the Copper World Complex in July, we reduced the number of drill rigs at site to three. Recent drilling has confirmed the continuity of the mineralization between the Bolsa and East deposits and extended the size of the mineralized envelope, which remains open in several directions and at depth.
Nevada Regional Exploration
A conductivity-resistivity IP ground survey commenced in October 2022 at the Mason Valley properties located on our private land claims near the Mason project. This work, in combination with a re-interpretation of geological data from past operating mines and previous exploration data, will be used to finalize a drill plan to test high grade skarn targets in 2023.
Appointment of Chief Financial Officer
On October 13, 2022, Eugene Lei was appointed as Hudbay's Senior Vice President and Chief Financial Officer. Mr. Lei is highly regarded within the industry and has over 20 years of global mining investment banking, finance and corporate development experience. Since joining Hudbay in 2012, he has progressed through several senior management roles and executive responsibilities, including leading the corporate development, strategy and investor relations functions. He was interim CFO at Hudbay in 2020 and led the gold prepayment transaction in May 2020 to finance the capital reinvestment program in the New Britannia mill.
PERU OPERATIONS REVIEW
| Three months ended | Nine months ended | Guidance | |||
Sep. 30, 2022 | Sep. 30, 2021 | Sep. 30, 2022 | Sep. 30, 2021 | Annual | ||
2022 | ||||||
Constancia ore mined 1 | tonnes | 6,300,252 | 6,208,019 | 20,225,517 | 21,971,858 |
|
Copper | % | 0.36 | 0.30 | 0.33 | 0.30 |
|
Gold | g/tonne | 0.05 | 0.04 | 0.04 | 0.04 |
|
Silver | g/tonne | 3.38 | 2.76 | 3.37 | 2.90 |
|
Molybdenum | % | 0.01 | 0.01 | 0.01 | 0.01 |
|
Pampacancha ore mined 1 | tonnes | 2,488,928 | 2,050,813 | 4,547,621 | 3,033,805 |
|
Copper | % | 0.29 | 0.27 | 0.29 | 0.27 |
|
Gold | g/tonne | 0.23 | 0.27 | 0.28 | 0.27 |
|
Silver | g/tonne | 4.30 | 3.58 | 4.24 | 3.86 |
|
Molybdenum | % | 0.01 | 0.01 | 0.01 | 0.01 |
|
Total ore mined | tonnes | 8,789,180 | 8,258,832 | 24,773,138 | 25,005,663 |
|
Strip ratio 2 |
| 1.26 | 1.46 | 1.20 | 1.04 |
|
Ore milled | tonnes | 7,742,020 | 6,985,035 | 22,726,559 | 20,760,830 |
|
Copper | % | 0.34 | 0.30 | 0.32 | 0.31 |
|
Gold | g/tonne | 0.08 | 0.11 | 0.08 | 0.07 |
|
Silver | g/tonne | 3.48 | 3.93 | 3.46 | 3.22 |
|
Molybdenum | % | 0.01 | 0.01 | 0.01 | 0.01 |
|
Copper concentrate | tonnes | 100,545 | 78,711 | 275,275 | 239,367 |
|
Concentrate grade | % Cu | 22.18 | 22.96 | 22.65 | 22.96 |
|
Copper recovery | % | 84.5 | 84.9 | 84.9 | 84.1 |
|
Gold recovery | % | 61.9 | 71.9 | 60.7 | 65.1 |
|
Silver recovery | % | 65.2 | 59.1 | 65.3 | 64.9 |
|
Molybdenum recovery | % | 41.0 | 33.5 | 33.9 | 33.4 |
|
Combined unit operating costs 3,4,5 | $/tonne | 13.06 | 10.93 | 12.48 | 10.99 | 10.10 - 12.90 6 |
1 Reported tonnes and grade for ore mined are estimates based on mine plan assumptions and may not reconcile fully to ore milled. | ||||||
2 Strip ratio is calculated as waste mined divided by ore mined. | ||||||
3 Reflects combined mine, mill and general and administrative ("G&A") costs per tonne of ore milled. Reflects the deduction of expected capitalized stripping costs. | ||||||
4 Combined unit costs is a non-IFRS financial performance measure with no standardized definition under IFRS. For further information and a detailed reconciliation, please see the discussion under the "Non-IFRS Financial Performance Measures" section of this MD&A. | ||||||
5 Excludes approximately $0.9 million, or $0.12 per tonne and $4.5 million, or $0.20 per tonne, of COVID-19 related costs during the three and nine months ended September 30, 2022 respectively and $5.5 million, or $0.78 per tonne and $15.7 million or $0.76 per tonne, of COVID-19 related costs during the three and nine months ended September 30, 2021. | ||||||
6 Combined unit cost guidance for 2022 excludes COVID-19 related costs. | ||||||
Total ore mined in the third quarter of 2022 increased by 6% compared to the same period in 2021 due to lower amounts of waste being mined. Ore milled during the third quarter of 2022 was 11% higher than the same period in 2021 due to softer ore from Pampacancha. Milled copper grades increased in the third quarter of 2022 in comparison to the same period in 2021 due to higher head grades from both Constancia and Pampacancha. Milled gold grades decreased in the third quarter of 2022 mainly due to temporarily lower gold grades from Pampacancha.
Copper recoveries in the third quarter were in line with the comparative 2021 period. Gold recoveries in the third quarter of 2022 were 14% lower than the comparative 2021 period due to varying ore types and lower gold grades in the quarter. Silver recoveries in the third quarter of 2022 were 10% higher than the comparative 2021 period due to higher contaminants impacting the recoveries in the comparative period.
Year-to-date ore mined was consistent with the same period in 2021. Year-to-date recoveries of copper and silver were marginally higher than the same period in 2021 while recoveries of gold decreased over the period primarily due to the same factors as described above for the quarter-over-quarter variance.
Combined mine, mill and G&A unit operating costs in the third quarter of 2022 were 19% higher than the same period in 2021 primarily due to inflationary pressures on fuel, consumables and energy costs, partially offset by higher volume of tonnes milled. Combined mine, mill and G&A unit operating costs in the first three quarters of 2022 were 14% higher than the same period in 2021 due to the same factors as the quarterly variance. We expect to complete a four-day mill shutdown at Constancia in November 2022 to advance maintenance activities that were originally planned for the first quarter of 2023. As a result of ongoing inflationary cost pressures and the additional mill maintenance program expected in the fourth quarter, full year unit operating costs in Peru are expected to be near the top end of the 2022 guidance range.
Contained metal in | Three months ended |
| Nine months ended |
| Guidance | |||
Sep. 30, 2022 | Sep. 30, 2021 |
| Sep. 30, 2022 | Sep. 30, 2021 |
| Annual | ||
|
| 2022 | ||||||
Copper | tonnes | 22,302 | 18,072 |
| 62,348 | 54,957 |
| 89,000 - 115,000 |
Gold | oz | 12,722 | 17,531 |
| 37,369 | 32,389 |
| 70,000 - 90,000 |
Silver | oz | 564,299 | 521,036 |
| 1,654,095 | 1,394,809 |
| 1,620,000 - 2,100,000 |
Molybdenum | tonnes | 437 | 282 |
| 1,033 | 871 |
| 1,100 - 1,400 |
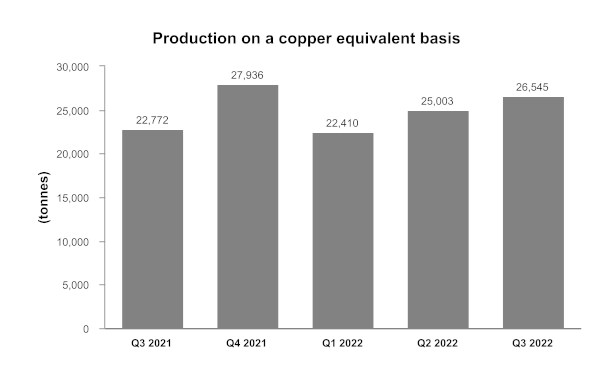
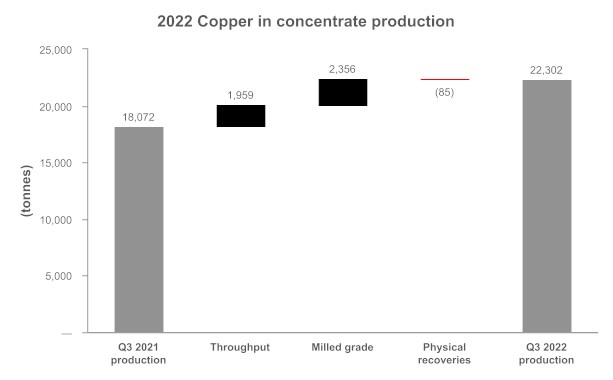
Production of copper, silver and molybdenum, was higher in the third quarter of 2022 and year-to-date compared to the same periods in 2021 due to an increase in throughput, higher copper grades and higher silver and molybdenum recoveries. Production of gold, was 27% lower in the third quarter of 2022 compared to the same period in 2021 due to lower gold grades from Pampacancha and lower associated recoveries as mentioned above. Year-to-date 2022 gold production was 15% higher than the comparative prior year period due to higher mill throughput and higher gold grades, partially offset by lower gold recoveries. Full year production in Peru is expected to benefit from higher grades in the fourth quarter of 2022 and, as such, full year production of all metals in Peru remains on track to achieve the guidance ranges for 2022.
Peru Cash Cost and Sustaining Cash Cost
| Three months ended | Nine months ended | Guidance | |||
Sep. 30, | Sep. 30, | Sep. 30, | Sep. 30, | Annual 2022 | ||
Cash cost per pound of copper produced, net of by-product credits1 | $/lb | 1.68 | 1.26 | 1.69 | 1.65 | 1.10 - 1.40 |
Sustaining cash cost per pound of copper produced, net of by-product credits1 | $/lb | 2.46 | 2.31 | 2.46 | 2.46 |
|
1 Cash cost and sustaining cash costs per pound of copper produced, net of by-product credits, are not recognized under IFRS. For more detail on these non-IFRS financial performance measures, please see the discussion under the "Non-IFRS Financial Performance Measures" section of this MD&A. | ||||||
Cash cost per pound of copper produced, net of by-product credits, in the third quarter of 2022 was $1.68, an increase of 33% compared to the same period in 2021 due to inflationary pressures driving higher mining and milling costs and lower precious metal by-product credits, partially offset by higher copper production. However, cash cost per pound of copper produced, net of by-product credits, in the third quarter was 8% lower than the second quarter of 2022, primarily due to higher by-product credits and higher copper production. Although copper cash cost is expected to continue to decline in the fourth quarter with higher anticipated copper production and contributions from precious metal by-product credits, full year cash cost is expected to exceed the upper end of the 2022 guidance range by approximately 5%, primarily due to the inflationary cost environment. Cash cost per pound of copper produced, net of by-product credits for the first nine months of 2022 was $1.69, a 2% increase compared to the same period in 2021 due to the same reasons provided above offset by higher by-product credits.
Sustaining cash cost per pound of copper produced, net of by-product credits, for the third quarter of 2022 was 6% above the comparative 2021 period and was impacted by the same factors affecting cash costs noted above partially offset by lower sustaining capital expenditures. However, year-to-date sustaining cash cost per pound of copper produced, net of by-product credits, was unchanged from 2022 compared to the same period in 2021 despite increased inflationary cost pressures.
Metal Sold
| Three months ended | Nine months ended | |||
Sep. 30, 2022 | Sep. 30, 2021 | Sep. 30, 2022 | Sep. 30, 2021 | ||
Payable metal in concentrate |
|
|
|
|
|
Copper | tonnes | 20,718 | 16,065 | 56,016 | 50,847 |
Gold | oz | 11,970 | 16,902 | 34,852 | 25,503 |
Silver | oz | 513,470 | 457,263 | 1,634,549 | 1,109,939 |
Molybdenum | tonnes | 511 | 304 | 931 | 853 |
Quantities of payable metal sold for the three and nine months ended September 30, 2022 were primarily affected by the same factors as contained metal production.
MANITOBA OPERATIONS REVIEW
Mines
| Three months ended | Nine months ended | |||
Sep. 30, 2022 | Sep. 30, 2021 | Sep. 30, 2022 | Sep. 30, 2021 | ||
Lalor |
|
|
|
|
|
Ore | tonnes | 347,345 | 392,380 | 1,146,750 | 1,170,933 |
Copper | % | 0.71 | 0.86 | 0.74 | 0.69 |
Zinc | % | 3.27 | 3.60 | 3.46 | 4.24 |
Gold | g/tonne | 4.57 | 3.85 | 3.99 | 3.23 |
Silver | g/tonne | 21.27 | 22.13 | 22.80 | 22.61 |
777 |
|
|
|
|
|
Ore | tonnes | - | 256,536 | 484,355 | 786,966 |
Copper | % | - | 1.06 | 1.12 | 1.33 |
Zinc | % | - | 3.88 | 3.83 | 3.82 |
Gold | g/tonne | - | 1.96 | 1.66 | 2.11 |
Silver | g/tonne | - | 22.99 | 20.85 | 25.32 |
Total Mines |
|
|
|
|
|
Ore | tonnes | 347,345 | 648,916 | 1,631,105 | 1,957,899 |
Copper | % | 0.71 | 0.94 | 0.85 | 0.95 |
Zinc | % | 3.27 | 3.71 | 3.57 | 4.07 |
Gold | g/tonne | 4.57 | 3.10 | 3.30 | 2.78 |
Silver | g/tonne | 21.27 | 22.47 | 22.22 | 23.70 |
Unit Operating Costs 1,2 | Three months ended | Nine months ended | |||
Sep. 30, 2022 | Sep. 30, 2021 | Sep. 30, 2022 | Sep. 30, 2021 | ||
Mines |
|
|
|
|
|
Lalor | C$/tonne | 152.84 | 115.84 | 135.62 | 115.89 |
777 | C$/tonne | - | 91.17 | 87.50 | 87.99 |
Total Mines | C$/tonne | 152.84 | 106.09 | 121.33 | 104.68 |
1 Reflects costs per tonne of ore mined. | |||||
2 Unit costs is a non-IFRS financial performance measure with no standardized definition under IFRS. For further information and a detailed reconciliation, please see the discussion under the "Non-IFRS Financial Performance Measures" section of this MD&A. | |||||
After 18 years of steady production at 777 in Flin Flon, the final reserves were depleted in June 2022. Closure activities in Flin Flon, including the zinc plant, were substantially completed in the third quarter with most of our employees and equipment of value transitioned to our Snow Lake operations to support Lalor's ramp-up strategy of 5,300 tonnes per day in early 2023. 777 was decommissioned in early August with the removal of shaft conveyances and hoist ropes, and securing of the shaft and all other openings to underground. The Flin Flon mill was safely placed on long-term care and maintenance during the third quarter.
A key focus area for the Snow Lake operations during the third quarter was integrating the Flin Flon employees and equipment to be able to transition away from the use of contractors in the future. Lalor's ore production during the quarter was impacted by an underground scoop tram fire as well as an unplanned Manitoba Hydro power outage due to the failure of a remote transmission line supplying power to the town of Snow Lake and our property, both of which occurred in September. The two-day power outage affected our operations at Lalor, the New Britannia and Stall mills and the Snow Lake camp and required several days to fully restore power, ventilation, and water services to the underground operations at Lalor. Once production activities resumed, priority was placed on mining the higher value gold and copper-gold zone ore to maintain throughput at New Britannia mill. Lalor completed a scheduled maintenance program at the end of the third quarter and into the beginning of the fourth quarter to replace surface ore chutes and complete other pre-winter maintenance activities. Lalor's ore production is expected to return to 4,650 tonnes per day in the fourth quarter and is on track to ramp up to 5,300 tonnes per day in early 2023.
Ore mined at our Manitoba operations during the third quarter of 2022 was 46% lower than the same period in 2021 mainly due to the closure of 777 in June 2022 which resulted in a significant decline in ore mined in the third quarter compared to the prior year period which benefited from the full contribution of 777 mine production. Excluding 777 production, Lalor mined ore in the third quarter was 11% lower than the same period in 2021 due to the above noted transition and production interruptions impacting operations. Gold grades mined during the third quarter of 2022 were 19% higher than the same period in 2021. Copper, zinc and silver grades mined at Lalor during the third quarter of 2022 were 17%, 9% and 4% lower, respectively, compared to the same period in 2021.
Year-to-date ore mined at our Manitoba operations in 2022 was 17% lower than the same period in 2021 mainly due to the closure of 777 in June 2022 as mentioned above. Year-to-date ore mined at Lalor in 2022 remained consistent with the same period in 2021. Copper, gold and silver grades mined at Lalor during the first nine months of 2022 were 7%, 24% and 1% higher, respectively, compared to the same period in 2021, mainly due to an increased focus on mining of gold and copper-gold stopes and a corresponding decrease of production from the base metal zones. As such, year-to-date zinc grades mined at Lalor in 2022 were 18% lower than the same period in 2021, in line with the mine plan.
Total mine unit operating costs during the third quarter of 2022 increased by 44%, reflecting the standalone cost structure of Lalor compared to the same period in 2021 which included operating costs for both Lalor and the lower cost 777 mine. Operating costs were also impacted by higher inflationary cost pressures for bulk commodities, fuel, and contractor costs compared to the same period in 2021, in addition to lower ore production volumes as mentioned above.
Total mine unit operating costs during the first nine months of 2022 increased by 16% compared to the same period in 2021 due to the factors mentioned above and higher propane usage early in the year caused by a colder winter.
Processing Facilities
| Three months ended | Nine months ended | |||
Sep. 30, 2022 | Sep. 30, 2021 | Sep. 30, 2022 | Sep. 30, 2021 | ||
Stall & New Britannia Concentrator Combined |
|
|
|
| |
Ore | tonnes | 362,108 | 408,201 | 1,165,415 | 1,087,029 |
Copper | % | 0.69 | 0.82 | 0.75 | 0.71 |
Zinc | % | 3.33 | 3.58 | 3.59 | 4.37 |
Gold | g/tonne | 4.60 | 3.84 | 4.12 | 3.23 |
Silver | g/tonne | 20.66 | 23.32 | 22.67 | 22.97 |
Copper concentrate | tonnes | 12,411 | 18,422 | 44,075 | 39,797 |
Concentrate grade | % Cu | 17.69 | 15.41 | 17.51 | 16.66 |
Zinc concentrate | tonnes | 19,442 | 25,429 | 65,100 | 83,698 |
Concentrate grade | % Zn | 50.15 | 49.72 | 50.80 | 50.41 |
Copper recovery - concentrate | % | 88.3 | 84.3 | 88.5 | 86.0 |
Zinc recovery - concentrate (Stall) | % | 88.0 | 88.2 | 85.9 | 89.4 |
Gold recovery - concentrate | % | 60.9 | 53.4 | 59.4 | 55.1 |
Silver recovery - concentrate | % | 57.6 | 52.7 | 58.6 | 54.6 |
Contained metal in concentrate produced |
|
|
| ||
Copper | tonnes | 2,196 | 2,839 | 7,719 | 6,630 |
Zinc | tonnes | 9,750 | 12,643 | 33,069 | 42,191 |
Gold | oz | 32,570 | 26,906 | 91,565 | 62,191 |
Silver | oz | 138,615 | 161,418 | 498,046 | 438,168 |
Metal in doré produced |
|
|
| ||
Gold | oz | 7,887 | 404 | 21,608 | 404 |
Silver | oz | 14,155 | 10 | 40,175 | 10 |
Flin Flon Concentrator |
|
|
|
|
|
Ore | tonnes | - | 258,062 | 497,344 | 870,951 |
Copper | % | - | 1.06 | 1.11 | 1.26 |
Zinc | % | - | 3.86 | 3.87 | 3.89 |
Gold | g/tonne | - | 1.96 | 1.67 | 2.12 |
Silver | g/tonne | - | 22.93 | 21.00 | 24.86 |
Copper concentrate | tonnes | - | 10,276 | 22,602 | 44,092 |
Concentrate grade | % Cu | - | 22.70 | 21.24 | 21.96 |
Zinc concentrate | tonnes | - | 16,412 | 31,602 | 55,621 |
Concentrate grade | % Zn | - | 49.97 | 50.59 | 50.58 |
Copper recovery | % | - | 85.2 | 86.7 | 88.0 |
Zinc recovery | % | - | 82.2 | 83.0 | 83.0 |
Gold recovery | % | - | 58.1 | 57.1 | 58.3 |
Silver recovery | % | - | 42.4 | 51.8 | 44.9 |
Contained metal in concentrate produced |
|
|
| ||
Copper | tonnes | - | 2,334 | 4,801 | 9,685 |
Zinc | tonnes | - | 8,201 | 15,986 | 28,131 |
Gold | oz | - | 9,435 | 15,238 | 34,640 |
Silver | oz | - | 80,713 | 173,963 | 312,781 |
Unit Operating Costs 1 | Three months ended |
| Nine months ended |
| Guidance | |||
Sep. 30, | Sep. 30, |
| Sep. 30, | Sep. 30, |
| Annual | ||
| 2022 | |||||||
Concentrators |
|
|
|
|
|
|
|
|
Stall & New Britannia | C$/tonne | 59.77 | 26.30 |
| 52.87 | 24.80 |
|
|
Flin Flon | C$/tonne | - | 29.15 |
| 28.14 | 27.65 |
|
|
Combined mine/mill unit operating costs 2,3 |
|
|
|
|
| |||
Manitoba | C$/tonne | 235 | 147 |
| 185 | 149 |
| 170 - 185 |
1 Reflects costs per tonne of milled ore. | ||||||||
2 Reflects combined mine, mill and G&A costs per tonne of milled ore. | ||||||||
3 Combined unit costs is a non-IFRS financial performance measure with no standardized definition under IFRS. For further information and a detailed reconciliation, please see the discussion under the "Non-IFRS Financial Performance Measures" section of this MD&A. | ||||||||
The combined Stall and New Britannia mills processed 11% less ore in the third quarter of 2022 compared to the same period in 2021, mainly due to the above noted production interruptions impacting Lalor and the milling operations. Stall recoveries were consistent with the metallurgical model for the head grades delivered. Compared to the same period in 2021, unit operating costs at the Stall and New Britannia mills were higher in the third quarter of 2022 as a result of higher costs at New Britannia and inflationary cost pressures.
The combined Stall and New Britannia mills processed 7% more ore in the first nine months of 2022 compared to the same period in 2021 due to lower production from New Britannia in the comparative period as commissioning activities at the New Britannia gold circuit were completed in July 2021. Stall recoveries were consistent with the metallurgical model for the head grades delivered. Compared to the same period in 2021, unit operating costs at the Stall and New Britannia mills were higher in first nine months of 2022 for the same reasons outlined in the third quarter variance as well as scheduled mill maintenance at New Britannia early in the year and baseline effects as New Britannia was not yet fully operational in the comparative period.
The New Britannia mill achieved consistent production in the third quarter, averaging approximately 1,440 tonnes per day. Metal recoveries have now stabilized near our targeted levels for the mill. Additional improvement initiatives will continue to be advanced in the upcoming quarters with a focus on reducing reagent and grinding media consumption that has contributed to higher operating costs than planned. These initiatives require minimal capital expenditures and will further improve overall metal recoveries and copper concentrate grades.
Combined unit operating costs in the third quarter of 2022 and year-to-date increased by 60% and 24%, respectively, compared to the same periods in 2021 for the same reasons as outlined above. Looking ahead to the fourth quarter of 2022, we expect combined unit operating costs to remain elevated due to ongoing inflationary cost pressures and the removal of the lower-cost Flin Flon operations. As such, full year combined unit costs in Manitoba are expected to exceed the upper end of the 2022 guidance range by approximately 5%.
|
| Three months ended | Nine months ended | Guidance | ||
Contained metal in concentrate | Sep. 30, | Sep. 30, | Sep. 30, | Sep. 30, | Annual | |
2022 | ||||||
Copper | tonnes | 2,196 | 5,173 | 12,520 | 16,315 | 12,000 - 16,000 |
Gold 2 | oz | 32,570 | 36,341 | 106,803 | 96,831 | - |
Silver 3 | oz | 138,615 | 242,131 | 672,009 | 750,949 | - |
Zinc | tonnes | 9,750 | 20,844 | 49,055 | 70,322 | 50,000 - 70,000 |
Metal in doré produced 1 |
|
| ||||
Gold 2 | oz | 7,887 | 404 | 21,608 | 404 | - |
Silver 3 | oz | 14,155 | 10 | 40,175 | 10 | - |
Contained metal in concentrate and doré produced |
| |||||
Gold 2 | oz | 40,457 | 36,745 | 128,411 | 97,235 | 150,000 - 185,000 |
Silver 3 | oz | 152,770 | 242,141 | 712,184 | 750,959 | 800,000 - 1,100,000 |
1 Metal reported in concentrate is prior to deductions associated with smelter terms. |
| |||||
2 Gold production guidance includes gold contained in concentrate produced and gold in doré. | ||||||
3 Silver production guidance includes silver contained in concentrate produced and silver in doré. | ||||||
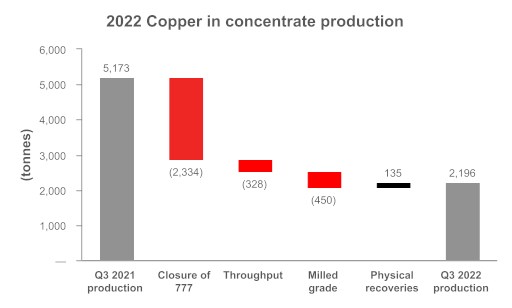
Metal production in the third quarter was lower following the closure of 777 in June 2022 and the above noted production interruptions, partially offset by higher Lalor gold grades and improved gold recoveries at New Britannia. Compared to the same period in 2021, gold production in the third quarter of 2022 increased by 10% due to increased production from Snow Lake, while copper, zinc and silver production decreased by 58%, 53% and 37%, respectively, over the same period.
Year-to-date metal production was impacted by the same reasons noted above. Compared to the same period in 2021, gold production in the first nine months of 2022 increased by 32%, while copper, zinc and silver production decreased by 23%, 30% and 5%, respectively, over the same time period.
Full year production of all metals is on track to achieve guidance ranges for 2022.
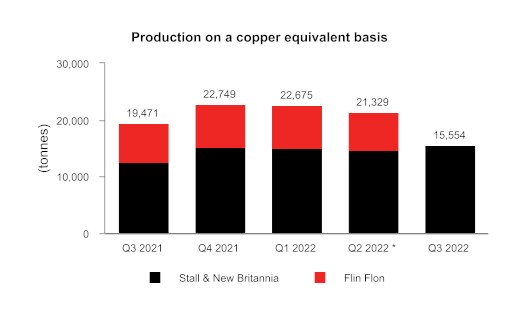
* Mining activities at 777 were completed in June 2022
Zinc Plant
Zinc Production | Three months ended |
| Nine months ended |
| |||
Sep. 30, 2022 | Sep. 30, 2021 |
| Sep. 30, 2022 | Sep. 30, 2021 |
| ||
| |||||||
Zinc Concentrate Treated |
|
|
|
|
| ||
Domestic | tonnes | - | 44,275 |
| 76,223 | 146,140 |
|
Refined Metal Produced |
|
|
|
|
| ||
Domestic | tonnes | - | 19,858 |
| 37,894 | 68,785 |
|
Unit Operating Costs | Three months ended |
| Nine months ended |
| |||
Sep. 30, 2022 | Sep. 30, 2021 |
| Sep. 30, 2022 | Sep. 30, 2021 |
| ||
| |||||||
Zinc Plant 1,2 | C$/lb | - | 0.55 |
| 0.60 | 0.53 |
|
1 Zinc unit operating costs include G&A costs. 2 Zinc unit costs is a non-IFRS financial performance measure with no standardized definition under IFRS. For further information and a detailed reconciliation, please see the discussion under the "Non-IFRS Financial Performance Measures" section of this MD&A. | |||||||
The zinc plant ceased operations on June 30, 2022 and, as such, had no production during the third quarter. Closure activities commenced and are progressing safely during the third quarter of 2022.
Manitoba Cash Cost and Sustaining Cash Cost
| Three months ended | Nine months ended | Guidance | ||||||||||||||
| Sep. 30, 2022 | Sep. 30, 2021 | Sep. 30, 2022 | Sep. 30, 2021 | Annual 2022 | ||||||||||||
| Cost per pound of gold produced | ||||||||||||||||
| Cash cost per ounce of gold produced, net of by-product credits 1, 2 | $/oz | 216 | - | 136 | - | 300 - 550 | ||||||||||
| Sustaining cash cost per ounce of gold produced, net of by-product credits 1, 2 | $/oz | 1,045 | - | 909 | - | |||||||||||
| Cost per pound of copper produced | ||||||||||||||||
| Cash cost per pound of copper produced, net of by-product credits 1 | $/lb | (10.64 | ) | (1.64 | ) | (3.75 | ) | (1.90 | ) | |||||||
| Sustaining cash cost per pound of copper produced, net of by-product credits 1 | $/lb | (3.71 | ) | 0.75 | (0.15 | ) | 0.99 | |||||||||
1 Cash cost and sustaining cash cost per pound of copper and per ounce of gold produced, net of by-product credits, are not recognized under IFRS. For more detail on this non-IFRS financial performance measure, please see the discussion under the "Non-IFRS Financial Performance Measures" section of this MD&A.
2 Cash cost and sustaining cash cost per ounce of gold produced, net of by-product credits were introduced in 2022 and do not have a published comparative.
Cash cost per ounce of gold produced, net of by-product credits, in the third quarter was $216, higher than the second quarter of 2022 primarily due to lower by-product credits as gold revenue continues to increase and become the largest contributor to total Manitoba revenue. Gold cash costs were also impacted by higher treatment and refining charges, partially offset by lower mining, milling, G&A and zinc refining costs due to the closure of 777 and the zinc plant. Year-to-date cash cost per ounce of gold produced, net of by-product credits, continues to track below our 2022 guidance range and, as such, we reiterate the guidance range for the full year.
Sustaining cash cost per ounce of gold produced, net of by-product credits, in the third quarter was higher than the second quarter of 2022 primarily due to the same factors affecting cash cost and higher cash sustaining capital expenditures, partially offset by lower royalties.
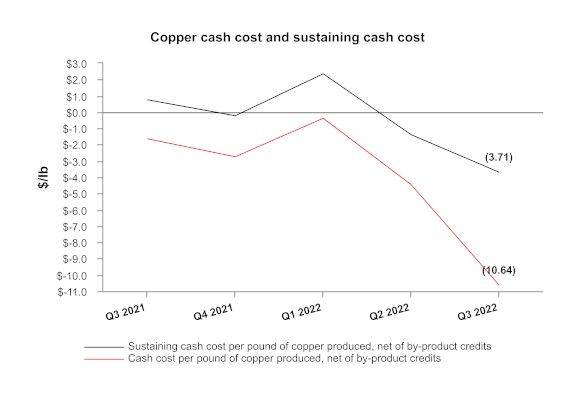
Cash cost per pound of copper produced, net of by-product credits, in the third quarter of 2022 was lower compared to the same period in 2021, as a result of higher zinc and gold by-product revenues, lower mining and zinc refining costs, due to the closure of 777 mine and the zinc plant, partially offset by higher milling, profit sharing, treatment and refining costs and significantly lower copper production due to the closure of 777.
Cash cost per pound of copper produced, net of by-product credits, for the first nine months of 2022 was lower compared to the same period in 2021, as a result of higher gold by-product revenues, lower mining and zinc refining costs offset by higher milling, treatment and refining charges and profit sharing costs with significantly lower production due to the closure of 777.
Sustaining cash cost per pound of copper produced, net of by-product credits, in the third quarter of 2022 was lower compared to the same period in 2021, primarily due to the reasons listed above offset by higher cash sustaining capital expenditures compared to the same period in 2021.
Sustaining cash cost per pound of copper produced, net of by-product credits, for the first nine months of 2022 was lower compared to the same period in 2021, due to the same reasons provided above and slightly lower cash sustaining capital expenditures compared to the same period in 2021.
Metal Sold
| Three months ended |
| Nine months ended | |||
Sep. 30, 2022 | Sep. 30, 2021 |
| Sep. 30, 2022 | Sep. 30, 2021 | ||
Payable metal in concentrate and doré |
|
|
|
|
|
|
Copper | tonnes | 4,081 | 5,071 |
| 13,042 | 16,394 |
Gold | oz | 54,962 | 30,941 |
| 131,307 | 85,928 |
Silver | oz | 302,946 | 244,338 |
| 784,630 | 678,929 |
Zinc 1 | tonnes | 12,714 | 21,619 |
| 50,813 | 75,323 |
1 Includes refined zinc metal and payable zinc in concentrate sold. | ||||||
All excess copper concentrate built up during the first half of 2022 due to limited railcar availability caused by winter transportation bottlenecks was sold during the third quarter. Sales of copper and zinc during the three and nine months ended September 30, 2022 were lower than the comparable periods in 2021 due to the closure of 777 in June 2022 as well as the above noted production interruptions. Final refined zinc metal sales were completed in August 2022 and the first zinc concentrate sale occurred in July 2022. Gold sales during the three and nine months ended September 30, 2022 were higher than the comparable period in 2021 as New Britannia only reached commercial production in September 2021.
FINANCIAL REVIEW
Financial Results
In the third quarter of 2022, we recorded a net loss of $8.1 million compared to a net loss of $170.4 million in the third quarter of 2021, representing a decrease in loss of $162.3 million. Year-to-date in 2022, we recorded a net profit of $87.8 million compared to a net loss of $233.9 million for the same period in 2021, representing an increase in profit of $321.7 million.
The following table provides further details on these variances:
| (in $ millions) | Three months ended September 30, 2022 | Nine months ended September 30, 2022 | ||||
| Increase (decrease) in components of profit or loss: | ||||||
| Revenues | (12.8 | ) | 63.4 | |||
| Cost of sales | ||||||
| Mine operating costs | (12.9 | ) | (62.6 | ) | ||
| Depreciation and amortization | (3.8 | ) | 9.8 | |||
| Impairment - environmental obligation | 147.3 | 147.3 | ||||
| Selling and administrative expenses | (1.1 | ) | 5.4 | |||
| Exploration expenses | 5.2 | (3.1 | ) | |||
| Environmental obligation adjustment | 6.6 | 142.1 | ||||
| Other expenses | 9.5 | 4.8 | ||||
| Impairment loss | - | (95.0 | ) | |||
| Net finance expense | 9.6 | 100.6 | ||||
| Tax expense | 14.7 | 9.0 | ||||
| Decrease in loss/increase in profit for the period | 162.3 | 321.7 |
Revenue
Revenue for the third quarter of 2022 was $346.2 million, $12.8 million lower than the same period in 2021, primarily as a result of lower copper prices and lower zinc sales volumes, partially offset by higher copper and gold sales volumes. We continue to see higher sales volumes of gold following the 2021 commencement of operations at the high-grade Pampacancha deposit in Peru and the copper-gold circuit at the New Britannia mill in Manitoba. Copper sales volumes increased in the third quarter of 2022, relative to the prior year primarily due to higher throughput and copper grades in Peru. Lower zinc sales volumes are a result of a reduction in overall zinc production due to the closure of 777 in Manitoba during June 2022, as well as lower zinc grades from Lalor as we continue to transition to mining of the gold lenses and away from base metal zones.
Revenue for the first nine months of 2022 was $1,140.2 million, $63.4 million higher than the same period in 2021, mainly due to higher realized zinc prices as well as higher copper and precious metal sales volumes. Offsetting these increases were lower zinc sales, due to the same reasons as the quarter-to-date variances described above.
The following table provides further details on these variances:
| (in $ millions) | Three months ended September 30, 2022 | Nine months ended September 30, 2022 | ||||
| Metals prices1 | ||||||
| Lower copper prices | (43.0 | ) | (10.5 | ) | ||
| Higher zinc prices | 3.7 | 45.8 | ||||
| Lower gold prices | (5.0 | ) | (6.5 | ) | ||
| Lower silver prices | (2.5 | ) | (10.3 | ) | ||
| Sales volumes | ||||||
| Higher copper sales volumes | 34.3 | 16.6 | ||||
| Lower zinc sales volumes | (28.1 | ) | (74.3 | ) | ||
| Higher gold sales volumes | 30.4 | 93.5 | ||||
| Higher silver sales volumes | 2.7 | 16.2 | ||||
| Other | ||||||
| Change in derivative mark-to-market on zinc | 0.3 | - | ||||
| Molybdenum and other volume and pricing differences | 4.0 | 0.8 | ||||
| Variable consideration adjustments | (2.3 | ) | (0.6 | ) | ||
| Effect of higher treatment and refining charges | (7.3 | ) | (7.3 | ) | ||
| (Decrease) increase in revenue in 2022 compared to 2021 | (12.8 | ) | 63.4 | |||
| 1 See discussion below for further information regarding metals prices. | ||||||
Our revenue by significant product type is summarized below:
| Three months ended | Nine months ended | |||||||||||
| (in $ millions) | Sep. 30, 2022 | Sep. 30, 2021 | Sep. 30, 2022 | Sep. 30, 2021 | ||||||||
| Copper | 194.8 | 201.6 | 634.5 | 625.5 | ||||||||
| Zinc | 44.1 | 67.7 | 199.3 | 227.2 | ||||||||
| Gold | 99.9 | 62.0 | 257.8 | 162.0 | ||||||||
| Silver | 6.6 | 6.0 | 22.0 | 19.7 | ||||||||
| Molybdenum | 18.7 | 12.8 | 36.9 | 26.9 | ||||||||
| Other metals | 0.2 | 1.9 | 4.7 | 6.1 | ||||||||
| Revenue from contracts | 364.3 | 352.0 | 1,155.2 | 1,067.4 | ||||||||
| Amortization of deferred revenue - gold | 8.4 | 13.6 | 31.6 | 27.7 | ||||||||
| Amortization of deferred revenue - silver | 9.2 | 9.9 | 30.2 | 26.6 | ||||||||
| Amortization of deferred revenue - variable consideration adjustments - prior periods | (2.3 | ) | - | 1.0 | 1.6 | |||||||
| Pricing and volume adjustments1 | (11.6 | ) | (2.0 | ) | (28.8 | ) | (4.8 | ) | ||||
| Treatment and refining charges | (21.8 | ) | (14.5 | ) | (49.0 | ) | (41.7 | ) | ||||
| Revenue | 346.2 | 359.0 | 1,140.2 | 1,076.8 | ||||||||
| 1 Pricing and volume adjustments represents mark-to-market adjustments on provisionally prices sales, realized and unrealized changes to fair value for non-hedge derivative contracts and adjustments to originally invoiced weights and assays. | ||||||||||||
For further detail on variable consideration adjustments, refer to note 16 of our consolidated interim financial statements.
Realized sales prices
This measure is intended to enable management and investors to understand the average realized price of metals sold to third parties in each reporting period. The average realized price per unit sold does not have any standardized meaning prescribed by IFRS, is unlikely to be comparable to similar measures presented by other issuers and should not be considered in isolation or a substitute for measures of performance prepared in accordance with IFRS.
For sales of copper, zinc, gold and silver we may enter into non-hedge derivatives ("QP hedges") which are intended to manage the provisional pricing risk arising from quotational period terms in concentrate sales agreements. The QP hedges are not removed from the calculation of realized prices. We expect that gains and losses on QP hedges will offset provisional pricing adjustments on concentrate sales contracts.
Our realized prices for the third quarter of 2022 and 2021, respectively, are summarized below:
| Realized prices1 for the | LME YTD 20222 | Realized prices1 for the | ||||
Three months ended | Nine months ended | ||||||
| LME QTD 20222 | Sep. 30, 2022 | Sep. 30, 2021 | Sep. 30, 2022 | Sep. 30, 2021 | ||
Prices |
|
|
|
|
|
|
|
Copper | $/lb | 3.51 | 3.47 | 4.26 | 4.12 | 4.07 | 4.14 |
Zinc3 | $/lb | 1.42 | 1.56 | 1.43 | 1.63 | 1.78 | 1.37 |
Gold4 | $/oz |
| 1,519 | 1,594 |
| 1,668 | 1,707 |
Silver4 | $/oz |
| 19.72 | 22.74 |
| 21.70 | 26.01 |
1 Realized prices exclude refining and treatment charges and are on the sale of finished metal or metal in concentrate. Realized prices include the effect of provisional pricing adjustments on prior period sales. | |||||||
2 London Metal Exchange average for copper and zinc prices. | |||||||
3 Includes sales of cast zinc metal and zinc concentrate. Zinc realized prices include premiums paid by customers for delivery of refined zinc metal, but exclude unrealized gains and losses related to non-hedge derivative contracts that are included in zinc revenues. Realized prices include the effect of provisional pricing adjustments on zinc concentrate. | |||||||
4 Sales of gold and silver from our 777 and Constancia mines are subject to our precious metals stream agreement with Wheaton, pursuant to which we recognize deferred revenue for precious metals deliveries and also receive cash payments. Stream sales are included within realized prices and their respective deferred revenue and cash payment rates can be found on page 31 of this MD&A. | |||||||

The following tables provide a reconciliation of average realized price per unit sold, by metal, to revenues as shown in the consolidated financial statements.
| Three months ended September 30, 2022 | |||||||||||||||||||||
| (in $ millions) 1 | Copper | Zinc | Gold | Silver | Molybdenum | Other | Total | ||||||||||||||
| Revenue from contracts 2 | 194.8 | 44.1 | 99.9 | 6.6 | 18.7 | 0.2 | 364.3 | ||||||||||||||
| Amortization of deferred revenue | - | - | 8.4 | 9.2 | - | - | 17.6 | ||||||||||||||
| Pricing and volume adjustments 3 | (5.0 | ) | (0.5 | ) | (6.6 | ) | 0.3 | 0.2 | - | (11.6 | ) | ||||||||||
| By-product credits 4 | 189.8 | 43.6 | 101.7 | 16.1 | 18.9 | 0.2 | 370.3 | ||||||||||||||
| Derivative mark-to-market 5 | - | - | - | - | - | - | - | ||||||||||||||
| Revenue, excluding mark-to-market on non-QP hedges | 189.8 | 43.6 | 101.7 | 16.1 | 18.9 | 0.2 | 370.3 | ||||||||||||||
| Payable metal in concentrate sold 6 | 24,799 | 12,714 | 66,932 | 816,416 | 511 | - | - | ||||||||||||||
| Realized price 7 | 7,654 | 3,429 | 1,519 | 19.72 | - | - | - | ||||||||||||||
| Realized price 8 | 3.47 | 1.56 | - | - | - | - | - | ||||||||||||||
| Nine months ended September 30, 2022 | |||||||||||||||||||||
| (in $ millions) 1 | Copper | Zinc | Gold | Silver | Molybdenum | Other | Total | ||||||||||||||
| Revenue from contracts 2 | 634.5 | 199.3 | 257.8 | 22.0 | 36.9 | 4.7 | 1,155.2 | ||||||||||||||
| Amortization of deferred revenue | - | - | 31.6 | 30.2 | - | - | 61.8 | ||||||||||||||
| Pricing and volume adjustments 3 | (15.6 | ) | - | (12.2 | ) | 0.3 | (1.3 | ) | - | (28.8 | ) | ||||||||||
| By-product credits 4 | 618.9 | 199.3 | 277.2 | 52.5 | 35.6 | 4.7 | 1,188.2 | ||||||||||||||
| Derivative mark-to-market 5 | - | 0.4 | - | - | - | - | 0.4 | ||||||||||||||
| Revenue, excluding mark-to-market on non-QP hedges | 618.9 | 199.7 | 277.2 | 52.5 | 35.6 | 4.7 | 1,188.6 | ||||||||||||||
| Payable metal in concentrate sold 6 | 69,058 | 50,813 | 166,159 | 2,419,179 | 931 | - | - | ||||||||||||||
| Realized price 7 | 8,962 | 3,930 | 1,668 | 21.70 | - | - | - | ||||||||||||||
| Realized price 8 | 4.07 | 1.78 | - | - | - | - | - | ||||||||||||||
1 Average realized price per unit sold may not calculate based on amounts presented in this table due to rounding.
2 As per financial statements.
3 Pricing and volume adjustments represents mark-to-market adjustments on provisionally priced sales, realized and unrealized changes to fair value for non-hedge derivative contracts and adjustments to originally invoiced weights and assays.
4 By-product credits subtotal is used in the calculated of cash cost per pound of copper and zinc produced, net of by-product credits. Cash cost per pound of copper and per ounce of gold produced, net of by-product credits, are non-IFRS financial performance measures with no standardized definition under IFRS. For further information and a detailed reconciliation, please see the discussion under the "Non-IFRS Financial Performance Measures" section of this MD&A.
5 Derivative mark-to-market excludes mark-to-market on QP hedges.
6 Copper, zinc and molybdenum shown in metric tonnes and gold and silver shown in ounces.
7 Realized price for copper, zinc and molybdenum in $/metric tonne and realized price for gold and silver in $/oz.
8 Realized price for copper and zinc in $/lb.
The price, quantity and mix of metals sold, affect our revenue, operating cash flow and profit. Revenue from metals sales can vary from quarter to quarter due to production levels, shipping volumes and transfer of risk and title to customers.
| Three months ended September 30, 2021 | |||||||||||||||||||||
| (in $ millions) 1 | Copper | Zinc | Gold | Silver | Molybdenum | Other | Total | ||||||||||||||
| Revenue from contracts 2 | 201.6 | 67.7 | 62.0 | 6.0 | 12.8 | 1.9 | 352.0 | ||||||||||||||
| Amortization of deferred revenue | - | - | 13.6 | 9.9 | - | - | 23.5 | ||||||||||||||
| Pricing and volume adjustments 3 | (3.1 | ) | - | 0.7 | - | 0.4 | - | (2.0 | ) | ||||||||||||
| By-product credits 4 | 198.5 | 67.7 | 76.3 | 15.9 | 13.2 | 1.9 | 373.5 | ||||||||||||||
| Derivative mark-to-market 5 | - | 0.3 | - | - | - | - | 0.3 | ||||||||||||||
| Revenue, excluding mark-to-market on non-QP hedges | 198.5 | 68.0 | 76.3 | 15.9 | 13.2 | 1.9 | 373.8 | ||||||||||||||
| Payable metal in concentrate sold 6 | 21,136 | 21,619 | 47,843 | 701,601 | 304 | - | - | ||||||||||||||
| Realized price 7 | 9,389 | 3,145 | 1,594 | 22.74 | - | - | - | ||||||||||||||
| Realized price 8 | 4.26 | 1.43 | - | - | - | - | - | ||||||||||||||
| Nine months ended September 30, 2021 | |||||||||||||||||||||
| (in $ millions) 1 | Copper | Zinc | Gold | Silver | Molybdenum | Other | Total | ||||||||||||||
| Revenue from contracts 2 | 625.5 | 227.2 | 162.0 | 19.7 | 26.9 | 6.1 | 1,067.4 | ||||||||||||||
| Amortization of deferred revenue | - | - | 27.7 | 26.6 | - | - | 54.3 | ||||||||||||||
| Pricing and volume adjustments 3 | (12.7 | ) | 0.6 | 0.5 | 0.3 | 6.5 | - | (4.8 | ) | ||||||||||||
| By-product credits 4 | 612.8 | 227.8 | 190.2 | 46.6 | 33.4 | 6.1 | 1,116.9 | ||||||||||||||
| Derivative mark-to-market 5 | - | 0.4 | - | - | - | - | 0.4 | ||||||||||||||
| Revenue, excluding mark-to-market on non-QP hedges | 612.8 | 228.2 | 190.2 | 46.6 | 33.4 | 6.1 | 1,117.3 | ||||||||||||||
| Payable metal in concentrate sold 6 | 67,241 | 75,323 | 111,431 | 1,788,868 | 853 | - | - | ||||||||||||||
| Realized price 7 | 9,115 | 3,029 | 1,707 | 26.01 | - | - | - | ||||||||||||||
| Realized price 8 | 4.14 | 1.37 | - | - | - | - | - | ||||||||||||||
1 Average realized price per unit sold may not calculate based on amounts presented in this table due to rounding.
2 As per financial statements.
3 Pricing and volume adjustments represents mark-to-market adjustments on provisionally priced sales, realized and unrealized changes to fair value for non-hedge derivative contracts and adjustments to originally invoiced weights and assays.
4 By-product credits subtotal is used in the calculated of cash cost per pound of copper and zinc produced, net of by-product credits. Cash cost per pound of copper and per ounce of gold produced, net of by-product credits, are non-IFRS financial performance measures with no standardized definition under IFRS. For further information and a detailed reconciliation, please see the discussion under the "Non-IFRS Financial Performance Measures" section of this MD&A.
5 Derivative mark-to-market excludes mark-to-market on QP hedges.
6 Copper, zinc and molybdenum shown in metric tonnes and gold and silver shown in ounces.
7 Realized price for copper, zinc and molybdenum in $/metric tonne and realized price for gold and silver in $/oz.
8 Realized price for copper and zinc in $/lb.
Stream Sales
The following table shows stream sales included within realized prices and their respective deferred revenue and cash payment rates:
|
| Three months ended | Nine months ended | ||
|
| Sep. 30, 2022 | Sep. 30, 2022 | ||
|
| Manitoba | Peru 4 | Manitoba | Peru 4 |
Gold | oz | 3,098 | 6,336 | 11,115 | 24,262 |
Silver | oz | 73,347 | 498,199 | 235,626 | 1,635,865 |
Gold deferred revenue drawdown rate1,2 | $/oz | 1,214 | 734 | 1,238 | 734 |
Gold cash rate3 | $/oz | 432 | 416 | 430 | 413 |
Total gold stream realized price | $/oz | 1,646 | 1,150 | 1,668 | 1,147 |
Silver deferred revenue drawdown rate1,2 | $/oz | 24.01 | 14.95 | 24.43 | 14.95 |
Silver cash rate3 | $/oz | 6.37 | 6.14 | 6.34 | 6.10 |
Total silver stream realized price | $/oz | 30.38 | 21.09 | 30.77 | 21.05 |
|
|
|
|
| |
| Three months ended | Nine months ended | |||
Sep. 30, 2021 | Sep. 30, 2021 | ||||
Manitoba | Peru | Manitoba | Peru | ||
Gold | oz | 5,880 | 8,159 | 14,151 | 12,156 |
Silver | oz | 98,442 | 484,279 | 256,585 | 1,125,533 |
Gold deferred revenue drawdown rate1,2 | $/oz | 1,253 | 762 | 1,264 | 806 |
Gold cash rate 3 | $/oz | 427 | 412 | 426 | 409 |
Total gold stream realized price | $/oz | 1,680 | 1,174 | 1,690 | 1,215 |
Silver deferred revenue drawdown rate1,2 | $/oz | 24.15 | 15.64 | 24.37 | 18.05 |
Silver cash rate 3 | $/oz | 6.30 | 6.08 | 6.28 | 6.04 |
Total silver stream realized price | $/oz | 30.45 | 21.72 | 30.65 | 24.09 |
1Subsequent to the variable consideration adjustment recorded on January 1, 2022, the deferred revenue amortization is recorded in Manitoba at C$1,584/oz gold and C$31.28/oz silver (September 30, 2021 - C$1,578/oz gold and C$30.38/oz silver) and converted to US dollars at the exchange rate in effect at the time of revenue recognition. A variable consideration adjustment was recorded on September 30, 2022 in Manitoba following a revised forecast for 777 in the third quarter of 2022, which indicated that substantially all of 777's precious metals reserves and inventory levels have been depleted.
2 Deferred revenue drawdown rates for gold and silver do not include variable consideration adjustments.
3 The gold and silver cash rate for Manitoba increased by 1% from $400/oz and $5.90/oz effective August 1, 2015. Subsequently every year, on August 1, the cash rate will increase by 1% compounded. The weighted average cash rate is disclosed. The gold and silver cash rate for Peru increased by 1% from $400/oz and $5.90/oz effective August 4, 2019. Subsequently every year, on August 4, the cash rate will increase by 1% compounded. The weighted average cash rate is disclosed.
4 Subsequent to the variable consideration adjustment recorded on January 1, 2022, the deferred revenue amortization is recorded in Peru at $734/oz gold and $14.95/oz silver. Effective May 1, 2021, the drawdown rate for the Peru stream agreement for gold was $762/oz and prior to May 1, 2021, the drawdown rate for Peru gold was $990/oz. Effective May 1, 2021, the drawdown rate for the Peru stream agreement for silver was $15.64/oz and prior to May 1, 2021 the drawdown rate for Peru silver was $21.86/oz.
Cost of Sales
Our detailed cost of sales is summarized as follows:
| (in $ thousands) | Three months ended | Nine months ended | ||||||||||
| Sep. 30, 2022 | Sep. 30, 2021 | Sep. 30, 2022 | Sep. 30, 2021 | |||||||||
| Peru | ||||||||||||
| Mining | 35,197 | 22,772 | 95,899 | 70,444 | ||||||||
| Milling | 52,043 | 44,750 | 144,429 | 128,356 | ||||||||
| Changes in product inventory | (2,497 | ) | (3,126 | ) | (15,663 | ) | (9,236 | ) | ||||
| Depreciation and amortization | 56,614 | 47,185 | 152,787 | 140,330 | ||||||||
| G&A | 13,405 | 13,979 | 48,180 | 45,380 | ||||||||
| Inventory adjustments | - | - | (558 | ) | (1,446 | ) | ||||||
| Freight, royalties and other charges | 14,645 | 10,462 | 38,390 | 32,448 | ||||||||
| Total Peru cost of sales | 169,407 | 136,022 | 463,464 | 406,276 | ||||||||
| Manitoba | ||||||||||||
| Mining | 40,659 | 54,634 | 154,592 | 163,769 | ||||||||
| Milling | 16,573 | 14,484 | 59,035 | 40,801 | ||||||||
| Zinc plant | - | 15,868 | 32,755 | 53,383 | ||||||||
| Changes in product inventory | 32,223 | 8,798 | 28,963 | 7,303 | ||||||||
| Depreciation and amortization | 33,197 | 38,825 | 105,420 | 127,667 | ||||||||
| Inventory adjustments | 2,074 | 5,445 | 4,104 | 5,445 | ||||||||
| G&A | 9,971 | 8,794 | 55,935 | 39,719 | ||||||||
| Past service pension cost | - | 4,229 | - | 4,229 | ||||||||
| Freight, royalties and other charges | 9,637 | 9,975 | 28,764 | 31,656 | ||||||||
| Total Manitoba cost of sales | 144,334 | 161,052 | 469,568 | 473,972 | ||||||||
| Cost of sales | 313,741 | 297,074 | 933,032 | 880,248 | ||||||||
Total cost of sales for the third quarter of 2022 was $313.7 million, reflecting an increase of $16.7 million from the third quarter of 2021. Peru cost of sales increased by $33.4 million in the third quarter of 2022, compared to the same period of 2021 as a result of increases in mining, milling, depreciation and freight costs. The increases in mining and milling costs were mainly driven by higher throughput as well as higher consumable costs. The increase to depreciation was mainly driven by the increase in tonnes mined and milled as well as higher contained metal in 2022 compared to the same quarter in 2021. Manitoba cost of sales decreased by $16.7 million in the third quarter of 2022, compared to the same period of 2021 as a result of the closure of the zinc plant in June 2022, decreases in depreciation and mining costs due to the closure of 777 and a reduction of past service costs. These decreases were partially offset by a significant drawdown of copper concentrate product inventory and higher milling costs at New Britannia.
Total cost of sales for the first three quarters of 2022 was $933.0 million, reflecting an increase of $52.8 million from the same period in 2021. Peru cost of sales increased by $57.2 million mainly driven by higher mining, milling, depreciation and freight costs, partially offset by a buildup of finished goods inventory. The increases in mining costs were primarily due to a higher strip ratio and higher diesel prices. The increases in milling costs were due to higher power prices as well as higher throughput. The increase to depreciation was mainly driven by mining of higher grade ore. Manitoba cost of sales decreased by $4.4 million as a result of a decrease in depreciation resulting from lower production following the closure of 777, as increasing real, long-term discount rates have reduced the overall provision and corresponding asset, along with decreases in zinc plant costs and 777 mining costs following their closure in June 2022. Partially offsetting these decreases was a significant drawdown of copper concentrate product inventory and increase in milling and G&A costs, mostly related to inflationary pressures on consumables and higher volumes of ore milled at New Britannia as well as increases in accrued employee profit sharing.
For details on unit operating costs refer to the respective tables in the "Operations Review" section of this MD&A.
For the third quarter of 2022, other significant variances in expenses from operations, compared to the same period in 2021, include the following:
- Environmental obligation adjustments increased by $6.6 million, largely as a result of gains on the revaluation of the environmental obligation on our non-producing sites in Manitoba due to changes in long-term real discount rates.
Given the long term nature of the reclamation cash flows, the related environmental provision is highly sensitive to changes in long-term risk-free discount rates and, as such, we may continue to experience significant quarterly closure cost provision revaluations.
- Other expenses decreased by $9.5 million compared to the same period in 2021. The decrease was primarily related to $11.1 million of decreased losses on disposal of property, plant and equipment and non-current assets and $4.9 million decrease in evaluation costs as costs related to Copper World have been capitalized since May 2022. Partially offsetting these impacts were increases of $4.3 million related care & maintenance costs for the Flin Flon concentrator and tailings impoundment area and $1.4 million in restructuring and closure activities for the Flin Flon complex.
For the year-to-date 2022, other significant variances in expenses from operations, compared to 2021, include the following:
- Environmental obligation adjustments increased by $142.1 million, largely as a result of gains on the revaluation of the environmental obligation on our non-producing sites in Manitoba. Specifically, an increase in long term risk-free discount rates resulted in a large decline in the closure cost provision.
- Impairment loss of $95.0 million, related to certain capitalized costs and assets associated with the previous stand-alone development plan for the Rosemont deposit, which were determined to no longer be recoverable.
- Exploration expenses increased by $3.1 million compared to the same period in 2021, reflecting new drilling programs in Peru and in the Flin Flon tailings area.
- Selling and administrative expenses decreased by $5.4 million compared to the same period in 2021. The decrease was primarily due to lower share based compensation expense as a result of the revaluation of previously issued share units to lower share prices during the current year compared to the prior year.
Net finance expense
| (in $ thousands) | Three months ended | Nine months ended | ||||||||||
| Sep. 30, 2022 | Sep. 30, 2021 | Sep. 30, 2022 | Sep. 30, 2021 | |||||||||
| Finance costs - accrued or payable: | ||||||||||||
| Interest expense on long-term debt | 16,921 | 19,300 | 50,730 | 57,837 | ||||||||
| Withholding taxes | 1,544 | 1,914 | 4,564 | 5,881 | ||||||||
| Tender premium on senior unsecured notes | - | - | - | 22,878 | ||||||||
| Loss (gain) on disposal of investments | - | - | 3,132 | (515 | ) | |||||||
| Other accrued/payable costs (income)1 | 984 | 2,009 | 4,616 | 6,060 | ||||||||
| Total finance costs - accrued or payable | 19,449 | 23,223 | 63,042 | 92,141 | ||||||||
| Finance costs - non-cash: | ||||||||||||
| Accretion on streaming agreements2 | 8,567 | 8,295 | 20,760 | 34,359 | ||||||||
| Change in fair value of financial assets and liabilities at fair value through profit or loss | (6,686 | ) | 162 | (5,888 | ) | 47,735 | ||||||
| Write off unamortized transaction costs | - | - | - | 2,480 | ||||||||
| Other non-cash costs3 | (735 | ) | (1,470 | ) | 3,852 | 5,657 | ||||||
| Total finance costs - non-cash | 1,146 | 6,987 | 18,724 | 90,231 | ||||||||
| Net finance expense | 20,595 | 30,210 | 81,766 | 182,372 | ||||||||
1 Includes interest income and other finance expense.
2 Includes variable consideration adjustment (prior periods).
3 Includes accretion on community agreements, accretion on Wheaton refund liability, unwinding of discount on provisions, and net foreign exchange losses (gains).
Net finance expense during the third quarter ended September 30, 2022, decreased by $9.6 million compared to the third quarter of 2021 due to a $3.8 million decrease in accrued finance costs and a $5.8 million decrease in non-cash finance costs.
This overall decrease was primarily driven by a $7.0 million increase in non-cash gains on the revaluation of the gold prepayment liability due to lower gold forward prices, a reduction in interest expense of $2.4 million mainly due to lower interest rates on our long term debt, a $1.8 million relative gain on foreign exchange, and a $1.3 million reduction in the accretion on streaming arrangements due to the closure of 777 in June 2022. This decrease was partially offset by a $1.3 million increase in accretion on environmental provisions.
Net finance expense during the first three quarters of 2022, decreased by $100.6 million compared to the same period in 2021 due to a $29.1 million decrease in accrued finance costs and a $71.5 million decrease in non-cash finance costs.
The reduction in net finance expense was primarily driven by the refinancing of senior unsecured notes in the third quarter of 2021. The prior year refinancing included a $49.8 million write-off of a non-cash embedded derivative on the early redemption option associated with our extinguished senior unsecured notes as well as a call premium of $22.9 million, with no corresponding charges recorded in 2022. In addition, we also incurred a $13.6 million reduction in the accretion on streaming arrangements due to a lower interest rate following the amended Peru streaming arrangement in the second quarter of 2021, a reduction in interest expense of $7.1 million mainly due to lower interest rates on our long term debt, a $5.9 million relative gain on foreign exchange, and a decrease of $5.5 million in revaluation losses on our equity investments. Offsetting these increases was a $3.6 million increase in losses on the disposal of certain public investments and $3.2 million increase in accretion on environmental provisions.
Tax Expense (Recovery)
For the three and nine months ended September 30, 2022, tax expense decreased by $14.7 million and increased by $9.0 million, respectively, compared to the same periods in 2021. The following table provides further details:
| (in $ thousands) | Three months ended | Nine months ended | ||||||||||
| Sep. 30, 2022 | Sep. 30, 2021 | Sep. 30, 2022 | Sep. 30, 2021 | |||||||||
| Deferred tax expense (recovery) - income tax 1 | 17,070 | 10,864 | 5,208 | (8,835 | ) | |||||||
| Deferred tax expense (recovery) - mining tax 1 | 727 | (2,840 | ) | 5,844 | 9,023 | |||||||
| Total deferred tax expense | 17,797 | 8,024 | 11,052 | 188 | ||||||||
| Current tax (recovery) expense - income tax | (8,804 | ) | 11,182 | 4,150 | 14,064 | |||||||
| Current tax (recovery) expense - mining tax | (1,121 | ) | 3,375 | 7,077 | 17,051 | |||||||
| Total current tax (recovery) expense | (9,925 | ) | 14,557 | 11,227 | 31,115 | |||||||
| Tax expense | 7,872 | 22,581 | 22,279 | 31,303 | ||||||||
1 Deferred tax expense (recovery) represents our draw down/increase of non-cash deferred income and mining tax assets/liabilities.
Income Tax Expense/Recovery
Applying the estimated Canadian statutory income tax rate of 26.3% to our profit before taxes of $110.1 million for the year-to-date of 2022 would have resulted in a tax expense of approximately $29.0 million; however, we recorded an income tax expense of $9.4 million. The significant items causing our effective income tax rate to be different than the 26.3% estimated Canadian statutory income tax rate include:
- Deductible temporary differences with respect to Peru and Manitoba, relating to the decommissioning and restoration liabilities, were recognized as we have determined that it is probable that we will realize the recovery of these deferred tax assets based on the timing of the reversals of the deductible temporary differences and the future projected taxable profit of the Manitoba and Peru operations. This resulted in a combined deferred tax recovery of $43.4 million.
- Temporary income tax differences not recognized as we have determined that it is not probable that we will realize the recovery of these deferred tax assets. This resulted in a deferred tax expense of $3.4 million.
- Foreign exchange on the translation of deferred tax balances to group currency resulted in a deferred tax expense of $16.6 million.
- The tax expense with respect to our foreign operations are recorded using an income tax rate other than the Canadian statutory income tax rate of 26.3%, resulting in a tax expense of $6.6 million.
- The recognition of previously unrecognized deferred tax assets resulted in a deferred tax recovery of $4.0 million.
Mining Tax Expense
Applying the estimated Manitoba mining tax rate of 10.0% to our profit before taxes of $110.1 million for the third quarter of 2022 would have resulted in a tax expense of approximately $11.0 million; however, we recorded a mining tax expense of $12.9 million. Effective mining tax rates can vary significantly based on the composition of our earnings and the expected amount of mining taxable profits. Corporate costs and other costs not related to mining operations are not deductible in computing mining profits. A brief description of how mining taxes are calculated in our various business units is discussed below.
Manitoba
The Province of Manitoba imposes mining tax on profit related to the sale of mineral products mined in the Province of Manitoba (mining taxable profit) at the following rates:
- 10% of total mining taxable profit if mining profit is C$50 million or less;
- Between mining profit of C$50 and $C55 million, mining tax is equal to a minimum of C$5 million plus mining profit less C$50 million multiplied by 65%;
- 15% of total mining taxable profit if mining profits are between C$55 million and C$100 million;
- Between mining profit of C$100 million and C$105 million, mining tax is equal to a minimum of C$15 million plus mining profit less C$100 million multiplied by 57%; and
- 17% of total mining taxable profit if mining profits exceed C$105 million.
We estimate that the tax rate that will be applicable when temporary differences reverse will be approximately 10.0%.
Peru
The Peruvian government imposes two parallel mining tax regimes, the Special Mining Tax and the Modified Royalty, on companies' operating mining income on a sliding scale, with progressive rates ranging from 2.0% to 8.4% and 1.0% to 12.0%, respectively. Based on financial forecasts, we have recorded a deferred tax liability as at September 30, 2022, at the tax rate we expect to apply when temporary differences reverse.
LIQUIDITY AND CAPITAL RESOURCES
Senior Unsecured Notes
We have $600.0 million aggregate principal amount of 4.5% senior notes due April 2026 and $600.0 million aggregate principal amount of 6.125% senior notes due April 2029.
Senior Secured Revolving Credit Facilities and Surety Bonds
We have two senior secured revolving credit facilities ("the Credit Facilities") for our Canadian and Peruvian businesses, with combined total availability of $450.0 million and substantially similar terms and conditions. As at September 30, 2022, our liquidity includes $286.1 million in cash as well as undrawn availability of $368.7 million under our Credit Facilities. As at September 30, 2022, we were in compliance with our covenants under the Credit Facilities and had drawn $81.3 million in letters of credit under the Credit Facilities.
As at September 30, 2022, the Arizona business unit had $12.8 million in surety bonds issued to support future reclamation and closure obligations. The Peru business unit also had $107.4 million in letters of credit issued with various Peruvian financial institutions to support future reclamation and other operating matters. No cash collateral is required to be posted under these letters of credit or surety bonds.
C$130 Million Bilateral Letter of Credit Facility
On August 22, 2022, we closed a C$130.0 million bilateral letter of credit facility ("LC Facility") with a major Canadian financial institution. The LC Facility enhances our liquidity position by enabling the Company to issue up to C$130.0 million of letters of credit to beneficiaries on an unsecured basis at attractive rates, with a further C$30.0 million sub-limit for financial letters of credit. This new facility was permitted under the existing terms the Credit Facilities and has no financial covenants. There have been no letters of credit drawn under this LC Facility.
Financial Condition
Financial Condition as at September 30, 2022 compared to December 31, 2021
Cash increased by $15.1 million during the first nine months of the year to $286.1 million as at September 30, 2022. This increase was mainly the result of cash flow from operating activities of $401.4 million. Offsetting these cash inflows were cash outflows from investing and financing of $253.8 million from capital investments and community agreements primarily at our Peru and Manitoba operations, partial repayment of our gold prepayment liability of $54.3 million, interest payments of $31.9 million, lease payments of $29.2 million, $10.0 million for a scheduled payment related to the Rosemont acquisition, other finance payments of $9.2 million as well as dividends of $4.0 million. We hold the majority of our cash in low-risk, liquid investments with major Canadian and Peruvian financial institutions.
Working capital decreased by $47.7 million to $99.8 million from December 31, 2021 to September 30, 2022, primarily due to a decrease in trade and other receivables of $143.9 million mainly due to timing and changes in provisionally priced receivables and a decrease in inventory of $24.4 million due to a drawdown of finished goods inventory at our Manitoba operations. Offsetting these items was an decrease in other liabilities of $29.3 million mainly due to changes in decommissioning and restoration liabilities, a decrease in deferred revenue liabilities of $21.2 million due to the closure of 777 in June 2022, changes to other financial assets and liabilities as a result of the revaluation of non-hedge derivatives that resulted in an increase in working capital of $18.6 million, an increase in cash of $15.1 million, a decrease in lease liabilities of $12.9 million and an increase in taxes receivable of $9.8 million.
Cash Flows
The following table summarizes our cash flows for the three and nine months ended September 30, 2022 and September 30, 2021:
| (in $ thousands) | Three months ended | Nine months ended | ||||||||||
| Sep. 30, 2022 | Sep. 30, 2021 | Sep. 30, 2022 | Sep. 30, 2021 | |||||||||
| Operating cash flow before change in non-cash working capital | 81,617 | 103,509 | 282,581 | 326,945 | ||||||||
| Change in non-cash working capital | 90,891 | 36,289 | 118,840 | (38,978 | ) | |||||||
| Cash generated from operating activities | 172,508 | 139,798 | 401,421 | 287,967 | ||||||||
| Cash used in investing activities | (113,970 | ) | (88,893 | ) | (248,556 | ) | (270,654 | ) | ||||
| Cash used in financing activities | (31,531 | ) | (47,769 | ) | (137,720 | ) | (157,386 | ) | ||||
| Effect of movement in exchange rates on cash | 554 | 28 | (17 | ) | (1,611 | ) | ||||||
| Increase (decrease) in cash | 27,561 | 3,164 | 15,128 | (141,684 | ) | |||||||
Cash Flow from Operating Activities
Cash generated from operating activities was $172.5 million during the third quarter of 2022, an increase of $32.7 million compared with the same period in 2021. Operating cash flow before change in non-cash working capital was $81.6 million during the third quarter of 2022, reflecting a decrease of $21.9 million compared to the third quarter of 2021. The decrease in operating cash flows before changes in working capital is mostly attributable to lower copper prices, higher mine operating costs due to inflationary pressures on input costs and lower zinc sales volumes given the closure of 777 in June 2022, partially offset by higher copper and gold sales volumes.
Year-to-date cash generated from operating activities was $401.4 million in 2022, an increase of $113.5 million compared to 2021. Operating cash flow before changes in non-cash working capital for the third quarter of 2022 was $282.6 million, a decrease of $44.4 million compared to 2021. The decrease in operating cash flow before changes in working capital is mostly attributable to the timing of current tax payments, which increased by $20.7 million compared to the first three quarters of 2021, higher mine operating costs due to inflationary pressures on input costs and higher profit sharing and lower zinc sales volumes partially offset by higher gold sales volumes.
The increase in cash generated from changes in non-cash working capital is mostly the result of decreases in other net financial assets, receivables and inventories as at September 30, 2022 compared to previous periods.
Cash Flow from Investing and Financing Activities
During the third quarter of 2022, we spent $145.5 million in investing and financing activities, primarily driven by $89.5 million in capital expenditures, $29.5 million in community agreements, $17.1 million in partial settlement of our gold prepayment liability, $9.4 million in capitalized lease payments and $3.0 million in other finance payments.
Year-to-date, we used $386.3 million of cash in investing and financing activities, primarily driven by $220.1 million of capital expenditures, $33.6 million in community agreements, $54.3 million in partial settlement of our gold prepayment liability, $31.9 million of interest payments, $29.2 million in capitalized lease payments, $10.0 million for a scheduled payment related to the Rosemont acquisition, $9.2 million of financing costs mainly related to withholding taxes on our debt obligations and our revolving credit facilities and $4.0 million in dividend payments.
Capital Expenditures
The following summarizes accrued and cash additions to capital assets for the periods indicated:
| Three months ended | Nine months ended | Guidance | |||||||||||||
| Sep. 30, 2022 | Sep. 30, 2021 | Sep. 30, 2022 | Sep. 30, 2021 | Annual | |||||||||||
| (in $ millions) | 2022 | ||||||||||||||
| Manitoba sustaining capital expenditures | 31.6 | 23.5 | 99.0 | 77.9 | 115.0 | ||||||||||
| Peru sustaining capital expenditures 1 | 28.8 | 38.9 | 77.0 | 83.9 | 105.0 | ||||||||||
| Total sustaining capital expenditures | 60.4 | 62.4 | 176.0 | 161.8 | 220.0 | ||||||||||
| Arizona capitalized costs 2 | 12.0 | 6.1 | 27.1 | 12.6 | 40.0 | ||||||||||
| Peru growth capitalized expenditures | 1.3 | 2.0 | 1.5 | 23.1 | 10.0 | ||||||||||
| Manitoba growth capitalized expenditures | 6.9 | 21.0 | 24.4 | 97.2 | 50.0 | ||||||||||
| Other capitalized costs | 1.2 | 2.7 | 3.8 | 17.0 | - | ||||||||||
| Capitalized exploration 2 | 13.2 | 1.4 | 23.6 | 3.4 | 40.0 | ||||||||||
| Total other capitalized expenditures | 34.6 | 33.2 | 80.4 | 153.3 | |||||||||||
| Total capital additions | 95.0 | 95.6 | 256.4 | 315.1 | |||||||||||
| Reconciliation to cash capital additions: | |||||||||||||||
| Right-of-use asset additions | (5.8 | ) | (9.8 | ) | (26.1 | ) | (32.5 | ) | |||||||
| Community agreement additions, net | 2.6 | (3.2 | ) | - | (23.3 | ) | |||||||||
| Change in capital accruals and other | (2.3 | ) | 4.8 | (10.2 | ) | (9.8 | ) | ||||||||
| Acquisition of property, plant & equipment - cash | 89.5 | 87.4 | 220.1 | 249.5 | |||||||||||
1 Peru sustaining capital expenditures includes capitalized stripping costs.
2 In August 2022 Arizona capital expenditure guidance has increased by $20 million, which includes an additional $15 million in capitalized exploration and $5 million in capitalized costs.
For the three and nine months ended September 30, 2022, total capital additions declined by 1% and 19%, respectively, compared to the same periods in 2021 as a result of lower growth spending in Manitoba and lower Peru sustaining capital expenditures partially offset by higher sustaining capital expenditures in Manitoba.
Sustaining capital expenditures in Manitoba for the three and nine months ended September 30, 2022 were $31.6 million and $99.0 million, respectively, representing increases of $8.1 million and $21.1 million compared to the same period in 2021. The increase in year-to-date sustaining capital expenditures were mainly due to higher planned capital development and lease additions at Stall & New Britannia, partially offset by the cessation of capitalizing development costs at 777 given its closure.
Sustaining capital expenditures in Peru for the three and nine months ended September 30, 2022 were $28.8 million and $77.0 million, respectively, representing a decrease of $10.1 million and $6.9 million compared to the same period in 2021. The decreased expenditures mainly relate to lower spending on the tailings management facility expansion partially offset by increased capitalized stripping at Pampacancha.
Growth capital spending in Manitoba for the three and nine months ended September 30, 2022 were $6.9 million and $24.4 million, respectively, reflecting expenditures for the Lalor expansion and recovery improvement projects at both New Britannia and Stall. Compared to the same quarter of 2021, growth capital expenditures decreased by $14.1 million and $72.8 million, respectively, as the comparative period included significant costs related to the New Britannia refurbishment project, which was completed in the fourth quarter of 2021.
Growth capital expenditures in Peru for the three and nine months ended September 30, 2022 were $1.3 million and $1.5 million, respectively, representing decreases of $0.7 million and $21.6 million compared to the same periods in 2021. The decrease in year-to-date growth capital expenditures was caused by costs incurred in the comparative period to bring Pampacancha to commercial production in the second quarter of 2021.
Arizona's growth capital expenditures for the three and nine months ended September 30, 2022 were $12.0 million and $27.1 million, respectively, and relate primarily to pre-feasibility study costs associated with Copper World.
Other capitalized costs for the three and nine months ended September 30, 2022 were $1.2 million and $3.8 million, respectively, which are mostly made up of non-cash capitalized costs.
We expect consolidated sustaining and growth capital expenditures in 2022 to be approximately $20 million lower than our full year guidance, reflecting $30 million of discretionary spending reductions across the business, as mentioned earlier, partially offset by approximately $10 million in higher expected sustaining capital expenditures in Manitoba due to continued inflationary cost pressures.

Capital Commitments
As at September 30, 2022, we had outstanding capital commitments in Canada of approximately $18.9 million, of which $18.1 million can be terminated, approximately $33.9 million in Peru primarily related to exploration option agreements, all of which can be terminated, and approximately $44.6 million in Arizona, primarily related to our Copper World project, of which approximately $8.3 million can be terminated.
We expect that our financing costs will increase as we anticipate increasing the letters of credit and/or surety bonds required to support Manitoba's recently updated closure plans.
Contractual Obligations
The following table summarizes our significant contractual obligations as at September 30, 2022:
| Less than 12 months | 13 - 36 months | 37 - 60 months | More than 60 months | |
Payment Schedule (in $ millions) | Total | ||||
Long-term debt obligations1 | 1,579.6 | 67.5 | 135.0 | 703.6 | 673.5 |
Gold prepayment obligation2 | 80.3 | 64.5 | 15.8 | - | - |
Lease obligations | 127.5 | 43.8 | 51.3 | 15.7 | 16.7 |
Purchase obligation - capital commitments | 97.4 | 38.2 | 16.5 | 35.2 | 7.5 |
Purchase obligation - other commitments3 | 1,033.2 | 347.0 | 380.1 | 142.1 | 164.0 |
Pension and other employee future benefits obligations2 | 125.7 | 10.7 | 9.0 | 4.9 | 101.1 |
Community agreement obligations4, 5 | 52.3 | 7.4 | 6.8 | 5.6 | 32.5 |
Decommissioning and restoration obligations5 | 406.8 | 8.2 | 7.0 | 7.3 | 384.3 |
Total | 3,502.8 | 587.3 | 621.5 | 914.4 | 1,379.6 |
1 Long-term debt obligations include scheduled interest payments, as well as principal repayments.
2 Discounted.
3 Primarily made up of long-term agreements with operational suppliers, obligations for power purchase, concentrate handling, fleet and port services, as well as deferred consideration arising from the acquisition of Rosemont's minority interest.
4 Represents community agreement obligations and various finalized land user agreements, including Pampacancha.
5 Undiscounted before inflation.
In addition to the contractual obligations included in the above payment schedule, we also have the following commitments which impact our financial position:
- A profit-sharing plan with most Manitoba employees;
- A profit-sharing plan with all Peru employees;
- Wheaton precious metals stream agreements for 777 and the Constancia mines;
- A net smelter returns royalty agreement related to 777; and,
- Government royalty payments related to the Constancia mines.
Outstanding Share Data
As of November 1, 2022, the final trading day prior to the date of this MD&A, there were 261,903,151 common shares of Hudbay issued and outstanding. In addition, there were 1,667,343 stock options outstanding.
TREND ANALYSIS AND QUARTERLY REVIEW
A detailed quarterly and annual summary of financial and operating performance can be found in the "Summary of Results" section at the end of this MD&A. The following table sets forth selected consolidated financial information for each of our eight most recently completed quarters:
| (in $ millions, except per share amounts, production on a copper equivalent basis and average realized copper price) | 2021 | 2020 | ||||||||||||||||||||||
| 2022 | ||||||||||||||||||||||||
| Q3 | Q2 | Q1 | Q4 | Q33 | Q2 | Q1 | Q4 | |||||||||||||||||
| Production on a copper equivalent basis (tonnes) | 42,099 | 46,332 | 45,085 | 50,685 | 42,243 | 39,289 | 43,246 | 47,343 | ||||||||||||||||
| Average realized copper price ($/lb) | 3.47 | 4.28 | 4.53 | 4.34 | 4.26 | 4.40 | 3.69 | 3.29 | ||||||||||||||||
| Revenue | 346.2 | 415.5 | 378.6 | 425.2 | 359.0 | 404.2 | 313.6 | 322.3 | ||||||||||||||||
| Gross profit (loss) | 32.4 | 89.5 | 85.3 | 81.7 | (85.4 | ) | 82.2 | 52.5 | 34.4 | |||||||||||||||
| Profit (loss) before tax | (0.3 | ) | 21.5 | 88.9 | (0.2 | ) | (147.8 | ) | 14.8 | (69.6 | ) | 0.9 | ||||||||||||
| Profit (loss) | (8.1 | ) | 32.1 | 63.8 | (10.5 | ) | (170.4 | ) | (3.4 | ) | (60.1 | ) | 7.4 | |||||||||||
| Adjusted net earnings (loss)1,3 | (12.4 | ) | 30.5 | 5.2 | 32.7 | 0.9 | 5.4 | (16.1 | ) | (16.4 | ) | |||||||||||||
| Earnings (loss) per share: | ||||||||||||||||||||||||
| Basic and diluted | (0.03 | ) | 0.12 | 0.24 | (0.04 | ) | (0.65 | ) | (0.01 | ) | (0.23 | ) | 0.03 | |||||||||||
| Adjusted net earnings (loss)1,3 per share | (0.05 | ) | 0.12 | 0.02 | 0.13 | 0.00 | 0.02 | (0.06 | ) | (0.06 | ) | |||||||||||||
| Operating cash flow2 | 81.6 | 123.9 | 77.1 | 156.9 | 103.5 | 132.8 | 90.7 | 86.1 | ||||||||||||||||
| Adjusted EBITDA1 | 99.3 | 141.4 | 110.2 | 180.3 | 119.3 | 143.2 | 104.2 | 106.9 | ||||||||||||||||
1 Adjusted net earnings (loss), adjusted net earnings (loss) per share, and adjusted EBITDA are non-IFRS financial performance measure with no standardized definition under IFRS. For further information and a detailed reconciliation, please see the discussion under the "Non-IFRS Financial Performance Measures" section of this MD&A.
2 Operating cash flow before changes in non-cash working capita
3 The adjusted net earnings (loss) and adjusted net earnings (loss) per share in respect of the third quarter of 2021 were adjusted in our management's discussion and analysis of financial results for the year ended December 31, 2021 due to a change in the computed tax effect on certain adjustments. The adjusted net earnings changed from $38.2 million to an adjusted net earnings of $0.9 million and the adjusted net earnings per share changed from $0.15/share to an adjusted net earnings per share of $0.00/share.
Commodity prices have continued to experience declines during the third quarter of 2022 while growing inflationary pressures have contributed to higher mine operating costs resulting in declines in our key financial metrics during the quarter. Third quarter results were also impacted by lower production due to the closure of 777 in June 2022 and the commencement of care and maintenance activities, which will continue for the next several years. Relatively small movements in real, long-term discount rates will continue to impact the revaluation of our environmental provisions for closed sites in Manitoba and these movements will be reflected through the income statement.
The second quarter results for 2022 were impacted by a revaluation gain of $60.7 million pertaining mostly to the environmental obligation on our Flin Flon site due to increases in long-term risk-free interest rates. A pre-tax impairment loss of $95.0 million was recorded following the release of the Copper World Preliminary Economic Assessment in June 2022 as certain assets associated with the previous, stand-alone development plan for the Rosemont deposit are no longer expected to be recoverable.
Results in the first quarter of 2022 benefited from a trend of higher realized base metal prices, but were also impacted by rising operating costs caused by inflation. While we achieved increased gold production from the higher grade Pampacancha deposit and the higher recovery New Britannia gold mill, we experienced increased levels of COVID-19 related absenteeism in the workforce, impacting production, and also experienced limited availability of rail cars leading to reduced sales and an inventory build-up. The first quarter results were also impacted by a revaluation gain of $78.2 million pertaining mostly to the environmental obligation on our Flin Flon site and $1.7 million for our non-producing sites in Manitoba caused by an increase in long-term risk-free interest rates.
Results for the fourth quarter of 2021 benefited from higher realized metal prices. This strength in commodity prices combined with higher gold production following the commencement of commercial production at New Britannia and improving copper recoveries led to record revenue of $425.2 million during the quarter. Adjusted EBITDA and operating cash flow both reached record highs. Notwithstanding these records, continued inflationary pressures along with lower copper grades caused operating costs to climb and put pressure on gross margins, compared to earlier quarters. A revaluation of our environmental obligation for the Flin Flon closure plan resulted in a $46.2 million non-cash charge, which negatively impacted net income for the quarter.
During the third quarter of 2021, increasing base metal prices contributed to strong revenues and operating cash flow. Mining at Pampacancha continued to ramp-up, contributing significantly to gold production during the quarter. As a result of the planned closure of Flin Flon operations in mid-2022 and an updated Flin Flon closure plan, non-cash charges totaling $156.3 million were incurred, which negatively impacted gross profit for the quarter. In Peru, ongoing COVID-19 costs, along with lower copper grades, put pressure on operating costs.
Financial results in the second quarter of 2021 benefited from initial production at the Pampacancha pit but were negatively impacted by higher operating costs in Peru and lower Manitoba metal production caused by COVID-19 related impacts as well as lower copper and zinc grades and lower precious metal recoveries.
The first quarter of 2021 saw lower revenues compared to the fourth quarter of 2020 due to a delayed Peru shipment for which revenue could not be recognized, and lower sales volumes from Manitoba related to a buildup of finished goods inventory during the quarter as a result of a lack of rail car availability. third quarter results were negatively impacted by $75.2 million of various finance expenses related to the refinancing of our senior notes.
Following the sharp correction in commodity prices after the initial outbreak of the COVID-19 pandemic in early 2020, commodity prices rose steadily into 2021 providing a tailwind to our operating results. Earnings in the fourth quarter of 2020 were negatively impacted by the 777 production interruption which resulted in $11.7 million in certain overhead costs being expensed through cost of sales.
For information on previous trends and quarterly reviews, refer to our MD&A for the year ended December 31, 2021, dated February 23, 2022 and available on SEDAR at www.sedar.com.
NON-IFRS FINANCIAL PERFORMANCE MEASURES
Adjusted net earnings (loss), adjusted net earnings (loss) per share, adjusted EBITDA, net debt, cash cost, sustaining and all-in sustaining cash cost per pound of copper produced, cash cost and sustaining cash cost per ounce of gold produced and combined unit cost are non-IFRS performance measures. These measures do not have a meaning prescribed by IFRS and are therefore unlikely to be comparable to similar measures presented by other issuers. These measures should not be considered in isolation or as a substitute for measures prepared in accordance with IFRS and are not necessarily indicative of operating profit or cash flow from operations as determined under IFRS. Other companies may calculate these measures differently.
Management believes adjusted net earnings (loss) and adjusted net earnings (loss) per share provides an alternate measure of the Company's performance for the current period and gives insight into its expected performance in future periods. These measures are used internally by the Company to evaluate the performance of its underlying operations and to assist with its planning and forecasting of future operating results. As such, the Company believes these measures are useful to investors in assessing the Company's underlying performance. We provide adjusted EBITDA to help users analyze our results and to provide additional information about our ongoing cash generating potential in order to assess our capacity to service and repay debt, carry out investments and cover working capital needs. Net debt is shown because it is a performance measure used by the Company to assess our financial position. Cash cost, sustaining and all-in sustaining cash cost per pound of copper produced are shown because we believe they help investors and management assess the performance of our operations, including the margin generated by the operations and the Company. Cash cost and sustaining cash cost per ounce of gold produced are shown because we believe they help investors and management assess the performance of our Manitoba operations. Combined unit cost is shown because we believe it helps investors and management assess our cost structure and margins that are not impacted by variability in by-product commodity prices.
During 2021 and 2022, there were non-recurring adjustments for Arizona and Manitoba operations, including severance, past service pension costs, disposals of certain non-current assets, and inventory supplies write-downs as well as non-cash impairment charges related to an updated Flin Flon closure plan and lower long-term discount rates in the fourth quarter of 2021, none of which management believes are indicative of ongoing operating performance and therefore are adjusting items in the calculations of adjusted net earnings (loss) and adjusted EBITDA.
Cash cost and sustaining cash cost per pound of zinc produced was a previously disclosed non-IFRS measure, most recently published in our MD&A for the year ended December 31, 2021, dated February 23, 2022. With the closure of 777 and Flin Flon operations, including the zinc plant, in the second quarter of 2022, the production profile of Manitoba has shifted from zinc to gold and therefore we have ceased providing this measure on a go forward basis.
In the first and second quarter of 2022, we recorded a non-cash gain of $79.9 million and $60.7 million, respectively, mostly related to the quarterly revaluation of our Flin Flon environmental provision, which was impacted by rising long-term risk-free discount rates. With the closure of 777 and Flin Flon operations in the second quarter of 2022 and given the long-term nature of the reclamation cash flows, quarterly revaluation of the corresponding environmental provision remains highly sensitive to changes in real, long-term risk-free discount rates and, as such, we expect to continue to experience quarterly environmental provision revaluations, which is not indicative of our ongoing operating performance. This item has been included prospectively in our calculation of adjusted earnings.
Adjusted Net Earnings (Loss)
Adjusted net earnings (loss) represents net earnings (loss) excluding certain impacts, net of taxes, such as mark-to-market adjustments, impairment charges and reversal of impairment charges, write-down of assets, and foreign exchange (gain) loss. These measures are not necessarily indicative of net earnings (loss) or cash flows as determined under IFRS.
The following table provides a reconciliation of earnings (loss) per the consolidated interim income statements, to adjusted net earnings (loss) for the three and nine months ended September 30, 2022 and 2021.
| Three months ended | Nine months ended | |||||||||||
| (in $ millions) | Sep. 30, 2022 | Sep. 30,2021 | Sep. 30, 2022 | Sep. 30, 2021 | ||||||||
| (Loss) profit for the period | (8.1 | ) | (170.4 | ) | 87.8 | (233.9 | ) | |||||
| Tax expense | 7.8 | 22.6 | 22.3 | 31.3 | ||||||||
| (Loss) profit before tax | (0.3 | ) | (147.8 | ) | 110.1 | (202.6 | ) | |||||
| Adjusting items: | ||||||||||||
| Mark-to-market adjustments 1 | (4.2 | ) | 1.7 | (7.7 | ) | 53.4 | ||||||
| Foreign exchange (gain) loss | (4.8 | ) | (3.1 | ) | (5.6 | ) | 0.4 | |||||
| Inventory adjustments | 2.1 | 5.4 | 3.5 | 4.0 | ||||||||
| Variable consideration adjustment - stream revenue and accretion | 3.9 | - | (1.9 | ) | (1.0 | ) | ||||||
| Impairment losses | - | 147.3 | 95.0 | 147.3 | ||||||||
| Environmental obligation adjustments 2 | (6.4 | ) | - | (147.0 | ) | - | ||||||
| Evaluation expenses | 0.1 | - | 7.8 | - | ||||||||
| Insurance recovery | - | - | (5.7 | ) | - | |||||||
| Write-down of unamortized transaction costs | - | - | - | 2.5 | ||||||||
| Premium paid on redemption of notes | - | - | - | 22.9 | ||||||||
| Restructuring charges - Manitoba 3 | 5.1 | 3.6 | 9.5 | 3.6 | ||||||||
| Loss on disposal of investments | - | - | 3.1 | - | ||||||||
| Past service pension cost | - | 4.2 | - | 4.2 | ||||||||
| (Gain) loss on disposal of plant and equipment and non-current assets - Manitoba & Arizona | (6.0 | ) | 5.4 | (6.8 | ) | 5.4 | ||||||
| Adjusted (loss) earnings before income taxes | (10.5 | ) | 16.7 | 54.3 | 40.1 | |||||||
| Tax expense | (7.8 | ) | (22.6 | ) | (22.3 | ) | (31.3 | ) | ||||
| Tax impact of adjusting items | 5.9 | 6.8 | (8.6 | ) | (18.5 | ) | ||||||
| Adjusted net (loss) earnings | (12.4 | ) | 0.9 | 23.4 | (9.7 | ) | ||||||
| Adjusted net (loss) earnings ($/share) | (0.05 | ) | - | 0.09 | (0.04 | ) | ||||||
| Basic weighted average number of common shares outstanding (millions) | 261.9 | 261.5 | 261.8 | 261.4 | ||||||||
1 Includes changes in fair value of the gold prepayment liability, Canadian junior mining investments, other financial assets and liabilities at fair value through profit or loss and share-based compensation (recoveries) expenses.
2 Changes from movements to environmental obligation closure estimates are primarily related to the Flin Flon operations, which were fully depreciated as of June 30, 2022, as well as other Manitoba non-operating sites.
3 Includes closure costs for Flin Flon operations.
After adjusting reported net earnings for those items not considered representative of the Company's core business or indicative of future operations, the Company had an adjusted net loss in the third quarter of 2022 of $12.4 million or $0.05 earnings per share.
Adjusted EBITDA
Adjusted EBITDA is profit or loss before net finance expense/income, tax expense/recoveries, depreciation and amortization of property, plant and equipment and deferred revenue, as well as certain other adjustments. We calculate adjusted EBITDA by excluding certain adjustments included within our adjusted net earnings measure which we believe reflects the underlying performance of our core operating activities. The measure also removes the impact of non-cash items and financing costs that are not associated with measuring the underlying performance of our operations. However, our adjusted EBITDA is not the measure defined as EBITDA under our senior notes or revolving credit facilities and may not be comparable with performance measures with the same name reported by other companies. Adjusted EBITDA should not be considered as a substitute for profit or loss or as a better measure of liquidity than operating cash flow, which are calculated in accordance with IFRS. We provide adjusted EBITDA to help users analyze our results and to provide additional information about our ongoing cash generating potential in order to assess our capacity to service and repay debt, carry out investments and cover working capital needs.
The following table presents the reconciliation of earnings (loss) per the consolidated interim income statements, to adjusted EBITDA for the three and nine months ended September 30, 2022 and 2021:
| Three months ended | Nine months ended | |||||||||||
| (in $ millions) | Sep. 30, 2022 | Sep. 30, 2021 | Sep. 30, 2022 | Sep. 30, 2021 | ||||||||
| (Loss) profit for the period | (8.1 | ) | (170.4 | ) | 87.8 | (233.9 | ) | |||||
| Add back: | ||||||||||||
| Tax expense | 7.8 | 22.6 | 22.3 | 31.3 | ||||||||
| Net finance expense | 20.6 | 30.2 | 81.8 | 182.4 | ||||||||
| Other expense | 6.3 | 15.8 | 14.0 | 18.8 | ||||||||
| Depreciation and amortization | 89.8 | 86.0 | 258.2 | 268.0 | ||||||||
| Amortization of deferred revenue and variable consideration adjustment | (15.3 | ) | (23.5 | ) | (62.7 | ) | (55.9 | ) | ||||
| 101.1 | (39.3 | ) | 401.4 | 210.7 | ||||||||
| Adjusting items (pre-tax): | ||||||||||||
| Impairment losses | - | 147.3 | 95.0 | 147.3 | ||||||||
| Environmental obligation adjustment 1 | (6.4 | ) | 0.1 | (147.0 | ) | (4.9 | ) | |||||
| Inventory adjustments | 2.1 | 5.4 | 3.5 | 4.0 | ||||||||
| Past service pension cost | - | 4.2 | - | 4.2 | ||||||||
| Share-based compensation recovery (expense) 2 | 2.5 | 1.5 | (1.8 | ) | 5.5 | |||||||
| Adjusted EBITDA | 99.3 | 119.2 | 351.1 | 366.8 | ||||||||
1 Environmental obligation adjustments were presented within other expense for 2021 periods.
2 Share-based compensation expenses reflected in cost of sales and selling and administrative expenses.
Net Debt
The following table presents our calculation of net debt as at September 30, 2022 and December 31, 2021:
| (in $ thousands) | Sep. 30, 2022 | Dec. 31, 2021 | ||||
| Total long-term debt | 1,183,237 | 1,180,274 | ||||
| Cash | (286,117 | ) | (270,989 | ) | ||
| Net debt | 897,120 | 909,285 | ||||
Cash Cost, Sustaining and All-in Sustaining Cash Cost (Copper Basis)
Cash cost per pound of copper produced ("cash cost") is a non-IFRS measure that management uses as a key performance indicator to assess the performance of our operations. Our calculation designates copper as our primary metal of production as it has been the largest component of revenues. The calculation is presented in four manners:
- Cash cost, before by-product credits - This measure is gross of by-product revenues and is a function of the efforts and costs incurred to mine and process all ore mined. However, the measure divides this aggregate cost over only pounds of copper produced, our primary metal of production. This measure is generally less volatile from period to period, as it is not affected by changes in the price received for by-product metals. It is, however, significantly affected by the relative mix of copper concentrate and finished zinc production, where the sale of the zinc will occur later, and an increase in production of zinc metal will tend to result in an increase in cash cost under this measure.
- Cash cost, net of by-product credits - In order to calculate the net cost to produce and sell copper, the net of by-product credits measure subtracts the revenues realized from the sale of the metals other than copper. The by-product revenues from zinc, gold, and silver are significant and are integral to the economics of our operations. The economics that support our decision to produce and sell copper would be different if we did not receive revenues from the other significant metals being extracted and processed. This measure provides management and investors with an indication of the minimum copper price consistent with positive operating margins, assuming realized by-product metal prices are consistent with those prevailing during the reporting period. It also serves as an important operating statistic that management and investors utilize to measure our operating performance versus that of our competitors. However, it is important to understand that if by-product metal prices decline alongside copper prices, the cash cost net of by-product credits would increase, requiring a higher copper price than that reported to maintain positive cash flows and operating margins.
- Sustaining cash cost, net of by-product credits - This measure is an extension of cash cost that includes cash sustaining capital expenditures, including payments on capitalized leases, capitalized sustaining exploration, net smelter returns royalties, payments on certain long-term community agreements, as well as accretion and amortization for expected decommissioning activities for producing assets. It does not include corporate selling and administrative expenses. It provides a more fulsome measurement of the cost of sustaining production than cash cost, which is focused on operating costs only.
- All-in sustaining cash cost, net of by-product credits - This measure is an extension of sustaining cash cost that includes corporate G&A, regional costs, accretion and amortization for community agreements relating to current operations, and accretion for expected decommissioning activities for non-producing assets. Due to the inclusion of corporate selling and administrative expenses, all-in sustaining cash cost is presented on a consolidated basis only.
The tables below present a detailed build-up of cash cost and sustaining cash cost, net of by-product credits, by business unit in addition to consolidated all-in sustaining cash cost, net of by-product credits, and reconciliations between cash cost, net of by-product credits, to the most comparable IFRS measures of cost of sales for the three and nine months ended September 30, 2022 and 2021. Cash cost, net of by-product credits may not calculate exactly based on amounts presented in the tables below due to rounding.
Consolidated | Three months ended | Nine months ended | ||
Net pounds of copper produced |
|
| ||
(in thousands) | Sep. 30, 2022 | Sep. 30, 2021 | Sep. 30, 2022 | Sep. 30, 2021 |
Peru | 49,167 | 39,842 | 137,454 | 121,159 |
Manitoba | 4,841 | 11,404 | 27,602 | 35,968 |
Net pounds of copper produced | 54,008 | 51,246 | 165,056 | 157,127 |
| Consolidated | Three months ended | Nine months ended | ||||||||||||||||||||||
| Sep. 30, 2022 | Sep. 30, 2021 | Sep. 30, 2022 | Sep. 30, 2021 | |||||||||||||||||||||
| Cash cost per pound of copper produced | $000s | $/lb | $000s | $/lb | $000s | $/lb | $000s | $/lb | ||||||||||||||||
| Cash cost, before by-product credits | 211,664 | 3.92 | 206,615 | 4.04 | 697,624 | 4.23 | 635,383 | 4.05 | ||||||||||||||||
| By-product credits | (180,464 | ) | (3.34 | ) | (175,057 | ) | (3.42 | ) | (569,328 | ) | (3.45 | ) | (504,039 | ) | (3.21 | ) | ||||||||
| Cash cost, net of by-product credits | 31,200 | 0.58 | 31,558 | 0.62 | 128,296 | 0.78 | 131,344 | 0.84 | ||||||||||||||||
| Consolidated | Three months ended | Nine months ended | ||||||||||||||||||||||
| Sep. 30, 2022 | Sep. 30, 2021 | Sep. 30, 2022 | Sep. 30, 2021 | |||||||||||||||||||||
| Supplementary cash cost information | $000s | $/lb 1 | $000s | $/lb 1 | $000s | $/lb 1 | $000s | $/lb 1 | ||||||||||||||||
| By-product credits2: | ||||||||||||||||||||||||
| Zinc | 43,606 | 0.81 | 67,695 | 1.32 | 199,283 | 1.21 | 227,716 | 1.45 | ||||||||||||||||
| Gold 3 | 101,650 | 1.88 | 76,241 | 1.49 | 277,141 | 1.68 | 190,253 | 1.21 | ||||||||||||||||
| Silver 3 | 16,066 | 0.30 | 15,957 | 0.31 | 52,661 | 0.32 | 46,535 | 0.30 | ||||||||||||||||
| Molybdenum & other | 19,142 | 0.35 | 15,164 | 0.30 | 40,243 | 0.24 | 39,535 | 0.25 | ||||||||||||||||
| Total by-product credits | 180,464 | 3.34 | 175,057 | 3.42 | 569,328 | 3.45 | 504,039 | 3.21 | ||||||||||||||||
| Reconciliation to IFRS: | ||||||||||||||||||||||||
| Cash cost, net of by-product credits | 31,200 | 31,558 | 128,296 | 131,344 | ||||||||||||||||||||
| By-product credits | 180,464 | 175,057 | 569,328 | 504,039 | ||||||||||||||||||||
| Treatment and refining charges | (21,852 | ) | (14,531 | ) | (48,968 | ) | (41,710 | ) | ||||||||||||||||
| Inventory adjustments | 2,074 | 5,445 | 3,546 | 3,999 | ||||||||||||||||||||
| Share-based compensation expense | 114 | 145 | (70 | ) | 603 | |||||||||||||||||||
| Past service pension cost | - | 4,229 | - | 4,229 | ||||||||||||||||||||
| Change in product inventory | 29,726 | 5,672 | 13,300 | (1,933 | ) | |||||||||||||||||||
| Royalties | 2,204 | 3,489 | 9,393 | 11,680 | ||||||||||||||||||||
| Depreciation and amortization4 | 89,811 | 86,010 | 258,207 | 267,997 | ||||||||||||||||||||
| Cost of sales5 | 313,741 | 297,074 | 933,032 | 880,248 | ||||||||||||||||||||
1 Per pound of copper produced.
2 By-product credits are computed as revenue per financial statements, including amortization of deferred revenue and pricing and volume adjustments. For more information, please see the realized price reconciliation table on page 29 of this MD&A for these figures.
3 Gold and silver by-product credits do not include variable consideration adjustments with respect to stream arrangements. Variable consideration adjustments are cumulative adjustments to gold and silver stream deferred revenue primarily associated with the net change in mineral reserves and resources or amendments to the mine plan that would change the total expected deliverable ounces under the precious metal streaming arrangement. For the three and nine months ended September 30, 2022 the variable consideration adjustments amounted to an expense of $2,286 and income of $959, respectively (nine months ended September 30, 2021 - income of $1,617).
4 Depreciation is based on concentrate sold.
5 As per IFRS financial statements.
Peru | Three months ended | Nine months ended | ||
(in thousands) | Sep. 30, 2022 | Sep. 30, 2021 | Sep. 30, 2022 | Sep. 30, 2021 |
Net pounds of copper produced1 | 49,167 | 39,842 | 137,454 | 121,159 |
1 Contained copper in concentrate. | ||||
| Peru | Three months ended | Nine months ended | ||||||||||||||||||||||
| Sep. 30, 2022 | Sep. 30, 2021 | Sep. 30, 2022 | Sep. 30, 2021 | |||||||||||||||||||||
| Cash cost per pound of copper produced | $000s | $/lb | $000s | $/lb | $000s | $/lb | $000s | $/lb | ||||||||||||||||
| Mining | 35,197 | 0.72 | 22,772 | 0.57 | 95,899 | 0.70 | 70,444 | 0.58 | ||||||||||||||||
| Milling | 52,043 | 1.06 | 44,750 | 1.12 | 144,429 | 1.05 | 128,356 | 1.06 | ||||||||||||||||
| G&A | 13,421 | 0.27 | 13,948 | 0.35 | 48,198 | 0.35 | 45,278 | 0.37 | ||||||||||||||||
| Onsite costs | 100,661 | 2.05 | 81,470 | 2.04 | 288,526 | 2.10 | 244,078 | 2.01 | ||||||||||||||||
| Treatment & refining | 10,814 | 0.22 | 7,292 | 0.18 | 27,625 | 0.20 | 23,730 | 0.20 | ||||||||||||||||
| Freight & other | 12,905 | 0.26 | 9,464 | 0.24 | 34,679 | 0.25 | 29,707 | 0.25 | ||||||||||||||||
| Cash cost, before by-product credits | 124,380 | 2.53 | 98,226 | 2.46 | 350,830 | 2.55 | 297,515 | 2.46 | ||||||||||||||||
| By-product credits | (41,659 | ) | (0.85 | ) | (47,984 | ) | (1.20 | ) | (118,924 | ) | (0.86 | ) | (97,984 | ) | (0.81 | ) | ||||||||
| Cash cost, net of by-product credits | 82,721 | 1.68 | 50,242 | 1.26 | 231,906 | 1.69 | 199,531 | 1.65 | ||||||||||||||||
| Peru | Three months ended | Nine months ended | ||||||||||||||||||||||
| Sep. 30, 2022 | Sep. 30, 2021 | Sep. 30, 2022 | Sep. 30, 2021 | |||||||||||||||||||||
| Supplementary cash cost information | $000s | $/lb 1 | $000s | $/lb 1 | $000s | $/lb 1 | $000s | $/lb 1 | ||||||||||||||||
| By-product credits2: | ||||||||||||||||||||||||
| Gold3 | 12,793 | 0.26 | 24,196 | 0.61 | 48,696 | 0.35 | 37,185 | 0.31 | ||||||||||||||||
| Silver3 | 9,967 | 0.20 | 10,557 | 0.26 | 34,645 | 0.25 | 27,360 | 0.23 | ||||||||||||||||
| Molybdenum | 18,899 | 0.39 | 13,231 | 0.33 | 35,583 | 0.26 | 33,439 | 0.27 | ||||||||||||||||
| Total by-product credits | 41,659 | 0.85 | 47,984 | 1.20 | 118,924 | 0.86 | 97,984 | 0.81 | ||||||||||||||||
| Reconciliation to IFRS: | ||||||||||||||||||||||||
| Cash cost, net of by-product credits | 82,721 | 50,242 | 231,906 | 199,531 | ||||||||||||||||||||
| By-product credits | 41,659 | 47,984 | 118,924 | 97,984 | ||||||||||||||||||||
| Treatment and refining charges | (10,814 | ) | (7,292 | ) | (27,625 | ) | (23,730 | ) | ||||||||||||||||
| Inventory adjustments | - | - | (558 | ) | (1,446 | ) | ||||||||||||||||||
| Share-based compensation expenses | (16 | ) | 31 | (18 | ) | 102 | ||||||||||||||||||
| Change in product inventory | (2,497 | ) | (3,126 | ) | (15,663 | ) | (9,236 | ) | ||||||||||||||||
| Royalties | 1,740 | 998 | 3,711 | 2,741 | ||||||||||||||||||||
| Depreciation and amortization4 | 56,614 | 47,185 | 152,787 | 140,330 | ||||||||||||||||||||
| Cost of sales5 | 169,407 | 136,022 | 463,464 | 406,276 | ||||||||||||||||||||
1 Per pound of copper produced.
2 By-product credits are computed as revenue per financial statements, including amortization of deferred revenue and pricing and volume adjustments. For more information, please see the realized price reconciliation table on page 29 of this MD&A.
3 Gold and silver by-product credits do not include variable consideration adjustments with respect to stream arrangements.
4 Depreciation is based on concentrate sold.
5 As per IFRS financial statements.
Manitoba | Three months ended | Nine months ended | ||
(in thousands) | Sep. 30, 2022 | Sep. 30, 2021 | Sep. 30, 2022 | Sep. 30, 2021 |
Net pounds of copper produced1 | 4,841 | 11,404 | 27,602 | 35,968 |
1 Contained copper in concentrate. | ||||
| Manitoba | Three months ended | Nine months ended | ||||||||||||||||||||||
| Sep. 30, 2022 | Sep. 30, 2021 | Sep. 30, 2022 | Sep. 30, 2021 | |||||||||||||||||||||
| Cash cost per pound of copper produced | $000s | $/lb | $000s | $/lb | $000s | $/lb | $000s | $/lb | ||||||||||||||||
| Mining | 40,659 | 8.40 | 54,634 | 4.79 | 154,592 | 5.60 | 163,769 | 4.55 | ||||||||||||||||
| Milling | 16,573 | 3.42 | 14,484 | 1.27 | 59,035 | 2.14 | 40,801 | 1.13 | ||||||||||||||||
| Refining (zinc) | - | 0.00 | 15,868 | 1.39 | 32,755 | 1.19 | 53,383 | 1.48 | ||||||||||||||||
| G&A | 9,841 | 2.03 | 8,680 | 0.76 | 55,987 | 2.03 | 39,218 | 1.09 | ||||||||||||||||
| Onsite costs | 67,073 | 13.85 | 93,666 | 8.21 | 302,369 | 10.96 | 297,171 | 8.26 | ||||||||||||||||
| Treatment & refining | 11,038 | 2.29 | 7,239 | 0.63 | 21,343 | 0.77 | 17,980 | 0.50 | ||||||||||||||||
| Freight & other | 9,173 | 1.89 | 7,484 | 0.66 | 23,082 | 0.84 | 22,717 | 0.63 | ||||||||||||||||
| Cash cost, before by-product credits | 87,284 | 18.03 | 108,389 | 9.50 | 346,794 | 12.57 | 337,868 | 9.39 | ||||||||||||||||
| By-product credits | (138,805 | ) | (28.67 | ) | (127,073 | ) | (11.14 | ) | (450,404 | ) | (16.32 | ) | (406,055 | ) | (11.29 | ) | ||||||||
| Cash cost, net of by-product credits | (51,521 | ) | (10.64 | ) | (18,684 | ) | (1.64 | ) | (103,610 | ) | (3.75 | ) | (68,187 | ) | (1.90 | ) | ||||||||
| Manitoba | Three months ended | Nine months ended | ||||||||||||||||||||||
| Sep. 30, 2022 | Sep. 30, 2021 | Sep. 30, 2022 | Sep. 30, 2021 | |||||||||||||||||||||
| Supplementary cash cost information | $000s | $/lb 1 | $000s | $/lb 1 | $000s | $/lb 1 | $000s | $/lb 1 | ||||||||||||||||
| By-product credits2: | ||||||||||||||||||||||||
| Zinc | 43,606 | 9.01 | 67,695 | 5.94 | 199,283 | 7.22 | 227,716 | 6.33 | ||||||||||||||||
| Gold3 | 88,857 | 18.35 | 52,045 | 4.56 | 228,445 | 8.28 | 153,068 | 4.26 | ||||||||||||||||
| Silver3 | 6,099 | 1.26 | 5,400 | 0.47 | 18,016 | 0.65 | 19,175 | 0.53 | ||||||||||||||||
| Other | 243 | 0.05 | 1,933 | 0.17 | 4,660 | 0.17 | 6,096 | 0.17 | ||||||||||||||||
| Total by-product credits | 138,805 | 28.67 | 127,073 | 11.14 | 450,404 | 16.32 | 406,055 | 11.29 | ||||||||||||||||
| Reconciliation to IFRS: | ||||||||||||||||||||||||
| Cash cost, net of by-product credits | (51,521 | ) | (18,684 | ) | (103,610 | ) | (68,187 | ) | ||||||||||||||||
| By-product credits | 138,805 | 127,073 | 450,404 | 406,055 | ||||||||||||||||||||
| Treatment and refining charges | (11,038 | ) | (7,239 | ) | (21,343 | ) | (17,980 | ) | ||||||||||||||||
| Inventory adjustments | 2,074 | 5,445 | 4,104 | 5,445 | ||||||||||||||||||||
| Past service pension cost | - | 4,229 | - | 4,229 | ||||||||||||||||||||
| Share-based compensation expenses | 130 | 114 | (52 | ) | 501 | |||||||||||||||||||
| Change in product inventory | 32,223 | 8,798 | 28,963 | 7,303 | ||||||||||||||||||||
| Royalties | 464 | 2,491 | 5,682 | 8,939 | ||||||||||||||||||||
| Depreciation and amortization4 | 33,197 | 38,825 | 105,420 | 127,667 | ||||||||||||||||||||
| Cost of sales5 | 144,334 | 161,052 | 469,568 | 473,972 | ||||||||||||||||||||
1 Per pound of copper produced.
2 By-product credits are computed as revenue per financial statements, including amortization of deferred revenue and pricing and volume adjustments. For more information, please see the realized price reconciliation table on page 29 of this MD&A.
3 Gold and silver by-product credits do not include variable consideration adjustments with respect to stream arrangements.
4 Depreciation is based on concentrate sold.
5 As per IFRS financial statements.
| Consolidated | Three months ended | Nine months ended | ||||||||||||||||||||||
| Sep. 30, 2022 | Sep. 30, 2021 | Sep. 30, 2022 | Sep. 30, 2021 | |||||||||||||||||||||
| All-in sustaining cash cost per pound of copper produced | $000s | $/lb | $000s | $/lb | $000s | $/lb | $000s | $/lb | ||||||||||||||||
| Cash cost, net of by-product credits | 31,200 | 0.58 | 31,558 | 0.62 | 128,296 | 0.78 | 131,344 | 0.84 | ||||||||||||||||
| Cash sustaining capital expenditures | 69,588 | 1.29 | 65,694 | 1.28 | 195,724 | 1.18 | 190,649 | 1.21 | ||||||||||||||||
| Royalties | 2,204 | 0.04 | 3,489 | 0.07 | 9,393 | 0.06 | 11,680 | 0.07 | ||||||||||||||||
| Sustaining cash cost, net of by-product credits | 102,992 | 1.91 | 100,741 | 1.97 | 333,413 | 2.02 | 333,673 | 2.12 | ||||||||||||||||
| Corporate selling and administrative expenses & regional costs | 11,384 | 0.21 | 10,177 | 0.21 | 26,923 | 0.17 | 31,934 | 0.20 | ||||||||||||||||
| Accretion and amortization of decommissioning and community agreements1 | 2,099 | 0.04 | 652 | 0.01 | 3,694 | 0.02 | 1,936 | 0.01 | ||||||||||||||||
| All-in sustaining cash cost, net of by-product credits | 116,475 | 2.16 | 111,570 | 2.18 | 364,030 | 2.21 | 367,543 | 2.33 | ||||||||||||||||
| Reconciliation to property, plant and equipment additions: | ||||||||||||||||||||||||
| Property, plant and equipment additions | 72,237 | 76,435 | 182,348 | 254,903 | ||||||||||||||||||||
| Capitalized stripping net additions | 22,645 | 19,094 | 74,093 | 60,225 | ||||||||||||||||||||
| Total accrued capital additions | 94,882 | 95,529 | 256,441 | 315,128 | ||||||||||||||||||||
| Less other non-sustaining capital costs2 | 34,649 | 33,099 | 80,469 | 153,312 | ||||||||||||||||||||
| Total sustaining capital costs | 60,233 | 62,430 | 175,972 | 161,816 | ||||||||||||||||||||
| Right of use leased assets | (5,158 | ) | (9,549 | ) | (25,430 | ) | (19,971 | ) | ||||||||||||||||
| Capitalized lease cash payments - operating sites | 8,852 | 8,453 | 27,424 | 25,972 | ||||||||||||||||||||
| Community agreement cash payments | 2,491 | 82 | 6,632 | 425 | ||||||||||||||||||||
| Accretion and amortization of decommissioning and restoration obligations | 3,170 | 4,278 | 11,126 | 22,407 | ||||||||||||||||||||
| Cash sustaining capital expenditures | 69,588 | 65,694 | 195,724 | 190,649 | ||||||||||||||||||||
1 Includes accretion of decommissioning relating to non-productive sites, and accretion and amortization of current community agreements.
2 Other non-sustaining capital costs include Arizona capitalized costs, capitalized interest, capitalized exploration, and growth capital expenditures.
Peru | Three months ended | Nine months ended | ||||||
| Sep. 30, 2022 | Sep. 30, 2021 | Sep. 30, 2022 | Sep. 30, 2021 | ||||
Sustaining cash cost per pound of copper produced | $000s | $/lb | $000s | $/lb | $000s | $/lb | $000s | $/lb |
Cash cost, net of by-product credits | 82,721 | 1.68 | 50,242 | 1.26 | 231,906 | 1.69 | 199,531 | 1.65 |
Cash sustaining capital expenditures | 36,507 | 0.74 | 40,921 | 1.03 | 102,073 | 0.74 | 95,619 | 0.79 |
Royalties | 1,740 | 0.04 | 998 | 0.03 | 3,711 | 0.03 | 2,741 | 0.02 |
Sustaining cash cost per pound of copper produced | 120,968 | 2.46 | 92,161 | 2.31 | 337,690 | 2.46 | 297,891 | 2.46 |
1 Only includes exploration costs incurred for locations near to existing mine operations. | ||||||||
| Manitoba | Three months ended | Nine months ended | ||||||||||||||||||||||
| Sep. 30, 2022 | Sep. 30, 2021 | Sep. 30, 2022 | Sep. 30, 2021 | |||||||||||||||||||||
| Sustaining cash cost per pound of copper produced | $000s | $/lb | $000s | $/lb | $000s | $/lb | $000s | $/lb | ||||||||||||||||
| Cash cost, net of by-product credits | (51,521 | ) | (10.64 | ) | (18,684 | ) | (1.64 | ) | (103,610 | ) | (3.75 | ) | (68,187 | ) | (1.90 | ) | ||||||||
| Cash sustaining capital expenditures | 33,081 | 6.83 | 24,773 | 2.17 | 93,651 | 3.39 | 95,030 | 2.64 | ||||||||||||||||
| Royalties | 464 | 0.10 | 2,491 | 0.22 | 5,682 | 0.21 | 8,939 | 0.25 | ||||||||||||||||
| Sustaining cash cost per pound of copper produced | (17,976 | ) | (3.71 | ) | 8,580 | 0.75 | (4,277 | ) | (0.15 | ) | 35,782 | 0.99 | ||||||||||||
Gold Cash Cost and Gold Sustaining Cash Cost
Cash cost per ounce of gold produced ("gold cash cost") is a non-IFRS measure that management uses as a key performance indicator to assess the performance of our Manitoba operations. This alternative cash cost calculation designates gold as the primary metal of production as it represents a substantial component of revenues for our Manitoba business unit and should therefore be less volatile over time than Manitoba cash cost per pound of copper. The calculation is presented in three manners:
- Gold cash cost, before by-product credits - This measure is gross of by-product revenues and is a function of the efforts and costs incurred to mine and process all ore mined. However, the measure divides this aggregate cost over only ounces of gold produced, the assumed primary metal of production. This measure is generally less volatile from period to period, as it is not affected by changes in the price received for by-product metals.
- Gold cash cost, net of by-product credits - In order to calculate the net cost to produce and sell gold, the net of by-product credits measure subtracts the revenues realized from the sale of the metals other than gold. The by-product revenues from copper, zinc, and silver are significant and are integral to the economics of our Manitoba operation. The economics that support our decision to produce and sell gold would be different if we did not receive revenues from the other significant metals being extracted and processed. This measure provides management and investors with an indication of the minimum gold price consistent with positive operating margins, assuming realized by-product metal prices are consistent with those prevailing during the reporting period. It also serves as an important operating statistic that management and investors utilize to measure our operating performance at our Manitoba operation versus that of our competitors. However, it is important to understand that if by-product metal prices decline alongside gold prices, the gold cash cost net of by-product credits would increase, requiring a higher gold price than that reported to maintain positive cash flows and operating margins.
- Gold sustaining cash cost, net of by-product credits - This measure is an extension of gold cash cost that includes cash sustaining capital expenditures, capitalized exploration, net smelter returns royalties, as well as accretion and amortization for expected decommissioning activities for producing assets. It does not include corporate selling and administrative expenses. It provides a more fulsome measurement of the cost of sustaining production than gold cash cost, which is focused on operating costs only.
The tables below present a detailed build-up of gold cash cost and gold sustaining cash cost, net of by-product credits, for the Manitoba business unit, and reconciliations between gold cash cost, net of by-product credits, to the most comparable IFRS measures of cost of sales for the three and nine months ended September 30, 2022. The introduction of gold cash cost was made in 2022, as gold replaced zinc as the major output within Manitoba's production profile. No comparatives have been disclosed for this metric as Manitoba gold production in 2021 was not considered meaningful. Gold cash cost, net of by-product credits, may not calculate exactly based on amounts presented in the tables below due to rounding.
Manitoba | Three months ended | Nine months ended |
(in thousands) | Sep. 30, 2022 | Sep. 30, 2022 |
Net ounces of gold produced | 40,457 | 128,411 |
| Manitoba | Three months ended | Nine months ended | ||||||||||
| Sep. 30, 2022 | Sep. 30, 2022 | |||||||||||
| Cash cost per ounce of gold produced | $000s | $/oz | $000s | $/oz | ||||||||
| Cash cost, before by-product credits1 | 87,284 | 2,157 | 346,794 | 2,701 | ||||||||
| By-product credits | (78,565 | ) | (1,941 | ) | (329,362 | ) | (2,565 | ) | ||||
| Gold cash cost, net of by-product credits | 8,719 | 216 | 17,432 | 136 | ||||||||
| 1 For additional detail on cash cost, before by-product credits please see page 50 of this MD&A. | ||||||||||||
| Manitoba | Three months ended | Nine months ended | ||||||||||
| Sep. 30, 2022 | Sep. 30, 2022 | |||||||||||
| Supplementary cash cost information | $000s | $/oz 1 | $000s | $/oz1 | ||||||||
| By-product credits2: | ||||||||||||
| Copper | 28,617 | 707 | 107,403 | 836 | ||||||||
| Zinc | 43,606 | 1,077 | 199,283 | 1,553 | ||||||||
| Silver3 | 6,099 | 151 | 18,016 | 140 | ||||||||
| Other | 243 | 6 | 4,660 | 36 | ||||||||
| Total by-product credits | 78,565 | 1,941 | 329,362 | 2,565 | ||||||||
| Reconciliation to IFRS: | ||||||||||||
| Cash cost, net of by-product credits | 8,719 | 17,432 | ||||||||||
| By-product credits | 78,565 | 329,362 | ||||||||||
| Treatment and refining charges | (11,038 | ) | (21,343 | ) | ||||||||
| Share-based compensation expenses | 130 | (52 | ) | |||||||||
| Inventory adjustments | 2,074 | 4,104 | ||||||||||
| Change in product inventory | 32,223 | 28,963 | ||||||||||
| Royalties | 464 | 5,682 | ||||||||||
| Depreciation and amortization4 | 33,197 | 105,420 | ||||||||||
| Cost of sales5 | 144,334 | 469,568 | ||||||||||
1 Per ounce of gold produced.
2 By-product credits are computed as revenue per financial statements, amortization of deferred revenue and pricing and volume adjustments. For more information, please see the realized price reconciliation table on page 29 of this MD&A.
3 Silver by-product credits do not include variable consideration adjustments with respect to stream arrangements.
4 Depreciation is based on concentrate sold.
5 As per IFRS financial statements.
Manitoba | Three months ended | Nine months ended | ||
| Sep. 30, 2022 | Sep. 30, 2022 | ||
Sustaining cash cost per ounce of gold produced | $000s | $/oz | $000s | $/oz |
Gold cash cost, net of by-product credits | 8,719 | 216 | 17,432 | 136 |
Cash sustaining capital expenditures | 33,081 | 818 | 93,651 | 729 |
Royalties | 464 | 11 | 5,682 | 44 |
Sustaining cash cost per ounce of gold produced | 42,264 | 1,045 | 116,765 | 909 |
Combined Unit Cost and Zinc Plant Unit Cost Reconciliation
Combined unit cost ("unit cost") and zinc plant unit cost is a non-IFRS measure that management uses as a key performance indicator to assess the performance of our mining and milling operations. Combined unit cost and zinc plant unit cost are calculated by dividing the cost of sales by mill throughput and refined zinc metal produced, respectively. This measure is utilized by management and investors to assess our cost structure and margins and compare it to similar information provided by other companies in our industry. Unlike cash cost, this measure is not impacted by variability in by-product commodity prices since there are no by-product deductions; costs associated with profit-sharing and similar costs are excluded because of their correlation to external metal prices. In addition, the unit costs are reported in the functional currency of the operation which minimizes the impact of foreign currency fluctuations. In all, the unit cost measures provide an alternative perspective on operating cost performance with minimal impact from external market prices.
The tables below present a detailed combined unit cost and zinc plant unit costs for the Manitoba business unit and combined unit cost for the Peru business unit, and reconciliations between these measures to the most comparable IFRS measures of cost of sales for the three and nine months ended September 30, 2022 and 2021.
| Peru | Three months ended | Nine months ended | ||||||||||
| (in thousands except unit cost per tonne) | Sep. 30, 2022 | Sep. 30, 2021 | Sep. 30, 2022 | Sep. 30, 2021 | ||||||||
| Combined unit cost per tonne processed | ||||||||||||
| Mining | 35,197 | 22,772 | 95,899 | 70,444 | ||||||||
| Milling | 52,043 | 44,750 | 144,429 | 128,356 | ||||||||
| G&A 1 | 13,421 | 13,948 | 48,198 | 45,278 | ||||||||
| Other G&A 2 | 1,342 | (286 | ) | (279 | ) | (215 | ) | |||||
| 102,003 | 81,184 | 288,247 | 243,863 | |||||||||
| Less: COVID-19 related costs | 929 | 4,825 | 4,525 | 15,719 | ||||||||
| Unit cost | 101,074 | 76,359 | 283,722 | 228,144 | ||||||||
| Tonnes ore milled | 7,742 | 6,985 | 22,727 | 20,761 | ||||||||
| Combined unit cost per tonne | 13.06 | 10.93 | 12.48 | 10.99 | ||||||||
| Reconciliation to IFRS: | ||||||||||||
| Unit cost | 101,074 | 76,359 | 283,722 | 228,144 | ||||||||
| Freight & other | 12,905 | 9,464 | 34,679 | 29,707 | ||||||||
| COVID-19 related costs | 929 | 4,825 | 4,525 | 15,719 | ||||||||
| Other G&A | (1,342 | ) | 286 | 279 | 215 | |||||||
| Share-based compensation expenses | (16 | ) | 31 | (18 | ) | 102 | ||||||
| Inventory adjustments | - | - | (558 | ) | (1,446 | ) | ||||||
| Change in product inventory | (2,497 | ) | (3,126 | ) | (15,663 | ) | (9,236 | ) | ||||
| Royalties | 1,740 | 998 | 3,711 | 2,741 | ||||||||
| Depreciation and amortization | 56,614 | 47,185 | 152,787 | 140,330 | ||||||||
| Cost of sales3 | 169,407 | 136,022 | 463,464 | 406,276 | ||||||||
1 G&A as per cash cost reconciliation above.
2 Other G&A primarily includes profit sharing costs.
3 As per IFRS financial statements.
| Manitoba | Three months ended | Nine months ended | ||||||||||
| (in thousands except tonnes ore milled and unit cost per tonne) | Sep. 30, 2022 | Sep. 30, 2021 | Sep. 30, 2022 | Sep. 30, 2021 | ||||||||
| Combined unit cost per tonne processed | ||||||||||||
| Mining | 40,659 | 54,634 | 154,592 | 163,769 | ||||||||
| Milling | 16,573 | 14,484 | 59,035 | 40,801 | ||||||||
| G&A 1 | 9,841 | 8,680 | 55,987 | 39,218 | ||||||||
| Less: G&A allocated to zinc metal production and other areas | - | (3,280 | ) | (6,523 | ) | (10,822 | ) | |||||
| Less: Other G&A related to profit sharing costs | (1,784 | ) | 3,381 | (22,014 | ) | (72 | ) | |||||
| Unit cost | 65,289 | 77,899 | 241,077 | 232,894 | ||||||||
| USD/CAD implicit exchange rate | 1.31 | 1.26 | 1.28 | 1.25 | ||||||||
| Unit cost - C$ | 85,225 | 98,151 | 308,419 | 291,419 | ||||||||
| Tonnes ore milled | 362,108 | 666,263 | 1,662,759 | 1,957,980 | ||||||||
| Combined unit cost per tonne - C$ | 235 | 147 | 185 | 149 | ||||||||
| Reconciliation to IFRS: | ||||||||||||
| Unit cost | 65,289 | 77,899 | 241,077 | 232,894 | ||||||||
| Freight & other | 9,173 | 7,484 | 23,082 | 22,717 | ||||||||
| Refined (zinc) | - | 15,868 | 32,755 | 53,383 | ||||||||
| G&A allocated to zinc metal production | - | 3,280 | 6,523 | 10,822 | ||||||||
| Other G&A related to profit sharing | 1,784 | (3,381 | ) | 22,014 | 72 | |||||||
| Share-based compensation expenses | 130 | 114 | (52 | ) | 501 | |||||||
| Inventory adjustments | 2,074 | 5,445 | 4,104 | 5,445 | ||||||||
| Past service pension cost | - | 4,229 | - | 4,229 | ||||||||
| Change in product inventory | 32,223 | 8,798 | 28,963 | 7,303 | ||||||||
| Royalties | 464 | 2,491 | 5,682 | 8,939 | ||||||||
| Depreciation and amortization | 33,197 | 38,825 | 105,420 | 127,667 | ||||||||
| Cost of sales2 | 144,334 | 161,052 | 469,568 | 473,972 | ||||||||
1 G&A as per cash cost reconciliation above.
2 As per IFRS financial statements.
| Manitoba | Three months ended | Three months ended | |||||||||||
| (in thousands except zinc plant unit cost per pound) | September 30, 2022 | September 30, 2021 | September 30, 2022 | September 30, 2021 | |||||||||
| Zinc plant unit cost | |||||||||||||
| Zinc plant costs | - | 15,868 | 32,755 | 53,383 | |||||||||
| G&A 1 | 9,841 | 8,680 | 55,987 | 39,218 | |||||||||
| Less: G&A allocated to other areas | (8,057 | ) | (8,781 | ) | (27,450 | ) | (28,324 | ) | |||||
| Less: Other G&A related to profit sharing | (1,784 | ) | 3,381 | (22,014 | ) | (72 | ) | ||||||
| Zinc plant unit cost | - | 19,148 | 39,278 | 64,205 | |||||||||
| USD/CAD implicit exchange rate | - | 1.26 | 1.27 | 1.25 | |||||||||
| Zinc plant unit cost - C$ | - | 24,119 | 50,036 | 80,367 | |||||||||
| Refined metal produced (in pounds) | - | 43,779 | 83,542 | 151,645 | |||||||||
| Zinc plant unit cost per pound - C$ | - | 0.55 | 0.60 | 0.53 | |||||||||
| Reconciliation to IFRS: | |||||||||||||
| Zinc plant unit cost | - | 19,148 | 39,278 | 64,205 | |||||||||
| Freight & other | 9,173 | 7,484 | 23,082 | 22,717 | |||||||||
| Mining | 40,659 | 54,634 | 154,592 | 163,769 | |||||||||
| Milling | 16,573 | 14,484 | 59,035 | 40,801 | |||||||||
| G&A allocated to other areas | 8,057 | 8,781 | 27,450 | 28,324 | |||||||||
| Other G&A related to profit sharing | 1,784 | (3,381 | ) | 22,014 | 72 | ||||||||
| Share-based payment | 130 | 114 | (52 | ) | 501 | ||||||||
| Inventory adjustments | 2,074 | 5,445 | 4,104 | 5,445 | |||||||||
| Past service pension costs | - | 4,229 | - | 4,229 | |||||||||
| Change in product inventory | 32,223 | 8,798 | 28,963 | 7,303 | |||||||||
| Royalties | 464 | 2,491 | 5,682 | 8,939 | |||||||||
| Depreciation and amortization | 33,197 | 38,825 | 105,420 | 127,667 | |||||||||
| Cost of sales2 | 144,334 | 161,052 | 469,568 | 473,972 | |||||||||
1 G&A as per cash cost reconciliation above.
2 As per IFRS financial statements.
ACCOUNTING CHANGES AND CRITICAL ESTIMATES
New standards and interpretations not yet adopted
For information on new standards and interpretations not yet adopted, refer to note 4 of our September 30, 2022 consolidated interim financial statements.
Estimates and judgements
The preparation of the consolidated financial statements in accordance with IFRS requires us to make judgements, estimates and assumptions that affect the application of accounting policies, reported amounts of assets and liabilities, disclosure of contingent assets and liabilities at the date of the consolidated financial statements, and reported amounts of revenue and expenses during the reporting period. Actual results may differ from these estimates.
We review these estimates and underlying assumptions on an ongoing basis based on our experience and other factors, including expectations of future events that we believe to be reasonable under the circumstances. Revisions to accounting estimates are recognized in the period in which the estimates are revised and in any future periods affected. Certain accounting estimates and judgements have been identified as being "critical" to the presentation of our financial condition and results of operations because they require us to make subjective and/or complex judgments about matters that are inherently uncertain; or there is a reasonable likelihood that materially different amounts could be reported under different conditions or using different assumptions and estimates.
For more information on judgements and estimates, refer to note 2 of our September 30, 2022 consolidated interim financial statements.
CHANGES IN INTERNAL CONTROL OVER FINANCIAL REPORTING
Management is responsible for establishing and maintaining adequate internal control over financial reporting ("ICFR"). ICFR is designed to provide reasonable assurance regarding the reliability of financial reporting and the preparation of financial statements for external purposes in accordance with IFRS.
We did not make any changes to ICFR during the three months ended September 30, 2022 that materially affected or are reasonably likely to materially affect our ICFR.
NOTES TO READER
Forward-Looking Information
This MD&A contains forward-looking information within the meaning of applicable Canadian and United States securities legislation. All information contained in this MD&A, other than statements of current and historical fact, is forward-looking information. Often, but not always, forward-looking information can be identified by the use of words such as "plans", "expects", "budget", "guidance", "scheduled", "estimates", "forecasts", "strategy", "target", "intends", "objective", "goal", "understands", "anticipates" and "believes" (and variations of these or similar words) and statements that certain actions, events or results "may", "could", "would", "should", "might" "occur" or "be achieved" or "will be taken" (and variations of these or similar expressions). All of the forward-looking information in this MD&A is qualified by this cautionary note.
Forward-looking information includes, but is not limited to, production, cost and capital and exploration expenditure guidance, expectations regarding reductions in discretionary spending in 2022 and 2023, expectations regarding the impact of inflationary pressures on the cost of operations, financial condition and prospects, expectations regarding our cash balance and liquidity for the remainder of the year, expectations regarding the Copper World project, including our plans for a pre-feasibility study and the estimated timelines and pre-requisites for sanctioning the project, expectations regarding the permitting requirements for the Copper World project and permitting related litigation, expectations regarding the anticipated timelines for achieving target throughput and recoveries at the New Britannia mill, increasing the mining rate at Lalor to 5,300 tonnes per day, expectations regarding the ability to conduct exploration work on the Maria Reyna and Caballito properties, expectations resulting from the Flin Flon tailings drill program and the evaluation of the opportunity to reprocess tailings, plans to implement a winter drill program and other scoping studies in Manitoba, the expectations regarding the prospective nature of the Maria Reyna and Caballito properties, anticipated mine plans, anticipated metals prices and the anticipated sensitivity of our financial performance to metals prices, events that may affect our operations and development projects, anticipated cash flows from operations and related liquidity requirements, the anticipated effect of external factors on revenue, such as commodity prices, estimation of mineral reserves and resources, mine life projections, reclamation costs, economic outlook, government regulation of mining operations, and business and acquisition strategies. Forward-looking information is not, and cannot be, a guarantee of future results or events. Forward-looking information is based on, among other things, opinions, assumptions, estimates and analyses that, while considered reasonable by us at the date the forward-looking information is provided, inherently are subject to significant risks, uncertainties, contingencies and other factors that may cause actual results and events to be materially different from those expressed or implied by the forward-looking information.
The material factors or assumptions that we identified and were applied by us in drawing conclusions or making forecasts or projections set out in the forward-looking information include, but are not limited to:
- our ability to continue to operate safely and at full capacity despite COVID-19 related challenges;
- the availability, global supply and effectiveness of COVID-19 vaccines, the effective distribution of such vaccines in the countries in which we operate, the lessening of restrictions related to COVID-19, and the anticipated rate and timing for each of the foregoing;
- the ability to achieve production and cost guidance;
- the ability to achieve discretionary spending reductions without impacting operations;
- no significant interruptions to our operations due to COVID-19 or social or political unrest in the regions Hudbay operates;
- no interruptions to our plans for advancing the Copper World project;
- the ability to ramp up exploration in respect of the Maria Reyna and Caballito properties;
- the ability to ramp up the New Britannia mill to target throughput and recoveries and achieve the anticipated production;
- the ability to ramp up the Lalor mine to 5,300 tonnes per day;
- the success of mining, processing, exploration and development activities;
- the scheduled maintenance and availability of our processing facilities;
- the accuracy of geological, mining and metallurgical estimates;
- anticipated metals prices and the costs of production;
- the supply and demand for metals we produce;
- the supply and availability of all forms of energy and fuels at reasonable prices;
- no significant unanticipated operational or technical difficulties;
- the execution of our business and growth strategies, including the success of our strategic investments and initiatives;
- the availability of additional financing, if needed;
- the ability to complete project targets on time and on budget and other events that may affect our ability to develop our projects;
- the timing and receipt of various regulatory and governmental approvals;
- the availability of personnel for our exploration, development and operational projects and ongoing employee relations;
- maintaining good relations with the labour unions that represent certain of our employees in Manitoba and Peru;
- maintaining good relations with the communities in which we operate, including the neighbouring Indigenous communities and local governments;
- no significant unanticipated challenges with stakeholders at our various projects;
- no significant unanticipated events or changes relating to regulatory, environmental, health and safety matters;
- no contests over title to our properties, including as a result of rights or claimed rights of Indigenous peoples or challenges to the validity of our unpatented mining claims;
- the timing and possible outcome of pending litigation and no significant unanticipated litigation;
- certain tax matters, including, but not limited to current tax laws and regulations, changes in taxation policies and the refund of certain value added taxes from the Canadian and Peruvian governments; and
- no significant and continuing adverse changes in general economic conditions or conditions in the financial markets (including commodity prices and foreign exchange rates).
The risks, uncertainties, contingencies and other factors that may cause actual results to differ materially from those expressed or implied by the forward-looking information may include, but are not limited to, risks associated with COVID-19 and its effect on our operations, financial condition, projects and prospects, uncertainty with respect to the political and social environment in Peru and its potential impact on our mining operations, risks generally associated with the mining industry and the current geopolitical environment, including future commodity prices, currency and interest rate fluctuations, energy and consumable prices, supply chain constraints and general cost escalation in the current inflationary environment, uncertainties related to the development and operation of our projects, risks related to the Copper World project, including in relation to permitting, litigation, project delivery and financing risks, risks related to the new Lalor mine plan, including the continuing ramp-up of the New Britannia mill and the ability to convert inferred mineral resource estimates to higher confidence categories, the potential that additional financial assurance will be required to support the updated Flin Flon closure plan, dependence on key personnel and employee and union relations, risks related to political or social instability, unrest or change, risks in respect of Indigenous and community relations, rights and title claims, operational risks and hazards, including the cost of maintaining and upgrading the Company's tailings management facilities and any unanticipated environmental, industrial and geological events and developments and the inability to insure against all risks, failure of plant, equipment, processes, transportation and other infrastructure to operate as anticipated, compliance with government and environmental regulations, including permitting requirements and anti-bribery legislation, depletion of our reserves, volatile financial markets and interest rates that may affect our ability to obtain additional financing on acceptable terms, the failure to obtain required approvals or clearances from government authorities on a timely basis, uncertainties related to the geology, continuity, grade and estimates of mineral reserves and resources, and the potential for variations in grade and recovery rates, uncertain costs of reclamation activities, our ability to comply with our pension and other post-retirement obligations, our ability to abide by the covenants in our debt instruments and other material contracts, tax refunds, hedging transactions, as well as the risks discussed under the heading "Risk Factors" in our most recent Annual Information Form.
Should one or more risk, uncertainty, contingency or other factor materialize or should any factor or assumption prove incorrect, actual results could vary materially from those expressed or implied in the forward-looking information. Accordingly, you should not place undue reliance on forward-looking information. We do not assume any obligation to update or revise any forward-looking information after the date of this MD&A or to explain any material difference between subsequent actual events and any forward-looking information, except as required by applicable law.
Note to United States Investors
This MD&A has been prepared in accordance with the requirements of the securities laws in effect in Canada, which may differ materially from the requirements of United States securities laws applicable to U.S. issuers.
Qualified Person and NI 43-101
The technical and scientific information in this MD&A related to our material mineral projects has been approved by Olivier Tavchandjian, P. Geo, our Vice President, Exploration and Technical Services. Mr. Tavchandjian is a qualified person pursuant to National Instrument 43-101 - Standards of Disclosure for Mineral Projects ("NI 43-101").
For a description of the key assumptions, parameters and methods used to estimate mineral reserves and resources at Hudbay's material properties, as well as data verification procedures and a general discussion of the extent to which the estimates of scientific and technical information may be affected by any known environmental, permitting, legal title, taxation, sociopolitical, marketing or other relevant factors, please see the technical reports for our material properties as filed by us on SEDAR at www.sedar.com.
SUMMARY OF RESULTS
The following unaudited tables set out a summary of quarterly and annual results for the Company.
| Q3 2022 | Q2 2022 | Q1 2022 | 2021 4 | Q4 2021 | Q3 20215 | Q2 2021 | Q1 2021 | 2020 4 | Q4 2020 | Q3 2020 | ||||||||||||||||||||||||
| Consolidated Financial Condition ($000s) | ||||||||||||||||||||||||||||||||||
| Cash | $ | 286,117 | $ | 258,556 | $ | 213,359 | $ | 270,989 | $ | 270,989 | $ | 297,451 | $ | 294,287 | $ | 310,564 | $ | 439,135 | $ | 439,135 | $ | 449,014 | ||||||||||||
| Total long-term debt | 1,183,237 | 1,182,143 | 1,181,119 | 1,180,274 | 1,180,274 | 1,182,612 | 1,181,195 | 1,180,798 | 1,135,675 | 1,135,675 | 1,175,104 | |||||||||||||||||||||||
| Net debt1 | 897,120 | 923,587 | 967,760 | 909,285 | 909,285 | 885,161 | 886,908 | 870,234 | 696,540 | 696,540 | 726,090 | |||||||||||||||||||||||
| Consolidated Financial Performance ($000s except per share amounts) | ||||||||||||||||||||||||||||||||||
| Revenue | $ | 346,171 | $ | 415,454 | $ | 378,619 | $ | 1,501,998 | $ | 425,170 | $ | 358,961 | $ | 404,242 | $ | 313,624 | $ | 1,092,418 | $ | 322,290 | $ | 316,108 | ||||||||||||
| Cost of sales | 313,741 | 325,940 | 293,351 | 1,370,979 | 343,426 | 444,379 | 322,060 | 261,112 | 1,053,418 | 287,923 | 276,830 | |||||||||||||||||||||||
| Earnings (loss) before tax | (263 | ) | 21,504 | 88,861 | (202,751 | ) | (149 | ) | (147,830 | ) | 14,819 | (69,592 | ) | (179,089 | ) | 911 | (23,944 | ) | ||||||||||||||||
| Earnings (loss) | (8,135 | ) | 32,143 | 63,815 | (244,358 | ) | (10,453 | ) | (170,411 | ) | (3,395 | ) | (60,102 | ) | (144,584 | ) | 7,406 | (23,955 | ) | |||||||||||||||
| Basic and diluted earnings (loss) per share | $ | (0.03 | ) | $ | 0.12 | $ | 0.24 | $ | (0.93 | ) | $ | (0.04 | ) | $ | (0.65 | ) | $ | (0.01 | ) | $ | (0.23 | ) | $ | (0.55 | ) | $ | 0.03 | $ | (0.09 | ) | ||||
| Adjusted earnings (loss) per share 1 | $ | (0.05 | ) | $ | 0.12 | $ | 0.02 | $ | 0.09 | $ | 0.13 | $ | - | $ | 0.02 | $ | (0.06 | ) | $ | (0.46 | ) | $ | (0.06 | ) | $ | (0.10 | ) | |||||||
| Operating cash flow before change in non-cash working capital 1 | 81,617 | 123,911 | 77,053 | 483,862 | 156,917 | 103,509 | 132,786 | 90,656 | 241,863 | 86,071 | 84,383 | |||||||||||||||||||||||
| Adjusted EBITDA (in $ millions) 1 | 99.3 | 141.4 | 110.2 | 547.1 | 180.3 | 119.3 | 143.2 | 104.2 | 306.7 | 106.9 | 96.1 | |||||||||||||||||||||||
| Consolidated Operational Performance | ||||||||||||||||||||||||||||||||||
| Contained metal in concentrate and doré produced 2 | ||||||||||||||||||||||||||||||||||
| Copper | tonnes | 24,498 | 25,668 | 24,702 | 99,470 | 28,198 | 23,245 | 23,474 | 24,553 | 95,333 | 27,278 | 25,395 | ||||||||||||||||||||||
| Gold | ounces | 53,179 | 58,645 | 53,956 | 193,783 | 64,159 | 54,276 | 39,848 | 35,500 | 124,622 | 32,376 | 29,277 | ||||||||||||||||||||||
| Silver | ounces | 717,069 | 864,853 | 784,357 | 3,045,481 | 899,713 | 763,177 | 685,916 | 696,673 | 2,750,873 | 730,679 | 671,685 | ||||||||||||||||||||||
| Zinc | tonnes | 9,750 | 17,053 | 22,252 | 93,529 | 23,207 | 20,844 | 21,538 | 27,940 | 118,130 | 25,843 | 30,570 | ||||||||||||||||||||||
| Molybdenum | tonnes | 437 | 390 | 207 | 1,146 | 275 | 282 | 295 | 294 | 1,204 | 333 | 392 | ||||||||||||||||||||||
| Payable metal in concentrate and doré sold | ||||||||||||||||||||||||||||||||||
| Copper | tonnes | 24,799 | 23,650 | 20,609 | 92,200 | 24,959 | 21,136 | 25,176 | 20,929 | 88,888 | 22,963 | 25,903 | ||||||||||||||||||||||
| Gold | ounces | 66,932 | 50,884 | 48,343 | 168,358 | 56,927 | 47,843 | 38,205 | 25,383 | 122,949 | 35,179 | 30,605 | ||||||||||||||||||||||
| Silver | ounces | 816,416 | 738,171 | 864,591 | 2,427,508 | 638,640 | 701,601 | 577,507 | 509,760 | 2,585,586 | 762,384 | 705,495 | ||||||||||||||||||||||
| Zinc 3 | tonnes | 12,714 | 20,793 | 17,306 | 96,435 | 21,112 | 21,619 | 25,361 | 28,343 | 109,347 | 28,431 | 26,520 | ||||||||||||||||||||||
| Molybdenum | tonnes | 511 | 208 | 213 | 1,098 | 245 | 304 | 265 | 284 | 1,321 | 457 | 313 | ||||||||||||||||||||||
| Cash cost 1 | $/lb | $ | 0.58 | $ | 0.65 | $ | 1.11 | $ | 0.74 | $ | 0.51 | $ | 0.62 | $ | 0.84 | $ | 1.04 | $ | 0.60 | $ | 0.43 | $ | 0.65 | |||||||||||
| Sustaining cash cost | $/lb | $ | 1.91 | $ | 1.87 | $ | 2.29 | $ | 2.07 | $ | 1.95 | $ | 1.97 | $ | 2.25 | $ | 2.16 | $ | 1.93 | $ | 1.97 | $ | 2.02 | |||||||||||
| All-in sustaining cash cost 1 | $/lb | $ | 2.16 | $ | 1.93 | $ | 2.54 | $ | 2.30 | $ | 2.20 | $ | 2.18 | $ | 2.48 | $ | 2.37 | $ | 2.16 | $ | 2.24 | $ | 2.25 | |||||||||||
1Net debt, adjusted earnings (loss) per share, adjusted EBITDA, cash cost, sustaining cash cost and all-in sustaining cash cost per pound of copper produced, net of by-product credits, are non-IFRS financial performance measures with no standardized definition under IFRS. For further information and a detailed reconciliation, please see discussion under the "Non-IFRS Financial Performance Measures" section of this MD&A.
2 Metal reported in concentrate is prior to deductions associated with smelter contract terms.
3 Includes refined zinc metal sold.
4 Annual consolidated results may not calculate based on amounts presented in this table due to rounding.
5 The Q3 2021 adjusted net earnings (loss) and adjusted net earnings (loss) per share have been adjusted for changes made in the computation of tax impacts on certain adjusting items. The adjusted net earnings per share changed from $ 0.15/share to adjusted net earnings of $0.00/share. See the "Trend Analysis and Quarterly Review" section of this MD&A for further details.
| Q3 2022 | Q2 2022 | Q1 2022 | 2021 5 | Q4 2021 | Q3 2021 | Q2 2021 | Q1 2021 | 2020 5 | Q4 2020 | Q3 2020 | ||||||||||||||||||||||||
| Peru Operations | ||||||||||||||||||||||||||||||||||
| Constancia ore mined1 | tonnes | 6,300,252 | 7,017,114 | 6,908,151 | 29,714,327 | 7,742,469 | 6,208,019 | 8,016,373 | 7,747,466 | 27,529,950 | 9,313,784 | 8,455,668 | ||||||||||||||||||||||
| Copper | % | 0.36 | 0.33 | 0.32 | 0.31 | 0.33 | 0.30 | 0.30 | 0.30 | 0.32 | 0.31 | 0.31 | ||||||||||||||||||||||
| Gold | g/tonne | 0.05 | 0.04 | 0.04 | 0.04 | 0.04 | 0.04 | 0.04 | 0.04 | 0.03 | 0.03 | 0.03 | ||||||||||||||||||||||
| Silver | g/tonne | 3.38 | 3.53 | 3.22 | 2.88 | 2.81 | 2.76 | 3.02 | 2.90 | 2.75 | 2.61 | 2.55 | ||||||||||||||||||||||
| Molybdenum | % | 0.01 | 0.01 | 0.01 | 0.01 | 0.01 | 0.01 | 0.01 | 0.01 | 0.02 | 0.01 | 0.02 | ||||||||||||||||||||||
| Pampacancha ore mined1 | tonnes | 2,488,928 | 1,211,387 | 847,306 | 5,141,001 | 2,107,196 | 2,050,813 | 982,992 | - | - | - | - | ||||||||||||||||||||||
| Copper | % | 0.29 | 0.29 | 0.27 | 0.27 | 0.27 | 0.27 | 0.26 | - | - | - | - | ||||||||||||||||||||||
| Gold | g/tonne | 0.23 | 0.28 | 0.43 | 0.30 | 0.34 | 0.27 | 0.27 | - | - | - | - | ||||||||||||||||||||||
| Silver | g/tonne | 4.30 | 4.25 | 4.06 | 4.02 | 4.26 | 3.58 | 4.43 | - | - | - | - | ||||||||||||||||||||||
| Molybdenum | % | 0.01 | 0.01 | 0.01 | 0.01 | 0.01 | 0.01 | 0.01 | - | - | - | - | ||||||||||||||||||||||
| Ore milled | tonnes | 7,742,020 | 7,770,706 | 7,213,833 | 28,809,755 | 8,048,925 | 6,985,035 | 7,413,043 | 6,362,752 | 26,297,318 | 7,741,714 | 7,480,655 | ||||||||||||||||||||||
| Copper | % | 0.34 | 0.32 | 0.31 | 0.32 | 0.33 | 0.30 | 0.31 | 0.33 | 0.34 | 0.33 | 0.33 | ||||||||||||||||||||||
| Gold | g/tonne | 0.08 | 0.09 | 0.08 | 0.08 | 0.11 | 0.11 | 0.07 | 0.04 | 0.03 | 0.03 | 0.03 | ||||||||||||||||||||||
| Silver | g/tonne | 3.48 | 3.64 | 3.26 | 3.35 | 3.67 | 3.93 | 2.88 | 2.84 | 2.87 | 2.74 | 2.68 | ||||||||||||||||||||||
| Molybdenum | % | 0.01 | 0.01 | 0.01 | 0.01 | 0.01 | 0.01 | 0.01 | 0.01 | 0.02 | 0.02 | 0.02 | ||||||||||||||||||||||
| Copper recovery | % | 84.5 | 85.0 | 85.3 | 84.6 | 86.0 | 84.9 | 83.3 | 84.1 | 83.0 | 85.3 | 83.3 | ||||||||||||||||||||||
| Gold recovery | % | 61.9 | 60.3 | 59.8 | 64.6 | 63.6 | 71.9 | 62.2 | 52.0 | 49.8 | 52.7 | 51.6 | ||||||||||||||||||||||
| Silver recovery | % | 65.2 | 64.2 | 66.9 | 63.7 | 60.8 | 59.1 | 68.2 | 69.9 | 66.9 | 70.1 | 66.7 | ||||||||||||||||||||||
| Molybdenum recovery | % | 41.0 | 38.8 | 21.1 | 31.5 | 26.7 | 33.5 | 33.3 | 33.4 | 29.4 | 28.4 | 30.4 | ||||||||||||||||||||||
| Contained metal in concentrate | ||||||||||||||||||||||||||||||||||
| Copper | tonnes | 22,302 | 20,880 | 19,166 | 77,813 | 22,856 | 18,072 | 19,058 | 17,827 | 73,150 | 21,554 | 20,803 | ||||||||||||||||||||||
| Gold | ounces | 12,722 | 13,858 | 10,789 | 50,306 | 17,917 | 17,531 | 10,220 | 4,638 | 12,395 | 3,689 | 3,333 | ||||||||||||||||||||||
| Silver | ounces | 564,299 | 584,228 | 505,568 | 1,972,949 | 578,140 | 521,036 | 468,057 | 405,714 | 1,622,972 | 477,775 | 430,208 | ||||||||||||||||||||||
| Molybdenum | tonnes | 437 | 390 | 207 | 1,146 | 275 | 282 | 295 | 294 | 1,204 | 333 | 392 | ||||||||||||||||||||||
| Payable metal sold | ||||||||||||||||||||||||||||||||||
| Copper | tonnes | 20,718 | 18,473 | 16,825 | 71,398 | 20,551 | 16,065 | 19,946 | 14,836 | 68,506 | 18,583 | 21,654 | ||||||||||||||||||||||
| Gold | ounces | 11,970 | 8,430 | 14,452 | 41,807 | 16,304 | 16,902 | 5,638 | 2,963 | 10,986 | 3,297 | 3,753 | ||||||||||||||||||||||
| Silver | ounces | 513,470 | 484,946 | 636,133 | 1,490,651 | 380,712 | 457,263 | 315,064 | 337,612 | 1,518,548 | 480,843 | 433,595 | ||||||||||||||||||||||
| Molybdenum | tonnes | 511 | 208 | 213 | 1,098 | 245 | 304 | 265 | 284 | 1,321 | 457 | 313 | ||||||||||||||||||||||
| Peru combined unit operating cost 2,3,4 | $/tonne | $ | 13.06 | $ | 12.02 | $ | 12.37 | $ | 10.70 | $ | 9.96 | $ | 10.93 | $ | 10.40 | $ | 11.74 | $ | 9.46 | $ | 10.17 | $ | 9.85 | |||||||||||
| Peru cash cost3 | $/lb | $ | 1.68 | $ | 1.82 | $ | 1.54 | $ | 1.54 | $ | 1.28 | $ | 1.26 | $ | 1.85 | $ | 1.82 | $ | 1.45 | $ | 1.47 | $ | 1.54 | |||||||||||
| Peru sustaining cash cost3 | $/lb | $ | 2.46 | $ | 2.62 | $ | 2.27 | $ | 2.46 | $ | 2.46 | $ | 2.31 | $ | 2.69 | $ | 2.36 | $ | 2.20 | $ | 2.58 | $ | 2.29 |
1 Reported tonnes and grade for ore mined are estimates based on mine plan assumptions and may not fully reconcile to ore milled.
2 Reflects combined mine, mill and general and administrative ("G&A") costs per tonne of ore milled. Reflects the deduction of expected capitalized stripping costs.
3 Combined unit costs, cash cost, and sustaining cash cost per pound of copper produced, net of by-product credits, are non-IFRS financial performance measures with no standardized definition under IFRS. For further information and a detailed reconciliation, please see the discussion under the "Non-IFRS Financial Performance Measures" section of this MD&A
4 2022 and 2021 combined unit costs exclude COVID-19 related costs.
5 Annual consolidated results may not calculate based on amounts presented in this table due to rounding.
| Q3 2022 | Q2 2022 | Q1 2022 | 2021 1 | Q4 2021 | Q3 2021 | Q2 2021 | Q1 2021 | 2020 1 | Q4 2020 | Q3 2020 | ||||||||||||||||||||||||
| Manitoba Operations | ||||||||||||||||||||||||||||||||||
| Lalor ore mined | tonnes | 347,345 | 412,653 | 386,752 | 1,593,141 | 422,208 | 392,380 | 356,951 | 421,602 | 1,654,240 | 468,101 | 357,213 | ||||||||||||||||||||||
| Copper | % | 0.71 | 0.70 | 0.80 | 0.71 | 0.78 | 0.86 | 0.64 | 0.57 | 0.74 | 0.80 | 0.66 | ||||||||||||||||||||||
| Zinc | % | 3.27 | 3.06 | 4.06 | 4.23 | 4.19 | 3.60 | 3.81 | 5.20 | 5.73 | 5.54 | 5.98 | ||||||||||||||||||||||
| Gold | g/tonne | 4.57 | 3.73 | 3.76 | 3.41 | 3.92 | 3.85 | 3.19 | 2.67 | 2.51 | 2.79 | 2.28 | ||||||||||||||||||||||
| Silver | g/tonne | 21.27 | 23.95 | 22.94 | 24.66 | 30.35 | 22.13 | 22.98 | 22.75 | 25.31 | 24.96 | 21.23 | ||||||||||||||||||||||
| 777 ore mined | tonnes | - | 226,286 | 258,069 | 1,053,710 | 266,744 | 256,536 | 255,170 | 275,260 | 991,576 | 164,856 | 264,905 | ||||||||||||||||||||||
| Copper | % | 0.00 | 1.03 | 1.19 | 1.28 | 1.13 | 1.06 | 0.82 | 2.06 | 1.40 | 1.89 | 0.98 | ||||||||||||||||||||||
| Zinc | % | 0.00 | 3.51 | 4.12 | 3.91 | 4.16 | 3.88 | 3.57 | 4.00 | 3.88 | 2.98 | 3.95 | ||||||||||||||||||||||
| Gold | g/tonne | 0.00 | 1.62 | 1.69 | 2.03 | 1.80 | 1.96 | 1.97 | 2.39 | 1.90 | 1.85 | 2.01 | ||||||||||||||||||||||
| Silver | g/tonne | 0.00 | 20.63 | 21.05 | 25.25 | 25.02 | 22.99 | 23.35 | 29.32 | 24.13 | 21.64 | 24.25 | ||||||||||||||||||||||
| Stall & New Britannia Concentrator Combined: | ||||||||||||||||||||||||||||||||||
| Ore milled | tonnes | 362,108 | 406,006 | 397,301 | 1,506,756 | 419,727 | 408,201 | 317,484 | 361,344 | 1,412,751 | 372,624 | 335,739 | ||||||||||||||||||||||
| Copper | % | 0.69 | 0.73 | 0.82 | 0.72 | 0.75 | 0.82 | 0.68 | 0.60 | 0.73 | 0.79 | 0.68 | ||||||||||||||||||||||
| Zinc | % | 3.33 | 3.20 | 4.24 | 4.30 | 4.12 | 3.58 | 4.06 | 5.53 | 5.76 | 5.47 | 6.11 | ||||||||||||||||||||||
| Gold | g/tonne | 4.60 | 3.93 | 3.87 | 3.42 | 3.90 | 3.84 | 3.19 | 2.57 | 2.55 | 2.88 | 2.35 | ||||||||||||||||||||||
| Silver | g/tonne | 20.66 | 23.98 | 23.16 | 24.95 | 30.07 | 23.32 | 22.02 | 23.40 | 25.37 | 24.43 | 22.08 | ||||||||||||||||||||||
| Copper recovery | % | 88.3 | 89.5 | 87.5 | 86.8 | 88.7 | 84.3 | 88.8 | 85.7 | 86.2 | 87.1 | 84.0 | ||||||||||||||||||||||
| Zinc recovery | % | 80.9 | 75.5 | 85.7 | 88.9 | 87.4 | 88.2 | 88.1 | 91.1 | 91.9 | 90.9 | 92.7 | ||||||||||||||||||||||
| Gold recovery | % | 60.9 | 58.8 | 58.4 | 54.9 | 54.6 | 53.4 | 55.5 | 57.5 | 60.0 | 59.5 | 57.4 | ||||||||||||||||||||||
| Silver recovery | % | 57.6 | 58.1 | 60.0 | 54.4 | 53.9 | 52.7 | 55.1 | 56.2 | 60.4 | 60.3 | 57.5 | ||||||||||||||||||||||
| Flin Flon Concentrator: | ||||||||||||||||||||||||||||||||||
| Ore milled | tonnes | - | 243,312 | 254,032 | 1,133,516 | 262,565 | 258,062 | 329,503 | 283,386 | 1,205,314 | 225,663 | 322,156 | ||||||||||||||||||||||
| Copper | % | - | 1.02 | 1.20 | 1.23 | 1.12 | 1.06 | 0.89 | 1.88 | 1.28 | 1.59 | 0.99 | ||||||||||||||||||||||
| Zinc | % | - | 3.60 | 4.13 | 3.95 | 4.16 | 3.86 | 3.65 | 4.20 | 4.21 | 3.87 | 4.07 | ||||||||||||||||||||||
| Gold | g/tonne | - | 1.64 | 1.70 | 2.04 | 1.78 | 1.96 | 2.06 | 2.34 | 1.96 | 1.99 | 1.99 | ||||||||||||||||||||||
| Silver | g/tonne | - | 20.76 | 21.23 | 24.90 | 25.04 | 22.93 | 23.65 | 28.01 | 24.26 | 22.65 | 24.01 | ||||||||||||||||||||||
| Copper recovery | % | - | 85.5 | 87.6 | 87.7 | 86.7 | 85.2 | 84.8 | 91.3 | 86.0 | 88.1 | 83.9 | ||||||||||||||||||||||
| Zinc recovery | % | - | 82.9 | 83.2 | 83.0 | 83.1 | 82.2 | 84.8 | 81.8 | 85.5 | 83.9 | 87.9 | ||||||||||||||||||||||
| Gold recovery | % | - | 56.4 | 57.7 | 58.5 | 59.2 | 58.1 | 52.9 | 64.0 | 56.0 | 56.6 | 55.3 | ||||||||||||||||||||||
| Silver recovery | % | - | 51.0 | 52.5 | 45.1 | 45.6 | 42.4 | 37.5 | 54.1 | 45.9 | 46.5 | 42.0 | ||||||||||||||||||||||
1 Annual consolidated results may not calculate based on amounts presented in this table due to rounding.
| Q3 2022 | Q2 2022 | Q1 2022 | 2021 4 | Q4 2021 | Q3 2021 | Q2 2021 | Q1 2021 | 2020 4 | Q4 2020 | Q3 2020 | ||||||||||||||||||||||||
| Manitoba Operations (continued) | ||||||||||||||||||||||||||||||||||
| Total Manitoba contained metal in concentrate produced | ||||||||||||||||||||||||||||||||||
| Copper | tonnes | 2,196 | 4,788 | 5,536 | 21,657 | 5,342 | 5,173 | 4,416 | 6,726 | 22,183 | 5,724 | 4,592 | ||||||||||||||||||||||
| Zinc | tonnes | 9,750 | 17,053 | 22,252 | 93,529 | 23,207 | 20,844 | 21,538 | 27,940 | 118,130 | 25,843 | 30,570 | ||||||||||||||||||||||
| Gold | ounces | 32,570 | 37,346 | 36,887 | 134,475 | 37,644 | 36,341 | 29,628 | 30,862 | 112,227 | 28,687 | 25,944 | ||||||||||||||||||||||
| Silver | ounces | 138,615 | 264,651 | 268,743 | 1,066,003 | 315,054 | 242,131 | 217,859 | 290,959 | 1,127,901 | 252,904 | 241,477 | ||||||||||||||||||||||
| Precious metal in doré produced | ||||||||||||||||||||||||||||||||||
| Gold | ounces | 7,887 | 7,441 | 6,280 | 9,002 | 8,598 | 404 | - | - | - | - | - | ||||||||||||||||||||||
| Silver | ounces | 14,155 | 15,974 | 10,046 | 6,529 | 6,519 | 10 | - | - | - | - | - | ||||||||||||||||||||||
| Total Manitoba payable metal sold and doré | ||||||||||||||||||||||||||||||||||
| Copper | tonnes | 4,081 | 5,177 | 3,784 | 20,802 | 4,408 | 5,071 | 5,230 | 6,093 | 20,382 | 4,380 | 4,249 | ||||||||||||||||||||||
| Zinc1 | tonnes | 7,363 | 20,793 | 17,306 | 96,435 | 21,112 | 21,619 | 25,361 | 28,343 | 109,347 | 28,431 | 26,520 | ||||||||||||||||||||||
| Gold | ounces | 54,962 | 42,454 | 33,891 | 126,551 | 40,623 | 30,941 | 32,567 | 22,420 | 111,963 | 31,882 | 26,852 | ||||||||||||||||||||||
| Silver | ounces | 302,946 | 253,225 | 228,458 | 936,857 | 257,928 | 244,338 | 262,443 | 172,148 | 1,067,038 | 281,541 | 271,900 | ||||||||||||||||||||||
| Manitoba combined unit operating cost2,3 | C$/tonne | $ | 235 | 168 | 176 | $ | 154 | $ | 168 | $ | 147 | $ | 148 | $ | 151 | $ | 132 | $ | 140 | $ | 126 | |||||||||||||
| Manitoba copper cash cost3 | $/lb | $ | (10.64 | ) | (4.48 | ) | (0.40 | ) | $ | (2.11 | ) | $ | (2.77 | ) | $ | (1.64 | ) | $ | (3.51 | ) | $ | (1.04 | ) | $ | (2.20 | ) | $ | (3.48 | ) | $ | (3.41 | ) | ||
| Manitoba sustaining copper cash cost3 | $/lb | $ | (3.71 | ) | (1.40 | ) | 2.33 | $ | 0.69 | $ | (0.23 | ) | $ | 0.75 | $ | 0.36 | $ | 1.62 | $ | 1.02 | $ | (0.36 | ) | $ | 0.83 | |||||||||
| Manitoba gold cash cost 3, 5 | $/oz | $ | 216 | (207 | ) | 416 | $ | - | $ | - | $ | - | $ | - | $ | - | $ | - | $ | - | $ | - | ||||||||||||
| Manitoba sustaining gold cash cost 3,5 | $/oz | $ | 1,045 | 519 | 1,187 | $ | - | $ | - | $ | - | $ | - | $ | - | $ | - | $ | - | $ | - | |||||||||||||
1 Includes refined zinc metal sold.
2 Reflects combined mine, mill and G&A costs per tonne of milled ore.
3 Combined unit costs, cash cost, and sustaining cash cost per pound of copper produced, cash cost, and sustaining cash cost per ounce of gold produced, net of by-product credits, are non-IFRS financial performance measures with no standardized definition under IFRS. For further information and a detailed reconciliation, please see the discussion under the "Non-IFRS Financial Performance Measures" section of this MD&A.
4 Annual consolidated results may not calculate based on amounts presented in this table due to rounding.
5 Cash cost and sustaining cash cost per ounce of gold produced, net of by-product credits were introduced in 2022 and do not have a published comparative.