
Management's Discussion and Analysis of
Results of Operations and Financial Condition
For the year ended
December 31, 2022
February 23, 2023
INTRODUCTION
This Management's Discussion and Analysis ("MD&A") dated February 23, 2023 is intended to supplement Hudbay Minerals Inc.'s audited consolidated financial statements and related notes for the year ended December 31, 2022 and 2021 (the "consolidated financial statements"). The consolidated financial statements have been prepared in accordance with International Financial Reporting Standards ("IFRS"), as issued by the International Accounting Standards Board ("IASB").
References to "Hudbay", the "Company", "we", "us", "our" or similar terms refer to Hudbay Minerals Inc. and its direct and indirect subsidiaries as at December 31, 2022.
Readers should be aware that:
- This MD&A contains certain "forward-looking statements" and "forward-looking information" (collectively, "forward-looking information") that are subject to risk factors set out in a cautionary note contained in this MD&A.
- This MD&A has been prepared in accordance with the requirements of the securities laws in effect in Canada, which may differ materially from the requirements of United States securities laws applicable to US issuers.
- We use a number of non-IFRS financial performance measures in this MD&A. Please see the discussion under the "Non-IFRS Financial Performance Measures" section herein.
- The technical and scientific information in this MD&A has been approved by qualified persons based on a variety of assumptions and estimates.
For a discussion of each of the above matters, readers are urged to review the "Notes to Reader" discussion beginning on page 69 of this MD&A.
Additional information regarding Hudbay, including the risks related to our business and those that are reasonably likely to affect our consolidated financial statements in the future, is contained in our continuous disclosure materials, including our most recent Annual Information Form ("AIF"), consolidated financial statements and Management Information Circular available on SEDAR at www.sedar.com and on EDGAR at www.sec.gov.
All amounts are in US dollars unless otherwise noted.
OUR BUSINESS
We are a diversified mining company with long-life assets in North and South America. Our Constancia operations in Cusco (Peru) produce copper with gold, silver and molybdenum by-products. Our Snow Lake operations in Manitoba (Canada) produce gold with copper, zinc and silver by-products. We have an organic pipeline that includes the Copper World project in Arizona and the Mason project in Nevada (United States), and our growth strategy is focused on the exploration, development, operation, and optimization of properties we already control, as well as other mineral assets we may acquire that fit our strategic criteria. We are governed by the Canada Business Corporations Act and our shares are listed under the symbol "HBM" on the Toronto Stock Exchange, New York Stock Exchange and Bolsa de Valores de Lima.
STRATEGY
Our mission is to create sustainable value through the acquisition, development and operation of high quality, long life deposits with exploration potential in jurisdictions that support responsible mining, and to see the regions and communities in which we operate benefit from our presence.
We believe that copper is the commodity with the best long-term supply/demand fundamentals and offers shareholders the greatest opportunity for sustained risk-adjusted returns. Through the discovery and successful development of economic mineral deposits, and through highly efficient low-cost operations to extract the metals, we believe sustainable value will be created for all stakeholders.
Hudbay's successful development, ramp-up and operation of the Constancia open-pit mine in Peru, our long history of underground mining and full life-cycle experience in northern Manitoba, and our track record of reserve expansion through effective exploration, and our organic pipeline of copper development projects including Copper World, Mason and Llaguen, provide us with a competitive advantage relative to other mining companies of similar scale.
Over the past decade, we have built a world-class asset portfolio by executing a consistent long-term growth strategy focused on copper. We continuously work to generate strong free cash flow and optimize the value of our producing assets through exploration, brownfield expansion projects and efficient and safe operations. Furthermore, we intend to sustainably grow Hudbay through the exploration and development of our robust project pipeline, as well as through the acquisition of other properties that fit our stringent strategic criteria.
To ensure that any investment in our existing assets or acquisition of other mineral assets is consistent with our mission and creates sustainable value for stakeholders, we have established a number of criteria for evaluating these opportunities. The criteria include the following:
- Sustainability: We are focused on jurisdictions that support responsible mining activity. Our current geographic focus is on select investment grade countries in the Americas, with strong rule of law and respect for human rights consistent with our long-standing focus on environmental, social and governance ("ESG") principles;
- Copper Focus: We believe copper is the commodity with the best long-term supply/demand fundamentals. Global copper mine supply is challenged due to declining industry grades, limited exploration success and an insufficient pipeline of development-ready projects while demand will continue to increase through global decarbonization initiatives. We believe this long-term supply/demand gap will create opportunities for increased risk-adjusted returns. While our primary focus is on copper, we recognize the polymetallic nature of copper deposits and, in particular, the counter-cyclical nature of gold in our portfolio;
- Quality: We are focused on investing in long-life, low-cost, expandable, high-quality assets that can capture peak pricing of multiple commodity price cycles and can generate free cash flow through the trough of price cycles;
- Potential: We consider the full spectrum of acquisition and investment opportunities, from early-stage exploration to producing assets, that offer significant incremental potential for exploration, development, expansion and optimization beyond the stated resources and mine plan;
- Process: We develop a clear understanding of how an investment or acquisition can create value through our robust due diligence and capital allocation process that applies our technical, social, operational and project execution expertise;
- Operatorship: We believe value is created through leveraging Hudbay's competitive advantages in safe and efficient operations and effective exploration and project development and community relations. While operatorship is a key criterion, we are open to joint venture and partnerships that de-risk our portfolio and increase risk-adjusted returns; and
- Capital Allocation: We pursue investments and acquisitions that are accretive to Hudbay on a per share basis. Given that our strategic focus includes allocating capital to assets at various stages of development, when evaluating accretion, we will consider measures such as internal rate of return ("IRR"), return on invested capital ("ROIC"), net asset value per share and the contained value of reserves and resources per share.
Our key objectives for 2023 are to:
- Deliver copper and gold production growth with low cash costs driven by efficient operations;
- Position Hudbay to unlock its copper development pipeline through generating cash flow, managing discretionary spending, deleveraging and achieving strong returns on invested capital;
- De-risk the Copper World project through the completion of pre-feasibility studies, state permitting activities, evaluating a bulk sampling program and a potential joint venture partnership;
- Progress Constancia's leading efficiency metrics by applying smart technologies to continuously improve operating performance, including sensor-based ore sorting and the mill recovery improvement project;
- Advance plans to drill the prospective Maria Reyna and Caballito properties near Constancia;
- Continue to navigate the complex environment in Peru while maintaining aligned and supportive relationships with local communities;
- Execute expansion opportunities in Snow Lake with the completion of the Stall mill recovery improvement program and the ramp up beyond 4,650 tonnes per day at Lalor;
- Test the down-dip extensions at Lalor where the gold and copper zones remain open at depth and have the potential to expand Snow Lake gold mineralization beyond the current 2.4 million ounces of reserves and 1.7 million ounces of resources;
- Investigate opportunities to utilize the operating infrastructure in Snow Lake for potential future tailings reprocessing;
- Assess opportunities to reduce greenhouse gas emissions in alignment with our climate change commitments and global decarbonization goals;
- Prudently advance the three pre-requisites plan required for Copper World sanctioning; and
- Evaluate and execute growth opportunities that meet our stringent strategic criteria and allocate capital to pursue those opportunities that create sustainable value for the company and our stakeholders.
SUMMARY
Fourth Quarter and Full Year Operating and Financial Results
- Achieved 2022 consolidated production guidance for all metals and consolidated cash cost and sustaining cash cost guidance.
- Full year consolidated copper production of 104,173 tonnes, consolidated gold production of 219,700 ounces and consolidated silver production of 3,161,294 increased by 5%, 13% and 4%, respectively, in 2022 compared to 2021.
- The Peru operations delivered strong performance in the fourth quarter with a 21% increase in copper production and a 64% increase in gold production, compared to the third quarter of 2022, as grades and recoveries improved. The fourth quarter of 2022 was a record quarter for gold production in Peru. Peru's cash cost per pound of copper produced, net of by-product credits1, improved to $1.34 in the fourth quarter, representing a 20% decline compared to the third quarter of 2022.
- The Manitoba operations saw a 6% increase in Lalor's ore production in the fourth quarter compared to the third quarter of 2022, and the Lalor mine continues to ramp up following the transition of Flin Flon employees to Snow Lake. Manitoba's full year gold cash cost per ounce of gold produced, net of by-product credits1, was 1% below the low end of the annual guidance range.
- Full year consolidated cash cost and sustaining cash cost per pound of copper produced, net of by-product credits1, were $0.86 and $2.07, respectively, and similar to 2021 levels, despite inflationary cost pressures which were offset by higher copper production and higher by-product credits.
- Fourth quarter net loss and loss per share were $17.4 million and $0.07, respectively. After adjusting for a non-cash loss of $13.5 million related to a quarterly revaluation of the Flin Flon environmental reclamation provision due to changes in real, long-term risk-free discount rates, and an $8.0 million revaluation loss related to the gold prepayment liability, among other items, fourth quarter adjusted earnings1 per share were $0.01.
- Operating cash flow before change in non-cash working capital was $109.1 million and adjusted EBITDA1 was $124.7 million in the fourth quarter, an increase of 34% and 26%, respectively, over the third quarter of 2022, benefiting from higher copper sales volumes and higher molybdenum prices and sales volumes, but negatively impacted by a temporary buildup of unsold inventory in Peru.
- Constancia continued to operate throughout nation-wide road blockades in Peru in December and while the company was successful in completing two port shipments in December, inventory of approximately 25,000 wet metric tonnes of copper concentrate in Peru was unsold at the end of the quarter.
Executing on Growth Initiatives and Disciplined Capital Allocation
- Successful completion of recent brownfield investment program in 2022 with the Pampacancha satellite deposit contributing higher grade feed to Constancia and the New Britannia mill operating at targeted capacity.
- Invested approximately $80 million in 2022 to successfully execute a new strategy at Copper World focused on project de-risking. The pre-feasibility study for Phase I of Copper World is well-advanced with the main facility engineering completed and metallurgical test work being analyzed as part of the concentrate leaching trade off evaluations.
- Reached a community exploration agreement in 2022 to access the Maria Reyna and Caballito satellite properties located north of Constancia in Peru. Completed the surface investigation work needed to support drill permit applications.
- Initiated deep drilling at Lalor in January 2023 to test the down-dip gold and copper extensions and potentially unlock further value in Snow Lake.
- The Stall recovery improvement program is well-advanced and remains on track for completion in early 2023 with higher gold and copper recoveries expected to commence in the second quarter of 2023.
- Reinvigorated focus on free cash flow and delivered on discretionary spending reduction targets by reducing 2022 growth capital and exploration spending by approximately $30 million in Arizona, Manitoba and Peru.
- Reduced 2023 discretionary spending by more than $50 million primarily related to the deferral of the Copper World definitive feasibility study and the pebble crusher in Peru.
- Repaid approximately 50% of the original gold prepayment liability in 2022 and we remain focused on reducing net debt throughout 2023.
- Prudent approach to capital allocation demonstrated with the introduction of three prerequisites for sanctioning Copper World, including a prudent financing strategy with multi-faceted financial targets focused on a minimum cash balance, a stated maximum leverage, limited non-recourse project level debt and committed financial partners.
2023 Annual Guidance and Outlook
- Consolidated copper production is forecast to increase by approximately 10%2 to 114,0002 tonnes in 2023, compared to 2022, with higher grades from the Pampacancha deposit in Peru.
- Consolidated gold production is forecast to increase by 30%2 to 285,5002 ounces, compared to 2022, due to significantly higher gold production in Peru and Manitoba.
- Consolidated copper and gold production is expected to further increase in 2024, similar to the previously issued guidance, and 2025 copper and gold production is expected to benefit from an extension of mining activities at Pampacancha into the first half of 2025.
- Consolidated cash cost, net of by-product credits1, in 2023 is expected to decline by 30%2 and be within a range of $0.40 and $0.80 per pound of copper as a result of higher copper production and gold by-product credits.
- Approximately $65 million reduction in growth capital expenditures and exploration spending is expected in 2023 compared to 2022.
- Total capital expenditures are expected to decline by approximately 13% year-over-year to $300 million in 2023.
- Exploration expenditures are expected to decline by approximately 61% in 2023 as activities are focused on areas with high potential for new discovery and mineral reserve and resource expansion.
Summary of Fourth Quarter Results
Cash generated from operating activities in the fourth quarter of 2022 decreased to $86.4 million compared to $97.1 million in the same quarter of 2021. Peru operations were impacted by increasing tensions, protests, and social unrest following a change in political leadership in December 2022. Constancia has continued to operate throughout these disruptions but our ability to steadily receive critical supplies, such as fuel, and to transport concentrates has been impacted. Operating cash flow before change in non-cash working capital was $109.1 million during the fourth quarter of 2022, reflecting a decrease of $47.8 million compared to the same period of 2021. The decrease was primarily the result of lower copper prices, lower zinc and gold sales volumes, inflationary cost pressures on mine operating costs and higher treatment and refining charges, partially offset by higher molybdenum prices and sales volumes and higher copper sales volumes. Zinc and gold sales volumes were lower than the prior year primarily due to the planned closure of the Company's 777 mine in June 2022.
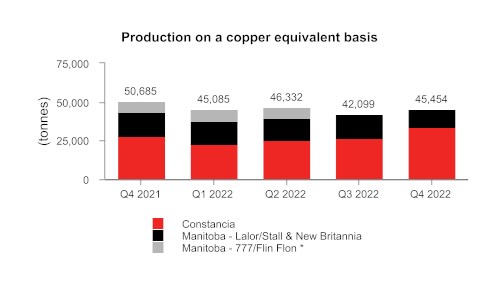
Production in the fourth quarter of 2022 did not include any production from the 777 mine, which closed, as planned, in June 2022. The comparison in this paragraph excludes the production from the 777 mine in the fourth quarter of 2021 to illustrate the comparative performance of our current operations. Consolidated copper production in the fourth quarter of 2022 increased by 14% compared to the same period in 2021 primarily due to higher copper grades in Peru. Consolidated gold production in the fourth quarter of 2022 decreased by 2% compared to the fourth quarter of 2021, due to lower throughput in Manitoba and Peru resulting from planned maintenance programs, partially offset by higher recoveries in Peru, higher Lalor gold grades and higher recoveries at Stall. Consolidated zinc production in the fourth quarter decreased by 55%, versus the comparative 2021 quarter due to the transition of mining toward the gold lenses at Lalor and a corresponding decrease of production from the base metal zones. Consolidated silver production in the fourth quarter decreased by 1% compared to the same period in 2021, due to lower Manitoba and Peru throughput and silver grades at Lalor, partially offset by higher recoveries. For a comprehensive comparison to the prior period (which includes production from the 777 mine), please refer to "Manitoba Operations Review" section.
Net loss and loss per share in the fourth quarter of 2022 were $17.4 million and $0.07, respectively, compared to a net loss and loss per share of $10.5 million and $0.04, respectively, in the fourth quarter of 2021. The 2022 fourth quarter results were negatively impacted by a non-cash loss of $13.5 million related to the quarterly revaluation of our Flin Flon environmental reclamation provision due to changes in real, long-term discount rates, an $8.0 million revaluation loss related to the gold prepayment liability and a $5.8 million loss on changes to other provisions. These costs were offset by a $2.4 million Manitoba post-employment plan curtailment gain.
Adjusted net earnings1 and adjusted net earnings per share1 in the fourth quarter of 2022 were $2.6 million and $0.01 per share, respectively, after adjusting for the non-cash revaluation loss of the environmental reclamation provision and the revaluation loss on the gold prepayment liability, among other items. This compares to adjusted net earnings and adjusted net earnings per share of $32.7 million, and $0.13 in the same period of 2021. Fourth quarter adjusted EBITDA1 was $124.7 million, compared to $180.8 million in the same period of 2021.
In the fourth quarter of 2022, consolidated cash cost per pound of copper produced, net of by-product credits1, was $1.08, compared to $0.51 in the same period in 2021. This increase was a result of lower precious metal by-product credits, inflationary cost pressures on operating costs and higher freight, treatment and refining charges, partially offset by slightly higher copper production. Consolidated sustaining cash cost per pound of copper produced, net of by-product credits1, was $2.21 in the fourth quarter of 2022 compared to $1.95 in the same period in 2021. This increase was primarily due to the same reasons outlined above, slightly offset by lower cash sustaining capital expenditures in Peru.
Consolidated all-in sustaining cash cost per pound of copper produced, net of by-product credits1, was $2.41 in the fourth quarter of 2022, higher than $2.20 in the same period in 2021, due to the same reasons outlined above partially offset by lower corporate selling and administrative expenses.
As at December 31, 2022, our liquidity includes $225.7 million in cash as well as undrawn availability of $354.3 million under our revolving credit facilities. We expect that our current liquidity combined with cash flow from operations, will be sufficient to meet our liquidity needs for the foreseeable future.
Summary of Full Year Results
We achieved our 2022 consolidated production guidance for all metals. However, production of copper and gold was at the lower end of the guidance range primarily due to lower-than-planned grades in the fourth quarter in Peru caused by short-term mine plan changes that were implemented to mitigate the risks associated with logistical and supply chain disruptions in Peru.
Cash generated from operating activities increased to $487.8 million in 2022 from $385.1 million in 2021. A portion of the increase is due to changes in non-cash working capital caused primarily by timing and changes in provisionally priced receivables and changes to other financial assets, liabilities and inventories. Operating cash flow before changes in non-cash working capital decreased to $391.7 million from $483.9 million in 2021. The decrease is the result of lower copper prices, lower zinc sales volumes and inflationary cost pressures on mine operating costs, partially offset by higher zinc prices and higher gold sales volumes. Zinc sales volumes were lower than the prior year due to the planned closure of the 777 mine in June 2022.
Excluding production from 777, consolidated copper, gold and silver production in the full year 2022 increased by 14%, 36% and 13%, respectively, compared to the same period in 2021 primarily due to higher throughput in Peru and Manitoba as well as higher overall copper and gold grades.
Net earnings and earnings per share for 2022 were $70.4 million and $0.27, respectively, compared to a net loss and loss per share of $244.4 million and $0.93, respectively, in 2021. The prior period results were negatively impacted by a $193.5 million revaluation of our Flin Flon environmental reclamation provision resulting in an impairment charge of the same amount as well as a $66.7 million in mark-to-market loss mostly from $49.8 million of write-offs for a non-cash embedded derivative on the early redemption option associated with our extinguished senior unsecured notes. Full year 2022 net earnings benefited from a non-cash gain of $133.5 million related to the revaluation of our Flin Flon environmental reclamation provision. The full year 2022 financial results were negatively impacted by a $95.0 million pre-tax impairment loss related to certain specific capitalized costs and assets associated with the previous stand-alone development plan for the Rosemont deposit, which were determined to no longer be recoverable.
Consolidated cash costs per pound of copper produced, net of by-product credits, in 2022 was $0.86 compared to $0.74 in 2021 and consolidated sustaining cash cost per pound of copper produced, net of by-product credits, in 2022 remained unchanged from 2021 at $2.07. Both measures remained in line with our 2022 guidance ranges.
* Mining activities at 777 were completed in June 2022

1 Adjusted net earnings (loss) and adjusted net earnings (loss) per share, adjusted EBITDA, cash cost, sustaining cash cost, all-in sustaining cash cost per pound of copper produced, net of by-product credits, cash cost, sustaining cash cost per ounce of gold produced, net of by-product credits, combined unit cost and net debt are non-IFRS financial performance measures with no standardized definition under IFRS. For further information and a detailed reconciliation, please see the discussion under the "Non-IFRS Financial Performance Measures" section of this MD&A.
2 Calculated using the mid-point of the guidance range.
KEY FINANCIAL RESULTS
| Financial Condition | | Dec. 31, 2022 | | | Dec. 31, 2021 | |
| (in $ thousands) | | | | | | |
| Cash | $ | 225,665 | | $ | 270,989 | |
| Total long-term debt | | 1,184,162 | | | 1,180,274 | |
| Net debt1 | | 958,497 | | | 909,285 | |
| Working capital2 | | 76,534 | | | 147,512 | |
| Total assets | | 4,325,943 | | | 4,616,231 | |
| Equity | | 1,571,809 | | | 1,476,828 | |
| 1 Net debt is a non-IFRS financial performance measure with no standardized definition under IFRS. For further information and a detailed reconciliation, please see discussion under the "Non-IFRS Financial Performance Measures" section of this MD&A. |
| 2 Working capital is determined as total current assets less total current liabilities as defined under IFRS and disclosed on the consolidated financial statements. |
| Financial Performance | | Three months ended | | | Year ended | |
(in $ thousands, except per share amounts or
as noted below) | | Dec. 31, 2022 | | | Dec. 31, 2021 | | | Dec. 31, 2022 | | | Dec. 31, 2021 | |
| Revenue | $ | 321,196 | | $ | 425,170 | | $ | 1,461,440 | | $ | 1,501,998 | |
| Cost of sales | | 251,520 | | | 343,426 | | | 1,184,552 | | | 1,370,979 | |
| (Loss) earnings before tax | | (14,287 | ) | | (149 | ) | | 95,815 | | | (202,751 | ) |
| Net (loss) earnings | | (17,441 | ) | | (10,453 | ) | | 70,382 | | | (244,358 | ) |
| Basic and diluted (loss) earnings per share | | (0.07 | ) | | (0.04 | ) | | 0.27 | | | (0.93 | ) |
| Adjusted earnings per share1 | | 0.01 | | | 0.13 | | | 0.10 | | | 0.09 | |
| Operating cash flow before changes in non-cash working capital2 | | 109.1 | | | 156.9 | | | 391.7 | | | 483.9 | |
| Adjusted EBITDA1,2 | | 124.7 | | | 180.8 | | | 475.9 | | | 547.8 | |
| 1 Adjusted earnings per share and adjusted EBITDA are non-IFRS financial performance measures with no standardized definition under IFRS. For further information and a detailed reconciliation, please see discussion under the "Non-IFRS Financial Performance Measures" section of this MD&A. |
| 2 In $ millions. |
KEY PRODUCTION RESULTS
| | | Three months ended | | | Three months ended | |
| | Dec. 31, 2022 | | | Dec. 31, 2021 | |
| | Peru | | | Manitoba | | | Total | | | Peru | | | Manitoba | | | Total | |
| Contained metal in concentrate and doré produced 1 | | | | | | | | | | | | | |
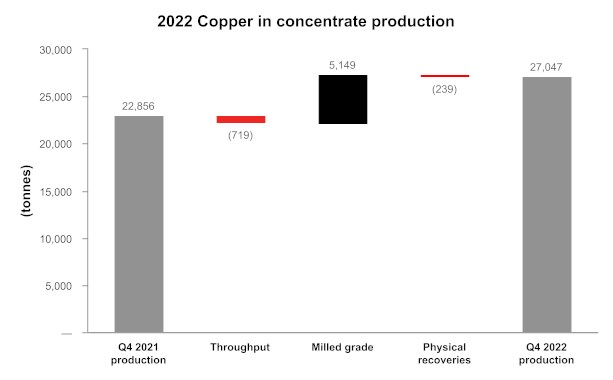
| Copper | tonnes | | 27,047 | | | 2,258 | | | 29,305 | | | 22,856 | | | 5,342 | | | 28,198 | |
| Gold | oz | | 20,860 | | | 33,060 | | | 53,920 | | | 17,917 | | | 46,242 | | | 64,159 | |
| Silver | oz | | 655,257 | | | 139,758 | | | 795,015 | | | 578,140 | | | 321,573 | | | 899,713 | |
| Zinc | tonnes | | - | | | 6,326 | | | 6,326 | | | - | | | 23,207 | | | 23,207 | |
| Molybdenum | tonnes | | 344 | | | - | | | 344 | | | 275 | | | - | | | 275 | |
| Payable metal sold | | | | | | | | | | | | | | | | | | |
| Copper | tonnes | | 23,789 | | | 1,626 | | | 25,415 | | | 20,551 | | | 4,408 | | | 24,959 | |
| Gold2 | oz | | 15,116 | | | 32,140 | | | 47,256 | | | 16,304 | | | 40,623 | | | 56,927 | |
| Silver2 | oz | | 411,129 | | | 148,177 | | | 559,306 | | | 380,712 | | | 257,928 | | | 638,640 | |
| Zinc3 | tonnes | | - | | | 8,230 | | | 8,230 | | | - | | | 21,112 | | | 21,112 | |
| Molybdenum | tonnes | | 421 | | | - | | | 421 | | | 245 | | | - | | | 245 | |
| 1 Metal reported in concentrate is prior to deductions associated with smelter contract terms. |
| 2 Includes total payable gold and silver in concentrate and in doré sold. |
| 3 Includes refined zinc metal and payable zinc in concentrate sold. |
| | | Year ended | | | Year ended | |
| | Dec. 31, 2022 | | | Dec. 31, 2021 | |
| | Peru | | | Manitoba | | | Total | | | Peru | | | Manitoba | | | Total | |
| Contained metal in concentrate produced 1 | | | | | | | | | | | | | | | | |
| Copper | tonnes | | 89,395 | | | 14,778 | | | 104,173 | | | 77,813 | | | 21,657 | | | 99,470 | |
| Gold | oz | | 58,229 | | | 161,471 | | | 219,700 | | | 50,306 | | | 143,477 | | | 193,783 | |
| Silver | oz | | 2,309,352 | | | 851,942 | | | 3,161,294 | | | 1,972,949 | | | 1,072,532 | | | 3,045,481 | |
| Zinc | tonnes | | - | | | 55,381 | | | 55,381 | | | - | | | 93,529 | | | 93,529 | |
| Molybdenum | tonnes | | 1,377 | | | - | | | 1,377 | | | 1,146 | | | - | | | 1,146 | |
| Payable metal sold | | | | | | | | | | | | | | | | | | |
| Copper | tonnes | | 79,805 | | | 14,668 | | | 94,473 | | | 71,398 | | | 20,802 | | | 92,200 | |
| Gold2 | oz | | 49,968 | | | 163,447 | | | 213,415 | | | 41,807 | | | 126,551 | | | 168,358 | |
| Silver2 | oz | | 2,045,678 | | | 932,807 | | | 2,978,485 | | | 1,490,651 | | | 936,857 | | | 2,427,508 | |
| Zinc3 | tonnes | | - | | | 59,043 | | | 59,043 | | | - | | | 96,435 | | | 96,435 | |
| Molybdenum | tonnes | | 1,352 | | | - | | | 1,352 | | | 1,098 | | | - | | | 1,098 | |
| 1 Metal reported in concentrate is prior to deductions associated with smelter contract terms. |
| 2 Includes total payable gold and silver in concentrate and in doré sold. |
| 3 Includes refined zinc metal and payable zinc in concentrate sold. |
KEY COST RESULTS
| | | | Three months ended | | | Year ended | | | Guidance | |
| | | | Dec. 31,
2022 | | | Dec. 31,
2021 | | | Dec. 31,
2022 | | | Dec. 31,
2021 | | | Annual
2022 | |
| Peru cash cost per pound of copper produced | | | | | | | | | | |
| Cash cost 1 | $/lb | | 1.34 | | | 1.28 | | | 1.58 | | | 1.54 | | | 1.10 - 1.40 | |
| Sustaining cash cost 1 | $/lb | | 2.09 | | | 2.46 | | | 2.35 | | | 2.46 | | | | |
| Manitoba cash cost per ounce of gold produced | | | | | | | | | | |
| Cash cost 1,2 | $/oz | | 922 | | | - | | | 297 | | | - | | | 300 - 550 | |
| Sustaining cash cost 1,2 | $/oz | | 1,795 | | | - | | | 1,091 | | | - | | | | |
| Consolidated cash cost per pound of copper produced | | | | | | | | | | |
| Cash cost 1 | $/lb | | 1.08 | | | 0.51 | | | 0.86 | | | 0.74 | | | 0.60 - 1.05 | |
| Sustaining cash cost 1 | $/lb | | 2.21 | | | 1.95 | | | 2.07 | | | 2.07 | | | 1.60 - 2.25 | |
| All-in sustaining cash cost1 | $/lb | | 2.41 | | | 2.20 | | | 2.26 | | | 2.30 | | | | |
| 1 Cash cost, sustaining cash cost, all-in sustaining cash cost per pound of copper produced, net of by-product credits, gold cash cost, sustaining cash cost per ounce of gold produced, net of by-product credits, and unit operating cost are non-IFRS financial performance measures with no standardized definition under IFRS. For further information and a detailed reconciliation, please see the discussion under the "Non-IFRS Financial Performance Measures" section of this MD&A. |
| 2 Cash cost and sustaining cash cost per ounce of gold produced, net of by-product credits were introduced in 2022 and do not have a published comparative. |
RECENT DEVELOPMENTS
Commitment to Climate Change Initiatives
On December 12, 2022, we announced our commitment to achieve net zero greenhouse gas ("GHG") emissions by 2050 and the adoption of interim 2030 GHG reduction targets to support this commitment. We have initiated a roadmap to further identify and manage risks associated with climate change, and opportunities to reduce GHG emissions in alignment with global decarbonization goals.
While our operations are well-positioned in the lower half of the global GHG emissions curve for copper operations, we recognize our role in mitigating climate change. Hudbay's GHG emissions reduction plan includes the following initiatives:
• Pursuing a 50% reduction in absolute Scope 1 and Scope 2 emissions from existing operations by 2030 (compared to 2021)
• Achieving net zero total emissions by 2050
• Reporting on material Scope 3 emissions in the near-term
• Assessing acquisitions and new projects against corporate emissions targets
• Continuing to be transparent with GHG performance data disclosure, including reporting total GHG emissions and GHG intensity
Hudbay's efforts have been focused on improving operating efficiencies to reduce the GHG emissions intensity at our mines through initiatives such as ore sorting and recovery improvement programs. We have identified multiple opportunities to achieve further reductions in emissions, including grid decarbonization in Peru, fleet and heating electrification and fuel switching in mobile equipment. We will continue to monitor and evaluate existing and new technologies as they become financially viable to implement at our operations. We will also consider emissions reduction opportunities in the design of our brownfield and greenfield growth projects. All initiatives will balance emissions and economic targets as part of our disciplined capital allocation strategy.
Advancing Activities to Prudently De-risk Copper World
In 2022, we invested approximately $80 million at Copper World to successfully execute a new strategy focused on a two-phase mine plan with the first phase located on private land claims. This strategy involved significant drilling campaigns to delineate seven newly discovered deposits adjacent to the known East deposit, the expansion of our private land package to over 4,500 acres, and the completion of a robust preliminary economic assessment for Copper World demonstrating a 16-year mine plan for Phase I, requiring only state level permits, and an expansion to a 44 year operation in Phase II with the utilization of federal lands.
Hudbay continues to advance pre-feasibility activities for Phase I of the Copper World project, which is expected to support the conversion of mineral resources to mineral reserves and optimize the layout and sequencing of the mineral processing facilities, in addition to evaluating other upside opportunities. Pre-feasibility level engineering of the main processing facility was completed by year-end together with geotechnical and hydrogeological site investigation activities. Metallurgical test work activities continued into 2023 and the results are being analyzed as part of concentrate leaching trade off evaluations. A pre-feasibility study for Phase I of the Copper World project is expected to be released in the second quarter of 2023.
In late 2022, Hudbay submitted the applications for an Aquifer Protection Permit and an Air Quality Permit to the Arizona Department of Environmental Quality ("ADEQ"). Hudbay continues to expect to receive these two remaining state permits in 2023. The other key state permit, the Mined Land Reclamation Plan, was received in 2022.In January 2023, Hudbay received an approved right-of-way from the State Land Department that will allow for infrastructure, such as roads, pipelines and powerlines, to connect between the properties in our private land package at Copper World.
Upon receipt of the state level permits, the company expects to conduct a bulk sampling program at Copper World to continue to de-risk the project by testing grade continuity, variable cut-off effectiveness and metallurgical strategies. Hudbay also intends to initiate a minority joint venture partner process following receipt of permits, which will allow the potential joint venture partner to participate in and help fund the definitive feasibility study activities in 2024.
Continued Focus on Cost Reductions and Capital Discipline
With a focus on generating positive cash flow, we delivered on our discretionary spending reduction targets by reducing 2022 growth capital and exploration spending by approximately $30 million in Arizona, Manitoba and Peru. We also reduced planned 2023 discretionary spending by more than $50 million primarily related to the deferral of the Copper World definitive feasibility study and the pebble crusher in Peru. Furthermore, planned 2023 growth and exploration expenditures are expected to be approximately $65 million lower than 2022 levels.
As an additional prudent measure intended to ensure positive cash flow generation and continued financial discipline, Hudbay expects to extend its existing quotational period hedging program, to cover approximately 13,000 tonnes of contained copper in the unsold concentrate inventory in Peru to lock in current copper prices.
We expect spending on our Copper World project in 2023 will be limited to de-risking activities, including the completion of the pre-feasibility study and state level permitting. The opportunity to sanction Copper World is not expected until 2025 based on current estimated timelines. This, together with our 2023 discretionary spending reductions, reflects a conservative approach to capital spending at Copper World over the next two years. As part of our disciplined financial planning approach to Copper World, we identified three specific prerequisites that would need to be achieved prior to making an investment decision in the project:
1. Permits - receipt of all state level permits required for Phase I;
2. Plan - completion of a definitive feasibility study with an internal rate of return of greater than 15%; and,
3. Prudent Financing Strategy - multi-faceted financial targets focused on a minimum cash balance, a stated maximum leverage, limited non-recourse project level debt and committed financial partners.
Exploration Update
Peru Regional Exploration
Hudbay controls a large, contiguous block of mineral rights with the potential to host mineral deposits within trucking distance of the Constancia processing facility, including the past producing Caballito property and the highly prospective Maria Reyna property. Following the execution of a surface rights exploration agreement with the community of Uchucarcco in August 2022, the company has commenced early exploration activities at the Maria Reyna and Caballito properties. Surface investigation activities together with baseline environmental and archaeological activities necessary to support drill permit applications for the Maria Reyna and Caballito prospects have been completed. Ground geophysical surveys commenced in the fourth quarter of 2022 and will continue once the Peruvian social situation improves. Field evidence confirms that both Caballito and Maria Reyna host sulfide and oxide rich copper mineralization in skarns, hydrothermal breccias and large porphyry intrusive bodies.
Recent activities at the Llaguen copper-molybdenum porphyry deposit in the Otuzco province in northern Peru have been focused on initiating metallurgical test work.
Manitoba Regional Exploration
Hudbay commenced a winter drill program in January 2023 with four drill rigs testing the down-dip gold and copper extensions of the Lalor deposit, which is the first time we have completed step-out drilling in the deeper zones at Lalor since the initial discovery of the gold and copper-gold zones in 2009 and 2010. One additional drill rig is testing a target located to the north of Lalor.
Arizona Regional Exploration
Recent drilling activities at Copper World have focused on close spaced infill drilling to support potential future bulk sampling programs. This drilling is now completed, and no additional drilling is planned for 2023.
Nevada Regional Exploration
A conductivity-resistivity IP ground survey commenced in the fourth quarter of 2022 on Hudbay's private land claims near the Mason project. This work, in combination with a re-interpretation of geological data from past operating mines and previous exploration data, will be used to finalize a future drill plan to test high grade skarn targets.
Dividend Declared
A semi-annual dividend of C$0.01 per share was declared on February 23, 2023. The dividend will be paid out on March 24, 2023 to shareholders of record as of March 7, 2023.
PERU OPERATIONS REVIEW
| | | Three months ended | | | Year ended | | | Guidance | |
| | Dec. 31, 2022 | | | Dec. 31, 2021 | | | Dec. 31, 2022 | | | Dec. 31, 2021 | | | Annual | |
| | 2022 | |
| Constancia ore mined 1 | tonnes | | 5,614,918 | | | 7,742,469 | | | 25,840,435 | | | 29,714,327 | | | | |
| Copper | % | | 0.40 | | | 0.33 | | | 0.35 | | | 0.31 | | | | |
| Gold | g/tonne | | 0.04 | | | 0.04 | | | 0.04 | | | 0.04 | | | | |
| Silver | g/tonne | | 3.48 | | | 2.81 | | | 3.40 | | | 2.88 | | | | |
| Molybdenum | % | | 0.01 | | | 0.01 | | | 0.01 | | | 0.01 | | | | |
| Pampacancha ore mined 1 | tonnes | | 3,771,629 | | | 2,107,196 | | | 8,319,250 | | | 5,141,001 | | | | |
| Copper | % | | 0.37 | | | 0.27 | | | 0.33 | | | 0.27 | | | | |
| Gold | g/tonne | | 0.29 | | | 0.34 | | | 0.29 | | | 0.30 | | | | |
| Silver | g/tonne | | 3.84 | | | 4.26 | | | 4.06 | | | 4.02 | | | | |
| Molybdenum | % | | 0.01 | | | 0.01 | | | 0.01 | | | 0.01 | | | | |
| Total ore mined | tonnes | | 9,386,547 | | | 9,849,665 | | | 34,159,685 | | | 34,855,328 | | | | |
| Strip ratio 2 | | | 0.97 | | | 0.95 | | | 1.13 | | | 1.02 | | | | |
| Ore milled | tonnes | | 7,795,735 | | | 8,048,925 | | | 30,522,294 | | | 28,809,755 | | | | |
| Copper | % | | 0.41 | | | 0.33 | | | 0.34 | | | 0.32 | | | | |
| Gold | g/tonne | | 0.12 | | | 0.11 | | | 0.09 | | | 0.08 | | | | |
| Silver | g/tonne | | 3.93 | | | 3.67 | | | 3.58 | | | 3.35 | | | | |
| Molybdenum | % | | 0.01 | | | 0.01 | | | 0.01 | | | 0.01 | | | | |
| Copper concentrate | tonnes | | 117,980 | | | 96,123 | | | 393,255 | | | 335,490 | | | | |
| Concentrate grade | % Cu | | 22.93 | | | 23.78 | | | 22.73 | | | 23.19 | | | | |
| Copper recovery | % | | 85.1 | | | 86.0 | | | 85.0 | | | 84.6 | | | | |
| Gold recovery | % | | 69.6 | | | 63.6 | | | 63.6 | | | 64.6 | | | | |
| Silver recovery | % | | 66.5 | | | 60.8 | | | 65.7 | | | 63.7 | | | | |
| Molybdenum recovery | % | | 37.7 | | | 26.7 | | | 34.8 | | | 31.5 | | | | |
| Combined unit operating costs 3,4,5 | $/tonne | | 13.64 | | | 9.96 | | | 12.78 | | | 10.70 | | | 10.10 - 12.90 6 | |
| 1 Reported tonnes and grade for ore mined are estimates based on mine plan assumptions and may not reconcile fully to ore milled. |
| 2 Strip ratio is calculated as waste mined divided by ore mined. |
| 3 Reflects combined mine, mill and general and administrative ("G&A") costs per tonne of ore milled. Reflects the deduction of expected capitalized stripping costs. |
| 4 Combined unit costs is a non-IFRS financial performance measure with no standardized definition under IFRS. For further information and a detailed reconciliation, please see the discussion under the "Non-IFRS Financial Performance Measures" section of this MD&A. |
| 5 Excludes approximately $0.7 million, or $0.09 per tonne and $5.2 million, or $0.17 per tonne, of COVID-19 related costs during the three and twelve months ended December 31, 2022 respectively and $4.1 million, or $0.51 per tonne and $19.8 million or $0.69 per tonne, of COVID-19 related costs during the three and twelve months ended December 31, 2021. |
| 6 Combined unit cost guidance for 2022 excludes COVID-19 related costs. |
Total ore mined in the fourth quarter of 2022 decreased by 5% compared to the same period in 2021 due, in part, to a short-term change in mine plan where the company prioritized the processing of lower grade stockpiles and shorter haulage distance ore from the Constancia pit in order to ration fuel during a period of nation-wide social unrest and road blockades following a change in Peru's political leadership in early December 2022. This short-term change in mine plan ensured the plant continued to operate uninterrupted.
Ore milled during the fourth quarter of 2022 was 3% lower than the same period in 2021 due to a previously announced plant maintenance program in November 2022. Milled copper grades increased by 24% in the fourth quarter of 2022 compared to the same period in 2021 due to higher head grades from both Pampacancha and Constancia.
Full year 2022 ore mined was 2% lower than the same period in 2021. Full year 2022 copper and gold grades milled were 6% and 13% higher, respectively, than the comparative 2021 period due to higher head grades from both Pampacancha and Constancia.
Copper recoveries in the fourth quarter of 2022 were in line with the comparative 2021 period. Gold and silver recoveries in the fourth quarter were both 9% higher than the comparative 2021 period due to higher milled gold and silver grades. Peru achieved a record quarterly gold recovery of 70% in the fourth quarter of 2022.
Full year 2022 recoveries for copper, gold and silver were relatively consistent with the comparable period of 2021.
Combined mine, mill and G&A unit operating costs in the fourth quarter of 2022 were 37% higher than the same period in 2021 primarily due to incremental costs associated with the fourth quarter planned mill maintenance, higher mining costs associated with mining more ore from Pampacancha, as well as inflationary pressures on fuel, consumables and energy costs. Full year combined mine, mill and G&A unit operating costs for 2022 were 19% higher than the same period in 2021 due to the same factors as the quarterly variance partially offset by higher ore milled.
Contained metal in
concentrate
produced | | Three months ended | | | Year ended | | | Guidance | |
| | Dec. 31,
2022 | | | Dec. 31,
2021 | | | Dec. 31,
2022 | | | Dec. 31,
2021 | | | Annual | |
| | 2022 | | | 2023 | |
| Copper | tonnes | | 27,047 | | | 22,856 | | | 89,395 | | | 77,813 | | | 89,000 - 115,000 | | | 91,000 - 116,000 | |
| Gold | oz | | 20,860 | | | 17,917 | | | 58,229 | | | 50,306 | | | 70,000 - 90,000 | | | 83,000 - 108,000 | |
| Silver | oz | | 655,257 | | | 578,140 | | | 2,309,352 | | | 1,972,949 | | | 1,620,000 - 2,100,000 | | | 2,210,000 - 2,650,000 | |
| Molybdenum | tonnes | | 344 | | | 275 | | | 1,377 | | | 1,146 | | | 1,100 - 1,400 | | | 1,300 - 1,600 | |
Fourth quarter 2022 production of molybdenum, copper, gold and silver was 25%, 18%, 16% and 13% higher, respectively, than the comparative period in 2021 due to higher copper and precious metal grades and higher precious metal and molybdenum recoveries. The fourth quarter of 2022 was a record quarter for gold production in Peru. Full year 2022 production of copper, gold, silver and molybdenum was 15%, 16%, 17% and 20% higher, respectively, than the comparative period in 2021 due to higher throughput, higher copper and precious metal grades and higher copper, silver and molybdenum recoveries.
Full year 2022 production of copper increased by 15% year-over-year to 89,395 tonnes, within the guidance range. Similarly, full year 2022 production of gold, silver and molybdenum increased by 16%, 17% and 20%, respectively, compared to 2021 due to higher throughput, higher copper and precious metal grades and higher copper, silver and molybdenum recoveries. Molybdenum production was in line with our annual guidance range, whereas silver production exceeded the top end of our annual guidance range by 10%. Gold production fell short of the annual guidance range primarily due to lower-than-planned grades from the Pampacancha pit in the fourth quarter of 2022 as a result of short-term changes in the mine plan.

Peru Cash Cost and Sustaining Cash Cost
| | | Three months ended | | | Year ended | | | Guidance | |
| | Dec. 31,
2022 | | | Dec. 31,
2021 | | | Dec. 31,
2022 | | | Dec. 31,
2021 | | | Annual
2022 | | | Annual
2023 | |
| Cash cost per pound of copper produced, net of by-product credits1 | $/lb | | 1.34 | | | 1.28 | | | 1.58 | | | 1.54 | | | 1.10 - 1.40 | | | 1.05 - 1.30 | |
| Sustaining cash cost per pound of copper produced, net of by-product credits1 | $/lb | | 2.09 | | | 2.46 | | | 2.35 | | | 2.46 | | | | | | | |
| 1 Cash cost and sustaining cash costs per pound of copper produced, net of by-product credits, are not recognized under IFRS. For more detail on these non-IFRS financial performance measures, please see the discussion under the "Non-IFRS Financial Performance Measures" section of this MD&A. |
Cash cost per pound of copper produced, net of by-product credits, in the fourth quarter of 2022 was $1.34, an increase of 5% compared to the same period in 2021 due to inflationary pressures on fuel, consumables and energy costs driving higher mining and milling costs, partially offset by lower general and administrative costs, higher molybdenum by-product credits and higher copper production. However, cash cost per pound of copper produced, net of by-product credits, in the fourth quarter of 2022 was below the run rate for the first nine months of the year primarily due to higher copper, gold and silver grades in the fourth quarter. Full year cash cost per pound of copper produced, net of by-product credits, was $1.58, a slight increase of 3% compared to the same period of 2021. This exceeded the upper end of our 2022 guidance range primarily due to higher mining and milling costs from input cost inflation and lower than expected by-product credits due to lower-than-expected gold grades from Pampacancha in the fourth quarter of 2022, as described above.
Sustaining cash cost per pound of copper produced, net of by-product credits, for the fourth quarter and full year 2022 were 15% and 4% lower, respectively, than the comparative 2021 periods due to lower sustaining capital expenditures and higher copper and gold production, offset, in part, by higher mining and milling costs from input cost inflation.

Metal Sold
| | | Three months ended | | | Year ended | |
| | Dec. 31, 2022 | | | Dec. 31, 2021 | | | Dec. 31, 2022 | | | Dec. 31, 2021 | |
| Payable metal in concentrate | | | | | | | | | | | | | |
| Copper | tonnes | | 23,789 | | | 20,551 | | | 79,805 | | | 71,398 | |
| Gold | oz | | 15,116 | | | 16,304 | | | 49,968 | | | 41,807 | |
| Silver | oz | | 411,129 | | | 380,712 | | | 2,045,678 | | | 1,490,651 | |
| Molybdenum | tonnes | | 421 | | | 245 | | | 1,352 | | | 1,098 | |
While we were able to complete two copper concentrate shipments from the Matarani port during December, Peru's copper, gold and silver sales in the fourth quarter of 2022 were impacted by higher-than-normal unsold copper concentrate inventory levels of approximately 25,000 wet metric tonnes as at December 31, 2022, due to the nation-wide road blockades in early December. We have been able to steadily operate the Constancia mill throughout the recent road blockades, and despite completing three copper concentrate shipments from the port in January 2023, Peru's unsold copper concentrate inventory levels reached a peak of approximately 47,000 wet metric tonnes in mid-February when transportation of concentrate resumed with the assistance of the community-based concentrate trucking companies.We expect concentrate inventory levels to normalize over the next several months.
MANITOBA OPERATIONS REVIEW
Mines
| | | Three months ended | | | Year ended | |
| | Dec. 31, 2022 | | | Dec. 31, 2021 | | | Dec. 31, 2022 | | | Dec. 31, 2021 | |
| Lalor | | | | | | | | | | | | | |
| Ore | tonnes | | 369,453 | | | 422,208 | | | 1,516,203 | | | 1,593,141 | |
| Copper | % | | 0.73 | | | 0.78 | | | 0.73 | | | 0.71 | |
| Zinc | % | | 2.17 | | | 4.19 | | | 3.14 | | | 4.23 | |
| Gold | g/tonne | | 4.00 | | | 3.92 | | | 4.00 | | | 3.41 | |
| Silver | g/tonne | | 19.37 | | | 30.35 | | | 21.96 | | | 24.66 | |
| 777 | | | | | | | | | | | | | |
| Ore | tonnes | | - | | | 266,744 | | | 484,355 | | | 1,053,710 | |
| Copper | % | | - | | | 1.13 | | | 1.12 | | | 1.28 | |
| Zinc | % | | - | | | 4.16 | | | 3.83 | | | 3.91 | |
| Gold | g/tonne | | - | | | 1.80 | | | 1.66 | | | 2.03 | |
| Silver | g/tonne | | - | | | 25.02 | | | 20.85 | | | 25.25 | |
| Total Mines | | | | | | | | | | | | | |
| Ore | tonnes | | 369,453 | | | 688,952 | | | 2,000,558 | | | 2,646,851 | |
| Copper | % | | 0.73 | | | 0.91 | | | 0.83 | | | 0.94 | |
| Zinc | % | | 2.17 | | | 4.18 | | | 3.31 | | | 4.10 | |
| Gold | g/tonne | | 4.00 | | | 3.10 | | | 3.43 | | | 2.86 | |
| Silver | g/tonne | | 19.37 | | | 28.29 | | | 21.69 | | | 24.90 | |
| | | | | | | | | | | | | | |
| Unit Operating Costs 1 | | Three months ended | | | Year ended | |
| | Dec. 31, 2022 | | | Dec. 31, 2021 | | | Dec. 31, 2022 | | | Dec. 31, 2021 | |
| Mines | | | | | | | | | | | | | |
| Lalor | C$/tonne | | 140.10 | | | 112.34 | | | 136.71 | | | 114.95 | |
| 777 | C$/tonne | | - | | | 100.34 | | | 87.50 | | | 91.12 | |
| Total Mines | C$/tonne | | 140.10 | | | 107.69 | | | 124.80 | | | 105.46 | |
| 1 Reflects costs per tonne of ore mined. | |
During the fourth quarter of 2022, the Manitoba team continued to focus on integrating our Flin Flon employees and equipment into the Snow Lake operations in order to significantly reduce our reliance on higher cost contractors. Lalor's ore production during the quarter was impacted by a planned maintenance program to replace surface ore chutes as well as various other pre-winter maintenance activities including the muck circuit, hoist drive and electrical maintenance. We continue to advance several key initiatives to support higher production levels at Lalor, including building longhole inventory, improving stope muck fragmentation, optimizing the development drift size and focusing on shaft availability improvements to enable more ore to be hoisted to surface while reducing inefficient trucking of ore via the ramp.
Ore mined at our Manitoba operations during the fourth quarter of 2022 was 46% lower than the same period in 2021 mainly due to the planned closure of 777 in June 2022 which resulted in a significant decline in ore mined in the fourth quarter compared to the prior year period which benefited from the full contribution of 777 mine production. Excluding 777 production, Lalor mined ore in the fourth quarter was 12% lower than the same period in 2021 due to the above noted transition and the planned maintenance program impacting operations. Gold grades mined during the fourth quarter of 2022 were 2% higher than the same period in 2021. Copper, zinc and silver grades mined at Lalor during the fourth quarter of 2022 were 6%, 48% and 36% lower, respectively, compared to the same period in 2021.
Ore mined at our Manitoba operations for the full year 2022 was 24% lower than 2021 mainly due to the closure of 777 in June 2022 as mentioned above. Ore mined at Lalor for the full year 2022 was 5% lower than 2021 while copper and gold grades mined at Lalor during 2022 were 3% and 17% higher, respectively. The zinc and silver grades at Lalor were 26% and 11% lower, respectively, compared to the same period in 2021, mainly due to an increased focus on mining of gold and copper-gold stopes and a corresponding decrease of production from the base metal zones.
Total mine unit operating costs during the fourth quarter of 2022 increased by 30%, reflecting the standalone cost structure of Lalor compared to the same period in 2021 which included operating costs for both Lalor and the lower cost 777 mine. Operating costs were also impacted by inflationary cost pressures for bulk commodities, fuel, and contractor costs compared to the same period in 2021, in addition to lower ore production volumes as mentioned above.
Total mine unit operating costs during the full year 2022 increased by 18% compared to the same period in 2021 due to the factors mentioned above and higher propane usage early in the year caused by a colder winter.
Processing Facilities
| | | Three months ended | | | Year ended | |
| | Dec. 31, 2022 | | | Dec. 31, 2021 | | | Dec. 31, 2022 | | | Dec. 31, 2021 | |
| Stall & New Britannia Concentrator Combined | | | | | | | | | | | | |
| Ore | tonnes | | 345,492 | | | 419,727 | | | 1,510,907 | | | 1,506,756 | |
| Copper | % | | 0.73 | | | 0.75 | | | 0.75 | | | 0.72 | |
| Zinc | % | | 2.31 | | | 4.12 | | | 3.30 | | | 4.30 | |
| Gold | g/tonne | | 3.98 | | | 3.90 | | | 4.08 | | | 3.42 | |
| Silver | g/tonne | | 20.40 | | | 30.07 | | | 22.15 | | | 24.95 | |
| Copper concentrate | tonnes | | 14,201 | | | 17,494 | | | 58,276 | | | 57,291 | |
| Concentrate grade | % Cu | | 15.90 | | | 15.92 | | | 17.12 | | | 16.43 | |
| Zinc concentrate | tonnes | | 12,706 | | | 27,672 | | | 77,806 | | | 111,370 | |
| Concentrate grade | % Zn | | 49.79 | | | 51.02 | | | 50.63 | | | 50.56 | |
| Copper recovery - concentrate | % | | 89.2 | | | 88.7 | | | 88.6 | | | 86.8 | |
| Zinc recovery - concentrate (Stall) | % | | 90.1 | | | 87.4 | | | 86.6 | | | 88.9 | |
| Gold recovery - concentrate | % | | 58.8 | | | 54.6 | | | 59.2 | | | 54.9 | |
| Silver recovery - concentrate | % | | 56.1 | | | 53.9 | | | 58.1 | | | 54.4 | |
| Contained metal in concentrate produced | | | | | | | | | | |
| Copper | tonnes | | 2,258 | | | 2,785 | | | 9,977 | | | 9,415 | |
| Zinc | tonnes | | 6,326 | | | 14,119 | | | 39,395 | | | 56,310 | |
| Gold | oz | | 25,961 | | | 28,720 | | | 117,526 | | | 90,911 | |
| Silver | oz | | 127,099 | | | 218,679 | | | 625,145 | | | 656,847 | |
| Metal in doré produced | | | | | | | | | | |
| Gold | oz | | 7,099 | | | 8,598 | | | 28,707 | | | 9,002 | |
| Silver | oz | | 12,659 | | | 6,519 | | | 52,834 | | | 6,529 | |
| Flin Flon Concentrator | | | | | | | | | | | | | |
| Ore | tonnes | | - | | | 262,565 | | | 497,344 | | | 1,133,516 | |
| Copper | % | | - | | | 1.12 | | | 1.11 | | | 1.23 | |
| Zinc | % | | - | | | 4.16 | | | 3.87 | | | 3.95 | |
| Gold | g/tonne | | - | | | 1.78 | | | 1.67 | | | 2.04 | |
| Silver | g/tonne | | - | | | 25.04 | | | 21.00 | | | 24.90 | |
| Copper concentrate | tonnes | | - | | | 12,554 | | | 22,602 | | | 56,646 | |
| Concentrate grade | % Cu | | - | | | 20.37 | | | 21.24 | | | 21.61 | |
| Zinc concentrate | tonnes | | - | | | 18,353 | | | 31,602 | | | 73,974 | |
| Concentrate grade | % Zn | | - | | | 49.51 | | | 50.59 | | | 50.31 | |
| Copper recovery | % | | - | | | 86.7 | | | 86.7 | | | 87.7 | |
| Zinc recovery | % | | - | | | 83.1 | | | 83.0 | | | 83.0 | |
| Gold recovery | % | | - | | | 59.2 | | | 57.1 | | | 58.5 | |
| Silver recovery | % | | - | | | 45.6 | | | 51.8 | | | 45.1 | |
| Contained metal in concentrate produced | | | | | | | | | | |
| Copper | tonnes | | - | | | 2,557 | | | 4,801 | | | 12,242 | |
| Zinc | tonnes | | - | | | 9,088 | | | 15,986 | | | 37,219 | |
| Gold | oz | | - | | | 8,924 | | | 15,238 | | | 43,564 | |
| Silver | oz | | - | | | 96,375 | | | 173,963 | | | 409,156 | |
| Unit Operating Costs 1 | | Three months ended | | | Year ended | | | Guidance | |
| | Dec. 31,
2022 | | | Dec. 31,
2021 | | | Dec. 31,
2022 | | | Dec. 31,
2021 | | | Annual | |
| | 2022 | |
| Concentrators | | | | | | | | | | | | | | | | |
| Stall & New Britannia | C$/tonne | | 58.49 | | | 47.67 | | | 54.16 | | | 31.17 | | | | |
| Flin Flon | C$/tonne | | - | | | 30.33 | | | 28.14 | | | 28.27 | | | | |
| Combined mine/mill unit operating costs 2,3 | | | | | | | | | | |
| Manitoba | C$/tonne | | 241 | | | 168 | | | 195 | | | 154 | | | 170 - 185 | |
| 1 Reflects costs per tonne of milled ore. |
| 2 Reflects combined mine, mill and G&A costs per tonne of milled ore. |
| 3 Combined unit costs is a non-IFRS financial performance measure with no standardized definition under IFRS. For further information and a detailed reconciliation, please see the discussion under the "Non-IFRS Financial Performance Measures" section of this MD&A. |
The combined Stall and New Britannia mills processed 18% less ore in the fourth quarter of 2022 compared to the same period in 2021, mainly due to the above noted transition and planned maintenance program impacting Lalor and the milling operations. Stall recoveries were consistent with the metallurgical model for the head grades delivered. Compared to the same period in 2021, unit operating costs at the Stall and New Britannia mills were higher in the fourth quarter of 2022 as a result of higher costs at New Britannia and inflationary cost pressures.
Ore processed at the combined Stall and New Britannia mills during the full year 2022 was in line with the same period in 2021. Stall recoveries were consistent with the metallurgical model for the head grades delivered. Compared to the same period in 2021, unit operating costs at the Stall and New Britannia mills were higher in 2022 for the same reasons outlined in the fourth quarter variance as well as scheduled mill maintenance at New Britannia early in the year and baseline effects as New Britannia was not yet fully operational in the comparative period.
The New Britannia mill continued to achieve consistent production in the fourth quarter, averaging approximately 1,530 tonnes per day. Metal recoveries have now stabilized near our targeted levels for the mill. Additional improvement initiatives will continue to be advanced in the upcoming quarters with a focus on reducing reagent and grinding media consumption that has contributed to higher operating costs than planned. These initiatives require minimal capital expenditures and will further improve overall metal recoveries and copper concentrate grades.
Combined mine, mill and G&A unit operating costs in the fourth quarter of 2022 and full year 2022 increased by 43% and 27%, respectively, compared to the same periods in 2021 reflecting inflationary cost pressures for bulk commodities, fuel, and contractor costs and the standalone cost structure of Lalor compared to the same period in 2021, which included operating costs for both Lalor and the lower cost 777 mine.
| | | | Three months ended | | | Year ended | | | Guidance | |
Contained
metal in
concentrate
produced 1 | | Dec. 31, 2022 | | | Dec. 31, 2021 | | | Dec. 31, 2022 | | | Dec. 31, 2021 | | | Annual | |
| | 2022 | | | 2023 | |
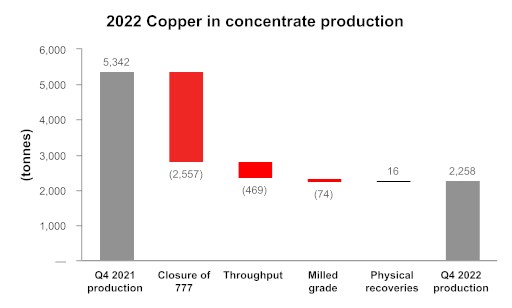
| Copper | tonnes | | 2,258 | | | 5,342 | | | 14,778 | | | 21,657 | | | 12,000 - 16,000 | | | 9,000 - 12,000 | |
| Gold 2 | oz | | 25,961 | | | 37,644 | | | 132,764 | | | 134,475 | | | - | | | - | |
| Silver 3 | oz | | 127,099 | | | 315,054 | | | 799,108 | | | 1,066,003 | | | - | | | - | |
| Zinc | tonnes | | 6,326 | | | 23,207 | | | 55,381 | | | 93,529 | | | 50,000 - 70,000 | | | 28,000 - 36,000 | |
| Metal in doré produced 1 | | | | | | | | | | |
| Gold 2 | oz | | 7,099 | | | 8,598 | | | 28,707 | | | 9,002 | | | - | | | - | |
| Silver 3 | oz | | 12,659 | | | 6,519 | | | 52,834 | | | 6,529 | | | - | | | - | |
| Contained metal in concentrate and doré produced | | | | | | | |
| Gold 2 | oz | | 33,060 | | | 46,242 | | | 161,471 | | | 143,477 | | | 150,000 - 185,000 | | | 175,000 - 205,000 | |
| Silver 3 | oz | | 139,758 | | | 321,573 | | | 851,942 | | | 1,072,532 | | | 800,000 - 1,100,000 | | | 750,000 - 1,000,000 | |
| 1 Metal reported in concentrate is prior to deductions associated with smelter terms. |
| 2 Gold production guidance includes gold contained in concentrate produced and gold in doré. |
| 3 Silver production guidance includes silver contained in concentrate produced and silver in doré. |
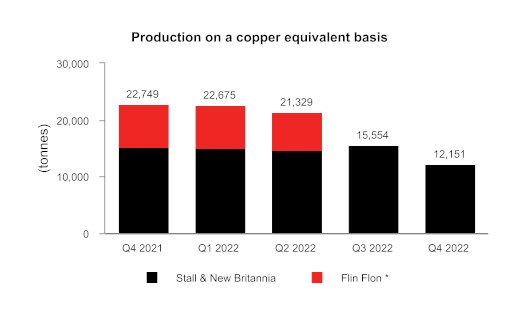
Manitoba's production of copper, gold, silver and zinc in the fourth quarter of 2022 was lower by 58%, 29%, 57% and 73%, respectively, than the comparative 2021 period following the planned closure of the 777 mine in June 2022, partially offset by higher metal recoveries. Full year 2022 metal production was similarly impacted by the planned closure of 777, resulting in a decrease in copper, zinc and silver production, while 2022 gold production increased by 13% as New Britannia ramped up to full production.
Full year production of all metals in Manitoba achieved our 2022 annual guidance ranges.
* Mining activities at 777 were completed in June 2022
Zinc Plant
| Zinc Production | | Three months ended | | | Year ended | |
| | Dec. 31, 2022 | | | Dec. 31, 2021 | | | Dec. 31, 2022 | | | Dec. 31, 2021 | |
| Zinc Concentrate Treated | | | | | | | | | | |
| Domestic | tonnes | | - | | | 45,143 | | | 76,223 | | | 191,283 | |
| Refined Metal Produced | | | | | | | | | | |
| Domestic | tonnes | | - | | | 20,783 | | | 37,894 | | | 89,568 | |
| Unit Operating Costs | | Three months ended | | | Year ended | |
| | Dec. 31,
2022 | | | Dec. 31,
2021 | | | Dec. 31,
2022 | | | Dec. 31,
2021 | |
| Zinc Plant 1,2 | C$/lb | | - | | | 0.63 | | | 0.60 | | | 0.55 | |
1 Zinc unit operating costs include G&A costs.
2 Zinc unit costs is a non-IFRS financial performance measure with no standardized definition under IFRS. For further information and a detailed reconciliation, please see the discussion under the "Non-IFRS Financial Performance Measures" section of this MD&A. |
The zinc plant ceased operations on June 30, 2022 and, as such, had no production during the second half of 2022. Closure activities commenced in the third quarter of 2022 and progressed safely during the fourth quarter of 2022.
Manitoba Cash Cost and Sustaining Cash Cost
| | | Three months ended | | | Year ended | | | Guidance | |
| | | | | | | | | | | | | | Annual | |
| | Dec. 31,
2022 | | | Dec. 31,
2021 | | | Dec. 31,
2022 | | | Dec. 31,
2021 | | | 2022 | | | 2023 | |
| Cost per pound of gold produced | | | | | | | | | | | | | | | | | | |
| Cash cost per ounce of gold produced, net of by-product credits 1, 2 | $/oz | | 922 | | | - | | | 297 | | | - | | | 300 - 550 | | | 500 - 800 | |
| Sustaining cash cost per ounce of gold produced, net of by-product credits 1, 2 | $/oz | | 1,795 | | | - | | | 1,091 | | | - | | | | | | | |
| 1 Cash cost and sustaining cash cost per ounce of gold produced, net of by-product credits, are not recognized under IFRS. For more detail on this non-IFRS financial performance measure, please see the discussion under the "Non-IFRS Financial Performance Measures" section of this MD&A. |
| 2Cash cost and sustaining cash cost per ounce of gold produced, net of by-product credits were introduced in 2022 and do not have a published comparative. |
Cash cost per ounce of gold produced, net of by-product credits, in the fourth quarter was $922, higher than the third quarter of 2022, primarily due to lower by-product credits and lower gold production. This was partially offset by lower mining, milling and general and administrative costs as well as lower treatment, refining and freight costs. However, full year 2022 cash cost per ounce of gold produced, net of by-product credits, was $297, 1% below the low end of our 2022 guidance range.
Sustaining cash cost per ounce of gold produced, net of by-product credits, in the fourth quarter was $1,795, higher than the third quarter of 2022, primarily due to the same factors affecting cash cost, partially offset by lower sustaining capital expenditures.
Metal Sold
| | | Three months ended | | | Year ended | |
| | Dec. 31, 2022 | | | Dec. 31, 2021 | | | Dec. 31, 2022 | | | Dec. 31, 2021 | |
| Payable metal in concentrate and doré | | | | | | | | | | | | | |
| Copper | tonnes | | 1,626 | | | 4,408 | | | 14,668 | | | 20,802 | |
| Gold | oz | | 32,140 | | | 40,623 | | | 163,447 | | | 126,551 | |
| Silver | oz | | 148,177 | | | 257,928 | | | 932,807 | | | 936,857 | |
| Zinc 1 | tonnes | | 8,230 | | | 21,112 | | | 59,043 | | | 96,435 | |
| 1 Includes refined zinc metal and payable zinc in concentrate sold. | |
Sales of copper and zinc during the three and twelve months ended December 31, 2022 were lower than the comparable periods in 2021 due to the same factors affecting production noted above. Gold sales during 2022 were 29% higher than 2021 as New Britannia only reached commercial production in September 2021.
OUTLOOK
This outlook includes forward-looking information about our operations and financial expectations based on our expectations and outlook as of February 23, 2023.
This outlook, including expected results and targets, is subject to various risks, uncertainties and assumptions, which may impact future performance and our achievement of the results and targets discussed in this section. For additional information on forward-looking information, refer to the "Forward-Looking Information" section of this MD&A. We may update our outlook depending on changes in metals prices and other factors, as per our "Commodity Markets" and "Sensitivity Analysis" discussions below. In addition to this section, refer to the "Operations Review", "Financial Review" and "Liquidity and Capital Resources" sections for additional details on our outlook for 2023.
Material Assumptions
Our annual production and operating cost guidance, along with our annual capital and exploration expenditure forecasts are discussed in detail below.
Production Guidance
Contained Metal in
Concentrate and Doré1 | 2023 Guidance | Year ended Dec. 31, 2022 | 2022 Guidance |
Peru | | | | |
Copper | tonnes | 91,000 - 116,000 | 89,395 | 89,000 - 115,000 |
Gold | oz | 83,000 - 108,000 | 58,229 | 70,000 - 90,000 |
Silver | oz | 2,210,000 - 2,650,000 | 2,309,352 | 1,620,000 - 2,100,000 |
Molybdenum | tonnes | 1,300 - 1,600 | 1,377 | 1,100 - 1,400 |
| | | | |
Manitoba | | | | |
Gold | oz | 175,000 - 205,000 | 161,471 | 150,000 - 185,000 |
Zinc | tonnes | 28,000 - 36,000 | 55,381 | 50,000 - 70,000 |
Copper | tonnes | 9,000 - 12,000 | 14,778 | 12,000 - 16,000 |
Silver | oz | 750,000 - 1,000,000 | 851,942 | 800,000 - 1,100,000 |
| | | | |
Total | | | | |
Copper | tonnes | 100,000 - 128,000 | 104,173 | 101,000 - 131,000 |
Gold | oz | 258,000 - 313,000 | 219,700 | 220,000 - 275,000 |
Zinc | tonnes | 28,000 - 36,000 | 55,381 | 50,000 - 70,000 |
Silver | oz | 2,960,000 - 3,650,000 | 3,161,294 | 2,420,000 - 3,200,000 |
Molybdenum | tonnes | 1,300 - 1,600 | 1,377 | 1,100 - 1,400 |
1 Metal reported in concentrate and doré is prior to refining losses or deductions associated with smelter terms. |
On a consolidated basis, we met 2022 production guidance for all metals. Consolidated copper and gold production was on the lower end of the guidance range primarily due to lower-than-planned grades in the fourth quarter of 2022 in Peru due to short-term mine plan changes that were implemented to mitigate the risks associated with logistical and supply chain disruptions in Peru.
In 2023, consolidated copper production is forecast to increase to 114,0001 tonnes, an increase of approximately 10%1 compared to 2022 levels, primarily as a result of higher expected copper production in Peru, with higher planned copper grades from the Pampacancha pit more than offsetting lower copper production in Manitoba. Consolidated gold production in 2023 is expected to increase by 30%1 to 285,5001 ounces year-over-year, due to significantly higher gold production in both Peru and Manitoba.
In early 2023, the mine plan for Peru was adjusted to prioritize the processing of lower grade stockpiles and shorter haulage distance ore to manage through the regional logistical challenges and ensure steady operation of the plant. This is expected to result in more ore being mined from the Constancia pit and less from the Pampacancha pit in the early part of the year, as well as lower recoveries due to the varying ore types present in the stockpiles. Despite these mine plan changes, 2023 copper and gold production in Peru is expected to be 103,5001 tonnes and 95,5001 ounces, representing year-over-year increases of 16%1 and 64%1, respectively. The revised mine plan for 2023 reflects a period of higher stripping activities in the Pampacancha pit from March to June with significantly higher copper and gold grades expected to be mined in the second half of 2023. Peru's production guidance also reflects regularly scheduled semi-annual mill maintenance shutdowns at Constancia during the second and fourth quarters of 2023.
In Manitoba, 2023 gold production is expected to increase by 18%1 to 190,0001 ounces compared to 2022 due to higher gold grades and a 10% increase in ore throughput at the Lalor mine. The 2023 mine plan at Lalor reflects higher production from the gold and copper-gold zones as those zones are expected to be prioritized over the base metal zones. The production guidance reflects a 10% increase in New Britannia mill throughput in 2023 given the mill has been consistently operating above its 1,500 tonnes per day nameplate capacity. The 2023 mine plan achieves gold production levels consistent with the most recent mine plan for Snow Lake but without the full ramp up to 5,300 tonnes per day as it maximizes value per tonne of ore at Lalor by prioritizing the mining of the gold-rich zones over the zinc-rich base metal zones and reflects higher throughput at the New Britannia mill. Year-over-year zinc production is expected to decline by 42%1 primarily as a result of the closure of the 777 mine in June 2022 and prioritizing the mining of the gold-rich zones over the zinc-rich base metal zones at Lalor. Manitoba's production guidance reflects regularly scheduled maintenance programs at the Lalor mine during the second and fourth quarters of 2023.
Given the short-term mine plan changes implemented at Constancia in early 2023 and the Lalor ramp-up strategy, as mentioned above, the company is examining the potential impact of these changes to 2024 and 2025 production. We expect our 2024 production guidance to be similar to the previously issued guidance on February 23, 2022, reflecting a further increase in copper production in Peru and gold production in Manitoba from 2023 levels. As a result of the 2023 mine plan changes in Peru, we now expect mining activities at the Pampacancha deposit to continue into the first half of 2025, which is expected to result in higher copper and gold production from Peru in 2025 beyond the levels shown in the most recent technical report for Constancia, dated March 29, 2021. We expect to release our new three-year production outlook together with our annual mineral reserve and resource update at the end of March 2023.
Capital Expenditure Guidance
Capital Expenditures1
(in $ millions) | 2023 Guidance3,4 | Year ended
Dec. 31, 2022 | 2022 Guidance |
| Sustaining capital | | | |
| Peru2 | 160.0 | 101.4 | 105.0 |
| Manitoba | 75.0 | 125.1 | 115.0 |
| Total sustaining capital | 235.0 | 226.5 | 220.0 |
| Growth capital | | | |
| Peru | 10.0 | 4.3 | 10.0 |
| Manitoba | 15.0 | 33.4 | 50.0 |
| Arizona5 | 30.0 | 36.2 | 40.0 |
| Total growth capital | 55.0 | 73.9 | 100.0 |
| Capitalized exploration | 10.0 | 42.3 | 40.0 |
| Total | 300.0 | 342.7 | 360.0 |
| 1 Excludes capitalized costs not considered to be sustaining or growth capital expenditures. |
| 2 Includes capitalized stripping costs. |
| 3 2023 capital expenditure guidance excludes right-of-use lease additions. |
| 4 2023 capital expenditure guidance is converted into U.S. dollars using an exchange rate of 1.35 C$/US$. |
| 5 2022 guidance reflects revised Arizona spending guidance issued on June 8, 2022, which includes $5 million in additional growth expenditures and $15 million in additional capitalized exploration related to Copper World. |
2022 total capital expenditures were 5% below guidance expectations as a result of the discretionary capital reductions across the business, partially offset by higher sustaining capital expenditures in Manitoba primarily due inflationary cost pressures and lease additions that were not originally contemplated in guidance.
We expect to continue to reduce discretionary spending with an approximately 13% year-over-year decline in total capital expenditures to $300 million in 2023, primarily due to lower discretionary growth spending and capitalized exploration in 2023.
Peru's sustaining capital expenditures in 2023 are expected to increase from 2022 levels primarily due to higher costs associated with heavy civil works for the completion of a tailings dam raise in 2023 and higher capitalized stripping costs as a result of the mine plan resequencing in 2023. Peru's growth capital spending of $10 million in 2023 includes costs associated with mill recovery improvement initiatives targeted to increase copper and molybdenum recoveries.
Manitoba's sustaining capital expenditures in 2023 are expected to be lower than 2022 primarily due to lower equipment spending at Lalor and in the mills after the Snow Lake transition and ramp up period in 2022. Manitoba's growth capital spending of $15 million in 2023 relates to the costs for the completion of the Stall mill recovery improvement project, which is expected to involve several flow sheet enhancements to increase gold and copper recoveries starting in the second quarter of 2023. These low-capital brownfield growth projects are expected to generate attractive returns and are part of our continuous improvement efforts.
The Manitoba spending guidance excludes approximately $20 million of annual care and maintenance costs related to the Flin Flon facilities in 2023, which are expected to be recorded as other operating expenses.
Arizona's growth capital spending of $30 million includes approximately $20 million in annual carrying and permitting costs for the Copper World and Mason projects and approximately $10 million for economic studies and site works in 2023.
Exploration Guidance
(in $ millions) | | Year ended | |
2023 Guidance1 | Dec. 31, 2022 | 2022 Guidance |
Peru | 15.0 | 25.1 | 25.0 |
Manitoba | 15.0 | 14.2 | 15.0 |
Arizona and other 2 | - | 37.5 | 40.0 |
Total exploration expenditures | 30.0 | 76.8 | 80.0 |
Capitalized spending | (10.0) | (42.3) | (40.0) |
Total exploration expense | 20.0 | 34.5 | 40.0 |
1 2023 exploration guidance excludes $5 million of non-cash amortization of community agreements for exploration properties. |
2 2022 guidance reflects an additional $15 million in capitalized exploration at Copper World announced on June 8, 2022. |
Total expected exploration expenditures of $30 million in 2023 are 61% lower than 2022 levels due to our continued focus on discretionary spending reductions. 2023 exploration activities are focused on areas with high potential for new discovery and mineral reserve and resource expansion.
In Peru, 2023 exploration activities will focus on permitting and drill preparation for the Maria Reyna and Caballito properties near Constancia. We also expect to complete a limited drill program at Pampacancha in 2023 to test the potential to add an incremental phase at depth to the reserve pit. In Manitoba, we have initiated a winter drill program focused on testing the deep extensions of the gold and copper zones at Lalor and a target to the north of Lalor.
Cash Cost Guidance
Copper remains the primary revenue contributor on a consolidated basis, and therefore, consolidated cost guidance has been presented as cash cost per pound of copper produced. We have also provided cash cost guidance for each of our operations based on their respective primary metal contributors. We expect combined unit operating costs in both Peru and Manitoba to trend lower in 2023, as we no longer plan to issue combined unit operating cost guidance, as we believe cash cost is a more common metric used to measure operating performance.
Cash cost 1 | 2023 Guidance | Year ended Dec. 31, 2022 | 2022 Guidance |
Peru cash cost per pound of copper2 | $/lb | 1.05 - 1.30 | 1.58 | 1.10 - 1.40 |
Manitoba cash cost per ounce of gold3 | $/oz | 500 - 800 | 297 | 300-550 |
| | | | |
Consolidated cash cost per pound of copper2 | $/lb | 0.40 - 0.80 | 0.86 | 0.60 - 1.05 |
Consolidated sustaining cash cost per pound of copper2 | $/lb | 1.35 - 2.05 | 2.07 | 1.60 - 2.25 |
1 Cash cost, net of by-product credits, per pound of copper produced is a non-IFRS financial performance measure with no standardized definition under IFRS. For further information and a detailed reconciliation, please see the discussion under the "Non-IFRS Financial Reporting Measures" section of this MD&A. |
2 Peru and consolidated cash cost, net of by-product credits, per pound of copper contained in concentrate and by-product credits are calculated using the gold and silver deferred revenue drawdown rates for the streamed ounces in Peru in effect on December 31, 2022 and the following commodity prices: $1,800 per ounce gold, $21.00 per ounce silver and $25.00 per pound molybdenum, $1.40 per pound zinc and an exchange rate of 1.35 C$/US$. |
3 Manitoba cash cost, net of by-product credits, per ounce of gold contained in concentrate and doré and by-product credits are calculated using the following commodity prices: $3.75 per pound copper, $21.00 per ounce silver, $1.40 per pound zinc and an exchange rate of 1.35 C$/US$. |
Copper cash cost in Peru is expected to decline by 26%1 in 2023 versus 2022, primarily due to higher gold by-product credits and higher copper production.
Gold cash cost in Manitoba is expected to increase in 2023 compared to 2022 as a result of the transition to a primary gold operation with lower by-product credits after the closure of the 777 mine in June 2022.
Consolidated copper cash cost in 2023 is expected to decline by 30%1 compared to 2022 levels due to the expected increase in copper production and higher expected gold by-product credits from the increase in annual gold production. Consolidated sustaining cash cost in 2023 is expected to be 18%1 lower than 2022 levels due to the same factors affecting consolidated cash cost, partially offset by slightly higher sustaining capital expenditures.
Metal production in any given quarter may vary from the annual guidance rate based on variations in grades and recoveries due to mine sequencing in the quarter, the timing of planned maintenance, and other factors. Cash cost and sustaining cash cost in any particular quarter can vary from the annual guidance ranges based on a variety of factors, including the scheduling of maintenance events, the prevailing commodity prices affecting by-product credits, the impact of social and political tensions in Peru, and seasonal heating requirements, particularly in Manitoba.
1 Year-over-year forecast changes assume the mid-point of the respective guidance range is achieved.
Commodity Markets
Our 2023 operational and financial performance will be influenced by a number of factors. At the macro-level, the general performance of the Chinese, North American and global economies will influence the demand for copper and zinc, while interest rates, inflation, the performance of financial markets and the level of economic uncertainty will influence the investment demand for gold. The recent relaxation of China's zero COVID policy has improved market sentiment and recent metal prices and may continue to provide commodity price tailwind should demand from China surprise to the upside. However, hawkish comments from the US Federal Reserve have contributed to a less dramatic price response to China's reopening. Recently, Peru has experienced heightened tensions and social unrest following a change in the country's political leadership which has contributed to reductions in the country's copper production, while inventory levels of many base metals are already low by historical standards. Challenges remain from the macro-economic and political side for both supply and demand which is likely to result in future price volatility for metal prices as we look ahead to 2023. However, the combination of China reopening and global supply challenges represents a net positive for global metal market fundamentals.
The realized prices we achieve in the commodity markets significantly affect our financial performance. Our general expectations regarding metals prices and foreign exchange rates are included below and in the "Sensitivity Analysis" section of this MD&A.
In addition to our production volumes, our financial performance is directly affected by a number of factors, including metals prices, foreign exchange rates, and input costs, including energy prices. Copper and zinc prices were under pressure in 2022, trending downward during the second half of the year. At the start of 2022, prices for copper and zinc remained well above the 10-year trailing average due to a strong rebound in demand for physical metal and lingering supply issues related to COVID-19. However, in the second half of the year, prices trended downwards amid growing recession fears in many parts of the world driven by central bank rate increases and the war in the Ukraine.
We have developed the following market analysis from various information sources including analyst and industry experts and our own market intelligence.
Copper
In 2022, the London Metal Exchange ("LME") copper price averaged approximately $4.00 per pound, ranging from an all-time high of $4.87 in March 2022 to a low of $3.18 per pound at the start of the second half of the year. Copper prices slowly recovered during the fourth quarter of 2022 ending the year at $3.80 per pound.
Copper prices faced headwinds during 2022 primarily due to growing recession fears and measures taken to tackle rising inflation. During the fourth quarter of 2022, following China's easing of pandemic related restrictions, prices started to recover.
Copper consumption grew by approximately 1% in 2022, approximating the growth in refined production and keeping the physical market relatively balanced and stocks at historically low levels.
Volatility in the short-term for copper is expected, however, strong future demand for copper will necessitate the development of intrinsically higher cost greenfield mines from the world's existing inventory of undeveloped deposits, at a time when existing mines are seeing significant cost inflation due to higher energy costs, consumables costs and taxes. This combination of market factors will likely result in significantly higher long term copper prices.
Improving prices of late are also an indication that investors are seeing beyond potential short term price volatility, to the structural copper metal deficit emerging mid-decade.
Zinc
In 2022, the LME zinc price averaged $1.58 per pound, with prices ranging from $1.22 per pound to $2.05 per pound. Zinc demand fell by 1.4% in 2022 after surging by 6.2% in 2021. The decrease in demand was primarily due to growing recession fears and policies aimed at controlling a resurgence in COVID-19. This lower demand growth was more than offset by reduced zinc supply, such that 2022 represented another year of metal deficits reducing already depleted global inventories.
The 2023 zinc metal market is projected to be the third consecutive year of global deficits. Supply chain inventories, as reflected by extreme metal premiums, are already critically low. Consequently, 2023 prices are expected to be supported by constructive supply/demand fundamentals.
Gold
In 2022, the London Gold Bullion Market price for gold averaged $1,803 per ounce, which remained relatively consistent with the average gold price of $1,799 per ounce in 2021. Gold prices traded between $1,622 per ounce and $2,051 per ounce during the year responding primarily to changing market sentiments on the direction of inflation and interest rates and the projected impact of the COVID-19 pandemic on the world economy.
The physical supply and demand for gold is not an arbitrator of future prices as it is with base metals because most of the gold ever mined is stored in bank vaults. Gold is an investment that has traditionally provided a safe haven for investors during uncertain economic times, as well as a hedge against inflation, future currency devaluation and declining values of other riskier asset classes. Concerns regarding the effect of COVID-19 on the global economic growth as governments taper monetary stimulus combined with record-high inflation and political instability in many regions of the world bodes well for the price of gold price in 2023. However, market expectations for increases in interest rates and a stronger US dollar may keep gold range bound between $1,800 and $1,900 per ounce.
Treatment Charges, Refining Charges, Zinc Metal Premiums and Freight Costs
Hudbay's operating margins are affected by a variety of marketing related costs and premiums related to the products that we produce. For the copper, zinc and molybdenum concentrates that we produce, we pay freight costs to deliver these products from our facilities to our customers and depending on the destination, we incur various combinations of truck, rail or ocean freight costs along with warehousing and loading fees. We also pay treatment and refining charges ("TC/RCs") to our customers who process our concentrates. For precious metal doré we produce, we incur transportation costs to ship to our customers.
A significant portion of our copper concentrate sales are made under multiyear contracts with an annual benchmark reference for TC/RCs. The annual benchmark for 2023 was established earlier this year at $88/8.8¢, compared to $65/6.5¢ in 2022. However since the benchmark was established, the global concentrate market has tightened, reflecting various mine production challenges in Central and South America.
Hudbay was also exposed to zinc concentrate treatment charges this year due to the closure of the Flin Flon smelter mid-year. The 2023 zinc concentrate benchmark has not yet been established, but will likely be agreed within the next 45 days. This year's benchmark is expected to exceed 2022's level of $230/dmt. However smelter curtailments in Europe are expected to be reversed to a degree this year, reducing the level of concentrate surplus previously anticipated.
Zinc metal premiums, applicable to metal sold from the Flin Flon zinc plant prior to its mid-year closure, reached record levels in North America, with spot premiums exceeding 30 cents. Power induced zinc smelter closures in Europe contributed to the market tightness in North America. Hudbay's combination of long term and spot sales resulted in record realizations prior to closure.
Bulk ocean freight rates were volatile in 2022, but remained elevated by historical standards. Hudbay's exposure to this market dynamic was limited due to previously agreed multiyear Contracts of Affreightment ("COA"), which covered the majority of our ocean freight requirements. Toward the end of 2022, spot ocean freights corrected, approaching $55/wmt for shipments from Peru to China. This afforded Hudbay, and other miners globally, an opportunity to enter into new COA's for production post 2022.
Container rates, which spiked more dramatically than bulk rates prior to the start of 2022, fell even more significantly in 2022, ending the year at approximately half the rates that prevailed at the start of the year for certain routes. This will positively impact shipment costs of molybdenum concentrate.
Sensitivity Analysis
The following table displays the estimated impact of changes in metals prices and foreign exchange rates on our 2023 net profit, earnings per share and operating cash flow, assuming that our operational performance is consistent with the mid-point of our guidance for 2023. The effects of a given change in an assumption are calculated in isolation.
| 2023 | Change of 10% | Impact on | Impact on | Impact on Operating CF |
| Base | represented by: | Profit | EPS1 | before WC changes |
Metals Prices | | | | | |
Copper price2 | $3.75/lb | +/- $0.38/lb | +/- $49M | +/- $0.19 | +/- $77M |
Zinc price | $1.40/lb | +/- $0.14/lb | +/- $5M | +/- $0.02 | +/- $8M |
Gold price3 | $1,800/oz | +/- $180/oz | +/- $23M | +/- $0.09 | +/- $38M |
| | | | | | |
Exchange Rates 4 | | | | | |
C$/US$ | 1.35 | +/-0.14 | +/- $26M | +/- $0.10 | +/- $32M |
1 Based on 262.0 million common shares outstanding as at December 31, 2022. |
2 Quotational period hedging program neutralizes provisional pricing adjustments. |
3 Gold price sensitivity also includes an impact of a +/- 10% change in the silver price (2023 assumption: $21.00/oz of silver). |
4 Change in profit from operational performance only, does not include change in profit arising from translation of balance sheet accounts. |
FINANCIAL REVIEW
Financial Results
In the fourth quarter of 2022, we recorded a net loss of $17.4 million compared to a net loss of $10.5 million in the fourth quarter of 2021, representing an increase in loss of $6.9 million. For the full year, we recorded a net profit of $70.4 million compared to a net loss of $244.4 million for the same period in 2021, representing an increase in profit of $314.8 million.
The following table provides further details on these variances:
| (in $ millions) | | Three months ended
December 31, 2022 | | | Year ended
December 31, 2022 | |
| Increase (decrease) in components of profit or loss: | | | | | | |
| Revenues | | (104.0 | ) | | (40.6 | ) |
| Cost of sales | | | | | | |
| Mine operating costs | | 35.2 | | | (27.3 | ) |
| Depreciation and amortization | | 10.5 | | | 20.3 | |
| Impairment - environmental obligation | | 46.2 | | | 193.5 | |
| Selling and administrative expenses | | 3.7 | | | 9.0 | |
| Exploration expenses | | 7.8 | | | 4.7 | |
| Re-evaluation adjustment - environmental obligation | | (13.2 | ) | | 128.9 | |
| Other expenses | | (2.2 | ) | | 2.6 | |
| Impairment loss | | - | | | (95.0 | ) |
| Net finance expense | | 1.9 | | | 102.5 | |
| Tax expense | | 7.2 | | | 16.2 | |
| (Increase in loss) / increase in profit for the period | | (6.9 | ) | | 314.8 | |
Revenue
Revenue for the fourth quarter of 2022 was $321.2 million, $104.0 million lower than the same period in 2021, primarily as a result of lower copper prices, lower zinc and gold sales volumes, higher treatment and refining charges, partially offset by higher molybdenum prices and sales volumes and higher copper sales volumes. Zinc and gold sales volumes were lower than prior year due to the planned closure of 777 in June 2022.
Full year revenue in 2022 was $1,461.4 million, $40.6 million lower than the same period in 2021, mainly due to lower zinc sales, due to the same reasons as the quarter-to-date variances described above, and lower copper and precious metal prices. Offsetting these decreases were higher realized zinc and molybdenum prices as well as higher copper, precious metal and molybdenum sales volumes.
The following table provides further details on these variances:
| (in $ millions) | | Three months ended
December 31, 2022 | | | Year ended
December 31, 2022 | |
| | | | | | | |
| Metals prices1 | | | | | | |
| Lower copper prices | | (40.7 | ) | | (51.3 | ) |
| (Lower) higher zinc prices | | (4.9 | ) | | 38.6 | |
| Lower gold prices | | (6.4 | ) | | (14.1 | ) |
| Lower silver prices | | (3.6 | ) | | (13.1 | ) |
| Sales volumes | | | | | | |
| Higher copper sales volumes | | 4.3 | | | 21.0 | |
| Lower zinc sales volumes | | (44.7 | ) | | (116.7 | ) |
| (Lower) higher gold sales volumes | | (17.0 | ) | | 77.6 | |
| (Lower) higher silver sales volumes | | (1.8 | ) | | 14.0 | |
| Other | | | | | | |
| Change in derivative mark-to-market on zinc | | (0.2 | ) | | (0.2 | ) |
| Molybdenum and other volume and pricing differences | | 17.2 | | | 17.7 | |
| Variable consideration adjustments | | - | | | (0.6 | ) |
| Effect of higher treatment and refining charges | | (6.2 | ) | | (13.5 | ) |
| Decrease in revenue in 2022 compared to 2021 | | (104.0 | ) | | (40.6 | ) |
| 1 See discussion below for further information regarding metals prices. | |
Our revenue by significant product type is summarized below:
| | | Three months ended | | | Year ended | |
| (in $ millions) | | Dec. 31, 2022 | | | Dec. 31, 2021 | | | Dec. 31, 2022 | | | Dec. 31, 2021 | |
| Copper | | 203.6 | | | 247.8 | | | 838.1 | | | 873.3 | |
| Zinc | | 24.1 | | | 73.9 | | | 223.4 | | | 301.1 | |
| Gold | | 67.4 | | | 84.5 | | | 325.1 | | | 246.6 | |
| Silver | | 2.8 | | | 7.3 | | | 24.9 | | | 26.9 | |
| Molybdenum | | 17.6 | | | 10.6 | | | 54.5 | | | 37.5 | |
| Other metals | | 0.7 | | | 1.4 | | | 5.4 | | | 7.5 | |
| Revenue from contracts | | 316.2 | | | 425.5 | | | 1,471.4 | | | 1,492.9 | |
| Amortization of deferred revenue - gold | | 4.4 | | | 10.1 | | | 36.0 | | | 37.8 | |
| Amortization of deferred revenue - silver | | 6.0 | | | 7.2 | | | 36.2 | | | 33.7 | |
| Amortization of deferred revenue - variable consideration adjustments - prior periods | | - | | | - | | | 1.0 | | | 1.6 | |
| Pricing and volume adjustments1 | | 14.5 | | | (3.9 | ) | | (14.3 | ) | | (8.6 | ) |
| Treatment and refining charges | | (19.9 | ) | | (13.7 | ) | | (68.9 | ) | | (55.4 | ) |
| Revenue | | 321.2 | | | 425.2 | | | 1,461.4 | | | 1,502.0 | |
| 1 Pricing and volume adjustments represents mark-to-market adjustments on provisionally prices sales, realized and unrealized changes to fair value for non-hedge derivative contracts and adjustments to originally invoiced weights and assays. |
For further detail on variable consideration adjustments, refer to note 19 of our consolidated financial statements.
Realized sales prices
This measure is intended to enable management and investors to understand the average realized price of metals sold to third parties in each reporting period. The average realized price per unit sold does not have any standardized meaning prescribed by IFRS, is unlikely to be comparable to similar measures presented by other issuers and should not be considered in isolation or a substitute for measures of performance prepared in accordance with IFRS.
For sales of copper, zinc, gold and silver we may enter into non-hedge derivatives ("QP hedges") which are intended to manage the provisional pricing risk arising from quotational period terms in concentrate sales agreements. The gains and losses on QP hedges are included in the calculation of realized prices. We expect that gains and losses on QP hedges will offset provisional pricing adjustments on concentrate sales contracts.
Our realized prices for the fourth quarter and full year 2022 and 2021, respectively, are summarized below:
| | | | Realized prices1 for the | | | LME YTD
20222 | | | Realized prices1 for the | |
| | Three months ended | | | Year ended | |
| | | LME QTD
20222 | | | Dec. 31,
2022 | | | Dec. 31,
2021 | | | Dec. 31,
2022 | | | Dec. 31,
2021 | |
| Prices | | | | | | | | | | | | | | | | | | | |
| Copper | $/lb | | 3.63 | | | 3.61 | | | 4.34 | | | 4.00 | | | 3.94 | | | 4.19 | |
| Zinc3 | $/lb | | 1.36 | | | 1.36 | | | 1.60 | | | 1.57 | | | 1.72 | | | 1.42 | |
| Gold4 | $/oz | | | | | 1,615 | | | 1,752 | | | | | | 1,656 | | | 1,722 | |
| Silver4 | $/oz | | | | | 16.99 | | | 23.26 | | | | | | 20.88 | | | 25.29 | |
| 1 Realized prices exclude refining and treatment charges and are on the sale of finished metal or metal in concentrate. Realized prices include the effect of provisional pricing adjustments on prior period sales. |
| 2 London Metal Exchange average for copper and zinc prices. |
| 3 Includes sales of cast zinc metal and zinc concentrate. Zinc realized prices include premiums paid by customers for delivery of refined zinc metal, but exclude unrealized gains and losses related to non-hedge derivative contracts that are included in zinc revenues. Realized prices include the effect of provisional pricing adjustments on zinc concentrate. |
| 4 Sales of gold and silver from our 777 and Constancia mines are subject to our precious metals stream agreement with Wheaton, pursuant to which we recognize deferred revenue for precious metals deliveries and also receive cash payments. Stream sales are included within realized prices and their respective deferred revenue and cash payment rates can be found on page 39 of this MD&A. |
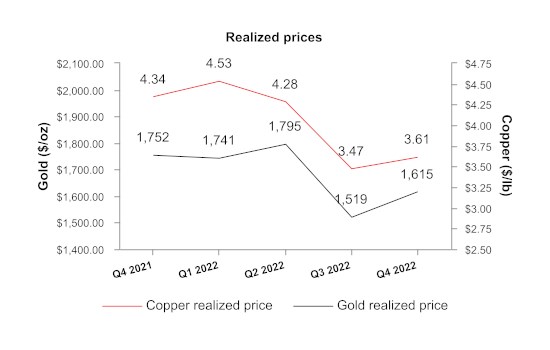
The following tables provide a reconciliation of average realized price per unit sold, by metal, to revenues as shown in the consolidated financial statements.
| Three months ended December 31, 2022 | |
| (in $ millions) 1 | | Copper | | | Zinc | | | Gold | | | Silver | | | Molybdenum | | | Other | | | Total | |
| Revenue from contracts 2 | | 203.6 | | | 24.1 | | | 67.4 | | | 2.8 | | | 17.6 | | | 0.7 | | | 316.2 | |
| Amortization of deferred revenue | | - | | | - | | | 4.4 | | | 6.0 | | | - | | | - | | | 10.4 | |
| Pricing and volume adjustments 3 | | (1.4 | ) | | 0.6 | | | 4.5 | | | 0.7 | | | 10.1 | | | - | | | 14.5 | |
| By-product credits 4 | | 202.2 | | | 24.7 | | | 76.3 | | | 9.5 | | | 27.7 | | | 0.7 | | | 341.1 | |
| Derivative mark-to-market 5 | | - | | | - | | | - | | | - | | | - | | | - | | | - | |
| Revenue, excluding mark-to-market on non-QP hedges | | 202.2 | | | 24.7 | | | 76.3 | | | 9.5 | | | 27.7 | | | 0.7 | | | 341.1 | |
| Payable metal in concentrate sold 6 | | 25,415 | | | 8,230 | | | 47,256 | | | 559,306 | | | 421 | | | - | | | - | |
| Realized price 7 | | 7,956 | | | 3,001 | | | 1,615 | | | 16.99 | | | - | | | - | | | - | |
| Realized price 8 | | 3.61 | | | 1.36 | | | - | | | - | | | - | | | - | | | - | |
| Twelve months ended December 31, 2022 | |
| (in $ millions) 1 | | Copper | | | Zinc | | | Gold | | | Silver | | | Molybdenum | | | Other | | | Total | |
| Revenue from contracts 2 | | 838.1 | | | 223.4 | | | 325.1 | | | 24.9 | | | 54.5 | | | 5.4 | | | 1,471.4 | |
| Amortization of deferred revenue | | - | | | - | | | 36.0 | | | 36.2 | | | - | | | - | | | 72.2 | |
| Pricing and volume adjustments 3 | | (17.0 | ) | | 0.6 | | | (7.6 | ) | | 1.1 | | | 8.6 | | | - | | | (14.3 | ) |
| By-product credits 4 | | 821.1 | | | 224.0 | | | 353.5 | | | 62.2 | | | 63.1 | | | 5.4 | | | 1,529.3 | |
| Derivative mark-to-market 5 | | - | | | 0.4 | | | - | | | - | | | - | | | - | | | 0.4 | |
Revenue, excluding mark-to-market
on non-QP hedges | | 821.1 | | | 224.4 | | | 353.5 | | | 62.2 | | | 63.1 | | | 5.4 | | | 1,529.7 | |
| Payable metal in concentrate sold 6 | | 94,473 | | | 59,043 | | | 213,415 | | | 2,978,485 | | | 1,352 | | | - | | | - | |
| Realized price 7 | | 8,691 | | | 3,801 | | | 1,656 | | | 20.88 | | | - | | | - | | | - | |
| Realized price 8 | | 3.94 | | | 1.72 | | | - | | | - | | | - | | | - | | | - | |
| 1 Average realized price per unit sold may not calculate based on amounts presented in this table due to rounding. |
| 2 As per financial statements. |
| 3 Pricing and volume adjustments represents mark-to-market adjustments on provisionally priced sales, realized and unrealized changes to fair value for non-hedge derivative contracts and adjustments to originally invoiced weights and assays. |
| 4 By-product credits subtotal is used in the calculated of cash cost per pound of copper and zinc produced, net of by-product credits. Cash cost per pound of copper and per ounce of gold produced, net of by-product credits, are non-IFRS financial performance measures with no standardized definition under IFRS. For further information and a detailed reconciliation, please see the discussion under the "Non-IFRS Financial Performance Measures" section of this MD&A. |
| 5 Derivative mark-to-market excludes mark-to-market on QP hedges. |
| 6 Copper, zinc and molybdenum shown in metric tonnes and gold and silver shown in ounces. |
| 7 Realized price for copper, zinc and molybdenum in $/metric tonne and realized price for gold and silver in $/oz. |
| 8 Realized price for copper and zinc in $/lb. |
The price, quantity and mix of metals sold, affect our revenue, operating cash flow and profit. Revenue from metals sales can vary from quarter to quarter due to production levels, shipping volumes and transfer of risk and title to customers.
| Three months ended December 31, 2021 | |
| (in $ millions) 1 | | Copper | | | Zinc | | | Gold | | | Silver | | | Molybdenum | | | Other | | | Total | |
| Revenue from contracts 2 | | 247.8 | | | 73.9 | | | 84.5 | | | 7.3 | | | 10.6 | | | 1.4 | | | 425.5 | |
| Amortization of deferred revenue | | - | | | - | | | 10.1 | | | 7.2 | | | - | | | - | | | 17.3 | |
| Pricing and volume adjustments 3 | | (9.2 | ) | | 0.6 | | | 5.1 | | | 0.4 | | | (0.8 | ) | | - | | | (3.9 | ) |
| By-product credits 4 | | 238.6 | | | 74.5 | | | 99.7 | | | 14.9 | | | 9.8 | | | 1.4 | | | 438.9 | |
| Derivative mark-to-market 5 | | - | | | (0.2 | ) | | - | | | - | | | - | | | - | | | (0.2 | ) |
| Revenue, excluding mark-to-market on non-QP hedges | | 238.6 | | | 74.3 | | | 99.7 | | | 14.9 | | | 9.8 | | | 1.4 | | | 438.7 | |
| Payable metal in concentrate sold 6 | | 24,959 | | | 21,112 | | | 56,927 | | | 638,640 | | | 245 | | | - | | | - | |
| Realized price 7 | | 9,559 | | | 3,523 | | | 1,752 | | | 23.26 | | | - | | | - | | | - | |
| Realized price 8 | | 4.34 | | | 1.60 | | | - | | | - | | | - | | | - | | | - | |
| Twelve months ended December 31, 2021 | |
| (in $ millions) 1 | | Copper | | | Zinc | | | Gold | | | Silver | | | Molybdenum | | | Other | | | Total | |
| Revenue from contracts 2 | | 873.3 | | | 301.1 | | | 246.6 | | | 26.9 | | | 37.5 | | | 7.5 | | | 1,492.9 | |
| Amortization of deferred revenue | | - | | | - | | | 37.8 | | | 33.7 | | | - | | | - | | | 71.5 | |
| Pricing and volume adjustments 3 | | (21.9 | ) | | 1.2 | | | 5.6 | | | 0.7 | | | 5.8 | | | - | | | (8.6 | ) |
| By-product credits 4 | | 851.4 | | | 302.3 | | | 290.0 | | | 61.3 | | | 43.3 | | | 7.5 | | | 1,555.8 | |
| Derivative mark-to-market 5 | | - | | | 0.2 | | | - | | | - | | | - | | | - | | | 0.2 | |
| Revenue, excluding mark-to-market on non-QP hedges | | 851.4 | | | 302.5 | | | 290.0 | | | 61.3 | | | 43.3 | | | 7.5 | | | 1,556.0 | |
| Payable metal in concentrate sold 6 | | 92,200 | | | 96,435 | | | 168,358 | | | 2,427,508 | | | 1,099 | | | - | | | - | |
| Realized price 7 | | 9,235 | | | 3,137 | | | 1,722 | | | 25.29 | | | - | | | - | | | - | |
| Realized price 8 | | 4.19 | | | 1.42 | | | - | | | - | | | - | | | - | | | - | |
| | | | | | | | | | | | | | | | | | | | | | |
| 1 Average realized price per unit sold may not calculate based on amounts presented in this table due to rounding. |
| 2 As per financial statements. |
| 3 Pricing and volume adjustments represents mark-to-market adjustments on provisionally priced sales, realized and unrealized changes to fair value for non-hedge derivative contracts and adjustments to originally invoiced weights and assays. |
| 4 By-product credits subtotal is used in the calculated of cash cost per pound of copper and zinc produced, net of by-product credits. Cash cost per pound of copper and per ounce of gold produced, net of by-product credits, are non-IFRS financial performance measures with no standardized definition under IFRS. For further information and a detailed reconciliation, please see the discussion under the "Non-IFRS Financial Performance Measures" section of this MD&A. |
| 5 Derivative mark-to-market excludes mark-to-market on QP hedges. |
| 6 Copper, zinc and molybdenum shown in metric tonnes and gold and silver shown in ounces. |
| 7 Realized price for copper, zinc and molybdenum in $/metric tonne and realized price for gold and silver in $/oz. |
| 8 Realized price for copper and zinc in $/lb. |
Stream Sales
The following table shows stream sales included within realized prices and their respective deferred revenue and cash payment rates:
| | | | Three months ended | | | Year ended | |
| | | | Dec. 31, 2022 | | | Dec. 31, 2022 | |
| | | | Manitoba | | | Peru 4 | | | Manitoba | | | Peru 4 | |
| Gold | oz | | - | | | 6,013 | | | 11,115 | | | 30,275 | |
| Silver | oz | | - | | | 402,883 | | | 235,626 | | | 2,038,748 | |
| Gold deferred revenue drawdown rate1,2 | $/oz | | - | | | 734 | | | 1,238 | | | 734 | |
| Gold cash rate3 | $/oz | | - | | | 416 | | | 430 | | | 414 | |
| Total gold stream realized price | $/oz | | - | | | 1,150 | | | 1,668 | | | 1,148 | |
| Silver deferred revenue drawdown rate1,2 | $/oz | | - | | | 14.95 | | | 24.43 | | | 14.95 | |
| Silver cash rate3 | $/oz | | - | | | 6.14 | | | 6.34 | | | 6.11 | |
| Total silver stream realized price | $/oz | | - | | | 21.09 | | | 30.77 | | | 21.06 | |
| | | Three months ended | | | Year ended | |
| | Dec. 31, 2021 | | | Dec. 31, 2021 | |
| | Manitoba | | | Peru | | | Manitoba | | | Peru 4 | |
| Gold | oz | | 4,290 | | | 6,196 | | | 18,441 | | | 18,352 | |
| Silver | oz | | 69,472 | | | 351,004 | | | 326,056 | | | 1,476,537 | |
| Gold deferred revenue drawdown rate1,2 | $/oz | | 1,253 | | | 762 | | | 1,262 | | | 791 | |
| Gold cash rate 3 | $/oz | | 429 | | | 412 | | | 426 | | | 410 | |
| Total gold stream realized price | $/oz | | 1,682 | | | 1,174 | | | 1,688 | | | 1,201 | |
| Silver deferred revenue drawdown rate1,2 | $/oz | | 24.14 | | | 15.64 | | | 24.32 | | | 17.47 | |
| Silver cash rate 3 | $/oz | | 6.33 | | | 6.08 | | | 6.29 | | | 6.05 | |
| Total silver stream realized price | $/oz | | 30.47 | | | 21.72 | | | 30.61 | | | 23.52 | |
| 1Subsequent to the variable consideration adjustment recorded on January 1, 2022, the deferred revenue amortization is recorded in Manitoba at C$1,584/oz gold and C$31.28/oz silver (December 31, 2021 - C$1,578/oz gold and C$30.38/oz silver) and converted to US dollars at the exchange rate in effect at the time of revenue recognition. A variable consideration adjustment was recorded on September 30, 2022 in Manitoba following a revised forecast for 777 in the third quarter of 2022, which indicated that substantially all of 777's precious metals reserves and inventory levels have been depleted. |
| 2 Deferred revenue drawdown rates for gold and silver do not include variable consideration adjustments. |
| 3 The gold and silver cash rate for Manitoba increased by 1% from $400/oz and $5.90/oz effective August 1, 2015. Subsequently every year, on August 1, the cash rate will increase by 1% compounded. The weighted average cash rate is disclosed. The gold and silver cash rate for Peru increased by 1% from $400/oz and $5.90/oz effective August 4, 2019. Subsequently every year, on August 4, the cash rate will increase by 1% compounded. The weighted average cash rate is disclosed. |
| 4 Subsequent to the variable consideration adjustment recorded on January 1, 2022, the deferred revenue amortization is recorded in Peru at $734/oz gold and $14.95/oz silver. Effective May 1, 2021, the drawdown rate for the Peru stream agreement for gold was $762/oz and prior to May 1, 2021, the drawdown rate for Peru gold was $990/oz. Effective May 1, 2021, the drawdown rate for the Peru stream agreement for silver was $15.64/oz and prior to May 1, 2021 the drawdown rate for Peru silver was $21.86/oz. |
Cost of Sales
Our detailed cost of sales is summarized as follows:
| (in $ thousands) | | Three months ended | | | Year ended | |
| | Dec. 31,
2022 | | | Dec. 31,
2021 | | | Dec. 31,
2022 | | | Dec. 31,
2021 | |
| Peru | | | | | | | | | | | | |
| Mining | | 41,647 | | | 27,756 | | | 137,546 | | | 98,200 | |
| Milling | | 50,723 | | | 40,121 | | | 195,152 | | | 168,477 | |
| Changes in product inventory | | (15,685 | ) | | (4,507 | ) | | (31,348 | ) | | (13,743 | ) |
| Depreciation and amortization | | 58,256 | | | 54,078 | | | 211,043 | | | 194,408 | |
| G&A | | 14,912 | | | 18,496 | | | 63,092 | | | 63,876 | |
| Inventory adjustments | | - | | | - | | | (558 | ) | | (1,446 | ) |
| Freight, royalties and other charges | | 17,263 | | | 12,371 | | | 55,651 | | | 44,819 | |
| Total Peru cost of sales | | 167,116 | | | 148,315 | | | 630,578 | | | 554,591 | |
| Manitoba | | | | | | | | | | | | |
| Mining | | 38,112 | | | 58,891 | | | 192,704 | | | 222,660 | |
| Milling | | 14,868 | | | 22,193 | | | 73,903 | | | 62,995 | |
| Zinc plant | | - | | | 19,008 | | | 32,755 | | | 72,392 | |
| Changes in product inventory | | (740 | ) | | (11,740 | ) | | 28,223 | | | (4,437 | ) |
| Depreciation and amortization | | 21,152 | | | 35,849 | | | 126,572 | | | 163,516 | |
| Inventory adjustments | | 7 | | | - | | | 4,111 | | | 5,445 | |
| G&A | | 6,847 | | | 14,345 | | | 62,782 | | | 54,063 | |
| Post-employment plan (curtailment) / past service cost | | (2,384 | ) | | 737 | | | (2,384 | ) | | 4,965 | |
| Freight, royalties and other charges | | 6,542 | | | 9,660 | | | 35,308 | | | 41,316 | |
| Total Manitoba cost of sales | | 84,404 | | | 148,943 | | | 553,974 | | | 622,915 | |
| Cost of sales | | 251,520 | | | 297,258 | | | 1,184,552 | | | 1,177,506 | |
Total cost of sales for the fourth quarter of 2022 was $251.5 million, reflecting a decrease of $45.7 million from the fourth quarter of 2021. Peru cost of sales increased by $18.8 million in the fourth quarter of 2022, compared to the same period of 2021 as a result of increases in mining, milling, depreciation and freight costs. The increases in mining and milling costs were mainly driven by a higher strip ratio as well as higher power prices and consumable costs. The increase to depreciation in the fourth quarter of 2022 was mainly driven by higher contained metal compared to the same quarter in 2021. These increases were partially offset by a buildup of copper concentrate inventory caused by logistics and supply chain disruptions from protests and social unrest in the southern Peru mining corridor. Manitoba cost of sales decreased by $64.5 million in the fourth quarter of 2022, compared to the same period of 2021 as a result of the closure of the zinc plant in June 2022, decreases in the mining, milling and depreciation costs due to the planned closure of 777 and the Flin Flon mill, a reduction of general and administrative and freight costs, a post-employment curtailment and favourable movements in the foreign exchange rate as Manitoba's costs are primarily denominated in Canadian dollars. These decreases were partially offset by a significant drawdown of copper concentrate product inventory.
Total cost of sales for 2022 was $1,184.6 million, reflecting an increase of $7.0 million from 2021. Peru cost of sales increased by $76.0 million primarily due to the same reasons outlined above for the fourth quarter variance. Manitoba cost of sales decreased by $69.0 million compared to the same period of 2021 as a result of the closure of the zinc plant in June 2022, decreases in the mining costs and depreciation due to the closure of 777, a reduction of freight costs, a post-employment curtailment gain and favourable movements in the foreign exchange rate as Manitoba's costs are primarily denominated in Canadian dollars. These decreases were partially offset by a significant drawdown of copper concentrate product inventory and increases in milling and general and administrative costs, mostly related to inflationary pressures on consumables and higher volumes of ore milled at New Britannia as well as increases in accrued employee profit sharing.
For details on unit operating costs, refer to the respective tables in the "Operations Review" section of this MD&A.
For the fourth quarter of 2022, other significant variances in expenses from operations, compared to the same period in 2021, include the following:
- A comparative period impairment - environmental provision of $46.2 million related to a prior period increase in the valuation of the environmental reclamation provision due to lower long-term discount rates for Flin Flon operation, which was expensed in the prior period as the site was scheduled to close in 2022. No such charge occurred in 2022.
- Re-evaluation adjustment - environmental provision increased by $13.2 million due to the relative revaluation of the environmental reclamation provision on our Manitoba non-producing sites from changes in long term risk-free discount rates and inflation rates.
Given the long term nature of the reclamation cash flows, the related environmental reclamation provision is highly sensitive to changes in inflation rates and long-term risk-free discount rates and, as such, we may continue to experience significant quarterly closure cost provision revaluations.
- Exploration expenses decreased by $7.8 million compared to 2021, as previously expensed Copper World drilling costs are now capitalized.
For the year-to-date 2022, other significant variances in expenses from operations, compared to 2021, include the following:
- A comparative period impairment - environmental provision of $193.5 million related to a revised Flin Flon closure plan reflecting higher cost estimates, leading to an increase in the environmental reclamation provision which was expensed in the prior period as the site was scheduled to close in 2022. No such charge occurred in 2022.
- Re-evaluation adjustment - environmental provision decreased by $128.9 million due to the relative revaluation of the environmental reclamation provision on our Manitoba non-producing sites from changes in long term risk-free discount rates and inflation rates.
- Impairment loss of $95.0 million during 2022 for certain capitalized costs and assets associated with the previous stand-alone development plan for the Rosemont deposit, which were determined to no longer be recoverable. No such charge occurred in 2021.
- Exploration expenses decreased by $4.7 million compared to 2021, as previously expensed Copper World costs are now capitalized.
- Selling and administrative expenses decreased by $9.0 million compared to 2021. The decrease was primarily due to lower share based compensation expense as a result of the revaluation of previously issued share units to lower share prices during the current year compared to the prior year.
Net finance expense
| (in $ thousands) | | Three months ended | | | Year ended | |
| | Dec. 31,
2022 | | | Dec. 31,
2021 | | | Dec. 31,
2022 | | | Dec. 31,
2021 | |
| | | | | | | | | | | | | |
| Finance costs - accrued or payable: | | | | | | | | | | | | |
| Interest expense on long-term debt | | 16,933 | | | 16,911 | | | 67,663 | | | 74,748 | |
| Withholding taxes | | 1,528 | | | 1,846 | | | 6,092 | | | 7,727 | |
| Tender premium on senior unsecured notes | | - | | | - | | | - | | | 22,878 | |
| Loss (gain) on disposal of investments | | 516 | | | (453 | ) | | 3,648 | | | (968 | ) |
| Other accrued/payable costs 1 | | 663 | | | 1,724 | | | 5,279 | | | 7,784 | |
| Total finance costs - accrued or payable | | 19,640 | | | 20,028 | | | 82,682 | | | 112,169 | |
| | | | | | | | | | | | | |
| Finance costs - non-cash: | | | | | | | | | | | | |
| Accretion on streaming agreements2 | | 7,018 | | | 8,295 | | | 27,778 | | | 42,654 | |
| Change in fair value of financial assets and liabilities at fair value through profit or loss | | 6,830 | | | 6,779 | | | 942 | | | 54,514 | |
| Write off unamortized transaction costs | | - | | | - | | | - | | | 2,480 | |
| Other non-cash costs3 | | 3,240 | | | 3,545 | | | 7,092 | | | 9,202 | |
| Total finance costs - non-cash | | 17,088 | | | 18,619 | | | 35,812 | | | 108,850 | |
| Net finance expense | | 36,728 | | | 38,647 | | | 118,494 | | | 221,019 | |
| 1 Includes interest income and other finance expense. |
| 2 Includes variable consideration adjustment (prior periods). |
| 3 Includes accretion on community agreements, accretion on Wheaton refund liability, unwinding of discount on provisions, and net foreign exchange losses (gains). |
Net finance expense during the fourth quarter ended December 31, 2022, decreased by $1.9 million compared to the fourth quarter of 2021 due to a $0.4 million decrease in accrued finance costs and a $1.5 million decrease in non-cash finance costs.
The overall decrease was primarily driven by a $1.3 million reduction in the accretion on streaming arrangements due to the planned closure of 777 in June 2022 and an increase of interest income.
Net finance expense during the year ended 2022, decreased by $102.5 million compared to year ended 2021 due to a $29.5 million decrease in accrued finance costs and a $73.0 million decrease in non-cash finance costs.
The reduction in net finance expense was primarily driven by the refinancing of senior unsecured notes in the third quarter of 2021. The prior year refinancing included a $49.8 million write-off of a non-cash embedded derivative on the early redemption option associated with our extinguished senior unsecured notes as well as a call premium of $22.9 million, with no corresponding charges recorded in 2022. In addition, we also incurred a $14.9 million reduction in the accretion on streaming arrangements due to a lower interest rate following the amended Peru streaming arrangement in the second quarter of 2021 and the closure of 777 in 2022, a reduction in interest expense of $7.1 million mainly due to lower interest rates on our long term debt, a decrease of $6.9 million in revaluation losses on our equity investments and a $6.8 million relative gain on foreign exchange. Partially offsetting these increases was a $4.6 million increase in losses on the disposal of certain public investments, a $3.5 million increase in accretion on environmental provisions and a $3.1 million increase in finance expense from a change in the relative revaluation of the gold prepayment liability.
Tax Expense (Recovery)
For the three months and year ended December 31, 2022, tax expense decreased by $7.2 million and $16.2 million, respectively, compared to the same periods in 2021. The following table provides further details:
| | | Three months ended | | | Year ended | |
| | Dec. 31, 2022 | | | Dec. 31, 2021 | | | Dec. 31, 2022 | | | Dec. 31, 2021 | |
| (in $ thousands) |
| Deferred tax recovery - income tax 1 | | (6,401 | ) | | (7,161 | ) | | (1,193 | ) | | (15,995 | ) |
| Deferred tax (recovery) expense - mining tax 1 | | (127 | ) | | 2,179 | | | 5,717 | | | 11,202 | |
| Total deferred tax (recovery) expense | | (6,528 | ) | | (4,982 | ) | | 4,524 | | | (4,793 | ) |
| Current tax expense - income tax | | 6,517 | | | 11,503 | | | 10,667 | | | 25,570 | |
| Current tax expense - mining tax | | 3,165 | | | 3,783 | | | 10,242 | | | 20,830 | |
| Total current tax expense | | 9,682 | | | 15,286 | | | 20,909 | | | 46,400 | |
| Tax expense | | 3,154 | | | 10,304 | | | 25,433 | | | 41,607 | |
| 1 Deferred tax expense (recovery) represents our draw down/increase of non-cash deferred income and mining tax assets/liabilities. | |
Income Tax Expense/Recovery
Applying the estimated Canadian statutory income tax rate of 26.3% to our profit before taxes of $95.8 million for the year-to-date of 2022 would have resulted in a tax expense of approximately $25.2 million; however, we recorded an income tax expense of $9.5 million. The significant items causing our effective income tax rate to be different than the 26.3% estimated Canadian statutory income tax rate include:
- Deductible temporary differences with respect to Peru and Manitoba, relating to the decommissioning and restoration liabilities, were recognized as we have determined that it is probable that we will realize the recovery of these deferred tax assets based on the timing of the reversals of the deductible temporary differences and the future projected taxable profit of the Manitoba and Peru operations. This resulted in a combined deferred tax recovery of $39.0 million.
- Temporary income tax differences recognized as we have determined that it is probable that we will realize the recovery of these deferred tax assets. This resulted in a deferred tax recovery of $0.5 million.
- Foreign exchange on the translation of deferred tax balances to group currency resulted in a deferred tax expense of $13.1 million.
- The tax expense with respect to our foreign operations are recorded using an income tax rate other than the Canadian statutory income tax rate of 26.3%, resulting in a tax expense of $15.3 million.
- The recognition of previously unrecognized deferred tax assets resulted in a deferred tax recovery of $3.9 million.
Mining Tax Expense
Applying the estimated Manitoba mining tax rate of 10.0% to our profit before taxes of $95.8 million for the fourth quarter of 2022 would have resulted in a tax expense of approximately $9.6 million; however, we recorded a mining tax expense of $15.9 million. Effective mining tax rates can vary significantly based on the composition of our earnings and the expected amount of mining taxable profits. Corporate costs and other costs not related to mining operations are not deductible in computing mining profits. A brief description of how mining taxes are calculated in our various business units is discussed below.
Manitoba
The Province of Manitoba imposes mining tax on profit related to the sale of mineral products mined in the Province of Manitoba (mining taxable profit) at the following rates:
- 10% of total mining taxable profit if mining profit is C$50 million or less;
- Between mining profit of C$50 and $C55 million, mining tax is equal to a minimum of C$5 million plus mining profit less C$50 million multiplied by 65%;
- 15% of total mining taxable profit if mining profits are between C$55 million and C$100 million;
- Between mining profit of C$100 million and C$105 million, mining tax is equal to a minimum of C$15 million plus mining profit less C$100 million multiplied by 57%; and
- 17% of total mining taxable profit if mining profits exceed C$105 million.
We estimate that the tax rate that will be applicable when temporary differences reverse will be approximately 10.0%.
Peru
The Peruvian government imposes two parallel mining tax regimes, the Special Mining Tax and the Modified Royalty, on companies' operating mining income on a sliding scale, with progressive rates ranging from 2.0% to 8.4% and 1.0% to 12.0%, respectively. Based on financial forecasts, we have recorded a deferred tax liability as at December 31, 2022, at the tax rate we expect to apply when temporary differences reverse.
LIQUIDITY AND CAPITAL RESOURCES
As at December 31, 2022, our liquidity includes $225.7 million in cash as well as undrawn total availability of $354.3 million under our revolving credit facilities.
Senior Unsecured Notes
We have $600.0 million aggregate principal amount of 4.5% senior notes due April 2026 and $600.0 million aggregate principal amount of 6.125% senior notes due April 2029.
Senior Secured Revolving Credit Facilities
We have two senior secured revolving credit facilities with total commitments of $450 million ("the Credit Facilities") for our Canadian and Peruvian businesses and substantially similar terms and conditions. As at December 31, 2022, we were in compliance with our covenants under the Credit Facilities and had drawn $25.5 million in letters of credit under the Credit Facilities.
C$130 Million Bilateral Letter of Credit Facility
On August 22, 2022, we closed a C$130.0 million bilateral letter of credit facility ("LC Facility") with a major Canadian financial institution. The LC Facility enables the Company to issue up to C$130.0 million of letters of credit to beneficiaries on an unsecured basis at attractive rates, with a further C$30.0 million sub-limit for financial letters of credit. This new facility was permitted under the existing terms the Credit Facilities and has no financial covenants. As at December 31, 2022, the Manitoba business unit had drawn $56.7 million in letters of credit under the LC Facility.
Surety Bonds
As at December 31, 2022, the Arizona business unit had $12.8 million in surety bonds issued to support future reclamation and closure obligations. The Peru business unit also had $107.6 million in letters of credit issued with various Peruvian financial institutions to support future reclamation and other operating matters. No cash collateral is required to be posted under these letters of credit or surety bonds.
Gold Prepay
During the fourth quarter of 2020, we entered into a gold forward sale and prepay transaction which generated $115.0 million in cash proceeds to pre-fund the expected capital requirements for the New Britannia gold mill refurbishment project. The transaction valued the future gold ounce delivery obligation for 79,954 gold ounces in 2022 and 2023 at forward curve prices averaging approximately $1,682 per ounce. The gold delivery obligation is expected to be satisfied with a monthly delivery of 3,331 gold ounces over a 24-month period from January 2022 to December 2023. The fair value of the financial liability at December 31, 2022 was $71,208.
Financial Condition
Financial Condition as at December 31, 2022 compared to December 31, 2021
Cash decreased by $45.3 million during the year to $225.7 million as at December 31, 2022. This decrease was mainly the result of investing and financing cash outflows of $346.5 million from capital investments and community agreements primarily at our Peru and Manitoba operations, partial repayment of our gold prepayment liability of $71.7 million, interest payments of $63.8 million, lease payments of $35.8 million, $10.0 million for a scheduled payment related to the Rosemont acquisition, other finance payments of $12.3 million as well as dividends of $4.0 million. Offsetting these outflows were cash inflows from operating activities of $487.8 million. We hold the majority of our cash in low-risk, liquid investments with major Canadian and Peruvian financial institutions.
Working capital decreased by $71.0 million to $76.5 million from December 31, 2021 to December 31, 2022, primarily due to a decrease in trade and other receivables of $90.9 million mainly due to timing and changes in provisionally priced receivables, a decrease in cash of $45.3 million and changes to other financial assets and liabilities of $10.8 million due to the revaluation of our non-hedge derivatives. Offsetting these items was a decrease in deferred revenue liabilities of $24.3 million due to the closure of 777 in June 2022, a decrease in net taxes payable of $20.3 million, a decrease in lease liabilities of $17.4 million, a decrease in other liabilities of $16.2 million mainly due to changes in decommissioning and restoration liabilities and an increase in prepaid expenses of $4.8 million.
Cash Flows
The following table summarizes our cash flows for the year ended months ended December 31, 2022 and December 31, 2021:
| (in $ thousands) | | Three months ended | | | Year ended | |
| | Dec. 31,
2022 | | | Dec. 31,
2021 | | | Dec. 31,
2022 | | | Dec. 31,
2021 | |
| Operating cash flow before change in non-cash working capital | | 109,148 | | | 156,917 | | | 391,729 | | | 483,862 | |
| Precious metals stream deposit | | - | | | 4,000 | | | - | | | 4,000 | |
| Change in non-cash working capital | | (22,766 | ) | | (63,813 | ) | | 96,074 | | | (102,791 | ) |
| Cash generated from operating activities | | 86,382 | | | 97,104 | | | 487,803 | | | 385,071 | |
| Cash used in investing activities | | (89,114 | ) | | (105,603 | ) | | (337,670 | ) | | (376,257 | ) |
| Cash used in financing activities | | (58,580 | ) | | (18,513 | ) | | (196,300 | ) | | (175,899 | ) |
| Effect of movement in exchange rates on cash | | 860 | | | 550 | | | 843 | | | (1,061 | ) |
| Decrease in cash | | (60,452 | ) | | (26,462 | ) | | (45,324 | ) | | (168,146 | ) |
Cash Flow from Operating Activities
Cash generated from operating activities was $86.4 million during the fourth quarter of 2022, a decrease of $10.7 million compared with the same period in 2021. Operating cash flow before change in non-cash working capital was $109.1 million during the fourth quarter of 2022, reflecting a decrease of $47.8 million compared to the fourth quarter of 2021. The decrease in operating cash flows before changes in working capital is mostly attributable to lower prices for all metals, lower gold sales volumes due to a temporary deferral of Pampacancha mining operations in the quarter, lower zinc sales volumes primarily due to the planned closure of 777 in June 2022, higher mine operating costs due to inflationary pressures on input costs, partially offset by higher molybdenum prices and sales volumes.
Cash generated from operating activities for the full year 2022 was $487.8 million in 2022, an increase of $102.7 million compared to 2021. Operating cash flow before changes in non-cash working capital for 2022 was $391.7 million, a decrease of $92.1 million compared to 2021. The decrease in operating cash flow before changes in working capital is mostly attributable to the timing of current tax payments, which increased by $19.5 million compared to 2021, higher mine operating costs due to inflationary pressures on input costs, lower copper and precious metal prices and lower zinc sales volumes partially offset by higher copper and precious metal sales volumes and higher zinc prices.
Cash Flow from Investing and Financing Activities
During the fourth quarter of 2022, we spent $147.7 million in investing and financing activities, primarily driven by $88.8 million in capital expenditures, $3.9 million in community agreements, $31.9 million of interest payments, $17.4 million in partial settlement of our gold prepayment liability, $6.5 million in capitalized lease payments and $3.1 million in other finance payments.
Year-to-date, we used $534.0 million of cash in investing and financing activities, primarily driven by $309.0 million of capital expenditures, $37.5 million in community agreements, $71.7 million in partial settlement of our gold prepayment liability, $63.8 million of interest payments, $35.8 million in capitalized lease payments, $12.3 million of financing costs mainly related to withholding taxes on our debt obligations and our revolving credit facilities, $10.0 million for a scheduled payment related to the Rosemont acquisition and $4.0 million in dividend payments.
Capital Expenditures
The following summarizes accrued and cash additions to capital assets for the periods indicated:
| | | Three months ended | | | Year ended | | | Guidance | |
| | Dec. 31,
2022 | | | Dec. 31,
2021 | | | Dec. 31,
2022 | | | Dec. 31,
2021 | | | Annual | |
| (in $ millions) | | 2022 | | | 20233 | |
| Manitoba sustaining capital expenditures | | 26.1 | | | 22.5 | | | 125.1 | | | 100.4 | | | 115.0 | | | 75.0 | |
| Peru sustaining capital expenditures 1 | | 24.4 | | | 45.0 | | | 101.4 | | | 128.9 | | | 105.0 | | | 160.0 | |
| Total sustaining capital expenditures | | 50.5 | | | 67.5 | | | 226.5 | | | 229.3 | | | 220.0 | | | 235.0 | |
| Arizona capitalized costs 2 | | 9.1 | | | 9.7 | | | 36.2 | | | 22.9 | | | 40.0 | | | 30.0 | |
| Peru growth capitalized expenditures | | 2.8 | | | - | | | 4.3 | | | 22.8 | | | 10.0 | | | 10.0 | |
| Manitoba growth capitalized expenditures | | 9.0 | | | 22.0 | | | 33.4 | | | 119.2 | | | 50.0 | | | 15.0 | |
| Other capitalized costs | | 2.0 | | | 1.7 | | | 5.8 | | | 18.2 | | | - | | | - | |
| Capitalized exploration 2 | | 18.7 | | | 9.9 | | | 42.3 | | | 13.3 | | | 40.0 | | | 10.0 | |
| Total other capitalized expenditures | | 41.6 | | | 43.3 | | | 122.0 | | | 196.4 | | | | | | | |
| Total capital additions | | 92.1 | | | 110.8 | | | 348.5 | | | 425.7 | | | | | | | |
| | | | | | | | | | | | | | | | | | | |
| Reconciliation to cash capital additions: | | | | | | | | | | | | | | | | | | |
| Right-of-use asset additions | | (1.9 | ) | | (17.2 | ) | | (28.0 | ) | | (49.7 | ) | | | | | | |
| Community agreement additions, net | | - | | | (0.9 | ) | | (3.5 | ) | | (24.2 | ) | | | | | | |
| Change in capital accruals and other | | (1.4 | ) | | 10.0 | | | (8.0 | ) | | 0.4 | | | | | | | |
| Acquisition of property, plant & equipment - cash | | 88.8 | | | 102.7 | | | 309.0 | | | 352.2 | | | | | | | |
| 1 Peru sustaining capital expenditures includes capitalized stripping costs. |
| 2 In August 2022 Arizona capital expenditure guidance has increased by $20 million, which includes an additional $15 million in capitalized exploration and $5 million in capitalized costs. |
| 3 Capital expenditure guidance in 2023 excludes right-of-use lease additions.. |
For the three months and year ended December 31, 2022, total capital additions declined by 17% and 18%, respectively, compared to the same periods in 2021 as a result of lower sustaining capital expenditures in Peru and mostly lower growth spending at our operations, partially offset by higher sustaining capital expenditures in Manitoba and higher capitalized exploration and growth spending in Arizona.
Sustaining capital expenditures in Manitoba for the three months and year ended December 31, 2022 were $26.1 million and $125.1 million, respectively, representing increases of $3.6 million and $24.7 million compared to the same period in 2021. The increase in year-to-date sustaining capital expenditures was mainly due to higher planned capital development at Lalor, additional spending for tailings management and lease additions related to the Snow Lake operations, partially offset by the cessation of capitalizing development costs at 777.
Sustaining capital expenditures in Peru for the three months and year ended December 31, 2022 were $24.4 million and $101.4 million, respectively, representing a decrease of $20.6 million and $27.5 million compared to the same period in 2021. The decreased expenditures mainly relate to lower spending for the tailings management facility expansion partially offset by increased capitalized stripping at Pampacancha.
Growth capital spending in Manitoba for the three months and year ended December 31, 2022 were $9.0 million and $33.4 million, respectively, reflecting expenditures for the Lalor expansion and recovery improvement projects at both New Britannia and Stall. Compared to the same periods in 2021, growth capital expenditures decreased by $13.0 million and $85.8 million for the three months and year ended December 31, 2022, respectively, as the comparative periods included significant costs related to the New Britannia refurbishment project, which was completed in the fourth quarter of 2021.
Growth capital expenditures in Peru for the twelve months ended December 31, 2022 were $4.3 million, representing a decrease of $18.5 million compared to the same period in 2021. This decrease was caused by costs incurred in the comparative period to bring Pampacancha into commercial production during 2021.
Arizona's growth capital expenditures for the three months and year ended December 31, 2022 were $9.1 million and $36.2 million, respectively, and relate primarily to the infill drilling at Copper World to upgrade resources to reserves and the pre-feasibility study costs.
Other capitalized costs for the three months and year ended December 31, 2022 were $2.0 million and $5.8 million, respectively, and mainly consist of changes in estimates for certain Peru community agreements.
Consolidated sustaining and growth capital expenditures in 2022 were below our full year combined guidance. This reflects discretionary growth capital reductions of approximately $25 million across the business, partially offset by approximately $10 million in higher sustaining capital expenditures in Manitoba due to inflationary cost pressures and lease additions that were not originally contemplated in guidance.

Capital Commitments
As at December 31, 2022, we had outstanding capital commitments in Canada of approximately $9.7 million, of which $8.7 million can be terminated, approximately $27.1 million in Peru primarily related to exploration option agreements, all of which can be terminated, and approximately $43.1 million in Arizona, primarily related to our Copper World project, of which approximately $7.2 million can be terminated.
Contractual Obligations
The following table summarizes our significant contractual obligations as at December 31, 2022:
| | | | | | Less than
12 months | | | 13 - 36
months | | | 37 - 60
months | | | More than
60 months | |
| Payment Schedule (in $ millions) | | Total | |
| Long-term debt obligations1 | | 1,541.7 | | | 66.7 | | | 132.9 | | | 687.0 | | | 655.1 | |
| Gold prepayment obligation2 | | 71.2 | | | 71.1 | | | 0.1 | | | - | | | - | |
| Lease obligations | | 127.6 | | | 43.7 | | | 50.3 | | | 14.0 | | | 19.6 | |
| Purchase obligation - capital commitments | | 80.0 | | | 27.2 | | | 16.3 | | | 36.5 | | | - | |
| Purchase obligation - other commitments3 | | 959.2 | | | 343.2 | | | 357.4 | | | 111.7 | | | 146.9 | |
| Pension and other employee future benefits obligations2 | | 95.1 | | | 8.3 | | | 10.5 | | | 8.3 | | | 68.0 | |
| Community agreement obligations4, 5 | | 67.7 | | | 8.4 | | | 8.6 | | | 7.7 | | | 43.0 | |
| Decommissioning and restoration obligations5 | | 411.3 | | | 8.4 | | | 9.1 | | | 7.4 | | | 386.4 | |
| Total | | 3,353.8 | | | 577.0 | | | 585.2 | | | 872.6 | | | 1,319.0 | |
| 1 Long-term debt obligations include scheduled interest payments, as well as principal repayments. |
| 2 Discounted. |
| 3 Primarily made up of long-term agreements with operational suppliers, obligations for power purchase, concentrate handling, fleet and port services, as well as deferred consideration arising from the acquisition of Rosemont's minority interest. |
| 4 Represents community agreement obligations and various finalized land user agreements, including Pampacancha. |
| 5 Undiscounted before inflation. |
In addition to the contractual obligations included in the above payment schedule, we also have the following commitments which impact our financial position:
- A profit-sharing plan with most Manitoba employees;
- A profit-sharing plan with all Peru employees;
- Wheaton precious metals stream agreements for 777 and the Constancia mines; and,
- Government royalty payments related to the Constancia mines.
Outstanding Share Data
As of February 22, 2023, the final trading day prior to the date of this MD&A, there were 262,025,681 common shares of Hudbay issued and outstanding. In addition, there were 1,512,070 stock options outstanding.
FINANCIAL RISK MANAGEMENT
The risks relating to Hudbay and our business include those risks described under the heading "Risk Factors" in our most recent Annual Information Form, which section has been incorporated by reference into this MD&A and should be reviewed by readers. In addition to those risks, we have identified the following other risks which may affect our financial statements in the future.
Political and Social Risks
On December 7, 2022, the former President of Peru, Pedro Castillo, was removed from office and replaced by Peru's former Vice President, Dina Boluarte. Following these political developments, Peru faced increasing tensions, protests, and social unrest. Protests have continued into early 2023 and the civil unrest has caused disruptions to commerce and supply chains. Constancia's operations have not been significantly impacted but our ability to steadily receive fuel and other key inputs and to deliver concentrates to port have been disrupted. Any prolonged disruption could cause us to temporarily shut down our operations, which could have an adverse effect on our financial results and cash flows. Hudbay continues to monitor the situation and mitigate the risks caused by the challenges with a focus on employee safety and site security. Given the uncertainty and future extent of these protests, our 2023 production and cost guidance are subject to higher than normal degree of uncertainty.
A change in government, government policy, the declaration of a state of emergency or the implementation of new, or the modification of existing, laws and regulations affecting our operations and other mineral properties could have a material adverse impact on us and our projects. We are at a heightened risk of having this occur whenever there is a change in government in the countries or regions in which we operate, as is currently the case in Peru.
Carrying Values and Mine Plan Updates
At the end of each reporting period, Hudbay reviews its groups of non-financial assets to determine whether there are any indicators of impairment or impairment reversal. If any such indicator exists, the Company estimates the recoverable amount of the non-financial asset group in order to determine the extent of the impairment loss or reversal, if any. At December 31, 2022, the Company assessed whether there were impairment or impairment reversal indicators associated with the general business environment and known changes to business planning. Other than an impairment indicator related to the PEA of the Copper World Complex, which contemplates the mining of Copper World deposits and the East deposit (formerly referred to as the Rosemont deposit) in a two-phase mine plan, there were no other impairment or impairment reversal indicators.
There are a number of potential indicators that could trigger non-financial asset impairment or reversal of impairment in the future. One such potential indicator is a change to the life of mine ("LOM") plan for an asset. LOM plans incorporate management's best estimates of key assumptions which include future commodity prices, the value of mineral resources not included in the LOM plan, production based on current estimates of recoverable reserves, discount rates, future operating and capital costs and future foreign exchange rates.
There is a risk that certain assumptions in the updated LOM plans for Constancia planned to be completed by the end of March 2023 could give rise to an indicator of impairment or impairment reversal and cause an adjustment to the carrying value of the relevant assets and/or impact our financial statements.
A pre-feasibility study for Phase I of the Copper World project is expected to be completed in 2023. There is a risk that certain assumptions in the pre-feasibility study could give rise to an indicator of impairment and/or impairment reversal and cause an adjustment to the carrying value of the relevant assets and/or impact our financial statements.
Metals Price Strategic Risk Management
From time to time, we maintain price protection programs and conduct commodity price risk management in line with Board-approved policies to reduce risk through the use of financial instruments.
Commodity prices are a key driver of our financial and operational results. Our strategic objective is to provide our investors with exposure to base metals prices, unless a reason exists to implement a hedging arrangement.
In the normal course, we typically consider metal price hedging to manage the risk associated with provisional pricing terms in concentrate sales agreements and in connection with stream delivery obligations. We may also occasionally consider metal price hedging in accordance with Board approved policies to achieve strategic objectives, including: locking in favourable metal prices to ensure a minimum cash flow during or after the construction of a mine or during a period of reduced liquidity, to maintain profitable production of shorter life/higher cost operations or as part of a financing arrangement.
During 2022, we entered into copper and zinc hedging transactions intended to manage the risk associated with provisional pricing terms in concentrate sales agreements.
As at December 31, 2022, we had 89.7 million pounds of net copper fixed for floating swaps outstanding at an average fixed receivable price of $3.61/lb associated with provisional pricing risk in concentrate sales agreements. These swaps settle across January to May 2023.
As at December 31, 2022, we had 17.5 million pounds of net zinc fixed for floating swaps outstanding at an average fixed receivable price of $1.32/lb associated with provisional pricing risk in concentrate sales agreements. These swaps settle across January to March 2023.
From time to time, we enter into gold and silver forward sales contracts to hedge the commodity price risk associated with the future settlement of provisionally priced deliveries. We are generally obligated to deliver gold and silver to Wheaton prior to the determination of final settlement prices. These forward sales contracts are entered into at the time we deliver gold and silver to Wheaton, and are intended to mitigate the risk of subsequent adverse gold and silver price changes. Gains and losses resulting from the settlement of these derivatives are recorded directly to revenue, as the forward sales contracts do not achieve hedge accounting, and the associated cash flows are classified in operating activities. Our swap agreements are with counterparties we believe to be creditworthy and do not require us to provide collateral.
During the fourth quarter of 2020, we entered into a gold forward sale and prepay transaction which generated $115.0 million in cash proceeds to pre-fund the expected capital requirements for the New Britannia gold mill refurbishment project. The transaction valued the future gold ounce delivery obligation for 79,954 gold ounces in 2022 and 2023 at forward curve prices averaging approximately $1,682 per ounce. The gold delivery obligation is expected to be satisfied with a monthly delivery of 3,331 gold ounces over a 24-month period from January 2022 to December 2023. The New Britannia gold mill achieved commercial production in the fourth quarter of 2021. The fair value of the financial liability at December 31, 2022 was $71,208.
Interest Rate and Foreign Exchange Risk Management
To the extent that we incur indebtedness at variable interest rates to fund our growth objectives, we may enter into interest rate hedging arrangements to manage our exposure to short-term interest rates. To the extent that we make commitments to capital expenditures denominated in foreign currencies, we may enter into foreign exchange forwards or acquire foreign currency outright, which may result in foreign exchange gains or losses in our consolidated income statements.
At December 31, 2022, approximately $189.4 million of our cash was held in US dollars, approximately $25.2 million of our cash was held in Canadian dollars, and approximately $11.1 million of our cash was held in Peruvian soles.
TREND ANALYSIS AND QUARTERLY REVIEW
A detailed quarterly and annual summary of financial and operating performance can be found in the "Summary of Results" section at the end of this MD&A. The following table sets forth selected consolidated financial information for each of our eight most recently completed quarters:
(in $ millions, except per share amounts,
production on a copper equivalent basis
and average realized copper price) | | 2021 |
2022 |
Q4 | Q3 | Q2 | Q1 | Q4 | Q33 | Q2 | Q1 |
Production on a copper equivalent basis (tonnes) | 45,454 | 42,099 | 46,332 | 45,085 | 50,685 | 42,243 | 39,289 | 43,246 |
| | | | | | | | | |
Average realized copper price ($/lb) | 3.61 | 3.47 | 4.28 | 4.53 | 4.34 | 4.26 | 4.40 | 3.69 |
Revenue | 321.2 | 346.2 | 415.5 | 378.6 | 425.2 | 359.0 | 404.2 | 313.6 |
Gross profit (loss) 4 | 69.7 | 32.4 | 89.5 | 85.3 | 81.7 | (85.4) | 82.2 | 52.5 |
Profit (loss) before tax | (14.3) | (0.3) | 21.5 | 88.9 | (0.2) | (147.8) | 14.8 | (69.6) |
Profit (loss) | (17.4) | (8.1) | 32.1 | 63.8 | (10.5) | (170.4) | (3.4) | (60.1) |
Adjusted net earnings (loss)1,3 | 2.6 | (12.4) | 30.5 | 5.2 | 32.7 | 0.9 | 5.4 | (16.1) |
Earnings (loss) per share: | | | | | | | | |
Basic and diluted | (0.07) | (0.03) | 0.12 | 0.24 | (0.04) | (0.65) | (0.01) | (0.23) |
Adjusted net earnings (loss)1,3 per share | 0.01 | (0.05) | 0.12 | 0.02 | 0.13 | 0.00 | 0.02 | (0.06) |
Operating cash flow2 | 109.1 | 81.6 | 123.9 | 77.1 | 156.9 | 103.5 | 132.8 | 90.7 |
Adjusted EBITDA1 | 124.7 | 99.3 | 141.4 | 110.2 | 180.8 | 119.2 | 143.2 | 104.2 |
1 Adjusted net earnings (loss), adjusted net earnings (loss) per share, and adjusted EBITDA are non-IFRS financial performance measure with no standardized definition under IFRS. For further information and a detailed reconciliation, please see the discussion under the "Non-IFRS Financial Performance Measures" section of this MD&A. |
2 Operating cash flow before changes in non-cash working capital and precious metals stream deposit. |
3 The adjusted net earnings (loss) and adjusted net earnings (loss) per share in respect of the fourth quarter of 2021 were adjusted in our management's discussion and analysis of financial results for the year ended December 31, 2021 due to a change in the computed tax effect on certain adjustments. The adjusted net earnings changed from $38.2 million to an adjusted net earnings of $0.9 million and the adjusted net earnings per share changed from $0.15/share to an adjusted net earnings per share of $0.00/share. |
4 Gross profit (loss) includes $147.3 million and $46.2 million, respectively, of impairment losses related to environmental reclamation provision for the now closed Flin Flon operation for the three months ended September 30, 2021 and December 31, 2021. |
The easing of domestic COVID measures by China during the fourth quarter of 2022 resulted in a rebound of most industrial commodity prices. However, late in the quarter, Peru experienced heightened tensions and social unrest following a change in the country's political leadership. Inflationary pressures on fuel, consumables and energy costs have persisted globally negatively impacting our production costs and margins.
Fourth quarter revenues were negatively impacted by lower production due to planned maintenance programs at Lalor and Constancia, the planned closure of 777 earlier in the year, short-term changes in the mine plan in Peru and a build up of product inventory in Peru due to the aforementioned social unrest. The revenue impact of lower throughput was partially offset by higher commodity prices. Additionally, the fourth quarter results were impacted by a non-cash loss of $13.5 million related to the quarterly revaluation of our Flin Flon environmental reclamation provision due to changes in real, long-term discount rates.
Commodity prices declined during the third quarter of 2022 while growing inflationary pressures have contributed to higher mine operating costs resulting in declines in our key financial metrics during the quarter. Third quarter results were also impacted by lower production due to the closure of 777 in the second quarter of 2022 and the commencement of care and maintenance activities, which will continue for the next several years. Relatively small movements in real, long-term discount rates will continue to impact the revaluation of our environmental reclamation provisions for closed sites in Manitoba and these movements will be reflected through the income statement.
The second quarter results for 2022 were impacted by a revaluation gain of $60.7 million pertaining mostly to the environmental reclamation provision on our Flin Flon site due to increases in long-term risk-free interest rates. A pre-tax impairment loss of $95.0 million was recorded following the release of the Copper World Preliminary Economic Assessment in June 2022 as certain assets associated with the previous, stand-alone development plan for the Rosemont deposit are no longer expected to be recoverable.
Results in the first quarter of 2022 benefited from a trend of higher realized base metal prices, but were also impacted by rising operating costs caused by inflation. While we achieved increased gold production from the higher grade Pampacancha deposit and the higher recovery New Britannia gold mill, we experienced increased levels of COVID-19 related absenteeism in the workforce, impacting production, and also experienced limited availability of rail cars leading to reduced sales and an inventory build-up. The first quarter results were also impacted by a revaluation gain of $78.2 million pertaining mostly to the environmental reclamation provision on our Flin Flon site and $1.7 million for our non-producing sites in Manitoba caused by an increase in long-term risk-free interest rates.
Results for the fourth quarter of 2021 benefited from higher realized metal prices. This strength in commodity prices combined with higher gold production following the commencement of commercial production at New Britannia and improving copper recoveries led to record revenue of $425.2 million during the quarter. Adjusted EBITDA and operating cash flow both reached record highs. Notwithstanding these records, continued inflationary pressures along with lower copper grades caused operating costs to climb and put pressure on gross margins, compared to earlier quarters. A revaluation of our environmental reclamation provision for the Flin Flon closure plan resulted in a $46.2 million non-cash charge, which negatively impacted net income for the quarter.
During the third quarter of 2021, increasing base metal prices contributed to strong revenues and operating cash flow. Mining at Pampacancha continued to ramp-up, contributing significantly to gold production during the quarter. As a result of the planned closure of Flin Flon operations in mid-2022 and an updated Flin Flon closure plan, non-cash charges totaling $156.3 million were incurred, which negatively impacted gross profit for the quarter. In Peru, ongoing COVID-19 costs, along with lower copper grades, put pressure on operating costs.
Financial results in the second quarter of 2021 benefited from initial production at the Pampacancha pit but were negatively impacted by higher operating costs in Peru and lower Manitoba metal production caused by COVID-19 related impacts as well as lower copper and zinc grades and lower precious metal recoveries.
The first quarter of 2021 saw lower revenues compared to the fourth quarter of 2020 due to a delayed Peru shipment for which revenue could not be recognized, and lower sales volumes from Manitoba related to a buildup of finished goods inventory during the quarter as a result of a lack of rail car availability. First quarter results were negatively impacted by $75.2 million of various finance expenses related to the refinancing of our senior notes.
The following table sets forth selected consolidated financial information for each of the three most recently completed years:
(in $ millions, except for earnings (loss) per share, dividends
declared per share, production on a copper equivalent basis
and average realized copper price) | | 2022 | | | 2021 | | | 2020 | |
| Production on a copper equivalent basis (tonnes) | | 178,970 | | | 175,463 | | | 184,084 | |
| Average realized copper price ($/lb) | | 3.94 | | | 4.19 | | | 2.86 | |
| Revenue | | 1,461.4 | | | 1,502.0 | | | 1,092.4 | |
| Gross profit 5 | | 276.9 | | | 131.0 | | | 39.0 | |
| (Loss) profit before tax | | 95.8 | | | (202.8 | ) | | (179.1 | ) |
| (Loss) profit | | 70.4 | | | (244.4 | ) | | (144.6 | ) |
| Adjusted net earnings (loss) 1 | | 26.4 | | | 23.1 | | | (121.0 | ) |
| (Loss) earnings per share: | | | | | | | | | |
| Basic and diluted | | 0.27 | | | (0.93 | ) | | (0.55 | ) |
| Adjusted net earnings (loss)1 per share | | 0.10 | | | 0.09 | | | (0.46 | ) |
| Total assets | | 4,325.9 | | | 4,616.2 | | | 4,666.6 | |
| Operating cash flow2 | | 391.7 | | | 483.9 | | | 241.9 | |
| Adjusted EBITDA1 | | 475.9 | | | 547.8 | | | 306.7 | |
| Total non-current financial liabilities3 | | 1,281.5 | | | 1,345.7 | | | 1,360.1 | |
| Dividends declared per share - C$4 | | 0.02 | | | 0.02 | | | 0.02 | |
| 1 Adjusted net earnings (loss), adjusted net earnings (loss) per share, and adjusted EBITDA are non-IFRS financial performance measure with no standardized definition under IFRS. For further information and a detailed reconciliation, please see the discussion under the "Non-IFRS Financial Reporting Measures" section of this MD&A. |
| 2 Operating cash flow before change in non-cash working capital and precious metals stream deposit. |
| 3 Total non-current financial liabilities consists of non-current other financial liabilities, lease liabilities and long-term debt. |
| 4 Dividend paid during March and September of each year. |
| 5 Gross profit includes $193.5 million of impairment losses related to environmental reclamation provision for the now closed Flin Flon operation for the year ended December 31, 2021. |
Copper equivalent 2022 production was substantially inline with the past two years while sales volumes of copper and gold increased 2% and 27%, respectively, from 2021. Zinc sales volumes fell 39% in 2022 following the planned closure of 777 and the zinc plant in the second quarter of 2022 in Manitoba. Additionally, the ramp up of the New Britannia mill in Manitoba and mining operations at Pampacancha in Peru have contributed to higher gold production in 2022. As a result, gold has overtaken zinc as the second largest source of Hudbay's revenue. Realized copper and gold prices have fallen in 2022 resulting in a decline in full year revenues compared to 2021. A profit of $70.4 million was recognized in 2022 and included a $133.5 million pre-tax revaluation gain of our Flin Flon environmental reclamation provision. Our 2022 results were negatively impacted by a $95.0 million pre-tax impairment loss related to certain specific capitalized costs and assets associated with the previous stand-alone development plan for the Rosemont deposit, which were determined to no longer be recoverable.
Gold production in 2021 climbed 55% compared to 2020 following the start of operations at our high-grade Pampacancha deposit and our New Britannia gold mill in the third and fourth quarter of 2021, respectively. The increased production of gold allowed us to capitalize on continued strength in gold prices. In addition, consistent throughput from Peru with improved copper recoveries and a nearly 50% increase in realized copper prices compared to 2020 was a significant factor in revenues climbing 37% to a record-high $1,502.0 million for the full year. From a cost perspective, global inflationary pressures increased substantially, contributing to a 20% and a 17% increase in 2021 combined unit costs in Peru and Manitoba, respectively, compared to 2020. Despite these cost pressures, the increases in copper and gold production and realized base metal prices resulted in the 2021 operating cash flow increasing by 100% from 2020. Net losses in 2021 were $70.4 million and reflect a pre-tax, non-cash impairment charge of $193.5 million related to an updated Flin Flon closure plan, among other items.
Although 2020 realized prices for copper and gold rose by 5% and 24%, respectively, compared to 2019, 2020 revenues declined by 12% due to lower sales volumes of copper. Sales volumes of copper declined by 31% in 2020 as compared to 2019 as a result of the temporary suspension of Constancia operations. Gross profit declined by 74% in 2020 as compared to 2019 as we expensed certain fixed overhead production costs of $31.9 million during the temporary suspension of operations at Constancia and $11.7 million during the production interruption at 777. Adjusted net loss in 2020 increased to $121.0 million compared to 2019, as a result of the same factors described above.
NON-IFRS FINANCIAL PERFORMANCE MEASURES
Adjusted net earnings (loss), adjusted net earnings (loss) per share, adjusted EBITDA, net debt, cash cost, sustaining and all-in sustaining cash cost per pound of copper produced, cash cost and sustaining cash cost per ounce of gold produced and combined unit cost are non-IFRS performance measures. These measures do not have a meaning prescribed by IFRS and are therefore unlikely to be comparable to similar measures presented by other issuers. These measures should not be considered in isolation or as a substitute for measures prepared in accordance with IFRS and are not necessarily indicative of operating profit or cash flow from operations as determined under IFRS. Other companies may calculate these measures differently.
Management believes adjusted net earnings (loss) and adjusted net earnings (loss) per share provides an alternate measure of the Company's performance for the current period and gives insight into its expected performance in future periods. These measures are used internally by the Company to evaluate the performance of its underlying operations and to assist with its planning and forecasting of future operating results. As such, the Company believes these measures are useful to investors in assessing the Company's underlying performance. We provide adjusted EBITDA to help users analyze our results and to provide additional information about our ongoing cash generating potential in order to assess our capacity to service and repay debt, carry out investments and cover working capital needs. Net debt is shown because it is a performance measure used by the Company to assess our financial position. Cash cost, sustaining and all-in sustaining cash cost per pound of copper produced are shown because we believe they help investors and management assess the performance of our operations, including the margin generated by the operations and the Company. Cash cost and sustaining cash cost per ounce of gold produced are shown because we believe they help investors and management assess the performance of our Manitoba operations. Combined unit cost is shown because we believe it helps investors and management assess our cost structure and margins that are not impacted by variability in by-product commodity prices.
During 2021 and 2022, there were non-recurring adjustments for Arizona and Manitoba operations, including severance, past service pension costs, disposals of certain non-current assets, and inventory supplies write-downs as well as non-cash impairment charges related to an updated Flin Flon closure plan and lower long-term discount rates in the fourth quarter of 2021, none of which management believes are indicative of ongoing operating performance and therefore are adjusting items in the calculations of adjusted net earnings (loss) and adjusted EBITDA.
Cash cost and sustaining cash cost per pound of zinc produced was a previously disclosed non-IFRS measure, most recently published in our MD&A for the year ended December 31, 2021, dated February 23, 2022. With the closure of 777 and Flin Flon operations, including the zinc plant, in the second quarter of 2022, the production profile of Manitoba has shifted from zinc to gold and therefore we have ceased providing this measure on a go forward basis.
During 2022, we recorded a non-cash gain of $133.5 million, mostly related to the quarterly revaluation of our Flin Flon environmental reclamation provision, which was impacted by rising long-term risk-free discount rates. With the closure of 777 and Flin Flon operations in the second quarter of 2022 and given the long-term nature of the reclamation cash flows, quarterly revaluation of the corresponding environmental reclamation provision remains highly sensitive to changes in real, long-term risk-free discount rates and, as such, we expect to continue to experience quarterly environmental reclamation provision revaluations, which is not indicative of our ongoing operating performance. This item has been included prospectively in our calculation of adjusted earnings.
Adjusted Net Earnings (Loss)
Adjusted net earnings (loss) represents net earnings (loss) excluding certain impacts, net of taxes, such as mark-to-market adjustments, impairment charges and reversal of impairment charges, write-down of assets, and foreign exchange (gain) loss. These measures are not necessarily indicative of net earnings (loss) or cash flows as determined under IFRS.
The following table provides a reconciliation of earnings (loss) per the consolidated income statements, to adjusted net earnings (loss) for the year ended months ended December 31, 2022 and 2021.
| | | Three months ended | | | Year ended | |
| (in $ millions) | | Dec. 31,
2022 | | | Dec. 31,
2021 | | | Dec. 31,
2022 | | | Dec. 31,
2021 | |
| (Loss) profit for the period | | (17.4 | ) | | (10.5 | ) | | 70.4 | | | (244.4 | ) |
| Tax expense | | 3.1 | | | 10.3 | | | 25.4 | | | 41.6 | |
| (Loss) profit before tax | | (14.3 | ) | | (0.2 | ) | | 95.8 | | | (202.8 | ) |
| Adjusting items: | | | | | | | | | | | | |
| Mark-to-market adjustments 1 | | 10.7 | | | 13.3 | | | 3.0 | | | 66.7 | |
| Foreign exchange loss (gain) | | 0.2 | | | 1.1 | | | (5.4 | ) | | 1.5 | |
| Inventory adjustments | | - | | | - | | | 3.6 | | | 4.0 | |
| Variable consideration adjustment - stream revenue and accretion | | - | | | - | | | (1.9 | ) | | (1.0 | ) |
| Impairment losses | | - | | | 46.2 | | | 95.0 | | | 193.5 | |
| Re-evaluation adjustment - environmental provision 2 | | 13.5 | | | - | | | (133.5 | ) | | - | |
| Evaluation expenses | | 0.1 | | | - | | | 7.9 | | | - | |
| Insurance recovery | | - | | | - | | | (5.7 | ) | | - | |
| Write-down of unamortized transaction costs | | - | | | - | | | - | | | 2.5 | |
| Premium paid on redemption of notes | | - | | | - | | | - | | | 22.9 | |
| Restructuring charges - Manitoba 3 | | 1.0 | | | 3.4 | | | 10.6 | | | 7.0 | |
| Loss on disposal of investments | | 0.5 | | | - | | | 3.6 | | | - | |
| Post-employment plan (curtailment) / past service cost adjustment | | (2.4 | ) | | 0.7 | | | (2.4 | ) | | 5.0 | |
| Loss (gain) on disposal of plant and equipment and non-current assets - Manitoba & Arizona | | 0.4 | | | 2.4 | | | (6.3 | ) | | 7.8 | |
| Changes in other provisions (non-capital) 4 | | 5.8 | | | - | | | 5.8 | | | - | |
| Adjusted earnings before income taxes | | 15.5 | | | 66.9 | | | 70.1 | | | 107.1 | |
| Tax expense | | (3.1 | ) | | (10.3 | ) | | (25.4 | ) | | (41.6 | ) |
| Tax impact of adjusting items | | (9.8 | ) | | (23.9 | ) | | (18.3 | ) | | (42.4 | ) |
| Adjusted net earnings | | 2.6 | | | 32.7 | | | 26.4 | | | 23.1 | |
| Adjusted net earnings ($/share) | | 0.01 | | | 0.13 | | | 0.10 | | | 0.09 | |
| Basic weighted average number of common shares outstanding (millions) | | 262.0 | | | 261.6 | | | 261.9 | | | 261.5 | |
| 1 Includes changes in fair value of the gold prepayment liability, Canadian junior mining investments, other financial assets and liabilities at fair value through profit or loss and share-based compensation (recoveries) expenses. |
| 2 Changes from movements to environmental reclamation provisions are primarily related to the Flin Flon operations, which were fully depreciated as of June 30, 2022, as well as other Manitoba non-operating sites. |
| 3 Includes closure costs for Flin Flon operations. |
| 4 Includes changes in other provisions including corporate restructuring and costs which do not pertaining to operation of the business. |
After adjusting reported net earnings for those items not considered representative of the Company's core business or indicative of future operations, the Company had an adjusted net loss in the fourth quarter of 2022 of $2.6 million or $0.01 earnings per share.
Adjusted EBITDA
Adjusted EBITDA is profit or loss before net finance expense/income, tax expense/recoveries, depreciation and amortization of property, plant and equipment and deferred revenue, as well as certain other adjustments. We calculate adjusted EBITDA by excluding certain adjustments included within our adjusted net earnings measure which we believe reflects the underlying performance of our core operating activities. The measure also removes the impact of non-cash items and financing costs that are not associated with measuring the underlying performance of our operations. However, our adjusted EBITDA is not the measure defined as EBITDA under our senior notes or revolving credit facilities and may not be comparable with performance measures with the same name reported by other companies. Adjusted EBITDA should not be considered as a substitute for profit or loss or as a better measure of liquidity than operating cash flow, which are calculated in accordance with IFRS. We provide adjusted EBITDA to help users analyze our results and to provide additional information about our ongoing cash generating potential in order to assess our capacity to service and repay debt, carry out investments and cover working capital needs.
The following table presents the reconciliation of earnings (loss) per the consolidated income statements, to adjusted EBITDA for the year ended months ended December 31, 2022 and 2021:
| | | Three months ended | | | Year ended | |
| (in $ millions) | | Dec. 31,
2022 | | | Dec. 31,
2021 | | | Dec. 31,
2022 | | | Dec. 31,
2021 | |
| (Loss) profit for the period | | (17.4 | ) | | (10.5 | ) | | 70.4 | | | (244.4 | ) |
| | | | | | | | | | | | | |
| Add back: | | | | | | | | | | | | |
| Tax expense | | 3.1 | | | 10.3 | | | 25.4 | | | 41.6 | |
| Net finance expense | | 36.7 | | | 38.6 | | | 118.5 | | | 221.0 | |
| Other expense | | 18.5 | | | 16.3 | | | 32.6 | | | 35.1 | |
| Depreciation and amortization | | 79.4 | | | 89.9 | | | 337.6 | | | 357.9 | |
| Amortization of deferred revenue and variable consideration adjustment | | (10.4 | ) | | (17.3 | ) | | (73.2 | ) | | (73.1 | ) |
| | | 109.9 | | | 127.3 | | | 511.3 | | | 338.1 | |
| Adjusting items (pre-tax): | | | | | | | | | | | | |
| Impairment losses | | - | | | 46.2 | | | 95.0 | | | 193.5 | |
| Re-evaluation adjustment - environmental provision 1 | | 13.5 | | | 0.3 | | | (133.5 | ) | | (4.6 | ) |
| Inventory adjustments | | - | | | - | | | 3.6 | | | 4.0 | |
| Post-employment plan (curtailment) / past service cost adjustment | | (2.4 | ) | | 0.7 | | | (2.4 | ) | | 5.0 | |
| Share-based compensation expense 2 | | 3.7 | | | 6.3 | | | 1.9 | | | 11.8 | |
| Adjusted EBITDA | | 124.7 | | | 180.8 | | | 475.9 | | | 547.8 | |
| | |
| 1 Environmental reclamation provision adjustments were presented within other expense for 2021 periods. | |
| 2 Share-based compensation expenses reflected in cost of sales and selling and administrative expenses. | |
Net Debt
The following table presents our calculation of net debt as at December 31, 2022 and December 31, 2021:
| (in $ thousands) | | Dec. 31,
2022 | | | Dec. 31,
2021 | |
| Total long-term debt | | 1,184,162 | | | 1,180,274 | |
| Cash | | (225,665 | ) | | (270,989 | ) |
| Net debt | | 958,497 | | | 909,285 | |
Cash Cost, Sustaining and All-in Sustaining Cash Cost (Copper Basis)
Cash cost per pound of copper produced ("cash cost") is a non-IFRS measure that management uses as a key performance indicator to assess the performance of our operations. Our calculation designates copper as our primary metal of production as it has been the largest component of revenues. The calculation is presented in four manners:
- Cash cost, before by-product credits - This measure is gross of by-product revenues and is a function of the efforts and costs incurred to mine and process all ore mined. However, the measure divides this aggregate cost over only pounds of copper produced, our primary metal of production. This measure is generally less volatile from period to period, as it is not affected by changes in the price received for by-product metals. It is, however, significantly affected by the relative mix of copper concentrate and finished zinc production, where the sale of the zinc will occur later, and an increase in production of zinc metal will tend to result in an increase in cash cost under this measure.
- Cash cost, net of by-product credits - In order to calculate the net cost to produce and sell copper, the net of by-product credits measure subtracts the revenues realized from the sale of the metals other than copper. The by-product revenues from zinc, gold, and silver are significant and are integral to the economics of our operations. The economics that support our decision to produce and sell copper would be different if we did not receive revenues from the other significant metals being extracted and processed. This measure provides management and investors with an indication of the minimum copper price consistent with positive operating margins, assuming realized by-product metal prices are consistent with those prevailing during the reporting period. It also serves as an important operating statistic that management and investors utilize to measure our operating performance versus that of our competitors. However, it is important to understand that if by-product metal prices decline alongside copper prices, the cash cost net of by-product credits would increase, requiring a higher copper price than that reported to maintain positive cash flows and operating margins.
- Sustaining cash cost, net of by-product credits - This measure is an extension of cash cost that includes cash sustaining capital expenditures, including payments on capitalized leases, capitalized sustaining exploration, net smelter returns royalties, payments on certain long-term community agreements, as well as accretion and amortization for expected decommissioning activities for producing assets. It does not include corporate selling and administrative expenses. It provides a more fulsome measurement of the cost of sustaining production than cash cost, which is focused on operating costs only.
- All-in sustaining cash cost, net of by-product credits - This measure is an extension of sustaining cash cost that includes corporate G&A, regional costs, accretion and amortization for community agreements relating to current operations, and accretion for expected decommissioning activities for non-producing sites. Due to the inclusion of corporate selling and administrative expenses, all-in sustaining cash cost is presented on a consolidated basis only.
The tables below present a detailed build-up of cash cost and sustaining cash cost, net of by-product credits, by business unit in addition to consolidated all-in sustaining cash cost, net of by-product credits, and reconciliations between cash cost, net of by-product credits, to the most comparable IFRS measures of cost of sales for the year ended months ended December 31, 2022 and 2021. Cash cost, net of by-product credits may not calculate exactly based on amounts presented in the tables below due to rounding.
| Consolidated | | Three months ended | | | Year ended | |
| Net pounds of copper produced1 | | | | | | |
| (in thousands) | | Dec. 31, 2022 | | | Dec. 31, 2021 | | | Dec. 31, 2022 | | | Dec. 31, 2021 | |
| Peru | | 59,628 | | | 50,389 | | | 197,082 | | | 171,548 | |
| Manitoba | | 4,978 | | | 11,777 | | | 32,580 | | | 47,745 | |
| Net pounds of copper produced | | 64,606 | | | 62,166 | | | 229,662 | | | 219,293 | |
| 1 Contained copper in concentrate. | |
| Consolidated | | Three months ended | | | Year ended | |
| | | Dec. 31, 2022 | | | Dec. 31, 2021 | | | Dec. 31, 2022 | | | Dec. 31, 2021 | |
| Cash cost per pound of copper produced | | $000s | | | $/lb | | | $000s | | | $/lb | | | $000s | | | $/lb | | | $000s | | | $/lb | |
| Cash cost, before by-product credits | | 208,642 | | | 3.23 | | | 232,224 | | | 3.73 | | | 906,265 | | | 3.94 | | | 867,607 | | | 3.95 | |
| By-product credits | | (138,990 | ) | | (2.15 | ) | | (200,306 | ) | | (3.22 | ) | | (708,334 | ) | | (3.08 | ) | | (704,345 | ) | | (3.21 | ) |
| Cash cost, net of by-product credits | | 69,652 | | | 1.08 | | | 31,918 | | | 0.51 | | | 197,931 | | | 0.86 | | | 163,262 | | | 0.74 | |
| Consolidated | | Three months ended | | | Year ended | |
| | | Dec. 31, 2022 | | | Dec. 31, 2021 | | | Dec. 31, 2022 | | | Dec. 31, 2021 | |
| Supplementary cash cost information | | $000s | | | $/lb 1 | | | $000s | | | $/lb 1 | | | $000s | | | $/lb 1 | | | $000s | | | $/lb 1 | |
| By-product credits2: | | | | | | | | | | | | | | | | | | | | | | | | |
| Zinc | | 24,744 | | | 0.38 | | | 74,585 | | | 1.20 | | | 224,043 | | | 0.98 | | | 302,301 | | | 1.38 | |
| Gold 3 | | 76,336 | | | 1.18 | | | 99,728 | | | 1.60 | | | 353,478 | | | 1.53 | | | 289,981 | | | 1.32 | |
| Silver 3 | | 9,592 | | | 0.15 | | | 14,853 | | | 0.24 | | | 62,252 | | | 0.27 | | | 61,388 | | | 0.28 | |
| Molybdenum & other | | 28,318 | | | 0.44 | | | 11,140 | | | 0.18 | | | 68,561 | | | 0.30 | | | 50,675 | | | 0.23 | |
| Total by-product credits | | 138,990 | | | 2.15 | | | 200,306 | | | 3.22 | | | 708,334 | | | 3.08 | | | 704,345 | | | 3.21 | |
| Reconciliation to IFRS: | | | | | | | | | | | | | | | | | | | | | | | | |
| Cash cost, net of by-product credits | | 69,652 | | | | | | 31,918 | | | | | | 197,931 | | | | | | 163,262 | | | | |
| By-product credits | | 138,990 | | | | | | 200,306 | | | | | | 708,334 | | | | | | 704,345 | | | | |
| Treatment and refining charges | | (19,968 | ) | | | | | (13,721 | ) | | | | | (68,936 | ) | | | | | (55,430 | ) | | | |
| Inventory adjustments | | 7 | | | | | | - | | | | | | 3,553 | | | | | | 3,999 | | | | |
| Share-based compensation expense | | 490 | | | | | | 744 | | | | | | 420 | | | | | | 1,347 | | | | |
| Past service pension/Curtailment | | (2,384 | ) | | | | | 737 | | | | | | (2,384 | ) | | | | | 4,965 | | | | |
| Change in product inventory | | (16,425 | ) | | | | | (16,247 | ) | | | | | (3,125 | ) | | | | | (18,180 | ) | | | |
| Royalties | | 1,750 | | | | | | 3,594 | | | | | | 11,144 | | | | | | 15,274 | | | | |
| Depreciation and amortization4 | | 79,408 | | | | | | 89,927 | | | | | | 337,615 | | | | | | 357,924 | | | | |
| Cost of sales5 | | 251,520 | | | | | | 297,258 | | | | | | 1,184,552 | | | | | | 1,177,506 | | | | |
| 1 Per pound of copper produced. |
| 2 By-product credits are computed as revenue per financial statements, including amortization of deferred revenue and pricing and volume adjustments. For more information, please see the realized price reconciliation table on page 37 of this MD&A for these figures. |
| 3 Gold and silver by-product credits do not include variable consideration adjustments with respect to stream arrangements. Variable consideration adjustments are cumulative adjustments to gold and silver stream deferred revenue primarily associated with the net change in mineral reserves and resources or amendments to the mine plan that would change the total expected deliverable ounces under the precious metal streaming arrangement. For the three and twelve months ended December 31, 2022 the variable consideration adjustments amounted income of nil and $959, respectively (three and twelve months ended December 31, 2021 - income of nil and $1,617). |
| 4 Depreciation is based on concentrate sold. |
| 5 As per IFRS financial statements, excluding impairment adjustments. |
| Peru | | Three months ended | | | Year ended | |
| (in thousands) | | Dec. 31, 2022 | | | Dec. 31, 2021 | | | Dec. 31, 2022 | | | Dec. 31, 2021 | |
| Net pounds of copper produced1 | | 59,628 | | | 50,389 | | | 197,082 | | | 171,548 | |
| 1 Contained copper in concentrate. | |
| Peru | | Three months ended | | | Year ended | |
| | | Dec. 31, 2022 | | | Dec. 31, 2021 | | | Dec. 31, 2022 | | | Dec. 31, 2021 | |
| Cash cost per pound of copper produced | | $000s | | | $/lb | | | $000s | | | $/lb | | | $000s | | | $/lb | | | $000s | | | $/lb | |
| Mining | | 41,647 | | | 0.70 | | | 27,756 | | | 0.55 | | | 137,546 | | | 0.70 | | | 98,200 | | | 0.57 | |
| Milling | | 50,723 | | | 0.85 | | | 40,121 | | | 0.80 | | | 195,152 | | | 0.99 | | | 168,477 | | | 0.99 | |
| G&A | | 14,817 | | | 0.25 | | | 18,351 | | | 0.36 | | | 63,015 | | | 0.32 | | | 63,629 | | | 0.37 | |
| Onsite costs | | 107,187 | | | 1.80 | | | 86,228 | | | 1.71 | | | 395,713 | | | 2.01 | | | 330,306 | | | 1.93 | |
| Treatment & refining | | 11,962 | | | 0.20 | | | 8,636 | | | 0.17 | | | 39,587 | | | 0.20 | | | 32,365 | | | 0.19 | |
| Freight & other | | 15,607 | | | 0.26 | | | 11,609 | | | 0.23 | | | 50,284 | | | 0.25 | | | 41,316 | | | 0.24 | |
| Cash cost, before by-product credits | | 134,756 | | | 2.26 | | | 106,473 | | | 2.11 | | | 485,584 | | | 2.46 | | | 403,987 | | | 2.36 | |
| By-product credits | | (54,563 | ) | | (0.92 | ) | | (41,900 | ) | | (0.83 | ) | | (173,488 | ) | | (0.88 | ) | | (139,885 | ) | | (0.82 | ) |
| Cash cost, net of by-product credits | | 80,193 | | | 1.34 | | | 64,573 | | | 1.28 | | | 312,096 | | | 1.58 | | | 264,102 | | | 1.54 | |
| Peru | | Three months ended | | | Year ended | |
| | | Dec. 31, 2022 | | | Dec. 31, 2021 | | | Dec. 31, 2022 | | | Dec. 31, 2021 | |
| Supplementary cash cost information | | $000s | | | $/lb 1 | | | $000s | | | $/lb 1 | | | $000s | | | $/lb 1 | | | $000s | | | $/lb 1 | |
| By-product credits2: | | | | | | | | | | | | | | | | | | | | | | | | |
| Gold3 | | 19,934 | | | 0.33 | | | 24,325 | | | 0.49 | | | 68,630 | | | 0.35 | | | 61,510 | | | 0.37 | |
| Silver3 | | 7,025 | | | 0.12 | | | 7,793 | | | 0.15 | | | 41,671 | | | 0.21 | | | 35,154 | | | 0.20 | |
| Molybdenum | | 27,604 | | | 0.47 | | | 9,782 | | | 0.19 | | | 63,187 | | | 0.32 | | | 43,221 | | | 0.25 | |
| Total by-product credits | | 54,563 | | | 0.92 | | | 41,900 | | | 0.83 | | | 173,488 | | | 0.88 | | | 139,885 | | | 0.82 | |
| Reconciliation to IFRS: | | | | | | | | | | | | | | | | | | | | | | | | |
| Cash cost, net of by-product credits | | 80,193 | | | | | | 64,573 | | | | | | 312,096 | | | | | | 264,102 | | | | |
| By-product credits | | 54,563 | | | | | | 41,900 | | | | | | 173,488 | | | | | | 139,885 | | | | |
| Treatment and refining charges | | (11,962 | ) | | | | | (8,636 | ) | | | | | (39,587 | ) | | | | | (32,365 | ) | | | |
| Inventory adjustments | | - | | | | | | - | | | | | | (558 | ) | | | | | (1,446 | ) | | | |
| Share-based compensation expenses | | 95 | | | | | | 145 | | | | | | 77 | | | | | | 247 | | | | |
| Change in product inventory | | (15,685 | ) | | | | | (4,507 | ) | | | | | (31,348 | ) | | | | | (13,743 | ) | | | |
| Royalties | | 1,656 | | | | | | 762 | | | | | | 5,367 | | | | | | 3,503 | | | | |
| Depreciation and amortization4 | | 58,256 | | | | | | 54,078 | | | | | | 211,043 | | | | | | 194,408 | | | | |
| Cost of sales5 | | 167,116 | | | | | | 148,315 | | | | | | 630,578 | | | | | | 554,591 | | | | |
| 1 Per pound of copper produced. |
| 2 By-product credits are computed as revenue per financial statements, including amortization of deferred revenue and pricing and volume adjustments. For more information, please see the realized price reconciliation table on page 37 of this MD&A. |
| 3 Gold and silver by-product credits do not include variable consideration adjustments with respect to stream arrangements. |
| 4 Depreciation is based on concentrate sold. |
| 5 As per IFRS financial statements, excluding impairment adjustments. |
| Consolidated | | Three months ended | | | Year ended | |
| | | Dec. 31, 2022 | | | Dec. 31, 2021 | | | Dec. 31, 2022 | | | Dec. 31, 2021 | |
| All-in sustaining cash cost per pound of copper produced | | $000s | | | $/lb | | | $000s | | | $/lb | | | $000s | | | $/lb | | | $000s | | | $/lb | |
| Cash cost, net of by-product credits | | 69,652 | | | 1.08 | | | 31,918 | | | 0.51 | | | 197,931 | | | 0.86 | | | 163,262 | | | 0.74 | |
| Cash sustaining capital expenditures | | 60,002 | | | 0.92 | | | 77,539 | | | 1.25 | | | 255,725 | | | 1.11 | | | 268,190 | | | 1.22 | |
| Capitalized exploration | | 11,500 | | | 0.18 | | | 8,000 | | | 0.13 | | | 11,500 | | | 0.05 | | | 8,000 | | | 0.04 | |
| Royalties | | 1,750 | | | 0.03 | | | 3,594 | | | 0.06 | | | 11,144 | | | 0.05 | | | 15,274 | | | 0.07 | |
| Sustaining cash cost, net of by-product credits | | 142,904 | | | 2.21 | | | 121,051 | | | 1.95 | | | 476,300 | | | 2.07 | | | 454,726 | | | 2.07 | |
| Corporate selling and administrative expenses & regional costs | | 11,876 | | | 0.19 | | | 14,729 | | | 0.24 | | | 38,799 | | | 0.17 | | | 46,663 | | | 0.21 | |
| Accretion and amortization of decommissioning and community agreements1 | | 722 | | | 0.01 | | | 894 | | | 0.01 | | | 4,416 | | | 0.02 | | | 2,830 | | | 0.01 | |
| All-in sustaining cash cost, net of by-product credits | | 155,502 | | | 2.41 | | | 136,674 | | | 2.20 | | | 519,515 | | | 2.26 | | | 504,219 | | | 2.30 | |
| Reconciliation to property, plant and equipment additions: | | | | | | | | | | | | | | | | | | | | | | | | |
| Property, plant and equipment additions | | 76,933 | | | | | | 91,432 | | | | | | 259,281 | | | | | | 346,335 | | | | |
| Capitalized stripping net additions | | 15,169 | | | | | | 19,201 | | | | | | 89,262 | | | | | | 79,426 | | | | |
| Total accrued capital additions | | 92,102 | | | | | | 110,633 | | | | | | 348,543 | | | | | | 425,761 | | | | |
| Less other non-sustaining capital costs2 | | 41,585 | | | | | | 43,176 | | | | | | 122,054 | | | | | | 196,435 | | | | |
| Total sustaining capital costs | | 50,517 | | | | | | 67,457 | | | | | | 226,489 | | | | | | 229,326 | | | | |
| Right of use leased assets | | (265 | ) | | | | | (6,714 | ) | | | | | (25,695 | ) | | | | | (26,685 | ) | | | |
| Capitalized lease cash payments - operating sites | | 5,848 | | | | | | 9,099 | | | | | | 33,271 | | | | | | 35,071 | | | | |
| Community agreement cash payments | | 2,854 | | | | | | 1,266 | | | | | | 9,486 | | | | | | 1,691 | | | | |
| Accretion and amortization of decommissioning and restoration obligations 3 | | 1,048 | | | | | | 6,431 | | | | | | 12,174 | | | | | | 28,987 | | | | |
| Cash sustaining capital expenditures | | 60,002 | | | | | | 77,539 | | | | | | 255,725 | | | | | | 268,390 | | | | |
| 1 Includes accretion of decommissioning relating to non-productive sites, and accretion and amortization of amortization of production related community agreements capitalized to Other assets. |
| 2 Other non-sustaining capital costs include Arizona capitalized costs, capitalized interest, capitalized exploration, and growth capital expenditures. |
| 3 Includes amortization of decommissioning and restoration PP&E assets and accretion of decommissioning and restoration liabilities related to producing sites. |
| Peru | | Three months ended | | | Year ended | |
| | | Dec. 31, 2022 | | | Dec. 31, 2021 | | | Dec. 31, 2022 | | | Dec. 31, 2021 | |
| Sustaining cash cost per pound of copper produced | | $000s | | | $/lb | | | $000s | | | $/lb | | | $000s | | | $/lb | | | $000s | | | $/lb | |
| Cash cost, net of by-product credits | | 80,193 | | | 1.34 | | | 64,573 | | | 1.28 | | | 312,096 | | | 1.58 | | | 264,102 | | | 1.54 | |
| Cash sustaining capital expenditures | | 31,240 | | | 0.53 | | | 50,423 | | | 1.00 | | | 133,313 | | | 0.68 | | | 146,044 | | | 0.85 | |
| Capitalized exploration1 | | 11,500 | | | 0.19 | | | 8,000 | | | 0.16 | | | 11,500 | | | 0.06 | | | 8,000 | | | 0.05 | |
| Royalties | | 1,656 | | | 0.03 | | | 762 | | | 0.02 | | | 5,367 | | | 0.03 | | | 3,503 | | | 0.02 | |
| Sustaining cash cost per pound of copper produced | | 124,589 | | | 2.09 | | | 123,758 | | | 2.46 | | | 462,276 | | | 2.35 | | | 421,649 | | | 2.46 | |
| 1 Only includes exploration costs incurred for locations near to existing mine operations. | |
Gold Cash Cost and Gold Sustaining Cash Cost
Cash cost per ounce of gold produced ("gold cash cost") is a non-IFRS measure that management uses as a key performance indicator to assess the performance of our Manitoba operations. This alternative cash cost calculation designates gold as the primary metal of production as it represents a substantial component of revenues for our Manitoba business unit and should therefore be less volatile over time than Manitoba cash cost per pound of copper. The calculation is presented in three manners:
- Gold cash cost, before by-product credits - This measure is gross of by-product revenues and is a function of the efforts and costs incurred to mine and process all ore mined. However, the measure divides this aggregate cost over only ounces of gold produced, the assumed primary metal of production. This measure is generally less volatile from period to period, as it is not affected by changes in the price received for by-product metals.
- Gold cash cost, net of by-product credits - In order to calculate the net cost to produce and sell gold, the net of by-product credits measure subtracts the revenues realized from the sale of the metals other than gold. The by-product revenues from copper, zinc, and silver are significant and are integral to the economics of our Manitoba operation. The economics that support our decision to produce and sell gold would be different if we did not receive revenues from the other significant metals being extracted and processed. This measure provides management and investors with an indication of the minimum gold price consistent with positive operating margins, assuming realized by-product metal prices are consistent with those prevailing during the reporting period. It also serves as an important operating statistic that management and investors utilize to measure our operating performance at our Manitoba operation versus that of our competitors. However, it is important to understand that if by-product metal prices decline alongside gold prices, the gold cash cost net of by-product credits would increase, requiring a higher gold price than that reported to maintain positive cash flows and operating margins.
- Gold sustaining cash cost, net of by-product credits - This measure is an extension of gold cash cost that includes cash sustaining capital expenditures, capitalized exploration, net smelter returns royalties, as well as accretion and amortization for expected decommissioning activities for producing assets. It does not include corporate selling and administrative expenses. It provides a more fulsome measurement of the cost of sustaining production than gold cash cost, which is focused on operating costs only.
The tables below present a detailed build-up of gold cash cost and gold sustaining cash cost, net of by-product credits, for the Manitoba business unit, and reconciliations between gold cash cost, net of by-product credits, to the most comparable IFRS measures of cost of sales for the year ended months ended December 31, 2022. The introduction of gold cash cost was made in 2022, as gold replaced zinc as the major output within Manitoba's production profile. No comparatives have been disclosed for this metric as Manitoba gold production in 2021 was not considered meaningful. Gold cash cost, net of by-product credits, may not calculate exactly based on amounts presented in the tables below due to rounding.
| Manitoba | | Three months ended | | | Year ended | |
| (in thousands) | | Dec. 31, 2022 | | | Dec. 31, 2022 | |
| Net ounces of gold produced1 | | 33,060 | | | 161,471 | |
| 1 Contained gold in concentrate and doré. | | | | | | |
| Manitoba | | Three months ended | | | Year ended | |
| | | Dec. 31, 2022 | | | Dec. 31, 2022 | |
| Cash cost per ounce of gold produced | | $000s | | | $/oz1 | | | $000s | | | $/oz1 | |
| Mining | | 38,112 | | | 1,153 | | | 192,704 | | | 1,193 | |
| Milling | | 14,868 | | | 450 | | | 73,903 | | | 458 | |
| Refining (zinc) | | - | | | - | | | 32,755 | | | 203 | |
| G&A | | 6,452 | | | 195 | | | 62,439 | | | 387 | |
| Onsite costs | | 59,432 | | | 1,798 | | | 361,801 | | | 2,241 | |
| Treatment & refining | | 8,006 | | | 242 | | | 29,349 | | | 181 | |
| Freight & other | | 6,448 | | | 195 | | | 29,531 | | | 183 | |
| Cash cost, before by-product credits | | 73,886 | | | 2,235 | | | 420,681 | | | 2,605 | |
| By-product credits | | (43,407 | ) | | (1,313 | ) | | (372,783 | ) | | (2,308 | ) |
| Gold cash cost, net of by-product credits | | 30,479 | | | 922 | | | 47,898 | | | 297 | |
| Manitoba | | Three months ended | | | Year ended | |
| | | Dec. 31, 2022 | | | Dec. 31, 2022 | |
| Supplementary cash cost information | | $000s | | | $/oz 1 | | | $000s | | | $/oz1 | |
| By-product credits2: | | | | | | | | | | | | |
| Copper | | 15,382 | | | 465 | | | 122,785 | | | 760 | |
| Zinc | | 24,744 | | | 748 | | | 224,043 | | | 1,388 | |
| Silver3 | | 2,567 | | | 78 | | | 20,581 | | | 127 | |
| Other | | 714 | | | 22 | | | 5,374 | | | 33 | |
| Total by-product credits | | 43,407 | | | 1,313 | | | 372,783 | | | 2,308 | |
| Reconciliation to IFRS: | | | | | | | | | | | | |
| Cash cost, net of by-product credits | | 30,479 | | | | | | 47,898 | | | | |
| By-product credits | | 43,407 | | | | | | 372,783 | | | | |
| Treatment and refining charges | | (8,006 | ) | | | | | (29,349 | ) | | | |
| Past service pension/curtailment | | (2,384 | ) | | | | | (2,384 | ) | | | |
| Share-based compensation expenses | | 395 | | | | | | 343 | | | | |
| Inventory adjustments | | 7 | | | | | | 4,111 | | | | |
| Change in product inventory | | (740 | ) | | | | | 28,223 | | | | |
| Royalties | | 94 | | | | | | 5,777 | | | | |
| Depreciation and amortization4 | | 21,152 | | | | | | 126,572 | | | | |
| Cost of sales5 | | 84,404 | | | | | | 553,974 | | | | |
| 1 Per ounce of gold produced. |
| 2 By-product credits are computed as revenue per financial statements, amortization of deferred revenue and pricing and volume adjustments. For more information, please see the realized price reconciliation table on page 37 of this MD&A. |
| 3 Silver by-product credits do not include variable consideration adjustments with respect to stream arrangements. |
| 4 Depreciation is based on concentrate sold. |
| 5 As per IFRS financial statements, excluding impairment adjustments. |
| Manitoba | | Three months ended | | | Year ended | |
| | | Dec. 31, 2022 | | | Dec. 31, 2022 | |
| Sustaining cash cost per ounce of gold produced | | $000s | | | $/oz | | | $000s | | | $/oz | |
| Gold cash cost, net of by-product credits | | 30,479 | | | 922 | | | 47,898 | | | 297 | |
| Cash sustaining capital expenditures | | 28,762 | | | 870 | | | 122,412 | | | 758 | |
| Royalties | | 94 | | | 3 | | | 5,777 | | | 36 | |
| Sustaining cash cost per ounce of gold produced | | 59,335 | | | 1,795 | | | 176,087 | | | 1,091 | |
Combined Unit Cost and Zinc Plant Unit Cost Reconciliation
Combined unit cost ("unit cost") and zinc plant unit cost is a non-IFRS measure that management uses as a key performance indicator to assess the performance of our mining and milling operations. Combined unit cost and zinc plant unit cost are calculated by dividing the cost of sales by mill throughput and refined zinc metal produced, respectively. This measure is utilized by management and investors to assess our cost structure and margins and compare it to similar information provided by other companies in our industry. Unlike cash cost, this measure is not impacted by variability in by-product commodity prices since there are no by-product deductions; costs associated with profit-sharing and similar costs are excluded because of their correlation to external metal prices. In addition, the unit costs are reported in the functional currency of the operation which minimizes the impact of foreign currency fluctuations. In all, the unit cost measures provide an alternative perspective on operating cost performance with minimal impact from external market prices.
The tables below present a detailed combined unit cost and zinc plant unit costs for the Manitoba business unit and combined unit cost for the Peru business unit, and reconciliations between these measures to the most comparable IFRS measures of cost of sales for the year ended months ended December 31, 2022 and 2021.
| Peru | | Three months ended | | | Year ended | |
| (in thousands except unit cost per tonne) | | Dec. 31,
2022 | | | Dec. 31,
2021 | | | Dec. 31,
2022 | | | Dec. 31,
2021 | |
| Combined unit cost per tonne processed |
| Mining | | 41,647 | | | 27,756 | | | 137,546 | | | 98,200 | |
| Milling | | 50,723 | | | 40,121 | | | 195,152 | | | 168,477 | |
| G&A 1 | | 14,817 | | | 18,351 | | | 63,015 | | | 63,629 | |
| Other G&A 2 | | (152 | ) | | (1,937 | ) | | (414 | ) | | (2,152 | ) |
| | | 107,035 | | | 84,291 | | | 395,299 | | | 328,154 | |
| Less: COVID-19 related costs | | 689 | | | 4,041 | | | 5,214 | | | 19,760 | |
| Unit cost | | 106,346 | | | 80,250 | | | 390,085 | | | 308,394 | |
| Tonnes ore milled | | 7,796 | | | 8,049 | | | 30,522 | | | 28,810 | |
| Combined unit cost per tonne | | 13.64 | | | 9.96 | | | 12.78 | | | 10.70 | |
| Reconciliation to IFRS: | | | | | | | | | | | | |
| Unit cost | | 106,346 | | | 80,250 | | | 390,085 | | | 308,394 | |
| Freight & other | | 15,607 | | | 11,609 | | | 50,284 | | | 41,316 | |
| COVID-19 related costs | | 689 | | | 4,041 | | | 5,214 | | | 19,760 | |
| Other G&A | | 152 | | | 1,937 | | | 414 | | | 2,152 | |
| Share-based compensation expenses | | 95 | | | 145 | | | 77 | | | 247 | |
| Inventory adjustments | | - | | | - | | | (558 | ) | | (1,446 | ) |
| Change in product inventory | | (15,685 | ) | | (4,507 | ) | | (31,348 | ) | | (13,743 | ) |
| Royalties | | 1,656 | | | 762 | | | 5,367 | | | 3,503 | |
| Depreciation and amortization | | 58,256 | | | 54,078 | | | 211,043 | | | 194,408 | |
| Cost of sales3 | | 167,116 | | | 148,315 | | | 630,578 | | | 554,591 | |
| 1 G&A as per cash cost reconciliation above. | |
| 2 Other G&A primarily includes profit sharing costs | |
| 3 As per IFRS financial statements, excluding impairment adjustments. | |
| Manitoba | | Three months ended | | | Year ended | |
| (in thousands except tonnes ore milled and unit cost per tonne) | | Dec. 31,
2022 | | | Dec. 31,
2021 | | | Dec. 31,
2022 | | | Dec. 31,
2021 | |
| Combined unit cost per tonne processed |
| Mining | | 38,112 | | | 58,891 | | | 192,704 | | | 222,660 | |
| Milling | | 14,868 | | | 22,193 | | | 73,903 | | | 62,995 | |
| G&A 1 | | 6,452 | | | 13,746 | | | 62,439 | | | 52,963 | |
| Less: G&A allocated to zinc metal production and other areas | | - | | | (3,762 | ) | | (6,523 | ) | | (14,656 | ) |
| Less: Other G&A related to profit sharing costs | | 1,939 | | | - | | | (20,075 | ) | | - | |
| Unit cost | | 61,371 | | | 91,068 | | | 302,448 | | | 323,962 | |
| USD/CAD implicit exchange rate | | 1.36 | | | 1.26 | | | 1.30 | | | 1.25 | |
| Unit cost - C$ | | 83,363 | | | 114,751 | | | 391,782 | | | 406,164 | |
| Tonnes ore milled | | 345,492 | | | 682,292 | | | 2,008,251 | | | 2,640,272 | |
| Combined unit cost per tonne - C$ | | 241 | | | 168 | | | 195 | | | 154 | |
| | | | | | | | | | | | | |
| Reconciliation to IFRS: | | | | | | | | | | | | |
| Unit cost | | 61,371 | | | 91,068 | | | 302,448 | | | 323,962 | |
| Freight & other | | 6,448 | | | 6,828 | | | 29,531 | | | 29,545 | |
| Refined (zinc) | | - | | | 19,008 | | | 32,755 | | | 72,392 | |
| G&A allocated to zinc metal production | | - | | | 3,762 | | | 6,523 | | | 14,656 | |
| Other G&A related to profit sharing | | (1,939 | ) | | - | | | 20,075 | | | - | |
| Share-based compensation expenses | | 395 | | | 599 | | | 343 | | | 1,100 | |
| Inventory adjustments | | 7 | | | - | | | 4,111 | | | 5,445 | |
| Past service pension/Curtailment | | (2,384 | ) | | 737 | | | (2,384 | ) | | 4,965 | |
| Change in product inventory | | (740 | ) | | (11,740 | ) | | 28,223 | | | (4,437 | ) |
| Royalties | | 94 | | | 2,832 | | | 5,777 | | | 11,771 | |
| Depreciation and amortization | | 21,152 | | | 35,849 | | | 126,572 | | | 163,516 | |
| Cost of sales2 | | 84,404 | | | 148,943 | | | 553,974 | | | 622,915 | |
| 1 G&A as per cash cost reconciliation above. | |
| 2 As per IFRS financial statements, excluding impairment adjustments. | |
| Manitoba | | Three months ended | | | Year ended | |
| (in thousands except zinc plant unit cost per pound) | | December
31, 2022 | | | December
31, 2021 | | | December
31, 2022 | | | December
31, 2021 | |
| Zinc plant unit cost |
| | | | | | | | | | | | | |
| Zinc plant costs | | - | | | 19,008 | | | 32,755 | | | 72,392 | |
| G&A 1 | | 6,452 | | | 13,746 | | | 62,439 | | | 52,963 | |
| Less: G&A allocated to other areas | | (8,391 | ) | | (9,984 | ) | | (35,841 | ) | | (38,307 | ) |
| Less: Other G&A related to profit sharing | | 1,939 | | | - | | | (20,075 | ) | | - | |
| Zinc plant unit cost | | - | | | 22,770 | | | 39,278 | | | 87,048 | |
| | | | | | | | | | | | | |
| USD/CAD implicit exchange rate | | - | | | 1.26 | | | 1.27 | | | 1.25 | |
| Zinc plant unit cost - C$ | | - | | | 28,690 | | | 50,036 | | | 109,062 | |
| Refined metal produced (in pounds) | | - | | | 45,819 | | | 83,542 | | | 197,461 | |
| Zinc plant unit cost per pound - C$ | | - | | | 0.63 | | | 0.60 | | | 0.55 | |
| | | | | | | | | | | | | |
| Reconciliation to IFRS: | | | | | | | | | | | | |
| Zinc plant unit cost | | - | | | 22,770 | | | 39,278 | | | 87,048 | |
| Freight & other | | 6,448 | | | 6,828 | | | 29,531 | | | 29,545 | |
| Mining | | 38,112 | | | 58,891 | | | 192,704 | | | 222,660 | |
| Milling | | 14,868 | | | 22,193 | | | 73,903 | | | 62,995 | |
| G&A allocated to other areas | | 8,391 | | | 9,984 | | | 35,841 | | | 38,307 | |
| Other G&A related to profit sharing | | (1,939 | ) | | - | | | 20,075 | | | - | |
| Share-based payment | | 395 | | | 599 | | | 343 | | | 1,100 | |
| Inventory adjustments | | 7 | | | - | | | 4,111 | | | 5,445 | |
| Past service pension/Curtailment | | (2,384 | ) | | 737 | | | (2,384 | ) | | 4,965 | |
| Change in product inventory | | (740 | ) | | (11,740 | ) | | 28,223 | | | (4,437 | ) |
| Royalties | | 94 | | | 2,832 | | | 5,777 | | | 11,771 | |
| Depreciation and amortization | | 21,152 | | | 35,849 | | | 126,572 | | | 163,516 | |
| Cost of sales2 | | 84,404 | | | 148,943 | | | 553,974 | | | 622,915 | |
| 1 G&A as per cash cost reconciliation above. | |
| 2 As per IFRS financial statements, excluding impairment adjustments. | |
ACCOUNTING CHANGES
New standards and interpretations not yet adopted
For information on new standards and interpretations not yet adopted, refer to note 4 of our audited consolidated financial statements for the year ended December 31, 2022.
CRITICAL ACCOUNTING JUDGEMENTS AND ESTIMATES
The preparation of the consolidated financial statements in conformity with IFRS requires us to make judgements, estimates and assumptions that affect the application of accounting policies, reported amounts of assets and liabilities, disclosure of contingent assets and liabilities at the date of the consolidated financial statements, and reported amounts of revenue and expenses during the reporting period. Actual results may differ from these estimates.
We review these estimates and underlying assumptions on an ongoing basis based on our experience and other factors, including expectations of future events that we believe to be reasonable under the circumstances. Revisions to accounting estimates are recognized in the period in which the estimates are revised and in any future periods affected. Certain accounting estimates and judgements have been identified as being "critical" to the presentation of our financial condition and results of operations because they require us to make subjective and/or complex judgments about matters that are inherently uncertain; or there is a reasonable likelihood that materially different amounts could be reported under different conditions or using different assumptions and estimates.
The following are significant judgements and estimates impacting the consolidated financial statements:
- Judgements and estimates that affect multiple areas of the consolidated financial statements:
- Mineral reserves and resources which form the basis of life of mine plans which are utilized in impairment testing, timing of payments related to decommissioning obligations and depreciation of capital assets. We estimate our mineral reserves and resources based on information compiled by qualified persons as defined in accordance with NI 43-101;
- Income and mining taxes, including estimates of future taxable profit which impacts the ability to realize deferred tax assets on our balance sheet; and
- In respect of the outcome of uncertain future events as it concerns recognizing contingent liabilities.
- Judgements and estimates that relate mainly to assets (these judgements may also affect other areas of the consolidated financial statements):
- Property, plant and equipment:
- Cost allocations for mine development;
- Mining properties expenditures capitalized;
- Classification of supply costs as related to capital development or inventory acquisition;
- Determining when exploration and evaluation assets should be transferred to capital works in progress within property, plant and equipment;
- Determination of when an asset or group of assets is in the condition and location to be ready for use as intended by management for the purposes of commencing depreciation;
- Componentization;
- Assessment of impairment, including determination of cash generating units and assessing for indicators of impairment;
- Recoverability of exploration and evaluation assets, including determination of cash generating units and assessing for indications of impairment;
- Units of production depreciation;
- Plant and equipment estimated useful lives and residual values;
- Capitalized stripping costs; and
- Finite life intangible assets.
- Impairment (and reversal of impairment) of non-financial assets:
- Future production levels and timing;
- Operating and capital costs;
- Future commodity prices;
- Foreign exchange rates; and
- Risk adjusted discount rates; and
- In process inventory quantities, inventory cost allocations and inventory valuation.
- Judgements and estimates that relate mainly to liabilities (these judgements may also affect other areas of the consolidated financial statements):
- Determination of deferred revenue per unit related to the precious metals stream transactions and determination of current portion of deferred revenue, which is based on timing of future sales, and adjustments of the expected conversion of resource to reserves;
- Pensions and other employee benefits; and
- Decommissioning, restoration and similar liabilities including estimated future costs and timing of spending.
- Estimates that relate mainly to the consolidated income statements:
- Assaying used to determine revenues and recoverability of inventories.
For more information on judgements and estimates, refer to note 2 of our consolidated financial statements for the year ended December 31, 2022.
DISCLOSURE CONTROLS AND PROCEDURES AND INTERNAL CONTROL OVER FINANCIAL REPORTING
Disclosure controls and procedures ("DC&P")
Management is responsible for establishing and maintaining adequate DC&P. As of December 31, 2022, we have evaluated the effectiveness of the design and operation of our DC&P in accordance with requirements of National Instrument 52-109 of the Canadian Securities Commission ("NI 52-109") and the Sarbanes Oxley Act of 2002 (as adopted by the US Securities and Exchange Commission). Our Chief Executive Officer ("CEO") and Chief Financial Officer ("CFO") supervised and participated in this evaluation.
As of December 31, 2022, based on management's evaluation, our CEO and CFO concluded that our DC&P were effective to ensure that information required to be disclosed by us in reports we file or submit is recorded, processed, summarized and reported within the time periods specified in securities legislation and is accumulated and communicated to our management, including our CEO and CFO, to allow timely decisions regarding required disclosure.
Internal control over financial reporting ("ICFR")
Management of Hudbay is responsible for establishing and maintaining adequate ICFR. Under the supervision and with the participation of our Chief Executive Officer and Chief Financial Officer, we evaluated the effectiveness of our ICFR as of December 31, 2022 based upon the Internal Control - Integrated Framework (2013) issued by the Committee of Sponsoring Organizations of the Treadway Commission. Based on management's evaluation, our CEO and CFO concluded that our ICFR was effective as of December 31, 2022.
The effectiveness of the Company's ICFR as of December 31, 2022 has been audited by Deloitte LLP, Independent Registered Public Accounting Firm as stated in their report immediately preceding the Company's audited consolidated financial statements for the year ended December 31, 2022.
Changes in ICFR
We did not make any changes to ICFR during the year ended December 31, 2022 that materially affected, or are reasonably likely to materially affect, our ICFR.
Inherent limitations of controls and procedures
All internal control systems, no matter how well designed, have inherent limitations. As a result, even systems determined to be effective may not prevent or detect misstatements on a timely basis, as systems can provide only reasonable assurance that the objectives of the control system are met. In addition, projections of any evaluation of the effectiveness of ICFR to future periods are subject to the risk that controls may become inadequate because of changes in conditions, or that the degree of compliance with the policies or procedures may change.
NOTES TO READER
Forward-Looking Information
This MD&A contains forward-looking information within the meaning of applicable Canadian and United States securities legislation. All information contained in this MD&A, other than statements of current and historical fact, is forward-looking information. Often, but not always, forward-looking information can be identified by the use of words such as "plans", "expects", "budget", "guidance", "scheduled", "estimates", "forecasts", "strategy", "target", "intends", "objective", "goal", "understands", "anticipates" and "believes" (and variations of these or similar words) and statements that certain actions, events or results "may", "could", "would", "should", "might" "occur" or "be achieved" or "will be taken" (and variations of these or similar expressions). All of the forward-looking information in this MD&A is qualified by this cautionary note.
Forward-looking information includes, but is not limited to, statements regarding our production, cost and capital and exploration expenditure guidance, the anticipated timing of our issuance of new three-year production outlook, expectations regarding reductions in discretionary spending, capital expenditures and net debt, expectations regarding the impact of inflationary pressures on our cost of operations, financial condition and prospects, expectations regarding our cash balance and liquidity for 2023, expectations regarding the Copper World project, including with respect to our plans for a pre-feasibility study and the estimated timelines and pre-requisites for sanctioning the project, expectations regarding the permitting requirements for the Copper World project and permitting related litigation, our ability to increase the mining rate at Lalor beyond 4,650 tonnes per day, the anticipated timing for completing the Stall recovery improvement program, expectations regarding the ability to conduct exploration work on the Maria Reyna and Caballito properties and to advance related drill plans, expectations regarding the duration and potential impact of short-term mine plan changes implemented at Constancia, expectations regarding the ability for the company to reduce greenhouse gas emissions, the company's evaluation of opportunities to reprocess tailings, expectations regarding the prospective nature of the Maria Reyna and Caballito properties, the anticipated impact of brownfield growth projects on our performance, anticipated expansion opportunities in Snow Lake, anticipated drill programs, anticipated mine plans, anticipated metals prices and the anticipated sensitivity of our financial performance to metals prices, events that may affect our operations and development projects, anticipated cash flows from operations and related liquidity requirements, the anticipated effect of external factors on revenue, such as commodity prices, estimation of mineral reserves and resources, mine life projections, reclamation costs, economic outlook, government regulation of mining operations, and business and acquisition strategies. Forward-looking information is not, and cannot be, a guarantee of future results or events. Forward-looking information is based on, among other things, opinions, assumptions, estimates and analyses that, while considered reasonable by us at the date the forward-looking information is provided, inherently are subject to significant risks, uncertainties, contingencies and other factors that may cause actual results and events to be materially different from those expressed or implied by the forward-looking information.
The material factors or assumptions that we identified and were applied by us in drawing conclusions or making forecasts or projections set out in the forward-looking information include, but are not limited to:
- the ability to achieve production and cost guidance;
- the ability to achieve discretionary spending reductions without impacting operations;
- no significant interruptions to our operations due to social or political unrest in the regions Hudbay operates, including the navigation of the complex environment in Peru;
- no interruptions to our plans for advancing the Copper World project;
- the ability to ramp up exploration in respect of the Maria Reyna and Caballito properties and to advance related drill plans;
- the ability to ramp up the Lalor mine beyond 4,650 tonnes per day;
- the success of mining, processing, exploration and development activities;
- the scheduled maintenance and availability of our processing facilities;
- the accuracy of geological, mining and metallurgical estimates;
- anticipated metals prices and the costs of production;
- the supply and demand for metals we produce;
- the supply and availability of all forms of energy and fuels at reasonable prices;
- no significant unanticipated operational or technical difficulties;
- the execution of our business and growth strategies, including the success of our strategic investments and initiatives;
- the availability of additional financing, if needed;
- the ability to complete project targets on time and on budget and other events that may affect our ability to develop our projects;
- the timing and receipt of various regulatory and governmental approvals;
- the availability of personnel for our exploration, development and operational projects and ongoing employee relations;
- maintaining good relations with the labour unions that represent certain of our employees in Manitoba and Peru;
- maintaining good relations with the communities in which we operate, including the neighbouring Indigenous communities and local governments;
- no significant unanticipated challenges with stakeholders at our various projects;
- no significant unanticipated events or changes relating to regulatory, environmental, health and safety matters;
- no contests over title to our properties, including as a result of rights or claimed rights of Indigenous peoples or challenges to the validity of our unpatented mining claims;
- the timing and possible outcome of pending litigation and no significant unanticipated litigation;
- certain tax matters, including, but not limited to current tax laws and regulations, changes in taxation policies and the refund of certain value added taxes from the Canadian and Peruvian governments; and
- no significant and continuing adverse changes in general economic conditions or conditions in the financial markets (including commodity prices and foreign exchange rates).
The risks, uncertainties, contingencies and other factors that may cause actual results to differ materially from those expressed or implied by the forward-looking information may include, but are not limited to, political and social risks in the regions the company operates, including the uncertainty with respect to the political and social environment in Peru and its potential impact on our mining operations (as further described below), risks generally associated with the mining industry and the current geopolitical environment, including future commodity prices, currency and interest rate fluctuations, energy and consumable prices, supply chain constraints and general cost escalation in the current inflationary environment, uncertainties related to the development and operation of our projects, risks related to the Copper World project, including in relation to permitting, litigation, project delivery and financing risks, risks related to the new Lalor mine plan, including the ability to convert inferred mineral resource estimates to higher confidence categories, dependence on key personnel and employee and union relations, risks related to political or social instability, unrest or change, risks in respect of Indigenous and community relations, rights and title claims, operational risks and hazards, including the cost of maintaining and upgrading our tailings management facilities and any unanticipated environmental, industrial and geological events and developments and the inability to insure against all risks, failure of plant, equipment, processes, transportation and other infrastructure to operate as anticipated, compliance with government and environmental regulations, including permitting requirements and anti-bribery legislation, depletion of our reserves, volatile financial markets and interest rates that may affect our ability to obtain additional financing on acceptable terms, the failure to obtain required approvals or clearances from government authorities on a timely basis, uncertainties related to the geology, continuity, grade and estimates of mineral reserves and resources, and the potential for variations in grade and recovery rates, uncertain costs of reclamation activities, our ability to comply with our pension and other post-retirement obligations, our ability to abide by the covenants in our debt instruments and other material contracts, tax refunds, hedging transactions, as well as the risks discussed under the heading "Risk Factors" in our most recent Annual Information Form.
Additionally, as a result of the heightened tensions, protests and social unrest in Peru following a recent change in the country's political leadership, the company has experienced intermittent disruptions to commerce and supply chains, including the ability to steadily receive critical supplies, and transport and sell concentrates. A prolonged disruption of logistics and supply chains may adversely impact operations at our Constancia mine. Given the uncertainty of the duration and extent of the social and political tensions in Peru, and the relative contribution of our Peru operations on our overall output, the 2023 production and cost guidance is subject to a higher-than-normal degree of uncertainty.
Should one or more risk, uncertainty, contingency or other factor materialize or should any factor or assumption prove incorrect, actual results could vary materially from those expressed or implied in the forward-looking information. Accordingly, you should not place undue reliance on forward-looking information. We do not assume any obligation to update or revise any forward-looking information after the date of this MD&A or to explain any material difference between subsequent actual events and any forward-looking information, except as required by applicable law.
Note to United States Investors
This MD&A has been prepared in accordance with the requirements of the securities laws in effect in Canada, which may differ materially from the requirements of United States securities laws applicable to U.S. issuers.
Qualified Person and NI 43-101
The technical and scientific information in this MD&A related to our material mineral projects has been approved by Olivier Tavchandjian, P. Geo, our Vice President, Exploration and Technical Services. Mr. Tavchandjian is a qualified person pursuant to National Instrument 43-101 - Standards of Disclosure for Mineral Projects ("NI 43-101").
For a description of the key assumptions, parameters and methods used to estimate mineral reserves and resources at Hudbay's material properties, as well as data verification procedures and a general discussion of the extent to which the estimates of scientific and technical information may be affected by any known environmental, permitting, legal title, taxation, sociopolitical, marketing or other relevant factors, please see the technical reports for our material properties as filed by us on SEDAR at www.sedar.com.
SUMMARY OF RESULTS
The following unaudited tables set out a summary of quarterly and annual results for the Company.
| | 2022 4 | Q4 2022 | Q3 2022 | Q2 2022 | Q1 2022 | 2021 4 | Q4 2021 | Q3 20215 | Q2 2021 | Q1 2021 | 2020 4 | Q4 2020 |
Consolidated Financial Condition ($000s) |
Cash | | $225,665 | $225,665 | $286,117 | $258,556 | $213,359 | $270,989 | $270,989 | $297,451 | $294,287 | $310,564 | $439,135 | $439,135 |
Total long-term debt | | 1,184,162 | 1,184,162 | 1,183,237 | 1,182,143 | 1,181,119 | 1,180,274 | 1,180,274 | 1,182,612 | 1,181,195 | 1,180,798 | 1,135,675 | 1,135,675 |
Net debt1 | | 958,497 | 958,497 | 897,120 | 923,587 | 967,760 | 909,285 | 909,285 | 885,161 | 886,908 | 870,234 | 696,540 | 696,540 |
Consolidated Financial Performance ($000s except per share amounts) | | | |
Revenue | | $1,461,440 | $321,196 | $346,171 | $415,454 | $378,619 | $1,501,998 | $425,170 | $358,961 | $404,242 | $313,624 | $1,092,418 | $322,290 |
Cost of sales | | 1,184,552 | 251,520 | 313,741 | 325,940 | 293,351 | 1,370,979 | 343,426 | 444,379 | 322,060 | 261,112 | 1,053,418 | 287,923 |
Earnings (loss) before tax | | 95,815 | (14,287) | (263) | 21,504 | 88,861 | (202,751) | (149) | (147,830) | 14,819 | (69,592) | (179,089) | 911 |
Earnings (loss) | | 70,382 | (17,441) | (8,135) | 32,143 | 63,815 | (244,358) | (10,453) | (170,411) | (3,395) | (60,102) | (144,584) | 7,406 |
Basic and diluted earnings (loss) per share | $0.27 | $(0.07) | $(0.03) | $0.12 | $0.24 | $(0.93) | $(0.04) | $(0.65) | $(0.01) | $(0.23) | $(0.55) | $0.03 |
Adjusted earnings (loss) per share 1 | $0.10 | $0.01 | $(0.05) | $0.12 | $0.02 | $0.09 | $0.13 | $- | $0.02 | $(0.06) | $(0.46) | $(0.06) |
Operating cash flow before change in non-cash working capital | 391,729 | 109,148 | 81,617 | 123,911 | 77,053 | 483,862 | 156,917 | 103,509 | 132,786 | 90,656 | 241,863 | 86,071 |
Adjusted EBITDA (in $ millions) 1 | 475.9 | 124.7 | 99.3 | 141.4 | 110.2 | 547.8 | 180.8 | 119.2 | 143.2 | 104.2 | 306.7 | 106.9 |
Consolidated Operational Performance | | | | | | | | | | |
Contained metal in concentrate and doré produced 2 | | | | | |
Copper | tonnes | 104,173 | 29,305 | 24,498 | 25,668 | 24,702 | 99,470 | 28,198 | 23,245 | 23,474 | 24,553 | 95,333 | 27,278 |
Gold | ounces | 219,700 | 53,920 | 53,179 | 58,645 | 53,956 | 193,783 | 64,159 | 54,276 | 39,848 | 35,500 | 124,622 | 32,376 |
Silver | ounces | 3,161,294 | 795,015 | 717,069 | 864,853 | 784,357 | 3,045,481 | 899,713 | 763,177 | 685,916 | 696,673 | 2,750,873 | 730,679 |
Zinc | tonnes | 55,381 | 6,326 | 9,750 | 17,053 | 22,252 | 93,529 | 23,207 | 20,844 | 21,538 | 27,940 | 118,130 | 25,843 |
Molybdenum | tonnes | 1,377 | 344 | 437 | 390 | 207 | 1,146 | 275 | 282 | 295 | 294 | 1,204 | 333 |
Payable metal in concentrate and doré sold | | | | | | | | | | | |
Copper | tonnes | 94,473 | 25,415 | 24,799 | 23,650 | 20,609 | 92,200 | 24,959 | 21,136 | 25,176 | 20,929 | 88,888 | 22,963 |
Gold | ounces | 213,415 | 47,256 | 66,932 | 50,884 | 48,343 | 168,358 | 56,927 | 47,843 | 38,205 | 25,383 | 122,949 | 35,179 |
Silver | ounces | 2,978,485 | 559,306 | 816,416 | 738,171 | 864,591 | 2,427,508 | 638,640 | 701,601 | 577,507 | 509,760 | 2,585,586 | 762,384 |
Zinc 3 | tonnes | 59,043 | 8,230 | 12,714 | 20,793 | 17,306 | 96,435 | 21,112 | 21,619 | 25,361 | 28,343 | 109,347 | 28,431 |
Molybdenum | tonnes | 1,352 | 421 | 511 | 208 | 213 | 1,098 | 245 | 304 | 265 | 284 | 1,321 | 457 |
Cash cost 1 | $/lb | $0.86 | $1.08 | $0.58 | $0.65 | $1.11 | $0.74 | $0.51 | $0.62 | $0.84 | $1.04 | $0.60 | $0.43 |
Sustaining cash cost | $/lb | $2.07 | $2.21 | $1.91 | $1.87 | $2.29 | $2.07 | $1.95 | $1.97 | $2.25 | $2.16 | $1.93 | $1.97 |
All-in sustaining cash cost 1 | $/lb | $2.26 | $2.41 | $2.16 | $1.93 | $2.54 | $2.30 | $2.20 | $2.18 | $2.48 | $2.37 | $2.16 | $2.24 |
1Net debt, adjusted earnings (loss) per share, adjusted EBITDA, cash cost, sustaining cash cost and all-in sustaining cash cost per pound of copper produced, net of by-product credits, are non-IFRS financial performance measures with no standardized definition under IFRS. For further information and a detailed reconciliation, please see discussion under the "Non-IFRS Financial Performance Measures" section of this MD&A. The above table sets forth selected non-IFRS financial performance measures for each of our nine most recently completed quarters and three most recently completed years; detailed reconciliations for non-comparable prior periods can be found in our MD&A for these prior periods in the "Non-IFRS Financial Performance Measures" section of these documents.
2 Metal reported in concentrate is prior to deductions associated with smelter contract terms.
3 Includes refined zinc metal sold.
4 Annual consolidated results may not calculate based on amounts presented in this table due to rounding.
5 The Q3 2021 adjusted net earnings (loss) and adjusted net earnings (loss) per share have been adjusted for changes made in the computation of tax impacts on certain adjusting items. The adjusted net earnings per share changed from $ 0.15/share to adjusted net earnings of $0.00/share. See the "Trend Analysis and Quarterly Review" section of this MD&A for further details.
| | 2022 5 | Q4 2022 | Q3 2022 | Q2 2022 | Q1 2022 | 2021 5 | Q4 2021 | Q3 2021 | Q2 2021 | Q1 2021 | 2020 5 | Q4 2020 |
Peru Operations | | | | | | | | | | | | | |
Constancia ore mined1 | tonnes | 25,840,435 | 5,614,918 | 6,300,252 | 7,017,114 | 6,908,151 | 29,714,327 | 7,742,469 | 6,208,019 | 8,016,373 | 7,747,466 | 27,529,950 | 9,313,784 |
Copper | % | 0.35 | 0.40 | 0.36 | 0.33 | 0.32 | 0.31 | 0.33 | 0.30 | 0.30 | 0.30 | 0.32 | 0.31 |
Gold | g/tonne | 0.04 | 0.04 | 0.05 | 0.04 | 0.04 | 0.04 | 0.04 | 0.04 | 0.04 | 0.04 | 0.03 | 0.03 |
Silver | g/tonne | 3.40 | 3.48 | 3.38 | 3.53 | 3.22 | 2.88 | 2.81 | 2.76 | 3.02 | 2.90 | 2.75 | 2.61 |
Molybdenum | % | 0.01 | 0.01 | 0.01 | 0.01 | 0.01 | 0.01 | 0.01 | 0.01 | 0.01 | 0.01 | 0.02 | 0.01 |
Pampacancha ore mined1 | tonnes | 8,319,250 | 3,771,629 | 2,488,928 | 1,211,387 | 847,306 | 5,141,001 | 2,107,196 | 2,050,813 | 982,992 | - | - | - |
Copper | % | 0.33 | 0.37 | 0.29 | 0.29 | 0.27 | 0.27 | 0.27 | 0.27 | 0.26 | - | - | - |
Gold | g/tonne | 0.29 | 0.29 | 0.23 | 0.28 | 0.43 | 0.30 | 0.34 | 0.27 | 0.27 | - | - | - |
Silver | g/tonne | 4.06 | 3.84 | 4.30 | 4.25 | 4.06 | 4.02 | 4.26 | 3.58 | 4.43 | - | - | - |
Molybdenum | % | 0.01 | 0.01 | 0.01 | 0.01 | 0.01 | 0.01 | 0.01 | 0.01 | 0.01 | - | - | - |
Ore milled | tonnes | 30,522,294 | 7,795,735 | 7,742,020 | 7,770,706 | 7,213,833 | 28,809,755 | 8,048,925 | 6,985,035 | 7,413,043 | 6,362,752 | 26,297,318 | 7,741,714 |
Copper | % | 0.34 | 0.41 | 0.34 | 0.32 | 0.31 | 0.32 | 0.33 | 0.30 | 0.31 | 0.33 | 0.34 | 0.33 |
Gold | g/tonne | 0.09 | 0.12 | 0.08 | 0.09 | 0.08 | 0.08 | 0.11 | 0.11 | 0.07 | 0.04 | 0.03 | 0.03 |
Silver | g/tonne | 3.58 | 3.93 | 3.48 | 3.64 | 3.26 | 3.35 | 3.67 | 3.93 | 2.88 | 2.84 | 2.87 | 2.74 |
Molybdenum | % | 0.01 | 0.01 | 0.01 | 0.01 | 0.01 | 0.01 | 0.01 | 0.01 | 0.01 | 0.01 | 0.02 | 0.02 |
Copper recovery | % | 85.0 | 85.1 | 84.5 | 85.0 | 85.3 | 84.6 | 86.0 | 84.9 | 83.3 | 84.1 | 83.0 | 85.3 |
Gold recovery | % | 63.6 | 69.6 | 61.9 | 60.3 | 59.8 | 64.6 | 63.6 | 71.9 | 62.2 | 52.0 | 49.8 | 52.7 |
Silver recovery | % | 65.7 | 66.5 | 65.2 | 64.2 | 66.9 | 63.7 | 60.8 | 59.1 | 68.2 | 69.9 | 66.9 | 70.1 |
Molybdenum recovery | % | 34.8 | 37.7 | 41.0 | 38.8 | 21.1 | 31.5 | 26.7 | 33.5 | 33.3 | 33.4 | 29.4 | 28.4 |
Contained metal in concentrate | | | | | | | | | | | | |
Copper | tonnes | 89,395 | 27,047 | 22,302 | 20,880 | 19,166 | 77,813 | 22,856 | 18,072 | 19,058 | 17,827 | 73,150 | 21,554 |
Gold | ounces | 58,229 | 20,860 | 12,722 | 13,858 | 10,789 | 50,306 | 17,917 | 17,531 | 10,220 | 4,638 | 12,395 | 3,689 |
Silver | ounces | 2,309,352 | 655,257 | 564,299 | 584,228 | 505,568 | 1,972,949 | 578,140 | 521,036 | 468,057 | 405,714 | 1,622,972 | 477,775 |
Molybdenum | tonnes | 1,377 | 344 | 437 | 390 | 207 | 1,146 | 275 | 282 | 295 | 294 | 1,204 | 333 |
Payable metal sold | | | | | | | | | | | | | |
Copper | tonnes | 79,805 | 23,789 | 20,718 | 18,473 | 16,825 | 71,398 | 20,551 | 16,065 | 19,946 | 14,836 | 68,506 | 18,583 |
Gold | ounces | 49,968 | 15,116 | 11,970 | 8,430 | 14,452 | 41,807 | 16,304 | 16,902 | 5,638 | 2,963 | 10,986 | 3,297 |
Silver | ounces | 2,045,678 | 411,129 | 513,470 | 484,946 | 636,133 | 1,490,651 | 380,712 | 457,263 | 315,064 | 337,612 | 1,518,548 | 480,843 |
Molybdenum | tonnes | 1,352 | 421 | 511 | 208 | 213 | 1,098 | 245 | 304 | 265 | 284 | 1,321 | 457 |
Peru combined unit operating cost 2,3,4 | $/tonne | $12.78 | $13.64 | $13.06 | $12.02 | $12.37 | $10.70 | $9.96 | $10.93 | $10.40 | $11.74 | $9.46 | $10.17 |
Peru cash cost3 | $/lb | $1.58 | $1.34 | $1.68 | $1.82 | $1.54 | $1.54 | $1.28 | $1.26 | $1.85 | $1.82 | $1.45 | $1.47 |
Peru sustaining cash cost3 | $/lb | $2.35 | $2.09 | $2.46 | $2.62 | $2.27 | $2.46 | $2.46 | $2.31 | $2.69 | $2.36 | $2.20 | $2.58 |
1 Reported tonnes and grade for ore mined are estimates based on mine plan assumptions and may not fully reconcile to ore milled. |
2 Reflects combined mine, mill and general and administrative ("G&A") costs per tonne of ore milled. Reflects the deduction of expected capitalized stripping costs. |
3 Combined unit costs, cash cost, and sustaining cash cost per pound of copper produced, net of by-product credits, are non-IFRS financial performance measures with no standardized definition under IFRS. For further information and a detailed reconciliation, please see the discussion under the "Non-IFRS Financial Performance Measures" section of this MD&A. The above table sets forth selected non-IFRS financial performance measures for each of our nine most recently completed quarters and three most recently completed years; detailed reconciliations for non-comparable prior periods can be found in our MD&A for these prior periods in the "Non-IFRS Financial Performance Measures" section of these documents. |
4 2022 and 2021 combined unit costs exclude COVID-19 related costs. |
5 Annual consolidated results may not calculate based on amounts presented in this table due to rounding. |
| | 2022 1 | Q4 2022 | Q3 2022 | Q2 2022 | Q1 2022 | 2021 1 | Q4 2021 | Q3 2021 | Q2 2021 | Q1 2021 | 2020 1 | Q4 2020 |
Manitoba Operations | | | | | | | | | | | | | |
Lalor ore mined | tonnes | 1,516,203 | 369,453 | 347,345 | 412,653 | 386,752 | 1,593,141 | 422,208 | 392,380 | 356,951 | 421,602 | 1,654,240 | 468,101 |
Copper | % | 0.73 | 0.73 | 0.71 | 0.70 | 0.80 | 0.71 | 0.78 | 0.86 | 0.64 | 0.57 | 0.74 | 0.80 |
Zinc | % | 3.14 | 2.17 | 3.27 | 3.06 | 4.06 | 4.23 | 4.19 | 3.60 | 3.81 | 5.20 | 5.73 | 5.54 |
Gold | g/tonne | 4.00 | 4.00 | 4.57 | 3.73 | 3.76 | 3.41 | 3.92 | 3.85 | 3.19 | 2.67 | 2.51 | 2.79 |
Silver | g/tonne | 21.96 | 19.37 | 21.27 | 23.95 | 22.94 | 24.66 | 30.35 | 22.13 | 22.98 | 22.75 | 25.31 | 24.96 |
777 ore mined | tonnes | 484,355 | - | - | 226,286 | 258,069 | 1,053,710 | 266,744 | 256,536 | 255,170 | 275,260 | 991,576 | 164,856 |
Copper | % | 1.12 | - | - | 1.03 | 1.19 | 1.28 | 1.13 | 1.06 | 0.82 | 2.06 | 1.40 | 1.89 |
Zinc | % | 3.83 | - | - | 3.51 | 4.12 | 3.91 | 4.16 | 3.88 | 3.57 | 4.00 | 3.88 | 2.98 |
Gold | g/tonne | 1.66 | - | - | 1.62 | 1.69 | 2.03 | 1.80 | 1.96 | 1.97 | 2.39 | 1.90 | 1.85 |
Silver | g/tonne | 20.85 | - | - | 20.63 | 21.05 | 25.25 | 25.02 | 22.99 | 23.35 | 29.32 | 24.13 | 21.64 |
Stall & New Britannia Concentrator Combined: | | | | | | | | | | | | |
Ore milled | tonnes | 1,510,907 | 345,492 | 362,108 | 406,006 | 397,301 | 1,506,756 | 419,727 | 408,201 | 317,484 | 361,344 | 1,412,751 | 372,624 |
Copper | % | 0.75 | 0.73 | 0.69 | 0.73 | 0.82 | 0.72 | 0.75 | 0.82 | 0.68 | 0.60 | 0.73 | 0.79 |
Zinc | % | 3.30 | 2.31 | 3.33 | 3.20 | 4.24 | 4.30 | 4.12 | 3.58 | 4.06 | 5.53 | 5.76 | 5.47 |
Gold | g/tonne | 4.08 | 3.98 | 4.60 | 3.93 | 3.87 | 3.42 | 3.90 | 3.84 | 3.19 | 2.57 | 2.55 | 2.88 |
Silver | g/tonne | 22.15 | 20.40 | 20.66 | 23.98 | 23.16 | 24.95 | 30.07 | 23.32 | 22.02 | 23.40 | 25.37 | 24.43 |
Copper recovery | % | 88.6 | 89.2 | 88.3 | 89.5 | 87.5 | 86.8 | 88.7 | 84.3 | 88.8 | 85.7 | 86.2 | 87.1 |
Zinc recovery | % | 79.0 | 79.4 | 80.9 | 75.5 | 85.7 | 88.9 | 87.4 | 88.2 | 88.1 | 91.1 | 91.9 | 90.9 |
Gold recovery | % | 59.2 | 58.8 | 60.9 | 58.8 | 58.4 | 54.9 | 54.6 | 53.4 | 55.5 | 57.5 | 60.0 | 59.5 |
Silver recovery | % | 58.1 | 56.1 | 57.6 | 58.1 | 60.0 | 54.4 | 53.9 | 52.7 | 55.1 | 56.2 | 60.4 | 60.3 |
Flin Flon Concentrator: | | | | | | | | | | | | |
Ore milled | tonnes | 497,344 | - | - | 243,312 | 254,032 | 1,133,516 | 262,565 | 258,062 | 329,503 | 283,386 | 1,205,314 | 225,663 |
Copper | % | 1.11 | - | - | 1.02 | 1.20 | 1.23 | 1.12 | 1.06 | 0.89 | 1.88 | 1.28 | 1.59 |
Zinc | % | 3.87 | - | - | 3.60 | 4.13 | 3.95 | 4.16 | 3.86 | 3.65 | 4.20 | 4.21 | 3.87 |
Gold | g/tonne | 1.67 | - | - | 1.64 | 1.70 | 2.04 | 1.78 | 1.96 | 2.06 | 2.34 | 1.96 | 1.99 |
Silver | g/tonne | 21.00 | - | - | 20.76 | 21.23 | 24.90 | 25.04 | 22.93 | 23.65 | 28.01 | 24.26 | 22.65 |
Copper recovery | % | 86.7 | - | - | 85.5 | 87.6 | 87.7 | 86.7 | 85.2 | 84.8 | 91.3 | 86.0 | 88.1 |
Zinc recovery | % | 83.0 | - | - | 82.9 | 83.2 | 83.0 | 83.1 | 82.2 | 84.8 | 81.8 | 85.5 | 83.9 |
Gold recovery | % | 57.1 | - | - | 56.4 | 57.7 | 58.5 | 59.2 | 58.1 | 52.9 | 64.0 | 56.0 | 56.6 |
Silver recovery | % | 51.8 | - | - | 51.0 | 52.5 | 45.1 | 45.6 | 42.4 | 37.5 | 54.1 | 45.9 | 46.5 |
1 Annual consolidated results may not calculate based on amounts presented in this table due to rounding. |
| | 2022 4 | Q4 2022 | Q3 2022 | Q2 2022 | Q1 2022 | 2021 4 | Q4 2021 | Q3 2021 | Q2 2021 | Q1 2021 | 2020 4 | Q4 2020 |
Manitoba Operations (continued) | | | | | | | | | | | | |
Total Manitoba contained metal in concentrate produced | | | | | |
Copper | tonnes | 14,778 | 2,258 | 2,196 | 4,788 | 5,536 | 21,657 | 5,342 | 5,173 | 4,416 | 6,726 | 22,183 | 5,724 |
Zinc | tonnes | 55,381 | 6,326 | 9,750 | 17,053 | 22,252 | 93,529 | 23,207 | 20,844 | 21,538 | 27,940 | 118,130 | 25,843 |
Gold | ounces | 132,764 | 25,961 | 32,570 | 37,346 | 36,887 | 134,475 | 37,644 | 36,341 | 29,628 | 30,862 | 112,227 | 28,687 |
Silver | ounces | 799,108 | 127,099 | 138,615 | 264,651 | 268,743 | 1,066,003 | 315,054 | 242,131 | 217,859 | 290,959 | 1,127,901 | 252,904 |
Precious metal in doré produced | | | | | | | | | | | | | |
Gold | ounces | 28,707 | 7,099 | 7,887 | 7,441 | 6,280 | 9,002 | 8,598 | 404 | - | - | - | - |
Silver | ounces | 52,834 | 12,659 | 14,155 | 15,974 | 10,046 | 6,529 | 6,519 | 10 | - | - | - | - |
Total Manitoba payable metal sold and doré | | | | | | | | | | | |
Copper | tonnes | 14,668 | 1,626 | 4,081 | 5,177 | 3,784 | 20,802 | 4,408 | 5,071 | 5,230 | 6,093 | 20,382 | 4,380 |
Zinc1 | tonnes | 59,043 | 8,230 | 12,714 | 20,793 | 17,306 | 96,435 | 21,112 | 21,619 | 25,361 | 28,343 | 109,347 | 28,431 |
Gold | ounces | 163,447 | 32,140 | 54,962 | 42,454 | 33,891 | 126,551 | 40,623 | 30,941 | 32,567 | 22,420 | 111,963 | 31,882 |
Silver | ounces | 932,807 | 148,177 | 302,946 | 253,225 | 228,458 | 936,857 | 257,928 | 244,338 | 262,443 | 172,148 | 1,067,038 | 281,541 |
Manitoba combined unit operating cost2,3 | C$/tonne | 195 | $241 | $235 | 168 | 176 | $154 | $168 | $147 | $148 | $151 | $132 | $140 |
Manitoba gold cash cost 3, 5 | $/oz | $297 | $922 | $216 | (207) | 416 | $- | $- | $- | $- | $- | $- | $- |
Manitoba sustaining gold cash cost 3,5 | $/oz | $1,091 | $1,795 | $1,045 | 519 | 1,187 | $- | $- | $- | $- | $- | $- | $- |
1 Includes refined zinc metal sold. |
2 Reflects combined mine, mill and G&A costs per tonne of milled ore. |
3 Combined unit costs, cash cost, and sustaining cash cost per pound of copper produced, cash cost, and sustaining cash cost per ounce of gold produced, net of by-product credits, are non-IFRS financial performance measures with no standardized definition under IFRS. For further information and a detailed reconciliation, please see the discussion under the "Non-IFRS Financial Performance Measures" section of this MD&A. The above table sets forth selected non-IFRS financial performance measures for each of our nine most recently completed quarters and three most recently completed years; detailed reconciliations for non-comparable prior periods can be found in our MD&A for these prior periods in the "Non-IFRS Financial Performance Measures" section of these documents. |
4 Annual consolidated results may not calculate based on amounts presented in this table due to rounding. |
5 Cash cost and sustaining cash cost per ounce of gold produced, net of by-product credits were introduced in 2022 and do not have a published comparative. |