
Management's Discussion and Analysis of
Results of Operations and Financial Condition
For the three and six months ended
June 30, 2023
August 8, 2023
INTRODUCTION
This Management's Discussion and Analysis ("MD&A") dated August 8, 2023 is intended to supplement Hudbay Minerals Inc.'s unaudited condensed consolidated interim financial statements and related notes for the three and six months ended June 30, 2023 and 2022 (the "consolidated interim financial statements"). The consolidated interim financial statements have been prepared in accordance with International Financial Reporting Standards ("IFRS"), including International Accounting Standard 34, Interim Financial Reporting, as issued by the International Accounting Standards Board ("IASB").
References to "Hudbay", the "Company", "we", "us", "our" or similar terms refer to Hudbay Minerals Inc. and its direct and indirect subsidiaries as at June 30, 2023.
Readers should be aware that:
- This MD&A includes certain information with respect to Hudbay's acquisition of Copper Mountain Mining Corporation ("Copper Mountain"), which was completed on June 20, 2023, including the results of the Copper Mountain mine's operations during the 10-day stub period from June 20 to June 30, 2023 (the "10-day stub period") and the acquisition's impact on Hudbay's financial condition as at June 30, 2023. Copper Mountain and its subsidiaries are referred to as the British Columbia Business Unit.
- This MD&A contains certain "forward-looking statements" and "forward-looking information" (collectively, "forward-looking information") that are subject to risk factors set out in a cautionary note contained in our MD&A.
- This MD&A includes an updated discussion of the risks associated with business integration and, in particular, the risks associated with integrating Copper Mountain into our operations and uncertainties related to its potential impact on our financial condition, financial performance and cash flows, and supplements the discussion of these risks in our most recent Annual Information Form ("AIF") and MD&A.
- This MD&A has been prepared in accordance with the requirements of the securities laws in effect in Canada, which may differ materially from the requirements of United States securities laws applicable to US issuers.
- We use a number of non-IFRS financial performance measures in our MD&A.
- The technical and scientific information in this MD&A has been approved by qualified persons based on a variety of assumptions and estimates.
For a discussion of each of the above matters, readers are urged to review the "Notes to Reader" discussion beginning on page 56 of this MD&A.
Additional information regarding Hudbay, including the risks related to our business and those that are reasonably likely to affect our consolidated interim financial statements in the future, is contained in our continuous disclosure materials, including our most recent AIF, consolidated interim financial statements and Management Information Circular available on SEDAR+ at www.sedarplus.ca and on EDGAR at www.sec.gov.
All amounts are in US dollars unless otherwise noted.
OUR BUSINESS
We are a diversified mining company with long-life assets in North and South America. Our Constancia operations in Cusco (Peru) produce copper with gold, silver and molybdenum by-products. Our Snow Lake operations in Manitoba (Canada) produce gold with copper, zinc and silver by-products. Our Copper Mountain operations in British Columbia (Canada) produce copper with gold and silver by-products. We have an organic pipeline that includes the Copper World project in Arizona and the Mason project in Nevada (United States), and our growth strategy is focused on the exploration, development, operation, and optimization of properties we already control, as well as other mineral assets we may acquire that fit our strategic criteria. We are governed by the Canada Business Corporations Act and our shares are listed under the symbol "HBM" on the Toronto Stock Exchange, New York Stock Exchange and Bolsa de Valores de Lima.
SUMMARY
Positioned for Strong Production Growth and Free Cash Flow Generation in the Second Half of 2023
- Reaffirmed full year 2023 consolidated production, cash cost and sustaining cash cost guidance for our Peru and Manitoba operations.
- On June 20, 2023, Hudbay completed the acquisition of Copper Mountain, creating a 150,000-tonnes-per-year copper producer with three long-life mines in tier-one jurisdictions and a world-class pipeline of organic copper growth projects.
- Copper Mountain owns 75% of the Copper Mountain mine in British Columbia (the "Copper Mountain Mine Joint Venture"), with Mitsubishi Materials Corporation ("MMC") holding the remaining non-controlling interest.
- Hudbay expects to release an updated technical report for the Copper Mountain mine in the fourth quarter, which will include updated annual production and cost estimates for the mine.
- Achieved higher grades from Pampacancha in July with 1.6 million tonnes of ore mined at 0.63% copper and 0.31 grams per tonne gold, consistent with the mine plan and company expectations for higher production in Peru in the third and fourth quarters of 2023.
Second Quarter Operating and Financial Results
- Consolidated production in the second quarter was 21,715 tonnes of copper and 48,996 ounces of gold, which includes production from the Copper Mountain mine during the 10-day stub period following the June 20, 2023 acquisition date.
- Consolidated cash cost and sustaining cash cost per pound of copper produced, net of by-product credits1, in the second quarter, were $1.60 and $2.73, respectively, excluding Copper Mountain's costs during the 10-day stub period.
- Peru operations successfully managed through a transitional quarter with elevated stripping activities at Pampacancha completed in June to enable mining high grade portions of the orebody in the second half of 2023. The Peru operations maintained steady performance, producing 17,682 tonnes of copper in the second quarter, which was in line with mine plan expectations. Peru cash cost per pound of copper produced, net of by-product credits1, in the second quarter was $2.14, in line with quarterly cadence expectations as Pampacancha is expected to deliver higher copper production and precious metal by-product credits in the second half of 2023.
- Manitoba operations produced 35,253 ounces of gold, which was impacted by lower throughput at the Stall mill due to downtime to complete the Stall mill Phase I recovery improvement project tie-ins which resulted in a buildup of surface ore stockpiles at the end of the second quarter. Lalor achieved an 11% increase in ore mined versus the first quarter as we continue to implement improvements to reduce costs and target higher production levels. Manitoba cash cost per ounce of gold produced, net of by-product credits1, was $1,097 and is expected to decline to be within the annual guidance range due to higher throughput, gold recoveries and gold grades expected in the second half of 2023.
- Second quarter net loss and loss per share were $14.9 million and $0.05, respectively. After adjusting for $6.8 million of transaction costs incurred during the quarter associated with the acquisition of Copper Mountain and a non-cash gain of $4.7 million related to a quarterly revaluation of our closed site environmental reclamation provision, among other items, second quarter adjusted loss1 per share was $0.07.
- Operating cash flow before change in non-cash working capital was $55.9 million and adjusted EBITDA1 was $81.2 million in the second quarter.
- Cash and cash equivalents declined during the second quarter to $179.7 million and were negatively impacted by lower base metal prices and lower production volumes as a result of scheduled mill maintenance programs, elevated stripping activity in Peru and a buildup of ore stockpiles in Manitoba. Cash and cash equivalents were also impacted by $25.8 million in total transaction costs related to the acquisition of Copper Mountain, $65.9 million of capital investments primarily related to sustaining capital investments, and a $31.9 million bond interest payment.
Executing on Growth Initiatives and Prudent Financial Planning
- Copper Mountain integration activities are progressing in line with expectations with over 50% of the targeted annualized corporate and tax synergies already achieved to date. We are focused on advancing our plans to stabilize the operation over the next 12 months, to be further detailed in a technical report, which will include an updated mine plan and mineral reserve and resource estimates, expected to be released in the fourth quarter.
- Copper World pre-feasibility study for Phase I is well-advanced and expected to be released in the third quarter.
- Snow Lake drilling intersected new high-grade copper-gold-silver zone 500 metres northwest of Lalor and indicates the hosting mineralization at Lalor continues down plunge for at least two kilometres.
- Completed the acquisition of the Cook Lake properties in Snow Lake, providing the potential for a new discovery on claims untested by modern geophysics and where historical drilling intersected base metal and gold mineralization at a fraction of Lalor's current known depth.
- Announced the entry into a definitive agreement to acquire all the issued and outstanding common shares of Rockcliff Metals Corp. ("Rockcliff"), which is expected to increase our land position within trucking distance of our Snow Lake processing facilities by more than 250%. The transaction is expected to close in the third quarter.
- On July 6, 2023, established framework for a multi-year exploration partnership with Marubeni Corporation focused on the discovery of new deposits within trucking distance of Hudbay's processing facilities in Flin Flon, Manitoba.
- First phase of the Stall recovery improvement project was completed during the second quarter with commissioning completed in May and ramp-up to higher metal recoveries expected in the second half of 2023.
- In connection with the Copper Mountain transaction, we amended our Revolving Credit Facilities ("RCFs") to (i) exclude the Copper Mountain group from the financial covenant calculations in the RCFs until the Copper Mountain Nordic bonds are repaid in full and (ii) increase the net debt to EBITDA covenant ratio to provide greater financial flexibility during the integration period.
- Subsequent to quarter end, we drew $90 million from our RCFs to finance the redemption of a portion of Copper Mountain's Nordic bonds, thus improving our ability to deleverage and repay debt sooner than the bond maturity.
- On track to deliver annual discretionary spending reduction targets for 2023 with lower growth capital and exploration expenditures compared to 2022. As a result of a continued focus on discretionary spending reductions, total capital expenditures for 2023 are expected to be approximately $15 million lower than guidance levels, representing 5% of total capital expenditure guidance.
Summary of Second Quarter Results
Cash generated from operating activities in the second quarter of 2023 decreased to $24.6 million compared to $165.6 million in the same quarter of 2022 predominantly due to a $73.0 million negative impact from changes in non-cash working capital as we executed a stripping campaign at Pampacancha to access high grade portions of the orebody in the second half of 2023. Operating cash flow before changes in working capital was $55.9 million during the second quarter of 2023, reflecting a decrease of $68.0 million compared to the same period of 2022. The decrease in operating cash flow before changes in non-cash working capital was primarily the result of lower copper and zinc prices, lower copper, zinc and gold sales volumes due to the comparative period including 777 production, the buildup of approximately 45,000 tonnes of surface ore stockpiles in Manitoba as Stall mill Phase I recovery improvement project commissioning was completed as well as a second quarter scheduled plant maintenance shutdown in Peru and higher treatment and refining charges.
On June 20, 2023, Hudbay successfully completed its previously announced acquisition of Copper Mountain (the "Copper Mountain Transaction"). Copper Mountain's first shipment of copper concentrate following the acquisition occurred on July 23, 2023 after a brief strike at the Port of Vancouver earlier in July. As such, Hudbay's second quarter results were not materially affected by Copper Mountain's operations with no revenues or corresponding cost of sales recorded during the 10-day stub period from the date of acquisition to the end of the second quarter. As a result, we do not present revenue, cost of sales, metal sold, cash cost and sustaining cash cost per pound of copper produced net of by-product credits1 for the Copper Mountain mine in this MD&A. Combined acquisition-related costs incurred were $25.8 million, of which $6.8 million was expensed by Hudbay during the second quarter, mainly related to legal and advisory fees, share-based payments incurred prior to transaction close and change of control payments, while the remaining costs were incurred by Copper Mountain prior to completion of the acquisition.
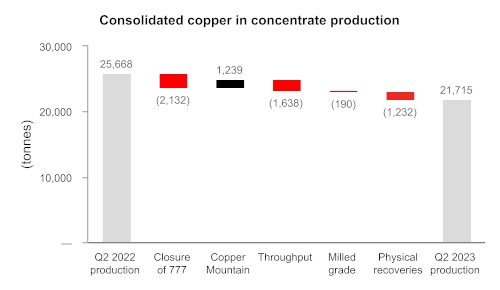
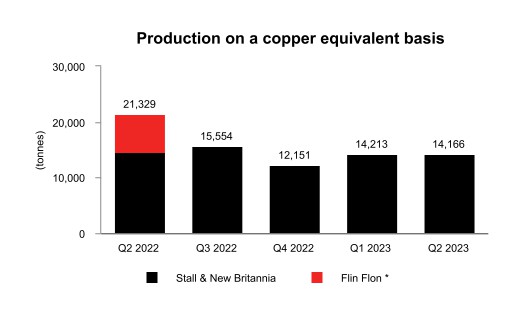
Production in the second quarter of 2023 did not include any production from the 777 mine, which closed, as planned, in June 2022 and only included limited production from the Copper Mountain mine during the 10-day stub period. The comparison in this paragraph excludes the production from the 777 mine in the second quarter of 2022 to illustrate the comparative performance of our current operations. Consolidated copper production in the second quarter of 2023 decreased by 8% compared to the same period in 2022 primarily due to executing a stripping campaign at Pampacancha as well as a scheduled mill maintenance program at Constancia. Consolidated gold production in the second quarter of 2023 decreased by 5% compared to the second quarter of 2022, mainly due to lower Peru mill throughput and lower New Britannia recoveries offset slightly by 5% higher gold ore grades in Manitoba. Consolidated silver production in the second quarter decreased by 22% compared to the same period in 2022. Consolidated zinc production in the second quarter of 2023 declined by 11% primarily due to lower throughput. For full historical production data (which includes production from the 777 mine), please refer to "Summary of Historical Results" section on page 59 of this MD&A.
Net loss and loss per share in the second quarter of 2023 were $14.9 million and $0.05, respectively, compared to net earnings and earnings per share of $32.1 million and $0.12, respectively, in the second quarter of 2022. The results were negatively impacted by $6.8 million of transaction costs associated with the acquisition of Copper Mountain and a $1.4 million foreign exchange loss. This was partially offset by a non-cash gain of $4.7 million related to the quarterly revaluation of the environmental reclamation provision at our closed sites and a $1.1 million revaluation gain related to the gold prepayment liability.
Adjusted net loss1 and adjusted net loss per share1 in the second quarter of 2023 were $18.3 million and $0.07 per share, respectively, after adjusting for $6.8 million of transaction costs associated with the acquisition of Copper Mountain and the non-cash revaluation gain of the environmental reclamation provision, among other items. This compares to adjusted net earnings and adjusted net earnings per share of $30.5 million, and $0.12 in the same period of 2022. Second quarter adjusted EBITDA1 was $81.2 million, compared to $141.4 million, compared to the same period in 2022.
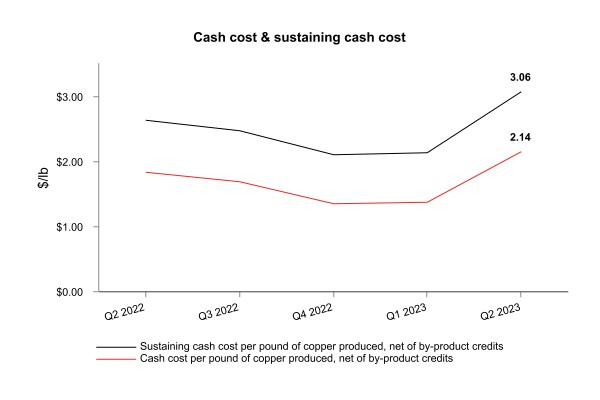
In the second quarter of 2023, consolidated cash cost per pound of copper produced, net of by-product credits1, was $1.60, compared to $0.65 in the same period in 2022. This increase was mainly the result of significantly lower by-product credits and lower copper production. Consolidated cash cost per pound of copper produced, net of by-product credits1 for the first six months of 2023 was above our 2023 guidance ranges but remained in line with quarterly cadence expectations. Consolidated sustaining cash cost per pound of copper produced, net of by-product credits1, was $2.73 in the second quarter of 2023 compared to $1.87 in the same period in 2022. This increase was primarily due to the same reasons outlined above partially offset by lower cash sustaining capital expenditures.
Consolidated all-in sustaining cash cost per pound of copper produced, net of by-product credits1, was $2.98 in the second quarter of 2023, higher than $1.93 in the same period in 2022, due to the same reasons outlined above as well as higher regional costs.
As at June 30, 2023, our liquidity included $179.7 million in cash and cash equivalents as well as undrawn availability of $184.1 million under our RCFs. Subsequent to quarter end, we drew $90 million from our RCFs to finance the redemption of $83.3 million of Copper Mountain's bonds, thereby reducing the aggregate amount of Copper Mountain bonds outstanding to $59.7 million and improving our ability to deleverage and repay debt sooner than the 2026 bond maturity. Based on expected free cash flow generation in the second half of 2023, we continue to expect to make progress on its deleveraging targets as outlined in its "3-P" plan for sanctioning Copper World. Current liquidity combined with cash flow from operations is expected to be sufficient to meet our liquidity needs for the foreseeable future.
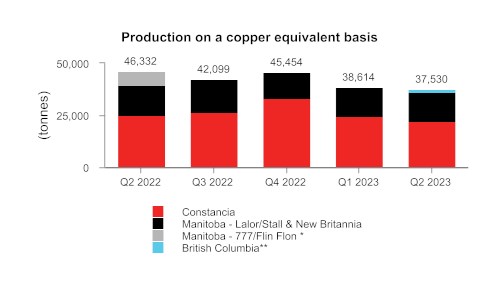
* Mining activities at 777 were completed in June 2022
** British Columbia production in Q2 2023 represents a 10-day stub period of production after the June 20, 2023 transaction closing date.
1 Adjusted net earnings (loss) and adjusted net earnings (loss) per share, adjusted EBITDA, cash cost, sustaining cash cost, all-in sustaining cash cost per pound of copper produced, net of by-product credits, cash cost, sustaining cash cost per ounce of gold produced, net of by-product credits, combined unit cost and net debt are non-IFRS financial performance measures with no standardized definition under IFRS. For further information and a detailed reconciliation, please see the discussion under the "Non-IFRS Financial Performance Measures" section of this MD&A. |
KEY FINANCIAL RESULTS
| Financial Condition3 | | | | | | |
| (in $ thousands) | | Jun. 30, 2023 | | | Dec. 31, 2022 | |
| Cash | $ | 179,734 | | $ | 225,665 | |
| Total long-term debt | | 1,370,682 | | | 1,184,162 | |
| Net debt1 | | 1,190,948 | | | 958,497 | |
| Working capital2 | | (61,357 | ) | | 76,534 | |
| Total assets | | 5,242,140 | | | 4,325,943 | |
| Equity attributable of owners of the Company | | 2,001,970 | | | 1,571,809 | |
1 Net debt is a non-IFRS financial performance measure with no standardized definition under IFRS. For further information and a detailed reconciliation, please see discussion under the "Non-IFRS Financial Performance Measures" section of this MD&A.
2 Working capital is determined as total current assets less total current liabilities as defined under IFRS and disclosed on the consolidated interim financial statements. Working capital reflects the full balance of Copper Mountain Nordic bonds, $144,981, as current, however, subsequent to quarter end, we drew $90 million from our revolving credit facilities to finance the redemption of a portion of Copper Mountain's Nordic bonds, as described under the "Liquidity and Capital Resources" section of this MD&A. As of the date hereof, the remaining Copper Mountain Nordic bonds are presented as long-term as well as our $90 million revolver draw.
3 Following completion of the Copper Mountain acquisition on June 20, 2023, the Company's financial condition has been impacted by the inclusion of Copper Mountain as at June 30, 2023 and accordingly there is no comparable period information.
| Financial Performance3 | | Three months ended | | | Six months ended | |
| (in $ thousands, except per share amounts or as noted below) | | Jun. 30, 2023 | | | Jun. 30, 2022 | | | Jun. 30, 2023 | | | Jun. 30, 2022 | |
| Revenue | $ | 312,166 | | $ | 415,454 | | $ | 607,385 | | $ | 794,073 | |
| Cost of sales | | 289,273 | | | 325,940 | | | 517,979 | | | 619,291 | |
| (Loss)/earnings before tax | | (30,731 | ) | | 21,504 | | | (13,301 | ) | | 110,365 | |
| Net (loss)/earnings | | (14,932 | ) | | 32,143 | | | (9,475 | ) | | 95,958 | |
| Basic and diluted (loss)/earnings per share | | (0.05 | ) | | 0.12 | | | (0.04 | ) | | 0.37 | |
| Adjusted (loss)/earnings per share1 | | (0.07 | ) | | 0.12 | | | (0.07 | ) | | 0.14 | |
| Operating cash flow before changes in non-cash working capital2 | | 55.9 | | | 123.9 | | | 141.5 | | | 201.0 | |
| Adjusted EBITDA1,2 | | 81.2 | | | 141.4 | | | 183.1 | | | 251.9 | |
1 Adjusted (loss) earnings per share and adjusted EBITDA are non-IFRS financial performance measures with no standardized definition under IFRS. For further information and a detailed reconciliation, please see discussion under the "Non-IFRS Financial Performance Measures" section of this MD&A.
2 In $ millions.
3 Following completion of the Copper Mountain acquisition on June 20, 2023, the Company's financial performance has not been materially affected by Copper Mountain's operations with no revenues or corresponding cost of sales recorded during the 10-day stub period from the date of acquisition to the end of the second quarter of 2023.
KEY PRODUCTION RESULTS
| | | Three months ended | | | Three months ended | |
| | Jun. 30, 2023 | | | Jun. 30, 2022 | |
| | Peru | | | Manitoba | | | British
Columbia4 | | | Total | | | Peru | | | Manitoba | | | Total | |
| Contained metal in concentrate and doré produced1 | |
| Copper | tonnes | | 17,682 | | | 2,794 | | | 1,239 | | | 21,715 | | | 20,880 | | | 4,788 | | | 25,668 | |
| Gold | oz | | 12,998 | | | 35,253 | | | 745 | | | 48,996 | | | 13,858 | | | 44,787 | | | 58,645 | |
| Silver | oz | | 419,642 | | | 180,750 | | | 11,918 | | | 612,310 | | | 584,228 | | | 280,625 | | | 864,853 | |
| Zinc | tonnes | | - | | | 8,758 | | | - | | | 8,758 | | | - | | | 17,053 | | | 17,053 | |
| Molybdenum | tonnes | | 414 | | | - | | | - | | | 414 | | | 390 | | | - | | | 390 | |
| Payable metal sold | |
| Copper | tonnes | | 21,207 | | | 1,871 | | | - | | | 23,078 | | | 18,473 | | | 5,177 | | | 23,650 | |
| Gold2 | oz | | 14,524 | | | 33,009 | | | - | | | 47,533 | | | 8,430 | | | 42,454 | | | 50,884 | |
| Silver2 | oz | | 671,532 | | | 133,916 | | | - | | | 805,448 | | | 484,946 | | | 253,225 | | | 738,171 | |
| Zinc3 | tonnes | | - | | | 8,641 | | | - | | | 8,641 | | | - | | | 20,793 | | | 20,793 | |
| Molybdenum | tonnes | | 314 | | | - | | | - | | | 314 | | | 208 | | | - | | | 208 | |
1 Metal reported in concentrate is prior to deductions associated with smelter contract terms.
2 Includes total payable gold and silver in concentrate and in doré sold.
3 For the three months ended June 30, 2023, this metric includes payable zinc in concentrate sold. For the three months ended June 30, 2022, this metric also included payable refined zinc metal sold.
4 Production results from Copper Mountain operations represents the 10-day stub period following the acquisition through to the end of the second quarter of 2023.
| | | Six months ended | | | Six months ended | |
| | Jun. 30, 2023 | | | Jun. 30, 2022 | |
| | Peru | | | Manitoba | | | British
Columbia4 | | | Total | | | Peru | | | Manitoba | | | Total | |
| Contained metal in concentrate produced 1 | | | | | | | | | | | | | |
| Copper | tonnes | | 38,200 | | | 4,839 | | | 1,239 | | | 44,278 | | | 40,046 | | | 10,324 | | | 50,370 | |
| Gold | oz | | 24,204 | | | 71,287 | | | 745 | | | 96,236 | | | 24,647 | | | 87,954 | | | 112,601 | |
| Silver | oz | | 971,809 | | | 331,392 | | | 11,918 | | | 1,315,119 | | | 1,089,796 | | | 559,414 | | | 1,649,210 | |
| Zinc | tonnes | | - | | | 18,604 | | | - | | | 18,604 | | | - | | | 39,305 | | | 39,305 | |
| Molybdenum | tonnes | | 703 | | | - | | | - | | | 703 | | | 596 | | | - | | | 596 | |
| Payable metal sold | |
| Copper | tonnes | | 37,523 | | | 4,096 | | | - | | | 41,619 | | | 35,298 | | | 8,961 | | | 44,259 | |
| Gold2 | oz | | 26,305 | | | 70,949 | | | - | | | 97,254 | | | 22,882 | | | 76,345 | | | 99,227 | |
| Silver2 | oz | | 1,063,739 | | | 283,595 | | | - | | | 1,347,334 | | | 1,121,079 | | | 481,684 | | | 1,602,763 | |
| Zinc3 | tonnes | | - | | | 14,269 | | | - | | | 14,269 | | | - | | | 38,099 | | | 38,099 | |
| Molybdenum | tonnes | | 568 | | | - | | | - | | | 568 | | | 421 | | | - | | | 421 | |
1 Metal reported in concentrate is prior to deductions associated with smelter contract terms.
2 Includes total payable gold and silver in concentrate and in doré sold.
3 For the six months ended June 30, 2023 this metric includes payable zinc in concentrate sold. For the six months ended June 30, 2022, this metric also included payable refined zinc metal sold.
4 Production results from Copper Mountain operations represents the 10-day stub period following the acquisition through to the end of the second quarter of 2023.
KEY COST RESULTS
| | | | Three months ended | | | Six months ended | | | Guidance | |
| | | | Jun. 30,
2023 | | | Jun. 30,
2022 | | | Jun. 30,
2023 | | | Jun. 30,
2022 | | | Annual
2023 | |
| Peru cash cost per pound of copper produced | |
| Cash cost 1 | $/lb | | 2.14 | | | 1.82 | | | 1.72 | | | 1.69 | | | 1.05 - 1.30 | |
| Sustaining cash cost 1 | $/lb | | 3.06 | | | 2.62 | | | 2.56 | | | 2.45 | | | | |
| Manitoba cash cost per ounce of gold produced | |
| Cash cost 1 | $/oz | | 1,097 | | | (207 | ) | | 1,017 | | | 99 | | | 500 - 800 | |
| Sustaining cash cost 1 | $/oz | | 1,521 | | | 519 | | | 1,427 | | | 847 | | | | |
| Consolidated cash cost per pound of copper produced2 | |
| Cash cost 1 | $/lb | | 1.60 | | | 0.65 | | | 1.21 | | | 0.87 | | | 0.40 - 0.80 | |
| Sustaining cash cost 1 | $/lb | | 2.73 | | | 1.87 | | | 2.25 | | | 2.07 | | | 1.35 - 2.05 | |
| All-in sustaining cash cost 1 | $/lb | | 2.98 | | | 1.93 | | | 2.50 | | | 2.23 | | | | |
1 Cash cost, sustaining cash cost, all-in sustaining cash cost per pound of copper produced, net of by-product credits, gold cash cost, sustaining cash cost per ounce of gold produced, net of by-product credits, and unit operating cost are non-IFRS financial performance measures with no standardized definition under IFRS. For further information and a detailed reconciliation, please see the discussion under the "Non-IFRS Financial Performance Measures" section of this MD&A.
2 Consolidated cash cost, sustaining cash cost and all-in sustaining cash cost per pound of copper produced, net of by-product credits, does not include Copper Mountain production or costs for the 10-day stub period at the end of the second quarter of 2023, nor the comparative periods.
RECENT DEVELOPMENTS
Completion of the Copper Mountain Acquisition
On June 20, 2023, Hudbay successfully completed its previously announced acquisition of Copper Mountain, pursuant to which Hudbay has acquired all of the issued and outstanding common shares of Copper Mountain (the "Copper Mountain Transaction").
As a result of the completion of the Copper Mountain Transaction, Copper Mountain became a wholly-owned subsidiary of Hudbay and Hudbay became the indirect owner of 75% of the Copper Mountain Mine Joint Venture.
In aggregate, Hudbay issued 84,165,617 Hudbay common shares under the Copper Mountain Transaction to former Copper Mountain shareholders as consideration for their Copper Mountain shares. The Copper Mountain shares were de-listed from the TSX on June 21, 2023 and an application has been submitted with the applicable Canadian securities commissions for Copper Mountain to cease to be a reporting issuer under Canadian securities laws.
In connection with the closing of the Copper Mountain Transaction, Hudbay appointed Jeane Hull and Paula Rogers, former directors of Copper Mountain, to the board of Hudbay.
The Copper Mountain Transaction creates a premier Americas-focused copper mining company that is well-positioned to deliver sustainable cash flows from an operating portfolio of three long-life mines, as well as compelling organic growth from a world-class pipeline of copper mine expansion and development projects. All assets in the combined portfolio are located in the tier-one mining-friendly jurisdictions of Canada, Peru and the United States. The combined company represents the third largest copper producer in Canada based on 2023 estimated copper production.
Integrating the Copper Mountain Mine
Copper Mountain integration activities are progressing in line with expectations and over 50% of the targeted annualized corporate and tax synergies have already been achieved to date. We are focused on advancing our plans to stabilize the operation over the next 12 months, including opening up the mine by adding additional mining faces and re-mobilizing idle haul trucks, optimizing the ore feed to the plant and implementing plant improvement initiatives. Further details on our plans will be provided in a technical report, including an updated mine plan, revised mineral reserve and resource estimates, and updated annual production and cost estimates for the Copper Mountain mine, which is expected to be released in the fourth quarter.
During the Copper Mountain Stub Period, the Copper Mountain mine produced 1,239 tonnes of copper, 745 ounces of gold and 11,918 ounces of silver. The first copper concentrate shipment following the acquisition date was completed on July 23, 2023 after a brief strike at the Port of Vancouver earlier in July.
As an additional prudent measure to ensure free cash flow generation in the second half of 2023 as Hudbay stabilizes the Copper Mountain operations, subsequent to quarter end, the Copper Mountain Mine Joint Venture entered into forward sales contracts for a total of 2,000 tonnes of copper production over the five-month period from August to December 2023 at an average price of $3.86 per pound.
Copper World Permitting and Pre-Feasibility Study Well-Advanced
In late 2022, Hudbay submitted the state-level applications for an Aquifer Protection Permit and an Air Quality Permit to the Arizona Department of Environmental Quality. We expect to receive these two outstanding state permits by early 2024.
In May 2023, we received a favourable ruling from the U.S. Court of Appeals for the Ninth Circuit that reversed the U.S. Fish and Wildlife Service's designation of the area near Copper World and the former Rosemont project as jaguar critical habitat. While this ruling doesn't impact the state permitting process for Phase I of Copper World, it is expected to simplify the federal permitting process for Phase II of the Copper World project.
Pre-feasibility activities for Phase I are well-advanced and a pre-feasibility study is expected to be released in the third quarter of 2023. We intend to initiate a minority joint venture partner process prior to commencing a definitive feasibility study, which will allow the potential joint venture partner to participate in the funding of definitive feasibility study activities in 2024 as well as in the final project design for Copper World.
Potential for Snow Lake Mine Life Extension with Discovery of New Mineralized Zones Near Lalor and Significant Regional Land Consolidation
In July 2023, the we announced positive results from our 2023 winter drill program near Lalor in Snow Lake, Manitoba, and significant land consolidation in the Snow Lake region through several strategic transactions. The agreements with multiple land holders will increase Hudbay's holdings in the Snow Lake region by more than 250%. We intend to explore these claims in hopes of finding a new anchor deposit to maximize and extend the life of our Snow Lake operations beyond 2038.
Lalor New Mineralized Zones
Our 2023 winter drill program in Snow Lake included the testing of a geophysical anomaly located northwest of Lalor, within 500 metres of existing underground infrastructure. All holes intersected an alteration zone that is known to host the Lalor mineralization. Certain holes intersected several sulphide horizons with both zinc and copper-gold-silver mineralization. Hole CH2303 intersected three mineralized zones, including 7.0 metres of 3.06% zinc and 15.1 grams per tonne silver; 3.5 metres of 3.81% copper, 3.75 grams per tonne gold and 104.5 grams per tonne silver; and 7.5 metres of 3.87% zinc and 7.5 grams per tonne silver. For more information on the drill holes, please refer to Hudbay's news release dated July 27, 2023.
The winter drill program also included testing of the down-plunge copper-gold extensions of the Lalor deposit, in the first drilling in the deeper zones at Lalor since the initial discovery of the copper-gold zones in 2009 and 2010. This initial campaign consisted of eight widely spaced drill holes over a distance of two kilometres, and all holes intersected the zone of strong alteration known to host the Lalor mineralization and have shown many occurrences of disseminated copper sulfides indicating the potential close proximity of one or more higher grade copper-gold feeder zones similar to Lens 27 currently in production at Lalor. These initial results from widely spaced drilling are an encouraging indication that the rocks hosting the rich copper-gold mineralization at Lalor continue down-plunge as predicted by Hudbay's geological models.
We expect to refine targets for our 2024 winter drilling campaign to the northwest and down-plunge from Lalor using the results from geophysical borehole surveys.
Acquisition of Cook Lake Properties in Snow Lake
In late June 2023, Hudbay completed the acquisition of the Cook Lake properties from Glencore plc. The Cook Lake properties are located within ten kilometres and along the same regional trend as our Lalor mine, and have the potential to host a new discovery at depth. The properties include the Cook Lake North and South properties, which are within 30 kilometres of Hudbay's Stall and New Britannia processing facilities.
Hudbay has received data regarding approximately 60,000 metres of historical drilling that was competed on the Cook Lake properties between 1971 and 2012, with an average depth of only 275 metres, which is a fraction of the depth of Lalor's current known mineralization of approximately 600 to 1,500 metres. The historical drill holes appear to have intersected base metal and copper-gold mineralization typical to the Snow Lake region. Although the historical data has not been validated by a qualified person, the mineralization indicates that there is the potential for new deposits on the same favourable mineralized horizons as many known deposits in the area, including the Lalor, 1901 and Chisel deposits. The Cook Lake properties are untested by modern deep geophysics, which was the discovery method for the Lalor mine.
Acquisition of Rockcliff to Consolidate Significant Land Package in Snow Lake
On June 19, 2023, Hudbay entered into a definitive agreement to acquire 100% of the issued and outstanding common shares of Rockcliff that we do not already own (the "Rockcliff Transaction"). Under the Rockcliff Transaction, Rockcliff shareholders will receive 0.006776 of a Hudbay common share for each Rockcliff common share held. The enterprise value to Hudbay, net of Rockcliff's cash, is approximately $13 million.
Rockcliff is one of the largest landholders in the Snow Lake area with more than 1,800 square kilometres across all of its properties. The completion of the Rockcliff Transaction will consolidate Hudbay's ownership of the Talbot deposit and provide us with additional exploration properties in the vicinity of our Stall and New Britannia mills, including the land adjacent to Hudbay's Pen II deposit, which is a low tonnage and high-grade zinc deposit that starts from surface and is located approximately six kilometres by road from the Lalor mine.
Completion of the Rockcliff Transaction is contingent upon court approval from the Ontario Superior Court of Justice (Commercial List), shareholder approval of at least two-thirds of the votes cast by Rockcliff shareholders at a special meeting scheduled to be held on August 31, 2023 and other customary conditions and stock exchange approvals. The Rockcliff Transaction is expected to close in the third quarter of 2023.
Advancing Metallurgical Testwork for the Flin Flon Tailings Reprocessing Opportunity
In 2021, Hudbay identified the opportunity to reprocess Flin Flon tailings where in excess of 100 million tonnes of tailings have been deposited for over 90 years. The company completed confirmatory drilling in 2022 which covered about two-thirds of the facility. The results indicated higher zinc, copper and silver grades than predicted from historical mill records while confirming the historical gold grade. Hudbay is completing metallurgical test work and evaluating metallurgical technologies, including the recent signing of a testwork agreement with Cobalt Blue Holdings Limited ("Cobalt Blue") to assess the processing viability of the Flin Flon tailings using Cobalt Blue's proprietary processing technology that recovers copper, zinc, gold and silver while converting sulphides into stable and benign sulphur.
Other Exploration Update
Constancia In-Mine Exploration
Hudbay continues to execute a limited drill program and technical evaluations at the Constancia deposit to confirm the economic viability of adding an additional mining phase to the current mine plan that would convert a portion of the mineral resources to mineral reserves. The results from this drill program and technical and economic evaluations are expected to be incorporated in the next annual mineral reserve and resource update.
Maria Reyna and Caballito Exploration
Hudbay controls a large, contiguous block of mineral rights with the potential to host satellite mineral deposits in close proximity to the Constancia processing facility, including the past producing Caballito property and the highly prospective Maria Reyna property. We commenced early exploration activities at Maria Reyna and Caballito after completing a surface rights exploration agreement with the community of Uchucarcco in August 2022. Surface investigation activities together with baseline environmental and archaeological activities necessary to support drill permit applications have been completed. Surface mapping and geochemical sampling confirm that both Caballito and Maria Reyna host sulfide and oxide rich copper mineralization in skarns, hydrothermal breccias and large porphyry intrusive bodies.
Lalor In-Mine Exploration
Hudbay continues to compile results from ongoing infill drilling at Lalor, which will be incorporated into the next annual mineral resource and reserve estimate update.
Flin Flon Exploration Partnership with Marubeni
On July 6, 2023 we announced the signing of a memorandum of understanding ("MOU") with Marubeni Corporation ("Marubeni") that establishes the framework for a multi-year exploration partnership focused on the discovery of new deposits on Hudbay's mineral properties within trucking distance of our processing facilities in Flin Flon, Manitoba. In connection with the MOU, Hudbay and Marubeni have agreed to negotiate the terms of a definitive agreement to govern the relationship between the parties and the Flin Flon properties that would form the subject of the exploration partnership (the "Project Properties"). It is currently contemplated that Marubeni would fund approximately $10 to $15 million of exploration expenditures on the Project Properties and that Hudbay will act as operator and carry out the exploration activities.
Dividend Declared
A semi-annual dividend of C$0.01 per share was declared on August 8, 2023. The dividend will be paid out on September 22, 2023 to shareholders of record as of September 1, 2023.
PERU OPERATIONS REVIEW
| | | | Three months ended | | | Six months ended | |
| | | | Jun. 30,
2023 | | | Jun. 30,
2022 | | | Jun. 30,
2023 | | | Jun. 30,
2022 | |
| Constancia ore mined1 | tonnes | | 3,647,399 | | | 7,017,114 | | | 7,050,580 | | | 13,925,265 | |
| Copper | % | | 0.31 | | | 0.33 | | | 0.33 | | | 0.32 | |
| Gold | g/tonne | | 0.04 | | | 0.04 | | | 0.04 | | | 0.04 | |
| Silver | g/tonne | | 2.49 | | | 3.53 | | | 2.50 | | | 3.37 | |
| Molybdenum | % | | 0.01 | | | 0.01 | | | 0.01 | | | 0.01 | |
| Pampacancha ore mined1 | tonnes | | 2,408,495 | | | 1,211,387 | | | 3,305,790 | | | 2,058,693 | |
| Copper | % | | 0.36 | | | 0.29 | | | 0.39 | | | 0.28 | |
| Gold | g/tonne | | 0.34 | | | 0.28 | | | 0.39 | | | 0.35 | |
| Silver | g/tonne | | 2.81 | | | 4.25 | | | 3.44 | | | 4.17 | |
| Molybdenum | % | | 0.02 | | | 0.01 | | | 0.01 | | | 0.01 | |
| Total ore mined | tonnes | | 6,055,894 | | | 8,228,501 | | | 10,356,370 | | | 15,983,958 | |
| Strip ratio2 | | | 1.74 | | | 1.22 | | | 1.78 | | | 1.16 | |
| Ore milled | tonnes | | 7,223,048 | | | 7,770,706 | | | 14,886,776 | | | 14,984,539 | |
| Copper | % | | 0.31 | | | 0.32 | | | 0.32 | | | 0.31 | |
| Gold | g/tonne | | 0.09 | | | 0.09 | | | 0.09 | | | 0.09 | |
| Silver | g/tonne | | 2.78 | | | 3.64 | | | 3.25 | | | 3.46 | |
| Molybdenum | % | | 0.01 | | | 0.01 | | | 0.01 | | | 0.01 | |
| Copper concentrate | tonnes | | 82,796 | | | 93,122 | | | 178,244 | | | 174,730 | |
| Concentrate grade | % Cu | | 21.36 | | | 22.42 | | | 21.43 | | | 22.92 | |
| Copper recovery | % | | 80.0 | | | 85.0 | | | 80.9 | | | 85.2 | |
| Gold recovery | % | | 61.1 | | | 60.3 | | | 59.0 | | | 60.1 | |
| Silver recovery | % | | 65.1 | | | 64.2 | | | 62.5 | | | 65.4 | |
| Molybdenum recovery | % | | 40.5 | | | 38.8 | | | 40.5 | | | 30.1 | |
| Combined unit operating costs3,4,5 | $/tonne | | 14.07 | | | 12.02 | | | 12.73 | | | 12.19 | |
1 Reported tonnes and grade for ore mined are estimates based on mine plan assumptions and may not reconcile fully to ore milled.
2 Strip ratio is calculated as waste mined divided by ore mined.
3 Reflects combined mine, mill and general and administrative ("G&A") costs per tonne of ore milled. Reflects the deduction of expected capitalized stripping costs.
4 Combined unit costs is a non-IFRS financial performance measure with no standardized definition under IFRS. For further information and a detailed reconciliation, please see the discussion under the "Non-IFRS Financial Performance Measures" section of this MD&A.
5 Excludes approximately $1.3 million or $0.16 per tonne, and $3.6 million or $0.24 per tonne, of COVID-19 related costs during the three and six months ended June 30, 2022.
Total ore mined in the second quarter of 2023 decreased by 26% compared to the same period in 2022 mainly due to the completion of a higher stripping period at the Pampacancha pit in June, in line with our mine plan to access high grade ore phases later in 2023, and the planned processing of a significant amount of ore from stockpiles during the second quarter of 2023.
Ore milled during the second quarter of 2023 was 7% lower than the same period in 2022 mainly due to a scheduled plant maintenance shutdown in the second quarter of 2023 without a corresponding shutdown in the comparative period. Milled copper grades decreased by 3% in the second quarter of 2023 compared to the same period in 2022 due to lower-grade ore from stockpiles partially offset by increased mining of higher-grade copper ore from Pampacancha.
Recoveries of copper during the second quarter of 2023 were 6% lower while the recoveries for gold and silver were both 1% higher than the comparative 2022 period. Recoveries of copper decreased in the second quarter of 2023, as expected, due to higher levels of impurities in stockpile ore.
Year-to-date ore mined was 35% lower than the same period in 2022 due to the same factors as the quarterly variance as well as increased stockpile processing in order to ration fuel during the protests and civil unrest experienced in Peru in early 2023. Recoveries of copper, gold and silver in the first half of 2023 were 5%, 2% and 4% lower than the same period in 2022 due to higher levels of impurities in stockpile ore.
Combined mine, mill and G&A unit operating costs in the second quarter of 2023 were 17% higher primarily due to higher costs related to the scheduled mill maintenance program and lower milled ore throughput during the quarter.
Contained metal in
concentrate produced | | Three months ended | | | Six months ended | | | Guidance | |
| | Jun. 30, 2023 | | | Jun. 30, 2022 | | | Jun. 30, 2023 | | | Jun. 30, 2022 | | | Annual | |
| | 2023 | |
| Copper | tonnes | | 17,682 | | | 20,880 | | | 38,200 | | | 40,046 | | | 91,000 - 116,000 | |
| Gold | oz | | 12,998 | | | 13,858 | | | 24,204 | | | 24,647 | | | 83,000 - 108,000 | |
| Silver | oz | | 419,642 | | | 584,228 | | | 971,809 | | | 1,089,796 | | | 2,210,000 - 2,650,000 | |
| Molybdenum | tonnes | | 414 | | | 390 | | | 703 | | | 596 | | | 1,300 - 1,600 | |
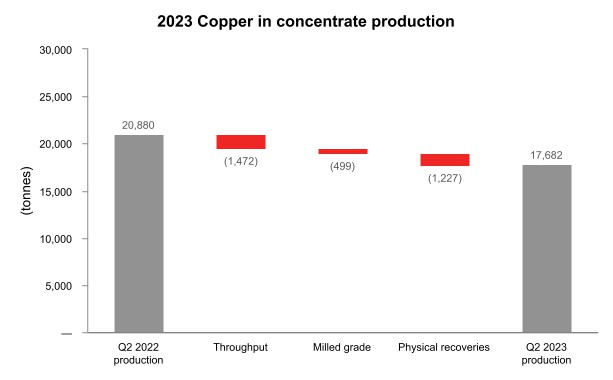
Second quarter 2023 production of copper, gold and silver was 15%, 6% and 28% lower, respectively, than the comparative period in 2022 due to lower throughput and lower copper and silver grades. Production of molybdenum in the second quarter of 2023 was 6% higher than the comparative prior year period due to higher grades and recoveries.
Year-to-date 2023 production of copper, gold and silver was 5%, 2% and 11% lower, respectively, than the comparative period in 2023, while the production of molybdenum was 18% higher over the same timeframe. Year to date 2023 production declines were mainly related to lower recoveries from processing stockpile ore with higher contaminants.
With the period of higher planned stripping activities in the Pampacancha pit completed in June and ore mined from Pampacancha in July totaling 1.6 million tonnes at 0.63% copper and 0.31 grams per tonne gold, we are well on track to achieve the higher expected production in the second half of the year, in line with our full year 2023 Peru production guidance.

Peru Cash Cost and Sustaining Cash Cost
| | | Three months ended | | | Six months ended | | | Guidance | |
| | Jun. 30, 2023 | | | Jun. 30, 2022 | | | Jun. 30, 2023 | | | Jun. 30, 2022 | | | Annual
2023 | |
| Cash cost per pound of copper produced, net of by-product credits1 | $/lb | | 2.14 | | | 1.82 | | | 1.72 | | | 1.69 | | | 1.05 - 1.30 | |
| Sustaining cash cost per pound of copper produced, net of by-product credits1 | $/lb | | 3.06 | | | 2.62 | | | 2.56 | | | 2.45 | | | | |
1 Cash cost and sustaining cash costs per pound of copper produced, net of by-product credits, are not recognized under IFRS. For more detail on these non-IFRS financial performance measures, please see the discussion under the "Non-IFRS Financial Performance Measures" section of this MD&A.
Cash cost per pound of copper produced, net of by-product credits, in the second quarter of 2023 was $2.14, an increase of 18% compared to the same period in 2022 due to fewer pounds of copper produced, higher milling costs related to the scheduled mill maintenance program and higher treatment and refining charges, partially offset by higher by-product credits and higher capitalized stripping. This cost measure remains above the upper end of our 2023 guidance range. However, it is expected to decline meaningfully in the second half of 2023 and the full year cash cost is expected to remain within the 2023 guidance range with higher expected copper production and contributions from precious metal by-product credits from Pampacancha later this year.
Cash cost per pound of copper produced, net of by-product credits, for the first half of 2023 was $1.72, an increase of 2% compared to the same period in 2022 due to fewer pounds of copper produced, as well as higher milling, treatment and refining charges and freight costs, partially offset by higher by-product credits.
Sustaining cash cost per pound of copper produced, net of by-product credits, for the second quarter and for the first half of 2023 were 17% and 4% higher, respectively, than the comparative 2022 periods primarily due to the same factors affecting cash cost noted above, partially offset by lower sustaining capital expenditures.
Metal Sold
| | | Three months ended | | | Six months ended | |
| | Jun. 30, 2023 | | | Jun. 30, 2022 | | | Jun. 30, 2023 | | | Jun. 30, 2022 | |
| Payable metal in concentrate | | | | | | | | | | | | |
| Copper | tonnes | | 21,207 | | | 18,473 | | | 37,523 | | | 35,298 | |
| Gold | oz | | 14,524 | | | 8,430 | | | 26,305 | | | 22,882 | |
| Silver | oz | | 671,532 | | | 484,946 | | | 1,063,739 | | | 1,121,079 | |
| Molybdenum | tonnes | | 314 | | | 208 | | | 568 | | | 421 | |
Peru's copper, gold and silver sales in the second quarter of 2023 were positively impacted by higher-than-normal unsold copper concentrate inventory levels at the end of the first quarter that were subsequently sold during the second quarter of 2023. Furthermore, payable gold and silver sales during the second quarter of 2023 were 72% and 38% higher, respectively, than the corresponding period in 2022 due to a precious metal stream sale that was recognized in revenue shortly after the first quarter cutoff date. Payable gold and silver included in this sale was approximately 4.5 thousand ounces of gold and 341 thousand ounces of silver.
MANITOBA OPERATIONS REVIEW
| | | Three months ended | | | Six months ended | |
| | Jun. 30, 2023 | | | Jun. 30, 20221 | | | Jun. 30, 2023 | | | Jun. 30, 20221 | |
| Lalor ore mined | tonnes | | 413,255 | | | 412,653 | | | 786,854 | | | 799,405 | |
| Gold | g/tonne | | 4.07 | | | 3.73 | | | 4.02 | | | 3.74 | |
| Copper | % | | 0.81 | | | 0.70 | | | 0.69 | | | 0.75 | |
| Zinc | % | | 3.14 | | | 3.06 | | | 3.23 | | | 3.54 | |
| Silver | g/tonne | | 23.27 | | | 23.95 | | | 20.88 | | | 23.46 | |
| New Britannia ore milled | tonnes | | 141,905 | | | 144,589 | | | 284,947 | | | 268,765 | |
| Gold | g/tonne | | 5.82 | | | 5.69 | | | 5.94 | | | 5.66 | |
| Copper | % | | 0.77 | | | 0.73 | | | 0.69 | | | 0.79 | |
| Zinc | % | | 0.85 | | | 0.94 | | | 0.80 | | | 0.90 | |
| Silver | g/tonne | | 25.79 | | | 19.77 | | | 24.08 | | | 20.81 | |
| Copper concentrate | tonnes | | 6,128 | | | 7,307 | | | 11,684 | | | 14,259 | |
| Concentrate grade | % Cu | | 16.20 | | | 13.37 | | | 15.29 | | | 13.53 | |
| Copper recovery - concentrate | % | | 91.2 | | | 92.4 | | | 91.4 | | | 90.8 | |
| Gold recovery - concentrate | % | | 55.0 | | | 62.7 | | | 58.6 | | | 62.1 | |
| Silver recovery - concentrate | % | | 57.0 | | | 62.9 | | | 59.3 | | | 63.1 | |
| Contained metal in concentrate produced | | | | | | | | | | |
| Gold | oz | | 14,614 | | | 16,571 | | | 31,849 | | | 30,391 | |
| Copper | tonnes | | 992 | | | 977 | | | 1,786 | | | 1,930 | |
| Silver | oz | | 67,134 | | | 57,772 | | | 130,903 | | | 113,529 | |
| Metal in doré produced2 | | | | | | | | | | |
| Gold | oz | | 6,305 | | | 7,441 | | | 11,692 | | | 13,721 | |
| Silver | oz | | 11,231 | | | 15,974 | | | 22,809 | | | 26,020 | |
| Stall ore milled | tonnes | | 238,633 | | | 261,417 | | | 481,252 | | | 534,542 | |
| Gold | g/tonne | | 3.12 | | | 2.95 | | | 2.95 | | | 3.01 | |
| Copper | % | | 0.85 | | | 0.73 | | | 0.72 | | | 0.77 | |
| Zinc | % | | 4.47 | | | 4.45 | | | 4.64 | | | 5.13 | |
| Silver | g/tonne | | 22.15 | | | 26.31 | | | 19.62 | | | 24.96 | |
| Copper concentrate | tonnes | | 8,281 | | | 8,077 | | | 14,926 | | | 17,405 | |
| Concentrate grade | % Cu | | 21.76 | | | 20.78 | | | 20.46 | | | 20.64 | |
| Zinc concentrate | tonnes | | 16,417 | | | 19,189 | | | 35,615 | | | 45,658 | |
| Concentrate grade | % Zn | | 53.35 | | | 51.08 | | | 52.24 | | | 51.07 | |
| Copper recovery | % | | 88.5 | | | 88.0 | | | 87.9 | | | 87.3 | |
| Zinc recovery | % | | 82.2 | | | 84.3 | | | 83.3 | | | 85.1 | |
| Gold recovery | % | | 59.9 | | | 54.6 | | | 60.9 | | | 55.2 | |
| Silver recovery | % | | 60.3 | | | 56.1 | | | 58.5 | | | 57.3 | |
| Contained metal in concentrate produced | | | | | | | | | | |
| Gold | oz | | 14,334 | | | 13,542 | | | 27,746 | | | 28,604 | |
| Copper | tonnes | | 1,802 | | | 1,679 | | | 3,053 | | | 3,593 | |
| Zinc | tonnes | | 8,758 | | | 9,803 | | | 18,604 | | | 23,319 | |
| Silver | oz | | 102,385 | | | 124,014 | | | 177,680 | | | 245,902 | |
1 The 777 mine and Flin Flon concentrator information is not disclosed in the table above. The relevant comparative information can be found on page 59 in the Summary of Historical Results section in this MD&A.
2 Doré includes sludge, slag and carbon fines in three and six months ended June 30, 2023.
| Unit Operating Costs1 | | Three months ended | | | Six months ended | |
| | Jun. 30,
2023 | | | Jun. 30,
20224 | | | Jun. 30,
2023 | | | Jun. 30,
20224 | |
| Lalor | C$/tonne | | 135.45 | | | 129.74 | | | 135.99 | | | 128.14 | |
| New Britannia | C$/tonne | | 84.18 | | | 80.00 | | | 83.08 | | | 86.37 | |
| Stall | C$/tonne | | 35.44 | | | 32.56 | | | 34.88 | | | 31.36 | |
| Combined mine/mill unit operating costs2,3 | | | | | | | | | | | | |
| Manitoba | C$/tonne | | 220 | | | 168 5 | | | 218 | | | 1725 | |
1 Reflects costs per tonne of ore mined/milled.
2 Reflects combined mine, mill and G&A costs per tonne of milled ore.
3 Combined unit costs is a non-IFRS financial performance measure with no standardized definition under IFRS. For further information and a detailed reconciliation, please see the discussion under the "Non-IFRS Financial Performance Measures" section of this MD&A.
4 The Flin Flon concentrator was decommissioned in Q3 2022. The relevant comparative information can be found on page 59 in the Summary of Historical Results in this MD&A.
5 Combined mine/mill unit operating costs shown for Q2 2022 included the Flin Flon operations and are not directly comparable to the current costs with only Snow Lake operations.
During the second quarter of 2023, the Manitoba team continued to advance several key initiatives to support higher production levels and improved metal recoveries at our Snow Lake operations. Significant progress has been made at Lalor in optimizing the development drift size, improving shaft availability and implementing changes to achieve better stope muck fragmentation, which enabled the elimination of inefficient trucking of ore to surface via the ramp late in the second quarter. The first phase of the Stall mill recovery improvement project, consisting of new cyclone packs, state-of-the-art Jameson Cells on the copper and zinc circuits and process control improvements, was completed during the second quarter. Commissioning of the circuits quickly achieved targeted copper and zinc concentrate grades, while gold recovery improvements progressed slower than planned. Changes to optimize the circuit are underway and we expect to achieve higher gold recoveries in the second half of 2023. We also implemented tailings deposition improvements that have enabled us to maximize the Anderson facility tailings capacity and defer incremental dam construction activities to future years.
We successfully completed planned maintenance of the muck circuit, rock breaker boom change out and repairs and electrical installations at Lalor during the second quarter. Despite this planned maintenance program, ore mined from Lalor increased by 11% in the second quarter compared to the first quarter, averaging over 4,500 tonnes per day. Lalor continues to implement improvements to reduce costs and target higher production levels with a focus on equipment fleet availability and building of longhole inventory.
Total ore mined at our Manitoba operations during the second quarter of 2023 was 35% lower than the same period in 2022 mainly due to the planned closure of 777 in June 2022 which resulted in a significant decline in ore mined in the second quarter compared to the prior year period, which benefited from the full contribution of 777 mine production. Excluding 777 production, copper, gold and zinc grades mined during the second quarter of 2023 were 16%, 9% and 3% higher than the same period in 2022, respectively, while silver grades were 3% lower, compared to the same period in 2022, consistent with the mine plan.
Total ore mined at our Manitoba operations during the first half of 2023 was 39% lower than the same period in 2022 mainly due to the planned closure of 777 in June 2022 as noted above. Excluding 777 production, Lalor mined ore in the first half of 2023 was 2% lower than the same period in 2022. Gold grades mined during the first half of 2023 were 7% higher than the same period in 2022. Copper, zinc and silver grades mined at Lalor during the first half of 2023 were 8%, 9% and 11% lower, respectively, compared to the same period in 2022, consistent with the mine plan.
Total mine unit operating costs during the second quarter of 2023 increased by 4% compared to the same period in 2022.
Stall mill processed 9% less ore in the second quarter of 2023 compared to the same period in 2022, in line with expectations, due to completion of the Phase I recovery improvement project during the quarter and the commissioning of new Jameson cells requiring associated tie-ins of piping, pump boxes and electrical instrumentation. The project was completed on schedule and within budget and has already yielded expected results with copper and zinc concentrates grades achieving target levels. Improvements in gold recovery is progressing slower than planned and changes are being made to optimize the circuit. As a result of the temporary interruptions introduced by the project tie-ins, there was a buildup of approximately 30,000 tonnes of base metal ore stockpiles above normal levels at the end of second quarter that will be milled during the second half of 2023. Compared to the same period in 2022, unit operating costs at the Stall mill were 9% higher during the second quarter of 2022 due to lower throughput.
New Britannia mill continued to achieve consistent production in the second quarter of 2023, averaging approximately 1,560 tonnes per day. We continue to advance improvement initiatives at New Britannia requiring minimal capital outlays with a focus on reducing reagent and grinding media consumption while further improving overall metal recoveries and copper concentrate grades. There was a buildup of approximately 15,000 tonnes of gold ore stockpiles above normal levels at the end of the second quarter, which will be milled during the second half of 2023. New Britannia unit operating costs increased by 5% during the second quarter of 2023 versus the same period of 2022, primarily due to slightly lower throughput.
Combined mine, mill and G&A unit operating costs in the second quarter of 2023 increased by 31%, compared to the same period in 2022 reflecting inflationary cost pressures on materials and consumables, lower mill throughput due, in part, to the 45,000 tonnes of additional ore stockpiled above normal operating levels at the end of the second quarter, and the standalone cost structure of Lalor compared to the same period in 2022, which included operating costs for both Lalor and the lower cost 777 mine. Combined mine, mill and G&A unit operating costs in the first half of 2023 increased by 27% compared to the same period in 2022 due to the same reasons mentioned above.
The zinc plant in Flin Flon permanently ceased operations in June 2022 with no production in the second quarter of 2023. Closure activities commenced in the third quarter of 2022 and continue to progress safely during 2023.
| | | | Three months ended | | | Six months ended | | | Guidance | |
Contained metal in concentrate
and doré produced1 | | Jun. 30,
2023 | | | Jun. 30,
2022 | | | Jun. 30,
2023 | | | Jun. 30,
2022 | | | Annual | |
| | 2023 | |
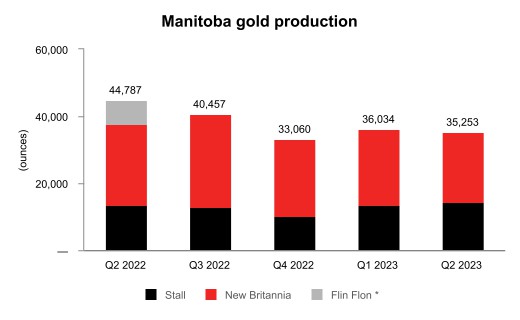
| Gold2 | oz | | 35,253 | | | 44,787 | | | 71,287 | | | 87,954 | | | 175,000 - 205,000 | |
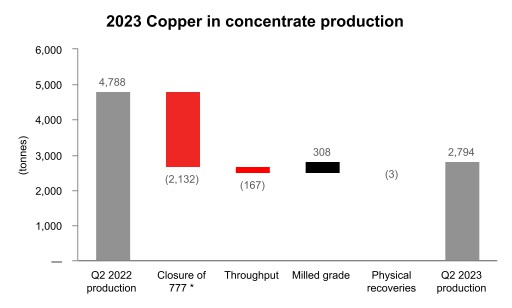
| Copper | tonnes | | 2,794 | | | 4,788 | | | 4,839 | | | 10,324 | | | 9,000 - 12,000 | |
| Zinc | tonnes | | 8,758 | | | 17,053 | | | 18,604 | | | 39,305 | | | 28,000 - 36,000 | |
| Silver3 | oz | | 180,750 | | | 280,625 | | | 331,392 | | | 559,414 | | | 750,000 - 1,000,000 | |
1 Metal reported in concentrate is prior to deductions associated with smelter terms.
2 Gold production guidance includes gold contained in concentrate produced and gold in doré.
3 Silver production guidance includes silver contained in concentrate produced and silver in doré.
Metal production during the second quarter of 2023 was lower than the comparative 2022 period due to lower volumes from the closure of 777 mine in June 2022, partially offset by higher copper, gold and zinc grades at Lalor. Manitoba's production of copper, gold, silver and zinc in the second quarter of 2023 was lower by 42%, 21%, 36% and 49%, respectively, than the comparative 2022 period for the reasons outlined above. Production of copper, gold, silver and zinc in the first half of 2023 was lower by 53%, 19%, 41% and 53%, respectively, than the comparative 2022 period mainly due to lower volumes from the closure of 777 mine in June 2022 and lower comparative base metal and silver grades.
With the completion of a number of key initiatives aimed to continue to support higher production levels at Lalor, improved metal recoveries at the mills and a prioritization of mining higher gold grade zones at Lalor in the second half of 2023, as planned, full year Manitoba production of all metals remains on track to achieve guidance ranges. However, with the slower ramp-up of gold recoveries associated with the Stall Phase 1 recovery improvement project in the second quarter, gold production is trending towards the lower end of the 2023 guidance range for Manitoba, while copper and zinc production is trending towards upper end of guidance ranges.
* Mining activities at 777 were completed in June 2022
* Mining activities at 777 were completed in June 2022
Manitoba Cash Cost and Sustaining Cash Cost
| | | Three months ended | | | Six months ended | | | Guidance | |
| | | | | | | | | | | | | | Annual | |
| | Jun. 30,
2023 | | | Jun. 30,
2022 | | | Jun. 30,
2023 | | | Jun. 30,
2022 | | | 2023 | |
| Cost per pound of gold produced | | | | | | | | | | | | | | | |
| Cash cost per ounce of gold produced, net of by-product credits 1 | $/oz | | 1,097 | | | (207 | ) | | 1,017 | | | 99 | | | 500 - 800 | |
| Sustaining cash cost per ounce of gold produced, net of by-product credits 1 | $/oz | | 1,521 | | | 519 | | | 1,427 | | | 847 | | | | |
1 Cash cost and sustaining cash cost per ounce of gold produced, net of by-product credits, are not recognized under IFRS. For more detail on this non-IFRS financial performance measure, please see the discussion under the "Non-IFRS Financial Performance Measures" section of this MD&A.
Cash cost per ounce of gold produced, net of by-product credits, in the second quarter of 2023 increased to $1,097 from the comparative 2022 period, primarily due to lower gold production given the lower throughput at Stall mill, significantly lower by-product credits and higher treatment and refining charges. This was partially offset by lower mining, milling, G&A, freight costs and the elimination of zinc refining costs due to the closure of 777 mine and the zinc plant in June 2022.
Cash cost per ounce of gold produced, net of by-product credits in the second quarter of 2023 was 37% above the upper end of our 2023 guidance range; however, it was significantly impacted by lower by-product credits, in accordance with the mine plan, and the buildup of surface ore stockpiles in front of the Stall and New Britannia mills. We expect this cost measure to decline meaningfully during the remainder of 2023 with increasing gold production from higher grade stopes, continued throughput increases at Lalor and the full realization of higher recoveries from the Stall mill Phase I recovery improvement project enabling full year cash costs to remain within the 2023 guidance range.
Sustaining cash cost per ounce of gold produced, net of by-product credits, for the second quarter of 2023 was $1,521, an increase of 193% from the comparative 2022 period primarily due to the same factors affecting cash cost noted above, partially offset by lower sustaining capital expenditures.
Cash cost per ounce of gold produced, net of by-product credits, in the first half of 2023 was $1,017. These costs were higher compared to the same period in 2022 primarily due to the same factors affecting second quarter 2023 cash cost noted above. Sustaining cash cost per ounce of gold produced, net of by-product credits, for the first half of 2023 was $1,427, an increase of 69% from the comparative 2022 period primarily due to the same factors affecting cash cost noted above, partially offset by lower sustaining capital expenditures.
Metal Sold
| | | Three months ended | | | Six months ended | |
| | Jun. 30,
2023 | | | Jun. 30,
2022 | | | Jun. 30,
2023 | | | Jun. 30,
2022 | |
| Payable metal in concentrate and doré | | | | | | | | | | | | | |
| Gold | oz | | 33,009 | | | 42,454 | | | 70,949 | | | 76,345 | |
| Copper | tonnes | | 1,871 | | | 5,177 | | | 4,096 | | | 8,961 | |
| Zinc 1 | tonnes | | 8,641 | | | 20,793 | | | 14,269 | | | 38,099 | |
| Silver | oz | | 133,916 | | | 253,225 | | | 283,595 | | | 481,684 | |
1 Includes refined zinc metal and payable zinc in concentrate sold.
Quantities of payable metal sold for the three and six months ended June 30, 2023 were lower than the comparable periods in 2022 primarily due to the same factors impacting contained metal production, as noted above.
FINANCIAL REVIEW
Our financial results presented within this "Financial Review" section have been largely unaffected by Copper Mountain's operations with no revenues or corresponding cost of sales recorded during the 10-day stub period from the date of acquisition to the end of the second quarter.
Financial Results
In the second quarter of 2023, we recorded a net loss of $14.9 million compared to a net profit of $32.1 million in the second quarter of 2022, representing a reduction in profit of $47.1 million. Year-to-date in 2023, we recorded a net loss of $9.5 million compared to a net profit of $95.9 million for the same period in 2022, representing a decrease in profit of $105.4 million
The following table provides further details on these variances:
| (in $ millions) | | Three months ended
June 30, 2023 | | | Six months ended
June 30, 2023 | |
| Reduction in components of profit or loss: | | | | | | |
| Revenues | | (103.3 | ) | | (186.7 | ) |
| Cost of sales | | | | | | |
| Mine operating costs | | 38.0 | | | 89.0 | |
| Depreciation and amortization | | (1.4 | ) | | 12.3 | |
| Selling and administrative expenses | | (7.0 | ) | | (4.4 | ) |
| Exploration expenses | | 3.7 | | | 14.1 | |
| Re-evaluation adjustment - environmental obligation | | (56.0 | ) | | (127.6 | ) |
| Other expenses | | (15.2 | ) | | (11.1 | ) |
| Impairment loss | | 95.0 | | | 95.0 | |
| Net finance expense | | (6.1 | ) | | (4.3 | ) |
| Tax expense | | 5.2 | | | 18.3 | |
| Reduction in profit for the period | | (47.1 | ) | | (105.4 | ) |
Revenue
Revenue for the second quarter of 2023 was $312.2 million, $103.3 million lower than the same period in 2022, primarily as a result of lower copper and zinc metal prices, lower copper, zinc and gold sales volumes and higher treatment and refining charges. Copper and zinc sales volumes were significantly lower than prior year due to the planned closure of the 777 mine in Manitoba in June 2022 contributing to higher production and sales in the comparative period.
Revenue for the first half of 2023 was $607.4 million, $186.7 million lower than the same period in 2022, mainly due to the same factors affecting the quarter-to-date variances described above partially offset by higher molybdenum prices.
The following table provides further details on these variances:
| (in $ millions) | | Three months ended
June 30, 2023 | | | Six months ended
June 30, 2023 | |
| | | | | | | |
| Metals prices1 | | | | | | |
| Lower copper prices | | (19.9 | ) | | (42.8 | ) |
| Lower zinc prices | | (15.1 | ) | | (19.2 | ) |
| Higher gold prices | | 0.7 | | | 7.5 | |
| Lower silver prices | | (2.3 | ) | | (1.5 | ) |
| Sales volumes | | | | | | |
| Lower copper sales volumes | | (5.4 | ) | | (25.5 | ) |
| Lower zinc sales volumes | | (52.0 | ) | | (97.7 | ) |
| Lower gold sales volumes | | (6.0 | ) | | (3.5 | ) |
| Higher (lower) silver sales volumes | | 1.6 | | | (5.8 | ) |
| Other | | | | | | |
| Change in derivative mark-to-market on zinc | | 0.5 | | | 0.4 | |
| Change in derivative mark-to-market on copper | | 4.5 | | | 4.5 | |
| Molybdenum and other volume and pricing differences | | 1.8 | | | 13.3 | |
| Variable consideration adjustments | | - | | | 1.7 | |
| Effect of higher treatment and refining charges | | (11.7 | ) | | (18.1 | ) |
| Decrease in revenue in 2023 compared to 2022 | | (103.3 | ) | | (186.7 | ) |
1 See discussion below for further information regarding metals prices.
Our revenue by significant product type is summarized below:
| | | Three months ended | | | Six months ended | |
| (in $ millions) | | Jun. 30, 2023 | | | Jun. 30, 2022 | | | Jun. 30, 2023 | | | Jun. 30, 2022 | |
| Copper | | 205.8 | | | 230.8 | | | 370.0 | | | 439.7 | |
| Zinc | | 20.3 | | | 88.7 | | | 40.1 | | | 155.2 | |
| Gold | | 75.9 | | | 90.3 | | | 150.8 | | | 157.9 | |
| Silver | | 7.2 | | | 8.9 | | | 13.5 | | | 15.5 | |
| Molybdenum | | 16.8 | | | 9.0 | | | 35.8 | | | 18.2 | |
| Other metals | | - | | | 2.0 | | | 0.2 | | | 4.4 | |
| Revenue from contracts | | 326.0 | | | 429.7 | | | 610.4 | | | 790.9 | |
| Amortization of deferred revenue - gold | | 7.9 | | | 10.0 | | | 13.3 | | | 23.2 | |
| Amortization of deferred revenue - silver | | 10.3 | | | 9.2 | | | 15.9 | | | 21.0 | |
| Amortization of deferred revenue - variable consideration adjustments - prior periods | | - | | | - | | | 4.9 | | | 3.2 | |
| Pricing and volume adjustments1 | | (5.3 | ) | | (18.4 | ) | | 8.1 | | | (17.1 | ) |
| Treatment and refining charges | | (26.7 | ) | | (15.0 | ) | | (45.2 | ) | | (27.1 | ) |
| Revenue | | 312.2 | | | 415.5 | | | 607.4 | | | 794.1 | |
1 Pricing and volume adjustments represents mark-to-market adjustments on provisionally prices sales, realized and unrealized changes to fair value for non-hedge derivative contracts and adjustments to originally invoiced weights and assays.
For further detail on variable consideration adjustments, refer to note 17 of our consolidated interim financial statements.
Realized sales prices
This measure is intended to enable management and investors to understand the average realized price of metals sold to third parties in each reporting period. The average realized price per unit sold does not have any standardized meaning prescribed by IFRS, is unlikely to be comparable to similar measures presented by other issuers and should not be considered in isolation or a substitute for measures of performance prepared in accordance with IFRS.
For sales of copper, zinc, gold and silver we may enter into non-hedge derivatives ("QP hedges") which are intended to manage the provisional pricing risk arising from quotational period terms in concentrate sales agreements. The gains and losses on QP hedges are included in the calculation of realized prices. We expect that gains and losses on QP hedges will offset provisional pricing adjustments on concentrate sales contracts.
Our realized prices for the second quarter of 2023 and 2022, respectively, are summarized below:
| | | | Realized prices1 for the | | | | | | Realized prices1 for the | |
| | Three months ended | | | | | | Six months ended | |
| | | LME QTD
20232 | | | Jun. 30,
2023 | | | Jun. 30,
2022 | | | LME YTD
20232 | | | Jun. 30,
2023 | | | Jun. 30,
2022 | |
| Prices | | | | | | | | | | | | | | | | | | | |
| Copper | $/lb | | 3.84 | | | 3.89 | | | 4.28 | | | 3.94 | | | 3.93 | | | 4.40 | |
| Zinc3 | $/lb | | 1.15 | | | 1.15 | | | 1.94 | | | 1.28 | | | 1.25 | | | 1.86 | |
| Gold4 | $/oz | | | | | 1,810 | | | 1,795 | | | | | | 1,846 | | | 1,769 | |
| Silver4 | $/oz | | | | | 21.45 | | | 24.32 | | | | | | 21.75 | | | 22.83 | |
1 Realized prices exclude refining and treatment charges and are on the sale of finished metal or metal in concentrate. Realized prices include the effect of provisional pricing adjustments on prior period sales.
2 London Metal Exchange average for copper and zinc prices.
3 Includes sales of zinc concentrate and sales of zinc metal for the three and six months ended June 30, 2022. Zinc realized prices include premiums paid by customers for delivery of refined zinc metal, but exclude unrealized gains and losses related to non-hedge derivative contracts that are included in zinc revenues. Realized prices include the effect of provisional pricing adjustments on zinc concentrate.
4 Sales of gold and silver from Constancia mine are subject to our precious metals stream agreement with Wheaton, pursuant to which we recognize deferred revenue for precious metals deliveries and also receive cash payments. Stream sales are included within realized prices and their respective deferred revenue and cash payment rates can be found on page 28 of this MD&A.
During the second quarter of 2023, we entered into a zero-cost collar program for approximately 10% of copper production expected in the second half of 2023. The program entails hedging 15.9 million pounds copper from July through to December 2023, inclusive, at an average floor price of $3.95 per pound and an average cap price of $4.28 per pound. The realized prices denoted above exclude the impact of derivative mark-to-market gains and losses on non-QP hedges which, if reflected above, would increase the realized copper price in the second quarter of 2023 by $0.09 per pound.

The following tables provide a reconciliation of average realized price per unit sold, by metal, to revenues as shown in the consolidated interim financial statements.
| Three months ended June 30, 2023 |
| (in $ millions) 1 | | Copper | | | Zinc | | | Gold | | | Silver | | | Molybdenum | | | Other | | | Total | |
| Revenue from contracts 2 | | 205.8 | | | 20.3 | | | 75.9 | | | 7.2 | | | 16.8 | | | - | | | 326.0 | |
| Amortization of deferred revenue | | - | | | - | | | 7.9 | | | 10.3 | | | - | | | - | | | 18.2 | |
| Pricing and volume adjustments 3 | | (3.3 | ) | | 1.6 | | | 2.3 | | | (0.3 | ) | | (5.6 | ) | | - | | | (5.3 | ) |
| By-product credits 4 | | 202.5 | | | 21.9 | | | 86.1 | | | 17.2 | | | 11.2 | | | - | | | 338.9 | |
| Derivative mark-to-market 5 | | (4.5 | ) | | - | | | - | | | - | | | - | | | - | | | (4.5 | ) |
| Revenue, excluding mark-to-market on non-QP hedges4 | | 198.0 | | | 21.9 | | | 86.1 | | | 17.2 | | | 11.2 | | | - | | | 334.4 | |
| Payable metal in concentrate and doré sold 6 | | 23,079 | | | 8,641 | | | 47,533 | | | 805,448 | | | 314 | | | - | | | - | |
| Realized price 7 | | 8,575 | | | 2,534 | | | 1,810 | | | 21.45 | | | - | | | - | | | - | |
| Realized price 8 | | 3.89 | | | 1.15 | | | - | | | - | | | - | | | - | | | - | |
| Six months ended June 30, 2023 |
| (in $ millions) 1 | | Copper | | | Zinc | | | Gold | | | Silver | | | Molybdenum | | | Other | | | Total | |
| Revenue from contracts 2 | | 370.0 | | | 40.1 | | | 150.8 | | | 13.5 | | | 35.8 | | | 0.2 | | | 610.4 | |
| Amortization of deferred revenue | | - | | | - | | | 13.3 | | | 15.9 | | | - | | | - | | | 29.2 | |
| Pricing and volume adjustments 3 | | (4.8 | ) | | (0.9 | ) | | 15.4 | | | (0.1 | ) | | (1.5 | ) | | - | | | 8.1 | |
| By-product credits 4 | | 365.2 | | | 39.2 | | | 179.5 | | | 29.3 | | | 34.3 | | | 0.2 | | | 647.7 | |
| Derivative mark-to-market 5 | | (4.5 | ) | | - | | | - | | | - | | | - | | | - | | | (4.5 | ) |
| Revenue, excluding mark-to-market on non-QP hedges | | 360.7 | | | 39.2 | | | 179.5 | | | 29.3 | | | 34.3 | | | 0.2 | | | 643.2 | |
| Payable metal in concentrate and dore sold 6 | | 41,619 | | | 14,269 | | | 97,254 | | | 1,347,334 | | | 568 | | | - | | | - | |
| Realized price 7 | | 8,667 | | | 2,747 | | | 1,846 | | | 21.75 | | | - | | | - | | | - | |
| Realized price 8 | | 3.93 | | | 1.25 | | | - | | | - | | | - | | | - | | | - | |
1 Average realized price per unit sold may not calculate based on amounts presented in this table due to rounding.
2 As per financial statements.
3 Pricing and volume adjustments represents mark-to-market adjustments on provisionally priced sales, realized and unrealized changes to fair value for non-hedge derivative contracts and adjustments to originally invoiced weights and assays.
4 By-product credits subtotal is used in the calculated of cash cost per pound of copper and ounce of gold produced, net of by-product credits. Cash cost per pound of copper and per ounce of gold produced, net of by-product credits, are non-IFRS financial performance measures with no standardized definition under IFRS. For further information and a detailed reconciliation, please see the discussion under the "Non-IFRS Financial Performance Measures" section of this MD&A.
5 Derivative mark-to-market excludes mark-to-market on QP hedges.
6 Copper, zinc and molybdenum shown in metric tonnes and gold and silver shown in ounces.
7 Realized price for copper and zinc in $/metric tonne and realized price for gold and silver in $/oz.
8 Realized price for copper and zinc in $/lb.
The price, quantity and mix of metals sold, affect our revenue, operating cash flow and profit. Revenue from metals sales can vary from quarter to quarter due to production levels, shipping volumes and transfer of risk and title to customers.
| Three months ended June 30, 2022 |
| (in $ millions) 1 | | Copper | | | Zinc | | | Gold | | | Silver | | | Molybdenum | | | Other | | | Total | |
| Revenue from contracts 2 | | 230.8 | | | 88.7 | | | 90.3 | | | 8.9 | | | 9.0 | | | 2.0 | | | 429.7 | |
| Amortization of deferred revenue | | - | | | - | | | 10.0 | | | 9.2 | | | - | | | - | | | 19.2 | |
| Pricing and volume adjustments 3 | | (7.5 | ) | | (0.2 | ) | | (8.9 | ) | | (0.2 | ) | | (1.6 | ) | | - | | | (18.4 | ) |
| By-product credits 4 | | 223.3 | | | 88.5 | | | 91.4 | | | 17.9 | | | 7.4 | | | 2.0 | | | 430.5 | |
| Derivative mark-to-market 5 | | - | | | 0.5 | | | - | | | - | | | - | | | - | | | 0.5 | |
| Revenue, excluding mark-to-market on non-QP hedges | | 223.3 | | | 89.0 | | | 91.4 | | | 17.9 | | | 7.4 | | | 2.0 | | | 431.0 | |
| Payable metal in concentrate and dore sold 6 | | 23,650 | | | 20,793 | | | 50,884 | | | 738,171 | | | 208 | | | - | | | - | |
| Realized price 7 | | 9,442 | | | 4,282 | | | 1,795 | | | 24.32 | | | - | | | - | | | - | |
| Realized price 8 | | 4.28 | | | 1.94 | | | - | | | - | | | - | | | - | | | - | |
| Six months ended June 30, 2022 |
| (in $ millions) 1 | | Copper | | | Zinc | | | Gold | | | Silver | | | Molybdenum | | | Other | | | Total | |
| Revenue from contracts 2 | | 439.7 | | | 155.2 | | | 157.9 | | | 15.5 | | | 18.2 | | | 4.4 | | | 790.9 | |
| Amortization of deferred revenue | | - | | | - | | | 23.2 | | | 21.0 | | | - | | | - | | | 44.2 | |
| Pricing and volume adjustments 3 | | (10.7 | ) | | 0.5 | | | (5.6 | ) | | 0.1 | | | (1.4 | ) | | - | | | (17.1 | ) |
| By-product credits 4 | | 429.0 | | | 155.7 | | | 175.5 | | | 36.6 | | | 16.8 | | | 4.4 | | | 818.0 | |
| Derivative mark-to-market 5 | | - | | | 0.4 | | | - | | | - | | | - | | | - | | | 0.4 | |
| Revenue, excluding mark-to-market on non-QP hedges | | 429.0 | | | 156.1 | | | 175.5 | | | 36.6 | | | 16.8 | | | 4.4 | | | 818.4 | |
| Payable metal in concentrate and dore sold 6 | | 44,259 | | | 38,099 | | | 99,227 | | | 1,602,763 | | | 421 | | | - | | | - | |
| Realized price 7 | | 9,695 | | | 4,097 | | | 1,769 | | | 22.83 | | | - | | | - | | | - | |
| Realized price 8 | | 4.40 | | | 1.86 | | | - | | | - | | | - | | | - | | | - | |
1 Average realized price per unit sold may not calculate based on amounts presented in this table due to rounding.
2 As per consolidated interim financial statements.
3 Pricing and volume adjustments represents mark-to-market adjustments on provisionally priced sales, realized and unrealized changes to fair value for non-hedge derivative contracts and adjustments to originally invoiced weights and assays.
4 By-product credits subtotal is used in the calculated of cash cost per pound of copper and zinc produced, net of by-product credits. Cash cost per pound of copper and per ounce of gold produced, net of by-product credits, are non-IFRS financial performance measures with no standardized definition under IFRS. For further information and a detailed reconciliation, please see the discussion under the "Non-IFRS Financial Reporting Measures" section of this MD&A.
5 Derivative mark-to-market excludes mark-to-market on QP hedges.
6 Copper, zinc and molybdenum shown in metric tonnes and gold and silver shown in ounces.
7 Realized price for copper, zinc and molybdenum in $/metric tonne and realized price for gold and silver in $/oz.
8 Realized price for copper and zinc in $/lb.
Stream Sales
The following table shows stream sales included within realized prices and their respective deferred revenue and cash payment rates:
| | | | Three months ended | | | Six months ended | |
| | | | Jun. 30, 2023 | | | Jun. 30, 2023 | |
| | | | Peru 1 | | | Peru 1 | |
| Gold | oz | | 9,619 | | | 16,198 | |
| Silver | oz | | 674,514 | | | 1,040,158 | |
| Gold deferred revenue drawdown rate1,2 | $/oz | | 820 | | | 820 | |
| Gold cash rate3 | $/oz | | 416 | | | 416 | |
| Total gold stream realized price | $/oz | | 1,236 | | | 1,236 | |
| Silver deferred revenue drawdown rate1,2 | $/oz | | 15.26 | | | 15.26 | |
| Silver cash rate3 | $/oz | | 6.14 | | | 6.14 | |
| Total silver stream realized price | $/oz | | 21.40 | | | 21.40 | |
| | | | Three months ended | | | Six months ended | |
| | | | Jun. 30, 2022 | | | Jun. 30, 2022 | |
| | | | Manitoba | | | Peru | | | Manitoba | | | Peru | |
| Gold | oz | | 3,629 | | | 7,431 | | | 8,017 | | | 17,926 | |
| Silver | oz | | 75,367 | | | 494,029 | | | 162,279 | | | 1,137,665 | |
| Gold deferred revenue drawdown rate1,2 | $/oz | | 1,241 | | | 734 | | | 1,247 | | | 734 | |
| Gold cash rate3 | $/oz | | 429 | | | 412 | | | 429 | | | 412 | |
| Total gold stream realized price | $/oz | | 1,670 | | | 1,146 | | | 1,676 | | | 1,146 | |
| Silver deferred revenue drawdown rate1,2 | $/oz | | 24.49 | | | 14.95 | | | 24.62 | | | 14.95 | |
| Silver cash rate3 | $/oz | | 6.33 | | | 6.08 | | | 6.33 | | | 6.08 | |
| Total silver stream realized price | $/oz | | 30.82 | | | 21.03 | | | 30.95 | | | 21.03 | |
1 Subsequent to the variable consideration adjustment recorded on January 1, 2023, the deferred revenue amortization is recorded in Peru at $820/oz gold and $15.26/oz silver (June 30, 2022 - $734/oz gold and $14.95/oz silver).
2 Deferred revenue drawdown rates for gold and silver do not include variable consideration adjustments.
3 The gold and silver cash rate for Manitoba increased by 1% from $400/oz and $5.90/oz effective August 1, 2015. Subsequently every year, on August 1, the cash rate will increase by 1% compounded. The weighted average cash rate is disclosed. The gold and silver cash rate for Peru increased by 1% from $400/oz and $5.90/oz effective August 4, 2019. Subsequently every year, on August 4, the cash rate will increase by 1% compounded. The weighted average cash rate is disclosed.
Cost of Sales
Our detailed cost of sales is summarized as follows:
| (in $ thousands) | | Three months ended | | | Six months ended | |
| | Jun. 30,
2023 | | | Jun. 30,
2022 | | | Jun. 30,
2023 | | | Jun. 30,
2022 | |
| Peru | | | | | | | | | | | | |
| Mining | | 31,654 | | | 32,300 | | | 58,440 | | | 60,702 | |
| Milling | | 54,676 | | | 44,731 | | | 100,867 | | | 92,386 | |
| Changes in product inventory | | 27,078 | | | (8,394 | ) | | 15,943 | | | (13,166 | ) |
| Depreciation and amortization | | 67,340 | | | 47,811 | | | 109,300 | | | 96,173 | |
| G&A | | 14,896 | | | 18,577 | | | 31,348 | | | 34,775 | |
| Inventory adjustments | | - | | | (97 | ) | | - | | | (558 | ) |
| Freight, royalties and other charges | | 14,903 | | | 13,414 | | | 27,995 | | | 23,745 | |
| Total Peru cost of sales | | 210,547 | | | 148,342 | | | 343,893 | | | 294,057 | |
| Manitoba | | | | | | | | | | | | |
| Mining | | 41,681 | | | 54,500 | | | 79,433 | | | 113,933 | |
| Milling | | 15,193 | | | 20,953 | | | 30,041 | | | 42,462 | |
| Zinc plant | | - | | | 14,379 | | | - | | | 32,755 | |
| Changes in product inventory | | (11,964 | ) | | 12,888 | | | (10,238 | ) | | (3,260 | ) |
| Depreciation and amortization | | 21,330 | | | 39,494 | | | 46,792 | | | 72,223 | |
| Inventory adjustments | | 906 | | | 2,030 | | | 906 | | | 2,030 | |
| G&A | | 6,139 | | | 22,721 | | | 16,321 | | | 45,964 | |
| Freight, royalties and other charges | | 5,441 | | | 10,633 | | | 10,831 | | | 19,127 | |
| Total Manitoba cost of sales | | 78,726 | | | 177,598 | | | 174,086 | | | 325,234 | |
| Cost of sales | | 289,273 | | | 325,940 | | | 517,979 | | | 619,291 | |
Total cost of sales for the second quarter of 2023 was $289.3 million, reflecting a decrease of $36.6 million from the second quarter of 2022. Peru cost of sales increased by $62.2 million in the second quarter of 2023, compared to the same period of 2022 mainly due to changes in product inventory caused a significant drawdown of copper concentrate that had accumulated during the first quarter of 2023 as nation-wide road blockades prevented shipments for most of the first quarter. Peru cost of sales were also higher in the second quarter of 2023, versus the comparative 2022 period, due to higher milling costs primarily related to a scheduled mill maintenance program with no similar maintenance program in the comparative period as well as higher depreciation.
Manitoba cost of sales decreased by $98.8 million in the second quarter of 2023, compared to the same period of 2022 as a result of the closure of the zinc plant in June 2022, decreases in the mining, milling and depreciation costs due to the planned closure of 777 and the Flin Flon mill, a reduction of general and administrative and freight costs, favourable movements in the foreign exchange rate as Manitoba's costs are primarily denominated in Canadian dollars and a higher relative buildup of copper concentrate inventory.
Total cost of sales for the first half of 2023 was $518.0 million, reflecting a decrease of $101.3 million from the same period in 2022. Peru cost of sales increased by $49.8 million mainly driven by higher depreciation, a higher relative drawdown of product inventory and higher milling costs due to a scheduled mill maintenance program. Manitoba cost of sales decreased by $151.1 million as a result of the same factors affecting the quarter-to-date Manitoba cost of sales variance described above.
For details on unit operating costs, refer to the respective tables in the "Operations Review" section of this MD&A.
For the second quarter of 2023, other significant variances in non-operating expenses, compared to the same period in 2022, include the following:
- A comparative period Impairment - Arizona decreased by $95.0 million. The prior period had an impairment related to certain capitalized costs and assets associated with the previous stand-alone development plan for the Rosemont deposit, which were determined to no longer be recoverable. No impairment was recorded in the comparative 2023 period.
- Re-evaluation adjustment - environmental provision decreased by $56.0 million due to the relative revaluation of the environmental reclamation provision on our Manitoba non-producing sites from changes in long term risk-free discount rates and inflation rates.
Given the long term nature of the reclamation cash flows, the related environmental reclamation provision is highly sensitive to changes in inflation rates and long-term risk-free discount rates and, as such, we may continue to experience significant quarterly closure cost provision revaluations.
- Selling and administrative expenses increased by $7.0 million compared to the same period in 2022, reflecting a higher share based compensation expense as a result of an increase in share price during the current year compared to the prior year.
- Other expenses increased by $15.2 million compared to the same period in 2022. The increase was primarily due to a comparative period insurance recovery of $5.7 million and increases in care & maintenance costs for the Flin Flon concentrator and tailings impoundment area following the planned closure of the Flin Flon operations in the second quarter of 2022 as well as transaction costs incurred to complete the acquisition of Copper Mountain. Partially offsetting these impacts was a non-recurring comparative period expense for the restructuring of the Manitoba operations in preparation for the closure of the Flin Flon operations.
- Exploration expenses decreased by $3.7 million reflecting a reduction in expensed exploration spending compared to the previous period.
For the year-to-date 2023, other significant variances in non-operating expenses, compared to the same period in 2022, include the following:
- Re-evaluation adjustment - environmental provision decreased by $127.6 million, for the same reasons outlined in the quarterly variance analysis.
- A comparative period Impairment - Arizona decreased by $95.0 million, as outlined in the second quarterly variance analysis.
- Exploration expenses decreased by $14.1 million as Copper World drilling and exploration costs, which were mainly expensed in the comparative 2022 period, have since been completed with incremental Copper World exploration now being capitalized.
- Selling and administrative expenses increased by $4.4 million for the same reasons outlined in the quarterly variance analysis.
- Other expenses increased by $11.1 million for the same reasons outlined in the quarterly variance analysis.
Net finance expense
| (in $ thousands) | | Three months ended | | | Six months ended | |
| | Jun. 30,
2023 | | | Jun. 30,
2022 | | | Jun. 30,
2023 | | | Jun. 30,
2022 | |
| | | | | | | | | | | | | |
| Finance costs - accrued or payable: | | | | | | | | | | | | |
| Interest expense on long-term debt | | 17,800 | | | 16,911 | | | 34,807 | | | 33,809 | |
| Withholding taxes | | 1,576 | | | 1,457 | | | 2,981 | | | 3,020 | |
| Loss on disposal of investments | | - | | | 3,132 | | | 652 | | | 3,132 | |
| Other accrued/payable costs1 | | 36 | | | 1,531 | | | 238 | | | 3,632 | |
| Total finance costs - accrued or payable | | 19,412 | | | 23,031 | | | 38,678 | | | 43,593 | |
| | | | | | | | | | | | | |
| Finance costs - non-cash: | | | | | | | | | | | | |
| Accretion on streaming agreements2 | | 6,596 | | | 7,357 | | | 13,097 | | | 12,193 | |
| Change in fair value of financial assets and liabilities at fair value through profit or loss | | (87 | ) | | (6,418 | ) | | 5,510 | | | 798 | |
| Other non-cash costs3 | | 4,582 | | | 457 | | | 8,194 | | | 4,587 | |
| Total finance costs - non-cash | | 11,091 | | | 1,396 | | | 26,801 | | | 17,578 | |
| Net finance expense | | 30,503 | | | 24,427 | | | 65,479 | | | 61,171 | |
1 Includes interest income and other finance expense.
2 Includes variable consideration adjustment (prior periods).
3 Includes accretion on community agreements, accretion on Wheaton refund liability, unwinding of discount on provisions, and net foreign exchange losses (gains).
Net finance expense during the second quarter ended June 30, 2023, increased by $6.1 million compared to the second quarter of 2022 primarily due to a $6.3 million decrease in the change in relative revaluation of the gold prepayment liability net of revaluation losses on our equity investments held at period end and a $3.6 million increase in net foreign exchange losses. These increases were partially offset by a $3.1 million decrease in loss on disposal of investments compared to same quarter in 2022 as well as $1.3 million of additional interest income earned.
Net finance expense during the first half of 2023, increased by $4.3 million compared to the same period in 2022 due a $4.7 million increase in the change in relative revaluation of the gold prepayment liability and revaluation losses on our equity investments, and a $2.5 million increase in net foreign exchange losses. This was partially offset by a $2.5 million decrease in losses on disposal of investments and $2.7 million of additional interest income earned.
Tax Expense
For the three months ended June 30, 2023, tax recoveries increased by $5.2 million and for the six months ended June 30, 2023, tax expense decreased by $18.3 million, compared to the same periods in 2022. The following table provides further details:
(in $ thousands)
| | Three months ended | | | Six months ended | |
| | Jun. 30,
2023 | | | Jun. 30,
2022 | | | Jun. 30,
2023 | | | Jun. 30,
2022 | |
| Deferred tax (recovery) expense - income tax1 | | (15,134 | ) | | (21,463 | ) | | (18,284 | ) | | (11,862 | ) |
| Deferred tax (recovery) expense - mining tax1 | | (70 | ) | | 127 | | | (2,069 | ) | | 5,117 | |
| Total deferred tax (recovery) expense | | (15,204 | ) | | (21,336 | ) | | (20,353 | ) | | (6,745 | ) |
| Current tax (recovery) expense - income tax | | (1,020 | ) | | 7,477 | | | 9,745 | | | 12,954 | |
| Current tax expense - mining tax | | 425 | | | 3,220 | | | 6,782 | | | 8,198 | |
| Total current tax (recovery) expense | | (595 | ) | | 10,697 | | | 16,527 | | | 21,152 | |
| Tax (recovery) expense | | (15,799 | ) | | (10,639 | ) | | (3,826 | ) | | 14,407 | |
1 Deferred tax expense (recovery) represents our draw down/increase of non-cash deferred income and mining tax assets/liabilities.
Income Tax Expense/Recovery
Applying the estimated Canadian statutory income tax rate of 26.3% to our loss before taxes of $13.3 million for the year-to-date of 2023 would have resulted in a tax recovery of approximately $3.5 million; however, we recorded an income tax recovery of $8.5 million. The significant items causing our effective income tax rate to be different than the 26.3% estimated Canadian statutory income tax rate include:
- Deductible temporary differences with respect to Peru and Manitoba, relating to the decommissioning and restoration liabilities, were recognized as we have determined that it is probable that we will realize the recovery of these deferred tax assets based on the timing of the reversals of the deductible temporary differences and the future projected taxable profit of the operations. This resulted in a combined deferred tax recovery of $3.2 million.
- Foreign exchange on the translation of deferred tax balances to group currency resulted in a deferred tax recovery of $7.1 million.
- The tax expense with respect to our foreign operations are recorded using an income tax rate other than the Canadian statutory income tax rate of 26.3%, resulting in a tax expense of $4.7 million.
Mining Tax Expense
Applying the estimated Manitoba mining tax rate of 10.0% to our loss before taxes of $13.3 million for the second quarter of 2023 would have resulted in a tax expense of approximately $1.3 million; however, we recorded a mining tax expense of $4.7 million. Effective mining tax rates can vary significantly based on the composition of our earnings and the expected amount of mining taxable profits. Corporate costs and other costs not related to mining operations are not deductible in computing mining profits. A brief description of how mining taxes are calculated in our various business units is discussed below.
Manitoba
The Province of Manitoba imposes mining tax on profit related to the sale of mineral products mined in the Province of Manitoba (mining taxable profit) at the following rates:
- 10% of total mining taxable profit if mining profit is C$50 million or less;
- Between mining profit of C$50 and $C55 million, mining tax is equal to a minimum of C$5 million plus mining profit less C$50 million multiplied by 65%;
- 15% of total mining taxable profit if mining profits are between C$55 million and C$100 million;
- Between mining profit of C$100 million and C$105 million, mining tax is equal to a minimum of C$15 million plus mining profit less C$100 million multiplied by 57%; and
- 17% of total mining taxable profit if mining profits exceed C$105 million.
We estimate that the tax rate that will be applicable when temporary differences reverse will be approximately 10.0%.
Peru
The Peruvian government imposes two parallel mining tax regimes, the Special Mining Tax and the Modified Royalty, on companies' operating mining income on a sliding scale, with progressive rates ranging from 2.0% to 8.4% and 1.0% to 12.0%, respectively. Based on financial forecasts, we have recorded a deferred tax liability as at June 30, 2023, at the tax rate we expect to apply when temporary differences reverse.
LIQUIDITY AND CAPITAL RESOURCES
As at June 30, 2023, our liquidity includes $179.7 million in cash as well as undrawn total availability of $184.1 million under our revolving credit facilities.
Subsequent to quarter end, we drew $90 million from our revolving credit facilities to finance the redemption of a portion of Copper Mountain's bonds, as described below.
Senior Unsecured Notes
We have $600.0 million aggregate principal amount of 4.5% senior notes due April 2026 and $600.0 million aggregate principal amount of 6.125% senior notes due April 2029.
In connection with the Copper Mountain Transaction, we designated the Copper Mountain group as Unrestricted Subsidiaries, as defined in the indentures governing our senior notes (the "Note Indentures"). As a result, Copper Mountain and its subsidiaries do not guarantee our obligations under the Note Indentures.
Senior Secured Revolving Credit Facilities
We have two senior secured revolving credit facilities with total commitments of $450 million ("the Credit Facilities") for our Canadian and Peruvian businesses and substantially similar terms and conditions.
In connection with the Copper Mountain Transaction, our Revolving Credit Facilities ("RCFs") were amended to allow Hudbay to designate the Copper Mountain Group of companies as Unrestricted Subsidiaries under the RCFs so that the debt, cash, interest and EBITDA are excluded from ratio calculations and the assets excluded from the RCF security package until the Copper Mountain bonds are repaid in full. In addition, the Net Debt to EBITDA covenant ratio was increased from 4:1 to 4.5:1 for the periods ending June 30 and September 30, 2023, to provide greater financial flexibility during the business integration period.
At June 30, 2023, we had $40.0 million outstanding under our Canadian revolving credit facility. As at June 30, 2023, we were in compliance with our covenants under the Credit Facilities and had also drawn $26.1 million in letters of credit under the Credit Facilities. In total, $66.1 million was owing under the Credit Facilities as at June 30, 2023.
C$130 Million Bilateral Letter of Credit Facility
On August 22, 2022, we closed a C$130.0 million bilateral letter of credit facility ("LC Facility") with a major Canadian financial institution. The LC Facility enables the Company to issue up to C$130.0 million of letters of credit to beneficiaries on an unsecured basis at attractive rates, with a further C$30.0 million sub-limit for financial letters of credit. This facility was permitted under the existing terms the Credit Facilities and has no financial covenants. As at June 30, 2023, the Manitoba business unit had drawn $58.0 million in letters of credit under the LC Facility.
Surety Bonds
As at June 30, 2023, the Arizona business unit had $12.8 million in surety bonds issued to support future reclamation and closure obligations. The Peru business unit also had $118.0 million in letters of credit issued with various Peruvian financial institutions to support future reclamation and other operating matters. The British Columbia business unit had $15.9 million in surety bonds issued to support future reclamation and $3.9 million in surety bonds issued to support the hydro used at Copper Mountain Mine. No cash collateral is required to be posted under these letters of credit or surety bonds.
Gold Prepay
During the fourth quarter of 2020, we entered into a gold forward sale and prepay transaction which generated $115.0 million in cash proceeds to pre-fund the expected capital requirements for the New Britannia gold mill refurbishment project. The transaction valued the future gold ounce delivery obligation at 79,954 gold ounces to be delivered in fixed monthly deliveries of 3,331 gold ounces over a 24-month period from January 2022 to December 2023.
During the first quarter of 2023, we amended our gold forward sale and prepay agreements to defer eight months of deliveries starting with February 2023. Deliveries of the outstanding 37,500 ounces of gold will resume in fixed monthly amounts starting in October 2023 until August 2024. The fair value of the financial liability at June 30, 2023 was $69.9 million.
Copper Mountain Bonds
On April 9, 2021, Copper Mountain completed an offering of $250 million of secured bonds ("the Bonds"). The Bonds mature on April 9, 2026 and bear interest at an annual rate of 8.0%, payable semi-annually on April 9 and October 9. Semi-annual principal installments in the amount of $5 million are payable on each interest payment date. As at June 30, 2023, the Company had $3.7 million on deposit in a debt service account to satisfy the upcoming semi-annual principal installment and interest payment. The debt service account balance is presented as restricted cash within other financial assets in our consolidated interim balance sheet.
The Bonds are secured by a general security agreement on the assets of Copper Mountain and a pledge of Copper Mountain's equity interest in the Copper Mountain mine, but do not benefit from any credit support from Hudbay or its other subsidiaries.
The Bonds require Copper Mountain to comply with certain covenants, including restrictions on dividends and indebtedness and a requirement to maintain certain minimum cash amounts at Copper Mountain and the Copper Mountain mine. As at June 30, 2023, the Company is in compliance with our financial covenants under the Bonds.
The Bonds also provide the bondholders with the right to put all or part of the principal amount of the outstanding Bonds to Copper Mountain at a price of 101%, plus accrued interest, following a change of control event. With the acquisition of Copper Mountain on June 20, 2023, the change of control event was triggered and $83.3 million of the Bonds were put to Copper Mountain on July 17, 2023. As described above, the Company utilized its Credit Facilities to finance the redemption of the Bonds that were put to Copper Mountain.
Copper Mountain may redeem all or part of the principal amount of the remaining outstanding Bonds at any time from October 2023, at redemption prices ranging from 104% to 100%, plus accrued and unpaid interest to the date of redemption.
As at June 30, 2023, the Bonds had a principal amount outstanding of $143.0 million. As at the date hereof, the Bonds have a principal amount outstanding of $59.7 million.
Financial Condition
Financial Condition as at June 30, 2023 compared to December 31, 2022
Cash decreased by $45.9 million during the first half of the year to $179.7 million as at June 30, 2023. This decrease was mainly the result of investing and financing cash outflows of $135.5 million for capital investments and community agreements primarily at our Peru and Manitoba operations, interest payments of $31.9 million, lease payments of $10.4 million, partial repayment of our gold prepayment liability of $6.4 million, other financing costs mainly related to our revolving credit facilities and withholding taxes of $6.2 million, $5.0 million for a scheduled payment related to the Rosemont acquisition as well as dividends paid of $1.9 million. Offsetting these outflows were cash inflows from operating activities of $95.8 million, $40.0 million draw on our Credit Facilities, $3.1 million of interest received and $10.7 million of net cash acquired on the closing of the Copper Mountain acquisition. We hold the majority of our cash in low-risk, liquid investments with major Canadian and Peruvian financial institutions.
Working capital decreased by $137.9 million to negative $61.4 million from December 31, 2022 to June 30, 2023, primarily due to a $145.0 million increase in the current portion of long term debt related to Copper Mountain Bonds that had a put option outstanding at June 30, 2023, which required the Bonds to be presented as current. Subsequent to June 30, 2023, $83.3 million of the Bonds were put to Copper Mountain on July 17, 2023. We drew $90 million from our revolving credit facilities to finance the redemption of this portion of the Bonds. Working capital also decreased due to a decrease in cash of $45.9 million, an increase in deferred revenue of $23.8 million, a decrease in trade receivables of $23.6 million mainly related to timing of sales receivables and an increase in lease liabilities of $14.8 million. Partially offsetting these items was a $65.5 million increase in inventories due, in part, to the buildup of approximately 45,000 tonnes of surface ore stockpiles in front of Stall and New Britannia mills, a $20.8 million decrease in other financial liabilities and a corresponding $21.3 million increase in other financial assets due to an increase in the value of commodity hedges as commodity prices eased off during the period, an increase in restricted cash from the acquisition of Copper Mountain, a $19.1 million decrease in other liabilities due to a decline in advances from customers and a $14.1 million decrease in current gold prepayment liability due to timing of gold delivery obligations.
Cash Flows
The following table summarizes our cash flows for the three and six months ended June 30, 2023 and June 30, 2022:
| (in $ thousands) | | Three months ended | | | Six months ended | |
| | Jun. 30,
2023 | | | Jun. 30,
2022 | | | Jun. 30,
2023 | | | Jun. 30,
2022 | |
| Operating cash flow before change in non-cash working capital | | 55,878 | | | 123,911 | | | 141,486 | | | 200,964 | |
| Change in non-cash working capital | | (31,321 | ) | | 41,695 | | | (45,650 | ) | | 27,949 | |
| Cash generated from operating activities | | 24,557 | | | 165,606 | | | 95,836 | | | 228,913 | |
| Cash used in investing activities | | (55,921 | ) | | (78,854 | ) | | (120,997 | ) | | (134,586 | ) |
| Cash used in financing activities | | (45,123 | ) | | (41,470 | ) | | (21,878 | ) | | (106,189 | ) |
| Effect of movement in exchange rates on cash | | 658 | | | (85 | ) | | 1,108 | | | (571 | ) |
| (Decrease) increase in cash | | (75,829 | ) | | 45,197 | | | (45,931 | ) | | (12,433 | ) |
Cash Flow from Operating Activities
Cash generated from operating activities was $24.6 million during the second quarter of 2023, a decrease of $141.0 million compared with the same period in 2022 predominantly due to a $73.0 negative impact from changes in non-cash working capital. Operating cash flow before change in non-cash working capital was $55.9 million during the second quarter of 2023, reflecting a decrease of $68.0 million compared to the second quarter of 2022. The decrease in operating cash flows before changes in working capital was primarily the result of lower copper and zinc prices, lower copper, zinc and gold sales volumes due to the comparative period including 777 production, the buildup of approximately 45,000 tonnes of surface ore stockpiles in Manitoba as the commissioning of the Stall mill Phase I recovery improvement project was completed as well as a second quarter scheduled plant maintenance shutdown in Peru and higher treatment and refining charges.
Year-to-date cash generated from operating activities was $95.8 million in 2023, a decrease of $133.1 million compared to 2022. Operating cash flow before changes in non-cash working capital for the first half of 2023 was $141.5 million, a decrease of $59.5 million compared to 2022. The decrease in operating cash flow before changes in working capital is mostly attributable to the same reasons outlined in the quarterly variance, partially offset by higher molybdenum prices and sales volumes.
Cash Flow from Investing and Financing Activities
During the second quarter of 2023, we spent $101.0 million in investing and financing activities, primarily driven by $65.9 million in capital expenditures, $2.7 million in community agreement payments, $31.9 million in interest payments, $5.1 million in capitalized lease payments, $5.0 million in deferred Rosemont acquisition payment and $3.0 million in other financing costs mainly related to our revolving credit facilities and withholding taxes. These cash outflows were partially offset by $1.5 million of interest received and $10.7 million of net cash acquired on the closing of the Copper Mountain acquisition.
Year-to-date, we used $142.9 million of cash in investing and financing activities, primarily driven by $130.8 million of capital expenditures, $4.6 million in community agreements, $31.9 million of interest payments, $10.4 million in lease payments, $6.4 million in partial settlement of our gold prepayment liability, $6.2 million in other financing costs mainly related to our revolving credit facilities and withholding taxes, $5.0 million for a scheduled payment related to the Rosemont acquisition and $1.9 million in dividend payments. These cash outflows were partially offset by a $40.0 million draw on our Credit Facilities, $3.1 million of interest received and $10.7 million of net cash acquired on the closing of the Copper Mountain acquisition.
Capital Expenditures
The following summarizes accrued and cash additions to capital assets for the periods indicated:
| | | Three months ended | | | Six months ended | | | Guidance | |
| | | Jun. 30, 2023 | | | Jun. 30, 2022 | | | Jun. 30, 2023 | | | Jun. 30, 2022 | | | Annual | |
| (in $ millions) | | 20232 | |
| Manitoba sustaining capital expenditures | | 12.5 | | | 33.8 | | | 24.1 | | | 57.8 | | | 75.0 | |
| Peru sustaining capital expenditures1 | | 28.7 | | | 28.1 | | | 57.8 | | | 47.0 | | | 160.0 | |
| Total sustaining capital expenditures | | 41.2 | | | 61.9 | | | 81.9 | | | 104.8 | | | 235.0 | |
| Arizona capitalized costs | | 5.5 | | | 12.4 | | | 11.6 | | | 15.5 | | | 30.0 | |
| Peru growth capitalized expenditures | | 9.9 | | | 0.1 | | | 11.7 | | | 0.2 | | | 10.0 | |
| Manitoba growth capitalized expenditures | | 5.1 | | | 12.6 | | | 13.5 | | | 17.5 | | | 15.0 | |
| Other capitalized costs2 | | 7.3 | | | 4.0 | | | 10.2 | | | 13.4 | | | - | |
| Capitalized exploration | | 0.3 | | | 7.0 | | | 0.9 | | | 10.1 | | | 10.0 | |
| Total other capitalized expenditures | | 28.1 | | | 36.1 | | | 47.9 | | | 56.7 | | | | |
| Total capital additions3 | | 69.3 | | | 98.0 | | | 129.8 | | | 161.5 | | | | |
| | | | | | | | | | | | | | | | |
| Reconciliation to cash capital additions: | | | | | | | | | | | | | | | |
| Right-of-use asset additions | | (4.1 | ) | | (12.5 | ) | | (4.7 | ) | | (20.3 | ) | | | |
| Community agreement additions | | (1.8 | ) | | - | | | (1.7 | ) | | (0.8 | ) | | | |
| Change in capital accruals and other | | 2.5 | | | (7.0 | ) | | 7.4 | | | (9.8 | ) | | | |
| Acquisition of property, plant & equipment - cash | | 65.9 | | | 78.5 | | | 130.8 | | | 130.6 | | | | |
1 Peru sustaining capital expenditures include capitalized stripping costs.
2 Other capitalized costs primarily include right-of-use lease additions, which are excluded from guidance in 2023.
3 Following completion of the Copper Mountain acquisition on June 20, 2023, the Company's capital additions have not been materially affected by Copper Mountain's operations during the 10-day stub period from the date of acquisition to the end of the second quarter.
For the three and six months ended June 30, 2023, total capital additions declined by 29% and 20%, respectively, compared to the same periods in 2022 as a result of lower sustaining capital expenditures in Manitoba, lower growth spending in Arizona and Manitoba, partially offset by higher sustaining and growth capital expenditures in Peru.
Sustaining capital expenditures in Manitoba for the three and six months ended June 30, 2023 were $12.5 million, and $24.1 million, respectively representing a decline of $21.3 million and $33.7 million compared to the same period in 2022 due to lower spending at Anderson tailings and lower capital development at Lalor in 2023. Sustaining capital expenditures in Peru for the three and six months ended June 30, 2023 were $28.7 million and $57.8 million respectively, representing an increase of $0.6 million and $10.8 million compared to the same period in 2022. The increases mainly relate to increased capitalized stripping at Pampacancha.
Growth capital spending in Manitoba for the three and six months ended June 30, 2023 was $5.1 million and $13.5 million, respectively, which mainly relates to the Stall mill recovery improvement project, which has now been completed. Growth capital expenditures in Peru for the three and six months ended June 30, 2023 were $9.9 million and $11.7 million, respectively, representing an increase of $9.8 million and $11.5 million compared to the same period in 2022 and mainly relate to planned spending on copper and molybdenum recovery improvement projects in 2023.
Arizona's capital expenditures for the three and six months ended June 30, 2023 were $5.5 million and $11.6 million, respectively, and mainly relate to pre-feasibility study costs and Copper World carrying costs.
Other capitalized costs for the three and six months ended June 30, 2023 were $7.3 million and $10.2 million, respectively, which are mostly made up of non-cash capitalized costs.
We expect consolidated sustaining, growth and capitalized exploration in 2023 to be approximately $15 million lower than our full year guidance.
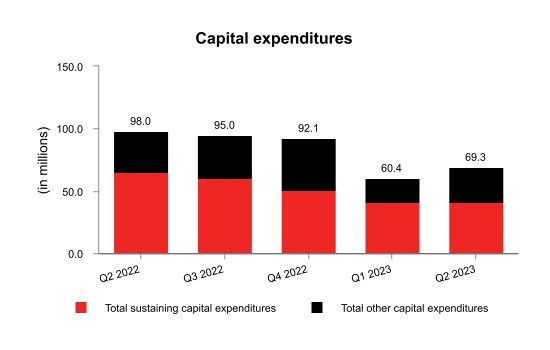
Capital Commitments
As at June 30, 2023, we had outstanding capital commitments in Canada of approximately $34.9 million, of which $30.6 million can be terminated, approximately $27.6 million in Peru primarily related to exploration option agreements, all of which can be terminated, and approximately $42.7 million in Arizona, primarily related to our Copper World project, of which approximately $7.2 million can be terminated.
Contractual Obligations
The following table summarizes our significant contractual obligations as at June 30, 2023:
| | | Total | | | Less than
12 months | | | 13 - 36
months | | | 37 - 60
months | | | More than
60 months | |
| Payment Schedule (in $ millions) |
| Long-term debt obligations1 | | 1,853.3 | | | 363.9 | | | 738.0 | | | 114.6 | | | 636.8 | |
| Gold prepayment obligation2 | | 70.0 | | | 57.2 | | | 12.8 | | | - | | | - | |
| Lease obligations | | 169.4 | | | 57.6 | | | 69.6 | | | 23.3 | | | 18.9 | |
| Purchase obligation - capital commitments | | 105.2 | | | 29.0 | | | 32.7 | | | 42.6 | | | 0.9 | |
| Purchase obligation - other commitments3 | | 1,718.9 | | | 444.1 | | | 622.9 | | | 181.2 | | | 470.7 | |
| Pension and other employee future benefits obligations2 | | 97.3 | | | 7.8 | | | 11.5 | | | 28.9 | | | 49.1 | |
| Community agreement obligations4, 5 | | 69.6 | | | 10.1 | | | 8.6 | | | 7.9 | | | 43.0 | |
| Decommissioning and restoration obligations5 | | 484.4 | | | 5.4 | | | 10.1 | | | 7.4 | | | 461.5 | |
| Total | | 4,568.1 | | | 975.1 | | | 1,506.2 | | | 405.9 | | | 1,680.9 | |
1 Long-term debt obligations include scheduled interest payments, as well as principal repayments .This balance also includes the Copper Mountain Bonds that were puttable as at June 30, 2023.
2 Discounted.
3 Primarily made up of long-term agreements with operational suppliers, obligations for power purchase, concentrate handling, fleet and port services, as well as deferred consideration arising from the acquisition of Rosemont's minority interest.
4 Represents community agreement obligations and various finalized land user agreements, including Pampacancha.
5 Undiscounted before inflation.
In addition to the contractual obligations included in the above payment schedule, we also have the following commitments which impact our financial position:
- A profit-sharing plan with most Manitoba employees;
- A profit-sharing plan with all Peru employees;
- Wheaton precious metals stream agreements for 777 and the Constancia mines; and,
- Government royalty payments related to the Constancia mines.
Outstanding Share Data
As of August 4, 2023, the final trading day prior to the date of this MD&A, there were 346,225,631 common shares of Hudbay issued and outstanding. In addition, there were 2,246,363 stock options outstanding.
FINANCIAL RISK MANAGEMENT
Business Integration Risk with Copper Mountain
Hudbay's expectations with respect to the financial benefits of the Copper Mountain Transaction were based on its internal projections of Copper Mountain's business and operations as well as those prepared by the Copper Mountain management team prior to completion of the transaction (together, the "Projections"). All such Projections were based on assumptions and information available at the time the Projections were prepared to, among other things, assist Hudbay in evaluating the Copper Mountain Transaction. Since acquiring ownership of the Copper Mountain mine, Hudbay's focus has been on engaging with key stakeholders and advancing its plans to stabilize the operation over the next 12 months and sustainably operate it in future years, which will be further detailed in a technical report and updated mine plan and mineral reserve and resource estimates for Copper Mountain to be released in the fourth quarter of 2023. Hudbay does not know whether the results of its technical report will be consistent with the assumptions made in the Projections or whether the Projections (which are subject to a number of known and unknown risks and uncertainties) will be realized. As a result of these contingencies, there can be no assurance that Hudbay's expectations with respect to the financial benefits of the Copper Mountain Transaction will be realized or that actual results will not be significantly higher or lower than expected. Further, the Projections were not prepared with a view toward public disclosure or toward compliance with IFRS, published guidelines of applicable securities regulatory authorities or the guidelines established by the Chartered Professional Accountants for preparation and presentation of prospective financial information. No independent accountants, have compiled, examined, or performed any procedures with respect to the Projections, nor have they expressed any opinion or any other form of assurance on such information or its achievability.
In addition, the ability to realize the benefits of the Copper Mountain Transaction will depend in part on, among other things, building relationships with key stakeholders and successfully consolidating functions and integrating operations, procedures and personnel in a timely and efficient manner, as well as on Hudbay's ability to realize the anticipated growth opportunities and synergies from integrating Copper Mountain's business following completion of the Copper Mountain Transaction. Integration activities have been progressing well to date. Successfully completing the business integration will require the dedication of management effort, time and resources which may divert management's focus and resources from other strategic opportunities available to Hudbay and from operational matters during this process. There can be no assurance that management will be able to integrate the operations of Copper Mountain's business successfully and realize the anticipated financial benefits. It is possible that the integration process could result in the loss of key employees, the disruption of the respective ongoing businesses or inconsistencies in standards, controls, procedures and policies that adversely affect the ability of management to maintain relationships with key stakeholders or to achieve the anticipated benefits of the Proposed Transaction. Any inability of management to successfully build relationships with key stakeholders and integrate the operations could have a material adverse effect on the business, financial condition and results of operations of Hudbay.
Implication of Copper World Pre-feasibility Study on Phase I of Copper World and Copper Mountain Technical Report
As with any change in mine plan, or new technical report or pre-feasibility assessment, there is a risk that the timing and extent of operating and capital expenditures may result in an indicator of impairment or impairment reversal. In the case of the forthcoming Copper World pre-feasibility study, management will assess impairment considerations with respect to changes in timing and expenditures to support the development of Copper World. In the case of the forthcoming Copper Mountain technical report, management will assess impairment considerations with respect to changes in timing and expenditures on Copper Mountain.
TREND ANALYSIS AND QUARTERLY REVIEW
A detailed quarterly and annual summary of financial and operating performance can be found in the "Summary of Results" section at the end of this MD&A. The following table sets forth selected consolidated financial information for each of our eight most recently completed quarters:
| (in $ millions, except per share amounts, production on a copper equivalent basis and average realized copper price) | | 2023 | | | 2022 | | | 2021 | |
| | Q2 | | | Q1 | | | Q4 | | | Q3 | | | Q2 | | | Q1 | | | Q4 | | | Q3 | |
| Production on a copper equivalent basis (tonnes) | | 37,530 | | | 38,614 | | | 45,454 | | | 42,099 | | | 46,332 | | | 45,085 | | | 50,685 | | | 42,243 | |
| Average realized copper price ($/lb) | | 3.89 | | | 3.98 | | | 3.61 | | | 3.47 | | | 4.28 | | | 4.53 | | | 4.34 | | | 4.26 | |
| Revenue | | 312.2 | | | 295.2 | | | 321.2 | | | 346.2 | | | 415.5 | | | 378.6 | | | 425.2 | | | 359.0 | |
| Gross profit (loss)3 | | 22.9 | | | 66.5 | | | 69.7 | | | 32.4 | | | 89.5 | | | 85.3 | | | 81.7 | | | (85.4 | ) |
| (Loss) profit before tax | | (30.7 | ) | | 17.4 | | | (14.3 | ) | | (0.3 | ) | | 21.5 | | | 88.9 | | | (0.2 | ) | | (147.8 | ) |
| (Loss) profit | | (14.9 | ) | | 5.5 | | | (17.4 | ) | | (8.1 | ) | | 32.1 | | | 63.8 | | | (10.5 | ) | | (170.4 | ) |
| Adjusted net (loss) earnings1 | | (18.3 | ) | | 0.1 | | | 2.6 | | | (12.4 | ) | | 30.5 | | | 5.2 | | | 32.7 | | | 0.9 | |
| (Loss) earnings per share: | | | | | | | | | | | | | | | | | | | | | | | | |
| Basic and diluted | | (0.05 | ) | | 0.02 | | | (0.07 | ) | | (0.03 | ) | | 0.12 | | | 0.24 | | | (0.04 | ) | | (0.65 | ) |
Adjusted net (loss) earnings1
per share | | (0.07 | ) | | 0.00 | | | 0.01 | | | (0.05 | ) | | 0.12 | | | 0.02 | | | 0.13 | | | 0.00 | |
| Operating cash flow2 | | 55.9 | | | 85.6 | | | 109.1 | | | 81.6 | | | 123.9 | | | 77.6 | | | 156.9 | | | 103.5 | |
| Adjusted EBITDA1 | | 81.2 | | | 101.9 | | | 124.7 | | | 99.3 | | | 141.4 | | | 110.2 | | | 180.8 | | | 119.2 | |
1 Adjusted net earnings (loss), adjusted net earnings (loss) per share, and adjusted EBITDA are non-IFRS financial performance measure with no standardized definition under IFRS. For further information and a detailed reconciliation, please see the discussion under the "Non-IFRS Financial Performance Measures" section of this MD&A.
2 Operating cash flow before changes in non-cash working capital.
3 Gross profit (loss) includes $147.3 million and $46.2 million, respectively, of impairment losses related to environmental reclamation provision for the now closed Flin Flon operation for the three months ended September 30, 2021 and December 31, 2021.
Commodity prices have generally rebounded and remained elevated in the first half of 2023, but these increases have also been accompanied by inflationary pressures on consumables, labour and supplies, which has put pressure on mine operating costs, sustaining cash costs, gross profit and operating cash flow particularly in the second quarter. The second quarter saw a drawdown of higher-than-normal unsold copper concentrate inventory levels in Peru that had built up due to supply chain disruptions during a short period of social and political unrest in the first quarter. The second quarter results also reflected the impact of the Copper Mountain acquisition which closed on June 20, 2023. There was a minimal impact to net earnings during the 10-day stub period at the end of the second quarter.
Average gold prices during the first quarter reached levels not seen since 2020, which positively impacted first quarter gross profit. Political unrest in Peru resulted in road blockades causing logistics and supply chain disruptions until mid-February 2023, resulting in a buildup of copper concentrate inventory above normal operating levels, affecting overall revenues and profit in the first quarter.
The easing of domestic COVID measures by China during the fourth quarter of 2022 resulted in a rebound of most industrial commodity prices. However, late in the quarter, Peru experienced heightened tensions and social unrest following a change in the country's political leadership. Inflationary pressures on fuel, consumables and energy costs have persisted globally, negatively impacting our production costs and margins.
Fourth quarter revenues were negatively impacted by lower production due to planned maintenance programs at Lalor and Constancia, the planned closure of 777 earlier in the year, short-term changes in the mine plan in Peru and a build up of product inventory in Peru due to the aforementioned social unrest. The revenue impact of lower throughput was partially offset by higher commodity prices. Additionally, the fourth quarter results were impacted by a non-cash loss of $13.5 million related to the quarterly revaluation of our Flin Flon environmental reclamation provision due to changes in real, long-term discount rates.
Commodity prices declined during the third quarter of 2022 while growing inflationary pressures contributed to higher mine operating costs resulting in declines in our key financial metrics during the quarter. Third quarter results were also impacted by lower production due to the closure of 777 in the second quarter of 2022 and the commencement of care and maintenance activities, which will continue for the next several years. Relatively small movements in real, long-term discount rates will continue to impact the revaluation of our environmental reclamation provisions for closed sites in Manitoba and these movements will be reflected through the income statement.
The second quarter results for 2022 were impacted by a revaluation gain of $60.7 million pertaining mostly to the environmental reclamation provision on our Flin Flon site due to increases in long-term risk-free interest rates. A pre-tax impairment loss of $95.0 million was recorded following the release of the Copper World Preliminary Economic Assessment in June 2022 as certain assets associated with the previous, stand-alone development plan for the Rosemont deposit are no longer expected to be recoverable.
Results in the first quarter of 2022 benefited from a trend of higher realized base metal prices, but were also impacted by rising operating costs caused by inflation. While we achieved increased gold production from the higher grade Pampacancha deposit and the higher recovery New Britannia gold mill, we experienced increased levels of COVID-19 related absenteeism in the workforce, impacting production, and also experienced limited availability of rail cars leading to reduced sales and an inventory build-up. The second quarter results were also impacted by a revaluation gain of $78.2 million pertaining mostly to the environmental reclamation provision on our Flin Flon site and $1.7 million for our non-producing sites in Manitoba caused by an increase in long-term risk-free interest rates.
Results for the fourth quarter of 2021 benefited from higher realized metal prices. This strength in commodity prices combined with higher gold production following the commencement of commercial production at New Britannia and improving copper recoveries led to record revenue of $425.2 million during the quarter. Adjusted EBITDA and operating cash flow both reached record highs. Notwithstanding these records, continued inflationary pressures along with lower copper grades caused operating costs to climb and put pressure on gross margins, compared to earlier quarters. A revaluation of our environmental reclamation provision for the Flin Flon closure plan resulted in a $46.2 million non-cash charge, which negatively impacted net income for the quarter.
During the third quarter of 2021, increasing base metal prices contributed to strong revenues and operating cash flow. Mining at Pampacancha continued to ramp-up, contributing significantly to gold production during the quarter. As a result of the planned closure of Flin Flon operations in mid-2022 and an updated Flin Flon closure plan, non-cash charges totaling $156.3 million were incurred, which negatively impacted gross profit for the quarter. In Peru, ongoing COVID-19 costs, along with lower copper grades, put pressure on operating costs.
NON-IFRS FINANCIAL PERFORMANCE MEASURES
Adjusted net earnings (loss), adjusted net earnings (loss) per share, adjusted EBITDA, realized prices, net debt, cash cost, sustaining and all-in sustaining cash cost per pound of copper produced, cash cost and sustaining cash cost per ounce of gold produced and combined unit cost are non-IFRS performance measures. These measures do not have a meaning prescribed by IFRS and are therefore unlikely to be comparable to similar measures presented by other issuers. These measures should not be considered in isolation or as a substitute for measures prepared in accordance with IFRS and are not necessarily indicative of operating profit or cash flow from operations as determined under IFRS. Other companies may calculate these measures differently.
Management believes adjusted net earnings (loss) and adjusted net earnings (loss) per share provides an alternate measure of the Company's performance for the current period and gives insight into its expected performance in future periods. These measures are used internally by the Company to evaluate the performance of its underlying operations and to assist with its planning and forecasting of future operating results. As such, the Company believes these measures are useful to investors in assessing the Company's underlying performance. We provide adjusted EBITDA to help users analyze our results and to provide additional information about our ongoing cash generating potential in order to assess our capacity to service and repay debt, carry out investments and cover working capital needs. Realized price is shown to understand the average realized price of metals sold to third parties in each reporting period. Net debt is shown because it is a performance measure used by the Company to assess our financial position. Cash cost, sustaining and all-in sustaining cash cost per pound of copper produced are shown because we believe they help investors and management assess the performance of our operations, including the margin generated by the operations and the Company. Cash cost and sustaining cash cost per ounce of gold produced are shown because we believe they help investors and management assess the performance of our Manitoba operations. Combined unit cost is shown because we believe it helps investors and management assess our cost structure and margins that are not impacted by variability in by-product commodity prices.
Adjusted Net Earnings (Loss)
Adjusted net earnings (loss) represents net earnings (loss) excluding certain impacts, net of taxes, such as mark-to-market adjustments, impairment charges and reversal of impairment charges, write-down of assets, revaluation of the environmental reclamation provision for closed sites, and foreign exchange (gain) loss. These measures are not necessarily indicative of net earnings (loss) or cash flows as determined under IFRS.
The following table provides a reconciliation of earnings (loss) per the consolidated interim income statements, to adjusted net earnings (loss) for the three and six months ended June 30, 2023 and 2022.
| | | Three months ended | | | Six months ended | |
| (in $ millions) | | Jun. 30,
2023 | | | Jun. 30,
2022 | | | Jun. 30,
2023 | | | Jun. 30,
2022 | |
| (Loss) profit for the period | | (14.9 | ) | | 32.1 | | | (9.5 | ) | | 95.9 | |
| Tax (recovery) expense | | (15.8 | ) | | (10.6 | ) | | (3.8 | ) | | 14.4 | |
| (Loss) profit before tax | | (30.7 | ) | | 21.5 | | | (13.3 | ) | | 110.3 | |
| Adjusting items: | | | | | | | | | | | | |
| Mark-to-market adjustments1 | | 0.6 | | | (14.0 | ) | | 7.4 | | | (3.5 | ) |
| Foreign exchange loss (gain) | | 1.4 | | | (2.2 | ) | | 1.7 | | | (0.7 | ) |
| Inventory adjustments | | 0.9 | | | 1.9 | | | 0.9 | | | 1.5 | |
| Variable consideration adjustment - stream revenue and accretion | | - | | | - | | | (5.0 | ) | | (5.8 | ) |
| Impairment - Arizona | | - | | | 95.0 | | | - | | | 95.0 | |
| Re-evaluation adjustment - environmental provision2 | | (4.7 | ) | | (60.7 | ) | | (12.9 | ) | | (140.5 | ) |
| Acquisition related costs | | 6.8 | | | - | | | 6.8 | | | - | |
| Evaluation expenses | | - | | | 0.7 | | | - | | | 7.7 | |
| Insurance recovery | | - | | | (5.7 | ) | | - | | | (5.7 | ) |
| Restructuring charges - Manitoba3 | | - | | | 3.7 | | | - | | | 4.4 | |
| Loss on disposal of investments | | - | | | 3.1 | | | 0.7 | | | 3.1 | |
| Loss on disposal of plant and equipment and non-current assets - Manitoba | | 0.3 | | | - | | | 0.4 | | | - | |
| Adjusted earnings before income taxes | | (25.4 | ) | | 43.3 | | | (13.3 | ) | | 65.8 | |
| Tax recovery (expense) | | 15.8 | | | 10.6 | | | 3.8 | | | (14.4 | ) |
| Tax impact of adjusting items | | (8.7 | ) | | (23.4 | ) | | (8.7 | ) | | (15.4 | ) |
| Adjusted net (loss) earnings | | (18.3 | ) | | 30.5 | | | (18.2 | ) | | 36.0 | |
| Adjusted net (loss) earnings ($/share) | | (0.07 | ) | | 0.12 | | | (0.07 | ) | | 0.14 | |
| Basic weighted average number of common shares outstanding (millions) | | 272.2 | | | 261.9 | | | 267.2 | | | 261.8 | |
1 Includes changes in fair value of the gold prepayment liability, Canadian junior mining investments, other financial assets and liabilities at fair value through profit or loss and share-based compensation (recoveries) expenses.
2 Changes from movements to environmental reclamation provisions are primarily related to the Flin Flon operations, which were fully depreciated as of June 30, 2022, as well as other Manitoba non-operating sites.
3 Includes closure costs for Flin Flon operations in 2022.
After adjusting reported net earnings for those items not considered representative of the Company's core business or indicative of future operations, the Company had an adjusted net loss in the second quarter of 2023 of $18.3 million or $0.07 loss per share.
Adjusted EBITDA
Adjusted EBITDA is profit or loss before net finance expense/income, tax expense/recoveries, depreciation and amortization of property, plant and equipment and deferred revenue, as well as certain other adjustments. We calculate adjusted EBITDA by excluding certain adjustments included within our adjusted net earnings measure which we believe reflects the underlying performance of our core operating activities. The measure also removes the impact of non-cash items and financing costs that are not associated with measuring the underlying performance of our operations. However, our adjusted EBITDA is not the measure defined as EBITDA under our senior notes or revolving credit facilities and may not be comparable with performance measures with the same name reported by other companies. Adjusted EBITDA should not be considered as a substitute for profit or loss or as a better measure of liquidity than operating cash flow, which are calculated in accordance with IFRS. We provide adjusted EBITDA to help users analyze our results and to provide additional information about our ongoing cash generating potential in order to assess our capacity to service and repay debt, carry out investments and cover working capital needs.
The following table presents the reconciliation of earnings (loss) per the consolidated interim income statements, to adjusted EBITDA for the three and six months ended June 30, 2023 and 2022:
| | | Three months ended | | | Six months ended | |
| (in $ millions) | | Jun. 30,
2023 | | Jun. 30,
2022 | | | Jun. 30,
2023 | | Jun. 30,
2022 | |
| (Loss) profit for the period | | (14.9 | ) | | 32.1 | | | (9.5 | ) | | 95.9 | |
| Add back: | | | | | | | | | | | | |
| Tax (recovery) expense | | (15.8 | ) | | (10.6 | ) | | (3.8 | ) | | 14.4 | |
| Net finance expense | | 30.5 | | | 24.4 | | | 65.5 | | | 61.2 | |
| Other expense | | 13.9 | | | (1.3 | ) | | 18.9 | | | 7.7 | |
| Depreciation and amortization | | 88.7 | | | 87.3 | | | 156.1 | | | 168.4 | |
| Amortization of deferred revenue and variable consideration adjustment | | (18.1 | ) | | (19.2 | ) | | (34.0 | ) | | (47.4 | ) |
| Adjusting items (pre-tax): | | | | | | | | | | | |
| Impairment losses | | - | | | 95.0 | | | - | | | 95.0 | |
| Re-evaluation adjustment - environmental provision | | (4.7 | ) | | (60.7 | ) | | (12.9 | ) | | (140.5 | ) |
| Inventory adjustments | | 0.9 | | | 1.9 | | | 0.9 | | | 1.5 | |
| Share-based compensation expense (recovery) 1 | | 0.7 | | | (7.5 | ) | | 1.9 | | | (4.3 | ) |
| Adjusted EBITDA | | 81.2 | | | 141.4 | | | 183.1 | | | 251.9 | |
1 Share-based compensation expense reflected in cost of sales and selling and administrative expenses.
Net Debt
The following table presents our calculation of net debt as at June 30, 2023 and December 31, 2022:
| (in $ thousands) | | Jun. 30, 2023 | | | Dec. 31,
2022 | |
| Total long-term debt | | 1,370,682 | | | 1,184,162 | |
| Cash | | (179,734 | ) | | (225,665 | ) |
| Net debt | | 1,190,948 | | | 958,497 | |
Cash Cost, Sustaining and All-in Sustaining Cash Cost (Copper Basis)
Cash cost per pound of copper produced ("cash cost") is a non-IFRS measure that management uses as a key performance indicator to assess the performance of our operations. Our calculation designates copper as our primary metal of production as it has been the largest component of revenues. The calculation is presented in four manners:
- Cash cost, before by-product credits - This measure is gross of by-product revenues and is a function of the efforts and costs incurred to mine and process all ore mined. However, the measure divides this aggregate cost over only pounds of copper produced, our primary metal of production. This measure is generally less volatile from period to period, as it is not affected by changes in the price received for by-product metals. It is, however, significantly affected by the relative mix of copper concentrate and finished zinc production, where the sale of the zinc will occur later, and an increase in production of zinc metal will tend to result in an increase in cash cost under this measure.
- Cash cost, net of by-product credits - In order to calculate the net cost to produce and sell copper, the net of by-product credits measure subtracts the revenues realized from the sale of the metals other than copper. The by-product revenues from zinc, gold, and silver are significant and are integral to the economics of our operations. The economics that support our decision to produce and sell copper would be different if we did not receive revenues from the other significant metals being extracted and processed. This measure provides management and investors with an indication of the minimum copper price consistent with positive operating margins, assuming realized by-product metal prices are consistent with those prevailing during the reporting period. It also serves as an important operating statistic that management and investors utilize to measure our operating performance versus that of our competitors. However, it is important to understand that if by-product metal prices decline alongside copper prices, the cash cost net of by-product credits would increase, requiring a higher copper price than that reported to maintain positive cash flows and operating margins.
- Sustaining cash cost, net of by-product credits - This measure is an extension of cash cost that includes cash sustaining capital expenditures, including payments on capitalized leases, capitalized sustaining exploration, net smelter returns royalties, payments on certain long-term community agreements, as well as accretion and amortization for expected decommissioning activities for producing assets. It does not include corporate selling and administrative expenses. It provides a more fulsome measurement of the cost of sustaining production than cash cost, which is focused on operating costs only.
- All-in sustaining cash cost, net of by-product credits - This measure is an extension of sustaining cash cost that includes corporate G&A, regional costs, accretion and amortization for community agreements relating to current operations, and accretion for expected decommissioning activities for non-producing sites. Due to the inclusion of corporate selling and administrative expenses, all-in sustaining cash cost is presented on a consolidated basis only.
The tables below present a detailed build-up of cash cost and sustaining cash cost, net of by-product credits, by business unit in addition to consolidated all-in sustaining cash cost, net of by-product credits, and reconciliations between cash cost, net of by-product credits, to the most comparable IFRS measures of cost of sales for the three and six months ended June 30, 2023 and 2022. Cash cost, net of by-product credits may not calculate exactly based on amounts presented in the tables below due to rounding.
| Consolidated | | Three months ended | | | Six months ended | |
| Net pounds of copper produced1, 2 | | | | | | |
| (in thousands) | | Jun. 30, 2023 | | | Jun. 30, 2022 | | | Jun. 30, 2023 | | | Jun. 30, 2022 | |
| Peru | | 38,982 | | | 46,032 | | | 84,215 | | | 88,286 | |
| Manitoba | | 6,160 | | | 10,556 | | | 10,668 | | | 22,761 | |
| Net pounds of copper produced | | 45,142 | | | 56,588 | | | 94,883 | | | 111,047 | |
1 Contained copper in concentrate.
2 Excludes Copper Mountain production for the 10-day stub period to the end of the second quarter of 2023.
| Consolidated | | Three months ended | | | Six months ended | |
| | | Jun. 30, 2023 | | | Jun. 30, 2022 | | | Jun. 30, 2023 | | | Jun. 30, 2022 | |
| Cash cost per pound of copper produced | | $000s | | | $/lb | | | $000s | | | $/lb | | | $000s | | | $/lb | | | $000s | | | $/lb | |
| Cash cost, before by-product credits | | 208,615 | | | 4.62 | | | 243,902 | | | 4.31 | | | 397,018 | | | 4.18 | | | 485,960 | | | 4.37 | |
| By-product credits | | (136,417 | ) | | (3.02 | ) | | (207,191 | ) | | (3.66 | ) | | (282,528 | ) | | (2.97 | ) | | (388,864 | ) | | (3.50 | ) |
| Cash cost, net of by-product credits | | 72,198 | | | 1.60 | | | 36,711 | | | 0.65 | | | 114,490 | | | 1.21 | | | 97,096 | | | 0.87 | |
| Consolidated | | Three months ended | | | Six months ended | |
| | | Jun. 30, 2023 | | | Jun. 30, 2022 | | | Jun. 30, 2023 | | | Jun. 30, 2022 | |
| Cash cost per pound of copper produced | | $000s | | | $/lb | | | $000s | | | $/lb | | | $000s | | | $/lb | | | $000s | | | $/lb | |
| Mining | | 73,335 | | | 1.62 | | | 86,800 | | | 1.53 | | | 137,873 | | | 1.45 | | | 174,635 | | | 1.57 | |
| Milling | | 69,869 | | | 1.55 | | | 65,684 | | | 1.16 | | | 130,908 | | | 1.38 | | | 134,848 | | | 1.21 | |
| Refining (zinc) | | - | | | - | | | 14,379 | | | 0.26 | | | - | | | - | | | 32,755 | | | 0.30 | |
| G&A | | 20,975 | | | 0.47 | | | 41,930 | | | 0.74 | | | 47,530 | | | 0.50 | | | 80,923 | | | 0.73 | |
| Onsite costs | | 164,179 | | | 3.64 | | | 208,793 | | | 3.69 | | | 316,311 | | | 3.33 | | | 423,161 | | | 3.81 | |
| Treatment & refining | | 26,670 | | | 0.59 | | | 15,033 | | | 0.27 | | | 45,165 | | | 0.48 | | | 27,116 | | | 0.24 | |
| Freight & other | | 17,766 | | | 0.39 | | | 20,076 | | | 0.35 | | | 35,542 | | | 0.37 | | | 35,683 | | | 0.32 | |
| Cash cost, before by-product credits | | 208,615 | | | 4.62 | | | 243,902 | | | 4.31 | | | 397,018 | | | 4.18 | | | 485,960 | | | 4.37 | |
| Consolidated | | Three months ended | | | Six months ended | |
| | | Jun. 30, 2023 | | | Jun. 30, 2022 | | | Jun. 30, 2023 | | | Jun. 30, 2022 | |
| Supplementary cash cost information | | $000s | | | $/lb 1 | | | $000s | | | $/lb 1 | | | $000s | | | $/lb1 | | | $000s | | | $/lb1 | |
| By-product credits2: | | | | | | | | | | | | | | | | | | | | | | | | |
| Zinc | | 21,896 | | | 0.48 | | | 88,548 | | | 1.56 | | | 39,270 | | | 0.41 | | | 155,677 | | | 1.40 | |
| Gold3 | | 86,026 | | | 1.91 | | | 91,317 | | | 1.61 | | | 179,505 | | | 1.89 | | | 175,491 | | | 1.58 | |
| Silver3 | | 17,281 | | | 0.38 | | | 17,956 | | | 0.32 | | | 29,279 | | | 0.31 | | | 36,595 | | | 0.33 | |
| Molybdenum & other | | 11,214 | | | 0.25 | | | 9,370 | | | 0.17 | | | 34,474 | | | 0.36 | | | 21,101 | | | 0.19 | |
| Total by-product credits | | 136,417 | | | 3.02 | | | 207,191 | | | 3.66 | | | 282,528 | | | 2.97 | | | 388,864 | | | 3.50 | |
| Reconciliation to IFRS: | | | | | | | | | | | | | | | | | | | | | | | | |
| Cash cost, net of by-product credits | | 72,198 | | | | | | 36,711 | | | | | | 114,490 | | | | | | 97,096 | | | | |
| By-product credits | | 136,417 | | | | | | 207,191 | | | | | | 282,528 | | | | | | 388,864 | | | | |
| Treatment and refining charges | | (26,670 | ) | | | | | (15,033 | ) | | | | | (45,165 | ) | | | | | (27,116 | ) | | | |
| Inventory adjustments | | 906 | | | | | | 1,933 | | | | | | 906 | | | | | | 1,472 | | | | |
| Share-based compensation expense | | 60 | | | | | | (632 | ) | | | | | 139 | | | | | | (184 | ) | | | |
| Change in product inventory | | 15,114 | | | | | | 4,494 | | | | | | 5,705 | | | | | | (16,426 | ) | | | |
| Royalties | | 2,578 | | | | | | 3,971 | | | | | | 3,284 | | | | | | 7,189 | | | | |
| Depreciation and amortization4 | | 88,670 | | | | | | 87,305 | | | | | | 156,092 | | | | | | 168,396 | | | | |
| Cost of sales5 | | 289,273 | | | | | | 325,940 | | | | | | 517,979 | | | | | | 619,291 | | | | |
1 Per pound of copper produced.
2 By-product credits are computed as revenue per financial statements, including amortization of deferred revenue and pricing and volume adjustments. For more information, please see the realized price reconciliation table on page 26 of this MD&A for these figures.
3 Gold and silver by-product credits do not include variable consideration adjustments with respect to stream arrangements. Variable consideration adjustments are cumulative adjustments to gold and silver stream deferred revenue primarily associated with the net change in mineral reserves and resources or amendments to the mine plan that would change the total expected deliverable ounces under the precious metal streaming arrangement. For the six months ended June 30, 2023 the variable consideration adjustments amounted income of $4,885 (six months ended June 30, 2022 - income of $3,245).
4 Depreciation is based on concentrate sold.
5 As per consolidated interim financial statements.
| Peru | | Three months ended | | | Six months ended | |
| (in thousands) | | Jun. 30, 2023 | | | Jun. 30, 2022 | | | Jun. 30, 2023 | | | Jun. 30, 2022 | |
| Net pounds of copper produced1 | | 38,982 | | | 46,032 | | | 84,215 | | | 88,286 | |
1 Contained copper in concentrate.
| Peru | | Three months ended | | | Six months ended | |
| | | Jun. 30, 2023 | | | Jun. 30, 2022 | | | Jun. 30, 2023 | | | Jun. 30, 2022 | |
Cash cost per pound of
copper produced | | $000s | | | $/lb | | | $000s | | | $/lb | | | $000s | | | $/lb | | | $000s | | | $/lb | |
| Mining | | 31,654 | | | 0.81 | | | 32,300 | | | 0.70 | | | 58,440 | | | 0.69 | | | 60,702 | | | 0.69 | |
| Milling | | 54,676 | | | 1.40 | | | 44,731 | | | 0.97 | | | 100,867 | | | 1.20 | | | 92,386 | | | 1.05 | |
| G&A | | 14,867 | | | 0.38 | | | 18,677 | | | 0.41 | | | 31,333 | | | 0.37 | | | 34,777 | | | 0.39 | |
| Onsite costs | | 101,197 | | | 2.59 | | | 95,708 | | | 2.08 | | | 190,640 | | | 2.26 | | | 187,865 | | | 2.13 | |
| Treatment & refining | | 17,097 | | | 0.44 | | | 9,226 | | | 0.20 | | | 27,700 | | | 0.33 | | | 16,811 | | | 0.19 | |
| Freight & other | | 12,424 | | | 0.32 | | | 12,297 | | | 0.26 | | | 24,851 | | | 0.30 | | | 21,774 | | | 0.25 | |
| Cash cost, before by-product credits | | 130,718 | | | 3.35 | | | 117,231 | | | 2.54 | | | 243,191 | | | 2.89 | | | 226,450 | | | 2.57 | |
| By-product credits | | (47,193 | ) | | (1.21 | ) | | (33,268 | ) | | (0.72 | ) | | (98,092 | ) | | (1.17 | ) | | (77,265 | ) | | (0.88 | ) |
| Cash cost, net of by-product credits | | 83,525 | | | 2.14 | | | 83,963 | | | 1.82 | | | 145,099 | | | 1.72 | | | 149,185 | | | 1.69 | |
| Peru | | Three months ended | | | Six months ended | |
| | | Jun. 30, 2023 | | | Jun. 30, 2022 | | | Jun. 30, 2023 | | | Jun. 30, 2022 | |
Supplementary cash cost
information | | $000s | | | $/lb 1 | | | $000s | | | $/lb 1 | | | $000s | | | $/lb 1 | | | $000s | | | $/lb 1 | |
| By-product credits2: | | | | | | | | | | | | | | | | | | | | | | | | |
| Gold3 | | 21,638 | | | 0.55 | | | 14,191 | | | 0.31 | | | 40,939 | | | 0.49 | | | 35,903 | | | 0.41 | |
| Silver3 | | 14,341 | | | 0.37 | | | 11,687 | | | 0.25 | | | 22,918 | | | 0.27 | | | 24,678 | | | 0.28 | |
| Molybdenum | | 11,214 | | | 0.29 | | | 7,390 | | | 0.16 | | | 34,235 | | | 0.41 | | | 16,684 | | | 0.19 | |
| Total by-product credits | | 47,193 | | | 1.21 | | | 33,268 | | | 0.72 | | | 98,092 | | | 1.17 | | | 77,265 | | | 0.88 | |
| Reconciliation to IFRS: | | | | | | | | | | | | | | | | | | | | | | | | |
| Cash cost, net of by-product credits | | 83,525 | | | | | | 83,963 | | | | | | 145,099 | | | | | | 149,185 | | | | |
| By-product credits | | 47,193 | | | | | | 33,268 | | | | | | 98,092 | | | | | | 77,265 | | | | |
| Treatment and refining charges | | (17,097 | ) | | | | | (9,226 | ) | | | | | (27,700 | ) | | | | | (16,811 | ) | | | |
| Inventory adjustments | | - | | | | | | (97 | ) | | | | | - | | | | | | (558 | ) | | | |
| Share-based compensation expenses | | 29 | | | | | | (100 | ) | | | | | 15 | | | | | | (2 | ) | | | |
| Change in product inventory | | 27,078 | | | | | | (8,394 | ) | | | | | 15,943 | | | | | | (13,166 | ) | | | |
| Royalties | | 2,479 | | | | | | 1,117 | | | | | | 3,144 | | | | | | 1,971 | | | | |
| Depreciation and amortization4 | | 67,340 | | | | | | 47,811 | | | | | | 109,300 | | | | | | 96,173 | | | | |
| Cost of sales5 | | 210,547 | | | | | | 148,342 | | | | | | 343,893 | | | | | | 294,057 | | | | |
1 Per pound of copper produced.
2 By-product credits are computed as revenue per financial statements, including amortization of deferred revenue and pricing and volume adjustments. For more information, please see the realized price reconciliation table on page 26 of this MD&A.
3 Gold and silver by-product credits do not include variable consideration adjustments with respect to stream arrangements.
4 Depreciation is based on concentrate sold.
5 As per consolidated interim financial statements.
| Consolidated | | Three months ended | | | Six months ended | |
| | | Jun. 30, 2023 | | | Jun. 30, 2022 | | | Jun. 30, 2023 | | | Jun. 30, 2022 | |
All-in sustaining cash cost per pound of
copper produced | | $000s | | | $/lb | | | $000s | | | $/lb | | | $000s | | | $/lb | | | $000s | | | $/lb | |
| Cash cost, net of by-product credits | | 72,198 | | | 1.60 | | | 36,711 | | | 0.65 | | | 114,490 | | | 1.21 | | | 97,096 | | | 0.87 | |
| Cash sustaining capital expenditures | | 48,253 | | | 1.07 | | | 65,173 | | | 1.15 | | | 96,121 | | | 1.01 | | | 126,136 | | | 1.14 | |
| Royalties | | 2,578 | | | 0.06 | | | 3,971 | | | 0.07 | | | 3,284 | | | 0.03 | | | 7,189 | | | 0.06 | |
| Sustaining cash cost, net of by-product credits | | 123,029 | | | 2.73 | | | 105,855 | | | 1.87 | | | 213,895 | | | 2.25 | | | 230,421 | | | 2.07 | |
| Corporate selling and administrative expenses & regional costs | | 9,603 | | | 0.21 | | | 2,479 | | | 0.04 | | | 19,818 | | | 0.21 | | | 15,539 | | | 0.15 | |
| Accretion and amortization of decommissioning and community agreements1 | | 1,792 | | | 0.04 | | | 874 | | | 0.02 | | | 3,750 | | | 0.04 | | | 1,595 | | | 0.01 | |
| All-in sustaining cash cost, net of by-product credits | | 134,424 | | | 2.98 | | | 109,208 | | | 1.93 | | | 237,463 | | | 2.50 | | | 247,555 | | | 2.23 | |
| Reconciliation to property, plant and equipment additions: | | | | | | | | | | | | | | | | | | | | | | | | |
| Property, plant and equipment additions | | 47,574 | | | | | | 70,712 | | | | | | 81,128 | | | | | | 110,111 | | | | |
| Capitalized stripping net additions | | 21,640 | | | | | | 27,302 | | | | | | 48,624 | | | | | | 51,448 | | | | |
| Total accrued capital additions | | 69,214 | | | | | | 98,014 | | | | | | 129,752 | | | | | | 161,559 | | | | |
| Less other non-sustaining capital costs2 | | 28,006 | | | | | | 45,489 | | | | | | 47,856 | | | | | | 66,093 | | | | |
| Total sustaining capital costs | | 41,208 | | | | | | 52,525 | | | | | | 81,896 | | | | | | 95,466 | | | | |
| Capitalized lease cash payments - operating sites | | 4,374 | | | | | | 9,313 | | | | | | 9,076 | | | | | | 18,572 | | | | |
| Community agreement cash payments | | 1,290 | | | | | | 370 | | | | | | 2,479 | | | | | | 4,142 | | | | |
| Accretion and amortization of decommissioning and restoration obligations 3 | | 1,381 | | | | | | 2,965 | | | | | | 2,670 | | | | | | 7,956 | | | | |
| Cash sustaining capital expenditures | | 48,253 | | | | | | 65,173 | | | | | | 96,121 | | | | | | 126,136 | | | | |
1 Includes accretion of decommissioning liability relating to non-producing sites, and accretion and amortization of community agreements capitalized to Other assets.
2 Other non-sustaining capital costs include Arizona capitalized costs, capitalized interest, capitalized exploration, right-of-use lease asset additions and growth capital expenditures.
3 Includes amortization of decommissioning and restoration PP&E assets and accretion of decommissioning and restoration liabilities related to producing sites.
| Peru | | Three months ended | | | Six months ended | |
| | | Jun. 30, 2023 | | | Jun. 30, 2022 | | | Jun. 30, 2023 | | | Jun. 30, 2022 | |
Sustaining cash cost per pound of
copper produced | | $000s | | | $/lb | | | $000s | | | $/lb | | | $000s | | | $/lb | | | $000s | | | $/lb | |
| Cash cost, net of by-product credits | | 83,525 | | | 2.14 | | | 83,963 | | | 1.82 | | | 145,099 | | | 1.72 | | | 149,185 | | | 1.69 | |
| Cash sustaining capital expenditures | | 33,425 | | | 0.86 | | | 35,527 | | | 0.78 | | | 66,989 | | | 0.80 | | | 65,566 | | | 0.74 | |
| Royalties | | 2,479 | | | 0.06 | | | 1,117 | | | 0.02 | | | 3,144 | | | 0.04 | | | 1,971 | | | 0.02 | |
| Sustaining cash cost per pound of copper produced | | 119,429 | | | 3.06 | | | 120,607 | | | 2.62 | | | 215,232 | | | 2.56 | | | 216,722 | | | 2.45 | |
Gold Cash Cost and Gold Sustaining Cash Cost
Cash cost per ounce of gold produced ("gold cash cost") is a non-IFRS measure that management uses as a key performance indicator to assess the performance of our Manitoba operations. This alternative cash cost calculation designates gold as the primary metal of production as it represents a substantial component of revenues for our Manitoba business unit and should therefore be less volatile over time than Manitoba cash cost per pound of copper. The calculation is presented in three manners:
- Gold cash cost, before by-product credits - This measure is gross of by-product revenues and is a function of the efforts and costs incurred to mine and process all ore mined. However, the measure divides this aggregate cost over only ounces of gold produced, the assumed primary metal of production. This measure is generally less volatile from period to period, as it is not affected by changes in the price received for by-product metals.
- Gold cash cost, net of by-product credits - In order to calculate the net cost to produce and sell gold, the net of by-product credits measure subtracts the revenues realized from the sale of the metals other than gold. The by-product revenues from copper, zinc, and silver are significant and are integral to the economics of our Manitoba operation. The economics that support our decision to produce and sell gold would be different if we did not receive revenues from the other significant metals being extracted and processed. This measure provides management and investors with an indication of the minimum gold price consistent with positive operating margins, assuming realized by-product metal prices are consistent with those prevailing during the reporting period. It also serves as an important operating statistic that management and investors utilize to measure our operating performance at our Manitoba operation versus that of our competitors. However, it is important to understand that if by-product metal prices decline alongside gold prices, the gold cash cost net of by-product credits would increase, requiring a higher gold price than that reported to maintain positive cash flows and operating margins.
- Gold sustaining cash cost, net of by-product credits - This measure is an extension of gold cash cost that includes cash sustaining capital expenditures, capitalized exploration, net smelter returns royalties, as well as accretion and amortization for expected decommissioning activities for producing assets. It does not include corporate selling and administrative expenses. It provides a more fulsome measurement of the cost of sustaining production than gold cash cost, which is focused on operating costs only.
The tables below present a detailed build-up of gold cash cost and gold sustaining cash cost, net of by-product credits, for the Manitoba business unit, and reconciliations between gold cash cost, net of by-product credits, to the most comparable IFRS measures of cost of sales for the three and six months ended June 30, 2023 and 2022. Gold cash cost, net of by-product credits, may not calculate exactly based on amounts presented in the tables below due to rounding.
| Manitoba | | Three months ended | | | Six months ended | |
| (in thousands) | | Jun. 30, 2023 | | | Jun. 30, 2022 | | | Jun. 30, 2023 | | | Jun. 30, 2022 | |
| Net ounces of gold produced1 | | 35,253 | | | 44,787 | | | 71,287 | | | 87,954 | |
1 Contained gold in concentrate and doré.
| Manitoba | | Three months ended | | | Six months ended | |
| | | Jun. 30, 2023 | | | Jun. 30, 2022 | | | Jun. 30, 2023 | | | Jun. 30, 2022 | |
| Cash cost per ounce of gold produced | | $000s | | | $/oz1 | | | $000s | | | $/oz1 | | | $000s | | | $/oz1 | | | $000s | | | $/oz1 | |
| Mining | | 41,681 | | | 1,182 | | | 54,500 | | | 1,217 | | | 79,433 | | | 1,114 | | | 113,933 | | | 1,295 | |
| Milling | | 15,193 | | | 431 | | | 20,953 | | | 468 | | | 30,041 | | | 422 | | | 42,462 | | | 483 | |
| Refining (zinc) | | - | | | - | | | 14,379 | | | 321 | | | - | | | - | | | 32,755 | | | 372 | |
| G&A | | 6,108 | | | 173 | | | 23,253 | | | 519 | | | 16,197 | | | 227 | | | 46,146 | | | 525 | |
| Onsite costs | | 62,982 | | | 1,786 | | | 113,085 | | | 2,525 | | | 125,671 | | | 1,763 | | | 235,296 | | | 2,675 | |
| Treatment & refining | | 9,573 | | | 271 | | | 5,807 | | | 130 | | | 17,465 | | | 245 | | | 10,305 | | | 117 | |
| Freight & other | | 5,342 | | | 152 | | | 7,779 | | | 173 | | | 10,691 | | | 150 | | | 13,909 | | | 158 | |
| Cash cost, before by-product credits | | 77,897 | | | 2,209 | | | 126,671 | | | 2,828 | | | 153,827 | | | 2,158 | | | 259,510 | | | 2,950 | |
| By-product credits | | (39,218 | ) | | (1,112 | ) | | (135,924 | ) | | (3,035 | ) | | (81,349 | ) | | (1,141 | ) | | (250,797 | ) | | (2,851 | ) |
| Gold cash cost, net of by-product credits | | 38,679 | | | 1,097 | | | (9,253 | ) | | (207 | ) | | 72,478 | | | 1,017 | | | 8,713 | | | 99 | |
| Manitoba | | Three months ended | | | Six months ended | |
Supplementary cash cost
information | | Jun. 30, 2023 | | | Jun. 30, 2022 | | | Jun. 30, 2023 | | | Jun. 30, 2022 | |
| | $000s | | | $/oz 1 | | | $000s | | | $/oz1 | | | $000s | | | $/oz 1 | | | $000s | | | $/oz 1 | |
| By-product credits2: | | | | | | | | | | | | | | | | | | | | | | | | |
| Copper | | 14,382 | | | 408 | | | 39,127 | | | 874 | | | 35,479 | | | 498 | | | 78,786 | | | 896 | |
| Zinc | | 21,896 | | | 621 | | | 88,548 | | | 1,977 | | | 39,270 | | | 551 | | | 155,677 | | | 1,770 | |
| Silver3 | | 2,940 | | | 83 | | | 6,269 | | | 140 | | | 6,361 | | | 89 | | | 11,917 | | | 135 | |
| Other | | - | | | - | | | 1,980 | | | 44 | | | 239 | | | 3 | | | 4,417 | | | 50 | |
| Total by-product credits | | 39,218 | | | 1,112 | | | 135,924 | | | 3,035 | | | 81,349 | | | 1,141 | | | 250,797 | | | 2,851 | |
| Reconciliation to IFRS: | | | | | | | | | | | | | | | | | | | | | | | | |
| Cash cost, net of by-product credits | | 38,679 | | | | | | (9,253 | ) | | | | | 72,478 | | | | | | 8,713 | | | | |
| By-product credits | | 39,218 | | | | | | 135,924 | | | | | | 81,349 | | | | | | 250,797 | | | | |
| Treatment and refining charges | | (9,573 | ) | | | | | (5,807 | ) | | | | | (17,465 | ) | | | | | (10,305 | ) | | | |
| Share-based compensation expenses | | 31 | | | | | | (532 | ) | | | | | 124 | | | | | | (182 | ) | | | |
| Inventory adjustments | | 906 | | | | | | 2,030 | | | | | | 906 | | | | | | 2,030 | | | | |
| Change in product inventory | | (11,964 | ) | | | | | 12,888 | | | | | | (10,238 | ) | | | | | (3,260 | ) | | | |
| Royalties | | 99 | | | | | | 2,854 | | | | | | 140 | | | | | | 5,218 | | | | |
| Depreciation and amortization4 | | 21,330 | | | | | | 39,494 | | | | | | 46,792 | | | | | | 72,223 | | | | |
| Cost of sales5 | | 78,726 | | | | | | 177,598 | | | | | | 174,086 | | | | | | 325,234 | | | | |
1 Per ounce of gold produced.
2 By-product credits are computed as revenue per financial statements, amortization of deferred revenue and pricing and volume adjustments. For more information, please see the realized price reconciliation table on page 26 of this MD&A.
3 Silver by-product credits do not include variable consideration adjustments with respect to stream arrangements.
4 Depreciation is based on concentrate sold.
5 As per consolidated interim financial statements.
| Manitoba | | Three months ended | | | Six months ended | |
| | | Jun. 30, 2023 | | | Jun. 30, 2022 | | | Jun. 30, 2023 | | | Jun. 30, 2022 | |
Sustaining cash cost per ounce of
gold produced | | $000s | | | $/oz | | | $000s | | | $/oz | | | $000s | | | $/oz | | | $000s | | | $/oz | |
| Gold cash cost, net of by-product credits | | 38,679 | | | 1,097 | | | (9,253 | ) | | (207 | ) | | 72,478 | | | 1,017 | | | 8,713 | | | 99 | |
| Cash sustaining capital expenditures | | 14,828 | | | 421 | | | 29,646 | | | 662 | | | 29,132 | | | 409 | | | 60,570 | | | 689 | |
| Royalties | | 99 | | | 3 | | | 2,854 | | | 64 | | | 140 | | | 1 | | | 5,218 | | | 59 | |
| Sustaining cash cost per ounce of gold produced | | 53,606 | | | 1,521 | | | 23,247 | | | 519 | | | 101,750 | | | 1,427 | | | 74,501 | | | 847 | |
Combined Unit Cost
Combined unit cost ("unit cost") and zinc plant unit cost is a non-IFRS measure that management uses as a key performance indicator to assess the performance of our mining and milling operations. Combined unit cost is calculated by dividing the cost of sales by mill throughput. This measure is utilized by management and investors to assess our cost structure and margins and compare it to similar information provided by other companies in our industry. Unlike cash cost, this measure is not impacted by variability in by-product commodity prices since there are no by-product deductions; costs associated with profit-sharing and similar costs are excluded because of their correlation to external metal prices. In addition, the unit costs are reported in the functional currency of the operation which minimizes the impact of foreign currency fluctuations. In all, the unit cost measures provide an alternative perspective on operating cost performance with minimal impact from external market prices.
The tables below present a detailed combined unit cost for the Peru and Manitoba business unit, and reconciliations between these measures to the most comparable IFRS measures of cost of sales for the three and six months ended June 30, 2023 and 2022.
| Peru | | Three months ended | | | Six months ended | |
| (in thousands except unit cost per tonne) | | Jun. 30,
2023 | | | Jun. 30,
2022 | | | Jun. 30,
2023 | | | Jun. 30,
2022 | |
| Combined unit cost per tonne processed |
| Mining | | 31,654 | | | 32,300 | | | 58,440 | | | 60,702 | |
| Milling | | 54,676 | | | 44,731 | | | 100,867 | | | 92,386 | |
| G&A1 | | 14,867 | | | 18,677 | | | 31,333 | | | 34,777 | |
| Less: Other G&A2 | | 458 | | | (1,050 | ) | | (1,081 | ) | | (1,621 | ) |
| | | 101,655 | | | 94,658 | | | 189,559 | | | 186,244 | |
| Less: COVID-19 related costs | | - | | | 1,275 | | | - | | | 3,596 | |
| Unit cost | | 101,655 | | | 93,383 | | | 189,559 | | | 182,648 | |
| Tonnes ore milled | | 7,223 | | | 7,771 | | | 14,887 | | | 14,985 | |
| Combined unit cost per tonne | | 14.07 | | | 12.02 | | | 12.73 | | | 12.19 | |
| Reconciliation to IFRS: | | | | | | | | | | | | |
| Unit cost | | 101,655 | | | 93,383 | | | 189,559 | | | 182,648 | |
| Freight & other | | 12,424 | | | 12,297 | | | 24,851 | | | 21,774 | |
| COVID-19 related costs | | - | | | 1,275 | | | - | | | 3,596 | |
| Other G&A | | (458 | ) | | 1,050 | | | 1,081 | | | 1,621 | |
| Share-based compensation expenses | | 29 | | | (100 | ) | | 15 | | | (2 | ) |
| Inventory adjustments | | - | | | (97 | ) | | - | | | (558 | ) |
| Change in product inventory | | 27,078 | | | (8,394 | ) | | 15,943 | | | (13,166 | ) |
| Royalties | | 2,479 | | | 1,117 | | | 3,144 | | | 1,971 | |
| Depreciation and amortization | | 67,340 | | | 47,811 | | | 109,300 | | | 96,173 | |
| Cost of sales3 | | 210,547 | | | 148,342 | | | 343,893 | | | 294,057 | |
1 G&A as per cash cost reconciliation above.
2 Other G&A primarily includes profit sharing costs.
3 As per consolidated interim financial statements.
| Manitoba | | Three months ended | | | Six months ended | |
| (in thousands except tonnes ore milled and unit cost per tonne) | | Jun. 30,
2023 | | | Jun. 30,
2022 | | | Jun. 30,
2023 | | | Jun. 30,
2022 | |
| Combined unit cost per tonne processed |
| Mining | | 41,681 | | | 54,500 | | | 79,433 | | | 113,933 | |
| Milling | | 15,193 | | | 20,953 | | | 30,041 | | | 42,462 | |
| G&A1 | | 6,108 | | | 23,253 | | | 16,197 | | | 46,146 | |
| Less: G&A allocated to zinc metal production and other areas | | - | | | (3,141 | ) | | - | | | (6,523 | ) |
| Less: Other G&A related to profit sharing costs | | (682 | ) | | (10,206 | ) | | (1,820 | ) | | (20,230 | ) |
| Unit cost | | 62,300 | | | 85,359 | | | 123,851 | | | 175,788 | |
| USD/CAD implicit exchange rate | | 1.34 | | | 1.27 | | | 1.34 | | | 1.27 | |
| Unit cost - C$ | | 83,659 | | | 108,806 | | | 166,853 | | | 223,310 | |
| Tonnes ore milled | | 380,538 | | | 649,318 | | | 766,199 | | | 1,300,651 | |
| Combined unit cost per tonne - C$ | | 220 | | | 168 | | | 218 | | | 172 | |
| Reconciliation to IFRS: | | | | | | | | | | | | |
| Unit cost | | 62,300 | | | 85,359 | | | 123,851 | | | 175,788 | |
| Freight & other | | 5,342 | | | 7,779 | | | 10,691 | | | 13,909 | |
| Refined (zinc) | | - | | | 14,379 | | | - | | | 32,755 | |
| G&A allocated to zinc metal production | | - | | | 3,141 | | | - | | | 6,523 | |
| Other G&A related to profit sharing | | 682 | | | 10,206 | | | 1,820 | | | 20,230 | |
| Share-based compensation expenses | | 31 | | | (532 | ) | | 124 | | | (182 | ) |
| Inventory adjustments | | 906 | | | 2,030 | | | 906 | | | 2,030 | |
| Change in product inventory | | (11,964 | ) | | 12,888 | | | (10,238 | ) | | (3,260 | ) |
| Royalties | | 99 | | | 2,854 | | | 140 | | | 5,218 | |
| Depreciation and amortization | | 21,330 | | | 39,494 | | | 46,792 | | | 72,223 | |
| Cost of sales2 | | 78,726 | | | 177,598 | | | 174,086 | | | 325,234 | |
1 G&A as per cash cost reconciliation above.
2 As per IFRS financial statements.
| Manitoba | | Three months ended | | | Six months ended | |
| (in thousands except zinc plant unit cost per pound) | | June 30, 2022 | | | June 30, 2022 | |
| Zinc plant unit cost 1 |
| Zinc plant costs | | 14,379 | | | 32,755 | |
| G&A 2 | | 23,253 | | | 46,146 | |
| Less: G&A allocated to other areas | | (9,906 | ) | | (19,393 | ) |
| Less: Other G&A related to profit sharing | | (10,206 | ) | | (20,230 | ) |
| Zinc plant unit cost | | 17,520 | | | 39,278 | |
| | | | | | | |
| USD/CAD implicit exchange rate | | 1.28 | | | 1.27 | |
| Zinc plant unit cost - C$ | | 22,475 | | | 50,036 | |
| Refined metal produced (in pounds) | | 39,311 | | | 83,542 | |
| Zinc plant unit cost per pound - C$ | | 0.57 | | | 0.60 | |
| | | | | | | |
| Reconciliation to IFRS: | | | | | | |
| Zinc plant unit cost | | 17,520 | | | 39,278 | |
| Freight & other | | 7,779 | | | 13,909 | |
| Mining | | 54,500 | | | 113,933 | |
| Milling | | 20,953 | | | 42,462 | |
| G&A allocated to other areas | | 9,906 | | | 19,393 | |
| Other G&A related to profit sharing | | 10,206 | | | 20,230 | |
| Share-based payment | | (532 | ) | | (182 | ) |
| Inventory adjustments | | 2,030 | | | 2,030 | |
| Change in product inventory | | 12,888 | | | (3,260 | ) |
| Royalties | | 2,854 | | | 5,218 | |
| Depreciation and amortization | | 39,494 | | | 72,223 | |
| Cost of sales3 | | 177,598 | | | 325,234 | |
1 The zinc plant ceased operations in June 2022. Prior year comparative information is disclosed above.
2 G&A as per cash cost reconciliation above.
3 As per IFRS financial statements.
ACCOUNTING CHANGES AND CRITICAL ESTIMATES
New standards and interpretations adopted and not yet adopted
For information on new standards and interpretations adopted and not yet adopted, refer to note 4 of our June 30, 2023 consolidated interim financial statements.
Estimates and judgements
The preparation of the consolidated interim financial statements in accordance with IFRS requires us to make judgements, estimates and assumptions that affect the application of accounting policies, reported amounts of assets and liabilities, disclosure of contingent assets and liabilities at the date of the consolidated interim financial statements, and reported amounts of revenue and expenses during the reporting period. Actual results may differ from these estimates.
We review these estimates and underlying assumptions on an ongoing basis based on our experience and other factors, including expectations of future events that we believe to be reasonable under the circumstances. Revisions to accounting estimates are recognized in the period in which the estimates are revised and in any future periods affected. Certain accounting estimates and judgements have been identified as being "critical" to the presentation of our financial condition and results of operations because they require us to make subjective and/or complex judgments about matters that are inherently uncertain; or there is a reasonable likelihood that materially different amounts could be reported under different conditions or using different assumptions and estimates.
For more information on judgements and estimates, refer to note 2 of our June 30, 2023 consolidated interim financial statements.
CHANGES IN INTERNAL CONTROL OVER FINANCIAL REPORTING
Management is responsible for establishing and maintaining adequate internal control over financial reporting ("ICFR"). ICFR is designed to provide reasonable assurance regarding the reliability of financial reporting and the preparation of consolidated interim financial statements for external purposes in accordance with IFRS.
Limitation on Scope of Design
Management has determined to limit the scope of design of disclosure controls and procedures ("DC&P") and ICFR to exclude controls, policies and procedures of Copper Mountain, which Hudbay acquired on June 20, 2023. Copper Mountain's total assets, net assets, total revenues and net loss on a combined basis constitute approximately 19%%, 27%%, 0% and 0%, respectively, of the consolidated interim financial statement amounts as of and for the six months ended June 30, 2023. This scope of limitation is in accordance with section 3.3(1)(b) of NI 52-109, which allows for an issuer to limit the design of DC&P or ICFR to exclude a business that the issuer acquired not more than 365 days before the end of the financial period to which the Chief Executive Officer's and Chief Financial Officer's certification of interim filings relate.
Other than related to the aforementioned acquisition of Copper Mountain, we did not make any changes to ICFR during the six months ended June 30, 2023 that materially affected or are reasonably likely to materially affect our ICFR.
NOTES TO READER
Forward-Looking Information
This MD&A contains forward-looking information within the meaning of applicable Canadian and United States securities legislation. All information contained in this MD&A, other than statements of current and historical fact, is forward-looking information. Often, but not always, forward-looking information can be identified by the use of words such as "plans", "expects", "budget", "guidance", "scheduled", "estimates", "forecasts", "strategy", "target", "intends", "objective", "goal", "understands", "anticipates" and "believes" (and variations of these or similar words) and statements that certain actions, events or results "may", "could", "would", "should", "might" "occur" or "be achieved" or "will be taken" (and variations of these or similar expressions). All of the forward-looking information in this MD&A is qualified by this cautionary note.
Forward-looking information includes, but is not limited to, statements with respect to the expected production and cash flow generation during the second half of the year, the expected timing for the release of an updated Copper Mountain mine technical report, the expected timing for the release of the Copper World pre-feasibility study for Phase I, the expected timing and effectiveness of the ongoing integration and optimization of Copper Mountain's operations, the expected consummation, timing and benefits of the Rockcliff Transaction and other Manitoba growth initiatives; approval of the Rockcliff Transaction by Rockcliff's shareholders, the satisfaction of the conditions precedent to the consummation of the Rockcliff Transaction, statements regarding our production, cost and capital and exploration expenditure guidance, expectations regarding reductions in discretionary spending, capital expenditures and net debt, expectations regarding the impact of inflationary pressures on our cost of operations, financial condition and prospects, our ability to deleverage and repay debt as needed, the consummation and timing of a potential partnership with Marubeni, expectations regarding our cash balance and liquidity, expectations regarding the Copper World project, the estimated timelines and pre-requisites for sanctioning the project and the pursuit of a potential minority joint venture partner, expectations regarding the permitting requirements for the Copper World project and permitting related litigation (including expected timing for receipt of such applicable permits), our ability to increase the mining rate at Lalor, the anticipated timing for completing the Stall recovery improvement program and anticipated benefits therefrom, expectations regarding the ability to conduct exploration work on the Maria Reyna and Caballito properties and to advance related drill plans, the timing of mining higher-grade ore in the Pampacancha pit and our expectations resulting therefrom, expectations regarding our ability to reduce greenhouse gas emissions, our evaluation of opportunities to reprocess tailings, expectations regarding the prospective nature of the Maria Reyna and Caballito properties, the anticipated impact of brownfield growth projects on our performance, anticipated expansion opportunities in Snow Lake and our ability to find a new anchor deposit near Snow Lake operations, anticipated drill programs and exploration activities, anticipated mine plans, anticipated metals prices and the anticipated sensitivity of our financial performance to metals prices, events that may affect our operations and development projects, anticipated cash flows from operations and related liquidity requirements, the anticipated effect of external factors on revenue, such as commodity prices, estimation of mineral reserves and resources, mine life projections, reclamation costs, economic outlook, government regulation of mining operations, and business and acquisition strategies. Forward-looking information is not, and cannot be, a guarantee of future results or events. Forward-looking information is based on, among other things, opinions, assumptions, estimates and analyses that, while considered reasonable by us at the date the forward-looking information is provided, inherently are subject to significant risks, uncertainties, contingencies and other factors that may cause actual results and events to be materially different from those expressed or implied by the forward-looking information.
The material factors or assumptions that we identified and were applied by us in drawing conclusions or making forecasts or projections set out in the forward-looking information include, but are not limited to:
- the ability to achieve production and cost guidance;
- the ability to achieve discretionary spending reductions without impacting operations;
- no significant interruptions to our operations due to social or political unrest in the regions we operate, including the navigation of the complex political and social environment in Peru;
- no interruptions to our plans for advancing the Copper World project, including with respect to timely receipt of applicable permits;
- our ability to successfully integrate and optimize the Copper Mountain operations and develop and maintain good relations with key stakeholders;
- the ability to ramp up exploration in respect of the Maria Reyna and Caballito properties and to advance related drill plans;
- the ability to satisfy the conditions to closing the Rockcliff Transaction, including the receipt of shareholder, stock exchange and court approvals;
- that no third party would make a superior proposal to the Rockcliff Transaction;
- that the definitive agreement for the Rockcliff Transaction would not be terminated in certain circumstances;
- the success of mining, processing, exploration and development activities;
- the scheduled maintenance and availability of our processing facilities;
- the accuracy of geological, mining and metallurgical estimates;
- anticipated metals prices and the costs of production;
- the supply and demand for metals we produce;
- the supply and availability of all forms of energy and fuels at reasonable prices;
- no significant unanticipated operational or technical difficulties;
- the execution of our business and growth strategies, including the success of our strategic investments and initiatives;
- the availability of additional financing, if needed;
- the ability to complete project targets on time and on budget and other events that may affect our ability to develop our projects;
- the timing and receipt of various regulatory and governmental approvals;
- the availability of personnel for our exploration, development and operational projects and ongoing employee relations;
- maintaining good relations with the employees at our operations, including in British Columbia;
- maintaining good relations with the labour unions that represent certain of our employees in Manitoba and Peru;
- maintaining good relations with the communities in which we operate, including the neighbouring Indigenous communities and local governments;
- no significant unanticipated challenges with stakeholders at our various projects;
- no significant unanticipated events or changes relating to regulatory, environmental, health and safety matters;
- no contests over title to our properties, including as a result of rights or claimed rights of Indigenous peoples or challenges to the validity of our unpatented mining claims;
- the timing and possible outcome of pending litigation and no significant unanticipated litigation;
- certain tax matters, including, but not limited to current tax laws and regulations, changes in taxation policies and the refund of certain value added taxes from the Canadian and Peruvian governments; and
- no significant and continuing adverse changes in general economic conditions or conditions in the financial markets (including commodity prices and foreign exchange rates).
The risks, uncertainties, contingencies and other factors that may cause actual results to differ materially from those expressed or implied by the forward-looking information may include, but are not limited to, risks related to the failure to effectively integrate and optimize the Copper Mountain operations, the failure to receive approval of the Rockcliff Transaction by Rockcliff's shareholders or the required court, stock exchange and other consents and approvals to effect the Rockcliff Transaction, the potential of a third party making a superior proposal to the Rockcliff Transaction, the possibility that the definitive agreement for the Rockcliff Transaction could be terminated under certain circumstances, political and social risks in the regions we operate, including the navigation of the complex political and social environment in Peru, risks generally associated with the mining industry and the current geopolitical environment, including future commodity prices, currency and interest rate fluctuations, energy and consumable prices, supply chain constraints and general cost escalation in the current inflationary environment, uncertainties related to the development and operation of our projects, risks related to the Copper World project, including in relation to permitting, litigation, project delivery and financing risks, risks related to the Lalor mine plan, including the ability to convert inferred mineral resource estimates to higher confidence categories, dependence on key personnel and employee and union relations, risks related to political or social instability, unrest or change, risks in respect of Indigenous and community relations, rights and title claims, operational risks and hazards, including the cost of maintaining and upgrading our tailings management facilities and any unanticipated environmental, industrial and geological events and developments and the inability to insure against all risks, failure of plant, equipment, processes, transportation and other infrastructure to operate as anticipated, compliance with government and environmental regulations, including permitting requirements and anti-bribery legislation, depletion of our reserves, volatile financial markets and interest rates that may affect our ability to obtain additional financing on acceptable terms, the failure to obtain required approvals or clearances from government authorities on a timely basis, uncertainties related to the geology, continuity, grade and estimates of mineral reserves and resources, and the potential for variations in grade and recovery rates, uncertain costs of reclamation activities, our ability to comply with our pension and other post-retirement obligations, our ability to abide by the covenants in our debt instruments and other material contracts, tax refunds, hedging transactions, as well as the risks discussed under the heading "Risk Factors" in our most recent Annual Information Form and under the heading "Financial Risk Management" in this MD&A .
Should one or more risk, uncertainty, contingency or other factor materialize or should any factor or assumption prove incorrect, actual results could vary materially from those expressed or implied in the forward-looking information. Accordingly, you should not place undue reliance on forward-looking information. We do not assume any obligation to update or revise any forward-looking information after the date of this MD&A or to explain any material difference between subsequent actual events and any forward-looking information, except as required by applicable law.
Note to United States Investors
This MD&A has been prepared in accordance with the requirements of the securities laws in effect in Canada, which may differ materially from the requirements of United States securities laws applicable to U.S. issuers.
Qualified Person and NI 43-101
The technical and scientific information in this MD&A related to our material mineral projects has been approved by Olivier Tavchandjian, P. Geo, our Senior Vice President, Exploration and Technical Services. Mr. Tavchandjian is a qualified person pursuant to National Instrument 43-101 - Standards of Disclosure for Mineral Projects ("NI 43-101").
Hudbay cautions that neither the historical information nor the quality assurance and quality control program that was applied during the execution of the Cook Lake drill program has been independently verified by a qualified person and, as such, Hudbay cautions that this information should not be relied upon by investors.
For a description of the key assumptions, parameters and methods used to estimate mineral reserves and resources at Hudbay's material properties, as well as data verification procedures and a general discussion of the extent to which the estimates of scientific and technical information may be affected by any known environmental, permitting, legal title, taxation, sociopolitical, marketing or other relevant factors, please see the technical reports for our material properties as filed by us on SEDAR+ at www.sedarplus.ca.
SUMMARY OF HISTORICAL RESULTS
The following unaudited tables set out a summary of quarterly and annual results for the Company.
| | | | Q2 2023 | | | Q1 2023 | | | 2022 4 | | | Q4 2022 | | | Q3 2022 | | | Q2 2022 | | | Q1 2022 | | | 2021 4 | | | Q4 2021 | | | Q3 2021 | | | Q2 2021 | |
| Consolidated Financial Condition ($000s) | |
| Cash | | $ | 179,734 | | $ | 255,563 | | $ | 225,665 | | $ | 225,665 | | $ | 286,117 | | $ | 258,556 | | $ | 213,359 | | $ | 270,989 | | $ | 270,989 | | $ | 297,451 | | $ | 294,287 | |
| Total long-term debt | | | 1,370,682 | | | 1,225,023 | | | 1,184,162 | | | 1,184,162 | | | 1,183,237 | | | 1,182,143 | | | 1,181,119 | | | 1,180,274 | | | 1,180,274 | | | 1,182,612 | | | 1,181,195 | |
| Net debt1 | | | 1,190,948 | | | 969,460 | | | 958,497 | | | 958,497 | | | 897,120 | | | 923,587 | | | 967,760 | | | 909,285 | | | 909,285 | | | 885,161 | | | 886,908 | |
| Consolidated Financial Performance ($000s except per share amounts) | |
| Revenue | | $ | 312,166 | | $ | 295,219 | | $ | 1,461,440 | | $ | 321,196 | | $ | 346,171 | | $ | 415,454 | | $ | 378,619 | | $ | 1,501,998 | | $ | 425,170 | | $ | 358,961 | | $ | 404,242 | |
| Cost of sales | | | 289,273 | | | 228,706 | | | 1,184,552 | | | 251,520 | | | 313,741 | | | 325,940 | | | 293,351 | | | 1,370,979 | | | 343,426 | | | 444,379 | | | 322,060 | |
| Earnings (loss) before tax | | | (30,731 | ) | | 17,430 | | | 95,815 | | | (14,287 | ) | | (263 | ) | | 21,504 | | | 88,861 | | | (202,751 | ) | | (149 | ) | | (147,830 | ) | | 14,819 | |
| Earnings (loss) | | | (14,932 | ) | | 5,457 | | | 70,382 | | | (17,441 | ) | | (8,135 | ) | | 32,143 | | | 63,815 | | | (244,358 | ) | | (10,453 | ) | | (170,411 | ) | | (3,395 | ) |
| Basic and diluted earnings (loss) per share | $ | (0.05 | ) | $ | 0.02 | | $ | 0.27 | | $ | (0.07 | ) | $ | (0.03 | ) | $ | 0.12 | | $ | 0.24 | | $ | (0.93 | ) | $ | (0.04 | ) | $ | (0.65 | ) | $ | (0.01 | ) |
| Adjusted earnings (loss) per share 1 | $ | (0.07 | ) | $ | 0.00 | | $ | 0.10 | | $ | 0.01 | | $ | (0.05 | ) | $ | 0.12 | | $ | 0.02 | | $ | 0.09 | | $ | 0.13 | | $ | 0.00 | | $ | 0.02 | |
| Operating cash flow before change in non-cash working capital | | 55,878 | | | 85,608 | | | 391,729 | | | 109,148 | | | 81,617 | | | 123,911 | | | 77,615 | | | 483,862 | | | 156,917 | | | 103,509 | | | 132,786 | |
| Adjusted EBITDA (in $ millions) 1 | | 81.2 | | | 101.9 | | | 475.9 | | | 124.7 | | | 99.3 | | | 141.4 | | | 110.2 | | | 547.8 | | | 180.8 | | | 119.2 | | | 143.2 | |
| Consolidated Operational Performance | | | | | | | | | | | | | | | | | | | | | | |
| Contained metal in concentrate and doré produced 2 | | | | | | | |
| Copper | tonnes | | 21,715 | | | 22,562 | | | 104,173 | | | 29,305 | | | 24,498 | | | 25,668 | | | 24,702 | | | 99,470 | | | 28,198 | | | 23,245 | | | 23,474 | |
| Gold | ounces | | 48,996 | | | 47,240 | | | 219,700 | | | 53,920 | | | 53,179 | | | 58,645 | | | 53,956 | | | 193,783 | | | 64,159 | | | 54,276 | | | 39,848 | |
| Silver | ounces | | 612,310 | | | 702,809 | | | 3,161,294 | | | 795,015 | | | 717,069 | | | 864,853 | | | 784,357 | | | 3,045,481 | | | 899,713 | | | 763,177 | | | 685,916 | |
| Zinc | tonnes | | 8,758 | | | 9,846 | | | 55,381 | | | 6,326 | | | 9,750 | | | 17,053 | | | 22,252 | | | 93,529 | | | 23,207 | | | 20,844 | | | 21,538 | |
| Molybdenum | tonnes | | 414 | | | 289 | | | 1,377 | | | 344 | | | 437 | | | 390 | | | 207 | | | 1,146 | | | 275 | | | 282 | | | 295 | |
| Payable metal in concentrate and doré sold | | | | | | | | | | | | | | | | | | | | | | | | | |
| Copper | tonnes | | 23,078 | | | 18,541 | | | 94,473 | | | 25,415 | | | 24,799 | | | 23,650 | | | 20,609 | | | 92,200 | | | 24,959 | | | 21,136 | | | 25,176 | |
| Gold | ounces | | 47,533 | | | 49,720 | | | 213,415 | | | 47,256 | | | 66,932 | | | 50,884 | | | 48,343 | | | 168,358 | | | 56,927 | | | 47,843 | | | 38,205 | |
| Silver | ounces | | 805,448 | | | 541,884 | | | 2,978,485 | | | 559,306 | | | 816,416 | | | 738,171 | | | 864,591 | | | 2,427,508 | | | 638,640 | | | 701,601 | | | 577,507 | |
| Zinc 3 | tonnes | | 8,641 | | | 5,628 | | | 59,043 | | | 8,230 | | | 12,714 | | | 20,793 | | | 17,306 | | | 96,435 | | | 21,112 | | | 21,619 | | | 25,361 | |
| Molybdenum | tonnes | | 314 | | | 254 | | | 1,352 | | | 421 | | | 511 | | | 208 | | | 213 | | | 1,098 | | | 245 | | | 304 | | | 265 | |
| Cash cost 1 | $/lb | $ | 1.60 | | $ | 0.85 | | $ | 0.86 | | $ | 1.08 | | $ | 0.58 | | $ | 0.65 | | $ | 1.11 | | $ | 0.74 | | $ | 0.51 | | $ | 0.62 | | $ | 0.84 | |
| Sustaining cash cost 1 | $/lb | $ | 2.73 | | $ | 1.83 | | $ | 2.07 | | $ | 2.21 | | $ | 1.91 | | $ | 1.87 | | $ | 2.29 | | $ | 2.07 | | $ | 1.95 | | $ | 1.97 | | $ | 2.25 | |
| All-in sustaining cash cost 1 | $/lb | $ | 2.98 | | $ | 2.07 | | $ | 2.26 | | $ | 2.41 | | $ | 2.16 | | $ | 1.93 | | $ | 2.54 | | $ | 2.30 | | $ | 2.20 | | $ | 2.18 | | $ | 2.48 | |
1Net debt, adjusted earnings (loss) per share, adjusted EBITDA, cash cost, sustaining cash cost and all-in sustaining cash cost per pound of copper produced, net of by-product credits, are non-IFRS financial performance measures with no standardized definition under IFRS. For further information and a detailed reconciliation, please see discussion under the "Non-IFRS Financial Performance Measures" section of this MD&A. The above table sets forth selected non-IFRS financial performance measures for each of our nine most recently completed quarters and three most recently completed years; detailed reconciliations for non-comparable prior periods can be found in our MD&A for these prior periods in the "Non-IFRS Financial Performance Measures" section of these documents.
2 Metal reported in concentrate is prior to deductions associated with smelter contract terms.
3 Includes refined zinc metal sold.
4 Annual consolidated results may not calculate based on amounts presented in this table due to rounding.
| | | | Q2 2023 | | | Q1 2023 | | | 2022 5 | | | Q4 2022 | | | Q3 2022 | | | Q2 2022 | | | Q1 2022 | | | 2021 5 | | | Q4 2021 | | | Q3 2021 | | | Q2 2021 | |
| Peru Operations | | | | | | | | | | | | | | | | | | | | | | | | | | | | | | | | | | |
| Constancia ore mined1 | tonnes | | 3,647,399 | | | 3,403,181 | | | 25,840,435 | | | 5,614,918 | | | 6,300,252 | | | 7,017,114 | | | 6,908,151 | | | 29,714,327 | | | 7,742,469 | | | 6,208,019 | | | 8,016,373 | |
| Copper | % | | 0.31 | | | 0.34 | | | 0.35 | | | 0.40 | | | 0.36 | | | 0.33 | | | 0.32 | | | 0.31 | | | 0.33 | | | 0.30 | | | 0.30 | |
| Gold | g/tonne | | 0.04 | | | 0.04 | | | 0.04 | | | 0.04 | | | 0.05 | | | 0.04 | | | 0.04 | | | 0.04 | | | 0.04 | | | 0.04 | | | 0.04 | |
| Silver | g/tonne | | 2.49 | | | 2.52 | | | 3.40 | | | 3.48 | | | 3.38 | | | 3.53 | | | 3.22 | | | 2.88 | | | 2.81 | | | 2.76 | | | 3.02 | |
| Molybdenum | % | | 0.01 | | | 0.01 | | | 0.01 | | | 0.01 | | | 0.01 | | | 0.01 | | | 0.01 | | | 0.01 | | | 0.01 | | | 0.01 | | | 0.01 | |
| Pampacancha ore mined1 | tonnes | | 2,408,495 | | | 897,295 | | | 8,319,250 | | | 3,771,629 | | | 2,488,928 | | | 1,211,387 | | | 847,306 | | | 5,141,001 | | | 2,107,196 | | | 2,050,813 | | | 982,992 | |
| Copper | % | | 0.36 | | | 0.49 | | | 0.33 | | | 0.37 | | | 0.29 | | | 0.29 | | | 0.27 | | | 0.27 | | | 0.27 | | | 0.27 | | | 0.26 | |
| Gold | g/tonne | | 0.34 | | | 0.52 | | | 0.29 | | | 0.29 | | | 0.23 | | | 0.28 | | | 0.43 | | | 0.30 | | | 0.34 | | | 0.27 | | | 0.27 | |
| Silver | g/tonne | | 2.81 | | | 5.12 | | | 4.06 | | | 3.84 | | | 4.30 | | | 4.25 | | | 4.06 | | | 4.02 | | | 4.26 | | | 3.58 | | | 4.43 | |
| Molybdenum | % | | 0.02 | | | 0.01 | | | 0.01 | | | 0.01 | | | 0.01 | | | 0.01 | | | 0.01 | | | 0.01 | | | 0.01 | | | 0.01 | | | 0.01 | |
| Ore milled | tonnes | | 7,223,048 | | | 7,663,728 | | | 30,522,294 | | | 7,795,735 | | | 7,742,020 | | | 7,770,706 | | | 7,213,833 | | | 28,809,755 | | | 8,048,925 | | | 6,985,035 | | | 7,413,043 | |
| Copper | % | | 0.31 | | | 0.33 | | | 0.34 | | | 0.41 | | | 0.34 | | | 0.32 | | | 0.31 | | | 0.32 | | | 0.33 | | | 0.30 | | | 0.31 | |
| Gold | g/tonne | | 0.09 | | | 0.08 | | | 0.09 | | | 0.12 | | | 0.08 | | | 0.09 | | | 0.08 | | | 0.08 | | | 0.11 | | | 0.11 | | | 0.07 | |
| Silver | g/tonne | | 2.78 | | | 3.69 | | | 3.58 | | | 3.93 | | | 3.48 | | | 3.64 | | | 3.26 | | | 3.35 | | | 3.67 | | | 3.93 | | | 2.88 | |
| Molybdenum | % | | 0.01 | | | 0.01 | | | 0.01 | | | 0.01 | | | 0.01 | | | 0.01 | | | 0.01 | | | 0.01 | | | 0.01 | | | 0.01 | | | 0.01 | |
| Copper recovery | % | | 80.0 | | | 81.7 | | | 85.0 | | | 85.1 | | | 84.5 | | | 85.0 | | | 85.3 | | | 84.6 | | | 86.0 | | | 84.9 | | | 83.3 | |
| Gold recovery | % | | 61.1 | | | 56.8 | | | 63.6 | | | 69.6 | | | 61.9 | | | 60.3 | | | 59.8 | | | 64.6 | | | 63.6 | | | 71.9 | | | 62.2 | |
| Silver recovery | % | | 65.1 | | | 60.7 | | | 65.7 | | | 66.5 | | | 65.2 | | | 64.2 | | | 66.9 | | | 63.7 | | | 60.8 | | | 59.1 | | | 68.2 | |
| Molybdenum recovery | % | | 40.5 | | | 34.8 | | | 34.8 | | | 37.7 | | | 41.0 | | | 38.8 | | | 21.1 | | | 31.5 | | | 26.7 | | | 33.5 | | | 33.3 | |
| Contained metal in concentrate | | | | | | | | | | | | | | | | | | | | | | | | | | | | | | | | | |
| Copper | tonnes | | 17,682 | | | 20,517 | | | 89,395 | | | 27,047 | | | 22,302 | | | 20,880 | | | 19,166 | | | 77,813 | | | 22,856 | | | 18,072 | | | 19,058 | |
| Gold | ounces | | 12,998 | | | 11,206 | | | 58,229 | | | 20,860 | | | 12,722 | | | 13,858 | | | 10,789 | | | 50,306 | | | 17,917 | | | 17,531 | | | 10,220 | |
| Silver | ounces | | 419,642 | | | 552,167 | | | 2,309,352 | | | 655,257 | | | 564,299 | | | 584,228 | | | 505,568 | | | 1,972,949 | | | 578,140 | | | 521,036 | | | 468,057 | |
| Molybdenum | tonnes | | 414 | | | 289 | | | 1,377 | | | 344 | | | 437 | | | 390 | | | 207 | | | 1,146 | | | 275 | | | 282 | | | 295 | |
| Payable metal sold | | | | | | | | | | | | | | | | | | | | | | | | | | | | | | | | | | |
| Copper | tonnes | | 21,207 | | | 16,316 | | | 79,805 | | | 23,789 | | | 20,718 | | | 18,473 | | | 16,825 | | | 71,398 | | | 20,551 | | | 16,065 | | | 19,946 | |
| Gold | ounces | | 14,524 | | | 11,781 | | | 49,968 | | | 15,116 | | | 11,970 | | | 8,430 | | | 14,452 | | | 41,807 | | | 16,304 | | | 16,902 | | | 5,638 | |
| Silver | ounces | | 671,532 | | | 392,207 | | | 2,045,678 | | | 411,129 | | | 513,470 | | | 484,946 | | | 636,133 | | | 1,490,651 | | | 380,712 | | | 457,263 | | | 315,064 | |
| Molybdenum | tonnes | | 314 | | | 254 | | | 1,352 | | | 421 | | | 511 | | | 208 | | | 213 | | | 1,098 | | | 245 | | | 304 | | | 265 | |
| Peru combined unit operating cost 2,3,4 | $/tonne | $ | 14.07 | | $ | 11.47 | | $ | 12.78 | | $ | 13.64 | | $ | 13.06 | | $ | 12.02 | | $ | 12.37 | | $ | 10.70 | | $ | 9.96 | | $ | 10.93 | | $ | 10.40 | |
| Peru cash cost3 | $/lb | $ | 2.14 | | $ | 1.36 | | $ | 1.58 | | $ | 1.34 | | $ | 1.68 | | $ | 1.82 | | $ | 1.54 | | $ | 1.54 | | $ | 1.28 | | $ | 1.26 | | $ | 1.85 | |
| Peru sustaining cash cost3 | $/lb | $ | 3.06 | | $ | 2.12 | | $ | 2.35 | | $ | 2.09 | | $ | 2.46 | | $ | 2.62 | | $ | 2.27 | | $ | 2.46 | | $ | 2.46 | | $ | 2.31 | | $ | 2.69 | |
1 Reported tonnes and grade for ore mined are estimates based on mine plan assumptions and may not fully reconcile to ore milled.
2 Reflects combined mine, mill and general and administrative ("G&A") costs per tonne of ore milled. Reflects the deduction of expected capitalized stripping costs.
3 Combined unit costs, cash cost, and sustaining cash cost per pound of copper produced, net of by-product credits, are non-IFRS financial performance measures with no standardized definition under IFRS. For further information and a detailed reconciliation, please see the discussion under the "Non-IFRS Financial Performance Measures" section of this MD&A. The above table sets forth selected non-IFRS financial performance measures for each of our nine most recently completed quarters and three most recently completed years; detailed reconciliations for non-comparable prior periods can be found in our MD&A for these prior periods in the "Non-IFRS Financial Performance Measures" section of these documents.
4 2022 and 2021 combined unit costs exclude COVID-19 related costs.
5 Annual consolidated results may not calculate based on amounts presented in this table due to rounding.
| | | | Q2 2023 | | | Q1 2023 | | | 2022 1 | | | Q4 2022 | | | Q3 2022 | | | Q2 2022 | | | Q1 2022 | | | 2021 1 | | | Q4 2021 | | | Q3 2021 | | | Q2 2021 | |
| Manitoba Operations | | | | | | | | | | | | | | | | | | | | | | | | | | | | | | | | | | |
| Lalor ore mined | tonnes | | 413,255 | | | 373,599 | | | 1,516,203 | | | 369,453 | | | 347,345 | | | 412,653 | | | 386,752 | | | 1,593,141 | | | 422,208 | | | 392,380 | | | 356,951 | |
| Copper | % | | 0.81 | | | 0.57 | | | 0.73 | | | 0.73 | | | 0.71 | | | 0.70 | | | 0.80 | | | 0.71 | | | 0.78 | | | 0.86 | | | 0.64 | |
| Zinc | % | | 3.14 | | | 3.32 | | | 3.14 | | | 2.17 | | | 3.27 | | | 3.06 | | | 4.06 | | | 4.23 | | | 4.19 | | | 3.60 | | | 3.81 | |
| Gold | g/tonne | | 4.07 | | | 3.96 | | | 4.00 | | | 4.00 | | | 4.57 | | | 3.73 | | | 3.76 | | | 3.41 | | | 3.92 | | | 3.85 | | | 3.19 | |
| Silver | g/tonne | | 23.27 | | | 18.24 | | | 21.96 | | | 19.37 | | | 21.27 | | | 23.95 | | | 22.94 | | | 24.66 | | | 30.35 | | | 22.13 | | | 22.98 | |
| 777 ore mined | tonnes | | - | | | - | | | 484,355 | | | - | | | - | | | 226,286 | | | 258,069 | | | 1,053,710 | | | 266,744 | | | 256,536 | | | 255,170 | |
| Copper | % | | - | | | - | | | 1.12 | | | - | | | - | | | 1.03 | | | 1.19 | | | 1.28 | | | 1.13 | | | 1.06 | | | 0.82 | |
| Zinc | % | | - | | | - | | | 3.83 | | | - | | | - | | | 3.51 | | | 4.12 | | | 3.91 | | | 4.16 | | | 3.88 | | | 3.57 | |
| Gold | g/tonne | | - | | | - | | | 1.66 | | | - | | | - | | | 1.62 | | | 1.69 | | | 2.03 | | | 1.80 | | | 1.96 | | | 1.97 | |
| Silver | g/tonne | | - | | | - | | | 20.85 | | | - | | | - | | | 20.63 | | | 21.05 | | | 25.25 | | | 25.02 | | | 22.99 | | | 23.35 | |
| Stall & New Britannia Concentrator Combined: | | | | | | | | | | | | | | | | | | | | | | | | | | | |
| Ore milled | tonnes | | 380,538 | | | 385,661 | | | 1,510,907 | | | 345,492 | | | 362,108 | | | 406,006 | | | 397,301 | | | 1,506,756 | | | 419,727 | | | 408,201 | | | 317,484 | |
| Copper | % | | 0.82 | | | 0.60 | | | 0.75 | | | 0.73 | | | 0.69 | | | 0.73 | | | 0.82 | | | 0.72 | | | 0.75 | | | 0.82 | | | 0.68 | |
| Zinc | % | | 3.12 | | | 3.31 | | | 3.30 | | | 2.31 | | | 3.33 | | | 3.20 | | | 4.24 | | | 4.30 | | | 4.12 | | | 3.58 | | | 4.06 | |
| Gold | g/tonne | | 4.13 | | | 3.99 | | | 4.08 | | | 3.98 | | | 4.60 | | | 3.93 | | | 3.87 | | | 3.42 | | | 3.90 | | | 3.84 | | | 3.19 | |
| Silver | g/tonne | | 23.51 | | | 19.08 | | | 22.15 | | | 20.40 | | | 20.66 | | | 23.98 | | | 23.16 | | | 24.95 | | | 30.07 | | | 23.32 | | | 22.02 | |
| Copper recovery | % | | 89.4 | | | 88.8 | | | 88.6 | | | 89.2 | | | 88.3 | | | 89.5 | | | 87.5 | | | 86.8 | | | 88.7 | | | 84.3 | | | 88.8 | |
| Zinc recovery | % | | 73.8 | | | 84.4 | | | 79.0 | | | 79.4 | | | 80.9 | | | 75.5 | | | 85.7 | | | 88.9 | | | 87.4 | | | 88.2 | | | 88.1 | |
| Gold recovery | % | | 57.3 | | | 62.0 | | | 59.2 | | | 58.8 | | | 60.9 | | | 58.8 | | | 58.4 | | | 54.9 | | | 54.6 | | | 53.4 | | | 55.5 | |
| Silver recovery | % | | 58.9 | | | 58.8 | | | 58.1 | | | 56.1 | | | 57.6 | | | 58.1 | | | 60.0 | | | 54.4 | | | 53.9 | | | 52.7 | | | 55.1 | |
| Flin Flon Concentrator: | | | | | | | | | | | | | | | | | | | | | | | | | | | | | | | | | |
| Ore milled | tonnes | | - | | | - | | | 497,344 | | | - | | | - | | | 243,312 | | | 254,032 | | | 1,133,516 | | | 262,565 | | | 258,062 | | | 329,503 | |
| Copper | % | | - | | | - | | | 1.11 | | | - | | | - | | | 1.02 | | | 1.20 | | | 1.23 | | | 1.12 | | | 1.06 | | | 0.89 | |
| Zinc | % | | - | | | - | | | 3.87 | | | - | | | - | | | 3.60 | | | 4.13 | | | 3.95 | | | 4.16 | | | 3.86 | | | 3.65 | |
| Gold | g/tonne | | - | | | - | | | 1.67 | | | - | | | - | | | 1.64 | | | 1.70 | | | 2.04 | | | 1.78 | | | 1.96 | | | 2.06 | |
| Silver | g/tonne | | - | | | - | | | 21.00 | | | - | | | - | | | 20.76 | | | 21.23 | | | 24.90 | | | 25.04 | | | 22.93 | | | 23.65 | |
| Copper recovery | % | | - | | | - | | | 86.7 | | | - | | | - | | | 85.5 | | | 87.6 | | | 87.7 | | | 86.7 | | | 85.2 | | | 84.8 | |
| Zinc recovery | % | | - | | | - | | | 83.0 | | | - | | | - | | | 82.9 | | | 83.2 | | | 83.0 | | | 83.1 | | | 82.2 | | | 84.8 | |
| Gold recovery | % | | - | | | - | | | 57.1 | | | - | | | - | | | 56.4 | | | 57.7 | | | 58.5 | | | 59.2 | | | 58.1 | | | 52.9 | |
| Silver recovery | % | | - | | | - | | | 51.8 | | | - | | | - | | | 51.0 | | | 52.5 | | | 45.1 | | | 45.6 | | | 42.4 | | | 37.5 | |
1 Annual consolidated results may not calculate based on amounts presented in this table due to rounding.
| | | | Q2 2023 | | | Q1 2023 | | | 2022 4 | | | Q4 2022 | | | Q3 2022 | | | Q2 2022 | | | Q1 2022 | | | 2021 4 | | | Q4 2021 | | | Q3 2021 | | | Q2 2021 | |
| Manitoba Operations (continued) | | | | | | | | | | | | | | | | | | | | | | | | | | | | | | | | | |
| Total Manitoba contained metal in concentrate produced | | | | | | | |
| Copper | tonnes | | 2,794 | | | 2,045 | | | 14,778 | | | 2,258 | | | 2,196 | | | 4,788 | | | 5,536 | | | 21,657 | | | 5,342 | | | 5,173 | | | 4,416 | |
| Zinc | tonnes | | 8,758 | | | 9,846 | | | 55,381 | | | 6,326 | | | 9,750 | | | 17,053 | | | 22,252 | | | 93,529 | | | 23,207 | | | 20,844 | | | 21,538 | |
| Gold | ounces | | 28,948 | | | 30,647 | | | 132,764 | | | 25,961 | | | 32,570 | | | 37,346 | | | 36,887 | | | 134,475 | | | 37,644 | | | 36,341 | | | 29,628 | |
| Silver | ounces | | 169,519 | | | 139,064 | | | 799,108 | | | 127,099 | | | 138,615 | | | 264,651 | | | 268,743 | | | 1,066,003 | | | 315,054 | | | 242,131 | | | 217,859 | |
| Precious metal in doré produced | | | | | | | | | | | | | | | | | | | | | | | | | | | | | | | | | | |
| Gold | ounces | | 6,305 | | | 5,387 | | | 28,707 | | | 7,099 | | | 7,887 | | | 7,441 | | | 6,280 | | | 9,002 | | | 8,598 | | | 404 | | | — | |
| Silver | ounces | | 11,231 | | | 11,578 | | | 52,834 | | | 12,659 | | | 14,155 | | | 15,974 | | | 10,046 | | | 6,529 | | | 6,519 | | | 10 | | | — | |
| Total Manitoba payable metal sold in concentrate and doré | | | | | | | | | | | | | | | | | | | | | | | | | |
| Copper | tonnes | | 1,871 | | | 2,225 | | | 14,668 | | | 1,626 | | | 4,081 | | | 5,177 | | | 3,784 | | | 20,802 | | | 4,408 | | | 5,071 | | | 5,230 | |
| Zinc1 | tonnes | | 8,641 | | | 5,628 | | | 59,043 | | | 8,230 | | | 12,714 | | | 20,793 | | | 17,306 | | | 96,435 | | | 21,112 | | | 21,619 | | | 25,361 | |
| Gold | ounces | | 33,009 | | | 37,939 | | | 163,447 | | | 32,140 | | | 54,962 | | | 42,454 | | | 33,891 | | | 126,551 | | | 40,623 | | | 30,941 | | | 32,567 | |
| Silver | ounces | | 133,916 | | | 149,677 | | | 932,807 | | | 148,177 | | | 302,946 | | | 253,225 | | | 228,458 | | | 936,857 | | | 257,928 | | | 244,338 | | | 262,443 | |
| Manitoba combined unit operating cost 2,3 | C$/tonne | $ | 220 | | $ | 216 | | $ | 195 | | $ | 241 | | $ | 235 | | $ | 168 | | $ | 176 | | $ | 154 | | $ | 168 | | $ | 147 | | $ | 148 | |
| Manitoba gold cash cost 3, 5 | $/oz | $ | 1,097 | | $ | 938 | | $ | 297 | | $ | 922 | | $ | 216 | | $ | (207 | ) | $ | 416 | | $ | — | | $ | — | | $ | — | | $ | — | |
| Manitoba sustaining gold cash cost 3,5 | $/oz | $ | 1,521 | | $ | 1,336 | | $ | 1,091 | | $ | 1,795 | | $ | 1,045 | | $ | 519 | | $ | 1,187 | | $ | — | | $ | — | | $ | — | | $ | — | |
1 Includes refined zinc metal sold.
2 Reflects combined mine, mill and G&A costs per tonne of milled ore.
3 Combined unit costs, cash cost, and sustaining cash cost per pound of copper produced, cash cost, and sustaining cash cost per ounce of gold produced, net of by-product credits, are non-IFRS financial performance measures with no standardized definition under IFRS. For further information and a detailed reconciliation, please see the discussion under the "Non-IFRS Financial Performance Measures" section of this MD&A. The above table sets forth selected non-IFRS financial performance measures for each of our nine most recently completed quarters and three most recently completed years; detailed reconciliations for non-comparable prior periods can be found in our MD&A for these prior periods in the "Non-IFRS Financial Performance Measures" section of these documents.
4 Annual consolidated results may not calculate based on amounts presented in this table due to rounding.
5 Cash cost and sustaining cash cost per ounce of gold produced, net of by-product credits were introduced in 2022 and do not have a published comparative.