
Management's Discussion and Analysis of
Results of Operations and Financial Condition
For the three and nine months ended
September 30, 2024
November 12, 2024
INTRODUCTION
This Management's Discussion and Analysis ("MD&A") dated November 12, 2024 is intended to supplement Hudbay Minerals Inc.'s unaudited condensed consolidated interim financial statements and related notes for the three and nine months ended September 30, 2024 and 2023 (the "consolidated interim financial statements"). The consolidated interim financial statements have been prepared in accordance with International Financial Reporting Standards ("IFRS"), including International Accounting Standard 34, Interim Financial Reporting, as issued by the International Accounting Standards Board ("IASB").
References to "Hudbay", the "Company", "we", "us", "our" or similar terms refer to Hudbay Minerals Inc. and its direct and indirect subsidiaries as at September 30, 2024.
Readers should be aware that:
- This MD&A contains certain "forward-looking statements" and "forward-looking information" (collectively, "forward-looking information") that are subject to risk factors set out in a cautionary note contained in our MD&A.
- This MD&A includes information with respect to Hudbay's acquisition of Copper Mountain, which was completed on June 20, 2023, including the results of the Copper Mountain mine's operations from the date of acquisition, June 20, 2023.
- This MD&A has been prepared in accordance with the requirements of the securities laws in effect in Canada, which may differ materially from the requirements of United States securities laws applicable to US issuers.
- We use a number of non-IFRS financial performance measures in our MD&A, which do not have standardized meaning under IFRS. For further information and detailed reconciliations of such measures, please see the discussion under the "Non-IFRS Financial Performance Measures" section herein.
- The technical and scientific information in this MD&A has been approved by qualified persons based on a variety of assumptions and estimates. Please see the discussion under the "Qualified Person and NI 43-101" section herein.
Readers are also urged to review the "Notes to Reader" section beginning on page 63 of this MD&A.
Additional information regarding Hudbay, including the risks related to our business and those that are reasonably likely to affect our consolidated interim financial statements in the future, is contained in our continuous disclosure materials, including our most recent AIF, consolidated interim financial statements and Management Information Circular available on SEDAR+ at www.sedarplus.ca and on EDGAR at www.sec.gov.
All amounts are in US dollars unless otherwise noted.
OUR BUSINESS
We are a diversified mining company with long-life assets in North and South America. Our Constancia operations in Cusco (Peru) produce copper with gold, silver and molybdenum by-products. Our Snow Lake operations in Manitoba (Canada) produce gold with copper, zinc and silver by-products. Our Copper Mountain operations in British Columbia (Canada) produce copper with gold and silver by-products. We have a copper-focused project development pipeline that includes the Copper World project in Arizona (United States) and the Mason project in Nevada (United States), and our growth strategy is focused on the exploration, development, operation, and optimization of properties we already control, as well as other mineral assets we may acquire that fit our strategic criteria. We are governed by the Canada Business Corporations Act and our shares are listed under the symbol "HBM" on the Toronto Stock Exchange, New York Stock Exchange and Bolsa de Valores de Lima.
OUR PURPOSE
We care about our people, our communities and our planet. Hudbay provides the metals the world needs. We work sustainably, transform lives and create better futures for communities.
We transform lives: We invest in our employees, their families and local communities through long-term employment, local procurement and economic development to improve their quality of life and ensure the communities benefit from our presence.
We operate responsibly: From exploration to closure, we operate safely and responsibly, we welcome innovation and we strive to minimize our environmental footprint while following leading operating practices in all facets of mining.
We provide critical metals: We produce copper and other metals needed for everyday products and essential for applications to support the energy transition toward a more sustainable future.
SUMMARY
Delivered Strong Third Quarter Operating and Financial Results, Led by Record Gold Production from Manitoba Operations; 2024 Production Guidance Reaffirmed and Cost Guidance Further Improved
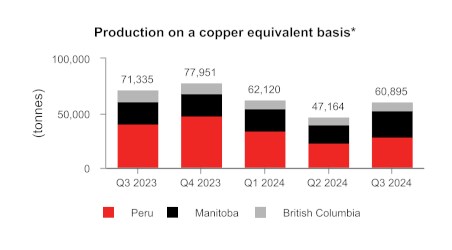
- Achieved consolidated copper production of 31,354 tonnes, in line with quarterly production cadence, and gold production of 89,073 ounces, far exceeding expectations, in the third quarter of 2024, representing an increase of 10% and 52%, respectively, from the second quarter of 2024.
- Enhanced operating platform delivered strong quarterly performance with record gold production at our Manitoba operations, the completion of planned stripping activities at Pampacancha in Peru and the benefits from stabilization and optimization initiatives at the Copper Mountain mine in British Columbia.
- Reaffirmed full year 2024 consolidated production guidance for all metals. Full-year consolidated copper production expected to trend towards the lower end of the guidance range and consolidated gold production expected to trend towards the higher end of the guidance range.
- Strong operating cost performance with consolidated cash cost1 and sustaining cash cost1 per pound of copper produced, net of by-product credits1, in the third quarter of 2024 of $0.18 and $1.71, respectively, an improvement of 84% and 35%, respectively, from the second quarter of 2024.
- Further improved 2024 annual operating cost guidance with decreased consolidated cash cost1 guidance range of $0.65 to $0.85 per pound, an additional improvement from the previously updated guidance range of $0.90 to $1.10 per pound, and decreased consolidated sustaining cash cost guidance range of $1.75 to $2.20 per pound from original guidance of $2.00 to $2.45 per pound, as a result of increased exposure to gold by-product credits and continued strong cost control across all operations.
- Peru operations continued to benefit from strong mill throughput, achieving a quarterly average of approximately 88,000 tonnes per day in the third quarter. The Pampacancha stripping program to advance to higher grades was completed in late September and is on track to achieve higher copper and gold grade ore in the fourth quarter. Peru operations produced 21,220 tonnes of copper and 20,331 ounces of gold in the third quarter of 2024, in line with quarterly cadence expectations. Peru cash cost per pound of copper produced, net of by-product credits1, $1.80 in the third quarter and is expected to improve in the fourth quarter of 2024 with continued strong cost control and higher copper and gold production.
- Manitoba operations produced 62,468 ounces of gold in the third quarter of 2024, far exceeding management's quarterly cadence expectations and achieving record quarterly production levels as New Britannia continues to operate well above nameplate and budgeted throughput levels and the Lalor mine continues to achieve better-than-expected gold grades. Manitoba cash cost per ounce of gold produced, net of by-product credits1, was $372 during the third quarter of 2024, a decrease of 52% compared to the second quarter of 2024. Full year Manitoba gold production is expected to exceed the top end of the 2024 guidance range.
- British Columbia operations produced 6,736 tonnes of copper at a cash cost per pound of copper produced, net of by-product credits1, of $1.81 in the third quarter of 2024. Achieved record quarterly copper recoveries of 84% and strong unit cost performance as a result of the successful operational stabilization efforts as mine stripping activities accelerate and mill optimization initiatives are underway. Full-year British Columbia copper production is expected to be slightly below the lower end of the 2024 guidance range.
- Achieved revenue of $485.8 million and operating cash flow before change in non-cash working capital of $186.3 million in the third quarter of 2024. Strong financial results were driven by higher realized gold prices as well as robust gold production in Manitoba, while delivering on higher recovery, throughput and cost control initiatives across all business units.
- Third quarter net earnings attributable to owners and earnings per share attributable to owners were $49.8 million and $0.13, respectively. After adjusting for items on a pre-tax basis such as a non-cash gain of $2.0 million related to a quarterly revaluation of our closed site environmental reclamation provision, a $5.2 million mark-to-market revaluation loss on various instruments such as the gold prepayment liability, unrealized strategic gold and copper hedges, investments and share-based compensation and a $2.2 million write-down of PP&E, among other items, third quarter adjusted earnings1 per share attributable to owners was $0.13.
- Adjusted EBITDA1 was $206.2 million during the third quarter of 2024, a 42% increase compared to the second quarter of 2024.
- Cash and cash equivalents and short-term investments increased by $233.5 million to $483.3 million during the first nine months of 2024 due to a successful equity offering and strong operating cash flows bolstered by higher copper and gold prices, which enabled a $412.1 million reduction in net debt1 during the first nine months of 2024.
Accelerated Deleveraging and Improved Balance Sheet Flexibility
- Hudbay's unique copper and gold diversification in Peru and North America provides exposure to higher copper and gold prices and attractive free cash flow generation.
- While a majority of revenues continue to be from copper, gold is representing an increasing portion of total revenues at 36% in the third quarter of 2024 and 33% year-to-date, compared to 27% and 26%, respectively, for the same periods in 2023, driven by higher gold production and strong leverage to higher gold prices.
- During the third quarter of 2024, deleveraging efforts continued with additional open market purchases of approximately $48.5 million of our senior unsecured notes in July and August 2024 at a discount. Long-term debt reduced to $1,108.9 million at September 30, 2024 from $1,287.5 million at December 31, 2023.
- On August 30, 2024, Hudbay completed the final monthly payment to settle the gold prepayment liability that was used to fund the refurbishment of the New Britannia gold mill. The elimination of the gold prepayment liability will further increase the Company's exposure to higher gold production in Snow Lake.
- Impressive operating cash flow before change in non-cash working capital generation of $186.3 million despite lower realized copper prices compared to the second quarter of 2024, capitalizing on higher gold production from Manitoba following the full repayment of our gold prepayment liability in August.
- Achieved trailing 12 month adjusted EBITDA1 of $839.8 million, a substantial increase from $498.5 million for the 12 months ending September 30, 2023.
- Reduced net debt1 to $625.6 million in the third quarter of 2024. The third quarter represents the fifth consecutive quarter of lower net debt as a result of deleveraging efforts and capitalizing on strong operating cash flow generation.
- The increase in cash and reduction in long-term debt significantly reduced our net debt to adjusted EBITDA ratio1 to 0.7x at September 30, 2024 compared to 1.6x at the end of 2023, well within the targeted 1.2x net debt to adjusted EBITDA ratio outlined in our three prerequisites plan (the "3-P plan") for advancing Copper World, including receipts of permits, a robust definitive feasibility study plan and a prudent financing strategy.
- Total liquidity substantially increased by 58% to $907.7 million at September 30, 2024 from $573.7 million at the end of 2023.
- Subsequent to the quarter end, further improved long-term balance sheet resilience with a proactive three-year extension of our senior secured revolving credit facilities from October 2025 to November 2028. The extended credit facilities provide increased financial flexibility to accretively maintain our 4.50% coupon 2026 senior unsecured notes outstanding to maturity and advance Copper World towards a sanctioning decision in accordance with the 3-P plan. The $450 million revolving credit facility includes an improved pricing grid reflecting the enhanced financial position of Hudbay and features an opportunity to increase the facility by an additional $150 million at our discretion during the four-year tenor, providing additional financial flexibility.
Advancing Growth Initiatives to Further Enhance Copper and Gold Exposure
- The successful completion of the planned stripping program at Pampacancha in September is expected to lead to significantly higher copper and gold grades in the fourth quarter of 2024, which together with maintaining strong operating performance at Constancia is expected to continue to generate meaningful free cash flow in Peru.
- The New Britannia mill continued to exceed expectations, driving continued strong gold production and free cash flow generation in Manitoba. The New Britannia mill achieved record throughput levels of approximately 2,080 tonnes per day in the third quarter, exceeding its original design capacity of 1,500 tonnes per day and its 2024 budgeted capacity of 1,800 tonnes per day due to the successful implementation of process improvement initiatives and effective preventative maintenance measures.
- We have successfully implemented post-acquisition plans to stabilize the Copper Mountain operations through mining fleet ramp-up activities and increased mill reliability and performance. Achieved record mill availability of 95% and record copper recoveries of 84% in the third quarter of 2024. Efforts are now focused on optimizing the operations through execution of the planned accelerated stripping program and mill throughput improvement projects.
- Received the Aquifer Protection Permit for Copper World in August, a key milestone and de-risking event in the advancement of the project. Continued to progress the 3-P plan for sanctioning Copper World, with transformed balance sheet near targeted levels and the remaining key state permit progressing on track. As disclosed in August, we commenced activities related to the preparation of feasibility studies for Copper World, resulting in an expected increase of $25 million in growth capital spending in Arizona.
- Drill permitting for highly prospective Maria Reyna and Caballito properties near Constancia continues to advance through the multi-step regulatory process with the environmental impact assessment applications approved for Maria Reyna in June and Caballito in September.
- The development of an access drift to the 1901 deposit in Snow Lake remains on track to reach mineralization in early 2025 and is intended to enable confirmation of the optimal mining method for the deposit and underground drilling to further evaluate the orebody and upgrade inferred gold resources to reserves. Initiated the development of an adjacent haulage drift to de-risk planned full production in 2027.
- Large 2024 exploration program continues in Snow Lake with eight drill rigs testing targets near Lalor and regional satellite properties. Includes follow-up drilling at Lalor Northwest located 400 metres from Lalor's underground infrastructure and the testing of a deep geophysical target at the Cook Lake North property.
- Continuing to advance Flin Flon tailings reprocessing opportunities through metallurgical test work and early economic evaluation to assess the possibility of producing critical minerals and precious metals while reducing the environmental footprint.
Summary of Third Quarter Results
Cash generated from operating activities of $146.2 million increased in the third quarter of 2024 compared to the second quarter of 2024, and was lower by $5.8 million compared to the same period in 2023. The decrease compared to the same period in 2023 is reflective of the timing of sales which occurred late in the current quarter, where payment was subsequently made by customers in October. Operating cash flow before change in non-cash working capital was $186.3 million during the third quarter of 2024, reflecting an increase of $4.3 million compared to the third quarter of 2023. The increase was primarily the result of higher gold production and sales volumes in Manitoba, strong operational cost performance across the business and higher realized metal prices. This was partially offset by lower copper sales volumes in Peru due to mining of the high-grade zones of the Pampacancha deposit in the third quarter of 2023 as well as a significant increase in cash taxes paid of $17.3 million at our Peru operations, compared to the same period in 2023.
Consolidated copper, gold, silver and zinc production in the third quarter of 2024 decreased by 25%, 12%, 7% and 22%, respectively, compared to the same period in 2023 primarily due to lower production and lower recoveries in Peru partially offset by higher gold production in Manitoba and British Columbia. With the completion of the planned stripping program in Peru at the end of the third quarter, October production results have already delivered higher grades as mining of the higher grade zones at Pampacancha is underway, in line with the mine plan.
Net earnings attributable to owners in the third quarter of 2024 was $49.8 million, or $0.13 per share, compared to $45.5 million, or $0.13 per share, in the third quarter of 2023. The third quarter of 2024 was impacted by various non-cash charges for unrealized losses on strategic copper and gold hedges and revaluation of share-based compensation due to a higher share price.
Adjusted net earnings attributable to owners1 and adjusted net earnings per share attributable to owners1 in the third quarter of 2024 were $50.3 million and $0.13 per share, respectively, after adjusting for items on a pre-tax basis such as a non-cash gain of $2.0 million related to a quarterly revaluation of our closed site environmental reclamation provision, a $5.2 million mark-to-market revaluation loss on various instruments such as the gold prepayment liability, unrealized strategic gold and copper hedges, investments and stock based compensation and a $2.2 million write-down of PP&E, among other items. This compares to adjusted net earnings attributable to owners1 and net earnings per share attributable to owners1 of $24.2 million and $0.07 per share in the same period of 2023.
Third quarter adjusted EBITDA1 was $206.2 million, an 8.1% increase compared to $190.7 million in the same period in 2023. The increase is the result of higher realized metal prices and successful operating cost control across the business despite lower sales volumes.
In the third quarter of 2024, consolidated cash cost per pound of copper produced, net of by-product credits1, was $0.18, compared to $1.10 in the same period in 2023. This decrease was mainly the result of significantly higher by-product credits and strong cost control leading to lower mining, milling, treatment and refining costs, partially offset by higher G&A costs from incorporating Copper Mountain and lower copper production. Consolidated sustaining cash cost per pound of copper produced, net of by-product credits1, was $1.71 in the third quarter of 2024 compared to $1.89 in the same period in 2023. This decrease was primarily due to the same reasons outlined above partially offset by higher cash sustaining capital expenditures.
Consolidated all-in sustaining cash cost per pound of copper produced, net of by-product credits1, was $1.95 in the third quarter of 2024, lower than $2.04 in the same period in 2023 due to significant gold by-product credits and continued strong cost control across all operations.
As at September 30, 2024, total liquidity was $907.7 million, including $443.3 million in cash and cash equivalents, $40.0 million in short-term investments as well as undrawn availability of $424.4 million under our revolving credit facilities. Net debt1 declined to $625.6 million at the end of the third quarter of 2024 compared to $1,037.7 million at the end of 2023. We expect that our current liquidity together with cash flows from operations will be sufficient to meet our liquidity needs for the next year.
*Copper equivalent production is calculated using the quarter average LME prices for each metal.


1 Adjusted net earnings (loss) - attributable to owners and adjusted net earnings (loss) per share - attributable to owners, adjusted EBITDA, cash cost, sustaining cash cost, all-in sustaining cash cost per pound of copper produced, net of by-product credits, cash cost, sustaining cash cost per ounce of gold produced, net of by-product credits, combined unit cost, net debt and net debt to adjusted EBITDA ratio are non-IFRS financial performance measures with no standardized definition under IFRS. For further information and a detailed reconciliation, please see the discussion under the "Non-IFRS Financial Performance Measures" section of this MD&A.
KEY FINANCIAL RESULTS
| Financial Condition | | | | | | |
| (in $ thousands, except net debt to adjusted EBITDA ratio) | | Sep. 30, 2024 | | | Dec. 31, 2023 | |
| Cash and cash equivalents and short-term investments | $ | 483,273 | | $ | 249,794 | |
| Total long-term debt | | 1,108,900 | | | 1,287,536 | |
| Net debt1 | | 625,627 | | | 1,037,742 | |
| Working capital2 | | 434,346 | | | 135,913 | |
| Total assets | | 5,508,075 | | | 5,312,634 | |
| Equity attributable to owners of the Company | | 2,537,845 | | | 2,096,811 | |
| Net debt to adjusted EBITDA 1 | | 0.7 | | | 1.6 | |
1 Net debt and net debt to adjusted trailing 12 month EBITDA are a non-IFRS financial performance measure with no standardized definition under IFRS. For further information and a detailed reconciliation, please see discussion under the "Non-IFRS Financial Performance Measures" section of this MD&A.
2 Working capital is determined as total current assets less total current liabilities as defined under IFRS and disclosed on the consolidated interim financial statements.
| Financial Performance | | Three months ended | | | Nine months ended | |
| (in $ thousands, except per share amounts or as noted below) | | Sep. 30, 2024 | | | Sep. 30, 2023 | | | Sep. 30, 2024 | | | Sep. 30, 2023 | |
| Revenue | $ | 485,773 | | $ | 480,456 | | $ | 1,436,282 | | $ | 1,087,841 | |
| Cost of sales | | 345,987 | | | 374,057 | | | 1,066,915 | | | 892,036 | |
| Earnings before tax | | 79,701 | | | 84,149 | | | 147,892 | | | 70,848 | |
| Net earnings for the period | | 50,354 | | | 45,490 | | | 48,512 | | | 36,015 | |
| Net earnings attributable to owners | | 49,762 | | | 45,125 | | | 55,537 | | | 35,650 | |
| Basic and diluted earnings per share - attributable | | 0.13 | | | 0.13 | | | 0.15 | | | 0.12 | |
| Adjusted earnings per share - attributable1 | | 0.13 | | | 0.07 | | | 0.30 | | | 0.02 | |
| Operating cash flow before change in non-cash working capital2 | | 186.3 | | | 182.0 | | | 455.9 | | | 323.5 | |
| Adjusted EBITDA1,2 | | 206.2 | | | 190.7 | | | 565.2 | | | 373.4 | |
1 Adjusted earnings (loss) per share - attributable to owners and adjusted EBITDA are non-IFRS financial performance measures with no standardized definition under IFRS. For further information and a detailed reconciliation, please see discussion under the "Non-IFRS Financial Performance Measures" section of this MD&A.
2 In $ millions.
KEY PRODUCTION RESULTS
| | Three months ended | Three months ended |
| Sep. 30, 2024 | Sep. 30, 2023 |
| Peru | Manitoba | British
Columbia3 | Total | Peru | Manitoba | British
Columbia3 | Total |
| Contained metal in concentrate and doré produced1 | | | | | |
| Copper | tonnes | 21,220 | 3,398 | 6,736 | 31,354 | 29,081 | 3,580 | 9,303 | 41,964 |
| Gold | oz | 20,331 | 62,468 | 6,274 | 89,073 | 40,596 | 56,213 | 4,608 | 101,417 |
| Silver | oz | 648,209 | 281,397 | 55,963 | 985,569 | 697,211 | 264,752 | 101,069 | 1,063,032 |
| Zinc | tonnes | - | 8,069 | - | 8,069 | - | 10,291 | - | 10,291 |
| Molybdenum | tonnes | 362 | - | - | 362 | 466 | - | - | 466 |
| | | | | | | | | | |
| Payable metal sold | | | | | | | | |
| Copper | tonnes | 18,803 | 2,931 | 6,026 | 27,760 | 27,490 | 2,925 | 8,956 | 39,371 |
| Gold2 | oz | 9,795 | 57,238 | 6,199 | 73,232 | 32,757 | 36,713 | 5,329 | 74,799 |
| Silver2 | oz | 365,198 | 244,974 | 53,241 | 663,413 | 460,001 | 197,952 | 91,002 | 748,955 |
| Zinc | tonnes | - | 8,607 | - | 8,607 | - | 7,125 | - | 7,125 |
| Molybdenum | tonnes | 343 | - | - | 343 | 426 | - | - | 426 |
| | Nine months ended | Nine months ended |
| Sep. 30, 2024 | Sep. 30, 2023 |
| Peru | Manitoba | British
Columbia3 | Total | Peru | Manitoba | British
Columbia 3 | Total |
| Contained metal in concentrate and doré produced1 | | | | | |
| Copper | tonnes | 65,013 | 9,189 | 20,479 | 94,681 | 67,280 | 8,419 | 10,542 | 86,241 |
| Gold | oz | 60,147 | 162,787 | 15,145 | 238,079 | 64,800 | 127,500 | 5,353 | 197,653 |
| Silver | oz | 1,738,760 | 711,867 | 221,566 | 2,672,193 | 1,669,021 | 596,144 | 112,987 | 2,378,152 |
| Zinc | tonnes | - | 24,954 | - | 24,954 | - | 28,895 | - | 28,895 |
| Molybdenum | tonnes | 1,128 | - | - | 1,128 | 1,169 | - | - | 1,169 |
| Payable metal sold | | | | | | | | |
| Copper | tonnes | 59,363 | 8,281 | 19,523 | 87,167 | 65,013 | 7,021 | 8,956 | 80,990 |
| Gold2 | oz | 65,905 | 162,004 | 14,699 | 242,608 | 59,062 | 107,662 | 5,329 | 172,053 |
| Silver2 | oz | 1,519,207 | 674,301 | 205,789 | 2,399,297 | 1,523,740 | 481,547 | 91,002 | 2,096,289 |
| Zinc | tonnes | - | 19,859 | - | 19,859 | - | 21,394 | - | 21,394 |
| Molybdenum | tonnes | 1,105 | - | - | 1,105 | 994 | - | - | 994 |
1 Metal reported in concentrate is prior to deductions associated with smelter contract terms.
2 Includes total payable gold and silver in concentrate and in doré sold.
3 Includes 100% of Copper Mountain mine production. Hudbay owns 75% of Copper Mountain mine. As Copper Mountain was acquired on June 20, 2023, the production for the nine months ended September 30, 2023 represents the period from acquisition date, June 20, 2023, through to the end of the third quarter of 2023.
KEY COST RESULTS
| | | Three months ended | | Nine months ended | Guidance |
| | | Sep. 30,
2024 | Sep. 30,
2023 | | Sep. 30,
2024 | Sep. 30,
2023 | Annual
20242 |
| Peru cash cost per pound of copper produced | | | | |
| Cash cost1 | $/lb | 1.80 | 0.83 | | 1.28 | 1.34 | 1.25 - 1.60 |
| Sustaining cash cost1 | $/lb | 2.78 | 1.51 | | 2.08 | 2.10 | |
| Manitoba cash cost per ounce of gold produced | | | | |
| Cash cost1 | $/oz | 372 | 670 | | 606 | 864 | 700 - 900 |
| Sustaining cash cost1 | $/oz | 553 | 939 | | 855 | 1,212 | |
| British Columbia cash cost per pound of copper produced3 | | | | |
| Cash cost1 | $/lb | 1.81 | 2.67 | | 2.67 | 2.36 | 2.00 - 2.50 |
| Sustaining cash cost1 | $/lb | 5.06 | 3.39 | | 5.15 | 2.99 | |
| Consolidated cash cost per pound of copper produced | | | | |
| Cash cost1 | $/lb | 0.18 | 1.10 | | 0.46 | 1.14 | 0.65 - 0.85 |
| Sustaining cash cost1 | $/lb | 1.71 | 1.89 | | 1.74 | 2.04 | 1.75 - 2.20 |
| All-in sustaining cash cost1 | $/lb | 1.95 | 2.04 | | 2.06 | 2.24 | |
1 Cash cost, sustaining cash cost, all-in sustaining cash cost per pound of copper produced, net of by-product credits, gold cash cost, sustaining cash cost per ounce of gold produced, net of by-product credits, and unit operating cost are non-IFRS financial performance measures with no standardized definition under IFRS. For further information and a detailed reconciliation, please see the discussion under the "Non-IFRS Financial Performance Measures" section of this MD&A.
2 We have improved our 2024 annual consolidated cash cost guidance range to $0.65 to $0.85 per pound from the original guidance range of $1.05 to $1.25 per pound. We have also improved our 2024 annual consolidated sustaining cash cost guidance range to $1.75 to $2.20 per pound from the original guidance range of $2.00 to $2.45 per pound.
3As Copper Mountain was acquired on June 20, 2023, the results for the nine months ended September 30, 2023 represents the period from the acquisition date, June 20, 2023, through to the end of the third quarter of 2023.
RECENT DEVELOPMENTS
2024 Production Guidance Reaffirmed and Cash Cost Guidance Further Improved
We reaffirm our full year 2024 consolidated production guidance for all metals as we continue to deliver strong operating performance and we expect the fourth quarter to be the highest copper production quarter in 2024, in line with our quarterly cadence expectations. We expect 2024 consolidated copper production to trend towards the lower end of the guidance range and 2024 consolidated gold production to trend towards the higher end of the guidance range.
In Peru, the fourth quarter is expected to be the strongest quarter this year, and full year copper production is expected to trend towards the lower end of the guidance range, while gold production is expected to trend towards the higher end of the guidance range. In British Columbia, we expect to continue improving operating efficiencies in the fourth quarter, and full year copper production is expected to be slightly below the lower end of the guidance range, while full year gold production is expected to be within the guidance ranges.
In Manitoba, we expect the strong operating performance to continue into the fourth quarter, and full year gold production is now expected to exceed the top end of the guidance range and full year copper production is expected to trend towards the higher end of the guidance range.
We are again improving our full-year 2024 consolidated cash cost guidance range to $0.65 to $0.85 per pound copper from the previously announced range of $0.90 to $1.10 per pound and the original guidance range of $1.05 to $1.25 per pound. We are also improving our 2024 annual consolidated sustaining cash cost guidance range to $1.75 to $2.20 per pound copper from the original guidance range of $2.00 to $2.45 per pound. This is a result of increased exposure to gold by-product credits and continued strong cost control at all operations. We have reaffirmed all other 2024 guidance metrics.
Continued Debt Reduction and Improved Balance Sheet Flexibility
We took several prudent measures in the third quarter of 2024 to further improve our balance sheet strength and flexibility:
• Repurchased and retired an additional $48.5 million of senior unsecured notes - We made open market purchases of $13.4 million of the 2026 senior unsecured notes and $35.1 million of the 2029 senior unsecured notes during the quarter. As a result, a total of $82.6 million of senior unsecured notes have been repurchased and retired since the beginning of the year.
• Delivered the final $16.9 million under gold forward sale and prepay agreement - We completed the last monthly gold delivery in August 2024, resulting in the full repayment of the gold prepay facility which was used to fund the refurbishment of the New Britannia gold mill.
• Three-year extension of revolving credit facilities to 2028 - Subsequent to the quarter end, we proactively extended our senior secured revolving credit facilities by three years from October 2025 to November 2028 and negotiated the flexibility to leave our 4.50% 2026 senior unsecured notes outstanding to maturity as we advance Copper World towards a sanctioning decision in accordance with the 3-P plan. The newly extended $450 million revolving credit facility, with the existing banking syndicate, includes an improved pricing grid reflecting the enhanced financial position of Hudbay, and features an opportunity to increase the facility by an additional $150 million at our discretion during the four-year tenor, providing additional financial flexibility. The revolving credit facilities are currently undrawn (excluding letters of credit), having repaid $100 million of prior drawings associated with the Copper Mountain acquisition in the first half of 2024.
We have delivered five consecutive quarters of meaningful free cash flow generation as a result of recent brownfield investments in our operations, continuous improvement efforts and steady cost control across the business. During the last twelve months, we have repaid a total of $296 million of debt and gold prepayment liabilities.
As a result of continued deleveraging efforts and cash flow generation, we have substantially reduced net debt1 to $625.6 million at September 30, 2024, from $1,037.7 million at the end of 2023. The net debt reduction, together with higher levels of adjusted EBITDA1 over the last twelve months, has significantly improved our net debt to adjusted EBITDA ratio1 to 0.7x compared to 1.6x at the end of 2023. The improved balance sheet flexibility and accelerated debt reduction significantly advances the Company's progress as part of its 3-P plan for sanctioning Copper World, and results in the successful achievement of the targeted 1.2x net debt to 12 month trailing adjusted EBITDA1 ratio well ahead of schedule.
Advancing Permitting at Copper World
In August 2024, Hudbay received the Aquifer Protection Permit for the Copper World project from the Arizona Department of Environmental Quality ("ADEQ"). The Company proactively engaged with the ADEQ, ensuring a transparent and thorough permitting process by providing comprehensive and detailed information. The issuance of this permit is a key milestone in the advancement of Copper World, which is a standalone operation requiring state and local permits and is expected to produce 85,000 tonnes of copper per year over a 20-year mine life.
There are three key state permits required for Copper World sanctioning:
• Mined Land Reclamation Plan - Completed - the Mined Land Reclamation Plan was initially approved by the Arizona State Mine Inspector in October 2021 and was subsequently amended and approved to reflect a larger private land project footprint. This approval was challenged in state court, but the challenge was dismissed in May 2023.
• Aquifer Protection Permit - Completed - the Aquifer Protection Permit was received on August 29, 2024 from the ADEQ following a robust process that included detailed analysis by the agency and Hudbay, along with a public comment period that was completed in the second quarter of 2024.
• Air Quality Permit - On Track - the Air Quality Permit application was submitted to the ADEQ in late 2022 and follows a similar robust process, including a public comment period that concluded in September 2024.
With the receipt of the Aquifer Protection Permit on August 29, 2024, we announced that we commenced activities related to the preparation of feasibility studies for Copper World, resulting in an expected $25 million increase in growth capital spending in Arizona, compared to the original annual guidance of $20 million.
We intend to commence a minority joint venture partner process after receiving the Air Quality Permit. The potential joint venture partner is anticipated to participate in the funding of definitive feasibility study activities in 2025 as well as in the final project design and construction for Copper World.
The opportunity to sanction Copper World is not expected until 2026 based on current estimated timelines. Once in production, Copper World is expected to be a meaningful copper producer in the U.S. domestic copper supply chain, which will be required to help secure growing U.S. metal demand related to increased manufacturing capacity, infrastructure development, increased energy independence and domestic battery supply chain and production needs. The "Made-in-America" copper cathode anticipated to be produced at Copper World is expected to be sold entirely to domestic U.S. customers and would make Copper World the third largest cathode producer in the U.S. Hudbay is pleased with the level of local support received at the public comment meetings and looks forward to providing significant social and environmental benefits for the community and local economy in Arizona. Over the proposed initial 20-year mine life, the company expects to contribute more than $850 million in U.S. taxes, including approximately $170 million in taxes to the state of Arizona. Hudbay also expects Copper World to create more than 400 direct jobs and up to 3,000 indirect jobs in Arizona.
_________________________________________
1 Adjusted EBITDA and net debt to adjusted EBITDA ratio are non-IFRS financial performance measures with no standardized definition under IFRS. For further information and a detailed reconciliation, please see discussion under the "Non-IFRS Financial Performance Measures" section of this MD&A.
Copper Mountain Stabilization Complete and Optimization Initiatives Underway
Stabilization Phase Completed
Since acquiring Copper Mountain in June 2023, our stabilization efforts have been focused on ramping up the mining fleet to execute a planned accelerated stripping campaign to gain access to higher grades, as well as plant improvement initiatives to improve mill reliability and recoveries.
• Mine Ramp-up Activities Completed - Successfully remobilized all 28 haul trucks and added five additional haul trucks this year to execute the planned three-year accelerated stripping campaign at a lower cost and avoid contractor mining costs.
• Mill Stabilization Activities Completed - Implemented several mill initiatives, including reprogramming the mill expert system, installing advanced grinding control instrumentation, flotation operational strategy improvements and improved maintenance practices. This has resulted in record mill availability of 95% and record copper recovery of 84% being achieved in the third quarter of 2024.
• Operating Costs Stabilized - Achieved sequential quarterly improvements in unit operating costs and cash costs this year with the third quarter of 2024 being the lowest cost quarter at Copper Mountain since Hudbay's acquisition in June 2023.
• Corporate Synergies Target Achieved - Exceeded the targeted $10 million in annualized corporate synergies.
Optimization Phase Underway
Efforts are now focused on several optimization initiatives at Copper Mountain to access higher grades, further improve mill throughput and increase copper production and operating cash flows.
• Accelerated Stripping - Commenced a three-year accelerated stripping program to mitigate the substantially reduced stripping that occurred over the four years prior to Hudbay's acquisition. The stripping program is intended to unlock access to higher grade ore and further benefit operating costs.
• Mill Throughput Optimization - Advancing various engineering studies to increase mill throughput to its permitted levels of 50,000 tonnes per day earlier than was originally contemplated in the technical report, including the potential conversion of the third ball mill to a SAG mill to alleviate capacity limitations.
• On Track to Achieve Three-Year Operating Efficiencies Target - Stabilization initiatives have resulted in improved operating efficiencies, as demonstrated by improved mill throughput, record copper recoveries and lower unit operating costs since Hudbay's acquisition. On track to realize our three-year annual operating efficiencies target of $20 million.
New Britannia Mill Performance Exceeding Expectations and Driving Higher Gold Production
The New Britannia mill has been consistently exceeding performance expectations, achieving throughput levels of 1,650 tonnes per day in 2023, more than 1,850 tonnes per day in the first half of 2024, and reaching a quarterly record of 2,080 tonnes per day in the third quarter of 2024. We completed the brownfield investment in New Britannia in 2021 and refurbished the mill with a nominal capacity of 1,500 tonnes per day to provide additional processing capacity at our Snow Lake operations and allow us to achieve higher gold recoveries of approximately 90% as Lalor transitioned to the higher gold and copper areas of the mine plan. The Snow Lake operations achieved record quarterly gold production in the third quarter of 2024, and we now expect gold production in Manitoba to exceed the top end of the 2024 gold production guidance range of 200,000 ounces.
In August 2024, we completed the final payment under the New Britannia gold prepay facility, which further enhances our exposure to higher gold production in Snow Lake. With approximately two million ounces of contained gold in current mineral reserve estimates and another 1.4 million ounces of contained gold in inferred mineral resources, the New Britannia investment has unlocked significant value in Snow Lake. This could be further enhanced by regional exploration upside and the current strong gold price environment.
In the first quarter of 2024, we received a permit approval to increase the production rate at New Britannia to 2,500 tonnes per day, which will provide the opportunity to process more Lalor ore at the New Britannia mill and create additional processing capacity at Stall for potential new regional discoveries in Snow Lake.
Exploration Update
Large Exploration Drill Program Continues in Snow Lake
Hudbay continues to execute its 2024 exploration program with the goal of extending known mineralization near the Lalor deposit to further extend mine life as well as to find a new anchor deposit within trucking distance of the Snow Lake processing infrastructure. The 2024 program included the largest geophysical program in Hudbay's history in Snow Lake, with surface electromagnetic surveys detecting targets at more than 1,000 metres below surface and covering a 25 square-kilometre area including the Cook Lake claims that had been previously untested by modern deep geophysics.
We had eight drill rigs turning in Snow Lake during the third quarter, including two drills completing follow-up drilling at Lalor Northwest, located within 400 metres of the existing Lalor underground infrastructure. Six drill rigs were testing new geophysical targets and completing follow-up drilling at potential regional satellite deposits at the Cook Lake, Reed, Rail and Bur properties. One of the geophysical targets is a very strong deep anomaly located at Cook Lake North, approximately six kilometres from Lalor. Drilling activities are expected to continue throughout the winter season and assay results are pending.
We continue to advance the development of the exploration drift from the existing Lalor ramp towards the 1901 deposit, and the drift is expected to reach mineralization in early 2025. We plan to conduct definition drilling in 2025 to confirm the optimal mining method, evaluate the orebody geometry and continuity, and convert inferred mineral resources in the gold lenses to mineral reserves. In October, we initiated the development of an adjacent haulage drift to further de-risk future full production from the 1901 deposit in 2027.
Advancing Engineering Work for Flin Flon Tailings Reprocessing
Zinc Plant Tailings - Metallurgical test work continues following positive results from the initial confirmatory drill program completed earlier this year in the section of the tailings facility that was utilized by the zinc plant for 25 years. The results confirmed the grades of precious metals and critical minerals previously estimated from historical zinc plant records. An early economic study to evaluate the opportunity to reprocess the zinc plant tailings has confirmed the potential for a technically viable reprocessing alternative, and further engineering work is underway.
Mill Tailings - We continue to advance metallurgical test work on the opportunity to reprocess Flin Flon mill tailings where 100 million tonnes of tailings were deposited over 90 years. An early economic study on the mill tailings is planned.
Maria Reyna and Caballito Drill Permits Expected in 2025
Hudbay controls a large, contiguous block of mineral rights with the potential to host mineral deposits in close proximity to the Constancia processing facility, including the past producing Caballito property and the highly prospective Maria Reyna property. The company commenced early exploration activities at Maria Reyna and Caballito after completing a surface rights exploration agreement with the community of Uchucarcco in August 2022. As part of the drill permitting process, environmental impact assessment applications were submitted for the Maria Reyna property in November 2023 and for the Caballito property in April 2024. The environmental impact assessment (EIA) for Maria Reyna was approved by the government in June 2024 and the Caballito EIA was approved in September 2024. This represents one of several steps in the drill permitting process, which is expected to be completed in 2025.
PERU OPERATIONS REVIEW
| | Three months ended | Nine months ended |
Sep. 30,
2024 | Sep. 30,
2023 | Sep. 30,
2024 | Sep. 30,
2023 |
| Constancia ore mined1 | tonnes | 3,022,931 | 1,242,198 | 10,860,132 | 8,292,778 |
| Copper | % | 0.36 | 0.30 | 0.31 | 0.32 |
| Gold | g/tonne | 0.04 | 0.04 | 0.03 | 0.04 |
| Silver | g/tonne | 3.20 | 2.91 | 2.76 | 2.56 |
| Molybdenum | % | 0.02 | 0.01 | 0.01 | 0.01 |
| Pampacancha ore mined1 | tonnes | 1,777,092 | 5,894,013 | 5,280,235 | 9,199,803 |
| Copper | % | 0.48 | 0.53 | 0.50 | 0.48 |
| Gold | g/tonne | 0.27 | 0.30 | 0.28 | 0.33 |
| Silver | g/tonne | 6.23 | 4.22 | 4.98 | 3.94 |
| Molybdenum | % | 0.01 | 0.02 | 0.01 | 0.02 |
| Total ore mined | tonnes | 4,800,023 | 7,136,211 | 16,140,367 | 17,492,581 |
| Strip ratio2 | | 2.62 | 1.36 | 2.07 | 1.61 |
| Ore milled | tonnes | 8,137,248 | 7,895,109 | 23,934,171 | 22,781,885 |
| Copper | % | 0.32 | 0.43 | 0.32 | 0.36 |
| Gold | g/tonne | 0.11 | 0.21 | 0.11 | 0.13 |
| Silver | g/tonne | 3.70 | 3.75 | 3.35 | 3.42 |
| Molybdenum | % | 0.01 | 0.02 | 0.01 | 0.01 |
| Copper concentrate | tonnes | 100,462 | 132,828 | 304,190 | 311,072 |
| Concentrate grade | % Cu | 21.12 | 21.89 | 21.37 | 21.63 |
| Copper recovery | % | 82.6 | 85.2 | 83.6 | 82.7 |
| Gold recovery | % | 68.1 | 74.8 | 69.2 | 68.0 |
| Silver recovery | % | 67.0 | 73.2 | 67.4 | 66.6 |
| Molybdenum recovery | % | 39.0 | 37.2 | 42.7 | 39.1 |
| Combined unit operating costs3,4 | $/tonne | 12.78 | 12.20 | 12.12 | 12.55 |
1 Reported tonnes and grade for ore mined are estimates based on mine plan assumptions and may not reconcile fully to ore milled.
2 Strip ratio is calculated as waste mined divided by ore mined.
3 Reflects combined mine, mill and general and administrative ("G&A") costs per tonne of ore milled. Reflects the deduction of expected capitalized stripping costs.
4 Combined unit costs is a non-IFRS financial performance measure with no standardized definition under IFRS. For further information and a detailed reconciliation, please see the discussion under the "Non-IFRS Financial Performance Measures" section of this MD&A.
| | | Three months ended | Nine months ended |
| | | Sep. 30, 2024 | Sep. 30, 2023 | Sep. 30, 2024 | Sep. 30, 2023 |
| Contained metal in concentrate produced | | | | | |
| Copper | tonnes | 21,220 | 29,081 | 65,013 | 67,280 |
| Gold | oz | 20,331 | 40,596 | 60,147 | 64,800 |
| Silver | oz | 648,209 | 697,211 | 1,738,760 | 1,669,021 |
| Molybdenum | tonnes | 362 | 466 | 1,128 | 1,169 |
| Payable metal sold | | | | | |
| Copper | tonnes | 18,803 | 27,490 | 59,363 | 65,013 |
| Gold | oz | 9,795 | 32,757 | 65,905 | 59,062 |
| Silver | oz | 365,198 | 460,001 | 1,519,207 | 1,523,740 |
| Molybdenum | tonnes | 343 | 426 | 1,105 | 994 |
| Cost per pound of copper produced | | | | | |
| Cash cost1 | $/lb | 1.80 | 0.83 | 1.28 | 1.34 |
| Sustaining cash cost1 | $/lb | 2.78 | 1.51 | 2.08 | 2.10 |
1 Cash cost and sustaining cash costs per pound of copper produced, net of by-product credits, are not recognized under IFRS. For more detail on these non-IFRS financial performance measures, please see the discussion under the "Non-IFRS Financial Performance Measures" section of this MD&A.
Overview
Peru operations continued to benefit from strong mill throughput, averaging approximately 87,000 tonnes processed per day year-to-date and achieving an average of 88,000 tonnes per day in the third quarter. Cost performance for the nine months ended September 30, 2024 was also strong, despite lower grades milled, achieving lower unit operating costs, cash cost and sustaining cash cost compared to the comparative 2023 period. Cash cost also benefited from higher gold by-product sales revenues throughout 2024.
The planned stripping program at Pampacancha was completed in late September, and mining activities at Pampacancha are now focused on the next mining phase to deliver higher copper and gold grades in the fourth quarter of 2024.
The Company is evaluating opportunities to further increase mill throughput in the medium-to-long-term after the Peruvian Ministry of Energy and Mines approved a regulatory change in June 2024 to allow mining companies in Peru to increase throughput by up to 10% above permitted levels.
Mining Activities
Total ore mined in the third quarter of 2024 decreased by 33% compared to the same period in 2023, in line with our mine plan as we completed the planned stripping program at Pampacancha in late September. Ore mined from Pampacancha during the third quarter decreased to 1.8 million tonnes compared with 5.9 million tonnes in the third quarter of 2023 when we were in an unusually high period of ore mined from Pampacancha as per the 2023 mine plan cadence.
Year-to-date ore mined was 8% lower than the same period in 2023 due to the same factors as the quarterly variance.
Milling Activities
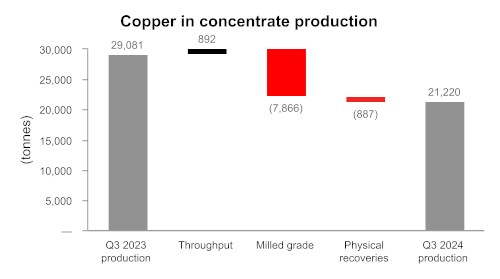
Ore milled during the third quarter of 2024 was 3% higher than the comparative 2023 period mainly due to the treatment of softer ore from stockpiles. Ore milled included supplemental ore feed from stockpiles during the quarter as the team completed pit stripping activities. Milled copper and gold grades decreased by 26% and 48%, respectively, in the third quarter of 2024 compared to the same period in 2023 due to lower amounts of high grade copper and gold from Pampacancha as the stripping campaign was underway, in addition to lower grades from the processing of stockpiled ore.
Ore milled during the first nine months of 2024 was 5% higher than the comparative 2023 period due to the same factors as the quarterly variance. Milled copper and gold grades decreased by 11% and 15%, respectively, in the first nine months of 2024 compared to the same period in 2023 due to the same factors as the quarterly variance.
Recoveries of copper and gold during the third quarter of 2024 were 83% and 68%, respectively, representing a decrease of 3% and 9%, respectively, compared with the same period in 2023 and were in line with our metallurgical models for the ore types that were being processed. Copper and gold recoveries are expected to increase in the fourth quarter as more higher grade ore is processed and less stockpile ore is used to supplement mill feed.
Recoveries of copper, gold and silver during the first nine months of 2024 were 84%, 69% and 67%, representing an increase of 1%, 2%, and 1%, respectively, compared with the 2023 period. This is also in line with our metallurgical models.
Production and Sales Performance
Third quarter 2024 production of copper, gold, silver and molybdenum was 21,220 tonnes, 20,331 ounces, 648,209 ounces and 362 tonnes, respectively, representing a decrease of 27%, 50%, 7% and 22%, respectively, compared with the same period in 2023 due to lower planned grades and recoveries as we completed the planned Pampacancha stripping activities and supplemented mill feed from lower grade stockpiles.
Year-to-date production of copper, gold and molybdenum was 65,013 tonnes, 60,147 ounces, and 1,128 tonnes, respectively, representing a decrease of 3%, 7% and 4%, respectively, from the comparative 2023 period due to the same factors as the quarterly variance. Production of silver was 1,738,760 ounces, representing an increase of 4% from the comparative 2023 period due to higher silver grades from Pampacancha.
Quantities of payable copper, gold and silver sold during the third quarter of 2024 were lower by 32%, 70% and 21%, respectively, than the corresponding period in 2023 primarily due to the same reasons affecting production and the timing of precious metal sales at the end of the quarter.
Year-to-date copper metal sold was 9% lower than the comparable period due to lower copper production levels. Gold metal sold was 12% higher than the comparable period primarily due to timing of precious metal sales at the beginning of the year.

*Copper equivalent production is calculated using the quarter average LME prices for each metal excluding molybdenum.
Cost Performance
Combined mine, mill and G&A unit operating costs in the third quarter were $12.78 per tonne, 5% higher than the same period in 2023 primarily due to higher mining and milling costs following a one-time payment associated with a revised labour agreement. This was partially offset by higher ore milled. Combined mine, mill and G&A unit operating costs in the first nine months of 2024 were $12.12 per tonne, a 3% decrease compared to the same period in 2023 primarily due to lower milling costs and higher ore milled, partially offset by higher mining and G&A costs.
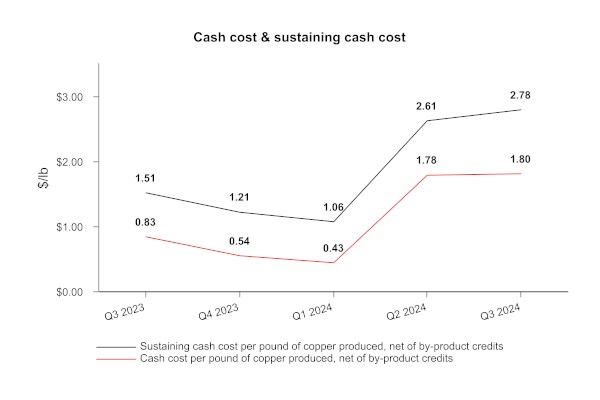
Cash cost per pound of copper produced, net of by-product credits, in the third quarter of 2024 was $1.80, an increase compared to $0.83 in the same period in 2023 due to lower by-product credits mostly as a result of lower gold sales volumes, fewer pounds of copper produced as a result of lower grades, as well as higher mining and milling costs. This was partially offset by lower treatment, refining and freight costs.
On a year-to-date basis, cash costs per pound of copper produced, net of by-product credits was $1.28, a decrease compared to $1.34 in the comparable 2023 period due to higher by-product credits, lower treatment and refining costs and lower milling costs. This was partially offset by higher profit sharing, higher mining cost, and lower pounds of copper produced.
Sustaining cash cost per pound of copper produced, net of by-product credits, was $2.78 in the third quarter, an increase compared to $1.51 in the same period in 2023 for the same factors as described for the cash cost variance above. On a year-to-date basis, sustaining cash cost per pound of copper produced, net of by-products, was consistent with the comparable period in 2023.
Peru Guidance Outlook
| | | Three months ended | Nine months ended | Guidance |
| | | Sep. 30,
2024 | Sep. 30,
2023 | Sep. 30,
2024 | Sep. 30,
2023 | Annual 2024 |
| Contained metal in concentrate produced | | | | | | |
| Copper | tonnes | 21,220 | 29,081 | 65,013 | 67,280 | 98,000 - 120,000 |
| Gold | oz | 20,331 | 40,596 | 60,147 | 64,800 | 76,000 - 93,000 |
| Silver | oz | 648,209 | 697,211 | 1,738,760 | 1,669,021 | 2,500,000 - 3,000,000 |
| Molybdenum | tonnes | 362 | 466 | 1,128 | 1,169 | 1,250 - 1,500 |
| Cost per pound of copper produced | | | | | | |
| Cash cost1 | $/lb | 1.80 | 0.83 | 1.28 | 1.34 | 1.25 - 1.60 |
1 Cash cost per pound of copper produced, net of by-product credits, are not recognized under IFRS. For more detail on these non-IFRS financial performance measures, please see the discussion under the "Non-IFRS Financial Performance Measures" section of this MD&A.
We expect to achieve our 2024 production and cost guidance range for all metals in Peru as the fourth quarter is expected to be the strongest quarter in Peru in 2024. We expect Peru 2024 full year copper production to trend towards the lower end of the guidance range due to lower than expected grades, while gold production is expected to trend towards the higher end of the guidance range due to a larger portion of the feed coming from higher gold grade Pampacancha stockpiles. Cash cost is expected to be favourably positioned at the lower end of the cost guidance range primarily due to high gold by-product credits.
MANITOBA OPERATIONS REVIEW
| | Three months ended | Nine months ended |
| Sep. 30, 2024 | Sep. 30, 2023 | Sep. 30, 2024 | Sep. 30, 2023 |
| Lalor ore mined | tonnes | 411,295 | 367,491 | 1,204,481 | 1,154,345 |
| Gold | g/tonne | 5.45 | 5.08 | 4.70 | 4.35 |
| Copper | % | 0.91 | 1.02 | 0.82 | 0.80 |
| Zinc | % | 2.73 | 3.31 | 2.80 | 3.25 |
| Silver | g/tonne | 30.45 | 27.80 | 25.46 | 23.08 |
| New Britannia ore milled | tonnes | 191,298 | 146,927 | 529,606 | 431,874 |
| Gold | g/tonne | 6.77 | 6.93 | 6.39 | 6.27 |
| Copper | % | 0.93 | 1.22 | 1.00 | 0.87 |
| Zinc | % | 1.12 | 0.90 | 0.96 | 0.84 |
| Silver | g/tonne | 30.24 | 23.88 | 25.62 | 24.01 |
| Copper concentrate | tonnes | 10,856 | 10,313 | 31,853 | 21,997 |
| Concentrate grade | % Cu | 15.18 | 16.93 | 15.70 | 16.06 |
| Gold recovery1 | % | 90.0 | 88.8 | 89.5 | 88.5 |
| Copper recovery | % | 92.8 | 97.4 | 94.5 | 94.3 |
| Silver recovery1 | % | 79.9 | 82.0 | 81.4 | 80.8 |
| Contained metal in concentrate produced | | | |
| Gold | oz | 24,355 | 21,189 | 68,000 | 53,038 |
| Copper | tonnes | 1,648 | 1,745 | 5,001 | 3,531 |
| Silver | oz | 114,157 | 71,290 | 277,132 | 202,193 |
| Metal in doré produced2 | | | |
| Gold | oz | 16,768 | 14,403 | 44,106 | 26,095 |
| Silver | oz | 42,244 | 39,926 | 118,977 | 62,735 |
| Stall ore milled | tonnes | 222,621 | 255,516 | 671,506 | 736,768 |
| Gold | g/tonne | 4.23 | 3.70 | 3.44 | 3.21 |
| Copper | % | 0.89 | 0.77 | 0.71 | 0.74 |
| Zinc | % | 4.12 | 4.88 | 4.23 | 4.72 |
| Silver | g/tonne | 30.20 | 28.82 | 25.43 | 22.81 |
| Copper concentrate | tonnes | 8,438 | 9,036 | 21,807 | 23,962 |
| Concentrate grade | % Cu | 20.74 | 20.32 | 19.20 | 20.41 |
| Zinc concentrate | tonnes | 15,338 | 19,431 | 48,456 | 55,046 |
| Concentrate grade | % Zn | 52.61 | 52.97 | 51.50 | 52.50 |
| Gold recovery | % | 70.5 | 67.8 | 68.3 | 63.7 |
| Copper recovery | % | 88.3 | 93.9 | 88.5 | 89.8 |
| Zinc recovery | % | 88.1 | 82.6 | 87.9 | 83.0 |
| Silver recovery | % | 57.8 | 64.9 | 57.4 | 61.3 |
| Contained metal in concentrate produced | | | |
| Gold | oz | 21,345 | 20,621 | 50,681 | 48,367 |
| Copper | tonnes | 1,750 | 1,835 | 4,188 | 4,888 |
| Zinc | tonnes | 8,069 | 10,291 | 24,954 | 28,895 |
| Silver | oz | 124,996 | 153,536 | 315,758 | 331,216 |
1 Gold and silver recovery includes total recovery from concentrate and doré.
2 Doré includes sludge, slag and carbon fines.
| | Three months ended | Nine months ended |
Sep. 30,
2024 | Sep. 30,
2023 | Sep. 30,
2024 | Sep. 30,
2023 |
| Total contained metal in concentrate and doré produced1 |
| Gold | oz | 62,468 | 56,213 | 162,787 | 127,500 |
| Copper | tonnes | 3,398 | 3,580 | 9,189 | 8,419 |
| Zinc | tonnes | 8,069 | 10,291 | 24,954 | 28,895 |
| Silver | oz | 281,397 | 264,752 | 711,867 | 596,144 |
| Payable metal sold in concentrate and doré | | | | |
| Gold | oz | 57,238 | 36,713 | 162,004 | 107,662 |
| Copper | tonnes | 2,931 | 2,925 | 8,281 | 7,021 |
| Zinc | tonnes | 8,607 | 7,125 | 19,859 | 21,394 |
| Silver | oz | 244,974 | 197,952 | 674,301 | 481,547 |
| Unit Operating Costs2 | | | | | |
| Lalor | C$/tonne | 132.97 | 151.14 | 143.10 | 140.81 |
| New Britannia | C$/tonne | 66.14 | 91.07 | 71.66 | 85.80 |
| Stall | C$/tonne | 46.72 | 36.56 | 41.92 | 35.46 |
| Combined mine/mill unit operating costs3,4 | C$/tonne | 211 | 217 | 224 | 218 |
| Cost per ounce of gold produced | | | | | |
| Cash cost4 | $/oz | 372 | 670 | 606 | 864 |
| Sustaining cash cost4 | $/oz | 553 | 939 | 855 | 1,212 |
1 Metal reported in concentrate is prior to deductions associated with smelter terms.
2 Reflects costs per tonne of ore mined/milled.
3 Reflects combined mine, mill and G&A costs per tonne of milled ore.
4 Combined unit costs, cash cost and sustaining cash cost per ounce of gold produced, net of by-product credits, are non-IFRS financial performance measures with no standardized definition under IFRS. For further information and a detailed reconciliation, please see the discussion under the "Non-IFRS Financial Performance Measures" section of this MD&A.
Overview
The Snow Lake operations in Manitoba delivered record production results during the third quarter of 2024, continuing to exceed expectations in performance and efficiency.
Performance from the Lalor mine was strong, benefiting from improved longhole muck fragmentation and a consistent higher-grade mining sequence that surpassed forecasted metal grades. In August, we successfully completed a five-day planned maintenance program aimed at enhancing the efficiency and reliability of our key infrastructure at the mine. Ongoing modifications to stope design further enhanced mucking efficiency throughout the lifecycle of stopes.
The New Britannia mill had another quarter of exceptional performance with the mill operating consistently above name plate capacity of 1,500 tonnes per day and achieving a new quarterly production record with an average throughput of 2,080 tonnes per day in the third quarter. Plant availability continues to improve, supported by low-capital projects aimed at further increasing throughput while continuing to achieve targeted gold recoveries of 90%. These efforts align with our long-term objectives of maximizing gold production by processing more high-grade ore from Lalor through the New Britannia mill, leading to higher gold recoveries. Notably, enhancements in the elution and stripping cycles contributed to increased gold doré production.
At the Stall mill, there was a slight reduction in throughput as more ore was diverted to New Britannia. Benefits from recent recovery improvement programs continue to be realized with gold recoveries of 71% and 68% achieved in the third quarter and year-to-date, respectively, compared to 64% in the first nine months of 2023. Efforts to continue to optimize recovery were advanced with the installation of new elongated cyclones in one of the two milling circuits late in third quarter. These cyclones are designed to improve grind size and, pending positive performance results, could be implemented across other circuits. Additionally, transitioning operational and maintenance responsibilities for the external crusher from contractors to the in-house team has resulted in more efficient cost management, supporting long-term savings at the Snow Lake operations.
Progress on the 1901 exploration drift is on track to intersect mineralization by early 2025, laying the groundwork for the 1901 haulage drift that will support full production from the 1901 deposit by 2027. Diamond drilling will soon follow to evaluate the orebody and optimize the mining approach for future conversion of inferred mineral resources into mineral reserves.
Environmental initiatives continue to progress well in Manitoba. At the Anderson tailings facility, enhanced deposition efficiency enabled deferral of dam construction capital to future years, while a new trial exploring alternative shore deposition techniques shows potential for further gains in efficiency. The operations remain on track to meet their environmental targets for 2024, with significant reductions in propane and diesel consumption achieved year-to-date compared to 2023. In addition, an initiative at Lalor to recycle natural groundwater for use as process water has successfully reduced the mine's reliance on fresh water.
Mining Activities
Total ore mined in Manitoba in the third quarter of 2024 was 12% higher than the comparable quarter in 2023. Gold and silver grades mined at Lalor during the third quarter were 7% and 10% higher, respectively, compared with the same period in 2023. Copper and zinc grades mined at Lalor during the third quarter were 11% and 18% lower, respectively, compared with the same period in 2023. The third quarter of 2024 saw significant improvements in ore production and precious metal grade quality. These changes align with improvements in mining techniques, most notably in longhole muck fragmentation, and anticipated higher grade precious metal sequences as part of the mine plan for the quarter.
Total ore mined at our Manitoba operations during the first nine months of 2024 was 4% higher than the same period in 2023. Gold, copper and silver grades mined at Lalor during the first nine months of 2024 were 8%, 3% and 10% higher, respectively, compared with the same period in 2023, consistent with the mine plan. Zinc grades mined at Lalor during the first nine months of 2024 were 14% lower than the same period in 2023.
Milling Activities
Consistent with our strategy of allocating more Lalor ore feed to New Britannia, the New Britannia mill throughput averaged approximately 2,080 tonnes per day in the third quarter of 2024, approximately 30% above average daily throughput levels in the same period in 2023. Recoveries of gold, copper and silver in the third quarter of 2024 were 90%, 93% and 80%, respectively, representing an increase of 1%, and a decrease of 5% and 3%, respectively, compared to the same period in 2023. Year-to-date total ore milled at New Britannia was 23% higher than the prior period for the same reason. With the higher ore grade processed, precious metals recoveries also increased by 1% year-to-date compared to the same period in 2023.
During the three and nine months ended September 30, 2024, the Stall mill processed 13% and 9% less ore, respectively, compared with the same period in 2023, which is aligned with our strategy of allocating more Lalor ore feed to New Britannia, as noted above. The Stall mill achieved gold recoveries of 71% in the third quarter, reflecting benefits from recent recovery improvement programs as higher gold grade ore is processed.
Production and Sales Performance
Manitoba operations achieved a new quarterly record for gold production at 62,468 ounces in the third quarter of 2024. The operations also produced 3,398 tonnes of copper, 8,069 tonnes of zinc and 281,397 ounces of silver during the third quarter of 2024. Compared to the third quarter of 2023, production of gold and silver in the third quarter of 2024 increased by 11% and 6%, respectively, while production of copper and zinc declined by 5% and 22%, respectively. The increased gold and silver production in the quarter is mainly due to our strategy of mining and allocating more Lalor gold ore feed to New Britannia to achieve higher recoveries, which resulted in planned lower production of copper and zinc.
Production of gold, copper and silver in the first nine months of 2024 was higher by 28%, 9% and 19%, respectively, than the comparative 2023 period mainly due to the same reasons as noted above, as well as higher production from copper-gold zones in the first quarter of 2024. Zinc production in the first nine months of 2024 decreased by 14%, aligned with forecasted production and strategy to mine more gold ore at Lalor.
Quantities of payable metal during the third quarter of 2024 were higher than the comparable periods in 2023 for all metals sold, primarily due to the same factors impacting contained metal production, as noted above. For the nine months ended September 30, 2024, payable metals sold for gold, copper and silver were higher than the comparable period, while zinc metal sold was lower than the comparable period.

Cost Performance
Lalor mining costs during the third quarter of 2024 decreased by 12% compared to the same period in 2023, achieving the lowest cost in the past 2 years, despite inflationary factors over that period, as a result of efficiency improvements and higher tonnage mined. Compared to the same period in 2023, milling costs at the Stall mill were 28% higher during the third quarter of 2024, primarily due to lower throughput as described earlier. New Britannia milling costs decreased by 27% during the third quarter of 2024 versus the same period in 2023, primarily a result of higher throughput as described earlier. Combined mine, mill and G&A unit operating costs in the third quarter of 2024 were C$211 per tonne, representing a 3% decrease compared to the same period in 2023. Combined mine, mill and G&A unit operating costs in the first nine months of 2024 increased by 3% to C$224 per tonne. The marginal increase in combined operating costs year-over-year was the result of higher administrative costs and longer haulage distances, which were partially offset by the effect of higher total throughput.
Cash cost per ounce of gold produced, net of by-product credits, in the third quarter of 2024 was $372, a decrease of 44% compared to the same period in 2023 due to significantly higher gold production and higher by-product credits, partially offset by higher G&A costs.
Sustaining cash cost per ounce of gold produced, net of by-product credits, in the third quarter of 2024 was $553, a decrease of 41% compared to the same period in 2023, primarily due to the same factors affecting cash cost and lower sustaining capital costs during the quarter.
Cash cost per ounce of gold produced, net of by-product credits, in the first nine months of 2024 was $606 per ounce. These costs were 30% lower compared to the same period in 2023 primarily due to higher gold production and by-product credits, partially offset by higher mining, milling and G&A costs resulting from higher employee profit sharing costs. Sustaining cash cost per ounce of gold produced, net of by-product credits, for the first nine months of 2024 was $855 per ounce, a decrease of 29% from the comparative 2023 period primarily due to the same factors affecting cash cost noted above, with lower sustaining capital expenditures compared to the prior year.
Manitoba Guidance Outlook
| | Three months ended | Nine months ended | Guidance |
Sep. 30,
2024 | Sep. 30,
2023 | Sep. 30,
2024 | Sep. 30,
2023 | Annual 2024 |
| Total contained metal in concentrate and doré produced1 | |
| Gold2 | oz | 62,468 | 56,213 | 162,787 | 127,500 | 170,000 - 200,000 |
| Copper | tonnes | 3,398 | 3,580 | 9,189 | 8,419 | 9,000 - 12,000 |
| Zinc | tonnes | 8,069 | 10,291 | 24,954 | 28,895 | 27,000 - 35,000 |
| Silver3 | oz | 281,397 | 264,752 | 711,867 | 596,144 | 750,000 - 1,000,000 |
| Cost per ounce of gold produced | |
| Cash cost4 | $/oz | 372 | 670 | 606 | 864 | 700 - 900 |
1 Metal reported in concentrate is prior to deductions associated with smelter terms.
2 Gold production guidance includes gold contained in concentrate produced and gold in doré.
3 Silver production guidance includes silver contained in concentrate produced and silver in doré.
4 Combined unit costs, cash cost per ounce of gold produced, net of by-product credits, are non-IFRS financial performance measures with no standardized definition under IFRS. For further information and a detailed reconciliation, please see the discussion under the "Non-IFRS Financial Performance Measures" section of this MD&A.
We now expect to exceed the top end of the 2024 gold production guidance range in Manitoba driven by outperformance at New Britannia with throughput achieving new record levels and the Lalor mine delivering better-than-expected gold grades by focusing on ore quality improvements. We also expect copper production to trend towards the higher end of the 2024 guidance range, and we are well on track to achieve zinc and silver 2024 production guidance. Similarly, we expect 2024 gold cash cost to be favourably positioned at the lower end of the cost guidance range, reflecting the strong cost control and gold production achieved to date.
BRITISH COLUMBIA OPERATIONS REVIEW
| | | Three months ended | Nine months
ended5 | Since
acquisition to5 |
| | | Sep. 30, 2024 | Sep. 30, 2023 | Sep. 30, 2024 | Sep. 30, 2023 |
| Ore mined1 | tonnes | 3,098,863 | 3,792,568 | 8,986,081 | 4,347,991 |
| Strip ratio2 | | 6.05 | 2.96 | 5.62 | 2.90 |
| Ore milled | tonnes | 3,363,176 | 3,158,006 | 9,775,752 | 3,600,261 |
| Copper | % | 0.24 | 0.36 | 0.25 | 0.36 |
| Gold | g/tonne | 0.09 | 0.08 | 0.08 | 0.08 |
| Silver | g/tonne | 0.73 | 1.40 | 0.97 | 1.36 |
| Copper concentrate | tonnes | 28,049 | 39,068 | 87,974 | 44,629 |
| Concentrate grade | % Cu | 24.0 | 23.8 | 23.3 | 23.8 |
| Copper recovery | % | 84.1 | 80.9 | 83.2 | 80.5 |
| Gold recovery | % | 67.3 | 56.1 | 62.2 | 57.5 |
| Silver recovery | % | 71.2 | 71.3 | 72.6 | 72.2 |
| Combined unit operating costs3,4 | C$/tonne | 15.58 | 24.88 | 19.56 | 21.82 |
1 Reported tonnes and grade for ore mined are estimates based on mine plan assumptions and may not reconcile fully to ore milled.
2 Strip ratio is calculated as waste mined divided by ore mined.
3 Reflects combined mine, mill and general and administrative ("G&A") costs per tonne of ore milled. Reflects the deduction of expected capitalized stripping costs.
4 Combined unit costs is a non-IFRS financial performance measure with no standardized definition under IFRS. For further information and a detailed reconciliation, please see the discussion under the "Non-IFRS Financial Performance Measures" section of this MD&A.
5 Copper Mountain mine results are stated at 100%. Hudbay owns 75% of Copper Mountain mine. As Copper Mountain was acquired on June 20, 2023, the results for the nine months ended September 30, 2023 represents the period from the acquisition date, June 20, 2023, through to the end of the third quarter of 2023.
| | | Three months ended | Nine months
ended2 | Since
acquisition to2 |
| | | Sep. 30, 2024 | Sep. 30, 2023 | Sep. 30, 2024 | Sep. 30, 2023 |
| Contained metal in concentrate produced | | | | |
| Copper | tonnes | 6,736 | 9,303 | 20,479 | 10,542 |
| Gold | oz | 6,274 | 4,608 | 15,145 | 5,353 |
| Silver | oz | 55,963 | 101,069 | 221,566 | 112,987 |
| Payable metal sold | | | | | |
| Copper | tonnes | 6,026 | 8,956 | 19,523 | 8,956 |
| Gold | oz | 6,199 | 5,329 | 14,699 | 5,329 |
| Silver | oz | 53,241 | 91,002 | 205,789 | 91,002 |
| Cost per pound of copper produced | | | | |
| Cash cost1 | $/lb | 1.81 | 2.67 | 2.67 | 2.36 |
| Sustaining cash cost1 | $/lb | 5.06 | 3.39 | 5.15 | 2.99 |
1 Cash cost and sustaining cash cost, net of by-product credits, are non-IFRS financial performance measures with no standardized definition under IFRS. For further information and a detailed reconciliation, please see the discussion under the "Non-IFRS Financial Performance Measures" section of this MD&A.
2 Copper Mountain mine results are stated at 100%. Hudbay owns 75% of Copper Mountain mine. As Copper Mountain was acquired on June 20, 2023, the results for the nine months ended September 30, 2023 represents the period from the acquisition date, June 20, 2023, through to the end of the third quarter of 2023.
Overview
Since acquiring Copper Mountain in June 2023, Hudbay has been focused on advancing operational stabilization plans, including opening up the mine by re-activating the full mining fleet, adding additional mining faces, optimizing the ore feed to the plant and implementing plant improvement initiatives that mirror Hudbay's successful processes at Constancia. These stabilization plans have successfully increased the total tonnes moved and resulted in stronger mill performance as demonstrated by record high mill availability of 95% and above-target copper recoveries of 84% in the third quarter of 2024. As a result, year-to-date mill performance has resulted in the highest mill availability and highest copper recoveries achieved at Copper Mountain mine in the last decade. Similarly, the stabilization efforts have successfully reduced combined unit operating costs to C$19.56 per tonne year-to-date, compared to C$21.38 per tonne milled in second half of 2023 (or first six months since acquisition).
Efforts are now focused on optimizing the operations throughout the balance of 2024 and into 2025. Mining activities will continue to execute the three-year accelerated stripping program intended to bring higher grade ore into the mine plan. Feasibility engineering has commenced to debottleneck and increase the nominal plant capacity to its permitted capacity of 50,000 tonnes per day earlier than contemplated in the most recent technical report.
Mining Activities
Total ore mined at Copper Mountain in the third quarter of 2024 was 3.1 million tonnes, a decrease of 18% compared to the third quarter of 2023. As planned, ore stockpiles were utilized as ore feed to the mill while the mine operation team increased waste stripping activities. Total material moved continued to ramp up in the quarter to 23.0 million tonnes, compared to 16.5 million tonnes in the same period last year, as a result of effective usage of the mining fleet to execute the accelerated stripping program to access higher head grades. The focus in the third quarter of 2024 was on mining efficiencies and operator recruitment to effectively utilize the available haul trucks fleet. As a result, total material moved is expected to continue to increase quarter-over-quarter as per the mine plan.
Milling Activities
The mill processed 3.4 million and 9.8 million tonnes of ore during the third quarter and first nine months of 2024, respectively. Ore processed in the third quarter of 2024 was 6% higher than the third quarter of 2023 benefiting from stabilization and reliability initiatives within the mill processing circuit. The average mill availability during the third quarter of 2024 increased to 95%, while maintaining a stable throughput rate. Mill throughput in the third quarter of 2024 was limited by unplanned maintenance and elevated clay material which impacted the second crushing circuit. During the third quarter, a number of initiatives were advanced to address these issues and other identified constraints and to improve throughput to targeted levels, with the benefits expected to be realized in the fourth quarter of 2024. Several mill initiatives have been implemented this year, including reprogramming the mill expert system, installation of advanced semi-autogenous grinding control instrumentation, redesign of the SAG liner package and updated operational procedures intended to remove magnetite from the pebble stream.
Milled copper grades during the third quarter of 2024 were 33% lower than the third quarter of 2023 as we continued to draw on stockpiled ore. Copper recoveries of 84.1% were higher than the third quarter of 2023, exceeding our expectations despite processing lower grades as the operations improved the regrind circuit constraint and implemented the flotation operational strategy improvements, including reagent selection and dose modification. Similarly, milled gold grades were higher in the third quarter of 2024 than the same period in 2023, resulting in higher gold recoveries of 67.3% in the third quarter of 2024.
Production and Sales Performance
During the third quarter of 2024, production of copper, gold and silver was 6,736 tonnes, 6,274 ounces and 55,963 ounces, respectively. Production of copper and silver decreased by 28% and 45%, respectively, compared to the third quarter of 2023 primarily as a result of lower head grades from the use of stockpiled ore to feed the mill. Gold production increased by 36% compared to the third quarter of 2023 due to higher gold grades and recoveries.
During the first nine months of 2024, production of copper, gold and silver was 20,479 tonnes, 15,145 ounces and 221,566 ounces, respectively.
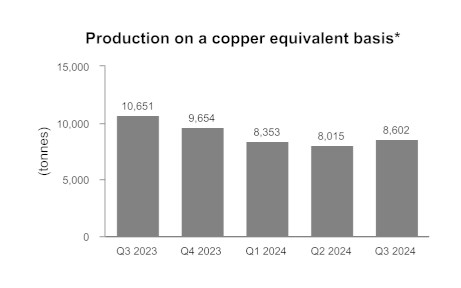
*Copper equivalent production is calculated using the quarter average LME prices for each metal excluding molybdenum.
** Copper Mountain mine production are stated at 100%. Hudbay owns 75% of Copper Mountain mine.
Cost Performance
Combined mine, mill and G&A unit operating costs in the third quarter of 2024 were C$15.58 per tonne milled, 34% lower than the third quarter of 2023. This is primarily due to lower mining costs as there were high ore rehandling costs in the third quarter of 2023, higher ore milled and the benefits from the various stabilization initiatives implemented over the course of this year. Combined unit operating costs are expected to continue to benefit from the execution of our accelerated stripping program and implementation of our optimization initiatives at Copper Mountain.
Combined mine, mill and G&A unit operating costs for the first nine months of 2024 were C$19.56 per tonne milled versus C$21.82 per tonne milled in second half of 2023 (or first six months since acquisition).
Cash cost and sustaining cash cost per pound of copper produced, net of by-product credits, in the third quarter of 2024 were $1.81 and $5.06, respectively. Cash cost was 32% lower than in the third quarter of 2023 for the same reasons as mentioned above regarding the unit cost variance. Sustaining cash costs were 49% higher than the third quarter of 2023 mainly as a result of planned higher capitalized stripping costs in order to arrive at higher grade ore, in accordance with our accelerated stripping program.
Cash cost and sustaining cash cost per pound of copper produced, net of by-product credits, in the first nine months of 2024 were $2.67 and $5.15, respectively.
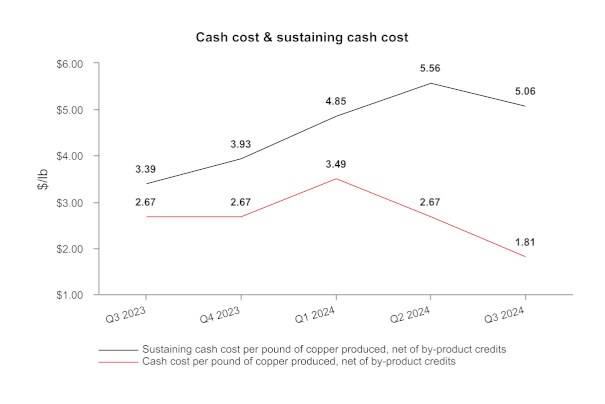
British Columbia Guidance Outlook
| | | Three months ended | Nine months
ended2 | Since
acquisition to2 | Guidance |
| | | Sep. 30,
2024 | Sep. 30,
2023 | Sep. 30, 2024 | Sep. 30, 2023 | Annual 2024 |
| Contained metal in concentrate produced | | | | | |
| Copper | tonnes | 6,736 | 9,303 | 20,479 | 10,542 | 30,000 - 44,000 |
| Gold | oz | 6,274 | 4,608 | 15,145 | 5,353 | 17,000 - 26,000 |
| Silver | oz | 55,963 | 101,069 | 221,566 | 112,987 | 300,000 - 455,000 |
| Cost per pound of copper produced | | | | | |
| Cash cost1 | $/lb | 1.81 | 2.67 | 2.67 | 2.36 | 2.00 - 2.50 |
1 Cash cost, net of by-product credits, are non-IFRS financial performance measures with no standardized definition under IFRS. For further information and a detailed reconciliation, please see the discussion under the "Non-IFRS Financial Performance Measures" section of this MD&A.
2 Copper Mountain mine results are stated at 100%. Hudbay owns 75% of Copper Mountain mine. As Copper Mountain was acquired on June 20, 2023, the results for the nine months ended September 30, 2023 represents the period from the acquisition date, June 20, 2023, through to the end of the third quarter of 2023.
We expect to be slightly below the low end of our 2024 guidance range for copper production in British Columbia as a result of lower grades in stockpiled ore and the ramp-up of stabilization efforts throughout the year. We expect gold and silver production to be within the 2024 guidance range in British Columbia. Cash cost for the nine months ended September 30, 2024 was above the higher end of our 2024 guidance range; however, we expect fourth quarter cash cost to continue to improve our anticipated full year cash cost towards the upper end of the 2024 cost guidance range.
FINANCIAL REVIEW
Financial Results
In the third quarter of 2024, we recorded net earnings attributable to owners of $49.8 million compared to net earnings on the same basis of $45.1 million in the third quarter of 2023, representing an increase in net earnings attributable to owners of $4.7 million. Year-to-date in 2024, we recorded net earnings attributable to owners of $55.5 million compared to net earnings on the same basis of $35.7 million for the same period in 2023, representing an increase earnings attributable to owners of $19.8 million.
The following table provides further details on the makeup of this variance:
(in $ millions) | Three months ended September 30, 2024 | Nine months ended September 30, 20241 |
Increase (decrease) in components of earnings: | | |
Revenues | 5.3 | 348.5 |
Cost of sales | | |
Mine operating costs | 11.8 | (140.4) |
Depreciation and amortization | 16.3 | (34.5) |
Selling and administrative expenses | (1.9) | (19.2) |
Exploration expenses | (7.5) | (12.5) |
Re-evaluation adjustment - environmental obligation | (34.4) | (39.4) |
Other expenses | 1.0 | (7.5) |
Net finance expense | 4.9 | (17.9) |
Tax expense | 9.4 | (64.6) |
Increase in net earnings for the period | 4.9 | 12.5 |
Change in non-controlling interest | (0.2) | 7.3 |
Increase in net earnings attributable to owners for the period | 4.7 | 19.8 |
1Copper Mountain mine results are stated at 100%. Hudbay owns 75% of Copper Mountain mine. As Copper Mountain was acquired on June 20, 2023, the results for the nine months ended September 30, 2023 represents the period from the acquisition date, June 20, 2023, through to the end of the third quarter of 2023. |
Revenue
Revenue for the third quarter of 2024 was $485.8 million, $5.3 million higher than the same period in 2023, primarily as a result of higher metal prices and higher zinc sales volumes, partially offset by lower copper sales volumes in Peru due to lower grades in the third quarter of 2024 as a planned stripping program was completed at Pampacancha in 2024.
Revenue for the first nine months of 2024 was $1,436.3 million, $348.5 million higher than the same period in 2023, primarily as a result of higher metal prices, higher gold and silver sales volumes and incremental revenue as a result of the Copper Mountain mine acquisition.
While a majority of revenues continue to be from copper, gold is representing an increasing portion of total revenues at 36% in the third quarter of 2024 and 33% year-to-date, compared to 27% and 26% in 2023, respectively. This is as a result of higher gold production and strong leverage higher gold prices in 2024, increasing commodity diversification and improving overall revenues.
The following table provides further details on these variances:
(in $ millions) | Three months ended September 30, 2024 | Nine months ended September 30, 2024 |
| | |
Metals prices1 | | |
Higher copper prices | 29.7 | 49.3 |
Higher gold prices | 62.3 | 95.0 |
Higher zinc prices | 3.6 | 1.5 |
Higher silver prices | 3.5 | 5.9 |
Sales volumes | | |
(Lower) higher copper sales volumes | (96.4) | (61.5) |
(Lower) higher gold sales volumes | (2.5) | 111.5 |
Higher (lower) zinc sales volumes | 3.5 | (4.0) |
(Lower) higher silver sales volumes | (1.9) | 3.2 |
British Columbia Business Unit2 | | |
Copper | - | 129.6 |
Gold | - | 19.8 |
Silver | - | 4.3 |
Treatment & Refining | - | (7.7) |
Other | | |
Molybdenum and other volume and pricing differences | (8.2) | (4.0) |
Variable consideration adjustments | - | (8.7) |
Effect of lower treatment and refining charges | 11.7 | 14.3 |
Increase in revenue in 2024 compared to 2023 | 5.3 | 348.5 |
1 See discussion below for further information regarding metals prices. |
2 Represents revenue for the period of January 1, 2024 through to June 30, 2024, where there was no comparable revenue in the comparative period due to the fact Copper Mountain mine was acquired on June 20, 2023. |
Our revenue by significant product type is summarized below:
| Three months ended | Nine months ended |
(in $ millions) | Sep. 30, 2024 | Sep. 30, 2023 | Sep. 30, 2024 | Sep. 30, 2023 |
Copper | 261.3 | 334.1 | 805.8 | 704.1 |
Gold | 176.4 | 128.4 | 474.0 | 279.2 |
Zinc | 24.2 | 17.8 | 54.7 | 57.9 |
Silver | 12.7 | 10.3 | 35.8 | 23.8 |
Molybdenum | 16.8 | 22.4 | 51.0 | 58.2 |
Other metals | - | - | 0.5 | 0.2 |
Revenue from contracts | 491.4 | 513.0 | 1,421.8 | 1,123.4 |
Amortization of deferred revenue - gold | 4.3 | 10.2 | 26.2 | 23.4 |
Amortization of deferred revenue - silver | 5.3 | 6.6 | 22.0 | 22.5 |
Amortization of deferred revenue - variable consideration adjustments - prior periods | - | - | (3.9) | 4.9 |
Pricing and volume adjustments1 | 6.0 | (16.4) | 41.6 | (8.4) |
Treatment and refining charges | (21.2) | (32.9) | (71.4) | (78.0) |
Revenue | 485.8 | 480.5 | 1,436.3 | 1,087.8 |
1 Pricing and volume adjustments represents mark-to-market adjustments on provisionally prices sales, realized and unrealized changes to fair value for non-hedge derivative contracts (QP hedges) and adjustments to originally invoiced weights and assays. |
For further detail on variable consideration adjustments, refer to note 18 of our consolidated interim financial statements.
Realized sales prices
This measure is intended to enable management and investors to understand the average realized price of metals sold to third parties in each reporting period. The average realized price per unit sold does not have any standardized meaning prescribed by IFRS, is unlikely to be comparable to similar measures presented by other issuers and should not be considered in isolation or a substitute for measures of performance prepared in accordance with IFRS.
For sales of copper, zinc, gold and silver we may enter into non-hedge derivatives ("QP hedges") which are intended to manage the provisional pricing risk arising from quotational period terms in concentrate sales agreements. The gains and losses on QP hedges are included in the calculation of realized prices. We expect that gains and losses on QP hedges will offset provisional pricing adjustments on concentrate sales contracts.
Our realized prices for the three and nine months ended September 30, 2024 and 2023, respectively, are summarized below:
| | Realized prices1 for the | | Realized prices1 for the |
| Three months ended | | Nine Months Ended |
| Prices | LME QTD 20242 | Sep. 30, 2024 | Sep. 30, 2023 | LME YTD
20242 | Sep. 30, 2024 | Sep. 30, 2023 |
| Copper | $/lb | 4.18 | 4.24 | 3.76 | 4.14 | 4.21 | 3.87 |
| Zinc | $/lb | 1.26 | 1.28 | 1.09 | 1.22 | 1.23 | 1.19 |
| Gold3 | $/oz | | 2,582 | 1,738 | | 2,206 | 1,798 |
| Silver3 | $/oz | | 27.58 | 22.34 | | 24.76 | 21.95 |
| 1 Realized prices exclude refining and treatment charges and are on the sale of finished metal or metal in concentrate. Realized prices include the effect of provisional pricing adjustments on prior period sales. |
| 2 London Metal Exchange average for Cash copper and zinc prices. |
| 3 Sales of gold and silver from Constancia mine are subject to our precious metals stream agreement with Wheaton, pursuant to which we recognize deferred revenue for precious metals deliveries and also receive cash payments. Stream sales are included within realized prices and their respective deferred revenue and cash payment rates can be found on page 35 of this MD&A. |
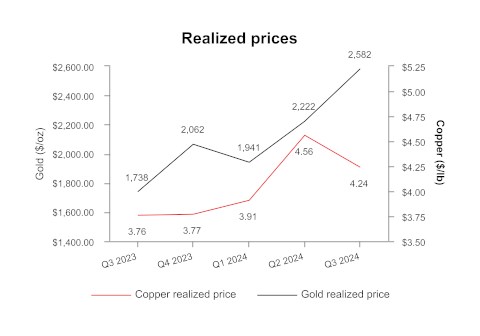
In addition to QP hedges, we may periodically undertake metal price hedging in accordance with Board approved policies to achieve strategic objectives, including locking in favourable metal prices to ensure minimum cash flows during or after the construction of a mine or during a period of reduced liquidity, to manage cash flows at shorter life or higher cost operations or as part of a financing arrangement. The realized prices, denoted in the table above, exclude the impact of derivative mark-to-market gains and losses on these non-QP hedges, which are included in change in fair value of financial instruments in our consolidated interim statement of earnings. The forward copper sales and zero copper cost collar hedges were entered into in the first quarter of 2024, which represent a total of approximately 50% of Copper Mountain's expected 2024 production.
As of September 30, 2024, Hudbay had the following non-QP hedges outstanding:
- Forward sales contracts at the Copper Mountain mine for a total of 9.3 million pounds of copper over the period of October 2024 to April 2025 at an average price of $3.95 per pound;
- Zero-cost collar program at the Copper Mountain mine for 11.6 million pounds of copper over a twelve month period of October 2024 to April 2025 at an average floor price of $3.88 per pound and an average cap price of $4.14 per pound; and
- Zero-cost collar program for 5,000 ounces of gold production per month over a period of October 2024 to December 2024 at an average floor price of $2,110 per ounce and an average cap price of $2,467 per ounce.
The following tables provide a reconciliation of average realized price per unit sold, by metal, to revenues as shown in the consolidated interim financial statements.
| Three months ended September 30, 2024 |
| (in $ millions) 1 | Copper | Gold | Zinc | Silver | Molybdenum | Other | Total |
| Revenue from contracts 2 | 261.3 | 176.4 | 24.2 | 12.7 | 16.8 | - | 491.4 |
| Amortization of deferred revenue | - | 4.3 | - | 5.3 | - | - | 9.6 |
| Pricing and volume adjustments 3 | (1.7) | 9.1 | - | 0.3 | (1.7) | - | 6.0 |
| Revenue, including mark-to-market on QP hedges 4 | 259.6 | 189.8 | 24.2 | 18.3 | 15.1 | - | 507.0 |
| Realized non-QP derivative mark-to-market | (1.4) | (0.7) | - | - | - | - | (2.1) |
| By-product credits 5 | 258.2 | 189.1 | 24.2 | 18.3 | 15.1 | - | 504.9 |
| Payable metal in concentrate and doré sold 6 | 27,760 | 73,232 | 8,607 | 663,413 | 343 | - | - |
| Realized price 7 | 9,352 | 2,582 | 2,812 | 27.58 | - | - | - |
| Realized price 8 | 4.24 | - | 1.28 | - | - | - | - |
| Nine months ended September 30, 2024 |
| (in $ millions) 1 | Copper | Gold | Zinc | Silver | Molybdenum | Other | Total |
| Revenue from contracts 2 | 805.8 | 474.0 | 54.7 | 35.8 | 51.0 | 0.5 | 1,421.8 |
| Amortization of deferred revenue | - | 26.2 | - | 22.0 | - | - | 48.2 |
| Pricing and volume adjustments 3 | 3.0 | 35.6 | (0.9) | 1.6 | 2.3 | - | 41.6 |
| Revenue, including mark-to-market on QP hedges 4 | 808.8 | 535.8 | 53.8 | 59.4 | 53.3 | 0.5 | 1,511.6 |
| Realized non-QP derivative mark-to-market | (3.9) | (0.7) | - | - | - | - | (4.6) |
| By-product credits 5 | 804.9 | 535.1 | 53.8 | 59.4 | 53.3 | 0.5 | 1,507.0 |
| Payable metal in concentrate and doré sold 6 | 87,167 | 242,608 | 19,859 | 2,399,297 | 1,105 | - | - |
| Realized price 7 | 9,279 | 2,206 | 2,709 | 24.76 | - | - | - |
| Realized price 8 | 4.21 | - | 1.23 | - | - | - | - |
| 1 Average realized price per unit sold may not calculate based on amounts presented in this table due to rounding. |
| 2 As per consolidated interim financial statements. |
| 3 Pricing and volume adjustments represents mark-to-market adjustments on provisionally priced sales, realized and unrealized changes to fair value for QP hedge derivative contracts and adjustments to originally invoiced weights and assays. |
| 4 Revenue, including mark-to-market on QP hedges is used in the calculation of realized price. |
| 5 By-product credits subtotal is used in the calculated of cash cost per pound of copper and ounce of gold produced, net of by-product credits. Cash cost per pound of copper and per ounce of gold produced, net of by-product credits, are non-IFRS financial performance measures with no standardized definition under IFRS. For further information and a detailed reconciliation, please see the discussion under the "Non-IFRS Financial Performance Measures" section of this MD&A. |
| 6 Copper, zinc and molybdenum shown in metric tonnes and gold and silver shown in ounces. |
| 7 Realized price for copper and zinc in $/metric tonne and realized price for gold and silver in $/oz. |
| 8 Realized price for copper and zinc in $/lb. |
The price, quantity and mix of metals sold affect our revenue, operating cash flow and gross profit. Revenue from metals sales can vary from quarter to quarter due to production levels, shipping volumes and transfer of risk and title to customers.
| Three months ended September 30, 2023 |
| (in $ millions) 1 | Copper | Gold | Zinc | Silver | Molybdenum | Other | Total |
| Revenue from contracts 2 | 334.1 | 128.4 | 17.8 | 10.3 | 22.4 | - | 513.0 |
| Amortization of deferred revenue | - | 10.2 | - | 6.6 | - | - | 16.8 |
| Pricing and volume adjustments 3 | (7.8) | (8.6) | (0.7) | (0.2) | 0.9 | - | (16.4) |
| Revenue, including mark-to-market on QP hedges 4 | 326.3 | 130.0 | 17.1 | 16.7 | 23.3 | - | 513.4 |
| Realized non-QP derivative mark-to-market 5 | - | - | - | - | - | - | - |
| By-product credits 4 | 326.3 | 130.0 | 17.1 | 16.7 | 23.3 | - | 513.4 |
| Payable metal in concentrate and doré sold 6 | 39,371 | 74,798 | 7,124 | 748,955 | 426 | - | - |
| Realized price 7 | 8,287 | 1,738 | 2,400 | 22.34 | - | - | - |
| Realized price 8 | 3.76 | - | 1.09 | - | - | - | - |
| Nine months ended September 30, 2023 |
| (in $ millions) 1 | Copper | Gold | Zinc | Silver | Molybdenum | Other | Total |
| Revenue from contracts 2 | 704.1 | 279.2 | 57.9 | 23.8 | 58.2 | 0.2 | 1,123.4 |
| Amortization of deferred revenue | - | 23.4 | - | 22.5 | - | - | 45.9 |
| Pricing and volume adjustments 3 | (12.7) | 6.8 | (1.6) | (0.3) | (0.6) | - | (8.4) |
| Revenue, including mark-to-market on QP hedges 4 | 691.4 | 309.4 | 56.3 | 46.0 | 57.6 | 0.2 | 1,160.9 |
| Realized non-QP derivative mark-to-market 5 | - | - | - | - | - | - | - |
| By-product credits 4 | 691.4 | 309.4 | 56.3 | 46.0 | 57.6 | 0.2 | 1,160.9 |
| Payable metal in concentrate and dore sold 6 | 80,990 | 172,052 | 21,393 | 2,096,289 | 994 | - | - |
| Realized price 7 | 8,538 | 1,798 | 2,632 | 21.95 | - | - | - |
| Realized price 8 | 3.87 | - | 1.19 | - | - | - | - |
| 1 Average realized price per unit sold may not calculate based on amounts presented in this table due to rounding. |
| 2 As per financial statements. |
| 3 Pricing and volume adjustments represents mark-to-market adjustments on provisionally priced sales, realized and unrealized changes to fair value for non-hedge derivative contracts and adjustments to originally invoiced weights and assays. |
| 4 By-product credits subtotal is used in the calculated of cash cost per pound of copper and ounce of gold produced, net of by-product credits. Cash cost per pound of copper and per ounce of gold produced, net of by-product credits, are non-IFRS financial performance measures with no standardized definition under IFRS. For further information and a detailed reconciliation, please see the discussion under the "Non-IFRS Financial Performance Measures" section of this MD&A. |
| 5 Derivative mark-to-market excludes mark-to-market on QP hedges. |
| 6 Copper, zinc and molybdenum shown in metric tonnes and gold and silver shown in ounces. |
| 7 Realized price for copper and zinc in $/metric tonne and realized price for gold and silver in $/oz. |
| 8 Realized price for copper and zinc in $/lb. |
Stream Sales
The following table shows stream sales included within realized prices and their respective deferred revenue and cash payment rates:
| | | Three months ended | Nine months ended |
| | | Sep. 30, 2024 | Sep. 30, 2023 | Sep. 30, 2024 | Sep. 30, 2023 |
| Gold | oz | 5,186 | 12,399 | 31,949 | 28,597 |
| Silver | oz | 365,807 | 434,894 | 1,513,545 | 1,475,052 |
| | | | | | |
| Gold deferred revenue drawdown rate1 | $/oz | 817 | 820 | 817 | 820 |
| Gold cash rate2 | $/oz | 425 | 420 | 422 | 418 |
| Total gold stream realized price | $/oz | 1,242 | 1,240 | 1,239 | 1,238 |
| | | | | | |
| Silver deferred revenue drawdown rate1 | $/oz | 14.56 | 15.26 | 14.56 | 15.26 |
| Silver cash rate2 | $/oz | 6.26 | 6.20 | 6.22 | 6.16 |
| Total silver stream realized price | $/oz | 20.82 | 21.46 | 20.78 | 21.42 |
| 1 Deferred revenue drawdown rates for gold and silver do not include variable consideration adjustments. |
| 2 The gold and silver cash rate for Peru increased by 1% from $400/oz and $5.90/oz effective August 4, 2019. Subsequently every year, on August 4, the cash rate will increase by 1% compounded. The gold and silver cash rate for Manitoba increased by 1% from $400/oz and $5.90/oz effective August 1, 2015. Subsequently every year, on August 1, the cash rate will increase by 1% compounded. The weighted average cash rate is disclosed. |
Subsequent to the variable consideration adjustment recorded on January 1, 2024, the deferred revenue amortization is recorded in Peru at $817/oz gold and $14.56/oz silver (September 30, 2023 - $820/oz gold and $15.26/oz silver).
Cost of Sales
Our detailed cost of sales is summarized as follows:
| (in $ thousands) | Three months ended | Nine months ended |
Sep. 30,
2024 | Sep. 30,
2023 | Sep. 30,
2024 | Sep. 30,
2023 |
| Peru | | | | |
| Mining | 37,647 | 33,875 | 98,173 | 92,315 |
| Milling | 48,535 | 46,996 | 143,494 | 147,863 |
| Changes in product inventory | 1,133 | 4,137 | 16,311 | 20,080 |
| Depreciation and amortization | 57,242 | 80,625 | 187,132 | 189,925 |
| G&A | 19,928 | 20,957 | 62,684 | 52,305 |
| Inventory adjustments | 206 | - | 206 | - |
| Freight, royalties and other charges | 16,247 | 18,055 | 48,467 | 46,050 |
| Total Peru cost of sales | 180,938 | 204,645 | 556,467 | 548,538 |
| Manitoba | | | | |
| Mining | 40,114 | 41,421 | 126,754 | 120,854 |
| Milling | 16,903 | 16,923 | 48,601 | 46,964 |
| Changes in product inventory | 1,245 | (766) | (1,722) | (11,004) |
| Depreciation and amortization | 27,662 | 26,873 | 79,000 | 73,665 |
| Inventory adjustments | 1,392 | - | 1,392 | 906 |
| G&A | 12,622 | 10,249 | 35,065 | 26,570 |
| Past service pension costs | 2,786 | - | 2,786 | - |
| Freight, royalties and other charges | 7,283 | 6,121 | 19,122 | 16,952 |
| Total Manitoba cost of sales | 110,007 | 100,821 | 310,998 | 274,907 |
| British Columbia1 | | | | |
| Mining | 12,918 | 29,251 | 60,934 | 29,251 |
| Milling | 19,707 | 24,102 | 64,589 | 24,102 |
| Changes in product inventory | (550) | 3 | 6,775 | 3 |
| Depreciation and amortization | 12,548 | 6,255 | 38,239 | 6,255 |
| G&A | 5,788 | 5,050 | 15,132 | 5,050 |
| Freight, royalties and other charges | 4,631 | 3,930 | 13,781 | 3,930 |
| Total British Columbia cost of sales | 55,042 | 68,591 | 199,450 | 68,591 |
| Cost of sales | 345,987 | 374,057 | 1,066,915 | 892,036 |
1 Copper Mountain mine results are stated at 100%. Hudbay owns 75% of Copper Mountain mine. As Copper Mountain was acquired on June 20, 2023, the results for the nine months ended September 30, 2023 represents the period from the acquisition date, June 20, 2023, through to the end of the third quarter of 2023.
Total cost of sales for the third quarter of 2024 was $346.0 million, reflecting a decrease of $28.1 million compared to the third quarter of 2023. British Columbia cost of sales decreased by $13.5 million primarily driven by lower mining and milling costs partially offset by higher depreciation in the quarter. Peru cost of sales decreased by $23.7 million in the third quarter of 2024, compared to the same period of 2023 mainly due to lower drawdown of product inventory versus the comparative 2023 period and lower depreciation in line with the lower production during the quarter. Manitoba cost of sales increased by $9.2 million in the third quarter of 2024, primarily as a result of $2.0 million related to drawdown of finished goods inventory, inventory adjustments for certain materials and supplies inventories and additional profit sharing charges during the quarter, compared to the same period of 2023.
Total cost of sales for the first nine months of 2024 was $1,066.9 million, reflecting an increase of $174.9 million from the same period in 2023 in part due to $130.9 million of 6 months of incremental operating costs from British Columbia. In addition, Peru cost of sales increased by $7.9 million mainly due to higher mining, G&A and freight costs. Manitoba cost of sales increased by $36.1 million as a result of a $9.3 million increase in the relative drawdown of finished goods inventory, $7.8 million increase in profit sharing, and higher mining, milling and depreciation as a result of higher production.
For details on unit operating costs, refer to the respective tables in the "Operations Review" section of this MD&A.
For the third quarter of 2024, other significant variances in non-operating expenses, compared to the same period in 2023, include the following:
- Net finance expenses decreased by $4.9 million primarily due to a decrease of $5.7 million on mark-to-market losses from investments in junior mining holdings, a decrease of $5.0 million from interest expense on long-term debt benefiting from the retirement of some senior notes, an increase in foreign exchange gain of $2.7 million, an increase of $1.6 million from interest income, a decrease of $1.1 million from withholding taxes, partially offset by an increase of $2.3 million on mark-to-market losses from non-QP hedges and an $8.0 million increase in the relative revaluation loss of the gold prepayment liability.
- Exploration expenses increased by $7.5 million primarily due to our planned Snow Lake exploration program consisting of modern geophysical programs and multi-phased drilling campaigns, much of which is funded by flow-through financing.
- Re-evaluation adjustment - environmental provision contributed $34.4 million of additional expense compared to the same period of 2023 due to the relative revaluation of the environmental reclamation provision on our Manitoba non-producing sites from changes in long term risk-free discount rates and inflation rates.
Given the long term nature of the reclamation cash flows, the related environmental reclamation provision is highly sensitive to changes in inflation rates and long-term risk-free discount rates and, as such, we may continue to experience significant quarterly environmental reclamation provision revaluations.
For the year-to-date 2024, other significant variances in non-operating expenses, compared to the same period in 2023, included the following:
- Net finance expenses increased by $17.9 million due to an increase in market-to-market losses of $16.7 million from non-QP hedges, an $8.4 million increase in the relative revaluation loss of the gold prepayment liability, a $4.7 million increase in other finance expenses mostly related to equipment financing, a $2.5 million increase in net foreign exchange loss, partially offset by a decrease in mark-to-market loss of $5.8 million from investments, an increase of $4.4 million in interest income, a $2.0 million decrease in interest expense on long-term debt, and a decrease in the accretion of revenue streaming arrangement of $1.8 million.
- Selling and administrative expenses increased by $19.2 million reflecting a higher share-based compensation expense as a result of a comparative increase in share price during the current period along with incremental selling and administrative expenses incurred by the Copper Mountain mine.
- Other expenses increased by $7.5 million primarily due to an increase of $12.4 million in write-off of previously capitalized PP&E costs, net of capitalized accrued interest, primarily related to an expired option agreement in Arizona and a $6.0 million increase in amortization of certain community costs, partially offset by a decrease of $6.9 million in acquisition costs related to the acquisition of Copper Mountain incurred in 2023 and $3.0 million gain related to the renouncement of flow-through share liability.
- Exploration expenses increased by $12.5 million primarily due to our planned Snow Lake exploration program consisting of modern geophysical programs and multi-phased drilling campaigns, much of which is funded by flow-through financing.
- Re-evaluation adjustment - environmental provision increased by $39.4 million due to the same reasons as outlined above in the quarterly variance analysis.
Tax Expense
For the three months ended September 30, 2024, tax expense decreased by $9.4 million compared to the same period in 2023. For the nine months ended September 30, 2024 tax expense increased by $64.6 million compared to the same period in 2023. The following table provides further details:
| (in $ thousands) | Three months ended | Nine months ended |
Sep. 30,
2024 | Sep. 30,
2023 | Sep. 30,
2024 | Sep. 30,
2023 |
| Deferred tax expense (recovery) - income tax1 | 3,993 | 1,913 | (1,243) | (16,371) |
| Deferred tax (recovery) expense - mining tax1 | (805) | 853 | (4,913) | (1,217) |
| Total deferred tax expense (recovery) | 3,188 | 2,766 | (6,156) | (17,588) |
| Current tax expense - income tax | 11,830 | 28,131 | 67,684 | 37,876 |
| Current tax expense - mining tax | 14,329 | 7,762 | 37,852 | 14,545 |
| Total current tax expense | 26,159 | 35,893 | 105,536 | 52,421 |
| Tax expense | 29,347 | 38,659 | 99,380 | 34,833 |
| 1 Deferred tax expense (recovery) represents our draw down/increase of non-cash deferred income and mining tax assets/liabilities. |
Income Tax Expense/Recovery
Applying the estimated Canadian statutory income tax rate of 26.7% to our net earnings before taxes of $147.9 million for year-to-date 2024 would have resulted in a tax expense of approximately $39.5 million; however, we recorded an income tax expense of $66.4 million. The significant items causing our effective income tax rate to be different than the 26.7% estimated Canadian statutory income tax rate include:
- Deductible temporary differences with respect to Peru, Manitoba and British Columbia, relating to the decommissioning and restoration liabilities, were derecognized as we have determined that it is probable that we will not realize the recovery of these deferred tax assets based on the timing of the reversals of the deductible temporary differences and the future projected taxable profit of the operations. This resulted in a combined deferred tax expense of $8.0 million.
- Foreign exchange on the translation of deferred tax balances to group currency resulted in a deferred tax expense of $7.1 million.
- The tax expense with respect to our foreign operations is recorded using an income tax rate other than the Canadian statutory income tax rate of 26.7%, resulting in a tax expense of $20.2 million.
- New Canadian tax legislation was passed that limits interest and finance expenses to 30% of Tax EBITDA and is applicable for the 2024 tax year. The restricted interest and finance expense ("RIFE") in the year creates a new tax pool that can be used in future years where there is excess capacity available. This tax pool can be carried forward indefinitely. We have not recognized this tax pool. The effect of RIFE limitations of which no deferred tax asset is recognized is equal to $6.7 million.
- Adjustments with respect to prior years, including an increase in the statutory tax rate owing to a change in provincial allocation, resulting in a deferred tax recovery of $7.3 million.
- Current mining tax deductions resulting in a deferred tax recovery of $10.7 million.
- Relinquishment of expenses as part of flow-through share financing resulting in a deferred tax increase of $3.4 million.
Mining Tax Expense
For year-to-date 2024, we recorded a mining tax expense of $33.0 million. Effective mining tax rates can vary significantly based on the composition of our earnings and the expected amount of mining taxable profits. Corporate costs and other costs not related to mining operations are not deductible in computing mining profits. A brief description of how mining taxes are calculated in our various business units is discussed below.
Manitoba
The Province of Manitoba imposes mining tax on earnings related to the sale of mineral products mined in the Province of Manitoba (mining taxable profit) at the following rates:
- 10% of total mining taxable earnings if mining profit is C$50 million or less;
- Between mining earnings of C$50 and $C55 million, mining tax is equal to a minimum of C$5 million plus mining earnings less C$50 million multiplied by 65%;
- 15% of total mining taxable earnings if mining profits are between C$55 million and C$100 million;
- Between mining earnings of C$100 million and C$105 million, mining tax is equal to a minimum of C$15 million plus mining earnings less C$100 million multiplied by 57%; and
- 17% of total mining taxable earnings if mining profits exceed C$105 million.
We estimate that the tax rate that will be applicable when temporary differences reverse will be approximately 10.0%.
Peru
The Peruvian government imposes two parallel mining tax regimes, the Special Mining Tax and the Modified Royalty, on companies' operating mining income on a sliding scale, with progressive rates ranging from 2.0% to 8.4% and 1.0% to 12.0%, respectively. Based on financial forecasts, we have recorded a deferred tax liability as at September 30, 2024, at the tax rate we expect to apply when temporary differences reverse.
British Columbia
The Province of British Columbia imposes a 13% net revenue tax on the sale of mineral products mined in the province of British Columbia after the mine owner has recovered the capital invested in the mine and its "Cumulative Expenditure Account" ("CEA") no longer has a balance. The tax is paid on the profit in excess of the capital that has been invested in the mine. British Columbia mineral tax is deductible for federal and provincial income tax purposes.
While there is a balance in the CEA account, the mine owner must pay a "Net Current Proceeds" ("NCP") tax of 2%. Any amounts paid as NCP can then be claimed in the future against net revenue taxes payable.
We estimate that the effective tax rate that will be applicable when temporary differences reverse will be approximately 9.49%.
LIQUIDITY AND CAPITAL RESOURCES
As at September 30, 2024, our liquidity includes $443.3 million in cash, $40.0 million in short-term investments as well as undrawn total availability of $424.4 million under our revolving credit facilities.
Senior Unsecured Notes
During the third quarter of 2024, we purchased $13.4 million of our 4.5% senior notes due April 2026 ("2026 Notes") and $35.1 million of our 6.125% senior notes due April 2029 ("2029 Notes") on the open market. During 2024, we purchased a total $25.0 million of our 2026 Notes and $57.6 million of our 2029 Notes. As at September 30, 2024, we had $575.0 million aggregate principal amount of 2026 Notes and $542.4 million aggregate principal amount of 2029 Notes.
Senior Secured Revolving Credit Facilities
We have two senior secured revolving credit facilities with total commitments of $450 million ("the Credit Facilities") for our Canadian and Peruvian businesses on substantially similar terms and conditions.
During 2024, we fully repaid the $90.0 million of debt outstanding under our Peruvian revolving credit facility. As at September 30, 2024, there were nil draws under the Credit Facilities other than $25.6 million in letters of credit.
As at September 30, 2024, we were in compliance with our covenants under the Credit Facilities.
Subsequent to the quarter end, we proactively extended the Credit Facilities by three years from October 2025 to November 2028 and negotiated the flexibility to leave our 4.50% 2026 senior unsecured notes outstanding to maturity as we advance Copper World towards a sanctioning decision in accordance with the 3-P plan. The newly extended $450 million revolving credit facility, with the existing banking syndicate, includes an improved pricing grid reflecting the enhanced financial position of Hudbay, and features an opportunity to increase the facility by an additional $150 million at our discretion during the four-year tenor, providing additional financial flexibility.
C$130 Million Bilateral Letter of Credit Facility
We have a C$130.0 million bilateral letter of credit facility ("LC Facility") with a major Canadian financial institution. The LC Facility has no financial covenants and enables us to issue up to C$130.0 million of letters of credit to beneficiaries on an unsecured basis at attractive rates, including C$30.0 million sub-limit for financial letters of credit. As at September 30, 2024, the Manitoba business unit had drawn $56.1 million in letters of credit under the LC Facility.
Surety Bonds and Letters of Credit
As at September 30, 2024, the Arizona business unit had $18.4 million in surety bonds issued to support future reclamation and closure obligations and the Peru business unit had $126.1 million in letters of credit issued with various Peruvian financial institutions to support future reclamation and other operating matters. In addition, the British Columbia business unit had $48.6 million in surety bonds issued to support future reclamation and $4.9 million in surety bonds issued to support the hydro used at Copper Mountain mine. The British Columbia business unit also had $0.6 million in cash collateralized letters of credit issued with various Canadian financial institutions related to other operating matters.
Gold Prepayment Liability
During the fourth quarter of 2020, we entered into a gold forward sale and prepay transaction which generated $115.0 million in cash proceeds to pre-fund the expected capital requirements for the New Britannia gold mill refurbishment project. The transaction valued the future gold ounce delivery obligation at 79,954 gold ounces to be delivered in fixed monthly deliveries of 3,331 gold ounces over a 24-month period from January 2022 to December 2023.
During the third quarter of 2024, we completed our final fixed monthly delivery in August and have now fully completed all delivery obligations under the gold prepayment liability.
Working Capital
Working capital increased by $298.4 million to $434.3 million from December 31, 2023 to September 30, 2024, primarily due to an increase in cash and cash equivalents of $193.5 million, an increase in short-term investment of $40.0 million, a decrease in gold prepayment liability of $55.9 million, an increase in trade and other receivables of $43.6 million, a decrease in deferred revenue of $15.6 million, an increase in prepaid and other expenses of $4.1 million and a decrease in lease liabilities of $2.3 million. Partially offsetting these items were an increase in trades and other payable of $21.2 million, an increase in other financial liabilities and other liabilities of $17.2 million, a decrease in inventories of $10.7 million, an increase in taxes payable of $3.8 million and a decrease in other financial assets and taxes receivable of $3.7 million.
Cash Flows
The following table summarizes our cash flows for the three and nine months ended September 30, 2024 and September 30, 2023:
| (in $ thousands) | Three months ended | Nine months ended |
Sep. 30,
2024 | Sep. 30,
2023 | Sep. 30,
2024 | Sep. 30,
2023 |
| Operating cash flow before change in non-cash working capital | 186,322 | 181,980 | 455,889 | 323,466 |
| Change in non-cash working capital | (40,144) | (30,032) | (31,553) | (75,682) |
| Cash generated from operating activities | 146,178 | 151,948 | 424,336 | 247,784 |
| Cash used in investing activities | (95,867) | (68,247) | (283,962) | (189,244) |
| Cash (used in) generated from financing activities | (92,277) | (18,698) | 51,485 | (40,576) |
| Effect of movement in exchange rates on cash | 1,472 | 480 | 1,620 | 1,588 |
| (Decrease) increase in cash | (40,494) | 65,483 | 193,479 | 19,552 |
Cash Flow from Operating Activities
Cash generated from operating activities was $146.2 million during the third quarter of 2024, a decrease of $5.8 million compared to the same period in 2023. Operating cash flow before change in non-cash working capital was $186.3 million during the third quarter of 2024, reflecting an increase of $4.3 million compared to the third quarter of 2023. The increase in operating cash flows before change in working capital was primarily the result of higher realized gold and copper prices more than offsetting the impact of lower planned production of copper and precious metals and the impact of an increase of $17.3 million in cash taxes paid mostly in Peru, compared to the same period in 2023.
Year-to-date cash generated from operating activities was $424.3 million in 2024, an increase of $176.6 million compared to 2023. Operating cash flow before changes in non-cash working capital for the first nine months of 2024 was $455.9 million, an increase of $132.4 million compared to 2023. The increase in operating cash flow before changes in working capital was primarily the result of higher metal prices and gold sales volumes in part due to higher gold and copper grades at Lalor, as well as the incremental contribution margin from the Copper Mountain mine. This was partially offset by a significant increase in cash taxes paid of $85.1 million mainly at our Peru operations, compared to the same period in 2023.
Cash Flow from Investing and Financing Activities
During the third quarter of 2024, we spent $188.1 million in investing and financing activities, primarily driven by $98.3 million in capital expenditures, $48.1 million of our senior unsecured notes repurchased, net of discount, a $16.8 million repayment of our gold prepayment liability, $11.6 million in capitalized lease and equipment financing payments, the final $10.0 million deferred payment for the acquisition of a prior minority interest in Copper World, $2.9 million in other financing costs mainly related to our Credit Facilities and withholding taxes, $2.9 million in dividend payments and $2.4 million in community agreement payments. These cash outflows were partially offset by $5.1 million of interest income received.
Year-to-date, we spent $232.5 million in investing and financing activities, primarily driven by $250.2 million in capital expenditures, $100.0 million in repayments on our revolving credit facilities, $62.2 million repayment of our gold prepayment liability, $81.9 million of our senior unsecured notes repurchased, net of discount, $40.0 million in short-term investments, $37.4 million in interest paid on our long-term debt, $30.6 million in capitalized lease and equipment financing payments, $10.3 million in other financing costs mainly related to our Credit Facilities and withholding taxes, the final $10.0 million deferred payment for the acquisition of a prior minority interest in Copper World, $6.3 million in community agreement payments and $5.5 million of dividends paid. These cash outflows were partially offset by $386.2 million of proceeds from equity issuance, net of transaction and issuance costs, $12.8 million of interest income and grants received and $2.5 million net proceeds from exercise of stock options and warrants.
Capital Expenditures
The following summarizes accrued and cash additions to capital assets for the periods indicated:
| | Three months ended | Nine months ended | Guidance |
| | Sep. 30,
2024 | Sep. 30,
2023 | Sep. 30,
2024 | Sep. 30,
2023 | Annual
20242 |
| (in $ millions) |
| Peru sustaining capital expenditures1 | 39.8 | 37.5 | 94.5 | 95.3 | 130.0 |
| Manitoba sustaining capital expenditures | 8.8 | 12.6 | 33.1 | 36.7 | 55.0 |
| British Columbia sustaining capital expenditures3 | 40.7 | 11.1 | 93.9 | 11.1 | 105.0 |
| Total sustaining capital expenditures | 89.3 | 61.2 | 221.5 | 143.1 | 290.0 |
| Arizona capitalized costs4 | 5.7 | 4.2 | 15.5 | 15.8 | 45.0 |
| Peru growth capitalized expenditures | 0.1 | 0.3 | 0.3 | 12.0 | 2.0 |
| Manitoba growth capitalized expenditures | 1.4 | - | 4.7 | 13.5 | 10.0 |
| British Columbia growth capitalized expenditures | 2.4 | - | 3.4 | - | 5.0 |
| Other capitalized costs2 | 25.6 | 18.5 | 71.8 | 28.7 | |
| Capitalized exploration | 1.4 | 14.9 | 5.5 | 15.8 | 8.0 |
| Total other capitalized expenditures | 36.6 | 37.9 | 101.2 | 85.8 | |
| Total accrued capital additions | 125.9 | 99.1 | 322.7 | 228.9 | |
| | | | | | |
| Reconciliation to cash capital additions: | | | | | |
| Right-of-use asset and equipment financing additions | (16.5) | (17.5) | (54.1) | (22.2) | |
| Grants received | - | (13.7) | 2.4 | (13.7) | |
| Community agreement additions | - | (0.3) | (1.8) | (2.0) | |
| Non-cash capitalized stripping | (9.1) | (1.5) | (18.2) | (5.3) | |
| Change in capital accruals and other | (2.0) | 3.1 | (0.8) | 14.3 | |
| Acquisition of property, plant & equipment - cash | 98.3 | 69.2 | 250.2 | 200.0 | |
| 1 Peru sustaining capital expenditures include capitalized stripping costs. | |
| 2 Other capitalized costs primarily include right-of-use lease and equipment financing additions, which are excluded from guidance in 2024, in addition to non-cash deferred stripping. |
| 3 Includes 100% of Copper Mountain mine production. Hudbay owns 75% of Copper mountain mine. As Copper Mountain was acquired on June 20, 2023, the production for the nine months ended September 30, 2023 represents the period from the acquisition date, June 20, 2023, through to the end of the third quarter of 2023. |
| 4 With the receipt of the Aquifer Protection Permit on August 29, 2024, we expect to commence activities related to the preparation of feasibility studies for Copper World. As a result, 2024 growth capital spending in Arizona has increased by an additional $25 million, compared to the original 2024 guidance of $20 million. |
For the three and nine months ended September 30, 2024, total capital additions increased by $26.8 million and $93.8 million, respectively, compared to the same period in 2023, primarily due to new sustaining capital expenditures at the Copper Mountain mine and new leases and equipment financing transactions, partially offset by higher capitalized right of use assets and leases, and reduced sustaining and growth capital expenditures in Manitoba and Peru.
Sustaining capital expenditures in Manitoba for the three and nine months ended September 30, 2024 were $8.8 million and $33.1 million, respectively, representing a decrease of $3.8 million and $3.6 million, respectively, compared to the same period in 2023 due to lower capital development at Lalor. Sustaining capital expenditures in Peru for the three and nine months ended September 30, 2024 were $39.8 million and $94.5 million, respectively, representing an increase of $2.3 million and a decrease of $0.8 million, respectively, compared to the same period in 2023. Sustaining capital expenditures in British Columbia for the three and nine months ended September 30, 2024 were $40.7 million and $93.9 million, respectively, which included $18.5 million and $48.9 million of capitalized stripping related to our planned three-year accelerated stripping campaign to access higher grade ore.
Growth capital spending in Manitoba for the three and nine months ended September 30, 2024 was $1.4 million and $4.7 million, respectively, representing a increase of $1.4 million and a decrease of $8.8 million, respectively, compared to the same period in 2023. The decrease mainly relates to the completion of the Stall mill recovery improvement project in 2023, partially offset by the development of an exploration drift at 1901 in 2024. Growth capital expenditures in Peru for the three and nine months ended September 30, 2024 were $0.1 million and $0.3 million, respectively, representing a decrease of $0.2 million and $11.7 million, respectively. The decrease mainly relates to the completion of the copper recovery improvement project in 2023. Arizona's capital expenditures for the three and nine months ended September 30, 2024 were $5.7 million and $15.5 million, respectively, mainly related to ongoing carrying costs.
Other capitalized costs for the three and nine months ended September 30, 2024 were $25.6 million and $71.8 million, respectively, which are mostly made up of non-cash capitalized lease and equipment financing additions.
Capitalized exploration for the three and nine months ended September 30, 2024 were $1.4 million and $5.5 million, respectively.
We expect 2024 total capital expenditures to be in line with annual guidance.
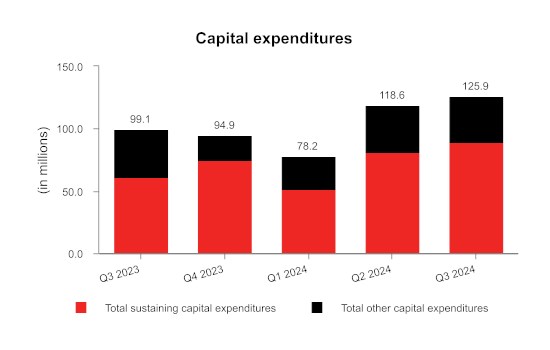
Capital Commitments
As at September 30, 2024, we had outstanding capital commitments in Canada of approximately $11.4 million, of which $3.7 million can be terminated, approximately $57.3 million in Peru primarily related to sustaining capital commitments and exploration option agreements, all of which can be terminated, and approximately $35.2 million in Arizona, primarily related to our Copper World project, none of which can be terminated.
Contractual Obligations
The following table summarizes our significant contractual obligations as at September 30, 2024:
| | Total | Less than
12 months | 13 - 36
months | 37 - 60
months | More than
60 months |
| Payment Schedule (in $ millions) |
| Long-term debt obligations1 | 1,341.2 | 62.5 | 669.9 | 608.8 | - |
| Equipment Financing and lease obligations | 179.4 | 71.5 | 70.5 | 27.3 | 10.1 |
| Purchase obligation - capital commitments | 103.9 | 48.0 | 36.3 | 19.6 | - |
| Purchase obligation - other commitments3 | 1,378.0 | 408.0 | 378.5 | 134.1 | 457.4 |
| Pension and other employee future benefits obligations2 | 110.2 | 4.8 | 16.2 | 8.8 | 80.4 |
| Community agreement obligations4, 5 | 90.5 | 22.0 | 11.5 | 8.1 | 48.9 |
| Decommissioning and restoration obligations5 | 488.3 | 4.4 | 12.9 | 7.5 | 463.5 |
| Total | 3,691.5 | 621.2 | 1,195.8 | 814.2 | 1,060.3 |
| 1 Long-term debt obligations include scheduled interest payments, as well as principal repayments |
| 2 Discounted. |
| 3 Primarily made up of trades payables, accrued liabilities, long-term agreements with operational suppliers, obligations for power purchases, concentrate handling and fleet and port services. |
| 4 Represents community agreement obligations and various finalized land user agreements, including Pampacancha. |
| 5 Undiscounted before inflation. |
In addition to the contractual obligations included in the above payment schedule, we also have the following commitments which impact our financial position:
- A profit-sharing plan with most Manitoba employees;
- A profit-sharing plan with all Peru employees;
- Wheaton precious metals stream agreement for the Constancia mine;
- Government royalty payments related to the Constancia mines; and,
- Participation agreements related to the Copper Mountain mine.
Outstanding Share Data
As of November 11, 2024, the final trading day prior to the date of this MD&A, there were 393,933,811 common shares of Hudbay issued and outstanding. In addition, there were 2,504,975 stock options and 80,872 common share purchase warrants outstanding.
TREND ANALYSIS AND QUARTERLY REVIEW
A detailed quarterly and annual summary of financial and operating performance can be found in the "Summary of Results" section at the end of this MD&A. The following table sets forth selected consolidated financial information for each of our eight most recently completed quarters:
| (in $ millions, except per share amounts, production on a copper equivalent basis and average realized copper price) | 2024 | 2023 | 2022 |
| Q3 | Q2 | Q1 | Q42 | Q3 | Q2 | Q1 | Q42 |
| Production on a copper equivalent basis (tonnes) | 60,895 | 47,164 | 62,120 | 77,951 | 71,335 | 37,530 | 38,614 | 45,454 |
| Average realized copper price ($/lb) | 4.24 | 4.56 | 3.91 | 3.77 | 3.77 | 3.89 | 3.98 | 3.61 |
| Average realized gold price ($/oz) | 2,582 | 2,222 | 1,941 | 2,062 | 1,738 | 1,810 | 1,881 | 1,615 |
| Revenue | 485.8 | 425.5 | 525.0 | 602.2 | 480.5 | 312.2 | 295.2 | 321.2 |
| Gross profit | 139.8 | 77.6 | 152.0 | 196.8 | 106.4 | 22.9 | 66.5 | 69.7 |
| Earnings (loss) before tax | 79.7 | 0.4 | 67.8 | 81.0 | 84.1 | (30.7) | 17.4 | (14.3) |
| Net earnings (loss) | 50.4 | (20.4) | 18.5 | 33.5 | 45.5 | (14.9) | 5.5 | (17.4) |
| Net earnings (loss) earnings - attributable | 49.8 | (16.6) | 22.4 | 30.7 | 45.1 | (14.9) | 5.5 | (17.4) |
| Adjusted net earnings (loss)1 - attributable | 50.3 | 0.1 | 59.4 | 68.6 | 24.3 | (18.3) | 0.1 | 2.6 |
| Earnings (loss) per share attributable: | | | | | | | | |
| Basic and diluted | 0.13 | (0.05) | 0.06 | 0.09 | 0.13 | (0.05) | 0.02 | (0.07) |
| Adjusted net earnings (loss)1 per share - attributable | 0.13 | 0.00 | 0.17 | 0.20 | 0.07 | (0.07) | 0.00 | 0.01 |
| Operating cash flow before change in non-cash working capital | 186.3 | 122.0 | 147.5 | 246.5 | 182.0 | 55.9 | 85.6 | 109.1 |
| Adjusted EBITDA1 | 206.2 | 145.0 | 214.2 | 274.4 | 190.7 | 81.2 | 101.9 | 124.7 |
| Adjusted EBITDA LTM1 | 839.8 | 824.3 | 760.5 | 647.8 | 498.5 | 407.1 | 467.3 | 475.9 |
| 1 Adjusted net earnings (loss) - attributable to owners, adjusted net earnings (loss) per share - attributable to owners, adjusted EBITDA, and adjusted EBITDA last twelve months ("LTM") are non-IFRS financial performance measure with no standardized definition under IFRS. For further information and a detailed reconciliation, please see the discussion under the "Non-IFRS Financial Performance Measures" section of this MD&A. |
| 2 Annual consolidated results may not calculate based on amounts presented in this table due to rounding. |
On a quarterly basis, the Company's revenue is primarily impacted by metal prices, production mix and sales volumes of the key metals we produce. In addition to these factors, gross profit, net earnings (loss) attributable, earnings (loss) per share attributable, operating cash flow before change in non-cash working capital and adjusted EBITDA are also impacted by input costs. Net earnings (loss) and earnings (loss) per share are further impacted by net finance expense and re-evaluation adjustments of our closed site environmental provision.
The Company's results have also been impacted by the acquisition of Copper Mountain in June 2023.
During the third quarter of 2024, profitability and cash flows grew compared to the second quarter of 2024. This strength is related to higher gold, copper and zinc production compared to the second quarter of 2024, along with returning strength in commodity prices including record gold prices. These impacts offset lower planned mined grades observed in Peru in the third quarter of 2024 and the higher cash mining taxes paid in Peru resulting from higher profitability over the past several quarters. Strong operating cost control has continued into the third quarter resulting from a number of operational initiatives and high levels of mill throughput being experienced throughout the business.
During the second quarter of 2024, realized copper and gold prices continue to climb which overcame the decline in sales volumes of concentrate compared to the first quarter of 2024. Expected lower mined grades observed for the same metals in Peru and Manitoba were the primary factor for the decline in production since the first quarter of the year. Cost control remained favourable as we continued to track within cost guidance given the expected cadence in the year's production profile. Higher mining taxes continued as we experienced higher profitability over the past several quarters. Lastly, volatile inter-period copper and gold prices led to relatively high mark-to-market adjustments for our strategic non-QP hedging program and high share prices for our common shares led to higher share-based compensation expenses. This led to a total of $19.5 million in mark-to-market adjustments to be added back in our adjusted net earnings - attributable to owners measure
The first quarter of 2024 and the fourth quarter of 2023 reflected the continuation of strong copper, gold and silver production that commenced in the third quarter of 2023. The increase in copper, gold and silver prices in the first quarter of 2024 also contributed to strong revenue and profitability in the quarter.
Third quarter of 2023 results reflected significantly higher copper and gold production and sales volumes from the high grade zones of the Pampacancha deposit and higher gold and copper grade zones at Lalor resulting in a significant increase in our revenues, gross profits and earnings.
The second quarter of 2023 benefited from the drawdown of higher-than-normal unsold copper concentrate inventory levels in Peru that had built up due to supply chain disruptions during a short period of social and political unrest in the first quarter of 2023.
Gold prices during the first quarter of 2023 averaged levels not seen since 2020, which positively impacted gross profit during the quarter. Social and political unrest in Peru resulted in road blockades causing logistics and supply chain disruptions until mid-February 2023 and led to a buildup of copper concentrate inventory above normal operating levels, affecting overall revenues and net earnings attributable in the first quarter.
Revenues for the fourth quarter of 2022 were negatively impacted by lower production due to planned maintenance programs at Lalor and Constancia, short-term changes in the mine plan in Peru and a build up of product inventory in Peru due to the aforementioned social unrest. The revenue impact of lower throughput was partially offset by higher commodity prices. Inflationary pressures on fuel, consumables and energy costs negatively impacting our production costs and margins.
NON-IFRS FINANCIAL PERFORMANCE MEASURES
Adjusted net earnings (loss) attributable to owners, adjusted net earnings (loss) per share attributable to owners, adjusted EBITDA, realized prices, net debt, net debt to adjusted EBITDA, cash cost, sustaining and all-in sustaining cash cost per pound of copper produced, cash cost and sustaining cash cost per ounce of gold produced, combined unit cost and ratios based on these measures are non-IFRS performance measures. These measures do not have a meaning prescribed by IFRS and are therefore unlikely to be comparable to similar measures presented by other issuers. These measures should not be considered in isolation or as a substitute for measures prepared in accordance with IFRS and are not necessarily indicative of gross profit or cash flow from operations as determined under IFRS. Other companies may calculate these measures differently.
Management believes adjusted net earnings (loss) attributable to owners and adjusted net earnings (loss) per share attributable to owners provides an alternate measure of the Company's performance for the current period and gives insight into its expected performance in future periods. These measures are used internally by the Company to evaluate the performance of its underlying operations and to assist with its planning and forecasting of future operating results. As such, the Company believes these measures are useful to investors in assessing the Company's underlying performance. We provide adjusted EBITDA to help users analyze our results and to provide additional information about our ongoing cash generating potential in order to assess our capacity to service and repay debt, carry out investments and cover working capital needs. Net debt is shown because it is a performance measure used by the Company to assess our financial position. Net debt to adjusted EBITDA is shown because it is a performance measure used by the Company to assess our financial leverage and debt capacity. Realized price is shown to understand the average realized price of metals sold to third parties in each reporting period. Cash cost, sustaining and all-in sustaining cash cost per pound of copper produced are shown because we believe they help investors and management assess the performance of our operations, including the margin generated by the operations and the Company. Cash cost and sustaining cash cost per ounce of gold produced are shown because we believe they help investors and management assess the performance of our Manitoba operations. Combined unit cost is shown because we believe it helps investors and management assess our cost structure and margins that are not impacted by variability in by-product commodity prices.
Adjusted Net Earnings - Attributable
Adjusted net earnings attributable to owners represents net earnings (loss) excluding certain impacts such as mark-to-market adjustments, foreign exchange (gains) loss, revaluation adjustment - environmental provisions for closed sites, variable consideration adjustment related to stream agreements, impairment charges and reversal of impairment charges on assets, (gain) loss on disposal of assets, other items that are not indicative of the underlying operating performance of our core business; and tax effect and non-controlling interest of the previously discussed items. These measures are not necessarily indicative of net earnings (loss) as determined under IFRS. The following table provides a reconciliation of net earnings and non-controlling interest per the condensed consolidated interim statements of income, to adjusted net earnings attributable to owners of the Company for the three and nine months ended September 30, 2024 and 2023.
| | Three months ended | Nine months ended |
| (in $ millions) | Sep. 30,
2024 | Sep. 30,
2023 | Sep. 30,
2024 | Sep. 30,
2023 |
| Net earnings for the period | 50.4 | 45.5 | 48.5 | 36.0 |
| Tax expense | 29.3 | 38.7 | 99.4 | 34.8 |
| Earnings before tax | 79.7 | 84.2 | 147.9 | 70.8 |
| Adjusting items: | | | | |
| Mark-to-market adjustments1 | 5.2 | 1.3 | 37.4 | 9.4 |
| Foreign exchange (gain) loss | (3.3) | (0.6) | 3.6 | 1.1 |
| Re-evaluation adjustment - environmental provision2 | 2.0 | (32.4) | (6.0) | (45.4) |
| Variable consideration adjustment - stream revenue and accretion | - | - | 4.0 | (5.0) |
| Inventory adjustments | 1.6 | - | 1.6 | 0.9 |
| Acquisition related costs | - | 0.1 | - | 6.9 |
| Restructuring charges | - | 2.3 | 1.2 | 2.3 |
| Reduction of obligation to renounce flow-through expenditures | (2.0) | - | (3.0) | - |
| Write-down/loss on disposal of PP&E | 2.2 | - | 13.3 | 0.4 |
| Adjusted earnings before income taxes | 85.4 | 54.9 | 200.0 | 41.4 |
| Tax expense | (29.3) | (38.7) | (99.4) | (34.8) |
| Tax impact of adjusting items | (5.2) | 8.2 | 7.4 | (0.5) |
| Adjusted net earnings | 50.9 | 24.4 | 108.0 | 6.1 |
| Adjusted net earnings attributable to non-controlling interest: | | | | |
| Net (earnings) loss for the period | (0.6) | (0.4) | 7.0 | (0.4) |
| Adjusting items, including tax impact | - | 0.2 | (3.9) | 0.2 |
| Adjusted net earnings - attributable to owners | 50.3 | 24.2 | 111.1 | 5.9 |
| Adjusted net earnings ($/share) - attributable to owners | 0.13 | 0.07 | 0.30 | 0.02 |
| Basic weighted average number of common shares outstanding (millions) | 393.6 | 346.7 | 371.0 | 294.0 |
| 1 Includes changes in fair value of the gold prepayment liability, Canadian junior mining investments, other financial assets and liabilities at fair value through net earnings and share-based compensation (recoveries) expenses. Also includes gains and losses on disposition of investments. |
| 2 Changes from movements to environmental reclamation provisions are primarily related to the Flin Flon operations, which were fully depreciated as of June 30, 2022, as well as other Manitoba non-operating sites. |
After adjusting reported net earnings for those items not considered representative of the Company's core business or indicative of future operations, the Company had adjusted net earnings - attributable in the third quarter of 2024 of $50.3 million or 0.13 earnings per share.
Adjusted EBITDA
Adjusted EBITDA is earnings before net finance expense/income, tax expense/recoveries, depreciation and amortization of property, plant and equipment and deferred revenue, as well as certain other adjustments. We calculate adjusted EBITDA by excluding certain adjustments included within our adjusted net earnings attributable measure which we believe reflects the underlying performance of our core operating activities. The measure also removes the impact of non-cash items and financing costs that are not associated with measuring the underlying performance of our operations. However, our adjusted EBITDA is not the measure defined as EBITDA under our senior notes or revolving credit facilities and may not be comparable with performance measures with the same name reported by other companies. Adjusted EBITDA should not be considered as a substitute for earnings or as a better measure of liquidity than operating cash flow, which are calculated in accordance with IFRS. We provide adjusted EBITDA to help users analyze our results and to provide additional information about our ongoing cash generating potential in order to assess our capacity to service and repay debt, carry out investments and cover working capital needs.
The following table presents the reconciliation of earnings per the condensed consolidated interim statements of income, to adjusted EBITDA for the three and nine months ended September 30, 2024 and 2023:
| | Three months ended | Nine months ended |
| (in $ millions) | Sep. 30,
2024 | Sep. 30,
2023 | Sep. 30,
2024 | Sep. 30,
2023 |
| Net earnings for the period | 50.4 | 45.5 | 48.5 | 36.0 |
| Add back: | | | | |
| Tax expense | 29.3 | 38.7 | 99.4 | 34.8 |
| Net finance expense | 26.0 | 30.9 | 114.3 | 96.4 |
| Other expense | 7.9 | 8.9 | 35.3 | 27.7 |
| Depreciation and amortization | 97.5 | 113.8 | 304.4 | 269.8 |
| Amortization of deferred revenue and variable consideration adjustment | (9.5) | (16.8) | (44.3) | (50.8) |
| Adjusting items (pre-tax): | | | | |
| Re-evaluation adjustment - environmental provision | 2.0 | (32.4) | (6.0) | (45.4) |
| Inventory adjustments | 1.6 | - | 1.6 | 0.9 |
| Option agreement proceeds (Marubeni) | - | - | (0.4) | - |
| Realized loss on non-QP hedges | (2.1) | - | (4.7) | - |
| Share-based compensation expense 1 | 3.1 | 2.1 | 17.1 | 4.0 |
| Adjusted EBITDA | 206.2 | 190.7 | 565.2 | 373.4 |
| 1 Share-based compensation expense reflected in cost of sales and selling and administrative expenses. |
Net Debt
The following table presents our calculation of net debt as at September 30, 2024 and December 31, 2023:
| | |
| (in $ thousands) | | Sep. 30,
2024 | | | Dec. 31,
2023 | |
| Total long-term debt | | 1,108,900 | | | 1,287,536 | |
| Cash and cash equivalents | | (443,273 | ) | | (249,794 | ) |
| Short-term investments | | (40,000 | ) | | - | |
| Net debt | | 625,627 | | | 1,037,742 | |
Net Debt to Adjusted EBITDA Ratio
The following table presents our calculation of net debt to adjusted EBITDA, both metrics have been reconciled above to the most comparable IFRS measure, as at September 30, 2024 and December 31, 2023:
| | |
| (in $ millions, except net debt to adjusted EBITDA ratio) | | Sep. 30,
2024 | | | Dec. 31,
2023 | |
| Net debt | | 625.6 | | | 1,037.7 | |
| Adjusted EBITDA for the last twelve months | | 839.8 | | | 647.8 | |
| Net debt to adjusted EBITDA | | 0.7 | | | 1.6 | |
The following table presents the reconciliation of Net earnings per the condensed consolidated interim statements of income, to adjusted EBITDA for the last twelve months ended September 30, 2024 and December 31, 2023:
| | | 12 months ended | |
| (in $ millions) | | Sep. 30,
2024 | | | Dec. 31,
2023 | |
| Net earnings for the period | | 82.0 | | | 69.5 | |
| Add back: | | | | | | |
| Tax expense | | 146.9 | | | 82.3 | |
| Net finance expense | | 163.2 | | | 145.3 | |
| Other expense | | 46.0 | | | 38.3 | |
| Depreciation and amortization | | 426.3 | | | 391.7 | |
| Amortization of deferred revenue and variable consideration adjustment | | (70.7 | ) | | (77.3 | ) |
| Adjusting items (pre-tax): | | | | | | |
| Re-evaluation adjustment - environmental provision | | 28.0 | | | (11.4 | ) |
| Inventory adjustments | | 3.0 | | | 2.3 | |
| Option agreement proceeds (Marubeni) | | (0.4 | ) | | - | |
| Realized loss on non-QP hedges | | (4.7 | ) | | - | |
| Share-based compensation expense 1 | | 20.2 | | | 7.1 | |
| Adjusted EBITDA for the last twelve months | | 839.8 | | | 647.8 | |
| 1 Share-based compensation expense reflected in cost of sales and selling and administrative expenses. | |
The following table presents our calculation of the last twelve months adjusted EBITDA:
| | | Three months ended | | | LTM1 | |
Trailing Adjusted EBITDA
(in $ millions) | | Sep. 30,
2024 | | | Jun. 30,
2024 | | | Mar. 31,
2024 | | | Dec. 31,
2023 | |
| Net earnings (loss) for the period | | 50.4 | | | (20.4 | ) | | 18.5 | | | 33.5 | | | 82.0 | |
| Add back: | | | | | | | | | | | | | | | |
| Tax expense | | 29.3 | | | 20.8 | | | 49.3 | | | 47.5 | | | 146.9 | |
| Net finance expense | | 26.0 | | | 44.3 | | | 44.0 | | | 48.9 | | | 163.2 | |
| Other expenses | | 7.9 | | | 11.2 | | | 16.3 | | | 10.6 | | | 46.0 | |
| Depreciation and amortization | | 97.5 | | | 97.6 | | | 109.3 | | | 121.9 | | | 426.3 | |
| Amortization of deferred revenue and variable consideration adjustment | | (9.5 | ) | | (11.5 | ) | | (23.2 | ) | | (26.5 | ) | | (70.7 | ) |
| Adjusting items (pre-tax): | | | | | | | | | | | | | | | |
| Re-evaluation adjustment - environmental provision | | 2.0 | | | (2.7 | ) | | (5.3 | ) | | 34.0 | | | 28.0 | |
| Inventory adjustments | | 1.6 | | | - | | | - | | | 1.4 | | | 3.0 | |
| Realized loss on non-QP hedges | | (2.1 | ) | | (2.6 | ) | | - | | | - | | | (4.7 | ) |
| Option agreement proceeds | | - | | | - | | | (0.4 | ) | | - | | | (0.4 | ) |
| Share-based compensation expenses2 | | 3.1 | | | 8.3 | | | 5.7 | | | 3.1 | | | 20.2 | |
| Adjusted EBITDA | | 206.2 | | | 145.0 | | | 214.2 | | | 274.4 | | | 839.8 | |
| 1 LTM (last twelve months) as of September 30, 2024. | |
| 2 Share-based compensation expense reflected in cost of sales and administrative expenses. | |
Cash Cost, Sustaining and All-in Sustaining Cash Cost (Copper Basis)
Cash cost per pound of copper produced ("cash cost") is a non-IFRS measure that management uses as a key performance indicator to assess the performance of our operations. Our calculation designates copper as our primary metal of production as it has been the largest component of revenues. The calculation is presented in four manners:
- Cash cost, before by-product credits - This measure is gross of by-product revenues and is a function of the efforts and costs incurred to mine and process all ore mined. However, the measure divides this aggregate cost over only pounds of copper produced, our primary metal of production. This measure is generally less volatile from period to period, as it is not affected by changes in the price received for by-product metals. It is, however, affected by the relative mix of copper concentrate and zinc concentrate production, where an increase in production of zinc concentrate will tend to result in an increase in cash cost under this measure.
- Cash cost, net of by-product credits - In order to calculate the net cost to produce and sell copper, the net of by-product credits measure subtracts the revenues realized from the sale of the metals other than copper. The by-product revenues from zinc, gold, and silver are significant and are integral to the economics of our operations. The economics that support our decision to produce and sell copper would be different if we did not receive revenues from the other significant metals being extracted and processed. This measure provides management and investors with an indication of the minimum copper price consistent with positive operating margins, assuming realized by-product metal prices are consistent with those prevailing during the reporting period. It also serves as an important operating statistic that management and investors utilize to measure our operating performance versus that of our competitors. However, it is important to understand that if by-product metal prices decline alongside copper prices, the cash cost net of by-product credits would increase, requiring a higher copper price than that reported to maintain positive cash flows and operating margins.
- Sustaining cash cost, net of by-product credits - This measure is an extension of cash cost that includes cash sustaining capital expenditures, including payments on capitalized leases, capitalized sustaining exploration, net smelter returns royalties, payments on certain long-term community agreements, as well as accretion and amortization for expected decommissioning activities for producing assets. It does not include corporate selling and administrative expenses. It provides a more fulsome measurement of the cost of sustaining production than cash cost, which is focused on operating costs only.
- All-in sustaining cash cost, net of by-product credits - This measure is an extension of sustaining cash cost that includes corporate G&A, regional costs, accretion and amortization for community agreements relating to current operations, and accretion for expected decommissioning activities for non-producing sites. Due to the inclusion of corporate selling and administrative expenses, all-in sustaining cash cost is presented on a consolidated basis only.
The tables below present a detailed build-up of cash cost and sustaining cash cost, net of by-product credits, by business unit in addition to consolidated all-in sustaining cash cost, net of by-product credits, and reconciliations between cash cost, net of by-product credits, to the most comparable IFRS measures of cost of sales for the three and nine months ended September 30, 2024 and 2023. Cash cost, net of by-product credits may not calculate exactly based on amounts presented in the tables below due to rounding.
| Consolidated | Three months ended | Nine months ended |
| Net pounds of copper produced1 | | |
| (in thousands) | Sep. 30, 2024 | Sep. 30, 2023 | Sep. 30, 2024 | Sep. 30, 2023 |
| Peru | 46,782 | 64,112 | 143,329 | 148,327 |
| Manitoba | 7,491 | 7,893 | 20,258 | 18,561 |
| British Columbia | 14,850 | 20,510 | 45,148 | 23,240 |
| Net pounds of copper produced | 69,123 | 92,515 | 208,735 | 190,128 |
| 1 Contained copper in concentrate. | | | | | | | | | | | | |
| Consolidated | Three months ended | Nine months ended |
| | Sep. 30, 2024 | Sep. 30, 2023 | Sep. 30, 2024 | Sep. 30, 2023 |
| Cash cost per pound of copper produced | $000s | $/lb | $000s | $/lb | $000s | $/lb | $000s | $/lb |
| Cash cost, before by-product credits | 259,457 | 3.75 | 288,410 | 3.12 | 798,751 | 3.83 | 685,428 | 3.61 |
| By-product credits | (246,724) | (3.57) | (187,023) | (2.02) | (702,083) | (3.37) | (469,551) | (2.47) |
| Cash cost, net of by-product credits | 12,733 | 0.18 | 101,387 | 1.10 | 96,668 | 0.46 | 215,877 | 1.14 |
| Consolidated | Three months ended | Nine months ended |
| | Sep. 30, 2024 | Sep. 30, 2023 | Sep. 30, 2024 | Sep. 30, 2023 |
| Cash cost per pound of copper produced | $000s | $/lb | $000s | $/lb | $000s | $/lb | $000s | $/lb |
| Mining | 90,679 | 1.31 | 104,547 | 1.13 | 285,861 | 1.37 | 242,420 | 1.28 |
| Milling | 85,145 | 1.23 | 88,021 | 0.95 | 256,684 | 1.23 | 218,929 | 1.15 |
| G&A | 38,016 | 0.55 | 36,107 | 0.39 | 111,596 | 0.53 | 83,637 | 0.44 |
| Onsite costs | 213,840 | 3.09 | 228,675 | 2.47 | 654,141 | 3.13 | 544,986 | 2.87 |
| Treatment & refining | 21,202 | 0.31 | 32,882 | 0.36 | 71,428 | 0.35 | 78,047 | 0.41 |
| Freight & other | 24,415 | 0.35 | 26,853 | 0.29 | 73,182 | 0.35 | 62,395 | 0.33 |
| Cash cost, before by-product credits | 259,457 | 3.75 | 288,410 | 3.12 | 798,751 | 3.83 | 685,428 | 3.61 |
| Consolidated | Three months ended | Nine months ended |
| | Sep. 30, 2024 | Sep. 30, 2023 | Sep. 30, 2024 | Sep. 30, 2023 |
| Supplementary cash cost information | $000s | $/lb 1 | $000s | $/lb 1 | $000s | $/lb1 | $000s | $/lb1 |
| By-product credits2: | | | | | | | | |
| Zinc | 24,326 | 0.35 | 17,099 | 0.18 | 53,831 | 0.26 | 56,369 | 0.30 |
| Gold3 | 188,957 | 2.73 | 129,954 | 1.41 | 534,968 | 2.57 | 309,459 | 1.63 |
| Silver3 | 18,347 | 0.27 | 16,724 | 0.18 | 59,474 | 0.28 | 46,003 | 0.24 |
| Molybdenum & other | 15,094 | 0.22 | 23,246 | 0.25 | 53,810 | 0.26 | 57,720 | 0.30 |
| Total by-product credits | 246,724 | 3.57 | 187,023 | 2.02 | 702,083 | 3.37 | 469,551 | 2.47 |
| Reconciliation to IFRS: | | | | | | | | |
| Cash cost, net of by-product credits | 12,733 | | 101,387 | | 96,668 | | 215,877 | |
| By-product credits | 246,724 | | 187,023 | | 702,083 | | 469,551 | |
| Treatment and refining charges | (21,202) | | (32,882) | | (71,428) | | (78,047) | |
| Inventory adjustments | 1,598 | | - | | 1,598 | | 906 | |
| Share-based compensation expense | 322 | | 149 | | 1,285 | | 288 | |
| Past service pension costs | 2,786 | | - | | 2,786 | | - | |
| Change in product inventory | 1,828 | | 3,374 | | 21,364 | | 9,079 | |
| Royalties | 3,746 | | 1,253 | | 8,188 | | 4,537 | |
| Depreciation and amortization4 | 97,452 | | 113,753 | | 304,371 | | 269,845 | |
| Cost of sales5 | 345,987 | | 374,057 | | 1,066,915 | | 892,036 | |
| 1 Per pound of copper produced. |
| 2 By-product credits are computed as revenue per financial statements, including amortization of deferred revenue and pricing and volume adjustments. For more information, please see the realized price reconciliation table on page 33 of this MD&A for these figures. |
| 3 Gold and silver by-product credits do not include variable consideration adjustments with respect to stream arrangements. Variable consideration adjustments are cumulative adjustments to gold and silver stream deferred revenue primarily associated with the net change in mineral reserves and resources or amendments to the mine plan that would change the total expected deliverable ounces under the precious metal streaming arrangement. For the nine months ended September 30, 2024 the variable consideration adjustments amounted loss of $3,849 (nine months ended September 30, 2023 - income of $4,885). |
| 4 Depreciation is based on concentrate sold. |
| 5 As per consolidated interim financial statements. |
| Peru | Three months ended | Nine months ended |
| (in thousands) | Sep. 30, 2024 | Sep. 30, 2023 | Sep. 30, 2024 | Sep. 30, 2023 |
| Net pounds of copper produced1 | 46,782 | 64,112 | 143,329 | 148,327 |
| 1 Contained copper in concentrate. |
| Peru | Three months ended | Nine months ended |
| | Sep. 30, 2024 | Sep. 30, 2023 | Sep. 30, 2024 | Sep. 30, 2023 |
| Cash cost per pound of copper produced | $000s | $/lb | $000s | $/lb | $000s | $/lb | $000s | $/lb |
| Mining | 37,647 | 0.81 | 33,875 | 0.53 | 98,173 | 0.69 | 92,315 | 0.62 |
| Milling | 48,535 | 1.04 | 46,996 | 0.73 | 143,494 | 1.00 | 147,863 | 1.00 |
| G&A | 19,830 | 0.42 | 20,912 | 0.33 | 62,271 | 0.43 | 52,245 | 0.35 |
| Onsite costs | 106,012 | 2.27 | 101,783 | 1.59 | 303,938 | 2.12 | 292,423 | 1.97 |
| Treatment & refining | 11,366 | 0.24 | 19,143 | 0.30 | 37,422 | 0.26 | 46,843 | 0.32 |
| Freight & other | 14,130 | 0.30 | 17,040 | 0.26 | 43,303 | 0.30 | 41,891 | 0.28 |
| Cash cost, before by-product credits | 131,508 | 2.81 | 137,966 | 2.15 | 384,663 | 2.68 | 381,157 | 2.57 |
| By-product credits | (47,245) | (1.01) | (84,793) | (1.32) | (201,825) | (1.40) | (182,885) | (1.23) |
| Cash cost, net of by-product credits | 84,263 | 1.80 | 53,173 | 0.83 | 182,838 | 1.28 | 198,272 | 1.34 |
| Peru | Three months ended | Nine months ended |
| | Sep. 30, 2024 | Sep. 30, 2023 | Sep. 30, 2024 | Sep. 30, 2023 |
| Supplementary cash cost information | $000s | $/lb 1 | $000s | $/lb 1 | $000s | $/lb 1 | $000s | $/lb 1 |
| By-product credits2: | | | | | | | | |
| Gold3 | 22,945 | 0.49 | 51,459 | 0.80 | 114,028 | 0.79 | 92,398 | 0.62 |
| Silver3 | 9,214 | 0.20 | 10,088 | 0.16 | 34,468 | 0.24 | 33,006 | 0.22 |
| Molybdenum | 15,086 | 0.32 | 23,246 | 0.36 | 53,329 | 0.37 | 57,481 | 0.39 |
| Total by-product credits | 47,245 | 1.01 | 84,793 | 1.32 | 201,825 | 1.40 | 182,885 | 1.23 |
| Reconciliation to IFRS: | | | | | | | | |
| Cash cost, net of by-product credits | 84,263 | | 53,173 | | 182,838 | | 198,272 | |
| By-product credits | 47,245 | | 84,793 | | 201,825 | | 182,885 | |
| Treatment and refining charges | (11,366) | | (19,143) | | (37,422) | | (46,843) | |
| Inventory adjustments | 206 | | - | | 206 | | - | |
| Share-based compensation expenses | 98 | | 45 | | 413 | | 60 | |
| Change in product inventory | 1,133 | | 4,137 | | 16,311 | | 20,080 | |
| Royalties | 2,117 | | 1,015 | | 5,164 | | 4,159 | |
| Depreciation and amortization4 | 57,242 | | 80,625 | | 187,132 | | 189,925 | |
| Cost of sales5 | 180,938 | | 204,645 | | 556,467 | | 548,538 | |
| 1 Per pound of copper produced. |
| 2 By-product credits are computed as revenue per financial statements, including amortization of deferred revenue and pricing and volume adjustments. For more information, please see the realized price reconciliation table on page 33 of this MD&A. |
| 3 Gold and silver by-product credits do not include variable consideration adjustments with respect to stream arrangements. |
| 4 Depreciation is based on concentrate sold. |
| 5 As per consolidated interim financial statements. |
| British Columbia | Three months ended | Nine months ended |
| (in thousands) | Sep. 30, 2024 | Sep. 30, 2023 | Sep. 30, 2024 | Sep. 30, 2023 |
| Net pounds of copper produced1 | 14,850 | 20,510 | 45,148 | 23,240 |
| 1 Contained copper in concentrate. |
| British Columbia | Three months ended | Nine months ended |
| | Sep. 30, 2024 | Sep. 30, 2023 | Sep. 30, 2024 | Sep. 30, 2023 |
| Cash cost per pound of copper produced | $000s | $/lb | $000s | $/lb | $000s | $/lb | $000s | $/lb |
| Mining | 12,918 | 0.87 | 29,251 | 1.43 | 60,934 | 1.35 | 29,251 | 1.26 |
| Milling | 19,707 | 1.33 | 24,102 | 1.17 | 64,589 | 1.43 | 24,102 | 1.04 |
| G&A | 5,788 | 0.39 | 5,050 | 0.25 | 15,132 | 0.34 | 5,050 | 0.22 |
| Onsite costs | 38,413 | 2.59 | 58,403 | 2.85 | 140,655 | 3.12 | 58,403 | 2.52 |
| Treatment & refining | 3,307 | 0.22 | 4,905 | 0.24 | 10,982 | 0.24 | 4,905 | 0.21 |
| Freight & other | 3,002 | 0.20 | 3,693 | 0.18 | 10,757 | 0.24 | 3,693 | 0.16 |
| Cash cost, before by-product credits | 44,722 | 3.01 | 67,001 | 3.27 | 162,394 | 3.60 | 67,001 | 2.89 |
| By-product credits | (17,891) | (1.20) | (12,234) | (0.60) | (41,957) | (0.93) | (12,234) | (0.53) |
| Cash cost, net of by-product credits | 26,831 | 1.81 | 54,767 | 2.67 | 120,437 | 2.67 | 54,767 | 2.36 |
| British Columbia | Three months ended | Nine months ended |
| | Sep. 30, 2024 | Sep. 30, 2023 | Sep. 30, 2024 | Sep. 30, 2023 |
| Supplementary cash cost information | $000s | $/lb 1 | $000s | $/lb 1 | $000s | $/lb 1 | $000s | $/lb 1 |
| By-product credits2: | | | | | | | | |
| Gold | 16,259 | 1.09 | 10,120 | 0.50 | 36,027 | 0.80 | 10,120 | 0.44 |
| Silver | 1,632 | 0.11 | 2,114 | 0.10 | 5,930 | 0.13 | 2,114 | 0.09 |
| Total by-product credits | 17,891 | 1.20 | 12,234 | 0.60 | 41,957 | 0.93 | 12,234 | 0.53 |
| Reconciliation to IFRS: | | | | | | | | |
| Cash cost, net of by-product credits | 26,831 | | 54,767 | | 120,437 | | 54,767 | |
| By-product credits | 17,891 | | 12,234 | | 41,957 | | 12,234 | |
| Treatment and refining charges | (3,307) | | (4,905) | | (10,982) | | (4,905) | |
| Change in product inventory | (550) | | 3 | | 6,775 | | 3 | |
| Royalties | 1,629 | | 237 | | 3,024 | | 237 | |
| Depreciation and amortization3 | 12,548 | | 6,255 | | 38,239 | | 6,255 | |
| Cost of sales4 | 55,042 | | 68,591 | | 199,450 | | 68,591 | |
| 1 Per pound of copper produced. |
| 2 By-product credits are computed as revenue per financial statements, including amortization of deferred revenue and pricing and volume adjustments. For more information, please see the realized price reconciliation table on page 33 of this MD&A. |
| 3 Depreciation is based on concentrate sold. |
| 4 As per consolidated interim financial statements. |
| Consolidated | Three months ended | Nine months ended |
| | Sep. 30, 2024 | Sep. 30, 2023 | Sep. 30, 2024 | Sep. 30, 2023 |
| All-in sustaining cash cost per pound of copper produced | $000s | $/lb | $000s | $/lb | $000s | $/lb | $000s | $/lb |
| Cash cost, net of by-product credits | 12,733 | 0.18 | 101,387 | 1.10 | 96,668 | 0.46 | 215,877 | 1.14 |
| Cash sustaining capital expenditures | 101,610 | 1.47 | 72,193 | 0.78 | 256,897 | 1.23 | 168,315 | 0.88 |
| Capitalized exploration | - | - | - | - | 2,400 | 0.01 | - | - |
| Royalties | 3,746 | 0.06 | 1,253 | 0.01 | 8,188 | 0.04 | 4,537 | 0.02 |
| Sustaining cash cost, net of by-product credits | 118,089 | 1.71 | 174,833 | 1.89 | 364,153 | 1.74 | 388,729 | 2.04 |
| Corporate selling and administrative expenses & regional costs | 12,843 | 0.18 | 10,971 | 0.12 | 50,708 | 0.24 | 30,789 | 0.16 |
| Accretion and amortization of decommissioning and community agreements1 | 3,935 | 0.06 | 3,309 | 0.03 | 14,485 | 0.07 | 7,059 | 0.04 |
| All-in sustaining cash cost, net of by-product credits | 134,867 | 1.95 | 189,113 | 2.04 | 429,347 | 2.06 | 426,577 | 2.24 |
| Reconciliation to property, plant and equipment additions: | | | | | | | | |
| Property, plant and equipment additions | 76,708 | | 77,454 | | 198,151 | | 158,582 | |
| Capitalized stripping net additions | 49,304 | | 21,762 | | 124,661 | | 70,386 | |
| Total accrued capital additions | 126,012 | | 99,216 | | 322,812 | | 228,968 | |
| Less other non-sustaining capital costs2 | 36,599 | | 37,968 | | 101,246 | | 85,824 | |
| Total sustaining capital costs | 89,413 | | 61,248 | | 221,566 | | 143,144 | |
| Capitalized lease & equipment financing cash payments - operating sites | 10,234 | | 7,199 | | 28,083 | | 16,275 | |
| Community agreement cash payments | 312 | | 1,953 | | 1,790 | | 4,432 | |
| Accretion and amortization of decommissioning and restoration obligations 3 | 1,651 | | 1,793 | | 5,458 | | 4,464 | |
| Cash sustaining capital expenditures | 101,610 | | 72,193 | | 256,897 | | 168,315 | |
| 1 Includes accretion of decommissioning liability relating to non-producing sites, and accretion and amortization of community agreements capitalized to Other assets. |
| 2 Other non-sustaining capital costs include Arizona capitalized costs, capitalized interest, capitalized exploration, right-of-use lease asset additions, equipment financing asset additions and growth capital expenditures. |
| 3 Includes amortization of decommissioning and restoration PP&E assets and accretion of decommissioning and restoration liabilities related to producing sites. |
| Peru | Three months ended | Nine months ended |
| | Sep. 30, 2024 | Sep. 30, 2023 | Sep. 30, 2024 | Sep. 30, 2023 |
| Sustaining cash cost per pound of copper produced | $000s | $/lb | $000s | $/lb | $000s | $/lb | $000s | $/lb |
| Cash cost, net of by-product credits | 84,263 | 1.80 | 53,173 | 0.83 | 182,838 | 1.28 | 198,272 | 1.34 |
| Cash sustaining capital expenditures | 43,710 | 0.93 | 42,607 | 0.66 | 107,291 | 0.75 | 109,596 | 0.74 |
| Capitalized exploration1 | - | - | - | - | 2,400 | 0.01 | - | - |
| Royalties | 2,117 | 0.05 | 1,015 | 0.02 | 5,164 | 0.04 | 4,159 | 0.03 |
| Sustaining cash cost per pound of copper produced | 130,090 | 2.78 | 96,795 | 1.51 | 297,693 | 2.08 | 312,027 | 2.10 |
| 1 Only includes exploration costs incurred for locations near to existing mine operations. |
| British Columbia | Three months ended | Nine months ended |
| | Sep. 30, 2024 | Sep. 30, 2023 | Sep. 30, 2024 | Sep. 30, 2023 |
| Sustaining cash cost per pound of copper produced | $000s | $/lb | $000s | $/lb | $000s | $/lb | $000s | $/lb |
| Cash cost, net of by-product credits | 26,831 | 1.81 | 54,767 | 2.67 | 120,437 | 2.67 | 54,767 | 2.36 |
| Cash sustaining capital expenditures | 46,612 | 3.14 | 14,487 | 0.71 | 109,083 | 2.41 | 14,487 | 0.62 |
| Capitalized exploration | - | - | - | - | 0 | 0.00 | - | - |
| Royalties | 1,629 | 0.11 | 237 | 0.01 | 3,024 | 0.07 | 237 | 0.01 |
| Sustaining cash cost per pound of copper produced | 75,072 | 5.06 | 69,491 | 3.39 | 232,544 | 5.15 | 69,491 | 2.99 |
Gold Cash Cost and Gold Sustaining Cash Cost
Cash cost per ounce of gold produced ("gold cash cost") is a non-IFRS measure that management uses as a key performance indicator to assess the performance of our Manitoba operations. This alternative cash cost calculation designates gold as the primary metal of production as it represents a substantial component of revenues for our Manitoba business unit and should therefore be less volatile over time than Manitoba cash cost per pound of copper. The calculation is presented in three manners:
- Gold cash cost, before by-product credits - This measure is gross of by-product revenues and is a function of the efforts and costs incurred to mine and process all ore mined. However, the measure divides this aggregate cost over only ounces of gold produced, the assumed primary metal of production. This measure is generally less volatile from period to period, as it is not affected by changes in the price received for by-product metals.
- Gold cash cost, net of by-product credits - In order to calculate the net cost to produce and sell gold, the net of by-product credits measure subtracts the revenues realized from the sale of the metals other than gold. The by-product revenues from copper, zinc, and silver are significant and are integral to the economics of our Manitoba operation. The economics that support our decision to produce and sell gold would be different if we did not receive revenues from the other significant metals being extracted and processed. This measure provides management and investors with an indication of the minimum gold price consistent with positive operating margins, assuming realized by-product metal prices are consistent with those prevailing during the reporting period. It also serves as an important operating statistic that management and investors utilize to measure our operating performance at our Manitoba operation versus that of our competitors. However, it is important to understand that if by-product metal prices decline alongside gold prices, the gold cash cost net of by-product credits would increase, requiring a higher gold price than that reported to maintain positive cash flows and operating margins.
- Gold sustaining cash cost, net of by-product credits - This measure is an extension of gold cash cost that includes cash sustaining capital expenditures, capitalized exploration, net smelter returns royalties, as well as accretion and amortization for expected decommissioning activities for producing assets. It does not include corporate selling and administrative expenses. It provides a more fulsome measurement of the cost of sustaining production than gold cash cost, which is focused on operating costs only.
The tables below present a detailed build-up of gold cash cost and gold sustaining cash cost, net of by-product credits, for the Manitoba business unit, and reconciliations between gold cash cost, net of by-product credits, to the most comparable IFRS measures of cost of sales for the three and nine months ended September 30, 2024 and 2023. Gold cash cost, net of by-product credits, may not calculate exactly based on amounts presented in the tables below due to rounding.
| Manitoba | Three months ended | Nine months ended |
| (in thousands) | Sep. 30, 2024 | Sep. 30, 2023 | Sep. 30, 2024 | Sep. 30, 2023 |
| Net ounces of gold produced1 | 62,468 | 56,213 | 162,787 | 127,500 |
| 1 Contained gold in concentrate and doré. | | | | |
| Manitoba | Three months ended | Nine months ended |
| | Sep. 30, 2024 | Sep. 30, 2023 | Sep. 30, 2024 | Sep. 30, 2023 |
| Cash cost per ounce of gold produced | $000s | $/oz1 | $000s | $/oz1 | $000s | $/oz1 | $000s | $/oz1 |
| Mining | 40,114 | 642 | 41,421 | 737 | 126,754 | 779 | 120,854 | 948 |
| Milling | 16,903 | 271 | 16,923 | 301 | 48,601 | 298 | 46,964 | 368 |
| G&A | 12,398 | 198 | 10,145 | 180 | 34,193 | 210 | 26,342 | 207 |
| Onsite costs | 69,415 | 1,111 | 68,489 | 1,218 | 209,548 | 1,287 | 194,160 | 1,523 |
| Treatment & refining | 6,529 | 104 | 8,834 | 157 | 23,024 | 141 | 26,299 | 206 |
| Freight & other | 7,283 | 117 | 6,120 | 109 | 19,122 | 118 | 16,811 | 132 |
| Cash cost, before by-product credits | 83,227 | 1,332 | 83,443 | 1,484 | 251,694 | 1,546 | 237,270 | 1,861 |
| By-product credits | (59,987) | (960) | (45,779) | (814) | (153,107) | (940) | (127,128) | (997) |
| Gold cash cost, net of by-product credits | 23,240 | 372 | 37,664 | 670 | 98,587 | 606 | 110,142 | 864 |
| Manitoba | Three months ended | Nine months ended |
Supplementary cash cost
information | Sep. 30, 2024 | Sep. 30, 2023 | Sep. 30, 2024 | Sep. 30, 2023 |
| $000s | $/oz 1 | $000s | $/oz1 | $000s | $/oz 1 | $000s | $/oz 1 |
| By-product credits2: | | | | | | | | |
| Copper | 28,152 | 451 | 24,158 | 430 | 79,719 | 490 | 59,637 | 468 |
| Zinc | 24,326 | 389 | 17,099 | 304 | 53,831 | 330 | 56,369 | 442 |
| Silver | 7,501 | 120 | 4,522 | 80 | 19,076 | 117 | 10,883 | 85 |
| Other | 8 | - | - | - | 481 | 3 | 239 | 2 |
| Total by-product credits | 59,987 | 960 | 45,779 | 814 | 153,107 | 940 | 127,128 | 997 |
| Reconciliation to IFRS: | | | | | | | | |
| Cash cost, net of by-product credits | 23,240 | | 37,664 | | 98,587 | | 110,142 | |
| By-product credits | 59,987 | | 45,779 | | 153,107 | | 127,128 | |
| Treatment and refining charges | (6,529) | | (8,834) | | (23,024) | | (26,299) | |
| Past service pension costs | 2,786 | | - | | 2,786 | | - | |
| Share-based compensation expenses | 224 | | 104 | | 872 | | 228 | |
| Inventory adjustments | 1,392 | | - | | 1,392 | | 906 | |
| Change in product inventory | 1,245 | | (766) | | (1,722) | | (11,004) | |
| Royalties | - | | 1 | | - | | 141 | |
| Depreciation and amortization3 | 27,662 | | 26,873 | | 79,000 | | 73,665 | |
| Cost of sales4 | 110,007 | | 100,821 | | 310,998 | | 274,907 | |
| 1 Per ounce of gold produced. |
| 2 By-product credits are computed as revenue per financial statements, amortization of deferred revenue and pricing and volume adjustments. For more information, please see the realized price reconciliation table on page 33 of this MD&A. |
| 3 Depreciation is based on concentrate sold. |
| 4 As per consolidated interim financial statements. |
| Manitoba | Three months ended | Nine months ended |
| | Sep. 30, 2024 | Sep. 30, 2023 | Sep. 30, 2024 | Sep. 30, 2023 |
| Sustaining cash cost per ounce of gold produced | $000s | $/oz | $000s | $/oz | $000s | $/oz | $000s | $/oz |
| Gold cash cost, net of by-product credits | 23,240 | 372 | 37,664 | 670 | 98,587 | 606 | 110,142 | 864 |
| Cash sustaining capital expenditures | 11,289 | 181 | 15,100 | 269 | 40,524 | 249 | 44,232 | 347 |
| Royalties | - | - | 1 | - | - | - | 141 | 1 |
| Sustaining cash cost per ounce of gold produced | 34,529 | 553 | 52,765 | 939 | 139,111 | 855 | 154,515 | 1,212 |
Combined Unit Cost
Combined unit cost ("unit cost") and zinc plant unit cost is a non-IFRS measure that management uses as a key performance indicator to assess the performance of our mining and milling operations. Combined unit cost is calculated by dividing the cost of sales by mill throughput. This measure is utilized by management and investors to assess our cost structure and margins and compare it to similar information provided by other companies in our industry. Unlike cash cost, this measure is not impacted by variability in by-product commodity prices since there are no by-product deductions; costs associated with profit-sharing and similar costs are excluded because of their correlation to external metal prices. In addition, the unit costs are reported in the functional currency of the operation which minimizes the impact of foreign currency fluctuations. In all, the unit cost measures provide an alternative perspective on operating cost performance with minimal impact from external market prices.
The tables below present a detailed combined unit cost for the Peru and Manitoba business units, and reconciliations between these measures to the most comparable IFRS measures of cost of sales for the three and nine months ended September 30, 2024 and 2023.
| Peru | Three months ended | Nine months ended |
| (in thousands except unit cost per tonne) | Sep. 30,
2024 | Sep. 30,
2023 | Sep. 30,
2024 | Sep. 30,
2023 |
| Combined unit cost per tonne processed |
| Mining | 37,647 | 33,875 | 98,173 | 92,315 |
| Milling | 48,535 | 46,996 | 143,494 | 147,863 |
| G&A1 | 19,830 | 20,912 | 62,271 | 52,245 |
| Less: Other G&A2 | (1,993) | (5,440) | (13,793) | (6,521) |
| Unit cost | 104,019 | 96,343 | 290,145 | 285,902 |
| Tonnes ore milled | 8,137 | 7,895 | 23,934 | 22,782 |
| Combined unit cost per tonne | 12.78 | 12.20 | 12.12 | 12.55 |
| Reconciliation to IFRS: | | | | |
| Unit cost | 104,019 | 96,343 | 290,145 | 285,902 |
| Freight & other | 14,130 | 17,040 | 43,303 | 41,891 |
| Other G&A | 1,993 | 5,440 | 13,793 | 6,521 |
| Share-based compensation expenses | 98 | 45 | 413 | 60 |
| Inventory adjustments | 206 | - | 206 | - |
| Change in product inventory | 1,133 | 4,137 | 16,311 | 20,080 |
| Royalties | 2,117 | 1,015 | 5,164 | 4,159 |
| Depreciation and amortization | 57,242 | 80,625 | 187,132 | 189,925 |
| Cost of sales3 | 180,938 | 204,645 | 556,467 | 548,538 |
| 1 G&A as per cash cost reconciliation above. |
| 2 Other G&A primarily includes profit sharing costs. |
| 3 As per consolidated interim financial statements. |
| Manitoba | Three months ended | Nine months ended |
| (in thousands except tonnes ore milled and unit cost per tonne) | Sep. 30, 2024 | Sep. 30, 2023 | Sep. 30, 2024 | Sep. 30, 2023 |
| Combined unit cost per tonne processed |
| Mining | 40,114 | 41,421 | 126,754 | 120,854 |
| Milling | 16,903 | 16,923 | 48,601 | 46,964 |
| G&A1 | 12,398 | 10,145 | 34,193 | 26,342 |
| Less: Other G&A related to profit sharing costs | (5,385) | (3,308) | (12,945) | (5,128) |
| Unit cost | 64,030 | 65,181 | 196,603 | 189,032 |
| USD/CAD implicit exchange rate | 1.36 | 1.34 | 1.37 | 1.34 |
| Unit cost - C$ | 87,391 | 87,363 | 268,475 | 254,216 |
| Tonnes ore milled | 413,919 | 402,443 | 1,201,112 | 1,168,642 |
| Combined unit cost per tonne - C$ | 211 | 217 | 224 | 218 |
| Reconciliation to IFRS: | | | | |
| Unit cost | 64,030 | 65,181 | 196,603 | 189,032 |
| Freight & other | 7,283 | 6,120 | 19,122 | 16,811 |
| Other G&A related to profit sharing | 5,385 | 3,308 | 12,945 | 5,128 |
| Share-based compensation expenses | 224 | 104 | 872 | 228 |
| Inventory adjustments | 1,392 | - | 1,392 | 906 |
| Past service pension costs | 2,786 | - | 2,786 | - |
| Change in product inventory | 1,245 | (766) | (1,722) | (11,004) |
| Royalties | - | 1 | - | 141 |
| Depreciation and amortization | 27,662 | 26,873 | 79,000 | 73,665 |
| Cost of sales2 | 110,007 | 100,821 | 310,998 | 274,907 |
| 1 G&A as per cash cost reconciliation above. |
| 2 As per consolidated interim financial statements. |
| British Columbia | Three months ended | Nine months ended |
| (in thousands except unit cost per tonne) | Sep. 30, 2024 | Sep. 30, 2023 | Sep. 30, 2024 | Sep. 30, 2023 |
| Combined unit cost per tonne processed |
| Mining | 12,918 | 29,251 | 60,934 | 29,251 |
| Milling | 19,707 | 24,102 | 64,589 | 24,102 |
| G&A1 | 5,788 | 5,050 | 15,132 | 5,050 |
| Unit cost | 38,413 | 58,403 | 140,655 | 58,403 |
| USD/CAD implicit exchange rate | 1.35 | 1.35 | 1.35 | 1.35 |
| Unit cost - C$ | 52,388 | 78,566 | 191,198 | 78,566 |
| Tonnes ore milled | 3,363 | 3,158 | 9,776 | 3,600 |
| Combined unit cost per tonne - C$ | 15.58 | 24.88 | 19.56 | 21.82 |
| Reconciliation to IFRS: | | | | |
| Unit cost | 38,413 | 58,403 | 140,655 | 58,403 |
| Freight & other | 3,002 | 3,693 | 10,757 | 3,693 |
| Change in product inventory | (550) | 3 | 6,775 | 3 |
| Royalties | 1,629 | 237 | 3,024 | 237 |
| Depreciation and amortization | 12,548 | 6,255 | 38,239 | 6,255 |
| Cost of sales2 | 55,042 | 68,591 | 199,450 | 68,591 |
| 1 G&A as per cash cost reconciliation above. |
| 2 As per consolidated interim financial statements. |
ACCOUNTING CHANGES AND CRITICAL ESTIMATES
New standards and interpretations adopted
For information on new standards and interpretations adopted, refer to note 3 of our September 30, 2024 consolidated interim financial statements.
Estimates and judgements
The preparation of the consolidated interim financial statements in accordance with IFRS requires us to make judgements, estimates and assumptions that affect the application of accounting policies, reported amounts of assets and liabilities, disclosure of contingent assets and liabilities at the date of the consolidated interim financial statements, and reported amounts of revenue and expenses during the reporting period. Actual results may differ from these estimates.
We review these estimates and underlying assumptions on an ongoing basis based on our experience and other factors, including expectations of future events that we believe to be reasonable under the circumstances. Revisions to accounting estimates are recognized in the period in which the estimates are revised and in any future periods affected. Certain accounting estimates and judgements have been identified as being "critical" to the presentation of our financial condition and results of operations because they require us to make subjective and/or complex judgments about matters that are inherently uncertain; or there is a reasonable likelihood that materially different amounts could be reported under different conditions or using different assumptions and estimates.
For more information on judgements and estimates, refer to note 2 of our September 30, 2024 consolidated interim financial statements.
CHANGES IN INTERNAL CONTROL OVER FINANCIAL REPORTING
Management is responsible for establishing and maintaining adequate internal control over financial reporting ("ICFR"). ICFR is designed to provide reasonable assurance regarding the reliability of financial reporting and the preparation of consolidated interim financial statements for external purposes in accordance with IFRS.
We did not make any changes to ICFR during the three month ended September 30, 2024 that materially affected or are reasonably likely to materially affect our ICFR.
NOTES TO READER
Forward-Looking Information
This MD&A contains forward-looking information within the meaning of applicable Canadian and United States securities legislation. All information contained in this MD&A, other than statements of current and historical fact, is forward-looking information. Often, but not always, forward-looking information can be identified by the use of words such as "plans", "expects", "budget", "guidance", "scheduled", "estimates", "forecasts", "strategy", "target", "intends", "objective", "goal", "understands", "anticipates" and "believes" (and variations of these or similar words) and statements that certain actions, events or results "may", "could", "would", "should", "might" "occur" or "be achieved" or "will be taken" (and variations of these or similar expressions). All of the forward-looking information in this MD&A is qualified by this cautionary note.
Forward-looking information includes, but is not limited to, statements with respect to our production, cost and capital and exploration expenditure guidance, our ability to optimize the Copper Mountain mine operation, the implementation of stripping strategies and the expected benefits therefrom, the estimated timelines and pre-requisites for sanctioning the Copper World project and the pursuit of a potential minority joint venture partner, expectations regarding the permitting requirements for the Copper World project (including expected timing for receipt of the Air Quality Permit), the expected benefits of the sanctioning of Copper World project, the expected benefits of Manitoba growth initiatives, including exploration drift at the 1901 deposit, our future deleveraging strategies and our ability to deleverage and repay debt as needed, expectations regarding our cash balance and liquidity, expectations regarding the ability to conduct exploration work and execute on exploration programs on its properties and to advance related drill plans, the advancement of the exploration program at Maria Reyna and Caballito and the status of the related drill permit application process, expectations regarding the prospective nature of the Maria Reyna and Caballito properties, the ability to continue mining higher-grade ore in the Pampacancha pit and our expectations resulting therefrom, expectations regarding our ability to further reduce greenhouse gas emissions, our evaluation and assessment of opportunities to reprocess tailings using various metallurgical technologies, the anticipated impact of brownfield and greenfield growth projects on our performance, anticipated expansion opportunities and extension of mine life in Snow Lake and our ability to find a new anchor deposit near our Snow Lake operations, anticipated future drill programs and exploration activities and any results expected therefrom, anticipated mine plans, anticipated metals prices and the anticipated sensitivity of our financial performance to metals prices, events that may affect our operations and development projects, anticipated cash flows from operations and related liquidity requirements, the anticipated effect of external factors on revenue, such as commodity prices, estimation of mineral reserves and resources, mine life projections, reclamation costs, economic outlook, government regulation of mining operations, and business and acquisition strategies. Forward-looking information is not, and cannot be, a guarantee of future results or events. Forward-looking information is based on, among other things, opinions, assumptions, estimates and analyses that, while considered reasonable by us at the date the forward-looking information is provided, inherently are subject to significant risks, uncertainties, contingencies and other factors that may cause actual results and events to be materially different from those expressed or implied by the forward-looking information.
The material factors or assumptions that we identified and were applied by us in drawing conclusions or making forecasts or projections set out in the forward-looking information include, but are not limited to:
- the ability to achieve production, cost and capital and exploration expenditure guidance;
- no significant interruptions to our operations due to social or political unrest in the regions we operate, including the navigation of the complex political and social environment in Peru;
- no interruptions to our plans for advancing the Copper World project, including with respect to timely receipt of the Air Quality Permit and the pursuit of a potential joint venture partner;
- our ability to successfully complete the optimization of the Copper Mountain operations, obtain required permits and develop and maintain good relations with key stakeholders;
- the ability to execute on its exploration plans and to advance related drill plans;
- the ability to advance the exploration program at Maria Reyna and Caballito;
- the success of mining, processing, exploration and development activities;
- the scheduled maintenance and availability of our processing facilities;
- the accuracy of geological, mining and metallurgical estimates;
- anticipated metals prices and the costs of production;
- the supply and demand for metals we produce;
- the supply and availability of all forms of energy and fuels at reasonable prices;
- no significant unanticipated operational or technical difficulties;
- no significant interruptions to operations due to adverse effects from extreme weather events, including but not limited to forest fires that may affect the regions in which we operate;
- the execution of our business and growth strategies, including the success of our strategic investments and initiatives;
- the availability of additional financing, if needed;
- the ability to deleverage and repay debt, as needed;
- the ability to complete project targets on time and on budget and other events that may affect our ability to develop our projects;
- the timing and receipt of various regulatory and governmental approvals;
- the availability of personnel for our exploration, development and operational projects and ongoing employee relations;
- maintaining good relations with the employees at our operations;
- maintaining good relations with the labour unions that represent certain of our employees in Manitoba and Peru;
- maintaining good relations with the communities in which we operate, including the neighbouring Indigenous communities and local governments;
- no significant unanticipated challenges with stakeholders at our various projects;
- no significant unanticipated events or changes relating to regulatory, environmental, health and safety matters;
- no contests over title to our properties, including as a result of rights or claimed rights of Indigenous peoples or challenges to the validity of our unpatented mining claims;
- the timing and possible outcome of pending litigation and no significant unanticipated litigation;
- certain tax matters, including, but not limited to current tax laws and regulations, changes in taxation policies and the refund of certain value added taxes from the Canadian and Peruvian governments; and
- no significant and continuing adverse changes in general economic conditions or conditions in the financial markets (including commodity prices and foreign exchange rates).
The risks, uncertainties, contingencies and other factors that may cause actual results to differ materially from those expressed or implied by the forward-looking information may include, but are not limited to, risks related to the failure to effectively complete the optimization and expansion of the Copper Mountain mine operations, political and social risks in the regions we operate, including the navigation of the complex political and social environment in Peru, risks generally associated with the mining industry and the current geopolitical environment, including future commodity prices, potential tariffs, currency and interest rate fluctuations, energy and consumable prices, supply chain constraints and general cost escalation in the current inflationary environment, uncertainties related to the development and operation of our projects, the risk of an indicator of impairment or impairment reversal relating to a material mineral property, risks related to the Copper World project, including in relation to permitting, project delivery and financing risks, risks related to the Lalor mine plan, including the ability to convert inferred mineral resource estimates to higher confidence categories, dependence on key personnel and employee and union relations, risks related to political or social instability, unrest or change, risks in respect of Indigenous and community relations, rights and title claims, risks related to extreme weather events, including, forest fires that may affect the regions in which we operate and other severe storms, operational risks and hazards, including the cost of maintaining and upgrading our tailings management facilities and any unanticipated environmental, industrial and geological events and developments and the inability to insure against all risks, failure of plant, equipment, processes, transportation and other infrastructure to operate as anticipated, compliance with government and environmental regulations, including permitting requirements and anti-bribery legislation, depletion of our reserves, volatile financial markets and interest rates that may affect our ability to obtain additional financing on acceptable terms, the failure to obtain required approvals or clearances from government authorities on a timely basis, uncertainties related to the geology, continuity, grade and estimates of mineral reserves and resources, and the potential for variations in grade and recovery rates, uncertain costs of reclamation activities, our ability to comply with our pension and other post-retirement obligations, our ability to abide by the covenants in our debt instruments and other material contracts, tax refunds, hedging transactions, as well as the risks discussed under the heading "Risk Factors" in our most recent Annual Information Form which is available on the company's SEDAR+ profile at www.sedarplus.ca and the company's EDGAR profile at www.sec.gov.
Should one or more risk, uncertainty, contingency or other factor materialize or should any factor or assumption prove incorrect, actual results could vary materially from those expressed or implied in the forward-looking information. Accordingly, you should not place undue reliance on forward-looking information. We do not assume any obligation to update or revise any forward-looking information after the date of this MD&A or to explain any material difference between subsequent actual events and any forward-looking information, except as required by applicable law.
Note to United States Investors
This MD&A has been prepared in accordance with the requirements of the securities laws in effect in Canada, which may differ materially from the requirements of United States securities laws applicable to U.S. issuers.
Qualified Person and NI 43-101
The technical and scientific information in this MD&A related to our material mineral projects has been approved by Olivier Tavchandjian, P. Geo, Senior Vice President, Exploration and Technical Services. Mr. Tavchandjian is a qualified person pursuant to National Instrument 43-101 - Standards of Disclosure for Mineral Projects ("NI 43-101").
For a description of the key assumptions, parameters and methods used to estimate mineral reserves and resources at Hudbay's material mineral properties, as well as data verification procedures and a general discussion of the extent to which the estimates of scientific and technical information may be affected by any known environmental, permitting, legal title, taxation, sociopolitical, marketing or other relevant factors, please see the technical reports for our material properties as filed by us on SEDAR+ at www.sedarplus.ca and EDGAR at www.sec.gov.
SUMMARY OF HISTORICAL RESULTS
The following unaudited tables set out a summary of quarterly and annual results for the Company.
| | | Q3 2024 | Q2 2024 | Q1 2024 | 2023 4 | Q4 2023 | Q3 2023 | Q2 2023 | Q1 2023 | 2022 4 | Q4 2022 | Q3 2022 |
| Consolidated Financial Condition ($000s) |
| Cash and cash equivalents and short-term investments | | $483,273 | $523,767 | $284,385 | $249,794 | $249,794 | $245,217 | $179,734 | $255,563 | $225,665 | $225,665 | $286,117 |
| Total long-term debt | | 1,108,900 | 1,155,575 | 1,278,587 | 1,287,536 | 1,287,536 | 1,377,443 | 1,370,682 | 1,225,023 | 1,184,162 | 1,184,162 | 1,183,237 |
| Net debt1 | | 625,627 | 631,808 | 994,202 | 1,037,742 | 1,037,742 | 1,132,226 | 1,190,948 | 969,460 | 958,497 | 958,497 | 897,120 |
| Consolidated Financial Performance ($000s except per share amounts) |
| Revenue | | $485,773 | $425,520 | $524,989 | $1,690,030 | $602,189 | $480,456 | $312,166 | $295,219 | $1,461,440 | $321,196 | $346,171 |
| Cost of sales | | 345,987 | 347,893 | 373,035 | 1,297,469 | 405,433 | 374,057 | 289,273 | 228,706 | 1,184,552 | 251,520 | 313,741 |
| Earnings (loss) before tax | | 79,701 | 441 | 67,750 | 151,830 | 80,982 | 84,149 | (30,731) | 17,430 | 95,815 | (14,287) | (263) |
| Net (loss) earnings | | 50,354 | (20,377) | 18,535 | 69,543 | 33,528 | 45,490 | (14,932) | 5,457 | 70,382 | (17,441) | (8,135) |
| Net (loss) earnings attributable to owners1 | 49,762 | (16,583) | 22,358 | 66,367 | 30,717 | 45,125 | (14,932) | 5,457 | 6,567 | (17,441) | (8,135) |
| Basic and diluted earnings (loss) per share attributable to owners | $0.13 | $(0.05) | $0.06 | $0.21 | $0.09 | $0.13 | $(0.05) | $0.02 | $0.27 | $(0.07) | $(0.03) |
| Adjusted earnings (loss) per share attributable to owners 1 | $0.13 | $0.00 | $0.17 | $0.23 | $0.20 | $0.07 | $(0.07) | $0.00 | $0.10 | $0.01 | $(0.05) |
| Operating cash flow before change in non-cash working capital | 186,322 | 122,028 | 147,539 | 569,994 | 246,528 | 181,980 | 55,878 | 85,608 | 391,729 | 109,148 | 81,617 |
| Adjusted EBITDA (in $ millions) 1 | 206.2 | 145.0 | 214.2 | 647.8 | 274.4 | 190.7 | 81.2 | 101.9 | 475.9 | 124.7 | 99.3 |
| Consolidated Operational Performance | |
| Contained metal in concentrate and doré produced 2 | | | |
| Copper | tonnes | 31,354 | 28,578 | 34,749 | 131,691 | 45,450 | 41,964 | 21,715 | 22,562 | 104,173 | 29,305 | 24,498 |
| Gold | ounces | 89,073 | 58,614 | 90,392 | 310,429 | 112,776 | 101,417 | 48,996 | 47,240 | 219,700 | 53,920 | 53,179 |
| Silver | ounces | 985,569 | 738,707 | 947,917 | 3,575,234 | 1,197,082 | 1,063,032 | 612,310 | 702,809 | 3,161,294 | 795,015 | 717,069 |
| Zinc | tonnes | 8,069 | 8,087 | 8,798 | 34,642 | 5,747 | 10,291 | 8,758 | 9,846 | 55,381 | 6,326 | 9,750 |
| Molybdenum | tonnes | 362 | 369 | 397 | 1,566 | 397 | 466 | 414 | 289 | 1,377 | 344 | 437 |
| Payable metal in concentrate and doré sold | | | | |
| Copper | tonnes | 27,760 | 25,799 | 33,608 | 124,996 | 44,006 | 39,371 | 23,078 | 18,541 | 94,473 | 25,415 | 24,799 |
| Gold | ounces | 73,232 | 61,295 | 108,081 | 276,893 | 104,840 | 74,799 | 47,533 | 49,720 | 213,415 | 47,256 | 66,932 |
| Silver | ounces | 663,413 | 667,036 | 1,068,848 | 3,145,166 | 1,048,877 | 748,955 | 805,448 | 541,884 | 2,978,485 | 559,306 | 816,416 |
| Zinc 3 | tonnes | 8,607 | 5,133 | 6,119 | 28,779 | 7,385 | 7,125 | 8,641 | 5,628 | 59,043 | 8,230 | 12,714 |
| Molybdenum | tonnes | 343 | 347 | 415 | 1,462 | 468 | 426 | 314 | 254 | 1,352 | 421 | 511 |
| Cash cost 1 | $/lb | $0.18 | $1.14 | $0.16 | $0.80 | $0.16 | $1.10 | $1.60 | $0.85 | $0.86 | $1.08 | $0.58 |
| Sustaining cash cost 1 | $/lb | $1.71 | $2.65 | $1.03 | $1.72 | $1.09 | $1.89 | $2.73 | $1.83 | $2.07 | $2.21 | $1.91 |
| All-in sustaining cash cost 1 | $/lb | $1.95 | $3.07 | $1.32 | $1.92 | $1.31 | $2.04 | $2.98 | $2.07 | $2.26 | $2.41 | $2.16 |
1Net debt, adjusted earnings (loss) per share attributable to owners, adjusted EBITDA, cash cost, sustaining cash cost and all-in sustaining cash cost per pound of copper produced, net of by-product credits, are non-IFRS financial performance measures with no standardized definition under IFRS. For further information and a detailed reconciliation, please see discussion under the "Non-IFRS Financial Performance Measures" section of this MD&A. The above table sets forth selected non-IFRS financial performance measures for each of our nine most recently completed quarters and three most recently completed years; detailed reconciliations for non-comparable prior periods can be found in our MD&A for these prior periods in the "Non-IFRS Financial Performance Measures" section of these documents.
2 Metal reported in concentrate is prior to deductions associated with smelter contract terms.
3 Includes refined zinc metal sold.
4 Annual consolidated results may not calculate based on amounts presented in this table due to rounding.
| | | Q3 2024 | Q2 2024 | Q1 2024 | 2023 5 | Q4 2023 | Q3 2023 | Q2 2023 | Q1 2023 | 2022 5 | Q4 2022 | Q3 2022 |
| Peru Operations | | | | | | | |
| Constancia ore mined1 | tonnes | 3,022,931 | 5,277,654 | 2,559,547 | 9,265,954 | 973,176 | 1,242,198 | 3,647,399 | 3,403,181 | 25,840,435 | 5,614,918 | 6,300,252 |
| Copper | % | 0.36 | 0.29 | 0.31 | 0.32 | 0.30 | 0.30 | 0.31 | 0.34 | 0.35 | 0.40 | 0.36 |
| Gold | g/tonne | 0.04 | 0.03 | 0.04 | 0.04 | 0.04 | 0.04 | 0.04 | 0.04 | 0.04 | 0.04 | 0.05 |
| Silver | g/tonne | 3.20 | 2.50 | 2.79 | 2.53 | 2.26 | 2.91 | 2.49 | 2.52 | 3.40 | 3.48 | 3.38 |
| Molybdenum | % | 0.02 | 0.01 | 0.01 | 0.01 | 0.01 | 0.01 | 0.01 | 0.01 | 0.01 | 0.01 | 0.01 |
| Pampacancha ore mined1 | tonnes | 1,777,092 | 1,288,789 | 2,214,354 | 14,756,416 | 5,556,613 | 5,894,013 | 2,408,495 | 897,295 | 8,319,250 | 3,771,629 | 2,488,928 |
| Copper | % | 0.48 | 0.41 | 0.56 | 0.51 | 0.56 | 0.53 | 0.36 | 0.49 | 0.33 | 0.37 | 0.29 |
| Gold | g/tonne | 0.27 | 0.20 | 0.32 | 0.33 | 0.32 | 0.30 | 0.34 | 0.52 | 0.29 | 0.29 | 0.23 |
| Silver | g/tonne | 6.23 | 3.83 | 4.64 | 4.28 | 4.84 | 4.22 | 2.81 | 5.12 | 4.06 | 3.84 | 4.30 |
| Molybdenum | % | 0.01 | 0.02 | 0.02 | 0.01 | 0.01 | 0.02 | 0.02 | 0.01 | 0.01 | 0.01 | 0.01 |
| Strip Ratio | | 2.62 | 1.74 | 1.95 | 1.51 | 1.26 | 1.36 | 1.74 | 1.84 | 1.13 | 0.97 | 1.26 |
| Ore milled | tonnes | 8,137,248 | 7,718,962 | 8,077,962 | 30,720,929 | 7,939,044 | 7,895,109 | 7,223,048 | 7,663,728 | 30,522,294 | 7,795,735 | 7,742,020 |
| Copper | % | 0.32 | 0.30 | 0.36 | 0.39 | 0.48 | 0.43 | 0.31 | 0.33 | 0.34 | 0.41 | 0.34 |
| Gold | g/tonne | 0.11 | 0.07 | 0.15 | 0.16 | 0.25 | 0.21 | 0.09 | 0.08 | 0.09 | 0.12 | 0.08 |
| Silver | g/tonne | 3.70 | 2.85 | 3.48 | 3.62 | 4.20 | 3.75 | 2.78 | 3.69 | 3.58 | 3.93 | 3.48 |
| Molybdenum | % | 0.01 | 0.01 | 0.01 | 0.01 | 0.01 | 0.02 | 0.01 | 0.01 | 0.01 | 0.01 | 0.01 |
| Copper recovery | % | 82.6 | 83.1 | 84.9 | 84.2 | 87.4 | 85.2 | 80.0 | 81.7 | 85.0 | 85.1 | 84.5 |
| Gold recovery | % | 68.1 | 61.4 | 73.4 | 71.8 | 77.6 | 74.8 | 61.1 | 56.8 | 63.6 | 69.6 | 61.9 |
| Silver recovery | % | 67.0 | 63.9 | 70.7 | 70.0 | 78.0 | 73.2 | 65.1 | 60.7 | 65.7 | 66.5 | 65.2 |
| Molybdenum recovery | % | 39.0 | 46.3 | 43.2 | 35.8 | 33.6 | 37.2 | 40.5 | 34.8 | 34.8 | 37.7 | 41.0 |
| Contained metal in concentrate | | | | | | |
| Copper | tonnes | 21,220 | 19,217 | 24,576 | 100,487 | 33,207 | 29,081 | 17,682 | 20,517 | 89,395 | 27,047 | 22,302 |
| Gold | ounces | 20,331 | 10,672 | 29,144 | 114,218 | 49,418 | 40,596 | 12,998 | 11,206 | 58,229 | 20,860 | 12,722 |
| Silver | ounces | 648,209 | 450,833 | 639,718 | 2,505,229 | 836,208 | 697,211 | 419,642 | 552,167 | 2,309,352 | 655,257 | 564,299 |
| Molybdenum | tonnes | 362 | 369 | 397 | 1,566 | 397 | 466 | 414 | 289 | 1,377 | 344 | 437 |
| Payable metal sold | | | | | | | | | | | | |
| Copper | tonnes | 18,803 | 16,806 | 23,754 | 96,213 | 31,200 | 27,490 | 21,207 | 16,316 | 79,805 | 23,789 | 20,718 |
| Gold | ounces | 9,795 | 13,433 | 42,677 | 97,176 | 38,114 | 32,757 | 14,524 | 11,781 | 49,968 | 15,116 | 11,970 |
| Silver | ounces | 365,198 | 400,302 | 753,707 | 2,227,419 | 703,679 | 460,001 | 671,532 | 392,207 | 2,045,678 | 411,129 | 513,470 |
| Molybdenum | tonnes | 343 | 347 | 415 | 1,462 | 468 | 426 | 314 | 254 | 1,352 | 421 | 511 |
| Unit cost 2,3,4 | $/tonne | $12.78 | $12.68 | $10.92 | $12.47 | $12.24 | $12.20 | $14.07 | $11.47 | $12.78 | $13.64 | $13.06 |
| Peru cash cost3 | $/lb | $1.80 | $1.78 | $0.43 | $1.07 | $0.54 | $0.83 | $2.14 | $1.36 | $1.58 | $1.34 | $1.68 |
| Peru sustaining cash cost3 | $/lb | $2.78 | $2.61 | $1.06 | $1.81 | $1.21 | $1.51 | $3.06 | $2.12 | $2.35 | $2.09 | $2.46 |
| 1 Reported tonnes and grade for ore mined are estimates based on mine plan assumptions and may not fully reconcile to ore milled. |
| 2 Reflects combined mine, mill and general and administrative ("G&A") costs per tonne of ore milled. Reflects the deduction of expected capitalized stripping costs. |
| 3 Combined unit costs, cash cost, and sustaining cash cost per pound of copper produced, net of by-product credits, are non-IFRS financial performance measures with no standardized definition under IFRS. For further information and a detailed reconciliation, please see the discussion under the "Non-IFRS Financial Performance Measures" section of this MD&A. The above table sets forth selected non-IFRS financial performance measures for each of our nine most recently completed quarters and three most recently completed years; detailed reconciliations for non-comparable prior periods can be found in our MD&A for these prior periods in the "Non-IFRS Financial Performance Measures" section of these documents. |
| 4 2022 combined unit costs exclude COVID-19 related costs. |
| 5 Annual consolidated results may not calculate based on amounts presented in this table due to rounding. |
| | Q3 2024 | Q2 2024 | Q1 2024 | 2023 1 | Q4 2023 | Q3 2023 | Q2 2023 | Q1 2023 | 2022 1 | Q4 2022 | Q3 2022 |
Manitoba Operations | | | | | | | | | | | | |
Lalor ore mined | tonnes | 411,295 | 385,478 | 407,708 | 1,526,729 | 372,384 | 367,491 | 413,255 | 373,599 | 1,516,203 | 369,453 | 347,345 |
Gold | g/tonne | 5.45 | 3.75 | 4.84 | 4.74 | 5.92 | 5.08 | 4.07 | 3.96 | 4.00 | 4.00 | 4.57 |
Copper | % | 0.91 | 0.69 | 0.84 | 0.86 | 1.04 | 1.02 | 0.81 | 0.57 | 0.73 | 0.73 | 0.71 |
Zinc | % | 2.73 | 2.76 | 2.92 | 3.00 | 2.20 | 3.31 | 3.14 | 3.32 | 3.14 | 2.17 | 3.27 |
Silver | g/tonne | 30.45 | 22.29 | 23.44 | 24.51 | 28.92 | 27.80 | 23.27 | 18.24 | 21.96 | 19.37 | 21.27 |
777 ore mined | tonnes | - | - | - | - | - | - | - | - | 484,355 | - | - |
Gold | g/tonne | - | - | - | - | - | - | - | - | 1.66 | - | - |
Copper | % | - | - | - | - | - | - | - | - | 1.12 | - | - |
Zinc | % | - | - | - | - | - | - | - | - | 3.83 | - | - |
Silver | g/tonne | - | - | - | - | - | - | - | - | 20.85 | - | - |
Stall Concentrator: | | | | |
Ore milled | tonnes | 222,621 | 229,527 | 219,358 | 965,567 | 228,799 | 255,516 | 238,633 | 242,619 | 968,638 | 204,350 | 229,746 |
Gold | g/tonne | 4.23 | 3.02 | 3.07 | 3.45 | 4.22 | 3.70 | 3.12 | 2.78 | 2.86 | 2.50 | 2.81 |
Copper | % | 0.89 | 0.59 | 0.64 | 0.74 | 0.73 | 0.77 | 0.85 | 0.59 | 0.71 | 0.61 | 0.67 |
Zinc | % | 4.12 | 4.05 | 4.54 | 4.36 | 3.20 | 4.88 | 4.47 | 4.81 | 4.70 | 3.43 | 4.82 |
Silver | g/tonne | 30.20 | 21.74 | 24.46 | 24.19 | 28.63 | 28.82 | 22.15 | 17.14 | 22.81 | 19.24 | 20.98 |
Copper recovery | % | 88.3 | 85.4 | 91.7 | 90.4 | 92.0 | 93.9 | 88.5 | 87.0 | 87.2 | 89.0 | 85.8 |
Zinc recovery | % | 88.1 | 87.1 | 88.4 | 82.2 | 78.5 | 82.6 | 82.2 | 84.4 | 86.6 | 90.1 | 88.0 |
Gold recovery | % | 70.5 | 65.5 | 68.0 | 64.8 | 67.5 | 67.8 | 59.9 | 61.9 | 58.0 | 62.4 | 61.3 |
Silver recovery | % | 57.8 | 54.2 | 59.8 | 61.4 | 61.8 | 64.9 | 60.3 | 56.3 | 56.8 | 56.6 | 55.7 |
New Britannia Concentrator: | | | | |
Ore milled | tonnes | 191,298 | 167,899 | 170,409 | 596,912 | 165,038 | 146,927 | 141,905 | 143,042 | 542,269 | 141,142 | 132,362 |
Gold | g/tonne | 6.77 | 5.31 | 7.03 | 6.76 | 8.03 | 6.93 | 5.82 | 6.05 | 6.28 | 6.11 | 7.70 |
Copper | % | 0.93 | 0.94 | 1.13 | 1.03 | 1.46 | 1.22 | 0.77 | 0.61 | 0.81 | 0.91 | 0.72 |
Zinc | % | 1.12 | 0.92 | 0.82 | 0.84 | 0.85 | 0.90 | 0.85 | 0.76 | 0.80 | 0.67 | 0.73 |
Silver | g/tonne | 30.24 | 24.42 | 21.60 | 25.11 | 27.97 | 23.88 | 25.79 | 22.39 | 20.97 | 22.09 | 20.11 |
Copper recovery | % | 92.8 | 94.4 | 96.2 | 93.3 | 91.6 | 97.4 | 91.2 | 91.7 | 90.7 | 89.3 | 92.3 |
Gold recovery - concentrate and doré | % | 90.0 | 90.0 | 88.6 | 88.6 | 89.0 | 88.8 | 88.6 | 87.9 | - | - | - |
Silver recovery - concentrate and doré | % | 79.9 | 83.1 | 82.0 | 81.4 | 83.2 | 82.0 | 79.6 | 80.9 | - | - | - |
Flin Flon Concentrator: | | | | | | | | | | | |
Ore milled | tonnes | - | - | - | - | - | - | - | - | 497,344 | - | - |
Gold | g/tonne | - | - | - | - | - | - | - | - | 1.67 | - | - |
Copper | % | - | - | - | - | - | - | - | - | 1.11 | - | - |
Zinc | % | - | - | - | - | - | - | - | - | 3.87 | - | - |
Silver | g/tonne | - | - | - | - | - | - | - | - | 21.00 | - | - |
Copper recovery | % | - | - | - | - | - | - | - | - | 86.7 | - | - |
Zinc recovery | % | - | - | - | - | - | - | - | - | 83.0 | - | - |
Gold recovery | % | - | - | - | - | - | - | - | - | 57.1 | - | - |
Silver recovery | % | - | - | - | - | - | - | - | - | 51.8 | - | - |
1 Annual consolidated results may not calculate based on amounts presented in this table due to rounding. |
| | Q3 2024 | Q2 2024 | Q1 2024 | 2023 4 | Q4 2023 | Q3 2023 | Q2 2023 | Q1 2023 | 2022 4 | Q4 2022 | Q3 2022 |
Manitoba Operations (continued) | | | | | | | | | | | |
Total Manitoba contained metal in concentrate and doré produced5 | | | | |
Gold | ounces | 62,468 | 43,488 | 56,831 | 187,363 | 59,863 | 56,213 | 35,253 | 36,034 | 161,471 | 33,060 | 40,457 |
Copper | tonnes | 3,398 | 2,642 | 3,149 | 12,154 | 3,735 | 3,580 | 2,794 | 2,045 | 14,778 | 2,258 | 2,196 |
Zinc | tonnes | 8,069 | 8,087 | 8,798 | 34,642 | 5,747 | 10,291 | 8,758 | 9,846 | 55,381 | 6,326 | 9,750 |
Silver | ounces | 281,397 | 210,647 | 219,823 | 851,723 | 255,579 | 264,752 | 180,750 | 150,642 | 851,942 | 139,758 | 152,770 |
Total Manitoba payable metal sold in concentrate and doré | | | | | |
Gold | ounces | 57,238 | 42,763 | 62,003 | 171,297 | 63,635 | 36,713 | 33,009 | 37,939 | 163,447 | 32,140 | 54,962 |
Copper | tonnes | 2,931 | 2,429 | 2,921 | 10,708 | 3,687 | 2,925 | 1,871 | 2,225 | 14,668 | 1,626 | 4,081 |
Zinc1 | tonnes | 8,607 | 5,133 | 6,119 | 28,779 | 7,385 | 7,125 | 8,641 | 5,628 | 59,043 | 8,230 | 12,714 |
Silver | ounces | 244,974 | 197,486 | 231,841 | 728,304 | 246,757 | 197,952 | 133,916 | 149,677 | 932,807 | 148,177 | 302,946 |
Combined unit cost 2,3 | C$/tonne | $211 | $225 | $235 | $217 | $216 | $217 | $220 | $216 | $195 | $241 | $235 |
Gold cash cost 3 | $/oz | $372 | $771 | $736 | $727 | $434 | $670 | $1,097 | $938 | $297 | $922 | $216 |
Sustaining gold cash cost 3 | $/oz | $553 | $1,163 | $950 | $1,077 | $788 | $939 | $1,521 | $1,336 | $1,091 | $1,795 | $1,045 |
1 Includes refined zinc metal sold. |
2 Reflects combined mine, mill and G&A costs per tonne of milled ore. |
3 Combined unit costs, cash cost, and sustaining cash cost per pound of copper produced, cash cost, and sustaining cash cost per ounce of gold produced, net of by-product credits, are non-IFRS financial performance measures with no standardized definition under IFRS. For further information and a detailed reconciliation, please see the discussion under the "Non-IFRS Financial Performance Measures" section of this MD&A. The above table sets forth selected non-IFRS financial performance measures for each of our nine most recently completed quarters and three most recently completed years; detailed reconciliations for non-comparable prior periods can be found in our MD&A for these prior periods in the "Non-IFRS Financial Performance Measures" section of these documents. |
4 Annual consolidated results may not calculate based on amounts presented in this table due to rounding. 5 Metal reported in concentrate is prior to deductions associated with smelter terms |
| | Q3 2024 | Q2 2024 | Q1 2024 | 2023 6 | Q4 2023 | Q3 2023 | Q2 2023 5 | Q1 2023 | 2022 | Q4 2022 | Q3 2022 |
British Columbia Operations 4 | | | | | | |
Ore mined1 | tonnes | 3,098,863 | 2,164,722 | 3,722,496 | 6,975,389 | 2,627,398 | 3,792,568 | 555,423 | - | - | - | - |
Strip Ratio | | 6.05 | 7.61 | 4.10 | 3.82 | 5.34 | 2.96 | - | - | - | - | - |
Ore milled | tonnes | 3,363,176 | 3,232,427 | 3,180,149 | 6,862,152 | 3,261,891 | 3,158,006 | 442,255 | - | - | - | - |
Copper | % | 0.24 | 0.25 | 0.27 | 0.35 | 0.33 | 0.36 | 0.36 | - | - | - | - |
Gold | g/tonne | 0.09 | 0.07 | 0.07 | 0.07 | 0.06 | 0.08 | 0.08 | - | - | - | - |
Silver | g/tonne | 0.73 | 1.01 | 1.19 | 1.36 | 1.36 | 1.40 | 1.07 | - | - | - | - |
Copper recovery | % | 84.1 | 82.3 | 83.4 | 79.7 | 78.8 | 80.90 | 77.69 | - | - | - | - |
Gold recovery | % | 67.3 | 57.2 | 61.8 | 55.9 | 54.1 | 56.10 | 67.90 | - | - | - | - |
Silver recovery | % | 71.2 | 73.9 | 72.4 | 73.0 | 73.8 | 71.30 | 78.60 | - | - | - | - |
Contained metal in concentrate produced | | | | | |
Copper | tonnes | 6,736 | 6,719 | 7,024 | 19,050 | 8,508 | 9,303 | 1,239 | - | - | - | - |
Gold | ounces | 6,274 | 4,454 | 4,417 | 8,848 | 3,495 | 4,608 | 745 | - | - | - | - |
Silver | ounces | 55,963 | 77,227 | 88,376 | 218,282 | 105,295 | 101,069 | 11,918 | - | - | - | - |
Payable metal sold | | | | | | | | | | | | |
Copper | tonnes | 6,026 | 6,564 | 6,933 | 18,075 | 9,119 | 8,956 | - | - | - | - | - |
Gold | ounces | 6,199 | 5,099 | 3,401 | 8,420 | 3,091 | 5,329 | - | - | - | - | - |
Silver | ounces | 53,241 | 69,248 | 83,300 | 189,443 | 98,441 | 91,002 | - | - | - | - | - |
Combined unit cost 2,3 | C$/tonne | $15.58 | $19.65 | $23.67 | $21.38 | $20.90 | $24.88 | - | - | - | - | - |
Cash cost3 | $/lb | $1.81 | $2.67 | $3.49 | $2.50 | $2.67 | $2.67 | - | - | - | - | - |
Sustaining cash cost 3 | $/lb | $5.06 | $5.56 | $4.85 | $3.41 | $3.93 | $3.39 | - | - | - | - | - |
1 Reported tonnes and grade for ore mined are estimates based on mine plan assumptions and may not fully reconcile to ore milled. |
2 Reflects combined mine, mill and general and administrative ("G&A") costs per tonne of ore milled. Reflects the deduction of expected capitalized stripping costs. |
3 Combined unit costs, cash cost, and sustaining cash cost per pound of copper produced, net of by-product credits, are non-IFRS financial performance measures with no standardized definition under IFRS. For further information and a detailed reconciliation, please see the discussion under the "Non-IFRS Financial Performance Measures" section of this MD&A. The above table sets forth selected non-IFRS financial performance measures for each of our nine most recently completed quarters and three most recently completed years; detailed reconciliations for non-comparable prior periods can be found in our MD&A for these prior periods in the "Non-IFRS Financial Performance Measures" section of these documents. |
4 Includes 100% of Copper Mountain mine production. Hudbay owns 75% of Copper Mountain mine. |
5 Production results from Copper Mountain operations represents the period from the June 20, 2023 acquisition date through to the end of the second quarter of 2023. |
6 Annual consolidated results may not calculate based on amounts presented in this table due to rounding. |