
Management's Discussion and Analysis of
Results of Operations and Financial Condition
For the year ended
December 31, 2024
February 18, 2025
INTRODUCTION
This Management's Discussion and Analysis ("MD&A") dated February 18, 2025 is intended to supplement Hudbay Minerals Inc.'s audited consolidated financial statements and related notes for the year ended December 31, 2024 and 2023 (the "consolidated financial statements"). The consolidated financial statements have been prepared in accordance with IFRS® Accounting Standards ("IFRS" or "GAAP") as issued by the International Accounting Standards Board ("IASB").
References to "Hudbay", the "Company", "we", "us", "our" or similar terms refer to Hudbay Minerals Inc. and its direct and indirect subsidiaries as at December 31, 2024.
Readers should be aware that:
- This MD&A contains certain "forward-looking statements" and "forward-looking information" (collectively, "forward-looking information") that are subject to risk factors set out in a cautionary note contained in our MD&A.
- This MD&A includes information with respect to Hudbay's acquisition of Copper Mountain, which was completed on June 20, 2023, including the results of the Copper Mountain mine's operations from the date of acquisition, June 20, 2023.
- This MD&A has been prepared in accordance with the requirements of the securities laws in effect in Canada, which may differ materially from the requirements of United States securities laws applicable to US issuers.
- We use a number of non-GAAP financial performance measures in our MD&A, which do not have standardized meaning under IFRS. For further information and detailed reconciliations of such measures, please see the discussion under the "Non-GAAP Financial Performance Measures" section herein.
- The technical and scientific information in this MD&A has been approved by qualified persons based on a variety of assumptions and estimates. Please see the discussion under the "Qualified Person and NI 43-101" section herein.
Readers are also urged to review the "Notes to Reader" section beginning on page 75 of this MD&A.
Additional information regarding Hudbay, including the risks related to our business and those that are reasonably likely to affect our consolidated financial statements in the future, is contained in our continuous disclosure materials, including our most recent AIF, consolidated financial statements and Management Information Circular available on SEDAR+ at www.sedarplus.ca and on EDGAR at www.sec.gov.
All amounts are in US dollars unless otherwise noted.
OUR BUSINESS
We are a copper-focused critical minerals company with three long-life operations and a world-class pipeline of copper growth projects in tier-one mining jurisdictions of Canada, Peru and the United States. Hudbay's operating portfolio includes the Constancia mine in Cusco (Peru), the Snow Lake operations in Manitoba (Canada) and the Copper Mountain mine in British Columbia (Canada). Copper is the primary metal produced by the company, which is complemented by meaningful gold production and by-product zinc, silver and molybdenum. Hudbay's growth pipeline includes the Copper World project in Arizona (United States), the Mason project in Nevada (United States), the Llaguen project in La Libertad (Peru) and several expansion and exploration opportunities near its existing operations. We are governed by the Canada Business Corporations Act and our shares are listed under the symbol "HBM" on the Toronto Stock Exchange, New York Stock Exchange and Bolsa de Valores de Lima.
OUR PURPOSE
We care about our people, our communities and our planet. Hudbay provides the metals the world needs. We work sustainably, transform lives and create better futures for communities.
We transform lives: We invest in our employees, their families and local communities through long-term employment, local procurement and economic development to improve their quality of life and ensure the communities benefit from our presence.
We operate responsibly: From exploration to closure, we operate safely and responsibly, we welcome innovation and we strive to minimize our environmental footprint while following leading operating practices in all facets of mining.
We provide critical metals: We produce copper and other metals needed for everyday products and essential for applications to support the energy transition toward a more sustainable future.
OUR STRATEGY
Our mission is to create sustainable value and strong returns by leveraging our core strengths in community relations, focused exploration, mine development and efficient operations.
We believe that copper is the commodity with the best long-term supply/demand fundamentals and offers shareholders the greatest opportunity for sustained risk-adjusted returns. Copper is essential for achieving energy transition and AI technology needs - it is one of the most heavily utilized metals in renewable energy systems and is a key component for power networks, circuit boards and cooling systems in data processing centres. Through the discovery and successful development of economic mineral deposits, and through highly efficient low-cost operations to extract the metals, we believe sustainable value will be created for all stakeholders.
Hudbay's successful development, ramp-up and operation of the Constancia open-pit mine in Peru, our long history of underground mining and full life-cycle experience in northern Manitoba, our track record of reserve expansion through effective exploration, and our organic pipeline of copper development projects including Copper World and Mason provide us with a competitive advantage to deliver sustainable value relative to other mining companies of similar scale.
Over the past decade, we have built a world-class asset portfolio by executing a consistent long-term growth strategy focused on copper. We continuously work to generate strong free cash flow and optimize the value of our producing assets through exploration, brownfield expansion projects and efficient and safe operations. Furthermore, we intend to sustainably grow Hudbay through the exploration and development of our robust project pipeline, as well as through the acquisition of other properties that fit our stringent strategic criteria.
To ensure that any investment in our existing assets or acquisition of other mineral assets is consistent with our purpose and mission, we have established a number of criteria for evaluating these opportunities. The criteria include the following:
- Sustainability: We are focused on jurisdictions that support responsible mining activity. Our current geographic focus is on select investment grade countries in the Americas, with strong rule of law and respect for human rights consistent with our long-standing focus on environmental, social and governance ("ESG") principles;
- Copper Focus: We believe copper is the commodity with the best long-term supply/demand fundamentals. Global copper mine supply is challenged due to declining industry grades, limited exploration success and an insufficient pipeline of development-ready projects while demand will continue to increase through global decarbonization initiatives and the rapid growth in AI data processing centres. We believe this long-term supply/demand gap will create opportunities for increased risk-adjusted returns. While our primary focus is on copper, we recognize and value the polymetallic nature of copper deposits and, in particular, the counter-cyclical nature of gold in our portfolio;
- Quality: We are focused on investing in long-life, low-cost, expandable, high-quality assets that can capture peak pricing of multiple commodity price cycles and can generate free cash flow through the troughs of price cycles;
- Potential: We consider the full spectrum of acquisition and investment opportunities, from early-stage exploration to producing assets, that offer significant incremental potential for exploration, development, expansion and optimization beyond the stated resources and mine plan;
- Process: We develop a clear understanding of how an investment or acquisition can create value through our robust due diligence and capital allocation process that applies our technical, social, operational and project execution expertise;
- Operatorship: We believe value is created through leveraging Hudbay's competitive advantages in safe and efficient operations and effective exploration and project development and community relations. While operatorship is a key criterion, we are open to joint ventures and partnerships that de-risk our portfolio and increase risk-adjusted returns; and
- Capital Allocation: We pursue investments and acquisitions that are accretive to Hudbay on a per share basis. Given that our strategic focus includes allocating capital to assets at various stages of development, when evaluating accretion, we will consider measures such as internal rate of return ("IRR"), return on invested capital ("ROIC"), net asset value per share and the contained value of reserves and resources per share.
Our key objectives for 2025 are to:
- Deliver strong copper and gold production levels from diversified operating platform;
- Maintain strong operating cost performance, achieving industry-leading margins;
- Generate strong cash flow to further enhance Hudbay's financial position to reinvest in high-return brownfield projects and unlock industry-leading copper growth pipeline;
- Maintain focus on financial discipline with stringent capital allocation criteria to guide discretionary spending and generate strong returns on invested capital;
- Maintain record performance at our New Britannia mill and continuous improvement initiatives throughout our Snow Lake operations;
- Implement mill optimization projects at Copper Mountain to drive improved operating performance;
- Evaluate the potential to increase mill throughput at Constancia with the installation of a pebble crusher;
- Advance the Copper World project through definitive feasibility studies and the remaining elements of the three pre-requisites plan required for sanctioning, including a potential joint venture partnership;
- Drill the 1901 deposit from the new underground access drift to test for gold and copper extensions and upgrade resources;
- Advance plans to drill the prospective Maria Reyna and Caballito properties near Constancia;
- Execute extensive exploration program on the large land package in Snow Lake to target new discoveries to utilize excess capacity at the Stall mill and further enhance production;
- Advance economic studies for the reprocessing of Flin Flon tailings;
- Explore for new discoveries within trucking distance of the Flin Flon processing facilities as part of the exploration partnership with Marubeni;
- Continue to identify and evaluate opportunities to further reduce greenhouse gas emissions and update corporate targets based on further studies and the Copper Mountain acquisition;
- Assess growth opportunities that meet our stringent strategic criteria and allocate capital to pursue those opportunities that create sustainable value for the company and our stakeholders; and
- As always, continue to operate safely and sustainably, aligned with our company purpose to ensure that our activities have a positive impact on our people, our communities and our planet.
SUMMARY
Delivered Record Annual Results, Led by Record Gold Production from Manitoba Operations and Record Revenues; 2024 Consolidated Production and Cost Guidance Achieved
- Achieved record annual revenue of $2,021.2 million and record annual adjusted EBITDA1 of $822.5 million.
- Enhanced operating platform achieved 2024 consolidated production guidance for all metals with record gold production exceeding the top end of the 2024 guidance range. Full-year consolidated copper production of 137,943 tonnes, gold production of 332,240 ounces and silver production of 3,983,851 ounces increased by 5%, 7% and 11% respectively, compared to full year 2023.
- Significantly outperformed our twice-improved 2024 consolidated cash cost guidance. Strong cost control and meaningful exposure to gold by-product credits resulted in better-than-expected consolidated 2024 cash cost1 and sustaining cash cost1 per pound of copper produced, net of by-product credits, of $0.46 and $1.62, respectively, an improvement of 43% and 6%, respectively, compared to 2023.
- Peru full year copper production was within the 2024 guidance range while gold production exceeded the top end of guidance as additional gold benches were prioritized in the fourth quarter. Peru full year cash costs of $1.18 per pound outperformed the 2024 annual guidance range.
- Manitoba full year gold production of 214,225 ounces exceeded the top end of the 2024 guidance range of 170,000 to 200,000 ounces. Manitoba full year cash costs of $606 per ounce outperformed the lower end of 2024 annual guidance range of $700 to $900 per ounce.
- British Columbia full year copper production was below the low end of the 2024 guidance range, as expected, while full year gold production was in line with the 2024 annual guidance range. Copper production was lower than the guidance range as a result of lower grades in stockpiled ore and lower mill throughput during the ramp-up of stabilization and optimization efforts throughout the year. British Columbia continues to advance mill optimization initiatives with the goal to achieve higher mill throughput in 2025.
- Cash and cash equivalents and short-term investments increased by $332.0 million to $581.8 million during 2024 due to a successful equity offering and strong operating cash flows bolstered by higher copper and gold prices, which enabled a $512.0 million reduction in net debt1 during 2024.
Delivered Strong Fourth Quarter Operating and Financial Results
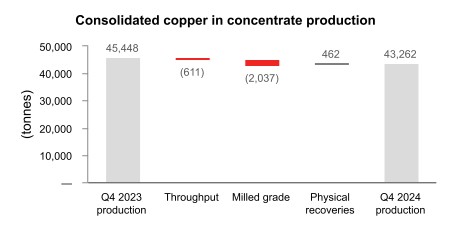
- Fourth quarter consolidated copper production of 43,262 tonnes was in line with quarterly production cadence expectations and increased 38% from the third quarter of 2024. Consolidated gold production of 94,161 ounces significantly exceeded expectations and represented an increase of 6% from the strong levels achieved in the third quarter of 2024.
- Strong operating cost performance with consolidated cash cost1 and sustaining cash cost1 per pound of copper produced, net of by-product credits1, in the fourth quarter of 2024 of $0.45 and $1.37, respectively, representing another quarter of industry-leading cost performance.
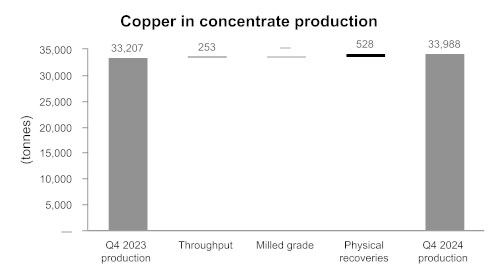
- Peru operations continued to benefit from strong and consistent mill throughput, achieving averages of approximately 87,000 tonnes per day in the fourth quarter, despite a planned semi-annual mill maintenance shutdown. The on-time completion of the Pampacancha stripping program contributed to higher grade ore during the fourth quarter. Peru operations produced 33,988 tonnes of copper and 38,079 ounces of gold in the fourth quarter of 2024, in line with quarterly cadence expectations. Peru cash cost per pound of copper produced, net of by-product credits1, was $1.00 in the fourth quarter, demonstrating continued strong cost performance.
- Manitoba operations produced 51,438 ounces of gold in the fourth quarter of 2024, significantly exceeding management's expectations in both production and efficiency. Manitoba cash cost per ounce of gold produced, net of by-product credits1, was $607 during the fourth quarter, reflecting better-than-expected operating performance and continued strong operating cost margins.
- British Columbia operations produced 5,927 tonnes of copper at a cash cost per pound of copper produced, net of by-product credits1, of $3.00 in the fourth quarter of 2024, reflecting reduced mill throughput versus the third quarter of 2024 as a result of ramp-up periods following mill maintenance shutdowns during the quarter.
- Achieved revenue of $584.9 million and operating cash flow before change in non-cash working capital of $231.5 million in the fourth quarter of 2024, a 20% and 24% increase, respectively, from the third quarter of 2024. Strong financial results were driven by higher realized gold prices as well as strong copper production in Peru, while delivering on higher grades, throughput and cost control initiatives across all business units.
- Fourth quarter net earnings attributable to owners and earnings per share attributable to owners were $21.2 million and $0.05, respectively. After adjusting for items on a pre-tax basis such as a non-cash $17.4 million foreign exchange loss, a $14.1 million write-down of PP&E, a $10.3 million mark-to-market revaluation gain on various instruments such as unrealized strategic copper hedges, investments and share-based compensation, and a non-cash loss of $2.5 million related to a quarterly revaluation of our closed site environmental reclamation provision, among other items, fourth quarter adjusted earnings1 per share attributable to owners was $0.18.
- Adjusted EBITDA1 was $257.3 million during the fourth quarter of 2024, a 25% increase compared to the third quarter of 2024.
- Financial results in the fourth quarter would have been even higher if excess copper inventory in Peru at the end of December 2024 was sold. A total of approximately 30,000 wet metric tonnes of copper concentrate was unsold at the end of December, compared to normal levels of 15,000 wet metric tonnes. The excess copper concentrate inventory in Peru is expected to be sold in the first quarter of 2025.
Achieved Significant Debt Reduction and Transformed Balance Sheet
- Hudbay's unique copper and gold diversification in Peru and Canada provides exposure to higher copper and gold prices and attractive free cash flow generation.
- While the majority of revenues continue to be derived from copper production, gold represented an increasing portion of total revenues at 35% in 2024 compared to 29% in 2023, which was driven by high gold prices and record gold production in Manitoba.
- Impressive operating cash flow and free cash flow generation in 2024 reflects continued strong copper and gold production in Peru and higher gold production from Manitoba following the full repayment of our gold prepayment liability in August 2024, as well as operating cash flow contributions from British Columbia.
- Strong operating cash flow generation and the net proceeds from the equity offering in May 2024 allowed the Company to significantly deleverage and transform the balance sheet with $245 million of combined debt repayments and gold prepayment liability reductions in 2024.
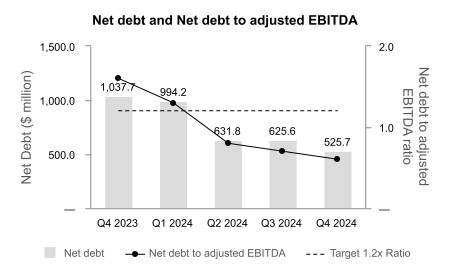
- Further reduced net debt1 to $525.7 million in the fourth quarter of 2024, representing the fourth consecutive quarter of lower net debt as a result of deleveraging efforts and capitalizing on strong operating cash flow generation.
- Record annual adjusted EBITDA1 of $822.5 million in 2024 was a substantial increase from $647.8 million in 2023.
- The increase in cash and reduction in long-term debt significantly reduced our net debt to adjusted EBITDA ratio1 to 0.6x at the end of 2024 compared to 1.6x at the end of 2023, well within the targeted 1.2x net debt to adjusted EBITDA ratio outlined in our three prerequisites plan (the "3-P plan") for advancing Copper World, and transforming Hudbay from one of the highest leverage positions to the lowest leverage position among industry peers .
- In November 2024, further improved long-term balance sheet resilience with a proactive three-year extension of the Company's senior secured revolving credit facilities from October 2025 to November 2028. The extended credit facilities provide increased financial flexibility to accretively maintain the 4.50% coupon 2026 senior unsecured notes outstanding to maturity and advance Copper World towards a sanctioning decision in accordance with the 3-P plan. The $450 million revolving credit facilities include an improved pricing grid reflecting the enhanced financial position of Hudbay and feature an opportunity to increase the facility by an additional $150 million at Hudbay's discretion during the four-year tenor, providing additional financial flexibility.
- Total liquidity substantially increased by 76% to $1,007.8 million at the end of 2024 from $573.7 million at the end of 2023.
Advancing Growth Initiatives to Further Enhance Copper and Gold Exposure
- Received all major permits required for the development and operation of Copper World with the receipt of the Air Quality Permit in January 2025 and the Aquifer Protection Permit in August 2024. Copper World is now the highest grade and lowest capital intensity fully permitted copper project in the Americas.
- Continuing to progress the 3-P plan for Copper World in 2025 with definitive feasibility study activities and minority joint venture partner process underway.
- The successful completion of the planned stripping program at Pampacancha in September unlocked significantly higher copper and gold grades in the fourth quarter of 2024, which together with maintaining strong operating performance at Constancia has generated meaningful free cash flow in Peru.
- The New Britannia mill continued to exceed throughput expectations, driving continued strong gold production and free cash flow generation in Manitoba. The New Britannia mill achieved throughput levels of approximately 2,020 tonnes per day in the fourth quarter, exceeding its original design capacity of 1,500 tonnes per day and its 2024 budgeted capacity of 1,800 tonnes per day due to the successful implementation of process improvement initiatives and effective preventative maintenance measures. After three years of operations, a post-project review of the New Britannia refurbishment investment has increased the unlevered IRR to 36% from 19% at project sanction in 2020.
- We have successfully implemented post-acquisition plans to stabilize the Copper Mountain operations through mining fleet ramp-up activities and increased mill reliability and performance. Efforts are now focused on optimizing the operations in 2025 through execution of the planned accelerated stripping program and mill throughput improvement projects.
- Drill permitting for highly prospective Maria Reyna and Caballito properties near Constancia continues to advance through the multi-step regulatory process with the conclusion of the process expected in 2025.
- The development of an access drift to the 1901 deposit in Snow Lake is progressing well and first ore mining is expected in the second quarter of 2025 to enable confirmation of the optimal mining method for the deposit. Underground step-out drilling to-date has intersected copper-gold mineralization and additional drilling is planned for 2025. The development of an adjacent haulage drift has been initiated to de-risk planned full production in 2027.
- Large 2024 exploration program in Snow Lake continued testing targets near Lalor and regional satellite properties throughout the winter months with encouraging results. 2025 exploration plans include a large geophysics program and follow-up drilling at Lalor Northwest located 400 metres from Lalor's underground infrastructure, along with the testing of a deep geophysical target at the Cook Lake North property.
- Continuing to advance Flin Flon tailings reprocessing opportunities through metallurgical test work and early economic evaluation to assess the possibility of producing critical minerals and precious metals while reducing the environmental footprint.
2025 Guidance Reflects Stable Copper and Gold Production at Industry-leading Margins
- Consolidated copper production of 133,000 tonnes, based on the midpoint of the 2025 guidance range, is expected to remain stable with 2024 levels, reflecting higher expected production in British Columbia as mill throughput optimization plans are implemented, offset by a lower portion of ore feed from the high-grade Pampacancha satellite deposit in Peru.
- Consolidated gold production of 277,750 ounces, based on the midpoint of the 2025 guidance range, is expected to be lower than 2024 production, reflecting a lower portion of ore feed from Pampacancha in 2025 and the accelerated mining of high-grade gold benches in late 2024, partially offset by continued strong gold production in Manitoba.
- Consolidated cash cost, net of by-product credits, in 2025 is expected to be within $0.80 to $1.00 per pound as we continue to focus on maintaining strong cost control across the business, driving industry-leading margins.
- Total sustaining capital expenditures are expected to be $365 million in 2025, reflecting some deferrals from 2024 and higher sustaining spending at the operations.
- Total growth capital expenditures are expected to be $205 million in 2025 as we reinvest in several high-return growth projects in 2025 to deliver increased copper exposure. This includes $55 million for mill throughput improvement projects in British Columbia, $25 million for mill throughput improvement projects in Peru, and $65 million for Copper World de-risking activities and feasibility studies.
- Exploration expenditures are expected to total $40 million in 2025 as we continue to execute our large multi-year exploration program in the Snow Lake region, which continues to be partially funded by critical minerals premium flow-through financing that was completed in the fourth quarter.
Summary of Fourth Quarter Results
Cash generated from operating activities of $238.1 million increased by $92.1 million in the fourth quarter of 2024 compared to the third quarter of 2024, and was higher by $9.1 million compared to the fourth quarter of 2023. Operating cash flow before change in non-cash working capital was $231.5 million during the fourth quarter of 2024, reflecting an increase of $45.4 million from the third quarter of 2024 and a decrease of $15.0 million compared to the fourth quarter of 2023. The increase compared to the third quarter of 2024 reflects higher copper and gold sales volumes driven by higher grades in Peru and continued strong gold production in Manitoba. The decrease compared to the fourth quarter of 2023 was primarily the result of lower copper sales volumes in Peru due to higher unsold copper concentrate inventory levels at year end 2024 as a result of a strong ramp-up of production of higher grade ore during the quarter. In addition, operating cash flow was impacted by lower copper production from Copper Mountain due to planned and unplanned maintenance activities at the mill. This was partially offset by strong operational cost performance across the business and higher realized metal prices.
Consolidated copper production of 43,262 tonnes in the fourth quarter of 2024 was in line with quarterly production cadence and represented a significant increase of 38% from the third quarter of 2024. Consolidated gold production of 94,161 ounces significantly exceeded expectations and represented an increase of 6% from the third quarter of 2024. Consolidated copper and gold production in the fourth quarter of 2024 decreased by 5% and 17%, respectively, compared to the same period in 2023 primarily due to lower gold production and lower planned ore grades in Peru and Manitoba as well as lower copper production at Copper Mountain due to mill maintenance. Consolidated silver and zinc production in the fourth quarter of 2024 increased by 10% and 46%, respectively compared to the same period in 2023 primarily due to higher grades and higher throughput in Peru, as we completed planned stripping activities.
Net earnings attributable to owners in the fourth quarter of 2024 was $21.2 million, or $0.05 per share, compared to $30.7 million, or $0.10 per share, in the fourth quarter of 2023. The fourth quarter of 2024 was impacted by various non-cash charges for foreign exchange losses, write-offs of previously capitalized PP&E and revaluation of share-based compensation due to a higher share price.
Adjusted net earnings attributable to owners1 and adjusted net earnings per share attributable to owners1 in the fourth quarter of 2024 were $70.3 million and $0.18 per share, respectively, after adjusting for items on a pre-tax basis such as a non-cash $17.4 million foreign exchange loss, a $14.1 million write-down of PP&E, a $10.3 million mark-to-market revaluation gain on various instruments such as unrealized strategic copper hedges, investments and stock based compensation, and a non-cash loss of $2.5 million related to a quarterly revaluation of our closed site environmental reclamation provision, among other items. This compares to adjusted net earnings attributable to owners1 and net earnings per share attributable to owners1 of $68.9 million and $0.20 per share in the same period of 2023.
Fourth quarter adjusted EBITDA1 was $257.3 million, a 25% increase compared to $206.2 million in the third quarter of 2024 as higher copper and gold grades led to increased sales volumes. Fourth quarter adjusted EBITDA declined by 6% compared to $274.4 million in the fourth quarter of 2023 as a result of the aforementioned lower copper and gold sales volumes. In addition, in Peru copper concentrate inventory levels totaled approximately 30,000 wet metric tonnes at the end of the quarter, higher than normal levels of 15,000 wet metric tonnes were unsold at the end of the quarter because of the strong production ramp-up late in the year. The excess copper concentrate in Peru is expected to be sold in the first quarter of 2025.
In the fourth quarter of 2024, consolidated cash cost per pound of copper produced, net of by-product credits1, was $0.45 compared to $0.18 in the third quarter of 2024, as higher production more than offset higher mining, milling and G&A costs in the fourth quarter, but by-product credits were lower on a per pound basis. Fourth quarter consolidated cash cost per pound of copper, net of by-product credits1 increased compared to $0.16 in the same period in 2023. This increase was mainly the result of higher mining, milling and G&A costs as well as lower copper production.
Consolidated sustaining cash cost per pound of copper produced, net of by-product credits1, was $1.37 in the fourth quarter of 2024 compared to $1.71 in the third quarter of 2024, with the decrease is driven by strong cost control and lower sustaining capital expenditures in the fourth quarter. Fourth quarter consolidated sustaining cash cost per pound of copper produced, net of by-product credit1, was higher compared to $1.09 in the same period in 2023. This increase was primarily due to the same reasons outlined above, partially offset by lower sustaining capital expenditures.
Consolidated all-in sustaining cash cost per pound of copper produced, net of by-product credits1, was $1.53 in the fourth quarter of 2024, lower than $1.95 in the third quarter of 2024 mainly due to the same reason outlined above as well as lower corporate G&A and regional costs in the fourth quarter. Fourth quarter consolidated all-in sustaining cash cost per pound of copper produced, net of by-product credits1, was higher than $1.31 in the same period in 2023 due to the same reasons outlined above.
As at December 31, 2024, total liquidity was $1,007.8 million, including $541.8 million in cash and cash equivalents, $40.0 million in short-term investments as well as undrawn availability of $426.0 million under our revolving credit facilities. Net debt1 declined to $525.7 million at the end of 2024 compared to $1,037.7 million at the end of 2023. We expect that our current liquidity together with cash flows from operations will be sufficient to meet our liquidity needs for the next year.
Summary of Full Year Results
We achieved our 2024 consolidated production guidance for all metals and significantly exceeded our 2024 production guidance for gold. On a business unit stand-alone basis, Peru exceeded the top end of the gold production guidance and achieved the guidance ranges for all other metals. Manitoba exceeded the top end of the gold and copper guidance ranges and achieved the guidance ranges for all other metals. In British Columbia production of gold was within the guidance range, whereas copper production was below the low end of guidance range as a result of lower grades in stockpiled ore and reduced throughput during the mill stabilization period.
Consolidated copper, gold and silver production for the full year 2024 increased by 5%, 7% and 11%, respectively, compared to the same period in 2023 primarily due to the incremental production from Copper Mountain and higher throughput and operating performance in Manitoba.
Cash generated from operating activities increased to $666.2 million in 2024 from $476.9 million in 2023. Operating cash flow before change in non-cash working capital increased to a record $691.1 million in 2024 from $570.0 million in 2023. The increase in operating cash flow before changes in working capital was primarily the result of higher metal prices and gold sales volumes, as well as the incremental contribution margin from the Copper Mountain mine. This was partially offset by a significant increase in cash taxes paid of $132.5 million, compared to $54.8 million in 2023 mainly at our Peru operations.
Net earnings attributable to owners for 2024 was $76.7 million, or $0.20 per share, compared to $66.4 million, or $0.22 per share, in 2023. Full year 2024 net earnings were positively impacted by increases in sales volumes and higher realized prices for all metals, partially offset by various non-cash charges related to foreign exchange losses, write-offs of previously capitalized PP&E, mark-to-market revaluation losses on various instruments such as unrealized strategic copper hedges, investments and share-based compensation and higher mining and income tax expenses.
Adjusted net earnings attributable to owners1 and adjusted net earnings per share attributable to owners1 for 2024 were $181.4 million and $0.48 per share, respectively, after adjusting for items on a pre-tax basis such as a $27.4 million write-down of PP&E, a $27.1 million mark-to-market revaluation loss on various instruments such as the gold prepayment liability, unrealized strategic copper and gold hedges, investments and stock based compensation, a non-cash $21.0 million foreign exchange loss and a non-cash gain of $3.5 million related to the revaluation of our closed site environmental reclamation provision, among other items. This compares to adjusted net earnings attributable to owners1 and net earnings per share attributable to owners1 of $69.0 million and $0.23 per share in the same period of 2023.
Adjusted EBITDA1 was $822.5 million in 2024, a 27% increase compared to $647.8 million in 2023. The increase is the result of higher realized metal prices and higher sales volumes during the year.
Consolidated cash cost per pound of copper produced, net of by-product credits1, was $0.46, compared to $0.80 in 2023 which outperformed our twice-improved 2024 annual cost guidance. The improvement was mainly the result of higher copper production and higher gold by-product credits, partially offset by higher mining, milling and G&A costs. Consolidated sustaining cash cost per pound of copper produced, net of by-product credits1, of $1.62 in 2024 decreased from $1.72 in 2023 due to the same reasons outlined above partially offset by higher cash sustaining capital expenditures.
Consolidated all-in sustaining cash cost per pound of copper produced, net of by-product credits1, was $1.88 in 2024, slightly lower than $1.92 in 2023 as a result of the same reasons outlined above partially offset by higher corporate selling and administrative costs primarily due to a revaluation of share-based compensation associated with a higher share price.

*Copper equivalent production is calculated using the quarter average LME prices for each metal.
|
1 Adjusted net earnings (loss) - attributable to owners and adjusted net earnings (loss) per share - attributable to owners, adjusted EBITDA, cash cost, sustaining cash cost, all-in sustaining cash cost per pound of copper produced, net of by-product credits, cash cost, sustaining cash cost per ounce of gold produced, net of by-product credits, combined unit cost, net debt and net debt to adjusted EBITDA ratio are non-GAAP financial performance measures with no standardized definition under IFRS. For further information and a detailed reconciliation, please see the discussion under the "Non-GAAP Financial Performance Measures" section of this MD&A.
KEY FINANCIAL RESULTS
| Financial Condition | ||||||
| (in $ millions, except net debt to adjusted EBITDA ratio) | Dec. 31, 2024 | Dec. 31, 2023 | ||||
| Cash and cash equivalents and short-term investments | $ | 581.8 | $ | 249.8 | ||
| Total long-term debt | 1,107.5 | 1,287.5 | ||||
| Net debt1 | 525.7 | 1,037.7 | ||||
| Working capital2 | 511.3 | 135.8 | ||||
| Total assets | 5,487.6 | 5,312.6 | ||||
| Equity attributable to owners of the Company | 2,553.2 | 2,096.8 | ||||
| Net debt to adjusted EBITDA 1 | 0.6 | 1.6 |
1 Net debt and net debt to adjusted EBITDA are non-GAAP financial performance measures with no standardized definition under IFRS. For further information and a detailed reconciliation, please see discussion under the "Non-GAAP Financial Performance Measures" section of this MD&A.
2 Working capital is determined as total current assets less total current liabilities as defined under IFRS and disclosed on the consolidated financial statements.
| Financial Performance | Three months ended | Year ended | ||||||||||
| (in $ millions, except per share amounts or as noted below) | Dec. 31, 2024 | Dec. 31, 2023 | Dec. 31, 2024 | Dec. 31, 2023 | ||||||||
| Revenue | $ | 584.9 | $ | 602.2 | $ | 2,021.2 | $ | 1,690.0 | ||||
| Cost of sales | 400.5 | 405.4 | 1,467.4 | 1,297.5 | ||||||||
| Earnings before tax | 103.7 | 81.0 | 251.6 | 151.8 | ||||||||
| Net earnings | 19.3 | 33.5 | 67.8 | 69.5 | ||||||||
| Net earnings attributable to owners | 21.2 | 30.7 | 76.7 | 66.4 | ||||||||
| Basic and diluted earnings per share - attributable | 0.05 | 0.10 | 0.20 | 0.22 | ||||||||
| Adjusted earnings per share - attributable1 | 0.18 | 0.20 | 0.48 | 0.23 | ||||||||
| Operating cash flow before change in non-cash working capital | 231.5 | 246.5 | 691.1 | 570.0 | ||||||||
| Adjusted EBITDA1 | 257.3 | 274.4 | 822.5 | 647.8 | ||||||||
1 Adjusted earnings per share - attributable to owners and adjusted EBITDA are non-GAAP financial performance measures with no standardized definition under IFRS. For further information and a detailed reconciliation, please see discussion under the "Non-GAAP Financial Performance Measures" section of this MD&A.
KEY PRODUCTION RESULTS
| Three months ended | Three months ended | ||||||||||||||||||||||||
| Dec. 31, 2024 | Dec. 31, 2023 | ||||||||||||||||||||||||
| Peru | Manitoba | British Columbia3 | Total | Peru | Manitoba | British Columbia3 | Total | ||||||||||||||||||
| Contained metal in concentrate and doré produced1 | |||||||||||||||||||||||||
| Copper | tonnes | 33,988 | 3,347 | 5,927 | 43,262 | 33,207 | 3,735 | 8,508 | 45,450 | ||||||||||||||||
| Gold | oz | 38,079 | 51,438 | 4,644 | 94,161 | 49,418 | 59,863 | 3,495 | 112,776 | ||||||||||||||||
| Silver | oz | 969,502 | 283,223 | 58,933 | 1,311,658 | 836,208 | 255,579 | 105,295 | 1,197,082 | ||||||||||||||||
| Zinc | tonnes | - | 8,385 | - | 8,385 | - | 5,747 | - | 5,747 | ||||||||||||||||
| Molybdenum | tonnes | 195 | - | - | 195 | 397 | - | - | 397 | ||||||||||||||||
| Payable metal sold | |||||||||||||||||||||||||
| Copper | tonnes | 28,775 | 3,321 | 5,831 | 37,927 | 31,200 | 3,687 | 9,119 | 44,006 | ||||||||||||||||
| Gold2 | oz | 37,459 | 50,239 | 5,036 | 92,734 | 38,114 | 63,635 | 3,091 | 104,840 | ||||||||||||||||
| Silver2 | oz | 824,613 | 282,158 | 43,747 | 1,150,518 | 703,679 | 246,757 | 98,441 | 1,048,877 | ||||||||||||||||
| Zinc | tonnes | - | 5,261 | - | 5,261 | - | 7,385 | - | 7,385 | ||||||||||||||||
| Molybdenum | tonnes | 182 | - | - | 182 | 468 | - | - | 468 | ||||||||||||||||
| Year ended | Year ended | ||||||||||||||||||||||||
| Dec. 31, 2024 | Dec. 31, 2023 | ||||||||||||||||||||||||
| Peru | Manitoba | British Columbia3 | Total | Peru | Manitoba | British Columbia 3 | Total | ||||||||||||||||||
| Contained metal in concentrate and doré produced1 | |||||||||||||||||||||||||
| Copper | tonnes | 99,001 | 12,536 | 26,406 | 137,943 | 100,487 | 12,154 | 19,050 | 131,691 | ||||||||||||||||
| Gold | oz | 98,226 | 214,225 | 19,789 | 332,240 | 114,218 | 187,363 | 8,848 | 310,429 | ||||||||||||||||
| Silver | oz | 2,708,262 | 995,090 | 280,499 | 3,983,851 | 2,505,229 | 851,723 | 218,282 | 3,575,234 | ||||||||||||||||
| Zinc | tonnes | - | 33,339 | - | 33,339 | - | 34,642 | - | 34,642 | ||||||||||||||||
| Molybdenum | tonnes | 1,323 | - | - | 1,323 | 1,566 | - | - | 1,566 | ||||||||||||||||
| Payable metal sold | |||||||||||||||||||||||||
| Copper | tonnes | 88,138 | 11,602 | 25,354 | 125,094 | 96,213 | 10,708 | 18,075 | 124,996 | ||||||||||||||||
| Gold2 | oz | 103,364 | 212,243 | 19,735 | 335,342 | 97,176 | 171,297 | 8,420 | 276,893 | ||||||||||||||||
| Silver2 | oz | 2,343,820 | 956,460 | 249,536 | 3,549,816 | 2,227,419 | 728,304 | 189,443 | 3,145,166 | ||||||||||||||||
| Zinc | tonnes | - | 25,120 | - | 25,120 | - | 28,779 | - | 28,779 | ||||||||||||||||
| Molybdenum | tonnes | 1,287 | - | - | 1,287 | 1,462 | - | - | 1,462 | ||||||||||||||||
1 Metal reported in concentrate is prior to deductions associated with smelter contract terms.
2 Includes total payable gold and silver in concentrate and in doré sold.
3 Includes 100% of Copper Mountain mine production. Hudbay owns 75% of Copper Mountain mine. As Copper Mountain was acquired on June 20, 2023, the production for the year ended December 31, 2023 represents the period from acquisition date, June 20, 2023, through to year end December 31, 2023.
KEY COST RESULTS
| Three months ended | Year ended | Guidance | ||||||||||||||
| Dec. 31, 2024 | Dec. 31, 2023 | Dec. 31, 2024 | Dec. 31, 2023 | Annual 20242 | ||||||||||||
| Peru cash cost per pound of copper produced | ||||||||||||||||
| Cash cost1 | $/lb | 1.00 | 0.54 | 1.18 | 1.07 | 1.25 - 1.60 | ||||||||||
| Sustaining cash cost1 | $/lb | 1.48 | 1.21 | 1.86 | 1.81 | |||||||||||
| Manitoba cash cost per ounce of gold produced | ||||||||||||||||
| Cash cost1 | $/oz | 607 | 434 | 606 | 727 | 700 - 900 | ||||||||||
| Sustaining cash cost1 | $/oz | 908 | 788 | 868 | 1,077 | |||||||||||
| British Columbia cash cost per pound of copper produced3 | ||||||||||||||||
| Cash cost1 | $/lb | 3.00 | 2.67 | 2.74 | 2.49 | 2.00 - 2.50 | ||||||||||
| Sustaining cash cost1 | $/lb | 5.76 | 3.93 | 5.29 | 3.41 | |||||||||||
| Consolidated cash cost per pound of copper produced | ||||||||||||||||
| Cash cost1 | $/lb | 0.45 | 0.16 | 0.46 | 0.80 | 0.65 - 0.85 | ||||||||||
| Sustaining cash cost1 | $/lb | 1.37 | 1.09 | 1.62 | 1.72 | 1.75 - 2.20 | ||||||||||
| All-in sustaining cash cost1 | $/lb | 1.53 | 1.31 | 1.88 | 1.92 | |||||||||||
1 Cash cost, sustaining cash cost, all-in sustaining cash cost per pound of copper produced, net of by-product credits, gold cash cost, sustaining cash cost per ounce of gold produced, net of by-product credits, and unit operating cost are non-GAAP financial performance measures with no standardized definition under IFRS. For further information and a detailed reconciliation, please see the discussion under the "Non-GAAP Financial Performance Measures" section of this MD&A.
2 We previously improved our 2024 annual consolidated cash cost guidance range to $0.65 to $0.85 per pound from the original guidance range of $1.05 to $1.25 per pound. We also previously improved our 2024 annual consolidated sustaining cash cost guidance range to $1.75 to $2.20 per pound from the original guidance range of $2.00 to $2.45 per pound.
3As Copper Mountain was acquired on June 20, 2023, the results for the year ended December 31, 2023 represents the period from the acquisition date, June 20, 2023, through to the year ended 2023.
RECENT DEVELOPMENTS
Significant Debt Reduction and Transformed Balance Sheet
We took several prudent measures in 2024 to significantly improve the strength of our balance sheet and improve financial flexibility, including a total of $245 million of combined debt repayments and gold prepayment liability reductions:
• In May 2024, we completed a successful equity offering issuing common shares for gross proceeds of $402.5 million, resulting in net proceeds of $386.2 million after transaction costs.
• Repurchased and retired a total of $82.6 million of senior unsecured notes during the year.
• Repaid $100 million of prior drawdowns under our revolving credit facilities during the year.
• Fully repaid the gold prepay facility, with $62.3 million in gold deliveries in 2024 and the final payment completed in August.
• In November, we proactively extended our senior secured revolving credit facilities by three years from October 2025 to November 2028 and negotiated the flexibility to leave our 4.50% 2026 senior unsecured notes outstanding to maturity as Copper World advances towards a sanctioning decision in accordance with the 3-P plan. The newly extended $450 million revolving credit facilities include an improved pricing grid reflecting the enhanced financial position of Hudbay and feature an opportunity to increase the facility by an additional $150 million at our discretion during the four-year tenor, providing additional financial flexibility.
We have delivered six consecutive quarters of meaningful free cash flow generation as a result of recent brownfield investments, continuous operational improvement efforts and steady cost control across the business. As a result of the continued cash flow generation and our deleveraging efforts, we have substantially reduced our net debt[1] to $525.7 million as of December 31, 2024, as compared to $1,037.7 million at the end of 2023. The net debt reduction, together with higher levels of adjusted EBITDA1 over the last twelve months, has significantly improved our net debt to adjusted EBITDA ratio1 to 0.6x compared to 1.6x at the end of 2023.
Copper World Permitting Completed
On January 2, 2025, Hudbay received the Air Quality Permit for the Copper World project from the Arizona Department of Environmental Quality ("ADEQ"). The issuance of this permit is a significant milestone in the advancement of the project as it is the final major permit required for the development and operation of Copper World. Copper World is expected to produce 85,000 tonnes of copper per year over an initial 20-year mine life.
Hudbay has now received all three key state permits required for Copper World development and operation:
• Mined Land Reclamation Plan - Completed - the Mined Land Reclamation Plan was initially approved by the Arizona State Mine Inspector in October 2021 and was subsequently amended and approved to reflect a larger private land project footprint. This approval was challenged in state court, but the challenge was dismissed in May 2023.
• Aquifer Protection Permit - Completed - the Aquifer Protection Permit was received on August 29, 2024 from the ADEQ following a robust process that included detailed analysis by the agency and Hudbay, along with a public comment period that was completed in the second quarter of 2024.
• Air Quality Permit - Completed - the Air Quality Permit was received on January 2, 2025 from the ADEQ following a similarly robust process, including a public comment period that concluded in the third quarter of 2024. An administrative appeal was filed by certain opponents in late January, as expected and the Company is confident the permit will be upheld, similar to the project's other state-level permits .
Hudbay received the Aquifer Protection Permit and Air Quality Permit on schedule after a thorough public consultation process, and the Company is pleased with the level of local support it has received. Hudbay looks forward to providing significant benefits for the community and local economy in Arizona. Once in production, Copper World is expected to be a meaningful copper producer in the U.S. domestic copper supply chain, which will be required to help secure growing U.S. metal demand related to increased manufacturing capacity, infrastructure development, increased energy independence, domestic battery supply chain and strengthening the nation's security.
Now that the major permits for Copper World have been received, Hudbay commenced a minority joint venture partner process early in 2025. It is anticipated that any minority joint venture partner would participate in the funding of definitive feasibility study activities in 2025 as well as in the final project design and construction for Copper World.
The sanctioning of Copper World is not expected until 2026 based on current estimated timelines.
____________________________________________
1 Adjusted EBITDA and net debt to adjusted EBITDA ratio are non-GAAP financial performance measures with no standardized definition under IFRS. For further information and a detailed reconciliation, please see discussion under the "Non-GAAP Financial Performance Measures" section of this MD&A
Bolstering Technical Capabilities
As we advance the many brownfield and greenfield growth opportunities within our portfolio, we have enhanced the senior management team with additional technical expertise and expanded the U.S. team to build bench strength and establish key leadership positions.
Hudbay's Senior Vice President of the U.S. Business Unit, Javier Del Rio, has been focusing his time solely on leading the Copper World project, leveraging his project development and operational expertise as the former head of Hudbay's South America Business Unit where he oversaw the development and operation of the Company's flagship Constancia mine in Peru. In addition, Warren Flannery, Hudbay's Vice President of Business Planning and Reclamation, relocated to Arizona in September 2024 to take on the role of Vice President of Copper World. In his new role, Mr. Flannery is leading the operational readiness of Copper World as the company advances through definitive feasibility study activities in 2025.
Adding to the U.S. expertise, in August 2024, Hudbay hired Robert Comer as Executive Director, External Affairs & Legal in Arizona. As an experienced attorney, Mr. Comer brings more than 30 years of U.S. permitting and mining law expertise. During his career, Mr. Comer has held senior leadership positions with businesses and the federal government and has successfully advanced numerous resource projects, including through environmental and land use compliance, defending permits through litigation, NEPA permitting and government relations. He is a significant asset to Copper World as Hudbay continues to advance towards a sanctioning decision in 2026.
After receiving all key permits and with feasibility study activities underway, in February 2025, we added to our U.S. team's project development expertise with the appointment of Kim Hackney as Project Director of Copper World. Mr. Hackney is a project professional with over 40 years of extensive experience in the mining industry having held several roles in project and construction management, including managing owners teams, EPCM projects and self-perform projects. He is recognized in the industry for bringing projects online within budget and on schedule, and his in-depth expertise includes global base and precious metals projects located in North, Central and South America, Canada, Africa, Australia, Indonesia, and Uzbekistan.
Hudbay also appointed John O'Shaughnessy as Vice President, Business Development in February 2025 to provide expert oversight and strategic leadership of the global mine planning process. Mr. O'Shaughnessy has 25 years of mining expertise, including numerous progressive engineering, operational and leadership roles at Vale's mining operations in Ontario and Newfoundland and Labrador. He was most recently the North Atlantic Lead for Vale's Base Metals division where he led and deployed strategic initiatives for the North Atlantic region. His broad technical expertise further augments Hudbay's technical bench strength.
New Britannia Demonstrates Successful Capital Allocation to Maximize Risk-adjusted Returns
Hudbay has a proven track record of prudently allocating capital to generate the highest risk-adjusted returns as we execute our growth strategy and advance our world-class asset portfolio. As an example of this success, we have completed a post-project review of the brownfield investment in the New Britannia mill refurbishment project in 2020 and 2021.
Hudbay acquired the New Britannia mill in 2015 for $12 million as a potential gold processing solution for the high-grade Lalor gold and copper-gold ores by providing additional processing capacity at the Snow Lake operations and allowing us to achieve higher gold recoveries of approximately 90%, compared to 55% at the existing mill. After completing several economic studies, the refurbishment project construction commenced in early 2020 with an initial capital cost of $115 million and an estimated unlevered IRR of 19%. The initial capital investment was funded by a $115 million low-cost gold prepay facility entered into in May 2020. Project construction was completed on time with mill ramp-up and commissioning achieved in the fourth quarter of 2021. The mill was refurbished with a nameplate design capacity of 1,500 tonnes per day, and has been consistently exceeding performance expectations, achieving throughput levels of 1,650 tonnes per day in 2023 and reaching record throughput levels of over 2,000 tonnes per day in 2024. The project payback was achieved after 2.5 years, and in August 2024, the gold prepay facility was fully repaid, which has increased exposure to the current high gold price environment and further improved cash flows. After three years of operations, the unlevered IRR for the New Britannia gold mill refurbishment project has now increased to 36% after adjusting for the higher production rates, stronger gold prices and current capital and operating costs.
Hudbay Celebrates Major Milestone with Millionth Ounce of Gold Recovered from Lalor Mine
At the end of 2024, we surpassed a total of one million ounces of gold produced at our Lalor mine in Snow Lake, Manitoba. This milestone reinforces the significant value Hudbay has unlocked by combining its exploration expertise, processing infrastructure and operating efficiency to maximize gold production at our Snow Lake operations. In 2024, the Snow Lake operations achieved record annual gold production exceeding the top end of the gold production guidance range with 214,225 ounces produced.
With approximately two million ounces of contained gold in current mineral reserve estimates and another 1.4 million ounces of contained gold in inferred mineral resources, Hudbay expects to continue to unlock significant value in Snow Lake and looks forward to further growing the mineral resource base through regional exploration as we continue to execute one of the largest exploration programs in Snow Lake operating history.
Exploration Update
Large Exploration Drill Program Continues in Snow Lake
In 2024, Hudbay completed the largest exploration program in the Company's history with the goal of extending known mineralization near the Lalor deposit to further extend mine life as well as to find a new anchor deposit within trucking distance of the Snow Lake processing infrastructure. The 2024 program included the largest geophysical program in Hudbay's history in Snow Lake, with surface electromagnetic surveys detecting targets at more than 1,000 metres below surface and covering a 25 square-kilometre area including the Cook Lake claims that had been previously untested by modern deep geophysics.
At Lalor Northwest, follow-up drilling in the second half of 2024 confirmed the potential for a new gold-copper discovery located approximately 400 metres from the existing Lalor underground infrastructure. Several new intersections have helped establish the geometry of this new discovery, and we plan to continue to drill Lalor Northwest in 2025.
At the regional Rail property, which was acquired through the Rockcliff acquisition in 2023, the 2024 drill program yielded new intersections of high-grade copper-gold mineralization. These results will be combined with historical drilling results on the property to update the geological model and assess its economic potential.
2024 drilling at the 1901 deposit from the exploration drift targeted down plunge extensions of the ore body. Five step-out holes were drilled beyond the known extent of the mineralization and all five holes have intersected visible copper-gold mineralization. Additional planned drilling at 1901 in 2025 is expected to confirm and potentially extend the orebody geometry and to convert inferred mineral resources in the gold lenses to mineral reserves.
We continue to test a very strong deep geophysical anomaly located at Cook Lake North, approximately six kilometres from Lalor with drilling activities continuing throughout the winter season.
Signed Exploration Agreement with First Nations in Manitoba
In February 2025, Hudbay signed its first-ever exploration agreement with the Kiciwapa Cree Nation, reflecting the Company's commitment to meaningful collaboration as we explore for new mineral resources in the Snow Lake and Flin Flon regions.
Advancing Engineering Work for Flin Flon Tailings Reprocessing
Zinc Plant Tailings - Metallurgical test work continues following positive results from the initial confirmatory drill program completed in 2024 in the section of the tailings facility that was utilized by the zinc plant for 25 years. The results confirmed the grades of precious metals and critical minerals previously estimated from historical zinc plant records. An early economic study to evaluate the opportunity to reprocess the zinc plant tailings has confirmed the potential for a technically viable reprocessing alternative, and further engineering work is underway.
Mill Tailings - We continue to advance metallurgical test work on the opportunity to reprocess Flin Flon mill tailings where 100 million tonnes of tailings were deposited over 90 years. An early economic study on the mill tailings is planned.
Maria Reyna and Caballito Drill Permits Expected in 2025
Hudbay controls a large, contiguous block of mineral rights with the potential to host mineral deposits in close proximity to the Constancia processing facility, including the past producing Caballito property and the highly prospective Maria Reyna property. The Company commenced early exploration activities at Maria Reyna and Caballito after completing a surface rights exploration agreement with the community of Uchucarcco in August 2022. As part of the drill permitting process, environmental impact assessment applications were submitted for the Maria Reyna property in November 2023 and for the Caballito property in April 2024. The environmental impact assessment (EIA) for Maria Reyna was approved by the government in June 2024 and the Caballito EIA was approved in September 2024. This represents one of several steps in the drill permitting process, which is expected to be completed in 2025.
Board Chair Transition
Effective January 1, 2025, Stephen A. Lang stepped down as Chair of Hudbay's Board of Directors due to health reasons. David S. Smith, current independent director, has been appointed Chair of the Board. Mr. Lang, who was appointed Chair in October 2019, will remain on the Board as an independent director. Mr. Smith joined the Board as an independent director in May 2019, bringing nearly 40 years of financial and executive leadership experience in the mining sector. Mr. Smith is a corporate director who has had a career on both the finance and the supply sides of the mining business, with extensive international experience in the acquisition, sale, development, financing and operations of base and precious metal operations.
Dividend Declared
A semi-annual dividend of C$0.01 per share was declared on February 18, 2025. The dividend will be paid out on March 21, 2025 to shareholders of record as of close of business on March 4, 2025.
PERU OPERATIONS REVIEW
| Three months ended | Year ended | |||
Dec. 31, 2024 | Dec. 31, 2023 | Dec. 31, 2024 | Dec. 31, 2023 | ||
Constancia ore mined1 | tonnes | 4,186,058 | 973,176 | 15,046,190 | 9,265,954 |
Copper | % | 0.40 | 0.30 | 0.34 | 0.32 |
Gold | g/tonne | 0.04 | 0.04 | 0.04 | 0.04 |
Silver | g/tonne | 3.88 | 2.26 | 3.08 | 2.53 |
Molybdenum | % | 0.02 | 0.01 | 0.01 | 0.01 |
Pampacancha ore mined1 | tonnes | 4,037,264 | 5,556,613 | 9,317,499 | 14,756,416 |
Copper | % | 0.63 | 0.56 | 0.55 | 0.51 |
Gold | g/tonne | 0.38 | 0.32 | 0.32 | 0.33 |
Silver | g/tonne | 6.43 | 4.84 | 5.61 | 4.28 |
Molybdenum | % | 0.00 | 0.01 | 0.01 | 0.01 |
Total ore mined | tonnes | 8,223,322 | 6,529,789 | 24,363,689 | 24,022,370 |
Strip ratio2 |
| 1.22 | 1.26 | 1.78 | 1.51 |
Ore milled | tonnes | 7,999,453 | 7,939,044 | 31,933,624 | 30,720,929 |
Copper | % | 0.48 | 0.48 | 0.36 | 0.39 |
Gold | g/tonne | 0.20 | 0.25 | 0.14 | 0.16 |
Silver | g/tonne | 5.28 | 4.20 | 3.84 | 3.62 |
Molybdenum | % | 0.01 | 0.01 | 0.01 | 0.01 |
Copper concentrate | tonnes | 148,283 | 146,065 | 452,473 | 457,137 |
Concentrate grade | % Cu | 22.92 | 22.73 | 21.88 | 21.98 |
Copper recovery | % | 87.8 | 87.4 | 85.0 | 84.2 |
Gold recovery | % | 73.3 | 77.6 | 70.7 | 71.8 |
Silver recovery | % | 71.4 | 78.0 | 68.8 | 70.0 |
Molybdenum recovery | % | 37.1 | 33.6 | 41.7 | 35.8 |
Combined unit operating costs3,4 | $/tonne | 15.25 | 12.24 | 12.91 | 12.47 |
1 Reported tonnes and grade for ore mined are estimates based on mine plan assumptions and may not reconcile fully to ore milled.
2 Strip ratio is calculated as waste mined divided by ore mined.
3 Reflects combined mine, mill and general and administrative ("G&A") costs per tonne of ore milled. Reflects the deduction of expected capitalized stripping costs.
4 Combined unit costs is a non-GAAP financial performance measure with no standardized definition under IFRS. For further information and a detailed reconciliation, please see the discussion under the "Non-GAAP Financial Performance Measures" section of this MD&A.
|
| Three months ended | Year ended | ||
|
| Dec. 31, 2024 | Dec. 31, 2023 | Dec. 31, 2024 | Dec. 31, 2023 |
Contained metal in concentrate produced |
|
|
|
|
|
Copper | tonnes | 33,988 | 33,207 | 99,001 | 100,487 |
Gold | oz | 38,079 | 49,418 | 98,226 | 114,218 |
Silver | oz | 969,502 | 836,208 | 2,708,262 | 2,505,229 |
Molybdenum | tonnes | 195 | 397 | 1,323 | 1,566 |
Payable metal sold |
|
|
|
|
|
Copper | tonnes | 28,775 | 31,200 | 88,138 | 96,213 |
Gold | oz | 37,459 | 38,114 | 103,364 | 97,176 |
Silver | oz | 824,613 | 703,679 | 2,343,820 | 2,227,419 |
Molybdenum | tonnes | 182 | 468 | 1,287 | 1,462 |
Cost per pound of copper produced |
|
|
|
|
|
Cash cost1 | $/lb | 1.00 | 0.54 | 1.18 | 1.07 |
Sustaining cash cost1 | $/lb | 1.48 | 1.21 | 1.86 | 1.81 |
1 Cash cost and sustaining cash costs per pound of copper produced, net of by-product credits, are not recognized under IFRS. For more detail on these non-GAAP financial performance measures, please see the discussion under the "Non-GAAP Financial Performance Measures" section of this MD&A.
Overview
Peru operations delivered higher grades in fourth quarter, as planned, and continued to benefit from strong and consistent mill throughput in 2024, averaging approximately 87,000 tonnes processed per day in the fourth quarter and full year of 2024. Cost performance in 2024 was better than expected as the operations achieved steady operating unit cost performance while benefiting from higher gold by-product sales revenues. The fourth quarter also benefited from a larger portion of ore mill feed coming from Pampacancha.
Approximately 30,000 wet metric tonnes of copper concentrate in Peru were unsold as of December 31, 2024, which is approximately 15,000 wet metric tonnes above normal levels and resulted from the strong production ramp-up that occurred late in the quarter. The excess copper concentrate is expected to be sold in the first quarter of 2025.
The Company continues to evaluate opportunities to further increase mill throughput after the Peruvian Ministry of Energy and Mines approved a regulatory change in June 2024 to allow mining companies in Peru to increase throughput by up to 10% above permitted levels.
Mining Activities
Total ore mined in the fourth quarter of 2024 increased by 26% compared to the same period in 2023, in line with our mine plan as we completed the planned stripping program at Pampacancha in late September. The planned stripping phase at Pampacancha allowed us to mine higher copper and gold grade ore in the fourth quarter, as expected. Ore mined from Pampacancha during the fourth quarter decreased to 4.0 million tonnes compared with 5.6 million tonnes in the fourth quarter of 2023 when we were in an unusually high period of ore mined from Pampacancha as per the 2023 mine plan cadence. However, total ore mined in the fourth quarter of 2024 was higher than the same period in 2023 with the inclusion of ore mined in the Constancia pit.
Full year ore mined in 2024 was slightly higher than 2023 despite periods of intensive stripping in 2024, primarily as a result of the effective use of mobile equipment and higher fleet availability.
Milling Activities
Ore milled during the fourth quarter of 2024 was 1% higher than the comparative 2023 period mainly due to the treatment of softer ore from Constancia. Milled copper grades were consistent with the same period last year. Milled gold grades decreased by 20% in the fourth quarter of 2024 compared to the same period in 2023 but were better than expected as we mined additional gold benches in the Pampacancha pit during the fourth quarter of 2024. The Constancia mill achieved record copper recoveries of 88% in the fourth quarter of 2024, higher than the previous record of 87% achieved in the comparative period. Recoveries of gold and silver during the fourth quarter of 2024 were 73% and 71%, respectively, representing a decrease of 6% and 8% respectively, compared to the same period in 2023, but remained in line with our metallurgical models for the ore types that were being processed.
Ore milled during the year ended 2024 was 4% higher than the comparative 2023 period due to the same factors as the quarterly variance. For the full year, milled copper and gold grades decreased by 8% and 13%, respectively, compared to the same period in 2023, as a result of less ore being fed from Pampacancha, as per plan. Recoveries of copper during the year ended 2024 were 85%, representing an increase of 1%, compared with the 2023 period, despite being impacted by supplemental ore feed from stockpiles during pit stripping activities early in the year. Gold and silver recoveries during the year ended 2024 were 71% and 69%, representing a decrease of 2% and 2%, respectively. This is in line with our metallurgical models.
Production and Sales Performance
Production of copper and silver in the fourth quarter of 2024 was 33,988 tonnes and 969,502 ounces, respectively, representing an increase of 2% and 16%, respectively, compared to the same period in 2023 primarily due to higher throughput. Production of gold and molybdenum in the fourth quarter of 2024 was 38,079 ounces and 195 tonnes, respectively, representing a decrease of 23% and 51%, respectively, compared to the same period in 2023 as a larger portion of lower grade Constancia ore was processed in the current quarter compared to the same period last year.
Full year production of copper, gold and molybdenum in 2024 was 99,001 tonnes, 98,226 ounces, and 1,323 tonnes, respectively, representing a decrease of 1%, 14% and 16%, respectively, from the comparative 2023 period primarily due to lower grades since more material was mined from Constancia and reclaimed from the stockpile during 2024 compared with the prior year, partially offset by higher throughput. Production of silver was 2,708,262 ounces, representing an increase of 8% from the comparative 2023 period due to higher silver grades from Pampacancha.
Quantities of sold copper and gold during the fourth quarter of 2024 were lower by 8%, and 2%, respectively, than the corresponding period in 2023 primarily due to unsold copper concentrate inventory levels at quarter end. Approximately 30,000 wet metric tonnes of copper concentrate in Peru were unsold as of December 31, 2024, which is approximately 15,000 wet metric tonnes above normal levels and resulted from the strong production ramp-up that occurred late in the quarter. Copper concentrate inventory levels are expected to normalize in the first quarter of 2025. Quantity of molybdenum sold during the fourth quarter of 2024 was lower by 61% due to lower production during the quarter. Quantity of silver sold during the fourth quarter of 2024 was higher by 17% than the corresponding period in 2023 due to the aforementioned higher grades.
Full year copper metal sold was 8% lower than the comparable period due to higher ending inventory levels. Gold metal sold was 6% higher than the comparable period primarily due to timing of precious metal sales at the beginning of the year.
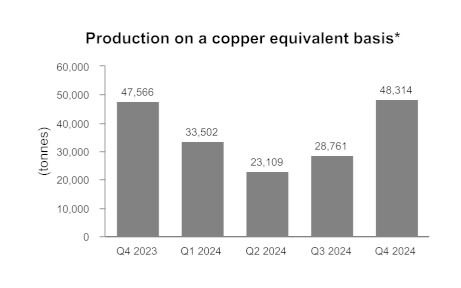
*Copper equivalent production is calculated using the quarter average LME prices for each metal excluding molybdenum.
Cost Performance
Combined mine, mill and G&A unit operating cost in the fourth quarter of 2024 was $15.25 per tonne, 25% higher than the same period in 2023 primarily due to lower capitalized stripping, higher milling costs with a planned semi-annual mill maintenance shutdown in the quarter, and higher G&A costs including profit sharing. This increase was partially offset by higher ore milled. Combined mine, mill and G&A unit operating costs for the full year 2024 were $12.91 per tonne, a 4% increase compared to the same period in 2023 as higher mining and G&A costs were partially offset by higher throughput and slightly lower milling costs.
Cash cost per pound of copper produced, net of by-product credits, in the fourth quarter of 2024 was $1.00, an increase compared to $0.54 in the same period in 2023 due to lower capitalized stripping, higher mining, milling and G&A costs including profit sharing. In addition, lower by-product credits were realized from gold and molybdenum mostly as a result of lower grades compared to the same period last year.
Full year 2024 cash cost per pound of copper produced, net of by-product credits2 was $1.18, an increase compared to $1.07 in 2023 due to lower capitalized stripping, higher mining and G&A costs, including higher profit sharing and slightly lower copper production.
Sustaining cash cost per pound of copper produced, net of by-product credits2, was $1.48 in the fourth quarter, an increase compared with $1.21 in the same period of 2023. The increase was due to the same factors as described for the cash cost variance above, partially offset by lower sustaining capital due to lower capitalized stripping. On a full year basis, sustaining cash cost per pound of copper produced, net of by-products credits2, was $1.86, only marginally higher than the $1.81 for the comparable period in 2023, due to the same reasons described for the cash cost variance over the full year period.

Peru Guidance Outlook
|
| Three months ended | Year ended | Guidance | |||
|
| Dec. 31, | Dec. 31, | Dec. 31, | Dec. 31, | Annual 2024 | Annual 2025 |
Contained metal in concentrate produced |
|
|
|
|
|
|
|
Copper | tonnes | 33,988 | 33,207 | 99,001 | 100,487 | 98,000 - 120,000 | 80,000 - 97,000 |
Gold | oz | 38,079 | 49,418 | 98,226 | 114,218 | 76,000 - 93,000 | 49,000 - 60,000 |
Silver | oz | 969,502 | 836,208 | 2,708,262 | 2,505,229 | 2,500,000 - 3,000,000 | 2,475,000 - 3,025,000 |
Molybdenum | tonnes | 195 | 397 | 1,323 | 1,566 | 1,250 - 1,500 | 1,300 - 1,500 |
Cost per pound of copper produced |
|
|
|
|
|
|
|
Cash cost1 | $/lb | 1.00 | 0.54 | 1.18 | 1.07 | 1.25 - 1.60 | 1.35 - 1.65 |
1 Cash cost per pound of copper produced, net of by-product credits, are not recognized under IFRS. For more detail on these non-GAAP financial performance measures, please see the discussion under the "Non-GAAP Financial Performance Measures" section of this MD&A.
Full year 2024 copper, silver and molybdenum production achieved our annual guidance ranges, and gold production exceeded the upper end of our guidance range by 6%.
Cash cost per pound of copper produced2 of $1.18 was better than expected and outperformed the low end of the cost guidance range by 6%.
MANITOBA OPERATIONS REVIEW
| Three months ended | Year ended | |||
Dec. 31, 2024 | Dec. 31, 2023 | Dec. 31, 2024 | Dec. 31, 2023 | ||
Lalor ore mined | tonnes | 422,454 | 372,384 | 1,626,935 | 1,526,729 |
Gold | g/tonne | 4.61 | 5.92 | 4.68 | 4.74 |
Copper | % | 0.95 | 1.04 | 0.85 | 0.86 |
Zinc | % | 2.95 | 2.20 | 2.84 | 3.00 |
Silver | g/tonne | 31.91 | 28.92 | 27.14 | 24.51 |
New Britannia ore milled | tonnes | 185,592 | 165,038 | 715,198 | 596,912 |
Gold | g/tonne | 5.99 | 8.03 | 6.29 | 6.76 |
Copper | % | 1.17 | 1.46 | 1.04 | 1.03 |
Zinc | % | 1.08 | 0.85 | 0.99 | 0.84 |
Silver | g/tonne | 33.97 | 27.97 | 27.78 | 25.11 |
Copper concentrate | tonnes | 12,345 | 15,179 | 44,198 | 37,176 |
Concentrate grade | % Cu | 16.00 | 14.55 | 15.78 | 15.44 |
Gold recovery1 | % | 90.2 | 89.0 | 89.7 | 88.6 |
Copper recovery | % | 91.3 | 91.6 | 93.6 | 93.3 |
Silver recovery1 | % | 79.6 | 83.2 | 80.9 | 81.5 |
Contained metal in concentrate produced |
|
|
|
| |
Gold | oz | 22,011 | 24,760 | 90,011 | 77,798 |
Copper | tonnes | 1,975 | 2,208 | 6,976 | 5,739 |
Silver | oz | 119,201 | 90,501 | 396,333 | 292,694 |
Metal in doré produced2 |
|
|
|
|
|
Gold | oz | 12,747 | 14,144 | 56,853 | 40,239 |
Silver | oz | 46,431 | 34,895 | 165,408 | 97,630 |
Stall ore milled | tonnes | 222,004 | 228,799 | 893,510 | 965,567 |
Gold | g/tonne | 3.36 | 4.22 | 3.42 | 3.45 |
Copper | % | 0.73 | 0.73 | 0.71 | 0.74 |
Zinc | % | 4.62 | 3.20 | 4.33 | 4.36 |
Silver | g/tonne | 29.90 | 28.63 | 26.54 | 24.19 |
Copper concentrate | tonnes | 7,222 | 7,938 | 29,029 | 31,900 |
Concentrate grade | % Cu | 19.01 | 19.23 | 19.16 | 20.11 |
Zinc concentrate | tonnes | 16,187 | 11,778 | 64,643 | 66,824 |
Concentrate grade | % Zn | 51.80 | 48.79 | 51.58 | 51.84 |
Gold recovery | % | 69.6 | 67.5 | 68.6 | 64.8 |
Copper recovery | % | 84.4 | 92.0 | 87.4 | 90.4 |
Zinc recovery | % | 81.7 | 78.5 | 86.2 | 82.2 |
Silver recovery | % | 55.1 | 61.8 | 56.8 | 61.4 |
Contained metal in concentrate produced |
|
|
|
| |
Gold | oz | 16,680 | 20,959 | 67,361 | 69,326 |
Copper | tonnes | 1,372 | 1,527 | 5,560 | 6,415 |
Zinc | tonnes | 8,385 | 5,747 | 33,339 | 34,642 |
Silver | oz | 117,591 | 130,183 | 433,349 | 461,399 |
1 Gold and silver recovery includes total recovery from concentrate and doré.
2 Doré includes sludge, slag and carbon fines.
| Three months ended | Year ended | |||
Dec. 31, 2024 | Dec. 31, 2023 | Dec. 31, 2024 | Dec. 31, 2023 | ||
Total contained metal in concentrate and doré produced1 | |||||
Gold | oz | 51,438 | 59,863 | 214,225 | 187,363 |
Copper | tonnes | 3,347 | 3,735 | 12,536 | 12,154 |
Zinc | tonnes | 8,385 | 5,747 | 33,339 | 34,642 |
Silver | oz | 283,223 | 255,579 | 995,090 | 851,723 |
Payable metal sold in concentrate and doré |
|
|
|
| |
Gold | oz | 50,239 | 63,635 | 212,243 | 171,297 |
Copper | tonnes | 3,321 | 3,687 | 11,602 | 10,708 |
Zinc | tonnes | 5,261 | 7,385 | 25,120 | 28,779 |
Silver | oz | 282,158 | 246,757 | 956,460 | 728,304 |
Unit Operating Costs2 |
|
|
|
|
|
Lalor | C$/tonne | 141.13 | 147.10 | 142.59 | 142.35 |
New Britannia | C$/tonne | 69.09 | 75.36 | 70.99 | 82.91 |
Stall | C$/tonne | 46.34 | 36.97 | 43.02 | 35.82 |
Combined unit operating costs3,4 | C$/tonne | 233 | 216 | 226 | 217 |
Cost per ounce of gold produced |
|
|
|
|
|
Cash cost4 | $/oz | 607 | 434 | 606 | 727 |
Sustaining cash cost4 | $/oz | 908 | 788 | 868 | 1,077 |
1 Metal reported in concentrate is prior to deductions associated with smelter terms.
2 Reflects costs per tonne of ore mined/milled.
3 Reflects combined mine, mill and G&A costs per tonne of milled ore.
4 Combined unit costs, cash cost and sustaining cash cost per ounce of gold produced, net of by-product credits, are non-GAAP financial performance measures with no standardized definition under IFRS. For further information and a detailed reconciliation, please see the discussion under the "Non-GAAP Financial Performance Measures" section of this MD&A.
Overview
The Snow Lake operations in Manitoba continued to deliver strong operational performance during the fourth quarter of 2024, exceeding expectations in both production and efficiency. A significant milestone was achieved in December 2024 with the recovery of one million ounces from the Lalor mine, reflecting the success of our strategy to maximize gold production from the Snow Lake operations. Record annual gold production of 214,225 ounces in 2024 was achieved through a combination of higher metallurgical recoveries at the New Britannia and Stall mills, despite processing lower gold grades year-over-year, and the strategic allocation of more gold ore feed to the New Britannia mill. This success reflects the positive impact of ongoing continuous improvement initiatives.
The Lalor mine achieved strong production results in the fourth quarter, achieving an average of 4,600 tonnes per day, marking the highest quarterly ore production in 2024. This strong performance was driven by positive muck fragmentation, stope availability and improved mobile equipment availability compared to the same period in 2023. Ongoing modifications to stope design, directing ore to the brow of the stope, continues to further enhanced mucking efficiency throughout the lifecycle of stopes.
The New Britannia mill had another quarter of exceptional performance with the mill operating consistently above nameplate capacity, achieving an average throughput of approximately 2,020 tonnes per day in the fourth quarter of 2024. Plant availability remained strong, supported by ongoing low-capital projects aimed at further increasing throughput while maintaining targeted gold recoveries of 90%. Construction of an enclosure for the copper slurry thickener tank was completed, enhancing year-round reliability and reducing costs associated with winter protection.
At the Stall mill, there was a slight reduction in throughput as more ore was diverted to New Britannia. Benefits from recent recovery improvement programs continue to be realized with gold recoveries exceeding prior year figures. Efforts to continue to optimize recovery were advanced with the installation of new elongated cyclones. These cyclones have demonstrated improved grind size distribution and enhanced gold recoveries, with an immediate payback on capital.
Progress on the 1901 deposit continued via the exploration drift and the recently started haulage drift, which achieved high advance rates in the fourth quarter of 2024, laying the groundwork to support full production from the 1901 deposit by 2027. With the drifts performing well, mining of first ore is scheduled for the second quarter of 2025. Exploration diamond drilling targeting down plunge mineralization intersected copper in the initial five holes, and further drilling is currently underway to follow up on the positive results. Additional drilling is planned in 2025 to evaluate the orebody and optimize the mining approach for future conversion of inferred mineral resources into mineral reserves.
At the Anderson Tailings Impoundment Area, tailings deposition efficiency continues to exceed expectations with new equipment and operational routines.
Environmental initiatives continued to advance in the fourth quarter, and the business achieved a year-over-year reduction in greenhouse gas emissions of approximately 8%, achieving our 2024 environmental targets, primarily driven by significant reductions in diesel and propane consumption across the operations. These reductions were achieved through the introduction and operation of battery electric vehicles underground at Lalor, and converting propane to electric heating in areas of the plant.
The Manitoba business unit continues to prioritize strong relationships with Indigenous communities. Several meetings with Indigenous Nations were held to discuss future exploration and geophysical programs within their Traditional Territories. To date, we have received letters of support for geophysical programs, and positive progress is being made in negotiating exploration agreements. In February 2025, Hudbay signed its first-ever exploration agreement with the Kiciwapa Cree Nation.
Mining Activities
Total ore mined in Manitoba in the fourth quarter of 2024 was 13% higher than the comparable quarter in 2023. Silver and zinc grades mined at Lalor during the fourth quarter were 10% and 34% higher, respectively, compared to the same period in 2023. Gold and copper grades mined at Lalor during the fourth quarter were 22% and 9% lower, respectively, compared to the same period in 2023. The year ended December 31, 2024 saw significant improvements in ore production and precious metal grade quality. These changes align with improvements in mining techniques, most notably in longhole muck fragmentation, and anticipated higher grade precious metal sequences.
Total ore mined at our Manitoba operations during the year ended December 31, 2024 was 7% higher than the same period in 2023. Silver grades mined at Lalor during the year ended December 31, 2024 were 11% higher compared with the same period in 2023, consistent with the mine plan. Gold, copper and zinc grades mined at Lalor during the year ended December 31, 2024 were 1%, 1% and 5%, respectively, lower than the same period in 2023, but gold grades were better than expected in 2024.
Milling Activities
Consistent with our strategy of allocating more Lalor ore feed to New Britannia, the New Britannia mill throughput averaged approximately 2,020 tonnes per day in the fourth quarter of 2024, approximately 12% above average daily throughput levels in the same period in 2023. Recoveries of gold and silver in the fourth quarter of 2024 were 90% and 80%, respectively, representing an increase of 1%, and a decrease of 4%, respectively, compared to the same period in 2023. Copper recovery in the fourth quarter of 2024 was 91%, remaining consistent when compared to the same period in 2023. Full year 2024 total ore milled at New Britannia was 20% higher than 2023, reflecting the consistently strong performance throughout 2024 as a result of continuous improvement efforts. Despite processing lower gold grade ore, gold recoveries also increased by 1% in 2024 compared to 2023.
During the three months and year ended December 31, 2024, the Stall mill processed 3% and 7% less ore, respectively, compared with the same period in 2023, which is aligned with our strategy of allocating more Lalor ore feed to New Britannia, as noted above. The Stall mill achieved gold recoveries of 70% in the fourth quarter, reflecting benefits from recent recovery improvement programs.
Production and Sales Performance
Manitoba operations produced 51,438 ounces of gold, 3,347 tonnes of copper, 8,385 tonnes of zinc and 283,223 ounces of silver during the fourth quarter of 2024. Compared to the fourth quarter of 2023, production of zinc and silver in the fourth quarter of 2024 increased by 46% and 11%, respectively, while production of gold and copper declined by 14% and 10%, respectively, as planned.
Full year production of gold, copper and silver in 2024 was higher by 14%, 3% and 17%, respectively, than the comparative 2023 period mainly due to the same reasons as noted above, as well as higher production from gold and copper-gold zones and better than expected gold grades. Zinc production in 2024 decreased by 4%, aligned with forecasted production and the strategy to mine more gold ore at Lalor.
Quantities of metal sold during the fourth quarter of 2024 were lower for all metals except silver, as compared to the comparable period in 2023, primarily due to the same factors impacting contained metal production, as noted above. During the year ended December 31, 2024, metal sold for gold, copper and silver were higher than the comparable period, while zinc metal sold was lower than the comparable period.
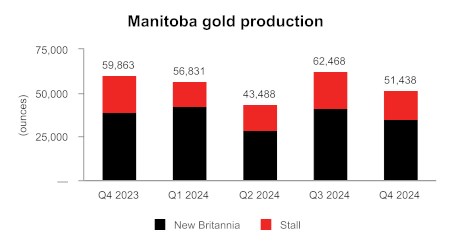
Cost Performance
Lalor mining costs during the fourth quarter of 2024 decreased by 4% compared to the same period in 2023, as a result of efficiency improvements and higher tonnage mined more than offsetting inflationary factors. Compared to the same period in 2023, milling costs at the Stall mill were 25% higher during the fourth quarter of 2024, primarily due to lower throughput as described earlier. New Britannia milling costs decreased by 8% during the fourth quarter of 2024 versus the same period in 2023, primarily as a result of higher throughput as described earlier. Combined mine, mill and G&A unit operating costs in the fourth quarter of 2024 were C$233 per tonne, representing an 8% increase compared to the same period in 2023. Combined mine, mill and G&A unit operating costs during for the year ended December 31, 2024 increased by 4% to C$226 per tonne. The marginal increase in operating costs year-over-year was largely the result of more tonnes being processed at New Britannia compared to Stall which operates at a lower cost per unit.
Cash cost per ounce of gold produced, net of by-product credits, in the fourth quarter of 2024 was $607, an increase compared to the same period in 2023, primarily due to lower gold production and higher profit sharing costs but remained better than expected as a result of continued operating efficiencies and focus on strong cost control.
Sustaining cash cost per ounce of gold produced, net of by-product credits, in the fourth quarter of 2024 was $908, an increase of 15% compared to the same period in 2023, primarily due to the same factors affecting cash cost, partially offset by lower sustaining capital costs during the quarter.
Cash cost per ounce of gold produced, net of by-product credits, during the year ended December 31, 2024 was $606 per ounce. These costs were 17% lower compared to the same period in 2023 primarily due to higher gold production and by-product credits, partially offset by higher mining, milling and G&A costs resulting from higher employee profit sharing costs. Sustaining cash cost per ounce of gold produced, net of by-product credits, for the year ended December 31, 2024 was $868 per ounce, a decrease of 19% from 2023 primarily due to the same factors affecting cash cost noted above, together with lower sustaining capital expenditures compared to the prior year.
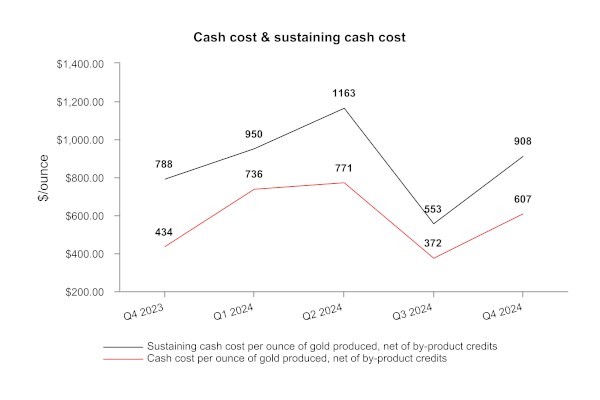
Manitoba Guidance Outlook
| Three months ended | Year ended | Guidance | ||||
Dec. 31, 2024 | Dec. 31, 2023 | Dec. 31, 2024 | Dec. 31, 2023 | Annual 2024 | Annual 2025 | ||
Total contained metal in concentrate and doré produced1 |
|
| |||||
Gold2 | oz | 51,438 | 59,863 | 214,225 | 187,363 | 170,000 - 200,000 | 180,000 - 220,000 |
Copper | tonnes | 3,347 | 3,735 | 12,536 | 12,154 | 9,000 - 12,000 | 9,000 - 11,000 |
Zinc | tonnes | 8,385 | 5,747 | 33,339 | 34,642 | 27,000 - 35,000 | 21,000 - 27,000 |
Silver3 | oz | 283,223 | 255,579 | 995,090 | 851,723 | 750,000 - 1,000,000 | 800,000 - 1,000,000 |
Cost per ounce of gold produced |
|
| |||||
Cash cost4 | $/oz | 607 | 434 | 606 | 727 | 700 - 900 | 650 - 850 |
1 Metal reported in concentrate is prior to deductions associated with smelter terms.
2 Gold production guidance includes gold contained in concentrate produced and gold in doré.
3 Silver production guidance includes silver contained in concentrate produced and silver in doré.
4 Combined unit costs, cash cost per ounce of gold produced, net of by-product credits, are non-GAAP financial performance measures with no standardized definition under IFRS. For further information and a detailed reconciliation, please see the discussion under the "Non-GAAP Financial Performance Measures" section of this MD&A.
Full year 2024 gold and copper production both exceeded the upper end of our guidance range by 7% and 4%, respectively. Zinc production was in line with our annual guidance range, whereas silver production was at the top end of guidance range.
Full year 2024 cash cost per ounce of gold produced of $606 was better than expected and significantly outperformed the low end of the cost guidance range by 13%.
BRITISH COLUMBIA OPERATIONS REVIEW
|
| Three months ended | Year ended5 | Since acquisition | |
| Dec. 31, 2024 | Dec. 31, 2023 | Dec. 31, 2024 | Dec. 31, 2023 | |
Ore mined1 | tonnes | 2,374,044 | 2,627,398 | 11,360,125 | 6,975,389 |
Strip ratio2 |
| 7.36 | 5.34 | 5.98 | 3.82 |
Ore milled | tonnes | 2,880,927 | 3,261,891 | 12,656,679 | 6,862,152 |
Copper | % | 0.26 | 0.33 | 0.25 | 0.35 |
Gold | g/tonne | 0.09 | 0.06 | 0.08 | 0.07 |
Silver | g/tonne | 0.92 | 1.36 | 0.96 | 1.36 |
Copper concentrate | tonnes | 25,554 | 38,056 | 113,528 | 82,685 |
Concentrate grade | % Cu | 23.2 | 22.4 | 23.3 | 23.1 |
Copper recovery | % | 79.5 | 78.8 | 82.4 | 79.7 |
Gold recovery | % | 55.8 | 54.1 | 60.5 | 55.9 |
Silver recovery | % | 69.0 | 73.8 | 71.8 | 73.0 |
Combined unit operating costs3,4 | C$/tonne | 23.22 | 20.90 | 20.39 | 21.38 |
1 Reported tonnes and grade for ore mined are estimates based on mine plan assumptions and may not reconcile fully to ore milled.
2 Strip ratio is calculated as waste mined divided by ore mined.
3 Reflects combined mine, mill and general and administrative ("G&A") costs per tonne of ore milled. Reflects the deduction of expected capitalized stripping costs.
4 Combined unit costs is a non-GAAP financial performance measure with no standardized definition under IFRS. For further information and a detailed reconciliation, please see the discussion under the "Non-GAAP Financial Performance Measures" section of this MD&A.
5 Copper Mountain mine results are stated at 100%. Hudbay owns 75% of Copper Mountain mine. As Copper Mountain was acquired on June 20, 2023, the results for the year ended December 31, 2023 represents the period from the acquisition date, June 20, 2023, through to the end of the fourth quarter of 2023.
|
| Three months ended | Year ended2 | Since acquisition | |
|
| Dec. 31, 2024 | Dec. 31, 2023 | Dec. 31, 2024 | Dec. 31, 2023 |
Contained metal in concentrate produced |
|
|
|
| |
Copper | tonnes | 5,927 | 8,508 | 26,406 | 19,050 |
Gold | oz | 4,644 | 3,495 | 19,789 | 8,848 |
Silver | oz | 58,933 | 105,295 | 280,499 | 218,282 |
Payable metal sold |
|
|
|
|
|
Copper | tonnes | 5,831 | 9,119 | 25,354 | 18,075 |
Gold | oz | 5,036 | 3,091 | 19,735 | 8,420 |
Silver | oz | 43,747 | 98,441 | 249,536 | 189,443 |
Cost per pound of copper produced |
|
|
|
| |
Cash cost1 | $/lb | 3.00 | 2.67 | 2.74 | 2.49 |
Sustaining cash cost1 | $/lb | 5.76 | 3.93 | 5.29 | 3.41 |
1 Cash cost and sustaining cash cost, net of by-product credits, are non-GAAP financial performance measures with no standardized definition under IFRS. For further information and a detailed reconciliation, please see the discussion under the "Non-GAAP Financial Performance Measures" section of this MD&A.
2 Copper Mountain mine results are stated at 100%. Hudbay owns 75% of Copper Mountain mine. As Copper Mountain was acquired on June 20, 2023, the results for the year ended December 31, 2023 represents the period from the acquisition date, June 20, 2023, through to the end of the fourth quarter of 2023.
Overview
Since acquiring Copper Mountain in June 2023, Hudbay has been focused on advancing operational stabilization plans, including opening up the mine by re-activating the full mining fleet, adding additional haul trucks, adding additional mining faces, optimizing the ore feed to the plant and implementing plant improvement initiatives that mirror Hudbay's successful processes at Constancia. These stabilization plans have successfully increased the total tonnes moved and resulted in stronger mill performance as demonstrated by high mill availability of 92% and copper recoveries of 82% in 2024, compared to 85% and 80% respectively, in 2023.
Efforts are now focused on optimizing the operations in 2025. Mining activities will continue to execute the three-year accelerated stripping program intended to bring higher grade ore into the mine plan. In January, we completed feasibility engineering to debottleneck and increase the nominal plant capacity to its permitted capacity of 50,000 tonnes per day earlier than contemplated in the most recent technical report.
Mining Activities
Total ore mined at Copper Mountain in the fourth quarter of 2024 was 2.4 million tonnes, a decrease of 10% compared to the fourth quarter of 2023. As planned, ore stockpiles were utilized as ore feed to the mill while the mine operation team increased waste stripping activities. Total material moved continued to ramp up in the quarter to 21.4 million tonnes, compared to 18.3 million tonnes in the same period last year, as a result of effective usage of the mining fleet to execute the accelerated stripping program to access higher head grades. The focus in the fourth quarter of 2024 was on mining efficiencies and operator recruitment to effectively utilize the available haul truck fleet. As a result, total material moved is expected to increase quarter-over-quarter in 2025 as per the mine plan.
Milling Activities
The mill processed 2.9 million and 12.7 million tonnes of ore during the fourth quarter and the year ended December 31, 2024, respectively. Ore processed in the fourth quarter of 2024 was 12% lower than the fourth quarter of 2023, limited by both planned and unplanned maintenance and elevated clay material which impacted the secondary crushing circuit. In the fourth quarter of 2024, a number of initiatives were advanced to address these issues and other identified constraints to improve throughput to targeted levels. Several mill initiatives have been implemented in 2024, including, recovery improvements, reprogramming the mill expert system, installation of advanced semi-autogenous grinding control instrumentation, redesigned SAG liner package and updated operational procedures intended to remove magnetite from the pebble stream. Progressive improvements are expected to continue through 2025.
Milled copper grades during the fourth quarter of 2024 were 21% lower than the fourth quarter of 2023 as we continued to draw on lower grade stockpiled ore. Copper recoveries of 79.5% were higher than the fourth quarter of 2023 but were impacted by the ramp-up periods following the planned and unplanned maintenance shutdowns during the quarter. Milled gold grades were higher in the fourth quarter of 2024 than the same period in 2023, resulting in higher gold recoveries of 55.8% in the fourth quarter of 2024.
Full year 2024 copper recoveries of 82.4% were higher than 2023 and exceeded the mine plan expectations, despite processing lower grades, as the operations improved the regrind circuit constraint and implemented the flotation operational strategy improvements, including reagent selection and dose modification. Full year gold recoveries of 60.5% were higher than 2023 due to higher milled gold grades.
Production and Sales Performance
During the fourth quarter of 2024, production of copper, gold and silver was 5,927 tonnes, 4,644 ounces and 58,933 ounces, respectively. Production of copper and silver decreased by 30% and 44%, respectively, compared to the fourth quarter of 2023 primarily as a result of lower head grades from the use of stockpiled ore to feed the mill and lower mill throughput as a result of planned and unplanned maintenance shutdowns. Gold production increased by 33% compared to the fourth quarter of 2023 due to higher gold grades and recoveries.
During the year ended December 31, 2024, production of copper, gold and silver was 26,406 tonnes, 19,789 ounces and 280,499 ounces, respectively.
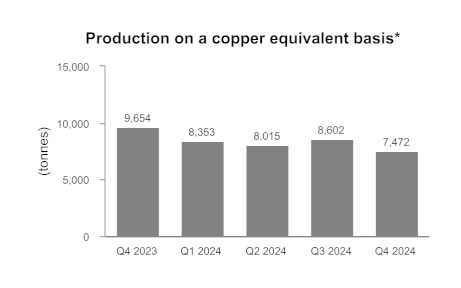
*Copper equivalent production is calculated using the quarter average LME prices for each metal excluding molybdenum. Copper Mountain mine production are stated at 100%. Hudbay owns 75% of Copper Mountain mine.
Cost Performance
Combined mine, mill and G&A unit operating costs in the fourth quarter of 2024 were C$23.22 per tonne milled, 11% higher than the fourth quarter of 2023. This was primarily due to lower ore milled during the fourth quarter, as a result of the previously mentioned planned and unplanned maintenance activities.
Combined mine, mill and G&A unit operating costs during the year ended December 31, 2024 were C$20.39 per tonne milled versus C$21.38 per tonne milled in second half of 2023 (or first six months since acquisition).
Cash cost and sustaining cash cost per pound of copper produced, net of by-product credits, in the fourth quarter of 2024 were $3.00 and $5.76, respectively. Cash cost was 12% higher than in the fourth quarter of 2023 largely due to lower copper production as described above, partially offset by higher by-product credits. Sustaining cash costs were 47% higher than the fourth quarter of 2023 mainly as a result of planned higher capitalized stripping costs in accordance with our accelerated stripping program to access higher grade ore.
Cash cost and sustaining cash cost per pound of copper produced, net of by-product credits, during the year ended December 31, 2024 were $2.74 and $5.29, respectively.
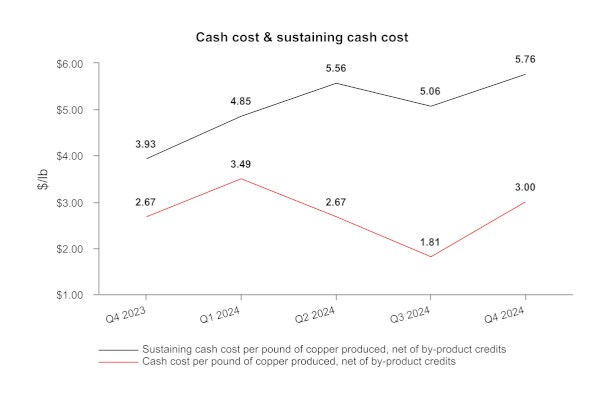
British Columbia Guidance Outlook
|
| Three months ended | Year ended2 | Since | Guidance | ||
|
| Dec. 31, | Dec. 31, | Dec. 31, | Dec. 31, | Annual 2024 | Annual 2025 |
Contained metal in concentrate produced |
|
|
|
|
|
| |
Copper | tonnes | 5,927 | 8,508 | 26,406 | 19,050 | 30,000 - 44,000 | 28,000 - 41,000 |
Gold | oz | 4,644 | 3,495 | 19,789 | 8,848 | 17,000 - 26,000 | 18,500 - 28,000 |
Silver | oz | 58,933 | 105,295 | 280,499 | 218,282 | 300,000 - 455,000 | 245,000 - 365,000 |
Cost per pound of copper produced |
|
|
|
|
|
| |
Cash cost1 | $/lb | 3.00 | 2.67 | 2.74 | 2.49 | 2.00 - 2.50 | 2.45 - 3.45 |
1 Cash cost, net of by-product credits, are non-GAAP financial performance measures with no standardized definition under IFRS. For further information and a detailed reconciliation, please see the discussion under the "Non-GAAP Financial Performance Measures" section of this MD&A.
2 Copper Mountain mine results are stated at 100%. Hudbay owns 75% of Copper Mountain mine. As Copper Mountain was acquired on June 20, 2023, the results for the year ended December 31, 2023 represents the period from the acquisition date, June 20, 2023, through to the end of the fourth quarter of 2023.
Full year 2024 gold production was in line with our annual guidance range, whereas copper and silver production were below the guidance ranges for each metal primarily as a result of lower grades in stockpiled ore and lower throughput during the ramp-up of stabilization and optimization efforts throughout the year.
Cash cost per pound of copper produced was $2.74 which was above the higher end of the cost guidance range driven by lower copper production as mentioned above.
OUTLOOK
This outlook includes forward-looking information about our operations and financial expectations based on our expectations and outlook as of February 18, 2025.
This outlook, including expected results and targets, is subject to various risks, uncertainties and assumptions, which may impact future performance and our achievement of the results and targets discussed in this section. For additional information on forward-looking information, refer to the "Forward-Looking Information" section of this MD&A. We may update our outlook depending on changes in metals prices and other factors, as per our "Commodity Markets" and "Sensitivity Analysis" discussions below. In addition to this section, refer to the "Operations Review", "Financial Review" and "Liquidity and Capital Resources" sections for additional details on our outlook for 2025.
Material Assumptions
Our annual production and operating cost guidance, along with our annual capital and exploration expenditure forecasts are discussed in detail below.
Production Guidance
Contained Metal in Concentrate and Doré1 | 2025 Guidance | Year ended Dec. 31, 2024 | 2024 Guidance | |
Peru |
|
|
|
|
Copper | tonnes | 80,000 - 97,000 | 99,001 | 98,000 - 120,000 |
Gold | oz | 49,000 - 60,000 | 98,226 | 76,000 - 93,000 |
Silver | oz | 2,475,000 - 3,025,000 | 2,708,262 | 2,500,000 - 3,000,000 |
Molybdenum | tonnes | 1,300 - 1,500 | 1,323 | 1,250 - 1,500 |
|
|
|
|
|
Manitoba |
|
|
|
|
Gold | oz | 180,000 - 220,000 | 214,225 | 170,000 - 200,000 |
Zinc | tonnes | 21,000 - 27,000 | 33,339 | 27,000 - 35,000 |
Copper | tonnes | 9,000 - 11,000 | 12,536 | 9,000 - 12,000 |
Silver | oz | 800,000 - 1,000,000 | 995,090 | 750,000 - 1,000,000 |
|
|
|
|
|
British Columbia |
|
|
|
|
Copper | tonnes | 28,000 - 41,000 | 26,406 | 30,000 - 44,000 |
Gold | oz | 18,500 - 28,000 | 19,789 | 17,000 - 26,000 |
Silver | oz | 245,000 - 365,000 | 280,499 | 300,000 - 455,000 |
|
|
|
|
|
Total |
|
|
|
|
Copper | tonnes | 117,000 - 149,000 | 137,943 | 137,000 - 176,000 |
Gold | oz | 247,500 - 308,000 | 332,240 | 263,000 - 319,000 |
Zinc | tonnes | 21,000 - 27,000 | 33,339 | 27,000 - 35,000 |
Silver | oz | 3,520,000 - 4,390,000 | 3,983,851 | 3,550,000 - 4,455,000 |
Molybdenum | tonnes | 1,300 - 1,500 | 1,323 | 1,250 - 1,500 |
1 Metal reported in concentrate and doré is prior to refining losses or deductions associated with smelter terms.
2 Represents 100% of the production from the Copper Mountain mine. Hudbay holds a 75% interest in the Copper Mountain mine.
On a consolidated basis, we successfully achieved 2024 production guidance for all metals. On a business unit stand-alone basis, Peru exceeded the top end of the gold production guidance range and achieved the guidance ranges for all other metals. Manitoba exceeded the top end of the gold and copper production guidance ranges and achieved the guidance ranges for all other metals. In British Columbia, copper production was below the low end of the guidance range as a result of lower grades in stockpiled ore and reduced throughput during the mill stabilization period, while gold production was within the guidance range.
In 2025, consolidated copper production is forecasted to remain stable with 2024 levels at 133,000 tonnes1. This is a result of slightly lower grades in Peru with a lower portion of ore feed from Pampacancha as it depletes at the end of 2025, offset by higher expected production in British Columbia as a result of mill throughput ramp-up throughout the year and higher expected grades from the accelerated stripping schedule. Consolidated gold production in 2025 is expected to decrease by 16% to 277,750 ounces1 due to the accelerated mining of high grade gold benches at Pampacancha in 2024 and a focus on high grade gold zones at Lalor in 2024 which resulted in both Peru and Manitoba exceeding the top end of the 2024 gold production guidance ranges.
In Peru, 2025 copper production is expected to be 88,500 tonnes1, a decrease of 11% from 2024 with less mill ore feed coming from Pampacancha in 2025. Gold production is expected to be 54,500 ounces1, lower than 2024 levels as additional high grade gold benches were mined in late 2024, ahead of schedule, resulting in gold production exceeding 2024 guidance levels. The Pampacancha deposit is now expected to be depleted in early December 2025 as opposed to October 2025, as the mine plan has smoothed Pampacancha production throughout the year. Total mill ore feed from Pampacancha is expected to be approximately 25% in 2025, lower than the typical one-third in prior years as Pampacancha approaches depletion. Peru's 2025 production guidance reflects a period of higher stripping activities at Pampacancha from January until April, as well as regularly scheduled semi-annual mill maintenance shutdowns at Constancia during the second and fourth quarters of 2025.
In Manitoba, 2025 gold production is anticipated to be 200,000 ounces1, a decrease of 7% from the record levels achieved in 2024. The impressive operating performance is expected to continue into 2025, resulting in new 2025 gold production guidance to be 8% higher than the previous 2025 guidance of 185,000 ounces1. The production guidance anticipates Lalor operating at 4,500 tonnes per day supplemented by 45,000 tonnes of ore feed from the 1901 deposit in 2025 as we confirm the optimal mining method. New Britannia mill throughput is expected to continue to exceed expectations and operate at 2,000 tonnes per day in 2025, far exceeding its original design capacity of 1,500 tonnes per day. Zinc production for 2025 is expected to be 24,000 tonnes1, a 28% decline from 2024 due to a lower grade base metal mining sequence at Lalor.
In British Columbia, 2025 copper production is expected to be 34,500 tonnes1, a 31% increase from 2024 as a result of mill throughput ramp-up in the second half of the year from several mill initiatives, including the planned conversion of the third ball mill to a second SAG mill, and higher grades from the accelerated stripping schedule. The mill throughput ramp-up reflects the first half of 2025 at similar throughput levels seen in 2024 with a significant increase in throughput in the second half of 2025 concurrent with the completion of second SAG mill project, ramping up towards 50,000 tonnes per day in 2026.
We will release updated three-year production outlook together with our annual mineral reserve and resource update in March 2025.
Cash Cost Guidance
Copper remains the primary revenue contributor on a consolidated basis, and therefore, consolidated cost guidance has been presented as cash cost per pound of copper produced, net of by-product credits. We have also provided cash cost guidance for each of our operations based on their respective primary metal contributors.
Cash cost 1 | 2025 Guidance | Year ended Dec. 31, 2024 | 2024 Guidance5 | |
Peru cash cost per pound of copper2 | $/lb | 1.35 - 1.65 | 1.18 | 1.25 - 1.60 |
Manitoba cash cost per ounce of gold3 | $/oz | 650 - 850 | 606 | 700 - 900 |
British Columbia cash cost per pound of copper4 | $/lb | 2.45 - 3.45 | 2.74 | 2.00 - 2.50 |
|
|
|
|
|
Consolidated cash cost per pound of copper2 | $/lb | 0.80 - 1.00 | 0.46 | 0.65 - 0.85 |
Consolidated sustaining cash cost per pound of copper2 | $/lb | 2.25 - 2.65 | 1.62 | 1.75 - 2.20 |
1 Cash cost and sustaining cash cost, net of by-product credits, per pound of copper produced and cash costs, net of by-product credits, per ounce of gold produced are non-GAAP financial performance measure with no standardized definition under IFRS. For further information and a detailed reconciliation, please see the discussion under the "Non-GAAP Financial Performance Measures" section of this MD&A.
2 Peru cash cost, net of by-product credits, per pound of produced assumes by-product credits are calculated using the gold and silver deferred revenue drawdown rates for the streamed ounces in Peru in effect on December 31, 2024 and the following commodity price for 2025: $2,500 per ounce gold, $26.00 per ounce silver and $18.00 per pound molybdenum.
3 Manitoba cash cost, net of by-product credits, per ounce of gold assumes by-product credits are calculated using the following commodity prices for 2025: $4.10 per pound copper, $26.00 per ounce silver, $1.20 per pound zinc and an exchange rate of 1.35 C$/US$.
4 British Columbia cash cost, net of by-product credits, per pound of copper assumes by-product credits are calculated using the following commodity price assumptions for 2025: $2,500 per ounce gold, $26.00 per ounce silver and an exchange rate of 1.35 C$/US$.
5 We had improved our 2024 annual consolidated cash cost guidance range to $0.65 to $0.85 per pound from the original guidance range of $1.05 to $1.25 per pound. We have also improved our 2024 annual sustaining cash cost guidance range to $1.75 to $2.20 per pound from the original guidance range of $2.00 to $2.45 per pound.
Consolidated cash cost in 2025 is expected to be within $0.80 to $1.00 per pound of copper, net of by-product credits, as we continue to focus on maintaining strong cost control across the business, driving industry-leading margins. Sustaining cash cost in 2025 is expected to be within $2.25 to $2.65 per pound of copper, net of by-product credits, reflecting slightly lower copper production, lower by-product credits and higher sustaining capital expenditures compared to 2024.
Copper cash cost in Peru is expected to be between $1.35 to $1.65 per pound in 2025, reflecting steady unit operating cost performance, offset by lower copper production and by-product credits compared to 2024.
Gold cash cost in Manitoba is expected to be between $650 to $850 per ounce in 2025, an increase compared to 2024 as a result of lower by-product credits and slightly lower gold production but remains at industry-low levels driving strong margins compared to current gold prices.
Copper cash cost in British Columbia is expected to be between $2.45 to $3.45 per pound in 2025, an increase from 2024 due to higher mining costs related to more material moved as we execute the planned accelerated stripping program and higher milling costs as we implement the mill improvement projects this year, partially offset by higher copper production.
Capital Expenditure Guidance
Capital Expenditures1 | 2025 Guidance5 | Year ended Dec. 31, 2024 | 2024 Guidance6 |
Sustaining capital 2 |
|
|
|
Peru 3 | 170.0 | 124.4 | 130.0 |
Manitoba | 60.0 | 45.6 | 55.0 |
British Columbia - sustaining capital | 50.0 | 51.5 | 35.0 |
British Columbia - capitalized stripping 3 | 85.0 | 71.6 | 70.0 |
Total sustaining capital | 365.0 | 293.1 | 290.0 |
Growth capital |
|
|
|
Peru | 25.0 | 0.8 | 2.0 |
Manitoba 4 | 15.0 | 7.0 | 10.0 |
British Columbia | 75.0 | 8.1 | 5.0 |
Arizona 6 | 90.0 | 28.9 | 45.0 |
Total growth capital | 205.0 | 44.8 | 62.0 |
Capitalized exploration5 | 10.0 | 12.2 | 8.0 |
Total | 580.0 | 350.1 | 360.0 |
1 Excludes capitalized costs not considered to be sustaining or growth capital expenditures.
2 Sustaining capital guidance excludes right-of-use lease additions, additions as a result of equipment financing arrangements, and non-cash deferred stripping.
3 Includes capitalized stripping and development costs.
4 2025 Manitoba growth capital partially funded by approximately $5 million in Canadian Development Expense flow-through financing proceeds (2024 - $3 million).
5 2025 Canadian capital expenditures guidance is converted into U.S. dollars using an exchange rate of 1.35 C$/US$.
6 2024 Arizona growth capital guidance was increased by an additional $25 million, compared to the original 2024 guidance of $20 million, related to early feasibility study work after receipt of the Aquifer Protection Permit in August 2024.
2024 total capital expenditures were $10 million lower than our full year guidance of $360 million as lower growth capital and certain sustaining capital deferrals were partially offset by higher sustaining capital in British Columbia.
2025 total capital expenditures are expected to be $580 million, reflecting an increase in growth capital spend as we reinvest in several high-return growth projects as well as higher sustaining capital at the operations, including some deferrals from 2024, as discussed below.
Peru 2025 sustaining capital expenditures are expected to increase to $170 million as a result of higher capitalized stripping, mine equipment purchases and capital deferrals from 2024. Peru 2025 growth capital expenditures of $25 million in 2025 relates primarily to the installation of a pebble crusher to increase mill throughput starting in 2026 and other mill optimization initiatives.
Manitoba 2025 sustaining capital expenditures are expected to increase to $60 million primarily as a result of additional underground capitalized development costs. Manitoba 2025 growth capital spending of $15 million relates to the development of the exploration and haulage drifts at the 1901 deposit. The 1901 growth expenditures will be partially funded by $5 million in proceeds from a Canadian Development Expense premium flow-through financing in December 2024. Manitoba spending guidance excludes approximately $15 million of annual care and maintenance costs related to the Flin Flon facilities in 2025, which are expected to be recorded as other operating expenses.
British Columbia 2025 sustaining capital expenditures are expected to remain consistent with 2024 at $50 million for mine and mill equipment capital. In addition, we expect to spend approximately $85 million for capitalized stripping costs in 2025 related to continued accelerated stripping as part of the three-year stabilization and optimization plan at Copper Mountain. British Columbia 2025 growth capital spending of $75 million includes approximately $55 million for the conversion of the third ball mill to a second SAG mill to increase throughput rates starting in the second half of 2025 and ramping up to 50,000 tonnes per day in 2026.
Arizona 2025 growth capital spending of $90 million includes approximately $65 million in costs related to de-risking activities and definitive feasibility studies for Copper World and $25 million of typical annual holding costs.
Exploration Guidance
(in $ millions) |
| Year ended |
|
2025 Guidance | Dec. 31, 2024 | 2024 Guidance | |
Peru1 | 19.0 | 19.8 | 17.0 |
Manitoba2 | 30.0 | 26.4 | 23.0 |
British Columbia | 1.0 | 1.6 | 2.0 |
Arizona and other | - | 1.8 | 1.0 |
Total exploration expenditures | 50.0 | 49.6 | 43.0 |
Capitalized spending | (10.0) | (12.2) | (8.0) |
Total exploration expense | 40.0 | 37.4 | 35.0 |
1 Peru exploration expenditures exclude $5 million of non-cash amortization of community agreements for exploration properties.
2 Manitoba exploration partially funded by approximately $7 million in Canadian Exploration Expense flow-through financing proceeds for 2025 (2024 - $11 million).
2025 exploration expenditures are expected to total $40 million, in line with 2024 exploration spending as we continue to execute a multi-year extensive geophysics and drilling program in Snow Lake to extend mine life and explore for new discoveries, as described below.
In Manitoba, 2025 exploration activities will focus on completing the largest geophysics program in our history, including 800 kilometres of ground electromagnetic surveys and an extensive airborne geophysics survey. We plan to complete underground and surface drilling at Lalor to increase mineral resource and reserve estimates, including follow-up drilling at the new Lalor Northwest discovery. Underground drilling is planned for 1901 from the new exploration drift to upgrade and expand the mineral reserve and resource estimates. In addition, we plan to continue drilling activities at several regional targets in 2025, including the Cook Lake properties, following up on encouraging results in 2024. A portion of the 2025 Manitoba exploration program will be funded by $7 million in proceeds from a critical minerals premium flow-through financing completed in December 2024. We issued 476,200 Canadian Exploration Expense flow-through common shares of the Company, at a price of C$22.05 per share, representing a premium of approximately 65%.
In Peru, 2025 exploration activities will continue to focus on final permitting and drill preparation for the Maria Reyna and Caballito properties near Constancia.
|
1 Calculated using the midpoint of the guidance range
Commodity Markets
Our 2025 operational and financial performance will be influenced by a variety of factors including our production volumes, metal prices and input costs. The general performance of the Chinese, North American and global economies will influence the demand for copper and zinc and the prices we receive, while interest rates, inflation, the performance of financial markets, the amount of central bank gold purchases and the level of geopolitical uncertainty will drive the price we receive for our gold.
Whilst the pace of potential central banks interest rate reductions was a high profile driver of economic uncertainty in 2024, 2025 will be dominated by tariffs and trade wars stemming from the Trump White House. The magnitude of these tariffs, which countries are ultimately targeted, the duration of the tariffs, the breadth of products and services targeted, which countries these tariffs are directed against and the retaliatory tariffs imposed by other nations will determine how profound the effect is on world economic growth, trade flows, inflation, foreign exchange rates and the prices that Hudbay receives for its products. Hudbay does not currently sell any concentrate or precious metal doré into the USA from Canada so the tariffs currently contemplated by the US administration will not have any significant direct effect on our sales revenues.
The realized prices we achieve in the commodity markets significantly affect our financial performance. Our general expectations regarding metals prices and foreign exchange rates are included below and in the "Sensitivity Analysis" section of this MD&A.
We have developed the following market analysis from various information sources including analyst and industry experts and our own market intelligence.
Copper
In 2024, the London Metal Exchange ("LME") Cash copper price began the year by declining by $0.20 per pound until mid-February before surging to a an annual high of $5.03 per pound on May 21 on the strength of unprecedented investment interest, the anticipation of strong manufacturing demand in China, the LME's ban on Russian copper and a technical squeeze that developed on the Commodities Exchange ("Comex") in New York. After this initial run to over $5 per pound, LME Cash copper prices spent the balance of the year trading between $4.00 and $4.60 per pound with 2024 prices averaging $4.15 for the full year.
The LME contango between cash and 3-month was at its highest level in 10 years during 2024, owing to a well-supplied market, high prices and high interest rates, all of which figure into the contango equation. This large contango combined with the quotational period options that are a common component of sales contracts in the copper industry, has allowed traders to subsidize the purchase of concentrates, allowing spot TC/RCs to remain close to zero and sometimes negative for most of the past year. Low and negative TC/RCs have occurred briefly historically but for very short periods of time, making the current situation unprecedented.
2025 is likely to be a bumpy year for copper prices owing to the tremendous economic uncertainly introduced by potential tariffs which could have a negative effect on copper demand if they tip the world economy into recession or lead to temporary spikes in prices due to dislocations in the world's supply chain for copper concentrates and copper metal. Copper prices may also be impacted by western world smelter curtailments or closures due to low TC/RCs which could reduce supply although governments would most likely intervene to prevent these outcomes.
Growing future demand for copper, driven by the energy transition and AI data centres, will necessitate the development of intrinsically higher capital cost greenfield mines from the world's remaining inventory of lower-grade undeveloped copper deposits, which, in combination with higher operating costs and taxes, is expected to result in significantly higher copper prices in 2027 and beyond.
Zinc
The LME zinc price spent the first quarter of 2024 rangebound between $1.05 and $1.15 per pound, where it had traded for most of 2023. However, during the balance of the year, the price was more robust, trading between $1.20 and $1.40 per pound which brought the average price for 2024 to $1.26 per pound. In January 2025, the zinc price softened, declining to $1.23 per pound.
In 2025, two large new zinc mines are scheduled to ramp up in China and Russia which is expected to increase global mine production by 1.9% according to CRU. With demand forecast to be almost flat there does not appear to be a great incentive for prices to increase from current levels as they did in 2024 although it is possible that low treatment charges for zinc concentrate may cause smelters in China to curtail production and produce less metal which would be positive for the zinc price.
Gold
The physical supply and demand for gold is not an arbitrator of future prices as it is with base metals because most of the gold ever mined is stored in bank vaults. Gold is an investment that has traditionally provided a safe haven for investors during uncertain economic times, as well as a hedge against inflation, future currency devaluation and declining values of other riskier asset classes. The decline in interest rates in 2024, coupled with the election of a new president in the USA who has promised to enact policies which are considered to be inflationary, drove gold prices on the London Bullion Market to their best year since 2020 with prices up almost 26% to $2,609 per ounce on December 31. In the first month of 2025, the gold price maintained its momentum, hitting an all-time high of over $2,800 per ounce at the end of January as Donald Trump prepared to introduce tariffs on Canada, Mexico and China.
While continued interest rate reductions by the US Federal Reserve are temporarily on hold there is more than enough concern about the inflationary nature of the Trump policy agenda to be supportive of higher gold prices in the near term and most industry observers and participants have raised their long-term price projections for gold to over $1,900 per ounce.
Treatment Charges, Refining Charges, and Freight Costs
Hudbay's operating margins are affected by a variety of third-party processing charges and logistics costs that must be incurred to convert our concentrates into refined metal. For the copper, zinc and molybdenum concentrates that we produce, we pay freight costs to deliver these products from our facilities to our customers which include, depending on the destination, various combinations of truck, rail or ocean freight costs along with warehousing and loading fees. We also pay treatment and refining charges ("TC/RCs") to our customers who process our copper concentrates. For precious metal doré we produce, we incur transportation costs to ship to a third-party refinery.
A portion of our copper concentrate sales are made under multi-year contracts, with a link to annual benchmark treatment and refining charges. The large decline in annual treatment/refining charges from 2024 to 2025 reflects how exceptionally undersupplied the copper concentrate market is this year. The 2025 benchmark treatment and refining charges have been agreed with Chinese smelters at $21.25/2.125 cents, representing a dramatic fall from last year's benchmark of $80/8 cents. This represents a decline of approximately $0.17 per pound of copper compared to 2024 levels. Spot TC/RCs for copper concentrates have been in low single digits to negative $15/1.5 cents since early in 2024 and remain in this range due to the undersupplied smelter market that has driven the 2025 benchmark to record lows. With terms at current levels many non-integrated smelters in the western world and many smaller custom smelters in China will be under economic pressure to reduce output or temporarily shutter their facilities.
Hudbay is also exposed to zinc concentrate treatment charges, as a seller of zinc concentrate. The 2025 zinc concentrate benchmark has not been established yet, however industry expectations are that the 2025 benchmark will decrease substantially from the $160 per tonne benchmark in 2024 given that spot processing terms for zinc concentrates in 2024 have been around zero dollars per tonne for most of the year for many of the same reasons that the copper concentrate terms have been depressed.
Bulk ocean freight rates for our concentrates remained depressed in early 2025, continuing the market weakness experienced during Q4 of 2024. There is considerable uncertainty regarding rates for the balance of 2025, in part due to potential changing trade flows resulting from the imposition of tariffs by the Trump administration which will disrupt traditional trade flows and geopolitical related oil price uncertainty both of which could lead to increased global freight rates. Alternatively, if the world economy tips into recession global freight rates could further decline. Hudbay locked in ocean freight rates for approximately 45% of our Peruvian requirements for 2025 and 2026 and may seek to lock in additional fixed rates for the balance of our production over the same period.
Sensitivity Analysis
The following table displays the estimated impact of changes in metals prices and foreign exchange rates on our 2025 net profit, earnings per share and operating cash flow, assuming that our operational performance is consistent with the mid-point of our guidance for 2025. The effects of a given change in an assumption are calculated in isolation.
| 2025 Base | Change of +/-10% | Impact on | Impact on | Impact on Operating CF |
Metals Prices |
|
|
|
|
|
Copper price2 | $4.10/lb | $0.41/lb | $75M | $0.19 | $100M |
Gold price3 | $2,500/oz | $250/oz | $31M | $0.08 | $56M |
Zinc price | $1.20/lb | $0.12/lb | $3M | $0.01 | $6M |
Exchange Rates 4 |
|
|
|
|
|
C$/US$ | 1.35 | 0.14 | $63M | $0.16 | $62M |
1 Based on 394.9 million common shares outstanding as at December 31, 2024.
2 Quotational period hedging program neutralizes provisional pricing adjustments.
3 Gold price sensitivity also includes an impact of a +/- 10% change in the silver price (2025 assumption: $26.00/oz of silver).
4 Change in profit from operational performance only, does not include change in profit arising from translation of balance sheet accounts.
FINANCIAL REVIEW
Financial Results
In the fourth quarter of 2024, we recorded net earnings attributable to owners of $21.2 million compared to net earnings on the same basis of $30.7 million in the fourth quarter of 2023, representing a decrease in net earnings attributable to owners of $9.5 million. For the full year of 2024, we recorded net earnings attributable to owners of $76.7 million compared to net earnings on the same basis of $66.4 million for the same period in 2023, representing an increase in earnings attributable to owners of $10.3 million.
The following table provides further details on the makeup of this variance:
| (in $ millions) | Three months ended December 31, 2024 | Year ended December 31, 20241 | ||||
| (Decrease) increase in components of earnings: | ||||||
| Revenues | (17.3 | ) | 331.2 | |||
| Cost of sales | ||||||
| Mine operating costs | 5.3 | (135.0 | ) | |||
| Depreciation and amortization | (0.4 | ) | (34.9 | ) | ||
| Selling and administrative expenses | 1.4 | (17.8 | ) | |||
| Exploration expenses | (0.8 | ) | (13.3 | ) | ||
| Re-evaluation adjustment - environmental obligation | 31.5 | (7.9 | ) | |||
| Other expenses | (11.5 | ) | (19.1 | ) | ||
| Net finance expense | 14.5 | (3.4 | ) | |||
| Tax expense | (36.9 | ) | (101.5 | ) | ||
| Increase in net earnings for the period | (14.2 | ) | (1.7 | ) | ||
| Change in non-controlling interest | 4.7 | 12.0 | ||||
| (Decrease) increase in net earnings attributable to owners for the period | (9.5 | ) | 10.3 |
1Copper Mountain mine results are stated at 100%. Hudbay owns 75% of Copper Mountain mine. As Copper Mountain was acquired on June 20, 2023, the results for the year ended December 31, 2023 represents the period from the acquisition date, June 20, 2023, through to the end of the fourth quarter of 2023.
Revenue
Revenue for the fourth quarter of 2024 was $584.9 million, $17.3 million lower than the same period in 2023, primarily due to lower sales volume of copper and gold in Peru from lower production levels and lower gold grade ore processed in Manitoba in line with the mine plan for the fourth quarter of 2024 partially offset by higher metal prices and lower treatment and refining charges.
Revenue during the year ended December 31, 2024 was $2,021.2 million, $331.2 million higher than in 2023, primarily as a result of higher metal prices, higher gold and silver sales volumes and incremental revenue as a result of the Copper Mountain mine acquisition.
While a majority of revenues continue to be from copper, gold is representing an increasing portion of total revenues at 35% in 2024 compared to 29% in 2023. This is as a result of higher gold production and strong leverage to higher gold prices in 2024, increasing commodity diversification and improving overall revenues.
The following table provides further details on these variances:
| (in $ millions) | Three months ended December 31, 2024 | Year ended December 31, 2024 | ||||
| Metals prices1 | ||||||
| Higher copper prices | 26.9 | 76.1 | ||||
| Higher gold prices | 24.6 | 119.6 | ||||
| Higher zinc prices | 2.9 | 4.4 | ||||
| Higher silver prices | 1.7 | 7.6 | ||||
| Sales volumes | ||||||
| Lower copper sales volumes | (50.6 | ) | (112.1 | ) | ||
| (Lower) higher gold sales volumes | (25.0 | ) | 86.5 | |||
| Lower zinc sales volumes | (5.4 | ) | (9.3 | ) | ||
| Higher silver sales volumes | 2.2 | 5.4 | ||||
| British Columbia Business Unit2 | ||||||
| Copper | - | 129.6 | ||||
| Gold | - | 19.8 | ||||
| Silver | - | 4.3 | ||||
| Treatment & Refining | - | (7.7 | ) | |||
| Other | ||||||
| Molybdenum and other volume and pricing differences | (4.4 | ) | (8.4 | ) | ||
| Variable consideration adjustments | - | (8.7 | ) | |||
| Effect of lower treatment and refining charges | 9.8 | 24.1 | ||||
| (Decrease) increase in revenue in 2024 compared to 2023 | (17.3 | ) | 331.2 |
1 See discussion below for further information regarding metals prices.
2 Represents revenue for the period of January 1, 2024 through to June 30, 2024, where there was no comparable revenue in the comparative period due to the fact Copper Mountain mine was acquired on June 20, 2023.
Our revenue by significant product type is summarized below:
| Three months ended | Year ended | |||||||||||
| (in $ millions) | Dec. 31, 2024 | Dec. 31, 2023 | Dec. 31, 2024 | Dec. 31, 2023 | ||||||||
| Copper | 349.0 | 361.7 | 1,154.8 | 1,065.8 | ||||||||
| Gold | 199.6 | 183.8 | 673.6 | 463.0 | ||||||||
| Zinc | 16.4 | 18.7 | 71.1 | 76.6 | ||||||||
| Silver | 15.7 | 11.8 | 51.5 | 35.6 | ||||||||
| Molybdenum | 9.1 | 21.2 | 60.1 | 79.4 | ||||||||
| Other metals | 1.2 | - | 1.7 | 0.2 | ||||||||
| Revenue from contracts | 591.0 | 597.2 | 2,012.8 | 1,720.6 | ||||||||
| Amortization of deferred revenue - gold | 14.6 | 16.3 | 40.7 | 39.7 | ||||||||
| Amortization of deferred revenue - silver | 11.6 | 10.2 | 33.6 | 32.7 | ||||||||
| Amortization of deferred revenue - variable consideration adjustments - prior periods | - | - | (3.8 | ) | 4.9 | |||||||
| Pricing and volume adjustments1 | (6.4 | ) | 14.2 | 35.2 | 5.8 | |||||||
| Treatment and refining charges | (25.9 | ) | (35.7 | ) | (97.3 | ) | (113.7 | ) | ||||
| Revenue | 584.9 | 602.2 | 2,021.2 | 1,690.0 | ||||||||
1 Pricing and volume adjustments represents mark-to-market adjustments on provisionally prices sales, realized and unrealized changes to fair value for non-hedge derivative contracts (QP hedges) and adjustments to originally invoiced weights and assays.
For further detail on variable consideration adjustments, refer to note 22 of our consolidated financial statements.
Realized sales prices
This measure is intended to enable management and investors to understand the average realized price of metals sold to third parties in each reporting period. The average realized price per unit sold does not have any standardized meaning prescribed by IFRS, is unlikely to be comparable to similar measures presented by other issuers and should not be considered in isolation or a substitute for measures of performance prepared in accordance with IFRS.
For sales of copper, zinc, gold and silver we may enter into non-hedge derivatives ("QP hedges") which are intended to manage the provisional pricing risk arising from quotational period terms in concentrate sales agreements. The gains and losses on QP hedges are included in the calculation of realized prices. We expect that gains and losses on QP hedges will offset provisional pricing adjustments on concentrate sales contracts.
Our realized prices for the three months and year ended December 31, 2024 and 2023, respectively, are summarized below:
| Realized prices1 for the |
| Realized prices1 for the | ||||
Three months ended |
| Year ended | |||||
Prices | LME QTD | Dec. 31, 2024 | Dec. 31, 2023 | LME YTD 20242 | Dec. 31, 2024 | Dec. 31, 2023 | |
Copper | $/lb | 4.17 | 4.09 | 3.77 | 4.15 | 4.18 | 3.84 |
Zinc | $/lb | 1.38 | 1.39 | 1.14 | 1.26 | 1.26 | 1.18 |
Gold3 | $/oz |
| 2,327 | 2,062 |
| 2,241 | 1,898 |
Silver3 | $/oz |
| 23.12 | 21.67 |
| 24.23 | 21.85 |
1 Realized prices exclude refining and treatment charges and are on the sale of finished metal or metal in concentrate. Realized prices include the effect of provisional pricing adjustments on prior period sales.
2 London Metal Exchange average for Cash copper and zinc prices.
3 Sales of gold and silver from Constancia mine are subject to our precious metals stream agreement with Wheaton, pursuant to which we recognize deferred revenue for precious metals deliveries and also receive cash payments. Stream sales are included within realized prices and their respective deferred revenue and cash payment rates can be found on page 45 of this MD&A.
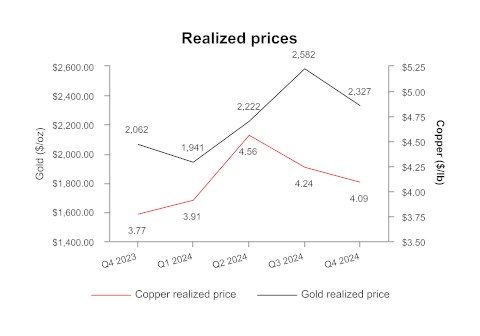
In addition to QP hedges, we may periodically undertake metal price hedging in accordance with Board approved policies to achieve strategic objectives, including locking in favourable metal prices to ensure minimum cash flows during or after the construction of a mine or during a period of reduced liquidity, to manage cash flows at shorter life or higher cost operations or as part of a financing arrangement. The realized prices, denoted in the table above, excludes the impact of derivative mark-to-market gains and losses on these non-QP hedges, which are included in change in fair value of financial instruments in our consolidated statement of earnings. The forward copper sales and zero cost collar hedges that were entered into in the first quarter of 2024, which represented a total of approximately 61% of Copper Mountain's 2024 production.
As of December 31, 2024, Hudbay had the following non-QP hedges outstanding:
- Forward sales contracts at the Copper Mountain mine for a total of 5.3 million pounds of copper over the period of January 2025 to April 2025 at an average price of $3.95 per pound; and
- Zero-cost collar program at the Copper Mountain mine for 6.6 million pounds of copper over a twelve month period of January 2025 to April 2025 at an average floor price of $3.88 per pound and an average cap price of $4.14 per pound.
The following tables provide a reconciliation of average realized price per unit sold, by metal, to revenues as shown in the consolidated financial statements.
| Three months ended December 31, 2024 | |||||||||||||||||||||
| (in $ millions except for realized price and payable metal sold) 1 | Copper | Gold | Zinc | Silver | Molybdenum | Other | Total | ||||||||||||||
| Revenue from contracts | 349.0 | 199.6 | 16.4 | 15.7 | 9.1 | 1.2 | 591.0 | ||||||||||||||
| Amortization of deferred revenue | - | 14.6 | - | 11.6 | - | - | 26.2 | ||||||||||||||
| Pricing and volume adjustments 3 | (6.6 | ) | 1.6 | (0.3 | ) | (0.7 | ) | (0.4 | ) | - | (6.4 | ) | |||||||||
| Revenue, including mark-to-market on QP hedges 4 | 342.4 | 215.8 | 16.1 | 26.6 | 8.7 | 1.2 | 610.8 | ||||||||||||||
| Realized non-QP derivative mark-to-market | (1.3 | ) | (2.9 | ) | - | - | - | - | (4.2 | ) | |||||||||||
| By-product credits 5 | 341.1 | 212.9 | 16.1 | 26.6 | 8.7 | 1.2 | 606.6 | ||||||||||||||
| Payable metal in concentrate and doré sold 6 | 37,927 | 92,734 | 5,261 | 1,150,518 | 182 | - | - | ||||||||||||||
| Realized price 7 | 9,028 | 2,327 | 3,060 | 23.12 | - | - | - | ||||||||||||||
| Realized price 8 | 4.09 | - | 1.39 | - | - | - | - | ||||||||||||||
| Year ended December 31, 2024 | |||||||||||||||||||||
| (in $ millions except for realized price and payable metal sold) 1 | Copper | Gold | Zinc | Silver | Molybdenum | Other | Total | ||||||||||||||
| Revenue from contracts 2 | 1,154.8 | 673.6 | 71.1 | 51.5 | 60.1 | 1.7 | 2,012.8 | ||||||||||||||
| Amortization of deferred revenue | - | 40.7 | - | 33.6 | - | - | 74.3 | ||||||||||||||
| Pricing and volume adjustments 3 | (3.6 | ) | 37.2 | (1.2 | ) | 0.9 | 1.9 | - | 35.2 | ||||||||||||
| Revenue, including mark-to-market on QP hedges 4 | 1,151.2 | 751.5 | 69.9 | 86.0 | 62.0 | 1.7 | 2,122.3 | ||||||||||||||
| Realized non-QP derivative mark-to-market | (5.2 | ) | (3.7 | ) | - | - | - | - | (8.9 | ) | |||||||||||
| By-product credits 5 | 1,146.0 | 747.8 | 69.9 | 86.0 | 62.0 | 1.7 | 2,113.4 | ||||||||||||||
| Payable metal in concentrate and doré sold 6 | 125,094 | 335,342 | 25,120 | 3,549,816 | 1,287 | - | - | ||||||||||||||
| Realized price 7 | 9,203 | 2,241 | 2,783 | 24.23 | - | - | - | ||||||||||||||
| Realized price 8 | 4.18 | - | 1.26 | - | - | - | - | ||||||||||||||
1 Average realized price per unit sold may not calculate based on amounts presented in this table due to rounding.
2 As per financial statements.
3 Pricing and volume adjustments represents mark-to-market adjustments on provisionally priced sales, realized and unrealized changes to fair value for QP hedge derivative contracts and adjustments to originally invoiced weights and assays.
4 Revenue, including mark-to-market on QP hedges is used in the calculation of realized price.
5 By-product credits subtotal is used in the calculated of cash cost per pound of copper and ounce of gold produced, net of by-product credits. Cash cost per pound of copper and per ounce of gold produced, net of by-product credits, are non-GAAP financial performance measures with no standardized definition under IFRS. For further information and a detailed reconciliation, please see the discussion under the "Non-GAAP Financial Performance Measures" section of this MD&A.
6 Copper, zinc and molybdenum shown in metric tonnes and gold and silver shown in ounces.
7 Realized price for copper and zinc in $/metric tonne and realized price for gold and silver in $/oz.
8 Realized price for copper and zinc in $/lb.
The price, quantity and mix of metals sold affect our revenue, operating cash flow and gross profit. Revenue from metals sales can vary from quarter to quarter due to production levels, shipping volumes and transfer of risk and title to customers.
| Three months ended December 31, 2023 | |||||||||||||||||||||
| (in $ millions except for realized price and payable metal sold) 1 | Copper | Gold | Zinc | Silver | Molybdenum | Other | Total | ||||||||||||||
| Revenue from contracts 2 | 361.7 | 183.8 | 18.7 | 11.8 | 21.2 | - | 597.2 | ||||||||||||||
| Amortization of deferred revenue | - | 16.3 | - | 10.2 | - | - | 26.5 | ||||||||||||||
| Pricing and volume adjustments 3 | 4.4 | 16.1 | (0.1 | ) | 0.7 | (6.9 | ) | - | 14.2 | ||||||||||||
| Revenue, including mark-to-market on QP hedges 4 | 366.1 | 216.2 | 18.6 | 22.7 | 14.3 | - | 637.9 | ||||||||||||||
| Realized non-QP derivative mark-to-market 5 | - | - | - | - | - | - | - | ||||||||||||||
| By-product credits 4 | 366.1 | 216.2 | 18.6 | 22.7 | 14.3 | - | 637.9 | ||||||||||||||
| Payable metal in concentrate and doré sold 6 | 44,006 | 104,841 | 7,385 | 1,048,879 | 468 | - | - | ||||||||||||||
| Realized price 7 | 8,319 | 2,062 | 2,519 | 21.67 | - | - | - | ||||||||||||||
| Realized price 8 | 3.77 | - | 1.14 | - | - | - | - | ||||||||||||||
| Year ended December 31, 2023 | |||||||||||||||||||||
| (in $ millions except for realized price and payable metal sold) 1 | Copper | Gold | Zinc | Silver | Molybdenum | Other | Total | ||||||||||||||
| Revenue from contracts 2 | 1,065.8 | 463.0 | 76.6 | 35.6 | 79.4 | 0.2 | 1,720.6 | ||||||||||||||
| Amortization of deferred revenue | - | 39.7 | - | 32.7 | - | - | 72.4 | ||||||||||||||
| Pricing and volume adjustments 3 | (8.3 | ) | 22.9 | (1.7 | ) | 0.4 | (7.5 | ) | - | 5.8 | |||||||||||
| Revenue, including mark-to-market on QP hedges 4 | 1,057.5 | 525.6 | 74.9 | 68.7 | 71.9 | 0.2 | 1,798.8 | ||||||||||||||
| Realized non-QP derivative mark-to-market 5 | - | - | - | - | - | - | - | ||||||||||||||
| By-product credits 4 | 1,057.5 | 525.6 | 74.9 | 68.7 | 71.9 | 0.2 | 1,798.8 | ||||||||||||||
| Payable metal in concentrate and dore sold 6 | 124,996 | 276,893 | 28,779 | 3,145,166 | 1,462 | - | - | ||||||||||||||
| Realized price 7 | 8,460 | 1,898 | 2,603 | 21.85 | - | - | - | ||||||||||||||
| Realized price 8 | 3.84 | - | 1.18 | - | - | - | - | ||||||||||||||
1 Average realized price per unit sold may not calculate based on amounts presented in this table due to rounding.
2 As per financial statements.
3 Pricing and volume adjustments represents mark-to-market adjustments on provisionally priced sales, realized and unrealized changes to fair value for non-hedge derivative contracts and adjustments to originally invoiced weights and assays.
4 By-product credits subtotal is used in the calculated of cash cost per pound of copper and ounce of gold produced, net of by-product credits. Cash cost per pound of copper and per ounce of gold produced, net of by-product credits, are non-GAAP financial performance measures with no standardized definition under IFRS. For further information and a detailed reconciliation, please see the discussion under the "Non-GAAP Financial Performance Measures" section of this MD&A.
5 Derivative mark-to-market excludes mark-to-market on QP hedges.
6 Copper, zinc and molybdenum shown in metric tonnes and gold and silver shown in ounces.
7 Realized price for copper and zinc in $/metric tonne and realized price for gold and silver in $/oz.
8 Realized price for copper and zinc in $/lb.
Precious metals - stream sales and realized price breakdown
The following table shows a breakdown of realized prices for precious metals inclusive of stream and offtaker revenue. It further identifies the components of the realized price for stream revenues between the amortized drawdown rate and cash payment rate.
| (in $ millions except for realized price and payable metal sold) | Gold | Silver | |||||||||||||||||||||||
| Three months ended | Year ended | Three months ended | Year ended | ||||||||||||||||||||||
| Revenue | Dec. 31, 2024 | Dec. 31, 2023 | Dec. 31, 2024 | Dec. 31, 2023 | Dec. 31, 2024 | Dec. 31, 2023 | Dec. 31, 2024 | Dec. 31, 2023 | |||||||||||||||||
| Stream | 22.2 | 24.7 | 61.8 | 60.1 | 16.6 | 14.3 | 48.0 | 45.9 | |||||||||||||||||
| Offtaker | 193.6 | 191.5 | 689.7 | 465.4 | 10.0 | 8.4 | 38.0 | 22.8 | |||||||||||||||||
| Revenue, including mark-to-market on QP hedges 3 | 215.8 | 216.2 | 751.5 | 525.5 | 26.6 | 22.7 | 86.0 | 68.7 | |||||||||||||||||
| Payable metal sold | |||||||||||||||||||||||||
| Stream | oz | 17,873 | 19,925 | 49,822 | 48,522 | 796,849 | 665,191 | 2,310,394 | 2,140,243 | ||||||||||||||||
| Offtaker | oz | 74,861 | 84,917 | 285,520 | 228,371 | 353,669 | 383,688 | 1,239,422 | 1,004,923 | ||||||||||||||||
| Total payable metal sold | oz | 92,734 | 104,842 | 335,342 | 276,893 | 1,150,518 | 1,048,879 | 3,549,816 | 3,145,166 | ||||||||||||||||
| Deferred revenue drawdown rate1 | $/oz | 817 | 820 | 817 | 820 | 14.56 | 15.26 | 14.56 | 15.26 | ||||||||||||||||
| Cash rate2 | $/oz | 425 | 420 | 423 | 418 | 6.26 | 6.20 | 6.23 | 6.17 | ||||||||||||||||
| Stream realized price | $/oz | 1,242 | 1,240 | 1,240 | 1,238 | 20.82 | 21.46 | 20.79 | 21.43 | ||||||||||||||||
| Offtaker realized price | $/oz | 2,586 | 2,255 | 2,416 | 2,038 | 28.28 | 21.89 | 30.66 | 22.69 | ||||||||||||||||
| Realized price | $/oz | 2,327 | 2,062 | 2,241 | 1,898 | 23.12 | 21.67 | 24.23 | 21.85 | ||||||||||||||||
1 Deferred revenue drawdown rates for gold and silver do not include variable consideration adjustments.
2 The gold and silver cash rate for Peru increased by 1% from $400/oz and $5.90/oz effective August 4, 2019. Subsequently every year, on August 4, the cash rate will increase by 1% compounded. The gold and silver cash rate for Manitoba increased by 1% from $400/oz and $5.90/oz effective August 1, 2015. Subsequently every year, on August 1, the cash rate will increase by 1% compounded. The weighted average cash rate is disclosed.
3 Revenue, including mark-to-market on QP hedges is used in the calculation of realized price.
Subsequent to the variable consideration adjustment recorded on January 1, 2024, the deferred revenue amortization is recorded in Peru at $817 per ounce gold and $14.56 per ounce silver (December 31, 2023 - $820 per ounce gold and $15.26 per ounce silver).
Cost of Sales
Our detailed cost of sales is summarized as follows:
| (in $ millions) | Three months ended | Year ended | ||||||||||
| Dec. 31, 2024 | Dec. 31, 2023 | Dec. 31, 2024 | Dec. 31, 2023 | |||||||||
| Peru | ||||||||||||
| Mining | 47.3 | 30.4 | 145.5 | 122.6 | ||||||||
| Milling | 53.6 | 50.2 | 197.1 | 198.1 | ||||||||
| Changes in product inventory | (6.7 | ) | 8.0 | 9.6 | 28.1 | |||||||
| Depreciation and amortization | 83.2 | 85.7 | 270.3 | 275.7 | ||||||||
| G&A | 33.3 | 24.9 | 96.0 | 77.3 | ||||||||
| Inventory adjustments | (0.2 | ) | - | - | - | |||||||
| Freight, royalties and other charges | 20.7 | 22.3 | 69.2 | 68.3 | ||||||||
| Total Peru cost of sales | 231.2 | 221.5 | 787.7 | 770.1 | ||||||||
| Manitoba | ||||||||||||
| Mining | 42.6 | 40.3 | 169.4 | 161.1 | ||||||||
| Milling | 16.6 | 15.3 | 65.2 | 62.3 | ||||||||
| Changes in product inventory | (0.3 | ) | 12.8 | (2.0 | ) | 1.8 | ||||||
| Depreciation and amortization | 27.2 | 30.6 | 106.2 | 104.3 | ||||||||
| Inventory adjustments | 0.3 | 1.4 | 1.7 | 2.3 | ||||||||
| G&A | 13.0 | 8.6 | 48.7 | 35.2 | ||||||||
| Past service costs | 1.5 | - | 4.3 | - | ||||||||
| Freight, royalties and other charges | 7.0 | 6.8 | 25.4 | 23.7 | ||||||||
| Total Manitoba cost of sales | 107.9 | 115.8 | 418.9 | 390.7 | ||||||||
| British Columbia1 | ||||||||||||
| Mining | 18.2 | 19.0 | 79.1 | 48.3 | ||||||||
| Milling | 25.2 | 25.2 | 89.8 | 49.3 | ||||||||
| Changes in product inventory | (3.0 | ) | 8.5 | 3.8 | 8.5 | |||||||
| Depreciation and amortization | 11.8 | 5.5 | 50.1 | 11.7 | ||||||||
| G&A | 5.0 | 5.6 | 20.0 | 10.7 | ||||||||
| Inventory adjustments | 1.2 | - | 1.2 | - | ||||||||
| Freight, royalties and other charges | 3.0 | 4.3 | 16.8 | 8.2 | ||||||||
| Total British Columbia cost of sales | 61.4 | 68.1 | 260.8 | 136.7 | ||||||||
| Cost of sales | 400.5 | 405.4 | 1,467.4 | 1,297.5 | ||||||||
1 Copper Mountain mine results are stated at 100%. Hudbay owns 75% of Copper Mountain mine. As Copper Mountain was acquired on June 20, 2023, the results for the year ended December 31, 2023 represents the period from the acquisition date, June 20, 2023, through to the end of the fourth quarter of 2023.
Total cost of sales for the fourth quarter of 2024 was $400.5 million, reflecting a decrease of $4.9 million compared to the fourth quarter of 2023. British Columbia cost of sales decreased by $6.7 million primarily driven by the effect of an increase in finished concentrate inventory, lower mining and G&A costs partially offset by higher depreciation during the quarter. Peru cost of sales increased by $9.7 million in the fourth quarter of 2024, compared to the same period of 2023 mainly due higher mining and milling costs in line with higher production during the quarter partially offset by the effect of the increase in inventory versus the comparative 2023 period. Manitoba cost of sales decreased by $7.9 million in the fourth quarter of 2024, primarily as a result decrease in the relative change in finished goods inventory and lower depreciation and amortization during the quarter, compared to the same period of 2023.
Total cost of sales for the year ended December 31, 2024 was $1,467.4 million, reflecting an increase of $169.9 million from the same period in 2023 in part due to $124.1 million of incremental operating costs from British Columbia. In addition, Peru cost of sales increased by $17.6 million as a result of an increase of $11.0 million in profit sharing and higher mining, G&A and freight costs. Manitoba cost of sales increased by $28.2 million as a result of a $10.3 million increase in profit sharing and $13.1 million of higher mining, milling and depreciation as a result of higher production.
For details on unit operating costs, refer to the respective tables in the "Operations Review" section of this MD&A.
For the fourth quarter of 2024, other significant variances in expenses, compared to the same period in 2023, include the following:
- Net finance expenses decreased by $14.5 million primarily due to a $9.0 million decrease in the relative revaluation loss of the gold prepayment liability, a decrease of $7.6 million on mark-to-market losses from non-QP hedges, a decrease of $4.4 million from interest expense on long-term debt benefiting from the retirement of some senior notes, an increase of $3.3 million from interest income, a decrease of $1.4 million from withholding taxes, partially offset by an increase in foreign exchange loss of $13.1 million.
- Other expenses increased by $11.5 million primarily due to an increase of $7.6 million in the write-off of previously capitalized PP&E costs and the prior year benefited from an $8.1 million recovery from insurance and value added tax partially offset by a $4.5 million decrease in the amortization of certain community costs.
- Re-evaluation adjustment - environmental provision contributed a decrease of $31.5 million in expenses compared to the same period of 2023 due to the relative revaluation of the environmental reclamation provision on our Manitoba non-producing sites from changes in long term risk-free discount rates and inflation rates.
Given the long term nature of the reclamation cash flows, the related environmental reclamation provision is highly sensitive to changes in inflation rates and long-term risk-free discount rates and, as such, we may continue to experience significant quarterly environmental reclamation provision revaluations.
For the year 2024, other significant variances in expenses, compared to the same period in 2023, included the following:
- Net finance expenses increased by $3.4 million due to an increase in market-to-market losses of $9.1 million from non-QP hedges, a $3.3 million increase in interest expense on equipment financing and leases, a $15.7 million increase in net foreign exchange loss, partially offset by a decrease in mark-to-market loss of $6.0 million from investments, an increase of $7.6 million in interest income, a $6.4 million decrease in interest expense on long-term debt, a decrease of $3.8 million in withholding taxes and a decrease in the accretion of revenue streaming arrangement of $2.4 million.
- Selling and administrative expenses increased by $17.8 million reflecting a higher share-based compensation expense as a result of a comparative increase in share price during the current period along with incremental selling and administrative expenses incurred by the Copper Mountain mine.
- Other expenses increased by $19.1 million primarily due to an increase of $20.0 million in write-off of previously capitalized PP&E costs, net of capitalized accrued interest, primarily related to an expired option agreement in Arizona of $8.1 million and Copper Mountain PP&E writedowns of $16.0 million, and the prior year benefited from an $8.1 million of recovery from insurance and value added tax, a decrease of $6.9 million in acquisition costs related to the acquisition of Copper Mountain incurred in 2023 and a $2.0 million gain related to the renouncement of the flow-through share liability, net of provisions.
- Exploration expenses increased by $13.3 million primarily due to our planned Snow Lake exploration program consisting of modern geophysical programs and multi-phased drilling campaigns, much of which is funded by flow-through financing.
- Re-evaluation adjustment - environmental provision gain decreased by $7.9 million due to the same reasons as outlined above in the quarterly variance analysis.
Tax Expense
For the three months ended December 31, 2024, tax expense increased by $36.9 million compared to the same period in 2023. For the year ended December 31, 2024 tax expense increased by $101.5 million compared to the same period in 2023. The following table provides further details:
| (in $ millions) | Three months ended | Year ended | ||||||||||
| Dec. 31, 2024 | Dec. 31, 2023 | Dec. 31, 2024 | Dec. 31, 2023 | |||||||||
| Current tax expense - income tax | 52.2 | 45.2 | 119.9 | 83.1 | ||||||||
| Deferred tax expense (recovery) - income tax1 | 15.1 | (3.2 | ) | 13.9 | (19.6 | ) | ||||||
| Total income tax expense | 67.3 | 42.0 | 133.8 | 63.5 | ||||||||
| Current tax expense - mining tax | 19.2 | 7.5 | 57.0 | 22.0 | ||||||||
| Deferred tax (recovery) expense - mining tax1 | (2.1 | ) | (2.0 | ) | (7.0 | ) | (3.2 | ) | ||||
| Total mining tax expense | 17.1 | 5.5 | 50.0 | 18.8 | ||||||||
| Tax expense | 84.4 | 47.5 | 183.8 | 82.3 | ||||||||
1 Deferred tax expense (recovery) represents our draw down/increase of non-cash deferred income and mining tax assets/liabilities.
Income Tax Expense/Recovery
Applying the estimated Canadian statutory income tax rate of 26.7% to our net earnings before taxes of $251.6 million for the full year of 2024 would have resulted in a tax expense of approximately $67.2 million; however, we recorded an income tax expense of $133.8 million. The primary items causing our effective income tax rate to be different than the 26.7% estimated Canadian statutory income tax rate include:
- Foreign exchange on the translation of deferred tax balances to group currency resulted in a deferred tax expense of $26.2 million.
- The tax expense with respect to our foreign operations is recorded using an income tax rate other than the Canadian statutory income tax rate of 26.7%, resulting in a tax expense of $36.7 million.
Mining Tax Expense
For full year of 2024, we recorded a mining tax expense of $50.0 million. Effective mining tax rates can vary significantly based on the composition of our earnings and the expected amount of mining taxable profits. Corporate costs and other costs not related to mining operations are not deductible in computing mining profits. A brief description of how mining taxes are calculated in our various business units is discussed below.
Manitoba
The Province of Manitoba imposes mining tax on earnings related to the sale of mineral products mined in the Province of Manitoba (mining taxable profit) at the following rates:
- 10% of total mining taxable earnings if mining profit is C$50 million or less;
- Between mining earnings of C$50 and $C55 million, mining tax is equal to a minimum of C$5 million plus mining earnings less C$50 million multiplied by 65%;
- 15% of total mining taxable earnings if mining profits are between C$55 million and C$100 million;
- Between mining earnings of C$100 million and C$105 million, mining tax is equal to a minimum of C$15 million plus mining earnings less C$100 million multiplied by 57%; and
- 17% of total mining taxable earnings if mining profits exceed C$105 million.
We estimate that the deferred tax rate that will be applicable when temporary differences reverse will be approximately 10.0%.
Peru
The Peruvian government imposes two parallel mining tax regimes, the Special Mining Tax and the Modified Royalty, on companies' operating mining income on a sliding scale, with progressive rates ranging from 2.0% to 8.4% and 1.0% to 12.0%, respectively. Based on financial forecasts, we have recorded a deferred tax liability as at December 31, 2024, at the tax rate we expect to apply when temporary differences reverse.
British Columbia
The Province of British Columbia imposes a 13% net revenue tax on the sale of mineral products mined in the province of British Columbia after the mine owner has recovered the capital invested in the mine and its "Cumulative Expenditure Account" ("CEA") no longer has a balance. The tax is paid on the profit in excess of the capital that has been invested in the mine. British Columbia mineral tax is deductible for federal and provincial income tax purposes.
While there is a balance in the CEA account, the mine owner must pay a "Net Current Proceeds" ("NCP") tax of 2%. Any amounts paid as NCP can then be claimed in the future against net revenue taxes payable.
We estimate that the effective tax rate that will be applicable when temporary differences reverse will be approximately 9.49%.
LIQUIDITY AND CAPITAL RESOURCES
Total liquidity substantially increased by 76% to $1,007.8 million at December 31, 2024 from $573.7 million at the end of 2023.
As at December 31, 2024, our liquidity includes $541.8 million in cash, $40.0 million in short-term investments as well as undrawn total availability of $426.0 million under our revolving credit facilities.
Senior Unsecured Notes
During 2024, we purchased a total of $25.0 million of our 2026 Notes and $57.6 million of our 2029 Notes in the open market at a discount to par value. As at December 31, 2024, we had $575.0 million aggregate principal amount of 2026 Notes and $542.4 million aggregate principal amount of 2029 Notes.
Senior Secured Revolving Credit Facilities
We have two senior secured revolving credit facilities with total commitments of $450 million ("the Credit Facilities") for our Canadian and Peruvian businesses on substantially similar terms and conditions.
During 2024, we fully repaid $100 million of debt outstanding under our revolving credit facilities. As at December 31, 2024, there were nil cash drawings under the Credit Facilities and $24.0 million in letters of credit secured under the Canadian Facility.
As at December 31, 2024, we were in compliance with our covenants under the Credit Facilities.
During the fourth quarter, we proactively extended the Credit Facilities by three years from October 2025 to November 2028 and negotiated the flexibility to leave our 4.50% 2026 senior unsecured notes outstanding to maturity as we advance Copper World towards a sanctioning decision in accordance with the 3-P plan. The newly extended $450 million revolving credit facility, with the existing banking syndicate, includes an improved pricing grid reflecting the enhanced financial position of Hudbay, and features an accordion provision that provides Hudbay with the option to increase the facility by an additional $150 million at our discretion during the four-year tenor, providing additional financial flexibility.
C$130 Million Bilateral Letter of Credit Facility
We have a C$130.0 million bilateral letter of credit facility ("LC Facility") with a major Canadian financial institution. The LC Facility has no financial covenants and enables us to issue up to C$130.0 million of letters of credit to beneficiaries on an unsecured basis at attractive rates, including C$30.0 million sub-limit for financial letters of credit. As at December 31, 2024, the Manitoba business unit had drawn $52.7 million in letters of credit under the LC Facility.
Surety Bonds and Letters of Credit
As at December 31, 2024, the Arizona business unit had $18.4 million in surety bonds issued to support future reclamation and closure obligations and the Peru business unit had $126.1 million in letters of credit issued with various Peruvian financial institutions to support future reclamation and other operating matters. In addition, the British Columbia business unit had $45.6 million in surety bonds issued to support future reclamation and $1.0 million in surety bonds issued to support the hydro used at Copper Mountain mine. The British Columbia business unit also had $0.6 million in cash collateralized letters of credit issued with various Canadian financial institutions related to other operating matters.
Gold Prepayment Liability
During the fourth quarter of 2020, we entered into a gold forward sale and prepay transaction which generated $115.0 million in cash proceeds to pre-fund the expected capital requirements for the New Britannia gold mill refurbishment project. The transaction valued the future gold ounce delivery obligation at 79,954 gold ounces to be delivered in fixed monthly deliveries of 3,331 gold ounces over a 24-month period from January 2022 to December 2023, which period was extended to August 2024.
During the third quarter of 2024, we completed our final fixed monthly delivery in August and have now fully completed all delivery obligations under the gold prepayment liability.
Working Capital
Working capital increased by $375.5 million to $511.3 million from December 31, 2023 to December 31, 2024, primarily due to an increase in cash and cash equivalents of $292.0 million, a decrease in gold prepayment liability of $55.9 million, an increase in short-term investment of $40.0 million, an increase in trade and other receivables of $32.1 million mainly related to the timing of receiving statutory receivables, a decrease in deferred revenue of $24.6 million, an increase in prepaid and other expenses of $11.1 million and an increase in other financial assets and taxes receivable of $10.0 million. Partially offsetting these items was an increase in taxes payable of $47.3 million mainly as a result of higher mining taxes from higher taxable income, an increase in trades and other payable of $30.9 million and a decrease in inventories of $9.9 million.
Cash Flows
The following table summarizes our cash flows for the three months and year ended December 31, 2024 and December 31, 2023:
| (in $ millions) | Three months ended | Year ended | ||||||||||
| Dec. 31, 2024 | Dec. 31, 2023 | Dec. 31, 2024 | Dec. 31, 2023 | |||||||||
| Operating cash flow before change in non-cash working capital | 231.5 | 246.5 | 691.1 | 570.0 | ||||||||
| Change in non-cash working capital | 6.6 | (17.5 | ) | (24.9 | ) | (93.1 | ) | |||||
| Cash generated from operating activities | 238.1 | 229.0 | 666.2 | 476.9 | ||||||||
| Cash used in investing activities | (99.6 | ) | (82.5 | ) | (382.9 | ) | (271.8 | ) | ||||
| Cash (used in) generated from financing activities | (36.9 | ) | (141.8 | ) | 10.2 | (182.4 | ) | |||||
| Effect of movement in exchange rates on cash | (3.1 | ) | (0.1 | ) | (1.5 | ) | 1.4 | |||||
| Net increase in cash | 98.5 | 4.6 | 292.0 | 24.1 | ||||||||
Cash Flow from Operating Activities
Cash generated from operating activities was $238.1 million during the fourth quarter of 2024, an increase of $9.1 million compared to the same period in 2023. Operating cash flow before change in non-cash working capital was $231.5 million during the fourth quarter of 2024, reflecting a decrease of $15.0 million compared to the fourth quarter of 2023. The decrease in operating cash flows before change in working capital was primarily the result of lower sales volume of copper and gold which overcame the strong realized prices for those respective metals.
Year-to-date cash generated from operating activities was $666.2 million in 2024, an increase of $189.3 million compared to 2023. Operating cash flow before changes in non-cash working capital for the year ended December 31, 2024 was $691.1 million, an increase of $121.1 million compared to 2023. The increase in operating cash flow before changes in working capital was primarily the result of higher metal prices and gold sales volumes, as well as the incremental contribution margin from the Copper Mountain mine. This was partially offset by a significant increase in cash taxes paid of $132.5 million mainly at our Peru operations, compared to the same period in 2023.
Cash Flow from Investing and Financing Activities
During the fourth quarter of 2024, we spent $136.5 million in investing and financing activities, primarily driven by $96.9 million in capital expenditures, $30.5 million in interest paid on long-term debt, $11.0 million in capitalized lease and equipment financing payments, $4.8 million in other financing costs mainly related to our Credit Facilities and foreign withholding taxes and $2.7 million in community agreement payments. These cash outflows were partially offset by $4.0 million of interest income received.
In the full year 2024, we spent $372.7 million in investing and financing activities, primarily driven by $347.1 million in capital expenditures, $100.0 million in repayments on our revolving credit facilities, $81.9 million of our senior unsecured notes repurchased, net of discount, $67.9 million in interest paid on our long-term debt, $62.3 million full repayment of our gold prepayment liability, $41.6 million in capitalized lease and equipment financing payments, $40.0 million in short-term investments, $15.1 million in other financing costs mainly related to our Credit Facilities and foreign withholding taxes, the final $10.0 million deferred payment for the acquisition of a prior minority interest in Copper World, $9.1 million in community agreement payments and $5.5 million of dividends paid. These cash outflows were partially offset by $398.0 million of proceeds from equity issuance, net of transaction and issuance costs, $17.5 million of interest income and grants received and $4.4 million net proceeds from exercise of stock options and warrants.
Capital Expenditures
The following summarizes accrued and cash additions to capital assets for the periods indicated:
| Three months ended | Year ended | Guidance | |||||||||||||
| (in $ millions) | Dec. 31, 2024 | Dec. 31, 2023 | Dec. 31, 2024 | Dec. 31, 2023 | Annual 20242 | ||||||||||
| Peru sustaining capital expenditures1 | 29.9 | 36.8 | 124.4 | 132.1 | 130.0 | ||||||||||
| Manitoba sustaining capital expenditures | 12.5 | 19.1 | 45.6 | 55.8 | 55.0 | ||||||||||
| British Columbia sustaining capital expenditures3 | 29.2 | 19.1 | 123.1 | 30.2 | 105.0 | ||||||||||
| Total sustaining capital expenditures | 71.6 | 75.0 | 293.1 | 218.1 | 290.0 | ||||||||||
| Arizona capitalized costs4 | 13.4 | 5.5 | 28.9 | 21.3 | 45.0 | ||||||||||
| Peru growth capitalized expenditures | 0.5 | 0.1 | 0.8 | 12.1 | 2.0 | ||||||||||
| Manitoba growth capitalized expenditures | 2.3 | - | 7.0 | 13.5 | 10.0 | ||||||||||
| British Columbia growth capitalized expenditures | 4.7 | 1.2 | 8.1 | 1.2 | 5.0 | ||||||||||
| Capitalized exploration | 6.7 | 6.2 | 12.2 | 7.8 | 8.0 | ||||||||||
| Right-of-use asset and equipment financing additions | 42.3 | 0.2 | 96.5 | 21.4 | |||||||||||
| Grants received | (0.7 | ) | - | (3.1 | ) | - | |||||||||
| Community agreement additions | 12.7 | (0.2 | ) | 14.5 | 1.8 | ||||||||||
| Non-cash capitalized stripping | 6.2 | 3.5 | 24.5 | 8.8 | |||||||||||
| Rockcliff acquisition | - | - | - | 14.2 | |||||||||||
| Other capitalized costs | 3.7 | 3.4 | 3.7 | 3.6 | |||||||||||
| Total other capitalized expenditures | 91.8 | 19.9 | 193.1 | 105.7 | |||||||||||
| Total accrued capital additions | 163.4 | 94.9 | 486.2 | 323.8 | |||||||||||
| Reconciliation to cash capital additions: | |||||||||||||||
| Other capitalized costs2 | (60.5 | ) | (6.9 | ) | (132.4 | ) | (45.7 | ) | |||||||
| Change in capital accruals | (5.9 | ) | (6.9 | ) | (6.7 | ) | 3.0 | ||||||||
| Acquisition of property, plant & equipment - cash | 97.0 | 81.1 | 347.1 | 281.1 | |||||||||||
1 Peru sustaining capital expenditures include capitalized stripping costs.
2 Other capitalized costs primarily include right-of-use lease and equipment financing additions, which are excluded from guidance in 2024, in addition to non-cash deferred stripping
3 Includes 100% of Copper Mountain mine production. Hudbay owns 75% of Copper mountain mine. As Copper Mountain was acquired on June 20, 2023, the production for the year ended December 31, 2023 represents the period from the acquisition date, June 20, 2023, through to the end of the fourth quarter of 2023.
4 With the receipt of the Aquifer Protection Permit on August 29, 2024, we expect to commence activities related to the preparation of feasibility studies for Copper World. As a result, 2024 growth capital spending in Arizona has increased by an additional $25 million, compared to the original 2024 guidance of $20 million.
For the quarter and year ended December 31, 2024, total capital additions increased by $68.5 million and $162.4 million, respectively, compared to the same period in 2023, primarily due to sustaining capital expenditures at the Copper Mountain mine representing a full year of ownership in 2024 and in moving forward our plan for production improvements. In addition, a number of new leases and equipment financing transactions were signed mostly for the Copper Mountain mine. This was partially offset by reduced sustaining and growth capital expenditures in Manitoba and Peru.
Sustaining capital expenditures in Manitoba for the three months and year ended December 31, 2024 were $12.5 million and $45.6 million, respectively, representing a decrease of $6.6 million and $10.2 million, respectively, compared to the same periods in 2023 mostly due to lower capital development at Lalor. Sustaining capital expenditures in Peru for the three months and year ended December 31, 2024 were $29.9 million and $124.4 million, respectively, representing a decrease of $6.9 million and $7.7 million, respectively, compared to the same periods in 2023 as a result of the timing of various stripping campaigns and civil work projects. Sustaining capital expenditures in British Columbia for the three months and year ended December 31, 2024 were $29.2 million and $123.1 million, respectively, which included $20.9 million and $69.7 million, respectively, of capitalized stripping related to our planned three-year accelerated stripping campaign to access higher grade ore.
Growth capital spending in Manitoba for the three months and year ended December 31, 2024 was $2.3 million and $7.0 million, respectively, representing an increase of $2.3 million and a decrease of $6.5 million, respectively, compared to the same periods in 2023. The decrease for the full year mainly relates to the completion of the Stall mill recovery improvement project in 2023, partially offset by the development of an exploration access drift at 1901 in 2024. Growth capital expenditures in Peru for the three months and year ended December 31, 2024 were $0.5 million and $0.8 million, respectively, representing an increase of $0.4 million and a decrease of $11.3 million, respectively. The annual decrease mainly relates to the completion of the copper recovery improvement project in 2023. Arizona's capital expenditures for the three months and year ended December 31, 2024 were $13.4 million and $28.9 million, respectively, mainly related to ongoing carrying costs and feasibility preparation.
Capitalized exploration for the three months and year ended December 31, 2024 was $6.7 million and $12.2 million, respectively.
Total consolidated sustaining and growth capital expenditures in 2024 were approximately $10 million lower than our full year guidance of $360 million. This reflects continued financial discipline and certain capital deferrals to 2025.
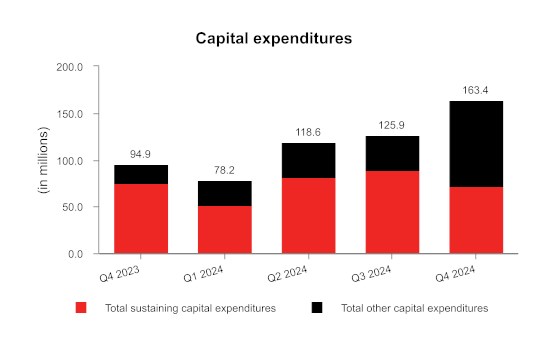
Capital Commitments
As at December 31, 2024, we had outstanding capital commitments in Canada of approximately $16.8 million, of which $1.6 million can be terminated, approximately $37.1 million in Peru primarily related to sustaining capital commitments and exploration option agreements, all of which can be terminated, and approximately $35.2 million in Arizona, primarily related to our Copper World project, none of which can be terminated.
Contractual Obligations
The following table summarizes our significant contractual obligations as at December 31, 2024:
| Total | Less than 12 months | 13 - 36 months | 37 - 60 months | More than 60 months |
Payment Schedule (in $ millions) | |||||
Long-term debt obligations1 | 1,318.6 | 62.5 | 661.1 | 595.0 | - |
Equipment financing and lease obligations | 203.4 | 71.8 | 82.7 | 30.9 | 18.0 |
Purchase obligation - capital commitments | 89.2 | 41.6 | 28.1 | 19.5 | - |
Purchase obligation - other commitments3 | 1,466.5 | 514.9 | 418.2 | 128.8 | 404.6 |
Pension and other employee future benefits obligations2 | 103.4 | 4.5 | 15.2 | 8.3 | 75.4 |
Community agreement obligations4, 5 | 99.0 | 26.1 | 17.0 | 8.3 | 47.6 |
Decommissioning and restoration obligations5 | 469.1 | 4.0 | 16.3 | 7.1 | 441.7 |
Total | 3,749.2 | 725.4 | 1,238.6 | 797.9 | 987.3 |
1 Long-term debt obligations include scheduled interest payments, as well as principal repayments
2 Discounted.
3 Primarily made up of trades payables, accrued liabilities, long-term agreements with operational suppliers, obligations for power purchases, concentrate handling and fleet and port services.
4 Represents community agreement obligations and various finalized land user agreements, including Pampacancha.
5 Undiscounted before inflation.
In addition to the contractual obligations included in the above payment schedule, we also have the following commitments which impact our financial position:
- A profit-sharing plan with most Manitoba employees;
- A profit-sharing plan with all Peru employees;
- Wheaton precious metals stream agreement for the Constancia mine;
- Government royalty payments related to the Constancia mines;
- Participation agreements related to the Copper Mountain mine, and
- Contracts related to future production and sales, such as royalties.
Outstanding Share Data
As of February 14, 2025, the final trading day prior to the date of this MD&A, there were 394,944,496 common shares of Hudbay issued and outstanding. In addition, there were 2,478,600 stock options and 60,544 common share purchase warrants outstanding.
FINANCIAL RISK MANAGEMENT
The Financial Risk Management risks in this MD&A are not exhaustive. Please also refer to the heading "Risk Factors" in our most recent Annual Information Form for a discussion of the additional risk factors that may affect Hudbay's business, operations and financial condition. In addition to those risks, we have identified the following other risks which may affect our consolidated financial statements in the future.
Metals Price Strategic Risk Management
Commodity prices are a key driver of our financial and operational results. Our strategic objective is to provide our investors with exposure to base metals prices, unless a reason exists to implement a hedging arrangement. From time to time, we maintain price protection programs and conduct commodity price risk management in line with Board-approved policies to reduce risk through the use of financial instruments.
In the normal course, we typically consider metal price hedging to manage the risk associated with provisional pricing terms in concentrate sales agreements and in connection with stream delivery obligations. We may also occasionally consider metal price hedging in accordance with Board approved policies to achieve strategic objectives, including: locking in favourable metal prices to ensure a minimum cash flow during or after the construction of a mine or during a period of reduced liquidity, to maintain profitable production of shorter life/higher cost operations or as part of a financing arrangement.
During the year, we entered into copper and zinc hedging transactions intended to manage the risk associated with provisional pricing terms in concentrate sales agreements.
As at December 31, 2024, we had 61.7 million pounds of net copper fixed for floating swaps outstanding at an average fixed receivable price of $4.19/lb associated with provisional pricing risk in concentrate sales agreements. These swaps settled beginning in January 2025 and will continue through May 2025.
As at December 31, 2024, we had 9.7 million pounds of net zinc fixed for floating swaps outstanding at an average fixed receivable price of $1.38/lb associated with provisional pricing risk in concentrate sales agreements. These swaps settled beginning in January 2025 and will continue through April 2025.
As at December 31, 2024, we had copper forward sales contracts at Copper Mountain for a total of 5.3 million pounds of copper production over the period from January 2025 to April 2025 at an average price of $3.95 per pound. Additionally, we had a zero-cost collar program for 6.6 million pounds copper production over the period from January 2025 to April 2025 at an average floor price of $3.88 per pound and an average cap price of $4.14 per pound.
From time to time, we enter into gold and silver forward sales contracts to hedge the commodity price risk associated with the future settlement of provisionally priced deliveries. We are generally obligated to deliver gold and silver to Wheaton Precious Metals Corp. ("Wheaton") prior to the determination of final settlement prices. These forward sales contracts are entered into at the time we deliver gold and silver to Wheaton, and are intended to mitigate the risk of subsequent adverse gold and silver price changes. Gains and losses resulting from the settlement of these derivatives are recorded directly to revenue, as the forward sales contracts do not achieve hedge accounting, and the associated cash flows are classified in operating activities. Our swap agreements are with counterparties we believe to be creditworthy and do not require us to provide collateral.
Carrying Values and Mine Plan Updates
At the end of each reporting period, Hudbay reviews its groups of non-financial assets to determine whether there are any indicators of impairment or impairment reversal. If any such indicator exists, the Company estimates the recoverable amount of the non-financial asset group in order to determine the extent of the impairment loss or reversal, if any. At December 31, 2024, the Company assessed whether there were impairment or impairment reversal indicators associated with the general business environment and known changes to business planning and found that there were no impairment or impairment reversal indicators.
There are a number of potential indicators that could trigger non-financial asset impairment or reversal of impairment in the future. One such potential indicator is a change to the life of mine ("LOM") plan for an asset, which we generally publish in the first quarter of every year. LOM plans incorporate management's best estimates of key assumptions which include future commodity prices, the value of mineral resources not included in the LOM plan, production based on current estimates of recoverable reserves, discount rates, future operating and capital costs and future foreign exchange rates.
There is a risk that certain assumptions in the updated LOM plans could give rise to an indicator of impairment or impairment reversal and cause an adjustment to the carrying value of the relevant assets and/or impact our financial statements.
Interest Rate and Foreign Exchange Risk Management
To the extent that we incur indebtedness at variable interest rates to fund our growth objectives, we may enter into interest rate hedging arrangements to manage our exposure to short-term interest rates. To the extent that we make commitments to capital expenditures denominated in foreign currencies, we may enter into foreign exchange forwards or acquire foreign currency outright, which may result in foreign exchange gains or losses in our consolidated statement of earnings.
At December 31, 2024, approximately $511.9 million of our cash was held in US dollars, approximately $26.2 million of our cash was held in Canadian dollars, and approximately $3.7 million of our cash was held in Peruvian soles.
Business Integration Risk with Copper Mountain
The ability to realize the benefits of the Copper Mountain transaction will depend in part on, building relationships with key stakeholders, stabilizing and optimizing the operation and successfully integrating functions, operations, procedures and personnel in a timely and efficient manner. It will also depend on Hudbay's ability to realize its updated mine plan (including the New Ingerbelle expansion) and the anticipated benefits from optimizing the operation.
There can be no assurance that management will be able to successfully complete the optimization of Copper Mountain's operations, achieve the updated mine plan and fully realize the anticipated operational and financial benefits the acquisition.
Political and Regulatory Changes - Trade
Since the Company operates across several jurisdictions, certain political and regulatory changes in Canada, the US, Peru, and other countries could negatively impact our operations and financial results. Recent and upcoming national elections, including those in Canada and the US, have brought, or may bring, new political leadership with substantially different political, social, and economic policy priorities on both domestic and foreign policy matters, including with respect to critical minerals, trade and tariffs. Political and regulatory risks such as these could have an impact on our operations and financial results. Although we do not currently sell any concentrate or precious metal doré into the United States from Canada, and the implementation or expansion of tariffs on exported and/or imported products could negatively affect supply chains, the price of consumables and the cost of mine development and construction.
TREND ANALYSIS AND QUARTERLY REVIEW
A detailed quarterly and annual summary of financial and operating performance can be found in the "Summary of Results" section at the end of this MD&A. The following table sets forth selected consolidated financial information for each of our eight most recently completed quarters:
| (in $ millions, except per share amounts, production on a copper equivalent basis and average realized copper price) | 2024 | 2023 | ||||||||||||||||||||||
| Q42 | Q3 | Q2 | Q1 | Q42 | Q33 | Q2 | Q1 | |||||||||||||||||
| Production on a copper equivalent basis (tonnes) | 77,769 | 60,895 | 47,164 | 62,120 | 77,951 | 71,335 | 37,530 | 38,614 | ||||||||||||||||
| Average realized copper price ($/lb) | 4.09 | 4.24 | 4.56 | 3.91 | 3.77 | 3.77 | 3.89 | 3.98 | ||||||||||||||||
| Average realized gold price ($/oz) | 2,327 | 2,582 | 2,222 | 1,941 | 2,062 | 1,738 | 1,810 | 1,881 | ||||||||||||||||
| Revenue | 584.9 | 485.8 | 425.5 | 525.0 | 602.2 | 480.5 | 312.2 | 295.2 | ||||||||||||||||
| Gross profit | 184.4 | 139.8 | 77.6 | 152.0 | 196.8 | 106.4 | 22.9 | 66.5 | ||||||||||||||||
| Income (loss) before tax | 103.7 | 79.7 | 0.4 | 67.8 | 81.0 | 84.1 | (30.7 | ) | 17.4 | |||||||||||||||
| Net income (loss) | 19.3 | 50.4 | (20.4 | ) | 18.5 | 33.5 | 45.5 | (14.9 | ) | 5.5 | ||||||||||||||
| Net income (loss) - attributable | 21.2 | 49.8 | (16.6 | ) | 22.4 | 30.7 | 45.1 | (14.9 | ) | 5.5 | ||||||||||||||
| Adjusted net earnings (loss)1 - attributable | 70.3 | 50.3 | 0.1 | 59.4 | 68.6 | 24.3 | (18.3 | ) | 0.1 | |||||||||||||||
| Earnings (loss) per share attributable: | ||||||||||||||||||||||||
| Basic and diluted | 0.05 | 0.13 | (0.05 | ) | 0.06 | 0.09 | 0.13 | (0.05 | ) | 0.02 | ||||||||||||||
| Adjusted net earnings (loss)1 per share - attributable | 0.18 | 0.13 | 0.00 | 0.17 | 0.20 | 0.07 | (0.07 | ) | 0.00 | |||||||||||||||
| Operating cash flow before change in non-cash working capital | 231.5 | 186.3 | 122.0 | 147.5 | 246.5 | 182.0 | 55.9 | 85.6 | ||||||||||||||||
| Adjusted EBITDA1 | 257.3 | 206.2 | 145.0 | 214.2 | 274.4 | 190.7 | 81.2 | 101.9 | ||||||||||||||||
| Adjusted EBITDA LTM1 | 822.5 | 839.8 | 824.3 | 760.5 | 647.8 | 498.5 | 407.1 | 467.3 | ||||||||||||||||
1 Adjusted net earnings (loss) - attributable to owners, adjusted net earnings (loss) per share - attributable to owners, adjusted EBITDA, and adjusted EBITDA last twelve months ("LTM") are non-GAAP financial performance measure with no standardized definition under IFRS. For further information and a detailed reconciliation, please see the discussion under the "Non-GAAP Financial Performance Measures" section of this MD&A.
2 Annual consolidated results may not calculate based on amounts presented in this table due to rounding.
3 The Company acquired Copper Mountain on June 20, 2023, and Q3 2023 represented the first full quarter of Copper Mountain production included in the Company's financial results.
On a quarterly basis, the Company's revenue is primarily impacted by metal prices, production mix and sales volumes of the key metals we produce. In addition to these factors, gross profit, net earnings (loss) attributable, earnings (loss) per share attributable, operating cash flow before change in non-cash working capital and adjusted EBITDA are also impacted by input costs. Net earnings (loss) and earnings (loss) per share are further impacted by net finance expense and re-evaluation adjustments of our closed site environmental provision.
During the fourth quarter of 2024, copper equivalent production increased to 77,769 tonnes. Our Manitoba and Peru operations delivered strong quarterly production as expected and unlocked higher grade helping the Company exceed 2024 annual gold guidance. Strong cost control and meaningful exposure to gold by-product credits resulted in consolidated cash cost1 and sustaining cash cost1 per pound of copper produced, net of by-product credits1, in the fourth quarter of 2024 of $0.45 and $1.37, respectively, contributing to our outperformance of our improved full year 2024 cost guidance. Furthermore, the settlement of the gold prepayment liability in the third quarter of 2024, allowed Hudbay to capitalize on surging gold prices. Since acquiring Copper Mountain in June 2023, we have moved to optimization efforts which have been focused on ramping up the mining fleet to execute a planned accelerated stripping campaign to gain access to higher grades, as well as plant improvement initiatives to improve mill reliability and recoveries. See "Financial Risk Management - Business Integration Risk with Copper Mountain" above for further details.
During the third quarter of 2024, profitability and cash flows grew compared to the second quarter of 2024. This strength was attributable in part to higher gold, copper and zinc production compared to the second quarter of 2024, along with returning strength in commodity prices including record gold prices. These impacts offset lower planned mined grades observed in Peru in the third quarter of 2024 and the higher cash mining taxes paid in Peru resulting from higher profitability over the past several quarters. Strong operating cost control continued into the third quarter of 2024 resulting from a number of operational initiatives and high levels of mill throughput being experienced throughout the business.
During the second quarter of 2024, realized copper and gold prices continued to climb which overcame the decline in sales volumes of concentrate compared to the first quarter of 2024. Expected lower mined grades observed for the same metals in Peru and Manitoba were the primary factor for the decline in production since the first quarter of the year. Cost control remained favourable as we continued to track within cost guidance given the expected cadence in the year's production profile. Higher mining taxes continued as we experienced higher profitability over the past several quarters. Lastly, volatile inter-period copper and gold prices led to relatively high mark-to-market adjustments for our strategic non-QP hedging program and high share prices for our common shares led to higher share-based compensation expenses. This led to a total of $19.5 million in mark-to-market adjustments to be added back in our adjusted net earnings - attributable to owners measure.
The first quarter of 2024 and the fourth quarter of 2023 reflected the continuation of strong copper, gold and silver production that commenced in the third quarter of 2023. The increase in copper, gold and silver prices in the first quarter of 2024 also contributed to strong revenue and profitability in the quarter.
Third quarter of 2023 results reflected significantly higher copper and gold production and sales volumes from the high grade zones of the Pampacancha deposit and higher gold and copper grade zones at Lalor resulting in a significant increase in our revenues, gross profits and earnings.
The second quarter of 2023 benefited from the drawdown of higher-than-normal unsold copper concentrate inventory levels in Peru that had built up due to supply chain disruptions during a short period of social and political unrest in the first quarter of 2023.
Gold prices during the first quarter of 2023 averaged levels not seen since 2020, which positively impacted gross profit during the quarter. Social and political unrest in Peru resulted in road blockades causing logistics and supply chain disruptions until mid-February 2023 and led to a buildup of copper concentrate inventory above normal operating levels, affecting overall revenues and net earnings attributable in the first quarter.
The following table sets forth selected consolidated financial information for each of the three most recently completed years:
(in $ millions, except for earnings (loss) per share, dividends declared per share, production on a copper equivalent basis and average realized copper price) | 2024 | 2023 | 2022 |
Production on a copper equivalent basis (tonnes) | 247,948 | 225,430 | 178,970 |
Average realized copper price ($/lb) | 4.18 | 3.84 | 3.94 |
Revenue | 2,021.2 | 1,690.0 | 1,461.4 |
Gross profit | 553.8 | 392.5 | 276.9 |
Income before tax | 251.6 | 151.8 | 95.8 |
Net income | 67.8 | 69.5 | 70.4 |
Adjusted net earnings - attributable 1 | 181.4 | 69.0 | 26.4 |
Earnings per share attributable: |
|
|
|
Basic and diluted | 0.20 | 0.22 | 0.27 |
Adjusted net earnings 1 per share - attributable | 0.48 | 0.23 | 0.10 |
Total assets | 5,487.6 | 5,312.6 | 4,325.9 |
Operating cash flow before precious metals stream deposit and changes in non-cash working capital | 691.1 | 570.0 | 391.7 |
Adjusted EBITDA1 | 822.5 | 647.8 | 475.9 |
Total non-current financial liabilities2 | 1,266.2 | 1,400.7 | 1,281.5 |
Dividends declared per share - C$3 | 0.02 | 0.02 | 0.02 |
1 Adjusted net earnings - attributable, adjusted net earnings per share - attributable, and adjusted EBITDA are non-GAAP financial performance measure with no standardized definition under IFRS. For further information and a detailed reconciliation, please see the discussion under the "Non-GAAP Financial Performance Measures" section of this MD&A.
2 Total non-current financial liabilities consists of non-current other financial liabilities, lease liabilities and long-term debt.
3 Dividend paid during March and September of each year.
We achieved copper equivalent production of 247,948 tonnes. Record copper equivalent production along with strong metal prices resulted in record annual revenue of $2,021.2 million and record annual adjusted EBITDA of $822.5 million. Our enhanced operating platform delivered a strong consolidated annual performance with record annual gold production exceeding 2024 consolidated guidance. The completion of planned stripping activities at Pampacancha in Peru unlocked higher copper and gold grades. In addition, record gold production was achieved in Manitoba in 2024 through a combination of higher metallurgical recoveries at New Britannia and Stall Mills, despite processing lower gold grades year-over-year. Since acquiring Copper Mountain in June 2023, we have shifted to optimization efforts which have been focused on ramping up the mining fleet to execute a planned accelerated stripping campaign to gain access to higher grades, as well as plant improvement initiatives to improve mill reliability and recoveries.
Despite the planned closure of the 777 mine in June 2022, we achieved record production on a copper equivalent basis during 2024 due to additional production from our recently acquired Copper Mountain mine as well a significantly higher copper and gold production from mining the high grade zones of the Pampacancha deposit and higher gold and copper grade zones at Lalor. Operating cash flow before change in non-cash working capital increased by $178.3 million to $570.0 million in 2023 mainly driven by record metal production during the year.
NON-GAAP FINANCIAL PERFORMANCE MEASURES
Adjusted net earnings (loss) attributable to owners, adjusted net earnings (loss) per share attributable to owners, adjusted EBITDA, realized prices, net debt, net debt to adjusted EBITDA, cash cost, sustaining and all-in sustaining cash cost per pound of copper produced, cash cost and sustaining cash cost per ounce of gold produced, combined unit cost and ratios based on these measures are non-GAAP performance measures. These measures do not have a meaning prescribed by IFRS and are therefore unlikely to be comparable to similar measures presented by other issuers. These measures should not be considered in isolation or as a substitute for measures prepared in accordance with IFRS and are not necessarily indicative of gross profit or cash flow from operations as determined under IFRS. Other companies may calculate these measures differently.
Management believes adjusted net earnings (loss) attributable to owners and adjusted net earnings (loss) per share attributable to owners provides an alternate measure of the Company's performance for the current period and gives insight into its expected performance in future periods. These measures are used internally by the Company to evaluate the performance of its underlying operations and to assist with its planning and forecasting of future operating results. As such, the Company believes these measures are useful to investors in assessing the Company's underlying performance. We provide adjusted EBITDA to help users analyze our results and to provide additional information about our ongoing cash generating potential in order to assess our capacity to service and repay debt, carry out investments and cover working capital needs. Net debt is shown because it is a performance measure used by the Company to assess our financial position. Net debt to adjusted EBITDA is shown because it is a performance measure used by the Company to assess our financial leverage and debt capacity. Realized price is shown to understand the average realized price of metals sold to third parties in each reporting period. Cash cost, sustaining and all-in sustaining cash cost per pound of copper produced are shown because we believe they help investors and management assess the performance of our operations, including the margin generated by the operations and the Company. Cash cost and sustaining cash cost per ounce of gold produced are shown because we believe they help investors and management assess the performance of our Manitoba operations. Combined unit cost is shown because we believe it helps investors and management assess our cost structure and margins that are not impacted by variability in by-product commodity prices.
Adjusted Net Earnings - Attributable to owners
Adjusted net earnings attributable to owners represents net earnings (loss) excluding certain impacts such as mark-to-market adjustments, foreign exchange (gains) loss, revaluation adjustment - environmental provisions for closed sites, variable consideration adjustment related to stream agreements, impairment charges and reversal of impairment charges on assets, (gain) loss on disposal of assets, other items that are not indicative of the underlying operating performance of our core business; and tax effect and non-controlling interest of the previously discussed items. These measures are not necessarily indicative of net earnings (loss) as determined under IFRS. The following table provides a reconciliation of net earnings and non-controlling interest per the consolidated statements of income, to adjusted net earnings attributable to owners of the Company for the year ended December 31, 2024 and 2023.
| Three months ended | Year ended | |||||||||||
| (in $ millions) | Dec. 31, 2024 | Dec. 31, 2023 | Dec. 31, 2024 | Dec. 31, 2023 | ||||||||
| Net earnings for the period | 19.3 | 33.5 | 67.8 | 69.5 | ||||||||
| Tax expense | 84.4 | 47.5 | 183.8 | 82.3 | ||||||||
| Earnings before tax | 103.7 | 81.0 | 251.6 | 151.8 | ||||||||
| Adjusting items: | ||||||||||||
| Mark-to-market adjustments1 | (10.3 | ) | 12.7 | 27.1 | 22.1 | |||||||
| Foreign exchange loss | 17.4 | 4.2 | 21.0 | 5.3 | ||||||||
| Re-evaluation adjustment - environmental provision | 2.5 | 34.0 | (3.5 | ) | (11.4 | ) | ||||||
| Variable consideration adjustment - stream revenue and accretion | - | - | 4.0 | (5.0 | ) | |||||||
| Inventory adjustments | 1.3 | 1.4 | 2.9 | 2.3 | ||||||||
| Premium paid on redemption of notes | - | 2.2 | - | 2.2 | ||||||||
| Acquisition related costs | - | - | - | 6.9 | ||||||||
| Insurance recovery | - | (4.2 | ) | - | (4.2 | ) | ||||||
| Value-added-tax recovery | - | (3.9 | ) | - | (3.9 | ) | ||||||
| Write off fair value of the Copper Mountain Bonds | - | (1.0 | ) | - | (1.0 | ) | ||||||
| Restructuring charges | - | 0.6 | 1.2 | 2.9 | ||||||||
| Reduction of obligation to renounce flow-through share expenditures, net of provisions | 1.0 | - | (2.0 | ) | - | |||||||
| Write-down/loss on disposal of PP&E | 14.1 | 6.6 | 27.4 | 7.4 | ||||||||
| Adjusted earnings before income taxes | 129.7 | 133.6 | 329.7 | 175.4 | ||||||||
| Tax expense | (84.4 | ) | (47.5 | ) | (183.8 | ) | (82.3 | ) | ||||
| Tax impact of adjusting items | 23.4 | (14.8 | ) | 30.8 | (20.6 | ) | ||||||
| Adjusted net earnings | 68.7 | 71.3 | 176.7 | 72.5 | ||||||||
| Adjusted net earnings attributable to non-controlling interest: | ||||||||||||
| Net loss (earnings) for the period | 1.9 | (2.8 | ) | 8.9 | (3.2 | ) | ||||||
| Adjusting items, including tax impact | (0.3 | ) | 0.4 | (4.2 | ) | (0.3 | ) | |||||
| Adjusted net earnings - attributable to owners | 70.3 | 68.9 | 181.4 | 69.0 | ||||||||
| Adjusted net earnings ($/share) - attributable to owners | 0.18 | 0.20 | 0.48 | 0.23 | ||||||||
| Basic weighted average number of common shares outstanding (millions) | 394.0 | 349.1 | 376.8 | 310.8 | ||||||||
1 Includes changes in fair value of the gold prepayment liability, Canadian junior mining investments, other financial assets and liabilities at fair value through net earnings and share-based compensation expenses (recoveries). Also includes gains and losses on disposition of investments.
After adjusting reported net earnings for those items not considered representative of the Company's core business or indicative of future operations, the Company had adjusted net earnings - attributable in the fourth quarter of 2024 of $70.3 million or 0.18 earnings per share.
Adjusted EBITDA
Adjusted EBITDA is net earnings before net finance expense/income, tax expense/recoveries, depreciation and amortization of property, plant and equipment and deferred revenue, as well as certain other adjustments. We calculate adjusted EBITDA by excluding certain adjustments included within our adjusted net earnings attributable measure which we believe reflects the underlying performance of our core operating activities. The measure also removes the impact of non-cash items and financing costs that are not associated with measuring the underlying performance of our operations. However, our adjusted EBITDA is not the measure defined as EBITDA under our senior notes or revolving credit facilities and may not be comparable with performance measures with the same name reported by other companies. Adjusted EBITDA should not be considered as a substitute for earnings, which is calculated in accordance with IFRS. We provide adjusted EBITDA to help users analyze our results and to provide additional information about our ongoing cash generating potential in order to assess our capacity to service and repay debt, carry out investments and cover working capital needs.
The following table presents the reconciliation of earnings per the consolidated statements of income, to adjusted EBITDA for the three months ended and year ended December 31, 2024 and 2023:
| Three months ended | Year ended | |||||||||||
| (in $ millions) | Dec. 31, 2024 | Dec. 31, 2023 | Dec. 31, 2024 | Dec. 31, 2023 | ||||||||
| Net earnings for the period | 19.3 | 33.5 | 67.8 | 69.5 | ||||||||
| Add back: | ||||||||||||
| Tax expense | 84.4 | 47.5 | 183.8 | 82.3 | ||||||||
| Net finance expense | 34.4 | 48.9 | 148.7 | 145.3 | ||||||||
| Other expense | 22.1 | 10.6 | 57.4 | 38.3 | ||||||||
| Depreciation and amortization | 122.2 | 121.9 | 426.6 | 391.7 | ||||||||
| Amortization of deferred revenue and variable consideration adjustment | (26.2 | ) | (26.5 | ) | (70.5 | ) | (77.3 | ) | ||||
| Adjusting items (pre-tax): | ||||||||||||
| Re-evaluation adjustment - environmental provision | 2.5 | 34.0 | (3.5 | ) | (11.4 | ) | ||||||
| Inventory adjustments | 1.3 | 1.4 | 2.9 | 2.3 | ||||||||
| Option agreement proceeds (Marubeni) | - | - | (0.4 | ) | - | |||||||
| Realized loss on non-QP hedges | (4.2 | ) | - | (8.9 | ) | - | ||||||
| Share-based compensation expense 1 | 1.5 | 3.1 | 18.6 | 7.1 | ||||||||
| Adjusted EBITDA | 257.3 | 274.4 | 822.5 | 647.8 | ||||||||
1 Share-based compensation expense reflected in cost of sales and selling and administrative expenses.
Net Debt
The following table presents our calculation of net debt as at December 31, 2024 and December 31, 2023:
| (in $ millions) | Dec. 31, 2024 | Dec. 31, 2023 | ||||
| Total long-term debt | 1,107.5 | 1,287.5 | ||||
| Cash and cash equivalents | (541.8 | ) | (249.8 | ) | ||
| Short-term investments | (40.0 | ) | - | |||
| Net debt | 525.7 | 1,037.7 |
Net Debt to Adjusted EBITDA Ratio
The following table presents our calculation of net debt to adjusted EBITDA, both metrics have been reconciled above to the most comparable IFRS measure, as at December 31, 2024 and December 31, 2023:
| (in $ millions, except net debt to adjusted EBITDA ratio) | Dec. 31, 2024 | Dec. 31, 2023 | ||||
| Net debt | 525.7 | 1,037.7 | ||||
| Adjusted EBITDA for the last twelve months | 822.5 | 647.8 | ||||
| Net debt to adjusted EBITDA | 0.6 | 1.6 |
Cash Cost, Sustaining and All-in Sustaining Cash Cost (Copper Basis)
Cash cost per pound of copper produced ("cash cost") is a non-GAAP measure that management uses as a key performance indicator to assess the performance of our operations. Our calculation designates copper as our primary metal of production as it has been the largest component of revenues. The calculation is presented in four manners:
- Cash cost, before by-product credits - This measure is gross of by-product revenues and is a function of the efforts and costs incurred to mine and process all ore mined. However, the measure divides this aggregate cost over only pounds of copper produced, our primary metal of production. This measure is generally less volatile from period to period, as it is not affected by changes in the price received for by-product metals. It is, however, affected by the relative mix of copper concentrate and zinc concentrate production, where an increase in production of zinc concentrate will tend to result in an increase in cash cost under this measure.
- Cash cost, net of by-product credits - In order to calculate the net cost to produce and sell copper, the net of by-product credits measure subtracts the revenues realized from the sale of the metals other than copper. The by-product revenues from zinc, gold, and silver are significant and are integral to the economics of our operations. The economics that support our decision to produce and sell copper would be different if we did not receive revenues from the other significant metals being extracted and processed. This measure provides management and investors with an indication of the minimum copper price consistent with positive operating margins, assuming realized by-product metal prices are consistent with those prevailing during the reporting period. It also serves as an important operating statistic that management and investors utilize to measure our operating performance versus that of our competitors. However, it is important to understand that if by-product metal prices decline alongside copper prices, the cash cost net of by-product credits would increase, requiring a higher copper price than that reported to maintain positive cash flows and operating margins.
- Sustaining cash cost, net of by-product credits - This measure is an extension of cash cost that includes cash sustaining capital expenditures, including payments on capitalized leases, capitalized sustaining exploration, net smelter returns royalties, payments on certain long-term community agreements, as well as accretion and amortization for expected decommissioning activities for producing assets. It does not include corporate selling and administrative expenses. It provides a more fulsome measurement of the cost of sustaining production than cash cost, which is focused on operating costs only.
- All-in sustaining cash cost, net of by-product credits - This measure is an extension of sustaining cash cost that includes corporate G&A, regional costs, accretion and amortization for community agreements relating to current operations, and accretion for expected decommissioning activities for non-producing sites. Due to the inclusion of corporate selling and administrative expenses, all-in sustaining cash cost is presented on a consolidated basis only.
The tables below present a detailed build-up of cash cost and sustaining cash cost, net of by-product credits, by business unit in addition to consolidated all-in sustaining cash cost, net of by-product credits, and reconciliations between cash cost, net of by-product credits, to the most comparable IFRS measures of cost of sales for the three months and year ended December 31, 2024 and 2023. Cash cost, net of by-product credits may not calculate exactly based on amounts presented in the tables below due to rounding.
| Consolidated | Three months ended | Year ended | ||||||||||
| (in thousands) | Dec. 31, 2024 | Dec. 31, 2023 | Dec. 31, 2024 | Dec. 31, 2023 | ||||||||
| Peru | 74,931 | 73,209 | 218,260 | 221,536 | ||||||||
| Manitoba | 7,379 | 8,234 | 27,637 | 26,795 | ||||||||
| British Columbia | 13,067 | 18,755 | 58,215 | 41,995 | ||||||||
| Net pounds of copper produced1 | 95,377 | 100,198 | 304,112 | 290,326 | ||||||||
1 Contained copper in concentrate.
| Consolidated | Three months ended | Year ended | ||||||||||||||||||||||
| Dec. 31, 2024 | Dec. 31, 2023 | Dec. 31, 2024 | Dec. 31, 2023 | |||||||||||||||||||||
| Cash cost per pound of copper produced | $ millions | $/lb | $ millions | $/lb | $ millions | $/lb | $ millions | $/lb | ||||||||||||||||
| Cash cost, before by-product credits | 308.6 | 3.23 | 287.2 | 2.87 | 1,107.3 | 3.64 | 972.7 | 3.35 | ||||||||||||||||
| By-product credits | (265.5 | ) | (2.78 | ) | (271.8 | ) | (2.71 | ) | (967.4 | ) | (3.18 | ) | (741.3 | ) | (2.55 | ) | ||||||||
| Cash cost, net of by-product credits | 43.1 | 0.45 | 15.4 | 0.16 | 139.9 | 0.46 | 231.4 | 0.80 | ||||||||||||||||
| Consolidated | Three months ended | Year ended | ||||||||||||||||||||||
| Dec. 31, 2024 | Dec. 31, 2023 | Dec. 31, 2024 | Dec. 31, 2023 | |||||||||||||||||||||
| Cash cost per pound of copper produced | $ millions | $/lb | $ millions | $/lb | $ millions | $/lb | $ millions | $/lb | ||||||||||||||||
| Mining | 108.1 | 1.13 | 89.7 | 0.89 | 394.0 | 1.30 | 332.0 | 1.14 | ||||||||||||||||
| Milling | 95.4 | 1.00 | 90.7 | 0.91 | 352.1 | 1.16 | 309.7 | 1.07 | ||||||||||||||||
| G&A | 50.6 | 0.53 | 38.8 | 0.39 | 162.8 | 0.54 | 122.6 | 0.42 | ||||||||||||||||
| Onsite costs | 254.1 | 2.66 | 219.2 | 2.19 | 908.9 | 3.00 | 764.3 | 2.63 | ||||||||||||||||
| Treatment & refining | 25.9 | 0.27 | 35.7 | 0.36 | 97.3 | 0.31 | 113.7 | 0.39 | ||||||||||||||||
| Freight & other | 28.6 | 0.30 | 32.3 | 0.32 | 101.1 | 0.33 | 94.7 | 0.33 | ||||||||||||||||
| Cash cost, before by-product credits | 308.6 | 3.23 | 287.2 | 2.87 | 1,107.3 | 3.64 | 972.7 | 3.35 | ||||||||||||||||
| Consolidated | Three months ended | Year ended | ||||||||||||||||||||||
| Dec. 31, 2024 | Dec. 31, 2023 | Dec. 31, 2024 | Dec. 31, 2023 | |||||||||||||||||||||
| Supplementary cash cost information | $ millions | $/lb 1 | $ millions | $/lb 1 | $ millions | $/lb1 | $ millions | $/lb1 | ||||||||||||||||
| By-product credits2: | ||||||||||||||||||||||||
| Zinc | 16.1 | 0.17 | 18.6 | 0.18 | 69.9 | 0.23 | 74.9 | 0.26 | ||||||||||||||||
| Gold3 | 212.9 | 2.23 | 216.2 | 2.16 | 747.8 | 2.46 | 525.6 | 1.80 | ||||||||||||||||
| Silver3 | 26.6 | 0.28 | 22.7 | 0.23 | 86.0 | 0.28 | 68.7 | 0.24 | ||||||||||||||||
| Molybdenum & other | 9.9 | 0.10 | 14.3 | 0.14 | 63.7 | 0.21 | 72.1 | 0.25 | ||||||||||||||||
| Total by-product credits | 265.5 | 2.78 | 271.8 | 2.71 | 967.4 | 3.18 | 741.3 | 2.55 | ||||||||||||||||
| Reconciliation to IFRS: | ||||||||||||||||||||||||
| Cash cost, net of by-product credits | 43.1 | 15.4 | 139.9 | 231.4 | ||||||||||||||||||||
| By-product credits | 265.5 | 271.8 | 967.4 | 741.3 | ||||||||||||||||||||
| Treatment and refining charges | (25.9 | ) | (35.7 | ) | (97.3 | ) | (113.7 | ) | ||||||||||||||||
| Inventory adjustments | 1.3 | 1.4 | 2.9 | 2.3 | ||||||||||||||||||||
| Share-based compensation expense | 0.7 | 0.3 | 1.9 | 0.6 | ||||||||||||||||||||
| Past service costs | 1.5 | - | 4.3 | - | ||||||||||||||||||||
| Change in product inventory | (10.0 | ) | 29.3 | 11.4 | 38.4 | |||||||||||||||||||
| Royalties | 2.1 | 1.1 | 10.3 | 5.5 | ||||||||||||||||||||
| Depreciation and amortization4 | 122.2 | 121.8 | 426.6 | 391.7 | ||||||||||||||||||||
| Cost of sales5 | 400.5 | 405.4 | 1,467.4 | 1,297.5 | ||||||||||||||||||||
1 Per pound of copper produced.
2 By-product credits are computed as revenue per financial statements, including amortization of deferred revenue and pricing and volume adjustments. For more information, please see the realized price reconciliation table on page 43 of this MD&A for these figures.
3 Gold and silver by-product credits do not include variable consideration adjustments with respect to stream arrangements. Variable consideration adjustments are cumulative adjustments to gold and silver stream deferred revenue primarily associated with the net change in mineral reserves and resources or amendments to the mine plan that would change the total expected deliverable ounces under the precious metal streaming arrangement. For the year ended December 31, 2024 the variable consideration adjustments amounted loss of $3.8 million (year ended December 31, 2023 - income of $4.9 million).
4 Depreciation is based on concentrate sold.
5 As per consolidated financial statements.
| Peru | Three months ended | Year ended | ||||||||||
| (in thousands) | Dec. 31, 2024 | Dec. 31, 2023 | Dec. 31, 2024 | Dec. 31, 2023 | ||||||||
| Net pounds of copper produced1 | 74,931 | 73,209 | 218,260 | 221,536 | ||||||||
1 Contained copper in concentrate.
| Peru | Three months ended | Year ended | ||||||||||||||||||||||
| Dec. 31, 2024 | Dec. 31, 2023 | Dec. 31, 2024 | Dec. 31, 2023 | |||||||||||||||||||||
| Cash cost per pound of copper produced | $ millions | $/lb | $ millions | $/lb | $ millions | $/lb | $ millions | $/lb | ||||||||||||||||
| Mining | 47.3 | 0.63 | 30.4 | 0.41 | 145.5 | 0.67 | 122.6 | 0.55 | ||||||||||||||||
| Milling | 53.6 | 0.72 | 50.2 | 0.69 | 197.1 | 0.90 | 198.1 | 0.90 | ||||||||||||||||
| G&A | 33.2 | 0.44 | 24.8 | 0.34 | 95.5 | 0.44 | 77.2 | 0.35 | ||||||||||||||||
| Onsite costs | 134.1 | 1.79 | 105.4 | 1.44 | 438.1 | 2.01 | 397.9 | 1.80 | ||||||||||||||||
| Treatment & refining | 16.0 | 0.21 | 19.6 | 0.27 | 53.4 | 0.24 | 66.4 | 0.30 | ||||||||||||||||
| Freight & other | 19.2 | 0.25 | 20.8 | 0.28 | 62.5 | 0.29 | 62.7 | 0.28 | ||||||||||||||||
| Cash cost, before by-product credits | 169.3 | 2.25 | 145.8 | 1.99 | 554.0 | 2.54 | 527.0 | 2.38 | ||||||||||||||||
| By-product credits | (94.0 | ) | (1.25 | ) | (106.1 | ) | (1.45 | ) | (295.8 | ) | (1.36 | ) | (289.1 | ) | (1.31 | ) | ||||||||
| Cash cost, net of by-product credits | 75.3 | 1.00 | 39.7 | 0.54 | 258.2 | 1.18 | 237.9 | 1.07 | ||||||||||||||||
| Peru | Three months ended | Year ended | ||||||||||||||||||||||
| Dec. 31, 2024 | Dec. 31, 2023 | Dec. 31, 2024 | Dec. 31, 2023 | |||||||||||||||||||||
| Supplementary cash cost information | $ millions | $/lb 1 | $ millions | $/lb 1 | $ millions | $/lb 1 | $ millions | $/lb 1 | ||||||||||||||||
| By-product credits2: | ||||||||||||||||||||||||
| Gold3 | 68.5 | 0.91 | 77.5 | 1.05 | 182.5 | 0.84 | 169.9 | 0.77 | ||||||||||||||||
| Silver3 | 16.8 | 0.22 | 14.3 | 0.20 | 51.3 | 0.24 | 47.3 | 0.21 | ||||||||||||||||
| Molybdenum | 8.7 | 0.12 | 14.3 | 0.20 | 62.0 | 0.28 | 71.9 | 0.33 | ||||||||||||||||
| Total by-product credits | 94.0 | 1.25 | 106.1 | 1.45 | 295.8 | 1.36 | 289.1 | 1.31 | ||||||||||||||||
| Reconciliation to IFRS: | ||||||||||||||||||||||||
| Cash cost, net of by-product credits | 75.3 | 39.7 | 258.2 | 237.9 | ||||||||||||||||||||
| By-product credits | 94.0 | 106.1 | 295.8 | 289.1 | ||||||||||||||||||||
| Treatment and refining charges | (16.0 | ) | (19.6 | ) | (53.4 | ) | (66.4 | ) | ||||||||||||||||
| Inventory adjustments | (0.2 | ) | - | - | - | |||||||||||||||||||
| Share-based compensation expenses | 0.1 | 0.1 | 0.5 | 0.1 | ||||||||||||||||||||
| Change in product inventory | (6.7 | ) | 8.0 | 9.6 | 28.1 | |||||||||||||||||||
| Royalties | 1.5 | 1.5 | 6.7 | 5.6 | ||||||||||||||||||||
| Depreciation and amortization4 | 83.2 | 85.7 | 270.3 | 275.7 | ||||||||||||||||||||
| Cost of sales5 | 231.2 | 221.5 | 787.7 | 770.1 | ||||||||||||||||||||
1 Per pound of copper produced.
2 By-product credits are computed as revenue per financial statements, including amortization of deferred revenue and pricing and volume adjustments. For more information, please see the realized price reconciliation table on page 43 of this MD&A.
3 Gold and silver by-product credits do not include variable consideration adjustments with respect to stream arrangements.
4 Depreciation is based on concentrate sold.
5 As per the consolidated financial statements.
| British Columbia | Three months ended | Year ended | ||||||||||
| (in thousands) | Dec. 31, 2024 | Dec. 31, 2023 | Dec. 31, 2024 | Dec. 31, 2023 | ||||||||
| Net pounds of copper produced1 | 13,067 | 18,755 | 58,215 | 41,995 | ||||||||
1 Contained copper in concentrate.
| British Columbia | Three months ended | Year ended | ||||||||||||||||||||||
| Dec. 31, 2024 | Dec. 31, 2023 | Dec. 31, 2024 | Dec. 31, 2023 | |||||||||||||||||||||
| Cash cost per pound of copper produced | $ millions | $/lb | $ millions | $/lb | $ millions | $/lb | $ millions | $/lb | ||||||||||||||||
| Mining | 18.2 | 1.39 | 19.0 | 1.01 | 79.1 | 1.36 | 48.3 | 1.15 | ||||||||||||||||
| Milling | 25.2 | 1.93 | 25.2 | 1.35 | 89.8 | 1.54 | 49.3 | 1.17 | ||||||||||||||||
| G&A | 4.6 | 0.35 | 5.6 | 0.30 | 19.6 | 0.34 | 10.7 | 0.25 | ||||||||||||||||
| Onsite costs | 48.0 | 3.67 | 49.8 | 2.66 | 188.5 | 3.24 | 108.3 | 2.57 | ||||||||||||||||
| Treatment & refining | 3.4 | 0.26 | 4.9 | 0.26 | 14.4 | 0.25 | 9.8 | 0.23 | ||||||||||||||||
| Freight & other | 2.4 | 0.19 | 4.7 | 0.25 | 13.2 | 0.22 | 8.4 | 0.20 | ||||||||||||||||
| Cash cost, before by-product credits | 53.8 | 4.12 | 59.4 | 3.17 | 216.1 | 3.71 | 126.5 | 3.00 | ||||||||||||||||
| By-product credits | (14.6 | ) | (1.12 | ) | (9.3 | ) | (0.50 | ) | (56.5 | ) | (0.97 | ) | (21.5 | ) | (0.51 | ) | ||||||||
| Cash cost, net of by-product credits | 39.2 | 3.00 | 50.1 | 2.67 | 159.6 | 2.74 | 105.0 | 2.49 | ||||||||||||||||
| British Columbia | Three months ended | Year ended | ||||||||||||||||||||||
| Dec. 31, 2024 | Dec. 31, 2023 | Dec. 31, 2024 | Dec. 31, 2023 | |||||||||||||||||||||
| Supplementary cash cost information | $ millions | $/lb 1 | $ millions | $/lb 1 | $ millions | $/lb 1 | $ millions | $/lb 1 | ||||||||||||||||
| By-product credits2: | ||||||||||||||||||||||||
| Gold | 13.3 | 1.02 | 6.9 | 0.37 | 49.3 | 0.85 | 17.0 | 0.40 | ||||||||||||||||
| Silver | 1.3 | 0.10 | 2.4 | 0.13 | 7.2 | 0.12 | 4.5 | 0.11 | ||||||||||||||||
| Total by-product credits | 14.6 | 1.12 | 9.3 | 0.50 | 56.5 | 0.97 | 21.5 | 0.51 | ||||||||||||||||
| Reconciliation to IFRS: | ||||||||||||||||||||||||
| Cash cost, net of by-product credits | 39.2 | 50.1 | 159.6 | 105.0 | ||||||||||||||||||||
| By-product credits | 14.6 | 9.3 | 56.5 | 21.5 | ||||||||||||||||||||
| Treatment and refining charges | (3.4 | ) | (4.9 | ) | (14.4 | ) | (9.8 | ) | ||||||||||||||||
| Inventory adjustments | 1.2 | - | 1.2 | - | ||||||||||||||||||||
| Change in product inventory | (3.0 | ) | 8.5 | 3.8 | 8.5 | |||||||||||||||||||
| Share based payment | 0.4 | - | 0.4 | - | ||||||||||||||||||||
| Royalties | 0.6 | (0.4 | ) | 3.6 | (0.2 | ) | ||||||||||||||||||
| Depreciation and amortization3 | 11.8 | 5.5 | 50.1 | 11.7 | ||||||||||||||||||||
| Cost of sales4 | 61.4 | 68.1 | 260.8 | 136.7 | ||||||||||||||||||||
1 Per pound of copper produced.
2 By-product credits are computed as revenue per financial statements, including amortization of deferred revenue and pricing and volume adjustments. For more information, please see the realized price reconciliation table on page 43 of this MD&A.
3 Depreciation is based on concentrate sold.
4 As per consolidated financial statements.
| Consolidated | Three months ended | Year ended | ||||||||||||||||||||||
| Dec. 31, 2024 | Dec. 31, 2023 | Dec. 31, 2024 | Dec. 31, 2023 | |||||||||||||||||||||
| All-in sustaining cash cost per pound of copper produced | $ millions | $/lb | $ millions | $/lb | $ millions | $/lb | $ millions | $/lb | ||||||||||||||||
| Cash cost, net of by-product credits | 43.1 | 0.45 | 15.4 | 0.16 | 139.9 | 0.46 | 231.4 | 0.80 | ||||||||||||||||
| Cash sustaining capital expenditures | 85.3 | 0.89 | 87.6 | 0.87 | 342.2 | 1.13 | 255.9 | 0.88 | ||||||||||||||||
| Capitalized exploration | - | - | 5.2 | 0.05 | - | - | 5.2 | 0.02 | ||||||||||||||||
| Royalties | 2.1 | 0.03 | 1.1 | 0.01 | 10.3 | 0.03 | 5.5 | 0.02 | ||||||||||||||||
| Sustaining cash cost, net of by-product credits | 130.5 | 1.37 | 109.3 | 1.09 | 492.4 | 1.62 | 498.0 | 1.72 | ||||||||||||||||
| Corporate selling and administrative expenses & regional costs | 11.6 | 0.12 | 12.7 | 0.13 | 62.4 | 0.20 | 43.5 | 0.14 | ||||||||||||||||
| Accretion and amortization of decommissioning and community agreements1 | 3.7 | 0.04 | 9.0 | 0.09 | 17.3 | 0.06 | 16.0 | 0.06 | ||||||||||||||||
| All-in sustaining cash cost, net of by-product credits | 145.8 | 1.53 | 131.0 | 1.31 | 572.1 | 1.88 | 557.5 | 1.92 | ||||||||||||||||
| Reconciliation to property, plant and equipment additions: | ||||||||||||||||||||||||
| Property, plant and equipment additions | 127.6 | 54.0 | 325.7 | 212.6 | ||||||||||||||||||||
| Capitalized stripping net additions | 35.8 | 40.9 | 160.5 | 111.2 | ||||||||||||||||||||
| Total accrued capital additions | 163.4 | 94.9 | 486.2 | 323.8 | ||||||||||||||||||||
| Less other non-sustaining capital costs2 | 91.8 | 19.9 | 193.1 | 105.7 | ||||||||||||||||||||
| Total sustaining capital costs | 71.6 | 75.0 | 293.1 | 218.1 | ||||||||||||||||||||
| Capitalized lease & equipment financing cash payments - operating sites | 10.3 | 8.7 | 38.4 | 25.0 | ||||||||||||||||||||
| Community agreement cash payments 3 | 0.7 | 2.3 | 2.5 | 6.7 | ||||||||||||||||||||
| Accretion and amortization of decommissioning and restoration obligations 4 | 2.7 | 1.6 | 8.2 | 6.1 | ||||||||||||||||||||
| Cash sustaining capital expenditures | 85.3 | 87.6 | 342.2 | 255.9 | ||||||||||||||||||||
1 Includes accretion of decommissioning liability relating to non-producing sites, and accretion and amortization of community agreements capitalized to Other assets.
2 Other non-sustaining capital costs include Arizona capitalized costs, capitalized interest, capitalized exploration, right-of-use lease asset additions, equipment financing asset additions, growth capital expenditures and reclassification related to capital spares.
3 Amortization for community agreements relating to current operations.
4 Includes amortization of decommissioning and restoration PP&E assets and accretion of decommissioning and restoration liabilities related to producing sites.
| Peru | Three months ended | Year ended | ||||||||||||||||||||||
| Dec. 31, 2024 | Dec. 31, 2023 | Dec. 31, 2024 | Dec. 31, 2023 | |||||||||||||||||||||
| Sustaining cash cost per pound of copper produced | $ millions | $/lb | $ millions | $/lb | $ millions | $/lb | $ millions | $/lb | ||||||||||||||||
| Cash cost, net of by-product credits | 75.3 | 1.00 | 39.7 | 0.54 | 258.2 | 1.18 | 237.9 | 1.07 | ||||||||||||||||
| Cash sustaining capital expenditures | 34.3 | 0.46 | 42.3 | 0.58 | 141.6 | 0.65 | 152.0 | 0.69 | ||||||||||||||||
| Capitalized exploration | - | - | 5.2 | 0.07 | - | - | 5.2 | 0.02 | ||||||||||||||||
| Royalties | 1.5 | 0.02 | 1.5 | 0.02 | 6.7 | 0.03 | 5.6 | 0.03 | ||||||||||||||||
| Sustaining cash cost per pound of copper produced | 111.1 | 1.48 | 88.7 | 1.21 | 406.5 | 1.86 | 400.7 | 1.81 | ||||||||||||||||
| British Columbia | Three months ended | Year ended | ||||||||||||||||||||||
| Dec. 31, 2024 | Dec. 31, 2023 | Dec. 31, 2024 | Dec. 31, 2023 | |||||||||||||||||||||
| Sustaining cash cost per pound of copper produced | $ millions | $/lb | $ millions | $/lb | $ millions | $/lb | $ millions | $/lb | ||||||||||||||||
| Cash cost, net of by-product credits | 39.2 | 3.00 | 50.1 | 2.67 | 159.6 | 2.74 | 105.0 | 2.49 | ||||||||||||||||
| Cash sustaining capital expenditures | 35.4 | 2.71 | 24.1 | 1.28 | 144.5 | 2.48 | 38.5 | 0.92 | ||||||||||||||||
| Royalties | 0.6 | 0.05 | (0.4 | ) | (0.02 | ) | 3.6 | 0.07 | (0.2 | ) | - | |||||||||||||
| Sustaining cash cost per pound of copper produced | 75.2 | 5.76 | 73.8 | 3.93 | 307.7 | 5.29 | 143.3 | 3.41 | ||||||||||||||||
Gold Cash Cost and Gold Sustaining Cash Cost
Cash cost per ounce of gold produced ("gold cash cost") is a non-GAAP measure that management uses as a key performance indicator to assess the performance of our Manitoba operations. This alternative cash cost calculation designates gold as the primary metal of production as it represents a substantial component of revenues for our Manitoba business unit and should therefore be less volatile over time than Manitoba cash cost per pound of copper. The calculation is presented in three manners:
- Gold cash cost, before by-product credits - This measure is gross of by-product revenues and is a function of the efforts and costs incurred to mine and process all ore mined. However, the measure divides this aggregate cost over only ounces of gold produced, the assumed primary metal of production. This measure is generally less volatile from period to period, as it is not affected by changes in the price received for by-product metals.
- Gold cash cost, net of by-product credits - In order to calculate the net cost to produce and sell gold, the net of by-product credits measure subtracts the revenues realized from the sale of the metals other than gold. The by-product revenues from copper, zinc, and silver are significant and are integral to the economics of our Manitoba operation. The economics that support our decision to produce and sell gold would be different if we did not receive revenues from the other significant metals being extracted and processed. This measure provides management and investors with an indication of the minimum gold price consistent with positive operating margins, assuming realized by-product metal prices are consistent with those prevailing during the reporting period. It also serves as an important operating statistic that management and investors utilize to measure our operating performance at our Manitoba operation versus that of our competitors. However, it is important to understand that if by-product metal prices decline alongside gold prices, the gold cash cost net of by-product credits would increase, requiring a higher gold price than that reported to maintain positive cash flows and operating margins.
- Gold sustaining cash cost, net of by-product credits - This measure is an extension of gold cash cost that includes cash sustaining capital expenditures, capitalized exploration, net smelter returns royalties, as well as accretion and amortization for expected decommissioning activities for producing assets. It does not include corporate selling and administrative expenses. It provides a more fulsome measurement of the cost of sustaining production than gold cash cost, which is focused on operating costs only.
The tables below present a detailed build-up of gold cash cost and gold sustaining cash cost, net of by-product credits, for the Manitoba business unit, and reconciliations between gold cash cost, net of by-product credits, to the most comparable IFRS measures of cost of sales for the year ended December 31, 2024 and 2023. Gold cash cost, net of by-product credits, may not calculate exactly based on amounts presented in the tables below due to rounding.
| Manitoba | Three months ended | Year ended | ||||||||||
| (in thousands) | Dec. 31, 2024 | Dec. 31, 2023 | Dec. 31, 2024 | Dec. 31, 2023 | ||||||||
| Net ounces of gold produced1 | 51,438 | 59,863 | 214,225 | 187,363 | ||||||||
1 Contained gold in concentrate and doré.
| Manitoba | Three months ended | Year ended | ||||||||||||||||||||||
| Dec. 31, 2024 | Dec. 31, 2023 | Dec. 31, 2024 | Dec. 31, 2023 | |||||||||||||||||||||
| Cash cost per ounce of gold produced | $ millions | $/oz1 | $ millions | $/oz1 | $ millions | $/oz1 | $ millions | $/oz1 | ||||||||||||||||
| Mining | 42.6 | 828 | 40.3 | 673 | 169.4 | 791 | 161.1 | 860 | ||||||||||||||||
| Milling | 16.6 | 323 | 15.3 | 256 | 65.2 | 304 | 62.3 | 333 | ||||||||||||||||
| G&A | 12.8 | 249 | 8.4 | 140 | 47.7 | 223 | 34.7 | 185 | ||||||||||||||||
| Onsite costs | 72.0 | 1,400 | 64.0 | 1,069 | 282.3 | 1,318 | 258.1 | 1,378 | ||||||||||||||||
| Treatment & refining | 6.5 | 126 | 11.1 | 186 | 29.5 | 137 | 37.5 | 200 | ||||||||||||||||
| Freight & other | 7.0 | 136 | 6.8 | 113 | 25.4 | 119 | 23.6 | 126 | ||||||||||||||||
| Cash cost, before by-product credits | 85.5 | 1,662 | 81.9 | 1,368 | 337.2 | 1,574 | 319.2 | 1,704 | ||||||||||||||||
| By-product credits | (54.3 | ) | (1,055 | ) | (56.0 | ) | (934 | ) | (207.3 | ) | (968 | ) | (183.1 | ) | (977 | ) | ||||||||
| Gold cash cost, net of by-product credits | 31.2 | 607 | 25.9 | 434 | 129.9 | 606 | 136.1 | 727 | ||||||||||||||||
| Manitoba | Three months ended | Year ended | ||||||||||||||||||||||
| Supplementary cash cost information | Dec. 31, 2024 | Dec. 31, 2023 | Dec. 31, 2024 | Dec. 31, 2023 | ||||||||||||||||||||
| $ millions | $/oz 1 | $ millions | $/oz 1 | $ millions | $/oz 1 | $ millions | $/oz 1 | |||||||||||||||||
| By-product credits2: | ||||||||||||||||||||||||
| Copper | 28.5 | 554 | 31.4 | 526 | 108.2 | 505 | 91.1 | 487 | ||||||||||||||||
| Zinc | 16.1 | 313 | 18.6 | 308 | 69.9 | 326 | 74.9 | 399 | ||||||||||||||||
| Silver | 8.5 | 165 | 6.0 | 100 | 27.5 | 128 | 16.9 | 90 | ||||||||||||||||
| Other | 1.2 | 23 | - | - | 1.7 | 9 | 0.2 | 1 | ||||||||||||||||
| Total by-product credits | 54.3 | 1,055 | 56.0 | 934 | 207.3 | 968 | 183.1 | 977 | ||||||||||||||||
| Reconciliation to IFRS: | ||||||||||||||||||||||||
| Cash cost, net of by-product credits | 31.2 | 25.9 | 129.9 | 136.1 | ||||||||||||||||||||
| By-product credits | 54.3 | 56.0 | 207.3 | 183.1 | ||||||||||||||||||||
| Treatment and refining charges | (6.5 | ) | (11.1 | ) | (29.5 | ) | (37.5 | ) | ||||||||||||||||
| Past service costs | 1.5 | - | 4.3 | - | ||||||||||||||||||||
| Share-based compensation expenses | 0.2 | 0.2 | 1.0 | 0.5 | ||||||||||||||||||||
| Inventory adjustments | 0.3 | 1.4 | 1.7 | 2.3 | ||||||||||||||||||||
| Change in product inventory | (0.3 | ) | 12.8 | (2.0 | ) | 1.8 | ||||||||||||||||||
| Royalties | - | - | - | 0.1 | ||||||||||||||||||||
| Depreciation and amortization3 | 27.2 | 30.6 | 106.2 | 104.3 | ||||||||||||||||||||
| Cost of sales4 | 107.9 | 115.8 | 418.9 | 390.7 | ||||||||||||||||||||
1 Per ounce of gold produced.
2 By-product credits are computed as revenue per financial statements, amortization of deferred revenue and pricing and volume adjustments. For more information, please see the realized price reconciliation table on page 43 of this MD&A.
3 Depreciation is based on concentrate sold.
4 As per consolidated financial statements.
| Manitoba | Three months ended | Year ended | ||||||||||||||||||||||
| Dec. 31, 2024 | Dec. 31, 2023 | Dec. 31, 2024 | Dec. 31, 2023 | |||||||||||||||||||||
| Sustaining cash cost per ounce of gold produced | $ millions | $/oz | $ millions | $/oz | $ millions | $/oz | $ millions | $/oz | ||||||||||||||||
| Gold cash cost, net of by-product credits | 31.2 | 607 | 25.9 | 434 | 129.9 | 606 | 136.1 | 727 | ||||||||||||||||
| Cash sustaining capital expenditures | 15.5 | 301 | 21.2 | 354 | 56.1 | 262 | 65.4 | 349 | ||||||||||||||||
| Royalties | - | - | - | - | - | - | 0.1 | 1 | ||||||||||||||||
| Sustaining cash cost per ounce of gold produced | 46.7 | 908 | 47.1 | 788 | 186.0 | 868 | 201.6 | 1,077 | ||||||||||||||||
Combined Unit Cost
Combined unit cost ("unit cost") and zinc plant unit cost is a non-GAAP measure that management uses as a key performance indicator to assess the performance of our mining and milling operations. Combined unit cost is calculated by dividing the cost of sales by mill throughput. This measure is utilized by management and investors to assess our cost structure and margins and compare it to similar information provided by other companies in our industry. Unlike cash cost, this measure is not impacted by variability in by-product commodity prices since there are no by-product deductions; costs associated with profit-sharing and similar costs are excluded because of their correlation to external metal prices. In addition, the unit costs are reported in the functional currency of the operation which minimizes the impact of foreign currency fluctuations. In all, the unit cost measures provide an alternative perspective on operating cost performance with minimal impact from external market prices.
The tables below present a detailed combined unit cost for the Peru and Manitoba business units, and reconciliations between these measures to the most comparable IFRS measures of cost of sales for the year ended December 31, 2024 and 2023.
| Peru | Three months ended | Year ended | ||||||||||
| (in millions except ore tonnes milled and unit cost per tonne) | Dec. 31, 2024 | Dec. 31, 2023 | Dec. 31, 2024 | Dec. 31, 2023 | ||||||||
| Combined unit cost per tonne processed | ||||||||||||
| Mining | 47.3 | 30.4 | 145.5 | 122.6 | ||||||||
| Milling | 53.6 | 50.2 | 197.1 | 198.1 | ||||||||
| G&A1 | 33.2 | 24.8 | 95.5 | 77.2 | ||||||||
| Less: Other G&A2 | (12.1 | ) | (8.2 | ) | (25.9 | ) | (14.9 | ) | ||||
| Unit cost | 122.0 | 97.2 | 412.2 | 383.0 | ||||||||
| Tonnes ore milled | 7,999 | 7,939 | 31,934 | 30,721 | ||||||||
| Combined unit cost per tonne | 15.25 | 12.24 | 12.91 | 12.47 | ||||||||
| Reconciliation to IFRS: | ||||||||||||
| Unit cost | 122.0 | 97.2 | 412.2 | 383.0 | ||||||||
| Freight & other | 19.2 | 20.8 | 62.5 | 62.7 | ||||||||
| Other G&A | 12.1 | 8.2 | 25.9 | 14.9 | ||||||||
| Share-based compensation expenses | 0.1 | 0.1 | 0.5 | 0.1 | ||||||||
| Inventory adjustments | (0.2 | ) | - | - | - | |||||||
| Change in product inventory | (6.7 | ) | 8.0 | 9.6 | 28.1 | |||||||
| Royalties | 1.5 | 1.5 | 6.7 | 5.6 | ||||||||
| Depreciation and amortization | 83.2 | 85.7 | 270.3 | 275.7 | ||||||||
| Cost of sales3 | 231.2 | 221.5 | 787.7 | 770.1 | ||||||||
1 G&A as per cash cost reconciliation above.
2 Other G&A primarily includes profit sharing costs.
3 As per consolidated financial statements.
| Manitoba | Three months ended | Year ended | ||||||||||
| (in millions except tonnes ore milled and unit cost per tonne) | Dec. 31, 2024 | Dec. 31, 2023 | Dec. 31, 2024 | Dec. 31, 2023 | ||||||||
| Combined unit cost per tonne processed | ||||||||||||
| Mining | 42.6 | 40.3 | 169.4 | 161.1 | ||||||||
| Milling | 16.6 | 15.3 | 65.2 | 62.3 | ||||||||
| G&A1 | 12.8 | 8.4 | 47.7 | 34.7 | ||||||||
| Less: Other G&A related to profit sharing costs | (4.0 | ) | (1.5 | ) | (17.0 | ) | (6.7 | ) | ||||
| Unit cost | 68.0 | 62.5 | 265.3 | 251.4 | ||||||||
| USD/CAD implicit exchange rate | 1.39 | 1.36 | 1.37 | 1.35 | ||||||||
| Unit cost - C$ | 95.0 | 85.0 | 363.5 | 339.2 | ||||||||
| Tonnes ore milled | 407,596 | 393,837 | 1,608,708 | 1,562,479 | ||||||||
| Combined unit cost per tonne - C$ | 233 | 216 | 226 | 217 | ||||||||
| Reconciliation to IFRS: | ||||||||||||
| Unit cost | 68.0 | 62.5 | 265.3 | 251.4 | ||||||||
| Freight & other | 7.0 | 6.8 | 25.4 | 23.6 | ||||||||
| Other G&A related to profit sharing | 4.0 | 1.5 | 17.0 | 6.7 | ||||||||
| Share-based compensation expenses | 0.2 | 0.2 | 1.0 | 0.5 | ||||||||
| Inventory adjustments | 0.3 | 1.4 | 1.7 | 2.3 | ||||||||
| Past service costs | 1.5 | - | 4.3 | - | ||||||||
| Change in product inventory | (0.3 | ) | 12.8 | (2.0 | ) | 1.8 | ||||||
| Royalties | - | - | - | 0.1 | ||||||||
| Depreciation and amortization | 27.2 | 30.6 | 106.2 | 104.3 | ||||||||
| Cost of sales2 | 107.9 | 115.8 | 418.9 | 390.7 | ||||||||
1 G&A as per cash cost reconciliation above.
2 As per consolidated financial statements.
| British Columbia | Three months ended | Year ended | ||||||||||
| (in millions except tonnes ore milled and unit cost per tonne) | Dec. 31, 2024 | Dec. 31, 2023 | Dec. 31, 2024 | Dec. 31, 2023 | ||||||||
| Combined unit cost per tonne processed | ||||||||||||
| Mining | 18.2 | 19.0 | 79.1 | 48.3 | ||||||||
| Milling | 25.2 | 25.2 | 89.8 | 49.3 | ||||||||
| G&A1 | 4.6 | 5.6 | 19.6 | 10.7 | ||||||||
| Unit cost | 48.0 | 49.8 | 188.5 | 108.3 | ||||||||
| USD/CAD implicit exchange rate | 1.38 | 1.37 | 1.37 | 1.36 | ||||||||
| Unit cost - C$ | 66.9 | 68.2 | 258.1 | 146.7 | ||||||||
| Tonnes ore milled | 2,881 | 3,262 | 12,657 | 6,862 | ||||||||
| Combined unit cost per tonne - C$ | 23.22 | 20.90 | 20.39 | 21.38 | ||||||||
| Reconciliation to IFRS: | ||||||||||||
| Unit cost | 48.0 | 49.8 | 188.5 | 108.3 | ||||||||
| Freight & other | 2.4 | 4.7 | 13.2 | 8.4 | ||||||||
| Change in product inventory | (3.0 | ) | 8.5 | 3.8 | 8.5 | |||||||
| Shared based compensation | 0.4 | - | 0.4 | - | ||||||||
| Inventory adjustments | 1.2 | - | 1.2 | - | ||||||||
| Royalties | 0.6 | (0.4 | ) | 3.6 | (0.2 | ) | ||||||
| Depreciation and amortization | 11.8 | 5.5 | 50.1 | 11.7 | ||||||||
| Cost of sales2 | 61.4 | 68.1 | 260.8 | 136.7 | ||||||||
1 G&A as per cash cost reconciliation above.
2 As per consolidated financial statements.
ACCOUNTING CHANGES
New standards and interpretations adopted and not yet adopted
For information on new standards and interpretations adopted and not yet adopted, refer to note 4 of our December 31, 2024 consolidated financial statements.
CRITICAL ACCOUNTING JUDGEMENTS AND ESTIMATES
The preparation of the consolidated financial statements in conformity with IFRS requires us to make judgements, estimates and assumptions that affect the application of accounting policies, reported amounts of assets and liabilities, disclosure of contingent assets and liabilities at the date of the consolidated financial statements, and reported amounts of revenue and expenses during the reporting period. Actual results may differ from these estimates.
We review these estimates and underlying assumptions on an ongoing basis based on our experience and other factors, including expectations of future events that we believe to be reasonable under the circumstances. Revisions to accounting estimates are recognized in the period in which the estimates are revised and in any future periods affected. Certain accounting estimates and judgements have been identified as being "critical" to the presentation of our financial condition and results of operations because they require us to make subjective and/or complex judgements about matters that are inherently uncertain; or there is a reasonable likelihood that materially different amounts could be reported under different conditions or using different assumptions and estimates.
The following are significant judgements and estimates impacting the consolidated financial statements:
- Judgements and estimates that affect multiple areas of the consolidated financial statements:
- Mineral reserves and resources which form the basis of life of mine plans which are utilized in impairment testing, timing of payments related to decommissioning obligations and depreciation of capital assets. We estimate our mineral reserves and resources based on information compiled by qualified persons as defined in accordance with NI 43-101;
- Income and mining taxes, including estimates of future taxable profit which impacts the ability to realize deferred tax assets on our balance sheet; and
- In respect of the outcome of uncertain future events as it concerns recognizing contingent liabilities.
- Judgements and estimates that relate mainly to assets (these judgements may also affect other areas of the consolidated financial statements):
- Property, plant and equipment:
- Cost allocations for mine development;
- Mining properties expenditures capitalized;
- Classification of supply costs as related to capital development or inventory acquisition;
- Determining when exploration and evaluation assets should be transferred to capital works in progress within property, plant and equipment;
- Determination of when an asset or group of assets is in the condition and location to be ready for use as intended by management for the purposes of commencing depreciation;
- Componentization;
- Assessment of impairment, including determination of cash generating units and assessing for indicators of impairment;
- Recoverability of exploration and evaluation assets, including determination of cash generating units and assessing for indications of impairment;
- Units of production depreciation;
- Plant and equipment estimated useful lives and residual values;
- Capitalized stripping costs; and
- Finite life intangible assets.
- Impairment (and reversal of impairment) of non-financial assets:
- Future production levels and timing;
- Operating and capital costs;
- Future commodity prices;
- Foreign exchange rates; and
- Risk adjusted discount rates; and
- In process inventory quantities, inventory cost allocations and inventory valuation.
- Judgements and estimates that relate mainly to liabilities (these judgements may also affect other areas of the consolidated financial statements):
- Determination of deferred revenue per unit related to the precious metals stream transactions and determination of current portion of deferred revenue, which is based on timing of future sales, and adjustments of the expected conversion of resource to reserves;
- Pensions and other employee benefits; and
- Decommissioning, restoration and similar liabilities including estimated future costs and timing of spending.
- Estimates that relate mainly to the consolidated statements of income:
- Assaying used to determine revenues and recoverability of inventories.
For more information on judgements and estimates, refer to note 2 of our consolidated financial statements for the year ended December 31, 2024.
DISCLOSURE CONTROLS AND PROCEDURES AND INTERNAL CONTROL OVER FINANCIAL REPORTING
Disclosure controls and procedures ("DC&P")
Management is responsible for establishing and maintaining adequate DC&P. As of December 31, 2024, we have evaluated the effectiveness of the design and operation of our DC&P in accordance with requirements of National Instrument 52-109 of the Canadian Securities Commission ("NI 52-109") and the Sarbanes Oxley Act of 2002 (as adopted by the US Securities and Exchange Commission). Our Chief Executive Officer ("CEO") and Chief Financial Officer ("CFO") supervised and participated in this evaluation.
As of December 31, 2024, based on management's evaluation, our CEO and CFO concluded that our DC&P were effective to ensure that information required to be disclosed by us in reports we file or submit is recorded, processed, summarized and reported within the time periods specified in securities legislation and is accumulated and communicated to our management, including our CEO and CFO, to allow timely decisions regarding required disclosure.
Internal control over financial reporting ("ICFR")
Management of Hudbay is responsible for establishing and maintaining adequate ICFR. Under the supervision and with the participation of our Chief Executive Officer and Chief Financial Officer, we evaluated the effectiveness of our ICFR as of December 31, 2024 based upon the Internal Control - Integrated Framework (2013) issued by the Committee of Sponsoring Organizations of the Treadway Commission. Based on management's evaluation, our CEO and CFO concluded that our ICFR was effective as of December 31, 2024.
The effectiveness of the Company's ICFR as of December 31, 2024 has been audited by Deloitte LLP, Independent Registered Public Accounting Firm as stated in their report immediately preceding the Company's consolidated financial statements for the year ended December 31, 2024.
Changes in ICFR
We did not make any changes to ICFR during the year ended December 31, 2024 that materially affected, or are reasonably likely to materially affect, our ICFR.
Inherent limitations of controls and procedures
All internal control systems, no matter how well designed, have inherent limitations. As a result, even systems determined to be effective may not prevent or detect misstatements on a timely basis, as systems can provide only reasonable assurance that the objectives of the control system are met. In addition, projections of any evaluation of the effectiveness of ICFR to future periods are subject to the risk that controls may become inadequate because of changes in conditions, or that the degree of compliance with the policies or procedures may change.
NOTES TO READER
Forward-Looking Information
This MD&A contains forward-looking information within the meaning of applicable Canadian and United States securities legislation. All information contained in this MD&A, other than statements of current and historical fact, is forward-looking information. Often, but not always, forward-looking information can be identified by the use of words such as "plans", "expects", "budget", "guidance", "scheduled", "estimates", "forecasts", "strategy", "target", "intends", "objective", "goal", "understands", "anticipates" and "believes" (and variations of these or similar words) and statements that certain actions, events or results "may", "could", "would", "should", "might" "occur" or "be achieved" or "will be taken" (and variations of these or similar expressions). All of the forward-looking information in this MD&A is qualified by this cautionary note.
Forward-looking information includes, but is not limited to, statements with respect to our production, cost and capital and exploration expenditure guidance, expectations regarding reductions in discretionary spending and capital expenditures, our ability to stabilize and optimize the Copper Mountain mine operation, the implementation of stripping strategies and the expected benefits therefrom, the estimated timelines and pre-requisites for sanctioning the Copper World project and the pursuit of a potential minority joint venture partner, the possibility of and expectations regarding the results of any challenges to the permits for the Copper World project, the expected benefits of the sanctioning of Copper World project, the expected benefits of Manitoba growth initiatives, including the use of the exploration drift at the 1901 deposit, the potential utilization of excess capacity at the Stall mill, and the advancement of our exploration partnership with Marubeni, the anticipated use of proceeds from the flow-through financing completed during the fourth quarter of 2024, our future deleveraging strategies and our ability to deleverage and repay debt as needed, expectations regarding our cash balance and liquidity, expectations regarding the ability to conduct exploration work and execute on exploration programs on its properties and to advance related drill plans, including the advancement of the exploration program at Maria Reyna and Caballito and the status of the related drill permit application process, the ability to continue mining higher-grade ore in the Pampacancha pit and our expectations resulting therefrom, expectations regarding our ability to further reduce greenhouse gas emissions, our evaluation and assessment of opportunities to reprocess tailings using various metallurgical technologies, expectations regarding the prospective nature of the Maria Reyna and Caballito properties, the anticipated impact of brownfield and greenfield growth projects on our performance, anticipated expansion opportunities and extension of mine life in Snow Lake and our ability to find a new anchor deposit near our Snow Lake operations, anticipated future drill programs and exploration activities and any results expected therefrom, anticipated mine plans, anticipated metals prices and the anticipated sensitivity of our financial performance to metals prices, events that may affect our operations and development projects, anticipated cash flows from operations and related liquidity requirements, the anticipated effect of external factors on revenue, such as commodity prices, estimation of mineral reserves and resources, mine life projections, reclamation costs, economic outlook, government regulation of mining operations, and business and acquisition strategies. Forward-looking information is not, and cannot be, a guarantee of future results or events. Forward-looking information is based on, among other things, opinions, assumptions, estimates and analyses that, while considered reasonable by us at the date the forward-looking information is provided, inherently are subject to significant risks, uncertainties, contingencies and other factors that may cause actual results and events to be materially different from those expressed or implied by the forward-looking information.
The material factors or assumptions that we identified and were applied by us in drawing conclusions or making forecasts or projections set out in the forward-looking information include, but are not limited to:
- the ability to achieve production, cost and capital and exploration expenditure guidance;
- no significant interruptions to our operations due to social or political unrest in the regions we operate, including the navigation of the complex political and social environment in Peru;
- no interruptions to our plans for advancing the Copper World project, including with respect to any successful challenges to the Copper World permits and/or the pursuit of a potential minority joint venture partner;
- our ability to successfully complete the stabilization and optimization of the Copper Mountain operations, obtain required permits and develop and maintain good relations with key stakeholders;
- the ability to execute on its exploration plans and to advance related drill plans;
- the ability to advance the exploration program at the Maria Reyna and Caballito properties;
- the success of mining, processing, exploration and development activities;
- the scheduled maintenance and availability of our processing facilities;
- the accuracy of geological, mining and metallurgical estimates;
- anticipated metals prices and the costs of production;
- the supply and demand for metals we produce;
- the supply and availability of all forms of energy and fuels at reasonable prices;
- no significant unanticipated operational or technical difficulties;
- the execution of our business and growth strategies, including the success of our strategic investments and initiatives;
- the availability of additional financing, if needed;
- the ability to deleverage and repay debt, as needed;
- the ability to complete project targets on time and on budget and other events that may affect our ability to develop our projects;
- the timing and receipt of various regulatory and governmental approvals;
- the availability of personnel for our exploration, development and operational projects and ongoing employee relations;
- maintaining good relations with the employees at our operations;
- maintaining good relations with the labour unions that represent certain of our employees in Manitoba and Peru;
- maintaining good relations with the communities in which we operate, including the neighbouring Indigenous communities and local governments;
- no significant unanticipated challenges with stakeholders at our various projects;
- no significant unanticipated events or changes relating to regulatory, environmental, health and safety matters;
- no contests over title to our properties, including as a result of rights or claimed rights of Indigenous peoples or challenges to the validity of our unpatented mining claims;
- the timing and possible outcome of pending litigation and no significant unanticipated litigation;
- certain tax matters, including, but not limited to current tax laws and regulations, changes in taxation policies and the refund of certain value added taxes from the Canadian and Peruvian governments; and
- no significant and continuing adverse changes in general economic conditions or conditions in the financial markets (including commodity prices and foreign exchange rates).
The risks, uncertainties, contingencies and other factors that may cause actual results to differ materially from those expressed or implied by the forward-looking information may include, but are not limited to, risks related to the failure to effectively complete the stabilization, optimization and expansion of the Copper Mountain mine operations, political and social risks in the regions we operate, including the navigation of the complex political and social environment in Peru, risks generally associated with the mining industry and the current geopolitical environment, including future commodity prices, the potential implementation or expansion of tariffs, currency and interest rate fluctuations, energy and consumable prices, supply chain constraints and general cost escalation in the current inflationary environment, uncertainties related to the development and operation of our projects, the risk of an indicator of impairment or impairment reversal relating to a material mineral property, risks related to the Copper World project, including in relation to project delivery and financing risks, risks related to the Lalor mine plan, including the ability to convert inferred mineral resource estimates to higher confidence categories, dependence on key personnel and employee and union relations, risks related to political or social instability, unrest or change, risks in respect of Indigenous and community relations, rights and title claims, operational risks and hazards, including the cost of maintaining and upgrading our tailings management facilities and any unanticipated environmental, industrial and geological events and developments and the inability to insure against all risks, failure of plant, equipment, processes, transportation and other infrastructure to operate as anticipated, compliance with government and environmental regulations, including permitting requirements and anti-bribery legislation, depletion of our reserves, volatile financial markets and interest rates that may affect our ability to obtain additional financing on acceptable terms, the failure to obtain required approvals or clearances from government authorities on a timely basis, uncertainties related to the geology, continuity, grade and estimates of mineral reserves and resources, and the potential for variations in grade and recovery rates, uncertain costs of reclamation activities, our ability to comply with our pension and other post-retirement obligations, our ability to abide by the covenants in our debt instruments and other material contracts, tax refunds, hedging transactions, as well as the risks discussed under the heading "Risk Factors" in our most recent Annual Information Form which is available on the Company's SEDAR+ profile at www.sedarplus.ca and the Company's EDGAR profile at www.sec.gov.
Should one or more risk, uncertainty, contingency or other factor materialize or should any factor or assumption prove incorrect, actual results could vary materially from those expressed or implied in the forward-looking information. Accordingly, you should not place undue reliance on forward-looking information. We do not assume any obligation to update or revise any forward-looking information after the date of this MD&A or to explain any material difference between subsequent actual events and any forward-looking information, except as required by applicable law.
Note to United States Investors
This MD&A has been prepared in accordance with the requirements of the securities laws in effect in Canada, which may differ materially from the requirements of United States securities laws applicable to U.S. issuers.
Qualified Person and NI 43-101
The technical and scientific information in this MD&A related to our material mineral projects has been approved by Olivier Tavchandjian, P. Geo, Senior Vice President, Exploration and Technical Services. Mr. Tavchandjian is a qualified person pursuant to National Instrument 43-101 - Standards of Disclosure for Mineral Projects ("NI 43-101").
For a description of the key assumptions, parameters and methods used to estimate mineral reserves and resources at Hudbay's material mineral properties, as well as data verification procedures and a general discussion of the extent to which the estimates of scientific and technical information may be affected by any known environmental, permitting, legal title, taxation, sociopolitical, marketing or other relevant factors, please see the technical reports for our material properties as filed by us on SEDAR+ at www.sedarplus.ca and EDGAR at www.sec.gov.
SUMMARY OF HISTORICAL RESULTS
The following unaudited tables set out a summary of quarterly and annual results for the Company.
| 2024 4 | Q4 2024 | Q3 2024 | Q2 2024 | Q1 2024 | 2023 4 | Q4 2023 | Q3 2023 | Q2 2023 | Q1 2023 | 2022 4 | Q4 2022 | |||||||||||||||||||||||||
| Consolidated Financial Condition ($ millions) | ||||||||||||||||||||||||||||||||||||
| Cash and cash equivalents and short-term investments | $ | 581.8 | $ | 581.8 | $ | 483.3 | $ | 523.8 | $ | 284.4 | $ | 249.8 | $ | 249.8 | $ | 245.2 | $ | 179.7 | $ | 255.6 | $ | 225.7 | $ | 225.7 | ||||||||||||
| Total long-term debt | 1,107.5 | 1,107.5 | 1,108.9 | 1,155.6 | 1,278.6 | 1,287.5 | 1,287.5 | 1,377.4 | 1,370.7 | 1,225.0 | 1,184.2 | 1,184.2 | ||||||||||||||||||||||||
| Net debt1 | 525.7 | 525.7 | 625.6 | 631.8 | 994.2 | 1,037.7 | 1,037.7 | 1,132.2 | 1,190.9 | 969.5 | 958.5 | 958.5 | ||||||||||||||||||||||||
| Consolidated Financial Performance ($ millions except per share amounts) | ||||||||||||||||||||||||||||||||||||
| Revenue | $ | 2,021.2 | $ | 584.9 | $ | 485.8 | $ | 425.5 | $ | 525.0 | $ | 1,690.0 | $ | 602.2 | $ | 480.5 | $ | 312.2 | $ | 295.2 | $ | 1,461.4 | $ | 321.2 | ||||||||||||
| Cost of sales | 1,467.4 | 400.5 | 346.0 | 347.9 | 373.0 | 1,297.5 | 405.4 | 374.1 | 289.3 | 228.7 | 1,184.6 | 251.5 | ||||||||||||||||||||||||
| Earnings (loss) before tax | 251.6 | 103.7 | 79.7 | 0.4 | 67.8 | 151.8 | 81.0 | 84.1 | (30.7 | ) | 17.4 | 95.8 | (14.3 | ) | ||||||||||||||||||||||
| Net (loss) earnings | 67.8 | 19.3 | 50.4 | (20.4 | ) | 18.5 | 69.5 | 33.5 | 45.5 | (14.9 | ) | 5.5 | 70.4 | (17.4 | ) | |||||||||||||||||||||
| Net (loss) earnings attributable to owners1 | 76.7 | 21.2 | 49.8 | (16.6 | ) | 22.4 | 66.4 | 30.7 | 45.1 | (14.9 | ) | 5.5 | 6.6 | (17.4 | ) | |||||||||||||||||||||
| Basic and diluted earnings (loss) per share | $ | 0.20 | $ | 0.05 | $ | 0.13 | $ | (0.05 | ) | $ | 0.06 | $ | 0.22 | $ | 0.09 | $ | 0.13 | $ | (0.05 | ) | $ | 0.02 | $ | 0.27 | $ | (0.07 | ) | |||||||||
| Adjusted earnings (loss) per share attributable to owners 1 | $ | 0.48 | $ | 0.18 | $ | 0.13 | $ | 0.00 | $ | 0.17 | $ | 0.23 | $ | 0.20 | $ | 0.07 | $ | (0.07 | ) | $ | 0.00 | $ | 0.10 | $ | 0.01 | |||||||||||
| Operating cash flow before change in non-cash working capital | 691.1 | 231.5 | 188.3 | 123.6 | 147.5 | 570.0 | 246.5 | 182.0 | 55.9 | 85.6 | 391.7 | 109.1 | ||||||||||||||||||||||||
| Adjusted EBITDA 1 | 822.5 | 257.3 | 206.2 | 145.0 | 214.2 | 647.8 | 274.4 | 190.7 | 81.2 | 101.9 | 475.9 | 124.7 | ||||||||||||||||||||||||
| Consolidated Operational Performance | ||||||||||||||||||||||||||||||||||||
| Contained metal in concentrate and doré produced 2 | ||||||||||||||||||||||||||||||||||||
| Copper | 137,943 | 43,262 | 31,354 | 28,578 | 34,749 | 131,691 | 45,450 | 41,964 | 21,715 | 22,562 | 104,173 | 29,305 | ||||||||||||||||||||||||
| Gold | 332,240 | 94,161 | 89,073 | 58,614 | 90,392 | 310,429 | 112,776 | 101,417 | 48,996 | 47,240 | 219,700 | 53,920 | ||||||||||||||||||||||||
| Silver | 3,983,851 | 1,311,658 | 985,569 | 738,707 | 947,917 | 3,575,234 | 1,197,082 | 1,063,032 | 612,310 | 702,809 | 3,161,294 | 795,015 | ||||||||||||||||||||||||
| Zinc | 33,339 | 8,385 | 8,069 | 8,087 | 8,798 | 34,642 | 5,747 | 10,291 | 8,758 | 9,846 | 55,381 | 6,326 | ||||||||||||||||||||||||
| Molybdenum | 1,323 | 195 | 362 | 369 | 397 | 1,566 | 397 | 466 | 414 | 289 | 1,377 | 344 | ||||||||||||||||||||||||
| Payable metal in concentrate and doré sold | ||||||||||||||||||||||||||||||||||||
| Copper | 125,094 | 37,927 | 27,760 | 25,799 | 33,608 | 124,996 | 44,006 | 39,371 | 23,078 | 18,541 | 94,473 | 25,415 | ||||||||||||||||||||||||
| Gold | 335,342 | 92,734 | 73,232 | 61,295 | 108,081 | 276,893 | 104,840 | 74,799 | 47,533 | 49,720 | 213,415 | 47,256 | ||||||||||||||||||||||||
| Silver | 3,549,816 | 1,150,518 | 663,413 | 667,036 | 1,068,848 | 3,145,166 | 1,048,877 | 748,955 | 805,448 | 541,884 | 2,978,485 | 559,306 | ||||||||||||||||||||||||
| Zinc 3 | 25,120 | 5,261 | 8,607 | 5,133 | 6,119 | 28,779 | 7,385 | 7,125 | 8,641 | 5,628 | 59,043 | 8,230 | ||||||||||||||||||||||||
| Molybdenum | 1,287 | 182 | 343 | 347 | 415 | 1,462 | 468 | 426 | 314 | 254 | 1,352 | 421 | ||||||||||||||||||||||||
| Cash cost 1 | $ | 0.46 | $ | 0.45 | $ | 0.18 | $ | 1.14 | $ | 0.16 | $ | 0.80 | $ | 0.16 | $ | 1.10 | $ | 1.60 | $ | 0.85 | $ | 0.86 | $ | 1.08 | ||||||||||||
| Sustaining cash cost 1 | $ | 1.62 | $ | 1.37 | $ | 1.71 | $ | 2.65 | $ | 1.03 | $ | 1.72 | $ | 1.09 | $ | 1.89 | $ | 2.73 | $ | 1.83 | $ | 2.07 | $ | 2.21 | ||||||||||||
| All-in sustaining cash cost 1 | $ | 1.88 | $ | 1.53 | $ | 1.95 | $ | 3.07 | $ | 1.32 | $ | 1.92 | $ | 1.31 | $ | 2.04 | $ | 2.98 | $ | 2.07 | $ | 2.26 | $ | 2.41 | ||||||||||||
1Net debt, adjusted earnings (loss) per share attributable to owners, adjusted EBITDA, cash cost, sustaining cash cost and all-in sustaining cash cost per pound of copper produced, net of by-product credits, are non-GAAP financial performance measures with no standardized definition under IFRS. For further information and a detailed reconciliation, please see discussion under the "Non-GAAP Financial Performance Measures" section of this MD&A. The above table sets forth selected non-GAAP financial performance measures for each of our nine most recently completed quarters and three most recently completed years; detailed reconciliations for non-comparable prior periods can be found in our MD&A for these prior periods in the "Non-GAAP Financial Performance Measures" section of these documents.
2 Metal reported in concentrate is prior to deductions associated with smelter contract terms.
3 Includes refined zinc metal sold.
4 Annual consolidated results may not calculate based on amounts presented in this table due to rounding.
| 2024 5 | Q4 2024 | Q3 2024 | Q2 2024 | Q1 2024 | 2023 5 | Q4 2023 | Q3 2023 | Q2 2023 | Q1 2023 | 2022 5 | Q4 2022 | ||||||||||||||||||||||||||
| Peru Operations | |||||||||||||||||||||||||||||||||||||
| Constancia ore mined1 | tonnes | 15,046,190 | 4,186,058 | 3,022,931 | 5,277,654 | 2,559,547 | 9,265,954 | 973,176 | 1,242,198 | 3,647,399 | 3,403,181 | 25,840,435 | 5,614,918 | ||||||||||||||||||||||||
| Copper | % | 0.34 | 0.40 | 0.36 | 0.29 | 0.31 | 0.32 | 0.30 | 0.30 | 0.31 | 0.34 | 0.35 | 0.40 | ||||||||||||||||||||||||
| Gold | g/tonne | 0.04 | 0.04 | 0.04 | 0.03 | 0.04 | 0.04 | 0.04 | 0.04 | 0.04 | 0.04 | 0.04 | 0.04 | ||||||||||||||||||||||||
| Silver | g/tonne | 3.08 | 3.88 | 3.20 | 2.50 | 2.79 | 2.53 | 2.26 | 2.91 | 2.49 | 2.52 | 3.40 | 3.48 | ||||||||||||||||||||||||
| Molybdenum | % | 0.01 | 0.02 | 0.02 | 0.01 | 0.01 | 0.01 | 0.01 | 0.01 | 0.01 | 0.01 | 0.01 | 0.01 | ||||||||||||||||||||||||
| Pampacancha ore mined1 | tonnes | 9,317,499 | 4,037,264 | 1,777,092 | 1,288,789 | 2,214,354 | 14,756,416 | 5,556,613 | 5,894,013 | 2,408,495 | 897,295 | 8,319,250 | 3,771,629 | ||||||||||||||||||||||||
| Copper | % | 0.55 | 0.63 | 0.48 | 0.41 | 0.56 | 0.51 | 0.56 | 0.53 | 0.36 | 0.49 | 0.33 | 0.37 | ||||||||||||||||||||||||
| Gold | g/tonne | 0.32 | 0.38 | 0.27 | 0.20 | 0.32 | 0.33 | 0.32 | 0.30 | 0.34 | 0.52 | 0.29 | 0.29 | ||||||||||||||||||||||||
| Silver | g/tonne | 5.61 | 6.43 | 6.23 | 3.83 | 4.64 | 4.28 | 4.84 | 4.22 | 2.81 | 5.12 | 4.06 | 3.84 | ||||||||||||||||||||||||
| Molybdenum | % | 0.01 | 0.00 | 0.01 | 0.02 | 0.02 | 0.01 | 0.01 | 0.02 | 0.02 | 0.01 | 0.01 | 0.01 | ||||||||||||||||||||||||
| Strip Ratio | 1.78 | 1.22 | 2.62 | 1.74 | 1.95 | 1.51 | 1.26 | 1.36 | 1.74 | 1.84 | 1.13 | 0.97 | |||||||||||||||||||||||||
| Ore milled | tonnes | 31,933,624 | 7,999,453 | 8,137,248 | 7,718,962 | 8,077,962 | 30,720,929 | 7,939,044 | 7,895,109 | 7,223,048 | 7,663,728 | 30,522,294 | 7,795,735 | ||||||||||||||||||||||||
| Copper | % | 0.36 | 0.48 | 0.32 | 0.30 | 0.36 | 0.39 | 0.48 | 0.43 | 0.31 | 0.33 | 0.34 | 0.41 | ||||||||||||||||||||||||
| Gold | g/tonne | 0.14 | 0.20 | 0.11 | 0.07 | 0.15 | 0.16 | 0.25 | 0.21 | 0.09 | 0.08 | 0.09 | 0.12 | ||||||||||||||||||||||||
| Silver | g/tonne | 3.84 | 5.28 | 3.70 | 2.85 | 3.48 | 3.62 | 4.20 | 3.75 | 2.78 | 3.69 | 3.58 | 3.93 | ||||||||||||||||||||||||
| Molybdenum | % | 0.01 | 0.01 | 0.01 | 0.01 | 0.01 | 0.01 | 0.01 | 0.02 | 0.01 | 0.01 | 0.01 | 0.01 | ||||||||||||||||||||||||
| Copper recovery | % | 85.0 | 87.8 | 82.6 | 83.1 | 84.9 | 84.2 | 87.4 | 85.2 | 80.0 | 81.7 | 85.0 | 85.1 | ||||||||||||||||||||||||
| Gold recovery | % | 70.7 | 73.3 | 68.1 | 61.4 | 73.4 | 71.8 | 77.6 | 74.8 | 61.1 | 56.8 | 63.6 | 69.6 | ||||||||||||||||||||||||
| Silver recovery | % | 68.8 | 71.4 | 67.0 | 63.9 | 70.7 | 70.0 | 78.0 | 73.2 | 65.1 | 60.7 | 65.7 | 66.5 | ||||||||||||||||||||||||
| Molybdenum recovery | % | 41.7 | 37.1 | 39.0 | 46.3 | 43.2 | 35.8 | 33.6 | 37.2 | 40.5 | 34.8 | 34.8 | 37.7 | ||||||||||||||||||||||||
| Contained metal in concentrate | |||||||||||||||||||||||||||||||||||||
| Copper | tonnes | 99,001 | 33,988 | 21,220 | 19,217 | 24,576 | 100,487 | 33,207 | 29,081 | 17,682 | 20,517 | 89,395 | 27,047 | ||||||||||||||||||||||||
| Gold | ounces | 98,226 | 38,079 | 20,331 | 10,672 | 29,144 | 114,218 | 49,418 | 40,596 | 12,998 | 11,206 | 58,229 | 20,860 | ||||||||||||||||||||||||
| Silver | ounces | 2,708,262 | 969,502 | 648,209 | 450,833 | 639,718 | 2,505,229 | 836,208 | 697,211 | 419,642 | 552,167 | 2,309,352 | 655,257 | ||||||||||||||||||||||||
| Molybdenum | tonnes | 1,323 | 195 | 362 | 369 | 397 | 1,566 | 397 | 466 | 414 | 289 | 1,377 | 344 | ||||||||||||||||||||||||
| Payable metal sold | |||||||||||||||||||||||||||||||||||||
| Copper | tonnes | 88,138 | 28,775 | 18,803 | 16,806 | 23,754 | 96,213 | 31,200 | 27,490 | 21,207 | 16,316 | 79,805 | 23,789 | ||||||||||||||||||||||||
| Gold | ounces | 103,364 | 37,459 | 9,795 | 13,433 | 42,677 | 97,176 | 38,114 | 32,757 | 14,524 | 11,781 | 49,968 | 15,116 | ||||||||||||||||||||||||
| Silver | ounces | 2,343,820 | 824,613 | 365,198 | 400,302 | 753,707 | 2,227,419 | 703,679 | 460,001 | 671,532 | 392,207 | 2,045,678 | 411,129 | ||||||||||||||||||||||||
| Molybdenum | tonnes | 1,287 | 182 | 343 | 347 | 415 | 1,462 | 468 | 426 | 314 | 254 | 1,352 | 421 | ||||||||||||||||||||||||
| Unit cost 2,3,4 | $/tonne | $ | 12.91 | $ | 15.25 | $ | 12.78 | $ | 12.68 | $ | 10.92 | $ | 12.47 | $ | 12.24 | $ | 12.20 | $ | 14.07 | $ | 11.47 | $ | 12.78 | $ | 13.64 | ||||||||||||
| Peru cash cost3 | $/lb | $ | 1.18 | $ | 1.00 | $ | 1.80 | $ | 1.78 | $ | 0.43 | $ | 1.07 | $ | 0.54 | $ | 0.83 | $ | 2.14 | $ | 1.36 | $ | 1.58 | $ | 1.34 | ||||||||||||
| Peru sustaining cash cost3 | $/lb | $ | 1.86 | $ | 1.48 | $ | 2.78 | $ | 2.61 | $ | 1.06 | $ | 1.81 | $ | 1.21 | $ | 1.51 | $ | 3.06 | $ | 2.12 | $ | 2.35 | $ | 2.09 | ||||||||||||
1 Reported tonnes and grade for ore mined are estimates based on mine plan assumptions and may not fully reconcile to ore milled.
2 Reflects combined mine, mill and general and administrative ("G&A") costs per tonne of ore milled. Reflects the deduction of expected capitalized stripping costs.
3 Combined unit costs, cash cost, and sustaining cash cost per pound of copper produced, net of by-product credits, are non-GAAP financial performance measures with no standardized definition under IFRS. For further information and a detailed reconciliation, please see the discussion under the "Non-GAAP Financial Performance Measures" section of this MD&A. The above table sets forth selected non-GAAP financial performance measures for each of our nine most recently completed quarters and three most recently completed years; detailed reconciliations for non-comparable prior periods can be found in our MD&A for these prior periods in the "Non-GAAP Financial Performance Measures" section of these documents.
4 2022 combined unit costs exclude COVID-19 related costs.
5 Annual consolidated results may not calculate based on amounts presented in this table due to rounding.
| 2024 1 | Q4 2024 | Q3 2024 | Q2 2024 | Q1 2024 | 2023 1 | Q4 2023 | Q3 2023 | Q2 2023 | Q1 2023 | 2022 1 | Q4 2022 | |||||||||||||||||||||||||||
| Manitoba Operations | ||||||||||||||||||||||||||||||||||||||
| Lalor ore mined | tonnes | 1,626,935 | 422,454 | 411,295 | 385,478 | 407,708 | 1,526,729 | 372,384 | 367,491 | 413,255 | 373,599 | 1,516,203 | 369,453 | |||||||||||||||||||||||||
| Gold | g/tonne | 4.68 | 4.61 | 5.45 | 3.75 | 4.84 | 4.74 | 5.92 | 5.08 | 4.07 | 3.96 | 4.00 | 4.00 | |||||||||||||||||||||||||
| Copper | % | 0.85 | 0.95 | 0.91 | 0.69 | 0.84 | 0.86 | 1.04 | 1.02 | 0.81 | 0.57 | 0.73 | 0.73 | |||||||||||||||||||||||||
| Zinc | % | 2.84 | 2.95 | 2.73 | 2.76 | 2.92 | 3.00 | 2.20 | 3.31 | 3.14 | 3.32 | 3.14 | 2.17 | |||||||||||||||||||||||||
| Silver | g/tonne | 27.14 | 31.91 | 30.45 | 22.29 | 23.44 | 24.51 | 28.92 | 27.80 | 23.27 | 18.24 | 21.96 | 19.37 | |||||||||||||||||||||||||
| 777 ore mined | tonnes | - | - | - | - | - | - | - | - | - | - | 484,355 | - | |||||||||||||||||||||||||
| Gold | g/tonne | - | - | - | - | - | - | - | - | - | - | 1.66 | - | |||||||||||||||||||||||||
| Copper | % | - | - | - | - | - | - | - | - | - | - | 1.12 | - | |||||||||||||||||||||||||
| Zinc | % | - | - | - | - | - | - | - | - | - | - | 3.83 | - | |||||||||||||||||||||||||
| Silver | g/tonne | - | - | - | - | - | - | - | - | - | - | 20.85 | - | |||||||||||||||||||||||||
| Stall Concentrator: | ||||||||||||||||||||||||||||||||||||||
| Ore milled | tonnes | 893,510 | 222,004 | 222,621 | 229,527 | 219,358 | 965,567 | 228,799 | 255,516 | 238,633 | 242,619 | 968,638 | 204,350 | |||||||||||||||||||||||||
| Gold | g/tonne | 3.42 | 3.36 | 4.23 | 3.02 | 3.07 | 3.45 | 4.22 | 3.70 | 3.12 | 2.78 | 2.86 | 2.50 | |||||||||||||||||||||||||
| Copper | % | 0.71 | 0.73 | 0.89 | 0.59 | 0.64 | 0.74 | 0.73 | 0.77 | 0.85 | 0.59 | 0.71 | 0.61 | |||||||||||||||||||||||||
| Zinc | % | 4.33 | 4.62 | 4.12 | 4.05 | 4.54 | 4.36 | 3.20 | 4.88 | 4.47 | 4.81 | 4.70 | 3.43 | |||||||||||||||||||||||||
| Silver | g/tonne | 26.54 | 29.90 | 30.20 | 21.74 | 24.46 | 24.19 | 28.63 | 28.82 | 22.15 | 17.14 | 22.81 | 19.24 | |||||||||||||||||||||||||
| Gold recovery | % | 68.6 | 69.6 | 70.5 | 65.5 | 68.0 | 64.8 | 67.5 | 67.8 | 59.9 | 61.9 | 58.0 | 62.4 | |||||||||||||||||||||||||
| Copper recovery | % | 87.4 | 84.4 | 88.3 | 85.4 | 91.7 | 90.4 | 92.0 | 93.9 | 88.5 | 87.0 | 87.2 | 89.0 | |||||||||||||||||||||||||
| Zinc recovery | % | 86.2 | 81.7 | 88.1 | 87.1 | 88.4 | 82.2 | 78.5 | 82.6 | 82.2 | 84.4 | 86.6 | 90.1 | |||||||||||||||||||||||||
| Silver recovery | % | 56.8 | 55.1 | 57.8 | 54.2 | 59.8 | 61.4 | 61.8 | 64.9 | 60.3 | 56.3 | 56.8 | 56.6 | |||||||||||||||||||||||||
| New Britannia Concentrator: | ||||||||||||||||||||||||||||||||||||||
| Ore milled | tonnes | 715,198 | 185,592 | 191,298 | 167,899 | 170,409 | 596,912 | 165,038 | 146,927 | 141,905 | 143,042 | 542,269 | 141,142 | |||||||||||||||||||||||||
| Gold | g/tonne | 6.29 | 5.99 | 6.77 | 5.31 | 7.03 | 6.76 | 8.03 | 6.93 | 5.82 | 6.05 | 6.28 | 6.11 | |||||||||||||||||||||||||
| Copper | % | 1.04 | 1.17 | 0.93 | 0.94 | 1.13 | 1.03 | 1.46 | 1.22 | 0.77 | 0.61 | 0.81 | 0.91 | |||||||||||||||||||||||||
| Zinc | % | 0.99 | 1.08 | 1.12 | 0.92 | 0.82 | 0.84 | 0.85 | 0.90 | 0.85 | 0.76 | 0.80 | 0.67 | |||||||||||||||||||||||||
| Silver | g/tonne | 27.78 | 33.97 | 30.24 | 24.42 | 21.60 | 25.11 | 27.97 | 23.88 | 25.79 | 22.39 | 20.97 | 22.09 | |||||||||||||||||||||||||
| Gold recovery - concentrate and doré | % | 89.7 | 90.2 | 90.0 | 90.0 | 88.6 | 88.6 | 89.0 | 88.8 | 88.6 | 87.9 | - | - | |||||||||||||||||||||||||
| Copper recovery | % | 93.6 | 91.3 | 92.8 | 94.4 | 96.2 | 93.3 | 91.6 | 97.4 | 91.2 | 91.7 | 90.7 | 89.3 | |||||||||||||||||||||||||
| Silver recovery - concentrate and doré | % | 80.9 | 79.6 | 79.9 | 83.1 | 82.0 | 81.5 | 83.2 | 82.0 | 79.6 | 80.9 | - | - | |||||||||||||||||||||||||
| Flin Flon Concentrator: | ||||||||||||||||||||||||||||||||||||||
| Ore milled | tonnes | - | - | - | - | - | - | - | - | - | - | 497,344 | - | |||||||||||||||||||||||||
| Gold | g/tonne | - | - | - | - | - | - | - | - | - | - | 1.67 | - | |||||||||||||||||||||||||
| Copper | % | - | - | - | - | - | - | - | - | - | - | 1.11 | - | |||||||||||||||||||||||||
| Zinc | % | - | - | - | - | - | - | - | - | - | - | 3.87 | - | |||||||||||||||||||||||||
| Silver | g/tonne | - | - | - | - | - | - | - | - | - | - | 21.00 | - | |||||||||||||||||||||||||
| Gold recovery | % | - | - | - | - | - | - | - | - | - | - | 57.1 | - | |||||||||||||||||||||||||
| Copper recovery | % | - | - | - | - | - | - | - | - | - | - | 86.7 | - | |||||||||||||||||||||||||
| Zinc recovery | % | - | - | - | - | - | - | - | - | - | - | 83.0 | - | |||||||||||||||||||||||||
| Silver recovery | % | - | - | - | - | - | - | - | - | - | - | 51.8 | - | |||||||||||||||||||||||||
1 Annual consolidated results may not calculate based on amounts presented in this table due to rounding.
| 2024 4 | Q4 2024 | Q3 2024 | Q2 2024 | Q1 2024 | 2023 4 | Q4 2023 | Q3 2023 | Q2 2023 | Q1 2023 | 2022 4 | Q4 2022 | ||||||||||||||||||||||||||
| Manitoba Operations (continued) | |||||||||||||||||||||||||||||||||||||
| Total Manitoba contained metal in concentrate and doré produced5 | |||||||||||||||||||||||||||||||||||||
| Gold | ounces | 214,225 | 51,438 | 62,468 | 43,488 | 56,831 | 187,363 | 59,863 | 56,213 | 35,253 | 36,034 | 161,471 | 33,060 | ||||||||||||||||||||||||
| Copper | tonnes | 12,536 | 3,347 | 3,398 | 2,642 | 3,149 | 12,154 | 3,735 | 3,580 | 2,794 | 2,045 | 14,778 | 2,258 | ||||||||||||||||||||||||
| Zinc | tonnes | 33,339 | 8,385 | 8,069 | 8,087 | 8,798 | 34,642 | 5,747 | 10,291 | 8,758 | 9,846 | 55,381 | 6,326 | ||||||||||||||||||||||||
| Silver | ounces | 995,090 | 283,223 | 281,397 | 210,647 | 219,823 | 851,723 | 255,579 | 264,752 | 180,750 | 150,642 | 851,942 | 139,758 | ||||||||||||||||||||||||
| Total Manitoba payable metal sold in concentrate and doré | |||||||||||||||||||||||||||||||||||||
| Gold | ounces | 212,243 | 50,239 | 57,238 | 42,763 | 62,003 | 171,297 | 63,635 | 36,713 | 33,009 | 37,939 | 163,447 | 32,140 | ||||||||||||||||||||||||
| Copper | tonnes | 11,602 | 3,321 | 2,931 | 2,429 | 2,921 | 10,708 | 3,687 | 2,925 | 1,871 | 2,225 | 14,668 | 1,626 | ||||||||||||||||||||||||
| Zinc1 | tonnes | 25,120 | 5,261 | 8,607 | 5,133 | 6,119 | 28,779 | 7,385 | 7,125 | 8,641 | 5,628 | 59,043 | 8,230 | ||||||||||||||||||||||||
| Silver | ounces | 956,460 | 282,158 | 244,974 | 197,486 | 231,841 | 728,304 | 246,757 | 197,952 | 133,916 | 149,677 | 932,807 | 148,177 | ||||||||||||||||||||||||
| Combined unit cost 2,3 | C$/tonne | $ | 226 | $ | 233 | $ | 211 | $ | 225 | $ | 235 | $ | 217 | $ | 216 | $ | 217 | $ | 220 | $ | 216 | $ | 195 | $ | 241 | ||||||||||||
| Gold cash cost 3 | $/oz | $ | 606 | $ | 607 | $ | 372 | $ | 771 | $ | 736 | $ | 727 | $ | 434 | $ | 670 | $ | 1,097 | $ | 938 | $ | 297 | $ | 922 | ||||||||||||
| Sustaining gold cash cost 3 | $/oz | $ | 868 | $ | 908 | $ | 553 | $ | 1,163 | $ | 950 | $ | 1,077 | $ | 788 | $ | 939 | $ | 1,521 | $ | 1,336 | $ | 1,091 | $ | 1,795 | ||||||||||||
1 Includes refined zinc metal sold.
2 Reflects combined mine, mill and G&A costs per tonne of milled ore.
3 Combined unit costs, cash cost, and sustaining cash cost per pound of copper produced, cash cost, and sustaining cash cost per ounce of gold produced, net of by-product credits, are non-GAAP financial performance measures with no standardized definition under IFRS. For further information and a detailed reconciliation, please see the discussion under the "Non-GAAP Financial Performance Measures" section of this MD&A. The above table sets forth selected non-GAAP financial performance measures for each of our nine most recently completed quarters and three most recently completed years; detailed reconciliations for non-comparable prior periods can be found in our MD&A for these prior periods in the "Non-GAAP Financial Performance Measures" section of these documents.
4 Annual consolidated results may not calculate based on amounts presented in this table due to rounding.
5 Metal reported in concentrate is prior to deductions associated with smelter terms
| 2024 6 | Q4 2024 | Q3 2024 | Q2 2024 | Q1 2024 | 2023 6 | Q4 2023 | Q3 2023 | Q2 2023 5 | Q1 2023 | 2022 | Q4 2022 | ||||||||||||||||||||||||||
| British Columbia Operations 4 | |||||||||||||||||||||||||||||||||||||
| Ore mined1 | tonnes | 11,360,125 | 2,374,044 | 3,098,863 | 2,164,722 | 3,722,496 | 6,975,389 | 2,627,398 | 3,792,568 | 555,423 | - | - | - | ||||||||||||||||||||||||
| Strip Ratio | 5.98 | 7.36 | 6.05 | 7.61 | 4.10 | 3.82 | 5.34 | 2.96 | - | - | - | - | |||||||||||||||||||||||||
| Ore milled | tonnes | 12,656,679 | 2,880,927 | 3,363,176 | 3,232,427 | 3,180,149 | 6,862,152 | 3,261,891 | 3,158,006 | 442,255 | - | - | - | ||||||||||||||||||||||||
| Copper | % | 0.25 | 0.26 | 0.24 | 0.25 | 0.27 | 0.35 | 0.33 | 0.36 | 0.36 | - | - | - | ||||||||||||||||||||||||
| Gold | g/tonne | 0.08 | 0.09 | 0.09 | 0.07 | 0.07 | 0.07 | 0.06 | 0.08 | 0.08 | - | - | - | ||||||||||||||||||||||||
| Silver | g/tonne | 0.96 | 0.92 | 0.73 | 1.01 | 1.19 | 1.36 | 1.36 | 1.40 | 1.07 | - | - | - | ||||||||||||||||||||||||
| Copper recovery | % | 82.4 | 79.5 | 84.1 | 82.3 | 83.4 | 79.7 | 78.8 | 80.90 | 77.69 | - | - | - | ||||||||||||||||||||||||
| Gold recovery | % | 60.5 | 55.8 | 67.3 | 57.2 | 61.8 | 55.9 | 54.1 | 56.10 | 67.90 | - | - | - | ||||||||||||||||||||||||
| Silver recovery | % | 71.8 | 69.0 | 71.2 | 73.9 | 72.4 | 73.0 | 73.8 | 71.30 | 78.60 | - | - | - | ||||||||||||||||||||||||
| Contained metal in concentrate produced | |||||||||||||||||||||||||||||||||||||
| Copper | tonnes | 26,406 | 5,927 | 6,736 | 6,719 | 7,024 | 19,050 | 8,508 | 9,303 | 1,239 | - | - | - | ||||||||||||||||||||||||
| Gold | ounces | 19,789 | 4,644 | 6,274 | 4,454 | 4,417 | 8,848 | 3,495 | 4,608 | 745 | - | - | - | ||||||||||||||||||||||||
| Silver | ounces | 280,499 | 58,933 | 55,963 | 77,227 | 88,376 | 218,282 | 105,295 | 101,069 | 11,918 | - | - | - | ||||||||||||||||||||||||
| Payable metal | |||||||||||||||||||||||||||||||||||||
| Copper | tonnes | 25,354 | 5,831 | 6,026 | 6,564 | 6,933 | 18,075 | 9,119 | 8,956 | - | - | - | - | ||||||||||||||||||||||||
| Gold | ounces | 19,735 | 5,036 | 6,199 | 5,099 | 3,401 | 8,420 | 3,091 | 5,329 | - | - | - | - | ||||||||||||||||||||||||
| Silver | ounces | 249,536 | 43,747 | 53,241 | 69,248 | 83,300 | 189,443 | 98,441 | 91,002 | - | - | - | - | ||||||||||||||||||||||||
| Combined unit cost 2,3 | C$/tonne | $ | 20.39 | $ | 23.22 | $ | 15.58 | $ | 19.65 | $ | 23.67 | $ | 21.38 | $ | 20.90 | $ | 24.88 | - | - | - | - | ||||||||||||||||
| Cash cost3 | $/lb | $ | 2.74 | $ | 3.00 | $ | 1.81 | $ | 2.67 | $ | 3.49 | $ | 2.49 | $ | 2.67 | $ | 2.67 | - | - | - | - | ||||||||||||||||
| Sustaining cash cost 3 | $/lb | $ | 5.29 | $ | 5.76 | $ | 5.06 | $ | 5.56 | $ | 4.85 | $ | 3.41 | $ | 3.93 | $ | 3.39 | - | - | - | - | ||||||||||||||||
1 Reported tonnes and grade for ore mined are estimates based on mine plan assumptions and may not fully reconcile to ore milled.
2 Reflects combined mine, mill and general and administrative ("G&A") costs per tonne of ore milled. Reflects the deduction of expected capitalized stripping costs.
3 Combined unit costs, cash cost, and sustaining cash cost per pound of copper produced, net of by-product credits, are non-GAAP financial performance measures with no standardized definition under IFRS. For further information and a detailed reconciliation, please see the discussion under the "Non-GAAP Financial Performance Measures" section of this MD&A. The above table sets forth selected non-GAAP financial performance measures for each of our nine most recently completed quarters and three most recently completed years; detailed reconciliations for non-comparable prior periods can be found in our MD&A for these prior periods in the "Non-GAAP Financial Performance Measures" section of these documents.
4 Includes 100% of Copper Mountain mine production. Hudbay owns 75% of Copper Mountain mine.
5 Production results from Copper Mountain operations represents the period from the June 20, 2023 acquisition date through to the end of the second quarter of 2023.
6 Annual consolidated results may not calculate based on amounts presented in this table due to rounding.