Exhibit 99.1
Pre-Feasibility Study Technical Report, on the Lalor Deposit, Snow Lake, Manitoba, Canada
Effective Date: March 29th, 2012

25 York Street, Suite 800
Toronto, Ontario
Canada M5J 2V5
Prepared by: | Rob Carter P. Eng. |
| Manager, Project Evaluation, Hudbay |
|
|
| Tim Schwartz P.Geo. |
| Senior Geologist, Hudbay |
|
|
| Steve West P. Eng. |
| Superintendent, Environmental Control, Hudbay |
|
|
| Karl Hoover P. Eng |
| Manager, Lalor Concentrator Project, Hudbay. |
TABLE OF CONTENTS
1.0 | SUMMARY | 1-1 | |
| 1.1 | Summary | 1-1 |
| 1.2 | Technical Summary | 1-9 |
2.0 | INTRODUCTION AND TERMS OF REFERENCE | 2-1 | |
| 2.1 | Unit Abbreviations | 2-2 |
| 2.2 | Name Abbreviations | 2-4 |
3.0 | RELIANCE ON OTHER EXPERTS | 3-1 | |
4.0 | PROPERTY DESCRIPTION AND LOCATION | 4-1 | |
| 4.1 | Land Tenure | 4-1 |
| 4.2 | Land Use Permitting | 4-5 |
5.0 | ACCESSIBILITY, CLIMATE, LOCAL RESOURCES, INFRASTRUCTURE AND PHYSIOGRAPHY | 5-1 | |
| 5.1 | Accessibility | 5-1 |
| 5.2 | Climate | 5-1 |
| 5.3 | Local Resources | 5-3 |
| 5.4 | Infrastructure | 5-3 |
| 5.5 | Physiography | 5-4 |
6.0 | HISTORY | 6-1 | |
| 6.1 | Exploration in the Chisel Basin Area | 6-1 |
| 6.2 | Historical Mining in the Snow Lake Area | 6-1 |
7.0 | GEOLOGICAL SETTING AND MINERALIZATION | 7-1 | |
| 7.1 | Regional Geology | 7-1 |
| 7.2 | Property Geology | 7-3 |
| 7.3 | Base Metal Mineralization | 7-7 |
| 7.4 | Gold Mineralization | 7-9 |
8.0 | DEPOSIT TYPE | 8-1 | |
9.0 | EXPLORATION | 9-1 | |
| 9.1 | Borehole Electromagnetic (EM) Surveys | 9-1 |
10.0 | DRILLING | 10-1 | |
| 10.1 | Surveying of Property Grid and Drill Hole Collars | 10-3 |
| 10.2 | Downhole Surveying | 10-4 |
11.0 | SAMPLING PREPARATION, ANALYSES, AND SECURITY | 11-8 | |
| 11.1 | Laboratory/Laboratories Used | 11-8 |
| 11.2 | Sample Receipt | 11-8 |
| 11.3 | Sample Preparation | 11-8 |
| 11.4 | Assay Methodology | 11-9 |
| 11.4.1 | Hudbay | 11-9 |
| 11.4.2 | Acme Analytical Laboratories Ltd | 11-10 |
| 11.5 | Security | 11-12 |
12.0 | DATA VERIFICATION | 12-14 | |
| 12.1 | Quality Assurance / Quality Control | 12-14 |
| 12.2 | Blanks | 12-14 |
| 12.3 | Certified Standards | 12-15 |
| 12.4 | Duplicates | 12-16 |
| 12.5 | Gold | 12-18 |
| 12.6 | Site Visit | 12-20 |
| 12.7 | Core Review | 12-20 |
| 12.8 | Drilling Database | 12-21 |
| 12.9 | Mineral Resource Database Management | 12-22 |
13.0 | MINERAL PROCESSING AND METALLURGICAL TESTING | 13-1 | |
| 13.1 | Metallurgical Testing | 13-1 |
14.0 | MINERAL RESOURCE ESTIMATES | 14-1 | |
| 14.1 | Zinc Rich Base Metal Resources | 14-1 |
| 14.1.1 | Zinc Rich Base Metal Mineral Resources Summary | 14-1 |
| 14.1.2 | Zinc Equivalency | 14-1 |
| 14.1.3 | Wireframe Models | 14-2 |
| 14.1.4 | Bulk Density | 14-6 |
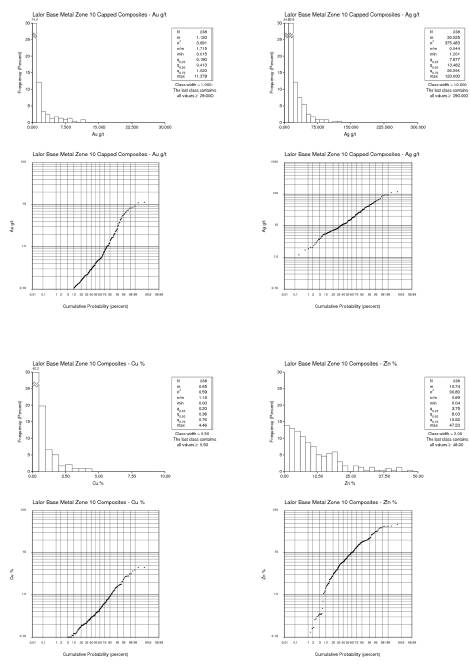
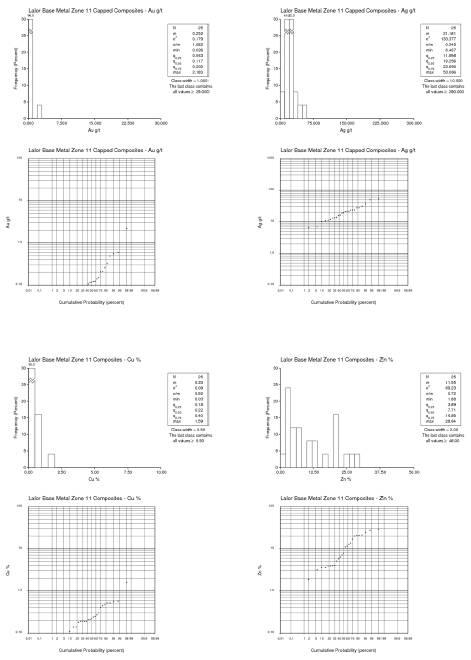
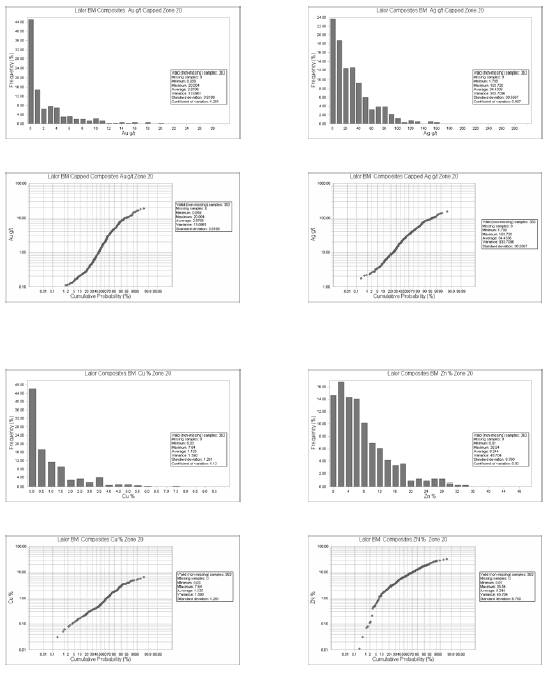
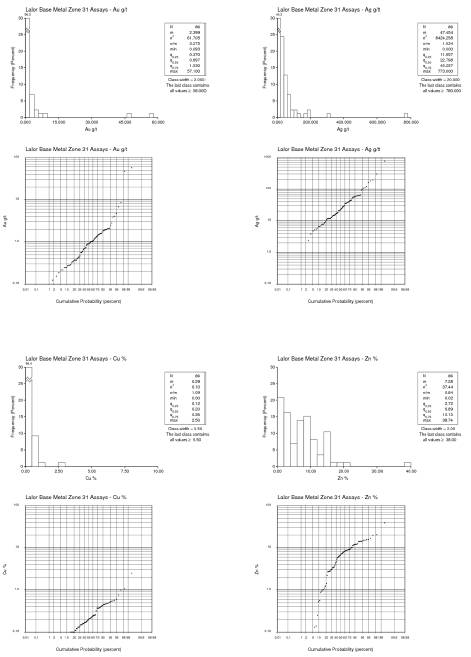
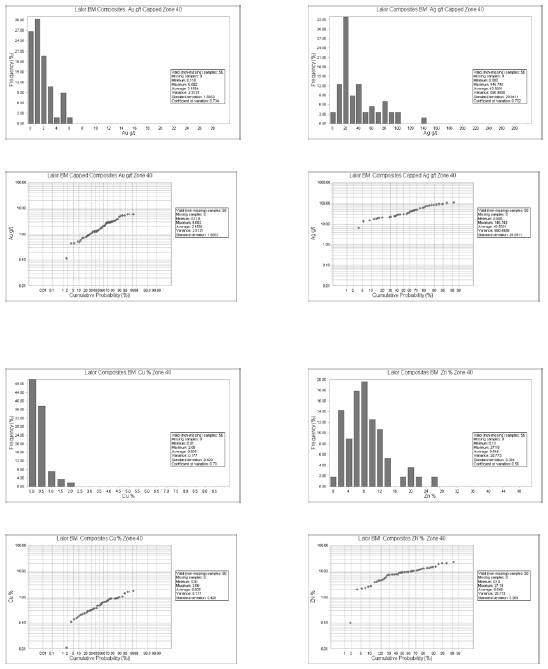
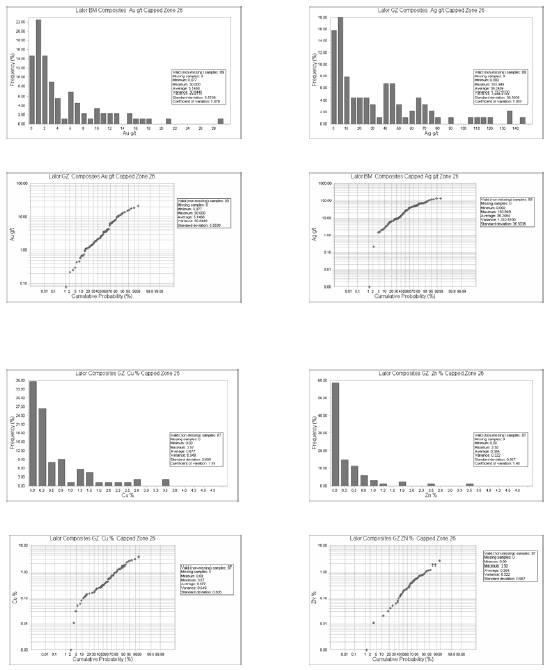
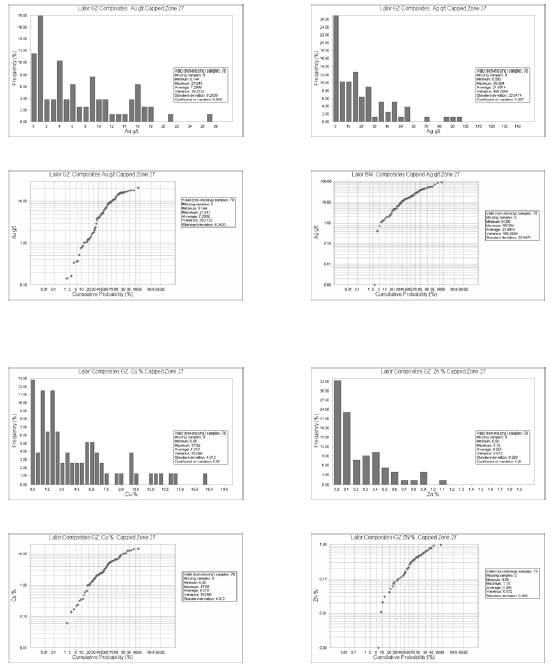
| 14.1.5 | Assay Statistics | 14-9 |
| 14.1.6 | Capping of High Grades | 14-12 |
| 14.1.7 | Composites | 14-13 |
| 14.1.8 | Composite Restriction | 14-15 |
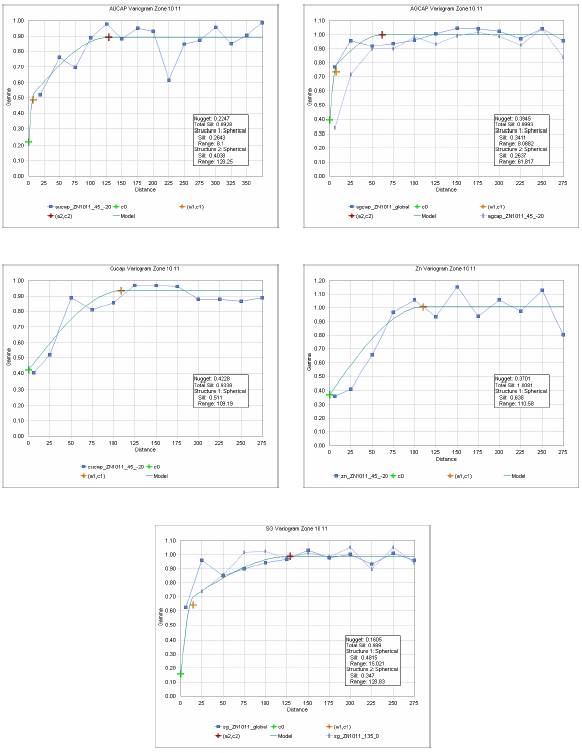
| 14.1.9 | Mineralization Continuity and Variography | 14-18 |
| 14.1.10 | Resource Block Model | 14-19 |
| 14.1.11 | Interpolation Plan | 14-20 |
| 14.1.12 | Block Model Validation | 14-21 |
| 14.1.13 | Visual Comparison | 14-21 |
| 14.1.14 | Method Comparison | 14-23 |
| 14.1.15 | Swath Plots | 14-23 |
| 14.1.16 | Comparison to October 2009 Mineral Resource Estimate | 14-26 |
| 14.1.17 | Mineral Resource Classification | 14-26 |
| 14.2 | Gold Zone Resource | 14-32 |
| 14.2.1 | Gold Rich Mineral Resources Summary | 14-32 |
| 14.2.2 | Wireframe Models | 14-32 |
| 14.2.3 | Bulk Density | 14-36 |
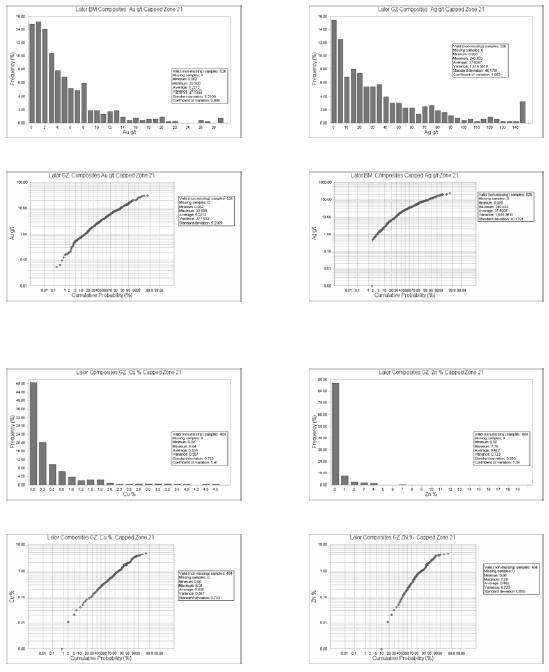
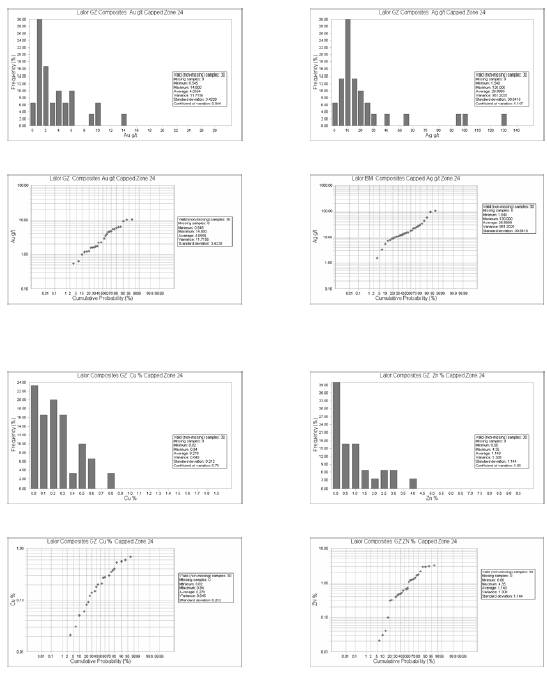
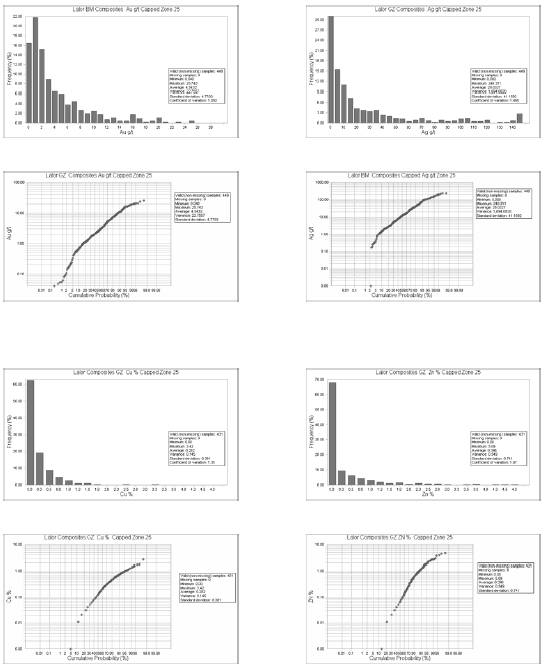
| 14.2.4 | Assay Statistics | 14-39 |
| 14.2.5 | Capping of High Grades | 14-41 |
| 14.2.6 | Composites | 14-44 |
| 14.2.7 | Composite Restriction | 14-46 |
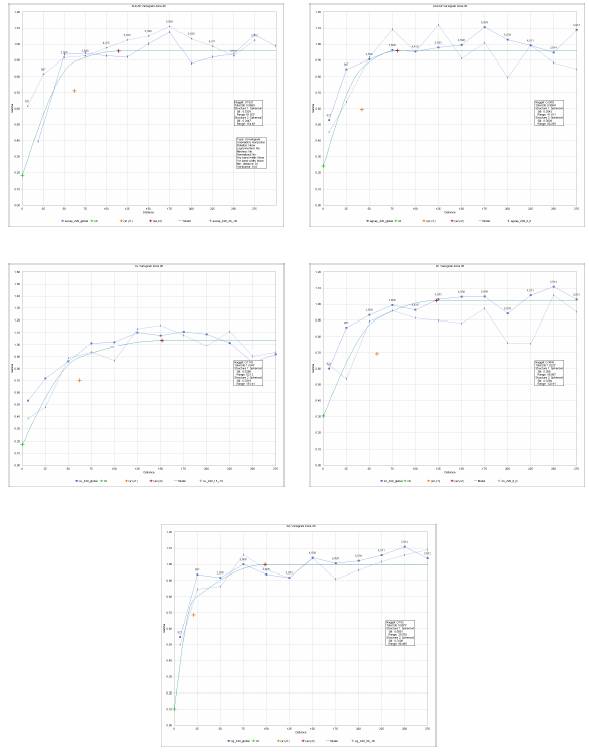
| 14.2.8 | Mineralization Continuity and Variography | 14-49 |
| 14.2.9 | Resource Block Model | 14-49 |
| 14.2.10 | Interpolation Plan | 14-50 |
| 14.2.11 | Block Model Validation | 14-51 |
| 14.2.12 | Visual Comparison | 14-51 |
| 14.2.13 | Method Comparison | 14-53 |
| 14.2.14 | Swath Plots | 14-53 |
| 14.2.15 | Comparison to October 2009 Mineral Resource Estimate | 14-53 |
| 14.2.16 | Mineral Resource Classification | 14-54 |
| 14.3 | Mineral Resource Summary | 14-61 |
15.0 | MINERAL RESERVE ESTIMATES | 15-1 | |
| 15.1 | Dilution and Recovery | 15-3 |
| 15.1.1 | Internal Dilution | 15-3 |
| 15.1.2 | External Dilution | 15-4 |
| 15.1.3 | Mining Recovery | 15-5 |
| 15.2 | Reserve Economics | 15-6 |
16.0 | MINING METHODS | 16-1 | |
| 16.1 | Introduction | 16-1 |
| 16.2 | Lateral Development | 16-1 |
| 16.3 | Vertical Development | 16-2 |
| 16.4 | Stope Mining | 16-2 |
| 16.4.1 | Mechanized Cut & Fill Mining | 16-3 |
| 16.4.2 | Mechanized Post Pillar Cut & Fill Mining | 16-3 |
| 16.4.3 | Longhole Open Stope Mining | 16-5 |
| 16.4.4 | Sill Pillar Mining | 16-6 |
| 16.5 | Backfill | 16-6 |
| 16.6 | Ore Removal | 16-7 |
| 16.7 | Surface Infrastructure | 16-7 |
| 16.8 | Geotechnical Design | 16-10 |
| 16.8.1 | Short Term Requirements | 16-10 |
| 16.8.2 | Long Term Requirements | 16-11 |
| 16.9 | Support Systems | 16-12 |
| 16.9.1 | Developed in a Single Pass | 16-13 |
| 16.9.2 | Sill Pillar Support | 16-13 |
| 16.10 | Underground Development | 16-14 |
| 16.10.1 | Lateral Development | 16-14 |
| 16.10.2 | Vertical Development | 16-16 |
| 16.11 | Diamond Drilling | 16-17 |
| 16.12 | Hydrogeological Testing | 16-18 |
| 16.13 | Stope Design | 16-18 |
| 16.13.1 | Post Pillar Design for Post Pillar Cut & Fill Option | 16-19 |
| 16.13.2 | Vertical Sequence | 16-20 |
| 16.13.3 | Horizontal Sequence | 16-20 |
| 16.14 | Dilution and Recovery | 16-21 |
| 16.15 | Mining Operations | 16-21 |
| 16.15.1 | Mine Equipment | 16-22 |
| 16.15.2 | Production Schedules | 16-23 |
| 16.15.3 | Mine Ventilation | 16-25 |
| 16.15.4 | Mine Power | 16-30 |
| 16.16 | Manpower | 16-32 |
| 16.16.1 | Mine Construction | 16-32 |
| 16.16.2 | Mine Operation | 16-33 |
| 16.17 | Mine Safety & Health | 16-34 |
| 16.17.1 | Refuge Stations | 16-35 |
| 16.17.2 | SECOND EGRESS | 16-35 |
17.0 | RECOVERY METHODS | 17-1 | |
| 17.1 | Introduction | 17-1 |
| 17.2 | Lalor Concentrator Description | 17-1 |
18.0 | PROJECT INFRASTRUCTURE | 18-1 | |
19.0 | MARKET STUDIES AND CONTRACTS | 19-1 | |
20.0 | ENVIRONMENTAL STUDIES, PERMITTING, AND SOCIAL OR COMMUNITY IMPACT | 20-1 | |
| 20.1 | Environmental Studies and Planning | 20-1 |
| 20.2 | Waste, Tailings Disposal and Water Management | 20-1 |
| 20.3 | Permitting Requirements | 20-1 |
| 20.4 | Mineral Lease and Surface Lease | 20-2 |
| 20.5 | Community Support | 20-3 |
| 20.6 | Aboriginal People and First Nations | 20-3 |
| 20.7 | Heritage Resources | 20-4 |
| 20.8 | Mine Closure Requirements and Plans | 20-4 |
21.0 | CAPITAL AND OPERATING COSTS | 21-1 | |
| 21.1 | Capital Costs | 21-1 |
| 21.2 | OPERATING COSTS | 21-2 | |
22.0 | ECONOMIC ANALYSIS | 22-1 | ||
| 22.1 | Cash Flow, NPV, IRR, and Payback Period | 22-1 | |
| 22.2 | Principal Assumptions | 22-6 | |
| 22.3 | Sensitivity Analysis | 22-9 | |
| 22.4 | Taxes and Royalties | 22-10 | |
23.0 | ADJACENT PROPERTIES | 23-11 | ||
24.0 | OTHER RELEVENT DATA AND INFORMATION | 24-12 | ||
25.0 | INTERPRETATION AND CONCLUSIONS | 25-13 | ||
26.0 | RECOMMENDATIONS | 26-17 | ||
27.0 | REFERENCES | 27-1 | ||
28.0 | SIGNATURE PAGE | 28-1 | ||
29.0 | CERTIFICATES OF QUALIFIED PERSONS | 29-1 | ||
|
| Certificate of Robert Carter | 29-1 | |
|
| Certificate of Tim Schwartz | 29-3 | |
|
| Certificate of Karl Hoover | 29-5 | |
|
| Certificate of Stephen West | 29-7 | |
30.0 | Appendix 1 | 30-1 | ||
| Assay Sample Statistics | 30-1 | ||
31.0 | Appendix 2 | 31-1 | ||
| Composite Statistics | 31-1 | ||
32.0 | Appendix 3 | 32-14 | ||
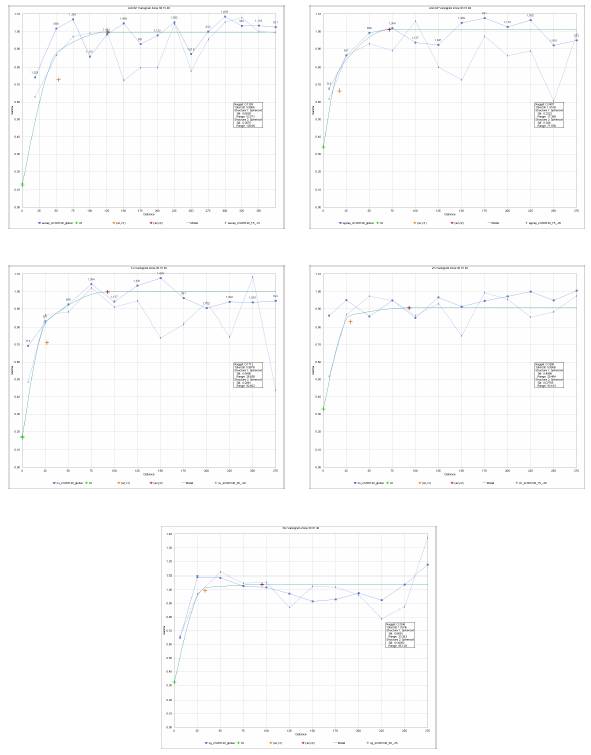
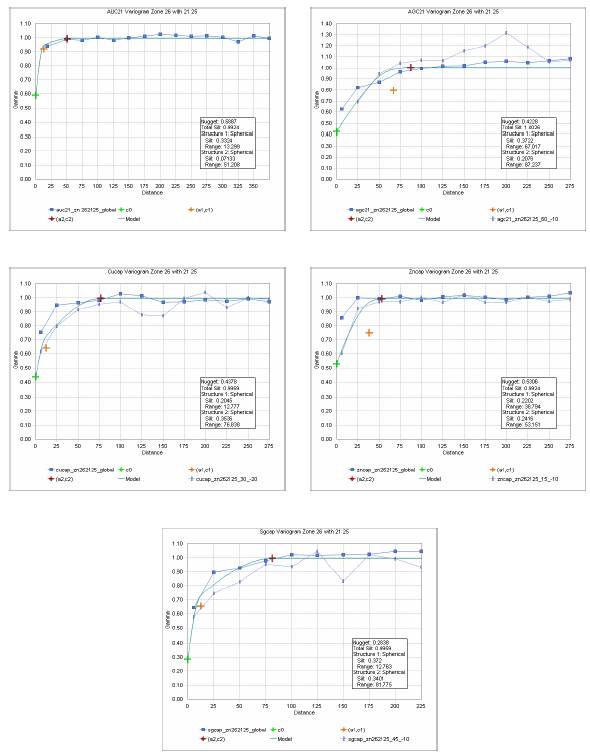
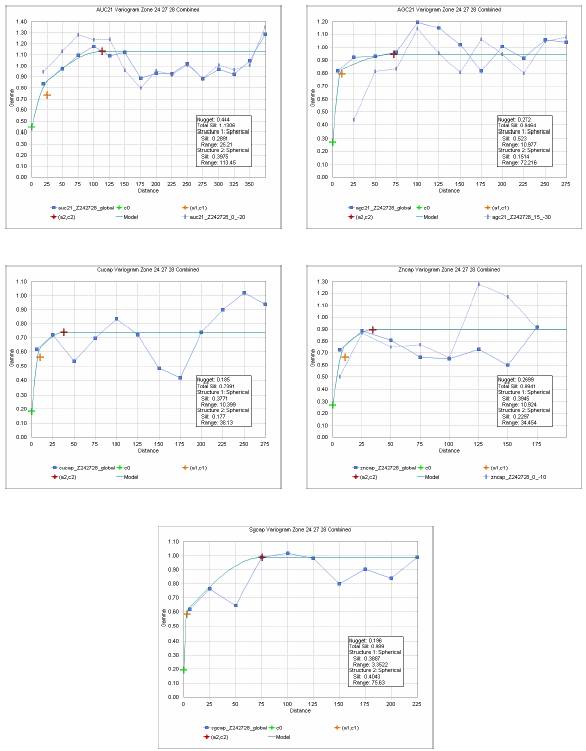
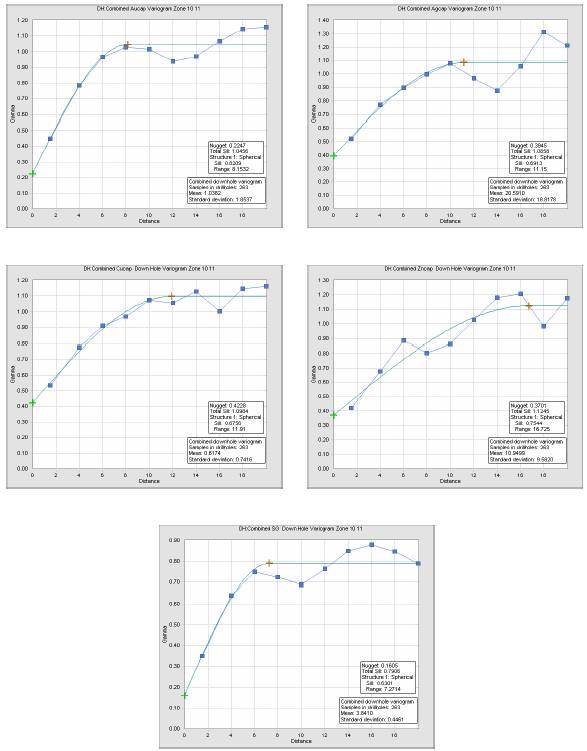
| Correlograms | 32-14 | ||
LIST OF TABLES
Table 1-1 | Mineral Reserves Summary |
| 1-2 |
Table 1-2 | base Case Comparison |
| 1-4 |
Table 1-3 | Lalor Resource summary |
| 1-13 |
Table 1-4 | Projected Recoveries |
| 1-20 |
Table 1-5 | Capital Costs |
| 1-24 |
Table 1-6 | Operating Costs |
| 1-25 |
Table 1-7 | Pre-tax Economic Model Results |
| 1-26 |
Table 4-1 | Property Mineral Claims |
| 4-1 |
Table 4-2 | Property Mineral Leases |
| 4-2 |
Table 4-3 | Permits |
| 4-5 |
Table 7-1 | Summary of Zinc Rich Interpreted Wireframes |
| 7-8 |
Table 7-2 | Summary of Gold Interpreted Wireframes |
| 7-10 |
Table 10-1 | Summary of Diamond Drill Holes With Assay Results as of JanUary 1, 2012 |
| 10-3 |
Table 11-1 | Hudbay Laboratory Detection Limits |
| 11-9 |
Table 11-2 | Acme Elemental Detection Limits |
| 11-12 |
Table 12-1 | Blank Assay Results Hudbay |
| 12-15 |
Table 12-2 | Blank Assay Results ACME |
| 12-15 |
Table 12-3 | Comparison Hudbay Assay and Acme Check Assay For Gold |
| 12-20 |
Table 13-1 | Metallurgical Sample Head Grades |
| 13-2 |
Table 13-2 | Results of Two-Stage Cleaner Testing |
| 13-4 |
Table 13-3 | Make-up of Master Composite |
| 13-5 |
Table 13-4 | Ore Hardness Testing Summary |
| 13-5 |
Table 13-5 | Locked Cycle Test Conditions - Master Composites |
| 13-6 |
Table 13-6 | Locked Cycle Test Results — Master Composites |
| 13-7 |
Table 13-7 | Make-up of Variability Composites |
| 13-8 |
Table 13-8 | Locked Cycle Test Conditions — Variability Composites |
| 13-8 |
Table 13-9 | Locked Cycle Test Results — Variability Composites |
| 13-9 |
Table 13-10 | Make-up of New Master Composite |
| 13-11 |
Table 13-11 | Locked Cycle Test Conditions — Phase 3 |
| 13-11 |
Table 13-12 | Locked Cycle Test Results — Phase 3 |
| 13-12 |
Table 13-13 | Minor Element Analyses of Concentrates |
| 13-13 |
Table 13-14 | Projected Recoveries |
| 13-14 |
Table 14-1 | Metal Price and Metal Recovery Assumptions |
| 14-2 |
Table 14-2 | Summary of Zinc Rich Interpreted Wireframes |
| 14-3 |
Table 14-3 | Summary of Measured SG Values |
| 14-7 |
Table 14-4 | Proportion of Metal in Minerals |
| 14-8 |
Table 14-5 | Summary of Stoichiometric Calculated SG Values |
| 14-9 |
Table 14-6 | Range of Assay Values By Zinc Rich Mineralized Zone |
| 14-9 |
Table 14-7 | High Grade Capping Summary |
| 14-12 |
Table 14-8 | Composite Statistics By Zinc Rich Mineralized Zone |
| 14-13 |
Table 14-9 | High Grade Composite Restriction Summary |
| 14-16 |
Table 14-10 | Lalor Base Metal Variography Parameters |
| 14-19 |
Table 14-11 | Block Model Geometries |
| 14-20 |
Table 14-12 | Search Parameters Base Metals |
| 14-20 |
Table 14-13 | Global Comparison by Estimation Method |
| 14-23 |
Table 14-14 | Indicated Comparison October 2009 to October 2011 Estimates |
| 14-26 |
Table 14-15 | Inferred Comparison October 2009 to October 2011 Estimates |
| 14-26 |
Table 14-16 | Summary of Gold Interpreted Wireframes |
| 14-33 |
Table 14-17 | Summary of Measured SG Values |
| 14-37 |
Table 14-18 | Proportion of Metal in Minerals |
| 14-38 |
Table 14-19 | Summary of Stoichiometric Calculated SG Values |
| 14-39 |
Table 14-20 | Range of Assay Values By Gold Zone |
| 14-39 |
Table 14-21 | High Grade Capping Summary |
| 14-42 |
Table 14-22 | Composite Statistics by Gold Mineralized Zone |
| 14-44 |
Table 14-23 | High Grade Composite Restriction Summary |
| 14-47 |
Table 14-24 | Lalor Gold Variography Parameters |
| 14-49 |
Table 14-25 | Block Model Geometries |
| 14-50 |
Table 14-26 | Search Parameters Gold |
| 14-51 |
Table 14-27 | Global Comparison by Estimation Method |
| 14-53 |
Table 14-30 | Lalor Resource summary |
| 14-61 |
Table 15-1 | Metallurgical Assumptions |
| 15-2 |
Table 15.2 | Mineral Reserves Summary |
| 15-2 |
Table 15-3 | Dilution Factors |
| 15-3 |
Table 15-4 | Mining Recovery Factors |
| 15-5 |
Table 15-5 | Copper Concentrate Net Revenue Assumptions |
| 15-6 |
Table 15-6 | Zinc Concentrate & Secondaries Revenue Assumptions |
| 15-6 |
Table 15-7 | Reserve Sensitivity to NSR |
| 15-7 |
Table 15-8 | Net Smelter Return Calculations |
| 15-1 |
Table 16-1 | Lateral Jumbo Development |
| 16-10 |
Table 16-2 | Lateral Jumbo Development |
| 16-16 |
Table 16-3 | Vertical Development |
| 16-17 |
Table 16-4 | Mine Equipment |
| 16-22 |
Table 16-5 | LOM Production Schedule |
| 16-24 |
Table 16-6 | LOM Concentrate Production BY YEAR |
| 16-24 |
Table 16-7 | Mine Construction Manpower |
| 16-33 |
Table 16-8 | Mine & Mill Operations Manpower |
| 16-34 |
Table 17-1 | Estimated Water Consumption |
| 17-5 |
Table 17-2 | Estimated Grinding Media and Reagent Consumption |
| 17-6 |
Table 21-1 | Capital Costs |
| 21-1 |
Table 21-2 | Operating Costs |
| 21-2 |
Table 22-1 | Pre-tax Economic Model Results |
| 22-1 |
Table 22-2 | Pre-tax Cash Flow By Year (CDN$) |
| 22-3 |
Table 22-3 | Metal And Exchange Rate Price Deck |
| 22-6 |
Table 22-4 | Metal And Exchange Rate Price Deck |
| 22-6 |
Table 22-5 | Smelter And Refining Costs |
| 22-7 |
Table 22-6 | Economic Model Parameters |
| 22-7 |
Table 22-7 | Mine Production Summary |
| 22-8 |
Table 22-8 | LOM Concentrator Production |
| 22-8 |
Table 22-9 | LOM Payable Metals |
| 22-9 |
Table 22-10 | Base Case Comparison |
| 22-10 |
Table 22-10 | Manitoba Mining Tax Rates |
| 22-10 |
LIST OF FIGURES
Figure 1-1 | Sensitivities |
| 1-4 |
Figure 4-1 | Location Map |
| 4-3 |
Figure 4-2 | Mineral Claim and Lease Map |
| 4-4 |
Figure 5-1 | Snow Lake Regional Map |
| 5-2 |
Figure 7-1 | Geology of Manitoba |
| 7-2 |
Figure 7-2 | Geology of the Flin Flon Greenstone Belt, Manitoba |
| 7-3 |
Figure 7-3 | Volcanic Stratigraphy of the Snow Lake Area |
| 7-5 |
Figure 7-4 | Geology of the Snow Lake Area |
| 7-6 |
Figure 10-1 | Drill Hole Locations |
| 10-6 |
Figure 10-2 | Drill Hole and Mineralized Zone Outlines in Plan View |
| 10-7 |
Figure 12-1 | Comparison of Hudbay Assay and Acme Check Assay for Gold |
| 12-16 |
Figure 12-2 | Comparison of Hudbay Assay and Acme Check Assay for Silver |
| 12-17 |
Figure 12-3 | Comparison of Hudbay Assay and Acme Check Assay for Copper |
| 12-17 |
Figure 12-4 | Comparison of Hudbay Assay and Acme Check Assay for Zinc |
| 12-18 |
Figure 12-5 | Comparison of Hudbay Assay and Acme Assay From Gold Recheck Program |
| 12-19 |
Figure 14-1 | Plan View of Zinc Rich Base Metal Mineralized Zone Outlines |
| 14-4 |
Figure 14-2 | 3D View of Zinc Rich Base Metal Mineralized Zones Looking 310° Azimuth |
| 14-5 |
Figure 14-3 | 3D View of Zinc Rich Base Metal Mineralized Zones Looking 40° Azimuth |
| 14-6 |
Figure 14-4 | Comparison of Stoichiometric Calculated and Measured SG Values |
| 14-8 |
Figure 14-5 | Zone 10 Plan View — Zinc Block Model Grades |
| 14-22 |
Figure 14-6 | Elevation Swath Plots |
| 14-24 |
Figure 14-7 | Northing Swath Plots |
| 14-25 |
Figure 14-8 | Plan View of Indicated and Inferred Mineral Resource for Zone 10 |
| 14-28 |
Figure 14-9 | Plan View of Inferred Mineral Resource for Zone 11 |
| 14-28 |
Figure 14-10 | Plan View of Indicated and Inferred Mineral Resource for Zone 20 |
| 14-29 |
Figure 14-11 | Plan View of Indicated and Inferred Mineral Resource for Zone 30 |
| 14-30 |
Figure 14-12 | Plan View of Inferred Mineral Resource for Zone 31 |
| 14-30 |
Figure 14-13 | Plan View of Indicated and Inferred Mineral Resource for Zone 40 |
| 14-31 |
Figure 14-14 | Plan View of Gold Zone Outlines |
| 14-34 |
Figure 14-15 | 3D View of Gold Zones Looking 310° Azimuth |
| 14-35 |
Figure 14-16 | 3D View of Gold Zones Looking 40° Azimuth |
| 14-36 |
Figure 14-17 | Comparison of Stoichiometric Calculated and Measured SG Values |
| 14-38 |
Figure 14-18 | Zone 21 Plan View — Au Block Model Grades |
| 14-52 |
Figure 14-19 | Plan View of Indicated and Inferred Mineral Resource for Zone 21 |
| 14-55 |
Figure 14-20 | Plan View of Inferred Mineral Resource for Zone 25 |
| 14-56 |
Figure 14-21 | Plan View of Inferred Mineral Resource for Zone 24 |
| 14-57 |
Figure 14-22 | Plan View of Inferred Mineral Resource for Zone 26 |
| 14-58 |
Figure 14-23 | Plan View of Inferred Mineral Resource for Zone 27 |
| 14-59 |
Figure 14-24 | Plan View of Inferred Mineral Resource for Zone 28 |
| 14-60 |
Figure 16-1 | Typical Cut & Fill Mining Cross Section |
| 16-4 |
Figure 16-2 | Typical Post Pillar Cut & Fill Plan View |
| 16-5 |
Figure 16-3 | Site General Arrangement |
| 16-9 |
Figure 16-4 | Lalor Phase 1 Ventilation |
| 16-26 |
Figure 16-5 | Lalor Phase 2 Ventilation |
| 16-27 |
Figure 16-6 | Lalor Phase 3 Ventilation |
| 16-28 |
Figure 16-7 | Lalor Phase 4 Ventilation |
| 16-29 |
Figure 16-8 | Lalor Phase 5 Ventilation |
| 16-30 |
Figure 17-1 | Lalor Concentrator Simplified Block Flow Diagram |
| 17-1 |
Figure 18-1 | Site Access Road And Services |
| 18-1 |
Figure 22-1 | Revenue By Metal |
| 22-2 |
Figure 22-2 | Sensitivities |
| 22-9 |
APPENDICES
A1-1 | Assay Sample Statistics Zone 10 |
| 30-2 |
A1-2 | Assay Sample Statistics Zone 11 |
| 30-3 |
A1-3 | Assay Sample Statistics Zone 20 |
| 30-4 |
A1-4 | Assay Sample Statistics Zone 30 |
| 30-5 |
A1-5 | Assay Sample Statistics Zone 31 |
| 30-6 |
A1-6 | Assay Sample Statistics Zone 40 |
| 30-7 |
A1-7 | Assay Sample Statistics Zone 21 |
| 30-8 |
A1-8 | Assay Sample Statistics Zone 24 |
| 30-9 |
A1-9 | Assay Sample Statistics Zone 25 |
| 30-10 |
A1-10 | Assay Sample Statistics Zone 26 |
| 30-11 |
A1-11 | Assay Sample Statistics Zone 27 |
| 30-12 |
A1-12 | Assay Sample Statistics Zone 28 |
| 30-13 |
A2-1 | Composite Statistics Zone 10 |
| 31-2 |
A2-2 | Composite Statistics Zone 11 |
| 31-3 |
A2-3 | Composite Statistics Zone 20 |
| 31-4 |
A2-4 | Composite Statistics Zone 30 |
| 31-5 |
A2-5 | Composite Statistics Zone 31 |
| 31-6 |
A2-6 | Composite Statistics Zone 40 |
| 31-7 |
A2-7 | Composite Statistics Zone 21 |
| 31-8 |
A2-8 | Composite Statistics Zone 24 |
| 31-9 |
A2-9 | Composite Statistics Zone 25 |
| 31-10 |
A2-10 | Composite Statistics Zone 26 |
| 31-11 |
A2-11 | Composite Statistics Zone 27 |
| 31-12 |
A2-12 | Composite Statistics Zone 28 |
| 31-13 |
A3-1 | Correlograms Zones 10 and 11 Combined |
| 32-15 |
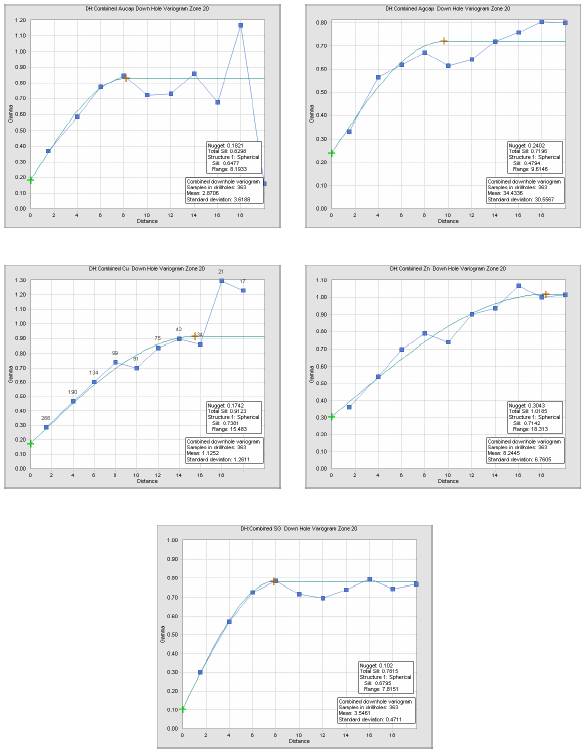
A3-2 | Correlograms Zone 20 |
| 32-16 |
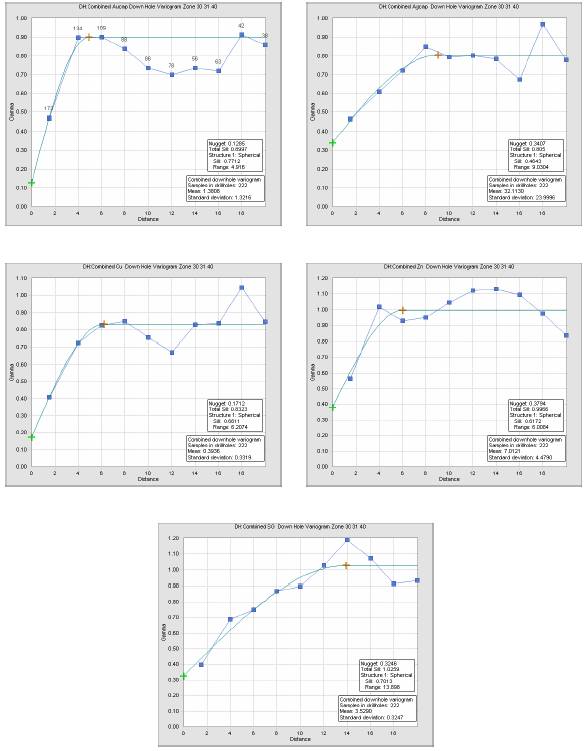
A3-3 | Correlograms Zones 30, 31 and 40 Combined |
| 32-17 |
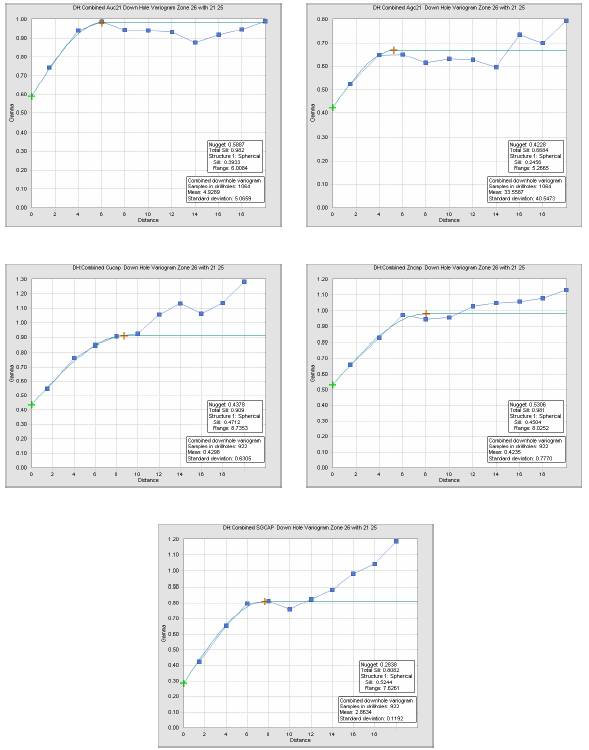
A3-4 | Correlograms Zones 21, 25 and 26 Combined |
| 32-18 |
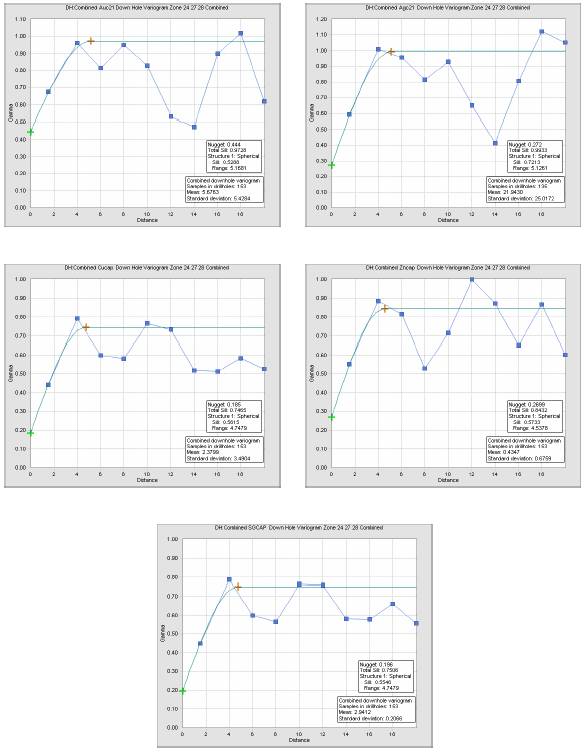
A3-5 | Correlograms Zones 24, 27 and 28 Combined |
| 32-19 |
A3-6 | Down Hole Correlograms Zones 10 and 11 Combined |
| 32-20 |
A3-7 | Down Hole Correlograms Zone 20 |
| 32-21 |
A3-8 | Down Hole Correlograms Zones 30, 31 and 40 Combined |
| 32-22 |
A3-9 | Down Hole Correlograms Zones 21, 25 and 26 Combined |
| 32-23 |
A3-10 | Down Hole Correlograms Zones 24, 27 and 28 Combined |
| 32-24 |
1.0 SUMMARY
1.1 Summary
INTRODUCTION
The authors have prepared this Pre-Feasibility study technical report for Hudbay Minerals Inc. (Hudbay) on their Lalor deposit, located near Snow Lake, Manitoba. This technical report conforms to the CIM Mineral Resource and Mineral Reserves definitions referred to in National Instrument (NI) 43-101, Standards of Disclosure for Mineral Projects.
Hudbay is a Canadian integrated mining company with assets in North and South America principally focused on the discovery, production and marketing of base and precious metals. Hudbay’s objective is to maximize shareholder value through efficient operations, organic growth and accretive acquisitions, while maintaining its financial strength.
The Hudbay operations in Flin Flon, Manitoba include the 777 Mine, Trout Lake Mine, ore concentrator and zinc plant. Operations in Snow Lake, Manitoba, include the Chisel North Mine and an ore concentrator. Lalor is located approximately 18 km by road west of the town of Snow Lake, Manitoba.
This report represents an update of information pertaining to the Lalor deposit previously disclosed in a NI 43-101 report dated October 2009 and an update to an internal Pre-feasibility in February 2011. Additional drilling has resulted in the majority portion of the zinc rich base metal resources being categorized as indicated resources and the first time calculation of indicated and inferred gold and copper-gold mineralization.
In 2007 Lalor was considered primarily a zinc deposit with local copper, gold, silver and lead mineralization that occurs along a stratiform sulphide horizon. Since discovery in 2007, a total of 121 parent holes, 101 wedge offsets and numerous holes were deepened on the property and have better defined the extensive gold zones in addition to the zinc rich mineral resources.
MINERAL RESERVES
The Lalor mineral reserves were prepared under the supervision of Robert Carter, P. Eng., who is employed by Hudbay as Manager, Project Evaluation and who is a Qualified Person under NI 43-101. The Lalor mineral reserves presented in Table 1-1 are estimated from the indicated zinc-rich and indicated gold zone mineral resources. To determine the economic viability of resources, prefeasibility level onsite operating costs (mining, concentrating and general mine expenses) and offsite costs (concentrate freight, processing, refining, general & administration) were estimated and applied against bulk copper-lead and zinc concentrate produced from each mining area.
TABLE 1-1 MINERAL RESERVES SUMMARY
|
| Tonnes |
| Au (g/t) |
| Ag (g/t) |
| Cu (%) |
| Zn (%) |
|
Base Metal Probable Mineral Reserve |
| 12,591,000 |
| 1.55 |
| 23.81 |
| 0.63 |
| 7.92 |
|
Gold Rich Ore Probable Mineral Reserve |
| 1,841,000 |
| 3.99 |
| 21.77 |
| 0.38 |
| 0.38 |
|
|
|
|
|
|
|
|
|
|
|
|
|
Total Probable Mineral Reserve |
| 14,432,000 |
| 1.86 |
| 23.55 |
| 0.60 |
| 6.95 |
|
(1) The weighted average (based on planned production tonnage) from 2012 to 2016 used for mineral reserve estimation for zinc was US$1.11 per pound (includes premium) , the copper price was US$3.12 per pound, the gold price was US$1,399 per ounce and the silver price was US$27.28 per ounce using an exchange of 1.03 C$/US$. Post 2016 the mineral reserve estimation used a zinc price of US$1.00 per pound (includes premium), a copper price of US$2.75 per pound, a gold price of US$1,100 per ounces and a silver price of US$22 per ounce using an exchange of 1.05 C$/US$.
The orebody is polymetallic with economically significant metals being zinc, gold, copper, silver. There are two different ore types:
· Base metals ores. Near solid to solid sulphide ores, with dominant pyrite and sphalerite with minor blebs & stringers of chalcopyrite and pyrrhotite.
· Gold rich ores. Silicified gold and silver enriched ores with stringers to disseminated chalcopyrite and sphalerite mineralization.
Base metal grades are relatively consistent throughout the ore zones. Ore zones were divided into mining areas based on ore thickness, dip and proximity to other ore zones. Mining methods were established for each mining area and a net smelter return (NSR) was calculated to determine the economic viability.
ECONOMIC OVERVIEW
· Base case cash flow of $269.5M with a NPV8% of -$128.8M and a 4.2% IRR
· Weighted average metal prices used for the base case LOM are US$1,150.40/oz gold, US$22.87/oz silver, US$2.81/lb copper, US$0.97/lb zinc at an exchange rate of CDN$/US$ of 1.044 over the life of mine
· Major project capital is estimated at $703.2M of which $206M has been incurred as of December 31, 2011. The life of mine sustaining capital costs are estimated to be $370.3M. The capital cost estimates have an accuracy of +/- 15%.
· 16 year mine life that includes a 3 year preproduction period that commences in 2012 and ceases in 2027. Commercial production is achieved in 2015 and full production at a rate of 3,300tpd is expected from 2017 to 2025.
· The mine plan contains 14.43M tonnes of ore with an average margin of $18.67/tonne
· Over the LOM Lalor is expected to produce 368,601 tonnes of bulk copper concentrate with gold and silver payables and 1,715,276 tonnes of zinc concentrate
A sensitivity analysis for Lalor project is summarized in Figure 1-1. The project is most sensitive to the exchange rate followed by metal prices, mined grade, operating costs, and capital costs respectively.
Sensitivities to the base case commodity price and exchange rate assumptions are shown in Table 1-2. The three year historical price case improves the pre-tax cash flow to $356.7M and has minimal impact on IRR.
Sensitivity to gold zone tonnage was done to determine the impact of increasing the gold zone reserves by 1.0M tonnes at the average gold reserve grade of 3.99g/t Au, 21.77g/t Ag, 0.38% Cu and 0.38% Zn. This sensitivity improves the pre-tax cash flow by $67.0M.
FIGURE 1-1 SENSITIVITIES
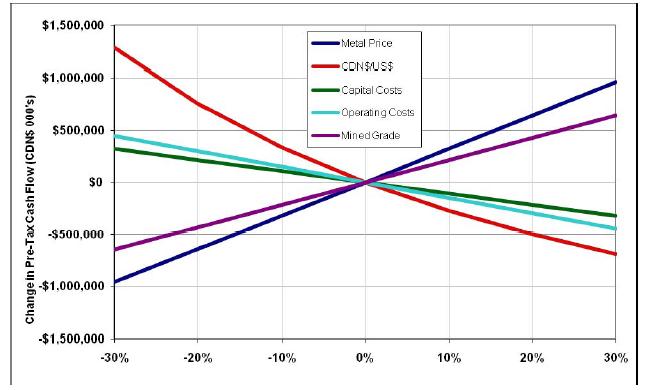
TABLE 1-2 BASE CASE COMPARISON
|
| Base Case |
| 3 Year Historical |
|
Price and Exchange Weighted Averages |
|
|
|
|
|
Gold (US$/oz) |
| 1,150.40 |
| 1,301.00 |
|
Silver (US$/oz) |
| 22.87 |
| 24.50 |
|
Copper (US$/lb) |
| 2.81 |
| 3.38 |
|
Zinc (US$/lb) |
| 0.97 |
| 0.93 |
|
Exchange (CDN$/US$) |
| 1.044 |
| 1.04 |
|
|
|
|
|
|
|
Pre-tax Cash Flow CDN$ 000’s |
| 269,468 |
| 356,731 |
|
IRR |
| 4.16 | % | 4.97 | % |
(1)Bloomberg three year historical average (March 1, 2009 to February 29, 2012).
CONCLUSIONS
This technical report has used investigation and analysis that are considered appropriate for pre-feasibility study level assessment.
The following presents the interpretations and conclusions of this Pre-feasibility study:
Geology
· The geological interpretation of the Lalor deposit is a series of 12 stacked zones of base metal zinc rich and separate gold rich mineralization. The base metal and gold zones are typical of VMS deposits that precipitated at or near the seafloor in association with contemporaneous volcanism. The depositional environment of this mineralization is similar to that of present and past producing deposits in the Snow Lake camp, with the exception of a more extensive associated hydrothermal alteration pipe and feeder zone than previous discoveries. That has produced a strongly enriched gold footwall zone suggestion a copper-gold association which is comparable to other gold enriched VMS camps and deposits.
Mineral Resource
· The current mineral resource estimate of both the base metal and gold zones were carried out using a block model method constrained by wireframe grade-shell models, with ordinary kriging interpolation. The mineral resources have been classified according to the CIM Definition Standards as incorporated in NI 43-101. Resource blocks are classified as Indicated or Inferred, depending upon the confidence level of the resource based on experience with similar deposits and the spatial continuity of the mineralization.
Processing
· Metallurgical test programs of the Lalor ores began in 2008 with a series of sample composites with a primary objective of developing a flowsheet for either the design of a new concentrator or modifications to the existing Snow Lake concentrator, and to determine expected concentrate grades and metal recoveries. The series of cleaner and lock cycle test conditions concluded that the deposit is best suited to produce a bulk copper-lead concentrate and a separate zinc concentrate. The projected copper
and zinc recoveries are very good with moderate gold and silver recoveries. Bottle roll cyanide leach tests done on tailing samples from the various composites and blends estimated improved gold and silver recoveries and further testwork will be done prior to mining of the gold zones and possible construction of a leach plant attached to the new concentrator.
Infrastructure
· The majority of surface infrastructure is being constructed under an Advanced Exploration Project (AEP), with the exception of the permanent office/dry complex and the concentrator. Lalor is being designed to mine and mill 4,500 tonnes per day of ore. Primary access to the mine will be by a concrete lined 6.9m diameter production shaft. Secondary ramp access from Chisel North mine is complete. Ore will be hoisted to surface and milled on site using a SAG/ball mill, producing zinc and bulk copper/lead concentrates. Where possible, existing infrastructure from Hudbay Chisel North mine operation will be used or extended to Lalor. Lalor is 18 road kilometres from the Town of Snow Lake, Manitoba. General area infrastructure includes provincial roads and 115kV Manitoba Hydro grid power to within four kilometres of Lalor, and Manitoba Telecom land line and cellular phone service. The Town of Snow Lake is a full service community with available housing, hospital, police, fire department, potable water system, restaurants and stores. The community is serviced by a 914m gravel airstrip to provide emergency medical evacuation. Lalor is located four road kilometres from the Hudbay Chisel North mine. Chisel North infrastructure includes a mined out open pit used for waste rock disposal, fresh (process) water sources, pumps and waterlines, 4160V and 550V power, mine discharge water lines, a 2,500gpm water treatment plant with retention areas, plus mine buildings including offices and a changehouse. These facilities were used for ramp development and will be used during Lalor operation. The permitted Hudbay Anderson TIA, located approximately 12km from Lalor will be used for tailings disposal.
Environmental and Permitting
· Environmental baseline investigations since 2007 were used to conclude an environmental impact assessment for the Lalor project. The Lalor infrastructure and
development is currently being done under an Advanced Exploration Project submitted to the Manitoba Government and approved in 2010. AECOM is finalizing for Hudbay the Environmental Impact Assessment Report for the proposed Lalor Mine, which will conclude that the project is not likely to result in any significant adverse environmental or socio-economic impacts. In addition to the mine baseline and environmental impact reports, AECOM is currently finalizing the Lalor Concentrator Environmental Baseline Assessment, which is planned to be released in the Q2 2012. The main permits that will be required for the Lalor Project are Manitoba Environment Act licenses for the Lalor Mine and Lalor Concentrator and for expansion of the existing Anderson Tailings Impoundment Area. No new tailings impoundment area will be required. No federal permits are anticipated for any of the Lalor facilities.
Mineral Reserves
· Indicated mineral resources were used to establish the probable mineral reserve. Mining, processing and economic parameters were applied to the block model to form the basis of the reserve estimate. To determine the economic viability of resources, prefeasibility level onsite operating costs and offsite costs were estimated and applied against bulk copper-lead and zinc concentrates produced from each mining area. Net smelter return payables were estimated assuming the metallurgical recoveries and longterm metal prices for mining areas comprised of blocks from the block model.
Mine Plan
· Lalor will be a ramp and shaft accessible underground mine with production and development done by rubber tired underground mining equipment. A 3,200m ramp from Hudbay Chisel North mine to the Lalor deposit was completed in December 2011 and is currently providing access for underground diamond drilling and pre development of the orebody and required infrastructure. Three stope mining methods will be used at Lalor: mechanized cut & fill, post pillar cut & fill and longhole open stope. At the end of ore zones, where resources narrow, cut & fill mining will be used. Where the dip exceeds 35° and the orebody is of sufficient thickness, longhole open stope mining will we used. All stopes at Lalor will be backfilled to maintain long
term stability and to provide a floor to work from for subsequent mining. The production schedule assumes a preproduction period from 2012 to 2014 and commercial production achieved in 2015 with a mine life until 2027.
Economics
· The deposit is marginally economic with an IRR of 4.2% and a NPV8% of -$128.8M, according to the assumptions of this study with a start date of the project as of January 1, 2010. The economic analysis includes the $206M of capital expense incurred as of December 31, 2011 and excludes 12,616,000 tonnes of inferred resource. The estimated total mine project capital to bring the project into commercial production is $703.2M of which $497M remains to be spent as of January 1, 2012.
While there can be risks associated with mining projects, many of those risks have already been mitigated due to the advanced level of this project and since the surface infrastructure for the mine is near complete and the basic engineering for the new concentrator is done. The author summarizes main risks associated with the Lalor project as follows:
· Ability to achieve operating and capital cost estimates
· Ability to secure environmental permits
· Forecasted metal commodity price and exchange rate
The author summarizes the following opportunities for improvement with the Lalor Project:
· Ability to increase mine production through put beyond 3,300tpd. The production hoist and new concentrator will have design capacities of 4,500tpd.
· Extension to life of mine through upgrading of the inferred resource to higher confidence categories and the discovery of additional resources
· Bottle roll cyanide leach tests indicate that significantly higher gold and silver recoveries can be achieved and could further enhance the project economics.
RECOMMENDATIONS
The author recommends that an economic evaluation of a potential gold leach plant should be undertaken prior to mining the gold zones. A gold plant would increase the gold recovery and may enhance project economics.
The author recommends that Hudbay proceed with the current plan of exploration drilling from underground with the goal of upgrading the gold and copper gold zones.
The author recommends that Hudbay continue with their advancement of the Lalor Project activities at an expected major project capital remaining of $497.3M as of January 1, 2012. There is little uncertainty in the project at this time and no trade-off studies are being conducted. The surface site infrastructure is near complete, basic engineering for the concentrate is done, the deposit is already accessible via the 3,200m ramp from Chisel North mine to the Lalor deposit and the ventilation shaft from surface is over half developed. Hudbay is currently drilling Zone 10 from underground drill platforms to define ore contacts in preparation of ore production. This information will also provide pertinent information to confirm our underground geotechnical design. Because of the advanced nature of the project, the author is not in a position to make further meaningful recommendations.
1.2 Technical Summary
PROPERTY DESCRIPTION AND LOCATION
The Lalor deposit is located approximately 18km by road west of the town of Snow Lake, Manitoba. The nearest larger centres (5,000+) are Flin Flon (215km), The Pas (200km) and Thompson (230km), all accessible by paved highway. The nearest full service commercial airport is located at Baker’s Narrows, near Flin Flon, approximately 200km from Lalor. The nearest international airport is located in Winnipeg, approximately 700km from Snow Lake. There is no rail in the immediate area of Lalor or Snow Lake. The nearest rail access is at Wekusko siding, approximately 65km southeast of Lalor.
LAND TENURE
The Lalor property is located approximately 215km east of Flin Flon and 18km west of Snow Lake in the province of Manitoba at 54°52’N latitude, 100°08’W longitude and 303m ASL. Hudbay owns a 100% interest in the property through five mineral claims and eight Order in Council Leases to the south. Application has been submitted to convert the mineral claims to mineral leases.
EXPLORATION
The Snow Lake area has had an active mining history for more than 50 years. Hudbay has played an integral part in this history since the late 1950s by operating nine mines in the area including Photo Lake, Rod, Chisel Lake Chisel North and Chisel Open Pit, Stall Lake, Osborne Lake, Spruce Point, Ghost Lake, and Anderson Lake.
The Snow Lake concentrator was commissioned in 1979 and operated continuously until shutdown in early 1993 as a result of the depletion of the Chisel Open Pit and Stall Lake mines. The concentrator was reopened in 1994 to process ore from the Photo Lake Mine and continued to process ore from the Chisel North Mine until February 2009. With the reopening of Chisel North in 2010, the concentrator reopened and is expected to remain open until a new concentrator is commissioned on the Lalor site.
In early 2007, drill hole DUB168 was drilled almost vertically to test a 2003 surveyed Crone Geophysics deep penetrating pulse electromagnetic anomaly and intersected a band of conductive mineralization between 781.74m and 826.87m (45.13m). Assay results include 0.30% Cu and 7.62% Zn over the 45.13 m, including 0.19% Cu and 17.26% Zn over 16.45 m. Drilling at Lalor has been continuous since the discovery of mineralization on the property.
GEOLOGY AND MINERALIZATION
REGIONAL GEOLOGY
The Lalor property lies in the eastern (Snow Lake) portion of the Paleoproterozoic Flin Flon Greenstone belt and is overlain by a thin veneer of Pleistocene glacial/fluvial sediments. Located within the Trans-Hudson Orogen, the Flin Flon Belt consists of a variety of distinct 1.92 to 1.87 Ga tectonostratigraphic assemblages including juvenile arc, back-arc, ocean-floor and ocean-island and evolved volcanic arc assemblages that were amalgamated to form an accretionary collage (named the Amisk Collage) prior to the emplacement of voluminous intermediate to granitoid plutons and generally subsequent deformation. The volcanic assemblages consist of mafic to felsic volcanic rocks with intercalated volcanogenic sedimentary rocks. The younger plutons and coeval successor arc volcanics, volcaniclastic,
and sedimentary successor basin rocks include the older, largely marine turbidites of the Burntwood Group and the terrestrial metasedimentary sequences of the Missi Group.
The Flin Flon belt is in fault and /or gradational contact with the Kisseynew Domain metasedimentary gneisses to the north and is unconformably overlain by the Phanerozoic cover of sandstone and dolostones to the south. Regional metamorphism at 1.82 to 1.81Ga formed mineral assemblages in the Flin Flon Belt that range from prehnite-pumpellyite to middle amphibolite facies in the east and upper amphibolite facies in the north and west.
The Snow Lake portion of the Flin Flon belt is dominated by fold-thrust style tectonics that is atypical of western and central portions of the belt. It is a south-verging, northeast dipping imbricate that was thrust over the previously amalgamated collage of oceanic and arc rocks to the west. The thrust package of the Snow Lake area has been modified by 1.82 to 1.81Ga regional metamorphism of lower to middle almandine-amphibolite facies mineral assemblages.
Intrusions in the belt are divided into pre-, syn- and post tectonic varieties where the pre-tectonic group includes intrusions that are coeval with the volcanic rocks, as well as those that crosscut volcanic and Missi supracrustal rocks. Numerous mafic to ultramafic dykes intrude the volcanic rocks.
LOCAL AND PROPERTY GEOLOGY
The Snow Lake arc assemblage, which hosts the producing and past-producing mines in the Snow Lake area, is a 20km wide by 6km thick section that records a temporal evolution in geodynamic setting from ‘primitive arc’ (Anderson sequence to the south) to ‘mature arc’ (Chisel sequence) to ‘arc-rift’ (Snow Creek sequence to the northeast). The ‘mature arc’ Chisel sequence that hosts the zinc rich Chisel, Ghost, Chisel North, and Lalor deposits typically contains thin and discontinuous volcaniclastic deposits and intermediate to felsic flow-dome complexes.
The Chisel sequence is lithologically diverse and displays rapid lateral facies variations and abundant volcaniclastic rocks. Mafic and felsic flows both exhibit evolved geochemical characteristics (relative to the unevolved underlying Anderson sequence) consistent with one
of, or a combination of, the following: within-plate enrichment, derivation from a more fertile mantle source, lower average extents of melting at greater depths, and contamination from older crustal fragments. These rocks have undergone metamorphism at the lower to middle almandine-amphibolite facies.
Rock units in the hangingwall of the Lalor deposit typically reflect this diversity and variation in rock types that include mafic and felsic volcanic and volcaniclastic units, mafic wacke, fragmental units of various grain sizes, and crystal tuff units
The Lalor deposit is similar to other massive sulphide bodies in the Chisel sequence (Chisel Lake, Ghost Lake, Chisel North, and Photo Lake), and lies along the same stratigraphic horizon as the Chisel Lake and Chisel North deposits. It is interpreted that the top of the zone is near a decollement contact.
The most common dyke intrusion throughout these rocks is a fine grained feldspar-phyric gabbro to diorite. The Chisel Lake pluton, a late 1.8km by 9.8km layered ultramafic intrusion, truncates the main lens of the Chisel Lake massive sulphide deposit but is not seen in any of the Lalor drill core.
The footwall rocks have extensive hydrothermal alteration and metamorphic recrystallization has produced rather exotic aluminous mineral assemblages. These assemblages include chlorite dominant schists, sericite dominant schists, and cordierite+anthophyllite gneisses. Other minerals indicative of hydrothermal alteration that occur extensively throughout these rather simplified rock assemblages include quartz, feldspar, kyanite, biotite, garnet, staurolite, hornblende, and carbonate. Clinopyroxene, gahnite and anhydrite also occur locally. These assemblages are typical of metamorphosed footwall hydrothermal alteration commonly associated with volcanogenic massive sulphide (VMS) deposits and are similar to that at the other massive sulphide deposits in the Chisel Lake area.
All of the mineralization is relatively flat lying, trends 270° to 310° azimuth and dips between 15° to 30° to the north.
MINERAL RESOURCES
The mineral resource estimate for the Lalor deposit is tabulated in Table 1-3 and is inclusive to the mineral reserves.
TABLE 1-3 LALOR RESOURCE SUMMARY
Indicated Resource |
| TONNES |
| Au (g/t) |
| Ag (g/t) |
| Cu (%) |
| ZN (%) |
|
Base Metal |
| 14,048,000 |
| 1.79 |
| 27.49 |
| 0.71 |
| 8.96 |
|
|
|
|
|
|
|
|
|
|
|
|
|
Gold Zone |
| 2,729,000 |
| 4.31 |
| 22.27 |
| 0.39 |
| 0.43 |
|
|
|
|
|
|
|
|
|
|
|
|
|
Inferred Resource |
| TONNES |
| Au (g/t) |
| Ag (g/t) |
| Cu (%) |
| ZN (%) |
|
Base Metal |
| 3,817,000 |
| 1.20 |
| 22.15 |
| 0.60 |
| 9.09 |
|
|
|
|
|
|
|
|
|
|
|
|
|
Gold Zone |
| 7,338,000 |
| 4.64 |
| 31.35 |
| 0.41 |
| 0.32 |
|
|
|
|
|
|
|
|
|
|
|
|
|
Copper-Gold Zone |
| 1,461,000 |
| 6.80 |
| 20.33 |
| 4.15 |
| 0.31 |
|
Notes:
(1) CIM definitions were followed for the mineral resources.
(2) Zinc rich base metal mineral resources are estimated at ZNEQ cut-off of 4% (ZNEQ% equals Zn% + Cu% x 2.895 + Au g/t x 1.220 + Ag g/t x 0.023) and a minimum two meter true width.
(3) Gold and Copper Gold zone mineral resources are estimated at a 1.0 g/t gold cut-off and a minimum two meter true width.
(4) Long term $US metal prices of $1,100/oz gold, $22.00/oz silver, $2.75/lb copper and $0.95/lb zinc were used for the estimation of ZNEQ.
(5) Metal recovery assumptions of 65% gold, 60% silver, 90% copper and 90% zinc were used for the estimation of ZNEQ.
(6) Specific gravity measurements were taken on a large portion of the samples. Where actual measurements were not available stoichiometric values were calculated.
From a geological standpoint, the base metal zones and gold zones which make up the Lalor deposit are generally distinct, but can interact with each other in many areas. The gold rich areas are normally exclusive of the base metal rich areas, and for this reason they are separated during the actual resource calculation.
The current mineral resource estimate for the Lalor deposit has been calculated by Hudbay. The estimates of both the base metal and gold zones were carried out using a block model method constrained by wireframe grade-shell models, with ordinary kriging (OK) interpolation.
The base metal grade estimation was constrained using wireframe models of the zinc rich base metal mineralized zones using geologically interpreted copper and zinc mineralized intersections with a 4% ZNEQ cut-off and a minimum width of two metres. The wireframes were interpreted from diamond drill information collected by Hudbay. In total, six stacked lenses or zones of zinc-rich polymetallic near solid to solid sulphide mineralization were identified, approximately 570m to 1,160m below surface, occurring at or near the top of hydrothermally altered felsic rocks.
The precious metal intersections of the Lalor gold zones contain low amounts of iron sulphide (4% to 5% on average) that is in the form of pyrite, pyrrhotite and chalcopyrite. Generally minor amounts of galena and sphalerite occur. The intersections display no distinct marker horizons other than being extensively altered to form rather exotic mineral assemblages. The gold mineralization associated with each zone was interpreted into three-dimensional wireframes based on a 1.0g/t gold cut-off over a minimum two metre interval. In total, six distinct zones of mineralization have been interpreted approximately 750m to 1,480m below surface.
The drill hole database contains 121 parent holes and 101 wedge offsets, totalling 195,393 m of drilling. All information used in the estimation of the mineral resources was extracted directly from the Hudbay acQuire database management system managed by the Hudbay Mines Technical Services department.
Prior to compositing all zones, high-grade samples of gold and silver were capped, according to zone. Samples were composited into two meter lengths prior to grade estimation. High grade composites for all the metals were restricted during the grade interpolation by limiting the search distance.
Geostatisitcal analyses of the composites were used to evaluate search parameters and search ellipsoids for use in the grade estimation. The orientations for the ellipsoids were derived from the variography process. The major search distance is parallel to the plunge of the mineralization, the minor search distance is parallel to the strike of the mineralization, and the vertical search distance corresponds to the thickness of the mineralization.
Bulk density values, measured for the majority of the samples, were used in weighting the composite grades and were applied for the estimation of tonnage.
Validation exercises were carried out on the block model grade estimates. These validation exercises included:
A. Inspection of the OK block model grades in plan and section views in comparison to drill hole grades;
B. Comparison of the global mean grades based on nearest neighbour, inverse distance squared weighted and OK estimation methods;
C. Swath plot comparisons of the estimation methods;
D. Comparison to September 2009 mineral resource estimate.
Mineral resources have been classified according to CIM Definition Standards on Mineral Resources and Mineral Reserves (CIM definitions), as incorporated in NI 43-101. All blocks estimated during the grade interpolation were assigned at least an Inferred category. Blocks estimated by at least three drill holes and less than 50 m from the nearest composite were generally qualified as Indicated resources. The blocks were then inspected in plan view to define a reasonably coherent volume of Indicated blocks with a more or less uniform density of drilling. Isolated Indicated blocks outside this volume were manually downgraded to Inferred.
MINING
Lalor will be a ramp and shaft accessible underground mine with production and development done by rubber tired underground mining equipment. A 3,200m ramp from Hudbay Chisel North mine to the Lalor deposit was completed in December 2011 and is
currently providing access for underground diamond drilling and pre development of the orebody and required infrastructure.
The majority of surface infrastructure is being constructed under an Advanced Exploration Project (AEP), with the exception of the permanent office/dry complex and the concentrator. Surface infrastructure completed or in progress at the end of 2011 includes:
· 3km mine site access corridor, which includes the mine haul road, 25kV overhead power line and covered/heat traced process water and mine discharge water pipelines
· Onsite services distribution. This includes pole and buried electrical services and switchgear and buried freshwater and mine discharge water pipelines.
· Hoisthouse, including hoist foundations. Installation of the mine service hoist and production hoist is in progress.
· Production shaft collar and foundations, including ventilation plenum
· Ore bunker, ore bin and headframe in progress
· Warehouse/shop complex
· Mine water handling systems, including polishing pond, onsite pumphouse, mine discharge water tanks and pumps and freshwater tanks and pumps. Offsite booster pump station for freshwater and mine discharge water completed.
· Offsite 24MVA 115/25kV temporary substation. This will be replaced by a permanent substation with 2 x 24MVA 115/25kV transformers.
Surface infrastructure required but not started includes:
· 400 person changehouse complex that will house staff offices
· 4,500tpd concentrator, including primary crusher, SAG mill, ball mill, copper and zinc flotation circuits, thickeners and filters. Concentrator complex will also include concentrate storage and handling facility and metallurgical laboratory
· Permanent ventilation installations, including offsite exhaust fan and onsite mine downcast air heater and fans
Three stope mining methods will be used at Lalor: mechanized cut & fill, post pillar cut & fill and longhole open stope. At the end of ore zones, where resources narrow, cut & fill
mining will be used. Where the dip exceeds 35° and the orebody is of sufficient thickness, longhole open stope mining will we used.
All stopes at Lalor will be backfilled to maintain long term stability and to provide a floor to work from for subsequent mining. Backfill will be either:
· Cemented waste rock backfill
· Unconsolidated waste rock backfill
· Paste backfill
The majority of backfill will be paste backfill. Paste backfill is an engineered product comprised of mill tailings and a binder (3% cement by weight) mixed with water to provide a thickened paste that is delivered by borehole and pipes to stopes. Hudbay has experience with the design and operation of a paste backfill system, currently in use at the Flin Flon concentrator and 777 mine.
Ore will be loaded by scooptram to underground haul trucks and hauled to the production shaft. Ore will be dumped onto a grizzly at 910m level for sizing to -0.4m by a rockbreaker. A 40m raise below the grizzly will provide approximately 1,200 tonnes of coarse ore storage. A chute at the bottom of the raise at 955m level will feed ore to a conveyor that will load a measuring flask with 15 tonnes of ore. Ore will be skipped to a surface bin by two skips in balance. Ore from the surface bin will be conveyed to the primary crusher at the onsite concentrator.
Underground development for waste and ore drifts, crosscuts and ramps will be done using two boom electric hydraulic jumbos. Rounds mined in low sulphide waste will be mined using ANFO, while rounds mined in ore will be blasted using emulsion with a sulphide blast inhibitor. Ore and waste will be mucked by scooptram to a remuck or directly in a haul truck. . Following mucking, standard ground support consisting of resin grouted rebar and welded wire mesh to within 1.8m of the sill will be installed. Mine services, including compressed air, process water and discharge water pipes, paste backfill pipeline, power cables, leaky feeder communications antenna and ventilation duct will be installed in main levels and stope entrances.
Generally, main levels will be developed parallel to and in the footwall of the ore zones. To optimize development, in some areas of the mine, main levels will be located to provide access to multiple ore zones. As levels are developed, stope entrance crosscuts will be stubbed off and used as temporary remucks. Main levels will be connected by a haul ramp to allow mechanized equipment to travel from level to level.
Stope access crosscuts to cut & fill stopes will be driven at -15% to allow multiple cuts from a single crosscut. Cut & fill stope entrances will be located approximately every 150m along strike. In longhole stopes, a footwall drift will be mined between the main level and the stope and drawpoint crosscuts will be developed.
Mine ventilation is based on the diesel mobile equipment plan and their legislated ventilation requirements. Major mobile equipment will be equipped with low emissions Tier III or better diesel engines. Multiple openings to surface and fan/burner installations are required to provide ventilation for Lalor. The Chisel North ventilation fan will provide 340,000cfm to underground. 260,000cfm will ventilate Lalor via the access ramp, with 80,000cfm exhausting to surface via the Chisel North ramp. The Lalor ramp vent fan will provide 240,000cfm to Lalor. An additional 600,000cfm will be provided to the mine via the Lalor production shaft for a total of 1,100,000cfm.
The LOM production schedule assumes a high zinc grade pre-production period from 2012 to 2014. Production from this period is expected to be processed at the Snow Lake concentrator. The new concentrator at site will be commissioned prior to achieving commercial production in year 2015. Full production at a rate of 3,300tpd is expected from 2017 through 2025 and decreases in 2026 to 2027.
Contractor and Hudbay personnel will be required during the construction and operation of Lalor mine. Lalor will be operated on a continuous cycle. The majority of operations and maintenance personnel will work 12 hour shifts on a 4 days on, 4 days off cycle. Operations support, technical and administrative personnel will work 8 hour day shifts, 40 hours per week. The mine will be operated under Collective Bargaining Agreements between Hudbay management and local unions.
Mine operations manpower will comprise Hudbay hourly operations and maintenance personnel as well as salaried supervision, mine administration and technical staff, plus contractor personnel for diamond drilling and technical support. Concentrator personnel will include diamond drillers, raise miners and vendor representatives for bits & steel, tires, and equipment fleet maintenance and audits. Personnel will vary year to year and is expected to average 259 for the mine operation and 78 for the new concentrator during full production.
Grid electricity is supplied by Manitoba Hydro, the provincial power utility. Manitoba Hydro’s 115kV powerline terminates at the Chisel Lake minesite, approximately 7 road kilometres from the Lalor site. Manitoba Hydro supplies 115kV power to the Hudbay owned Chisel Lake 115-25kV 24MVA transformer that was installed to provide temporary project construction power
The Chisel Lake substation presently provides power to all of the Lalor surface infrastructure and for underground development. All overhead powerlines required for power transmission are in place, excluding the concentrator. The permanent electrical substation will be located at the Chisel North minesite, which will be equipped with two reconditioned 115-25kV 24MVA transformers. One from the Chisel Lake site will be relocated to Chisel North site and the second reconditioned 24MVA will also be installed at the Chisel North site. This arrangement will supply 24MVA of power to Lalor and area, with 24MVA of redundant power in case of transformer failure. The expected electrical load will be approximately 20MVA for the mine and concentrator.
MINERAL PROCESSING AND METALLURGICAL TESTING
In 2008 over 1600kg of samples from numerous Lalor drill holes were gathered representing the majority of ore types expected in the deposit. A test program was put together to develop an appropriate flowsheet for either the design of a new concentrator or modifications to the existing plant, and to determine expected concentrate grades and metal recoveries. SGS Vancouver Metallurgy was responsible for this test program. The program included, but not limited to, mineralogical analysis, ore hardness, gravity concentration, flotation tests and grind size analysis,
Mineralogical analysis showed that the chalcopyrite in Lalor ore is mostly coarse grained and liberated at grind sizes of approximately 100 microns. However, 15 to 20% of the chalcopyrite remains locked, primarily with sphalerite, at sizes below 20 microns. Copper is present almost exclusively as chalcopyrite with minor bornite. Zinc is present mainly as sphalerite, with minor amounts of gahnite. The sphalerite is coarse grained and liberated at a grind size of 250 microns. Lead is present as fine grained galena and would require a grind size of 70 microns for liberation. However there is insufficient galena in the ore to warrant a primary grind this fine.
The series of cleaner and lock cycle test conditions concluded that the deposit is best suited to produce a bulk copper-lead concentrate and a separate zinc concentrate. The projected copper and zinc recoveries are very good with moderate gold and silver recoveries. Bottle roll cyanide leach tests done on tailing samples from the various composites and blends estimated improved gold and silver recoveries and further testwork will be done prior to mining of the gold zones and possible construction of a leach plant attached to the new concentrator.
Projected metallurgical recoveries at expected probable mineral reserve grades are shown in Table 1-4.
TABLE 1-4 PROJECTED RECOVERIES
Metal |
| Head Assay |
| Recovery (%) |
Gold (g/t) |
| 1.86 |
| 62.0 |
Silver (g/t) |
| 23.55 |
| 68.0 |
Copper (%) |
| 0.60 |
| 85.7 |
Zinc (%) |
| 6.95 |
| 94.0 |
General conclusions and assumptions from the testing program indicate:
1. Lead head grades will be in the order of 0.25%, and the copper/lead separation stage will not be included in the initial plant design. The plant will produce a bulk copper-lead concentrate. The estimated bulk concentrate grade is 20% copper and approximately 5% lead. It is estimated that lead penalties will be incurred at $2.25 per tonne of concentrate for
each 1% in excess of 0.5% by the smelter. Gold and silver recoveries are to the bulk concentrate.
2. Expected zinc circuit performance in the plant is better represented by the first series of locked cycle tests on the master composite. The higher zinc concentrate grades produced in later testwork are not required. The estimated zinc concentrate grade is 55% Zn.
The new Lalor concentrator complex will be located at the existing Lalor project site. Conventional crushing, grinding and flotation operations will be used to process the ore. The nominal throughput rate will be 4,500 tonnes per day. The mill will operate 24 hours per day, 365 days per year, with scheduled downtime for maintenance as required.
Tailings from the flotation circuit will be utilized to produce a cemented paste backfill for use underground. Tailings not required for paste backfill will be pumped to the existing Anderson Tailings Impoundment Area (TIA).
PROJECT INFRASTRUCTURE
Lalor is designed to mine and mill 4,500 tonnes per day of ore. Primary access to the mine will be by a concrete lined 6.9m diameter production shaft. Secondary ramp access from Chisel North mine is complete. Ore will be hoisted to surface and milled on site using a SAG/ball mill, producing zinc and bulk copper/lead concentrates. Where possible, existing infrastructure from Hudbay Chisel North mine operation will be used or extended to Lalor.
Lalor is 18 road kilometres from the Town of Snow Lake, Manitoba. General area infrastructure includes provincial roads and 115kV Manitoba Hydro grid power to within four kilometres of Lalor, and Manitoba Telecom land line and cellular phone service. The Town of Snow Lake is a full service community with available housing, hospital, police, fire department, potable water system, restaurants and stores. The community is serviced by a 914m gravel airstrip to provide emergency medical evacuation.
Lalor is located four road kilometres from the Hudbay Chisel North mine. Chisel North infrastructure includes a mined out open pit used for waste rock disposal, fresh (process) water sources, pumps and waterlines, 4160V and 550V power, mine discharge water lines, a
2,500gpm water treatment plant with retention areas, plus mine buildings including offices and a changehouse. These facilities were used for ramp development and will be used during Lalor operation.
The permitted Hudbay Anderson TIA, located approximately 12km from Lalor will be used for tailings disposal.
As of March 2012, off site infrastructure constructed for mine site and mine development included a camp, access road, water lines, temporary power station, and power lines. On site infrastructure constructed for the mine site, ventilation shaft and shaft project development period includes power pole distribution, temporary offices, warehouse and washroom facilities
Concurrent with construction of onsite services and infrastructure, sub grade concrete for the production shaft collar, hoist and headframe foundations, ventilation plenum and water treatment plant was poured. Buried waterlines, propane lines and power cables were installed and final site grading was completed.
ENVIRONMENTAL STUDIES, PERMITTING AND SOCIAL OR COMMUNITY IMPACT
Environmental baseline assessment drafts were completed by AECOM based on collection of field data concluded that there were no major negative environmental or social-economic impacts expected from the development of the project. Ongoing work by AECOM since 2007 has been necessary due to the extensive scope and detail of the multi-phased Lalor Project.
The Lalor Advanced Exploration Project plan was submitted to the Manitoba Government and approved in 2010, permitting early construction of the main shaft and commencement of underground development to extract a 10,000 tonne bulk sample of the mineralization. The Lalor Mine Environment Act license must be obtained before the main shaft is converted from exploration to production purposes. The application is expected to be filed at the end of Q1 2012 and the license received in Q3 2012.
The main permits that will be required for the Lalor Project are Manitoba Environment Act licenses for the Lalor Mine and Lalor Concentrator and for expansion of the existing Anderson Tailings Impoundment Area (TIA). No new tailings impoundment area will be required. No federal permits are anticipated for any of the Lalor facilities.
The Lalor Project has been envisaged to minimize its impact on the surrounding environment and reduce the overall footprint of development. This has been designed to the greatest extent possible, utilizing the existing infrastructure, services, and previously disturbed land area associated with pre-existing and current mining operations in the Snow Lake area.
The communities that will be impacted the most from the mine development are Flin Flon and Snow Lake. Public consultations will be done in both communities before development of the mine commences. The public consultation process is required under the Environment Act License application and will be in addition to the numerous presentations and information sessions Hudbay has held in the communities.
The project will provide jobs for both of these communities during construction and operation of the mine. The additional feed from the mine will also help ensure the continued employment of Hudbay employees in the Flin Flon and Snow Lake areas. Since the economies of both communities are based on mining, opposition to the project is seen as unlikely.
CAPITAL AND OPERATING COSTS
The LOM capital costs are estimated to be $1,073.4M, which includes $703.2M for major project capital as summarized in Table 1-5. The capital cost estimate has an accuracy of +/- 15%. There is an additional $352.8M for sustaining capital, which is $253.7M for capital development and major installations, $99.0M for new mine equipment, replacement equipment and equipment major rebuilds over the entire life of the project and $17.5M for tailings pond expansion. A contingency of $77.6M or 12.4% is included in the major project capital. As of December 31, 2011, $206M of the total $703.2M for major project capital has been incurred.
Mine Major Project capital surface construction costs and shaft sinking and equipping costs were estimated by Stantec Engineering from labour, materials and equipment workups in 2010. Mill construction costs were estimated by AMEC from labour, material and equipment workups in 2011. Equipment capital costs are based on quoted costs from equipment suppliers and development costs are estimated from historical costs from operating Hudbay mines. The capital cost estimate assumes new equipment purchases and potential cost savings from purchasing used equipment was not investigated.
TABLE 1-5 CAPITAL COSTS
|
| Major Project |
|
|
|
|
| ||
|
| Incurred to |
| Forecast |
| Sustaining |
| Total |
|
Surface Construction |
| 67,268 |
| 34,641 |
| 0 |
| 101,909 |
|
Concentrator |
| 0 |
| 173,621 |
| 17,497 |
| 191,118 |
|
Underground Development |
| 73,530 |
| 113,881 |
| 189,054 |
| 376,465 |
|
Mobile Mine Equipment |
| 578 |
| 19,034 |
| 99,030 |
| 118,642 |
|
Fixed Mine Equipment |
| 15,936 |
| 7,516 |
| 0 |
| 23,452 |
|
Indirects & General Mine Expense |
| 4,297 |
| 35,154 |
| 64,679 |
| 104,130 |
|
EPCM |
| 22,801 |
| 57,351 |
| 0 |
| 80,152 |
|
Contingency |
| 21,495 |
| 56,085 |
| 0 |
| 77,580 |
|
Total Capital Cost |
| 205,905 |
| 497,284 |
| 370,260 |
| 1,073,449 |
|
Operating costs were estimated from a combination of Hudbay operations, quotes from contractors and from labour and material workups prepared by Stantec Engineering (mine) and AMEC (concentrator). Operating costs include onsite operating development, ore production, concentrating and share of General Mine Expense costs, as well as offsite zinc processing and G&A costs. The total operating LOM costs are estimated to be $102.83/tonne milled or $1,484.1M for the life of the mine, shown in Table 1-6.
TABLE 1-6 OPERATING COSTS
|
| Unit Cost |
| Total |
| |
Ore Extraction |
| 23.12 |
| 333,685 |
| |
Operating Development |
| 4.54 |
| 65,509 |
| |
Subtotal Direct Mining |
| 27.66 |
| 399,194 |
| |
Allocated GME |
| 11.24 |
| 162,253 |
| |
Subtotal Mine Operating |
| 38.90 |
| 561,447 |
| |
|
|
|
|
|
| |
Mill Operating |
| 19.04 |
| 274,805 |
| |
Total Mine/Mill Operating |
| 57.94 |
| 836,252 |
| |
|
|
|
|
|
| |
Zinc Processing |
| 27.25 |
| $ | 393,283 |
|
G & A |
| 17.64 |
| 254,577 |
| |
Total Operating Cost |
| 102.83 |
| 1,484,112 |
| |
ECONOMIC ANAYSIS
The pre-tax cash flow is $269.5M with a NPV8% of $-128.8M and a 4.2% IRR, which is summarized in Table 1-7. The economic analysis includes the $206M of capital expense incurred as of December 31, 2011 and excludes 12,616,000 tonnes of inferred resource. Project payback occurs in 2023, which is the ninth year of commercial production. The revenue by metal is 60.3% from zinc, 21.8% from gold and copper and silver make up the remaining 18%. The annual pre-tax cash flow for Lalor is based on the LOM production schedule.
TABLE 1-7 PRE-TAX ECONOMIC MODEL RESULTS
|
| Value |
| Unit Rate |
|
Revenue from Sale of Zinc Metal |
| 1,270,443 |
| 88.02 |
|
Revenue from Sale of Concentrates |
| 1,558,587 |
| 107.99 |
|
Net Revenue |
| 2,829,030 |
| 196.01 |
|
|
|
|
|
|
|
Operating Costs (Table 21-2) |
| 1,484,112 |
| 102.83 |
|
Operating Margin |
| 1,344,918 |
| 93.19 |
|
|
|
|
|
|
|
Major Project Capital (Table 21-1) |
| 703,189 |
| 48.72 |
|
Sustaining Capital (Table 21-1) |
| 370,260 |
| 25.65 |
|
Net Closure, Severance, Salvage |
| 2,000 |
| 0.14 |
|
|
|
|
|
|
|
Pre-Tax Cash flow |
| 269,468 |
| 18.67 |
|
NPV8% |
| -128,761 |
|
|
|
IRR |
| 4.2 | % |
|
|
2.0 INTRODUCTION AND TERMS OF REFERENCE
The authors have prepared this Pre-Feasibility study technical report for Hudbay Minerals Inc. (Hudbay) on their Lalor deposit, located near Snow Lake, Manitoba. This technical report conforms to the CIM Mineral Resource and Mineral Reserves definitions referred to in National Instrument (NI) 43-101, Standards of Disclosure for Mineral Projects.
Hudbay is a Canadian integrated mining company with assets in North and South America principally focused on the discovery, production and marketing of base and precious metals. Hudbay’s objective is to maximize shareholder value through efficient operations, organic growth and accretive acquisitions, while maintaining its financial strength.
The Hudbay operations in Flin Flon, Manitoba include the 777 Mine, Trout Lake Mine, ore concentrator and zinc plant. Operations in Snow Lake, Manitoba, include the Chisel North Mine and an ore concentrator. Lalor is located approximately 18 km by road west of the town of Snow Lake, Manitoba.
This report represents an update of information pertaining to the Lalor deposit previously disclosed in a NI 43-101 report dated October 2009 and an update to an internal Pre-feasibility in February 2011. Additional drilling has resulted in the majority portion of the zinc rich base metal resources being categorized as indicated resources and the first time calculation of indicated and inferred gold and copper-gold mineralization.
In 2007 Lalor was considered primarily a zinc deposit with local copper, gold, silver and lead mineralization that occurs along a stratiform sulphide horizon. Since discovery in 2007, a total of 121 parent holes, 101 wedge offsets and numerous holes were deepened on the property and have better defined the extensive gold zones in addition to the zinc rich mineral resources.
Mineralization of the zinc rich base metal zones occur as disseminated to solid sulphides consisting of medium to coarse grained sphalerite, pyrite and chalcopyrite with lesser amounts of galena and arsenopyrite. Precious metal intersections of the Lalor gold zones
contain low amounts of iron sulphide (4% to 5% on average) that is in the form of pyrite, pyrrhotite and chalcopyrite. Generally minor amounts of galena and sphalerite occur.
Hudbay owns 100% of the interest in the property, through a group of five contiguous claims and eight mineral leases.
Tim Schwartz, P.Geo., Senior Geologist Hudbay, completed the mineral resource estimation under the supervision of Robert Carter, P.Eng., Manager of Project Evaluation with Hudbay. Mr. Schwartz has reviewed the geological database and other digital information for this project and visited the Property on March 26, 2012.
Robert Carter, P.Eng., Manager of Project Evaluation, Hudbay, supervised the mineral reserve estimations and mine plan design completed by Doug Salahub, Superintendent of Mines Technical Services Hudbay. Mr. Carter last visited the property on June 7, 2011 and numerous times prior to this date. The personal site inspections were part of the mineral resource estimation and technical report process to become familiar with conditions on the Property, assess the ongoing project development, to observe the geology and mineralization and verify the work completed on the Property.
2.1 Unit Abbreviations
Units of measurement in this report conform to the SI (metric) system unless otherwise noted.
°C |
| degree Celsius |
% |
| percent |
BTU |
| British thermal unit |
CDN$ |
| Canadian dollars |
cfm |
| Cubic feet per minute |
dmt |
| Dry metric tonnes |
Ga |
| billion years |
g |
| gram |
g/t |
| gram per tonne |
hr |
| hour |
ha |
| hectare |
HP |
| Horsepower |
kg |
| kilogram |
km |
| kilometre |
km/hr |
| kilometre per hour |
kW |
| kilowatt |
L/min |
| litres per minute |
m3 |
| cubic metre |
m |
| Metre |
M |
| million |
mm |
| millimetre |
MW |
| Megawatt |
nT |
| nanotesla |
oz |
| Troy ounces |
t |
| metric tonne |
US$ |
| United States dollar |
US GPM |
| United States gallon per minute |
V |
| Volt |
2.2 Name Abbreviations
Abbreviations of company names and terms used in the report.
3D |
| Three-Dimensional |
AAS |
| Atomic Absorption Spectrometry |
Acme |
| Acme Analytical Laboratories Ltd. |
acQuire |
| Drillhole Database Management Program |
AEP |
| Advanced Exploration Project |
Ag |
| Silver |
ASL |
| Above Sea Level |
Au |
| Gold |
BQ |
| BQ drill core size 36.4mm |
CIM |
| Canadian Institute of Mining, Metallurgy and Petroleum |
CIP/CIL |
| Carbon-in-pulp / Carbon-in-leach |
Cu |
| Copper |
DGPS |
| Differential Global Positioning System |
EM |
| Electromagnetic |
Fe |
| Iron |
GPS |
| Global Positioning System |
Hudbay |
| Collectively all Hudbay Minerals Inc. subsidiaries and business groups |
ICP |
| Inductively Coupled Plasma |
IDW |
| Inverse Distance Squared Weighted |
Lagger |
| Drillhole data entry system |
LOM |
| Life of mine |
NI |
| National Instrument |
NN |
| Nearest Neighbour |
NSR |
| Net smelter return |
NQ |
| NQ drill core size 47.6mm |
NSS |
| Near solid sulphide |
OIC |
| Order In Council |
OK |
| Ordinary Kriging |
P. Eng. |
| Professional Engineer |
P. Geo. |
| Professional Geoscientist |
Pb |
| Lead |
PR |
| Provincial Road |
QAQC |
| Quality Assurance and Quality Control |
Reflex |
| Reflex E-Z Shot |
RTK |
| Real Time Kinematic |
SAG |
| Semi Autogenous Grinding |
SG |
| Specific Gravity |
SS |
| Solid sulphide |
TIA |
| Tailings Impoundment Area |
UTM |
| Universal Transverse Mercator |
VMS |
| Volcanogenic Massive Sulphide |
Zn |
| Zinc |
ZNEQ |
| Zinc Equivalency |
3.0 RELIANCE ON OTHER EXPERTS
Standard professional procedures were followed in preparing the contents of this Technical Report. Data used in this report has been verified where possible and the author’s have no reason to believe that the data was not collected in a professional manner and no information has been withheld that would affect the conclusions made herein.
The information, conclusions, opinions, and estimates contained herein are based on:
· Information available to Hudbay at the time of preparation of this report,
· Assumptions, conditions, and qualifications as set forth in this report
For the purpose of the report, the author’s have relied on title and property ownership information provided by Ens Land Management (email dated February 24, 2012 from Janelle Toffan).
The author has relied on tax information provided by Hudbay tax department.
Except for the purposes legislated under provincial securities law, any use of the report by any third party is at the party’s sole risk.
4.0 PROPERTY DESCRIPTION AND LOCATION
The Lalor property is located approximately 215 km east of Flin Flon and 18 km west of Snow Lake in the province of Manitoba at 54°52’N latitude, 100°08’W longitude and 303 m ASL (Figure 4-1).
Hudbay owns a 100% interest in the property through five mineral claims and eight Order in Council Leases to the south. Application has been submitted to convert the mineral claims to mineral leases.
4.1 Land Tenure
The five contiguous claims, held by Hudbay encompass the majority of the Lalor deposit. The southerly up-plunge extension of the mineralization lies within the Hudbay Order In Council Leases. The five claims cover an area totalling 765 ha and are in good standing (Table 4-1). Application has been submitted to convert these claims to a Mineral Lease. The eight Order In Council Leases (Table 4-2) that contain the up-plunge extension of the mineralization total 152 ha (see Figure 4-2). Property boundaries are set forth in the mineral leases and claims as shown below.
TABLE 4-1 PROPERTY MINERAL CLAIMS
Claim Number |
| Disposition Name |
| Owner |
| Hectares |
| Anniversary Date |
CB10605 |
| DUB 10605 |
| Hudbay |
| 195 |
| 20-Aug-2020 |
CB10606 |
| DUB 10606 |
| Hudbay |
| 182 |
| 20-Aug-2020 |
CB10607 |
| DUB 10607 |
| Hudbay |
| 107 |
| 20-Aug-2012 |
CB10608 |
| DUB 10608 |
| Hudbay |
| 100 |
| 20-Aug-2020 |
CB5361 |
|
|
| Hudbay |
| 181 |
| 9-May-2012 |
Total |
| 5 |
|
|
| 765 |
|
|
TABLE 4-2 PROPERTY MINERAL LEASES
Lease Number |
| Disposition Name |
| Owner |
| Hectares |
| Anniversary Date |
M 5778 |
| OX 153 |
| Hudbay |
| 16 |
| 8-Apr-2012 |
M 5779 |
| OX 154 |
| Hudbay |
| 18 |
| 8-Apr-2012 |
M 5780 |
| OX 155 |
| Hudbay |
| 18 |
| 8-Apr-2012 |
M 5781 |
| OX 156 |
| Hudbay |
| 20 |
| 8-Apr-2012 |
M 7278 |
| OX 143 |
| Hudbay |
| 22 |
| 6-Sep-2012 |
M 7279 |
| OX 144 |
| Hudbay |
| 21 |
| 6-Sep-2012 |
M 7280 |
| OX 145 |
| Hudbay |
| 22 |
| 6-Sep-2012 |
M 7281 |
| OX 146 |
| Hudbay |
| 15 |
| 6-Sep-2012 |
Total |
| 8 |
|
|
| 152 |
|
|
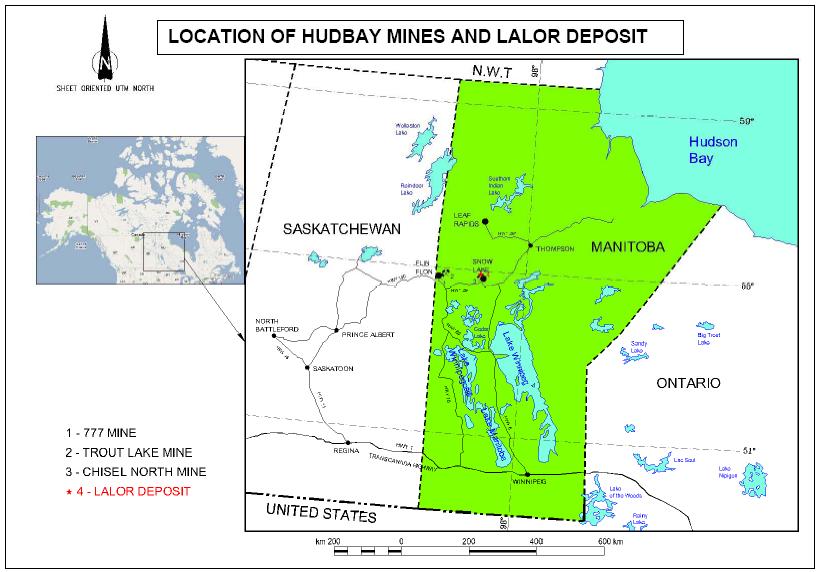
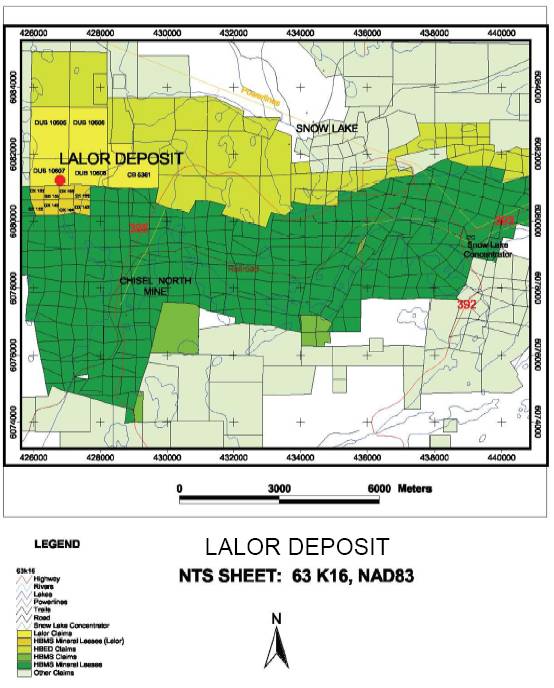
The mineral claims have a work commitment of C$25/ha per year and filing fees of C$12/claim per year, which must be submitted with application to renew. Field work is carried out and a Report of Work is submitted to the Ministry of Manitoba Innovation, Energy and Mines (the Manitoba government) office for assessment credits. Assessment credits can be used towards the work commitment of any claim within a 3,200ha area of the claim where the original work was incurred. Claims can be renewed for any number of years provided sufficient assessment credits exist and are applied, to meet the work required over the number of years being renewed.
The Order in Council (OIC) Leases have a term of 21 years. An annual payment of C$10.50/ha or C$193 minimum payment is due over the 21 year term. Annual tax of C$10 per lease is due by December 31 of each year. There is no work commitment on an OIC lease.
4.2 Land Use Permitting
General Permit GP59093 is held by Hudbay for the Lalor exploration road and parking lot. General Permit GP63483 is held by Hudbay for the advance exploration site. In addition, Hudbay holds a quarry lease for a source of roadbed material (QL-1928). Table 4-3 shows the permit status for the Lalor property.
TABLE 4-3 PERMITS
Permit |
| Owner |
| Work |
GP59093 |
| Hudbay |
| 4km x 50m all weather road |
GP59093 |
| Hudbay |
| 200m x 200m parking lot |
GP63483 |
| Hudbay |
| Structures and improvements to support Advanced Exploration Project |
QL 1928 |
| Hudbay |
| Quarry |
Hudbay holds the Mineral and Mineral Access Rights to the Lalor deposit. This allows use and occupation of the land surface for the purposes of prospecting, exploring for, developing, mining or producing minerals on, in or under the land. Should any buildings and/or structures be required for the efficient and economical performance of the mining
operations, an application must be made to the Manitoba government for a surface lease (Toffan, 2012).
5.0 ACCESSIBILITY, CLIMATE, LOCAL RESOURCES, INFRASTRUCTURE AND PHYSIOGRAPHY
5.1 Accessibility
The Lalor deposit is located approximately 215km by road east of Flin Flon and 18km by road west of the community of Snow Lake, Manitoba. Access to the deposit is from Provincial Road (PR) #395, a gravel road off PR #392, which joins the town of Snow Lake and PR #39 (Figure 5-1). From PR #395 there is an all weather permanent road into the site to support the infrastructure construction and permanent mine site.
5.2 Climate
The Snow Lake area has a typical mid-continental climate, with short summers and long, cold winters. Climate generally has only a minor effect on local exploration and mining activities.
The nearest Environment Canada weather station is located near Baker’s Narrows at the Flin Flon airport, approximately 16km southeast of Flin Flon, and approximately 100 km west of the Lalor deposit. The average annual temperature at the Baker’s Narrows weather station is 0.1°C. The average summer temperature is approximately 17°C, and the average winter temperature is -14°C. The lowest monthly average temperature occurs in January at -21.1°C, and the highest monthly average temperature is in July at 18.3°C. Freeze-up of small bays and lakes occurs in mid-November, with breakup occurring in mid-May. There is an average of 115 frost-free days.
On average 45.7cm of precipitation falls annually, 35% as snow. Since 1960, extreme monthly precipitations have been zero to a high of 18.11cm, with a maximum daily precipitation of 7.82cm. Average monthly winds for the area range from 10km/hr to 13km/hr, with 40% of the winds originating from the northwest, northeast or north.
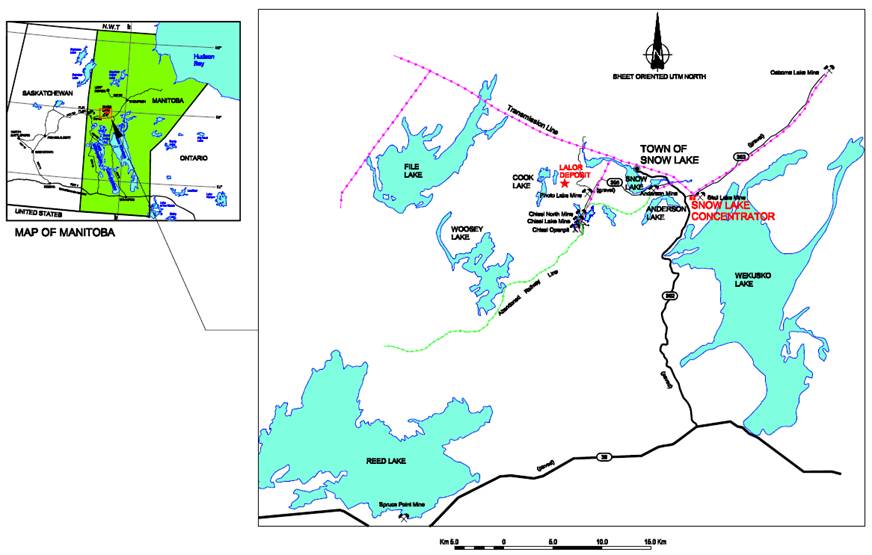
5.3 Local Resources
The nearest community is the town of Snow Lake, Manitoba, located approximately 15km from Lalor. The community of 723 (2011 census) has 526 private dwellings, of which 324 are single-detached or semi-detached houses. There are two cottage subdivisions located on Wekusko Lake along PR #391, as well as residences at Herb Lake Landing, approximately 40km south of the town. There are also a small number of seasonal remote cottages located near lakes throughout the area.
Snow Lake community services include a health facility staffed with two doctors, ambulance, fire truck, a grocery store, two hotel/motels, three service stations, a kindergarten to grade 12 school, a hockey arena, a five-sheet curling rink and a nine-hole golf course.
The nearest larger centres (5,000+) are Flin Flon (215 km), The Pas (200 km) and Thompson (230 km), all accessible by paved highway. There is a 1,100m x 20m unserviced gravel municipal airstrip located approximately 30km from Lalor along PR #394. A small craft charter service operates out of the community of Snow Lake, where small planes and helicopters can be chartered. Rental vehicles are available at the Flin Flon airport. The nearest full service commercial airport is located at Baker’s Narrows, near Flin Flon, approximately 200 km from Lalor. The nearest international airport is located in Winnipeg, approximately 700 km from Snow Lake.
There is no rail in the immediate area of Lalor or Snow Lake. The nearest rail access is at Wekusko siding, approximately 65km southeast of Lalor. Wekusko is accessible by an all-weather road. A gravel rail bed (ties and rail removed) connects the Snow Lake concentrator to Chisel Lake Mine, and continues to a rail line at Optic Lake siding, approximately 65km west of Chisel Lake. Optic Lake is not road accessible.
5.4 Infrastructure
Hudbay operates a zinc metallurgical plant in Flin Flon, Manitoba, approximately 215 km from Lalor. Present capacity is 115,000 tpa refined zinc.
Hudbay operates an ore concentrator approximately 15 km from Lalor. The mill operates five days per week at 1,300 short tons per milling day, processing ore from the Chisel North Mine. The mill has two circuits, with design capacities of 1,000stpd and 2,400stpd.
The concentrator has one circuit operational and is only producing zinc concentrate. It was historically capable of producing copper, zinc and lead concentrates. The tailings are either dry-filtered or slurried and deposited at the Anderson Lake tailings pond. Concentrates are hauled by truck to Hudbay metallurgical facilities in Flin Flon.
General area infrastructure includes provincial roads and 115kV Manitoba Hydro grid power to within four kilometres of Lalor, and Manitoba Telecom land line and cellular phone service.
The Town of Snow Lake is a full service community with available housing, hospital, police, fire department, potable water system, restaurants and stores. The community is serviced by a 914m gravel airstrip to provide emergency medical evacuation.
Lalor is located four road kilometres from the Hudbay Chisel North mine. Chisel North infrastructure includes a mined out open pit used for waste rock disposal, fresh (process) water sources, pumps and waterlines, 4160V and 550V power, mine discharge water lines, a 2,500gpm water treatment plant with retention areas, plus mine buildings including offices and a changehouse. These facilities were used for ramp development and will be used during Lalor operation. The permitted Hudbay Anderson TIA, located approximately 12km from Lalor will be used for tailings disposal.
5.5 Physiography
The deposit is located in the Boreal Shield Ecozone, the largest ecozone in Canada, extending as a broad inverted arch from northern Saskatchewan east to Newfoundland. The area of Lalor and surrounding water bodies (Snow, File, Woosey, Anderson and Wekusko lakes) are located in the Churchill River Upland Ecoregion in the Wekusko Ecodistrict. The dominant soils are well to excessively drained dystic brunisols that have developed on shallow, sandy and stony veneers of water-worked glacial till overlying bedrock. Significant areas consist of peat-filled depressions with very poorly drained Typic and Terric Fibrisolic and Mesisolic Organic soils overlying loamy to clayey glaciolacustrine sediments.
The property area is approximately 300m ASL, with depressional lowlands, and has gentle relief that rarely exceeds 10m, consisting of ridged to hummocky sloping rocks
6.0 HISTORY
The Snow Lake area has a long exploration and mining history. The Lalor deposit was discovered in 2007.
6.1 Exploration in the Chisel Basin Area
Exploration in the Chisel Basin has been active since 1955. The Chisel Basin area has hosted three producing mines, namely, Chisel Lake, Chisel Open Pit and Chisel North. All three mines have very similar lithological and mineralogical features. This basin is also the host of the Lalor deposit.
In early 2007, drill hole DUB168 was drilled almost vertically to test a 2003 surveyed Crone Geophysics deep penetrating pulse electromagnetic anomaly and intersected a band of conductive mineralization between 781.74m and 826.87m (45.13m). Assay results include 0.30% Cu and 7.62% Zn over the 45.13m including 0.19% Cu and 17.26% Zn over 16.45m. Drilling at Lalor has been continuous since the discovery of mineralization on the property.
6.2 Historical Mining in the Snow Lake Area
The Snow Lake area has had an active mining history for more than 50 years. Hudbay has played an integral part in this history since the late 1950s by operating nine mines in the area including Photo Lake, Rod, Chisel Lake Chisel North and Chisel Open Pit, Stall Lake, Osborne Lake, Spruce Point, Ghost Lake, and Anderson Lake.
The Snow Lake concentrator was commissioned in 1979 and operated continuously until shutdown in early 1993 as a result of the depletion of the Chisel Open Pit and Stall Lake mines. The concentrator was reopened in 1994 to process ore from the Photo Lake Mine and continued to process ore from the Chisel North Mine until February 2009. With the reopening of Chisel North in 2010, the concentrator reopened and is expected to remain open until a new mill and concentrator is commissioned on the Lalor site.
7.0 GEOLOGICAL SETTING AND MINERALIZATION
7.1 Regional Geology
The Lalor property lies in the eastern (Snow Lake) portion of the Paleoproterozoic Flin Flon Greenstone Belt (Figure 7-1) and is overlain by a thin veneer of Pleistocene glacial/fluvial sediments. Located within the Trans-Hudson Orogen, the Flin Flon Greenstone Belt consists of a variety of distinct 1.92 to 1.87Ga tectonostratigraphic assemblages including juvenile arc, back-arc, ocean-floor and ocean-island and evolved volcanic arc assemblages that were amalgamated to form an accretionary collage (named the Amisk Collage) prior to the emplacement of voluminous intermediate to granitoid plutons and generally subsequent deformation (Syme et al., 1998). The volcanic assemblages consist of mafic to felsic volcanic rocks with intercalated volcanogenic sedimentary rocks. The younger plutons and coeval successor arc volcanics, volcaniclastic, and sedimentary successor basin rocks include the older, largely marine turbidites of the Burntwood Group and the terrestrial metasedimentary sequences of the Missi Group.
The Flin Flon belt is in fault and /or gradational contact with the Kisseynew Domain metasedimentary gneisses to the north and is unconformably overlain by the Phanerozoic cover of sandstone and dolostones to the south (Figure 7-2). Regional metamorphism at 1.82 to 1.81Ga formed mineral assemblages in the Flin Flon belt that range from prehnite-pumpellyite to middle amphibolite facies in the east and upper amphibolite facies in the north and west (David and Machado, 1996; Froese and Moore, 1980; Syme et al., 1998).
The Snow Lake portion of the Flin Flon belt is dominated by fold-thrust style tectonics that is atypical of western and central portions of the belt. It is a south-verging, northeast dipping imbricate that was thrust over the previously amalgamated collage of oceanic and arc rocks to the west (Bailes and Galley, 1999). The thrust package of the Snow Lake area has been modified by 1.82 to 1.81 Ga regional metamorphism of lower to middle almandine-amphibolite facies mineral assemblages (David and Machado, 1996; Froese and Moore, 1980).

Source: http://www.gov.mb.ca/stem/mrd/geo/exp-sup/mbgeology.html Manitoba Science, Technology, Energy and Mines
FIGURE 7-2 GEOLOGY OF THE FLIN FLON GREENSTONE BELT, MANITOBA
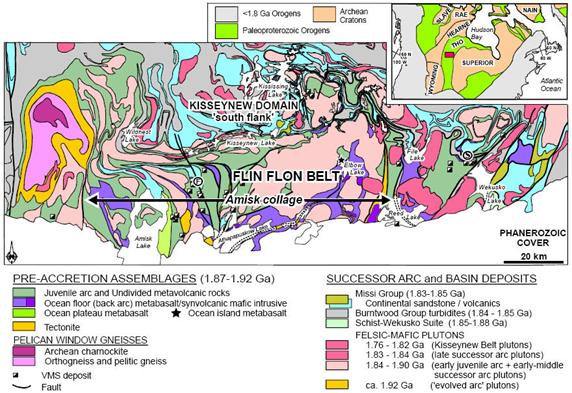
Source: http://www.gov.mb.ca/stem/mrd/geo/exp-sup/mbgeology.html
Manitoba Science, Technology, Energy and Mines
Intrusions in the belt are divided into pre-, syn- and post tectonic varieties where the pre-tectonic group includes intrusions that are coeval with the volcanic rocks, as well as those that crosscut volcanic and Missi supracrustal rocks. Numerous mafic to ultramafic dykes intrude the volcanic rocks.
7.2 Property Geology
The Snow Lake arc assemblage (Figures 7-3 and 7-4) that hosts the producing and past-producing mines in the Snow Lake area is a 20km wide by 6km thick section that records a
temporal evolution in geodynamic setting from ‘primitive arc’ (Anderson sequence to the south) to ‘mature arc’ (Chisel sequence) to ‘arc-rift’ (Snow Creek sequence to the northeast, Bailes and Galley, 2007). The ‘mature arc’ Chisel sequence that hosts the zinc rich Chisel, Ghost, Chisel North, and Lalor deposits typically contains thin and discontinuous volcaniclastic deposits and intermediate to felsic flow-dome complexes.
The Chisel sequence is lithologically diverse and displays rapid lateral facies variations and abundant volcaniclastic rocks. Mafic and felsic flows both exhibit evolved geochemical characteristics (relative to the unevolved underlying Anderson sequence) consistent with one of, or a combination of, the following: within-plate enrichment, derivation from a more fertile mantle source, lower average extents of melting at greater depths, and contamination from older crustal fragments. These rocks have undergone metamorphism at the lower to middle almandine-amphibolite facies.
Rock units in the hanging wall of the Lalor deposit typically reflect this diversity and variation in rock types that include mafic and felsic volcanic and volocaniclastic units, mafic wacke, fragmental units of various grain sizes, and crystal tuff units.
FIGURE 7-4 GEOLOGY OF THE SNOW LAKE AREA
Source: http://www.gov.mb.ca/iedm/mrd/geo/gis/geoscimaps.html
Manitoba Science, Technology, Energy and Mines
The Lalor deposit is similar to other massive sulphide bodies in the Chisel sequence (Chisel Lake, Ghost Lake, Chisel North, and Photo Lake), and lies along the same stratigraphic horizon as the Chisel Lake and Chisel North deposits. It is interpreted that the top of the zone is near a decollement contact with the overturned hanging wall rocks.
The most common dyke intrusion throughout these rocks is a fine grained feldspar-phyric gabbro to diorite. The Chisel Lake pluton, a late 1.8km by 9.8km layered ultramafic intrusion (Bailes and Galley, 2007), truncates the main lens of the Chisel Lake massive sulphide deposit but is not seen in any of the Lalor drill core.
The extensive hydrothermal alteration and metamorphic recrystallization of the footwall rocks has produced some exotic aluminous mineral assemblages. These assemblages include chlorite and sericite dominant schists and cordierite+anthophyllite gneisses. Other minerals indicative of hydrothermal alteration that occur extensively throughout these rock assemblages include quartz, feldspar, kyanite, biotite, garnet, staurolite, hornblende, and carbonate. Clinopyroxene, gahnite and anhydrite also occur locally. These assemblages are typical of metamorphosed footwall hydrothermal alteration commonly associated with volcanogenic massive sulphide (VMS) deposits and are similar to that at the other massive sulphide deposits in the Chisel Lake area.
7.3 Base Metal Mineralization
The Lalor VMS deposit is flat lying, with zinc mineralization beginning at approximately 570m from surface and extending to a depth of approximately 1,160m. The mineralization trends about 270° to 310° azimuth and dips between 15° and 30° to the north. It has a lateral extent of about 900m in the north-south direction and 700m in the east-west direction.
Sulphide mineralization is pyrite and sphalerite. In the near solid (semi-massive) to solid (massive) sulphide sections, pyrite occurs as fine to coarse grained crystals ranging one to six millimetres and averages two to three millimetres in size. Sphalerite occurs interstitial to the pyrite. A crude bedding or lamination is locally discernable between these two sulphide minerals. Near solid coarse grained sphalerite zones occur locally as bands or boudins that strongly suggest that remobilization took place during metamorphism.
Disseminated blebs and stringers of pyrrhotite and chalcopyrite occur locally within the massive sulphides, adjacent to and generally in the footwall of the massive sulphides. The hydrothermally altered rocks in the footwall commonly contain some very low concentrations of sulphide minerals.
Some sections of massive pyrrhotite occur, but these tend to give way to pyrite-sphalerite-dominant zones.
Six distinct stacked zinc rich mineralized zones have been interpreted within the Lalor deposit based on the Zinc Equivalency (ZNEQ) of 4% over a minimum two metre interval (Table 7-1).
The top two lenses of the stacked base metal zones (coded as Zone 11 and 10) have higher grade zinc and iron content. The footwall lenses coded as Zones 20, 30, 31 and 40 have moderate to high zinc grades hosted in near solid sulphides containing higher grade gold and locally appreciable amounts of copper.
Overall, Zones 10 and 20 have the largest extent and volume of mineralization. Zone 10 extends approximately 450m in the east-west and 600m in the north-south direction and Zone 20, 450m in the east-west and 900m in the north-south direction.
TABLE 7-1 SUMMARY OF ZINC RICH INTERPRETED WIREFRAMES
Zone |
| Volume (m3) |
| Average Thickness |
| Number of |
| Assayed |
| Volume |
|
10 |
| 1,686,000 |
| 9.1 |
| 46 |
| 472.59 |
| 37,000 |
|
11 |
| 127,000 |
| 3.4 |
| 14 |
| 50.16 |
| 9,000 |
|
20 |
| 1,862,000 |
| 8.9 |
| 87 |
| 725.62 |
| 21,000 |
|
30 |
| 761,000 |
| 11.7 |
| 23 |
| 268.75 |
| 33,000 |
|
31 |
| 145,000 |
| 7.5 |
| 6 |
| 58.9 |
| 24,000 |
|
40 |
| 298,000 |
| 6.8 |
| 13 |
| 114.73 |
| 23,000 |
|
Total |
| 4,879,000 |
|
|
|
|
| 1,690.75 |
|
|
|
7.4 Gold Mineralization
Gold and silver enriched zones occur near the margins of the zinc rich sulphide lenses and as lenses in local silicified alteration. Remobilization is illustrated in some of the gold-rich zones by late veining that is more or less restricted to the massive lenses. Some of the footwall zones tend to be associated with silicification and the presence of gahnite. These zones are often characterized by copper-gold association, and are currently interpreted as being associated with higher temperature fluids below a zone of lower temperature base-metal accumulations.
Footwall gold mineralization is typical of any VMS footwall feeder zone with copper-rich, disseminated and vein style are overlain by a massive, zinc-rich lens. The fact that the footwall zone is strongly enriched in gold suggests a copper-gold association which is comparable to other gold enriched VMS camps and deposits (Mercier-Langevin, 2009).
General observations of the known gold zones indicate areas which are coarse grained and porphyroblastic in nature are gold poor, while fine grain siliceous (± veins ± sulphide traces) and strained looking stratigraphy tend to be gold rich. To date no definitive structural controls of the gold mineralization has been interpreted. However, the intensity and style of alteration can vary strongly over short distances and may suggest that the alteration was forming discordant stockwork like zones that are now strongly transposed in the main foliation (Mercier-Langevin, 2009).
Six lens groups have been interpreted within the deposit area and are present between 750m to 1,480m below surface (Table 7-2). Their general shape is similar to the base metals. However, the current interpretation suggests the deeper copper-gold lens tends to have a much more linear trend to the north than the rest of the zones. The gold mineralization associated with each zone was interpreted into three-dimensional wireframes based on a 1.0 g/t gold cut-off over a minimum two metre interval.
TABLE 7-2 SUMMARY OF GOLD INTERPRETED WIREFRAMES
Gold |
| Volume (m3) |
| Average Thickness |
| Number of |
| Assayed |
| Volume |
|
21 |
| 1,283,000 |
| 8.7 |
| 76 |
| 758.62 |
| 17,000 |
|
24 |
| 107,000 |
| 4.9 |
| 10 |
| 58.75 |
| 11,000 |
|
25 |
| 1,678,000 |
| 9.8 |
| 75 |
| 830.27 |
| 22,000 |
|
26 |
| 276,000 |
| 6.4 |
| 21 |
| 170.29 |
| 13,000 |
|
27 |
| 482,000 |
| 8.1 |
| 13 |
| 120.58 |
| 37,000 |
|
28 |
| 172,000 |
| 9.8 |
| 11 |
| 92.07 |
| 16,000 |
|
Total |
| 3,998,000 |
|
|
|
|
| 2,030.58 |
|
|
|
8.0 DEPOSIT TYPE
Lalor is interpreted as a VMS deposit that precipitated at or near the seafloor in association with contemporaneous volcanism, forming a stratabound accumulation of sulphide minerals. VMS deposits typically form during periods of rifting along volcanic arcs, fore arcs, and in extensional back arc basins. Rifting causes extension and thinning of the crust, providing the high heat source required to generate and sustain a high-temperature hydrothermal system (Franklin et al., 2005).
The location of VMS deposits is often controlled by synvolcanic faults and fissures, which permit a focused discharge of hydrothermal fluids. A typical deposit will include the massive mineralization located proximal to the active hydrothermal vent, footwall stockwork mineralization, and distal products, which are typically thin but extensive. Footwall, and less commonly, hanging wall semiconformable alteration zones are produced by high temperature water-rock interactions (Franklin et al., 2005).
The depositional environment for the mineralization at Lalor is similar to that of present and past producing base metal deposits in felsic to mafic volcanic and volcaniclastic rocks in the Snow Lake mining camp. The deposit appears to have an extensive associated hydrothermal alteration pipe.
9.0 EXPLORATION
Exploration in the Lalor deposit area is conducted by Hudbay with the main exploration office in the area located in Flin Flon. A field office, including core logging and storage facilities, is situated on the Hudbay Snow Lake concentrator site.
In 2003, a Crone Geophysics high power time-domain electromagnetic (EM) system experimental survey was conducted over the deepest portion (approximately 600 m vertical depth) of the Chisel North Mine. The survey was designed and interpreted by Hudbay and was conducted by Koop Geotechnical Services Inc. The survey provided conclusive evidence that the system could detect conductive bodies at depths greater than 500m and it was decided to extend the survey coverage further down-dip and down-plunge of the known mineralized lenses. A double-wired transmitter loop measuring two kilometres by two kilometres was used to maximize the EM field strength. The survey results were interpreted using three-dimensional computer modeling software. The model indicated a highly conductive, shallow-dipping zone at a vertical depth of 800m. The Lalor drilling began in March 2007 to test the geophysical anomaly, and diamond drill hole DUB168 intersected conductive sulphides at a depth of approximately 780m. Drilling is ongoing and has been continuous since the discovery hole.
Exploration since the disclosed October 2009 NI 43-101 technical report has focused on delineation of the inferred resource, confirming the continuity of the mineralization down plunge and testing for new mineralization peripheral to the known deposit.
9.1 Borehole Electromagnetic (EM) Surveys
Time-domain borehole EM surveys with three dimensional probes are routinely conducted on drill holes. The survey results identify any off-hole conductors that have been missed and indicate direction to the target as well as the dimensions and the attitude of the conductor. The survey also may detect any possible conductors which lie past the end of the hole allowing the geologist to know whether or not the hole should be deepened.
10.0 DRILLING
The Lalor drilling began in March 2007 to test an electromagnetic anomaly and the first hole DUB168 intersected appreciable widths of zinc-rich massive sulphides. Drilling is ongoing and has been continuous since the discovery hole. This report contains drilling information as of a September 30, 2011 cut-off date.
The majority of the drilling on the property is by near vertical holes were the sample length is approximately equal to the true thickness because of the flat lying nature of the Lalor deposit.
All diamond drilling was completed from surface retrieving whole core sizes of BQ and NQ. Wedge offsets and associated directional drilling were completed on parent holes, resulting in time and cost savings over drilling a new hole from surface. Wedging and directional drilling were used at Lalor for acquiring metallurgical sample and delineation purposes. For delineation purposes, wedge offsets are oriented towards specific targets selected by the geologists along a path calculated by the directional drilling technicians. In metallurgical sampling wedge offsets are not oriented and the wedge is set just above the zone that is to be sampled such that the core sample collected is generally within 10m to 20m of the parent hole intersection. As many as seven wedge offsets have been completed from one parent hole.
Due to the size of the wedging and directional drilling equipment used for this project, all of the parent drill holes used for wedge offsets are NQ size. Tech Directional Services Inc. of Newfoundland is the contractor operating the Devico directional drilling system. The Devico system allows for the collection of AQ core from an NQ hole throughout the steering process. An offset of up to 20° per 30m of hole can be achieved with this system. Core recovery is generally greater than 90%.
The first step in the wedging process is to backfill the hole with cement so as not to leave space in the parent below the wedge. An expandable wedge retainer (plug) is then set in the parent hole at a predetermined depth and a wooden block is placed on top of the wedge. A non-retrievable steel wedge is set into the wooden block and is held in place by the axe head
of the wedge that splits the wooden block. This, plus the swelling of the wood as it hydrates, holds the wooden block tightly in place and subsequently keeps the wedge oriented properly. The wedge face is oriented using an orientation tool in the wedge dropper and a downhole survey tool by the directional drilling technicians to achieve the desired direction.
A bullnose bit is used to kick off the wedge and start a new hole. No core is recovered in this process. The bullnose is generally used for five metres of drilling, just enough to get past the steel wedge and establish a new hole. A wedge will allow up to a two degree deviation from the parent hole. The natural bend of the steel rods and core barrel as they drill past the wedge increases the amount of deviation from the wedge.
For metallurgical samples, after bullnose drilling, the NQ drilling is allowed to proceed off the wedge for 40m to 80m or more until the sample is collected. The hole is then cemented and the process can be repeated higher up the hole.
For delineation drilling purposes, once a wedge offset is established from the parent hole (usually 12m to 15m past the wedge), the directional drilling technicians use the Devico system to steer the hole towards the drill target. Generally the system is used for short distances and then normal NQ drilling is resumed.
At the time of the cut-off date for this report, there was wedging from 86 parent holes.
Core recovery at Lalor is near 100% on all holes.
Table 10-1 presents a summary of all diamond drill holes with assay results as of January 1, 2012 in the Lalor Deposit area.
TABLE 10-1 SUMMARY OF DIAMOND DRILL HOLES WITH ASSAY RESULTS AS OF JANUARY 1, 2012
Year |
| Hole |
| Operator |
| Number |
| Core Size |
| Length |
| Drilling |
|
|
| Parent |
| Hudbay |
| 2 |
| BQ |
| 2,342 |
| Major Drilling Ltd. |
|
2007 |
| Parent |
| Hudbay |
| 26 |
| NQ |
| 29,600 |
| Major Drilling Ltd. |
|
|
| Parent |
| Hudbay |
| 41 |
| NQ |
| 45,454 |
| Major Drilling Ltd. |
|
2008 |
| Wedge |
| Hudbay |
| 32 |
| NQ/AQ |
| 12,112 |
| Major Drilling Ltd. |
|
|
| Parent |
| Hudbay |
| 29 |
| NQ |
| 35,390 |
| Major Drilling Ltd. |
|
2009 |
| Wedge |
| Hudbay |
| 47 |
| NQ/AQ |
| 22,884 |
| Major Drilling Ltd. |
|
|
| Parent |
| Hudbay |
| 13 |
| NQ |
| 17,438 |
| Major Drilling Ltd. |
|
2010 |
| Wedge |
| Hudbay |
| 17 |
| NQ/AQ |
| 11,576 |
| Major Drilling Ltd. |
|
|
| Parent |
| Hudbay |
| 10 |
| NQ |
| 15,458 |
| Major Drilling Ltd. |
|
2011 |
| Wedge |
| Hudbay |
| 5 |
| NQ/AQ |
| 3,139 |
| Major Drilling Ltd. |
|
Total |
|
|
|
|
| 222 |
|
|
| 195,393 |
|
|
|
10.1 Surveying of Property Grid and Drill Hole Collars
In August 2007, Manitoba land surveyors, Balchen & Kulchycki Surveys (Balchen & Kulchycki), established control points at the Lalor property using a Trimble R8 RTK DGPS system, rated as subdecimetre in accuracy. The survey consisted of locating the coordinates of the property grid and 14 drill hole collars. Coordinates are reported in UTM NAD83.
Hudbay has conducted numerous field trips to survey drill hole collars completed after August 2007. The surveys were conducted using a Trimble 5800 RTK DGPS. The base stations were set up on a point previously surveyed by Balchen & Kulchycki at the edge of PR #395, approximately 3.3 km from the drilling area. Collars were then surveyed with a rover unit linked to the base via radio. During the survey the equipment’s reliability was
checked by surveying three of the benchmark sets established by Balchen & Kulchycki in the drilling area. In each case, the difference between the two sets of coordinates was less than two centimetres. Drill hole collars previously surveyed by Balchen & Kulchycki were check surveyed and discrepancies were negligible.
All diamond drill holes were proposed and collared based on the property grid, which was referenced from baselines in the area that were cut every 1,230m. Chain and turning boards were used to establish the grid on 91m centres.
The location of the drill holes is shown in Figure 10-1 in relation to the base metal mineralized outlines. The holes were originally drilled at 200m to 400m spacing across the geophysical target to outline the overall deposit extents. The deposit is currently drilled at less than 50m in the middle of the base metal zones and 75m to 125m spacing along the perimeter. The majority of holes are drilled near vertical and tend to deviate towards the southwest direction. Figure 10-2 illustrates the Lalor deposit drill holes and the zinc rich mineralized zone outlines in plan view.
10.2 Downhole Surveying
Downhole surveys were completed using a Reflex EZ-Shot® (Reflex) instrument. Surveys were completed at regular intervals of 30m to 50m down the hole.
The Reflex instrument measures the azimuth relative to the earth’s magnetic field and records the dip of the hole. The magnetic field strength is checked for possible magnetic interference, where magnetic rock or material close to the instrument affects the magnetic field strength and magnetic azimuth readings.
The normal magnetic field strength for the deposit is 5,800nT to 6,000nT, established in an area free of magnetic effects. The Reflex instrument is calibrated based on the normal field strength and flashes when the magnetic strength is greater or less than 1,000nT from normal. The geologist validates the survey results and will accept or reject the magnetic azimuth reading.
A gyro survey was completed at the Lalor deposit site in February 2009 to check the accuracy of the Reflex readings. The survey was conducted by Sperry Drilling Services,
which is a division of Halliburton Group Canada. Four drill holes were selected for the survey and differences between the Reflex and the gyro survey were less than 1% at the end of the drill holes. The gyro surveys have confirmed that the magnetic Reflex survey is accurate and reliable method of downhole surveying at the Lalor deposit.
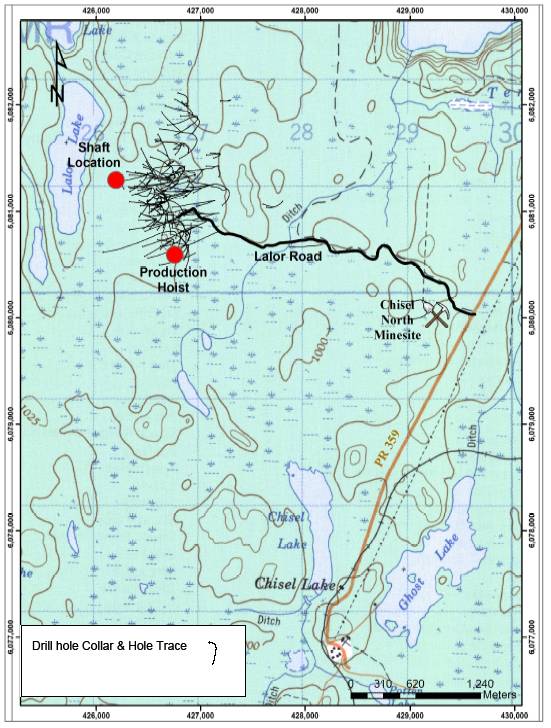
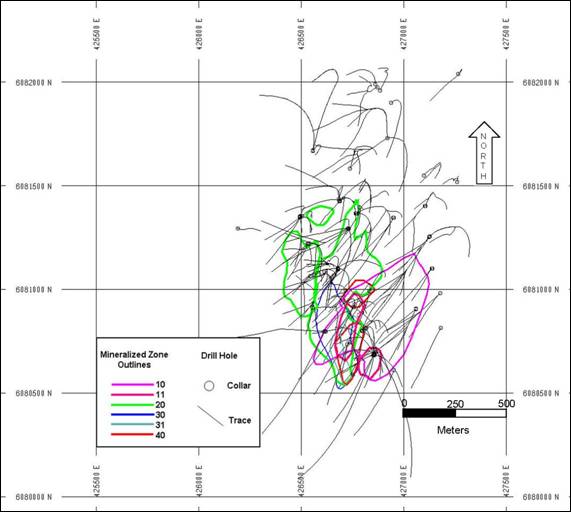
11.0 SAMPLING PREPARATION, ANALYSES, AND SECURITY
11.1 Laboratory/Laboratories Used
Prior to November 1, 2009, the Lalor samples were all prepared and analyzed by Hudbay at the Flin Flon, Manitoba assay laboratory. As part of Hudbay QAQC measures, pulp duplicates were sent to Acme Analytical Laboratories Ltd. (Acme) in Vancouver, BC for comparison and verification purposes. Beginning November 1, 2009, the Lalor samples are prepared by Hudbay and then shipped to Acme for analysis. Pulp duplicates are analyzed at the Hudbay laboratory in Flin Flon for comparison and verification of the Acme assay.
11.2 Sample Receipt
Once sample intervals are selected, estimated sphalerite, chalcopyrite, and pyrite percentages are recorded in a sample tag book with a unique sample number for each sample interval. The samples are labelled on the core and are recorded in the sample booklet.
Assay certificates have had two sources (Hudbay assay laboratory and external Acme laboratory) and two forms (hard copy and digital). The Hudbay assay laboratory issues a hard copy daily assay report as well as a digital equivalent. The hard copies are archived in binders at Hudbay and the digital copies are archived with write privileges given only to the chief exploration geologist and the database manager. The Hudbay assay laboratory database keeps analyses archived indefinitely. For older analyses, assay certificates may only exist in hard copy. Acme issues a hard copy and digital copy of the assay certificates for each sample batch. The hard copies are archived in binders and the digital copies are archived with the same write privileges as the Hudbay copies.
11.3 Sample Preparation
All samples arriving at the Hudbay laboratory are checked against the geologist’s sample submission sheets. Laboratory analytical work sheets are generated for the analysis areas. Any wet samples are dried at 105°C as per industry standard. The core samples are crushed to (-)10 mesh then split to approximately 250g, pulverized to about 90% passing, (-
)150 mesh and placed into labelled bags. Crusher and pulverizer checks are conducted daily to ensure there is no excessive wear on the crusher plates and pulverizer pots.
As of January 1, 2009 the remaining crushed core sample (coarse reject) not used for grade analysis is returned to the sample bag and stored at the Hudbay Hangar for future reference.
11.4 Assay Methodology
11.4.1 Hudbay
Prior to November 1, 2009 all samples were analyzed at the Hudbay Assay Laboratory in Flin Flon. The samples were analyzed for the following elements: gold, silver, copper, zinc, lead, iron, arsenic and nickel. Base metal and silver assaying was completed by aqua regia digestion and read by a simultaneous ICP unit. The gold analysis was completed on each sample by atomic absorption spectrometry (AAS) after fire assay lead collection. As of May 1, 2009 all samples with gold values (AAS) > 10g/t were re-assayed using a gravimetric finish. Detection limits of the ICP and AAS are shown in Table 11-1.
TABLE 11-1 HUDBAY LABORATORY DETECTION LIMITS
Element |
| Detection Limit |
Ag |
| 0.439 g/t |
As |
| 0.002% |
Au |
| 0.034 g/t |
Cu |
| 0.003% |
Fe |
| 0.007% |
Ni |
| 0.001% |
Pb |
| 0.002% |
Zn |
| 0.010% |
All analytical balances are certified annually by a third party. Check weights are used daily to verify calibration of balances. All metal standards used to make the calibration standards for the AAS and ICP are certified and traceable. Each is received with a certificate of analysis. Both the AAS and ICP are serviced twice per year by the instrument
manufactures qualified service representative to ensure that the instruments meet original design specifications.
The Flin Flon assay laboratory has been participating in CANMET PTP/MAL round robin testing since 2000. PTP/MAL is a requirement for laboratories that are ISO 17025 certified. The laboratory also has been participating since 2002 in round robin testing conducted by GEOSTATS of Australia.
Fine sample pulps are kept in secure storage at the laboratory after analysis. Pulps are only released to after all data is validated. Project personnel retrieved the designated pulps (approximately 1 out of every 20 samples) for submittal to Acme as part of their QAQC measures.
11.4.2 Acme Analytical Laboratories Ltd
Since November 1, 2009 all samples are analyzed by Acme. The Hudbay laboratory prepares the fine pulps as previously described. The sample information is then recorded on an ACME sample submission sheet on a box by box basis. Each box contains a copy of the sample sheet for those samples that are in the box, and the box is closed and labelled for shipping. The samples are shipped by ground freight on an as need basis.
Acme performs a multi-element assay (Group 7AR) measured on an ICP emission spectrograph after aqua regia digestion, and gold analysis (Group 601) on an ICP emission spectrometer after fire assay. As of September 2009 all gold samples reported > 10g/t by fire assay are then gravimetrically finished (Group 601+612) as instructed by Hudbay.
For the multi-element assay, aliquots of 1.000 ± 0.002g are weighed into 100mL volumetric flasks. Acme’s QAQC protocol requires one pulp duplicate to monitor analytical precision and a blank and aliquot of in-house reference material to monitor accuracy in each batch of 36 samples. 30mL of Aqua Regia, a 1:1:1 mixture of ACS grade concentrated HCl, concentrated HNO3 and de-mineralised H2O, is added to each sample. Samples are digested for one hour in a hot water bath (> 95°C). After cooling for 3 hours, solutions are made up to volume (100mL) with dilute (5%) HCl. Very high-grade samples may require a 1g to 250mL or 0.25g to 250mL sample/solution ratio for accurate determination. Acme’s
QAQC protocol requires simultaneous digestion of a reagent blank inserted in each batch. Sample solutions are aspirated into a Spectro Ciros Vision ICP emission spectrograph (ES) to determine 23 elements. Raw and final data from the ICP-ES undergoes a final verification by a British Columbia Certified Assayer who then signs the Analytical Report before it is released to the client. This 23 multi-element assay has detection limits displayed in Table 11-2.
For the gold analysis, one assay ton aliquots (29.2g) are weighed into fire assay crucibles. Smaller aliquots of ¼ or ½ assay ton may be required with difficult ore matrices. The sample aliquot is custom blended with fire assay fluxes, PbO litharge and a silver inquart. Firing the charge at 1050°C liberates Au, Ag ± PGEs that report to the molten Pb-metal phase. After cooling the Pb button is recovered, placed in a cupel, and fired at 950°C to render an Ag ± Au ± PGEs dore bead. The bead is weighed and parted (i.e. leached in 1mL of hot HNO3) to dissolve silver leaving a gold sponge. Adding 10mL of HCl dissolves the Au ± PGE sponge. Solutions are analysed for gold on a Jarrel-Ash Atomcomp model 975 ICP emission spectrometer. Gold in excess of 10g/t forms a large sponge that can be weighed (gravimetric finish). An analytical batch is comprised of 34 samples.
As part of Acme’s QAQC protocol, a sample-prep blank is inserted as the first sample and carried through all stages of preparation to analysis as well as a pulp duplicate to monitor analytical precision. Two reagent blanks are inserted in each batch to measure background, and aliquots of Rocklabs Certified Reference Materials to monitor accuracy. Raw and final data undergo a final verification by a British Columbia Certified Assayer who signs the Analytical Report before it is released to the client. Acme is currently registered with ISO 9001:2008 accreditation.
TABLE 11-2 ACME ELEMENTAL DETECTION LIMITS
Element |
| Detection Limit |
Ag |
| 2.000 g/t |
Al |
| 0.010 % |
As |
| 0.010% |
Au |
| 0.010 g/t |
Bi |
| 0.010 % |
Ca |
| 0.010 % |
Cd |
| 0.001 % |
Co |
| 0.001 % |
Cr |
| 0.001 % |
Cu |
| 0.001 % |
Fe |
| 0.010 % |
Hg |
| 0.001 % |
K |
| 0.010 % |
Mg |
| 0.010 % |
Mn |
| 0.010 % |
Mo |
| 0.001 % |
Na |
| 0.010 % |
Ni |
| 0.001 % |
P |
| 0.001 % |
Pb |
| 0.010 % |
Sb |
| 0.001 % |
Sr |
| 0.001 % |
W |
| 0.001 % |
Zn |
| 0.010 % |
11.5 Security
Security measures taken to ensure the validity and integrity of the samples collected include:
· Chain of custody of drill core from the drill site to the core logging area
· Buildings are kept locked when not in use
· Core sampling is undertaken by technicians under the supervision of Hudbay geologists
· Chain of custody for core cutting through to delivery to Hudbay laboratory in Flin Flon
· Well documented and implemented receiving and processing procedures at the Hudbay laboratory in Flin Flon
· The Hudbay Flin Flon Laboratory samples results are stored on a secure mainframe based Laboratory Information Management System (LIMS)
· The diamond drill hole database is stored on the secure Hudbay network, using the acQuire database management system with strict access rights
The author believes that there are no factors that could have materially impacted on the accuracy and reliability of the sample preparation, security, and analytical procedures and that those used are appropriate and adequate for VMS type mineralization.
12.0 DATA VERIFICATION
12.1 Quality Assurance / Quality Control
A total of 63,904 samples from 108 parent holes and 96 wedges were sawn and submitted to the Hudbay and Acme laboratories for assay. In addition, 1,993 blanks were sent to Hudbay and 1,324 blanks were sent to Acme. A total of 1,978 reference standards were inserted and submitted into the mainstream of samples to HBMS, and 1,323 samples to ACME.
Assays of fine pulp material, or duplicate samples, were run by the Hudbay laboratory on 1,156 of the submitted samples. Duplicate samples were analyzed by the Hudbay laboratory then shipped to Acme for comparison and verification purposes as part of the external QAQC process. After November, 2009, 1,108 pulps of samples analysed by Acme were shipped back to the Hudbay laboratory for analyses and comparison.
The author’s opinion is that the data verification is adequate for the purposes used in the technical report.
12.2 Blanks
A total of 1,993 blank non-mineralized granite samples and certified blanks were submitted to the Hudbay laboratory to test for cross-contamination from sample to sample. Of the 1,993 samples assayed, 1,001 reported nil values for gold, 1,954 reported nil values for silver, 1,948 reported nil values for copper and 1,783 reported nil values for zinc and are summarized in Table 12-1.
TABLE 12-1 BLANK ASSAY RESULTS HUDBAY
Total Number |
| Metal |
| Total Number |
| Minimum |
| Maximum |
| Average Grade |
|
1993 |
| Gold |
| 992 |
| 0.034 g/t |
| 2.983 g/t |
| 0.06 g/t |
|
1993 |
| Silver |
| 39 |
| 0.686 g/t |
| 3.771 g/t |
| 1.10 g/t |
|
1993 |
| Copper |
| 45 |
| 0.01% |
| 0.17% |
| 0.03% |
|
1993 |
| Zinc |
| 210 |
| 0.01% |
| 0.44% |
| 0.04% |
|
A total of 1,324 certified blanks and a few blank non-mineralized granite samples were submitted to the Acme laboratory to test for cross-contamination from sample to sample. Of the 1,324 samples assayed, 1,044 reported nil values for gold, 1,319 reported nil values for silver, 56 reported nil values for copper and 1,279 reported nil values for zinc and are summarized in Table 12-2.
TABLE 12-2 BLANK ASSAY RESULTS ACME
Total Number |
| Metal |
| Total Number |
| Minimum |
| Maximum |
| Average Grade |
|
1324 |
| Gold |
| 280 |
| 0.005 g/t |
| 2.431 g/t |
| 0.032 g/t |
|
1324 |
| Silver |
| 5 |
| 2 g/t |
| 26 g/t |
| 10.6 g/t |
|
1324 |
| Copper |
| 1268 |
| 0.00% |
| 0.40% |
| 0.00% |
|
1324 |
| Zinc |
| 44 |
| 0.01% |
| 0.07% |
| 0.02% |
|
12.3 Certified Standards
Pre November 2009 reference standard analyses from the Hudbay assay laboratory for all standards show good precision of the laboratory between the copper and zinc best values. However, many of the Series 4 zinc results are lower than the reference standard best values, due to the use by the Hudbay laboratory of aqua regia digestion rather than total digestion that was used during certification of the Series 4 values. Certification for the Series 5 values was done solely by aqua regia. Nonetheless, the lower values returned for the
Series 4 standards suggest a slight conservatism of the zinc values used for the mineral resource estimate.
Of the 1,978 reference standards submitted to Hudbay laboratory, five were from Series 3, 284 from Series 4 and 1,689 Series 5.
Starting November 1, 2009, reference standard analyses was done by Acme. These standards are from the Series 5 group only. All standards show a good precision of the laboratory for all elements.
12.4 Duplicates
Figures 14-1 through 14-4 display the comparison of 1,156 original Hudbay gold, silver, copper and zinc assays to Acme assay results on the same fine pulp rejects as part of Hudbay external QAQC. The comparison between laboratory results has good reproducibility with R2 values ranging from 0.9394 for gold to 0.9977 for copper.
FIGURE 12-1 COMPARISON OF HUDBAY ASSAY AND ACME CHECK ASSAY FOR GOLD
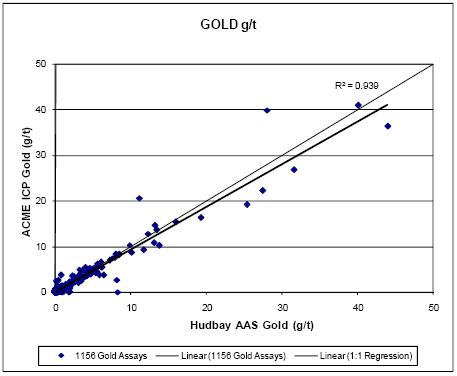
FIGURE 12-2 COMPARISON OF HUDBAY ASSAY AND ACME CHECK ASSAY FOR SILVER
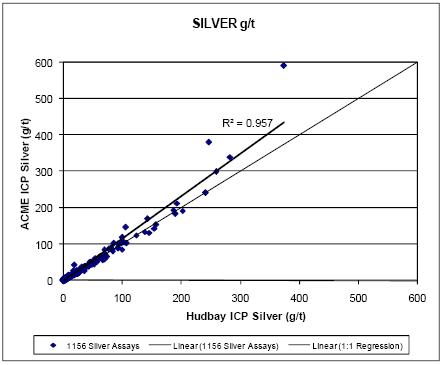
FIGURE 12-3 COMPARISON OF HUDBAY ASSAY AND ACME CHECK ASSAY FOR COPPER
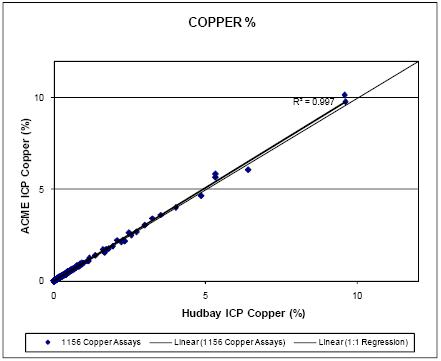
FIGURE 12-4 COMPARISON OF HUDBAY ASSAY AND ACME CHECK ASSAY FOR ZINC
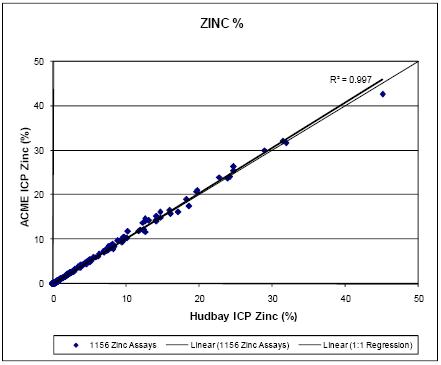
In addition to the aforementioned duplicate analyses checks, regular duplicate checks within the Hudbay laboratory, and duplicated check comparisons of parent samples from Acme are done by the Hudbay laboratory at the request of the qualified person.
12.5 Gold
With the discovery of the precious metal intersections and focused diamond drilling on gold zones, there has been particular attention placed on the assay results of the gold duplicates between laboratories and quantification of assay differences due to analytical methods. Historically the Hudbay laboratory uses atomic absorption spectrometry after fire assay and the Acme laboratory uses an ICP emission spectrometry after fire assay. Although the R2 value for gold has been quite high, a slight bias was suspected when sample results were plotted against a 1:1 correlation line (see Figure 12-1). Acme results appeared to be reporting slightly lower than HBMS results.
To test for bias, an additional 1,839 fine pulp rejects from the potential gold zone drill holes were shipped to the Acme laboratory for analysis. This larger data set was considered
to be more representative of the potential gold zone expected values. The shipment included 61 certified blanks inserted immediately after the higher grade gold samples and 100 certified standards inserted approximately every 20th sample. Analytically all samples were to be ICP-ES after fire assay and those samples reporting > 10 g/t were then required to be gravimetrically finished.
Figure 12-5 displays the comparison of the 1,839 gold check assays from HBMS and Acme laboratories. Results appear good based on a calculated R2 value of 0.9721. However of the 1,839 check assays, 73.6% of the assays reported from Acme were slightly lower in value in comparison to Hudbay regardless of the grade class. A detailed analysis of the results is seen in Table 12-3.
FIGURE 12-5 COMPARISON OF HUDBAY ASSAY AND ACME ASSAY FROM GOLD RECHECK PROGRAM

TABLE 12-3 COMPARISON HUDBAY ASSAY AND ACME CHECK ASSAY FOR GOLD
Gold Range (g/t) |
| Samples Reporting |
| R2 Value |
| Gold Value |
|
< 5 |
| 70.9% |
| 0.8196 |
| 0.9281 : 1.0000 |
|
5 to 10 |
| 81.0% |
| 0.5226 |
| 0.8928 : 1.0000 |
|
10 to 30 |
| 86.8% |
| 0.6780 |
| 0.8361 : 1.0000 |
|
> 30 |
| 88.9% |
| 0.9173 |
| 0.8960 : 1.0000 |
|
All |
| 73.6% |
| 0.9721 |
| 0.8881 : 1.0000 |
|
Based on the results from the comparison, the Hudbay gold assays within the acQuire database were prioritized and adjusted as follows for the calculation of mineral resources:
Priority 1 |
| Acme gold assay results |
Priority 2 |
| Hudbay gold assay results adjusted as follows |
|
| Assay values < 10 g/t downgraded 10% |
|
| Assay values 10 to 30 g/t downgraded 16% |
|
| Assay values > 30 g/t downgraded 10% |
The QAQC program is ongoing and is being monitored closely.
12.6 Site Visit
Robert Carter, P.Eng., Manager of Project Evaluation, Hudbay, last visited the property on June 7, 2011 and numerous times prior to this date. The personal site inspections were part of the mineral resource estimation and technical report process to become familiar with conditions on the Property, to observe the geology and mineralization and verify the work completed on the Property.
12.7 Core Review
Robert Carter, P.Eng., reviewed the geological data and verified drill core mineralization during site visits.
12.8 Drilling Database
Drill hole data (header, geological intervals, sample intervals, and submitted QAQC samples) are logged by the geologists into the local Lagger database for the project. Drill hole validation is performed within Lagger to check for validity of reported lengths, geology intervals, and sample intervals such that there are no overlapping intervals, duplicate sample numbers, etc. Specific gravity (SG) measurements and geotechnical details are stored within Excel spreadsheets. Once the drill hole data has been reviewed by the on-site project geologist the Lagger and SG files are emailed to the Hudbay Lagger database manager.
On receipt of the Lagger log, the Hudbay database manager also checks for inconsistencies with the data. Drill hole locations and other header data are double checked against the records (grid maps, UTM maps, and daily drill reports). On receipt of the analytical request, the sheet is reviewed by the database manager to ensure it is uniquely identified and properly completed. The QC sheet is also examined to ensure the sheet and the Lagger log are in agreement (project number, number of samples, spelling of sample numbers, misspelled duplicates, mistaken duplicates). Any discrepancies are brought to the attention of the project geologist or the core technician. Once the Hudbay project manager is satisfied with the drill hole input data, the Lagger database project files are stored on the Hudbay network and then uploaded to the acQuire database management system monitored by the Hudbay Mines Technical Services (MTS) department. All information is stored and linked directly to the original logging input sheets from Lagger kept in PDF format.
On receipt of the printed daily report from the Hudbay laboratory, the analytical results for assay intervals are uploaded directly into the acQuire database system using the sample number as the identifier. QC results are examined and any discrepancies are flagged and reported either back to the laboratory or to the Hudbay database manager. The Hudbay database manager also compares the analytical results to the logged visual estimates for copper, zinc and iron. Discrepancies are brought to the attention of the project geologist and re-assaying may be requested if the significance of the interval is warranted.
Assay results from the external Acme laboratory are kept in the acQuire database as unique identified variables. This information is readily available and can be easily charted directly from the database system.
Drill core is stored at the Hudbay Hangar site near Flin Flon and at the core logging facility near the Snow Lake concentrator. Fine pulp rejects are kept in perpetuity in lidded plastic pails at the Hudbay Hangar.
12.9 Mineral Resource Database Management
All information used in the estimation of the mineral resources was extracted directly from the Hudbay acQuire database management system managed by the MTS department. The MineSight software package used for the 3D modeling and grade interpolation downloads information directly from this database.
In the author’s opinion, the drill hole and assay database is acceptable for resource estimation.
13.0 MINERAL PROCESSING AND METALLURGICAL TESTING
13.1 Metallurgical Testing
The following reports were used in the preparation of this summary:
1. | A Report on the Recovery of Copper, Zinc, Gold and Silver from Lalor Samples |
| SGS Vancouver Metallurgy |
| July 20, 2009 |
|
|
2. | An Investigation into the Recovery of Copper, Lead, Zinc, and Gold from Lalor Samples — Phase II |
| SGS Vancouver Metallurgy |
| February 25, 2011 |
|
|
3. | An Investigation Into Extraction of Gold and Silver From Flotation Tailings of Lalor |
| Polymetallic Ore Sample |
| SGS Vancouver Metallurgy |
| August 25, 2011 |
|
|
4. | The Optimization of Lalor Flotation Conditions — Phase III |
| SGS Vancouver Metallurgy |
| October 25, 2011 |
|
|
5. | Lalor Project |
| Mill Specifications for 5,400tpd Design |
| S73 SAG Design Comminution Analysis Rev 3 |
| Starkey & Associates |
| November 4, 2011 |
The primary objectives of the test program were to develop an appropriate flowsheet for either the design of a new concentrator or modifications to the existing Snow Lake concentrator, and to determine expected concentrate grades and metal recoveries.
In October 2008, 637 samples from nine drill holes with a total weight of 1,616kg were received at SGS Vancouver Metallurgy. These samples were used to prepare nine composites representing the following ore types:
Ore Type A: | Near solid sulphide (NSS) to solid sulphide (SS) with elevated Au, Cu, and Zn |
Ore Type B: | NSS to SS with minimal Au and Cu and elevated Zn |
Ore Type 20C: | Mineralized with elevated Au, Cu, Zn (Zone 20) |
Ore Type 40C: | Mineralized with elevated Au, Cu, Zn (Zone 40) |
Ore Type D: | Mineralized with minimal Au, Cu, and elevated Zn |
Ore Type E: | Stringer with minimal Au, Cu, Zn |
Contact Gangue: | Stringer sulphides and waste on contact with ore |
Zone 10 Contact Au: | Elevated Au on contact with Zone 10 |
Zone 20 Contact Au: | Elevated Au on contact with Zone 20 |
The composites were crushed and assayed in duplicate to determine the head grades shown in Table 13-1.
TABLE 13-1 METALLURGICAL SAMPLE HEAD GRADES
Composite ID |
| Au, g/t |
| Ag, g/t |
| Cu, % |
| Pb, % |
| Zn, % |
| Fe, % |
|
Type A |
| 5.71 |
| 47.20 |
| 2.41 |
| 0.17 |
| 11.50 |
| 24.30 |
|
Duplicate |
| 5.37 |
| 45.90 |
| 2.40 |
| 0.19 |
| 11.60 |
| 23.50 |
|
Type B |
| 0.34 |
| 10.30 |
| 0.21 |
| 0.54 |
| 11.90 |
| 30.50 |
|
Duplicate |
| 0.37 |
| 9.30 |
| 0.22 |
| 0.43 |
| 11.70 |
| 31.20 |
|
Type 20C |
| 2.17 |
| 16.60 |
| 1.43 |
| 0.06 |
| 4.30 |
| 9.98 |
|
Duplicate |
| 2.06 |
| 15.70 |
| 1.52 |
| 0.06 |
| 4.46 |
| 10.50 |
|
Type 40C |
| 2.48 |
| 53.20 |
| 0.99 |
| 1.92 |
| 9.59 |
| 16.30 |
|
Duplicate |
| 2.62 |
| 54.40 |
| 0.95 |
| 1.85 |
| 9.67 |
| 16.60 |
|
Type D |
| 0.99 |
| 42.30 |
| 0.20 |
| 1.58 |
| 4.91 |
| 16.50 |
|
Duplicate |
| 1.13 |
| 42.40 |
| 0.21 |
| 1.59 |
| 5.14 |
| 17.00 |
|
Type E |
| 0.73 |
| 14.40 |
| 0.45 |
| 0.15 |
| 2.91 |
| 14.80 |
|
Duplicate |
| 0.76 |
| 14.50 |
| 0.43 |
| 0.15 |
| 2.76 |
| 14.00 |
|
Contact Gangue |
| 2.63 |
| 32.80 |
| 0.62 |
| 0.64 |
| 1.04 |
| 12.70 |
|
Duplicate |
| 3.02 |
| 33.20 |
| 0.58 |
| 0.62 |
| 1.04 |
| 12.40 |
|
Zone 10 Au |
| 5.57 |
| 59.40 |
| 0.98 |
| 0.18 |
| 0.50 |
| 11.60 |
|
Duplicate |
| 4.81 |
| 57.40 |
| 0.94 |
| 0.17 |
| 0.52 |
| 11.80 |
|
Zone 20 Au |
| 4.95 |
| 26.20 |
| 0.36 |
| 0.29 |
| 1.20 |
| 6.55 |
|
Duplicate |
| 4.47 |
| 26.60 |
| 0.32 |
| 0.30 |
| 1.16 |
| 6.19 |
|
The above composites were used to prepare 8 blended test charges as follows:
Charge 1: | Type A + gangue |
Charge 2: | Type B + E + Gangue |
Charge 3: | Type A + B |
Charge 4: | Type A+B+C+D+E |
Charges 5-8: | Prepared by including contact Au with charges 1 - 4 |
The focus of the first phase of testwork was on mineralogical analysis, hardness, gravity concentration and scoping flotation testwork.
Mineralogical analysis showed that the chalcopyrite in Lalor ore is mostly coarse grained and liberated at grind sizes of approximately 100 microns. However, 15 to 20% of the chalcopyrite remains locked, primarily with sphalerite, at sizes below 20 microns. Copper is present almost exclusively as chalcopyrite with minor bornite. Zinc is present mainly as sphalerite, with minor amounts of gahnite. The sphalerite is coarse grained and liberated at a grind size of 250 microns. Lead is present as fine grained galena and would require a grind size of 70 microns for liberation. However there is insufficient galena in the ore to warrant a primary grind this fine.
Ore hardness was measured with Bond Work Index tests in the first phase of work. The average rod mill work index was 6.8 kwh/t on the base metals ore and 10.6 kwh/t on the contact gold ore. The ball mill work indexes averaged 10.5 kwh/t on the base metals ore and 13.2 kwh/t on the contact gold ore. These values indicate that the base metal ores are relatively soft, and the contact gold ores are of medium hardness.
A gravity concentration test was done on each of the test charges to determine the suitability of gravity concentration for gold recovery. Samples were ground to 100 microns and concentrated with a Knelson Concentrator. Knelson concentrate was then upgraded with a V-Deck laboratory Mozely Mineral Separator.
The best recoveries were obtained from charges 1 and 5 which had the highest gold head grades. Gold recovery on these two charges was 31% and 46%, while recoveries on the other charges ranged from 10% to 24%.
Initial batch rougher flotation tests were done at a fixed grind size of 100 microns to make preliminary selections of reagent addition rates and flotation times. Reagent selections were based on those currently in use at the Flin Flon and Snow Lake concentrators. These tests were followed by a grind evaluation series, single stage cleaner tests, and two stage cleaner tests.
Results of the two stage open circuit cleaner tests are shown in Table 3-2. These tests were done at a primary grind size of approximately 100 microns, and included a regrind on the copper rougher concentrate (to a P80 of approximately 38 microns) to address the previously identified issue of fine chalcopyrite locking with sphalerite. A similar regrind was
also done on the zinc rougher concentrate at this stage of the testwork, but was later discontinued.
TABLE 13-2 RESULTS OF TWO-STAGE CLEANER TESTING
Cu Cleaner Concentrate
Charge |
| Test |
| Mass |
| Assays, % or g/t |
| % Distribution |
| ||||||||||||||||||||||||
No. |
| No. |
| % |
| Cu |
| Zn |
| Pb |
| Au |
| Ag |
| Fe |
| S |
| Cu |
| Zn |
| Pb |
| Au |
| Ag |
| Fe |
| S |
|
1 |
| LL1-13 |
| 7.66 |
| 24.68 |
| 6.22 |
| 2.91 |
| 56.2 |
| 521 |
| 28.6 |
| 31.3 |
| 88.4 |
| 4.9 |
| 89.3 |
| 74.2 |
| 73.7 |
| 9.7 |
| 9.5 |
|
2 |
| LL2-9 |
| 2.69 |
| 9.59 |
| 6.55 |
| 14.29 |
| 16.5 |
| 365 |
| 23.0 |
| 26.6 |
| 79.7 |
| 1.9 |
| 85.6 |
| 54.1 |
| 67.2 |
| 2.2 |
| 2.4 |
|
3 |
| LL3-9 |
| 4.62 |
| 14.88 |
| 6.45 |
| 8.17 |
| 26.0 |
| 373 |
| 28.1 |
| 30.4 |
| 87.3 |
| 3.8 |
| 89.9 |
| 65.9 |
| 72.8 |
| 5.5 |
| 5.7 |
|
4 |
| LL4-9 |
| 3.85 |
| 15.79 |
| 5.12 |
| 13.80 |
| 37.8 |
| 568 |
| 23.1 |
| 27.2 |
| 86.0 |
| 2.8 |
| 89.5 |
| 70.0 |
| 76.6 |
| 4.1 |
| 4.6 |
|
5 |
| LL5-9 |
| 5.68 |
| 25.69 |
| 3.62 |
| 3.84 |
| 69.4 |
| 632 |
| 25.9 |
| 27.5 |
| 82.1 |
| 2.8 |
| 88.8 |
| 70.5 |
| 70.7 |
| 7.8 |
| 7.8 |
|
6 |
| LL6-9 |
| 3.18 |
| 10.52 |
| 4.84 |
| 10.49 |
| 36.6 |
| 461 |
| 20.3 |
| 21.4 |
| 82.0 |
| 2.2 |
| 83.8 |
| 63.4 |
| 69.5 |
| 2.7 |
| 2.9 |
|
7 |
| LL7-9 |
| 3.55 |
| 16.94 |
| 4.07 |
| 8.92 |
| 53.2 |
| 580 |
| 22.4 |
| 24.8 |
| 83.2 |
| 2.5 |
| 87.4 |
| 63.7 |
| 72.2 |
| 3.9 |
| 4.4 |
|
8 |
| LL8-9 |
| 3.98 |
| 15.73 |
| 4.33 |
| 11.66 |
| 52.0 |
| 607 |
| 21.6 |
| 23.8 |
| 85.5 |
| 3.1 |
| 86.7 |
| 68.8 |
| 74.5 |
| 4.6 |
| 5.1 |
|
Zn Cleaner Concentrate
Charge |
| Test |
| Mass |
| Assays, % or g/t |
| % Distribution |
| ||||||||||||||||||||||||
No. |
| No. |
| % |
| Cu |
| Zn |
| Pb |
| Au |
| Ag |
| Fe |
| S |
| Cu |
| Zn |
| Pb |
| Au |
| Ag |
| Fe |
| S |
|
1 |
| LL1-13 |
| 15.18 |
| 0.43 |
| 55.10 |
| 0.02 |
| 1.2 |
| 28 |
| 11.9 |
| 34.7 |
| 3.1 |
| 86.4 |
| 1.2 |
| 3.1 |
| 7.9 |
| 8.0 |
| 20.8 |
|
2 |
| LL2-9 |
| 12.98 |
| 0.15 |
| 62.52 |
| 0.03 |
| 0.2 |
| 8 |
| 8.6 |
| 33.9 |
| 6.0 |
| 88.2 |
| 0.9 |
| 3.6 |
| 7.2 |
| 3.9 |
| 14.7 |
|
3 |
| LL3-9 |
| 12.03 |
| 0.16 |
| 55.01 |
| 0.02 |
| 0.3 |
| 11 |
| 12.9 |
| 35.0 |
| 2.4 |
| 85.0 |
| 0.6 |
| 2.2 |
| 5.6 |
| 6.6 |
| 17.1 |
|
4 |
| LL4-9 |
| 10.41 |
| 0.18 |
| 58.54 |
| 0.04 |
| 0.4 |
| 12 |
| 8.9 |
| 33.8 |
| 2.7 |
| 87.2 |
| 0.7 |
| 2.0 |
| 4.4 |
| 4.2 |
| 15.6 |
|
5 |
| LL5-9 |
| 11.16 |
| 0.66 |
| 58.25 |
| 0.02 |
| 1.4 |
| 30 |
| 10.9 |
| 33.8 |
| 4.2 |
| 87.4 |
| 0.9 |
| 2.8 |
| 6.6 |
| 6.5 |
| 18.9 |
|
6 |
| LL6-9 |
| 10.71 |
| 0.17 |
| 56.64 |
| 0.04 |
| 0.4 |
| 10 |
| 11.6 |
| 34.1 |
| 4.5 |
| 87.1 |
| 1.1 |
| 2.1 |
| 5.1 |
| 5.2 |
| 15.6 |
|
7 |
| LL7-9 |
| 8.66 |
| 0.20 |
| 56.48 |
| 0.02 |
| 0.6 |
| 13 |
| 11.8 |
| 35.2 |
| 2.4 |
| 83.2 |
| 0.5 |
| 1.8 |
| 4.0 |
| 5.0 |
| 15.3 |
|
8 |
| LL8-9 |
| 9.22 |
| 0.25 |
| 53.04 |
| 0.06 |
| 0.8 |
| 12 |
| 13.5 |
| 33.8 |
| 3.2 |
| 87.7 |
| 1.0 |
| 2.3 |
| 3.4 |
| 6.6 |
| 16.6 |
|
High copper recovery and good copper/zinc separation was obtained on all charges. Copper concentrate grades were good on charges 1 and 5, but concentrate grades were relatively low on the other charges due primarily to dilution with lead. Copper/lead separation was not in scope for the first phase of work, but would be the subject of further work. Zinc recoveries and concentrate grades were very good for all charges.
The second phase of work included additional mineralogical analysis, hardness, gravity concentration, batch and locked cycle flotation tests, dewatering tests, and cyanidation of flotation tailings for gold extraction. A master composite, four variability composites, and two gold zone composites (Zones 21 and 25) blended with base metals ore were tested.
The master composite sample was prepared with the samples received for the first phase of work. This composite was used for baseline testwork. Ore types, assays, and zone distribution data for the master composite are summarized in Table 13-3.
TABLE 13-3 MAKE-UP OF MASTER COMPOSITE
Sample |
| Weight |
| Assays, %, g/t |
| Zone Distribution, % |
| ||||||||||||||
Name |
| % |
| Au |
| Ag |
| Cu |
| Pb |
| Zn |
| Fe |
| 10 |
| 20 |
| 40 |
|
Type A |
| 2.22 |
| 5.71 |
| 47.2 |
| 2.41 |
| 0.17 |
| 11.50 |
| 24.3 |
|
|
| 100 |
|
|
|
Type B |
| 1.67 |
| 0.34 |
| 10.3 |
| 0.21 |
| 0.54 |
| 11.90 |
| 30.5 |
| 100 |
|
|
|
|
|
Type D |
| 11.04 |
| 0.99 |
| 42.3 |
| 0.20 |
| 1.58 |
| 4.91 |
| 16.5 |
| 100 |
|
|
|
|
|
Type E |
| 0.71 |
| 0.73 |
| 14.4 |
| 0.45 |
| 0.15 |
| 2.91 |
| 14.8 |
| 50 |
| 50 |
|
|
|
Type 20C |
| 1.59 |
| 2.17 |
| 16.6 |
| 1.43 |
| 0.06 |
| 4.30 |
| 10.0 |
|
|
| 100 |
|
|
|
Type 40C |
| 14.42 |
| 2.48 |
| 53.2 |
| 0.99 |
| 1.92 |
| 9.59 |
| 16.3 |
|
|
|
|
| 100 |
|
Contact Gangue |
| 4.21 |
| 2.63 |
| 32.8 |
| 0.62 |
| 0.64 |
| 1.04 |
| 12.7 |
| 40 |
| 40 |
| 20 |
|
Charge #1 |
| 2.98 |
| 4.85 |
| 47.3 |
| 2.01 |
| 0.24 |
| 9.26 |
| 21.0 |
|
|
| 100 |
|
|
|
Charge #2 |
| 11.12 |
| 0.81 |
| 14.0 |
| 0.30 |
| 0.47 |
| 9.13 |
| 25.7 |
| 100 |
|
|
|
|
|
Charge #3 |
| 8.74 |
| 1.66 |
| 23.1 |
| 0.74 |
| 0.44 |
| 7.78 |
| 22.3 |
| 71 |
| 29 |
|
|
|
Charge #4 |
| 10.71 |
| 1.97 |
| 27.0 |
| 0.73 |
| 0.59 |
| 7.08 |
| 19.9 |
| 63 |
| 26 |
| 12 |
|
Charge #5 |
| 9.53 |
| 1.82 |
| 19.9 |
| 0.38 |
| 0.36 |
| 6.92 |
| 21.4 |
| 100 |
|
|
|
|
|
Charge #7 |
| 9.53 |
| 2.51 |
| 28.0 |
| 0.69 |
| 0.40 |
| 5.96 |
| 18.9 |
| 71 |
| 29 |
|
|
|
Charge #8 |
| 9.53 |
| 2.64 |
| 28.5 |
| 0.66 |
| 0.48 |
| 5.47 |
| 17.5 |
| 63 |
| 26 |
| 12 |
|
Head (calc) |
| 100.00 |
| 2.04 |
| 31.0 |
| 0.69 |
| 0.78 |
| 7.13 |
| 19.5 |
| 62 |
| 20 |
| 18 |
|
Head (measured) |
|
|
| 1.96 |
| 30.2 |
| 0.73 |
| 0.79 |
| 7.30 |
| 21.7 |
|
|
|
|
|
|
|
Mineralogical analysis indicated that the gold in Zones 21 and 25 composites was present as native gold with some electrum and tellurides. The gold is quite fine (80% < 20 microns) and largely non-responsive to gravity concentration.
Additional hardness testing included Bond work index testing, abrasion testing, and SAG design tests on base metal and gold zone samples. Test results, including data from the first phase, are summarized in Table 13-4. Samples SAG03 to SAG06 were also submitted to SGS for Sag Power Index (SPI) testing as a means of corroborating the SAG design results. At the time of writing this report, the SPI results had been received but not evaluated.
TABLE 13-4 ORE HARDNESS TESTING SUMMARY
|
|
|
| Starkey |
| Bond Ball Mill |
| Bond Rod Mill |
| Bond |
|
|
| ||||
|
|
|
| SAGDesign |
| Work Index |
| Work Index |
| Abrasion |
|
|
| ||||
Sample |
| Lab |
| kwh/t |
| kwh/t |
| mesh |
| kwh/t |
| mesh |
| Ai |
| Comments |
|
Comp A |
| SGS |
|
|
| 10.16 |
| 100 |
| 6.7 |
| 14 |
|
|
| Comp A + Comp B represent all the base metal ore (13.2 mt, ~ 50% of the resource) |
|
Comp B |
| SGS |
|
|
| 10.81 |
| 100 |
| 6.8 |
| 14 |
|
|
|
| |
Zone 10 Au |
| SGS |
|
|
| 12.98 |
| 100 |
| 10.6 |
| 14 |
|
|
| Now Zone 21 |
|
Zone 20 Au |
| SGS |
|
|
| 13.43 |
| 100 |
| 10.5 |
| 14 |
|
|
| Now Zone 21 |
|
HBM SAG01 |
| Inspectorate |
| 4.25 |
| 14.63 |
| 100 |
| 9.7 |
|
|
|
|
| Approx. same as Comp A + Comp B |
|
HBM SAG02 |
| Inspectorate |
| 4.41 |
| 13.88 |
| 100 |
| 10.1 |
|
|
|
|
| 50% base metals and 50% Zone 25 Au |
|
HBM SAG03 |
| Inspectorate |
| 4.72 |
| 15.05 |
|
|
|
|
|
|
|
|
| Base metals, high Cu, Zone 10 |
|
HBM SAG04 |
| Inspectorate |
| 2.38 |
| 13.13 |
|
|
|
|
|
|
|
|
| Base metals, high Zn, Zone 10 |
|
HBM SAG05 |
| Inspectorate |
| 2.04 |
| 11.66 |
|
|
|
|
|
|
|
|
| Base metals, Zone 20 |
|
HBM SAG06 |
| Inspectorate |
| 6.39 |
| 16.06 |
|
|
|
|
|
|
|
|
| Gold, Zone 21 |
|
Zone 21 Au Comp |
| SGS |
|
|
| 14.70 |
| 100 |
| 10.4 |
| 14 |
|
|
| Represents ~ 3.2 mt |
|
Zone 25 Au Comp |
| SGS |
|
|
| 15.40 |
| 100 |
| 11.3 |
| 14 |
|
|
| Represents ~ 4.0 mt |
|
Gangue |
| SGS |
|
|
| 13.80 |
| 100 |
|
|
|
|
| 0.396 |
| Represents waste within 2 meters of ore |
|
Base Metal Comp |
| SGS |
|
|
|
|
|
|
|
|
|
|
| 0.152 |
| Approx. same as Comp A + Comp B |
|
A total of 44 batch tests and four locked cycle tests were done on the master composite to develop the baseline flowsheet. The batch tests were used to evaluate the effects of grind size, pH, collector type, depressant dosages, flotation times, and recycled water. The process included bulk copper-lead rougher flotation, regrind and cleaning of the bulk rougher concentrate, copper-lead separation, and zinc roughing and cleaning. The flowsheet developed in the batch tests was then tested in four locked cycle tests.
The conditions for the locked cycle tests are shown in Table 13-5 and the results are shown in Table 13-6.
TABLE 13-5 LOCKED CYCLE TEST CONDITIONS - MASTER COMPOSITES
Process |
| Conditions |
| LCT-1 |
| LCT-2 |
| LCT-3 |
| LCT-4 |
Primary Grind |
| P80 Size, microns |
| 71 |
| 80 |
| 80 |
| 80 |
|
| Water |
| Tap Water |
| Tap Water |
| Aged Recycle |
| Aged Recycle |
|
| pH |
| 8.6 |
| 8.6 |
| 8.6 |
| 8.6 |
|
| NaCN/ZnSO4, g/t |
| 20/60 |
| 20/60 |
| 20/60 |
| 20/60 |
Cu-Pb Bulk Roughing |
| 3418A, g/t |
| 40 |
| 40 |
| 40 |
| 40 |
|
| pH |
| 9.5 - 9.7 |
| 9.5 - 9.7 |
| 9.5 - 9.7 |
| 9.5 - 9.7 |
Cu-Pb Bullk Conc Regrind |
| P80 Size, microns |
| 32 |
| 35 |
| 35 |
| 35 |
Cu-Pb Bulk Cleaning |
| 3418A, g/t |
| 15 |
| 15 |
| 15 |
| 15 |
|
| pH |
| 10.2 |
| 10.2 |
| 10.2 |
| 10.2 |
|
| No. of stages |
| 3 |
| 3 |
| 3 |
| 3 |
Cu-Pb Separation |
| NaCN, g/t |
| 400 |
| 400 |
| 400 |
| 400 |
|
| 3418A, g/t |
| 3 |
| 3 |
| 3 |
| 3 |
Pb Cleaning |
| 3418A, g/t |
| 3 |
| 3 |
| 4 |
| 4 |
|
| pH |
| 10.5 |
| 10.5 |
| 10.5 |
| 10.5 |
|
| No. of stages |
| 4 |
| 4 |
| 4 |
| 4 |
Zn Roughing |
| CuSO4, g/tt |
| 300 |
| 300 |
| 300 |
| 300 |
|
| Xanthate (SIPX), g/t |
| 35 |
| 35 |
| 17 |
| 17 |
|
| pH |
| 11.5 |
| 11.5 |
| 11.5 |
| 11.5 |
Zn Cleaning and 1st Cleaner |
| Xanthate (SIPX), g/t |
| 4 |
| 4 |
| 0 |
| 0 |
Scavenging |
| pH |
| 11.5 |
| 11.5 |
| 11.5 |
| 11.5 |
|
| No. of stages |
| 3 |
| 3 |
| 3 |
| 3 |
TABLE 13-6 LOCKED CYCLE TEST RESULTS — MASTER COMPOSITES
|
|
|
| Assays, % or g/t |
| Distribution, % |
| ||||||||||||
Product |
|
|
| LCT-1 |
| LCT-2 |
| LCT-3 |
| LCT-4 |
| LCT-1 |
| LCT-2 |
| LCT-3 |
| LCT-4 |
|
|
|
|
|
|
|
|
|
|
|
|
|
|
|
|
|
|
|
|
|
Feed |
| Wt |
|
|
|
|
|
|
|
|
| 100 |
| 100 |
| 100 |
| 100 |
|
|
| Cu |
| 0.88 |
| 0.74 |
| 0.73 |
| 0.73 |
| 100 |
| 100 |
| 100 |
| 100 |
|
|
| Pb |
| 0.73 |
| 0.79 |
| 0.69 |
| 0.73 |
| 100 |
| 100 |
| 100 |
| 100 |
|
|
| Zn |
| 7.23 |
| 7.24 |
| 6.80 |
| 7.58 |
| 100 |
| 100 |
| 100 |
| 100 |
|
|
| Au |
| 1.66 |
| 1.83 |
| 1.90 |
| 1.80 |
| 100 |
| 100 |
| 100 |
| 100 |
|
|
| Ag |
| 27.4 |
| 27.9 |
| 31.3 |
| 28.6 |
| 100 |
| 100 |
| 100 |
| 100 |
|
|
|
|
|
|
|
|
|
|
|
|
|
|
|
|
|
|
|
|
|
Lead Concentrate |
| Wt |
|
|
|
|
|
|
|
|
| 1.31 |
| 1.41 |
| 1.40 |
| 1.29 |
|
|
| Cu |
| 1.17 |
| 1.24 |
| 2.12 |
| 0.76 |
| 2.23 |
| 2.37 |
| 4.09 |
| 1.34 |
|
|
| Pb |
| 47.86 |
| 47.48 |
| 43.49 |
| 49.75 |
| 85.33 |
| 88.05 |
| 87.90 |
| 88.32 |
|
|
| Zn |
| 1.04 |
| 1.09 |
| 1.13 |
| 1.12 |
| 0.19 |
| 0.21 |
| 0.23 |
| 0.19 |
|
|
| Au |
| 9.06 |
| 8.91 |
| 6.73 |
| 5.90 |
| 7.14 |
| 6.85 |
| 4.97 |
| 4.23 |
|
|
| Ag |
| 442.0 |
| 432.0 |
| 428.0 |
| 460.0 |
| 21.1 |
| 21.8 |
| 19.1 |
| 20.8 |
|
|
|
|
|
|
|
|
|
|
|
|
|
|
|
|
|
|
|
|
|
Copper Concentrate |
| Wt |
|
|
|
|
|
|
|
|
| 2.16 |
| 2.30 |
| 1.99 |
| 2.24 |
|
|
| Cu |
| 27.70 |
| 28.16 |
| 29.29 |
| 29.00 |
| 87.76 |
| 87.64 |
| 80.44 |
| 88.55 |
|
|
| Pb |
| 1.76 |
| 1.48 |
| 1.21 |
| 1.51 |
| 5.21 |
| 4.48 |
| 3.48 |
| 4.67 |
|
|
| Zn |
| 4.57 |
| 5.24 |
| 3.97 |
| 4.97 |
| 1.36 |
| 1.67 |
| 1.16 |
| 1.47 |
|
|
| Au |
| 40.71 |
| 46.65 |
| 60.09 |
| 50.12 |
| 53.14 |
| 58.57 |
| 63.13 |
| 62.45 |
|
|
| Ag |
| 625.0 |
| 636.0 |
| 748.0 |
| 717.0 |
| 49.4 |
| 52.4 |
| 47.6 |
| 56.2 |
|
|
|
|
|
|
|
|
|
|
|
|
|
|
|
|
|
|
|
|
|
Bulk Concentrate |
| Wt |
|
|
|
|
|
|
|
|
| 3.47 |
| 3.71 |
| 3.39 |
| 3.53 |
|
|
| Cu |
| 17.71 |
| 17.94 |
| 18.08 |
| 18.68 |
| 89.99 |
| 90.01 |
| 84.53 |
| 89.89 |
|
|
| Pb |
| 19.12 |
| 18.95 |
| 18.65 |
| 19.13 |
| 90.54 |
| 92.53 |
| 91.38 |
| 92.99 |
|
|
| Zn |
| 3.24 |
| 3.66 |
| 2.80 |
| 3.56 |
| 1.55 |
| 1.88 |
| 1.39 |
| 1.66 |
|
|
| Au |
| 28.79 |
| 32.32 |
| 38.08 |
| 33.97 |
| 60.28 |
| 65.42 |
| 68.10 |
| 66.68 |
|
|
| Ag |
| 556.1 |
| 558.5 |
| 616.0 |
| 623.1 |
| 70.4 |
| 74.2 |
| 66.7 |
| 76.9 |
|
|
|
|
|
|
|
|
|
|
|
|
|
|
|
|
|
|
|
|
|
Zinc Concentrate |
| Wt |
|
|
|
|
|
|
|
|
| 12.13 |
| 12.77 |
| 13.20 |
| 12.01 |
|
|
| Cu |
| 0.35 |
| 0.33 |
| 0.54 |
| 0.32 |
| 6.28 |
| 5.76 |
| 9.82 |
| 5.25 |
|
|
| Pb |
| 0.19 |
| 0.15 |
| 0.14 |
| 0.11 |
| 3.09 |
| 2.47 |
| 2.73 |
| 1.77 |
|
|
| Zn |
| 55.05 |
| 54.42 |
| 49.48 |
| 60.40 |
| 92.33 |
| 95.97 |
| 96.03 |
| 95.76 |
|
|
| Au |
| 0.96 |
| 0.99 |
| 1.24 |
| 0.72 |
| 7.06 |
| 6.91 |
| 8.63 |
| 4.84 |
|
|
| Ag |
| 22.6 |
| 18.7 |
| 25.8 |
| 22.9 |
| 10.0 |
| 8.6 |
| 10.9 |
| 9.6 |
|
|
|
|
|
|
|
|
|
|
|
|
|
|
|
|
|
|
|
|
|
Zinc Cleaner |
| Wt |
|
|
|
|
|
|
|
|
| 2.71 |
| 2.74 |
| 2.11 |
| 2.33 |
|
Scavenger Tails |
| Cu |
| 0.34 |
| 0.26 |
| 0.40 |
| 0.35 |
| 1.33 |
| 0.96 |
| 1.16 |
| 1.12 |
|
|
| Pb |
| 0.32 |
| 0.21 |
| 0.26 |
| 0.22 |
| 1.17 |
| 0.76 |
| 0.79 |
| 0.72 |
|
|
| Zn |
| 2.56 |
| 1.57 |
| 2.25 |
| 2.51 |
| 0.96 |
| 0.59 |
| 0.70 |
| 0.77 |
|
|
| Au |
| 2.47 |
| 2.20 |
| 2.29 |
| 2.47 |
| 4.04 |
| 3.29 |
| 2.56 |
| 3.20 |
|
|
| Ag |
| 23.7 |
| 22.2 |
| 31.8 |
| 30.9 |
| 2.3 |
| 2.2 |
| 2.2 |
| 2.5 |
|
|
|
|
|
|
|
|
|
|
|
|
|
|
|
|
|
|
|
|
|
Zinc Rougher Tails |
| Wt |
|
|
|
|
|
|
|
|
| 81.69 |
| 80.77 |
| 83.65 |
| 82.13 |
|
|
| Cu |
| 0.02 |
| 0.03 |
| 0.04 |
| 0.03 |
| 2.39 |
| 3.28 |
| 4.48 |
| 3.73 |
|
|
| Pb |
| 0.05 |
| 0.04 |
| 0.04 |
| 0.04 |
| 5.20 |
| 4.25 |
| 5.09 |
| 4.52 |
|
|
| Zn |
| 0.46 |
| 0.14 |
| 0.16 |
| 0.17 |
| 5.16 |
| 1.56 |
| 1.87 |
| 1.81 |
|
|
| Au |
| 0.58 |
| 0.55 |
| 0.48 |
| 0.55 |
| 28.62 |
| 24.38 |
| 20.72 |
| 25.28 |
|
|
| Ag |
| 5.80 |
| 5.20 |
| 7.80 |
| 3.80 |
| 17.20 |
| 15.05 |
| 20.22 |
| 10.92 |
|
All four locked cycle tests were stable and good recoveries were obtained.
The flow sheet developed in baseline testing was then tested on variability composites. These composites were prepared as shown in Table 13-7.
TABLE 13-7 MAKE-UP OF VARIABILITY COMPOSITES
|
| Variability Comp 1 |
| Variability Comp 2 |
| Variability Comp 3 |
| Variability Comp 4 |
|
|
| High grade Zn |
| High grade Zn |
| Low grade Zn |
| Low grade Zn |
|
|
| High grade Cu |
| Low grade Cu |
| High grade Cu |
| Low grade Cu |
|
|
| High grade Au |
| Low grade Au |
| High grade Au |
| Low grade Au |
|
Percent by Zone |
|
|
|
|
|
|
|
|
|
Zone 10 |
| 35 |
| 75 |
| 40 |
| 34 |
|
Zone 20 |
| 65 |
| 25 |
| 60 |
| 66 |
|
Head Assays, g/t, % |
|
|
|
|
|
|
|
|
|
Au |
| 2.98 |
| 0.29 |
| 4.29 |
| 1.14 |
|
Ag |
| 21.10 |
| 12.30 |
| 21.30 | �� | 16.70 |
|
Cu |
| 0.95 |
| 0.22 |
| 0.96 |
| 0.42 |
|
Zn |
| 11.00 |
| 10.30 |
| 5.23 |
| 4.42 |
|
Pb |
| 0.23 |
| 0.23 |
| 0.21 |
| 0.26 |
|
Fe |
| 22.90 |
| 23.20 |
| 17.10 |
| 16.30 |
|
S |
| 24.60 |
| 22.80 |
| 16.60 |
| 14.70 |
|
Three batch tests were done on each composite, including one test each with gravity concentration. The optimum conditions from the batch tests were used for the locked cycle tests. The gravity concentration step did not improve recovery and was discontinued.
The conditions for the locked cycle tests on the variability composites are shown in Table 13-8, and the results are shown in Table 13-9.
TABLE 13-8 LOCKED CYCLE TEST CONDITIONS — VARIABILITY COMPOSITES
Process |
| Conditions |
| Vari-1 |
| Vari-2 |
| Vari-3 |
| Vari-4 |
|
Primary Grind |
| P80 Size, microns |
| 79 |
| 80 |
| 82 |
| 80 |
|
|
| Water |
| Tap Water |
| Tap Water |
| Tap Water |
| Tap Water |
|
|
| pH |
| 8.6 |
| 8.6 |
| 8.6 |
| 8.6 |
|
|
| NaCN/ZnSO4, g/t |
| 20/60 |
| 20/60 |
| 20/60 |
| 20/60 |
|
Cu-Pb Bulk Roughing |
| 3418A, g/t |
| 40 |
| 40 |
| 40 |
| 40 |
|
|
| pH |
| 9.5 - 9.6 |
| 9.5 - 9.6 |
| 9.5 - 9.6 |
| 9.5 - 9.6 |
|
Cu-Pb Bullk Conc Regrind |
| P80 Size, microns |
| 30 |
| 30 |
| 30 |
| 30 |
|
Cu-Pb Bulk Cleaning |
| 3418A, g/t |
| 15 |
| 15 |
| 15 |
| 15 |
|
|
| pH |
| 10.5 |
| 10.5 |
| 10.5 |
| 10.5 |
|
|
| No. of stages |
| 3 |
| 3 |
| 3 |
| 3 |
|
Cu-Pb Separation |
| NaCN, g/t |
| 300 |
| 400 |
| 400 |
| 400 |
|
|
| 3418A, g/t |
| 4 |
| 4 |
| 4 |
| 4 |
|
Pb Cleaning |
| 3418A, g/t |
| 4.5 |
| 4.5 |
| 4.5 |
| 4.5 |
|
|
| pH |
| 10.5 |
| 10.5 |
| 10.5 |
| 10.5 |
|
|
| No. of stages |
| 4 |
| 4 |
| 4 |
| 4 |
|
Zn Roughing |
| CuSO4, g/tt |
| 550 |
| 500 |
| 210 |
| 180 |
|
|
| Xanthate (SIPX), g/t |
| 55 |
| 50 |
| 30 |
| 25 |
|
|
| pH |
| 11.5 |
| 11.5 |
| 11.5 |
| 11.5 |
|
Zn Cleaning and 1st Cleaner |
| Xanthate (SIPX), g/t |
| 6 |
| 2 |
| 2 |
| 3 |
|
Scavenging |
| pH |
| 11.5 |
| 11.5 |
| 11.5 |
| 11.5 |
|
|
| No. of stages |
| 3 |
| 3 |
| 3 |
| 3 |
|
TABLE 13-9 LOCKED CYCLE TEST RESULTS — VARIABILITY COMPOSITES
|
|
|
| Assays, % or g/t |
| Distribution, % |
| ||||||||||||
Product |
|
|
| Vari-1 |
| Vari-2 |
| Vari-3 |
| Vari-4 |
| Vari-1 |
| Vari-2 |
| Vari-3 |
| Vari-4 |
|
Feed |
| Wt |
|
|
|
|
|
|
|
|
| 100 |
| 100 |
| 100 |
| 100 |
|
|
| Cu |
| 0.95 |
| 0.25 |
| 0.90 |
| 0.44 |
| 100 |
| 100 |
| 100 |
| 100 |
|
|
| Pb |
| 0.22 |
| 0.23 |
| 0.19 |
| 0.27 |
| 100 |
| 100 |
| 100 |
| 100 |
|
|
| Zn |
| 10.76 |
| 10.30 |
| 5.27 |
| 4.17 |
| 100 |
| 100 |
| 100 |
| 100 |
|
|
| Au |
| 2.87 |
| 0.20 |
| 3.40 |
| 0.93 |
| 100 |
| 100 |
| 100 |
| 100 |
|
|
| Ag |
| 22.1 |
| 11.3 |
| 22.6 |
| 15.7 |
| 100 |
| 100 |
| 100 |
| 100 |
|
Lead Concentrate |
| Wt |
|
|
|
|
|
|
|
|
| 1.27 |
| 1.00 |
| 1.17 |
| 1.51 |
|
|
| Cu |
| 0.71 |
| 0.21 |
| 0.54 |
| 0.36 |
| 0.95 |
| 0.84 |
| 0.71 |
| 1.25 |
|
|
| Pb |
| 14.68 |
| 20.36 |
| 12.86 |
| 15.22 |
| 84.72 |
| 87.07 |
| 76.19 |
| 85.89 |
|
|
| Zn |
| 0.98 |
| 0.68 |
| 0.72 |
| 0.54 |
| 0.12 |
| 0.07 |
| 0.16 |
| 0.20 |
|
|
| Au |
| 24.07 |
| 0.93 |
| 32.75 |
| 2.04 |
| 10.66 |
| 4.56 |
| 11.25 |
| 3.30 |
|
|
| Ag |
| 145.0 |
| 196.0 |
| 154.0 |
| 151.0 |
| 8.4 |
| 17.3 |
| 8.0 |
| 14.6 |
|
Copper Concentrate |
| Wt |
|
|
|
|
|
|
|
|
| 3.06 |
| 0.72 |
| 3.05 |
| 1.38 |
|
|
| Cu |
| 27.40 |
| 24.30 |
| 27.60 |
| 27.20 |
| 88.52 |
| 70.27 |
| 93.32 |
| 86.49 |
|
|
| Pb |
| 0.44 |
| 1.24 |
| 0.66 |
| 1.01 |
| 6.09 |
| 3.81 |
| 10.46 |
| 5.21 |
|
|
| Zn |
| 6.52 |
| 7.71 |
| 3.32 |
| 3.64 |
| 1.85 |
| 0.54 |
| 1.92 |
| 1.21 |
|
|
| Au |
| 58.74 |
| 12.43 |
| 62.60 |
| 36.79 |
| 62.66 |
| 43.66 |
| 56.04 |
| 54.60 |
|
|
| Ag |
| 409.0 |
| 447.0 |
| 434.0 |
| 567.0 |
| 56.7 |
| 28.4 |
| 58.6 |
| 50.1 |
|
Bulk Concentrate |
| Wt |
|
|
|
|
|
|
|
|
| 4.33 |
| 1.72 |
| 4.21 |
| 2.89 |
|
|
| Cu |
| 19.57 |
| 10.28 |
| 20.10 |
| 13.20 |
| 89.47 |
| 71.11 |
| 94.03 |
| 87.74 |
|
|
| Pb |
| 4.62 |
| 12.37 |
| 4.04 |
| 8.42 |
| 90.81 |
| 90.88 |
| 86.65 |
| 91.10 |
|
|
| Zn |
| 4.89 |
| 3.62 |
| 2.60 |
| 2.02 |
| 1.97 |
| 0.61 |
| 2.08 |
| 1.41 |
|
|
| Au |
| 48.57 |
| 5.74 |
| 54.32 |
| 18.66 |
| 73.32 |
| 48.22 |
| 67.29 |
| 57.90 |
|
|
| Ag |
| 331.6 |
| 300.9 |
| 356.4 |
| 349.9 |
| 65.0 |
| 45.7 |
| 66.6 |
| 64.7 |
|
Zinc Concentrate |
| Wt |
|
|
|
|
|
|
|
|
| 16.17 |
| 15.75 |
| 7.92 |
| 6.71 |
|
|
| Cu |
| 0.22 |
| 0.19 |
| 0.26 |
| 0.27 |
| 3.70 |
| 12.25 |
| 2.29 |
| 4.16 |
|
|
| Pb |
| 0.02 |
| 0.02 |
| 0.03 |
| 0.04 |
| 1.22 |
| 1.35 |
| 1.14 |
| 1.09 |
|
|
| Zn |
| 60.55 |
| 60.97 |
| 57.42 |
| 57.95 |
| 90.99 |
| 92.36 |
| 86.38 |
| 93.24 |
|
|
| Au |
| 0.23 |
| 0.06 |
| 0.78 |
| 0.32 |
| 1.28 |
| 4.36 |
| 1.82 |
| 2.30 |
|
|
| Ag |
| 13.5 |
| 15.5 |
| 17.9 |
| 16.3 |
| 9.9 |
| 21.6 |
| 6.3 |
| 7.0 |
|
Zinc Cleaner |
| Wt |
|
|
|
|
|
|
|
|
| 5.46 |
| 11.25 |
| 4.22 |
| 3.53 |
|
Scavenger Tails |
| Cu |
| 0.15 |
| 0.36 |
| 0.34 |
| 0.45 |
| 2.13 |
| 6.60 |
| 1.67 |
| 2.78 |
|
|
| Pb |
| 0.04 |
| 0.08 |
| 0.10 |
| 0.17 |
| 1.24 |
| 1.68 |
| 1.65 |
| 1.32 |
|
|
| Zn |
| 3.23 |
| 4.16 |
| 3.45 |
| 3.26 |
| 3.14 |
| 3.53 |
| 3.33 |
| 2.92 |
|
|
| Au |
| 0.15 |
| 3.70 |
| 1.41 |
| 5.31 |
| 2.85 |
| 8.02 |
| 4.59 |
| 5.34 |
|
|
| Ag |
| 7.5 |
| 26.2 |
| 22.3 |
| 28.4 |
| 4.2 |
| 7.4 |
| 4.9 |
| 5.0 |
|
Zinc Rougher Tails |
| Wt |
|
|
|
|
|
|
|
|
| 74.05 |
| 71.28 |
| 83.65 |
| 86.86 |
|
|
| Cu |
| 0.08 |
| 0.03 |
| 0.02 |
| 0.03 |
| 4.69 |
| 10.03 |
| 2.02 |
| 5.32 |
|
|
| Pb |
| 0.02 |
| 0.02 |
| 0.02 |
| 0.02 |
| 6.73 |
| 6.09 |
| 8.56 |
| 6.49 |
|
|
| Zn |
| 0.57 |
| 0.38 |
| 0.52 |
| 0.12 |
| 3.90 |
| 2.61 |
| 8.21 |
| 2.43 |
|
|
| Au |
| 0.88 |
| 0.11 |
| 1.07 |
| 0.37 |
| 22.75 |
| 39.40 |
| 26.31 |
| 34.46 |
|
|
| Ag |
| 6.20 |
| 4.00 |
| 6.00 |
| 4.20 |
| 20.82 |
| 25.33 |
| 22.24 |
| 23.30 |
|
Copper concentrate grades and recoveries were good on the variability composites. The average zinc concentrate grade and recovery in this series of tests was 59.2% and 90.7% respectively, compared to 54.8% and 95.0% in the first series of locked cycle tests. The results are consistent with the reduced mass pull (from rougher concentrate to final zinc concentrate) in the variability series.
Saleable lead concentrate grades were not produced from any of these tests due to the combined impact of low lead head grades and the presence of coarse, readily floatable talc which diluted the concentrates.
It is expected that ore from the gold zones (Zone 21 and 25) will be mined along with the base metals ore. Accordingly, tests were done on blends of gold ore with the master composite and variability composites.
The flowsheet developed for the master composites and variability composites was tested using Zone 21 ore blended in ratios varying from 25% to 75% of the total. Eighteen batch and three locked cycle tests were done.
Good concentrate grades and recoveries were obtained in all 3 locked cycle tests. Concentrates assayed 28.9% to 29.8% copper, with recoveries ranging from 76.4% to 86.3% according to the ratio of Zone 21 ore in the blend and the resultant copper head grade.
Zinc concentrates assayed from 53.6% to 62% zinc, with recoveries from 89% to 93.3%.
Lead concentrates assayed from 12.1% to 33% lead, with recoveries from 69.5% to 87.4%. The lead concentrates were diluted with coarse floatable gangue material.
The combined gold recoveries into the copper and lead concentrates were 54.8% to 60.3%. The combined silver recoveries were 51.2% to 67.9%.
Batch flotation tests only were done with Zone 25 material due to the limited amount of this sample that was available. Results from the batch tests indicated that zinc concentrate grades and recoveries were acceptable, but that the copper-lead separation became more difficult as the ratio of Zone 25 material in the blend increased.
Tests were done with pre-gravity concentration in the Zone 21 and 25 blend tests, but no improvement in gold recovery was observed.
The master composite was depleted near the end of the second phase of work, and a new master composite was prepared with the composition shown in Table 13-10.
TABLE 13-10 MAKE-UP OF NEW MASTER COMPOSITE
Sample |
| Wt % |
|
Variability Comp 1 |
| 27.7 |
|
Variability Comp 3 |
| 41.5 |
|
Variability Comp 4 |
| 15.7 |
|
Zone 40 Core |
| 8.5 |
|
Zone 25 Gold |
| 6.5 |
|
Total |
| 100 |
|
A total of 33 batch tests and 5 locked cycle tests were done on the new composite to optimize the flowsheet developed in the previous phase and provide data for the design of the new concentrator. The major changes from the previous tests included elimination of cyanide in the bulk flotation stage, reduced cyanide in copper-lead separation, and reduced collector usage in copper roughing and zinc cleaning.
The conditions for the locked cycle tests are shown in Table 13-11 and the results are shown in Table 13-12.
TABLE 13-11 LOCKED CYCLE TEST CONDITIONS — PHASE 3
Process |
| Conditions |
| LL- LCT-1 |
| LL-LCT-2 |
| LL-LCT-3 |
| LL-LCT-4 |
| LL-LCT-5 |
|
Primary Grind |
| P80 Size, microns |
| 80 |
| 80 |
| 80 |
| 80 |
| 85 |
|
|
| Water |
| Tap Water |
| Tap Water |
| Tap Water |
| Tap Water |
| Tap Water |
|
|
| pH |
| 9 |
| 9 |
| 9 |
| 9 |
| 9 |
|
|
| 3418A, g/t |
| 12 |
| 12 |
| 12 |
| 12 |
| 12 |
|
|
| ZnSO4, g/t |
| 60 |
| 60 |
| 60 |
| 60 |
| 60 |
|
|
|
|
|
|
|
|
|
|
|
|
|
|
|
Cu-Pb Bulk Roughing |
| 3418A, g/t |
| 3 |
| 3 |
| 3 |
| 3 |
| 3 |
|
|
| pH |
| 9.5 |
| 9.5 |
| 9.5 |
| 9.5 |
| 9.5 |
|
|
| Residence Time (min) |
| 8 |
| 8 |
| 8 |
| 8 |
| 8 |
|
|
|
|
|
|
|
|
|
|
|
|
|
|
|
Cu-Pb Bullk Conc Regrind |
| P80 Size, microns |
| 32 |
| 32 |
| 32 |
| 32 |
| 32 |
|
|
| ZnSO4, g/t |
| 0 |
| 0 |
| 30 |
| 60 |
| 60 |
|
|
| 3418A, g/t |
| 3 |
| 3 |
| 3 |
| 3 |
| 3 |
|
|
|
|
|
|
|
|
|
|
|
|
|
|
|
Cu-Pb Bulk Cleaning |
| 3418A, g/t |
| 3 |
| 3 |
| 3 |
| 3 |
| 4 |
|
|
| pH |
| 9.5 |
| 9.5 |
| 9.5 |
| 9.5 |
| 9.5 |
|
|
| No. of stages |
| 2 |
| 2 |
| 2 |
| 2 |
| 2 |
|
|
| Residence Time (min) |
| 6 |
| 6 |
| 6 |
| 6 |
| 6 |
|
|
|
|
|
|
|
|
|
|
|
|
|
|
|
Cu-Pb Separation |
| NaCN, g/t |
| 50 |
| 0 |
| 50 |
| 50 |
| 50 |
|
|
| 3418A, g/t |
| 1 |
| 1 |
| 1 |
| 1 |
| 1 |
|
|
| Residence Time (min) |
| 4 |
| 4 |
| 4 |
| 4 |
| 4 |
|
|
|
|
|
|
|
|
|
|
|
|
|
|
|
Pb Cleaning |
| 3418A, g/t |
| 1 |
| 1 |
| 1 |
| 1 |
| 1 |
|
|
| pH |
| 10.5 |
| 10.5 |
| 10.5 |
| 10.5 |
| 10.5 |
|
|
| No. of stages |
| 3 |
| 3 |
| 3 |
| 3 |
| 3 |
|
|
| Residence Time (min) |
| 11 |
| 11 |
| 11 |
| 11 |
| 11 |
|
|
|
|
|
|
|
|
|
|
|
|
|
|
|
Zn Roughing |
| CuSO4, g/tt |
| 300 |
| 300 |
| 300 |
| 300 |
| 300 |
|
|
| Xanthate (SIPX), g/t |
| 35 |
| 35 |
| 35 |
| 35 |
| 35 |
|
|
| pH |
| 11.5 |
| 11.5 |
| 11.5 |
| 11.5 |
| 11.5 |
|
|
| Residence Time (min) |
| 3 |
| 3 |
| 3 |
| 3 |
| 3 |
|
|
|
|
|
|
|
|
|
|
|
|
|
|
|
Zn Cleaning |
| Xanthate (SIPX), g/t |
| 1 |
| 1 |
| 1 |
| 1 |
| 1 |
|
|
| pH |
| 11.5 |
| 11.5 |
| 11.5 |
| 11.5 |
| 11.5 |
|
|
| No. of stages |
| 3 |
| 3 |
| 3 |
| 3 |
| 3 |
|
|
| Residence Time (min) |
| 6 |
| 6 |
| 6 |
| 6 |
| 6 |
|
TABLE 13-12 LOCKED CYCLE TEST RESULTS — PHASE 3
|
|
|
| Assays, % or g/t |
| Distribution, % |
| ||||||||||||||||
Product |
|
|
| LL-LCT-1 |
| LL-LCT-2 |
| LL-LCT-3 |
| LL-LCT-4 |
| LL-LCT-5 |
| LL-LCT-1 |
| LL-LCT-2 |
| LL-LCT-3 |
| LL-LCT-4 |
| LL-LCT-5 |
|
Feed |
| Wt |
|
|
|
|
|
|
|
|
|
|
| 100 |
| 100 |
| 100 |
| 100 |
| 100 |
|
|
| Cu |
| 0.75 |
| 0.78 |
| 0.79 |
| 0.79 |
| 0.82 |
| 100 |
| 100 |
| 100 |
| 100 |
| 100 |
|
|
| Pb |
| 0.31 |
| 0.31 |
| 0.31 |
| 0.28 |
| 0.31 |
| 100 |
| 100 |
| 100 |
| 100 |
| 100 |
|
|
| Zn |
| 6.63 |
| 6.94 |
| 6.42 |
| 6.13 |
| 6.40 |
| 100 |
| 100 |
| 100 |
| 100 |
| 100 |
|
|
| Au |
| 3.71 |
| 3.64 |
| 3.34 |
| 3.67 |
| 3.69 |
| 100 |
| 100 |
| 100 |
| 100 |
| 100 |
|
|
| Ag |
| 23.8 |
| 23.6 |
| 23.5 |
| 23.7 |
| 24.2 |
| 100 |
| 100 |
| 100 |
| 100 |
| 100 |
|
|
|
|
|
|
|
|
|
|
|
|
|
|
|
|
|
|
|
|
|
|
|
|
|
Lead Concentrate |
| Wt |
|
|
|
|
|
|
|
|
|
|
| 1.67 |
| 1.75 |
| 1.69 |
| 1.48 |
| 1.60 |
|
|
| Cu |
| 2.53 |
| 1.80 |
| 2.44 |
| 2.12 |
| 2.17 |
| 5.59 |
| 4.04 |
| 5.23 |
| 3.95 |
| 4.23 |
|
|
| Pb |
| 15.80 |
| 14.75 |
| 15.30 |
| 14.70 |
| 16.10 |
| 85.25 |
| 84.15 |
| 84.04 |
| 77.16 |
| 82.76 |
|
|
| Zn |
| 0.74 |
| 0.78 |
| 0.67 |
| 0.53 |
| 0.67 |
| 0.19 |
| 0.20 |
| 0.18 |
| 0.13 |
| 0.17 |
|
|
| Au |
| 53.50 |
| 38.80 |
| 33.50 |
| 53.30 |
| 56.90 |
| 24.03 |
| 18.68 |
| 16.95 |
| 21.53 |
| 24.76 |
|
|
| Ag |
| 324.0 |
| 262.0 |
| 263.0 |
| 330.0 |
| 326.0 |
| 22.7 |
| 19.5 |
| 19.0 |
| 20.6 |
| 21.6 |
|
|
|
|
|
|
|
|
|
|
|
|
|
|
|
|
|
|
|
|
|
|
|
|
|
Copper Concentrate |
| Wt |
|
|
|
|
|
|
|
|
|
|
| 2.67 |
| 3.29 |
| 2.88 |
| 2.86 |
| 2.82 |
|
|
| Cu |
| 23.90 |
| 20.80 |
| 23.80 |
| 24.60 |
| 25.30 |
| 84.91 |
| 87.80 |
| 86.74 |
| 88.68 |
| 86.45 |
|
|
| Pb |
| 0.19 |
| 0.44 |
| 0.60 |
| 0.97 |
| 0.53 |
| 1.67 |
| 4.76 |
| 5.66 |
| 9.91 |
| 4.81 |
|
|
| Zn |
| 5.60 |
| 6.64 |
| 5.13 |
| 4.29 |
| 4.93 |
| 2.26 |
| 3.16 |
| 2.30 |
| 2.01 |
| 2.17 |
|
|
| Au |
| 64.20 |
| 59.10 |
| 63.40 |
| 62.60 |
| 60.50 |
| 46.17 |
| 53.45 |
| 54.71 |
| 48.96 |
| 46.31 |
|
|
| Ag |
| 408.0 |
| 368.0 |
| 426.0 |
| 404.0 |
| 414.0 |
| 45.9 |
| 51.4 |
| 52.3 |
| 48.8 |
| 48.3 |
|
|
|
|
|
|
|
|
|
|
|
|
|
|
|
|
|
|
|
|
|
|
|
|
|
Bulk Concentrate |
| Wt |
|
|
|
|
|
|
|
|
|
|
| 4.34 |
| 5.05 |
| 4.57 |
| 4.34 |
| 4.43 |
|
|
| Cu |
| 15.69 |
| 14.20 |
| 15.90 |
| 16.94 |
| 16.91 |
| 90.50 |
| 91.84 |
| 91.97 |
| 92.63 |
| 90.68 |
|
|
| Pb |
| 6.19 |
| 5.41 |
| 6.04 |
| 5.65 |
| 6.17 |
| 86.92 |
| 88.91 |
| 89.70 |
| 87.07 |
| 87.57 |
|
|
| Zn |
| 3.73 |
| 4.61 |
| 3.48 |
| 3.01 |
| 3.39 |
| 2.45 |
| 3.36 |
| 2.48 |
| 2.14 |
| 2.34 |
|
|
| Au |
| 60.09 |
| 52.05 |
| 52.34 |
| 59.43 |
| 59.19 |
| 70.20 |
| 72.13 |
| 71.66 |
| 70.49 |
| 71.07 |
|
|
| Ag |
| 375.7 |
| 331.2 |
| 365.7 |
| 378.8 |
| 382.1 |
| 68.6 |
| 70.9 |
| 71.3 |
| 69.4 |
| 70.0 |
|
|
|
|
|
|
|
|
|
|
|
|
|
|
|
|
|
|
|
|
|
|
|
|
|
Zinc Concentrate |
| Wt |
|
|
|
|
|
|
|
|
|
|
| 10.48 |
| 9.82 |
| 10.69 |
| 10.32 |
| 10.63 |
|
|
| Cu |
| 0.24 |
| 0.20 |
| 0.25 |
| 0.22 |
| 0.29 |
| 3.39 |
| 2.48 |
| 3.38 |
| 2.83 |
| 3.69 |
|
|
| Pb |
| 0.09 |
| 0.05 |
| 0.05 |
| 0.07 |
| 0.08 |
| 2.96 |
| 1.50 |
| 1.62 |
| 2.59 |
| 2.63 |
|
|
| Zn |
| 58.00 |
| 63.00 |
| 56.60 |
| 55.60 |
| 56.20 |
| 91.63 |
| 89.09 |
| 94.19 |
| 93.88 |
| 93.42 |
|
|
| Au |
| 0.76 |
| 0.46 |
| 0.71 |
| 1.03 |
| 0.96 |
| 2.14 |
| 1.24 |
| 2.29 |
| 2.91 |
| 2.78 |
|
|
| Ag |
| 17.8 |
| 14.0 |
| 16.8 |
| 21.0 |
| 19.0 |
| 7.9 |
| 5.8 |
| 7.7 |
| 9.1 |
| 8.4 |
|
|
|
|
|
|
|
|
|
|
|
|
|
|
|
|
|
|
|
|
|
|
|
|
|
Zinc Cleaner |
| Wt |
|
|
|
|
|
|
|
|
|
|
| 3.78 |
| 3.70 |
| 3.88 |
| 4.58 |
| 3.67 |
|
Scavenger Tails |
| Cu |
| 0.43 |
| 0.39 |
| 0.32 |
| 0.26 |
| 0.45 |
| 2.16 |
| 1.85 |
| 1.59 |
| 1.48 |
| 2.01 |
|
|
| Pb |
| 0.18 |
| 0.14 |
| 0.13 |
| 0.11 |
| 0.17 |
| 2.21 |
| 1.65 |
| 1.85 |
| 1.73 |
| 1.98 |
|
|
| Zn |
| 5.38 |
| 7.95 |
| 2.67 |
| 2.39 |
| 3.26 |
| 3.07 |
| 4.28 |
| 1.61 |
| 1.79 |
| 1.87 |
|
|
| Au |
| 4.44 |
| 3.58 |
| 3.44 |
| 3.99 |
| 5.31 |
| 4.51 |
| 3.67 |
| 4.00 |
| 4.98 |
| 5.28 |
|
|
| Ag |
| 28.4 |
| 25.0 |
| 22.7 |
| 20.7 |
| 28.4 |
| 4.5 |
| 4.0 |
| 3.8 |
| 4.0 |
| 4.3 |
|
|
|
|
|
|
|
|
|
|
|
|
|
|
|
|
|
|
|
|
|
|
|
|
|
Zinc Rougher Tails |
| Wt |
|
|
|
|
|
|
|
|
|
|
| 81.40 |
| 81.41 |
| 80.85 |
| 80.54 |
| 81.28 |
|
|
| Cu |
| 0.04 |
| 0.04 |
| 0.03 |
| 0.03 |
| 0.04 |
| 3.96 |
| 3.83 |
| 3.07 |
| 3.05 |
| 3.62 |
|
|
| Pb |
| 0.03 |
| 0.03 |
| 0.03 |
| 0.03 |
| 0.03 |
| 7.91 |
| 7.95 |
| 7.02 |
| 8.61 |
| 7.81 |
|
|
| Zn |
| 0.23 |
| 0.26 |
| 0.14 |
| 0.17 |
| 0.19 |
| 2.86 |
| 3.28 |
| 1.72 |
| 2.20 |
| 2.37 |
|
|
| Au |
| 1.06 |
| 1.03 |
| 0.91 |
| 0.98 |
| 0.95 |
| 23.15 |
| 22.96 |
| 22.05 |
| 21.62 |
| 20.87 |
|
|
| Ag |
| 5.57 |
| 5.60 |
| 5.03 |
| 5.13 |
| 5.20 |
| 19.06 |
| 19.31 |
| 17.35 |
| 17.47 |
| 17.36 |
|
Copper concentrate grades and recoveries were good. Lead concentrate grades were again low due to the effects of low lead head grades and the presence of readily floating coarse talc.
The average zinc concentrate grade and recovery in this series was 57.9% and 92.4% respectively. Both of these results lie midway between the results of the previous two series of locked cycle tests, and are again consistent with the mass pull from rougher concentrate to final concentrate.
The concentrates from test LL-LCT-5 were submitted for minor element scans. The results are shown in Table 13-13. The bulk concentrate assays were calculated as weighted averages from the lead and copper concentrates. As expected, the magnesium assay is
high in the bulk and lead concentrates. Further test work will be directed toward gangue rejection in the bulk flotation stage.
TABLE 13-13 MINOR ELEMENT ANALYSES OF CONCENTRATES
|
|
|
| Pb |
| Cu |
| Bulk Cu/Pb |
| Zn |
|
Element |
| Unit |
| Concentrate |
| Concentrate |
| Concentrate* |
| Concentrate |
|
XRF - Pyrosulphate |
|
|
|
|
|
|
|
|
|
|
|
Fusion |
|
|
|
|
|
|
|
|
|
|
|
Cu |
| % |
| 2.17 |
| 25.3 |
| 16.89 |
| 0.29 |
|
Pb |
| % |
| 16.1 |
| 0.53 |
| 6.2 |
| 0.08 |
|
Zn |
| % |
| 0.67 |
| 4.93 |
| 3.38 |
| 56.2 |
|
Fe |
| % |
| 5.2 |
| 29.5 |
| 20.7 |
| 9.0 |
|
|
|
|
|
|
|
|
|
|
|
|
|
LECO |
|
|
|
|
|
|
|
|
|
|
|
S |
| % |
| 5.94 |
| 33.3 |
| 23.38 |
| 33.5 |
|
|
|
|
|
|
|
|
|
|
|
|
|
Fire Assay |
|
|
|
|
|
|
|
|
|
|
|
Au |
| g/t |
| 56.9 |
| 60.5 |
| 59.2 |
| 0.96 |
|
Ag |
| g/t |
| 326 |
| 414 |
| 383 |
| 19 |
|
|
|
|
|
|
|
|
|
|
|
|
|
Cold Vapour AA |
|
|
|
|
|
|
|
|
|
|
|
Hg |
| g/t |
| 8.2 |
| 8.1 |
| 8.1 |
| 138 |
|
|
|
|
|
|
|
|
|
|
|
|
|
ICP-OES |
|
|
|
|
|
|
|
|
|
|
|
Ag |
| g/t |
| 371 |
| 465 |
| 431 |
| 19 |
|
Al |
| g/t |
| 12500 |
| 3430 |
| 6718 |
| 815 |
|
As |
| g/t |
| 47 |
| 92 |
| 76 |
| < 30 |
|
Ba |
| g/t |
| 5 |
| 4 |
| 5 |
| < 0.2 |
|
Be |
| g/t |
| < 0.03 |
| < 0.03 |
| < 0.03 |
| < 0.03 |
|
Bi |
| g/t |
| < 80 |
| < 80 |
| < 80 |
| < 80 |
|
Ca |
| g/t |
| 1930 |
| 1950 |
| 1943 |
| 1100 |
|
Cd |
| g/t |
| 18 |
| 117 |
| 81 |
| 1320 |
|
Co |
| g/t |
| 8 |
| 48 |
| 33 |
| 10 |
|
Cr |
| g/t |
| 4 |
| < 4 |
| < 4 |
| 7 |
|
Cu |
| g/t |
| 21100 |
| 232000 |
| 155542 |
| 2410 |
|
Fe |
| g/t |
| 54500 |
| 293000 |
| 206536 |
| 87400 |
|
K |
| g/t |
| 269 |
| 75 |
| 145 |
| 24 |
|
Li |
| g/t |
| 8 |
| < 5 |
| 6 |
| < 5 |
|
Mg |
| g/t |
| 113000 |
| 10800 |
| 47851 |
| 453 |
|
Mn |
| g/t |
| 416 |
| 264 |
| 319 |
| 2170 |
|
Mo |
| g/t |
| 6 |
| < 5 |
| 5 |
| < 5 |
|
Na |
| g/t |
| 1420 |
| 168 |
| 622 |
| < 10 |
|
Ni |
| g/t |
| < 20 |
| 24 |
| 22 |
| < 20 |
|
P |
| g/t |
| < 200 |
| < 200 |
| < 200 |
| < 200 |
|
Pb |
| g/t |
| 154000 |
| 3790 |
| 58246 |
| 796 |
|
Sb |
| g/t |
| 457 |
| 129 |
| 248 |
| 17 |
|
Se |
| g/t |
| 979 |
| 251 |
| 515 |
| 192 |
|
Sn |
| g/t |
| < 20 |
| 68 |
| 44 |
| < 20 |
|
Sr |
| g/t |
| 3.14 |
| 2.52 |
| 2.74 |
| 0.61 |
|
Ti |
| g/t |
| 339 |
| 93 |
| 182 |
| 19 |
|
Tl |
| g/t |
| < 30 |
| < 30 |
| < 30 |
| < 30 |
|
U |
| g/t |
| < 40 |
| < 40 |
| < 40 |
| < 40 |
|
V |
| g/t |
| 42 |
| 7 |
| 20 |
| < 4 |
|
Y |
| g/t |
| 0.6 |
| < 0.2 |
| 0.4 |
| < 0.2 |
|
Zn |
| g/t |
| 6910 |
| 45000 |
| 31191 |
| — |
|
|
|
|
|
|
|
|
| *Calculated |
|
|
|
Bottle roll cyanide leach tests were done on tailings samples from the various composites and blends to test the amenability of these samples to cyanide leach for the recovery of gold and silver. Initial testing included three series of scoping tests followed by series of tests to optimize regrind size, cyanide concentration, pulp density, lead nitrate addition and pre-aeration. The best results were obtained by regrinding tailings to 40 microns prior to the leach. It was estimated that the average overall flotation and leach recoveries of gold and silver were 90% and 82.8% respectively. Leach kinetic tests and CIP/CIL modeling indicated that CIP was the most suitable process for extraction of gold from solution onto carbon. Cyanide destruction testwork indicated that the leach tailings were amenable to detoxification by the SO2 air process. Further testwork will be done on all aspects of the process prior to design and construction of a leach plant.
Dewatering testwork completed to date includes static settling tests on samples of zinc concentrate for flocculant selection, thickener sizing, and vacuum filter sizing. Pressure filtration testing was done on copper concentrate and a dynamic thickening test was done on a sample of zinc rougher tailings. Further work will include settling and filtration tests on bulk concentrate and an additional dynamic settling test on zinc rougher tailings.
Projected metallurgical recoveries at expected probable mineral reserve grades are shown in Table 13-14.
TABLE 13-14 PROJECTED RECOVERIES
Metal |
| Head Assay |
| Recovery (%) |
|
Gold (g/t) |
| 1.86 |
| 62.0 |
|
Silver (g/t) |
| 23.55 |
| 68.0 |
|
Copper (%) |
| 0.60 |
| 85.7 |
|
Zinc (%) |
| 6.95 |
| 94.0 |
|
Assumptions included in the recovery estimates:
1. Lead head grades will be in the order of 0.25%, and the copper/lead separation stage will not be included in the initial plant design. The plant will produce a bulk copper-lead concentrate. The estimated bulk concentrate grade is 20% copper and approximately 5% lead. It is estimated that lead penalties will be incurred at $2.25 per tonne of concentrate for
each 1% in excess of 0.5% by the smelter. Gold and silver recoveries are to the bulk concentrate.
2. Expected zinc circuit performance in the plant is better represented by the first series of locked cycle tests on the master composite. The higher zinc concentrate grades produced in later testwork are not required. The estimated zinc concentrate grade is 55% Zn.
14.0 MINERAL RESOURCE ESTIMATES
From a geological standpoint, the base metal zones and gold zones which make up the Lalor deposit are distinct. For this reason they are separated during the actual resource calculation, and are separated within the following discussions. A general summary of the combined deposit resource is provided at the end of the section.
14.1 Zinc Rich Base Metal Resources
14.1.1 Zinc Rich Base Metal Mineral Resources Summary
The Lalor zinc rich base metal estimate was prepared by Tim Schwartz, P. Geo., HBMS, under the direct supervision of Robert Carter, P. Eng., Hudbay. The estimate was completed using MineSight 6.5 block modelling software in UTM NAD83 coordinates (MineSight). The block model was constrained by interpreted 3D wireframes of the zinc rich base metal mineralized zones. Gold, silver, copper, zinc, lead, and iron grades and specific gravity were estimated into blocks using ordinary kriging (OK) interpolation. Zone intersections were selected based on a minimum 4% Zinc Equivalency formula (ZNEQ) over a two metre core length. The ZNEQ was calculated from metal price and metal recovery assumptions, with economic contributions from gold, silver, copper and zinc.
14.1.2 Zinc Equivalency
Due to the polymetallic nature of the Lalor deposit, a ZNEQ formula shown below was used for the zinc rich base metal estimate that was derived from metal price and metal recovery assumptions provided by Hudbay (Table 14-1).
ZNEQ% = Zn% + ((Cu% x (Cu Value in US$ per %)/(Zn Value in US$ per %)) x (Cu Recovery/Zn Recovery) + ((Au g/t x (Au Value in US$ per g/t)/(Zn Value in US$ per %)) x (Au Recovery/Zn Recovery)) + ((Ag g/t x (Ag Value in US$ per g/t)/(Zn Value in US$ per %)) x (Ag Recovery/Zn Recovery))
TABLE 14-1 METAL PRICE AND METAL RECOVERY ASSUMPTIONS
Product |
| Metal Price (US$) |
| Metal Recovery (%) |
| US$ Equivalent |
|
Gold |
| 1100.00/oz |
| 65 |
| 22.99 per g/t |
|
Silver |
| 22.00/oz |
| 60 |
| 0.42 per g/t |
|
Copper |
| 2.75/lb |
| 90 |
| 54.56 per % |
|
Zinc |
| 0.95/lb |
| 90 |
| 18.85 per % |
|
The metal prices are based on Hudbay long term equilibrium assumptions of the metal market. The metal recovery assumptions are in line with the Chisel North, Trout Lake and 777 Mines, and concentrators at Snow Lake and Flin Flon, Manitoba, operated by Hudbay. An exchange rate of 1.05 C$ per US$ is assumed.
In selecting drill hole intersections for the zinc rich base metal mineral resource estimate, a minimum of 4% ZNEQ over a two metre core length, or 8 m%, was required. This equates to US$75.40/t of metal value using the metal price and metal recovery assumptions in the ZNEQ formula.
The minimum US$75.40/t of metal value is justified from the operating costs at Chisel North Mine, which are on the order of C$70/t to C$80/t for low angle post pillar cut and fill mining method.
The Lalor zinc rich base metal deposit is a natural occurrence of copper and zinc mineralization and in most cases the contacts are defined as the boundary between potentially economic massive sulphide material and weakly mineralized low grade mineralization with no economic potential. This is similar to the adjacent Chisel North Mine where generally no hard cut-off is required for resource estimation. No sensitivities for cut-off grade determination were therefore completed on the zinc rich base metal zones and it was assumed that there is no base metal mineral resource at grades lower than the applied minimum ZNEQ.
14.1.3 Wireframe Models
Continued exploration since the October 2009 NI 43-101 technical report necessitated an update in all of the wireframe models produced for that report. New drill hole intersections were coded using the same ZNEQ of 4% over a minimum two metre interval. The original
models were sliced on 10m spacing along the original azimuth of 040°. These polyline slices were adjusted for the new drilling. The polylines were linked and triangulated to create new three-dimensional wireframe solids. (See plan view showing mineralized outlines in Figure 14-1 and three dimensional views in Figures 14-2 and 14-3). These new wireframe models were then sliced in other directions for shape verification related to apparent plunge, strike and dip of the lenses. In general, the mineralization was projected either less than half the drill hole spacing or halfway to a low grade or unmineralized hole along the perimeter of the lens. Wireframe volumes and drilling information, shown in Table 14-2, have been validated in MineSight, with no errors.
TABLE 14-2 SUMMARY OF ZINC RICH INTERPRETED WIREFRAMES
Zone |
| Volume (m3) |
| Average Thickness |
| Number of |
| Assayed |
| Volume |
|
10 |
| 1,686,000 |
| 9.1 |
| 46 |
| 472.59 |
| 37,000 |
|
11 |
| 127,000 |
| 3.4 |
| 14 |
| 50.16 |
| 9,000 |
|
20 |
| 1,862,000 |
| 8.9 |
| 87 |
| 725.62 |
| 21,000 |
|
30 |
| 761,000 |
| 11.7 |
| 23 |
| 268.75 |
| 33,000 |
|
31 |
| 145,000 |
| 7.5 |
| 6 |
| 58.9 |
| 24,000 |
|
40 |
| 298,000 |
| 6.8 |
| 13 |
| 114.73 |
| 23,000 |
|
Total |
| 4,879,000 |
|
|
|
|
| 1,690.75 |
|
|
|
The additional drilling since the October 2009 NI 43-101 technical report was mostly within the bounds of the previously interpreted lenses. As a result, there is very little change around the peripheries of the shapes, and most of the changes are thickness changes within the previous shapes.
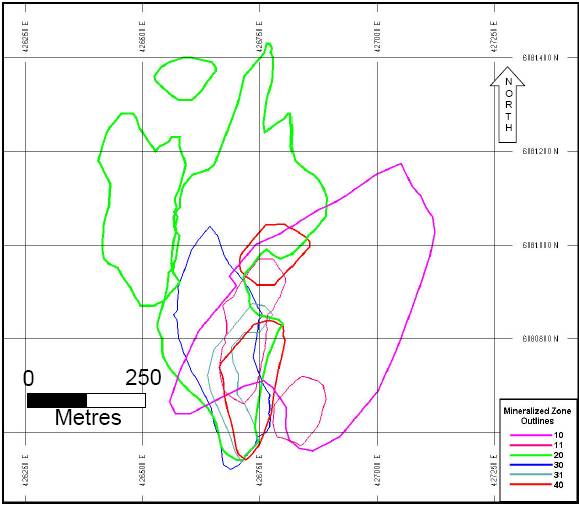

FIGURE 14-3 3D VIEW OF ZINC RICH BASE METAL MINERALIZED ZONES LOOKING 40° AZIMUTH

14.1.4 Bulk Density
Specific gravities were measured by Hudbay geologists and technicians on 80% of the sampled assay intervals included in the zinc rich base metal resource estimation for a total of 1,957 measurements. A summary of all the measured SG values incorporated into the resource estimation is displayed in Table 14-3.
TABLE 14-3 SUMMARY OF MEASURED SG VALUES
Zone |
| Count |
| Minimum |
| Maximum |
| Mean |
|
10 |
| 546 |
| 2.74 |
| 4.75 |
| 3.80 |
|
11 |
| 39 |
| 2.98 |
| 4.21 |
| 3.64 |
|
20 |
| 860 |
| 2.66 |
| 4.60 |
| 3.51 |
|
30 |
| 299 |
| 2.71 |
| 4.57 |
| 3.48 |
|
31 |
| 66 |
| 2.94 |
| 3.98 |
| 3.42 |
|
40 |
| 147 |
| 2.77 |
| 4.08 |
| 3.52 |
|
Total |
| 1957 |
| 2.66 |
| 4.75 |
| 3.59 |
|
The measured SG values were compared to calculated stoichiometric values for each sample for confirmation. A simple XY plot of the comparison is shown in Figure 14-4 with a derived R2 value of 0.9274, indicating a high degree of correlation between the values. The stoichiometric method uses the assayed percentages of copper, zinc, lead, iron and arsenic to calculate the percentage of chalcopyrite, sphalerite, galena, pyrite and arsenopyrite, respectively, in each sample. Stoichiometric (calculated) density and proportions of each metal by mineral type are shown in Table 14-4. The percentage of elemental copper, zinc, lead and arsenic in each mineral is added, where the total for each sample must add to 100%, so the remainder (1 subtract total metals measured) was assumed to be gangue material with a 2.70 SG.
FIGURE 14-4 COMPARISON OF STOICHIOMETRIC CALCULATED AND MEASURED SG VALUES
TABLE 14-4 PROPORTION OF METAL IN MINERALS
|
|
|
| Chemical |
| Proportion of Metal in Minerals |
| ||||||||
Mineral |
| Density |
| Formula |
| Copper |
| Zinc |
| Lead |
| Iron |
| Arsenic |
|
Chalcopyrite |
| 4.2 |
| CuFeS2 |
| 0.346 |
| — |
| — |
| 0.304 |
| — |
|
Sphalerite |
| 4.0 |
| ZnS |
| — |
| 0.671 |
| — |
| — |
| — |
|
Galena |
| 7.5 |
| PbS |
| — |
| — |
| 0.866 |
| — |
| — |
|
Pyrite |
| 5.0 |
| FeS2 |
| — |
| — |
| — |
| 0.466 |
| — |
|
Arsenopyrite |
| 6.0 |
| FeAsS |
| — |
| — |
| — |
| 0.343 |
| 0.460 |
|
Samples not SG measured were stoichiometrically calculated and results of the calculated values are shown in Table 14-5.
TABLE 14-5 SUMMARY OF STOICHIOMETRIC CALCULATED SG VALUES
Zone |
| Count |
| Minimum |
| Maximum |
| Mean |
|
10 |
| 128 |
| 2.92 |
| 5.06 |
| 3.97 |
|
11 |
| 39 |
| 3.03 |
| 5.30 |
| 4.24 |
|
20 |
| 226 |
| 2.70 |
| 5.07 |
| 3.74 |
|
30 |
| 57 |
| 2.88 |
| 4.56 |
| 3.73 |
|
31 |
| 20 |
| 2.99 |
| 4.65 |
| 3.67 |
|
40 |
| 26 |
| 2.82 |
| 4.55 |
| 3.60 |
|
Total |
| 496 |
| 2.70 |
| 5.30 |
| 3.83 |
|
14.1.5 Assay Statistics
A total of 2,453 mineralized assay intervals from 65 parent drill holes and 57 wedge offsets defining the zones of zinc rich base metal mineralization on the property were used for resource estimation. The remaining holes are located on the fringe of the deposit and are either not mineralized or contain weak mineralization not meeting the ZNEQ cut-off criteria, or were drilled for metallurgical purposes.
Samples were grouped according to their interpreted lens of zinc rich mineralization into zones. Sample statistics of the assayed information are shown in Table 14-6. Data analysis was conducted by creating probability and histogram plots of the selected data as shown in Appendix 1.
TABLE 14-6 RANGE OF ASSAY VALUES BY ZINC RICH MINERALIZED ZONE
Au (g/t)
Zone |
| Number |
| Minimum |
| Maximum |
| Mean |
| Standard |
| Coefficient |
|
10 |
| 674 |
| 0.00 |
| 24.48 |
| 1.08 |
| 2.46 |
| 2.27 |
|
11 |
| 78 |
| 0.00 |
| 5.55 |
| 0.40 |
| 0.93 |
| 2.35 |
|
20 |
| 1086 |
| 0.00 |
| 195.15 |
| 3.23 |
| 8.67 |
| 2.68 |
|
30 |
| 356 |
| 0.03 |
| 56.96 |
| 1.44 |
| 4.53 |
| 3.16 |
|
31 |
| 86 |
| 0.09 |
| 57.10 |
| 2.40 |
| 7.90 |
| 3.29 |
|
40 |
| 173 |
| 0.06 |
| 31.14 |
| 2.37 |
| 3.40 |
| 1.43 |
|
All |
| 2453 |
| 0.00 |
| 195.15 |
| 2.20 |
| 6.48 |
| 2.94 |
|
Continuation of Table 14-6
Ag (g/t)
Zone |
| Number |
| Minimum |
| Maximum |
| Mean |
| Standard |
| Coefficient |
|
10 |
| 674 |
| 0.00 |
| 374.06 |
| 22.71 |
| 35.64 |
| 1.57 |
|
11 |
| 78 |
| 1.37 |
| 176.91 |
| 27.24 |
| 27.12 |
| 1.00 |
|
20 |
| 1086 |
| 0.00 |
| 363.00 |
| 37.00 |
| 46.39 |
| 1.25 |
|
30 |
| 356 |
| 1.03 |
| 349.03 |
| 28.38 |
| 35.43 |
| 1.25 |
|
31 |
| 86 |
| 0.00 |
| 773.00 |
| 47.45 |
| 92.32 |
| 1.95 |
|
40 |
| 173 |
| 0.00 |
| 171.09 |
| 42.55 |
| 35.38 |
| 0.83 |
|
All |
| 2453 |
| 0.00 |
| 773.00 |
| 32.27 |
| 44.07 |
| 1.37 |
|
Cu (%)
Zone |
| Number |
| Minimum |
| Maximum |
| Mean |
| Standard |
| Coefficient |
|
10 |
| 674 |
| 0.00 |
| 11.43 |
| 0.64 |
| 1.00 |
| 1.56 |
|
11 |
| 78 |
| 0.00 |
| 3.69 |
| 0.36 |
| 0.48 |
| 1.36 |
|
20 |
| 1086 |
| 0.00 |
| 13.59 |
| 1.11 |
| 1.51 |
| 1.36 |
|
30 |
| 356 |
| 0.02 |
| 2.61 |
| 0.32 |
| 0.34 |
| 1.05 |
|
31 |
| 86 |
| 0.00 |
| 2.50 |
| 0.29 |
| 0.31 |
| 1.09 |
|
40 |
| 173 |
| 0.00 |
| 6.57 |
| 0.61 |
| 0.71 |
| 1.16 |
|
All |
| 2453 |
| 0.00 |
| 13.59 |
| 0.78 |
| 1.20 |
| 1.54 |
|
Zn (%)
Zone |
| Number |
| Minimum |
| Maximum |
| Mean |
| Standard |
| Coefficient |
|
10 |
| 674 |
| 0.02 |
| 53.10 |
| 10.77 |
| 11.42 |
| 1.06 |
|
11 |
| 78 |
| 0.04 |
| 43.70 |
| 12.13 |
| 11.48 |
| 0.95 |
|
20 |
| 1086 |
| 0.00 |
| 45.31 |
| 8.13 |
| 8.14 |
| 1.00 |
|
30 |
| 356 |
| 0.02 |
| 32.51 |
| 5.80 |
| 4.91 |
| 0.85 |
|
31 |
| 86 |
| 0.02 |
| 38.74 |
| 7.28 |
| 6.15 |
| 0.85 |
|
40 |
| 173 |
| 0.09 |
| 37.23 |
| 8.94 |
| 6.69 |
| 0.75 |
|
All |
| 2453 |
| 0.00 |
| 53.10 |
| 8.67 |
| 8.95 |
| 1.03 |
|
Continuation of Table 14-6
PB (%)
Zone |
| Number |
| Minimum |
| Maximum |
| Mean |
| Standard |
| Coefficient |
|
10 |
| 674 |
| 0.00 |
| 14.30 |
| 0.26 |
| 1.03 |
| 3.95 |
|
11 |
| 78 |
| 0.00 |
| 1.71 |
| 0.20 |
| 0.38 |
| 1.86 |
|
20 |
| 1086 |
| 0.00 |
| 10.26 |
| 0.37 |
| 0.93 |
| 2.48 |
|
30 |
| 356 |
| 0.00 |
| 8.14 |
| 0.58 |
| 1.07 |
| 1.85 |
|
31 |
| 86 |
| 0.00 |
| 7.43 |
| 0.74 |
| 1.15 |
| 1.57 |
|
40 |
| 173 |
| 0.00 |
| 7.20 |
| 1.02 |
| 1.19 |
| 1.17 |
|
All |
| 2453 |
| 0.00 |
| 14.30 |
| 0.42 |
| 1.01 |
| 2.39 |
|
Fe (%)
Zone |
| Number |
| Minimum |
| Maximum |
| Mean |
| Standard |
| Coefficient |
|
10 |
| 674 |
| 2.57 |
| 46.07 |
| 22.90 |
| 10.09 |
| 0.44 |
|
11 |
| 78 |
| 5.29 |
| 51.26 |
| 23.38 |
| 9.34 |
| 0.40 |
|
20 |
| 1086 |
| 0.00 |
| 41.05 |
| 17.40 |
| 10.15 |
| 0.58 |
|
30 |
| 356 |
| 2.83 |
| 38.70 |
| 17.28 |
| 8.29 |
| 0.48 |
|
31 |
| 86 |
| 3.10 |
| 34.74 |
| 14.95 |
| 6.64 |
| 0.44 |
|
40 |
| 173 |
| 1.72 |
| 32.55 |
| 15.56 |
| 6.84 |
| 0.44 |
|
All |
| 2453 |
| 0.00 |
| 51.26 |
| 18.87 |
| 9.94 |
| 0.53 |
|
SG
Zone |
| Number |
| Minimum |
| Maximum |
| Mean |
| Standard |
| Coefficient |
|
10 |
| 674 |
| 2.74 |
| 5.06 |
| 3.83 |
| 0.52 |
| 0.14 |
|
11 |
| 78 |
| 2.98 |
| 5.30 |
| 3.94 |
| 0.54 |
| 0.14 |
|
20 |
| 1086 |
| 2.66 |
| 5.07 |
| 3.55 |
| 0.54 |
| 0.15 |
|
30 |
| 356 |
| 2.71 |
| 4.57 |
| 3.52 |
| 0.40 |
| 0.11 |
|
31 |
| 86 |
| 2.94 |
| 4.65 |
| 3.48 |
| 0.34 |
| 0.10 |
|
40 |
| 173 |
| 2.77 |
| 4.55 |
| 3.53 |
| 0.33 |
| 0.09 |
|
All |
| 2453 |
| 2.66 |
| 5.30 |
| 3.63 |
| 0.52 |
| 0.14 |
|
14.1.6 Capping of High Grades
In order to avoid any disproportionate influence of random, anomalously high grade assays on the resource average grade, histograms, cumulative frequency log probability charts, cutting curves, and decile analysis charts were created to examine the assay grade distribution within the zinc rich mineralized lenses and assess the need for grade capping. Skewness and high-grade outliers to the distribution can lead to overestimation of average grades unless some means of moderating the effect of the highest grade samples is applied. A common method for accomplishing this is by top cutting (or cap) high assays at some predetermined level prior to grade estimation. In reviewing the assay statistics by zone it was decided to cap high grade gold assays for each zone, while the high grade silver assays were capped for Zones 10, 11, 20, 30 and 31. The capped value and the number of affected assays are shown in Table 14-7. High-grade assays were capped prior to compositing.
TABLE 14-7 HIGH GRADE CAPPING SUMMARY
Au (g/t)
Zone |
| Capped Value |
| Number of Samples |
| % of |
|
10 |
| 13 |
| 11 |
| 1.63 | % |
11 |
| 3 |
| 3 |
| 3.80 | % |
20 |
| 26 |
| 17 |
| 1.57 | % |
30 |
| 8.5 |
| 5 |
| 1.40 | % |
31 |
| 2.4 |
| 9 |
| 10.34 | % |
40 |
| 9 |
| 3 |
| 1.72 | % |
All |
|
|
| 45 |
| 2.00 | % |
Ag (g/t)
Zone |
| Capped Value |
| Number of Samples |
| % of |
|
10 |
| 120 |
| 21 |
| 3.12 | % |
11 |
| 60 |
| 6 |
| 7.59 | % |
20 |
| 180 |
| 23 |
| 2.12 | % |
30 |
| 150 |
| 7 |
| 1.96 | % |
31 |
| 80 |
| 10 |
| 11.49 | % |
All |
|
|
| 67 |
| 2.93 | % |
14.1.7 Composites
After capping, assay samples were weighted by SG and composited into two metre downhole lengths while honouring the interpreted mineralized zone boundaries. Compositing of downhole assays results in a fractional length for the last sample in a given zone. Where this length is less than one metre, it was average weighted with the adjacent up-the-hole composite. Table 14-8 shows the composite summary information by zone and metal type used in estimating the resource. Data analysis was conducted by creating probability and histogram plots of the selected data as shown in Appendix 2.
TABLE 14-8 COMPOSITE STATISTICS BY ZINC RICH MINERALIZED ZONE
Au (g/t)
Zone |
| Number |
| Minimum |
| Maximum |
| Mean |
| Standard |
| Coefficient |
|
10 |
| 238 |
| 0.02 |
| 11.38 |
| 1.12 |
| 1.93 |
| 1.72 |
|
11 |
| 25 |
| 0.03 |
| 2.18 |
| 0.25 |
| 0.43 |
| 1.72 |
|
20 |
| 363 |
| 0.06 |
| 20.00 |
| 2.87 |
| 3.62 |
| 1.26 |
|
30 |
| 136 |
| 0.12 |
| 8.00 |
| 1.12 |
| 1.15 |
| 1.03 |
|
31 |
| 30 |
| 0.25 |
| 2.13 |
| 1.04 |
| 0.59 |
| 0.57 |
|
40 |
| 56 |
| 0.12 |
| 20.00 |
| 2.14 |
| 1.54 |
| 0.72 |
|
All |
| 848 |
| 0.02 |
| 20.00 |
| 1.91 |
| 2.79 |
| 1.46 |
|
Ag (g/t)
Zone |
| Number |
| Minimum |
| Maximum |
| Mean |
| Standard |
| Coefficient |
|
10 |
| 238 |
| 1.20 |
| 120.00 |
| 20.53 |
| 19.43 |
| 0.95 |
|
11 |
| 25 |
| 6.47 |
| 53.07 |
| 21.18 |
| 11.79 |
| 0.56 |
|
20 |
| 363 |
| 1.79 |
| 140.00 |
| 33.51 |
| 28.54 |
| 0.85 |
|
30 |
| 136 |
| 3.03 |
| 122.47 |
| 28.01 |
| 20.73 |
| 0.74 |
|
31 |
| 30 |
| 5.02 |
| 77.76 |
| 31.31 |
| 20.28 |
| 0.65 |
|
40 |
| 56 |
| 0.00 |
| 146.74 |
| 42.50 |
| 29.84 |
| 0.70 |
|
All |
| 848 |
| 0.00 |
| 146.74 |
| 29.14 |
| 25.32 |
| 0.87 |
|
Continuation of Table 14-8
Cu (%)
Zone |
| Number |
| Minimum |
| Maximum |
| Mean |
| Standard |
| Coefficient |
|
10 |
| 238 |
| 0.00 |
| 4.46 |
| 0.65 |
| 0.77 |
| 1.18 |
|
11 |
| 25 |
| 0.03 |
| 1.59 |
| 0.33 |
| 0.31 |
| 0.94 |
|
20 |
| 363 |
| 0.03 |
| 7.64 |
| 1.13 |
| 1.26 |
| 1.12 |
|
30 |
| 136 |
| 0.05 |
| 1.74 |
| 0.33 |
| 0.27 |
| 0.82 |
|
31 |
| 30 |
| 0.03 |
| 0.99 |
| 0.29 |
| 0.21 |
| 0.73 |
|
40 |
| 56 |
| 0.01 |
| 7.64 |
| 0.60 |
| 0.42 |
| 0.70 |
|
All |
| 848 |
| 0.00 |
| 7.64 |
| 0.78 |
| 0.99 |
| 1.27 |
|
Zn (%)
Zone |
| Number |
| Minimum |
| Maximum |
| Mean |
| Standard |
| Coefficient |
|
10 |
| 238 |
| 0.04 |
| 47.23 |
| 10.89 |
| 9.70 |
| 0.89 |
|
11 |
| 25 |
| 1.88 |
| 28.64 |
| 11.55 |
| 8.49 |
| 0.74 |
|
20 |
| 363 |
| 0.01 |
| 35.54 |
| 8.24 |
| 6.76 |
| 0.82 |
|
30 |
| 136 |
| 0.29 |
| 17.08 |
| 5.91 |
| 3.67 |
| 0.62 |
|
31 |
| 30 |
| 0.45 |
| 15.01 |
| 7.25 |
| 4.18 |
| 0.58 |
|
40 |
| 56 |
| 0.10 |
| 47.23 |
| 9.55 |
| 5.36 |
| 0.56 |
|
All |
| 848 |
| 0.01 |
| 47.23 |
| 8.76 |
| 7.45 |
| 0.85 |
|
Pb (%)
Zone |
| Number |
| Minimum |
| Maximum |
| Mean |
| Standard |
| Coefficient |
|
10 |
| 238 |
| 0.00 |
| 5.23 |
| 0.23 |
| 0.51 |
| 2.25 |
|
11 |
| 25 |
| 0.00 |
| 1.06 |
| 0.16 |
| 0.27 |
| 1.70 |
|
20 |
| 363 |
| 0.00 |
| 2.71 |
| 0.33 |
| 0.49 |
| 1.48 |
|
30 |
| 136 |
| 0.00 |
| 4.55 |
| 0.60 |
| 0.72 |
| 1.20 |
|
31 |
| 30 |
| 0.02 |
| 3.24 |
| 0.66 |
| 0.74 |
| 1.12 |
|
40 |
| 56 |
| 0.00 |
| 5.23 |
| 1.06 |
| 1.02 |
| 0.97 |
|
All |
| 848 |
| 0.00 |
| 5.23 |
| 0.40 |
| 0.63 |
| 1.58 |
|
Continuation of Table 14-8
Fe (%)
Zone |
| Number |
| Minimum |
| Maximum |
| Mean |
| Standard |
| Coefficient |
|
10 |
| 238 |
| 5.60 |
| 43.99 |
| 23.38 |
| 8.26 |
| 0.35 |
|
11 |
| 25 |
| 7.01 |
| 36.87 |
| 23.22 |
| 7.74 |
| 0.33 |
|
20 |
| 363 |
| 2.77 |
| 35.77 |
| 17.61 |
| 8.70 |
| 0.49 |
|
30 |
| 136 |
| 3.59 |
| 36.26 |
| 17.94 |
| 7.15 |
| 0.40 |
|
31 |
| 30 |
| 6.44 |
| 32.39 |
| 15.40 |
| 5.33 |
| 0.35 |
|
40 |
| 56 |
| 3.92 |
| 43.99 |
| 16.06 |
| 5.34 |
| 0.33 |
|
All |
| 848 |
| 2.77 |
| 43.99 |
| 19.27 |
| 8.49 |
| 0.44 |
|
SG
Zone |
| Number |
| Minimum |
| Maximum |
| Mean |
| Standard |
| Coefficient |
|
10 |
| 238 |
| 2.91 |
| 4.75 |
| 3.83 |
| 0.44 |
| 0.12 |
|
11 |
| 25 |
| 3.03 |
| 4.74 |
| 3.91 |
| 0.47 |
| 0.12 |
|
20 |
| 363 |
| 2.79 |
| 4.58 |
| 3.55 |
| 0.47 |
| 0.13 |
|
30 |
| 136 |
| 2.89 |
| 4.46 |
| 3.53 |
| 0.36 |
| 0.10 |
|
31 |
| 30 |
| 3.05 |
| 4.50 |
| 3.48 |
| 0.29 |
| 0.08 |
|
40 |
| 56 |
| 2.90 |
| 4.75 |
| 3.54 |
| 0.26 |
| 0.07 |
|
All |
| 848 |
| 2.79 |
| 4.75 |
| 3.63 |
| 0.45 |
| 0.12 |
|
14.1.8 Composite Restriction
A review of the probability and histogram plots from the composite data showed some high grade values were spatially discontinuous from the remainder of the data set and there was justification of restricting these higher grade values by limiting their search distance. The high grade values shown in Table 14-9 were restricted to a 45m influence for grade interpolation, which is approximately the global average drill hole spacing.
TABLE 14-9 HIGH GRADE COMPOSITE RESTRICTION SUMMARY
Au g/t
Zone |
| Restricted Value |
| Number of samples |
| % Samples Restricted |
|
10 |
| 8 |
| 6 |
| 2.5 | % |
11 |
| 1 |
| 1 |
| 4.0 | % |
20 |
| 13 |
| 9 |
| 2.5 | % |
30 |
| 4 |
| 4 |
| 2.9 | % |
31 |
| 2 |
| 3 |
| 10.0 | % |
40 |
| 5 |
| 6 |
| 10.7 | % |
ALL |
|
|
| 29 |
| 3.4 | % |
Ag (g/t)
Zone |
| Restricted Value |
| Number of samples |
| % Samples Restricted |
|
10 |
| 80 |
| 6 |
| 2.6 | % |
11 |
| 40 |
| 2 |
| 8.0 | % |
20 |
| 112 |
| 7 |
| 1.9 | % |
30 |
| 70 |
| 6 |
| 4.4 | % |
31 |
| 60 |
| 4 |
| 13.3 | % |
40 |
| 100 |
| 3 |
| 5.4 | % |
ALL |
|
|
| 28 |
| 3.3 | % |
Cu %
Zone |
| Restricted Value |
| Number of samples |
| % Samples Restricted |
|
10 |
| 2 |
| 15 |
| 6.3 | % |
11 |
| 0.6 |
| 1 |
| 4.0 | % |
20 |
| 4.5 |
| 12 |
| 3.3 | % |
30 |
| 0.9 |
| 5 |
| 3.7 | % |
31 |
| 0.6 |
| 2 |
| 6.7 | % |
40 |
| 1.3 |
| 4 |
| 7.1 | % |
ALL |
|
|
| 39 |
| 4.6 | % |
Continuation of Table 14-9
Zn %
Zone |
| Restricted Value |
| Number of samples |
| % Samples Restricted |
|
10 |
| 38 |
| 7 |
| 2.9 | % |
11 |
| 23 |
| 3 |
| 12.0 | % |
20 |
| 25 |
| 12 |
| 3.3 | % |
30 |
| 12 |
| 12 |
| 8.8 | % |
31 |
| 12 |
| 5 |
| 16.7 | % |
40 |
| 21 |
| 2 |
| 3.6 | % |
ALL |
|
|
| 41 |
| 4.8 | % |
Pb %
Zone |
| Restricted Value |
| Number of samples |
| % Samples Restricted |
|
10 |
| 1.5 |
| 7 |
| 2.9 | % |
11 |
| 0.6 |
| 2 |
| 8.0 | % |
20 |
| 2 |
| 10 |
| 1.9 | % |
30 |
| 2 |
| 8 |
| 5.9 | % |
31 |
| 1.6 |
| 4 |
| 13.3 | % |
40 |
| 3 |
| 2 |
| 3.6 | % |
ALL |
|
|
| 33 |
| 3.9 | % |
Fe %
Zone |
| Restricted Value |
| Number of samples |
| % Samples Restricted |
|
10 |
| 37 |
| 9 |
| 3.8 | % |
11 |
| 32 |
| 5 |
| 20.0 | % |
20 |
| 33 |
| 13 |
| 3.6 | % |
30 |
| 31 |
| 7 |
| 5.1 | % |
31 |
| 24 |
| 1 |
| 3.3 | % |
40 |
| 24 |
| 1 |
| 1.8 | % |
ALL |
|
|
| 36 |
| 4.2 | % |
Continuation of Table 14-9
SG
Zone |
| Restricted Value |
| Number of samples |
| % Samples Restricted |
|
10 |
| 4.6 |
| 10 |
| 4.2 | % |
11 |
| 4.5 |
| 4 |
| 16.0 | % |
20 |
| 4.4 |
| 8 |
| 2.2 | % |
30 |
| 4.2 |
| 6 |
| 4.4 | % |
31 |
| 3.8 |
| 1 |
| 3.3 | % |
40 |
| 3.9 |
| 2 |
| 3.6 | % |
ALL |
|
|
| 31 |
| 3.7 | % |
14.1.9 Mineralization Continuity and Variography
Correlograms, using MineSight software, were completed on the gold, silver, copper, zinc, lead, iron and SG composites. Combined composite data from Zones 10 and 11 were used in the correlograms, as well as combined composite data from Zones 30, 31 and 40. Zone 20 with the greatest number of composites was modeled independently. The reason for combining composites from zones for the variography process was to increase the number of composites from like mineralization and as a result get a better feel for the spatial continuity. Zones 10 and 11 have a similar mineralized trend with higher zinc and iron percentages than in the other zones, whereas Zones 30, 31 and 40 have similar mineralized trends with moderate zinc and disseminated to near solid sulphide material. Prior to combining the composites they were spatially moved so pairs between the zones were not developed.
Correlograms were generated to determine the orientation and spatial continuity of the composited mineralization and bulk density. A summary of the results is shown in Table 14-10, with plots presented in Appendix 3.
TABLE 14-10 LALOR BASE METAL VARIOGRAPHY PARAMETERS
|
|
|
|
|
|
|
|
|
|
|
|
|
| Rotation Angles |
| ||||
|
|
|
|
|
|
|
|
|
|
|
|
|
| (LRL Rule) |
| ||||
|
|
|
|
|
| Sill |
| Range (m) |
| Z- |
|
|
| Y- |
| ||||
Zone |
| Component |
| Nugget |
| 1 |
| 2 |
| 1 |
| 2 |
| Axis |
| X-Axis |
| Axis |
|
|
| Gold |
| 0.22 |
| 0.26 |
| 0.40 |
| 8 |
| 128 |
| 44° |
| -31° |
| 0° |
|
|
| Silver |
| 0.39 |
| 0.34 |
| 0.26 |
| 8 |
| 62 |
| 44° |
| -31° |
| 0° |
|
|
| Copper |
| 0.42 |
| 0.51 |
| — |
| 109 |
| — |
| 44° |
| -31° |
| 0° |
|
10 and 11 |
| Zinc |
| 0.37 |
| 0.64 |
| — |
| 111 |
| — |
| 44° |
| -31° |
| 0° |
|
|
| Lead |
| 0.42 |
| 0.55 |
| — |
| 69 |
| — |
| 44° |
| -31° |
| 0° |
|
|
| Iron |
| 0.17 |
| 0.58 |
| 0.25 |
| 24 |
| 143 |
| 44° |
| -31° |
| 0° |
|
|
| SG |
| 0.16 |
| 0.48 |
| 0.35 |
| 15 |
| 129 |
| 44° |
| -31° |
| 0° |
|
|
|
|
|
|
|
|
|
|
|
|
|
|
|
|
|
|
|
|
|
|
| Gold |
| 0.18 |
| 0.53 |
| 0.24 |
| 62 |
| 114 |
| 0° |
| -15° |
| 15° |
|
|
| Silver |
| 0.24 |
| 0.35 |
| 0.36 |
| 42 |
| 80 |
| 0° |
| -15° |
| 15° |
|
|
| Copper |
| 0.17 |
| 0.53 |
| 0.33 |
| 62 |
| 151 |
| 0° |
| -15° |
| 15° |
|
20 |
| Zinc |
| 0.30 |
| 0.39 |
| 0.33 |
| 58 |
| 123 |
| 0° |
| -15° |
| 15° |
|
|
| Lead |
| 0.44 |
| 0.15 |
| 0.41 |
| 57 |
| 125 |
| 0° |
| -15° |
| 15° |
|
|
| Iron |
| 0.14 |
| 0.56 |
| 0.32 |
| 25 |
| 105 |
| 0° |
| -15° |
| 15° |
|
|
| SG |
| 0.10 |
| 0.59 |
| 0.31 |
| 21 |
| 98 |
| 0° |
| -15° |
| 15° |
|
|
|
|
|
|
|
|
|
|
|
|
|
|
|
|
|
|
|
|
|
|
| Gold |
| 0.13 |
| 0.60 |
| 0.27 |
| 54 |
| 127 |
| -10° |
| -12° |
| 15° |
|
|
| Silver |
| 0.34 |
| 0.32 |
| 0.35 |
| 17 |
| 72 |
| -10° |
| -12° |
| 15° |
|
|
| Copper |
| 0.17 |
| 0.54 |
| 0.29 |
| 27 |
| 93 |
| -10° |
| -12° |
| 15° |
|
30, 31 and 40 |
| Zinc |
| 0.33 |
| 0.50 |
| 0.08 |
| 29 |
| 93 |
| -10° |
| -12° |
| 15° |
|
|
| Lead |
| 0.45 |
| 0.37 |
| 0.17 |
| 35 |
| 87 |
| -10° |
| -12° |
| 15° |
|
|
| Iron |
| 0.28 |
| 0.45 |
| 0.27 |
| 32 |
| 95 |
| -10° |
| -12° |
| 15° |
|
|
| SG |
| 0.32 |
| 0.67 |
| 0.04 |
| 33 |
| 95 |
| -10° |
| -12° |
| 15° |
|
14.1.10 Resource Block Model
One three-dimensional block model was constructed that contained all zones of mineralization using MineSight on UTM NAD83 coordinates. The origin of the model is 427,320m east, 6,082,500m north, and 4,840m relative elevation. Block dimensions of 10m by 10m by 10m were selected based on the average width of the resource wireframes, as well anticipation of the smallest mining unit based on the current underground mining practices at the Chisel North Mine. Block model geometry and parameters are provided in Table 14-11. The model encompasses a volume of 21 billion m3 and extends to 3,800 elevation (1,510 m below shaft collar).
TABLE 14-11 BLOCK MODEL GEOMETRIES
|
| Number of |
|
|
| Model Limits (UTM NAD83) |
| ||
Coordinate |
| Blocks |
| Block Size (m) |
| Minimum |
| Maximum |
|
X — East |
| 98 |
| 10 |
| 426,340 |
| 427,320 |
|
Y — North |
| 213 |
| 10 |
| 6,080,370 |
| 6,082,500 |
|
Z — Elevation |
| 104 |
| 10 |
| 3800 |
| 4840 |
|
14.1.11 Interpolation Plan
The interpolation of the Lalor zinc rich resource estimation model was completed on the capped composites using restriction searches to a distance of 45m by the following estimation methods: nearest neighbour (NN), inverse distance squared weighted (IDW) and ordinary kriging (OK).
The estimates using NN and two iterations using IDW and OK were completed on each zone. The first iteration was designed to estimate a block using the search distance parameters and minimum number of composites when the criteria in Table 14-12 were met. The second pass reduced the search distance and increased the minimum number of composites.
TABLE 14-12 SEARCH PARAMETERS BASE METALS
|
|
|
| Search Ellipse Distances (m) |
| Number of Composites |
| ||||||||
|
|
|
|
|
|
|
|
|
|
|
|
|
| Per Drill |
|
Pass |
| Zone |
| Major |
| Minor |
| Vertical |
| Minimum |
| Maximum |
| Hole |
|
|
| 10 |
| 250 |
| 100 |
| 50 |
| 4 |
| 12 |
| 3 |
|
|
| 11 |
| 250 |
| 100 |
| 50 |
| 1 |
| 6 |
| 1 |
|
|
| 20 |
| 240 |
| 160 |
| 80 |
| 5 |
| 15 |
| 4 |
|
|
| 30 |
| 150 |
| 100 |
| 50 |
| 5 |
| 15 |
| 4 |
|
|
| 31 |
| 300 |
| 200 |
| 100 |
| 4 |
| 12 |
| 3 |
|
First |
| 40 |
| 300 |
| 200 |
| 100 |
| 3 |
| 10 |
| 2 |
|
|
|
|
|
|
|
|
|
|
|
|
|
|
|
|
|
|
| 10 |
| 125 |
| 50 |
| 25 |
| 8 |
| 12 |
| 3 |
|
|
| 11 |
| 150 |
| 50 |
| 25 |
| 3 |
| 6 |
| 1 |
|
|
| 20 |
| 120 |
| 80 |
| 40 |
| 10 |
| 15 |
| 4 |
|
|
| 30 |
| 75 |
| 50 |
| 25 |
| 9 |
| 15 |
| 4 |
|
|
| 31 |
| 125 |
| 80 |
| 50 |
| 8 |
| 12 |
| 3 |
|
Second |
| 40 |
| 125 |
| 80 |
| 50 |
| 7 |
| 10 |
| 2 |
|
Rotation angles for the ellipsoid were derived from the variography process, which closely resembles the average strike and dip of the zones. The major search distance is parallel to the plunge of the mineralization, the minor search distance is parallel to the strike of the mineralization, and the vertical search distance corresponds to the thickness of the mineralization.
14.1.12 Block Model Validation
The Lalor zinc rich resource estimate was validated by the following methods:
· Inspection of the OK block model grades in plan and section views in comparison to the drill hole grades
· Comparison of the global mean grades based on NN, IDW and OK estimation methods
· Swath plot comparisons of the estimation methods
· Comparison to October 2009 mineral resource estimate.
14.1.13 Visual Comparison
The block models were checked in plan and section views to compare block grades with the drill hole grades, and ensure that the interpolation honoured the composites. The visual comparisons of block grades with composite grades of the gold, silver, copper and zinc showed a good correlation between the values (example shown in Figure 14-5).
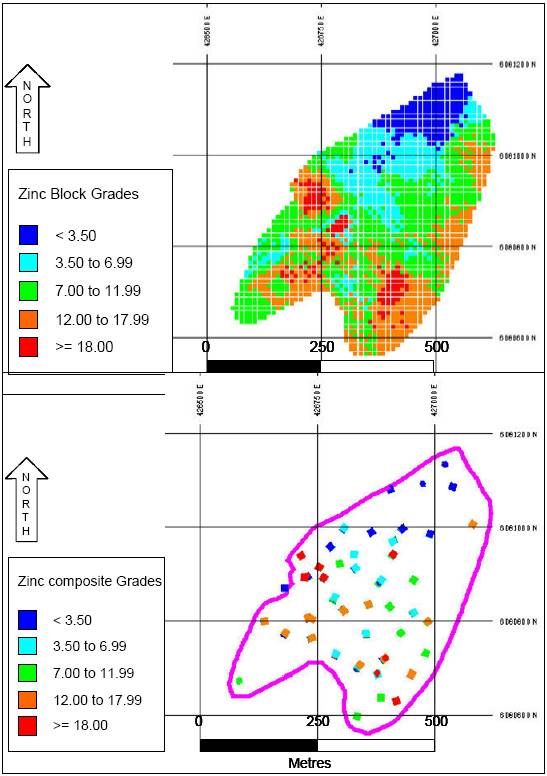
14.1.14 Method Comparison
The global block model estimation for the OK method was compared to the global estimation of the NN and IDW model values, as illustrated in Table 14-13.
TABLE 14-13 GLOBAL COMPARISON BY ESTIMATION METHOD
Method |
| Tonnes |
| Au (g/t) |
| Ag (g/t) |
| Cu (%) |
| Zn (%) |
| SG |
|
NN |
| 17,812,000 |
| 1.670 |
| 26.505 |
| 0.70 |
| 9.31 |
| 3.69 |
|
IDW |
| 18,049,000 |
| 1.645 |
| 26.568 |
| 0.71 |
| 9.29 |
| 3.73 |
|
OK |
| 17,864,000 |
| 1.665 |
| 26.348 |
| 0.69 |
| 8.99 |
| 3.68 |
|
All three methods have comparable results with only slight differences in grade and tonnage. The OK and NN methods in general have comparable results, with slightly lower tonnes and higher gold, silver and copper values for the NN method. This is common for comparisons of this type owing to the smoothing that usually occurs in an IDW or OK type of estimate. A comparison of the individual zones gave similar results.
14.1.15 Swath Plots
Swath plots were generated to assess the model for global bias by comparing OK values with NN and IDW values of the estimated blocks on elevation and north-south (northings) throughout the deposit (Figures 14-6 and 14-7). The IDW and OK models appear to show a smoothing of the grades compared to NN method. The swath plot results show a good comparison among the three methods, particularly within the main portions of the deposit as indicated by the tonnage graph. Grade estimates show the greatest differences along the interpreted mineralized boundaries with limited tonnes, and within areas of lower data density.
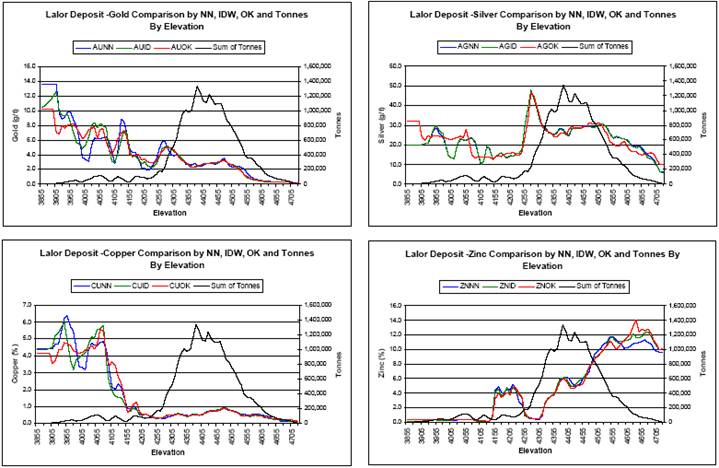
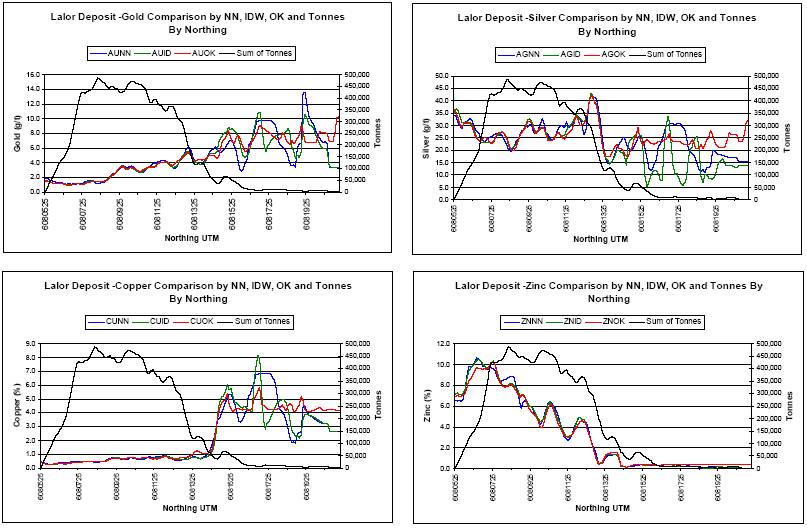
14.1.16 Comparison to October 2009 Mineral Resource Estimate
The October 2009 NI 43-101 compliant mineral resource estimate on the Lalor deposit reported an indicated mineral resource of 12.3 million tonnes and an inferred mineral resource of 5.0 million tonnes. This resource estimate included assay information from 58 parent and 31 wedge holes defining six stacked zones of zinc rich mineralization on the property. The 2011 mineral resource estimate of the zinc rich mineralization at Lalor includes assay information from 65 parent drill holes and 57 wedge holes defining the same six stacked zones of zinc rich mineralization with an indicated mineral resource of 14.0 million tonnes and an inferred mineral resource of 3.8 million tonnes. The estimates are category compared in Table 14-14 and 14-15.
TABLE 14-14 INDICATED COMPARISON OCTOBER 2009 TO OCTOBER 2011 ESTIMATES
Indicated Category |
| Tonnes |
| Au (g/t) |
| Ag (g/t) |
| Cu (%) |
| Zn (%) |
|
October 8, 2009 |
| 12.3 |
| 1.6 |
| 24.2 |
| 0.66 |
| 8.70 |
|
October 2011 |
| 14.0 |
| 1.8 |
| 27.5 |
| 0.71 |
| 8.96 |
|
TABLE 14-15 INFERRED COMPARISON OCTOBER 2009 TO OCTOBER 2011 ESTIMATES
Inferred Category |
| Tonnes |
| Au (g/t) |
| Ag (g/t) |
| Cu (%) |
| Zn (%) |
|
October 8, 2009 |
| 5.0 |
| 1.4 |
| 25.5 |
| 0.57 |
| 9.39 |
|
October 2011 |
| 3.8 |
| 1.2 |
| 22.2 |
| 0.60 |
| 9.09 |
|
The October 2011 base metal estimate increases the indicated resource by approximately 1.7 million tonnes and reduces the inferred by 1.2 million tonnes with minor changes in metal grade.
14.1.17 Mineral Resource Classification
Mineral resources have been classified according to the CIM Definition Standards on Mineral Resources and Mineral Reserves (CIM definitions), as incorporated in NI 43-101. Resource blocks are classified as Indicated or Inferred, depending upon the confidence level of the resource based on experience with similar base metal deposits and the spatial continuity of the mineralization. No measured resources have been defined to date.
Initial classification of the indicated resource is defined from the block model as follows:
· Blocks estimated in the second pass
· Blocks estimated by minimum of three composites from at least two drill holes
· �� Distance to closest composite is less than or equal to 50 m
Those blocks that fit the indicated resource criteria are reviewed in detail. Indicated resource blocks must be contiguous and these contiguous areas must be intersect with a minimum of two drill holes in order to eliminate the clustering of Indicated blocks surrounding one drill hole. This review resulted in reclassification of some of the proposed rndicated resources to inferred resources.
The remainder of the blocks within the interpreted Zones are classified as inferred resources. There were no blocks assigned to the measured resource category
The location of indicated and inferred resources for Zones 10, 20, 30 and 40, as well as the Inferred Resources for Zones 11 and 31 of the Lalor deposit are shown in Figures 14-8 to 14-13.
FIGURE 14-8 PLAN VIEW OF INDICATED AND INFERRED MINERAL RESOURCE FOR ZONE 10
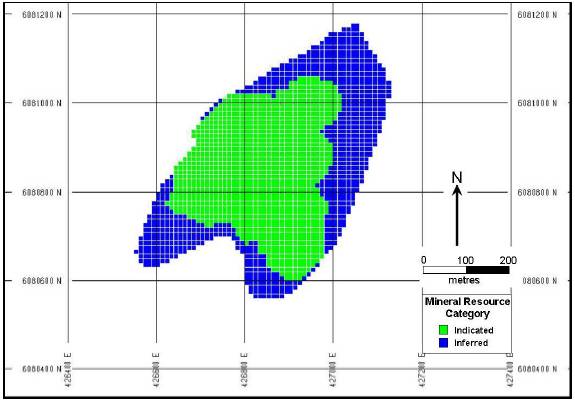
FIGURE 14-9 PLAN VIEW OF INFERRED MINERAL RESOURCE FOR ZONE 11

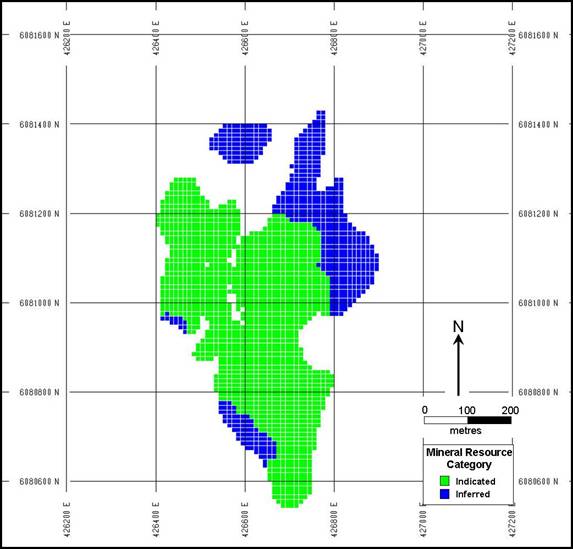
FIGURE 14-11 PLAN VIEW OF INDICATED AND INFERRED MINERAL RESOURCE FOR ZONE 30
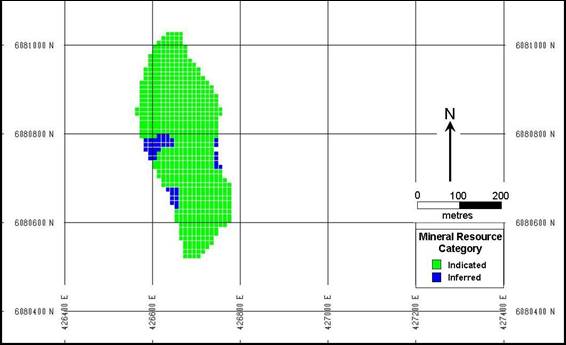
FIGURE 14-12 PLAN VIEW OF INFERRED MINERAL RESOURCE FOR ZONE 31
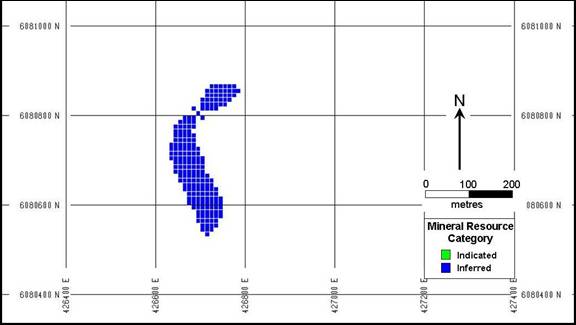
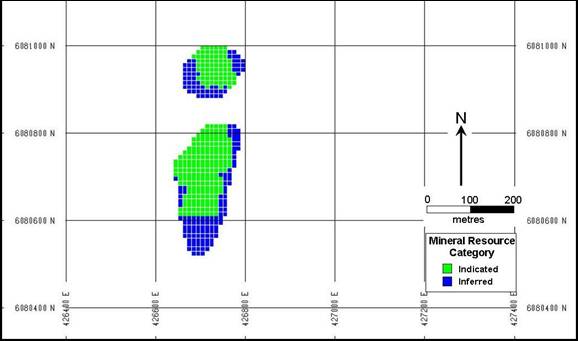
14.2 Gold Zone Resource
14.2.1 Gold Rich Mineral Resources Summary
The precious metal intersections of the Lalor gold zones contain low amounts of iron sulphide (4% to 5% on average) that is in the form of pyrite, pyrrhotite and chalcopyrite. Generally minor amounts of galena and sphalerite occur. The intersections display no distinct marker horizons other than being extensively altered to form rather exotic mineral assemblages. The gold mineralization associated with each zone was interpreted into three-dimensional wireframes based on a 1.0g/t gold cut-off over a minimum two metre interval.
The resource estimate was completed using MineSight 6.5 block modelling software in UTM NAD83 coordinates (MineSight). The block model was constrained by interpreted 3D wireframes of gold mineralized zones. Gold, silver, copper, zinc, lead, and iron grades and specific gravity were estimated into blocks using ordinary kriging (OK) interpolation.
14.2.2 Wireframe Models
Continued exploration since the October 2009 NI 43-101 technical report necessitated an update in all of the wireframe models produced for that report. The gold mineralization associated with each zone was interpreted into three-dimensional wireframes based on a 1.0g/t gold cut-off over a minimum two metre interval. The original models were sliced on 10m spacing along the original azimuth of 040°. These polyline slices were adjusted for the new drilling. The polylines were linked and triangulated to create new three-dimensional wireframe solids (see plan view showing mineralized outlines in Figure 14-14 and three dimensional views in Figures 14-5 and 14-6). These new wireframe models were then sliced in other directions for shape verification related to apparent plunge, strike and dip of the lenses. In general, the mineralization was projected either less than half the drill hole spacing or halfway to a low grade or unmineralized hole along the perimeter of the lens. Wireframe volumes and drilling information, shown in Table 14-16, have been validated in MineSight, with no errors.
The interpreted gold zones are generally co-parallel and are separate to the zinc rich base metal mineral resource zones. However, gold zones locally merge, overlap and cut through zinc rich base metal resources as is the case with gold Zones 21, 25 and 26.
Although the interpretation of Zones 21, 25 and 26 either merge, overlap or cut through zinc rich base metal zones the wireframes were intersected and any overlapping volume was removed from the corresponding gold zone. The block model was coded accordingly so there was no double counting of tonnes
TABLE 14-16 SUMMARY OF GOLD INTERPRETED WIREFRAMES
Gold |
| Volume (m3) |
| Average Thickness |
| Number of |
| Assayed |
| Volume |
|
21 |
| 1,283,000 |
| 8.7 |
| 76 |
| 758.62 |
| 17,000 |
|
24 |
| 107,000 |
| 4.9 |
| 10 |
| 58.75 |
| 11,000 |
|
25 |
| 1,678,000 |
| 9.8 |
| 75 |
| 830.27 |
| 22,000 |
|
26 |
| 276,000 |
| 6.4 |
| 21 |
| 170.29 |
| 13,000 |
|
27 |
| 482,000 |
| 8.1 |
| 13 |
| 120.58 |
| 37,000 |
|
28 |
| 172,000 |
| 9.8 |
| 11 |
| 92.07 |
| 16,000 |
|
Total |
| 3,998,000 |
|
|
|
|
| 2,030.58 |
|
|
|
The additional drilling since the October 2009 NI 43-101 technical report of the potential zone 21 and 25 estimate was mostly within the bounds of the previously interpreted lenses. As a result, there is very little change around the peripheries of the shapes, and most of the changes are thickness changes within the previous shapes. Increased drilling within and around the previous potential resource has lead to substantial changes of those shapes.
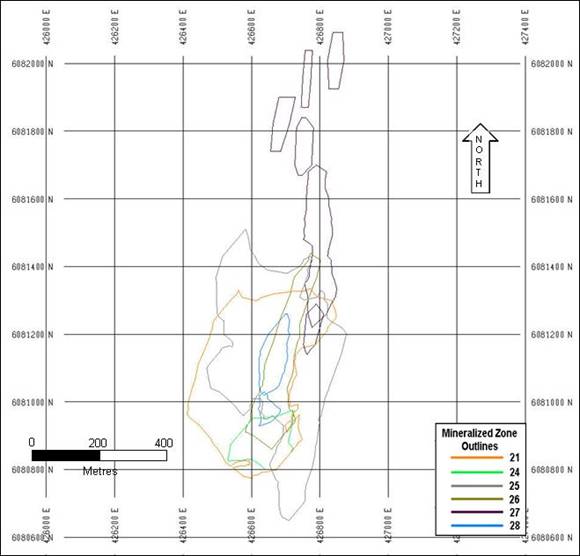

FIGURE 14-16 3D VIEW OF GOLD ZONES LOOKING 40° AZIMUTH
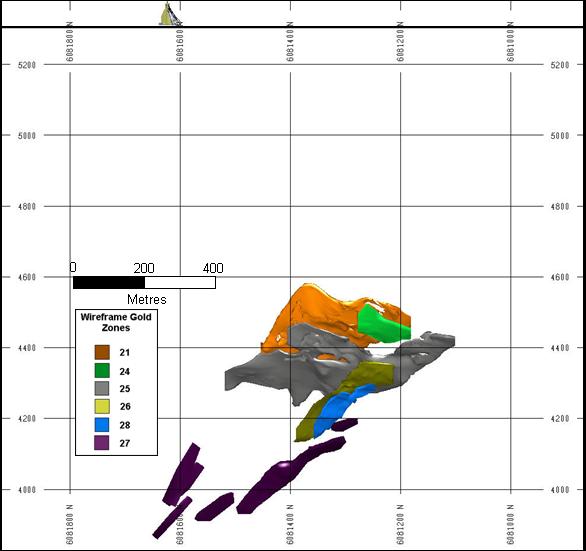
14.2.3 Bulk Density
Specific gravities were measured by Hudbay geologists and technicians on 46% of the sampled assay intervals included in the gold mineralization resource estimation for a total of 1,264 measurements. A summary of all the measured SG values incorporated into the resource estimation is displayed in Table 14-17.
TABLE 14-17 SUMMARY OF MEASURED SG VALUES
Zone |
| Count |
| Minimum |
| Maximum |
| Mean |
|
21 |
| 611 |
| 2.65 |
| 3.74 |
| 2.86 |
|
24 |
| 60 |
| 2.68 |
| 3.69 |
| 2.86 |
|
25 |
| 511 |
| 2.67 |
| 3.91 |
| 2.86 |
|
26 |
| 57 |
| 2.70 |
| 3.44 |
| 2.97 |
|
27 |
| 0 |
| 0.00 |
| 0.00 |
| 0.00 |
|
28 |
| 25 |
| 2.71 |
| 3.91 |
| 2.89 |
|
Total |
| 1,264 |
| 2.65 |
| 3.91 |
| 2.86 |
|
The measured SG values were compared to calculated stoichiometric values for each sample for confirmation. A simple XY plot of the comparison is shown in Figure 14-17 with a derived R2 value of 0.737, indicating a good correlation between the values. The stoichiometric method uses the assayed percentages of copper, zinc, lead, iron and arsenic to calculate the percentage of chalcopyrite, sphalerite, galena, pyrite and arsenopyrite, respectively, in each sample. Stoichiometric (calculated) density and proportions of each metal by mineral type are shown in Table 14-18. The percentage of elemental copper, zinc, lead and arsenic in each mineral is added, where the total for each sample must add to 100%, so the remainder (1 subtract total metals measured) was assumed to be gangue material with a 2.70 SG.
FIGURE 14-17 COMPARISON OF STOICHIOMETRIC CALCULATED AND MEASURED SG VALUES
TABLE 14-18 PROPORTION OF METAL IN MINERALS
|
|
|
| Chemical |
| Proportion of Metal in Minerals |
| ||||||||
Mineral |
| Density |
| Formula |
| Copper |
| Zinc |
| Lead |
| Iron |
| Arsenic |
|
Chalcopyrite |
| 4.2 |
| CuFeS2 |
| 0.346 |
| — |
| — |
| 0.304 |
| — |
|
Sphalerite |
| 4.0 |
| ZnS |
| — |
| 0.671 |
| — |
| — |
| — |
|
Galena |
| 7.5 |
| PbS |
| — |
| — |
| 0.866 |
| — |
| — |
|
Pyrrhotite |
| 4.6 |
| Fe1-x S |
| — |
| — |
| — |
| 0.635 |
| — |
|
Arsenopyrite |
| 6.0 |
| FeAsS |
| — |
| — |
| — |
| 0.343 |
| 0.460 |
|
Samples not SG measured were stoichiometrically calculated and results of the calculated values are shown in Table 14-19.
TABLE 14-19 SUMMARY OF STOICHIOMETRIC CALCULATED SG VALUES
Zone |
| Count |
| Minimum |
| Maximum |
| Mean |
|
21 |
| 447 |
| 2.72 |
| 3.85 |
| 2.89 |
|
24 |
| 11 |
| 2.75 |
| 3.92 |
| 2.91 |
|
25 |
| 566 |
| 2.72 |
| 3.52 |
| 2.85 |
|
26 |
| 171 |
| 2.73 |
| 3.60 |
| 2.95 |
|
27 |
| 168 |
| 2.74 |
| 4.03 |
| 3.05 |
|
28 |
| 92 |
| 2.72 |
| 3.52 |
| 2.84 |
|
Total |
| 1,455 |
| 2.72 |
| 3.79 |
| 2.84 |
|
14.2.4 Assay Statistics
A total of 3,235 mineralized assay intervals from 55 parent drill holes and 52 wedge offsets defining the zones of gold mineralization on the property. The remaining holes are located on the fringe of the deposit and are either not mineralized or contain weak mineralization not meeting the gold cut-off criteria, or were drilled for metallurgical purposes.
Samples were grouped according to their interpreted lens of gold mineralization into zones. Sample statistics of the assayed information are shown in Table 14-20. Data analysis was conducted by creating probability and histogram plots of the selected data as shown in Appendix 1.
TABLE 14-20 RANGE OF ASSAY VALUES BY GOLD ZONE
Au (g/t)
Zone |
| Number |
| Minimum |
| Maximum |
| Mean |
| Standard |
| Coefficient |
|
21 |
| 1481 |
| 0.00 |
| 768.93 |
| 9.22 |
| 37.36 |
| 13.61 |
|
24 |
| 71 |
| 0.09 |
| 122.06 |
| 6.74 |
| 16.99 |
| 2.52 |
|
25 |
| 1154 |
| 0.00 |
| 892.15 |
| 7.98 |
| 34.17 |
| 4.28 |
|
26 |
| 237 |
| 0.01 |
| 81.94 |
| 6.41 |
| 12.21 |
| 1.90 |
|
27 |
| 168 |
| 0.00 |
| 127.62 |
| 8.82 |
| 15.58 |
| 1.77 |
|
28 |
| 124 |
| 0.00 |
| 50.59 |
| 4.85 |
| 8.38 |
| 1.73 |
|
All |
| 3235 |
| 0.00 |
| 892.15 |
| 8.33 |
| 32.99 |
| 3.96 |
|
Continuation of Table 14-20
Ag (g/t)
Zone |
| Number |
| Minimum |
| Maximum |
| Mean |
| Standard |
| Coefficient |
|
21 |
| 1481 |
| 0.00 |
| 1074.00 |
| 46.67 |
| 82.59 |
| 2.98 |
|
24 |
| 71 |
| 0.00 |
| 266.74 |
| 34.29 |
| 53.41 |
| 1.56 |
|
25 |
| 1154 |
| 0.00 |
| 1164.00 |
| 36.46 |
| 81.63 |
| 2.24 |
|
26 |
| 237 |
| 0.00 | �� | 407.66 |
| 40.48 |
| 57.85 |
| 1.43 |
|
27 |
| 168 |
| 0.00 |
| 122.00 |
| 23.97 |
| 32.19 |
| 1.34 |
|
28 |
| 124 |
| 0.00 |
| 246.17 |
| 23.52 |
| 43.60 |
| 1.85 |
|
All |
| 3235 |
| 0.00 |
| 1164.00 |
| 40.24 |
| 77.32 |
| 1.92 |
|
Cu (%)
Zone |
| Number |
| Minimum |
| Maximum |
| Mean |
| Standard |
| Coefficient |
|
21 |
| 1481 |
| 0.00 |
| 14.40 |
| 1.08 |
| 1.82 |
| 23.49 |
|
24 |
| 71 |
| 0.00 |
| 1.94 |
| 0.34 |
| 0.41 |
| 1.20 |
|
25 |
| 1154 |
| 0.00 |
| 8.69 |
| 0.37 |
| 0.75 |
| 2.04 |
|
26 |
| 237 |
| 0.00 |
| 8.40 |
| 0.80 |
| 1.32 |
| 1.64 |
|
27 |
| 168 |
| 0.02 |
| 20.38 |
| 4.64 |
| 5.39 |
| 1.16 |
|
28 |
| 124 |
| 0.00 |
| 6.99 |
| 0.56 |
| 1.16 |
| 2.06 |
|
All |
| 3235 |
| 0.00 |
| 20.38 |
| 0.95 |
| 2.06 |
| 2.17 |
|
Zn (%)
Zone |
| Number |
| Minimum |
| Maximum |
| Mean |
| Standard |
| Coefficient |
|
21 |
| 1481 |
| 0.00 |
| 32.87 |
| 2.36 |
| 4.91 |
| 71.67 |
|
24 |
| 71 |
| 0.00 |
| 21.08 |
| 1.86 |
| 3.46 |
| 1.86 |
|
25 |
| 1154 |
| 0.00 |
| 38.74 |
| 1.10 |
| 3.27 |
| 2.97 |
|
26 |
| 237 |
| 0.00 |
| 5.90 |
| 0.48 |
| 0.96 |
| 2.00 |
|
27 |
| 168 |
| 0.00 |
| 1.67 |
| 0.30 |
| 0.37 |
| 1.23 |
|
28 |
| 124 |
| 0.00 |
| 24.80 |
| 0.54 |
| 2.41 |
| 4.50 |
|
All |
| 3235 |
| 0.00 |
| 38.74 |
| 1.59 |
| 4.00 |
| 2.52 |
|
Continuation of Table 14-20
Pb (%)
Zone |
| Number |
| Minimum |
| Maximum |
| Mean |
| Standard |
| Coefficient |
|
21 |
| 1481 |
| 0.00 |
| 12.92 |
| 0.25 |
| 0.76 |
| 2.05 |
|
24 |
| 71 |
| 0.00 |
| 6.58 |
| 0.45 |
| 0.99 |
| 2.21 |
|
25 |
| 1154 |
| 0.00 |
| 25.15 |
| 0.32 |
| 1.13 |
| 3.49 |
|
26 |
| 237 |
| 0.00 |
| 7.23 |
| 0.38 |
| 0.95 |
| 2.50 |
|
27 |
| 168 |
| 0.00 |
| 1.53 |
| 0.02 |
| 0.12 |
| 5.42 |
|
28 |
| 124 |
| 0.00 |
| 1.94 |
| 0.05 |
| 0.20 |
| 3.72 |
|
All |
| 3235 |
| 0.00 |
| 25.15 |
| 0.27 |
| 0.90 |
| 3.35 |
|
Fe (%)
Zone |
| Number |
| Minimum |
| Maximum |
| Mean |
| Standard |
| Coefficient |
|
21 |
| 1481 |
| 0.00 |
| 39.07 |
| 8.43 |
| 8.43 |
| 5.73 |
|
24 |
| 71 |
| 0.77 |
| 34.94 |
| 5.35 |
| 7.14 |
| 1.33 |
|
25 |
| 1154 |
| 0.27 |
| 34.74 |
| 4.60 |
| 4.63 |
| 1.01 |
|
26 |
| 237 |
| 1.12 |
| 30.65 |
| 6.86 |
| 5.36 |
| 0.78 |
|
27 |
| 168 |
| 1.36 |
| 32.39 |
| 8.85 |
| 7.39 |
| 0.83 |
|
28 |
| 124 |
| 0.64 |
| 36.26 |
| 5.12 |
| 5.64 |
| 1.10 |
|
All |
| 3235 |
| 0.00 |
| 39.07 |
| 6.65 |
| 7.09 |
| 1.07 |
|
SG
Zone |
| Number |
| Minimum |
| Maximum |
| Mean |
| Standard |
| Coefficient |
|
21 |
| 1481 |
| 2.65 |
| 5.07 |
| 3.05 |
| 0.43 |
| 0.16 |
|
24 |
| 71 |
| 2.68 |
| 3.92 |
| 2.86 |
| 0.22 |
| 0.08 |
|
25 |
| 1154 |
| 2.67 |
| 4.65 |
| 2.90 |
| 0.24 |
| 0.08 |
|
26 |
| 237 |
| 2.70 |
| 3.82 |
| 2.97 |
| 0.19 |
| 0.06 |
|
27 |
| 168 |
| 2.74 |
| 4.03 |
| 3.05 |
| 0.32 |
| 0.10 |
|
28 |
| 124 |
| 2.71 |
| 3.79 |
| 2.89 |
| 0.21 |
| 0.07 |
|
All |
| 3235 |
| 2.65 |
| 5.07 |
| 2.98 |
| 0.35 |
| 0.12 |
|
14.2.5 Capping of High Grades
In order to avoid any disproportionate influence of random, anomalously high grade assays on the resource average grade, histograms, cumulative frequency log probability charts, cutting curves, and decile analysis charts were created to examine the assay grade distribution within the zinc rich mineralized lenses and assess the need for grade capping. Skewness and high-grade outliers to the distribution can lead to overestimation of average
grades unless some means of moderating the effect of the highest grade samples is applied. A common method for accomplishing this is by top cutting (or cap) high assays at some predetermined level prior to grade estimation. In reviewing the assay statistics by zone it was decided to cap high grade gold assays for each zone, while the high grade silver assays were capped for Zones 10, 11, 20, 30 and 31. The capped value and the number of affected assays are shown in Table 14-21. High-grade assays were capped prior to compositing.
TABLE 14-21 HIGH GRADE CAPPING SUMMARY
Au (g/t)
Zone |
| Capped Value |
| Number of Samples |
| % of Samples Capped |
|
21 |
| 32.5 |
| 89 |
| 6.01 | % |
24 |
| 17.5 |
| 6 |
| 8.45 | % |
25 |
| 30 |
| 58 |
| 5.03 | % |
26 |
| 30 |
| 10 |
| 4.20 | % |
27 |
| 32.5 |
| 10 |
| 5.92 | % |
28 |
| 22 |
| 6 |
| 4.80 | % |
All |
|
|
| 179 |
| 5.53 | % |
Ag (g/t)
Zone |
| Capped Value |
| Number of Samples |
| % of Samples |
|
21 |
| 300 |
| 28 |
| 1.89 | % |
24 |
| 130 |
| 5 |
| 7.04 | % |
25 |
| 250 |
| 33 |
| 2.86 | % |
26 |
| 200 |
| 6 |
| 2.52 | % |
27 |
| 100 |
| 7 |
| 4.14 | % |
28 |
| 100 |
| 6 |
| 4.80 | % |
All |
|
|
| 85 |
| 2.63 | % |
Continuation of Table 14-21
Cu (%)
Zone |
| Capped Value |
| Number of Samples |
| % of Samples |
|
21 |
| 7 |
| 35 |
| 2.36 | % |
24 |
| 1 |
| 7 |
| 9.86 | % |
25 |
| 3.5 |
| 10 |
| 0.87 | % |
26 |
| 5.5 |
| 5 |
| 2.10 | % |
27 |
| 19 |
| 3 |
| 1.78 | % |
28 |
| 3.2 |
| 5 |
| 4.00 | % |
All |
|
|
| 65 |
| 2.01 | % |
Zn (%)
Zone |
| Capped Value |
| Number of Samples |
| % of Samples |
|
21 |
| 9 |
| 127 |
| 8.58 | % |
24 |
| 6 |
| 6 |
| 8.45 | % |
25 |
| 8 |
| 48 |
| 4.16 | % |
26 |
| 3.5 |
| 7 |
| 2.94 | % |
27 |
| 1.4 |
| 1 |
| 0.59 | % |
28 |
| 2 |
| 5 |
| 4.00 | % |
All |
|
|
| 194 |
| 5.99 | % |
Pb (%)
Zone |
| Capped Value |
| Number of Samples |
| % of Samples |
|
21 |
| 4.4 |
| 7 |
| 0.47 | % |
24 |
| 2.1 |
| 3 |
| 4.23 | % |
25 |
| 4.5 |
| 13 |
| 1.13 | % |
26 |
| 4 |
| 3 |
| 1.26 | % |
27 |
| 0.6 |
| 1 |
| 0.59 | % |
28 |
| 0.6 |
| 1 |
| 0.80 | % |
All |
|
|
| 28 |
| 0.86 | % |
Fe (%)
Zone |
| Capped Value |
| Number of Samples |
| % of Samples |
|
21 |
| 28 |
| 80 |
| 5.40 | % |
24 |
| 13 |
| 5 |
| 7.04 | % |
25 |
| 23 |
| 18 |
| 1.56 | % |
26 |
| 24 |
| 5 |
| 2.10 | % |
27 |
| 26 |
| 6 |
| 3.55 | % |
28 |
| 16 |
| 6 |
| 4.80 | % |
All |
|
|
| 120 |
| 3.71 | % |
Continuation of Table 14-21
SG
Zone |
| Capped Value |
| Number of Samples |
| % of Samples |
|
21 |
| 3.9 |
| 128 |
| 8.64 | % |
24 |
| 3.2 |
| 4 |
| 5.63 | % |
25 |
| 3.7 |
| 27 |
| 2.34 | % |
26 |
| 3.7 |
| 2 |
| 0.84 | % |
27 |
| 3.9 |
| 3 |
| 1.78 | % |
28 |
| 3.6 |
| 3 |
| 2.40 | % |
All |
|
|
| 167 |
| 5.16 | % |
14.2.6 Composites
After capping, assay samples were weighted by SG and composited into two metre downhole lengths while honouring the interpreted mineralized zone boundaries. Compositing of downhole assays results in a fractional length for the last sample in a given zone. Where this length is less than one metre, it was average weighted with the adjacent up-the-hole composite. Table 14-22 shows the composite summary information by zone and metal type used in estimating the resource. Data analysis was conducted by creating probability and histogram plots of the selected data as shown in Appendix 2.
TABLE 14-22 COMPOSITE STATISTICS BY GOLD MINERALIZED ZONE
Au (g/t)
Zone |
| Number |
| Minimum |
| Maximum |
| Mean |
| Standard |
| Coefficient |
|
21 |
| 526 |
| 0.05 |
| 32.50 |
| 5.22 |
| 5.21 |
| 1.00 |
|
24 |
| 30 |
| 0.55 |
| 14.80 |
| 4.06 |
| 3.42 |
| 0.84 |
|
25 |
| 449 |
| 0.04 |
| 25.74 |
| 4.54 |
| 4.77 |
| 1.05 |
|
26 |
| 89 |
| 0.08 |
| 30.00 |
| 5.15 |
| 5.55 |
| 1.08 |
|
27 |
| 60 |
| 0.14 |
| 27.54 |
| 7.30 |
| 6.44 |
| 0.88 |
|
28 |
| 45 |
| 0.17 |
| 18.43 |
| 5.87 |
| 5.75 |
| 0.98 |
|
All |
| 1199 |
| 0.04 |
| 32.50 |
| 4.99 |
| 5.10 |
| 1.02 |
|
Continuation of Table 14-22
Ag (g/t)
Zone |
| Number |
| Minimum |
| Maximum |
| Mean |
| Standard |
| Coefficient |
|
21 |
| 526 |
| 0.00 |
| 240.83 |
| 37.82 |
| 40.18 |
| 1.06 |
|
24 |
| 30 |
| 1.54 |
| 130.00 |
| 26.89 |
| 30.84 |
| 1.15 |
|
25 |
| 449 |
| 0.00 |
| 249.31 |
| 28.03 |
| 41.16 |
| 1.47 |
|
26 |
| 89 |
| 0.00 |
| 163.95 |
| 36.25 |
| 36.50 |
| 1.01 |
|
27 |
| 60 |
| 0.00 |
| 99.39 |
| 23.01 |
| 24.11 |
| 1.05 |
|
28 |
| 45 |
| 0.00 |
| 93.71 |
| 20.53 |
| 23.07 |
| 1.12 |
|
All |
| 1199 |
| 0.00 |
| 249.31 |
| 32.25 |
| 39.27 |
| 1.22 |
|
Cu (%)
Zone |
| Number |
| Minimum |
| Maximum |
| Mean |
| Standard |
| Coefficient |
|
21 |
| 404 |
| 0.00 |
| 6.04 |
| 0.53 |
| 0.75 |
| 1.41 |
|
24 |
| 30 |
| 0.02 |
| 0.84 |
| 0.28 |
| 0.21 |
| 0.76 |
|
25 |
| 431 |
| 0.00 |
| 3.42 |
| 0.29 |
| 0.41 |
| 1.41 |
|
26 |
| 87 |
| 0.00 |
| 3.67 |
| 0.68 |
| 0.81 |
| 1.19 |
|
27 |
| 60 |
| 0.06 |
| 17.65 |
| 4.61 |
| 4.39 |
| 0.95 |
|
28 |
| 45 |
| 0.01 |
| 2.41 |
| 2.82 |
| 3.93 |
| 1.39 |
|
All |
| 1057 |
| 0.00 |
| 17.65 |
| 0.66 |
| 1.54 |
| 2.33 |
|
Zn (%)
Zone |
| Number |
| Minimum |
| Maximum |
| Mean |
| Standard |
| Coefficient |
|
21 |
| 404 |
| 0.00 |
| 7.76 |
| 0.46 |
| 0.85 |
| 1.84 |
|
24 |
| 30 |
| 0.00 |
| 4.35 |
| 1.15 |
| 1.14 |
| 1.00 |
|
25 |
| 431 |
| 0.00 |
| 5.09 |
| 0.40 |
| 0.74 |
| 1.87 |
|
26 |
| 87 |
| 0.00 |
| 3.50 |
| 0.38 |
| 0.57 |
| 1.48 |
|
27 |
| 60 |
| 0.00 |
| 1.15 |
| 0.30 |
| 0.29 |
| 0.96 |
|
28 |
| 45 |
| 0.00 |
| 1.65 |
| 0.28 |
| 0.34 |
| 1.21 |
|
All |
| 1057 |
| 0.00 |
| 7.76 |
| 0.43 |
| 0.77 |
| 1.79 |
|
Continuation of Table 14-22
Pb (%)
Zone |
| Number |
| Minimum |
| Maximum |
| Mean |
| Standard |
| Coefficient |
|
21 |
| 404 |
| 0.00 |
| 2.67 |
| 0.20 |
| 0.40 |
| 1.98 |
|
24 |
| 30 |
| 0.00 |
| 2.10 |
| 0.34 |
| 0.56 |
| 1.68 |
|
25 |
| 431 |
| 0.00 |
| 4.50 |
| 0.23 |
| 0.56 |
| 2.41 |
|
26 |
| 87 |
| 0.00 |
| 3.03 |
| 0.35 |
| 0.64 |
| 1.82 |
|
27 |
| 60 |
| 0.00 |
| 0.14 |
| 0.01 |
| 0.02 |
| 1.70 |
|
28 |
| 45 |
| 0.00 |
| 0.52 |
| 0.03 |
| 0.07 |
| 2.76 |
|
All |
| 1057 |
| 0.00 |
| 4.50 |
| 0.21 |
| 0.49 |
| 2.28 |
|
Fe (%)
Zone |
| Number |
| Minimum |
| Maximum |
| Mean |
| Standard |
| Coefficient |
|
21 |
| 404 |
| 0.67 |
| 25.74 |
| 4.52 |
| 2.98 |
| 0.66 |
|
24 |
| 30 |
| 1.18 |
| 11.68 |
| 3.99 |
| 2.93 |
| 0.73 |
|
25 |
| 431 |
| 0.49 |
| 16.62 |
| 3.77 |
| 2.47 |
| 0.66 |
|
26 |
| 87 |
| 1.64 |
| 20.35 |
| 6.40 |
| 3.95 |
| 0.62 |
|
27 |
| 60 |
| 1.70 |
| 25.14 |
| 8.68 |
| 5.81 |
| 0.67 |
|
28 |
| 45 |
| 1.09 |
| 15.49 |
| 6.93 |
| 5.17 |
| 0.75 |
|
All |
| 1057 |
| 0.49 |
| 25.74 |
| 4.59 |
| 3.34 |
| 0.73 |
|
SG
Zone |
| Number |
| Minimum |
| Maximum |
| Mean |
| Standard |
| Coefficient |
|
21 |
| 404 |
| 2.68 |
| 3.64 |
| 2.86 |
| 0.12 |
| 0.04 |
|
24 |
| 30 |
| 2.70 |
| 3.10 |
| 2.83 |
| 0.11 |
| 0.04 |
|
25 |
| 431 |
| 2.68 |
| 3.35 |
| 2.85 |
| 0.11 |
| 0.04 |
|
26 |
| 87 |
| 2.71 |
| 3.40 |
| 2.95 |
| 0.14 |
| 0.05 |
|
27 |
| 60 |
| 2.76 |
| 3.82 |
| 3.04 |
| 0.25 |
| 0.08 |
|
28 |
| 45 |
| 2.74 |
| 3.54 |
| 2.97 |
| 0.23 |
| 0.08 |
|
All |
| 1057 |
| 2.68 |
| 3.82 |
| 2.87 |
| 0.14 |
| 0.05 |
|
14.2.7 Composite Restriction
A review of the probability and histogram plots from the composite data showed some high grade values were spatially discontinuous from the remainder of the data set and there was justification of restricting these higher grade values by limiting their search distance.
The high grade values shown in Table 14-23 were restricted to a 45m influence for grade interpolation, which is approximately the global average drill hole spacing.
TABLE 14-23 HIGH GRADE COMPOSITE RESTRICTION SUMMARY
Au g/t
Zone |
| Restricted Value |
| Number of samples |
| % Samples Restricted |
|
21 |
| 24 |
| 1 |
| 1.3 | % |
24 |
| 7 |
| 4 |
| 13.3 | % |
25 |
| 21 |
| 4 |
| 0.9 | % |
26 |
| 19 |
| 2 |
| 2.3 | % |
27 |
| 18 |
| 4 |
| 5.1 | % |
28 |
| 10 |
| 3 |
| 6.7 | % |
ALL |
|
|
| 18 |
| 1.5 | % |
Ag (g/t)
Zone |
| Restricted Value |
| Number of samples |
| % Samples Restricted |
|
21 |
| 140 |
| 17 |
| 3.4 | % |
24 |
| 35 |
| 5 |
| 16.7 | % |
25 |
| 125 |
| 17 |
| 3.8 | % |
26 |
| 125 |
| 3 |
| 3.4 | % |
27 |
| 60 |
| 4 |
| 5.1 | % |
28 |
| 50 |
| 4 |
| 8.9 | % |
ALL |
|
|
| 50 |
| 4.1 | % |
Cu %
Zone |
| Restricted Value |
| Number of samples |
| % Samples Restricted |
|
21 |
| 4.25 |
| 3 |
| 0.5 | % |
24 |
| 0.6 |
| 3 |
| 10.0 | % |
25 |
| 1.75 |
| 3 |
| 0.7 | % |
26 |
| 3 |
| 2 |
| 2.3 | % |
27 |
| 10.5 |
| 7 |
| 9.0 | % |
28 |
| 1 |
| 4 |
| 8.9 | % |
ALL |
|
|
| 22 |
| 1.8 | % |
Continuation of Table 14-23
Zn %
Zone |
| Restricted Value |
| Number of samples |
| % Samples Restricted |
|
21 |
| 5 |
| 1 |
| 0.3 | % |
24 |
| 3 |
| 3 |
| 10.0 | % |
25 |
| 3.25 |
| 6 |
| 1.4 | % |
26 |
| 1.5 |
| 4 |
| 4.6 | % |
27 |
| 0.9 |
| 4 |
| 5.1 | % |
28 |
| 0.6 |
| 5 |
| 11.1 | % |
ALL |
|
|
| 23 |
| 1.9 | % |
Pb %
Zone |
| Restricted Value |
| Number of samples |
| % Samples Restricted |
|
21 |
| 2 |
| 4 |
| 1.0 | % |
24 |
| 0.4 |
| 5 |
| 16.7 | % |
25 |
| 3.2 |
| 2 |
| 0.5 | % |
26 |
| 1.8 |
| 4 |
| 4.6 | % |
27 |
| 0.07 |
| 2 |
| 2.6 | % |
28 |
| 0.2 |
| 4 |
| 8.9 | % |
ALL |
|
|
| 21 |
| 1.7 | % |
Fe %
Zone |
| Restricted Value |
| Number of samples |
| % Samples Restricted |
|
21 |
| 18 |
| 4 |
| 1.0 | % |
24 |
| 10 |
| 2 |
| 6.7 | % |
25 |
| 12 |
| 5 |
| 1.1 | % |
26 |
| none |
| 0 |
| 0.0 | % |
27 |
| 18 |
| 7 |
| 9.0 | % |
28 |
| 7 |
| 6 |
| 13.3 | % |
ALL |
|
|
| 24 |
| 2.0 | % |
SG
Zone |
| Restricted Value |
| Number of samples |
| % Samples Restricted |
|
21 |
| 3.3 |
| 4 |
| 1.0 | % |
24 |
| 3.1 |
| 1 |
| 3.3 | % |
25 |
| none |
| 0 |
| 0.0 | % |
26 |
| none |
| 0 |
| 0.0 | % |
27 |
| 3.5 |
| 5 |
| 6.4 | % |
28 |
| 3 |
| 5 |
| 11.1 | % |
ALL |
|
|
| 15 |
| 1.2 | % |
14.2.8 Mineralization Continuity and Variography
Correlograms, using MineSight software, were completed on the gold, silver, copper, zinc, lead, iron and SG composites. Combined composite data from Zones 21, 25 and 26 were used in the correlograms, as well as combined composite data from Zones 24, 27 and 28. The reason for combining composites from zones for the variography process was to increase the number of composites from like mineralization and as a result get a better feel for the spatial continuity. Zones 21, 25 and 26 have a similar mineralized trend, whereas Zones 24, 27 and 28 have similarities. Prior to combining the composites they were spatially moved so pairs between the zones were not developed.
Correlograms were generated to determine the orientation and spatial continuity of the composited mineralization and bulk density. A summary of the results is shown in Table 14-24, with plots presented in Appendix 3.
TABLE 14-24 LALOR GOLD VARIOGRAPHY PARAMETERS
|
|
|
|
|
|
|
|
|
|
|
|
|
| Rotation Angles |
| ||||
|
|
|
|
|
| Sill |
| Range (m) |
| (LRL Rule) |
| ||||||||
Zone |
| Component |
| Nugget |
| 1 |
| 2 |
| 1 |
| 2 |
| Z- |
| X-Axis |
| Y- |
|
|
| Gold |
| 0.59 |
| 0.33 |
| 0.07 |
| 13 |
| 51 |
| 30° |
| -20° |
| -20° |
|
|
| Silver |
| 0.42 |
| 0.37 |
| 0.21 |
| 67 |
| 87 |
| 30° |
| -20° |
| -20° |
|
|
| Copper |
| 0.44 |
| 0.20 |
| 0.35 |
| 13 |
| 77 |
| 30° |
| -20° |
| -20° |
|
|
| Zinc |
| 0.53 |
| 0.22 |
| 0.24 |
| 39 |
| 53 |
| 30° |
| -20° |
| -20° |
|
|
| Lead |
| 0.32 |
| 0.21 |
| 0.47 |
| 66 |
| 105 |
| 30° |
| -20° |
| -20° |
|
21, 25 |
| Iron |
| 0.29 |
| 0.34 |
| 0.35 |
| 18 |
| 74 |
| 30° |
| -20° |
| -20° |
|
and 26 |
| SG |
| 0.28 |
| 0.37 |
| 0.34 |
| 13 |
| 82 |
| 30° |
| -20° |
| -20° |
|
|
|
|
|
|
|
|
|
|
|
|
|
|
|
|
|
|
|
|
|
|
| Gold |
| 0.44 |
| 0.29 |
| 0.40 |
| 25 |
| 113 |
| 0° |
| -20° |
| -20° |
|
|
| Silver |
| 0.27 |
| 0.52 |
| 0.15 |
| 11 |
| 72 |
| 0° |
| -20° |
| -20° |
|
|
| Copper |
| 0.19 |
| 0.38 |
| 0.18 |
| 10 |
| 38 |
| 0° |
| -20° |
| -20° |
|
|
| Zinc |
| 0.27 |
| 0.39 |
| 0.23 |
| 11 |
| 34 |
| 0° |
| -20° |
| -20° |
|
|
| Lead |
| 0.24 |
| 0.34 |
| 0.17 |
| 14 |
| 33 |
| 0° |
| -20° |
| -20° |
|
24, 27 |
| Iron |
| 0.19 |
| 0.31 |
| 0.50 |
| 14 |
| 71 |
| 0° |
| -20° |
| -20° |
|
and 28 |
| SG |
| 0.20 |
| 0.39 |
| 0.40 |
| 3 |
| 76 |
| 0° |
| -20° |
| -20° |
|
14.2.9 Resource Block Model
One three-dimensional block model was constructed that contained all zones of mineralization using MineSight on UTM NAD83 coordinates. The origin of the model is 427,320m east, 6,082,500m north, and 4,840m relative elevation. Block dimensions of 10m
by 10m by 10m were selected based on the average width of the resource wireframes, as well anticipation of the smallest mining unit based on the current underground mining practices at the Chisel North Mine. Block model geometry and parameters are provided in Table 14-25. The model encompasses a volume of 21 billion m3 and extends to 3,800 elevation (1,510 m below shaft collar).
TABLE 14-25 BLOCK MODEL GEOMETRIES
|
| Number of |
|
|
| Model Limits (UTM NAD83) |
| ||
Coordinate |
| Blocks |
| Block Size (m) |
| Minimum |
| Maximum |
|
X — East |
| 98 |
| 10 |
| 426,340 |
| 427,320 |
|
Y — North |
| 213 |
| 10 |
| 6,080,370 |
| 6,082,500 |
|
Z — Elevation |
| 104 |
| 10 |
| 3,800 |
| 4,840 |
|
14.2.10 Interpolation Plan
The interpolation of the Lalor gold zones resource estimation model was completed on the capped composites using restriction searches to a distance of 45m by the following estimation methods: nearest neighbour (NN), inverse distance squared weighted (IDW) and ordinary kriging (OK).
The estimates using NN and two iterations using IDW and OK were completed on each zone. The first iteration was designed to estimate a block using the search distance parameters and minimum number of composites when the criteria in Table 14-26 were met. The second pass reduced the search distance and increased the minimum number of composites
TABLE 14-26 SEARCH PARAMETERS GOLD
|
|
|
| Search Ellipse Distances (m) |
| Number of Composites |
| ||||||||
Pass |
| Zone |
| Major |
| Minor |
| Vertical |
| Minimum |
| Maximum |
| Per Drill |
|
|
| 21 |
| 150 |
| 100 |
| 50 |
| 5 |
| 15 |
| 4 |
|
|
| 25 |
| 150 |
| 100 |
| 50 |
| 5 |
| 15 |
| 4 |
|
|
| 24 |
| 250 |
| 100 |
| 100 |
| 1 |
| 9 |
| 2 |
|
First |
| 26 |
| 150 |
| 100 |
| 50 |
| 4 |
| 12 |
| 3 |
|
|
| 27 |
| 500 |
| 300 |
| 150 |
| 1 |
| 12 |
| 3 |
|
|
| 28 |
| 250 |
| 100 |
| 100 |
| 3 |
| 15 |
| 4 |
|
|
|
|
|
|
|
|
|
|
|
|
|
|
|
|
|
|
| 21 |
| 75 |
| 50 |
| 25 |
| 8 |
| 15 |
| 4 |
|
|
| 25 |
| 75 |
| 50 |
| 25 |
| 8 |
| 15 |
| 4 |
|
Second |
| 24 |
| 125 |
| 50 |
| 25 |
| 3 |
| 9 |
| 2 |
|
|
| 26 |
| 75 |
| 50 |
| 25 |
| 6 |
| 12 |
| 3 |
|
|
| 27 |
| 500 |
| 300 |
| 150 |
| 4 |
| 12 |
| 3 |
|
|
| 28 |
| 125 |
| 50 |
| 25 |
| 5 |
| 15 |
| 4 |
|
Rotation angles for the ellipsoid were derived from the variography process, which closely resembles the average strike and dip of the zones. The major search distance is parallel to the plunge of the mineralization, the minor search distance is parallel to the strike of the mineralization, and the vertical search distance corresponds to the thickness of the mineralization.
14.2.11 Block Model Validation
The Lalor Gold Zone resource estimate was validated by the following methods:
· Inspection of the OK block model grades in plan and section views in comparison to the drill hole grades
· Comparison of the global mean grades based on NN, IDW and OK estimation methods
· Swath plot comparisons of the estimation methods
· Comparison to October 2009 mineral resource estimate.
14.2.12 Visual Comparison
The block models were checked in plan and section views to compare block grades with the drill hole grades, and ensure that the interpolation honoured the composites. The visual comparisons of block grades with composite grades of the gold, silver, copper and zinc showed a good correlation between the values (example shown in Figure 14-18).
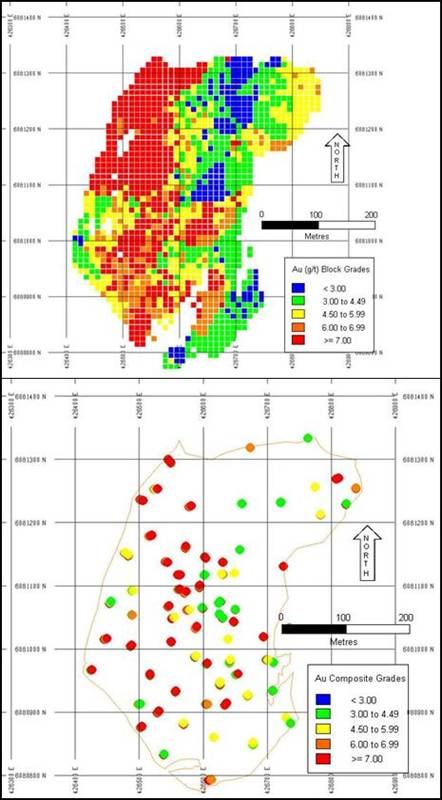
14.2.13 Method Comparison
The global block model estimation for the OK method was compared to the global estimation of the NN and IDW model values, as illustrated in Table 14-27.
TABLE 14-27 GLOBAL COMPARISON BY ESTIMATION METHOD
Method |
| Tonnes |
| Au (g/t) |
| Ag (g/t) |
| Cu (%) |
| Zn (%) |
| SG |
|
NN |
| 11,508,000 |
| 4.825 |
| 28.726 |
| 0.85 |
| 0.36 |
| 2.88 |
|
IDW |
| 11,516,000 |
| 4.840 |
| 27.674 |
| 0.85 |
| 0.35 |
| 2.88 |
|
OK |
| 11,527,000 |
| 4.835 |
| 27.800 |
| 0.88 |
| 0.34 |
| 2.89 |
|
The OK and IDW methods provide similar results with only a slight grade difference. The OK and NN methods in general have comparable results, with slightly lower tonnes and higher silver and zinc values for the NN method. This is common for comparisons of this type owing to the smoothing that usually occurs in an IDW or OK type of estimate. A comparison of the individual zones gave similar results.
14.2.14 Swath Plots
The Swath plots discussed earlier were used for the Gold zones as well (Figures 14-6 and 14-7).
14.2.15 Comparison to October 2009 Mineral Resource Estimate
The October 2009 NI 43-101 compliant mineral resource estimate on the Lalor deposit reported all gold zones as potential with an expectation of 10.6 to 12.0 million tonnes. This conceptual estimate included assay information from 45 parent and 21 wedge holes defining six stacked zones of gold mineralization on the property.
The 2011 mineral resource estimate of the gold mineralization at Lalor includes assay information from 55 parent drill holes and 52 wedge holes defining the same six stacked zones of gold mineralization with an indicated mineral resource of 2.7 million tonnes and an inferred mineral resource of 8.8 million tonnes
14.2.16 Mineral Resource Classification
Mineral resources have been classified according to the CIM Definition Standards on Mineral Resources and Mineral Reserves (CIM definitions), as incorporated in NI 43-101. Resource blocks are classified as Indicated or Inferred, depending upon the confidence level of the resource based on experience with similar deposits and the spatial continuity of the mineralization. No Measured Resources have been defined to date.
Initial classification of the Indicated Resource is defined from the block model as follows:
· Blocks estimated in the second pass
· Blocks estimated by minimum of three composites from at least two drill holes
· Distance to closest composite is less than or equal to 50 m
Those blocks that fit the Indicated Resource criteria are reviewed in detail. Indicated Resource blocks must be contiguous and these contiguous areas must be intersect with a minimum of two drill holes in order to eliminate the clustering of Indicated blocks surrounding one drill hole. This review resulted in reclassification of some of the proposed Indicated Resources to Inferred.
The remainder of the blocks within the interpreted Zones are classified as Inferred Resources. There were no blocks assigned to the Measured category
The location of Indicated and Inferred Resources for Zones 21 and 25, as well as the Inferred Resources for Zones 24, 26, 27 and 28 of the Lalor deposit are shown in Figures 14-19 to 14-24.
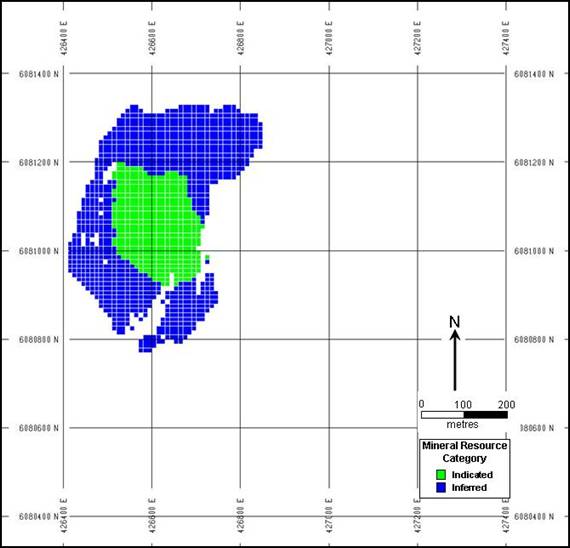
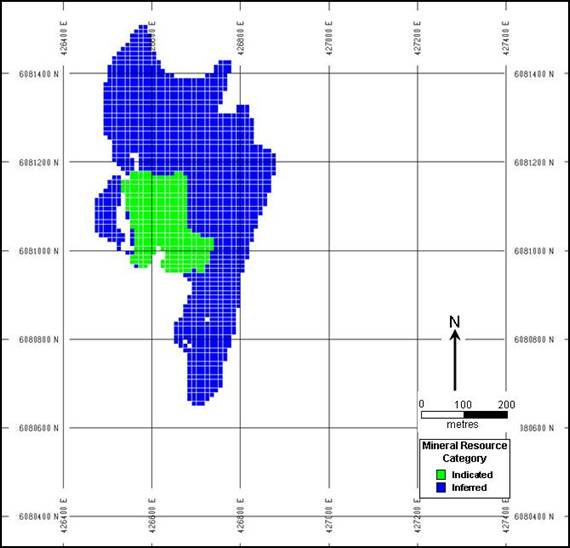
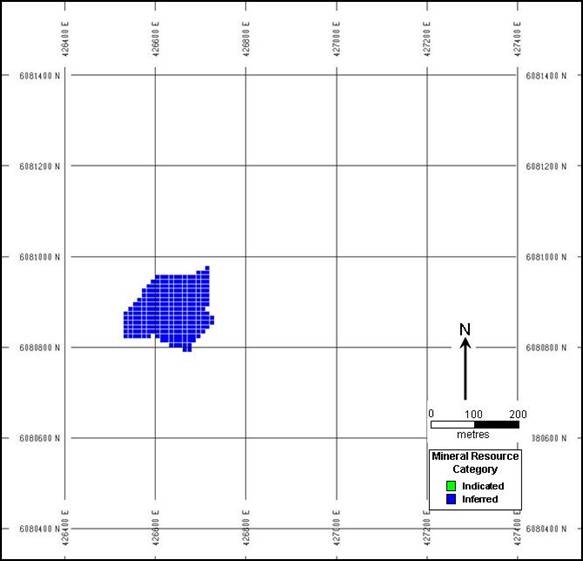
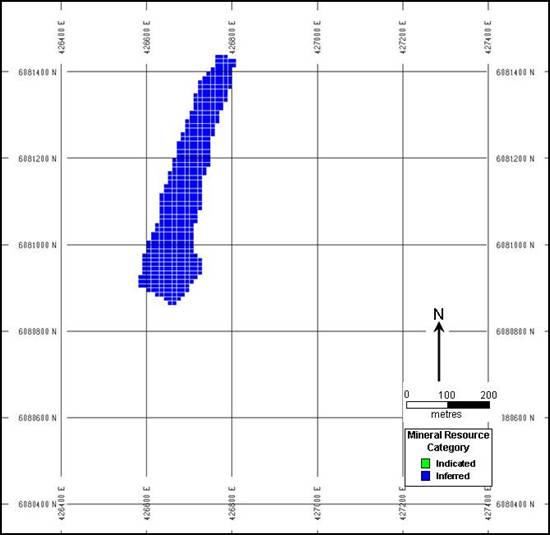
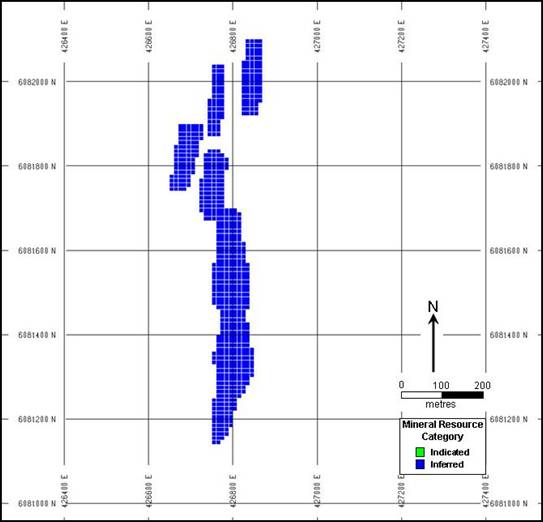
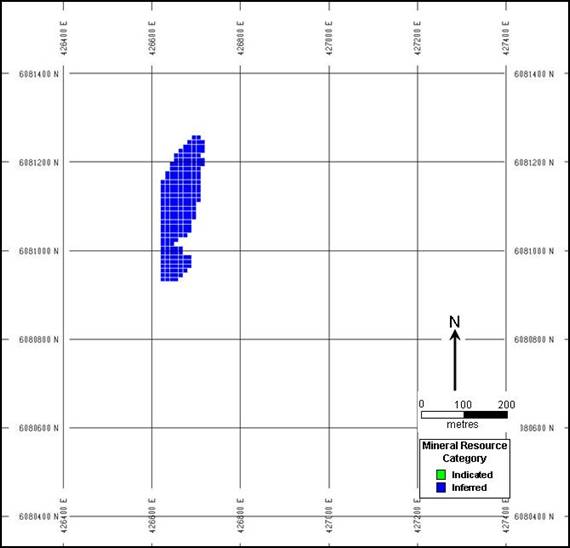
14.3 Mineral Resource Summary
The current interpretation of the Lalor Deposit indicates there are 12 lenses present. Six of these are base metal dominated and six are gold dominated, one of the gold zones is copper-rich and is reported separately in the resource summary Table 14-30. There is no measured resource at this time.
TABLE 14-30 LALOR RESOURCE SUMMARY
Indicated Resource |
| TONNES |
| Au (g/t) |
| Ag (g/t) |
| Cu (%) |
| ZN (%) |
|
Base Metal |
| 14,048,000 |
| 1.79 |
| 27.49 |
| 0.71 |
| 8.96 |
|
|
|
|
|
|
|
|
|
|
|
|
|
Gold Zone |
| 2,729,000 |
| 4.31 |
| 22.27 |
| 0.39 |
| 0.43 |
|
Inferred Resource |
| TONNES |
| Au (g/t) |
| Ag (g/t) |
| Cu (%) |
| ZN (%) |
|
Base Metal |
| 3,817,000 |
| 1.20 |
| 22.15 |
| 0.60 |
| 9.09 |
|
|
|
|
|
|
|
|
|
|
|
|
|
Gold Zone |
| 7,338,000 |
| 4.64 |
| 31.35 |
| 0.41 |
| 0.32 |
|
|
|
|
|
|
|
|
|
|
|
|
|
Copper-Gold Zone |
| 1,461,000 |
| 6.80 |
| 20.33 |
| 4.15 |
| 0.31 |
|
Notes:
(1) CIM definitions were followed for the mineral resources.
(2) Zinc rich base metal mineral resources are estimated at ZNEQ cut-off of 4% (ZNEQ% equals Zn% + Cu% x 2.895 + Au g/t x 1.220 + Ag g/t x 0.023) and a minimum two meter true width.
(3) Gold and Copper Gold zone mineral resources are estimated at a 1.0 g/t gold cut-off and a minimum two meter true width.
(4) Long term $US metal prices of $1,100/oz gold, $22.00/oz silver, $2.75/lb copper and $0.95/lb zinc were used for the estimation of ZNEQ.
(5) Metal recovery assumptions of 65% gold, 60% silver, 90% copper and 90% zinc were used for the estimation of ZNEQ.
(6) Specific gravity measurements were taken on a large portion of the samples. Where actual measurements were not available stoichiometric values were calculated.
15.0 MINERAL RESERVE ESTIMATES
Mining, processing and economic parameters were applied to the block model to form the basis of the reserve estimate. NI 43-101 defines a Mineral Reserve as “the economically mineable part of a Measured or Indicated Mineral Resource”. Only indicated resources have been used to establish the probable mineral reserve.
The orebody is polymetallic with economically significant metals being zinc, gold, copper, silver. There are two different ore types:
· Base metals ores. Near solid to solid sulphide ores, with dominant pyrite and sphalerite with minor blebs & stringers of chalcopyrite and pyrrhotite.
· Gold rich ores. Silicified gold and silver enriched ores with stringers to disseminated chalcopyrite and sphalerite mineralization.
Metallurgical testwork indicates that the base metal and gold rich ores can be blended and metallurgical assumptions are shown in Table 15-1. Two concentrates will be produced, a zinc concentrate that will be shipped to the Hudbay Flin Flon metallurgical complex for production of refined zinc, and a gold enriched bulk copper/lead concentrate that will be shipped to third party smelters. The low lead head grade of approximately 0.25% is diverted to the copper circuit because some of the gold and silver is associated with galena and increases the gold and silver recoveries to a bulk concentrate. Lead contained in the concentrate will have no payables and is expected to be below penalty amounts assigned by the smelter. Refer to Section 15.2 for smelter and refinery terms.
Base metal grades are relatively consistent throughout the ore zones. Ore zones were divided into mining areas based on ore thickness, dip and proximity to other ore zones. Mining methods were established for each mining area and a net smelter return (NSR) was calculated to determine the economic viability.
A summary of the conversion from mineral resource to mineral reserve is shown in Table 15-2.
TABLE 15-1 METALLURGICAL ASSUMPTIONS
|
| Au (g/t) |
| Ag (g/t) |
| Cu (%) |
| Zn (%) |
|
Production Head Grades |
| 1.86 |
| 23.55 |
| 0.60 |
| 6.95 |
|
|
|
|
|
|
|
|
|
|
|
Recovery to Zn Conc |
|
|
|
|
|
|
| 94.0 | % |
Recovery to Bulk Cu/Pb Conc |
| 62.0 | % | 68.0 | % | 85.7 | % |
|
|
|
|
|
|
|
|
|
|
|
|
Zn Concentrate Produced (avg) |
|
|
|
|
|
|
| 55.0 | % |
Bulk Cu/Pb Concentrate Produced (avg) |
| 45.1 g |
| 626.9 g |
| 20.0 | % |
|
|
TABLE 15.2 MINERAL RESERVES SUMMARY
|
|
|
| Tonnes |
| Au (g/t) |
| Ag (g/t) |
| Cu (%) |
| Zn (%) |
|
Base Metal Indicated Mineral Resource |
|
|
| 14,048,000 |
| 1.79 |
| 27.49 |
| 0.71 |
| 8.96 |
|
Base Metal Diluted Mineral Resource |
| 14.9% dil |
| 16,142,000 |
| 1.56 |
| 23.92 |
| 0.62 |
| 7.79 |
|
Base Metal Recovered Mineral Resource |
| 81.0% rec |
| 13,080,000 |
| 1.53 |
| 23.79 |
| 0.61 |
| 7.82 |
|
Base Metal Probable Mineral Reserve |
| $58.05 NSR |
| 12,591,000 |
| 1.55 |
| 23.81 |
| 0.63 |
| 7.92 |
|
|
|
|
|
|
|
|
|
|
|
|
|
|
|
Gold Rich Ore Indicated Mineral Resource |
|
|
| 2,729,000 |
| 4.31 |
| 22.27 |
| 0.39 |
| 0.43 |
|
Gold Rich Ore Diluted Mineral Resource |
| 15.5% |
| 3,151,000 |
| 3.74 |
| 19.28 |
| 0.34 |
| 0.37 |
|
Gold Rich Ore Recovered Mineral Resource |
| 75.8% |
| 2,388,000 |
| 3.71 |
| 19.21 |
| 0.33 |
| 0.38 |
|
Gold Rich Ore Probable Mineral Reserve |
| $26.96 NSR |
| 1,841,000 |
| 3.99 |
| 21.77 |
| 0.38 |
| 0.38 |
|
|
|
|
|
|
|
|
|
|
|
|
|
|
|
Total Indicated Mineral Resource |
|
|
| 16,776,000 |
| 2.20 |
| 26.64 |
| 0.66 |
| 7.57 |
|
Total Diluted Mineral Resource |
| 15.0% |
| 19,293,000 |
| 1.91 |
| 23.16 |
| 0.57 |
| 6.58 |
|
Total Recovered Mineral Resource |
| 80.2% |
| 15,468,000 |
| 1.864 |
| 23.08 |
| 0.57 |
| 6.67 |
|
Total Probable Mineral Reserve |
| $54.08 NSR |
| 14,432,000 |
| 1.88 |
| 23.55 |
| 0.60 |
| 6.95 |
|
15.1 Dilution and Recovery
Dilution is normally defined as the ratio of tonnes of waste mined to tonnes of ore mined expressed as a percentage. For this purpose the mineral resource contained within the 3D interpreted wireframes constructed by resource geologist from diamond drilling information contains only the mineralization and dilution is waste tonnes that will be mined with an assumed no metal value.
The specific gravity (SG) of waste dilution is assumed to be 2.8 and the average ore SG is 3.49. Dilution quantities were estimated volumetrically by cross section for each zone and each mining area and converted to tonnes of waste.
There are two sources of dilution: internal (or planned) dilution and external dilution. Dilution factors applied at Lalor are shown in Table 15-3.
TABLE 15-3 DILUTION FACTORS
|
|
|
| Volumetric Dilution |
|
|
| ||||||
Mining |
| Resource |
| Internal |
| External |
| External |
| Total |
| Total by |
|
Cut & Fill |
| 2,245,901 |
| 32.8 | % | 0.0 | % | 2.7 | % | 35.5 | % | 28.0 | % |
Post Pillar Cut & Fill |
| 6,478,620 |
| 14.1 | % | 0.0 | % | 2.3 | % | 16.4 | % | 14.2 | % |
Longhole |
| 6,816,615 |
| 8.4 | % | 4.9 | % | 2.0 | % | 15.4 | % | 11.9 | % |
Sill Pillars |
| 1,235,071 |
| 13.9 | % | 0.0 | % | 2.0 | % | 15.9 | % | 12.6 | % |
Total |
| 16,776,208 |
| 14.3 | % | 2.0 | % | 2.2 | % | 18.5 | % | 15.0 | % |
15.1.1 Internal Dilution
Internal dilution is waste rock that is planned to be mined with the ore during the course of mining. Mining considerations normally make the mining of internal dilution unavoidable.
At Lalor, internal dilution will be mined due to orebody geometry. Where the ore dips at less than 30°, cut and fill or post pillar cut and fill mining at 5m high vertical cuts will be used. Where the ore dips at greater than 30° and is of sufficient thickness, longhole mining with sills at 15m vertical intervals will be used.
In order to operate rubber tired mobile equipment in cut and fill stopes, and to maintain wall and back stability, ore drifts and ore cross cuts will be mined with vertical walls and a flat sill and back. To optimize ore recovery, some hangingwall and footwall waste rock will be mined. Where possible, a “shanty” back will be used at the hangingwall contact to minimize internal dilution.
Hudbay’s experience indicates that longhole stopes require a minimum 50° dip at the footwall to allow blasted ore to fall to drawpoints below. A wedge of waste rock is planned to be mined at the footwall contact to meet this requirement.
Internal dilution quantities for each mining area were estimated volumetrically by cross sections. For each cut and fill lift and each longhole stope, the total area planned to be mined was calculated. This was divided into mineral resource and waste areas. Waste areas were converted to tonnes based on a waste SG of 2.8, and mineral resource areas were converted to tonnes based on the SG of the resource. A total of 363 cross section samples were used for estimating internal dilution.
15.1.2 External Dilution
External dilution is waste rock that is mined with the ore beyond the stope design boundaries. External dilution is from two sources; wall falloff and overbreak and backfill.
External dilution from backfill will be minimized at Lalor as large cut and fill and longhole stopes will be backfilled with cemented tailings (paste backfill). In smaller stopes, unconsolidated waste backfill will be used. Due to the flat dip of the orebody, mucking will be on a footwall bench, effectively eliminating backfill dilution.
External dilution from overbreak and wall falloff is expected to be zero in cut and fill stopes, longhole undercut drifts and drill sublevels as all headings will be screened to eliminate falloff.
In longhole stopes, an average of 1m of falloff from the hangingwall in the stope has been assumed. Based on Hudbay’s experience and geotechnical evaluations, the short vertical interval (10m) will minimize hole deviation and subsequent wall falloff in longhole stopes.
15.1.3 Mining Recovery
Mining recovery is defined as the ratio of mineral resource tonnes delivered to the process plant (concentrator) to the insitu mineral resource tonnes. Mining recovery factors used for each mining method are shown in Table 15-4. Some mineral resources are not recovered due to:
· Mining design. This includes rib, post and sill pillars that are not recovered to maintain rock stability.
· Inefficiencies in mining. This includes small blocks of ore along ore/waste contacts and underbreak.
· Inefficiencies in mucking. This includes losses of broken rock in longhole stopes mucked by remote control scooptram and broken rock that is mixed with waste backfill and is not mucked.
TABLE 15-4 MINING RECOVERY FACTORS
Mining |
| Resource |
| Mining |
| Losses to |
| Mucking |
| Overall |
| Overall |
|
Cut & Fill |
| 2,245,901 |
| 10.0 | % | 0.0 | % | 0.0 | % | 10.0 | % | 90.0 | % |
Post Pillar Cut & Fill |
| 6,478,620 |
| 5.4 | % | 18.0 | % | 0.0 | % | 23.4 | % | 76.6 | % |
Longhole |
| 6,816,615 |
| 5.0 | % | 0.0 | % | 5.0 | % | 10.0 | % | 90.0 | % |
Sill Pillars |
| 1,235,071 |
| 0.0 | % | 75.0 | % | 0.0 | % | 75.0 | % | 25.0 | % |
Total |
| 16,776,208 |
| 5.5 | % | 12.3 | % | 2.0 | % | 19.8 | % | 80.2 | % |
The methodology used to estimate the overall recovered tonnes and grades was to cut plans at 10m intervals and cross sections at 50m intervals throughout the orebody using Promine software to establish sill pillars, separation pillars and mining blocks. Mining blocks are areas of similar geometry (dip and thickness) where a single mining method (cut & fill, post pillar cut & fill, or longhole) is appropriate.
After establishing mining blocks, cross sections were analyzed to determine expected dilution and expected mining losses. Mining areas that were defined as post pillar cut and fill were assigned losses based on the average stope and post pillar pattern.
Dilution and recovery factors were then applied to each mining block to determine the diluted and recovered tonnes to which economic criteria would be applied.
15.2 Reserve Economics
The net smelter return (NSR) payable was calculated assuming the metallurgical recoveries in Table 15.1. Metal prices were assumed at $0.95/lb for zinc, $2.75/lb for copper, $1,100/oz for gold and $22.00/oz for silver, with a currency exchange rate of 1.05 C$/US$. Assumed bulk copper/lead and zinc concentrate terms are shown in Tables 15-5 and 15-6.
TABLE 15-5 COPPER CONCENTRATE NET REVENUE ASSUMPTIONS
Item |
| Value |
|
Concentrate Freight |
| C$185.60/dmt |
|
|
|
|
|
Base Treatment Charge |
| US$75.00/dmt |
|
|
|
|
|
Payable Copper |
| 96.5% |
|
|
|
|
|
Payable Gold |
| 96.5% |
|
|
|
|
|
Payable Silver |
| 90.0% |
|
|
|
|
|
Penalties |
| None |
|
|
|
|
|
Copper Refining Charge |
| US$0.075/lb |
|
|
|
|
|
Gold Refining Charge |
| US$5.00/oz |
|
|
|
|
|
Silver Refining Charge |
| US$0.50/oz |
|
TABLE 15-6 ZINC CONCENTRATE & SECONDARIES REVENUE ASSUMPTIONS
Item |
| Value |
|
Zn Conc. Treatment & Zinc Refining Charges |
| C$379.00/dmt |
|
|
|
|
|
Zn Conc. Recovered Copper |
| 70.0% |
|
|
|
|
|
Zn Conc. Recovered/Payable Zinc |
| 97.5% |
|
|
|
|
|
Zn Conc. Penalties |
| None |
|
|
|
|
|
Copper Cake (ZPL Secondary Product) Grade |
| 70% Cu |
|
|
|
|
|
Copper Price for Cu in Cake |
| LME less $1,500/t |
|
|
|
|
|
Cu Cake Payable Copper |
| Content less 5 units |
|
|
|
|
|
Cu Cake Treatment Charge |
| US$615.38/dmt |
|
|
|
|
|
Cu Cake Freight |
| C$107.65/wmt |
|
NSR revenues were calculated for mining areas comprised of blocks from the block model. The average revenue attributed to the diluted Lalor mineral resources, after zinc metal distribution costs were applied is $222.84/t.
To determine the economic viability of resources, prefeasibility level onsite operating costs (mining, concentrating and general mine expenses) and offsite costs (concentrate freight, processing, refining, general & administration) were estimated and applied against bulk copper-lead and zinc concentrate produced from each mining area.
Onsite operating costs average $74.14/t of ore, including $58.55 for mining and $15.59 for milling. Mill costs include zinc concentrate freight to the Hudbay Flin Flon zinc processing plant. Onsite general and administration of $12.77/t is included in the mining cost.
Offsite costs are applied to zinc and bulk copper/lead concentrates produced, and payable or recovered metal. Offsite costs average $82.17/t mined. This includes $28.08/t for offsite general and administrative and an average of $53.09/t for processing and refining. Processing costs include Hudbay zinc plant costs for zinc concentrates and third party smelter treatment, refining costs and freight for the bulk copper/lead concentrates. Processing costs were applied per tonne of concentrate produced.
Resource optimization has not been done on an economic basis. This will be undertaken during the later stages of project development when the deposit is drilled from underground drill platforms. The mineral reserves are sensitive to decrease in NSR revenues and operating costs as demonstrated in Table 15-7.
TABLE 15-7 RESERVE SENSITIVITY TO NSR
NSR |
| + $10/t |
| Base Case |
| - $10/t |
| - $20/t |
| - $30/t |
| - $40/t |
|
Tonnes |
| 15,468,000 |
| 14,432,000 |
| 14,432,000 |
| 12,609,000 |
| 10,218,000 |
| 9,293,000 |
|
Au (g/t) |
| 1.86 |
| 1.86 |
| 1.86 |
| 1.80 |
| 2.00 |
| 1.89 |
|
Ag (g/t) |
| 23.08 |
| 23.55 |
| 23.55 |
| 24.41 |
| 24.15 |
| 24.59 |
|
Cu (%) |
| 0.57 |
| 0.60 |
| 0.60 |
| 0.62 |
| 0.70 |
| 0.72 |
|
Zn (%) |
| 6.67 |
| 6.95 |
| 6.95 |
| 7.47 |
| 7.94 |
| 8.55 |
|
Table 15-8 lists the resources that have had the NSR test applied and those that pass the economic test by mining block where converted to mineral reserves.
TABLE 15-8 NET SMELTER RETURN CALCULATIONS
Mining Block |
| Zone |
| Tonnes |
| Au |
| Ag |
| Cu |
| Zn |
| Revenues |
| Mining |
| Milling |
| Processing |
| G & A |
| Total |
| NSR |
| |||||||
|
|
|
|
|
|
|
|
|
|
|
|
|
|
|
|
|
|
|
|
|
|
|
|
|
|
|
| |||||||
Economic Blocks |
|
|
|
|
|
|
|
|
|
|
|
|
|
|
|
|
|
|
|
|
|
|
|
|
|
|
| |||||||
4455 LH Ind |
| 10 |
| 1,377,464 |
| 1.195 |
| 16.406 |
| 0.490 |
| 10.547 |
| $ | 273.35 |
| $ | 47.16 |
| $ | 16.55 |
| $ | 74.87 |
| $ | 38.59 |
| $ | 177.16 |
| $ | 96.19 |
|
4525 SP Ind |
| 10 |
| 83,623 |
| 0.686 |
| 13.829 |
| 0.335 |
| 11.461 |
| $ | 271.96 |
| $ | 52.45 |
| $ | 16.79 |
| $ | 78.74 |
| $ | 40.03 |
| $ | 188.01 |
| $ | 83.95 |
|
4610 LH Ind |
| 10 |
| 99,794 |
| 0.185 |
| 11.838 |
| 0.288 |
| 11.640 |
| $ | 261.78 |
| $ | 46.77 |
| $ | 16.84 |
| $ | 79.22 |
| $ | 40.15 |
| $ | 182.97 |
| $ | 78.80 |
|
4530 LH Ind |
| 10 |
| 1,840,306 |
| 0.379 |
| 14.874 |
| 0.364 |
| 10.183 |
| $ | 241.55 |
| $ | 46.68 |
| $ | 16.45 |
| $ | 70.80 |
| $ | 36.20 |
| $ | 170.13 |
| $ | 71.42 |
|
4455S CF Ind |
| 10 |
| 216,260 |
| 0.887 |
| 15.418 |
| 0.354 |
| 10.642 |
| $ | 261.13 |
| $ | 62.96 |
| $ | 16.57 |
| $ | 73.70 |
| $ | 37.58 |
| $ | 190.81 |
| $ | 70.33 |
|
4370 SP Ind |
| 10 |
| 8,588 |
| 1.713 |
| 16.723 |
| 0.495 |
| 3.690 |
| $ | 144.83 |
| $ | 51.46 |
| $ | 14.72 |
| $ | 30.57 |
| $ | 16.63 |
| $ | 113.37 |
| $ | 31.46 |
|
4455N CF Ind |
| 10 |
| 191,302 |
| 0.339 |
| 13.356 |
| 0.528 |
| 7.519 |
| $ | 194.60 |
| $ | 63.67 |
| $ | 15.74 |
| $ | 55.63 |
| $ | 29.24 |
| $ | 164.27 |
| $ | 30.33 |
|
4290 CF Ind |
| 10 |
| 76,921 |
| 1.753 |
| 17.851 |
| 0.511 |
| 3.236 |
| $ | 137.77 |
| $ | 61.69 |
| $ | 14.59 |
| $ | 27.84 |
| $ | 15.32 |
| $ | 119.45 |
| $ | 18.32 |
|
4415 PPCF Ind |
| 10 |
| 440,301 |
| 1.369 |
| 17.986 |
| 0.619 |
| 5.163 |
| $ | 174.92 |
| $ | 76.60 |
| $ | 15.11 |
| $ | 41.67 |
| $ | 22.55 |
| $ | 155.94 |
| $ | 18.99 |
|
4370 CF Ind |
| 10 |
| 676,334 |
| 1.431 |
| 16.228 |
| 0.528 |
| 4.915 |
| $ | 165.51 |
| $ | 72.43 |
| $ | 15.04 |
| $ | 38.90 |
| $ | 20.88 |
| $ | 147.25 |
| $ | 18.26 |
|
4455 LH Ind |
| 20 |
| 1,733,360 |
| 3.357 |
| 36.880 |
| 1.321 |
| 8.136 |
| $ | 323.00 |
| $ | 49.27 |
| $ | 15.90 |
| $ | 70.30 |
| $ | 38.89 |
| $ | 174.37 |
| $ | 148.63 |
|
4445 SP Ind |
| 20 |
| 144,941 |
| 2.977 |
| 31.444 |
| 0.935 |
| 6.494 |
| $ | 258.48 |
| $ | 53.88 |
| $ | 15.46 |
| $ | 54.63 |
| $ | 29.89 |
| $ | 153.87 |
| $ | 104.61 |
|
4375 PPCF Ind |
| 20 |
| 1,454,165 |
| 2.133 |
| 25.321 |
| 0.962 |
| 9.250 |
| $ | 295.79 |
| $ | 79.92 |
| $ | 16.20 |
| $ | 72.69 |
| $ | 38.99 |
| $ | 207.80 |
| $ | 87.99 |
|
4375 SP Ind |
| 20 |
| 19,930 |
| 1.144 |
| 14.620 |
| 0.570 |
| 9.696 |
| $ | 258.48 |
| $ | 51.51 |
| $ | 16.32 |
| $ | 70.36 |
| $ | 36.64 |
| $ | 174.82 |
| $ | 83.65 |
|
4425 LH Ind |
| 20 |
| 386,491 |
| 1.999 |
| 24.577 |
| 0.871 |
| 4.756 |
| $ | 196.21 |
| $ | 68.54 |
| $ | 15.00 |
| $ | 42.38 |
| $ | 23.68 |
| $ | 149.60 |
| $ | 46.61 |
|
4525 SP Ind |
| 20 |
| 18,227 |
| 3.345 |
| 39.988 |
| 1.306 |
| 6.995 |
| $ | 300.07 |
| $ | 52.45 |
| $ | 15.60 |
| $ | 62.74 |
| $ | 35.08 |
| $ | 165.87 |
| $ | 134.20 |
|
4525N CF Ind |
| 20 |
| 231,723 |
| 2.655 |
| 32.905 |
| 0.912 |
| 8.035 |
| $ | 282.64 |
| $ | 63.29 |
| $ | 15.88 |
| $ | 64.31 |
| $ | 34.61 |
| $ | 178.09 |
| $ | 104.55 |
|
4305 CF Ind |
| 20 |
| 99,697 |
| 2.796 |
| 28.109 |
| 0.490 |
| 7.000 |
| $ | 239.61 |
| $ | 61.82 |
| $ | 15.60 |
| $ | 52.17 |
| $ | 27.21 |
| $ | 156.79 |
| $ | 82.82 |
|
4455 PPCF Ind |
| 20 |
| 204,371 |
| 1.651 |
| 22.564 |
| 0.571 |
| 6.143 |
| $ | 200.24 |
| $ | 63.27 |
| $ | 15.37 |
| $ | 47.48 |
| $ | 25.24 |
| $ | 151.36 |
| $ | 48.88 |
|
4275 PPCF Ind |
| 20 |
| 36,475 |
| 0.510 |
| 9.825 |
| 0.687 |
| 8.679 |
| $ | 228.72 |
| $ | 63.54 |
| $ | 16.05 |
| $ | 65.16 |
| $ | 34.50 |
| $ | 179.25 |
| $ | 49.47 |
|
4475S CF Ind |
| 20 |
| 627,454 |
| 0.916 |
| 24.084 |
| 0.255 |
| 6.054 |
| $ | 166.93 |
| $ | 63.14 |
| $ | 15.35 |
| $ | 42.81 |
| $ | 21.90 |
| $ | 143.20 |
| $ | 23.73 |
|
4455 LH Ind |
| 21 |
| 240,340 |
| 4.660 |
| 29.501 |
| 0.460 |
| 0.264 |
| $ | 140.07 |
| $ | 39.98 |
| $ | 13.80 |
| $ | 8.34 |
| $ | 5.30 |
| $ | 67.43 |
| $ | 72.65 |
|
4425 LH Ind |
| 21 |
| 207,583 |
| 4.003 |
| 22.245 |
| 0.570 |
| 0.447 |
| $ | 132.79 |
| $ | 39.98 |
| $ | 13.85 |
| $ | 10.80 |
| $ | 6.95 |
| $ | 71.58 |
| $ | 61.21 |
|
4445 SP Ind |
| 21 |
| 41,729 |
| 4.873 |
| 26.846 |
| 0.495 |
| 0.283 |
| $ | 145.53 |
| $ | 53.88 |
| $ | 13.81 |
| $ | 8.90 |
| $ | 5.70 |
| $ | 82.29 |
| $ | 63.25 |
|
4375 PPCF Ind |
| 21 |
| 721,795 |
| 3.911 |
| 21.446 |
| 0.407 |
| 0.346 |
| $ | 119.72 |
| $ | 55.98 |
| $ | 13.82 |
| $ | 8.04 |
| $ | 5.05 |
| $ | 82.90 |
| $ | 36.82 |
|
4375 SP Ind |
| 21 |
| 651 |
| 2.402 |
| 12.932 |
| 0.195 |
| 0.524 |
| $ | 76.76 |
| $ | 39.70 |
| $ | 13.87 |
| $ | 6.24 |
| $ | 3.56 |
| $ | 63.37 |
| $ | 13.38 |
|
4370 PPCF |
| 25 |
| 629,280 |
| 3.773 |
| 18.715 |
| 0.244 |
| 0.444 |
| $ | 108.81 |
| $ | 67.17 |
| $ | 13.85 |
| $ | 6.54 |
| $ | 3.78 |
| $ | 91.34 |
| $ | 17.47 |
|
4310 SP |
| 30 |
| 3,216 |
| 0.586 |
| 22.218 |
| 0.428 |
| 6.579 |
| $ | 179.23 |
| $ | 51.46 |
| $ | 15.49 |
| $ | 48.38 |
| $ | 25.26 |
| $ | 140.58 |
| $ | 38.65 |
|
4355N PPCF |
| 30 |
| 123,672 |
| 1.024 |
| 29.453 |
| 0.271 |
| 5.703 |
| $ | 165.33 |
| $ | 67.71 |
| $ | 15.25 |
| $ | 40.81 |
| $ | 20.93 |
| $ | 144.69 |
| $ | 20.64 |
|
Mining Block |
| Zone |
| Tonnes |
| Au |
| Ag |
| Cu |
| Zn |
| Revenues |
| Mining |
| Milling |
| Processing |
| G & A |
| Total |
| NSR |
| |||||||
|
|
|
|
|
|
|
|
|
|
|
|
|
|
|
|
|
|
|
|
|
|
|
|
|
|
|
| |||||||
4350 SP |
| 30 |
| 26,679 |
| 0.965 |
| 20.863 |
| 0.215 |
| 5.394 |
| $ | 150.91 |
| $ | 51.46 |
| $ | 15.17 |
| $ | 38.00 |
| $ | 19.39 |
| $ | 124.02 |
| $ | 26.89 |
|
4355 LH |
| 30 |
| 980,377 |
| 0.853 |
| 25.691 |
| 0.281 |
| 4.934 |
| $ | 144.96 |
| $ | 54.18 |
| $ | 15.05 |
| $ | 35.90 |
| $ | 18.56 |
| $ | 123.69 |
| $ | 21.28 |
|
4320 PPCF |
| 30 |
| 294,397 |
| 0.778 |
| 20.822 |
| 0.327 |
| 5.612 |
| $ | 157.42 |
| $ | 58.26 |
| $ | 15.23 |
| $ | 40.82 |
| $ | 21.17 |
| $ | 135.47 |
| $ | 21.95 |
|
4355S PPCF |
| 30 |
| 338,413 |
| 1.379 |
| 30.784 |
| 0.231 |
| 5.695 |
| $ | 170.96 |
| $ | 68.62 |
| $ | 15.25 |
| $ | 40.29 |
| $ | 20.51 |
| $ | 144.67 |
| $ | 26.29 |
|
4270 PPCF |
| 40 |
| 405,433 |
| 1.852 |
| 42.583 |
| 0.585 |
| 7.473 |
| $ | 241.39 |
| $ | 61.83 |
| $ | 15.73 |
| $ | 56.51 |
| $ | 29.65 |
| $ | 163.72 |
| $ | 77.67 |
|
4145 CF |
| 40 |
| 199,319 |
| 1.253 |
| 16.350 |
| 0.407 |
| 10.476 |
| $ | 268.65 |
| $ | 55.02 |
| $ | 16.53 |
| $ | 73.35 |
| $ | 37.56 |
| $ | 182.46 |
| $ | 86.19 |
|
4270 CF |
| 40 |
| 252,146 |
| 1.350 |
| 32.836 |
| 0.336 |
| 6.627 |
| $ | 195.93 |
| $ | 61.65 |
| $ | 15.50 |
| $ | 47.69 |
| $ | 24.52 |
| $ | 149.36 |
| $ | 46.56 |
|
|
|
|
|
|
|
|
|
|
|
|
|
|
|
|
|
|
|
|
|
|
|
|
|
|
|
|
| |||||||
Total Economic Blocks |
|
|
| 14,432,000 |
| 1.86 |
| 23.55 |
| 0.60 |
| 6.95 |
| $ | 222.84 |
| $ | 58.55 |
| $ | 15.59 |
| $ | 53.09 |
| $ | 28.08 |
| $ | 155.31 |
| $ | 67.53 |
|
|
|
|
|
|
|
|
|
|
|
|
|
|
|
|
|
|
|
|
|
|
|
|
|
|
|
|
| |||||||
Non Economic Blocks (Not in Reserve) |
|
|
|
|
|
|
|
|
|
|
|
|
|
|
|
|
|
|
|
|
|
|
|
|
|
|
| |||||||
4280 S |
| 25 |
| 15,931 |
| 2.008 |
| 29.687 |
| 0.317 |
| 0.476 |
| $ | 81.79 |
| $ | 64.47 |
| $ | 13.86 |
| $ | 7.63 |
| $ | 4.59 |
| $ | 90.54 |
| $ | -8.75 |
|
4300 PPCF |
| 25 |
| 530,790 |
| 2.776 |
| 10.006 |
| 0.183 |
| 0.359 |
| $ | 79.24 |
| $ | 61.98 |
| $ | 13.83 |
| $ | 5.04 |
| $ | 2.92 |
| $ | 83.76 |
| $ | -4.53 |
|
4230 PPCF |
| 30 |
| 477 |
| 0.520 |
| 17.329 |
| 0.359 |
| 5.070 |
| $ | 141.21 |
| $ | 76.74 |
| $ | 15.08 |
| $ | 37.66 |
| $ | 19.75 |
| $ | 149.23 |
| $ | -8.02 |
|
4415 PPCF |
| 30 |
| 488,508 |
| 1.063 |
| 23.240 |
| 0.258 |
| 5.334 |
| $ | 155.06 |
| $ | 82.21 |
| $ | 15.15 |
| $ | 38.19 |
| $ | 19.61 |
| $ | 155.16 |
| $ | -0.10 |
|
Total Non Economic Blocks |
|
|
| 1,036,000 |
| 1.96 |
| 16.55 |
| 0.22 |
| 2.71 |
| $ | 115.07 |
| $ | 71.56 |
| $ | 14.45 |
| $ | 20.73 |
| $ | 10.83 |
| $ | 117.57 |
| $ | -2.50 |
|
16.0 MINING METHODS
16.1 Introduction
The mining method process includes underground development, stope mining, mucking, backfill and ore removal to surface methods. Geotechnical information and orebody geometry interpreted from diamond drill core were the major considerations for selection of stoping methods.
A geotechnical report, along with stoping recommendations was prepared in 2010. The ore zones and hangingwall and footwall rock is hard rock of good quality which will allow mechanized drill and blast development and stoping methods. The orebody dips at an average of -30°, with localized dips as flat as -10°and as steep as -55°. Drill & blast stoping methods that will be used are single pass mechanized cut & fill, post pillar cut & fill and longhole open stope.
Ore will be mucked from the face by manually operated scooptrams from ore drifts and cut & fill stopes. Longhole stopes will be mucked by remote control scooptrams. In both cases, ore will be loaded by scooptram to underground haul trucks and hauled to the ore handling system at the production shaft for hoisting to surface.
A paste backfill plant will be constructed on site. Paste backfill will be used in post pillar cut & fill stopes and in longhole stopes to accelerate the stope cycle. Single pass cut & fill stopes will be filled with waste rock from waste development.
Ore delivered to the production shaft will be sized to less than 0.4m at a rockbreaker/grizzly arrangement, hoisted from the mine by two 15 tonne skips in balance and unloaded to an ore bin on surface. Ore will be conveyed from the bin to a primary crusher, and conveyed to the concentrator.
16.2 Lateral Development
Drilling in waste and ore drifts, crosscuts and ramps will be done using two boom electric hydraulic jumbo drills. Rounds mined in low sulphide waste will be blasted using ANFO, while rounds mined in ore will be blasted using an emulsion with a sulphide blast inhibitor.
Ore and waste will be mucked by scooptram to a remuck or directly to a haul truck. Following mucking, standard ground support consisting of resin grouted rebar and welded wire mesh to within 1.8m of the sill will be installed. Mine services, including compressed air, process water and discharge water pipes, paste backfill pipeline, power cables, leaky feeder communications antenna and ventilation duct will be installed in main levels and stope entrances.
Generally, main levels will be developed parallel to and in the footwall of the ore zones. To optimize development, in some areas of the mine, main levels will be located to provide access to multiple ore zones. As levels are developed, stope entrance crosscuts will be stubbed off and used as temporary remucks. Main levels will be connected by a haul ramp to allow mechanized equipment to travel from level to level.
Stope access crosscuts to cut & fill stopes will be driven at -15% to allow multiple cuts from a single crosscut. Cut & fill stope entrances will be located approximately every 150m along strike. In longhole stopes, a footwall drift will be mined between the main level and the stope and drawpoint crosscuts will be developed.
16.3 Vertical Development
Main ventilation raises and ore/waste pass raises will be developed by a mining contractor using Alimak climbers and hand held drills. Ground support and ladderways, if required, will be installed to Hudbay standards.
Longhole slot raises will be limited to approximately 10m long and will be developed using longhole drop raise techniques.
Drain, backfill and electrical cable holes will be drilled using Hudbay longhole drills, and reamed to designed diameter. Larger diameter (+0.15m) holes will be drilled by contracted raisebore drills.
16.4 Stope Mining
Three stope mining methods will be used at Lalor: mechanized cut & fill, post pillar cut & fill and longhole open stope. At the end of ore zones, where resources narrow, cut & fill
mining will be used. Where the dip exceeds 35° and the orebody is of sufficient thickness, longhole open stope mining will we used.
16.4.1 Mechanized Cut & Fill Mining
Where mining is planned to be less than 14m wide and the ore is flatter than 35°, single pass overhand mechanized cut & fill mining will be used. The ore will be accessed from a footwall drift by a crosscut developed at approximately -15%. Ore will be mined 5.0m high up to the hangingwall and footwall contacts. When ore mining is complete, ore remaining on the sill will be mucked, pipe and ventilation duct will be stripped, backfill will be placed to within 1.8m of the back and the entrance crosscut will be backslashed to provide access to the next cut.
Ground control used in cut & fill mining will be 2.2m resin rebar in the back and walls to within 1.5m of the sill and welded wire mesh. In areas of excessive width, cement grouted cablebolts will be installed to provide additional support.
Approximately 18% of the mineral reserves will be mined using the mechanized cut & fill mining method.
16.4.2 Mechanized Post Pillar Cut & Fill Mining
Where mining is planned to be greater than 14m wide and the ore is flatter than 35°, overhand mechanized post pillar cut & fill mining will be used. Post pillars provide ground support to allow selective mining of wide stopes. As with mechanized cut & fill, the ore will be accessed from a footwall drift by a crosscut developed at approximately -15%. Ore will be mined 5.0m high up to the hangingwall and footwall contacts. When ore mining is complete, ore remaining on the sill will be mucked, pipe and ventilation duct will be stripped, backfill will be placed to within 1.8m of the back and the entrance crosscut will be backslashed to provide access to the next cut.
Based on design by Stantec Engineering, drifts and crosscuts in post pillar stopes will be 8m wide x 5m high, with 6m x 6m post pillars.
Ground control in post pillar cut & fill mining will be 2.2m resin rebar in the back, walls and pillars to within 1.5m’ of the sill and welded wire mesh. Refer to Figure 16-1 for a general cross section of cut & fill and post pillar cut & fill mining and Figure 16-2 for a general arrangement of a post pillar cut & fill stope.
Approximately 32% of the mineral reserve will be mined using the post pillar cut & fill method.
FIGURE 16-1 TYPICAL CUT & FILL MINING CROSS SECTION
FIGURE 16-2 TYPICAL POST PILLAR CUT & FILL PLAN VIEW
16.4.3 Longhole Open Stope Mining
Where mining is greater than 14m wide and the footwall of the ore is steeper than 35°, longhole open stope mining will be done. The advantages of longhole mining over the selective cut & fill methods include:
· Longhole is a non-entry method requiring less ground support and no post pillars.
· Bulk mining method. It’s a more productive, lower cost per tonne method.
Longhole stopes will be mined at 15m vertical sill to sill intervals. The 15m selected vertical height has been selected due to the flat lying nature of the ore. Increasing the sublevel interval would result in either excessive dilution, or lower recoveries.
The ore will be undercut at the top and bottom of the block, providing access for drilling and mucking. Drilling will be done by a top hammer longhole drill. Holes will be between 10m and 15m long. Hole diameter is expected to be 7.6cm, but may be adjusted based on ore fragmentation. Mucking will be done by remote control scooptram, loaded to haul trucks. The longhole methods planned for Lalor are in use at Hudbay’s 777 mine.
Longhole stopes will be 15m wide and mined in a primary/secondary sequence, where every second stope along strike is mined as a primary stope and backfilled with paste backfill, followed by mining secondary stopes that can be filled with either unconsolidated waste rock or paste backfill.
Approximately 48% of the mineral reserve will be mined using longhole mining.
16.4.4 Sill Pillar Mining
Sill pillars will be mined using a drift and fill method similar to the cut & fill methods described above. The last cut of the stope below the sill pillar will be tight backfilled with paste backfill to provide maximum support to the sill pillar. Drifts will be mined along the ore to a maximum width of 8m, separated by 7m rib pillars. These drifts will be tight backfilled. Recovery of sill pillars is scheduled to be 25%. Approximately 2% of the mineral reserve will be mined using sill pillar drift and fill mining.
16.5 Backfill
All stopes at Lalor will be backfilled to maintain long term stability and to provide a floor to work from for subsequent mining. Backfill will be either:
· Cemented waste rock backfill
· Unconsolidated waste rock backfill
· Paste backfill
Cemented waste rock backfill (CRF) will be used early in the mine life prior to commissioning of the new concentrator and paste backfill plant. Cement will be added to waste rock using a spray bar, and cemented rock will be placed in undercuts by scooptram. CRF is required to maintain long term stability to allow future recovery of sill pillars.
Unconsolidated or loose rock backfill (LRF) will be used in cut & fill stopes and in secondary longhole stopes, where pillar or wall confinement is not required.
The majority of backfill will be paste backfill. Paste backfill is an engineered product comprised of mill tailings and a binder (3% cement by weight) mixed with water to provide a thickened paste that is delivered by borehole and pipes to stopes. Hudbay has experience
with the design and operation of a paste backfill system, currently in use at the Flin Flon concentrator and 777 mine. Paste backfill has advantages over unconsolidated slurried mill tailings and loose rock fill as follows:
· Confines pillars in post pillar cut & fill stopes to increase pillar stability
· Flows to the hangingwall to seal off previous cut & fill cuts, improving ventilation control and limiting the potential for hangingwall failure. By comparison, loose rock fill typically rills to approximately 50°.
· Cures to a solid product. This allows mining between paste backfill walls in secondary longhole stopes, and creates a good mucking floor in all stopes. This also eliminates the possibility of the buildup of hydraulic head in stopes and potential flows of re-liquified unconsolidated tails.
16.6 Ore Removal
Ore will be loaded by scooptram to underground haul trucks and hauled to the production shaft. Ore will be dumped onto a grizzly at 910m level for sizing to -0.4m by a rockbreaker. A 40m raise below the grizzly will provide approximately 1,200 tonnes of coarse ore storage. A chute at the bottom of the raise at 955m level will feed ore to a conveyor that will load a measuring flask with 15 tonnes of ore. Ore will be skipped to a surface bin by two skips in balance. Ore from the surface bin will be conveyed to the primary crusher at the onsite concentrator.
16.7 Surface Infrastructure
The majority of surface infrastructure is being constructed under an Advanced Exploration Project (AEP), with the exception of the permanent office/dry complex and the concentrator. Surface infrastructure completed or in progress at the end of 2011 includes:
· 3km mine site access corridor, which includes the mine haul road, 25kV overhead power line and covered/heat traced process water and mine discharge water pipelines
· Onsite services distribution. This includes pole and buried electrical services and switchgear and buried freshwater and mine discharge water pipelines.
· Hoisthouse, including hoist foundations. Installation of the mine service hoist and production hoist is in progress.
· Production shaft collar and foundations, including ventilation plenum
· Ore bunker, ore bin and headframe in progress
· Warehouse/shop complex
· Mine water handling systems, including polishing pond, onsite pumphouse, mine discharge water tanks and pumps and freshwater tanks and pumps. Offsite booster pump station for freshwater and mine discharge water completed.
· Offsite 24MVA 115/25kV temporary substation. This will be replaced by a permanent substation with 2 x 24MVA 115/25kV transformers.
Surface infrastructure required but not started includes:
· 400 person changehouse complex that will house staff offices
· 4,500tpd concentrator, including primary crusher, SAG mill, ball mill, copper and zinc flotation circuits, thickeners and filters. Concentrator complex will also include concentrate storage and handling facility and metallurgical laboratory
· Permanent ventilation installations, including offsite exhaust fan and onsite mine downcast air heater and fans
Refer to Figure 16-3 for the Lalor site general arrangement drawing.
16.8 Geotechnical Design
Geotechnical design was completed by Stantec Engineering in 2009 and 2010. The orebody is flat lying beginning at 570m from surface and extending to a depth of 1,160m. It trends between 270° to 310° azimuth and dips between 15° and 30° to the north with a lateral extent of about 900m north to south and 700m east to west. A number of distinct stacked mineralized zones have been interpreted. The geotechnical design was based on a preliminary lithology of the Lalor orebody as shown in Table 16-1.
TABLE 16-1 LATERAL JUMBO DEVELOPMENT
Domain/Zone |
| Rock/Mineralization Type |
|
Hangingwall Rock |
| Basaltic wacke, crystal wacke/fragmental polymodal fragmenta. Cordierite + anthophyllite, mafic tuffs |
|
Zone 10 |
| Solid to near solid sulphides and minor disseminated sulphides |
|
Footwall to Zone 10 |
| Sericite + kyanite + pyrite schist, staurolite + garnet + biotite gneiss |
|
Hangingwall Zone 20 |
| Altered dacite, amphibolitized mafic volcanic, calc. Silicate gneiss, diorite |
|
Zone 20 |
| Near to solid sulphides |
|
Footwall Zone 20 |
| Chlorite schist, altered dacite, chlorite sericitic talc schist, quartz-biotite-amphibolite gneiss |
|
Hangingwall Zone 30 |
| Mineralized chlorite schist, quartz chlorite schist |
|
Zone 30 |
| Disseminated to near/solid sulphides |
|
Footwall Rock |
| Rhyolite fragmental, quartz biotite schist and chlorite schist |
|
The comments (from Stantec Engineering) below refer to both short term and long term requirements on future geomechanical data acquisition, including training requirements.
16.8.1 Short Term Requirements
Geotechnical Logging
· To ensure that rock mass quality is logged and assessed to industry standard, it is strongly recommended that a formal geotechnical core logging training be
provided to all core log technicians as soon as practicable. Note: This has been established for mine and exploration geologists.
Shaft Sinking
· An orientated geotechnical shaft pilot hole should be drilled and logged at the centre of the proposed shaft. Efforts should be made to drill geotechnical holes to the locations where major infrastructures, including crusher station, loading pocket and underground bins, are to be placed. These holes must be geotechnically logged. Note: This has been done, with an NQ pilot hole navi-drilled inside the production shaft, plus a wedge to the area of the loading pocket, bins and settling cones.
Geology and Structures
· Geotechnical data from other zones should be continuously collected following standard procedures.
· All geological core logging should be examined to identify and characterize any major structural features, including major fault and/or shear zones, that may intersect zones of the mineralization.
· DGI should be requested to combine Acoustic Televiewer (ATV) survey results from the two boreholes for each major domain, including hanging wall, various mineralization zones and footwall, to determine joint orientation for each major domain. If required, ATV surveys of additional holes should be undertaken.
· For Zone 30, a minimum of eight additional samples should be representatively collected from both hanging wall and footwall to further test rock properties, including Unconfined Compressive Strength (UCS), Young Modulus, and Poisson Ratio.
· Efforts should be made to interpret the lithology in the footwall, particularly the location and extent of the weak zones where future internal ramp and other major infrastructures may be proposed.
16.8.2 Long Term Requirements
Geotechnical Logging
· Geotechnical core logging is measured on a geotechnical domain basis. In somecases, the current measured domains have been as large as 65 metres in length. At these domain lengths, some resolution on differing geotechnical zones
can be lost. It is recommended that the maximum length of separate geotechnical domains should be limited to no more than 15 — 20 metres in length if the rock type and the structure of the rock are consistent.
· Core logging format should be optimized to ensure that both geology description and geotechnical data collection (Q’ and/or RMR) be located in the same summary sheet for the ease of data analysis.
Geology and Structures
· The interpretation of the various lithological units in and around various zones of the orebody, i.e. the major geotechnical domains, and the major structural interpretation, i.e. major faults and shear zones, should be generated/mapped in 3D for future mine design.
· Acoustic Televiewer (ATV) surveys should be used in selected boreholes to determine the orientation of fractures, veins, bedding, and textural features in-situ. The borehole break-out information determined from the survey could also be used to verify principal in-situ stress directions.
Rock Mass Classification Plots and Rock Properties Determination
· Rock mass classification wireframes (RQD and/or Q’ and/or RMR) should be generated in 3D space, similar to the ore grade distribution, from all diamond drill holes.
· Representative samples from various geotechnical domains, including HW, various ore zones and footwall, should continue to be collected to test rock properties, including Unconfined Compressive Strength (UCS), Young Modulus and Poisson Ratio.
16.9 Support Systems
Ground support will mainly consist of the following:
· Primary support: 2.2m long — No. 6 or No. 7 resin rebars (with 13cm x 13cm x 6mm plates) on a 1.2m x 1.2m pattern. The pattern to be extended across the back and down the walls to within 1.8m of the sill. Generally, this can be applied to a drift span of 7.0m if no major geological structures are encountered.
· Secondary support: depending upon the final drift span, longer bolts, such as strandlok bolts, typically on a 1.8m x 1.8m pattern, or cement grouted cable bolts, typically double cable bolts on a 2.1m x 2.1m pattern, should be installed. The minimum bolt length should be equal to one-third of the final drift span. This
should be applied to all drifts or major intersections which have a span of greater than 7.0 to 8.0m. Where passing bays (9.1m wide excavation) or large span (greater than 7.0m) drifts/intersections required (in the main decline from Chisel North and the internal ramp for Lalor) the following procedure:
Developed in Two Passes (Drift and Slash)
· For the first pass, the above primary support should be installed. On completion of the first pass and before starting the slash, 3.6m single resin grouted strandloks (using a general rule of a minimum bolt length being equal to one-third the final drift width) to be installed in the back on a 1.8m x 1.8m pattern. Alternatively, similar length of cement grouted double bugled cablebolts, may be used at a 2.1m x 2.1m pattern. It should be noted that cablebolts (with type 30 cement) must be allowed to cure for 24 hours before any development blasting within 30m.
· After the slash, a similar procedure as the first pass should be followed.
16.9.1 Developed in a Single Pass
Primary support should be installed as described above. In addition, cablebolts (or strandloks) should be maintained to within 10m of the face before drilling the next round. Additional ground support requirements, including screen and shotcrete, have been determined for both waste and mineralization development. These are based on rock mass characterization and drift geometry using Barton’s Q system. Ground support requirements for both vertical development and permanent excavations, which were extracted from “Standards Ground Support Policy” drafted by Hudbay for the Lalor mine.
16.9.2 Sill Pillar Support
Sill pillars will be formed at three proposed mining plan levels, including the 910m, 835m and 760m levels. Depending on ore geometry, strength of the mineralization and depth of mining, poor ground conditions are to be anticipated in the last three cuts (15 m) of each block, which will then be underneath excavated stopes. Hudbay standards state that drifts driven under excavated stopes require cablebolting when the sill pillar thickness is less than twice the width of the drift (8.0m). The minimum length of
cablebolt shall be equal to the width of the drift. Therefore, it is recommended that cable bolt length of 8.0m be installed for the first and second cuts of each sill pillar respectively as a secondary support. Some shotcreting may also be required.
When post pillar cut & fill is used, the requirements on backfill will be low. Unconsolidated fill, such as waste rock, may be used as backfill materials. Effort should be made to mine the cross cuts on retreat against backfill to provide confinement to the pillars.
With drift and fill, the requirements on backfill will be very high. The main consideration for this method is that each excavation may be adjacent to a previously filled excavation. The fill will be consolidated and tight filled. The fill type and mechanism of placement becomes important (refer to the following):
· Where paste fill or hydraulic fill is chosen, filling tight will require the use of sacrificial pipes (pours in long and small drifts) with burst disks, or the use of blasting cord to cut the pipe to stage pour locations (hydraulic fill will also require fill barricades). Procedures will be required to ensure that “tight fill (defined as 70% contact with the back) can be achieved.
· Should CRF be considered, tight fill may be placed with Rammer- Jammer techniques. However, the composition of the rock fill must be tightly controlled, as in many cases the mix can be too sloppy to tight fill with a steep rill.
It is recommended that ground support for all other zones be designed when more geotechnical data is available. In addition, calibrated two or three dimensional numerical modelling should be undertaken to identify the problematic areas. Control measures, including enhanced ground support, should be considered to reduce the risk of future ground instability.
16.10 Underground Development
16.10.1 Lateral Development
Drifts and ramps will be carried out using modern drill jumbos, by dedicated mine development crews, using the following equipment:
· Drilling - 2 boom electric/hydraulic drill jumbos equipped with 4.88m feeds and AC1838 or equivalent rockdrills, (Hudbay “standard” equipment). Drill advance may be 4.5m per round.
· Bolting — Maclean Engineering roofbolter or equivalent, equipped with a scissor deck and bolting boom. Bolters will come with rod adding systems to allow cablebolt and testhole drilling. The units will be equipped with AC1838/equivalent rockdrills and screen handling features.
· Mucking — Toro 650 or equivalent LHD equipped with a 6.1m³ bucket
· Trucking — Toro 40D/50D or equivalent haul trucks, equipped with an 18 m³ box, with an approximate haul capacity of 42 tonnes.
· Charging Rounds — Rounds will be charged with explosives using a scissor lift equipped with a 450kg ANFO loading pot. If emulsion explosives are required, the truck will be equipped to handle a 1.0m3 emulsion cube.
See Table 16-2 for the proposed lateral development by year.
TABLE 16-2 LATERAL JUMBO DEVELOPMENT
Year |
| Project |
| Sustaining |
| Exploration |
| Mine |
| Total (m) |
|
2010 |
| 3,305 |
|
|
|
|
|
|
| 3,305 |
|
2011 |
| 2,865 |
|
|
|
|
|
|
| 2,865 |
|
2012 |
| 2,400 | * | 0 |
| 0 |
|
|
| 2,400 |
|
2013 |
| 3,346 |
| 4,277 |
| 0 |
| 1,963 |
| 9,587 |
|
2014 |
| 1,026 |
| 7,305 |
| 1,000 |
| 1,920 |
| 11,251 |
|
2015 |
|
|
| 7,045 |
| 500 |
| 2,321 |
| 9,866 |
|
2016 |
|
|
| 5,613 |
| 0 |
| 1,919 |
| 7,532 |
|
2017 |
|
|
| 5,459 |
| 0 |
| 2,117 |
| 7,576 |
|
2018 |
|
|
| 4,959 |
| 0 |
| 2,428 |
| 7,387 |
|
2019 |
|
|
| 4,511 |
|
|
| 2,422 |
| 6,933 |
|
2020 |
|
|
| 4,511 |
|
|
| 2,419 |
| 6,930 |
|
2021 |
|
|
| 4,587 |
|
|
| 2,307 |
| 6,894 |
|
2022 |
|
|
| 4,711 |
|
|
| 2,425 |
| 7,136 |
|
2023 |
|
|
| 4,711 |
|
|
| 2,720 |
| 7,431 |
|
2024 |
|
|
| 3,511 |
|
|
| 1,836 |
| 5,347 |
|
2025 |
|
|
| 3,011 |
|
|
| 1,808 |
| 4,819 |
|
2026 |
|
|
| 0 |
|
|
| 1,279 |
| 1,279 |
|
2027 |
|
|
|
|
|
|
| 898 |
| 898 |
|
Total |
| 12,942 |
| 64,211 |
| 1,500 |
| 30,782 |
| 109,435 |
|
* Includes 713m preproduction undercut drifting.
16.10.2 Vertical Development
Due to the orebody geometry, minimal vertical or raise development will be required at Lalor after major infrastructure is completed. A number of options are available for raise development.
Large diameter raiseboring has been considered for raise development to surface. If necessary, winches and staging will be used to install ground support top down.
Alternatively, raises to surface during the major project period could also be completed using Alimak raise climbers and hand held pneumatic drills (Alimak climbers will allow the installation of services, installation of ground support, and grouting if required). Selection of Alimak raising will require waiting for access to the bottom of the raise, compared to early pilot hole drilling with raiseboring. Short (<20 metre) raises required within the zones for ventilation or ore removal, but not requiring services or ground support, will be excavated using longhole drop raise techniques. See Table 16-3 for the proposed vertical development by year.
Power cables holes and drain holes will be drilled using available equipment.
TABLE 16-3 VERTICAL DEVELOPMENT
Year |
| Ventilation |
| Production Shaft |
| Paste Fill Holes |
| Total (m) |
|
2010 |
| 465 |
|
|
|
|
| 465 |
|
2011 |
| 285 |
|
|
|
|
| 285 |
|
2012 |
| 565 |
| 800 |
|
|
| 1,365 |
|
2013 |
| 590 |
| 195 |
|
|
| 785 |
|
2014 |
| 480 |
|
|
| 419 |
| 899 |
|
2015 |
| 300 |
|
|
| 341 |
| 641 |
|
2016 |
| 320 |
|
|
|
|
| 320 |
|
2017 |
| 240 |
|
|
|
|
| 240 |
|
2018 |
| 80 |
|
|
|
|
| 80 |
|
2019 |
| 86 |
|
|
|
|
| 86 |
|
2020 |
| 86 |
|
|
|
|
| 86 |
|
2021 |
| 86 |
|
|
|
|
| 86 |
|
2022 |
| 86 |
|
|
|
|
| 86 |
|
|
|
|
|
|
|
|
|
|
|
Total |
| 3,669 |
| 995 |
| 760 |
| 5,424 |
|
16.11 Diamond Drilling
Diamond drilling will be completed by specialist contractor. Ore delineation holes will typically be drilled from one zone to the other, and be less than 200m in length. Stope definition holes will be drilled from undercut drifts through the contact to determine mucking
sill elevations and grade planning (which could vary sequence in some cases). Diamond drilling may be completed by drills installed on mobile rubber tired equipment, similar to the mobile drill used at Chisel North mine. The diamond drill will be configured to allow testholes to be drilled in all directions.
16.12 Hydrogeological Testing
Golder Associates Ltd. (Golder) was retained by Hudbay to carry out hydrogeological testing in selected 76mm (NQ) boreholes to assess general groundwater conditions at the Lalor mine area. Field work was performed in June 2009.
The program was designed to obtain information required for characterization of the local groundwater regime to estimate bulk inflows into simulated underground development.
Three diamond drill boreholes; DUB194, DUB201 and DUB223 were selected for testing and a summary of the program and results are:
· A total of 12 single-well hydraulic response tests were carried out during the hydrogeological testing program at the Lalor site. Four tests were conducted in each of the exploration boreholes DUB194, DUB201 and DUB 223.
· The length of the test intervals varied from 142m to 1223m
· The hydraulic conductivity values varied from 9 E-11 m/s to 2 E-8 m/s
· The bulk hydraulic conductivity was calculated at 8.3 E-10 m/s
· Potential groundwater inflows into a simulated section of a 1000m long tunnel located at depths of 500m and 1000m depths were estimated to be in the order of 50m3/day and 75m3/day respectively.
The potential groundwater inflows to the mine will be manageable from planned sump and pumping capacity.
16.13 Stope Design
Stope design is based on work completed in the internal prefeasibility study for Lalor mine, prepared by Stantec Engineering.
Hanging wall rocks are competent, typically including mafic, felsic volcaniclastic units, mafic wacke, fragmental units and crystal tuff units. Zone 10 is generally near solid to solid sulphides, but portions can occur as disseminated to stringer sulphides. Zones 20 and 30 tend to be disseminated and stringer sulphides, but near massive to massive sections do occur. Foot wall rocks are extensively hydrothermally altered and include chlorite dominant schists, sericite dominant schists, and cordierite+anthophyllite gneisses.
Rock mass quality for each major domain has been determined based on available geotechnical data provided to date. Generally the rock mass quality decreases from hanging wall to footwall due to the presence of higher alteration and chlorite dominant schist rocks in the footwall.
It should be noted that the zones are relatively flat. The hanging wall of the last cut will be the actual back of the drift. The lowest rock mass quality between the hangingwall rock and ore should be used for span design in the mineralization.
Room widths for Zones 10, 20 and 30 should be designed at 8.0m, 8.0m, and 7.0m respectively. An empirical model of Tributary Area has been used to investigate the pillar size for both post pillar cut & fill as well as drift and fill. It is recognized that the Tributary Area method is conservative, since it is assumed that the total overburden load is distributed to pillars and not transferred to the abutments. To ensure that the post pillar size will be adequately designed, the ratio of strength/stress for the post pillars is back calculated to areas in which post pillar cut and fill mining took place, including two ore zones from Chisel North mine. This back calculated ratio has been used as a basis for the post pillar design in this study.
16.13.1 Post Pillar Design for Post Pillar Cut & Fill Option
For Zones 10 and 20, drifts should be designed at 8.0m wide, as noted above, and post pillar should be 6.0m x 6.0m. For Zone 30, the opening should be 7.0m wide and post pillars should be 7.0m x 7.0m. The final recovery for Zones 10, 20 and 30 has been calculated at 82%, 82% and 75% respectively. A staggered post pillar arrangement is recommended to control back span.
16.13.2 Vertical Sequence
The current mining plans call for independent mining from four horizons, including the 760m, 835m, 910m, and 985m levels. This will divide the orebody into four mining blocks with a vertical height of 75m (15 cuts) for each block. These four mining horizons will ultimately result in sill pillar formation at the 910m, 835m, and 760m levels. These sill pillars are currently considered to be approximately three cuts thick (a vertical height of 15m). Difficult ground conditions may be anticipated due to high stress concentration in these sill pillars, and different mining strategies may be required to safely and efficiently recover these pillars.
It is believed that creating a stress shadow by mining one zone will not be easily accomplished due to the following reasons:
· The mineralization appears very flat and irregular;
· The major adjacent ore zones are either significantly apart from each other, or too close to each other; and
· One level access may force all zones to be mined cut by cut
16.13.3 Horizontal Sequence
At each lift, crosscuts will typically be driven to the middle of the mineralization along strike, and mining then will take place in a centre out fashion. In ore, the first drift should be driven either along the hanging wall or footwall to establish the ore/waste contacts. Some prefer that hanging wall ore access be avoided if possible due to reliance on a good tight backfill to fully support the hanging wall from the cuts mined out below. Hangingwall access is possible where conditions require it.
When several zones are located close together, preliminary analysis indicates that if the rock pillar between two adjacent mineralized zones is greater than 10m (horizontal thickness), the pillar can be left intact. However, if the rock pillar is less than 10m, drifting in the first mineralized zone should be tight backfilled (70% contact with the back) before mining the adjacent drift in the next zone. The narrow rock pillar remaining can be supported from the drift in the next zone. It is preferred that mining retreat from the hanging wall to the
footwall with access from the footwall side. In some situations, the narrow pillars may have to be mined. This overall approach warrants further review.
It is recognized that chevron shaped mining in both vertical and horizontal orientation typically will provide favorable stress conditions. However, this may not be easily achieved due to the complexity of the mineralization, multiple lenses, and irregularity. The following work is recommended to be undertaken:
· Numerical modeling be undertaken to optimize mining sequence from stress point of view
· The location of the internal ramps should be further examined to ensure reduced stress effects from mining. Numerical modeling can be used for comparison of various options if/as required.
· Mine plans should be further examined to ensure that mine design is optimized from both geomechanical and economic perspectives
16.14 Dilution and Recovery
Dilution and recovery was already covered in section 15.1 of this report.
16.15 Mining Operations
A typical development equipment crew will consist of a two-boom electric hydraulic jumbo, and a mechanical bolter sized to excavate all lateral development (either 5.0m x 5.0m or 6.0m x 6.0m). The crew will also have a 6.0m3 LHD, and a dedicated scissor lift. Cut & fill mining will require a similar crew makeup to that of a development crew, and will consist of a two-boom electric hydraulic jumbo, and a mechanical bolter sized to excavate all headings (5.0m high and up to 8.0m wide). The crew will also have a 6.0 3 LHD, and a dedicated scissor lift.
Drifting rounds will produce on average one 4.0m long x 6.0m wide x 5.0m ore round per day, or approximately 420 tonnes per day. Mining areas are assumed to be in the mining cycle 75% of the time and in the backfill cycle or otherwise unavailable for mining 25% of the time. The productivity of a single drifting area is expected to be 320 tonnes per day, or approximately 110,000 tonnes per year. Areas where the stope can average 7.0m wide could achieve 370 tonnes per day, and areas where the drifting averages 4.0m will be limited
to 210 tonnes per day (or less). Post pillar cut & fill will achieve better productivity during mining based on the multiple faces available. Faces should average 7.0m in width and up to two rounds recovered per day, but initial development will be limited to mostly single heading. Thus the mining rate will be limited to 600 tonnes per day for a large work area, and as low at 400 tonnes per day for smaller levels/areas.
Longhole mining productivity will depend on stope size and whether the stope is a primary or secondary stope. Based on Hudbay experience at 777 mine, longhole stope productivity, from start of longhole drilling to completion of paste backfill is approximately 400 to 600 tonnes per day for a 20,000 tonne stope. This assumes that drill sublevel development and drawpoint development are not part of the stoping cycle.
At steady state, production will be 3,300 tonnes per day and will be approximately 20% cut & fill, 30% post pillar cut & fill and 50% longhole. To achieve planned production, Lalor will require three cut & fill stopes, three post pillar cut & fill stopes and four longhole stopes in the ore mining cycle. Due to their length, Zone 20 and Zone 10 will have multiple mining areas available on each level. If the ore is accessed at four levels, 40 faces can be available for mining and production can be achieved.
16.15.1 Mine Equipment
Lalor will be a ramp and shaft accessible mine with production and development done by rubber tired underground mining equipment. Mine equipment required for steady state production is shown in Table 16-4.
TABLE 16-4 MINE EQUIPMENT
Category |
| Description |
| Fleet |
|
Direct Mining — Major |
| Underground Trucks 60 Tonne |
| 3 |
|
Direct Mining — Major |
| Underground Trucks 45/50 Tonne |
| 6 |
|
Direct Mining — Major |
| Scooptram 3 1/2 yd |
| 2 |
|
Direct Mining — Major |
| Scooptram 7.5 yd c/w remote |
| 4 |
|
Direct Mining — Major |
| Scooptram 10 yd c/w remote (9.2yd) |
| 5 |
|
Direct Mining — Major |
| Two Boom Jumbo |
| 4 |
|
Direct Mining — Major |
| Scissor Bolter |
| 6 |
|
Direct Mining — Major |
| Long Hole Drills |
| 4 |
|
Direct Mining — Major |
| Emulsion Truck |
| 1 |
|
Direct Mining — Major |
| Block Holer |
| 2 |
|
Direct Mining — Major |
| ANFO Truck |
| 6 |
|
Indirect Mining - Major |
| Scissor Lift Truck |
| 4 |
|
Indirect Mining - Major |
| Lube/Fuel Truck |
| 2 |
|
Indirect Mining - Major |
| Grader |
| 1 |
|
Subtotal Major Mobile |
|
|
| 50 |
|
|
|
|
|
|
|
Indirect Mining — Minor |
| Transmixer and Shotcrete Truck |
| 1 |
|
Indirect Mining — Minor |
| Personnel Carriers Toyota |
| 15 |
|
Indirect Mining — Minor |
| Mine Cat Backhoe Material Handling Loader |
| 5 |
|
Subtotal Minor Mobile |
|
|
| 21 |
|
|
|
|
|
|
|
Total Mobile Equipment |
|
|
| 71 |
|
|
|
|
|
|
|
Minor |
| Ventilation Fans 54” - 250 hp |
| 13 |
|
Minor |
| U/G Submersible Pumps 140hp |
| 4 |
|
Minor |
| U/G Submersible Pumps 90hp |
| 4 |
|
Minor |
| U/G Submersible Pumps 58hp |
| 4 |
|
Minor |
| U/G Submersible Pumps 30hp |
| 4 |
|
Minor |
| U/G Submersible Pumps 13hp |
| 9 |
|
Minor |
| Portable Refuge Stations |
| 4 |
|
Minor |
| Hand Held Drills Stopers |
| 10 |
|
Minor |
| Hand Held Drills Jacklegs |
| 10 |
|
Minor |
| Shotcrete Machine - Wet Mix |
| 1 |
|
Minor |
| Grout Pump c/w Mixer |
| 1 |
|
Minor |
| Portable Electrical Substations 1000KVA |
| 3 |
|
Minor |
| Pressure Washer |
| 2 |
|
Minor |
| Mine Rescue Equipment — From Chisel & Project |
| 0 |
|
Minor |
| Surveyor’s Equipment — From Chisel |
| 0 |
|
|
|
|
|
|
|
Subtotal Minor Equipment |
|
|
| 69 |
|
An allowance for replacement equipment has been included in the mine plan at 10% of the fleet value per year beginning in 2016. As part of the mobile equipment fleet management plan, Major Mobile equipment will be rebuilt at mid life (between 8,000 and 12,000 operating hours). An allowance of 5% of the fleet value is included in the mine plan for rebuilding equipment.
16.15.2 Production Schedules
The LOM production schedule shown in Table 16-5 assumes a high zinc grade pre-production period from 2012 to 2014. Production from this period is expected to be processed at the Snow Lake concentrator. The new concentrator at site will be commissioned prior to achieving commercial production in year 2015. Full production at a rate of 3,300tpd is expected from 2017 through 2025 and decreases in 2026 to 2027.
TABLE 16-5 LOM PRODUCTION SCHEDULE
Year |
| Tonnes |
| Au (g/t) |
| Ag (g/t) |
| Cu (%) |
| Zn (%) |
|
2012 |
| 74,859 |
| 1.10 |
| 17.85 |
| 0.40 |
| 11.37 |
|
2013 |
| 396,963 |
| 1.05 |
| 17.88 |
| 0.39 |
| 11.03 |
|
2014 |
| 527,554 |
| 2.06 |
| 23.53 |
| 0.67 |
| 8.36 |
|
2015 |
| 850,303 |
| 2.07 |
| 22.73 |
| 0.53 |
| 6.05 |
|
2016 |
| 895,295 |
| 1.66 |
| 18.93 |
| 0.54 |
| 8.43 |
|
2017 |
| 1,058,025 |
| 1.39 |
| 19.04 |
| 0.51 |
| 7.87 |
|
2018 |
| 1,194,600 |
| 1.59 |
| 21.75 |
| 0.57 |
| 7.54 |
|
2019 |
| 1,194,600 |
| 1.59 |
| 22.01 |
| 0.58 |
| 7.09 |
|
2020 |
| 1,194,600 |
| 1.58 |
| 22.26 |
| 0.55 |
| 7.02 |
|
2021 |
| 1,194,600 |
| 2.00 |
| 24.75 |
| 0.68 |
| 6.46 |
|
2022 |
| 1,194,600 |
| 1.85 |
| 24.56 |
| 0.61 |
| 6.50 |
|
2023 |
| 1,194,600 |
| 1.94 |
| 26.29 |
| 0.63 |
| 6.95 |
|
2024 |
| 1,008,450 |
| 1.93 |
| 24.92 |
| 0.62 |
| 6.74 |
|
2025 |
| 1,036,161 |
| 2.04 |
| 27.28 |
| 0.62 |
| 6.12 |
|
2026 |
| 815,947 |
| 2.43 |
| 28.48 |
| 0.63 |
| 5.21 |
|
2027 |
| 601,602 |
| 3.08 |
| 27.90 |
| 0.79 |
| 4.42 |
|
|
|
|
|
|
|
|
|
|
|
|
|
Total |
| 14,432,759 |
| 1.86 |
| 23.55 |
| 0.60 |
| 6.95 |
|
Lalor will produce a total of 1,715,276 tonnes of zinc concentrate and 368,601 tonnes of bulk copper-lead concentrate as shown in Table 16-6.
TABLE 16-6 LOM CONCENTRATE PRODUCTION BY YEAR
|
| Zinc Concentrate |
| Bulk Copper Concentrate |
| ||||||||||||||||
Year |
| Tonnes |
| Au |
| Ag |
| Cu |
| Zn |
| Tonnes |
| Au |
| Ag |
| Cu |
| Zn |
|
2012 |
| 14,549 |
| 0.11 |
| 8.86 |
| 0.13 |
| 55.00 |
| 1,283 |
| 39.73 |
| 708.43 |
| 20.00 |
| — |
|
2013 |
| 74,835 |
| 0.11 |
| 9.15 |
| 0.13 |
| 55.00 |
| 6,560 |
| 39.37 |
| 735.79 |
| 20.00 |
| — |
|
2014 |
| 75,374 |
| 0.29 |
| 15.89 |
| 0.29 |
| 55.00 |
| 15,090 |
| 44.75 |
| 559.35 |
| 20.00 |
| — |
|
2015 |
| 87,968 |
| 0.40 |
| 21.20 |
| 0.32 |
| 55.00 |
| 19,362 |
| 56.32 |
| 678.70 |
| 20.00 |
| — |
|
2016 |
| 129,029 |
| 0.23 |
| 12.67 |
| 0.23 |
| 55.00 |
| 20,526 |
| 44.87 |
| 561.39 |
| 20.00 |
| — |
|
2017 |
| 142,379 |
| 0.21 |
| 13.65 |
| 0.24 |
| 55.00 |
| 22,910 |
| 39.84 |
| 597.81 |
| 20.00 |
| — |
|
2018 |
| 153,853 |
| 0.25 |
| 16.29 |
| 0.28 |
| 55.00 |
| 29,220 |
| 40.18 |
| 604.55 |
| 20.00 |
| — |
|
2019 |
| 144,750 |
| 0.26 |
| 17.53 |
| 0.30 |
| 55.00 |
| 29,916 |
| 39.46 |
| 597.71 |
| 20.00 |
| — |
|
2020 |
| 143,249 |
| 0.26 |
| 17.91 |
| 0.29 |
| 55.00 |
| 28,228 |
| 41.54 |
| 640.55 |
| 20.00 |
| — |
|
2021 |
| 131,986 |
| 0.36 |
| 21.61 |
| 0.39 |
| 55.00 |
| 34,925 |
| 42.34 |
| 575.62 |
| 20.00 |
| — |
|
2022 |
| 132,744 |
| 0.33 |
| 21.33 |
| 0.35 |
| 55.00 |
| 31,324 |
| 43.86 |
| 636.93 |
| 20.00 |
| — |
|
2023 |
| 141,924 |
| 0.33 |
| 21.35 |
| 0.34 |
| 55.00 |
| 32,411 |
| 44.42 |
| 658.92 |
| 20.00 |
| — |
|
2024 |
| 116,215 |
| 0.34 |
| 20.87 |
| 0.34 |
| 55.00 |
| 26,901 |
| 44.95 |
| 635.19 |
| 20.00 |
| — |
|
2025 |
| 108,350 |
| 0.39 |
| 25.17 |
| 0.37 |
| 55.00 |
| 27,575 |
| 47.52 |
| 697.01 |
| 20.00 |
| — |
|
2026 |
| 72,667 |
| 0.54 |
| 30.86 |
| 0.45 |
| 55.00 |
| 22,022 |
| 55.71 |
| 717.53 |
| 20.00 |
| — |
|
2027 |
| 45,405 |
| 0.82 |
| 35.67 |
| 0.66 |
| 55.00 |
| 20,350 |
| 56.39 |
| 560.80 |
| 20.00 |
| — |
|
Total |
| 1,715,276 |
| 0.31 |
| 19.12 |
| 0.32 |
| 55.00 |
| 368,601 |
| 45.10 |
| 626.95 |
| 20.00 |
| — |
|
16.15.3 Mine Ventilation
Mine ventilation is based on the diesel mobile equipment plan and their legislated ventilation requirements. Major mobile equipment will be equipped with low emissions Tier III or better diesel engines. Prior legislation allowed stacking of ventilation requirements for underground diesel equipment. Recent changes to the Manitoba Workplace Safety and Health Act have eliminated this, and diesel equipment now requires 100% of its’ certified or legislated fresh air. This change was anticipated and was incorporated into the Lalor ventilation design of 1,100,000 cfm.
Multiple openings to surface and fan/burner installations are required to provide ventilation for Lalor. The Chisel North ventilation fan will provide 340,000cfm to underground. 260,000cfm will ventilate Lalor via the access ramp, with 80,000cfm exhausting to surface via the Chisel North ramp. The Lalor ramp vent fan will provide 240,000cfm to Lalor. An additional 600,000cfm will be provided to the mine via the Lalor production shaft for a total of 1,100,000cfm.
Winter mine air heating is required for Lalor. Three heaters will be required: the existing 36M BTU Chisel North heater, the 30M BTU Lalor ramp heater and a 80M BTU heater at the production shaft.
As of the end of 2011, fresh air is supplied to Lalor from surface down a fresh air Alimak raise to the access ramp. The face is ventilated via full face flow of 90,000cfm, which
exhausted through rigid duct and through an exhaust raisebore to surface. The main exhaust shaft is being sunk and will connect with an alimak raise being driven from 810m level. The production/fresh air downcast shaft will begin sinking March 2012. Ventilation to the mine will be added in stages.
STAGE 1: Alimak Breakthrough Into Ventilation Shaft
The breaktrough of the 2.4m x 2.4m Alimak raise into the ventilation shaft is expected in April 2012. Approximately 90,000cfm will upcast the Shaft to surface when the circuit is open at the bottom of the Alimak raise. The total exhaust is expected to be 185,000cfm. The present ducting system exhausting up the Lalor ramp exhaust raise will be maintained as the brow at the bottom of the Alimak raise is expected to seal off during the vent shaft sinking operations as shown in Figure 16-4.
FIGURE 16-4 LALOR PHASE 1 VENTILATION
STAGE 2: Completion Of The Ventilation Shaft
Completion of the 6.1m diameter ventilation shaft is expected by mid 2012. The airlock at the bottom of the shaft will be readied before this date and two 250 hp 1.4m fans will be installed. Approximately 260,000cfm will be forced up the shaft, providing ventilation for at least two crews conducting development operations shown in Figure 16-5.
Prior to starting the two shaft exhaust fans, the 1.4m Mecanicaid ducting will be removed and the bottom of the 3m bored Lalor ramp exhaust raise will be sealed with a bulkhead. If Chisel North ceases operations before August, 170,000cfm of the total exhaust capacity of 260,000cfm will be supplied from the Lalor ramp downcast fan and the rest from the Chisel North system. If Chisel North operations are extended, there is the option of setting the Lalor ramp fan to a maximum of 240,000cfm, and the remainder can be drawn from Chisel north.
FIGURE 16-5 LALOR PHASE 2 VENTILATION
STAGE 3: Installation Of Parallel 400hp And 250 hp Fans.
Complete the installation of two fans on 840m level, and remove one of the 250hp fans from Stage 2 as shown in Figure 16-6. The total exhaust capacity from the three fans will be 460,000cfm up the ventilation shaft, provided that the airway at the collar has been expanded as planned. It may be necessary to remove a 3m x 3m section of wall at the top of the temporary headframe to accommodate the exhaust volume. This will provide ventilation for two crews developing towards the main production shaft and a production rate of 1,500 tonnes/day from Zone 10.
FIGURE 16-6 LALOR PHASE 3 VENTILATION
STAGE 4: Breakthrough Into The Production Shaft
The production shaft will be accessed from the underground in October 2013. Prior to breakthrough, at least one of the intake fans must be operational at the shaft collar, and both main exhaust fans must be in operation at the top of the ventilation shaft.
Immediately after breakthrough, 300,000cfm will downcast the production shaft, and the exhaust fans will be operated at a mid-range capacity of 700,000cfm. The balance of the air intake into Lalor will be drawn from the Chisel North intake fan and the Lalor ramp intake fan as shown in Figure 16-7. The air volume exhausted will allow for a production of at least 3,500 tonnes/day.
FIGURE 16-7 LALOR PHASE 4 VENTILATION
STAGE 5: Two Levels Broken Through From Vent Shaft To Production Shaft
Two levels joining the ventilation and production shafts allow for a maximum exhaust capacity of 1,100,000cfm. Approximately 600,000cfm will be downcast the production shaft and 500,000 will be drawn down the Lalor ramp, shown in Figure 16-8. The ventilation flows will be sufficient for a production of 5,500 tonnes/day.
FIGURE 16-8 LALOR PHASE 5 VENTILATION
Completion of Stage 5 of the vent system development completes the mine ventilation circuit. Fresh air will be distributed to different areas of the mine via a series of ventilation raises and cross cuts that are developed off the ramp. Individual mining faces will be ventilated using 150 HP fans and 1.2m ventilation duct.
16.15.4 Mine Power
Grid electricity is supplied by Manitoba Hydro, the provincial power utility. Manitoba Hydro’s 115kV powerline terminates at the Chisel Lake minesite, approximately 7 road kilometres from the Lalor site. Manitoba Hydro supplies 115kV power to the Hudbay owned
Chisel Lake 115-25kV 24MVA transformer that was installed to provide temporary project construction power.
Power for Lalor mine operations will be required at:
· Chisel Lake site for the Lalor freshwater pumps and water treatment plant at 4160V and 550V. Required electrical equipment is installed and operational.
· Chisel North downcast fan site. This fan will supply 340,000cfm of mine ventilation air. There is a 25-13.8kV 5MVA transformer and a 25kv-4160V transformer that supply power to the Chisel North mine and Lalor ramp. Required electrical equipment is installed and operational.
· Lalor downcast fan site. This fan will supply 240,000cfm of mine ventilation air. There is a 25kV-4160V transformer at the site. Required electrical equipment is installed and operational.
· Chisel North minesite. There is a 25kV-2300V transformer at the Chisel North site that provides power to the mine office and changehouse, the surface crusher, the Lalor booster pump station and to the 140m level mine dewatering pump station. Required electrical equipment is installed and operational.
· Lalor site. Power is required for the Lalor hoists, surface buildings and mine underground electrical feeder cables (2). Required electrical equipment is installed and operational.
· Lalor concentrator. Construction of the concentrator is planned for 2013/14. Power will be supplied by overhead transmission line from the Lalor site.
· Lalor exhaust fans. Power is supplied to this site and the ventilation shaft is currently being sunk. Modifications to electrical distribution equipment may be required.
The Chisel Lake substation presently provides power to all of the sites listed above with the exception of the concentrator. All overhead powerlines required for power transmission are in place, excluding the concentrator.
The permanent electrical substation will be located at the Chisel North minesite. It will be equipped with two reconditioned 115-25kV 24MVA transformers. The first 24MVA transformer will be constructed and commissioned during 2012.
The second 24MVA transformer is presently installed at Chisel Lake and providing temporary project power. In 2013, this transformer will be relocated to the Chisel North substation. The two transformers will be installed in parallel and will be able to be isolated. This arrangement will supply 24MVA of power to Lalor and area, with 24MVA of redundant power in case of transformer failure.
Based on experience at Hudbay’s 777 mine and Flin Flon concentrator, the Lalor mine and concentrator’s electrical demand will be approximately 20MVA. Final power requirements are being calculated for the concentrator demand load.
16.16 Manpower
Contractor and Hudbay personnel will be required during the construction and operation of Lalor mine.
16.16.1 Mine Construction
During the construction period, the majority of personnel will be tradesmen with specific disciplines and the number of people on site will fluctuate with the work schedule. Both Hudbay and contractor personnel are required during mine construction. Construction and development manpower shown in Table 16-7 during the Major Project period occurs in 3 specific areas which are generally independent of each other, namely:
· Main Site. Work completed or in process to date at the main site includes: site clearing and levelling, hoisthouse and headframe construction, production and ventilation shaft sinking and shaft development, surface ventilation installations, warehouse & shop construction and office/changehouse construction.
· Underground Pre-Production DevelopmentRamp. Work at this site includes ramp development from Chisel to Lalor and internal mine development, construction and ore production prior to production shaft commissioning. Chisel North personnel will transfer to the ramp work area in mid 2012 following depletion of Chisel North mine.
· Concentrator. Work at this site includes site clearing and levelling, mill buildings, mill equipment installation and commissioning and tailings/water pipeline construction.
TABLE 16-7 MINE CONSTRUCTION MANPOWER
|
| 2012 |
| 2013 |
| 2014 |
| ||||||||||||||||||
Area |
| Q1 |
| Q2 |
| Q3 |
| Q4 |
| Q1 |
| Q2 |
| Q3 |
| Q4 |
| Q1 |
| Q2 |
| Q3 |
| Q4 |
|
Main Site Construction |
| 71 |
| 75 |
| 73 |
| 60 |
| 50 |
| 21 |
| 21 |
| 10 |
| 10 |
| 10 |
| 10 |
| 0 |
|
Main Site Shafts & U/G |
| 0 |
| 0 |
| 20 |
| 49 |
| 58 |
| 75 |
| 74 |
| 74 |
| 74 |
| 84 |
| 74 |
| 72 |
|
Underground Develoment— Contractor |
| 22 |
| 22 |
| 22 |
| 22 |
| 22 |
| 22 |
| 15 |
| 12 |
| 12 |
| 12 |
| 12 |
| 12 |
|
Undeground Development — Hudbay |
| 0 |
| 0 |
| 0 |
| 0 |
| 0 |
| 0 |
| 51 |
| 77 |
| 77 |
| 77 |
| 77 |
| 77 |
|
Concentrator & Pipelines |
| 0 |
| 0 |
| 0 |
| 0 |
| 0 |
| 0 |
| 0 |
| 0 |
| 3 |
| 122 |
| 171 |
| 152 |
|
EPCM & Owner’s Team |
| 27 |
| 27 |
| 27 |
| 27 |
| 27 |
| 27 |
| 42 |
| 50 |
| 65 |
| 66 |
| 66 |
| 66 |
|
Total Lalor Project |
| 120 |
| 124 |
| 142 |
| 158 |
| 157 |
| 145 |
| 204 |
| 223 |
| 241 |
| 371 |
| 410 |
| 379 |
|
16.16.2 Mine Operation
Following construction of the mine office and changehouse and commissioning of the production shaft and concentrator, Lalor will be an operating mine. Lalor will be operated on a continuous cycle. The majority of operations and maintenance personnel will work 12 hour shifts on a 4 days on, 4 days off cycle. Operations support, technical and administrative personnel will work 8 hour day shifts, 40 hours per week. The mine will be operated under Collective Bargaining Agreements between Hudbay management and local unions.
Mine operations manpower will comprise Hudbay hourly operations and maintenance personnel as well as salaried supervision, mine administration and technical staff, plus contractor personnel for diamond drilling and technical support. Concentrator personnel will include diamond drillers, raise miners and vendor representatives for bits & steel, tires, and equipment fleet maintenance and audits. Personnel will vary year to year. Average personnel requirements are shown in Table 16-8.
TABLE 16-8 MINE & MILL OPERATIONS MANPOWER
Discipline |
| Personnel |
|
Mine Operation |
|
|
|
Direct Mining |
| 98 |
|
Underground Support |
| 18 |
|
Surface |
| 19 |
|
Mine Maintenance |
| 56 |
|
Administration, Supervision and Technical |
| 39 |
|
Total Hudbay Personnel - Lalor Mine |
| 230 |
|
Contractors |
| 29 |
|
Total Lalor Mine |
| 259 |
|
|
|
|
|
Concentrator Operation |
|
|
|
Mill Operators |
| 38 |
|
Mill Maintenance |
| 18 |
|
Administration, Supervision & Technical |
| 9 |
|
Total Hudbay Personnel - Lalor Concentrator |
| 65 |
|
Mill Contractors |
| 13 |
|
Total Lalor Concentrator |
| 78 |
|
|
|
|
|
Total Lalor Mine & Concentrator |
| 337 |
|
16.17 Mine Safety & Health
Contractor and Hudbay personnel will be required to work under the applicable laws of the province of Manitoba, Canada. All contractors working on site will be required to have an approved health and safety program in place and have on site representation. Hudbay Plant Safety Rules and Regulations will be used at Lalor operations including, but not limited to:
· Positive Attitude Safety System (PASS) safety program
· Health monitoring programs (hearing and lung)
· Dust monitoring
· Ongoing water and environmental monitoring
· Personal Protective Equipment (ie. reflective outerwear, eye protection, hearing protection, respirators)
· Task analysis and job procedures.
16.17.1 Refuge Stations
Refuge stations are required at Lalor and are incorporated into the mine design. Hudbay’s standard refuge station is excavated from rock and requires two ventilation bulkheads, compressed air and a backup oxygen generator, potable water, stretcher kit and first aid supplies, and supplies to seal off the bulkheads.
In new development where it is impractical to excavate a refuge station, portable refuge stations will be used.
16.17.2 SECOND EGRESS
Underground mines require a second means of egress. The primary route in and out of the mine will be the production shaft equipped with a service cage. The shaft is equipped with a small auxiliary hoist and six person cage. In case of power failure, the auxiliary hoist can be operated by an emergency diesel generator to evacuate men from the mine.
In the case that the production shaft is not usable, the second egress from the mine is the ramp from 810m level to surface at Chisel North mine.
17.0 RECOVERY METHODS
17.1 Introduction
The new Lalor concentrator complex will be located at the existing Lalor project site. Conventional crushing, grinding and flotation operations will be used to process the ore. The nominal throughput rate will be 4,500 tonnes per day. The mill will operate 24 hours per day, 365 days per year, with scheduled downtime for maintenance as required.
The current plan is that the concentrator will produce a bulk copper-lead concentrate with gold and silver credits and a zinc concentrate, both for shipment by truck to Flin Flon. Although copper-lead separation was studied extensively in the test program, it is now apparent that lead head grades may generally be too low to make the operation of a lead circuit viable. However, equipment selections for the lead circuit have been made, and floor space will be provided in the new concentrator for the lead circuit. The final decision on the lead circuit will be made after early production ore from Lalor is tested in the Snow Lake Concentrator in Q4 2012. The potential benefit of the lead circuit would be that a higher grade copper concentrate could be produced without lead penalties. However, the lead concentrate will be low grade and could be difficult to sell. The lead itself in this concentrate would probably not be payable, but there would be credits for the contained gold and silver.
Tailings from the flotation circuit will be utilized to produce a cemented paste backfill for use underground. Tailings not required for paste backfill will be pumped to the existing Anderson Tailings Impoundment Area (TIA).
17.2 Lalor Concentrator Description
A simplified block flow diagram for planned Lalor concentrator is shown in Figure 17-1. Coarse ore as large as 610 mm in one dimension will be withdrawn from the head frame ore bin by an apron feeder and belt conveyed to a jaw crusher located in an annex to the main concentrator building. Coarse ore previously stockpiled on surface or delivered to the Lalor site from an alternate ore source can also be fed to the jaw crusher using a front end loader and a hopper located above the feed belt conveyor.
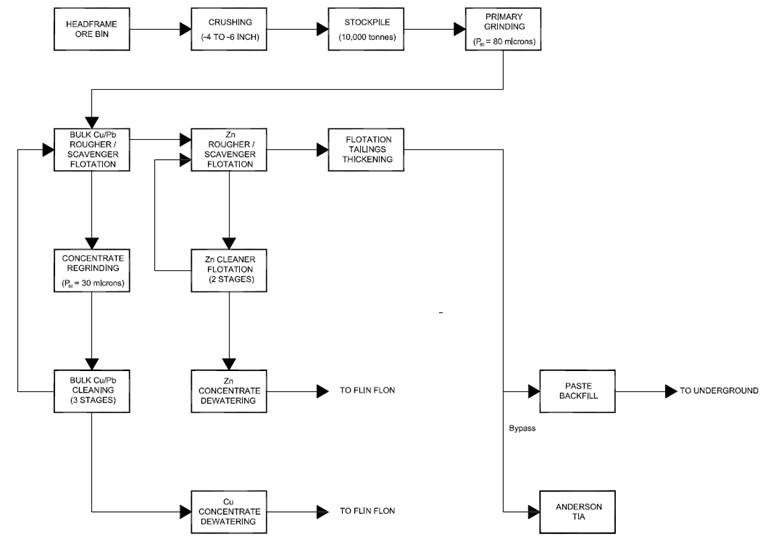
Jaw crusher discharge at minus 150 mm will be belt conveyed to a stockpile which will be enclosed to minimize dust emissions to the environment. Crushed ore will be withdrawn from under the stockpile by apron feeders and belt conveyed to the Semi Autogenous Grinding (SAG) mill feed chute. A belt scale located on the conveyor will measure the mill feed tonnage for accounting purposes.
The maximum size of the stockpile will be 10,000 tonnes with approximately 2,000 tonnes live capacity. Crushing will normally be operated to maintain a live inventory at the stockpile. In the event of a delay in the mine or a problem with the crushing system, a backhoe can be utilised to move additional crushed ore into the apron feeder drawdown cones.
The SAG mill will operate in closed circuit with a vibrating screen. Oversize from the screen will be circulated back to the SAG mill by gravity. Undersize from the screen will report to a pumpbox feeding a cluster of primary cyclones. Cyclone overflow at a target P80 size of 80 microns will flow by gravity to the flotation circuit. Cyclone underflow will mostly flow by gravity to a ball mill operating in closed circuit with the cyclones. A small fraction of the cyclone underflow will be diverted to a flash flotation cell for the recovery of liberated gold and copper. Flash flotation concentrate will be sent to the concentrate regrind circuit. Tailings from flash flotation will flow by gravity to the ball mill feed chute. Note that flash flotation was not tested in the laboratory. It was included in the flowsheet based on experience in the Flin Flon Concentrator, where it has been used for many years as a means of recovering fine gold that is not responsive to gravity concentration.
Methyl isobutyl carbinol (MIBC) frother will be added to the flash flotation cell feed to stabilize the froth. Zinc sulphate solution will be added to the ball mill feed to depress the flotation of zinc minerals. 3418A collector reagent will be added to the SAG mill feed to promote the flotation of copper and lead minerals.
Flotation feed will be conditioned with reagents (lime slurry for pH control, MIBC frother, 3418A flotation collector and CMC talc depressant) in an agitated tank and then fed by gravity to the bulk copper-lead rougher/scavenger flotation circuit consisting of six 30m3 tank
cells in series. Scavenger concentrate will be recycled to the conditioning tank while scavenger tailings will be pumped to the zinc flotation circuit.
Rougher flotation concentrate along with the flash flotation cell concentrate will be reground to a target P80 of 30 microns in a regrind mill operating in closed circuit with cyclones. Additional lime slurry, 3418A and zinc sulphate solution will be added to the regrind mill to condition the feed for cleaner flotation.
Reground bulk concentrate will be cleaned in a closed three stage tank cell flotation circuit. The first cleaner tails will be pumped back to the conditioning tank. The third cleaner concentrate will be pumped to the copper-lead dewatering circuit. The cleaner circuit will be configured to allow open circuit cleaning if appropriate.
Zinc flotation feed will be conditioned with reagents (lime slurry, MIBC frother, sodium isopropyl xanthate flotation collector and copper sulphate zinc mineral activator solution) in an agitated tank and then fed by gravity to the zinc rougher/scavenger flotation circuit consisting of six 30m3 tank cells in series. Scavenger concentrate will be recycled to the conditioning tank while scavenger tailings will be pumped to the flotation tailings thickening circuit.
Zinc rougher concentrate will be cleaned in a closed two stage tank cell flotation circuit. The first cleaner tails will be pumped back to the conditioning tank. The second cleaner concentrate will be pumped to the zinc dewatering circuit.
Flocculated bulk copper-lead concentrate will be pumped to a dedicated high-rate thickener. Thickener overflow will be pumped to the process water storage tank for recycle to minimize fresh water consumption. Underflow, at a target density of 70% solids, will be pumped to an agitated stock tank capable of holding 24 hours of production capacity.
Thickened copper-lead concentrate will be further dewatered to approximately 8% moisture on a pressure filter. Filtrate will be recycled to the bulk copper-lead concentrate thickener to prevent the loss of fine solids and reuse the water. Filter cake will be gravity fed to a storage bin in the load-out area.
Flocculated zinc concentrate will be pumped to a dedicated high-rate thickener. The overflow will be recycled to the process water storage tank. The underflow, at a target density of 70% solids, will be pumped to an agitated stock tank capable of holding 24 hours of production capacity.
Thickened zinc concentrate will be further dewatered to approximately 8% moisture using a vacuum filter. Filtrate will be recycled to the zinc concentrate thickener to prevent the loss of fine solids and reuse the water. Filter cake will be gravity fed to a storage bin in the load-out area.
A concentrate storage annex with capacity for up to five days of production of each concentrate, will be located adjacent to the main concentrator building. The shed will be fully enclosed with separate areas for zinc and copper concentrate storage.
A front end loader will be used to separately load the filtered concentrates into trucks for transport to Hudbay concentrate handling facilities in Flin Flon. Each truck will be weighed on a truck scale located in the load-out shed.
Flocculated flotation tailings will be pumped to a high-rate thickener located outdoors in a containment area adjacent to the concentrator building. Thickener overflow will be pumped to the process water storage tank for recycle in the milling process. Underflow, at a target density of 50% solids, will be pumped to a splitter box located in the paste backfill preparation area.
When paste backfill is not required in the mine, the thickened tailings will be diverted at the splitter box to the tailings pumpbox and pumped to the Anderson Tailings Impoundment Area. The pumping system will be designed for the maximum possible pumping distance of 17km. Two 3-stage pumping systems (one operating/one standby) will be installed in the concentrator building, eliminating the requirement for booster pumps along the tailings line route, which will significantly reduce the risk of spillage.
The tailings pipeline will be a dual pipe (pipe-in-a-pipe) system to minimize the risk of leakage to the environment. There will be a leak detection system installed over the full length of the tailings line in between the carrier and containment piping to monitor the
presence of water/slurry. Early leak detection will allow for an orderly shutdown and repair of the line to minimize the risk of spillage to the environment.
When the mine requires paste backfill, the thickened tailings will be diverted at the splitter box to the paste backfill plant cyclone feed pumpbox and pumped to the paste plant cyclones for fines removal. The fines in the cyclone overflow will gravity flow via the splitter box overflow to the tailings pumpbox. The cyclone underflow stream containing the coarse tailings material will gravity flow to a filter feed tank with six hours storage capacity. Coarse tailings will be vacuum filtered to a target density of 78% solids and belt conveyed to a twin screw mixer. Trim water will be added to the mixer to achieve a target paste slump. Cement slurry will be added at this point to achieve the desired final backfill strength. A positive displacement pump will be used to pump the paste underground via boreholes located adjacent to the mill building.
The process water system will be designed to minimize fresh water consumption by recycling as much water as possible internally in the mill via the tailings and concentrate thickeners. Make-up water for the process water tank will first be sourced from the mine water pumping system, followed by the reclaim water pumping system located at the east end of the Anderson TIA, and if necessary, from the fresh water pumping system located at Snow Lake. A small amount of fresh water will be required in the mill for applications where process water is not acceptable.
A combined fresh water and fire water tank will be provided. Fresh water storage will be located in the top section of the combined tank. The fire water reserve located in the bottom section of the combined tank will be sufficient for two hours at the design pumping rate. Both electric and diesel fire water pumps will be provided.
Potable water, sourced from the Town of Snow Lake’s water treatment system, will be hauled to the Lalor site in portable jugs. Water for sanitary usage will be pumped from the mine’s treated water system to a treated water distribution system in the mill. Sewage (including grey water) will be collected and pumped to a sewage treatment plant at the mine site.
The existing fresh and reclaim water pumping systems supplying the existing Snow Lake mill will be upgraded and rerouted to supply the new Lalor mill. These pipelines will follow the same route as the tailings pipeline as much as possible. The existing fresh water pumps will be replaced with larger units capable of maintaining the current maximum flow rate of 91 m3/h through the 150mm insulated polyethylene pipeline, lengthened to approximately 13.3km. The existing reclaim water pumps will also be replaced with larger units capable of maintaining the current maximum flow rate of 233m3/h through the 200mm insulated polyethylene pipeline lengthened to approximately 16.2km
Three plant air compressors and an instrument air compressor will be provided to supply 700kPa of dry compressed air throughout the mill facilities. Air for the tank flotation cells will be provided by a pair of low pressure blowers.
The power requirement for the concentrator has been estimated as 60kwh/tonne, The estimate was based on connected horsepower and an appropriate duty cycle for each piece of equipment.
A preliminary estimate of water consumption for the Lalor Concentrator is shown in Table 17-1 below. The estimate was based on a nominal throughput of 205 tonnes per hour and an availability of 92%. The fresh water source is Snow Lake. The reclaim water sources include thickener overflows, recycle water from the tailings impoundment area and mine discharge water.
TABLE 17-1 ESTIMATED WATER CONSUMPTION
|
| Water Consumption |
| ||||
Water Source |
| m3/yr |
| m3/tonne |
| % |
|
Fresh |
| 344,000 |
| 0.21 |
| 12.4 |
|
Reclaim |
| 2,424,000 |
| 1.48 |
| 87.6 |
|
Total |
| 2,768,000 |
| 1.69 |
| 100.0 |
|
A preliminary estimate of grinding media and reagent consumption for the Lalor Concentrator is shown in Table 17-2 below.
TABLE 17-2 ESTIMATED GRINDING MEDIA AND REAGENT CONSUMPTION
|
| Consumption |
|
Item |
| kg/tonne |
|
Grinding Media |
| 2.000 |
|
Lime |
| 2.000 |
|
Copper Sulphate |
| 0.300 |
|
Zinc Sulphate |
| 0.060 |
|
3418A Collector |
| 0.025 |
|
SIPX Collector |
| 0.035 |
|
MIBC Frother |
| 0.050 |
|
CMC |
| 0.100 |
|
Flocculant |
| 0.015 |
|
Cement* |
| 30.00 |
|
*per tonne of backfill produced
18.0 PROJECT INFRASTRUCTURE
Lalor is designed to mine and mill 4,500 tonnes per day of ore. Primary access to the mine will be by a concrete lined 6.9m diameter production shaft. Secondary ramp access from Chisel North mine is complete. Ore will be hoisted to surface and milled on site using a SAG/ball mill, producing zinc and bulk copper/lead concentrates. Where possible, existing infrastructure from Hudbay Chisel North mine operation will be used or extended to Lalor.
Lalor is 18 road kilometres from the Town of Snow Lake, Manitoba. General area infrastructure includes provincial roads and 115kV Manitoba Hydro grid power to within four kilometres of Lalor, and Manitoba Telecom land line and cellular phone service. The Town of Snow Lake is a full service community with available housing, hospital, police, fire department, potable water system, restaurants and stores. The community is serviced by a 914m gravel airstrip to provide emergency medical evacuation.
Lalor is located four road kilometres from the Hudbay Chisel North mine. Chisel North infrastructure includes a mined out open pit used for waste rock disposal, fresh (process) water sources, pumps and waterlines, 4160V and 550V power, mine discharge water lines, a 2,500gpm water treatment plant with retention areas, plus mine buildings including offices and a changehouse. These facilities were used for ramp development and will be used during Lalor operation.
The permitted Hudbay Anderson TIA, located approximately 12km from Lalor will be used for tailings disposal.
As of the end of 2011, all on and off site infrastructure required for mine site and mine development was in place. A site drawing of the Lalor project access road and services is shown in Figure 18-1.
As of March 2012, offsite infrastructure constructed for mine site and mine development included:
· 198 person camp in the Town of Snow Lake to house temporary construction personnel
· Four kilometre gravel access road connecting provincial road 395 to the mine site. The road was constructed to Manitoba Class B Feeder road standard.
· Four kilometre of insulated, heat traced fresh water and mine discharge water pipeline extension from Chisel North mine. Water line extensions included construction of a booster pump station.
· 25kV - 18MVA temporary power substation near the Chisel Lake water treatment plant. This substation provides power for underground development and the mine site for shaft sinking.
· Four kilometres of 25kV overhead powerline from Chisel North to Lalor and,
· Temporary engineering, procurement and project management office at Hudbay Flin Flon and at Chisel North mine
As of March 2012, onsite infrastructure constructed for the mine site, ventilation shaft and shaft project development period includes:
· Site power pole distribution and self contained 25kV/4160V/550V portable substations to provide construction power
· Hudbay temporary offices for safety and training, site security, engineering, site management and QAQC
· Laydown areas for temporary contractors’ offices and construction materials
· Warehouse/shop
· Washroom trailer with holding tank
· Mine discharge water settling pond and pump station
Concurrent with construction of onsite services and infrastructure, sub grade concrete for the production shaft collar, hoist and headframe foundations, ventilation plenum and water treatment plant was poured. Buried waterlines, propane lines and power cables were installed and final site grading was completed.
As of March 2012, the status and schedule for permanent infrastructure is:
· Haul road is complete and operating
· Powerline is complete and operating using a temporary substation
· Permanent electrical substation, engineering and site clearing/levelling are underway with construction scheduled for 2012 and 2013. Commissioning and changeover required by the end of 2014.
· Fresh water and mine discharge water pipelines, including heat trace is complete and operating
· Polishing pond and pump station are commissioned and operating
· Portable sewage treatment plant is installed and operating
· Water treatment plant equipment is onsite and installation is expected during the second quarter of 2012
· Warehouse and maintenance shop is built and in use
· Hoisthouse with service and production hoists are installed, which includes cranes, electrical switchgear and hoist controls. Planned to be commissioned in the second quarter of 2012.
· Shaft collar concrete, headframe with sheaves, ore bin and concrete waste bunker that includes auxiliary hoist installation. Planned to be commissioned for production shaft sinking in the second quarter of 2012.
· Fresh air ventilation plenum concrete is complete. Mine air heaters and fans are planned for construction during production shaft sinking in 2013.
· Utilidor for pipe and power distribution is complete
· Ventilation shaft is approximately 50% complete and the exhaust fan installation is scheduled for Q3 2012 upon completion of the shaft
· Engineering has begun for the permanent mine office and changehouse and is scheduled for construction during 2013.
· Temporary camp construction is complete and operational
· Preliminary engineering and equipment schedule is complete for the 4,500tpd concentrator, which is scheduled for construction during 2013 and 2014
19.0 MARKET STUDIES AND CONTRACTS
Hudbay will produce a bulk copper/lead concentrate and refined zinc from Lalor ore. Hudbay has a Metal Marketing division that is responsible for establishing and maintaining contracts for the sale of refined zinc, the sale of concentrates and freight contracts. As well, Hudbay conducts ongoing research of metal prices and sales terms as part of normal business and long range planning process. Contract terms used in the Lalor financial evaluation are based on this research and the author has reviewed these results and they support the assumptions made in this technical report.
Engineering, supply and construction contracts are initiated by the Lalor project management team in Flin Flon and contracts are managed and administered by Hudbay’s Flin Flon Contract Administration department. Hudbay follows a standard contracting out process that specifies contractors’ requirements to be eligible to be considered for work. Contractor selection criteria include ability to complete the work within the required time, safety record and programs, price, and proposed alternatives. Major contracts awarded for Lalor to date include:
· Stantec Engineering — Detailed engineering and design for site construction including hoisthouse, collarhouse, shaft and shaft collar, headframe, and site electrical distribution.
· Genivar Engineering — Detailed engineering and design for mine fresh water and mine discharge water systems, including piping and heat trace specifications, on site piping, booster pump station, mine site water treatment and pumping station and the site polishing pond.
· JS Redpath Ltd — Underground development including raises.
· Strilkiwski Contracting Ltd — Access road construction, site clearing and levelling, final site grading and waterline construction.
· Denare Beach Mechanical — Booster pump station, site pumphouse and water treatment plant construction.
· Manitoba Hydro — Construction of the powerline from Chisel North to the Lalor mine site.
· JS Redpath Ltd — Ventilation shaft sinking, including sinking setup, supply of sinking equipment and shaft sinking.
· PCL Construction Ltd — Concrete foundations construction.
· Multicrete Systems Inc — Concrete supply.
· Ocean Steel — Supply and erection of structural steel.
· Derksen Mechanical — Hoisthouse, headframe and warehouse piping, mechanical and electrical installations.
· Dumas Mining — Production shaft sinking, including supply of sinking equipment, shaft sinking, concrete shaft lining and supply and installation of shaft steel and equipment.
The Lalor contracts that are in place have rates and charges that are within industry norms.
Contracts for concentrator engineering and construction have not been awarded.
Quotations and delivery schedules have been received for supply of mining equipment. All mining equipment has been awarded with deliveries to site in progress.
20.0 ENVIRONMENTAL STUDIES, PERMITTING, AND SOCIAL OR COMMUNITY IMPACT
20.1 Environmental Studies and Planning
Commencing in 2007, AECOM carried out the environmental baseline investigations needed to conclude an environmental impact assessment for the Lalor project, including all necessary terrestrial and aquatic field studies. Much of the early baseline work was summarized in AECOM’s Lalor Advanced Exploration Project Plan (“Lalor AEP”), which was submitted to Manitoba Mines Branch to obtain approval for the Lalor AEP. AECOM is finalizing the Environmental Impact Assessment Report for the proposed Lalor Mine, which will conclude that the project is not likely to result in any significant adverse environmental or socio-economic impacts. In addition to the mine baseline and environmental impact reports, AECOM is currently finalizing the Lalor Concentrator Environmental Baseline Assessment, which is planned to be released in the Q2 2012.
20.2 Waste, Tailings Disposal and Water Management
There are no known environmental concerns which could adversely affect Hudbay’s ability to extract the Lalor mineral resource. Because of its location in close proximity to the existing Snow Lake and Chisel North facilities, design of the Project has been able to utilize existing infrastructure, services, and previously disturbed land that is associated with pre-existing and current mining operations in the Snow Lake area. The Lalor Project has been planned to minimize its impact on the surrounding environment by keeping the footprint of the Project as small as possible and by using existing licensed facilities for the withdrawal of water and disposal of wastes.
20.3 Permitting Requirements
The main permits that will be required for the Lalor Project are Manitoba Environment Act licenses for the Lalor Mine and Lalor Concentrator and for expansion of the existing Anderson Tailings Impoundment Area (TIA). No new tailings impoundment area will be required. No federal permits are anticipated for any of the Lalor facilities.
The Lalor AEP plan was submitted to the Manitoba Government and approved in 2010, permitting early construction of the main shaft and commencement of underground development to extract a 10,000 tonne bulk sample of the mineralization. The Lalor Mine Environment Act license must be obtained before the main shaft is converted from exploration to production purposes. The application is expected to be filed at the end of Q1 2012 and the license received in Q3 2012.
The Lalor Mine license will cover all facilities on the existing Lalor AEP site, including sewage and mine wastewater treatment facilities and the pipelines which carry freshwater into the site and remove treated wastewater from it. The sources of freshwater and facilities where treated wastewater are discharged to the environment are existing operating sites which are licensed pursuant to The Environment Act or regulated under the Federal Metal Mines Effluent Regulation.
Each Environment Act application will involve the submission of an environmental impact assessment report and a public review process. The approval process and time requirements have been contemplated in regards to overall project milestones. There is no indication that the licenses will not be obtained within the project schedule.
20.4 Mineral Lease and Surface Lease
Before mining of ore for production to the market can commence, a mineral lease is required from Manitoba Mines Branch. The mineral lease grants the holder the exclusive right to mine minerals within the lease area. An application has been submitted to convert the Lalor mineral claims to mineral lease and is currently being processed by Manitoba Mines Branch. There is no reason to believe that the requirements for the lease cannot be met within the timelines contemplated in the project schedule.
In specific areas associated with proposed pipeline routes and future improvements to the existing Anderson TIA, surface leases will be required. Activities are currently underway to apply for and obtain the required surface leases. There is no indication that theses leases can not be obtained in the time lines of the Lalor Project.
20.5 Community Support
The main settlement in the region of the Lalor deposit is the Town of Snow Lake, which is an important mining and service centre for the Ecodistrict and surrounding area. Snow Lake has a population of approximately 840 according to the 2006 data from Statistics Canada, with the majority of these residents employed at or supported by the mines located throughout the area. Many other Snow Lake residents are employed in the industries and services that support the region’s mining operations.
Hudbay and AECOM have carried out public consultation, including meetings to inform local communities about the progress of development of the Lalor Project and environmental effects of the Project. It is expected that Manitoba Conservation will take the reports of these meetings into account in the environmental licensing process.
The project will provide jobs for both Flin Flon and the Town of Snow Lake during construction and operation of the mine. The additional feed from the mine will also help ensure the continued employment of Hudbay employees in the Flin Flon and Snow Lake areas. Since the economies of both communities are based on mining, opposition to the project is seen as unlikely.
20.6 Aboriginal People and First Nations
Based on Hudbay’s long-term (more than 50 years) mining experience in the Snow Lake region, there is no known current First Nation or Aboriginal hunting, fishing, trapping or other traditional use in the zone of potential influence for the Lalor Project. There is no First Nation Registered Trapline District or Reserve in the area that will be affected by the Lalor Project. Although development on the Project Site has involved a loss of vegetation and habitat for wildlife, the vegetation and habitat type is common throughout the region.
The Mathias Colomb First Nation (“MCCN”), located 125 km northwest of Snow Lake at the community of Pukatawagan, has asserted a right to be consulted in connection with the Lalor Project. Hudbay currently is engaged in an information sharing process with MCCN and expects to be able to provide Manitoba with all environmental information necessary to
support any Crown consultation that may be required. No delay in Project schedule is anticipated.
20.7 Heritage Resources
The Lalor Project will not affect any known site of potential historical, archaeological or cultural significance. Approximately 20km south of the Lalor Project is Tramping Lake, which is the site of one of Manitoba’s largest known concentrations of aboriginal petrographs. These paintings are thought to have been created 1,500 to 3,000 years ago by the Algonkian-speaking ancestors of the Cree and Ojibway First Nations. Activities associated with the Lalor Project will not have any impact on this historical site.
20.8 Mine Closure Requirements and Plans
The Manitoba Mines and Minerals Act require a closure plan and financial assurance for any advanced exploration or mining project. Manitoba has accepted Closure Plans prepared by SRK in 2005 and financial assurance to cover the full cost of closure for all existing infrastructure that will continue to be used in operation of the Lalor Project. Existing operating facilities which will support the Lalor Project include the Chisel North Mine, which is connected by an underground ramp to the Lalor Project, the Snow Lake Concentrator and Anderson TIA, and piping systems associated with milling and tailings deposition, the Chisel Open Pit and the Chisel North water treatment plant.
Manitoba also has approved the Closure Plan for the Lalor AEP and accepted financial assurance in the amount of $1.5 million. The Lalor AEP Closure Plan was prepared in 2010 and approved as part of the AEP application process. The Lalor AEP Closure Plan will be reviewed and amended, if required, before the Lalor AEP is converted to use for production purposes. No material increase in the required amount of financial assurance is anticipated. It is anticipated that the site of the Lalor Mine will be substantially returned to its natural state in about five to ten years post closure, after which no monitoring or other measures will be required.
The applications for the new Lalor Concentrator and expansion of the Anderson TIA also will require the submission of a closure plan and financial assurance. It is expected that feasibility and design will be completed in 2012 and that closure planning and financial
assurance can be completed in 2013. Allowances for these applications are been made in existing budgets.
21.0 CAPITAL AND OPERATING COSTS
Capital and operating costs are estimated in constant 2012 Canadian dollars.
21.1 Capital Costs
The LOM capital costs are estimated to be $1,073.4M, which includes $703.2M for major project capital as summarized in Table 21.1. The capital cost estimate has an accuracy of +/- 15%. There is an additional $352.8M for sustaining capital, which is $253.7M for capital development and major installations, $99.0M for new mine equipment, replacement equipment and equipment major rebuilds over the entire life of the project and $17.5M for tailings pond expansion. A contingency of $77.6M or 12.4% is included in the major project capital. As of December 31, 2011, $206M of the total $703.2M for major project capital has been incurred.
Mine Major Project capital surface construction costs and shaft sinking and equipping costs were estimated by Stantec Engineering from labour, materials and equipment workups in 2010. Mill construction costs were estimated by AMEC from labour, material and equipment workups in 2011. Equipment capital costs are based on quoted costs from equipment suppliers and development costs are estimated from historical costs from operating Hudbay mines. The capital cost estimate assumes new equipment purchases and potential cost savings from purchasing used equipment was not investigated.
TABLE 21-1 CAPITAL COSTS
|
| Major Project |
|
|
|
|
| ||
|
| Incurred to |
| Forecast |
| Sustaining |
| Total |
|
Surface Construction |
| 67,268 |
| 34,641 |
| 0 |
| 101,909 |
|
Concentrator |
| 0 |
| 173,621 |
| 17,497 |
| 191,118 |
|
Underground Development |
| 73,530 |
| 113,881 |
| 189,054 |
| 376,465 |
|
Mobile Mine Equipment |
| 578 |
| 19,034 |
| 99,030 |
| 118,642 |
|
Fixed Mine Equipment |
| 15,936 |
| 7,516 |
| 0 |
| 23,452 |
|
Indirects & General Mine Expense |
| 4,297 |
| 35,154 |
| 64,679 |
| 104,130 |
|
EPCM |
| 22,801 |
| 57,351 |
| 0 |
| 80,152 |
|
Contingency |
| 21,495 |
| 56,085 |
| 0 |
| 77,580 |
|
Total Capital Cost |
| 205,905 |
| 497,284 |
| 370,260 |
| 1,073,449 |
|
21.2 OPERATING COSTS
Operating costs were estimated from a combination of Hudbay operations, quotes from contractors and from labour and material workups prepared by Stantec Engineering (mine) and AMEC (concentrator). Operating costs include onsite operating development, ore production, concentrating and share of General Mine Expense costs, as well as offsite zinc processing and G&A costs. The total operating LOM costs are estimated to be $102.83/tonne milled or $1,484.1M for the life of the mine, shown in Table 21.2.
TABLE 21-2 OPERATING COSTS
|
| Unit Cost |
| Total |
| |
Ore Extraction |
| 23.12 |
| 333,685 |
| |
Operating Development |
| 4.54 |
| 65,509 |
| |
Subtotal Direct Mining |
| 27.66 |
| 399,194 |
| |
Allocated GME |
| 11.24 |
| 162,253 |
| |
Subtotal Mine Operating |
| 38.90 |
| 561,447 |
| |
|
|
|
|
|
| |
Mill Operating |
| 19.04 |
| 274,805 |
| |
Total Mine/Mill Operating |
| 57.94 |
| 836,252 |
| |
|
|
|
|
|
| |
Zinc Processing |
| 27.25 |
| $ | 393,283 |
|
G & A |
| 17.64 |
| 254,577 |
| |
Total Operating Cost |
| 102.83 |
| 1,484,112 |
| |
22.0 ECONOMIC ANALYSIS
22.1 Cash Flow, NPV, IRR, and Payback Period
The pre-tax cash flow is $269.5M with a NPV8% of $-128.8M and a 4.2% IRR, which is summarized in Table 22-1 The economic analysis includes the $206M of capital expense incurred as of December 31, 2011 and excludes 12,616,000 tonnes of inferred resource. Project payback occurs in 2023, which is the ninth year of commercial production. The revenue by metal is 60.3% from zinc, 21.8% from gold and copper and silver make up the remaining 18% (see Figure 22-1). The annual pre-tax cash flow for Lalor is shown in Table 22-2.
TABLE 22-1 PRE-TAX ECONOMIC MODEL RESULTS
|
| Value |
| Unit Rate |
|
Revenue from Sale of Zinc Metal |
| 1,270,443 |
| 88.02 |
|
Revenue from Sale of Concentrates |
| 1,558,587 |
| 107.99 |
|
Net Revenue |
| 2,829,030 |
| 196.01 |
|
|
|
|
|
|
|
Operating Costs (Table 21-2) |
| 1,484,112 |
| 102.83 |
|
Operating Margin |
| 1,344,918 |
| 93.19 |
|
|
|
|
|
|
|
Major Project Capital (Table 21-1) |
| 703,189 |
| 48.72 |
|
Sustaining Capital (Table 21-1) |
| 370,260 |
| 25.65 |
|
Net Closure, Severance, Salvage |
| 2,000 |
| 0.14 |
|
|
|
|
|
|
|
Pre-Tax Cash flow |
| 269,468 |
| 18.67 |
|
NPV8% |
| -128,761 |
|
|
|
IRR |
| 4.2 | % |
|
|
TABLE 22-2 PRE-TAX CASH FLOW BY YEAR (CDN$)
|
|
|
| 2010 |
| 2011 |
| 2012 |
| 2013 |
| 2014 |
| 2015 |
| 2016 |
| |||||||
Mill Feed |
| Tonnes |
| 0 |
| 0 |
| 74,859 |
| 396,963 |
| 527,554 |
| 850,303 |
| 895,295 |
| |||||||
Gold Head Grade |
| g/tonne |
| 0.00 |
| 0.00 |
| 1.10 |
| 1.05 |
| 2.06 |
| 2.07 |
| 1.66 |
| |||||||
Silver Head Grade |
| g/tonne |
| 0.00 |
| 0.00 |
| 17.85 |
| 17.88 |
| 23.53 |
| 22.73 |
| 18.93 |
| |||||||
Copper Head Grade |
| % |
| 0.00 |
| 0.00 |
| 0.40 |
| 0.39 |
| 0.67 |
| 0.53 |
| 0.54 |
| |||||||
Zinc Head Grade |
| % |
| 0.00 |
| 0.00 |
| 11.37 |
| 11.03 |
| 8.36 |
| 6.05 |
| 8.43 |
| |||||||
|
|
|
|
|
|
|
|
|
|
|
|
|
|
|
|
|
| |||||||
Concentrator Recoveries |
|
|
|
|
|
|
|
|
|
|
|
|
|
|
|
|
| |||||||
Gold Recovery |
| % |
| 62.0 | % | 62.0 | % | 62.0 | % | 62.0 | % | 62.0 | % | 62.0 | % | 62.0 | % | |||||||
Silver Recovery |
| % |
| 68.0 | % | 68.0 | % | 68.0 | % | 68.0 | % | 68.0 | % | 68.0 | % | 68.0 | % | |||||||
Copper Recovery |
| % |
| 85.7 | % | 85.7 | % | 85.7 | % | 85.7 | % | 85.7 | % | 85.7 | % | 85.7 | % | |||||||
Zinc Recovery |
| % |
| 94.0 | % | 94.0 | % | 94.0 | % | 94.0 | % | 94.0 | % | 94.0 | % | 94.0 | % | |||||||
|
|
|
|
|
|
|
|
|
|
|
|
|
|
|
|
|
| |||||||
Copper Concentrate Produced |
| Tonnes |
| 0 |
| 0 |
| 1,283 |
| 6,560 |
| 15,090 |
| 19,362 |
| 20,526 |
| |||||||
Recovered Gold |
| oz |
| 0 |
| 0 |
| 1,639 |
| 8,304 |
| 21,710 |
| 35,056 |
| 29,614 |
| |||||||
Recovered Silver |
| oz |
| 0 |
| 0 |
| 29,214 |
| 155,196 |
| 271,375 |
| 422,483 |
| 370,474 |
| |||||||
Recovered Copper |
| 000's lbs |
| 0 |
| 0 |
| 566 |
| 2,893 |
| 6,654 |
| 8,537 |
| 9,050 |
| |||||||
|
|
|
|
|
|
|
|
|
|
|
|
|
|
|
|
|
| |||||||
Copper Concentrate Sold |
| Tonnes |
| 0 |
| 0 |
| 1,283 |
| 6,560 |
| 15,090 |
| 19,362 |
| 20,526 |
| |||||||
Payable Gold |
| % |
| 0.0 | % | 0.0 | % | 96.5 | % | 96.5 | % | 96.5 | % | 96.5 | % | 96.5 | % | |||||||
Payable Silver |
| % |
| 0.0 | % | 0.0 | % | 90.0 | % | 90.0 | % | 90.0 | % | 90.0 | % | 90.0 | % | |||||||
Payable Copper |
| % |
| 0.0 | % | 0.0 | % | 95.0 | % | 95.0 | % | 95.0 | % | 95.0 | % | 95.0 | % | |||||||
|
|
|
|
|
|
|
|
|
|
|
|
|
|
|
|
|
| |||||||
Payable Gold |
| oz |
| 0 |
| 0 |
| 1,581 |
| 8,013 |
| 20,950 |
| 33,829 |
| 28,577 |
| |||||||
Payable Silver |
| oz |
| 0 |
| 0 |
| 26,293 |
| 139,677 |
| 244,237 |
| 380,234 |
| 333,426 |
| |||||||
Payable Copper |
| 000's lbs |
| 0 |
| 0 |
| 537 |
| 2,748 |
| 6,321 |
| 8,110 |
| 8,598 |
| |||||||
|
|
|
|
|
|
|
|
|
|
|
|
|
|
|
|
|
| |||||||
Zinc Concentrate Produced |
| Tonnes |
| 0 |
| 0 |
| 14,549 |
| 74,835 |
| 75,374 |
| 87,968 |
| 129,029 |
| |||||||
Recovered Gold |
| oz |
| 0 |
| 0 |
| 53 |
| 268 |
| 700 |
| 1,131 |
| 955 |
| |||||||
Recovered Silver |
| oz |
| 0 |
| 0 |
| 4,146 |
| 22,024 |
| 38,511 |
| 59,955 |
| 52,575 |
| |||||||
Recovered Copper |
| 000's lbs |
| 0 |
| 0 |
| 42 |
| 213 |
| 489 |
| 628 |
| 665 |
| |||||||
Recovered Zinc |
| 000's lbs |
| 0 |
| 0 |
| 17,641 |
| 90,741 |
| 91,394 |
| 106,665 |
| 156,453 |
| |||||||
|
|
|
|
|
|
|
|
|
|
|
|
|
|
|
|
|
| |||||||
Zinc Concentrate Sold |
| Tonnes |
| 0 |
| 0 |
| 0 |
| 0 |
| 0 |
| 0 |
| 4,029 |
| |||||||
Payable Silver |
| % |
| 0.0 | % | 0.0 | % | 0.0 | % | 0.0 | % | 0.0 | % | 0.0 | % | 0.0 | % | |||||||
Payable Zinc |
| % |
| 0.0 | % | 0.0 | % | 0.0 | % | 0.0 | % | 0.0 | % | 0.0 | % | 85.0 | % | |||||||
|
|
|
|
|
|
|
|
|
|
|
|
|
|
|
|
|
| |||||||
Payable Silver |
| oz |
| 0 |
| 0 |
| 0 |
| 0 |
| 0 |
| 0 |
| 0 |
| |||||||
Payable Zinc |
| 000's lbs |
| 0 |
| 0 |
| 0 |
| 0 |
| 0 |
| 0 |
| 4,153 |
| |||||||
|
|
|
|
|
|
|
|
|
|
|
|
|
|
|
|
|
| |||||||
Zinc Concentrate Processed |
| Tonnes |
| 0 |
| 0 |
| 14,549 |
| 74,835 |
| 75,374 |
| 87,968 |
| 125,000 |
| |||||||
Recovered Copper |
| % |
| 80.0 | % | 80.0 | % | 80.0 | % | 80.0 | % | 80.0 | % | 80.0 | % | 80.0 | % | |||||||
Recovered Zinc |
| % |
| 97.5 | % | 97.5 | % | 97.5 | % | 97.5 | % | 97.5 | % | 97.5 | % | 97.5 | % | |||||||
|
|
|
|
|
|
|
|
|
|
|
|
|
|
|
|
|
| |||||||
Recovered Copper |
| 000's lbs |
| 0 |
| 0 |
| 33 |
| 170 |
| 391 |
| 502 |
| 516 |
| |||||||
Recovered Zinc |
| 000's lbs |
| 0 |
| 0 |
| 17,200 |
| 88,472 |
| 89,109 |
| 103,998 |
| 147,779 |
| |||||||
|
|
|
|
|
|
|
|
|
|
|
|
|
|
|
|
|
| |||||||
Copper to Copper Cake |
| 000's lbs |
| 0 |
| 0 |
| 33 |
| 170 |
| 391 |
| 502 |
| 516 |
| |||||||
|
|
|
|
|
|
|
|
|
|
|
|
|
|
|
|
|
| |||||||
Metal Prices |
|
|
|
|
|
|
|
|
|
|
|
|
|
|
|
|
| |||||||
Gold Price |
| US$/oz |
| $ | 1,150.00 |
| $ | 1,425.00 |
| $ | 1,800.00 |
| $ | 1,700.00 |
| $ | 1,450.00 |
| $ | 1,350.00 |
| $ | 1,250.00 |
|
Silver Price |
| US$/oz |
| $ | 18.50 |
| $ | 36.00 |
| $ | 35.00 |
| $ | 35.00 |
| $ | 28.00 |
| $ | 26.00 |
| $ | 24.00 |
|
Copper Price |
| US$/lb |
| $ | 3.35 |
| $ | 4.20 |
| $ | 3.75 |
| $ | 3.75 |
| $ | 3.40 |
| $ | 3.00 |
| $ | 2.75 |
|
Zinc Price |
| US$/lb |
| $ | 0.95 |
| $ | 1.05 |
| $ | 1.00 |
| $ | 1.05 |
| $ | 1.10 |
| $ | 1.10 |
| $ | 1.00 |
|
Exchange Rate |
| CDN$/US$ |
|
|
|
|
| 1.000 |
| 1.010 |
| 1.010 |
| 1.020 |
| 1.050 |
| |||||||
|
|
|
|
|
|
|
|
|
|
|
|
|
|
|
|
|
| |||||||
Revenue From Operations |
| CDN$ 000's |
| $ | 0 |
| $ | 0 |
| $ | 23,153 |
| $ | 124,224 |
| $ | 160,060 |
| $ | 200,127 |
| $ | 232,344 |
|
3rd Party Treatment Charges & Freight |
| CDN$ 000's |
| $ | 0 |
| $ | 0 |
| $ | (390 | ) | $ | (2,004 | ) | $ | (4,801 | ) | $ | (6,533 | ) | $ | (8,284 | ) |
Net Revenue |
| CDN$ 000's |
| $ | 0 |
| $ | 0 |
| $ | 22,763 |
| $ | 122,220 |
| $ | 155,260 |
| $ | 193,595 |
| $ | 224,060 |
|
|
|
|
|
|
|
|
|
|
|
|
|
|
|
|
|
|
| |||||||
Costs |
|
|
|
|
|
|
|
|
|
|
|
|
|
|
|
|
| |||||||
Mine Operating |
| CDN$ 000's |
| $ | 0 |
| $ | 0 |
| $ | (7,309 | ) | $ | (22,491 | ) | $ | (26,174 | ) | $ | (30,941 | ) | $ | (31,969 | ) |
Mill Operating |
| CDN$ 000's |
| $ | 0 |
| $ | 0 |
| $ | (2,946 | ) | $ | (11,487 | ) | $ | (13,333 | ) | $ | (16,667 | ) | $ | (17,754 | ) |
Processing & Refining |
| CDN$ 000's |
| $ | 0 |
| $ | 0 |
| $ | (5,514 | ) | $ | (28,362 | ) | $ | (28,567 | ) | $ | (33,340 | ) | $ | (47,375 | ) |
G & A |
| CDN$ 000's |
| $ | 0 |
| $ | 0 |
| $ | (6,818 | ) | $ | (19,247 | ) | $ | (20,910 | ) | $ | (22,071 | ) | $ | (23,866 | ) |
Initial Capital |
| CDN$ 000's |
| $ | (59,058 | ) | $ | (146,847 | ) | $ | (143,015 | ) | $ | (168,977 | ) | $ | (185,291 | ) | $ | 0 |
| $ | 0 |
|
Sustaining Capital |
| CDN$ 000's |
| $ | 0 |
| $ | 0 |
| $ | 0 |
| $ | (11,356 | ) | $ | (23,338 | ) | $ | (51,515 | ) | $ | (52,520 | ) |
Closure |
| CDN$ 000's |
| $ | 0 |
| $ | 0 |
| $ | 0 |
| $ | 0 |
| $ | 0 |
| $ | 0 |
| $ | 0 |
|
Earnings Before Income & Mining Taxes |
| CDN$ 000's |
| $ | (59,058 | ) | $ | (146,847 | ) | $ | (142,839 | ) | $ | (139,700 | ) | $ | (142,353 | ) | $ | 39,061 |
| $ | 50,577 |
|
Continuation of Table 22-2.
|
|
|
| 2017 |
| 2018 |
| 2019 |
| 2020 |
| 2021 |
| 2022 |
| 2023 |
| |||||||
Mill Feed |
| Tonnes |
| 1,058,025 |
| 1,194,600 |
| 1,194,600 |
| 1,194,600 |
| 1,194,600 |
| 1,194,600 |
| 1,194,600 |
| |||||||
Gold Head Grade |
| g/tonne |
| 1.39 |
| 1.59 |
| 1.59 |
| 1.58 |
| 2.00 |
| 1.85 |
| 1.94 |
| |||||||
Silver Head Grade |
| g/tonne |
| 19.04 |
| 21.75 |
| 22.01 |
| 22.26 |
| 24.75 |
| 24.56 |
| 26.29 |
| |||||||
Copper Head Grade |
| % |
| 0.51 |
| 0.57 |
| 0.58 |
| 0.55 |
| 0.68 |
| 0.61 |
| 0.63 |
| |||||||
Zinc Head Grade |
| % |
| 7.87 |
| 7.54 |
| 7.09 |
| 7.02 |
| 6.46 |
| 6.50 |
| 6.95 |
| |||||||
|
|
|
|
|
|
|
|
|
|
|
|
|
|
|
|
|
| |||||||
Concentrator Recoveries |
|
|
|
|
|
|
|
|
|
|
|
|
|
|
|
|
| |||||||
Gold Recovery |
| % |
| 62.0 | % | 62.0 | % | 62.0 | % | 62.0 | % | 62.0 | % | 62.0 | % | 62.0 | % | |||||||
Silver Recovery |
| % |
| 68.0 | % | 68.0 | % | 68.0 | % | 68.0 | % | 68.0 | % | 68.0 | % | 68.0 | % | |||||||
Copper Recovery |
| % |
| 85.7 | % | 85.7 | % | 85.7 | % | 85.7 | % | 85.7 | % | 85.7 | % | 85.7 | % | |||||||
Zinc Recovery |
| % |
| 94.0 | % | 94.0 | % | 94.0 | % | 94.0 | % | 94.0 | % | 94.0 | % | 94.0 | % | |||||||
|
|
|
|
|
|
|
|
|
|
|
|
|
|
|
|
|
| |||||||
Copper Concentrate Produced |
| Tonnes |
| 22,910 |
| 29,220 |
| 29,916 |
| 28,228 |
| 34,925 |
| 31,324 |
| 32,411 |
| |||||||
Recovered Gold |
| oz |
| 29,342 |
| 37,749 |
| 37,955 |
| 37,695 |
| 47,543 |
| 44,171 |
| 46,289 |
| |||||||
Recovered Silver |
| oz |
| 440,324 |
| 567,942 |
| 574,881 |
| 581,325 |
| 646,330 |
| 641,447 |
| 686,620 |
| |||||||
Recovered Copper |
| 000's lbs |
| 10,101 |
| 12,884 |
| 13,190 |
| 12,446 |
| 15,399 |
| 13,812 |
| 14,291 |
| |||||||
|
|
|
|
|
|
|
|
|
|
|
|
|
|
|
|
|
| |||||||
Copper Concentrate Sold |
| Tonnes |
| 22,910 |
| 29,220 |
| 29,916 |
| 28,228 |
| 34,925 |
| 31,324 |
| 32,411 |
| |||||||
Payable Gold |
| % |
| 96.5 | % | 96.5 | % | 96.5 | % | 96.5 | % | 96.5 | % | 96.5 | % | 96.5 | % | |||||||
Payable Silver |
| % |
| 90.0 | % | 90.0 | % | 90.0 | % | 90.0 | % | 90.0 | % | 90.0 | % | 90.0 | % | |||||||
Payable Copper |
| % |
| 95.0 | % | 95.0 | % | 95.0 | % | 95.0 | % | 95.0 | % | 95.0 | % | 95.0 | % | |||||||
|
|
|
|
|
|
|
|
|
|
|
|
|
|
|
|
|
| |||||||
Payable Gold |
| oz |
| 28,315 |
| 36,428 |
| 36,627 |
| 36,375 |
| 45,879 |
| 42,625 |
| 44,669 |
| |||||||
Payable Silver |
| oz |
| 396,292 |
| 511,148 |
| 517,393 |
| 523,193 |
| 581,697 |
| 577,302 |
| 617,958 |
| |||||||
Payable Copper |
| 000's lbs |
| 9,596 |
| 12,240 |
| 12,531 |
| 11,824 |
| 14,629 |
| 13,121 |
| 13,576 |
| |||||||
|
|
|
|
|
|
|
|
|
|
|
|
|
|
|
|
|
| |||||||
Zinc Concentrate Produced |
| Tonnes |
| 142,379 |
| 153,853 |
| 144,750 |
| 143,249 |
| 131,986 |
| 132,744 |
| 141,924 |
| |||||||
Recovered Gold |
| oz |
| 947 |
| 1,218 |
| 1,224 |
| 1,216 |
| 1,534 |
| 1,425 |
| 1,493 |
| |||||||
Recovered Silver |
| oz |
| 62,487 |
| 80,598 |
| 81,582 |
| 82,497 |
| 91,722 |
| 91,029 |
| 97,439 |
| |||||||
Recovered Copper |
| 000's lbs |
| 743 |
| 947 |
| 970 |
| 915 |
| 1,132 |
| 1,015 |
| 1,051 |
| |||||||
Recovered Zinc |
| 000's lbs |
| 172,640 |
| 186,553 |
| 175,516 |
| 173,695 |
| 160,038 |
| 160,958 |
| 172,089 |
| |||||||
|
|
|
|
|
|
|
|
|
|
|
|
|
|
|
|
|
| |||||||
Zinc Concentrate Sold |
| Tonnes |
| 22,379 |
| 33,439 |
| 438 |
| 0 |
| 0 |
| 132,744 |
| 141,924 |
| |||||||
Payable Silver |
| % |
| 0.0 | % | 0.0 | % | 0.0 | % | 0.0 | % | 0.0 | % | 0.0 | % | 0.0 | % | |||||||
Payable Zinc |
| % |
| 85.0 | % | 85.0 | % | 85.0 | % | 0.0 | % | 0.0 | % | 85.0 | % | 85.0 | % | |||||||
|
|
|
|
|
|
|
|
|
|
|
|
|
|
|
|
|
| |||||||
Payable Silver |
| oz |
| 0 |
| 0 |
| 0 |
| 0 |
| 0 |
| 0 |
| 0 |
| |||||||
Payable Zinc |
| 000's lbs |
| 23,065 |
| 34,464 |
| 451 |
| 0 |
| 0 |
| 136,814 |
| 146,276 |
| |||||||
|
|
|
|
|
|
|
|
|
|
|
|
|
|
|
|
|
| |||||||
Zinc Concentrate Processed |
| Tonnes |
| 120,000 |
| 120,414 |
| 144,312 |
| 143,249 |
| 131,986 |
| 0 |
| 0 |
| |||||||
Recovered Copper |
| % |
| 80.0 | % | 80.0 | % | 80.0 | % | 80.0 | % | 80.0 | % | 80.0 | % | 80.0 | % | |||||||
Recovered Zinc |
| % |
| 97.5 | % | 97.5 | % | 97.5 | % | 97.5 | % | 97.5 | % | 97.5 | % | 97.5 | % | |||||||
|
|
|
|
|
|
|
|
|
|
|
|
|
|
|
|
|
| |||||||
Recovered Copper |
| 000's lbs |
| 501 |
| 593 |
| 773 |
| 732 |
| 906 |
| 0 |
| 0 |
| |||||||
Recovered Zinc |
| 000's lbs |
| 141,867 |
| 142,357 |
| 170,610 |
| 169,353 |
| 156,037 |
| 0 |
| 0 |
| |||||||
|
|
|
|
|
|
|
|
|
|
|
|
|
|
|
|
|
| |||||||
Copper to Copper Cake |
| 000's lbs |
| 501 |
| 593 |
| 773 |
| 732 |
| 906 |
| 0 |
| 0 |
| |||||||
|
|
|
|
|
|
|
|
|
|
|
|
|
|
|
|
|
| |||||||
Metal Prices |
|
|
|
|
|
|
|
|
|
|
|
|
|
|
|
|
| |||||||
Gold Price |
| US$/oz |
| $ | 1,100.00 |
| $ | 1,100.00 |
| $ | 1,100.00 |
| $ | 1,100.00 |
| $ | 1,100.00 |
| $ | 1,100.00 |
| $ | 1,100.00 |
|
Silver Price |
| US$/oz |
| $ | 22.00 |
| $ | 22.00 |
| $ | 22.00 |
| $ | 22.00 |
| $ | 22.00 |
| $ | 22.00 |
| $ | 22.00 |
|
Copper Price |
| US$/lb |
| $ | 2.75 |
| $ | 2.75 |
| $ | 2.75 |
| $ | 2.75 |
| $ | 2.75 |
| $ | 2.75 |
| $ | 2.75 |
|
Zinc Price |
| US$/lb |
| $ | 0.95 |
| $ | 0.95 |
| $ | 0.95 |
| $ | 0.95 |
| $ | 0.95 |
| $ | 0.95 |
| $ | 0.95 |
|
Exchange Rate |
| CDN$/US$ |
| 1.050 |
| 1.050 |
| 1.050 |
| 1.050 |
| 1.050 |
| 1.050 |
| 1.050 |
| |||||||
|
|
|
|
|
|
|
|
|
|
|
|
|
|
|
|
|
| |||||||
Revenue From Operations |
| CDN$000's |
| $ | 235,095 |
| $ | 266,204 |
| $ | 264,068 |
| $ | 260,093 |
| $ | 267,483 |
| $ | 229,745 |
| $ | 243,300 |
|
3rd Party Treatment Charges & Freight |
| CDN$000's |
| $ | (15,072 | ) | $ | (20,819 | ) | $ | (10,241 | ) | $ | (9,556 | ) | $ | (11,793 | ) | $ | (53,993 | ) | $ | (57,391 | ) |
Net Revenue |
| CDN$000's |
| $ | 220,023 |
| $ | 245,386 |
| $ | 253,827 |
| $ | 250,538 |
| $ | 255,690 |
| $ | 175,751 |
| $ | 185,909 |
|
|
|
|
|
|
|
|
|
|
|
|
|
|
|
|
|
|
| |||||||
Costs |
|
|
|
|
|
|
|
|
|
|
|
|
|
|
|
|
| |||||||
Mine Operating |
| CDN$000's |
| $ | (37,912 | ) | $ | (42,998 | ) | $ | (43,662 | ) | $ | (42,204 | ) | $ | (42,558 | ) | $ | (41,702 | ) | $ | (40,292 | ) |
Mill Operating |
| CDN$000's |
| $ | (19,541 | ) | $ | (21,112 | ) | $ | (20,980 | ) | $ | (20,931 | ) | $ | (20,859 | ) | $ | (20,815 | ) | $ | (20,975 | ) |
Processing & Refining |
| CDN$000's |
| $ | (45,480 | ) | $ | (45,637 | ) | $ | (54,694 | ) | $ | (54,291 | ) | $ | (50,023 | ) | $ | 0 |
| $ | 0 |
|
G & A |
| CDN$000's |
| $ | (22,238 | ) | $ | (24,628 | ) | $ | (30,410 | ) | $ | (35,720 | ) | $ | (35,993 | ) | $ | (2,635 | ) | $ | (3,054 | ) |
Initial Capital |
| CDN$000's |
| $ | 0 |
| $ | 0 |
| $ | 0 |
| $ | 0 |
| $ | 0 |
| $ | 0 |
| $ | 0 |
|
Sustaining Capital |
| CDN$000's |
| $ | (31,251 | ) | $ | (27,954 | ) | $ | (26,083 | ) | $ | (26,232 | ) | $ | (26,592 | ) | $ | (26,749 | ) | $ | (26,413 | ) |
Closure |
| CDN$000's |
| $ | 0 |
| $ | 0 |
| $ | 0 |
| $ | 0 |
| $ | 0 |
| $ | 0 |
| $ | 0 |
|
Earnings Before Income & Mining Taxes |
| CDN$000's |
| $ | 63,602 |
| $ | 83,057 |
| $ | 77,997 |
| $ | 71,160 |
| $ | 79,664 |
| $ | 83,851 |
| $ | 95,175 |
|
Continuation of Table 22-2.
|
|
|
| 2024 |
| 2025 |
| 2026 |
| 2027 |
| 2028 |
| 2029 |
| Total |
| |||||||
Mill Feed |
| Tonnes |
| 1,008,450 |
| 1,036,161 |
| 815,947 |
| 601,602 |
| 0 |
| 0 |
| 14,432,759 |
| |||||||
Gold Head Grade |
| g/tonne |
| 1.93 |
| 2.04 |
| 2.43 |
| 3.08 |
| 1.76 |
| 2.37 |
| 1.86 |
| |||||||
Silver Head Grade |
| g/tonne |
| 24.92 |
| 27.28 |
| 28.48 |
| 27.90 |
| 24.44 |
| 29.10 |
| 23.55 |
| |||||||
Copper Head Grade |
| % |
| 0.62 |
| 0.62 |
| 0.63 |
| 0.79 |
| 0.53 |
| 0.80 |
| 0.60 |
| |||||||
Zinc Head Grade |
| % |
| 6.74 |
| 6.12 |
| 5.21 |
| 4.42 |
| 6.86 |
| 6.74 |
| 6.95 |
| |||||||
|
|
|
|
|
|
|
|
|
|
|
|
|
|
|
|
|
| |||||||
Concentrator Recoveries |
|
|
|
|
|
|
|
|
|
|
|
|
|
|
|
|
| |||||||
Gold Recovery |
| % |
| 62.0 | % | 62.0 | % | 62.0 | % | 62.0 | % | 62.0 | % | 62.0 | % | 62.0 | % | |||||||
Silver Recovery |
| % |
| 68.0 | % | 68.0 | % | 68.0 | % | 68.0 | % | 68.0 | % | 68.0 | % | 68.0 | % | |||||||
Copper Recovery |
| % |
| 85.7 | % | 85.7 | % | 85.7 | % | 85.7 | % | 85.7 | % | 85.7 | % | 85.7 | % | |||||||
Zinc Recovery |
| % |
| 94.0 | % | 94.0 | % | 94.0 | % | 94.0 | % | 94.0 | % | 94.0 | % | 94.0 | % | |||||||
|
|
|
|
|
|
|
|
|
|
|
|
|
|
|
|
|
| |||||||
Copper Concentrate Produced |
| Tonnes |
| 26,901 |
| 27,575 |
| 22,022 |
| 20,350 |
| 0 |
| 0 |
| 368,601 |
| |||||||
Recovered Gold |
| oz |
| 38,880 |
| 42,128 |
| 39,445 |
| 36,896 |
| 0 |
| 0 |
| 534,415 |
| |||||||
Recovered Silver |
| oz |
| 549,375 |
| 617,926 |
| 508,025 |
| 366,911 |
| 0 |
| 0 |
| 7,429,849 |
| |||||||
Recovered Copper |
| 000's lbs |
| 11,861 |
| 12,158 |
| 9,710 |
| 8,973 |
| 0 |
| 0 |
| 162,525 |
| |||||||
|
|
|
|
|
|
|
|
|
|
|
|
|
|
|
|
|
| |||||||
Copper Concentrate Sold |
| Tonnes |
| 26,901 |
| 27,575 |
| 22,022 |
| 20,350 |
| 0 |
| 0 |
| 368,601 |
| |||||||
Payable Gold |
| % |
| 96.5 | % | 96.5 | % | 96.5 | % | 96.5 | % | 0.0 | % | 0.0 | % | 96.5 | % | |||||||
Payable Silver |
| % |
| 90.0 | % | 90.0 | % | 90.0 | % | 90.0 | % | 0.0 | % | 0.0 | % | 90.0 | % | |||||||
Payable Copper |
| % |
| 95.0 | % | 95.0 | % | 95.0 | % | 95.0 | % | 0.0 | % | 0.0 | % | 95.0 | % | |||||||
|
|
|
|
|
|
|
|
|
|
|
|
|
|
|
|
|
| |||||||
Payable Gold |
| oz |
| 37,519 |
| 40,654 |
| 38,064 |
| 35,605 |
| 0 |
| 0 |
| 515,711 |
| |||||||
Payable Silver |
| oz |
| 494,437 |
| 556,133 |
| 457,223 |
| 330,220 |
| 0 |
| 0 |
| 6,686,864 |
| |||||||
Payable Copper |
| 000's lbs |
| 11,268 |
| 11,550 |
| 9,225 |
| 8,524 |
| 0 |
| 0 |
| 154,399 |
| |||||||
|
|
|
|
|
|
|
|
|
|
|
|
|
|
|
|
|
| |||||||
Zinc Concentrate Produced |
| Tonnes |
| 116,215 |
| 108,350 |
| 72,667 |
| 45,405 |
| 0 |
| 0 |
| 1,715,276 |
| |||||||
Recovered Gold |
| oz |
| 1,254 |
| 1,359 |
| 1,272 |
| 1,190 |
| 0 |
| 0 |
| 17,239 |
| |||||||
Recovered Silver |
| oz |
| 77,963 |
| 87,691 |
| 72,095 |
| 52,069 |
| 0 |
| 0 |
| 1,054,383 |
| |||||||
Recovered Copper |
| 000's lbs |
| 872 |
| 894 |
| 714 |
| 660 |
| 0 |
| 0 |
| 11,948 |
| |||||||
Recovered Zinc |
| 000's lbs |
| 140,916 |
| 131,378 |
| 88,112 |
| 55,055 |
| 0 |
| 0 |
| 2,079,845 |
| |||||||
|
|
|
|
|
|
|
|
|
|
|
|
|
|
|
|
|
| |||||||
Zinc Concentrate Sold |
| Tonnes |
| 116,215 |
| 108,350 |
| 72,667 |
| 45,405 |
| 0 |
| 0 |
| 677,590 |
| |||||||
Payable Silver |
| % |
| 0.0 | % | 0.0 | % | 0.0 | % | 0.0 | % | 0.0 | % | 0.0 | % | 0.0 | % | |||||||
Payable Zinc |
| % |
| 85.0 | % | 85.0 | % | 85.0 | % | 85.0 | % | 0.0 | % | 0.0 | % | 85.0 | % | |||||||
|
|
|
|
|
|
|
|
|
|
|
|
|
|
|
|
|
| |||||||
Payable Silver |
| oz |
| 0 |
| 0 |
| 0 |
| 0 |
| 0 |
| 0 |
| 0 |
| |||||||
Payable Zinc |
| 000's lbs |
| 119,778 |
| 111,672 |
| 74,895 |
| 46,797 |
| 0 |
| 0 |
| 698,365 |
| |||||||
|
|
|
|
|
|
|
|
|
|
|
|
|
|
|
|
|
| |||||||
Zinc Concentrate Processed |
| Tonnes |
| 0 |
| 0 |
| 0 |
| 0 |
| 0 |
| 0 |
| 1,037,687 |
| |||||||
Recovered Copper |
| % |
| 80.0 | % | 80.0 | % | 80.0 | % | 80.0 | % | 80.0 | % | 80.0 | % | 80.0 | % | |||||||
Recovered Zinc |
| % |
| 97.5 | % | 97.5 | % | 97.5 | % | 97.5 | % | 97.5 | % | 97.5 | % | 97.5 | % | |||||||
|
|
|
|
|
|
|
|
|
|
|
|
|
|
|
|
|
| |||||||
Recovered Copper |
| 000's lbs |
| 0 |
| 0 |
| 0 |
| 0 |
| 0 |
| 0 |
| 5,117 |
| |||||||
Recovered Zinc |
| 000's lbs |
| 0 |
| 0 |
| 0 |
| 0 |
| 0 |
| 0 |
| 1,226,783 |
| |||||||
|
|
|
|
|
|
|
|
|
|
|
|
|
|
|
|
|
| |||||||
Copper to Copper Cake |
| 000's lbs |
| 0 |
| 0 |
| 0 |
| 0 |
| 0 |
| 0 |
| 5,117 |
| |||||||
|
|
|
|
|
|
|
|
|
|
|
|
|
|
|
|
|
| |||||||
Metal Prices |
|
|
|
|
|
|
|
|
|
|
|
|
|
|
|
|
| |||||||
Gold Price |
| US$/oz |
| $ | 1,100.00 |
| $ | 1,100.00 |
| $ | 1,100.00 |
| $ | 1,100.00 |
| $ | 1,100.00 |
| $ | 1,100.00 |
| $ | 1,150.40 |
|
Silver Price |
| US$/oz |
| $ | 22.00 |
| $ | 22.00 |
| $ | 22.00 |
| $ | 22.00 |
| $ | 22.00 |
| $ | 22.00 |
| $ | 22.87 |
|
Copper Price |
| US$/lb |
| $ | 2.75 |
| $ | 2.75 |
| $ | 2.75 |
| $ | 2.75 |
| $ | 2.75 |
| $ | 2.75 |
| $ | 2.81 |
|
Zinc Price |
| US$/lb |
| $ | 0.95 |
| $ | 0.95 |
| $ | 0.95 |
| $ | 0.95 |
| $ | 0.95 |
| $ | 0.95 |
| $ | 0.97 |
|
Exchange Rate |
| CDN$/US$ |
| 1.050 |
| 1.050 |
| 1.050 |
| 1.050 |
| 1.050 |
| 1.050 |
| 1.044 |
| |||||||
|
|
|
|
|
|
|
|
|
|
|
|
|
|
|
|
|
| |||||||
Revenue From Operations |
| CDN$000's |
| $ | 200,484 |
| $ | 198,683 |
| $ | 151,938 |
| $ | 117,588 |
| $ | 0 |
| $ | 0 |
| $ | 3,174,590 |
|
3rd Party Treatment Charges & Freight |
| CDN$000's |
| $ | (47,105 | ) | $ | (44,763 | ) | $ | (31,207 | ) | $ | (21,611 | ) | $ | 0 |
| $ | 0 |
| $ | (345,561 | ) |
Net Revenue |
| CDN$000's |
| $ | 153,379 |
| $ | 153,920 |
| $ | 120,731 |
| $ | 95,977 |
| $ | 0 |
| $ | 0 |
| $ | 2,829,030 |
|
|
|
|
|
|
|
|
|
|
|
|
|
|
|
|
|
|
| |||||||
Costs |
|
|
|
|
|
|
|
|
|
|
|
|
|
|
|
|
| |||||||
Mine Operating |
| CDN$000's |
| $ | (38,478 | ) | $ | (40,637 | ) | $ | (39,311 | ) | $ | (32,809 | ) | $ | 0 |
| $ | 0 |
| $ | (561,447 | ) |
Mill Operating |
| CDN$000's |
| $ | (18,724 | ) | $ | (18,874 | ) | $ | (16,145 | ) | $ | (13,662 | ) | $ | 0 |
| $ | 0 |
| $ | (274,805 | ) |
Processing & Refining |
| CDN$000's |
| $ | 0 |
| $ | 0 |
| $ | 0 |
| $ | 0 |
| $ | 0 |
| $ | 0 |
| $ | (393,283 | ) |
G & A |
| CDN$000's |
| $ | (2,398 | ) | $ | (1,824 | ) | $ | (1,425 | ) | $ | (1,340 | ) | $ | 0 |
| $ | 0 |
| $ | (254,577 | ) |
Initial Capital |
| CDN$000's |
| $ | 0 |
| $ | 0 |
| $ | 0 |
| $ | 0 |
| $ | 0 |
| $ | 0 |
| $ | (703,189 | ) |
Sustaining Capital |
| CDN$000's |
| $ | (22,209 | ) | $ | (15,825 | ) | $ | (2,224 | ) | $ | 0 |
| $ | 0 |
| $ | 0 |
| $ | (370,261 | ) |
Closure |
| CDN$000's |
| $ | 0 |
| $ | 0 |
| $ | 0 |
| $ | 0 |
| $ | (1,500 | ) | $ | (500 | ) | $ | (2,000 | ) |
Earnings Before Income & Mining Taxes |
| CDN$000's |
| $ | 71,569 |
| $ | 76,760 |
| $ | 61,626 |
| $ | 48,166 |
| $ | (1,500 | ) | $ | (500 | ) | $ | 269,468 |
|
22.2 Principal Assumptions
The metal prices and exchange rates used in the economic analysis are based on forecasted metal prices from 11 well known financial institutions as of November 22, 2011. Long term equilibrium prices (LTEP) is used from 2017 onward. The metal prices used in the economic analysis are shown in Table 22-3.
TABLE 22-3 METAL AND EXCHANGE RATE PRICE DECK
Metal |
| 2012 |
| 2013 |
| 2014 |
| 2015 |
| 2016 |
| LTEP |
|
Gold (US$/oz) |
| 1,800 |
| 1,700 |
| 1,450 |
| 1,350 |
| 1,250 |
| 1,100 |
|
Silver (US$/oz) |
| 35.00 |
| 35.00 |
| 28.00 |
| 26.00 |
| 24.00 |
| 22.00 |
|
Copper (US$/lb) |
| 3.75 |
| 3.75 |
| 3.40 |
| 3.00 |
| 2.75 |
| 2.75 |
|
Zinc (US$/lb) |
| 1.00 |
| 1.05 |
| 1.10 |
| 1.10 |
| 1.00 |
| 0.95 |
|
CDN$/US$ |
| 1.00 |
| 1.01 |
| 1.01 |
| 1.02 |
| 1.05 |
| 1.05 |
|
Two concentrates will be produced. Zinc recovery to zinc concentrate is 94%, producing a 55% zinc grade concentrate shown in Table 22-4. Recoveries to copper concentrate are 86% copper, 62% gold and 68% silver. The copper concentrate grade is 20% copper. Metal recoveries and concentrate grade were based on the results of the metallurgical program as discussed in Section 13 of this report.
TABLE 22-4 METAL AND EXCHANGE RATE PRICE DECK
Metal |
| Bulk Copper Concentrate |
| Zinc Concentrate |
|
Gold |
| 62 | % |
|
|
Silver |
| 68 | % |
|
|
Copper |
| 86 | % |
|
|
Zinc |
|
|
| 94 | % |
Mine Major Project capital surface construction costs and shaft sinking and equipping costs were estimated by Stantec Engineering from labour, materials and equipment workups.
Mill construction capital costs and operating costs were estimated by AMEC from labour, material and equipment workups in 2011.
Equipment capital costs are based on quoted costs from equipment suppliers.
Capital mine development and mine operating costs were estimated by Stantec and Hudbay from labour and material workups and from historical costs from operating Hudbay mines.
Hudbay zinc plant operating costs and allocated General & Administrative overheads are based on internal 2012 budget costs.
Third party concentrate freight, smelter terms and refinery costs are based on Hudbay long term contract agreements and assumptions, summarized in Table 22-5. Other model parameters used in the economic analysis are shown in Table 22-6.
TABLE 22-5 SMELTER AND REFINING COSTS
|
|
|
|
|
| Zinc |
| Copper |
| Zinc |
| |||
Payables |
| Primary Metal |
| % |
| 100 | % | 95 | % | 85 | % | |||
|
| Gold |
| % |
| 0 | % | 97 | % | 0 | % | |||
|
| Silver |
| % |
| 0 | % | 90 | % | 0 | % | |||
|
|
|
|
|
|
|
|
|
|
|
| |||
Treatment Charge |
|
|
| CDN$/t conc |
| $ | 379.00 |
| $ | 77.60 |
| $ | 189.73 |
|
Freight to Smelter |
|
|
| CDN$/t conc |
| N/A |
| $ | 185.60 |
| $ | 140.53 |
| |
Lead Penalty |
|
|
| CDN$/t conc |
|
|
| $ | 10.13 |
|
|
| ||
|
|
|
|
|
|
|
|
|
|
|
| |||
Refining |
| Gold |
| CDN$/oz |
|
|
| $ | 5.23 |
|
|
| ||
|
| Silver |
| CDN$/oz |
|
|
| $ | 0.52 |
|
|
| ||
|
| Copper |
| CDN$/lb |
|
|
| $ | 0.078 |
|
|
| ||
TABLE 22-6 ECONOMIC MODEL PARAMETERS
Parameter |
|
|
| Input |
|
Preproduction Period |
| 2010 to 2014 |
| 5 years |
|
Mine Life |
| 2015 to 2027 |
| 13 years |
|
Operating Days per Year |
|
|
| 362 days |
|
Production Rate |
|
|
| 3,300dmt/day |
|
The assumed LOM production, shown in Table 22-7, is based on the diluted, recovered and economic portion of the indicated mineral resource.
TABLE 22-7 MINE PRODUCTION SUMMARY
Parameter |
| Units |
| Probable Reserves |
|
Production |
| tonnes |
| 14,432,000 |
|
|
|
|
|
|
|
Gold Grade |
| g/t |
| 1.86 |
|
Silver Grade |
| g/t |
| 23.55 |
|
Copper Grade |
| % |
| 0.60 |
|
Zinc Grade |
| % |
| 6.95 |
|
|
|
|
|
|
|
Contained Gold |
| oz |
| 861,961 |
|
Contained Silver |
| oz |
| 10,926,256 |
|
Contained Copper |
| tonnes |
| 86,021 |
|
Contained Zinc |
| tonnes |
| 1,003,619 |
|
The estimate of bulk copper concentrate, zinc concentrate and payable metals produced over the LOM are summarized in Table 22-8 and 22-9. Payable copper is calculated from bulk copper concentrates sold and copper cake produced as a secondary zinc plant product. Payable zinc is refined metal produced by Hudbay plus payable zinc in concentrates sold.
TABLE 22-8 LOM CONCENTRATOR PRODUCTION
Parameter |
| Units |
| Copper |
| Zinc Concentrate |
|
Concentrate Produced |
| tonnes |
| 368,601 |
| 1,715,276 |
|
|
|
|
|
|
|
|
|
Gold Grade |
| g/t |
| 45.10 |
|
|
|
Silver Grade |
| g/t |
| 626.95 |
|
|
|
Copper Grade |
| % |
| 20.00 |
|
|
|
Zinc Grade |
| % |
|
|
| 55.00 |
|
|
|
|
|
|
|
|
|
Contained Gold |
| oz |
| 534,416 |
|
|
|
Contained Silver |
| oz |
| 7,429,854 |
|
|
|
Contained Copper |
| tonnes |
| 73,720 |
|
|
|
Contained Zinc |
| tonnes |
|
|
| 943,402 |
|
TABLE 22-9 LOM PAYABLE METALS
Parameter |
| Units |
| Quantity |
|
Gold |
| oz |
| 515,711 |
|
Silver |
| oz |
| 6,686,869 |
|
Copper |
| 000’s lb |
| 159,516 |
|
Zinc |
| 000’s lb |
| 2,726,206 |
|
22.3 Sensitivity Analysis
A sensitivity analysis for Lalor project is summarized in Figure 22-2. The project is most sensitive to the exchange rate followed by metal prices, mined grade, operating costs, and capital costs respectively.
FIGURE 22-2 SENSITIVITIES
Sensitivities to the base case commodity price and exchange rate assumptions are shown in Table 22-10. The three year historical price case improves the pre-tax cash flow to $356.7M and has minimal impact on IRR.
TABLE 22-10 BASE CASE COMPARISON
|
| Base Case |
| 3 Year Historical |
|
Price and Exchange Weighted Averages |
|
|
|
|
|
Gold (US$/oz) |
| 1,150.40 |
| 1,301.00 |
|
Silver (US$/oz) |
| 22.87 |
| 24.50 |
|
Copper (US$/lb) |
| 2.81 |
| 3.38 |
|
Zinc (US$/lb) |
| 0.97 |
| 0.93 |
|
Exchange (CDN$/US$) |
| 1.044 |
| 1.04 |
|
|
|
|
|
|
|
Pre-tax Cash Flow CDN$ 000’s |
| 269,468 |
| 356,731 |
|
IRR |
| 4.16 | % | 4.97 | % |
(1) Bloomberg three year historical average (March 1, 2009 to February 29, 2012).
Sensitivity to gold zone tonnage was done to determine the impact of increasing the gold zone reserves by 1.0M tonnes at the average gold reserve grade of 3.99g/t Au, 21.77g/t Ag, 0.38% Cu and 0.38% Zn. This sensitivity improves the pre-tax cash flow by $67.0M.
22.4 Taxes and Royalties
Lalor Project will be subject to federal and provincial income taxes, as well as the Manitoba mining tax. The Manitoba mining tax is not applied to new mining projects until the original capital expenditures from the mine are recovered.
The combined federal and provincial tax rates are assumed to be approximately 27% for the LOM. The Manitoba mining tax rates are shown in Table 22-11.
TABLE 22-10 MANITOBA MINING TAX RATES
Taxable Income |
| Tax Rate |
|
0 to 50 million |
| 10 | % |
50 to 55 million |
| 65 | % |
55 to 100 million |
| 15 | % |
100 to 105 million |
| 57 | % |
>105 million |
| 17 | % |
23.0 ADJACENT PROPERTIES
The authors are not aware of any relevant work on properties immediately adjacent to the Lalor deposit other than Chisel North mine operation owned by Hudbay located approximately 3km to the south of Lalor. A 3,200m underground production ramp completed in 2011 connects the Chisel North mine and Lalor deposit.
24.0 OTHER RELEVENT DATA AND INFORMATION
The authors are not aware of any other information that would impact the reported estimate of mineral resources or estimated mineral reserves for the Lalor deposit.
25.0 INTERPRETATION AND CONCLUSIONS
This technical report has used investigation and analysis that are considered appropriate for pre-feasibility study level assessment.
The following presents the interpretations and conclusions of this Pre-feasibility study:
Geology
· The geological interpretation of the Lalor deposit is a series of 12 stacked zones of base metal zinc rich and separate gold rich mineralization. The base metal and gold zones are typical of VMS deposits that precipitated at or near the seafloor in association with contemporaneous volcanism. The depositional environment of this mineralization is similar to that of present and past producing deposits in the Snow Lake camp, with the exception of a more extensive associated hydrothermal alteration pipe and feeder zone than previous discoveries. That has produced a strongly enriched gold footwall zone suggestion a copper-gold association which is comparable to other gold enriched VMS camps and deposits.
Mineral Resource
· The current mineral resource estimate of both the base metal and gold zones were carried out using a block model method constrained by wireframe grade-shell models, with ordinary kriging interpolation. The mineral resources have been classified according to the CIM Definition Standards as incorporated in NI 43-101. Resource blocks are classified as Indicated or Inferred, depending upon the confidence level of the resource based on experience with similar deposits and the spatial continuity of the mineralization.
Processing
· Metallurgical test programs of the Lalor ores began in 2008 with a series of sample composites with a primary objective of developing a flowsheet for either the design of a new concentrator or modifications to the existing Snow Lake concentrator, and to determine expected concentrate grades and metal recoveries. The series of cleaner and lock cycle test conditions concluded that the deposit is best suited to produce a
bulk copper-lead concentrate and a separate zinc concentrate. The projected copper and zinc recoveries are very good with moderate gold and silver recoveries. Bottle roll cyanide leach tests done on tailing samples from the various composites and blends estimated improved gold and silver recoveries and further testwork will be done prior to mining of the gold zones and possible construction of a leach plant attached to the new concentrator.
Infrastructure
· The majority of surface infrastructure is being constructed under an Advanced Exploration Project (AEP), with the exception of the permanent office/dry complex and the concentrator. Lalor is being designed to mine and mill 4,500 tonnes per day of ore. Primary access to the mine will be by a concrete lined 6.9m diameter production shaft. Secondary ramp access from Chisel North mine is complete. Ore will be hoisted to surface and milled on site using a SAG/ball mill, producing zinc and bulk copper/lead concentrates. Where possible, existing infrastructure from Hudbay Chisel North mine operation will be used or extended to Lalor. Lalor is 18 road kilometres from the Town of Snow Lake, Manitoba. General area infrastructure includes provincial roads and 115kV Manitoba Hydro grid power to within four kilometres of Lalor, and Manitoba Telecom land line and cellular phone service. The Town of Snow Lake is a full service community with available housing, hospital, police, fire department, potable water system, restaurants and stores. The community is serviced by a 914m gravel airstrip to provide emergency medical evacuation. Lalor is located four road kilometres from the Hudbay Chisel North mine. Chisel North infrastructure includes a mined out open pit used for waste rock disposal, fresh (process) water sources, pumps and waterlines, 4160V and 550V power, mine discharge water lines, a 2,500gpm water treatment plant with retention areas, plus mine buildings including offices and a changehouse. These facilities were used for ramp development and will be used during Lalor operation. The permitted Hudbay Anderson TIA, located approximately 12km from Lalor will be used for tailings disposal.
Environmental and Permitting
· Environmental baseline investigations since 2007 were used to conclude an environmental impact assessment for the Lalor project. The Lalor infrastructure and
development is currently being done under an Advanced Exploration Project submitted to the Manitoba Government and approved in 2010. AECOM is finalizing for Hudbay the Environmental Impact Assessment Report for the proposed Lalor Mine, which will conclude that the project is not likely to result in any significant adverse environmental or socio-economic impacts. In addition to the mine baseline and environmental impact reports, AECOM is currently finalizing the Lalor Concentrator Environmental Baseline Assessment, which is planned to be released in the Q2 2012. The main permits that will be required for the Lalor Project are Manitoba Environment Act licenses for the Lalor Mine and Lalor Concentrator and for expansion of the existing Anderson Tailings Impoundment Area. No new tailings impoundment area will be required. No federal permits are anticipated for any of the Lalor facilities.
Mineral Reserves
· Indicated mineral resources were used to establish the probable mineral reserve. Mining, processing and economic parameters were applied to the block model to form the basis of the reserve estimate. To determine the economic viability of resources, prefeasibility level onsite operating costs and offsite costs were estimated and applied against bulk copper-lead and zinc concentrates produced from each mining area. Net smelter return payables were estimated assuming the metallurgical recoveries and longterm metal prices for mining areas comprised of blocks from the block model.
Mine Plan
· Lalor will be a ramp and shaft accessible underground mine with production and development done by rubber tired underground mining equipment. A 3,200m ramp from Hudbay Chisel North mine to the Lalor deposit was completed in December 2011 and is currently providing access for underground diamond drilling and pre development of the orebody and required infrastructure. Three stope mining methods will be used at Lalor: mechanized cut & fill, post pillar cut & fill and longhole open stope. At the end of ore zones, where resources narrow, cut & fill mining will be used. Where the dip exceeds 35° and the orebody is of sufficient thickness, longhole open stope mining will we used. All stopes at Lalor will be backfilled to maintain long term stability and to provide a floor to work from for subsequent mining.
The production schedule assumes a preproduction period from 2012 to 2014 and commercial production achieved in 2015 with a mine life until 2027.
Economics
· The deposit is marginally economic with an IRR of 4.2% and a NPV8% of -$128.8M, according to the assumptions of this study with a start date of the project as of January 1, 2010. The economic analysis includes the $206M of capital expense incurred as of December 31, 2011 and excludes 12,616,000 tonnes of inferred resource. The estimated total mine project capital to bring the project into commercial production is $703.2M of which $497M remains to be spent as of January 1, 2012.
While there can be risks associated with mining projects, many of those risks have already been mitigated due to the advanced level of this project and since the surface infrastructure for the mine is near complete and the basic engineering for the new concentrator is done. The author summarizes main risks associated with the Lalor project as follows:
· Ability to achieve operating and capital cost estimates
· Ability to secure environmental permits
· Forecasted metal commodity price and exchange rate
The author summarizes the following opportunities for improvement with the Lalor Project:
· Ability to increase mine production through put beyond 3,300tpd. The production hoist and new concentrator will have design capacities of 4,500tpd.
· Extension to life of mine through upgrading of the inferred resource to higher confidence categories and the discovery of additional resources
· Bottle roll cyanide leach tests indicate that significantly higher gold and silver recoveries can be achieved and could further enhance the project economics.
26.0 RECOMMENDATIONS
The author recommends that an economic evaluation of a potential gold leach plant should be undertaken prior to mining the gold zones. A gold plant would increase the gold recovery and may enhance project economics.
The author recommends that Hudbay proceed with the current plan of exploration drilling from underground with the goal of upgrading the gold and copper gold zones.
The author recommends that Hudbay continue with their advancement of the Lalor Project activities at an expected major project capital remaining of $497.3M as of January 1, 2012. There is little uncertainty in the project at this time and no trade-off studies are being conducted. The surface site infrastructure is near complete, basic engineering for the concentrate is done, the deposit is already accessible via the 3,200m ramp from Chisel North mine to the Lalor deposit and the ventilation shaft from surface is over half developed. Hudbay is currently drilling Zone 10 from underground drill platforms to define ore contacts in preparation of ore production. This information will also provide pertinent information to confirm our underground geotechnical design. Because of the advanced nature of the project, the author is not in a position to make further meaningful recommendations.
27.0 REFERENCES
Bailes, A.H., and Galley, A.G., 1999. Evolution of the Paleoproterozoic Snow Lake arc assemblage and geodynamic setting for associated volcanic-hosted massive sulphide deposits, Flin Flon Belt, Manitoba, Canada. Canadian Journal of Earth Sciences, 36, pp. 1789-1805.
Bailes, A.H., and Galley, A.G., 2007. Geology of the Chisel-Anderson Lakes Area, Snow Lake, Manitoba (NTS areas 63K16SW and west half of 63J13SE). Manitoba Science, Technology, Energy and Mines, Manitoba Geological Survey, Geoscientific Map MAP2007-1, scale 1:20,000 plus notes.
Canadian Institute Of Mining, Metallurgy and Petroleum, 2005: CIM Definition Standards on Mineral Resources and Mineral Reserves, December 11, 2005.
David, J., Bailes, A.H., and Machado, N., 1996: Evolution of the Snow Lake portion of the Paleoproterozoic Flin Flon and Kisseynew belts, Trans-Hudson Orogen, Manitoba, Canada. Precambrian Research, 80, pp. 107-124.
Franklin, J.M., Gibson, H.L., Jonasson, I.R., and Galley, A.G., 2005. Volcanogenic Massive Sulfide Deposits, in Hedenquist, J. W., Thompson, J. F. H., Goldfarb, R. J., and Richards, J. P., eds., Economic Geology 100th Anniversary Volume: Littleton, CO, Society of Economic Geologists, pp. 523-560.
Froese, E., and Moore, J.M., 1980. Metamorphism in the Snow Lake area, Manitoba; Geological Survey of Canada, Paper 78-27, p. 16.
Mercier-Langevin, P., 2009. Field Notes and Observations Lalor deposit, Snow Lake April 22-25th, 2009.
Manitoba Science, Technology, Energy and Mines http://www.gov.mb.ca/iedm/mrd/geo/gis/geoscimaps.html
Natural Resources Canada; http://www.geod.nrcan.gc.ca
Ontario Securities Commission, 2011: National Instrument 43-101, Standards of Disclosure for Mineral Projects, 2011.
SGS Vancouver Metallurgy: A Report on the Recovery of Copper, Zinc Gold and Silver From Lalor Samples, July 20, 2009
SGS Vancouver Metallurgy; An Investigation Into the Recovery of Copper, Lead, Zinc, and Gold From Lalor Samples — Phase II, February 25, 2011
SGS Vancouver Metallurgy; An Investigation Into Extraction of Gold and Silver From Flotation Tailings of Polymetallic Ore Sample; August 25, 2011
SGS Vancouver Metallurgy; The Optimization of Lalor Flotation Conditions — Phase III, October 25, 2011
Starkey & Associates; Lalor Project Mill Specifications for 5,400 t/d Design, S73 SAGDesign Comminution Analysis Rev 3, November 4, 2011
Syme, E.C., Lucas, S.B., Zwanzig, H.V., Bailes, A.H., Ashton, K.E., and Haidl, F.M., 1998: Geology, NATMAP Shield Margin Project area, Flin Flon Belt, Manitoba—Saskatchewan; Manitoba Energy and Mines, Geological Services, Map A-98-2, scale 1:100 000 and 1:350 000, with accompanying notes, 54 p.
Toffan, J., 2012. Email to Tim Schwartz, HBM&S. Ens Land Management, Creighton, Saskatchewan.
28.0 SIGNATURE PAGE
This report titled “Pre-Feasibility Study Technical Report, of the Lalor Deposit, Snow Lake, Manitoba, Canada”, dated March 29, 2012 was prepared and signed by the following authors:
Dated this 29th day of March, 2012. |
|
|
|
|
|
(signed) Robert Carter |
|
|
|
“Sealed” |
|
Signature of Qualified Person |
|
|
|
Robert Carter, P. Eng. |
|
Manager, Project Evaluation |
|
Hudbay |
|
|
|
|
|
Dated this 29th day of March, 2012. |
|
|
|
|
|
(signed) Tim Schwartz |
|
|
|
“Sealed” |
|
Signature of Qualified Person |
|
|
|
Tim Schwartz, M.Sc., P.Geo. |
|
Senior Geologist |
|
Hudbay |
|
|
|
|
|
Dated this 29th Day of March, 2012. |
|
|
|
|
|
(signed) Karl Hoover |
|
|
|
“Sealed” |
|
Signature of Qualified Person |
|
|
|
Karl Hoover, P.Eng. |
|
Manager, Lalor Concentrator Project |
|
Hudbay. |
|
Dated this 29th Day of March, 2012. |
|
|
|
|
|
(signed) Stephen West |
|
|
|
“Sealed” |
|
Signature of Qualified Person |
|
|
|
Stephen West, P.Eng. |
|
Superintendent, Environmental Control |
|
Hudbay |
|
29.0 CERTIFICATES OF QUALIFIED PERSONS
CERTIFICATE OF ROBERT CARTER
I, Robert Carter, P.Eng., of Burlington, Ontario, do hereby certify that:
1. I am currently employed as Manager of Project Evaluation with HudBay Minerals Inc. (the “Issuer”), 25 York Street, Suite 800, Toronto, Ontario, Canada, M5J 2V5
2. I graduated from University of Manitoba with a Bachelor of Sciences in Geological Engineering in 1997.
3. I am a member in good standing of the Association of Professional Engineers & Geoscientists of the Province of Manitoba, Registration #21836.
4. I am a member in good standing of the Association of Professional Engineers of Ontario, Registration #100089189.
5. I have practiced my profession continuously for over 15 years and have been involved in mineral exploration, mine site engineering and geology, mineral resource and mineral reserve estimations and economic studies on base metal deposits and operations in Canada, United States, and Ireland.
6. I have read the definition of “qualified person” set out in National Instrument 43-101 (NI 43-101) and certify that by reason of my education, affiliation with a professional association (as defined in NI 43-101) and past relevant work experience, I fulfil the requirements to be a “qualified person” for the purpose of NI 43-101.
7. I have, with the assistance of other contributing colleagues, am responsible for sections 1 and 15-26 of the technical report titled “Pre-Feasibility Study Technical Report, of the Lalor Deposit, Snow Lake, Manitoba, Canada”, dated March 29, 2012 (the “Technical Report”). I last visited the property on June 7, 2011 and numerous times prior to this date.
8. As of the date of this certificate, to the best of my knowledge, information and belief, the parts of the Technical Report that I am responsible for contain all scientific and technical information that is required to be disclosed to make the Technical not misleading.
9. I am not independent of the Issuer. Since I am an employee of the Issuer, a producing issuer, I fall under subsection 5.3 (3) of NI 43-101 where “A technical report required to be filed by a producing issuer is not required to be prepared by or under the supervision of an independent qualified person.”
10. I have read National Instrument 43-101 and Form 43-101F1, and the Technical Report has been prepared in compliance with the instrument and form.
11. I consent to the filing of the Technical Report with any stock exchange and other regulatory authority and any publication by them, including electronic publication in the public company files on their websites accessible by the public, of the Technical Report.
Dated this 29th day of March, 2012.
(signed) Robert Carter |
|
|
|
“Sealed” |
|
Signature of Qualified Person |
|
|
|
Robert Carter, P. Eng. |
|
Manager, Project Evaluation |
|
Hudbay |
|
CERTIFICATE OF TIM SCHWARTZ
I, Tim Schwartz, M.Sc., P.Geo., of Flin Flon, Manitoba, do hereby certify that:
1. I am currently employed as Senior Geologist with Hudbay Minerals Inc. (the “Issuer”), P.O. Box 1500, Flin Flon, Manitoba, Canada, R8A 1N9.
2. I am a graduate of the University of Manitoba, Winnipeg, Manitoba, Canada in 1991 with a Bachelor of Science Honours degree in Geology.
3. I am a graduate of the McMaster University, Hamilton, Ontario, Canada in 1995 with a Master of Science degree in Geology.
4. I am a member in good standing of the Association of Professional Engineers & Geoscientists of the Province of Manitoba, Registration #21285.
5. I have practiced my profession continuously for over 20 years and have been involved in mineral exploration for gold and base metals, and mine site geology, mineral resource estimations and studies on underground base metal deposits and operations in Canada.
6. I have read the definition of “qualified person” set out in National Instrument 43-101 (NI 43-101) and certify that by reason of my education, affiliation with a professional association (as defined in NI 43-101) and past relevant work experience, I fulfil the requirements to be a “qualified person” for the purpose of NI 43-101.
7. I am responsible for the preparation of sections 2 through 12 and section 14 of the technical report titled “Pre-Feasibility Study Technical Report, of the Lalor Deposit, Snow Lake, Manitoba, Canada”, dated March 29, 2012 (the “Technical Report”). I visited the property on March 26, 2012.
8. As of the date of this certificate to the best of my knowledge, information and belief, the technical report titled “Pre-Feasibility Study Technical Report, of the Lalor Deposit, Snow Lake, Manitoba, Canada”, dated March 28, 2012 contains all scientific and technical information that is required to be disclosed to make the Technical Report not misleading.
9. I am not independent of the Issuer. Since I am an employee of the Issuer, a producing issuer, I fall under subsection 5.3 (3) of NI 43-101 where “A technical report required to be filed by a producing issuer is not required to be prepared by or under the supervision of an independent qualified person.”
10. I have read National Instrument 43-101 and Form 43-101F1, and the portions of the Technical Report I am responsible for have been prepared in compliance with the instrument and form.
11. I consent to the filing of the Technical Report with any stock exchange and other regulatory authority and any publication by them, including electronic publication in the public company files on their websites accessible by the public, of the Technical Report.
Dated this 29th day of March, 2012. |
|
|
|
|
|
(signed) Tim Schwartz |
|
|
|
“Sealed” |
|
Signature of Qualified Person |
|
|
|
Tim Schwartz, M.Sc., P.Geo. |
|
Senior Geologist |
|
Hudbay |
|
CERTIFICATE OF KARL HOOVER
I, Karl Hoover, P.Eng., of Flin Flon, Manitoba, do hereby certify that:
1. I am currently employed as Manager of the Lalor Concentrator Project with Hudbay Minerals Inc. (the “Issuer”), PO Box 1500, Flin Flon, Manitoba, R8A 1N9.
2. I graduated from Laurentian University with a Bachelor of Engineering in Extractive Metallurgy in 1983.
3. I am a member in good standing of the Association of Professional Engineers and Geoscientists of the Province of Manitoba, Registration #35120.
4. I am a member in good standing of the Association of Professional Engineers and Geoscientists of Saskatchewan, Registration #14270.
5. I have practiced my profession continuously for over 27 years and have been involved with mineral processing of base metal ores, including plant management, process development, flow sheet design and plant optimization.
6. I have read the definition of “qualified person” set out in National Instrument 43-101 (NI 43-101) and certify that by reason of my education, affiliation with a professional association (as defined in NI 43-101) and past relevant work experience, I fulfil the requirements to be a “qualified person” for the purpose of NI 43-101.
7. I have prepared sections 13 and 17 of the technical report titled “Pre-Feasibility Study Technical Report, of the Lalor Deposit, Snow Lake, Manitoba, Canada”, dated March 29, 2012 (the “Technical Report”). I have last visited the Property on February 23, 2012.
8. As at the date of the Technical Report, to the best of my knowledge, information and belief, the portion of the Technical Report I am responsible for contains all scientific and technical information required to be disclosed to make the Technical report not misleading.
9. I am not independent of the Issuer. Since I am an employee of the Issuer, a producing issuer, I fall under subsection 5.3 (3) of NI 43-101 where “A technical report required to be filed by a producing issuer is not required to be prepared by or under the supervision of an independent qualified person.”
10. I have read National Instrument 43-101 and Form 43-101F1, and the portions of the Technical Report I am responsible for has been prepared in compliance with the instrument and form.
11. I consent to the filing of the Technical Report with any stock exchange and other regulatory authority and any publication by them, including electronic publication in the public company files on their websites accessible by the public, of the Technical Report.
Dated this 29th Day of March, 2012. |
|
|
|
|
|
(signed) Karl Hoover |
|
|
|
“Sealed” |
|
Signature of Qualified Person |
|
|
|
Karl Hoover, P.Eng. |
|
Manager, Lalor Concentrator Project |
|
Hudbay. |
|
CERTIFICATE OF STEPHEN WEST
I, Stephen West, P.Eng., of Flin Flon, Manitoba, do hereby certify that:
1. I am currently employed as Superintendent, Environmental Control with Hudbay Minerals Inc. (the “Issuer”), P.O. Box 1500, Flin Flon, Manitoba, R8A 1N9.
2. I graduated from University of Guelph with a Bachelor of Science in Water Resource Engineering in 1978.
3. I am a member in good standing of the Association of Professional Engineers and Geoscientists of the Province of Manitoba, Registration #5945.
4. I have practiced my profession continuously for almost 34 years and have been involved with environmental programs related to all aspects of mine and mill tailing impoundment operations.
5. I have read the definition of “qualified person” set out in National Instrument 43-101 (NI 43-101) and certify that by reason of my education, affiliation with a professional association (as defined in NI 43-101) and past relevant work experience, I fulfil the requirements to be a “qualified person” for the purpose of NI 43-101.
6. I have prepared section 20 of the technical report titled “Pre-Feasibility Study Technical Report, of the Lalor Deposit, Snow Lake, Manitoba, Canada”, dated March 29, 2012 (the “Technical Report”). I have last visited the Property on January 11, 2012.
7. As at the date of the Technical Report, to the best of my knowledge, information and belief, the portion of the Technical Report I am responsible for contains all scientific and technical information required to be disclosed to make the Technical report not misleading.
8. I am not independent of the Issuer. Since I am an employee of the Issuer, a producing issuer, I fall under subsection 5.3 (3) of NI 43-101 where “A technical report required to be filed by a producing issuer is not required to be prepared by or under the supervision of an independent qualified person.”
9. I have read National Instrument 43-101 and Form 43-101F1, and the portions of the Technical Report I am responsible for has been prepared in compliance with the instrument and form.
10. I consent to the filing of the Technical Report with any stock exchange and other regulatory authority and any publication by them, including electronic publication in the public company files on their websites accessible by the public, of the Technical Report.
Dated this 29th Day of March, 2012. |
|
|
|
|
|
(signed) Stephen West |
|
|
|
“Sealed” |
|
Signature of Qualified Person |
|
|
|
Stephen West, P.Eng. |
|
Superintendent, Environmental Control |
|
Hudbay. |
|
30.0 APPENDIX 1
ASSAY SAMPLE STATISTICS
Histograms and probability plots for the assayed samples contained within the mineralized wireframes by Zone used in the mineral resource estimation.
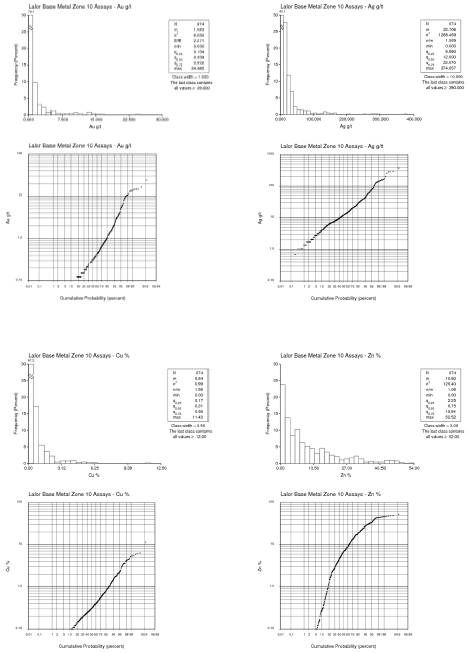
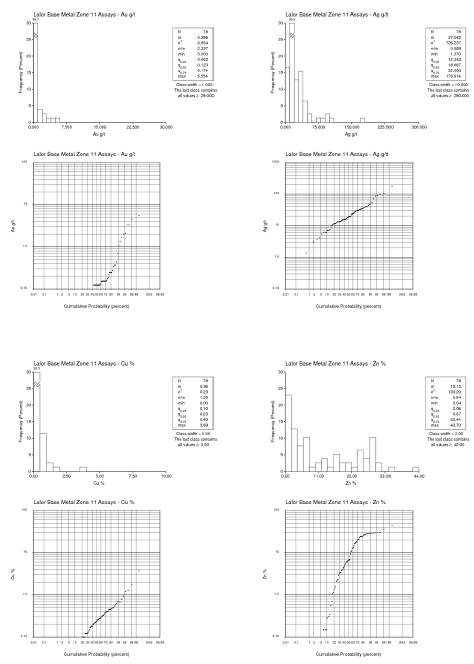
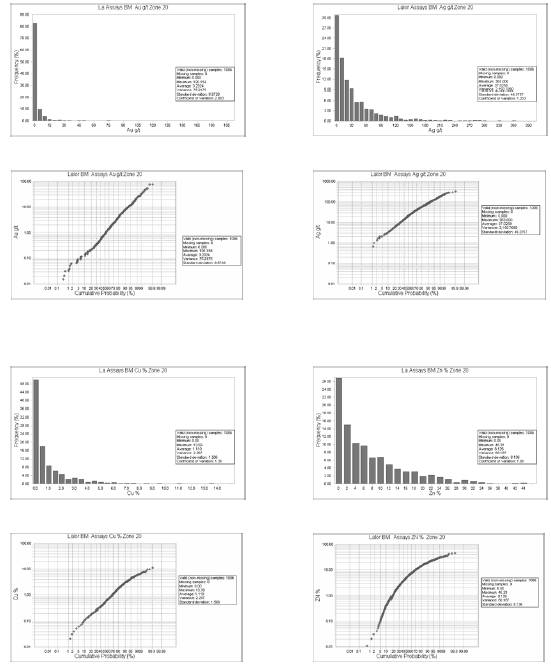

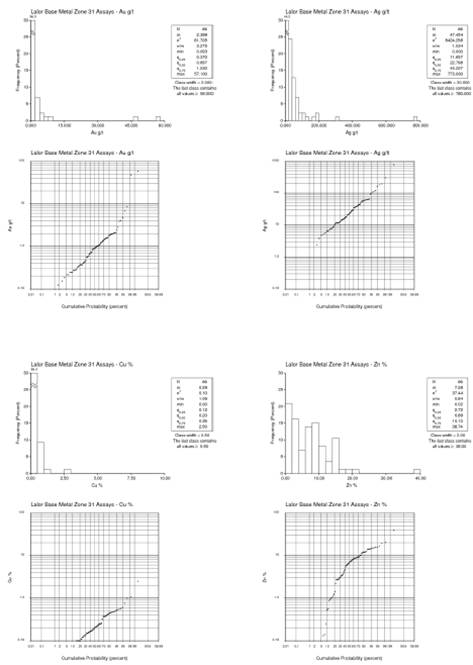


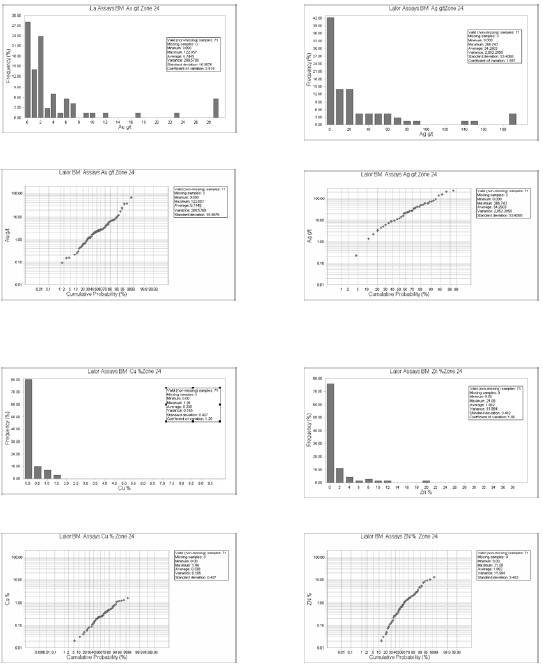

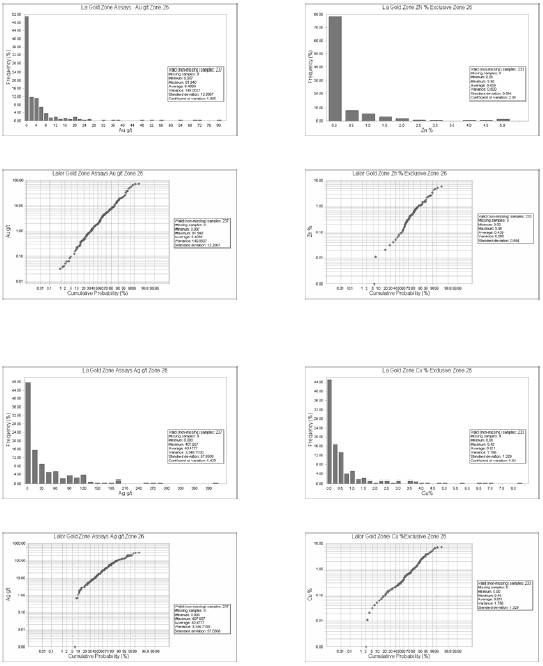
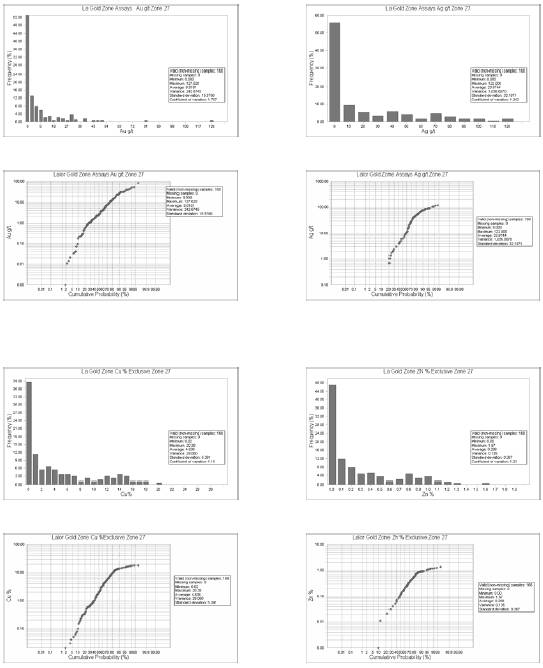
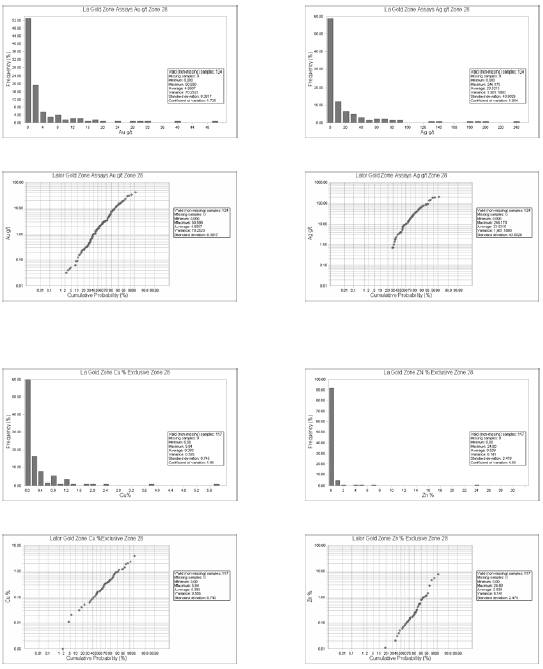
31.0 APPENDIX 2
COMPOSITE STATISTICS
Histograms and probability plots, for capped composites by Zone, used in the mineral resource estimation.