UNITED STATES
SECURITIES AND EXCHANGE COMMISSION
Washington, D.C. 20549
Form N-CSR
CERTIFIED SHAREHOLDER REPORT OF REGISTERED
MANAGEMENT INVESTMENT COMPANIES
Investment Company Act File Number: 811-21745
Eaton Vance Tax-Managed Global Buy-Write Opportunities Fund
(Exact Name of Registrant as Specified in Charter)
Two International Place, Boston, Massachusetts 02110
(Address of Principal Executive Offices)
Maureen A. Gemma
Two International Place, Boston, Massachusetts 02110
(Name and Address of Agent for Services)
(617) 482-8260
(Registrant’s Telephone Number)
December 31
Date of Fiscal Year End
December 31, 2014
Date of Reporting Period
Item 1. Reports to Stockholders

Eaton Vance
Tax-Managed Global Buy-Write Opportunities Fund (ETW)
Annual Report
December 31, 2014

Commodity Futures Trading Commission Registration. Effective December 31, 2012, the Commodity Futures Trading Commission (“CFTC”) adopted certain regulatory changes that subject registered investment companies and advisers to regulation by the CFTC if a fund invests more than a prescribed level of its assets in certain CFTC-regulated instruments (including futures, certain options and swap agreements) or markets itself as providing investment exposure to such instruments. The Fund has claimed an exclusion from the definition of the term “commodity pool operator” under the Commodity Exchange Act. Accordingly, neither the Fund nor the adviser with respect to the operation of the Fund is subject to CFTC regulation. Because of its management of other strategies, the Fund’s adviser is registered with the CFTC as a commodity pool operator and a commodity trading advisor.
Managed Distribution Plan. Pursuant to an exemptive order issued by the Securities and Exchange Commission (Order), the Fund is authorized to distribute long-term capital gains to shareholders more frequently than once per year. Pursuant to the Order, the Fund’s Board of Trustees approved a Managed Distribution Plan (MDP) pursuant to which the Fund makes monthly cash distributions to common shareholders, stated in terms of a fixed amount per common share.
The Fund currently distributes monthly cash distributions equal to $0.0973 per share in accordance with the MDP. You should not draw any conclusions about the Fund’s investment performance from the amount of these distributions or from the terms of the MDP. The MDP will be subject to regular periodic review by the Fund’s Board of Trustees and the Board may amend or terminate the MDP at any time without prior notice to Fund shareholders. However, at this time there are no reasonably foreseeable circumstances that might cause the termination of the MDP.
The Fund may distribute more than its net investment income and net realized capital gains and, therefore, a distribution may include a return of capital. A return of capital distribution does not necessarily reflect the Fund’s investment performance and should not be confused with “yield” or “income.” With each distribution, the Fund will issue a notice to shareholders and a press release containing information about the amount and sources of the distribution and other related information. The amounts and sources of distributions contained in the notice and press release are only estimates and are not provided for tax purposes. The amounts and sources of the Fund’s distributions for tax purposes will be reported to shareholders on Form 1099-DIV for each calendar year.
Fund shares are not insured by the FDIC and are not deposits or other obligations of, or guaranteed by, any depository institution. Shares are subject to investment risks, including possible loss of principal invested.
Annual Report December 31, 2014
Eaton Vance
Tax-Managed Global Buy-Write Opportunities Fund
Table of Contents
| | | | |
Management’s Discussion of Fund Performance | | | 2 | |
| |
Performance | | | 3 | |
| |
Fund Profile | | | 4 | |
| |
Fund Snapshot | | | 5 | |
| |
Endnotes and Additional Disclosures | | | 6 | |
| |
Financial Statements | | | 7 | |
| |
Report of Independent Registered Public Accounting Firm | | | 25 | |
| |
Federal Tax Information | | | 26 | |
| |
Dividend Reinvestment Plan | | | 27 | |
| |
Management and Organization | | | 29 | |
| |
Important Notices | | | 31 | |
Eaton Vance
Tax-Managed Global Buy-Write Opportunities Fund
December 31, 2014
Management’s Discussion of Fund Performance1
Economic and Market Conditions
“Decoupling” became the theme of global equity markets in 2014, as performance of U.S. equity markets during the 12-month period seemed to diverge from the rest of the world. An ongoing, modest economic recovery in the U.S. contrasted sharply with slowing or stagnant growth in most other regions. In the European Union, growth appeared to stall and Germany, one of the world’s leading exporters, experienced near-zero GDP growth in the second and third quarters of 2014. Japan slid into recession and China saw third-quarter GDP growth fall to its slowest quarterly pace in five years.
On the positive side, falling crude oil prices, brought on by increased supply and weaker global demand, helped boost consumer spending and most market sectors in developed economies, with the exception of energy. Expanding supply, especially in the U.S., helped blunt the impact that geopolitical turmoil in the Middle East and Ukraine/Russia might otherwise have had on oil prices. Lower crude prices, however, weighed heavily on emerging-market economies dependent on oil exports.
Decoupling was evident in the returns posted by the major market indexes. The MSCI World Index2, a proxy for global equities, rose 4.94% for the 12-month period ended December 31, 2014, powered largely by U.S. growth — whereas the MSCI World ex USA Index lost 4.32% for the same period. The MSCI EAFE Index of developed-market international equities fell 4.90%, primarily due to weakness in European stocks and the decline of the euro against the U.S. dollar. The MSCI Emerging Markets Index, meanwhile, dropped 2.19%. In the U.S., the Dow Jones Industrial Average advanced 10.04% and the broader U.S. market, as measured by the S&P 500 Index, gained 13.69%.
Fund Performance
For the 12-month period ended December 31, 2014, Eaton Vance Tax-Managed Global Buy-Write Opportunities Fund (the Fund) had a total return of 2.97% at net asset value (NAV), underperforming the 13.69% return of its benchmark, the S&P 500 Index (the Index), the 5.64% return of the CBOE S&P 500 BuyWrite Index and the 4.05% return of the CBOE NASDAQ-100 BuyWrite Index, but outperforming the -5.94% return of the FTSE Eurotop 100 Index in U.S. dollars. The Fund’s underlying common stock portfolio underperformed the Index for the period, and the Fund’s options overlay strategy also detracted from performance versus the Index.
The Fund employs an options strategy of writing (selling) stock index call options on a portion of its underlying common stock portfolio. The options strategy, which is designed to help limit the Fund’s exposure to market volatility and enhance current income, can be beneficial during periods of market weakness, but may detract from performance versus the Index during periods of market strength. When the U.S. market was trending upward, as it was for most of the 12-month period, the Fund’s writing of call options on U.S. indexes held back performance versus the Index. Call options written on overseas indexes, however, aided the Fund’s performance relative to the Index until the fourth quarter of 2014, when those options began to detract from the Fund’s relative performance. For the period as a whole, stock index call options on U.S. and overseas indexes were net detractors from the Fund’s performance versus the Index.
Within the Fund’s underlying common stock portfolio, exposure to European stocks in general was the largest contributor to underperformance versus the U.S.-based Index, as U.S. growth picked up during the period, while the European economy stagnated. Currency was a significant factor in the underperformance of the Fund’s European holdings because the euro declined against the dollar, hurting the performance of European stocks when converted into dollars.
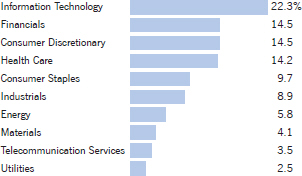
More specifically, stock selection in the financials, industrials and consumer discretionary sectors detracted from the Fund’s performance relative to the Index. Within financials, relative performance was hurt by losses in three European banking stocks: Banco Bilbao Vizcaya Argentaria SA, (Spain), Standard Chartered PLC (United Kingdom) and BNP Paribas SA (France). Within industrials, positions in European multinational aircraft company Airbus Group NV and British aircraft engine maker Rolls-Royce Holdings PLC lost value, as aircraft purchases slowed worldwide during the period. Within consumer discretionary, Fund performance versus the Index was hampered by the Fund’s holdings in Japanese clothing firm Fast Retailing Co., Ltd. and U.S. online retailer Amazon.com, Inc.
In contrast, energy was the only sector that helped the Fund’s performance versus the Index for the 12-month period. The Fund benefited from underweighting the lagging sector, including an underweight position in Exxon Mobil Corp., as profits of oil and gas producers were constrained by plummeting commodity prices.
See Endnotes and Additional Disclosures in this report.
Past performance is no guarantee of future results. Returns are historical and are calculated by determining the percentage change in net asset value (NAV) or market price (as applicable) with all distributions reinvested and includes management fees and other expenses. Fund performance at market price will differ from its results at NAV due to factors such as changing perceptions about the Fund, market conditions, fluctuations in supply and demand for Fund shares, or changes in Fund distributions. Investment return and principal value will fluctuate so that shares, when sold, may be worth more or less than their original cost. Performance less than one year is cumulative. Performance is for the stated time period only; due to market volatility, current Fund performance may be lower or higher than the quoted return. For performance as of the most recent month-end, please refer to eatonvance.com.
Eaton Vance
Tax-Managed Global Buy-Write Opportunities Fund
December 31, 2014
Performance2
Portfolio Managers Walter A. Row III, CFA, CMT and Thomas Seto
| | | | | | | | | | | | | | | | |
| % Average Annual Total Returns | | Inception Date | | | One Year | | | Five Years | | | Since
Inception | |
Fund at NAV | | | 09/30/2005 | | | | 2.97 | % | | | 8.51 | % | | | 6.53 | % |
Fund at Market Price | | | — | | | | 0.19 | | | | 6.10 | | | | 5.28 | |
S&P 500 Index | | | — | | | | 13.69 | % | | | 15.45 | % | | | 8.00 | % |
FTSE Eurotop 100 Index | | | — | | | | –5.94 | | | | 4.65 | | | | 4.21 | |
CBOE S&P 500 BuyWrite Index | | | | | | | 5.64 | | | | 7.09 | | | | 4.45 | |
CBOE NASDAQ–100 BuyWrite Index | | | | | | | 4.05 | | | | 6.20 | | | | 3.34 | |
| | | | |
| | | | | | | | | | | | | | | | |
| % Premium/Discount to NAV3 | | | | | | | | | | | | |
| | | | | | | | | | | | | | | –10.33 | % |
| | | | |
| | | | | | | | | | | | | | | | |
| Distributions4 | | | | | | | | | | | | |
Total Distributions per share for the period | | | | | | | | | | | | | | $ | 1.168 | |
Distribution Rate at NAV | | | | | | | | | | | | | | | 9.50 | % |
Distribution Rate at Market Price | | | | | | | | | | | | | | | 10.60 | % |
See Endnotes and Additional Disclosures in this report.
Past performance is no guarantee of future results. Returns are historical and are calculated by determining the percentage change in net asset value (NAV) or market price (as applicable) with all distributions reinvested and includes management fees and other expenses. Fund performance at market price will differ from its results at NAV due to factors such as changing per-ceptions about the Fund, market conditions, fluctuations in supply and demand for Fund shares, or changes in Fund distribu-tions. Investment return and principal value will fluctuate so that shares, when sold, may be worth more or less than their origi-nal cost. Performance less than one year is cumulative. Performance is for the stated time period only; due to market volatility, current Fund performance may be lower or higher than the quoted return. For performance as of the most recent month-end, please refer to eatonvance.com.
Eaton Vance
Tax-Managed Global Buy-Write Opportunities Fund
December 31, 2014
Fund Profile
Sector Allocation (% of total investments)5
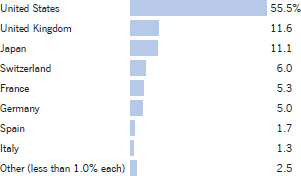
Country Allocation (% of total investments)5
Top 10 Holdings (% of total investments)5
| | | | |
Apple, Inc. | | | 4.7 | % |
Microsoft Corp. | | | 3.0 | |
Nestle SA | | | 1.8 | |
Roche Holding AG PC | | | 1.6 | |
Novartis AG | | | 1.6 | |
Intel Corp. | | | 1.4 | |
Google, Inc., Class C | | | 1.3 | |
Gilead Sciences, Inc. | | | 1.3 | |
Comcast Corp., Class A | | | 1.3 | |
Google, Inc., Class A | | | 1.2 | |
| | | | | |
Total | | | 19.2 | % |
| | | | | |
| | | | |
See Endnotes and Additional Disclosures in this report. | | | | |
| | 4 | | |
Eaton Vance
Tax-Managed Global Buy-Write Opportunities Fund
December 31, 2014
Fund Snapshot
| | |
| Objective | | The primary investment objective is to provide current income and gains, with a secondary objective of capital appreciation. |
| Strategy | | The Fund invests in a diversified portfolio of common stocks and writes call options on one or more U.S. and foreign indices on a substantial portion of the value of its common stock portfolio to generate current earnings from the option premium. The Fund evaluates returns on an after tax basis and seeks to minimize and defer federal income taxes incurred by shareholders in connection with their investment in the Fund. |
| | |
Options Strategy | | Write Index Covered Calls |
Equity Benchmarks2 | | S&P 500 Index FTSE Eurotop 100 Index |
Morningstar Category | | World Stock |
Distribution Frequency | | Monthly |
| |
| Common Stock Portfolio | | |
Positions Held | | 447 |
% US / Non-US | | 55.5/44.5 |
Average Market Cap | | $129.1 Billion |
| |
| Call Options Written | | |
% of Stock Portfolio | | 94% |
Average Days to Expiration | | 13 days |
% Out of the Money | | 1.4% |
The following terms as used in the Fund snapshot:
Average Market Cap: An indicator of the size of the companies in which the Fund invests and is the sum of each security’s weight in the portfolio multiplied by its market cap. Market Cap is determined by multiplying the price of a share of a company’s common stock by the number of shares outstanding.
Call Option: For an index call option, the buyer has the right to receive from the seller (or writer) a cash payment at the option expiration date equal to any positive difference between the value of the index at contract expiration and the exercise price. The buyer of a call option makes a cash payment (premium) to the seller (writer) of the option upon entering into the option contract.
Covered Call Strategy: A strategy of owning a portfolio of common stocks and writing call options on all or a portion of such stocks to generate current earnings from option premium.
Out of the Money: For a call option on an index, the extent to which the exercise price of the option exceeds the current price of the value of the index.
| | | | |
See Endnotes and Additional Disclosures in this report. | | | | |
| | 5 | | |
Eaton Vance
Tax-Managed Global Buy-Write Opportunities Fund
December 31, 2014
Endnotes and Additional Disclosures
| 1 | The views expressed in this report are those of the portfolio manager(s) and are current only through the date stated at the top of this page. These views are subject to change at any time based upon market or other conditions, and Eaton Vance and the Fund(s) disclaim any responsibility to update such views. These views may not be relied upon as investment advice and, because investment decisions are based on many factors, may not be relied upon as an indication of trading intent on behalf of any Eaton Vance fund. This commentary may contain statements that are not historical facts, referred to as “forward looking statements”. The Fund’s actual future results may differ significantly from those stated in any forward looking statement, depending on factors such as changes in securities or financial markets or general economic conditions, the volume of sales and purchases of Fund shares, the continuation of investment advisory, administrative and service contracts, and other risks discussed from time to time in the Fund’s filings with the Securities and Exchange Commission. |
| 2 | MSCI World Index is an unmanaged index of equity securities in the developed markets. The MSCI World ex USA Index is an unmanaged index of large-cap and mid-cap equity securities across the developed markets, excluding the U.S. MSCI EAFE Index is an unmanaged index of equities in the developed markets, excluding the U.S. and Canada. MSCI Emerging Markets Index is an unmanaged index of emerging-markets common stocks. MSCI indexes are net of foreign withholding taxes. Source: MSCI. MSCI data may not be reproduced or used for any other purpose. MSCI provides no warranties, has not prepared or approved this report, and has no liability hereunder. Dow Jones Industrial Average is a price-weighted average of 30 blue-chip stocks that are generally the leaders in their industry. S&P 500 Index is an unmanaged index of large-cap stocks commonly used as a measure of U.S. stock market performance. CBOE NASDAQ-100 BuyWrite Index measures the performance of a theoretical portfolio that owns stocks included in the NASDAQ-100 Index and writes (sells) NASDAQ-100 Index covered call options. FTSE Eurotop 100 Index is a tradable index designed to represent the performance of the 100 most highly capitalized blue-chip companies in Europe. The return for the FTSE Eurotop 100 Index is calculated in U.S. dollars. CBOE S&P 500 BuyWrite Index measures the performance of a hypothetical buy- write strategy on the S&P 500 Index. Unless otherwise stated, index returns do not reflect the effect of any applicable sales charges, commissions, expenses, taxes or leverage, as applicable. It is not possible to invest directly in an index.Performance since inception for an index, if presented, is the performance since the Fund’s or oldest share class’ inception, as applicable. |
| 3 | The shares of the Fund often trade at a discount or premium from their net asset value. The discount or premium of the Fund may vary over time and may be higher or lower than what is quoted in this report. For up-to-date premium/discount information, please refer to http://eatonvance.com/closedend. |
| 4 | The Distribution Rate is based on the Fund’s last regular distribution per share in the period (annualized) divided by the Fund’s NAV or market price at the end of the period. The Fund’s distributions may be comprised of amounts characterized for federal income tax purposes as qualified and non-qualified ordinary dividends, capital gains and nondividend distributions, also known as return of capital. For additional information about nondividend distributions, please refer to Eaton Vance Closed-End Fund Distribution Notices (19a) posted on our website, eatonvance.com. The Fund will determine the federal income tax character of distributions paid to a shareholder after the end of the calendar year. This is reported on the IRS form 1099-DIV and provided to the shareholder shortly after each year- end. For information about the tax character of distributions made in prior calendar years, please refer to Performance-Tax Character of Distributions on the Fund’s webpage available at eatonvance.com. In recent years, a significant portion of the Fund’s distributions has been characterized as a return of capital. The Fund’s distributions are determined by the investment adviser based on its current assessment of the Fund’s long-term return potential. As portfolio and market conditions change, the rate of distributions paid by the Fund could change. |
| 5 | Depictions do not reflect the Fund’s option positions. Excludes cash and cash equivalents. |
| | Fund snapshot and profile subject to change due to active management. |
Eaton Vance
Tax-Managed Global Buy-Write Opportunities Fund
December 31, 2014
Portfolio of Investments
| | | | | | | | |
| Common Stocks — 99.9% | |
| | |
| | | | | | | | |
| Security | | Shares | | | Value | |
| | | | | | | | |
|
Aerospace & Defense — 1.6% | |
Airbus Group NV | | | 56,122 | | | $ | 2,774,559 | |
General Dynamics Corp. | | | 6,866 | | | | 944,899 | |
Honeywell International, Inc. | | | 54,798 | | | | 5,475,416 | |
L-3 Communications Holdings, Inc. | | | 5,966 | | | | 752,969 | |
Northrop Grumman Corp. | | | 13,028 | | | | 1,920,197 | |
Raytheon Co. | | | 43,521 | | | | 4,707,666 | |
Rolls-Royce Holdings PLC(1) | | | 272,487 | | | | 3,660,548 | |
Textron, Inc. | | | 30,061 | | | | 1,265,869 | |
| | |
| | | $ | 21,502,123 | |
| | |
|
Air Freight & Logistics — 0.3% | |
Deutsche Post AG | | | 61,060 | | | $ | 1,982,124 | |
Expeditors International of Washington, Inc. | | | 33,631 | | | | 1,500,279 | |
United Parcel Service, Inc., Class B | | | 2,894 | | | | 321,726 | |
| | |
| | | $ | 3,804,129 | |
| | |
|
Airlines — 0.0%(2) | |
International Consolidated Airlines Group SA(1) | | | 65,562 | | | $ | 493,555 | |
| | |
| | | $ | 493,555 | |
| | |
|
Auto Components — 0.9% | |
Aisin Seiki Co., Ltd. | | | 10,200 | | | $ | 366,470 | |
Compagnie Generale des Etablissements Michelin, Class B | | | 26,277 | | | | 2,371,937 | |
Dana Holding Corp. | | | 46,794 | | | | 1,017,302 | |
Denso Corp. | | | 60,300 | | | | 2,810,451 | |
Johnson Controls, Inc. | | | 60,056 | | | | 2,903,107 | |
Toyoda Gosei Co., Ltd. | | | 12,800 | | | | 257,462 | |
Toyota Industries Corp. | | | 6,400 | | | | 328,011 | |
Yokohama Rubber Co., Ltd. (The) | | | 151,000 | | | | 1,374,905 | |
| | |
| | | $ | 11,429,645 | |
| | |
|
Automobiles — 1.4% | |
Daimler AG | | | 132,059 | | | $ | 10,968,036 | |
Ford Motor Co. | | | 47,101 | | | | 730,066 | |
Honda Motor Co., Ltd. | | | 98,400 | | | | 2,886,886 | |
Isuzu Motors, Ltd. | | | 99,500 | | | | 1,211,941 | |
Mazda Motor Corp. | | | 49,000 | | | | 1,176,763 | |
Toyota Motor Corp. | | | 21,500 | | | | 1,339,823 | |
| | |
| | | $ | 18,313,515 | |
| | |
|
Banks — 5.8% | |
Banco Bilbao Vizcaya Argentaria SA | | | 1,093,541 | | | $ | 10,327,841 | |
Banco Santander SA | | | 526,565 | | | | 4,419,520 | |
| | | | | | | | |
| Security | | Shares | | | Value | |
| | | | | | | | |
|
Banks (continued) | |
Bank of America Corp. | | | 125,000 | | | $ | 2,236,250 | |
Barclays PLC | | | 1,076,485 | | | | 4,046,864 | |
BB&T Corp. | | | 24,850 | | | | 966,416 | |
BNP Paribas SA | | | 92,220 | | | | 5,444,122 | |
Citigroup, Inc. | | | 12,000 | | | | 649,320 | |
Credit Agricole SA | | | 243,088 | | | | 3,137,906 | |
Danske Bank A/S | | | 77,886 | | | | 2,105,714 | |
Fifth Third Bancorp | | | 112,006 | | | | 2,282,122 | |
First Horizon National Corp. | | | 39,470 | | | | 536,003 | |
Hiroshima Bank, Ltd. (The) | | | 87,000 | | | | 414,087 | |
HSBC Holdings PLC | | | 499,100 | | | | 4,716,376 | |
Huntington Bancshares, Inc. | | | 307,053 | | | | 3,230,198 | |
Intesa Sanpaolo SpA | | | 1,046,540 | | | | 3,035,908 | |
JPMorgan Chase & Co. | | | 63,787 | | | | 3,991,790 | |
KBC Groep NV(1) | | | 22,722 | | | | 1,268,115 | |
KeyCorp | | | 238,919 | | | | 3,320,974 | |
Lloyds Banking Group PLC(1) | | | 1,918,446 | | | | 2,256,589 | |
Mizuho Financial Group, Inc. | | | 155,441 | | | | 260,566 | |
PNC Financial Services Group, Inc. (The) | | | 41,011 | | | | 3,741,434 | |
Shinsei Bank, Ltd. | | | 336,000 | | | | 584,780 | |
Standard Chartered PLC | | | 301,123 | | | | 4,503,564 | |
Sumitomo Mitsui Financial Group, Inc. | | | 8,108 | | | | 293,126 | |
SunTrust Banks, Inc. | | | 19,446 | | | | 814,787 | |
U.S. Bancorp | | | 20,850 | | | | 937,207 | |
UniCredit SpA | | | 326,003 | | | | 2,088,249 | |
Wells Fargo & Co. | | | 51,808 | | | | 2,840,115 | |
Zions Bancorporation | | | 26,814 | | | | 764,467 | |
| | |
| | | $ | 75,214,410 | |
| | |
|
Beverages — 1.5% | |
Coca-Cola Co. (The) | | | 100,476 | | | $ | 4,242,097 | |
Constellation Brands, Inc., Class A(1) | | | 33,994 | | | | 3,337,191 | |
Heineken Holding NV | | | 24,773 | | | | 1,550,827 | |
Heineken NV | | | 8,449 | | | | 599,944 | |
Kirin Holdings Co., Ltd. | | | 59,000 | | | | 733,127 | |
PepsiCo, Inc. | | | 75,676 | | | | 7,155,923 | |
Pernod-Ricard SA | | | 15,528 | | | | 1,725,745 | |
Takara Holdings, Inc. | | | 84,000 | | | | 544,806 | |
| | |
| | | $ | 19,889,660 | |
| | |
|
Biotechnology — 3.6% | |
Amgen, Inc. | | | 86,623 | | | $ | 13,798,178 | |
BioMarin Pharmaceutical, Inc.(1) | | | 19,589 | | | | 1,770,845 | |
Celgene Corp.(1) | | | 114,874 | | | | 12,849,806 | |
| | | | |
| | 7 | | See Notes to Financial Statements. |
Eaton Vance
Tax-Managed Global Buy-Write Opportunities Fund
December 31, 2014
Portfolio of Investments — continued
| | | | | | | | |
| Security | | Shares | | | Value | |
| | | | | | | | |
|
Biotechnology (continued) | |
Gilead Sciences, Inc.(1) | | | 181,884 | | | $ | 17,144,386 | |
Regeneron Pharmaceuticals, Inc.(1) | | | 4,161 | | | | 1,707,050 | |
| | |
| | | $ | 47,270,265 | |
| | |
|
Building Products — 0.3% | |
Asahi Glass Co., Ltd. | | | 38,776 | | | $ | 188,768 | |
Daikin Industries, Ltd. | | | 63,100 | | | | 4,046,226 | |
| | |
| | | $ | 4,234,994 | |
| | |
|
Capital Markets — 1.4% | |
Affiliated Managers Group, Inc.(1) | | | 4,285 | | | $ | 909,448 | |
Deutsche Bank AG | | | 138,432 | | | | 4,145,256 | |
Franklin Resources, Inc. | | | 27,848 | | | | 1,541,944 | |
GAM Holding AG | | | 58,376 | | | | 1,049,483 | |
Julius Baer Group, Ltd. | | | 76,144 | | | | 3,476,582 | |
Lazard, Ltd., Class A | | | 48,066 | | | | 2,404,742 | |
Morgan Stanley | | | 65,092 | | | | 2,525,569 | |
State Street Corp. | | | 25,132 | | | | 1,972,862 | |
| | |
| | | $ | 18,025,886 | |
| | |
|
Chemicals — 2.3% | |
Air Products and Chemicals, Inc. | | | 32,423 | | | $ | 4,676,369 | |
Akzo Nobel NV | | | 10,908 | | | | 754,725 | |
BASF SE | | | 80,346 | | | | 6,739,496 | |
Daicel Corp. | | | 51,000 | | | | 595,705 | |
Dow Chemical Co. (The) | | | 14,120 | | | | 644,013 | |
Eastman Chemical Co. | | | 22,750 | | | | 1,725,815 | |
Johnson Matthey PLC | | | 82,005 | | | | 4,314,348 | |
Kaneka Corp. | | | 57,000 | | | | 305,419 | |
Linde AG | | | 16,210 | | | | 2,985,920 | |
Mitsubishi Gas Chemical Co., Inc. | | | 55,000 | | | | 276,039 | |
Monsanto Co. | | | 4,840 | | | | 578,235 | |
Nitto Denko Corp. | | | 39,400 | | | | 2,201,495 | |
Shin-Etsu Chemical Co., Ltd. | | | 34,500 | | | | 2,245,940 | |
Showa Denko K.K. | | | 236,000 | | | | 290,518 | |
Solvay SA | | | 5,637 | | | | 762,771 | |
Sumitomo Chemical Co., Ltd. | | | 25,000 | | | | 98,418 | |
Toray Industries, Inc. | | | 66,000 | | | | 527,338 | |
Tosoh Corp. | | | 173,000 | | | | 831,934 | |
| | |
| | | $ | 30,554,498 | |
| | |
|
Commercial Services & Supplies — 0.4% | |
SECOM Co., Ltd. | | | 53,800 | | | $ | 3,091,057 | |
Waste Management, Inc. | | | 41,844 | | | | 2,147,434 | |
| | |
| | | $ | 5,238,491 | |
| | |
| | | | | | | | |
| Security | | Shares | | | Value | |
| | | | | | | | |
|
Communications Equipment — 2.3% | |
Cisco Systems, Inc. | | | 507,610 | | | $ | 14,119,172 | |
QUALCOMM, Inc. | | | 212,633 | | | | 15,805,011 | |
Riverbed Technology, Inc.(1) | | | 30,121 | | | | 614,770 | |
| | |
| | | $ | 30,538,953 | |
| | |
|
Construction & Engineering — 0.3% | |
Chiyoda Corp. | | | 69,000 | | | $ | 571,664 | |
Ferrovial SA | | | 81,605 | | | | 1,613,181 | |
JGC Corp. | | | 67,000 | | | | 1,379,315 | |
| | |
| | | $ | 3,564,160 | |
| | |
|
Construction Materials — 0.2% | |
CRH PLC | | | 62,332 | | | $ | 1,498,802 | |
Imerys SA | | | 4,825 | | | | 354,980 | |
Lafarge SA | | | 4,914 | | | | 344,963 | |
| | |
| | | $ | 2,198,745 | |
| | |
|
Consumer Finance — 0.5% | |
American Express Co. | | | 42,280 | | | $ | 3,933,731 | |
Credit Saison Co., Ltd. | | | 45,600 | | | | 847,995 | |
Navient Corp. | | | 50,603 | | | | 1,093,531 | |
SLM Corp. | | | 50,603 | | | | 515,645 | |
| | |
| | | $ | 6,390,902 | |
| | |
|
Containers & Packaging — 0.1% | |
Sealed Air Corp. | | | 27,433 | | | $ | 1,163,982 | |
Toyo Seikan Kaisha, Ltd. | | | 25,700 | | | | 319,234 | |
| | |
| | | $ | 1,483,216 | |
| | |
|
Distributors — 0.4% | |
Genuine Parts Co. | | | 33,642 | | | $ | 3,585,228 | |
LKQ Corp.(1) | | | 53,930 | | | | 1,516,512 | |
| | |
| | | $ | 5,101,740 | |
| | |
|
Diversified Consumer Services — 0.0%(2) | |
Benesse Holdings, Inc. | | | 12,400 | | | $ | 367,944 | |
| | |
| | | $ | 367,944 | |
| | |
|
Diversified Financial Services — 1.0% | |
Berkshire Hathaway, Inc., Class B(1) | | | 16,883 | | | $ | 2,534,982 | |
CME Group, Inc. | | | 4,775 | | | | 423,304 | |
Deutsche Boerse AG | | | 11,870 | | | | 843,505 | |
Groupe Bruxelles Lambert SA | | | 4,239 | | | | 361,672 | |
ING Groep NV(1) | | | 203,360 | | | | 2,627,342 | |
| | | | |
| | 8 | | See Notes to Financial Statements. |
Eaton Vance
Tax-Managed Global Buy-Write Opportunities Fund
December 31, 2014
Portfolio of Investments — continued
| | | | | | | | |
| Security | | Shares | | | Value | |
| | | | | | | | |
|
Diversified Financial Services (continued) | |
Investor AB, Class B | | | 56,000 | | | $ | 2,036,037 | |
McGraw Hill Financial, Inc. | | | 27,142 | | | | 2,415,095 | |
Moody’s Corp. | | | 18,539 | | | | 1,776,222 | |
ORIX Corp. | | | 41,300 | | | | 519,669 | |
| | |
| | | $ | 13,537,828 | |
| | |
|
Diversified Telecommunication Services — 1.8% | |
AT&T, Inc. | | | 135,858 | | | $ | 4,563,470 | |
Belgacom SA | | | 25,589 | | | | 928,458 | |
BT Group PLC | | | 454,642 | | | | 2,827,901 | |
Deutsche Telekom AG | | | 220,347 | | | | 3,525,625 | |
Frontier Communications Corp. | | | 60,044 | | | | 400,493 | |
Orange SA | | | 55,102 | | | | 937,103 | |
Telefonica SA | | | 180,183 | | | | 2,586,981 | |
Verizon Communications, Inc. | | | 171,611 | | | | 8,027,963 | |
| | |
| | | $ | 23,797,994 | |
| | |
|
Electric Utilities — 0.8% | |
Acciona SA(1) | | | 8,786 | | | $ | 592,874 | |
Duke Energy Corp. | | | 20,897 | | | | 1,745,735 | |
Edison International | | | 51,169 | | | | 3,350,546 | |
Enel SpA | | | 375,898 | | | | 1,675,571 | |
Fortum Oyj | | | 63,829 | | | | 1,385,827 | |
Hokkaido Electric Power Co., Inc.(1) | | | 104,600 | | | | 837,318 | |
Iberdrola SA | | | 72,714 | | | | 490,147 | |
Pepco Holdings, Inc. | | | 18,841 | | | | 507,388 | |
| | |
| | | $ | 10,585,406 | |
| | |
|
Electrical Equipment — 0.7% | |
ABB, Ltd. | | | 292,957 | | | $ | 6,198,425 | |
Fujikura, Ltd. | | | 69,000 | | | | 283,749 | |
Legrand SA | | | 47,726 | | | | 2,503,618 | |
Mabuchi Motor Co., Ltd. | | | 10,000 | | | | 396,924 | |
| | |
| | | $ | 9,382,716 | |
| | |
|
Electronic Equipment, Instruments & Components — 0.9% | |
Alps Electric Co., Ltd. | | | 123,800 | | | $ | 2,340,114 | |
Corning, Inc. | | | 19,975 | | | | 458,027 | |
Keyence Corp. | | | 10 | | | | 4,456 | |
Kyocera Corp. | | | 107,400 | | | | 4,914,579 | |
OMRON Corp. | | | 16,500 | | | | 738,135 | |
Taiyo Yuden Co., Ltd. | | | 124,900 | | | | 1,453,415 | |
TDK Corp. | | | 40,200 | | | | 2,367,595 | |
| | |
| | | $ | 12,276,321 | |
| | |
| | | | | | | | |
| Security | | Shares | | | Value | |
| | | | | | | | |
|
Energy Equipment & Services — 0.6% | |
CGG SA(1) | | | 31,600 | | | $ | 186,230 | |
Halliburton Co. | | | 50,931 | | | | 2,003,116 | |
Schlumberger, Ltd. | | | 56,234 | | | | 4,802,946 | |
Technip SA | | | 9,124 | | | | 543,494 | |
| | |
| | | $ | 7,535,786 | |
| | |
|
Food & Staples Retailing — 1.3% | |
Carrefour SA | | | 208,600 | | | $ | 6,347,992 | |
CVS Health Corp. | | | 71,786 | | | | 6,913,710 | |
Seven & i Holdings Co., Ltd. | | | 72,700 | | | | 2,615,117 | |
UNY Group Holdings Co., Ltd. | | | 76,200 | | | | 387,914 | |
Wal-Mart Stores, Inc. | | | 13,122 | | | | 1,126,917 | |
| | |
| | | $ | 17,391,650 | |
| | |
|
Food Products — 3.4% | |
Campbell Soup Co. | | | 14,087 | | | $ | 619,828 | |
Kraft Foods Group, Inc. | | | 56,682 | | | | 3,551,694 | |
Mondelez International, Inc., Class A | | | 238,500 | | | | 8,663,513 | |
Nestle SA | | | 322,714 | | | | 23,526,168 | |
Nissin Foods Holdings Co., Ltd. | | | 11,700 | | | | 557,658 | |
Toyo Suisan Kaisha, Ltd. | | | 6,000 | | | | 193,193 | |
Unilever NV | | | 173,549 | | | | 6,788,839 | |
Yakult Honsha Co., Ltd. | | | 15,300 | | | | 807,610 | |
| | |
| | | $ | 44,708,503 | |
| | |
|
Gas Utilities — 0.1% | |
Gas Natural SDG SA | | | 3,226 | | | $ | 81,039 | |
Snam SpA | | | 175,073 | | | | 866,475 | |
| | |
| | | $ | 947,514 | |
| | |
|
Health Care Equipment & Supplies — 1.4% | |
Abbott Laboratories | | | 113,910 | | | $ | 5,128,228 | |
Analogic Corp. | | | 10,189 | | | | 862,091 | |
Covidien PLC | | | 49,888 | | | | 5,102,545 | |
Halyard Health, Inc.(1) | | | 2,935 | | | | 133,455 | |
Hologic, Inc.(1) | | | 17,554 | | | | 469,394 | |
Medtronic, Inc. | | | 35,589 | | | | 2,569,526 | |
Olympus Corp.(1) | | | 65,500 | | | | 2,294,486 | |
Terumo Corp. | | | 62,400 | | | | 1,416,246 | |
| | |
| | | $ | 17,975,971 | |
| | |
|
Health Care Providers & Services — 1.0% | |
DaVita HealthCare Partners, Inc.(1) | | | 17,963 | | | $ | 1,360,518 | |
Express Scripts Holding Co.(1) | | | 30,000 | | | | 2,540,100 | |
| | | | |
| | 9 | | See Notes to Financial Statements. |
Eaton Vance
Tax-Managed Global Buy-Write Opportunities Fund
December 31, 2014
Portfolio of Investments — continued
| | | | | | | | |
| Security | | Shares | | | Value | |
| | | | | | | | |
|
Health Care Providers & Services (continued) | |
McKesson Corp. | | | 16,774 | | | $ | 3,481,947 | |
Team Health Holdings, Inc.(1) | | | 17,059 | | | | 981,404 | |
Tenet Healthcare Corp.(1) | | | 22,112 | | | | 1,120,415 | |
UnitedHealth Group, Inc. | | | 34,811 | | | | 3,519,044 | |
| | |
| | | $ | 13,003,428 | |
| | |
|
Hotels, Restaurants & Leisure — 1.1% | |
Accor SA | | | 26,214 | | | $ | 1,178,345 | |
International Game Technology | | | 29,429 | | | | 507,650 | |
Marriott International, Inc., Class A | | | 10,655 | | | | 831,410 | |
McDonald’s Corp. | | | 56,163 | | | | 5,262,473 | |
Six Flags Entertainment Corp. | | | 35,954 | | | | 1,551,415 | |
Yum! Brands, Inc. | | | 68,297 | | | | 4,975,437 | |
| | |
| | | $ | 14,306,730 | |
| | |
|
Household Durables — 0.3% | |
Casio Computer Co., Ltd. | | | 63,200 | | | $ | 966,793 | |
Nikon Corp. | | | 37,500 | | | | 498,259 | |
PulteGroup, Inc. | | | 70,920 | | | | 1,521,943 | |
Sekisui Chemical Co., Ltd. | | | 61,000 | | | | 733,889 | |
| | |
| | | $ | 3,720,884 | |
| | |
|
Household Products — 1.0% | |
Clorox Co. (The) | | | 18,837 | | | $ | 1,963,004 | |
Colgate-Palmolive Co. | | | 7,994 | | | | 553,105 | |
Henkel AG & Co. KGaA, PFC Shares | | | 18,309 | | | | 1,972,205 | |
Kimberly-Clark Corp. | | | 23,485 | | | | 2,713,457 | |
Procter & Gamble Co. (The) | | | 33,567 | | | | 3,057,618 | |
Reckitt Benckiser Group PLC | | | 25,431 | | | | 2,059,757 | |
Unicharm Corp. | | | 37,200 | | | | 891,650 | |
| | |
| | | $ | 13,210,796 | |
| | |
|
Industrial Conglomerates — 1.8% | |
3M Co. | | | 38,311 | | | $ | 6,295,263 | |
General Electric Co. | | | 109,052 | | | | 2,755,744 | |
Nisshinbo Holdings, Inc. | | | 109,000 | | | | 1,123,870 | |
Siemens AG | | | 113,166 | | | | 12,697,663 | |
Toshiba Corp. | | | 93,000 | | | | 392,209 | |
| | |
| | | $ | 23,264,749 | |
| | |
|
Insurance — 4.5% | |
ACE, Ltd. | | | 23,988 | | | $ | 2,755,741 | |
Ageas | | | 22,500 | | | | 799,992 | |
Allianz SE | | | 69,106 | | | | 11,445,762 | |
| | | | | | | | |
| Security | | Shares | | | Value | |
| | | | | | | | |
|
Insurance (continued) | |
Allstate Corp. (The) | | | 16,927 | | | $ | 1,189,122 | |
Assicurazioni Generali SpA | | | 235,416 | | | | 4,833,759 | |
Cincinnati Financial Corp. | | | 52,936 | | | | 2,743,673 | |
Delta Lloyd NV | | | 38,000 | | | | 835,633 | |
Hartford Financial Services Group, Inc. | | | 48,969 | | | | 2,041,518 | |
Lincoln National Corp. | | | 22,183 | | | | 1,279,294 | |
Marsh & McLennan Cos., Inc. | | | 73,286 | | | | 4,194,891 | |
MetLife, Inc. | | | 82,093 | | | | 4,440,410 | |
MS&AD Insurance Group Holdings, Inc. | | | 48,200 | | | | 1,142,254 | |
Principal Financial Group, Inc. | | | 44,331 | | | | 2,302,552 | |
Prudential Financial, Inc. | | | 37,177 | | | | 3,363,031 | |
Prudential PLC | | | 349,752 | | | | 8,086,082 | |
SCOR SE | | | 63,370 | | | | 1,920,132 | |
Sony Financial Holdings, Inc. | | | 6,900 | | | | 101,603 | |
Standard Life PLC | | | 479,801 | | | | 2,972,025 | |
Swiss Life Holding AG | | | 8,264 | | | | 1,953,211 | |
T&D Holdings, Inc. | | | 54,600 | | | | 654,536 | |
| | |
| | | $ | 59,055,221 | |
| | |
|
Internet & Catalog Retail — 1.8% | |
Amazon.com, Inc.(1) | | | 49,368 | | | $ | 15,321,359 | |
Netflix, Inc.(1) | | | 6,326 | | | | 2,161,025 | |
Priceline Group, Inc. (The)(1) | | | 4,505 | | | | 5,136,646 | |
Shutterfly, Inc.(1) | | | 21,804 | | | | 909,117 | |
| | |
| | | $ | 23,528,147 | |
| | |
| | |
Internet Software & Services — 4.2% | | | | | | | | |
eBay, Inc.(1) | | | 94,830 | | | $ | 5,321,860 | |
Facebook, Inc., Class A(1) | | | 163,423 | | | | 12,750,263 | |
Google, Inc., Class A(1) | | | 30,223 | | | | 16,038,137 | |
Google, Inc., Class C(1) | | | 32,847 | | | | 17,290,661 | |
Keysight Technologies, Inc.(1) | | | 6,518 | | | | 220,113 | |
LinkedIn Corp., Class A(1) | | | 7,885 | | | | 1,811,263 | |
United Internet AG | | | 32,975 | | | | 1,485,355 | |
| | |
| | | $ | 54,917,652 | |
| | |
|
IT Services — 1.7% | |
Accenture PLC, Class A | | | 5,056 | | | $ | 451,551 | |
Amadeus IT Holding SA, Class A | | | 24,489 | | | | 975,331 | |
AtoS | | | 5,628 | | | | 447,175 | |
Cap Gemini SA | | | 44,329 | | | | 3,170,282 | |
Cognizant Technology Solutions Corp., Class A(1) | | | 109,444 | | | | 5,763,321 | |
Fidelity National Information Services, Inc. | | | 51,873 | | | | 3,226,501 | |
Indra Sistemas SA | | | 100,870 | | | | 979,995 | |
International Business Machines Corp. | | | 17,397 | | | | 2,791,175 | |
MasterCard, Inc., Class A | | | 32,320 | | | | 2,784,691 | |
| | | | |
| | 10 | | See Notes to Financial Statements. |
Eaton Vance
Tax-Managed Global Buy-Write Opportunities Fund
December 31, 2014
Portfolio of Investments — continued
| | | | | | | | |
| Security | | Shares | | | Value | |
| | | | | | | | |
|
IT Services (continued) | |
Nomura Research Institute, Ltd. | | | 6,800 | | | $ | 207,979 | |
NTT Data Corp. | | | 29,100 | | | | 1,084,115 | |
Obic Co., Ltd. | | | 7,300 | | | | 236,883 | |
Otsuka Corp. | | | 7,800 | | | | 247,326 | |
Western Union Co. | | | 19,046 | | | | 341,114 | |
| | |
| | | $ | 22,707,439 | |
| | |
|
Leisure Products — 0.1% | �� |
Hasbro, Inc. | | | 21,651 | | | $ | 1,190,588 | |
| | |
| | | $ | 1,190,588 | |
| | |
|
Life Sciences Tools & Services — 0.3% | |
Agilent Technologies, Inc. | | | 13,037 | | | $ | 533,735 | |
PerkinElmer, Inc. | | | 27,425 | | | | 1,199,295 | |
Thermo Fisher Scientific, Inc. | | | 17,359 | | | | 2,174,909 | |
| | |
| | | $ | 3,907,939 | |
| | |
|
Machinery — 1.7% | |
Caterpillar, Inc. | | | 22,215 | | | $ | 2,033,339 | |
Dover Corp. | | | 7,424 | | | | 532,449 | |
Ebara Corp. | | | 278,000 | | | | 1,139,124 | |
FANUC Corp. | | | 48,127 | | | | 7,935,193 | |
IHI Corp. | | | 213,000 | | | | 1,078,730 | |
Japan Steel Works, Ltd. | | | 24,000 | | | | 84,915 | |
Kawasaki Heavy Industries, Ltd. | | | 107,000 | | | | 486,587 | |
Komatsu, Ltd. | | | 67,800 | | | | 1,498,918 | |
Kurita Water Industries, Ltd. | | | 6,200 | | | | 129,283 | |
Makita Corp. | | | 6,700 | | | | 301,915 | |
MAN AG | | | 10,039 | | | | 1,118,031 | |
NSK, Ltd. | | | 6,000 | | | | 70,840 | |
Pall Corp. | | | 17,298 | | | | 1,750,731 | |
Parker-Hannifin Corp. | | | 7,147 | | | | 921,606 | |
SMC Corp. | | | 1,900 | | | | 498,225 | |
Snap-on, Inc. | | | 6,143 | | | | 839,994 | |
Stanley Black & Decker, Inc. | | | 24,657 | | | | 2,369,045 | |
| | |
| | | $ | 22,788,925 | |
| | |
|
Marine — 0.0%(2) | |
Kirby Corp.(1) | | | 3,948 | | | $ | 318,762 | |
| | |
| | | $ | 318,762 | |
| | |
|
Media — 3.6% | |
Cablevision Systems Corp. | | | 25,804 | | | $ | 532,595 | |
CBS Corp., Class B | | | 10,000 | | | | 553,400 | |
| | | | | | | | |
| Security | | Shares | | | Value | |
| | | | | | | | |
|
Media (continued) | |
Comcast Corp., Class A | | | 287,003 | | | $ | 16,649,044 | |
Dentsu, Inc. | | | 26,600 | | | | 1,118,302 | |
DIRECTV(1) | | | 5,700 | | | | 494,190 | |
Hakuhodo DY Holdings, Inc. | | | 20,900 | | | | 200,012 | |
IMAX Corp.(1) | | | 13,812 | | | | 426,791 | |
Interpublic Group of Cos., Inc. | | | 50,333 | | | | 1,045,416 | |
Liberty Global PLC, Series A(1) | | | 11,898 | | | | 597,339 | |
Liberty Global PLC, Series C(1) | | | 39,666 | | | | 1,916,264 | |
Omnicom Group, Inc. | | | 30,682 | | | | 2,376,934 | |
ProSiebenSat.1 Media AG | | | 27,382 | | | | 1,144,110 | |
Sky PLC | | | 447,757 | | | | 6,249,041 | |
Time Warner Cable, Inc. | | | 23,227 | | | | 3,531,898 | |
Time Warner, Inc. | | | 22,926 | | | | 1,958,339 | |
Twenty-First Century Fox, Inc., Class A | | | 60,000 | | | | 2,304,300 | |
Walt Disney Co. (The) | | | 58,917 | | | | 5,549,392 | |
Wolters Kluwer NV | | | 961 | | | | 29,325 | |
| | |
| | | $ | 46,676,692 | |
| | |
|
Metals & Mining — 1.3% | |
BHP Billiton PLC | | | 189,390 | | | $ | 4,058,882 | |
Daido Steel Co., Ltd. | | | 85,000 | | | | 321,041 | |
Dowa Holdings Co., Ltd. | | | 105,000 | | | | 834,227 | |
Freeport-McMoRan, Inc. | | | 20,000 | | | | 467,200 | |
Glencore PLC | | | 483,787 | | | | 2,233,078 | |
JFE Holdings, Inc. | | | 8,400 | | | | 187,327 | |
Mitsubishi Materials Corp. | | | 80,000 | | | | 265,394 | |
Nucor Corp. | | | 23,673 | | | | 1,161,160 | |
Pacific Metals Co., Ltd.(1) | | | 42,000 | | | | 126,556 | |
Rio Tinto PLC | | | 141,107 | | | | 6,504,618 | |
Sumitomo Metal Mining Co., Ltd. | | | 51,000 | | | | 760,659 | |
United States Steel Corp. | | | 10,793 | | | | 288,605 | |
| | |
| | | $ | 17,208,747 | |
| | |
|
Multi-Utilities — 1.6% | |
Centrica PLC | | | 778,444 | | | $ | 3,371,778 | |
CMS Energy Corp. | | | 137,634 | | | | 4,782,781 | |
Consolidated Edison, Inc. | | | 24,350 | | | | 1,607,344 | |
Dominion Resources, Inc. | | | 27,793 | | | | 2,137,282 | |
GDF Suez | | | 294,016 | | | | 6,856,166 | |
NiSource, Inc. | | | 42,420 | | | | 1,799,456 | |
Public Service Enterprise Group, Inc. | | | 6,502 | | | | 269,248 | |
Veolia Environnement SA | | | 37,663 | | | | 667,118 | |
| | |
| | | $ | 21,491,173 | |
| | |
| | | | |
| | 11 | | See Notes to Financial Statements. |
Eaton Vance
Tax-Managed Global Buy-Write Opportunities Fund
December 31, 2014
Portfolio of Investments — continued
| | | | | | | | |
| Security | | Shares | | | Value | |
| | | | | | | | |
|
Multiline Retail — 1.3% | |
Isetan Mitsukoshi Holdings, Ltd. | | | 71,332 | | | $ | 882,676 | |
Macy’s, Inc. | | | 48,120 | | | | 3,163,890 | |
Marks & Spencer Group PLC | | | 432,844 | | | | 3,204,948 | |
Next PLC | | | 41,584 | | | | 4,410,270 | |
Nordstrom, Inc. | | | 19,173 | | | | 1,522,144 | |
Target Corp. | | | 41,968 | | | | 3,185,791 | |
| | |
| | | $ | 16,369,719 | |
| | |
|
Oil, Gas & Consumable Fuels — 5.3% | |
Anadarko Petroleum Corp. | | | 23,006 | | | $ | 1,897,995 | |
BP PLC | | | 962,053 | | | | 6,106,704 | |
Chevron Corp. | | | 72,650 | | | | 8,149,877 | |
ConocoPhillips | | | 40,825 | | | | 2,819,375 | |
ENI SpA | | | 230,830 | | | | 4,043,329 | |
Exxon Mobil Corp. | | | 103,554 | | | | 9,573,567 | |
Idemitsu Kosan Co., Ltd. | | | 12,400 | | | | 204,765 | |
Marathon Petroleum Corp. | | | 13,958 | | | | 1,259,849 | |
Newfield Exploration Co.(1) | | | 28,252 | | | | 766,194 | |
Phillips 66 | | | 36,105 | | | | 2,588,729 | |
Royal Dutch Shell PLC, Class A | | | 291,192 | | | | 9,717,918 | |
Royal Dutch Shell PLC, Class B | | | 234,515 | | | | 8,102,742 | |
Total SA | | | 199,276 | | | | 10,209,307 | |
Williams Cos., Inc. | | | 72,642 | | | | 3,264,531 | |
WPX Energy, Inc.(1) | | | 16,500 | | | | 191,895 | |
| | |
| | | $ | 68,896,777 | |
| | |
|
Paper & Forest Products — 0.2% | |
International Paper Co. | | | 29,828 | | | $ | 1,598,184 | |
OJI Paper Co., Ltd. | | | 95,000 | | | | 339,900 | |
| | |
| | | $ | 1,938,084 | |
| | |
|
Personal Products — 0.3% | |
Estee Lauder Cos., Inc. (The), Class A | | | 25,480 | | | $ | 1,941,576 | |
Kao Corp. | | | 61,054 | | | | 2,407,636 | |
| | |
| | | $ | 4,349,212 | |
| | |
|
Pharmaceuticals — 7.9% | |
AbbVie, Inc. | | | 48,532 | | | $ | 3,175,934 | |
Actavis PLC(1) | | | 14,047 | | | | 3,615,838 | |
Allergan, Inc. | | | 15,098 | | | | 3,209,684 | |
Astellas Pharma, Inc. | | | 269,300 | | | | 3,749,222 | |
AstraZeneca PLC | | | 117,424 | | | | 8,293,743 | |
Bayer AG | | | 26,130 | | | | 3,561,738 | |
Chugai Pharmaceutical Co., Ltd. | | | 99,100 | | | | 2,433,234 | |
| | | | | | | | |
| Security | | Shares | | | Value | |
| | | | | | | | |
|
Pharmaceuticals (continued) | |
Eisai Co., Ltd. | | | 43,946 | | | $ | 1,699,530 | |
Eli Lilly & Co. | | | 17,949 | | | | 1,238,302 | |
GlaxoSmithKline PLC | | | 118,141 | | | | 2,534,550 | |
Hisamitsu Pharmaceutical Co., Inc. | | | 3,300 | | | | 104,058 | |
Indivior PLC(1) | | | 25,431 | | | | 59,217 | |
Johnson & Johnson | | | 60,088 | | | | 6,283,402 | |
Mallinckrodt PLC(1) | | | 6,475 | | | | 641,219 | |
Merck & Co., Inc. | | | 103,665 | | | | 5,887,135 | |
Mitsubishi Tanabe Pharma Corp. | | | 10,000 | | | | 146,586 | |
Novartis AG | | | 218,832 | | | | 20,295,240 | |
Pfizer, Inc. | | | 109,562 | | | | 3,412,856 | |
Roche Holding AG PC | | | 75,965 | | | | 20,582,124 | |
Sanofi | | | 124,447 | | | | 11,345,888 | |
Takeda Pharmaceutical Co., Ltd. | | | 14,631 | | | | 605,691 | |
UCB SA | | | 9,177 | | | | 697,795 | |
| | |
| | | $ | 103,572,986 | |
| | |
|
Professional Services — 0.3% | |
Equifax, Inc. | | | 15,217 | | | $ | 1,230,599 | |
Experian PLC | | | 29,123 | | | | 490,925 | |
Intertek Group PLC | | | 7,167 | | | | 259,388 | |
Robert Half International, Inc. | | | 36,884 | | | | 2,153,288 | |
| | |
| | | $ | 4,134,200 | |
| | |
|
Real Estate Investment Trusts (REITs) — 0.8% | |
American Tower Corp. | | | 17,793 | | | $ | 1,758,838 | |
AvalonBay Communities, Inc. | | | 5,904 | | | | 964,655 | |
British Land Co. PLC (The) | | | 107,910 | | | | 1,301,250 | |
Intu Properties PLC | | | 189,600 | | | | 980,220 | |
Japan Real Estate Investment Corp. | | | 74 | | | | 356,552 | |
Nippon Building Fund, Inc. | | | 80 | | | | 401,609 | |
Simon Property Group, Inc. | | | 26,522 | | | | 4,829,921 | |
| | |
| | | $ | 10,593,045 | |
| | |
|
Real Estate Management & Development — 0.5% | |
Capital & Counties Properties PLC | | | 189,600 | | | $ | 1,071,339 | |
CBRE Group, Inc., Class A(1) | | | 41,385 | | | | 1,417,436 | |
Daito Trust Construction Co., Ltd. | | | 6,300 | | | | 714,658 | |
Heiwa Real Estate Co., Ltd. | | | 40,500 | | | | 613,488 | |
Nomura Real Estate Holdings, Inc. | | | 27,400 | | | | 468,882 | |
NTT Urban Development Corp. | | | 44,300 | | | | 446,128 | |
Sumitomo Realty & Development Co., Ltd. | | | 36,000 | | | | 1,226,489 | |
| | |
| | | $ | 5,958,420 | |
| | |
| | | | |
| | 12 | | See Notes to Financial Statements. |
Eaton Vance
Tax-Managed Global Buy-Write Opportunities Fund
December 31, 2014
Portfolio of Investments — continued
| | | | | | | | |
| Security | | Shares | | | Value | |
| | | | | | | | |
|
Road & Rail — 0.8% | |
Central Japan Railway Co. | | | 5,500 | | | $ | 824,319 | |
CSX Corp. | | | 115,014 | | | | 4,166,957 | |
East Japan Railway Co. | | | 11,200 | | | | 844,153 | |
Hankyu Hanshin Holdings, Inc. | | | 128 | | | | 687 | |
Kansas City Southern | | | 15,468 | | | | 1,887,560 | |
Keio Corp. | | | 76,000 | | | | 546,712 | |
Ryder System, Inc. | | | 14,154 | | | | 1,314,199 | |
Tobu Railway Co., Ltd. | | | 135,000 | | | | 577,279 | |
| | |
| | | $ | 10,161,866 | |
| | |
|
Semiconductors & Semiconductor Equipment — 3.7% | |
Advanced Micro Devices, Inc.(1) | | | 190,688 | | | $ | 509,137 | |
ARM Holdings PLC | | | 320,204 | | | | 4,919,096 | |
Cree, Inc.(1) | | | 17,003 | | | | 547,837 | |
Cypress Semiconductor Corp.(1) | | | 217,447 | | | | 3,105,143 | |
Intel Corp. | | | 518,070 | | | | 18,800,760 | |
Marvell Technology Group, Ltd. | | | 164,177 | | | | 2,380,567 | |
NXP Semiconductors NV(1) | | | 54,841 | | | | 4,189,852 | |
ROHM Co., Ltd. | | | 11,200 | | | | 674,836 | |
Sumco Corp. | | | 40,300 | | | | 576,939 | |
Texas Instruments, Inc. | | | 157,242 | | | | 8,406,944 | |
Tokyo Electron, Ltd. | | | 62,400 | | | | 4,731,805 | |
| | |
| | | $ | 48,842,916 | |
| | |
|
Software — 4.0% | |
Citrix Systems, Inc.(1) | | | 34,110 | | | $ | 2,176,218 | |
Electronic Arts, Inc.(1) | | | 53,174 | | | | 2,499,975 | |
Konami Corp. | | | 33,000 | | | | 605,002 | |
Microsoft Corp. | | | 832,840 | | | | 38,685,418 | |
Oracle Corp. | | | 156,176 | | | | 7,023,235 | |
Trend Micro, Inc. | | | 40,097 | | | | 1,108,010 | |
| | |
| | | $ | 52,097,858 | |
| | |
|
Specialty Retail — 2.5% | |
CarMax, Inc.(1) | | | 5,464 | | | $ | 363,793 | |
Fast Retailing Co., Ltd. | | | 42,100 | | | | 15,319,984 | |
Gap, Inc. (The) | | | 52,447 | | | | 2,208,543 | |
Groupe FNAC SA(1) | | | 922 | | | | 45,978 | |
Home Depot, Inc. (The) | | | 71,465 | | | | 7,501,681 | |
Lowe’s Companies, Inc. | | | 55,810 | | | | 3,839,728 | |
Tiffany & Co. | | | 24,739 | | | | 2,643,610 | |
USS Co., Ltd. | | | 27,200 | | | | 417,920 | |
Yamada Denki Co., Ltd. | | | 43,600 | | | | 146,283 | |
| | |
| | | $ | 32,487,520 | |
| | |
| | | | | | | | |
| Security | | Shares | | | Value | |
| | | | | | | | |
|
Technology Hardware, Storage & Peripherals — 5.3% | |
Apple, Inc. | | | 551,721 | | | $ | 60,898,964 | |
Brother Industries, Ltd. | | | 22,000 | | | | 398,802 | |
Canon, Inc. | | | 34,800 | | | | 1,106,074 | |
Hewlett-Packard Co. | | | 78,955 | | | | 3,168,464 | |
Konica Minolta, Inc. | | | 66,500 | | | | 724,585 | |
NEC Corp. | | | 77,000 | | | | 223,762 | |
NetApp, Inc. | | | 20,000 | | | | 829,000 | |
Nokia Oyj | | | 235,000 | | | | 1,858,569 | |
Ricoh Co., Ltd. | | | 28,000 | | | | 283,054 | |
| | |
| | | $ | 69,491,274 | |
| | |
|
Textiles, Apparel & Luxury Goods — 1.2% | |
Adidas AG | | | 11,824 | | | $ | 821,124 | |
Asics Corp. | | | 20,000 | | | | 481,506 | |
Christian Dior SA | | | 10,660 | | | | 1,824,332 | |
Coach, Inc. | | | 16,626 | | | | 624,472 | |
Hanesbrands, Inc. | | | 15,679 | | | | 1,750,090 | |
Hermes International | | | 1,334 | | | | 475,014 | |
Kering SA | | | 7,380 | | | | 1,418,219 | |
LVMH Moet Hennessy Louis Vuitton SA | | | 15,000 | | | | 2,376,025 | |
NIKE, Inc., Class B | | | 49,232 | | | | 4,733,657 | |
Onward Holdings Co., Ltd. | | | 30,000 | | | | 180,368 | |
Swatch Group, Ltd. (The), Bearer Shares | | | 2,352 | | | | 1,044,891 | |
| | |
| | | $ | 15,729,698 | |
| | |
|
Thrifts & Mortgage Finance — 0.1% | |
Hudson City Bancorp, Inc. | | | 84,624 | | | $ | 856,395 | |
| | |
| | | $ | 856,395 | |
| | |
|
Tobacco — 2.1% | |
British American Tobacco PLC | | | 243,393 | | | $ | 13,189,697 | |
Imperial Tobacco Group PLC | | | 143,738 | | | | 6,327,275 | |
Japan Tobacco, Inc. | | | 76,500 | | | | 2,105,492 | |
Lorillard, Inc. | | | 5,156 | | | | 324,519 | |
Philip Morris International, Inc. | | | 64,219 | | | | 5,230,637 | |
| | |
| | | $ | 27,177,620 | |
| | |
|
Trading Companies & Distributors — 0.5% | |
Marubeni Corp. | | | 147,000 | | | $ | 879,556 | |
Mitsubishi Corp. | | | 77,500 | | | | 1,418,259 | |
Sumitomo Corp. | | | 97,400 | | | | 1,000,364 | |
Wolseley PLC | | | 47,906 | | | | 2,738,873 | |
| | |
| | | $ | 6,037,052 | |
| | |
| | | | |
| | 13 | | See Notes to Financial Statements. |
Eaton Vance
Tax-Managed Global Buy-Write Opportunities Fund
December 31, 2014
Portfolio of Investments — continued
| | | | | | | | |
| Security | | Shares | | | Value | |
| | | | | | | | |
|
Transportation Infrastructure — 0.1% | |
ADP | | | 6,667 | | | $ | 806,205 | |
Kamigumi Co., Ltd. | | | 46,000 | | | | 409,760 | |
| | |
| | | $ | 1,215,965 | |
| | |
|
Wireless Telecommunication Services — 1.7% | |
KDDI Corp. | | | 72,100 | | | $ | 4,529,614 | |
SoftBank Corp. | | | 133,598 | | | | 7,952,187 | |
T-Mobile US, Inc.(1) | | | 10,717 | | | | 288,716 | |
Vodafone Group PLC | | | 2,557,042 | | | | 8,767,141 | |
| | |
| | | $ | 21,537,658 | |
| | |
| |
Total Common Stocks — 99.9%
(identified cost $720,824,451) | | | $ | 1,306,502,657 | |
| | |
| | | | | | | | | | | | | | | | |
|
| Call Options Written — (0.6)% | |
| |
| Exchange-Traded Options — (0.2)% | | | | | |
| | | | |
| | | | | | | | | | | | | | | | |
| Description | | Number of
Contracts | | | Strike
Price | | | Expiration
Date | | | Value | |
| | | | | | | | | | | | | | | | |
NASDAQ 100 Index | | | 210 | | | $ | 4,380 | | | | 1/2/15 | | | $ | (23,100 | ) |
NASDAQ 100 Index | | | 185 | | | | 4,315 | | | | 1/9/15 | | | | (192,400 | ) |
NASDAQ 100 Index | | | 110 | | | | 4,340 | | | | 1/17/15 | | | | (161,150 | ) |
NASDAQ 100 Index | | | 135 | | | | 4,350 | | | | 1/23/15 | | | | (273,375 | ) |
S&P 500 Index | | | 540 | | | | 2,090 | | | | 1/2/15 | | | | (27,000 | ) |
S&P 500 Index | | | 485 | | | | 2,065 | | | | 1/9/15 | | | | (751,750 | ) |
S&P 500 Index | | | 540 | | | | 2,100 | | | | 1/17/15 | | | | (334,800 | ) |
S&P 500 Index | | | 410 | | | | 2,110 | | | | 1/23/15 | | | | (295,200 | ) |
| | | | | | | | | | | | | | | | | |
| | | | | | | | | | | | | | $ | (2,058,775 | ) |
| | |
| | | | | | | | | | | | | | | | | | |
| |
| Over-the-Counter Options — (0.4)% | | | | | |
| | | | | |
| | | | | | | | | | | | | | | | | | |
| Description | | Counterparty | | Number of
Contracts | | | Strike
Price | | | Expiration
Date | | | Value | |
Dow Jones Euro
Stoxx 50 Index | | Bank of America, N.A. | | | 14,900 | | | | EUR 3,200 | | | | 1/16/15 | | | $ | (503,932 | ) |
Dow Jones Euro
Stoxx 50 Index | | Citibank, N.A. | | | 29,000 | | | | EUR 3,200 | | | | 1/16/15 | | | | (980,806 | ) |
Dow Jones Euro
Stoxx 50 Index | | Deutsche Bank AG | | | 14,500 | | | | EUR 3,225 | | | | 1/16/15 | | | | (346,528 | ) |
FTSE 100 Index | | Barclays Bank PLC | | | 7,100 | | | | GBP 6,525 | | | | 1/16/15 | | | | (1,244,933 | ) |
FTSE 100 Index | | Citibank, N.A. | | | 7,350 | | | | GBP 6,575 | | | | 1/16/15 | | | | (905,002 | ) |
Nikkei 225 Index | | Bank of America,
N.A. | | | 440,000 | | | | JPY 17,375 | | | | 1/9/15 | | | | (835,699 | ) |
Nikkei 225 Index | | Bank of America,
N.A. | | | 440,000 | | | | JPY 17,500 | | | | 1/9/15 | | | | (624,478 | ) |
| | | | | | | | | | | | | | | | | | |
| Description | | Counterparty | | Number of
Contracts | | | Strike
Price | | | Expiration
Date | | | Value | |
SMI Index | | Bank of America,
N.A. | | | 3,150 | | | | CHF 9,100 | | | | 1/16/15 | | | $ | (152,557 | ) |
SMI Index | | Societe Generale | | | 2,950 | | | | CHF 9,100 | | | | 1/16/15 | | | | (142,871 | ) |
| | | | | | | | | | | | | | | | | | | |
| | | | | | | | | | | | | | | | $ | (5,736,806 | ) |
| | | | | | | | | | | | | | | | | | | |
| | |
Total Call Options Written
(premiums received $10,245,680) | | | | | | | $ | (7,795,581 | ) |
| | | | | | | | | | | | | | | | | | | |
| | |
Other Assets, Less Liabilities — 0.7% | | | | | | | $ | 9,369,624 | |
| | | | | | | | | | | | | | | | | | | |
| | |
Net Assets — 100.0% | | | | | | | $ | 1,308,076,700 | |
| | | | | | | | | | | | | | | | | | | |
The percentage shown for each investment category in the Portfolio of Investments is based on net assets.
| | | | |
| PC | | – | | Participation Certificate |
| PFC Shares | | – | | Preference Shares |
| | | | |
| CHF | | – | | Swiss Franc |
| EUR | | – | | Euro |
| GBP | | – | | British Pound Sterling |
| JPY | | – | | Japanese Yen |
| (1) | Non-income producing security. |
| (2) | Amount is less than 0.05%. |
| | | | | | | | |
| Country Concentration of Portfolio | |
| | |
| | | | | | | | |
| Country | | Percentage of
Total Investments | | | Value | |
United States | | | 55.5 | % | | $ | 725,348,289 | |
United Kingdom | | | 11.6 | | | | 151,125,586 | |
Japan | | | 11.1 | | | | 145,083,421 | |
Switzerland | | | 6.0 | | | | 78,126,124 | |
France | | | 5.3 | | | | 69,412,835 | |
Germany | | | 5.0 | | | | 65,435,950 | |
Spain | | | 1.7 | | | | 22,560,464 | |
Italy | | | 1.3 | | | | 16,543,291 | |
Netherlands | | | 0.8 | | | | 10,587,648 | |
Ireland | | | 0.5 | | | | 7,242,566 | |
Belgium | | | 0.4 | | | | 4,818,803 | |
Finland | | | 0.2 | | | | 3,244,396 | |
Bermuda | | | 0.2 | | | | 2,404,742 | |
Denmark | | | 0.2 | | | | 2,105,714 | |
Sweden | | | 0.2 | | | | 2,036,037 | |
Canada | | | 0.0 | (1) | | | 426,791 | |
| | | | | | | | | |
Total Investments | | | 100.0 | % | | $ | 1,306,502,657 | |
| | | | | | | | | |
| (1) | Amount is less than 0.05%. |
| | | | |
| | 14 | | See Notes to Financial Statements. |
Eaton Vance
Tax-Managed Global Buy-Write Opportunities Fund
December 31, 2014
Statement of Assets and Liabilities
| | | | |
| Assets | | December 31, 2014 | |
Investments, at value (identified cost, $720,824,451) | | $ | 1,306,502,657 | |
Cash | | | 6,621,702 | |
Foreign currency, at value (identified cost, $1,072,672) | | | 1,065,692 | |
Dividends receivable | | | 1,272,928 | |
Tax reclaims receivable | | | 1,800,313 | |
Total assets | | $ | 1,317,263,292 | |
|
| Liabilities | |
Written options outstanding, at value (premiums received, $10,245,680) | | $ | 7,795,581 | |
Payable to affiliates: | | | | |
Investment adviser fee | | | 1,121,579 | |
Trustees’ fees | | | 15,908 | |
Accrued expenses | | | 253,524 | |
Total liabilities | | $ | 9,186,592 | |
Net Assets | | $ | 1,308,076,700 | |
|
| Sources of Net Assets | |
Common shares, $0.01 par value, unlimited number of shares authorized, 106,442,735 shares issued and outstanding | | $ | 1,064,427 | |
Additional paid-in capital | | | 804,560,038 | |
Accumulated net realized loss | | | (81,006,860 | ) |
Accumulated distributions in excess of net investment income | | | (4,483,145 | ) |
Net unrealized appreciation | | | 587,942,240 | |
Net Assets | | $ | 1,308,076,700 | |
| |
| Net Asset Value | | | | |
($1,308,076,700 ÷ 106,442,735 common shares issued and outstanding) | | $ | 12.29 | |
| | | | |
| | 15 | | See Notes to Financial Statements. |
Eaton Vance
Tax-Managed Global Buy-Write Opportunities Fund
December 31, 2014
Statement of Operations
| | | | |
| Investment Income | | Year Ended
December 31, 2014 | |
Dividends (net of foreign taxes, $2,048,876) | | $ | 39,895,282 | |
Total investment income | | $ | 39,895,282 | |
|
| Expenses | |
Investment adviser fee | | $ | 13,759,494 | |
Trustees’ fees and expenses | | | 64,421 | |
Custodian fee | | | 502,714 | |
Transfer and dividend disbursing agent fees | | | 19,132 | |
Legal and accounting services | | | 77,814 | |
Printing and postage | | | 485,861 | |
Miscellaneous | | | 183,575 | |
Total expenses | | $ | 15,093,011 | |
Deduct — | | | | |
Reduction of custodian fee | | $ | 2,226 | |
Total expense reductions | | $ | 2,226 | |
| |
Net expenses | | $ | 15,090,785 | |
| |
Net investment income | | $ | 24,804,497 | |
|
| Realized and Unrealized Gain (Loss) | |
Net realized gain (loss) — | | | | |
Investment transactions | | $ | 90,804,889 | |
Written options | | | (56,797,144 | ) |
Foreign currency transactions | | | (63,373 | ) |
Net realized gain | | $ | 33,944,372 | |
Change in unrealized appreciation (depreciation) — | | | | |
Investments | | $ | (48,338,602 | ) |
Written options | | | 24,704,150 | |
Foreign currency | | | (330,757 | ) |
Net change in unrealized appreciation (depreciation) | | $ | (23,965,209 | ) |
| |
Net realized and unrealized gain | | $ | 9,979,163 | |
| |
Net increase in net assets from operations | | $ | 34,783,660 | |
| | | | |
| | 16 | | See Notes to Financial Statements. |
Eaton Vance
Tax-Managed Global Buy-Write Opportunities Fund
December 31, 2014
Statements of Changes in Net Assets
| | | | | | | | |
| | | Year Ended December 31, | |
| Increase (Decrease) in Net Assets | | 2014 | | | 2013 | |
From operations — | | | | | | | | |
Net investment income | | $ | 24,804,497 | | | $ | 18,396,955 | |
Net realized gain (loss) from investment transactions, written options and foreign currency transactions | | | 33,944,372 | | | | (66,345,463 | ) |
Net change in unrealized appreciation (depreciation) from investments, written options and foreign currency | | | (23,965,209 | ) | | | 253,297,924 | |
Net increase in net assets from operations | | $ | 34,783,660 | | | $ | 205,349,416 | |
Distributions to shareholders — | | | | | | | | |
From net investment income | | $ | (25,686,293 | ) | | $ | (20,093,017 | ) |
Tax return of capital | | | (98,596,245 | ) | | | (104,202,559 | ) |
Total distributions | | $ | (124,282,538 | ) | | $ | (124,295,576 | ) |
Capital share transactions — | | | | | | | | |
Cost of shares repurchased (see Note 5) | | $ | — | | | $ | (747,820 | ) |
Net decrease in net assets from capital share transactions | | $ | — | | | $ | (747,820 | ) |
| | |
Net increase (decrease) in net assets | | $ | (89,498,878 | ) | | $ | 80,306,020 | |
|
| Net Assets | |
At beginning of year | | $ | 1,397,575,578 | | | $ | 1,317,269,558 | |
At end of year | | $ | 1,308,076,700 | | | $ | 1,397,575,578 | |
|
Accumulated distributions in excess of net investment income
included in net assets | |
At end of year | | $ | (4,483,145 | ) | | $ | (3,502,823 | ) |
| | | | |
| | 17 | | See Notes to Financial Statements. |
Eaton Vance
Tax-Managed Global Buy-Write Opportunities Fund
December 31, 2014
Financial Highlights
| | | | | | | | | | | | | | | | | | | | |
| | | Year Ended December 31, | |
| | | 2014 | | | 2013 | | | 2012 | | | 2011 | | | 2010 | |
Net asset value — Beginning of year | | $ | 13.130 | | | $ | 12.370 | | | $ | 12.220 | | | $ | 13.320 | | | $ | 13.840 | |
| | | | | |
| Income (Loss) From Operations | | | | | | | | | | | | | | | | | | | | |
Net investment income(1) | | $ | 0.233 | | | $ | 0.173 | | | $ | 0.223 | | | $ | 0.198 | | | $ | 0.160 | |
Net realized and unrealized gain (loss) | | | 0.095 | | | | 1.754 | | | | 1.084 | | | | (0.088 | ) | | | 0.792 | |
| | | | | |
Total income from operations | | $ | 0.328 | | | $ | 1.927 | | | $ | 1.307 | | | $ | 0.110 | | | $ | 0.952 | |
| | | | | |
| Less Distributions | | | | | | | | | | | | | | | | | | | | |
From net investment income | | $ | (0.242 | ) | | $ | (0.189 | ) | | $ | (0.233 | ) | | $ | (0.194 | ) | | $ | (0.167 | ) |
From net realized gain | | | — | | | | — | | | | — | | | | — | | | | (0.019 | ) |
Tax return of capital | | | (0.926 | ) | | | (0.979 | ) | | | (0.935 | ) | | | (1.016 | ) | | | (1.286 | ) |
| | | | | |
Total distributions | | $ | (1.168 | ) | | $ | (1.168 | ) | | $ | (1.168 | ) | | $ | (1.210 | ) | | $ | (1.472 | ) |
| | | | | |
Anti-dilutive effect of share repurchase program (see Note 5)(1) | | $ | — | | | $ | 0.001 | | | $ | 0.011 | | | $ | — | | | $ | — | |
| | | | | |
Net asset value — End of year | | $ | 12.290 | | | $ | 13.130 | | | $ | 12.370 | | | $ | 12.220 | | | $ | 13.320 | |
| | | | | |
Market value — End of year | | $ | 11.020 | | | $ | 12.100 | | | $ | 10.690 | | | $ | 10.280 | | | $ | 12.250 | |
| | | | | |
Total Investment Return on Net Asset Value(2) | | | 2.97 | % | | | 17.46 | % | | | 12.46 | % | | | 2.21 | % | | | 8.24 | % |
| | | | | |
Total Investment Return on Market Value(2) | | | 0.19 | % | | | 25.26 | % | | | 15.53 | % | | | (6.50 | )% | | | (0.81 | )% |
| | | | | |
| Ratios/Supplemental Data | | | | | | | | | | | | | | | | | | | | |
Net assets, end of year (000’s omitted) | | $ | 1,308,077 | | | $ | 1,397,576 | | | $ | 1,317,270 | | | $ | 1,309,944 | | | $ | 1,427,841 | |
Ratios (as a percentage of average daily net assets): | | | | | | | | | | | | | | | | | | | | |
Expenses(3) | | | 1.10 | % | | | 1.10 | % | | | 1.08 | % | | | 1.08 | % | | | 1.09 | % |
Net investment income | | | 1.80 | % | | | 1.37 | % | | | 1.77 | % | | | 1.53 | % | | | 1.23 | % |
Portfolio Turnover | | | 2 | % | | | 2 | % | | | 5 | % | | | 17 | % | | | 12 | % |
| (1) | Computed using average shares outstanding. |
| (2) | Returns are historical and are calculated by determining the percentage change in net asset value or market value with all distributions reinvested. Distributions are assumed to be reinvested at prices obtained under the Fund’s dividend reinvestment plan. |
| (3) | Excludes the effect of custody fee credits, if any, of less than 0.005%. |
| | | | |
| | 18 | | See Notes to Financial Statements. |
Eaton Vance
Tax-Managed Global Buy-Write Opportunities Fund
December 31, 2014
Notes to Financial Statements
1 Significant Accounting Policies
Eaton Vance Tax-Managed Global Buy-Write Opportunities Fund (the Fund) is a Massachusetts business trust registered under the Investment Company Act of 1940, as amended (the 1940 Act), as a diversified, closed-end management investment company. The Fund’s primary investment objective is to provide current income and gains, with a secondary objective of capital appreciation.
The following is a summary of significant accounting policies of the Fund. The policies are in conformity with accounting principles generally accepted in the United States of America (U.S. GAAP). The Fund is an investment company and follows accounting and reporting guidance in the Financial Accounting Standards Board (“FASB”) Accounting Standards Codification Topic 946.
A Investment Valuation — The following methodologies are used to determine the market value or fair value of investments.
Equity Securities. Equity securities listed on a U.S. securities exchange generally are valued at the last sale or closing price on the day of valuation or, if no sales took place on such date, at the mean between the closing bid and asked prices therefore on the exchange where such securities are principally traded. Equity securities listed on the NASDAQ Global or Global Select Market generally are valued at the NASDAQ official closing price. Unlisted or listed securities for which closing sales prices or closing quotations are not available are valued at the mean between the latest available bid and asked prices.
Derivatives. Exchange-traded options (other than FLexible EXchange traded options) are valued at the mean between the bid and asked prices at valuation time as reported by the Options Price Reporting Authority for U.S. listed options or by the relevant exchange or board of trade for non-U.S. listed options. Over-the-counter options and FLexible EXchange traded options traded at the Chicago Board Options Exchange are valued by a third party pricing service using techniques that consider factors including the value of the underlying instrument, the volatility of the underlying instrument and the period of time until option expiration.
Foreign Securities and Currencies. Foreign securities and currencies are valued in U.S. dollars, based on foreign currency exchange rate quotations supplied by a third party pricing service. The pricing service uses a proprietary model to determine the exchange rate. Inputs to the model include reported trades and implied bid/ask spreads. The daily valuation of exchange-traded foreign securities generally is determined as of the close of trading on the principal exchange on which such securities trade. Events occurring after the close of trading on foreign exchanges may result in adjustments to the valuation of foreign securities to more accurately reflect their fair value as of the close of regular trading on the New York Stock Exchange. When valuing foreign equity securities that meet certain criteria, the Fund’s Trustees have approved the use of a fair value service that values such securities to reflect market trading that occurs after the close of the applicable foreign markets of comparable securities or other instruments that have a strong correlation to the fair-valued securities.
Fair Valuation. Investments for which valuations or market quotations are not readily available or are deemed unreliable are valued at fair value using methods determined in good faith by or at the direction of the Trustees of the Fund in a manner that fairly reflects the security’s value, or the amount that the Fund might reasonably expect to receive for the security upon its current sale in the ordinary course. Each such determination is based on a consideration of relevant factors, which are likely to vary from one pricing context to another. These factors may include, but are not limited to, the type of security, the existence of any contractual restrictions on the security’s disposition, the price and extent of public trading in similar securities of the issuer or of comparable companies or entities, quotations or relevant information obtained from broker/dealers or other market participants, information obtained from the issuer, analysts, and/or the appropriate stock exchange (for exchange-traded securities), an analysis of the company’s or entity’s financial condition, and an evaluation of the forces that influence the issuer and the market(s) in which the security is purchased and sold.
B Investment Transactions — Investment transactions for financial statement purposes are accounted for on a trade date basis. Realized gains and losses on investments sold are determined on the basis of identified cost.
C Income — Dividend income is recorded on the ex-dividend date for dividends received in cash and/or securities. However, if the ex-dividend date has passed, certain dividends from foreign securities are recorded as the Fund is informed of the ex-dividend date. Withholding taxes on foreign dividends and capital gains have been provided for in accordance with the Fund’s understanding of the applicable countries’ tax rules and rates.
D Federal Taxes — The Fund’s policy is to comply with the provisions of the Internal Revenue Code applicable to regulated investment companies and to distribute to shareholders each year substantially all of its net investment income, and all or substantially all of its net realized capital gains. Accordingly, no provision for federal income or excise tax is necessary.
As of December 31, 2014, the Fund had no uncertain tax positions that would require financial statement recognition, de-recognition, or disclosure. The Fund files a U.S. federal income tax return annually after its fiscal year-end, which is subject to examination by the Internal Revenue Service for a period of three years from the date of filing.
E Expense Reduction — State Street Bank and Trust Company (SSBT) serves as custodian of the Fund. Pursuant to the custodian agreement, SSBT receives a fee reduced by credits, which are determined based on the average daily cash balance the Fund maintains with SSBT. All credit balances, if any, used to reduce the Fund’s custodian fees are reported as a reduction of expenses in the Statement of Operations.
F Foreign Currency Translation — Investment valuations, other assets, and liabilities initially expressed in foreign currencies are translated each business day into U.S. dollars based upon current exchange rates. Purchases and sales of foreign investment securities and income and expenses denominated in foreign currencies are translated into U.S. dollars based upon currency exchange rates in effect on the respective dates of such transactions. Recognized
Eaton Vance
Tax-Managed Global Buy-Write Opportunities Fund
December 31, 2014
Notes to Financial Statements — continued
gains or losses on investment transactions attributable to changes in foreign currency exchange rates are recorded for financial statement purposes as net realized gains and losses on investments. That portion of unrealized gains and losses on investments that results from fluctuations in foreign currency exchange rates is not separately disclosed.
G Use of Estimates — The preparation of the financial statements in conformity with U.S. GAAP requires management to make estimates and assumptions that affect the reported amounts of assets and liabilities at the date of the financial statements and the reported amounts of income and expense during the reporting period. Actual results could differ from those estimates.
H Indemnifications — Under the Fund’s organizational documents, its officers and Trustees may be indemnified against certain liabilities and expenses arising out of the performance of their duties to the Fund. Under Massachusetts law, if certain conditions prevail, shareholders of a Massachusetts business trust (such as the Fund) could be deemed to have personal liability for the obligations of the Fund. However, the Fund’s Declaration of Trust contains an express disclaimer of liability on the part of Fund shareholders and the By-laws provide that the Fund shall assume the defense on behalf of any Fund shareholders. Moreover, the By-laws also provide for indemnification out of Fund property of any shareholder held personally liable solely by reason of being or having been a shareholder for all loss or expense arising from such liability. Additionally, in the normal course of business, the Fund enters into agreements with service providers that may contain indemnification clauses. The Fund’s maximum exposure under these arrangements is unknown as this would involve future claims that may be made against the Fund that have not yet occurred.
I Written Options — Upon the writing of a call or a put option, the premium received by the Fund is included in the Statement of Assets and Liabilities as a liability. The amount of the liability is subsequently marked-to-market to reflect the current market value of the option written, in accordance with the Fund’s policies on investment valuations discussed above. Premiums received from writing options which expire are treated as realized gains. Premiums received from writing options which are exercised or are closed are added to or offset against the proceeds or amount paid on the transaction to determine the realized gain or loss. When an index option is exercised, the Fund is required to deliver an amount of cash determined by the excess of the strike price of the option over the value of the index (in the case of a put) or the excess of the value of the index over the strike price of the option (in the case of a call) at contract termination. If a put option on a security is exercised, the premium reduces the cost basis of the securities purchased by the Fund. The Fund, as a writer of an option, may have no control over whether the underlying securities or other assets may be sold (call) or purchased (put) and, as a result, bears the market risk of an unfavorable change in the price of the securities or other assets underlying the written option. The Fund may also bear the risk of not being able to enter into a closing transaction if a liquid secondary market does not exist.
2 Distributions to Shareholders and Income Tax Information
Subject to its Managed Distribution Plan, the Fund intends to make monthly distributions from its cash available for distribution, which consists of the Fund’s dividends and interest income after payment of Fund expenses, net option premiums and net realized and unrealized gains on stock investments. The Fund intends to distribute all or substantially all of its net realized capital gains. Distributions are recorded on the ex-dividend date. Distributions to shareholders are determined in accordance with income tax regulations, which may differ from U.S. GAAP. As required by U.S. GAAP, only distributions in excess of tax basis earnings and profits are reported in the financial statements as a return of capital. Permanent differences between book and tax accounting relating to distributions are reclassified to paid-in capital. For tax purposes, distributions from short-term capital gains are considered to be from ordinary income. Distributions in any year may include a substantial return of capital component.
The tax character of distributions declared for the years ended December 31, 2014 and December 31, 2013 was as follows:
| | | | | | | | |
| | | Year Ended December 31, | |
| | | 2014 | | | 2013 | |
| | |
Distributions declared from: | | | | | | | | |
Ordinary income | | $ | 25,686,293 | | | $ | 20,093,017 | |
Tax return of capital | | $ | 98,596,245 | | | $ | 104,202,559 | |
During the year ended December 31, 2014, accumulated net realized loss was decreased by $98,966, accumulated distributions in excess of net investment income was increased by $98,526 and paid-in capital was decreased by $440 due to differences between book and tax accounting, primarily for foreign currency gain (loss), distributions from real estate investment trusts (REITs) and investments in partnerships. These reclassifications had no effect on the net assets or net asset value per share of the Fund.
Eaton Vance
Tax-Managed Global Buy-Write Opportunities Fund
December 31, 2014
Notes to Financial Statements — continued
As of December 31, 2014, the components of distributable earnings (accumulated losses) and unrealized appreciation (depreciation) on a tax basis were as follows:
| | | | |
Deferred capital losses | | $ | (77,088,473 | ) |
Late year ordinary losses | | $ | (465,953 | ) |
Net unrealized appreciation | | $ | 580,006,661 | |
The differences between components of distributable earnings (accumulated losses) on a tax basis and the amounts reflected in the Statement of Assets and Liabilities are primarily due to wash sales, option contracts, distributions from REITs, investments in partnerships and investments in passive foreign investment companies.
At December 31, 2014, the Fund, for federal income tax purposes, had deferred capital losses of $77,088,473 which will reduce its taxable income arising from future net realized gains on investment transactions, if any, to the extent permitted by the Internal Revenue Code, and thus will reduce the amount of distributions to shareholders, which would otherwise be necessary to relieve the Fund of any liability for federal income or excise tax. The deferred capital losses are treated as arising on the first day of the Fund’s next taxable year and retain the same short-term or long-term character as when originally deferred. Of the deferred capital losses at December 31, 2014, $77,088,473 are short-term.
Additionally, at December 31, 2014, the Fund had a late year ordinary loss of $465,953, related to certain specified losses realized after October 31, 2014, which it has elected to defer to the following taxable year pursuant to income tax regulations.
The cost and unrealized appreciation (depreciation) of investments of the Fund at December 31, 2014, as determined on a federal income tax basis, were as follows:
| | | | |
| |
Aggregate cost | | $ | 725,767,486 | |
| |
Gross unrealized appreciation | | $ | 603,821,346 | |
Gross unrealized depreciation | | | (23,086,175 | ) |
| |
Net unrealized appreciation | | $ | 580,735,171 | |
3 Investment Adviser Fee and Other Transactions with Affiliates
The investment adviser fee is earned by Eaton Vance Management (EVM) as compensation for management and investment advisory services rendered to the Fund. The fee is computed at an annual rate of 1.00% of the Fund’s average daily gross assets and is payable monthly. Gross assets as referred to herein represent net assets plus obligations attributable to investment leverage, if any. For the year ended December 31, 2014, the Fund’s investment adviser fee amounted to $13,759,494. Pursuant to a sub-advisory agreement, EVM has delegated a portion of the investment management to Parametric Portfolio Associates LLC (Parametric), a majority-owned subsidiary of Eaton Vance Corp. EVM pays Parametric a portion of its advisory fee for sub-advisory services provided to the Fund. EVM also serves as administrator of the Fund, but receives no compensation.
Trustees and officers of the Fund who are members of EVM’s organization receive remuneration for their services to the Fund out of the investment adviser fee. Trustees of the Fund who are not affiliated with EVM may elect to defer receipt of all or a percentage of their annual fees in accordance with the terms of the Trustees Deferred Compensation Plan. For the year ended December 31, 2014, no significant amounts have been deferred. Certain officers and Trustees of the Fund are officers of EVM.
4 Purchases and Sales of Investments
Purchases and sales of investments, other than short-term obligations, aggregated $29,862,357 and $189,133,745, respectively, for the year ended December 31, 2014.
5 Common Shares of Beneficial Interest
The Fund may issue common shares pursuant to its dividend reinvestment plan. There were no common shares issued by the Fund for the years ended December 31, 2014 and December 31, 2013.
On August 6, 2012, the Board of Trustees of the Fund authorized the repurchase by the Fund of up to 10% of its then currently outstanding common shares in open-market transactions at a discount to net asset value (NAV). On September 30, 2013, the Board of Trustees of the Fund approved the continuation of the Fund’s share repurchase program. The Board authorized the repurchase by the Fund of up to 10% of its common shares outstanding as
Eaton Vance
Tax-Managed Global Buy-Write Opportunities Fund
December 31, 2014
Notes to Financial Statements — continued
of September 30, 2013 in open market transactions at a discount to NAV. The terms of the reauthorization increased the number of shares available for repurchase. The repurchase program does not obligate the Fund to purchase a specific amount of shares. There were no repurchases of common shares by the Fund for the year ended December 31, 2014. During the year ended December 31, 2013, the Fund repurchased 67,000 of its common shares under the share repurchase program at a cost, including brokerage commissions, of $747,820 and an average price per share of $11.16. The weighted average discount per share to NAV on these repurchases amounted to 10.49% for the year ended December 31, 2013.
6 Financial Instruments
The Fund may trade in financial instruments with off-balance sheet risk in the normal course of its investing activities. These financial instruments may include written options and may involve, to a varying degree, elements of risk in excess of the amounts recognized for financial statement purposes. The notional or contractual amounts of these instruments represent the investment the Fund has in particular classes of financial instruments and do not necessarily represent the amounts potentially subject to risk. The measurement of the risks associated with these instruments is meaningful only when all related and offsetting transactions are considered. A summary of written options at December 31, 2014 is included in the Portfolio of Investments.
Written options activity for the year ended December 31, 2014 was as follows:
| | | | | | | | |
| | | Number of
Contracts | | | Premiums
Received | |
| | |
Outstanding, beginning of year | | | 1,001,510 | | | $ | 13,876,769 | |
Options written | | | 12,174,795 | | | | 145,559,541 | |
Options terminated in closing purchase transactions | | | (8,658,735 | ) | | | (100,812,347 | ) |
Options expired | | | (3,556,005 | ) | | | (48,378,283 | ) |
| | |
Outstanding, end of year | | | 961,565 | | | $ | 10,245,680 | |
All of the securities of the Fund, unless otherwise pledged, are subject to segregation to satisfy the requirements of the escrow agent with respect to exchange-traded options. At December 31, 2014, the Fund had sufficient cash and/or securities to cover commitments under these contracts.
The Fund is subject to equity price risk in the normal course of pursuing its investment objectives. The Fund writes index call options above the current value of the index to generate premium income. In writing index call options, the Fund in effect, sells potential appreciation in the value of the applicable index above the exercise price in exchange for the option premium received. The Fund retains the risk of loss, minus the premium received, should the price of the underlying index decline. The Fund is not subject to counterparty credit risk with respect to its written options as the Fund, not the counterparty, is obligated to perform under such derivatives.
The Fund enters into over-the-counter written options that may contain provisions whereby the counterparty may terminate the contract under certain conditions, including but not limited to a decline in the Fund’s net assets below a certain level over a certain period of time, which would trigger a payment by the Fund for those derivatives in a liability position. At December 31, 2014, the fair value of derivatives with credit-related contingent features in a net liability position was $5,736,806. At December 31, 2014, there were no assets pledged by the Fund for such liability.
The Fund has entered into an International Swaps and Derivatives Association, Inc. Master Agreement (“ISDA Master Agreement”) or similar agreement with substantially all its derivative counterparties. An ISDA Master Agreement is a bilateral agreement between the Fund and a counterparty that governs certain OTC derivatives and typically contains, among other things, set-off provisions in the event of a default and/or termination event as defined under the relevant ISDA Master Agreement. Under an ISDA Master Agreement, the Fund may, under certain circumstances, offset with the counterparty certain derivative financial instruments’ payables and/or receivables with collateral held and/or posted and create one single net payment. The provisions of the ISDA Master Agreement typically permit a single net payment in the event of default including the bankruptcy or insolvency of the counterparty. However, bankruptcy or insolvency laws of a particular jurisdiction may impose restrictions on or prohibitions against the right of offset in bankruptcy or insolvency. Certain ISDA Master Agreements allow counterparties to OTC derivatives to terminate derivative contracts prior to maturity in the event the Fund’s net assets decline by a stated percentage or the Fund fails to meet the terms of its ISDA Master Agreements, which would cause the counterparty to accelerate payment by the Fund of any net liability owed to it.
The collateral requirements for derivatives traded under an ISDA Master Agreement are governed by a Credit Support Annex to the ISDA Master Agreement. Collateral requirements are determined at the close of business each day and are typically based on changes in market values for each transaction under an ISDA Master Agreement and netted into one amount for such agreement. Generally, the amount of collateral due from or to a counterparty is subject to a minimum transfer threshold amount before a transfer is required, which may vary by counterparty. Collateral pledged for the benefit of the Fund and/or counterparty is held in segregated accounts by the Fund’s custodian and cannot be sold, re-pledged, assigned or otherwise used while pledged. The portion of such collateral representing cash, if any, is reflected as restricted cash and, in the case of cash pledged by a counterparty for the benefit of the Fund, a corresponding liability on the Statement of Assets and Liabilities. Securities pledged by the Fund as collateral, if any, are identified as such in the Portfolio of Investments.
Eaton Vance
Tax-Managed Global Buy-Write Opportunities Fund
December 31, 2014
Notes to Financial Statements — continued
The fair value of open derivative instruments (not considered to be hedging instruments for accounting disclosure purposes) and whose primary underlying risk exposure is equity price risk at December 31, 2014 was as follows:
| | | | | | | | |
| | | Fair Value | |
| Derivative | | Asset Derivative | | | Liability Derivative | |
| | |
Written options | | $ | — | | | $ | (7,795,581 | )(1) |
| | |
Derivatives not subject to master netting or similar agreements | | $ | — | | | $ | (2,058,775 | ) |
| | |
Total Derivatives subject to master netting or similar agreements | | $ | — | | | $ | (5,736,806 | ) |
| (1) | Statement of Assets and Liabilities location: Written options outstanding, at value. |
The Fund’s derivative assets and liabilities at fair value by type, which are reported gross in the Statement of Assets and Liabilities, are presented in the table above. The following table presents the Fund’s derivative liabilities by counterparty, net of amounts available for offset under a master netting agreement and net of the related collateral pledged by the Fund for such liabilities as of December 31, 2014.
| | | | | | | | | | | | | | | | | | | | |
| Counterparty | | Derivative
Liabilities Subject to
Master Netting
Agreement | | | Derivatives
Available
for Offset | | | Non-cash
Collateral
Pledged(a) | | | Cash
Collateral
Pledged(a) | | | Net Amount of Derivative Liabilities(b) | |
| | | | | |
| Bank of America, N.A. | | $ | (2,116,666 | ) | | | $ — | | | | $ — | | | | $ — | | | $ | (2,116,666 | ) |
| Barclays Bank PLC | | | (1,244,933 | ) | | | — | | | | — | | | | — | | | | (1,244,933 | ) |
| Citibank, N.A. | | | (1,885,808 | ) | | | — | | | | — | | | | — | | | | (1,885,808 | ) |
| Deutsche Bank AG | | | (346,528 | ) | | | — | | | | — | | | | — | | | | (346,528 | ) |
| Societe Generale | | | (142,871 | ) | | | — | | | | — | | | | — | | | | (142,871 | ) |
| | | | | |
| | | $ | (5,736,806 | ) | | $ | — | | | $ | — | | | $ | — | | | $ | (5,736,806 | ) |
| (a) | In some instances, the actual collateral pledged may be more than the amount shown due to overcollateralization. |
| (b) | Net amount represents the net amount payable to the counterparty in the event of default. |
The effect of derivative instruments (not considered to be hedging instruments for accounting disclosure purposes) on the Statement of Operations and whose primary underlying risk exposure is equity price risk for the year ended December 31, 2014 was as follows:
| | | | | | | | |
| Derivative | | Realized Gain (Loss)
on Derivatives Recognized
in Income | | | Change in Unrealized
Appreciation (Depreciation) on
Derivatives Recognized in Income | |
| | |
Written options | | $ | (56,797,144 | )(1) | | $ | 24,704,150 | (2) |
| (1) | Statement of Operations location: Net realized gain (loss) – Written options. |
| (2) | Statement of Operations location: Change in unrealized appreciation (depreciation) – Written options. |
7 Risks Associated with Foreign Investments
Investing in securities issued by companies whose principal business activities are outside the United States may involve significant risks not present in domestic investments. For example, there is generally less publicly available information about foreign companies, particularly those not subject to the disclosure and reporting requirements of the U.S. securities laws. Certain foreign issuers are generally not bound by uniform accounting, auditing, and financial reporting requirements and standards of practice comparable to those applicable to domestic issuers. Investments in foreign securities also involve the risk of possible adverse changes in investment or exchange control regulations, expropriation or confiscatory taxation, limitation on the removal of funds or other assets of the Fund, political or financial instability or diplomatic and other developments which could affect such investments. Foreign securities markets, while growing in volume and sophistication, are generally not as developed as those in the United States, and securities of some foreign issuers (particularly those located in developing countries) may be less liquid and more volatile than securities of comparable U.S. companies. In general, there is less overall governmental supervision and regulation of foreign securities markets, broker/dealers and issuers than in the United States.
Eaton Vance
Tax-Managed Global Buy-Write Opportunities Fund
December 31, 2014
Notes to Financial Statements — continued
8 Fair Value Measurements
Under generally accepted accounting principles for fair value measurements, a three-tier hierarchy to prioritize the assumptions, referred to as inputs, is used in valuation techniques to measure fair value. The three-tier hierarchy of inputs is summarized in the three broad levels listed below.
| Ÿ | | Level 1 – quoted prices in active markets for identical investments |
| Ÿ | | Level 2 – other significant observable inputs (including quoted prices for similar investments, interest rates, prepayment speeds, credit risk, etc.) |
| Ÿ | | Level 3 – significant unobservable inputs (including a fund’s own assumptions in determining the fair value of investments) |
In cases where the inputs used to measure fair value fall in different levels of the fair value hierarchy, the level disclosed is determined based on the lowest level input that is significant to the fair value measurement in its entirety. The inputs or methodology used for valuing securities are not necessarily an indication of the risk associated with investing in those securities.
At December 31, 2014, the hierarchy of inputs used in valuing the Fund’s investments and open derivative instruments, which are carried at value, were as follows:
| | | | | | | | | | | | | | | | |
| Asset Description | | Level 1 | | | Level 2 | | | Level 3 | | | Total | |
| | | | |
Common Stocks | | | | | | | | | | | | | | | | |
Consumer Discretionary | | $ | 118,594,579 | | | $ | 70,628,243 | | | $ | — | | | $ | 189,222,822 | |
Consumer Staples | | | 51,394,789 | | | | 75,332,652 | | | | — | | | | 126,727,441 | |
Energy | | | 37,318,074 | | | | 39,114,489 | | | | — | | | | 76,432,563 | |
Financials | | | 82,495,635 | | | | 107,136,472 | | | | — | | | | 189,632,107 | |
Health Care | | | 105,970,458 | | | | 79,760,131 | | | | — | | | | 185,730,589 | |
Industrials | | | 47,605,991 | | | | 68,535,696 | | | | — | | | | 116,141,687 | |
Information Technology | | | 253,009,144 | | | | 37,863,269 | | | | — | | | | 290,872,413 | |
Materials | | | 12,303,563 | | | | 41,079,727 | | | | — | | | | 53,383,290 | |
Telecommunication Services | | | 13,280,642 | | | | 32,055,010 | | | | — | | | | 45,335,652 | |
Utilities | | | 16,199,780 | | | | 16,824,313 | | | | — | | | | 33,024,093 | |
| | | | |
Total Common Stocks | | $ | 738,172,655 | | | $ | 568,330,002 | * | | $ | — | | | $ | 1,306,502,657 | |
| | | | |
Total Investments | | $ | 738,172,655 | | | $ | 568,330,002 | | | $ | — | | | $ | 1,306,502,657 | |
| | | | |
Liability Description | | | | | | | | | | | | | | | | |
| | | | |
Call Options Written | | $ | (2,058,775 | ) | | $ | (5,736,806 | ) | | $ | — | | | $ | (7,795,581 | ) |
| | | | |
Total | | $ | (2,058,775 | ) | | $ | (5,736,806 | ) | | $ | — | | | $ | (7,795,581 | ) |
| * | Includes foreign equity securities whose values were adjusted to reflect market trading of comparable securities or other correlated instruments that occurred after the close of trading in their applicable foreign markets. |
The Fund held no investments or other financial instruments as of December 31, 2013 whose fair value was determined using Level 3 inputs. At December 31, 2014, there were no investments transferred between Level 1 and Level 2 during the year then ended.
9 Legal Proceedings
In November 2010, the Fund was named as defendant and a putative member of the proposed defendant class of shareholders in the case entitled Official Committee of Unsecured Creditors (UCC) of the Tribune Company v. FitzSimons, et al. as a result of its ownership of shares in the Tribune Company (Tribune) in 2007 when Tribune effected a leveraged buyout transaction (LBO) and was converted to a privately held company. The UCC, which has been replaced by a Litigation Trustee pursuant to Tribune’s plan of reorganization, seeks to recover payments of the proceeds of the LBO. This action is now part of a multi-district litigation proceeding in the Southern District of New York. The motion to dismiss was granted, and the plaintiff appealed. A decision on the appeal is expected in 2015. The value of the proceeds received by the Fund is approximately $891,000 (equal to 0.07% of net assets at December 31, 2014).
The Fund cannot predict the outcome of these proceedings or the effect, if any, on the Fund’s net asset value. The attorneys’ fees and costs related to these actions will be expensed by the Fund as incurred.
Eaton Vance
Tax-Managed Global Buy-Write Opportunities Fund
December 31, 2014
Report of Independent Registered Public Accounting Firm
To the Trustees and Shareholders of Eaton Vance Tax-Managed Global Buy-Write Opportunities Fund:
We have audited the accompanying statement of assets and liabilities of Eaton Vance Tax-Managed Global Buy-Write Opportunities Fund (the “Fund”), including the portfolio of investments, as of December 31, 2014, and the related statement of operations for the year then ended, the statements of changes in net assets for each of the two years in the period then ended, and the financial highlights for each of the five years in the period then ended. These financial statements and financial highlights are the responsibility of the Fund’s management. Our responsibility is to express an opinion on these financial statements and financial highlights based on our audits.
We conducted our audits in accordance with the standards of the Public Company Accounting Oversight Board (United States). Those standards require that we plan and perform the audit to obtain reasonable assurance about whether the financial statements and financial highlights are free of material misstatement. The Fund is not required to have, nor were we engaged to perform, an audit of its internal control over financial reporting. Our audits included consideration of internal control over financial reporting as a basis for designing audit procedures that are appropriate in the circumstances, but not for the purpose of expressing an opinion on the effectiveness of the Fund’s internal control over financial reporting. Accordingly, we express no such opinion. An audit also includes examining, on a test basis, evidence supporting the amounts and disclosures in the financial statements, assessing the accounting principles used and significant estimates made by management, as well as evaluating the overall financial statement presentation. Our procedures included confirmation of securities owned as of December 31, 2014, by correspondence with the custodian and brokers; where replies were not received from brokers, we performed other auditing procedures. We believe that our audits provide a reasonable basis for our opinion.
In our opinion, such financial statements and financial highlights referred to above present fairly, in all material respects, the financial position of Eaton Vance Tax-Managed Global Buy-Write Opportunities Fund as of December 31, 2014, the results of its operations for the year then ended, the changes in its net assets for each of the two years in the period then ended, and the financial highlights for each of the five years in the period then ended, in conformity with accounting principles generally accepted in the United States of America.
DELOITTE & TOUCHE LLP
Boston, Massachusetts
February 18, 2015
Eaton Vance
Tax-Managed Global Buy-Write Opportunities Fund
December 31, 2014
Federal Tax Information (Unaudited)
The Form 1099-DIV you received in February 2015 showed the tax status of all distributions paid to your account in calendar year 2014. Shareholders are advised to consult their own tax adviser with respect to the tax consequences of their investment in the Fund. As required by the Internal Revenue Code and/or regulations, shareholders must be notified regarding the status of qualified dividend income for individuals and the dividends received deduction for corporations.
Qualified Dividend Income. For the fiscal year ended December 31, 2014, the Fund designates approximately $41,197,400, or up to the maximum amount of such dividends allowable pursuant to the Internal Revenue Code, as qualified dividend income eligible for the reduced tax rate of 15%.
Dividends Received Deduction. Corporate shareholders are generally entitled to take the dividends received deduction on the portion of the Fund’s dividend distribution that qualifies under tax law. For the Fund’s fiscal 2014 ordinary income dividends, 52.66% qualifies for the corporate dividends received deduction.
Eaton Vance
Tax-Managed Global Buy-Write Opportunities Fund
December 31, 2014
Dividend Reinvestment Plan
The Fund offers a dividend reinvestment plan (Plan) pursuant to which shareholders may elect to have distributions automatically reinvested in common shares (Shares) of the Fund. You may elect to participate in the Plan by completing the Dividend Reinvestment Plan Application Form. If you do not participate, you will receive all distributions in cash paid by check mailed directly to you by American Stock Transfer & Trust Company, LLC (AST) as dividend paying agent. On the distribution payment date, if the NAV per Share is equal to or less than the market price per Share plus estimated brokerage commissions, then new Shares will be issued. The number of Shares shall be determined by the greater of the NAV per Share or 95% of the market price. Otherwise, Shares generally will be purchased on the open market by AST, the Plan agent (Agent). Distributions subject to income tax (if any) are taxable whether or not Shares are reinvested.
If your Shares are in the name of a brokerage firm, bank, or other nominee, you can ask the firm or nominee to participate in the Plan on your behalf. If the nominee does not offer the Plan, you will need to request that the Fund’s transfer agent re-register your Shares in your name or you will not be able to participate.
The Agent’s service fee for handling distributions will be paid by the Fund. Plan participants will be charged their pro rata share of brokerage commissions on all open-market purchases.
Plan participants may withdraw from the Plan at any time by writing to the Agent at the address noted on the following page. If you withdraw, you will receive Shares in your name for all Shares credited to your account under the Plan. If a participant elects by written notice to the Agent to sell part or all of his or her Shares and remit the proceeds, the Agent is authorized to deduct a $5.00 fee plus brokerage commissions from the proceeds.
If you wish to participate in the Plan and your Shares are held in your own name, you may complete the form on the following page and deliver it to the Agent. Any inquiries regarding the Plan can be directed to the Agent at 1-866-439-6787.
Eaton Vance
Tax-Managed Global Buy-Write Opportunities Fund
December 31, 2014
Application for Participation in Dividend Reinvestment Plan
This form is for shareholders who hold their common shares in their own names. If your common shares are held in the name of a brokerage firm, bank, or other nominee, you should contact your nominee to see if it will participate in the Plan on your behalf. If you wish to participate in the Plan, but your brokerage firm, bank, or nominee is unable to participate on your behalf, you should request that your common shares be re-registered in your own name which will enable your participation in the Plan.
The following authorization and appointment is given with the understanding that I may terminate it at any time by terminating my participation in the Plan as provided in the terms and conditions of the Plan.
Please print exact name on account:
Shareholder signature Date
Shareholder signature Date
Please sign exactly as your common shares are registered. All persons whose names appear on the share certificate must sign.
YOU SHOULD NOT RETURN THIS FORM IF YOU WISH TO RECEIVE YOUR DISTRIBUTIONS IN CASH. THIS IS NOT A PROXY.
This authorization form, when signed, should be mailed to the following address:
Eaton Vance Tax-Managed Global Buy-Write Opportunities Fund
c/o American Stock Transfer & Trust Company, LLC
P.O. Box 922
Wall Street Station
New York, NY 10269-0560
Number of Employees
The Fund is organized as a Massachusetts business trust and is registered under the Investment Company Act of 1940, as amended, as a closed-end management investment company and has no employees.
Number of Shareholders
As of December 31, 2014, Fund records indicate that there are 36 registered shareholders and approximately 57,996 shareholders owning the Fund shares in street name, such as through brokers, banks, and financial intermediaries.
If you are a street name shareholder and wish to receive Fund reports directly, which contain important information about the Fund, please write or call:
Eaton Vance Distributors, Inc.
Two International Place
Boston, MA 02110
1-800-262-1122
New York Stock Exchange symbol
The New York Stock Exchange symbol is ETW.
Eaton Vance
Tax-Managed Global Buy-Write Opportunities Fund
December 31, 2014
Management and Organization
Fund Management. The Trustees of Eaton Vance Tax-Managed Global Buy-Write Opportunities Fund (the Fund) are responsible for the overall management and supervision of the Fund’s affairs. The Trustees and officers of the Fund are listed below. Except as indicated, each individual has held the office shown or other offices in the same company for the last five years. The “Noninterested Trustees” consist of those Trustees who are not “interested persons” of the Fund, as that term is defined under the 1940 Act. The business address of each Trustee and officer is Two International Place, Boston, Massachusetts 02110. As used below, “EVC” refers to Eaton Vance Corp., “EV” refers to Eaton Vance, Inc., “EVM” refers to Eaton Vance Management, “BMR” refers to Boston Management and Research and “EVD” refers to Eaton Vance Distributors, Inc. EVC and EV are the corporate parent and trustee, respectively, of EVM and BMR. EVD is a wholly-owned subsidiary of EVC. Each officer affiliated with Eaton Vance may hold a position with other Eaton Vance affiliates that is comparable to his or her position with EVM listed below. Each Trustee oversees 179 portfolios in the Eaton Vance Complex (including all master and feeder funds in a master feeder structure). Each officer serves as an officer of certain other Eaton Vance funds. Each Trustee serves for a three year term. Each officer serves until his or her successor is elected.
| | | | | | |
| Name and Year of Birth | | Position(s) with the Fund | | Term Expiring; Trustee Since(1) | | Principal Occupation(s) and Directorships
During Past Five Years and Other Relevant Experience |
Interested Trustee |
| | | |
Thomas E. Faust Jr. 1958 | | Class I Trustee | | Until 2015. Trustee since 2007. | | Chairman, Chief Executive Officer and President of EVC, Director and President of EV, Chief Executive Officer and President of EVM and BMR, and Director of EVD. Trustee and/or officer of 179 registered investment companies. Mr. Faust is an interested person because of his positions with EVM, BMR, EVD, EVC and EV, which are affiliates of the Fund. Directorships in the Last Five Years.(2) Director of EVC and Hexavest Inc. |
| | | |
| | | | | | |
Noninterested Trustees |
| | | |
Scott E. Eston 1956 | | Class I Trustee | | Until 2015. Trustee since 2011. | | Private investor. Formerly held various positions at Grantham, Mayo, Van Otterloo and Co., L.L.C. (investment management firm) (1997-2009), including Chief Operating Officer (2002-2009), Chief Financial Officer (1997-2009) and Chairman of the Executive Committee (2002-2008); President and Principal Executive Officer, GMO Trust (open-end registered investment company) (2006-2009). Former Partner, Coopers and Lybrand L.L.P. (now PricewaterhouseCoopers) (public accounting firm) (1987-1997). Directorships in the Last Five Years.(2) None. |
| | | |
Cynthia E. Frost(3) 1961 | | Class I Trustee | | Until 2015. Trustee since 2014. | | Private investor. Formerly, Chief Investment Officer of Brown University (university endowment) (2000-2012); Portfolio Strategist for Duke Management Company (university endowment manager) (1995-2000); Managing Director, Cambridge Associates (1989-1995); Consultant, Bain and Company (1987-1989); Senior Equity Analyst, BA Investment Management Company (1983-1985). Directorships in the Last Five Years. None. |
| | | |
George J. Gorman(3) 1952 | | Class II Trustee | | Until 2016. Trustee since 2014. | | Principal at George J. Gorman LLC (consulting firm). Formerly, Senior Partner at Ernst & Young LLP (public accounting firm) (1974-2009). Directorships in the Last Five Years. Formerly, Trustee of the Bank of America Money Market Funds Series Trust (2011-2014) and of the Ashmore Funds (2010-2014). |
| | | |
Valerie A. Mosley(4) 1960 | | Class III Trustee | | Until 2017. Trustee since 2014. | | Chairwoman and Chief Executive Officer of Valmo Ventures (a consulting and investment firm). Former Partner and Senior Vice President, Portfolio Manager and Investment Strategist at Wellington Management Company, LLP (investment management firm) (1992-2012). Former Chief Investment Officer, PG Corbin Asset Management (1990-1992). Formerly worked in institutional corporate bond sales at Kidder Peabody (1986-1990). Directorships in the Last Five Years.(2) Director of Dynex Capital, Inc. (mortgage REIT) (since 2013). |
| | | |
William H. Park 1947 | | Class II Trustee | | Until 2016. Trustee since 2003. | | Consultant and private investor. Formerly, Chief Financial Officer, Aveon Group L.P. (investment management firm) (2010-2011). Formerly, Vice Chairman, Commercial Industrial Finance Corp. (specialty finance company) (2006-2010). Formerly, President and Chief Executive Officer, Prizm Capital Management, LLC (investment management firm) (2002-2005). Formerly, Executive Vice President and Chief Financial Officer, United Asset Management Corporation (investment management firm) (1982-2001). Formerly, Senior Manager, Price Waterhouse (now PricewaterhouseCoopers) (an independent registered public accounting firm) (1972-1981). Directorships in the Last Five Years.(2) None. |
Eaton Vance
Tax-Managed Global Buy-Write Opportunities Fund
December 31, 2014
Management and Organization — continued
| | | | | | |
| Name and Year of Birth | | Position(s) with the Fund | | Term Expiring; Trustee Since(1) | | Principal Occupation(s) and Directorships
During Past Five Years and Other Relevant Experience |
Noninterested Trustees (continued) |
| | | |
Ronald A. Pearlman 1940 | | Class II Trustee | | Until 2016. Trustee since 2003. | | Lawyer and consultant. Formerly, Professor of Law, Georgetown University Law Center (1999-2014). Formerly, Partner, Covington & Burling LLP (law firm) (1991-2000). Formerly, Chief of Staff, Joint Committee on Taxation, U.S. Congress (1988-1990). Formerly, Deputy Assistant Secretary (Tax Policy) and Assistant Secretary (Tax Policy), U.S. Department of the Treasury (1983-1985). Directorships in the Last Five Years.(2) None. |
| | | |
Helen Frame Peters 1948 | | Class III Trustee | | Until 2017. Trustee since 2008. | | Professor of Finance, Carroll School of Management, Boston College. Formerly, Dean, Carroll School of Management, Boston College (2000-2002). Formerly, Chief Investment Officer, Fixed Income, Scudder Kemper Investments (investment management firm) (1998-1999). Formerly, Chief Investment Officer, Equity and Fixed Income, Colonial Management Associates (investment management firm) (1991-1998). Directorships in the Last Five Years.(2) Formerly, Director of BJ’s Wholesale Club, Inc. (wholesale club retailer) (2004-2011). Formerly, Trustee of SPDR Index Shares Funds and SPDR Series Trust (exchange traded funds) (2000-2009). Formerly, Director of Federal Home Loan Bank of Boston (a bank for banks) (2007-2009). |
| | | |
Harriett Tee Taggart 1948 | | Class II Trustee | | Until 2016. Trustee since 2011. | | Managing Director, Taggart Associates (a professional practice firm). Formerly, Partner and Senior Vice President, Wellington Management Company, LLP (investment management firm) (1983-2006). Directorships in the Last Five Years.(2) Director of Albemarle Corporation (chemicals manufacturer) (since 2007) and The Hanover Group (specialty property and casualty insurance company) (since 2009). Formerly, Director of Lubrizol Corporation (specialty chemicals) (2007-2011). |
| | | |
Ralph F. Verni 1943 | | Chairman of the Board and Class III Trustee | | Until 2017. Trustee since 2005 and Chairman since 2007. | | Consultant and private investor. Formerly, Chief Investment Officer (1982-1992), Chief Financial Officer (1988-1990) and Director (1982-1992), New England Life. Formerly, Chairperson, New England Mutual Funds (1982-1992). Formerly, President and Chief Executive Officer, State Street Management & Research (1992-2000). Formerly, Chairperson, State Street Research Mutual Funds (1992-2000). Formerly, Director, W.P. Carey, LLC (1998-2004) and First Pioneer Farm Credit Corp. (2002-2006). Directorships in the Last Five Years.(2) None. |
| | | |
| | | | | | |
Principal Officers who are not Trustees |
| Name and Year of Birth | | Position(s) with the Fund | | Officer
Since(5) | | Principal Occupation(s) During Past Five Years |
Walter A. Row, III 1957 | | President | | 2004 | | Vice President of EVM and BMR. |
| | | |
Maureen A. Gemma 1960 | | Vice President, Secretary and Chief Legal Officer | | 2005 | | Vice President of EVM and BMR. |
| | | |
James F. Kirchner 1967 | | Treasurer | | 2007 | | Vice President of EVM and BMR. |
| | | |
Paul M. O’Neil 1953 | | Chief Compliance Officer | | 2004 | | Vice President of EVM and BMR. |
| (1) | Year first appointed to serve as Trustee for a fund in the Eaton Vance family of funds. Each Trustee has served continuously since appointment unless indicated otherwise. Each Trustee holds office until the annual meeting for the year in which his or her term expires and until his or her successor is elected and qualified, subject to a prior death, resignation, retirement, disqualification or removal. |
| (2) | During their respective tenures, the Trustees (except for Ms. Frost and Mr. Gorman) also served as Board members of one or more of the following funds (which operated in the years noted): eUnitsTM 2 Year U.S. Market Participation Trust: Upside to Cap / Buffered Downside (launched in 2012 and terminated in 2014); eUnitsTM 2 Year U.S. Market Participation Trust II: Upside to Cap / Buffered Downside (launched in 2012 and terminated in 2014); Eaton Vance Credit Opportunities Fund (launched in 2005 and terminated in 2010); Eaton Vance Insured Florida Plus Municipal Bond Fund (launched in 2002 and terminated in 2009); and Eaton Vance National Municipal Income Trust (launched in 1998 and terminated in 2009). However, Ms. Mosley did not serve as a Board member of eUnitsTM 2 Year U.S. Market Participation Trust: Upside to Cap / Buffered Downside (launched in 2012 and terminated in 2014). |
| (3) | Ms. Frost and Mr. Gorman began serving as Trustees effective May 29, 2014. |
| (4) | Ms. Mosley began serving as a Trustee effective January 1, 2014. |
| (5) | Year first elected to serve as officer of a fund in the Eaton Vance family of funds when the officer has served continuously. Otherwise, year of most recent election as an officer of a fund in the Eaton Vance family of funds. Titles may have changed since initial election. |
Eaton Vance Funds
IMPORTANT NOTICES
Privacy. The Eaton Vance organization is committed to ensuring your financial privacy. Each of the financial institutions identified below has in effect the following policy (“Privacy Policy”) with respect to nonpublic personal information about its customers:
| Ÿ | | Only such information received from you, through application forms or otherwise, and information about your Eaton Vance fund transactions will be collected. This may include information such as name, address, social security number, tax status, account balances and transactions. |
| Ÿ | | None of such information about you (or former customers) will be disclosed to anyone, except as permitted by law (which includes disclosure to employees necessary to service your account). In the normal course of servicing a customer’s account, Eaton Vance may share information with unaffiliated third parties that perform various required services such as transfer agents, custodians and broker-dealers. |
| Ÿ | | Policies and procedures (including physical, electronic and procedural safeguards) are in place that are designed to protect the confidentiality of such information. |
| Ÿ | | We reserve the right to change our Privacy Policy at any time upon proper notification to you. Customers may want to review our Privacy Policy periodically for changes by accessing the link on our homepage: www.eatonvance.com. |
Our pledge of privacy applies to the following entities within the Eaton Vance organization: the Eaton Vance Family of Funds, Eaton Vance Management, Eaton Vance Investment Counsel, Eaton Vance Distributors, Inc., Eaton Vance Trust Company, Eaton Vance Management’s Real Estate Investment Group and Boston Management and Research. In addition, our Privacy Policy applies only to those Eaton Vance customers who are individuals and who have a direct relationship with us. If a customer’s account (i.e., fund shares) is held in the name of a third-party financial advisor/broker-dealer, it is likely that only such advisor’s privacy policies apply to the customer. This notice supersedes all previously issued privacy disclosures. For more information about Eaton Vance’s Privacy Policy, please call 1-800-262-1122.
Delivery of Shareholder Documents. The Securities and Exchange Commission (SEC) permits funds to deliver only one copy of shareholder documents, including prospectuses, proxy statements and shareholder reports, to fund investors with multiple accounts at the same residential or post office box address. This practice is often called “householding” and it helps eliminate duplicate mailings to shareholders. Eaton Vance, or your financial advisor, may household the mailing of your documents indefinitely unless you instruct Eaton Vance, or your financial advisor, otherwise. If you would prefer that your Eaton Vance documents not be householded, please contact Eaton Vance at 1-800-262-1122, or contact your financial advisor. Your instructions that householding not apply to delivery of your Eaton Vance documents will be effective within 30 days of receipt by Eaton Vance or your financial advisor.
Portfolio Holdings. Each Eaton Vance Fund and its underlying Portfolio(s) (if applicable) will file a schedule of portfolio holdings on Form N-Q with the SEC for the first and third quarters of each fiscal year. The Form N-Q will be available on the Eaton Vance website at www.eatonvance.com, by calling Eaton Vance at 1-800-262-1122 or in the EDGAR database on the SEC’s website at www.sec.gov. Form N-Q may also be reviewed and copied at the SEC’s public reference room in Washington, D.C. (call 1-800-732-0330 for information on the operation of the public reference room).
Proxy Voting. From time to time, funds are required to vote proxies related to the securities held by the funds. The Eaton Vance Funds or their underlying Portfolios (if applicable) vote proxies according to a set of policies and procedures approved by the Funds’ and Portfolios’ Boards. You may obtain a description of these policies and procedures and information on how the Funds or Portfolios voted proxies relating to portfolio securities during the most recent 12-month period ended June 30, without charge, upon request, by calling 1-800-262-1122 and by accessing the SEC’s website at www.sec.gov.
Share Repurchase Program. The Fund’s Board of Trustees has approved a share repurchase program authorizing the Fund to repurchase up to 10% of its outstanding common shares as of the approved date in open market transactions at a discount to net asset value. The repurchase program does not obligate the Fund to purchase a specific amount of shares. The Fund’s repurchase activity, including the number of shares purchased, average price and average discount to net asset value, is disclosed in the Fund’s annual and semi-annual reports to shareholders.
Additional Notice to Shareholders. If applicable, a Fund may also redeem or purchase its outstanding preferred shares in order to maintain compliance with regulatory requirements, borrowing or rating agency requirements or for other purposes as it deems appropriate or necessary.
Closed-End Fund Information. Eaton Vance closed-end funds make fund performance data and certain information about portfolio characteristics available on the Eaton Vance website shortly after the end of each month. Other information about the funds is available on the website. The funds’ net asset value per share is readily accessible on the Eaton Vance website. Portfolio holdings for the most recent month-end are also posted to the website approximately 30 days following the end of the month. This information is available at www.eatonvance.com on the fund information pages under “Individual Investors — Closed-End Funds”.
This Page Intentionally Left Blank
Investment Adviser and Administrator
Eaton Vance Management
Two International Place
Boston, MA 02110
Sub-Adviser
Parametric Portfolio Associates LLC
1918 Eighth Avenue, Suite 3100
Seattle, WA 98101
Custodian
State Street Bank and Trust Company
State Street Financial Center, One Lincoln Street
Boston, MA 02111
Transfer Agent
American Stock Transfer & Trust Company, LLC
6201 15th Avenue
Brooklyn, NY 11219
Independent Registered Public Accounting Firm
Deloitte & Touche LLP
200 Berkeley Street
Boston, MA 02116-5022
Fund Offices
Two International Place
Boston, MA 02110
2552 12.31.14
Item 2. Code of Ethics
The registrant has adopted a code of ethics applicable to its Principal Executive Officer, Principal Financial Officer and Principal Accounting Officer. The registrant undertakes to provide a copy of such code of ethics to any person upon request, without charge, by calling 1-800-262-1122.
Item 3. Audit Committee Financial Expert
The registrant’s Board has designated William H. Park, an independent trustee, as its audit committee financial expert. Mr. Park is a certified public accountant who is a consultant and private investor. Previously, he served as the Chief Financial Officer of Aveon Group, L.P. (an investment management firm), as the Vice Chairman of Commercial Industrial Finance Corp. (specialty finance company), as President and Chief Executive Officer of Prizm Capital Management, LLC (investment management firm), as Executive Vice President and Chief Financial Officer of United Asset Management Corporation (an institutional investment management firm) and as a Senior Manager at Price Waterhouse (now PricewaterhouseCoopers) (an independent registered public accounting firm).
Item 4. Principal Accountant Fees and Services
(a)–(d)
The following table presents the aggregate fees billed to the registrant for the registrant’s fiscal years ended December 31, 2013 and December 31, 2014 by the registrant’s principal accountant, Deloitte & Touche LLP (“D&T”), for professional services rendered for the audit of the registrant’s annual financial statements and fees billed for other services rendered by D&T during such periods.
| | | | | | | | |
Fiscal Years Ended | | 12/31/13 | | | 12/31/14 | |
| | |
Audit Fees | | $ | 42,100 | | | $ | 42,750 | |
| | |
Audit-Related Fees(1) | | $ | 0 | | | $ | 0 | |
| | |
Tax Fees(2) | | $ | 12,370 | | | $ | 11,385 | |
| | |
All Other Fees(3) | | $ | 0 | | | $ | 0 | |
| | | | | | | | |
| | |
Total | | $ | 54,470 | | | $ | 54,135 | |
| | | | | | | | |
| (1) | Audit-related fees consist of the aggregate fees billed for assurance and related services that are reasonably related to the performance of the audit of financial statements and are not reported under the category of audit fees. |
| (2) | Tax fees consist of the aggregate fees billed for professional services rendered by the principal accountant relating to tax compliance, tax advice, and tax planning and specifically include fees for tax return preparation and other related tax compliance/planning matters. |
| (3) | All other fees consist of the aggregate fees billed for products and services provided by the principal accountant other than audit, audit-related, and tax services. |
(e)(1) The registrant’s audit committee has adopted policies and procedures relating to the pre-approval of services provided by the registrant’s principal accountant (the “Pre-Approval Policies”). The Pre-Approval Policies establish a framework intended to assist the audit committee in the proper discharge of its pre-approval responsibilities. As a general matter, the Pre-Approval Policies (i) specify certain types of audit, audit-related, tax, and other services determined to be pre-approved by the audit committee; and (ii) delineate specific procedures governing the mechanics of the pre-approval process, including the approval and monitoring of audit and non-audit service fees. Unless a service is specifically pre-approved under the Pre-Approval Policies, it must be separately pre-approved by the audit committee.
The Pre-Approval Policies and the types of audit and non-audit services pre-approved therein must be reviewed and ratified by the registrant’s audit committee at least annually. The registrant’s audit committee maintains full responsibility for the appointment, compensation, and oversight of the work of the registrant’s principal accountant.
(e)(2) No services described in paragraphs (b)-(d) above were approved by the registrant’s audit committee pursuant to the “de minimis exception” set forth in Rule 2-01(c)(7)(i)(C) of Regulation S-X.
(f) Not applicable.
(g) The following table presents (i) the aggregate non-audit fees (i.e., fees for audit-related, tax, and other services) billed to the registrant by D&T for the registrant’s fiscal years ended December 31, 2013 and December 31, 2014; and (ii) the aggregate non-audit fees (i.e., fees for audit-related, tax, and other services) billed to the Eaton Vance organization by D&T for the same time periods.
| | | | | | | | |
Fiscal Years Ended | | 12/31/13 | | | 12/31/14 | |
| | |
Registrant | | $ | 12,370 | | | $ | 11,385 | |
| | |
Eaton Vance(1) | | $ | 409,385 | | | $ | 99,750 | |
| (1) | The investment adviser to the registrant, as well as any of its affiliates that provide ongoing services to the registrant, are subsidiaries of Eaton Vance Corp. |
(h) The registrant’s audit committee has considered whether the provision by the registrant’s principal accountant of non-audit services to the registrant’s investment adviser and any entity controlling, controlled by, or under common control with the adviser that provides ongoing services to the registrant that were not pre-approved pursuant to Rule 2-01(c)(7)(ii) of Regulation S-X is compatible with maintaining the principal accountant’s independence.
Item 5. Audit Committee of Listed Registrants
The registrant has a separately-designated standing audit committee established in accordance with Section 3(a)(58)(A) of the Securities and Exchange Act of 1934, as amended. William H. Park (Chair), Scott E. Eston, Cynthia E. Frost, Ronald A. Pearlman and Ralph F. Verni are the members of the registrant’s audit committee.
Item 6. Schedule of Investments
Please see schedule of investments contained in the Report to Stockholders included under Item 1 of this Form N-CSR.
Item 7. Disclosure of Proxy Voting Policies and Procedures for Closed-End Management Investment Companies
The Board of Trustees of the Trust has adopted a proxy voting policy and procedure (the “Fund Policy”), pursuant to which the Trustees have delegated proxy voting responsibility to the Fund’s investment adviser and adopted the investment adviser’s proxy voting policies and procedures (the “Policies”) which are described below. The Trustees will review the Fund’s proxy voting records from time to time and will annually consider approving the Policies for the upcoming year. In the event that a conflict of interest arises between the Fund’s shareholders and the investment adviser, the administrator, or any of their affiliates or any affiliate of the Fund, the investment adviser will generally refrain from voting the proxies related to the companies giving rise to such conflict until it consults with the Board’s Special Committee except as contemplated under the Fund Policy. The Board’s Special Committee will instruct the investment adviser on the appropriate course of action.
The Policies are designed to promote accountability of a company’s management to its shareholders and to align the interests of management with those shareholders. An independent proxy voting service (“Agent”), currently Institutional Shareholder Services, Inc., has been retained to assist in the voting of proxies through the provision of vote analysis, implementation and recordkeeping and disclosure services. The investment adviser will generally vote proxies through the Agent. The Agent is required to vote all proxies and/or refer them back to the investment adviser pursuant to the Policies. It is
generally the policy of the investment adviser to vote in accordance with the recommendation of the Agent. The Agent shall refer to the investment adviser proxies relating to mergers and restructurings, and the disposition of assets, termination, liquidation and mergers contained in mutual fund proxies. The investment adviser will normally vote against anti-takeover measures and other proposals designed to limit the ability of shareholders to act on possible transactions, except in the case of closed-end management investment companies. The investment adviser generally supports management on social and environmental proposals. The investment adviser may abstain from voting from time to time where it determines that the costs associated with voting a proxy outweighs the benefits derived from exercising the right to vote or the economic effect on shareholders interests or the value of the portfolio holding is indeterminable or insignificant.
In addition, the investment adviser will monitor situations that may result in a conflict of interest between the Fund’s shareholders and the investment adviser, the administrator, or any of their affiliates or any affiliate of the Fund by maintaining a list of significant existing and prospective corporate clients. The investment adviser’s personnel responsible for reviewing and voting proxies on behalf of the Fund will report any proxy received or expected to be received from a company included on that list to the personnel of the investment adviser identified in the Policies. If such personnel expects to instruct the Agent to vote such proxies in a manner inconsistent with the guidelines of the Policies or the recommendation of the Agent, the personnel will consult with members of senior management of the investment adviser to determine if a material conflict of interests exists. If it is determined that a material conflict does exist, the investment adviser will seek instruction on how to vote from the Special Committee.
Information on how the Fund voted proxies relating to portfolio securities during the most recent 12 month period ended June 30 is available (1) without charge, upon request, by calling 1-800-262-1122, and (2) on the Securities and Exchange Commission’s website at http://www.sec.gov.
Item 8. Portfolio Managers of Closed-End Management Investment Companies
Eaton Vance Management (“EVM” or “Eaton Vance”) is the investment adviser to the Fund. EVM has engaged its affiliate, Parametric Portfolio Associates LLC (“Parametric”), as a sub-adviser to the Fund responsible for structuring and managing the Fund’s common stock portfolio, including tax-loss harvesting and other tax-management techniques.
Walter A. Row and other EVM investment professionals comprise the investment team responsible for managing the Fund’s overall investment program, providing the sub-advisers with research support and supervising the performance of the sub-advisers. Mr. Row is the portfolio manager responsible for the day-to-day management of EVM’s responsibilities with respect to the Fund’s investment portfolio. Mr. Row has been an EVM portfolio manager since 2004, is the Director of Structured Equity Portfolios at EVM, is a member of EVM’s Equity Strategy Committee and is a Vice President of EVM.
Thomas Seto is the Parametric portfolio manager responsible for the day-to-day management of the Fund’s common stock portfolio. Mr. Seto is the Head of Investment Management at Parametric where he is responsible for all portfolio management and trading at the Seattle Investment Center.
The following table shows, as of the Fund’s most recent fiscal year end, the number of accounts each portfolio manager managed in each of the listed categories and the total assets (in millions of dollars) in the accounts managed within each category. The table also shows the number of accounts with respect to which the advisory fee is based on the performance of the account, if any, and the total assets (in millions of dollars) in those accounts.
| | | | | | | | | | | | | | | | |
| | | Number of
All
Accounts | | | Total Assets of
All Accounts | | | Number of
Accounts
Paying a
Performance Fee | | | Total Assets
of Accounts
Paying a
Performance Fee | |
Walter A. Row | | | | | | | | | | | | | | | | |
Registered Investment Companies | | | 14 | | | $ | 14,304.4 | | | | 0 | | | $ | 0 | |
Other Pooled Investment Vehicles | | | 0 | | | $ | 0 | | | | 0 | | | $ | 0 | |
Other Accounts | | | 2 | | | $ | 3.4 | | | | 0 | | | $ | 0 | |
| | | | |
Thomas Seto | | | | | | | | | | | | | | | | |
Registered Investment Companies | | | 23 | (1) | | $ | 17,294.3 | | | | 0 | | | $ | 0 | |
Other Pooled Investment Vehicles | | | 4 | | | $ | 4,053.6 | | | | 0 | | | $ | 0 | |
Other Accounts(2) | | | 10,282 | | | $ | 52,080.1 | | | | 2 | | | $ | 1,281.1 | |
| (1) | This portfolio manager provides investment advice with respect to only a portion of the total assets of certain of these accounts. Only the assets allocated to this portfolio manager as of the Fund’s most recent fiscal year end are reflected in the table. |
| (2) | For “Other Accounts” that are part of a wrap account program, the number of accounts cited includes the number of sponsors for which the portfolio manager provides management services rather than the number of individual customer accounts within each wrap account program. |
The following table shows the dollar range of Fund shares beneficially by each portfolio manager as of the Fund’s most recent fiscal year end.
| | |
| Portfolio Manager | | Dollar Range of Equity
Securities Owned in the Fund |
Walter A. Row | | $10,001 - $50,000 |
Thomas Seto | | None |
Potential for Conflicts of Interest. It is possible that conflicts of interest may arise in connection with a portfolio manager’s management of a Fund’s investments on the one hand and the investments of other accounts for which the portfolio manager is responsible on the other. For example, a portfolio manager may have conflicts of interest in allocating management time, resources and investment opportunities among the Fund and other accounts he or she advises. In addition, due to differences in the investment strategies or restrictions between a Fund and the other accounts, a portfolio manager may take action with respect to another account that differs from the action taken with respect to the Fund. In some cases, another account managed by a portfolio manager may compensate EVM or the sub-adviser based on the performance of the securities held by that account. The existence of such a performance based fee may create additional conflicts of interest for the portfolio manager in the allocation of management time, resources and investment opportunities. Whenever conflicts of interest arise, the portfolio manager will endeavor to exercise his or her discretion in a manner that he or she believes is equitable to all interested persons. EVM and the sub-adviser have adopted several policies and procedures designed to address these potential conflicts including a code of ethics and policies which govern EVM’s and the sub-adviser’s trading practices, including among other things the aggregation and allocation of trades among clients, brokerage allocation, cross trades and best execution.
Compensation Structure for EVM
Compensation of EVM’s portfolio managers and other investment professionals has three primary components: (1) a base salary, (2) an annual cash bonus, and (3) annual stock-based compensation consisting of options to purchase shares of EVC’s nonvoting common stock and restricted shares of EVC’s nonvoting common stock. EVM’s investment professionals also receive certain retirement, insurance and other benefits that are broadly available to EVM’s employees. Compensation of EVM’s investment professionals is reviewed primarily on an annual basis. Cash bonuses, stock-based compensation awards, and adjustments in base salary are typically paid or put into effect at or shortly after the October 31st fiscal year end of EVC.
Method to Determine Compensation. EVM compensates its portfolio managers based primarily on the scale and complexity of their portfolio responsibilities and the total return performance of managed funds and accounts versus the benchmark(s) stated in the prospectus, as well as an appropriate peer group (as described below). In addition to rankings within peer groups of funds on the basis of absolute performance, consideration may also be given to relative risk-adjusted performance. Risk-adjusted performance measures include, but are not limited to, the Sharpe Ratio. Performance is normally based on periods ending on the September 30th preceding fiscal year end. Fund performance is normally evaluated primarily versus peer groups of funds as determined by Lipper Inc. and/or Morningstar, Inc. When a fund’s peer group as determined by Lipper or Morningstar is deemed by EVM’s management not to provide a fair comparison, performance may instead be evaluated primarily against a custom peer group or market index. In evaluating the performance of a fund and its manager, primary emphasis is normally placed on three-year performance, with secondary consideration of performance over longer and shorter periods. For funds that are tax-managed or otherwise have an objective of after-tax returns, performance is measured net of taxes. For other funds, performance is evaluated on a pre-tax basis. For funds with an investment objective other than total return (such as current income), consideration will also be given to the fund’s success in achieving its objective. For managers responsible for multiple funds and accounts, investment performance is evaluated on an aggregate basis, based on averages or weighted averages among managed funds and accounts. Funds and accounts that have performance-based advisory fees are not accorded disproportionate weightings in measuring aggregate portfolio manager performance.
The compensation of portfolio managers with other job responsibilities (such as heading an investment group or providing analytical support to other portfolios) will include consideration of the scope of such responsibilities and the managers’ performance in meeting them.
EVM seeks to compensate portfolio managers commensurate with their responsibilities and performance, and competitive with other firms within the investment management industry. EVM participates in investment-industry compensation surveys and utilizes survey data as a factor in determining salary, bonus and stock-based compensation levels for portfolio managers and other investment professionals. Salaries, bonuses and stock-based compensation are also influenced by the operating performance of EVM and its parent company. The overall annual cash bonus pool is generally based on a substantially fixed percentage of pre-bonus adjusted operating income. While the salaries of EVM’s portfolio managers are comparatively fixed, cash bonuses and stock-based compensation may fluctuate significantly from year to year, based on changes in manager performance and other factors as described herein. For a high performing portfolio manager, cash bonuses and stock-based compensation may represent a substantial portion of total compensation.
Compensation Structure for Parametric
Compensation of Parametric portfolio managers and other investment professionals has three primary components: (1) a base salary, (2) a cash bonus, and (3) annual stock-based compensation consisting of options to purchase shares of EVC nonvoting common stock, restricted shares of EVC nonvoting common stock and, for certain individuals, grants of profit participation interests in Parametric. Parametric investment professionals also receive certain retirement, insurance and other benefits that are broadly available to Parametric employees. Compensation of Parametric investment professionals is reviewed primarily on an annual basis. Stock-based compensation awards and adjustments in base salary and bonus are typically paid and/or put into effect at or shortly after fiscal year-end.
Method to Determine Compensation. Parametric seeks to compensate portfolio managers commensurate with their responsibilities and performance, and competitive with other firms within the investment management industry. The performance of portfolio managers is evaluated primarily based on success in achieving portfolio objectives for managed funds and accounts. The compensation of portfolio managers with other job responsibilities (such as product development) will include consideration of the scope of such responsibilities and the managers’ performance in meeting them.
Salaries, bonuses and stock-based compensation are also influenced by the operating performance of Parametric and EVC, its parent company. Cash bonuses available overall are determined based on a target percentage of Parametric profits. While the salaries of Parametric portfolio managers are comparatively fixed, cash bonuses and stock-based compensation may fluctuate substantially from year to year, based on changes in financial performance and other factors.
Item 9. Purchases of Equity Securities by Closed-End Management Investment Company and Affiliated Purchasers
No such purchases this period.
Item 10. Submission of Matters to a Vote of Security Holders
No material changes.
Item 11. Controls and Procedures
(a) It is the conclusion of the registrant’s principal executive officer and principal financial officer that the effectiveness of the registrant’s current disclosure controls and procedures (such disclosure controls and procedures having been evaluated within 90 days of the date of this filing) provide reasonable assurance that the information required to be disclosed by the registrant has been recorded, processed, summarized and reported within the time period specified in the Commission’s rules and forms and that the information required to be disclosed by the registrant has been accumulated and communicated to the registrant’s principal executive officer and principal financial officer in order to allow timely decisions regarding required disclosure.
(b) There have been no changes in the registrant’s internal controls over financial reporting during the second fiscal quarter of the period covered by this report that has materially affected, or is reasonably likely to materially affect, the registrant’s internal control over financial reporting.
Item 12. Exhibits
| | |
| (a)(1) | | Registrant’s Code of Ethics – Not applicable (please see Item 2). |
| |
| (a)(2)(i) | | Treasurer’s Section 302 certification. |
| |
| (a)(2)(ii) | | President’s Section 302 certification. |
| |
| (b) | | Combined Section 906 certification. |
| |
| (c) | | Registrant’s notices to shareholders pursuant to Registrant’s exemptive order granting an exemption from Section 19(b) of the 1940 Act and Rule 19b-1 thereunder regarding distributions paid pursuant to the Registrant’s Managed Distribution Plan. |
Signatures
Pursuant to the requirements of the Securities Exchange Act of 1934 and the Investment Company Act of 1940, the registrant has duly caused this report to be signed on its behalf by the undersigned, thereunto duly authorized.
Eaton Vance Tax-Managed Global Buy-Write Opportunities Fund
| | |
| By: | | /s/ Walter A. Row, III |
| | Walter A. Row, III |
| | President |
| |
| Date: | | February 12, 2015 |
Pursuant to the requirements of the Securities Exchange Act of 1934 and the Investment Company Act of 1940, this report has been signed below by the following persons on behalf of the registrant and in the capacities and on the dates indicated.
| | |
| By: | | /s/ James F. Kirchner |
| | James F. Kirchner |
| | Treasurer |
| |
| Date: | | February 12, 2015 |
| |
| By: | | /s/ Walter A. Row, III |
| | Walter A. Row, III |
| | President |
| |
| Date: | | February 12, 2015 |