UNITED STATES
SECURITIES AND EXCHANGE COMMISSION
Washington, D.C. 20549
FormN-CSR
CERTIFIED SHAREHOLDER REPORT OF REGISTERED
MANAGEMENT INVESTMENT COMPANIES
Investment Company Act File Number:811-21745
Eaton VanceTax-Managed GlobalBuy-Write Opportunities Fund
(Exact Name of Registrant as Specified in Charter)
Two International Place, Boston, Massachusetts 02110
(Address of Principal Executive Offices)
Maureen A. Gemma
Two International Place, Boston, Massachusetts 02110
(Name and Address of Agent for Services)
(617)482-8260
(Registrant’s Telephone Number)
December 31
Date of Fiscal Year End
December 31, 2019
Date of Reporting Period
Item 1. Reports to Stockholders

Eaton Vance
Tax-Managed GlobalBuy-Write Opportunities Fund (ETW)
Annual Report
December 31, 2019
Important Note. Beginning on January 1, 2021, as permitted by regulations adopted by the Securities and Exchange Commission, paper copies of the Fund’s annual and semi-annual shareholder reports will no longer be sent by mail unless you specifically request paper copies of the reports. Instead, the reports will be made available on the Fund’s website(funds.eatonvance.com/closed-end-fund-and-term-trust-documents.php), and you will be notified by mail each time a report is posted and provided with a website address to access the report.
If you already elected to receive shareholder reports electronically, you will not be affected by this change and you need not take any action. If you hold shares at the Fund’s transfer agent, American Stock Transfer & Trust Company, LLC (“AST”), you may elect to receive shareholder reports and other communications from the Fund electronically by contacting AST. If you own your shares through a financial intermediary (such as a broker-dealer or bank), you must contact your financial intermediary to sign up.
You may elect to receive all future Fund shareholder reports in paper free of charge. If you hold shares at AST, you can inform AST that you wish to continue receiving paper copies of your shareholder reports by calling1-866-439-6787. If you own these shares through a financial intermediary, you must contact your financial intermediary or follow instructions included with this disclosure, if applicable, to elect to continue to receive paper copies of your shareholder reports. Your election to receive reports in paper will apply to all funds held with AST or to all funds held through your financial intermediary, as applicable.

Commodity Futures Trading Commission Registration. Effective December 31, 2012, the Commodity Futures Trading Commission (“CFTC”) adopted certain regulatory changes that subject registered investment companies and advisers to regulation by the CFTC if a fund invests more than a prescribed level of its assets in certain CFTC-regulated instruments (including futures, certain options and swap agreements) or markets itself as providing investment exposure to such instruments. The Fund has claimed an exclusion from the definition of the term “commodity pool operator” under the Commodity Exchange Act. Accordingly, neither the Fund nor the adviser with respect to the operation of the Fund is subject to CFTC regulation. Because of its management of other strategies, the Fund’s adviser is registered with the CFTC as a commodity pool operator and a commodity trading advisor.
Managed Distribution Plan. Pursuant to an exemptive order issued by the Securities and Exchange Commission (Order), the Fund is authorized to distribute
long-term capital gains to shareholders more frequently than once per year. Pursuant to the Order, the Fund’s Board of Trustees approved a Managed Distribution Plan (MDP) pursuant to which the Fund makes monthly cash distributions to common shareholders, stated in terms of a fixed amount per common share.
The Fund currently distributes monthly cash distributions equal to $0.0727 per share in accordance with the MDP. You should not draw any conclusions about the Fund’s investment performance from the amount of these distributions or from the terms of the MDP. The MDP will be subject to regular periodic review by the Fund’s Board of Trustees and the Board may amend or terminate the MDP at any time without prior notice to Fund shareholders. However, at this time there are no reasonably foreseeable circumstances that might cause the termination of the MDP.
The Fund may distribute more than its net investment income and net realized capital gains and, therefore, a distribution may include a return of capital. A return of capital distribution does not necessarily reflect the Fund’s investment performance and should not be confused with “yield” or “income.” With each distribution, the Fund will issue a notice to shareholders and a press release containing information about the amount and sources of the distribution and other related information. The amounts and sources of distributions contained in the notice and press release are only estimates and are not provided for tax purposes. The amounts and sources of the Fund’s distributions for tax purposes will be reported to shareholders on Form1099-DIV for each calendar year.
Fund shares are not insured by the FDIC and are not deposits or other obligations of, or guaranteed by, any depository institution. Shares are subject to investment risks, including possible loss of principal invested.
Annual ReportDecember 31, 2019
Eaton Vance
Tax-Managed GlobalBuy-Write Opportunities Fund
Table of Contents
| | | | |
Management’s Discussion of Fund Performance | | | 2 | |
| |
Performance | | | 3 | |
| |
Fund Profile | | | 4 | |
| |
Fund Snapshot | | | 5 | |
| |
Endnotes and Additional Disclosures | | | 6 | |
| |
Financial Statements | | | 7 | |
| |
Report of Independent Registered Public Accounting Firm | | | 23 | |
| |
Federal Tax Information | | | 24 | |
| |
Dividend Reinvestment Plan | | | 25 | |
| |
Management and Organization | | | 27 | |
| |
Important Notices | | | 30 | |
Eaton Vance
Tax-Managed GlobalBuy-Write Opportunities Fund
December 31, 2019
Management’s Discussion of Fund Performance1
Economic and Market Conditions
With virtually every U.S. and global equity index posting double-digit returns for the12-month period ended December 31, 2019 — and bond markets in the black as well — 2019 was a good year for investments.
As the new year dawned in January 2019, investors appeared to be taking a “glass is half full” approach. Although U.S. manufacturing output and business investment remained weak — held back by slowing global growth and anon-again/off-again U.S.-China trade war — strong spending by U.S. consumers and dovish remarks by the U.S. Federal Reserve (the Fed) combined to lift investor sentiment. After four federal funds rate hikes in the previous year, markets began to project the Fed might actually lower rates in 2019 to stimulate the economy. U.S. unemployment, meanwhile, remained low and hiring remained strong.
As a result, U.S. stocks started the year with a climb, and international stocks followed. Facing concerns about slowing global growth and potential fallout from Brexit and U.S.-China trade issues, central banks around the world began to cut interest rates and employ other tools to stimulate their respective economies. For the first four months of 2019, the S&P 500®,2 the MSCI EAFE, the MSCI Emerging Markets, and the MSCI World indexes all reported strongly positive returns. Even a global stock pullback in May — sparked by heightened concerns about the U.S.-China trade spat — proved to be temporary, and the global stock rally resumed in June and July.
After holding interest rates steady through the first half of the year, the Fed cut the federal funds rate on July 31, 2019 — its first reduction in over a decade — followed by two additional rate cuts in September and October, to end the period at1.50%-1.75%. By end of the third quarter, 60 central banks around the world had lowered their interest rates.
After falling in August, global equities rallied again during the final months of the period, spurred by central bank actions; improved numbers from Chinese manufacturing, which had previously weakened; and optimism about a U.S.-China trade détente. Two events in December did much to allay investor concerns about trade and tariffs: passage of the United States-Mexico-Canada Agreement by the U.S. House of Representatives and the Trump administration’s agreement to aso-called“phase-one” trade deal with China.
During the12-month period ended December 31, 2019, the MSCI World Index, an index of developed market equity securities, returned 27.67%. The S&P 500® Index, a broad measure of U.S. stocks, returned 31.49%, hitting anall-time high the day after Christmas. The MSCI EAFE Index of developed-market international equities returned 22.01%, and the MSCI Emerging Markets Index returned 18.42%.
Fund Performance
For the12-month period ended December 31, 2019, Eaton VanceTax-Managed GlobalBuy-Write Opportunities Fund (the Fund) returned 18.05% at net asset value (NAV), underperforming the 31.49% return of its primary benchmark, the S&P 500® Index (the Index), the 23.77% return of the MSCI Europe Index in U.S. dollars, and the 19.09% return of the CboeNASDAQ-100 BuyWrite IndexSM; but outperforming the 15.68% return of the Cboe S&P 500 BuyWrite IndexSM.
The Fund’s options overlay strategy was the largest single detractor from Fund performance versus the Index, as might be expected during a period of strong equity market performance. The Fund employs an options strategy of writing (selling) stock index call options on a portion of its underlying common stock portfolio. The options strategy is designed to help limit the Fund’s exposure to market volatility and provide current income, but may limit the Fund’s upside potential in a rising market environment.
During the period, the overall market was characterized by strong equity performance and moderate levels of volatility. Despite the global equity market rally and sharp decline in realized volatility, however, implied volatility6 remained elevated throughout the year — due, in part, to investor concerns about trade tensions between the U.S. and China and a slowdown in global economic growth. In that environment, option premiums received by the Fund could not compensate for decreased participation in positive market returns caused by the options strategy. As a result, the options strategy dragged on Fund performance versus the Index.
The Fund’s common stock portfolio underperformed the Index and, thus, detracted from Fund performance versus the Index as well. Within the common stock portfolio, exposure to European and Japanese stocks, which together averaged about 45% of the portfolio during the period, hurt Fund performance versus the U.S.-centric Index.
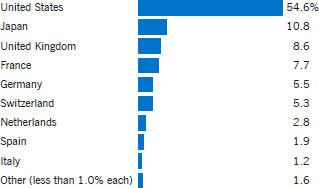
Although the Fund’s Japanese allocation and most of its European allocations delivered double-digit returns during the period, most of them could not match the strong returns of the Index during the period. The exceptions were the Fund’s modest allocations to the equity markets in Ireland, Switzerland, and the Netherlands, which contributed to performance versus the Index. On a country basis, the Fund’s allocation to U.S. equities, which averaged about 55% of the portfolio during the period, was the largest contributor to results versus the Index due to strong stock selection in the Fund’s U.S. holdings.
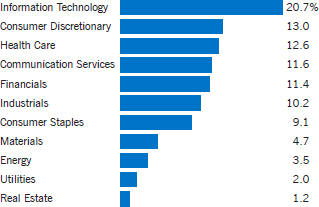
On a sector basis, detractors from performance versus the Index included security selections in the consumer staples, financials, and communication services sectors. Contributors to relative performance included security selections and an underweight position, relative to the Index, in both the health care and utilities sectors.
See Endnotes and Additional Disclosures in this report.
Past performance is no guarantee of future results. Returns are historical and are calculated net of management fees and other expenses by determining the percentage change in net asset value (NAV) or market price (as applicable) with all distributions reinvested in accordance with the Fund’s Dividend Reinvestment Plan. Performance at market price will differ from performance at NAV due to variations in the Fund’s market price versus NAV, which may reflect factors such as fluctuations in supply and demand for Fund shares, changes in Fund distributions, shifting market expectations for the Fund’s future returns and distribution rates, and other considerations affecting the trading prices ofclosed-end funds. Investment return and principal value will fluctuate so that shares, when sold, may be worth more or less than their original cost. Performance for periods less than or equal to one year is cumulative. Performance is for the stated time period only; due to market volatility, current Fund performance may be lower or higher than the quoted return. For performance as of the most recentmonth-end, please refer to eatonvance.com.
Eaton Vance
Tax-Managed GlobalBuy-Write Opportunities Fund
December 31, 2019
Performance2
Portfolio Managers Michael A. Allison, CFA of Eaton Vance Management and Thomas C. Seto of Parametric Portfolio Associates LLC
| | | | | | | | | | | | | | | | | | | | |
| % Average Annual Total Returns | | Inception Date | | | | | | One Year | | | Five Years | | | Ten Years | |
Fund at NAV | | | 09/30/2005 | | | | | | | | 18.05 | % | | | 6.91 | % | | | 7.71 | % |
Fund at Market Price | | | — | | | | | | | | 18.88 | | | | 9.06 | | | | 7.57 | |
S&P 500®Index | | | — | | | | | | | | 31.49 | % | | | 11.69 | % | | | 13.55 | % |
MSCI Europe Index | | | — | | | | | | | | 23.77 | | | | 5.05 | | | | 5.16 | |
Cboe S&P 500 BuyWrite IndexSM | | | — | | | | | | | | 15.68 | | | | 7.00 | | | | 7.04 | |
Cboe NASDAQ–100 BuyWrite IndexSM | | | — | | | | | | | | 19.09 | | | | 9.48 | | | | 7.83 | |
| | | | | |
| | | | | | | | | | | | | | | | | | | | |
| % Premium/Discount to NAV3 | | | | | | | | | | | | | | | |
| | | | | | | | | | | | | | | | | | | –0.96 | % |
| | | | | |
| | | | | | | | | | | | | | | | | | | | |
| Distributions4 | | | | | | | | | | | | | | | |
Total Distributions per share for the period | | | | | | | | | | | | | | | | | | $ | 0.872 | |
Distribution Rate at NAV | | | | | | | | | | | | | | | | | | | 8.33 | % |
Distribution Rate at Market Price | | | | | | | | | | | | | | | | | | | 8.41 | % |
See Endnotes and Additional Disclosures in this report.
Past performance is no guarantee of future results. Returns are historical and are calculated net of management fees and other expenses by determining the percentage change in net asset value (NAV) or market price (as applicable) with all distributions reinvested in accordance with the Fund’s Dividend Reinvestment Plan. Performance at market price will differ from performance at NAV due to variations in the Fund’s market price versus NAV, which may reflect factors such as fluctuations in supply and demand for Fund shares, changes in Fund distributions, shifting market expectations for the Fund’s future returns and distribution rates, and other considerations affecting the trading prices ofclosed-end funds. Investment return and principal value will fluctuate so that shares, when sold, may be worth more or less than their original cost. Performance for periods less than or equal to one year is cumulative. Performance is for the stated time period only; due to market volatility, current Fund performance may be lower or higher than the quoted return. For performance as of the most recentmonth-end, please refer to eatonvance.com.
Eaton Vance
Tax-Managed GlobalBuy-Write Opportunities Fund
December 31, 2019
Fund Profile
Sector Allocation (% of total investments)5
Country Allocation (% of total investments)5
Top 10 Holdings (% of total investments)5
| | | | |
| |
Apple, Inc. | | | 4.8 | % |
| |
Microsoft Corp. | | | 4.5 | |
| |
Amazon.com, Inc. | | | 3.3 | |
| |
Facebook, Inc., Class A | | | 2.2 | |
| |
Nestle SA | | | 1.9 | |
| |
Alphabet, Inc., Class A | | | 1.8 | |
| |
Alphabet, Inc., Class C | | | 1.7 | |
| |
Intel Corp. | | | 1.5 | |
| |
Roche Holding AG PC | | | 1.4 | |
| |
Allianz SE | | | 1.3 | |
| |
Total | | | 24.4 | % |
See Endnotes and Additional Disclosures in this report.
Eaton Vance
Tax-Managed GlobalBuy-Write Opportunities Fund
December 31, 2019
Fund Snapshot
| | |
| |
| Objective | | The primary investment objective is to provide current income and gains, with a secondary objective of capital appreciation. |
| |
| Strategy | | The Fund invests in a diversified portfolio of common stocks and writes call options on one or more U.S. and foreign indices on a substantial portion of the value of its common stock portfolio to generate current earnings from the option premium. The Fund evaluates returns on an after tax basis and seeks to minimize and defer federal income taxes incurred by shareholders in connection with their investment in the Fund. |
| | |
| |
| Options Strategy | | Write Index Covered Calls |
| |
| Equity Benchmarks2 | | S&P 500®Index MSCI Europe Index |
| |
| Morningstar Category | | Option Writing |
| |
| Distribution Frequency | | Monthly |
| |
| Common Stock Portfolio | | |
| |
| Positions Held | | 299 |
| |
| % US /Non-US | | 54.6/45.4 |
| |
| Average Market Cap | | $282.0 Billion |
| |
| Call Options Written | | |
| |
| % of Stock Portfolio | | 91% |
| |
| Average Days to Expiration | | 17 days |
| |
| % In the Money | | –0.7% |
The following terms as used in the Fund snapshot:
Average Market Cap: An indicator of the size of the companies in which the Fund invests and is the sum of each security’s weight in the portfolio multiplied by its market cap. Market Cap is determined by multiplying the price of a share of a company’s common stock by the number of shares outstanding.
Call Option: For an index call option, the buyer has the right to receive from the seller (or writer) a cash payment at the option expiration date equal to any positive difference between the value of the index at contract expiration and the exercise price. The buyer of a call option makes a cash payment (premium) to the seller (writer) of the option upon entering into the option contract.
Covered Call Strategy: A strategy of owning a portfolio of common stocks and writing call options on all or a portion of such stocks to generate current earnings from option premium.
In the Money: For a call option on an index, the extent to which the current price of the index exceeds the exercise price of the option.
See Endnotes and Additional Disclosures in this report.
Eaton Vance
Tax-Managed GlobalBuy-Write Opportunities Fund
December 31, 2019
Endnotes and Additional Disclosures
| 1 | The views expressed in this report are those of the portfolio manager(s) and are current only through the date stated at the top of this page. These views are subject to change at any time based upon market or other conditions, and Eaton Vance and the Fund(s) disclaim any responsibility to update such views. These views may not be relied upon as investment advice and, because investment decisions are based on many factors, may not be relied upon as an indication of trading intent on behalf of any Eaton Vance fund. This commentary may contain statements that are not historical facts, referred to as “forward looking statements.” The Fund’s actual future results may differ significantly from those stated in any forward looking statement, depending on factors such as changes in securities or financial markets or general economic conditions, the volume of sales and purchases of Fund shares, the continuation of investment advisory, administrative and service contracts, and other risks discussed from time to time in the Fund’s filings with the Securities and Exchange Commission. |
| 2 | S&P 500® Index is an unmanaged index oflarge-cap stocks commonly used as a measure of U.S. stock market performance. S&P Dow Jones Indices are a product of S&P Dow Jones Indices LLC (“S&P DJI”) and have been licensed for use. S&P® and S&P 500® are registered trademarks of S&P DJI; Dow Jones® is a registered trademark of Dow Jones Trademark Holdings LLC (“Dow Jones”); S&P DJI, Dow Jones and their respective affiliates do not sponsor, endorse, sell or promote the Fund, will not have any liability with respect thereto and do not have any liability for any errors, omissions, or interruptions of the S&P Dow Jones Indices. MSCI EAFE Index is an unmanaged index of equities in the developed markets, excluding the U.S. and Canada. MSCI Emerging Markets Index is an unmanaged index of emerging markets common stocks. MSCI World Index is an unmanaged index of equity securities in the developed markets. MSCI Europe Index is an unmanaged index designed to measure the developed equity market performance of Europe. MSCI indexes are net of foreign withholding taxes. Source: MSCI. MSCI data may not be reproduced or used for any other purpose. MSCI provides no warranties, has not prepared or approved this report, and has no liability hereunder. Cboe S&P 500 BuyWrite IndexSM measures the performance of a hypotheticalbuy-write strategy on the S&P 500® Index. Cboe NASDAQ–100 BuyWrite IndexSM measures the performance of a theoretical portfolio that owns stocks included in the NASDAQ–100® Index and writes (sells) NASDAQ–100® Index covered call options. Cboe Volatility Index® tracks the implied volatilities of a wide range of S&P 500® Index options. Unless otherwise stated, index returns do not reflect the effect of any applicable sales charges, commissions, expenses, taxes or leverage, as applicable. It is not possible to invest directly in an index. |
| 3 | The shares of the Fund often trade at a discount or premium to their net asset value. The discount or premium may vary over time and may be higher or lower than what is quoted in this report. Forup-to-date premium/discount information, please refer tohttps://funds.eatonvance.com/closed-end-fund-prices.php. |
| 4 | The Distribution Rate is based on the Fund’s last regular distribution per share in the period (annualized) divided by the Fund’s NAV or market price at the end of the period. The Fund’s distributions may be comprised of amounts characterized for federal income tax purposes as qualified andnon-qualified ordinary dividends, capital gains and nondividend distributions, also known as return of capital. For additional information about nondividend distributions, please refer to Eaton VanceClosed-End Fund Distribution Notices (19a) posted on our website, eatonvance.com. The Fund will determine the federal income tax character of distributions paid to a shareholder after the end of the calendar year. This is reported on the IRS form1099-DIV and provided to the shareholder shortly after eachyear-end. For information about the tax character of distributions made in prior calendar years, please refer toPerformance-Tax Character of Distributions on the Fund’s webpage available at eatonvance.com. In recent years, a significant portion of the Fund’s distributions has been characterized as a return of capital. The Fund’s distributions are determined by the investment adviser based on its current assessment of the Fund’s long-term return potential. Fund distributions may be affected by numerous factors including changes in Fund performance, the cost of financing for leverage, portfolio holdings, realized and projected returns, and other factors. As portfolio and market conditions change, the rate of distributions paid by the Fund could change. |
| 5 | Depictions do not reflect the Fund’s option positions. Excludes cash and cash equivalents. |
| 6 | Implied volatility refers to the market’s forecasted level of volatility going forward ��� one commonly used measure is the Cboe Volatility Index®, which looks 30 days ahead — whereas realized volatility refers to the level of volatility that actually occurred. |
| | Fund snapshot and profile subject to change due to active management. |
Eaton Vance
Tax-Managed Global Buy-Write Opportunities Fund
December 31, 2019
Portfolio of Investments
| | | | | | | | |
| Common Stocks— 101.0% | |
| Security | | Shares | | | Value | |
|
| Aerospace & Defense— 2.1% | |
| | |
Airbus SE(1) | | | 65,410 | | | $ | 9,599,906 | |
| | |
General Dynamics Corp.(1) | | | 6,866 | | | | 1,210,819 | |
| | |
L3Harris Technologies, Inc.(1) | | | 7,755 | | | | 1,534,482 | |
| | |
Northrop Grumman Corp.(1) | | | 13,028 | | | | 4,481,241 | |
| | |
Raytheon Co.(1) | | | 20,521 | | | | 4,509,284 | |
| | |
Rolls-Royce Holdings PLC | | | 156,584 | | | | 1,415,208 | |
| | |
Textron, Inc.(1) | | | 30,061 | | | | 1,340,721 | |
| |
| | | | $ | 24,091,661 | |
|
| Air Freight & Logistics— 0.3% | |
| | |
Deutsche Post AG(1) | | | 61,060 | | | $ | 2,321,755 | |
| | |
Expeditors International of Washington, Inc. | | | 16,714 | | | | 1,304,026 | |
| |
| | | | $ | 3,625,781 | |
|
| Airlines— 0.0%(2) | |
| | |
International Consolidated Airlines Group SA | | | 65,562 | | | $ | 542,471 | |
| |
| | | | $ | 542,471 | |
|
| Auto Components— 0.6% | |
| | |
Aisin Seiki Co., Ltd. | | | 10,200 | | | $ | 377,805 | |
| | |
Cie Generale des Etablissements Michelin SCA(1) | | | 15,277 | | | | 1,879,974 | |
| | |
Denso Corp. | | | 55,400 | | | | 2,501,993 | |
| | |
Toyota Industries Corp. | | | 6,400 | | | | 368,256 | |
| | |
Yokohama Rubber Co., Ltd. (The) | | | 75,500 | | | | 1,464,318 | |
| |
| | | | $ | 6,592,346 | |
|
| Automobiles— 1.0% | |
| | |
Daimler AG(1) | | | 132,059 | | | $ | 7,300,789 | |
| | |
Honda Motor Co., Ltd. | | | 24,800 | | | | 701,878 | |
| | |
Isuzu Motors, Ltd. | | | 89,500 | | | | 1,057,958 | |
| | |
Mazda Motor Corp. | | | 26,000 | | | | 221,557 | |
| | |
Toyota Motor Corp. | | | 12,900 | | | | 908,953 | |
| | |
Volkswagen AG, PFC Shares | | | 5,108 | | | | 1,005,450 | |
| |
| | | | $ | 11,196,585 | |
|
| Banks— 5.2% | |
| | |
Banco Santander SA | | | 1,466,812 | | | $ | 6,149,972 | |
| | |
Bank of America Corp.(1) | | | 50,000 | | | | 1,761,000 | |
| | |
BNP Paribas SA(1) | | | 75,132 | | | | 4,465,701 | |
| | |
Citigroup, Inc.(1) | | | 10,022 | | | | 800,658 | |
| | |
Credit Agricole SA(1) | | | 243,088 | | | | 3,537,256 | |
| | |
Danske Bank A/S(1) | | | 72,886 | | | | 1,179,171 | |
| | | | | | | | |
| Security | | Shares | | | Value | |
|
| Banks(continued) | |
| | |
Fifth Third Bancorp(1) | | | 47,006 | | | $ | 1,444,964 | |
| | |
HSBC Holdings PLC(1) | | | 774,578 | | | | 6,063,734 | |
| | |
Huntington Bancshares, Inc.(1) | | | 217,053 | | | | 3,273,159 | |
| | |
ING Groep NV(1) | | | 418,145 | | | | 5,027,108 | |
| | |
Intesa Sanpaolo SpA | | | 2,079,278 | | | | 5,477,209 | |
| | |
JPMorgan Chase & Co.(1) | | | 47,825 | | | | 6,666,805 | |
| | |
KBC Group NV | | | 22,722 | | | | 1,713,116 | |
| | |
KeyCorp(1) | | | 208,919 | | | | 4,228,521 | |
| | |
Lloyds Banking Group PLC | | | 927,572 | | | | 768,420 | |
| | |
PNC Financial Services Group, Inc. (The) | | | 6,406 | | | | 1,022,590 | |
| | |
Shinsei Bank, Ltd. | | | 31,400 | | | | 479,076 | |
| | |
Truist Financial Corp.(1) | | | 25,182 | | | | 1,418,250 | |
| | |
Wells Fargo & Co.(1) | | | 51,808 | | | | 2,787,270 | |
| |
| | | | $ | 58,263,980 | |
|
| Beverages— 1.4% | |
| | |
Coca-Cola Co. (The)(1) | | | 24,571 | | | $ | 1,360,005 | |
| | |
Constellation Brands, Inc., Class A(1) | | | 29,994 | | | | 5,691,362 | |
| | |
Heineken Holding NV | | | 24,773 | | | | 2,407,748 | |
| | |
Heineken NV | | | 7,692 | | | | 820,950 | |
| | |
Kirin Holdings Co., Ltd. | | | 59,000 | | | | 1,287,768 | |
| | |
PepsiCo, Inc.(1) | | | 32,854 | | | | 4,490,156 | |
| | |
Takara Holdings, Inc. | | | 20,500 | | | | 188,106 | |
| |
| | | | $ | 16,246,095 | |
|
| Biotechnology— 2.0% | |
| | |
AbbVie, Inc.(1) | | | 26,528 | | | $ | 2,348,789 | |
| | |
Amgen, Inc.(1) | | | 38,804 | | | | 9,354,480 | |
| | |
BioMarin Pharmaceutical, Inc.(1)(3) | | | 19,589 | | | | 1,656,250 | |
| | |
Gilead Sciences, Inc.(1) | | | 138,508 | | | | 9,000,250 | |
| |
| | | | $ | 22,359,769 | |
|
| Building Products— 0.6% | |
| | |
Daikin Industries, Ltd. | | | 47,700 | | | $ | 6,729,982 | |
| |
| | | | $ | 6,729,982 | |
|
| Capital Markets— 1.3% | |
| | |
CME Group, Inc. | | | 2,281 | | | $ | 457,842 | |
| | |
Moody’s Corp.(1) | | | 12,481 | | | | 2,963,114 | |
| | |
Morgan Stanley(1) | | | 35,092 | | | | 1,793,903 | |
| | |
S&P Global, Inc.(1) | | | 13,842 | | | | 3,779,558 | |
| | |
Schroders PLC(1) | | | 42,659 | | | | 1,883,656 | |
| | |
St. James’s Place PLC(1) | | | 209,534 | | | | 3,229,912 | |
| |
| | | | $ | 14,107,985 | |
| | | | |
| | 7 | | See Notes to Financial Statements. |
Eaton Vance
Tax-Managed Global Buy-Write Opportunities Fund
December 31, 2019
Portfolio of Investments — continued
| | | | | | | | |
| Security | | Shares | | | Value | |
|
| Chemicals— 3.3% | |
| | |
Air Liquide SA | | | 23,480 | | | $ | 3,328,777 | |
| | |
Air Products and Chemicals, Inc.(1) | | | 29,132 | | | | 6,845,729 | |
| | |
Akzo Nobel NV | | | 2,842 | | | | 290,236 | |
| | |
BASF SE(1) | | | 85,712 | | | | 6,457,253 | |
| | |
Corteva, Inc. | | | 4,706 | | | | 139,109 | |
| | |
Daicel Corp.(1) | | | 51,000 | | | | 487,578 | |
| | |
Dow, Inc. | | | 4,706 | | | | 257,559 | |
| | |
DuPont de Nemours, Inc. | | | 4,706 | | | | 302,125 | |
| | |
Eastman Chemical Co.(1) | | | 20,943 | | | | 1,659,942 | |
| | |
Johnson Matthey PLC(1) | | | 77,449 | | | | 3,079,478 | |
| | |
Linde PLC(1) | | | 37,750 | | | | 8,100,048 | |
| | |
Mitsubishi Gas Chemical Co., Inc. | | | 18,200 | | | | 277,262 | |
| | |
Nitto Denko Corp. | | | 34,900 | | | | 1,962,350 | |
| | |
Shin-Etsu Chemical Co., Ltd. | | | 22,800 | | | | 2,507,385 | |
| | |
Sumitomo Chemical Co., Ltd. | | | 25,000 | | | | 113,514 | |
| | |
Toray Industries, Inc. | | | 56,000 | | | | 379,429 | |
| | |
Tosoh Corp. | | | 86,500 | | | | 1,332,601 | |
| |
| | | | $ | 37,520,375 | |
|
| Commercial Services & Supplies— 0.4% | |
| | |
Rentokil Initial PLC | | | 97,214 | | | $ | 582,659 | |
| | |
SECOM Co., Ltd. | | | 31,800 | | | | 2,837,917 | |
| | |
Waste Management, Inc. | | | 10,662 | | | | 1,215,041 | |
| |
| | | | $ | 4,635,617 | |
|
| Communications Equipment— 1.2% | |
| | |
Cisco Systems, Inc.(1) | | | 290,093 | | | $ | 13,912,860 | |
| |
| | | | $ | 13,912,860 | |
|
| Construction & Engineering— 0.2% | |
| | |
Ferrovial SA | | | 87,504 | | | $ | 2,651,121 | |
| |
| | | | $ | 2,651,121 | |
|
| Construction Materials— 0.2% | |
| | |
CRH PLC | | | 62,332 | | | $ | 2,500,068 | |
| |
| | | | $ | 2,500,068 | |
|
| Consumer Finance— 0.4% | |
| | |
American Express Co.(1) | | | 31,280 | | | $ | 3,894,047 | |
| | |
Navient Corp. | | | 50,603 | | | | 692,249 | |
| |
| | | | $ | 4,586,296 | |
|
| Containers & Packaging— 0.0%(2) | |
| | |
Sealed Air Corp. | | | 13,286 | | | $ | 529,181 | |
| |
| | | | $ | 529,181 | |
| | | | | | | | |
| Security | | Shares | | | Value | |
|
| Distributors— 0.2% | |
| | |
LKQ Corp.(1)(3) | | | 53,930 | | | $ | 1,925,301 | |
| |
| | | | $ | 1,925,301 | |
|
| Diversified Financial Services— 0.7% | |
| | |
Berkshire Hathaway, Inc., Class B(1)(3) | | | 16,654 | | | $ | 3,772,131 | |
| | |
Groupe Bruxelles Lambert SA | | | 4,239 | | | | 447,303 | |
| | |
Investor AB, Class B | | | 34,952 | | | | 1,908,163 | |
| | |
M&G PLC(3) | | | 286,752 | | | | 900,961 | |
| | |
ORIX Corp. | | | 41,300 | | | | 684,397 | |
| |
| | | | $ | 7,712,955 | |
|
| Diversified Telecommunication Services— 1.1% | |
| | |
AT&T, Inc.(1) | | | 14,413 | | | $ | 563,260 | |
| | |
Deutsche Telekom AG(1) | | | 330,276 | | | | 5,397,427 | |
| | |
Orange SA | | | 210,144 | | | | 3,088,319 | |
| | |
United Internet AG | | | 32,975 | | | | 1,079,906 | |
| | |
Verizon Communications, Inc.(1) | | | 29,046 | | | | 1,783,424 | |
| |
| | | | $ | 11,912,336 | |
|
| Electric Utilities— 1.0% | |
| | |
Acciona SA | | | 8,786 | | | $ | 926,367 | |
| | |
Edison International(1) | | | 19,359 | | | | 1,459,862 | |
| | |
Iberdrola SA(1) | | | 861,510 | | | | 8,878,349 | |
| |
| | | | $ | 11,264,578 | |
|
| Electrical Equipment— 0.6% | |
| | |
ABB, Ltd.(1) | | | 115,511 | | | $ | 2,786,488 | |
| | |
Fujikura, Ltd. | | | 69,000 | | | | 283,912 | |
| | |
Legrand SA(1) | | | 47,726 | | | | 3,897,485 | |
| |
| | | | $ | 6,967,885 | |
|
| Electronic Equipment, Instruments & Components— 1.3% | |
| | |
Alps Alpine Co., Ltd. | | | 113,800 | | | $ | 2,583,183 | |
| | |
Corning, Inc. | | | 19,975 | | | | 581,472 | |
| | |
Halma PLC | | | 50,000 | | | | 1,400,132 | |
| | |
Kyocera Corp. | | | 33,800 | | | | 2,303,662 | |
| | |
Taiyo Yuden Co., Ltd. | | | 89,800 | | | | 2,739,109 | |
| | |
TDK Corp. | | | 40,200 | | | | 4,517,641 | |
| |
| | | | $ | 14,125,199 | |
|
| Entertainment— 2.0% | |
| | |
Electronic Arts, Inc.(1)(3) | | | 53,174 | | | $ | 5,716,737 | |
| | |
Konami Holdings Corp. | | | 5,500 | | | | 226,009 | |
| | | | |
| | 8 | | See Notes to Financial Statements. |
Eaton Vance
Tax-Managed Global Buy-Write Opportunities Fund
December 31, 2019
Portfolio of Investments — continued
| | | | | | | | |
| Security | | Shares | | | Value | |
|
| Entertainment(continued) | |
| | |
Netflix, Inc.(1)(3) | | | 21,000 | | | $ | 6,794,970 | |
| | |
Vivendi SA | | | 80,000 | | | | 2,316,601 | |
| | |
Walt Disney Co. (The)(1) | | | 53,917 | | | | 7,798,015 | |
| |
| | | | $ | 22,852,332 | |
|
| Equity Real Estate Investment Trusts (REITs)— 0.7% | |
| | |
American Tower Corp.(1) | | | 17,793 | | | $ | 4,089,187 | |
| | |
British Land Co. PLC (The) | | | 147,601 | | | | 1,249,839 | |
| | |
Simon Property Group, Inc.(1) | | | 19,951 | | | | 2,971,901 | |
| |
| | | | $ | 8,310,927 | |
|
| Food & Staples Retailing— 0.7% | |
| | |
FamilyMart Co., Ltd. | | | 34,400 | | | $ | 823,869 | |
| | |
Seven & i Holdings Co., Ltd. | | | 44,200 | | | | 1,620,169 | |
| | |
Tesco PLC | | | 890,919 | | | | 3,010,978 | |
| | |
Walmart, Inc.(1) | | | 18,421 | | | | 2,189,152 | |
| |
| | | | $ | 7,644,168 | |
|
| Food Products— 3.0% | |
| | |
Mondelez International, Inc., Class A(1) | | | 188,792 | | | $ | 10,398,663 | |
| | |
Nestle SA(1) | | | 203,470 | | | | 22,028,719 | |
| | |
Nissin Foods Holdings Co., Ltd. | | | 11,700 | | | | 868,991 | |
| | |
Toyo Suisan Kaisha, Ltd. | | | 5,000 | | | | 212,329 | |
| |
| | | | $ | 33,508,702 | |
|
| Gas Utilities— 0.1% | |
| | |
Italgas SpA | | | 35,014 | | | $ | 214,065 | |
| | |
Snam SpA | | | 175,073 | | | | 920,499 | |
| |
| | | | $ | 1,134,564 | |
|
| Health Care Equipment & Supplies— 1.1% | |
| | |
Abbott Laboratories(1) | | | 97,371 | | | $ | 8,457,645 | |
| | |
Olympus Corp. | | | 27,600 | | | | 425,391 | |
| | |
Terumo Corp. | | | 112,600 | | | | 3,994,406 | |
| |
| | | | $ | 12,877,442 | |
|
| Health Care Providers & Services— 1.6% | |
| | |
CVS Health Corp.(1) | | | 71,786 | | | $ | 5,332,982 | |
| | |
McKesson Corp.(1) | | | 16,774 | | | | 2,320,179 | |
| | |
UnitedHealth Group, Inc.(1) | | | 34,811 | | | | 10,233,738 | |
| |
| | | | $ | 17,886,899 | |
| | | | | | | | |
| Security | | Shares | | | Value | |
|
| Hotels, Restaurants & Leisure— 0.7% | |
| | |
Accor SA | | | 26,214 | | | $ | 1,230,453 | |
| | |
Six Flags Entertainment Corp.(1) | | | 29,121 | | | | 1,313,648 | |
| | |
Whitbread PLC | | | 11,872 | | | | 761,929 | |
| | |
Yum! Brands, Inc.(1) | | | 42,716 | | | | 4,302,783 | |
| |
| | | | $ | 7,608,813 | |
|
| Household Durables— 0.7% | |
| | |
Barratt Developments PLC(1) | | | 263,198 | | | $ | 2,606,036 | |
| | |
Casio Computer Co., Ltd. | | | 63,200 | | | | 1,262,957 | |
| | |
PulteGroup, Inc.(1) | | | 70,920 | | | | 2,751,696 | |
| | |
Sekisui Chemical Co., Ltd. | | | 61,000 | | | | 1,058,345 | |
| |
| | | | $ | 7,679,034 | |
|
| Household Products— 0.7% | |
| | |
Clorox Co. (The)(1) | | | 13,090 | | | $ | 2,009,839 | |
| | |
Henkel AG & Co. KGaA, PFC Shares | | | 18,309 | | | | 1,891,328 | |
| | |
Kimberly-Clark Corp. | | | 6,527 | | | | 897,789 | |
| | |
Procter & Gamble Co. (The)(1) | | | 4,074 | | | | 508,843 | |
| | |
Reckitt Benckiser Group PLC | | | 20,566 | | | | 1,670,545 | |
| | |
Unicharm Corp. | | | 35,200 | | | | 1,188,605 | |
| |
| | | | $ | 8,166,949 | |
|
| Industrial Conglomerates — 2.2% | |
| | |
3M Co.(1) | | | 18,736 | | | $ | 3,305,405 | |
| | |
Honeywell International, Inc.(1) | | | 31,549 | | | | 5,584,173 | |
| | |
Nisshinbo Holdings, Inc. | | | 109,000 | | | | 1,037,164 | |
| | |
Siemens AG(1) | | | 113,166 | | | | 14,778,522 | |
| |
| | | | $ | 24,705,264 | |
|
| Insurance— 4.0% | |
| | |
Ageas | | | 22,500 | | | $ | 1,330,483 | |
| | |
Allianz SE(1) | | | 61,906 | | | | 15,168,690 | |
| | |
Allstate Corp. (The)(1) | | | 14,927 | | | | 1,678,541 | |
| | |
Chubb, Ltd. | | | 7,404 | | | | 1,152,507 | |
| | |
Cincinnati Financial Corp.(1) | | | 23,801 | | | | 2,502,675 | |
| | |
Hartford Financial Services Group, Inc. (The) | | | 20,077 | | | | 1,220,079 | |
| | |
Lincoln National Corp.(1) | | | 17,183 | | | | 1,013,969 | |
| | |
Marsh & McLennan Cos., Inc.(1) | | | 33,742 | | | | 3,759,196 | |
| | |
MetLife, Inc.(1) | | | 27,893 | | | | 1,421,706 | |
| | |
MS&AD Insurance Group Holdings, Inc. | | | 37,200 | | | | 1,227,923 | |
| | |
Principal Financial Group, Inc. | | | 17,247 | | | | 948,585 | |
| | |
Prudential Financial, Inc. | | | 13,233 | | | | 1,240,461 | |
| | |
Prudential PLC(1) | | | 286,752 | | | | 5,494,349 | |
| | |
SCOR SE(1) | | | 61,069 | | | | 2,570,750 | |
| | |
Swiss Life Holding AG(1) | | | 8,264 | | | | 4,145,801 | |
| |
| | | | $ | 44,875,715 | |
| | | | |
| | 9 | | See Notes to Financial Statements. |
Eaton Vance
Tax-Managed Global Buy-Write Opportunities Fund
December 31, 2019
Portfolio of Investments — continued
| | | | | | | | |
| Security | | Shares | | | Value | |
|
| Interactive Media & Services— 5.8% | |
| | |
Alphabet, Inc., Class A(1)(3) | | | 15,702 | | | $ | 21,031,102 | |
| | |
Alphabet, Inc., Class C(1)(3) | | | 14,181 | | | | 18,960,281 | |
| | |
Facebook, Inc., Class A(1)(3) | | | 124,502 | | | | 25,554,035 | |
| |
| | | | $ | 65,545,418 | |
|
| Internet & Direct Marketing Retail— 4.1% | |
| | |
Amazon.com, Inc.(1)(3) | | | 20,450 | | | $ | 37,788,328 | |
| | |
Booking Holdings, Inc.(1)(3) | | | 3,947 | | | | 8,106,072 | |
| | |
Ocado Group PLC(1)(3) | | | 44,101 | | | | 748,262 | |
| |
| | | | $ | 46,642,662 | |
|
| IT Services— 2.8% | |
| | |
Amadeus IT Group SA | | | 24,489 | | | $ | 2,005,569 | |
| | |
Atos SE | | | 13,728 | | | | 1,147,151 | |
| | |
Capgemini SE(1) | | | 34,597 | | | | 4,231,380 | |
| | |
Cognizant Technology Solutions Corp., Class A(1) | | | 59,444 | | | | 3,686,717 | |
| | |
Fidelity National Information Services, Inc.(1) | | | 44,273 | | | | 6,157,932 | |
| | |
Indra Sistemas SA(3) | | | 58,122 | | | | 665,793 | |
| | |
Mastercard, Inc., Class A(1) | | | 16,997 | | | | 5,075,134 | |
| | |
Nomura Research Institute, Ltd. | | | 24,300 | | | | 519,680 | |
| | |
NTT Data Corp. | | | 62,200 | | | | 831,862 | |
| | |
Obic Co., Ltd. | | | 7,300 | | | | 983,316 | |
| | |
Otsuka Corp. | | | 15,600 | | | | 622,985 | |
| | |
PayPal Holdings, Inc.(1)(3) | | | 52,937 | | | | 5,726,195 | |
| | |
Perspecta, Inc. | | | 2,147 | | | | 56,767 | |
| | |
Worldline SA(3)(4) | | | 2,251 | | | | 159,576 | |
| |
| | | | $ | 31,870,057 | |
|
| Leisure Products— 0.2% | |
| | |
Hasbro, Inc.(1) | | | 20,651 | | | $ | 2,180,952 | |
| | |
Yamaha Corp. | | | 6,800 | | | | 377,016 | |
| |
| | | | $ | 2,557,968 | |
|
| Life Sciences Tools & Services— 0.6% | |
| | |
PerkinElmer, Inc. | | | 6,547 | | | $ | 635,714 | |
| | |
Thermo Fisher Scientific, Inc.(1) | | | 17,359 | | | | 5,639,418 | |
| |
| | | | $ | 6,275,132 | |
|
| Machinery— 1.3% | |
| | |
Dover Corp. | | | 7,424 | | | $ | 855,690 | |
| | |
Ebara Corp. | | | 25,500 | | | | 769,976 | |
| | |
FANUC Corp. | | | 23,827 | | | | 4,400,008 | |
| | |
Kawasaki Heavy Industries, Ltd. | | | 3,100 | | | | 67,756 | |
| | |
Komatsu, Ltd. | | | 29,200 | | | | 700,842 | |
| | | | | | | | |
| Security | | Shares | | | Value | |
|
| Machinery(continued) | |
| | |
Makita Corp. | | | 7,700 | | | $ | 265,918 | |
| | |
NSK, Ltd. | | | 6,000 | | | | 56,719 | |
| | |
Parker-Hannifin Corp.(1) | | | 7,147 | | | | 1,470,996 | |
| | |
SMC Corp. | | | 1,900 | | | | 868,899 | |
| | |
Snap-on, Inc. | | | 6,143 | | | | 1,040,624 | |
| | |
Stanley Black & Decker, Inc.(1) | | | 24,657 | | | | 4,086,651 | |
| |
| | | | $ | 14,584,079 | |
|
| Media— 1.7% | |
| | |
Charter Communications, Inc., Class A(1)(3) | | | 9,419 | | | $ | 4,568,969 | |
| | |
Comcast Corp., Class A(1) | | | 306,953 | | | | 13,803,676 | |
| | |
Hakuhodo DY Holdings, Inc. | | | 20,900 | | | | 336,302 | |
| |
| | | | $ | 18,708,947 | |
|
| Metals & Mining— 1.1% | |
| | |
Glencore PLC | | | 1,472,251 | | | $ | 4,584,173 | |
| | |
Mitsubishi Materials Corp. | | | 8,000 | | | | 217,117 | |
| | |
Rio Tinto PLC(1) | | | 127,078 | | | | 7,522,378 | |
| |
| | | | $ | 12,323,668 | |
|
| Multi-Utilities— 0.9% | |
| | |
CMS Energy Corp.(1) | | | 108,509 | | | $ | 6,818,706 | |
| | |
Engie SA | | | 62,752 | | | | 1,016,477 | |
| | |
NiSource, Inc.(1) | | | 42,420 | | | | 1,180,973 | |
| | |
Veolia Environnement SA | | | 37,663 | | | | 1,002,150 | |
| |
| | | | $ | 10,018,306 | |
|
| Multiline Retail— 0.6% | |
| | |
Isetan Mitsukoshi Holdings, Ltd. | | | 62,132 | | | $ | 557,928 | |
| | |
Next PLC(1) | | | 41,584 | | | | 3,874,909 | |
| | |
Target Corp.(1) | | | 15,229 | | | | 1,952,510 | |
| |
| | | | $ | 6,385,347 | |
|
| Oil, Gas & Consumable Fuels— 3.6% | |
| | |
BP PLC(1) | | | 1,013,220 | | | $ | 6,373,967 | |
| | |
Chevron Corp.(1) | | | 38,859 | | | | 4,682,898 | |
| | |
Eni SpA | | | 351,386 | | | | 5,457,456 | |
| | |
Exxon Mobil Corp. | | | 16,346 | | | | 1,140,624 | |
| | |
Idemitsu Kosan Co., Ltd. | | | 6,200 | | | | 171,317 | |
| | |
Marathon Petroleum Corp.(1) | | | 27,916 | | | | 1,681,939 | |
| | |
Phillips 66(1) | | | 36,105 | | | | 4,022,458 | |
| | |
Royal Dutch Shell PLC, Class A(1) | | | 189,507 | | | | 5,612,102 | |
| | |
Royal Dutch Shell PLC, Class B | | | 30,575 | | | | 907,578 | |
| | |
Total SA(1) | | | 185,656 | | | | 10,302,145 | |
| |
| | | | $ | 40,352,484 | |
| | | | |
| | 10 | | See Notes to Financial Statements. |
Eaton Vance
Tax-Managed Global Buy-Write Opportunities Fund
December 31, 2019
Portfolio of Investments — continued
| | | | | | | | |
| Security | | Shares | | | Value | |
|
| Paper & Forest Products— 0.1% | |
| | |
Mondi PLC | | | 38,326 | | | $ | 898,713 | |
| | |
Oji Holdings Corp. | | | 13,000 | | | | 70,304 | |
| |
| | | | $ | 969,017 | |
|
| Personal Products— 1.9% | |
| | |
Estee Lauder Cos., Inc. (The), Class A(1) | | | 25,480 | | | $ | 5,262,639 | |
| | |
Kao Corp.(1) | | | 49,454 | | | | 4,078,722 | |
| | |
Unilever NV(1) | | | 193,140 | | | | 11,084,435 | |
| | |
Unilever PLC | | | 15,759 | | | | 902,087 | |
| |
| | | | $ | 21,327,883 | |
|
| Pharmaceuticals— 7.5% | |
| | |
Astellas Pharma, Inc. | | | 205,900 | | | $ | 3,514,709 | |
| | |
AstraZeneca PLC(1) | | | 97,424 | | | | 9,751,357 | |
| | |
Bayer AG(1) | | | 26,130 | | | | 2,124,280 | |
| | |
Bristol-Myers Squibb Co.(1) | | | 78,074 | | | | 5,011,570 | |
| | |
Chugai Pharmaceutical Co., Ltd. | | | 61,300 | | | | 5,645,438 | |
| | |
Eisai Co., Ltd. | | | 13,646 | | | | 1,021,075 | |
| | |
Eli Lilly & Co.(1) | | | 13,232 | | | | 1,739,082 | |
| | |
Johnson & Johnson(1) | | | 15,601 | | | | 2,275,718 | |
| | |
Merck & Co., Inc.(1) | | | 103,665 | | | | 9,428,332 | |
| | |
Novartis AG(1) | | | 154,782 | | | | 14,656,241 | |
| | |
Pfizer, Inc.(1) | | | 14,458 | | | | 566,464 | |
| | |
Roche Holding AG PC | | | 50,591 | | | | 16,442,209 | |
| | |
Sanofi(1) | | | 113,195 | | | | 11,367,883 | |
| | |
UCB SA | | | 9,177 | | | | 730,256 | |
| |
| | | | $ | 84,274,614 | |
|
| Professional Services— 0.7% | |
| | |
Equifax, Inc.(1) | | | 15,217 | | | $ | 2,132,206 | |
| | |
Experian PLC | | | 85,608 | | | | 2,902,064 | |
| | |
Recruit Holdings Co., Ltd. | | | 12,500 | | | | 468,191 | |
| | |
Robert Half International, Inc.(1) | | | 30,884 | | | | 1,950,325 | |
| | |
Wolters Kluwer NV | | | 961 | | | | 70,168 | |
| |
| | | | $ | 7,522,954 | |
|
| Real Estate Management & Development— 0.5% | |
| | |
Capital & Counties Properties PLC | | | 189,600 | | | $ | 656,980 | |
| | |
CBRE Group, Inc., Class A(1)(3) | | | 37,761 | | | | 2,314,372 | |
| | |
Daito Trust Construction Co., Ltd. | | | 6,300 | | | | 778,530 | |
| | |
Heiwa Real Estate Co., Ltd. | | | 34,400 | | | | 946,088 | |
| | |
Sumitomo Realty & Development Co., Ltd. | | | 23,000 | | | | 802,458 | |
| |
| | | | $ | 5,498,428 | |
| | | | | | | | |
| Security | | Shares | | | Value | |
|
| Road & Rail— 1.1% | |
| | |
Central Japan Railway Co. | | | 3,400 | | | $ | 683,634 | |
| | |
CSX Corp.(1) | | | 108,014 | | | | 7,815,893 | |
| | |
East Japan Railway Co. | | | 2,900 | | | | 261,759 | |
| | |
Kansas City Southern(1) | | | 15,468 | | | | 2,369,079 | |
| | |
Keio Corp. | | | 15,200 | | | | 919,740 | |
| |
| | | | $ | 12,050,105 | |
|
| Semiconductors & Semiconductor Equipment— 4.8% | |
| | |
ASML Holding NV | | | 24,353 | | | $ | 7,209,862 | |
| | |
Infineon Technologies AG | | | 35,000 | | | | 790,802 | |
| | |
Intel Corp.(1) | | | 280,224 | | | | 16,771,406 | |
| | |
Marvell Technology Group, Ltd.(1) | | | 84,177 | | | | 2,235,741 | |
| | |
Maxim Integrated Products, Inc. | | | 18,000 | | | | 1,107,180 | |
| | |
NXP Semiconductors NV(1) | | | 40,985 | | | | 5,215,751 | |
| | |
STMicroelectronics NV | | | 35,000 | | | | 944,321 | |
| | |
Texas Instruments, Inc.(1) | | | 89,785 | | | | 11,518,518 | |
| | |
Tokyo Electron, Ltd. | | | 36,500 | | | | 7,969,044 | |
| |
| | | | $ | 53,762,625 | |
|
| Software— 5.8% | |
| | |
Citrix Systems, Inc.(1) | | | 33,243 | | | $ | 3,686,649 | |
| | |
Dassault Systemes SE | | | 6,700 | | | | 1,104,999 | |
| | |
Microsoft Corp.(1) | | | 327,284 | | | | 51,612,687 | |
| | |
Oracle Corp.(1) | | | 74,688 | | | | 3,956,970 | |
| | |
Sage Group PLC (The) | | | 313,890 | | | | 3,114,004 | |
| | |
salesforce.com, Inc.(3) | | | 4,000 | | | | 650,560 | |
| | |
Trend Micro, Inc. | | | 14,097 | | | | 721,341 | |
| |
| | | | $ | 64,847,210 | |
|
| Specialty Retail— 2.4% | |
| | |
Fast Retailing Co., Ltd. | | | 23,400 | | | $ | 13,901,328 | |
| | |
Fnac Darty SA(3) | | | 922 | | | | 54,788 | |
| | |
Home Depot, Inc. (The)(1) | | | 21,311 | | | | 4,653,896 | |
| | |
Lowe’s Cos., Inc.(1) | | | 44,810 | | | | 5,366,446 | |
| | |
Tiffany & Co.(1) | | | 19,173 | | | | 2,562,472 | |
| | |
USS Co., Ltd. | | | 27,200 | | | | 514,169 | |
| |
| | | | $ | 27,053,099 | |
|
| Technology Hardware, Storage & Peripherals— 5.0% | |
| | |
Apple, Inc.(1) | | | 185,459 | | | $ | 54,460,036 | |
| | |
Hewlett Packard Enterprise Co. | | | 78,955 | | | | 1,252,226 | |
| | |
HP, Inc.(1) | | | 39,615 | | | | 814,088 | |
| |
| | | | $ | 56,526,350 | |
| | | | |
| | 11 | | See Notes to Financial Statements. |
Eaton Vance
Tax-Managed Global Buy-Write Opportunities Fund
December 31, 2019
Portfolio of Investments — continued
| | | | | | | | |
| Security | | Shares | | | Value | |
|
| Textiles, Apparel & Luxury Goods — 2.7% | |
| | |
adidas AG | | | 13,921 | | | $ | 4,531,534 | |
| | |
Asics Corp. | | | 20,000 | | | | 331,828 | |
| | |
Kering(1) | | | 8,281 | | | | 5,456,471 | |
| | |
LVMH Moet Hennessy Louis Vuitton SE(1) | | | 32,072 | | | | 14,944,065 | |
| | |
NIKE, Inc., Class B(1) | | | 52,928 | | | | 5,362,136 | |
| |
| | | | $ | 30,626,034 | |
|
| Tobacco— 1.4% | |
| | |
British American Tobacco PLC(1) | | | 211,393 | | | $ | 8,984,640 | |
| | |
Imperial Brands PLC(1) | | | 46,553 | | | | 1,151,735 | |
| | |
Japan Tobacco, Inc. | | | 76,500 | | | | 1,705,686 | |
| | |
Philip Morris International, Inc.(1) | | | 50,068 | | | | 4,260,286 | |
| |
| | | | $ | 16,102,347 | |
|
| Trading Companies & Distributors— 0.6% | |
| | |
Ferguson PLC | | | 45,384 | | | $ | 4,130,254 | |
| | |
Marubeni Corp. | | | 20,000 | | | | 147,768 | |
| | |
Mitsubishi Corp. | | | 29,500 | | | | 781,495 | |
| | |
Sumitomo Corp. | | | 96,700 | | | | 1,436,317 | |
| |
| | | | $ | 6,495,834 | |
|
| Transportation Infrastructure— 0.1% | |
| | |
Aeroports de Paris | | | 6,667 | | | $ | 1,320,023 | |
| |
| | | | $ | 1,320,023 | |
|
| Wireless Telecommunication Services— 1.1% | |
| | |
KDDI Corp. | | | 137,900 | | | $ | 4,114,432 | |
| | |
SoftBank Group Corp. | | | 158,196 | | | | 6,868,399 | |
| | |
Vodafone Group PLC | | | 715,000 | | | | 1,388,082 | |
| |
| | | | $ | 12,370,913 | |
| |
Total Common Stocks — 101.0%
(identified cost $395,662,515) | | | $ | 1,137,262,740 | |
| |
Total Investments — 101.0%
(identified cost $395,662,515) | | | $ | 1,137,262,740 | |
| |
Total Written Call Options — (1.5)%
(premiums received $12,341,767) | | | $ | (16,966,960 | ) |
| |
Other Assets, Less Liabilities — 0.5% | | | $ | 5,207,454 | |
| |
Net Assets — 100.0% | | | $ | 1,125,503,234 | |
The percentage shown for each investment category in the Portfolio of Investments is based on net assets.
| (1) | Security (or a portion thereof) has been pledged as collateral for written options. |
| (2) | Amount is less than 0.05%. |
| (3) | Non-income producing security. |
| (4) | Security exempt from registration pursuant to Rule 144A under the Securities Act of 1933, as amended. These securities may be sold in certain transactions in reliance on an exemption from registration (normally to qualified institutional buyers). At December 31, 2019, the aggregate value of these securities is $159,576 or less than 0.05% of the Fund’s net assets. |
| | | | | | | | |
| Country Concentration of Portfolio | |
| Country | | Percentage
of Total Investments | | | Value | |
| | |
United States | | | 54.6 | % | | $ | 621,170,193 | |
| | |
Japan | | | 10.8 | | | | 122,673,844 | |
| | |
United Kingdom | | | 8.6 | | | | 97,621,121 | |
| | |
France | | | 7.7 | | | | 88,022,330 | |
| | |
Germany | | | 5.5 | | | | 62,847,736 | |
| | |
Switzerland | | | 5.3 | | | | 60,059,458 | |
| | |
Netherlands | | | 2.8 | | | | 32,126,258 | |
| | |
Spain | | | 1.9 | | | | 21,819,642 | |
| | |
Italy | | | 1.2 | | | | 13,013,550 | |
| | |
Ireland | | | 0.9 | | | | 10,600,116 | |
| | |
Belgium | | | 0.4 | | | | 4,221,158 | |
| | |
Sweden | | | 0.2 | | | | 1,908,163 | |
| | |
Denmark | | | 0.1 | | | | 1,179,171 | |
| | |
Total Investments | | | 100.0 | % | | $ | 1,137,262,740 | |
| | | | |
| | 12 | | See Notes to Financial Statements. |
Eaton Vance
Tax-Managed Global Buy-Write Opportunities Fund
December 31, 2019
Portfolio of Investments — continued
| | | | | | | | | | | | | | | | | | | | | | | | | | |
| Written Call Options — (1.5)% | |
|
| Exchange-Traded Options— (1.5)% | |
| | | | | | |
| Description | | | | Number of
Contracts | | | Notional
Amount | | | Exercise
Price | | | Expiration
Date | | | Value | |
| | | | | | | | |
| Dow Jones Euro Stoxx 50 Index | | | | | 1,320 | | | EUR | | | 49,435,980 | | | EUR | | | 3,700 | | | | 1/3/20 | | | $ | (629,438 | ) |
| | | | | | | | |
| Dow Jones Euro Stoxx 50 Index | | | | | 1,305 | | | EUR | | | 48,874,208 | | | EUR | | | 3,750 | | | | 1/10/20 | | | | (246,390 | ) |
| | | | | | | | |
| Dow Jones Euro Stoxx 50 Index | | | | | 1,310 | | | EUR | | | 49,061,465 | | | EUR | | | 3,750 | | | | 1/17/20 | | | | (861,184 | ) |
| | | | | | | | |
| Dow Jones Euro Stoxx 50 Index | | | | | 1,290 | | | EUR | | | 48,312,435 | | | EUR | | | 3,800 | | | | 1/24/20 | | | | (206,670 | ) |
| | | | | | | | |
| FTSE 100 Index | | | | | 530 | | | GBP | | | 39,974,932 | | | GBP | | | 7,550 | | | | 1/17/20 | | | | (463,586 | ) |
| | | | | | | | |
| FTSE 100 Index | | | | | 530 | | | GBP | | | 39,974,932 | | | GBP | | | 7,600 | | | | 1/17/20 | | | | (289,605 | ) |
| | | | | | | | |
| NASDAQ 100 Index | | | | | 35 | | | USD | | | 30,565,745 | | | USD | | | 8,250 | | | | 1/3/20 | | | | (1,691,900 | ) |
| | | | | | | | |
| NASDAQ 100 Index | | | | | 35 | | | USD | | | 30,565,745 | | | USD | | | 8,400 | | | | 1/8/20 | | | | (1,193,850 | ) |
| | | | | | | | |
| NASDAQ 100 Index | | | | | 35 | | | USD | | | 30,565,745 | | | USD | | | 8,400 | | | | 1/10/20 | | | | (1,220,800 | ) |
| | | | | | | | |
| NASDAQ 100 Index | | | | | 34 | | | USD | | | 29,692,438 | | | USD | | | 8,500 | | | | 1/15/20 | | | | (917,660 | ) |
| | | | | | | | |
| NASDAQ 100 Index | | | | | 34 | | | USD | | | 29,692,438 | | | USD | | | 8,600 | | | | 1/17/20 | | | | (666,570 | ) |
| | | | | | | | |
| NASDAQ 100 Index | | | | | 34 | | | USD | | | 29,692,438 | | | USD | | | 8,600 | | | | 1/22/20 | | | | (709,240 | ) |
| | | | | | | | |
| NASDAQ 100 Index | | | | | 34 | | | USD | | | 29,692,438 | | | USD | | | 8,750 | | | | 1/24/20 | | | | (403,410 | ) |
| | | | | | | | |
| NASDAQ 100 Index | | | | | 33 | | | USD | | | 28,819,131 | | | USD | | | 8,850 | | | | 1/29/20 | | | | (272,085 | ) |
| | | | | | | | |
| Nikkei 225 Index | | | | | 140 | | | JPY | | | 3,311,926,800 | | | JPY | | | 23,375 | | | | 1/10/20 | | | | (494,503 | ) |
| | | | | | | | |
| Nikkei 225 Index | | | | | 135 | | | JPY | | | 3,193,643,700 | | | JPY | | | 24,000 | | | | 1/17/20 | | | | (145,347 | ) |
| | | | | | | | |
| Nikkei 225 Index | | | | | 135 | | | JPY | | | 3,193,643,700 | | | JPY | | | 24,000 | | | | 1/24/20 | | | | (204,024 | ) |
| | | | | | | | |
| Nikkei 225 Index | | | | | 135 | | | JPY | | | 3,193,643,700 | | | JPY | | | 24,125 | | | | 2/14/20 | | | | (282,361 | ) |
| | | | | | | | |
| S&P 500 Index | | | | | 93 | | | USD | | | 30,046,254 | | | USD | | | 3,150 | | | | 1/3/20 | | | | (756,555 | ) |
| | | | | | | | |
| S&P 500 Index | | | | | 92 | | | USD | | | 29,723,176 | | | USD | | | 3,150 | | | | 1/6/20 | | | | (756,240 | ) |
| | | | | | | | |
| S&P 500 Index | | | | | 93 | | | USD | | | 30,046,254 | | | USD | | | 3,135 | | | | 1/8/20 | | | | (915,585 | ) |
| | | | | | | | |
| S&P 500 Index | | | | | 92 | | | USD | | | 29,723,176 | | | USD | | | 3,165 | | | | 1/10/20 | | | | (667,000 | ) |
| | | | | | | | |
| S&P 500 Index | | | | | 93 | | | USD | | | 30,046,254 | | | USD | | | 3,200 | | | | 1/13/20 | | | | (418,035 | ) |
| | | | | | | | |
| S&P 500 Index | | | | | 92 | | | USD | | | 29,723,176 | | | USD | | | 3,200 | | | | 1/15/20 | | | | (439,300 | ) |
| | | | | | | | |
| S&P 500 Index | | | | | 91 | | | USD | | | 29,400,098 | | | USD | | | 3,225 | | | | 1/17/20 | | | | (304,395 | ) |
| | | | | | | | |
| S&P 500 Index | | | | | 91 | | | USD | | | 29,400,098 | | | USD | | | 3,235 | | | | 1/21/20 | | | | (263,445 | ) |
| | | | | | | | |
| S&P 500 Index | | | | | 91 | | | USD | | | 29,400,098 | | | USD | | | 3,245 | | | | 1/22/20 | | | | (224,315 | ) |
| | | | | | | | |
| S&P 500 Index | | | | | 91 | | | USD | | | 29,400,098 | | | USD | | | 3,250 | | | | 1/24/20 | | | | (225,225 | ) |
| | | | | | | | |
| S&P 500 Index | | | | | 91 | | | USD | | | 29,400,098 | | | USD | | | 3,250 | | | | 1/27/20 | | | | (237,965 | ) |
| | | | | | | | |
| S&P 500 Index | | | | | 91 | | | USD | | | 29,400,098 | | | USD | | | 3,225 | | | | 1/29/20 | | | | (403,130 | ) |
| | | | | | | | |
| SMI Index | | | | | 420 | | | CHF | | | 44,591,148 | | | CHF | | | 10,600 | | | | 1/17/20 | | | | (457,147 | ) |
| | | | | | | | |
Total | | | | | | | | | | | | | | | | | | | | | | | | $ | (16,966,960 | ) |
Abbreviations:
| | | | |
| | |
| PC | | – | | Participation Certificate |
| | |
| PFC Shares | | – | | Preference Shares |
Currency Abbreviations:
| | | | |
| | |
| CHF | | – | | Swiss Franc |
| | |
| EUR | | – | | Euro |
| | |
| GBP | | – | | British Pound Sterling |
| | |
| JPY | | – | | Japanese Yen |
| | |
| USD | | – | | United States Dollar |
| | | | |
| | 13 | | See Notes to Financial Statements. |
Eaton Vance
Tax-Managed Global Buy-Write Opportunities Fund
December 31, 2019
Statement of Assets and Liabilities
| | | | |
| Assets | | December 31, 2019 | |
| |
Unaffiliated investments, at value (identified cost, $395,662,515) | | $ | 1,137,262,740 | |
| |
Cash | | | 2,301,262 | |
| |
Dividends receivable | | | 928,564 | |
| |
Receivable for investments sold | | | 1,303,864 | |
| |
Receivable for premiums on written options | | | 1,114,721 | |
| |
Tax reclaims receivable | | | 3,069,617 | |
| |
Total assets | | $ | 1,145,980,768 | |
|
| Liabilities | |
| |
Written options outstanding, at value (premiums received, $12,341,767) | | $ | 16,966,960 | |
| |
Payable for closed written options | | | 1,620,717 | |
| |
Due to custodian — foreign currency, at value (identified cost, $382,443) | | | 381,954 | |
| |
Payable to affiliates: | | | | |
| |
Investment adviser fee | | | 950,259 | |
| |
Trustees’ fees | | | 13,690 | |
| |
Accrued expenses | | | 543,954 | |
| |
Total liabilities | | $ | 20,477,534 | |
| |
Commitments and contingencies (see Note 9) | | | | |
| |
Net Assets | | $ | 1,125,503,234 | |
|
| Sources of Net Assets | |
| |
Common shares, $0.01 par value, unlimited number of shares authorized, 107,460,587 shares issued and outstanding | | $ | 1,074,606 | |
| |
Additionalpaid-in capital | | | 388,525,958 | |
| |
Distributable earnings | | | 735,902,670 | |
| |
Net Assets | | $ | 1,125,503,234 | |
| |
| Net Asset Value | | | | |
| |
($1,125,503,234 ÷ 107,460,587 common shares issued and outstanding) | | $ | 10.47 | |
| | | | |
| | 14 | | See Notes to Financial Statements. |
Eaton Vance
Tax-Managed Global Buy-Write Opportunities Fund
December 31, 2019
Statement of Operations
| | | | |
| Investment Income | | Year Ended December 31, 2019 | |
| |
Dividends (net of foreign taxes, $2,034,441) | | $ | 25,887,621 | |
| |
Total investment income | | $ | 25,887,621 | |
| |
| Expenses | | | | |
| |
Investment adviser fee | | $ | 10,947,540 | |
| |
Trustees’ fees and expenses | | | 57,642 | |
| |
Custodian fee | | | 403,456 | |
| |
Transfer and dividend disbursing agent fees | | | 18,200 | |
| |
Legal and accounting services | | | 81,200 | |
| |
Printing and postage | | | 392,789 | |
| |
Miscellaneous | | | 147,010 | |
| |
Total expenses | | $ | 12,047,837 | |
| |
Net investment income | | $ | 13,839,784 | |
| |
| Realized and Unrealized Gain (Loss) | | | | |
| |
Net realized gain (loss) — | | | | |
| |
Investment transactions | | $ | 115,523,003 | |
| |
Written options | | | (99,746,534 | ) |
| |
Foreign currency transactions | | | (2,977 | ) |
| |
Net realized gain | | $ | 15,773,492 | |
| |
Change in unrealized appreciation (depreciation) — | | | | |
| |
Investments | | $ | 156,594,891 | |
| |
Written options | | | (7,891,900 | ) |
| |
Foreign currency | | | 52,232 | |
| |
Net change in unrealized appreciation (depreciation) | | $ | 148,755,223 | |
| |
Net realized and unrealized gain | | $ | 164,528,715 | |
| |
Net increase in net assets from operations | | $ | 178,368,499 | |
| | | | |
| | 15 | | See Notes to Financial Statements. |
Eaton Vance
Tax-Managed Global Buy-Write Opportunities Fund
December 31, 2019
Statements of Changes in Net Assets
| | | | | | | | |
| | | Year Ended December 31, | |
| Increase (Decrease) in Net Assets | | 2019 | | | 2018 | |
| | |
From operations — | | | | | | | | |
| | |
Net investment income | | $ | 13,839,784 | | | $ | 15,128,471 | |
| | |
Net realized gain | | | 15,773,492 | | | | 72,370,895 | |
| | |
Net change in unrealized appreciation (depreciation) | | | 148,755,223 | | | | (175,026,326 | ) |
| | |
Net increase (decrease) in net assets from operations | | $ | 178,368,499 | | | $ | (87,526,960 | ) |
| | |
Distributions to shareholders | | $ | (24,800,161 | ) | | $ | (72,720,403 | ) |
| | |
Tax return of capital to shareholders | | $ | (68,948,455 | ) | | $ | (44,306,251 | ) |
| | |
Capital share transactions — | | | | | | | | |
| | |
Proceeds from shelf offering, net of offering costs (see Note 5) | | $ | — | | | $ | 5,016,377 | |
| | |
Reinvestment of distributions | | | — | | | | 3,505,554 | |
| | |
Net increase in net assets from capital share transactions | | $ | — | | | $ | 8,521,931 | |
| | |
Net increase (decrease) in net assets | | $ | 84,619,883 | | | $ | (196,031,683 | ) |
|
| Net Assets | |
| | |
At beginning of year | | $ | 1,040,883,351 | | | $ | 1,236,915,034 | |
| | |
At end of year | | $ | 1,125,503,234 | | | $ | 1,040,883,351 | |
| | | | |
| | 16 | | See Notes to Financial Statements. |
Eaton Vance
Tax-Managed Global Buy-Write Opportunities Fund
December 31, 2019
Financial Highlights
| | | | | | | | | | | | | | | | | | | | |
| | | Year Ended December 31, | |
| | | 2019 | | | 2018 | | | 2017 | | | 2016 | | | 2015 | |
| | | | | |
Net asset value — Beginning of year | | $ | 9.690 | | | $ | 11.590 | | | $ | 10.710 | | | $ | 11.560 | | | $ | 12.290 | |
| | | | | |
| Income (Loss) From Operations | | | | | | | | | | | | | | | | | | | | |
| | | | | |
Net investment income(1) | | $ | 0.129 | | | $ | 0.141 | | | $ | 0.135 | | | $ | 0.163 | | | $ | 0.183 | |
| | | | | |
Net realized and unrealized gain (loss) | | | 1.523 | | | | (0.950 | ) | | | 1.850 | | | | 0.155 | | | | 0.255 | |
| | | | | |
Total income (loss) from operations | | $ | 1.652 | | | $ | (0.809 | ) | | $ | 1.985 | | | $ | 0.318 | | | $ | 0.438 | |
| | | | | |
| Less Distributions | | | | | | | | | | | | | | | | | | | | |
| | | | | |
From net investment income | | $ | (0.142 | ) | | $ | (0.129 | ) | | $ | (0.149 | ) | | $ | (0.155 | ) | | $ | (0.183 | ) |
| | | | | |
From net realized gain | | | (0.089 | ) | | | (0.550 | ) | | | — | | | | — | | | | — | |
| | | | | |
Tax return of capital | | | (0.641 | ) | | | (0.413 | ) | | | (0.956 | ) | | | (1.013 | ) | | | (0.985 | ) |
| | | | | |
Total distributions | | $ | (0.872 | ) | | $ | (1.092 | ) | | $ | (1.105 | ) | | $ | (1.168 | ) | | $ | (1.168 | ) |
| | | | | |
Premium from common shares sold through shelf offering (see Note 5)(1) | | $ | — | | | $ | 0.001 | | | $ | — | | | $ | — | | | $ | — | |
| | | | | |
Net asset value — End of year | | $ | 10.470 | | | $ | 9.690 | | | $ | 11.590 | | | $ | 10.710 | | | $ | 11.560 | |
| | | | | |
Market value — End of year | | $ | 10.370 | | | $ | 9.530 | | | $ | 11.920 | | | $ | 10.070 | | | $ | 11.230 | |
| | | | | |
Total Investment Return on Net Asset Value(2) | | | 18.05 | % | | | (7.72 | )% | | | 19.28 | % | | | 3.46 | % | | | 3.92 | % |
| | | | | |
Total Investment Return on Market Value(2) | | | 18.88 | % | | | (11.76 | )% | | | 30.47 | % | | | 0.14 | % | | | 12.59 | % |
|
| Ratios/Supplemental Data | |
| | | | | |
Net assets, end of year (000’s omitted) | | $ | 1,125,503 | | | $ | 1,040,883 | | | $ | 1,236,915 | | | $ | 1,139,577 | | | $ | 1,230,445 | |
| | | | | |
Ratios (as a percentage of average daily net assets): | | | | | | | | | | | | | | | | | | | | |
| | | | | |
Expenses(3) | | | 1.10 | % | | | 1.09 | % | | | 1.09 | % | | | 1.10 | % | | | 1.09 | % |
| | | | | |
Net investment income | | | 1.26 | % | | | 1.27 | % | | | 1.20 | % | | | 1.50 | % | | | 1.50 | % |
| | | | | |
Portfolio Turnover | | | 2 | % | | | 4 | % | | | 1 | % | | | 8 | % | | | 7 | % |
| (1) | Computed using average shares outstanding. |
| (2) | Returns are historical and are calculated by determining the percentage change in net asset value or market value with all distributions reinvested. Distributions are assumed to be reinvested at prices obtained under the Fund’s dividend reinvestment plan. |
| (3) | Excludes the effect of custody fee credits, if any, of less than 0.005%. Effective September 1, 2015, custody fee credits, which were earned on cash deposit balances, were discontinued by the custodian. |
| | | | |
| | 17 | | See Notes to Financial Statements. |
Eaton Vance
Tax-Managed Global Buy-Write Opportunities Fund
December 31, 2019
Notes to Financial Statements
1 Significant Accounting Policies
Eaton VanceTax-Managed GlobalBuy-Write Opportunities Fund (the Fund) is a Massachusetts business trust registered under the Investment Company Act of 1940, as amended (the 1940 Act), as a diversified,closed-end management investment company. The Fund’s primary investment objective is to provide current income and gains, with a secondary objective of capital appreciation.
The following is a summary of significant accounting policies of the Fund. The policies are in conformity with accounting principles generally accepted in the United States of America (U.S. GAAP). The Fund is an investment company and follows accounting and reporting guidance in the Financial Accounting Standards Board (FASB) Accounting Standards Codification Topic 946.
A Investment Valuation — The following methodologies are used to determine the market value or fair value of investments.
Equity Securities. Equity securities listed on a U.S. securities exchange generally are valued at the last sale or closing price on the day of valuation or, if no sales took place on such date, at the mean between the closing bid and ask prices on the exchange where such securities are principally traded. Equity securities listed on the NASDAQ Global or Global Select Market generally are valued at the NASDAQ official closing price. Unlisted or listed securities for which closing sales prices or closing quotations are not available are valued at the mean between the latest available bid and ask prices.
Derivatives. U.S. exchange-traded options are valued at the mean between the bid and ask prices at valuation time as reported by the Options Price Reporting Authority. Non U.S. exchange-traded options andover-the-counter options are valued by a third party pricing service using techniques that consider factors including the value of the underlying instrument, the volatility of the underlying instrument and the period of time until option expiration.
Foreign Securities and Currencies. Foreign securities and currencies are valued in U.S. dollars, based on foreign currency exchange rate quotations supplied by a third party pricing service. The pricing service uses a proprietary model to determine the exchange rate. Inputs to the model include reported trades and implied bid/ask spreads. The daily valuation of exchange-traded foreign securities generally is determined as of the close of trading on the principal exchange on which such securities trade. Events occurring after the close of trading on foreign exchanges may result in adjustments to the valuation of foreign securities to more accurately reflect their fair value as of the close of regular trading on the New York Stock Exchange. When valuing foreign equity securities that meet certain criteria, the Fund’s Trustees have approved the use of a fair value service that values such securities to reflect market trading that occurs after the close of the applicable foreign markets of comparable securities or other instruments that have a strong correlation to the fair-valued securities.
Fair Valuation. Investments for which valuations or market quotations are not readily available or are deemed unreliable are valued at fair value using methods determined in good faith by or at the direction of the Trustees of the Fund in a manner that most fairly reflects the security’s “fair value”, which is the amount that the Fund might reasonably expect to receive for the security upon its current sale in the ordinary course. Each such determination is based on a consideration of relevant factors, which are likely to vary from one pricing context to another. These factors may include, but are not limited to, the type of security, the existence of any contractual restrictions on the security’s disposition, the price and extent of public trading in similar securities of the issuer or of comparable companies or entities, quotations or relevant information obtained from broker/dealers or other market participants, information obtained from the issuer, analysts, and/or the appropriate stock exchange (for exchange-traded securities), an analysis of the company’s or entity’s financial statements, and an evaluation of the forces that influence the issuer and the market(s) in which the security is purchased and sold.
B Investment Transactions — Investment transactions for financial statement purposes are accounted for on a trade date basis. Realized gains and losses on investments sold are determined on the basis of identified cost.
C Income — Dividend income is recorded on theex-dividend date for dividends received in cash and/or securities. However, if theex-dividend date has passed, certain dividends from foreign securities are recorded as the Fund is informed of theex-dividend date. Withholding taxes on foreign dividends and capital gains have been provided for in accordance with the Fund’s understanding of the applicable countries’ tax rules and rates. In consideration of recent decisions rendered by European courts, the Fund has filed additional tax reclaims for previously withheld taxes on dividends earned in certain European Union countries. These filings are subject to various administrative and judicial proceedings within these countries. Due to the uncertainty as to the ultimate resolution of these proceedings, the likelihood of receipt of these reclaims, and the potential timing of payment, no amounts are reflected in the financial statements for such outstanding reclaims.
D Federal Taxes — The Fund’s policy is to comply with the provisions of the Internal Revenue Code applicable to regulated investment companies and to distribute to shareholders each year substantially all of its net investment income, and all or substantially all of its net realized capital gains. Accordingly, no provision for federal income or excise tax is necessary.
As of December 31, 2019, the Fund had no uncertain tax positions that would require financial statement recognition,de-recognition, or disclosure. The Fund files a U.S. federal income tax return annually after its fiscalyear-end, which is subject to examination by the Internal Revenue Service for a period of three years from the date of filing.
E Foreign Currency Translation — Investment valuations, other assets, and liabilities initially expressed in foreign currencies are translated each business day into U.S. dollars based upon current exchange rates. Purchases and sales of foreign investment securities and income and expenses denominated in foreign currencies are translated into U.S. dollars based upon currency exchange rates in effect on the respective dates of such transactions. Recognized gains or losses on investment transactions attributable to changes in foreign currency exchange rates are recorded for financial statement purposes as net realized gains and losses on investments. That portion of unrealized gains and losses on investments that results from fluctuations in foreign currency exchange rates is not separately disclosed.
Eaton Vance
Tax-Managed Global Buy-Write Opportunities Fund
December 31, 2019
Notes to Financial Statements — continued
F Use of Estimates — The preparation of the financial statements in conformity with U.S. GAAP requires management to make estimates and assumptions that affect the reported amounts of assets and liabilities at the date of the financial statements and the reported amounts of income and expense during the reporting period. Actual results could differ from those estimates.
G Indemnifications — Under the Fund’s organizational documents, its officers and Trustees may be indemnified against certain liabilities and expenses arising out of the performance of their duties to the Fund. Under Massachusetts law, if certain conditions prevail, shareholders of a Massachusetts business trust (such as the Fund) could be deemed to have personal liability for the obligations of the Fund. However, the Fund’s Declaration of Trust contains an express disclaimer of liability on the part of Fund shareholders and theBy-laws provide that the Fund shall assume, upon request by the shareholder, the defense on behalf of any Fund shareholders. Moreover, theBy-laws also provide for indemnification out of Fund property of any shareholder held personally liable solely by reason of being or having been a shareholder for all loss or expense arising from such liability. Additionally, in the normal course of business, the Fund enters into agreements with service providers that may contain indemnification clauses. The Fund’s maximum exposure under these arrangements is unknown as this would involve future claims that may be made against the Fund that have not yet occurred.
H Written Options — Upon the writing of a call or a put option, the premium received by the Fund is included in the Statement of Assets and Liabilities as a liability. The amount of the liability is subsequentlymarked-to-market to reflect the current market value of the option written, in accordance with the Fund’s policies on investment valuations discussed above. Premiums received from writing options which expire are treated as realized gains. Premiums received from writing options which are exercised or are closed are added to or offset against the proceeds or amount paid on the transaction to determine the realized gain or loss. When an index option is exercised, the Fund is required to deliver an amount of cash determined by the excess of the exercise price of the option over the value of the index (in the case of a put) or the excess of the value of the index over the exercise price of the option (in the case of a call) at contract termination. If a put option on a security is exercised, the premium reduces the cost basis of the securities purchased by the Fund. The Fund, as a writer of an option, may have no control over whether the underlying securities or other assets may be sold (call) or purchased (put) and, as a result, bears the market risk of an unfavorable change in the price of the securities or other assets underlying the written option. The Fund may also bear the risk of not being able to enter into a closing transaction if a liquid secondary market does not exist.
2 Distributions to Shareholders and Income Tax Information
Subject to its Managed Distribution Plan, the Fund makes monthly distributions from its cash available for distribution, which consists of the Fund’s dividends and interest income after payment of Fund expenses, net option premiums and net realized and unrealized gains on stock investments. The Fund intends to distribute all or substantially all of its net realized capital gains. Distributions are recorded on theex-dividend date. Distributions to shareholders are determined in accordance with income tax regulations, which may differ from U.S. GAAP. As required by U.S. GAAP, only distributions in excess of tax basis earnings and profits are reported in the financial statements as a return of capital. Permanent differences between book and tax accounting relating to distributions are reclassified topaid-in capital. For tax purposes, distributions from short-term capital gains are considered to be from ordinary income. Distributions in any year may include a substantial return of capital component.
The tax character of distributions declared for the years ended December 31, 2019 and December 31, 2018 was as follows:
| | | | | | | | |
| | | Year Ended December 31, | |
| | | 2019 | | | 2018 | |
| | |
Ordinary income | | $ | 15,214,720 | | | $ | 13,759,731 | |
| | |
Long-term capital gains | | $ | 9,585,441 | | | $ | 58,960,672 | |
| | |
Tax return of capital | | $ | 68,948,455 | | | $ | 44,306,251 | |
During the year ended December 31, 2019, distributable earnings was decreased by $27,937 andpaid-in capital was increased by $27,937 due to differences between book and tax accounting. These reclassifications had no effect on the net assets or net asset value per share of the Fund.
As of December 31, 2019, the components of distributable earnings (accumulated loss) on a tax basis were as follows:
| | | | |
| | |
Late year ordinary losses | | $ | (43,607 | ) |
| |
Post October capital losses | | $ | (2,434,278 | ) |
| |
Net unrealized appreciation | | $ | 738,380,555 | |
At December 31, 2019, the Fund had a late year ordinary loss of $43,607, related to certain specified losses realized after October 31, 2019, which it has elected to defer to the following taxable year pursuant to income tax regulations.
At December 31, 2019, the Fund had a net capital loss of $2,434,278 attributable to security transactions incurred after October 31, 2019 that it has elected to defer. This net capital loss is treated as arising on the first day of the Fund’s taxable year ending December 31, 2020.
Eaton Vance
Tax-Managed Global Buy-Write Opportunities Fund
December 31, 2019
Notes to Financial Statements — continued
The cost and unrealized appreciation (depreciation) of investments, including open derivative contracts, of the Fund at December 31, 2019, as determined on a federal income tax basis, were as follows:
| | | | |
| |
Aggregate cost | | $ | 397,265,236 | |
| |
Gross unrealized appreciation | | $ | 738,641,827 | |
| |
Gross unrealized depreciation | | | (229,316 | ) |
| |
Net unrealized appreciation | | $ | 738,412,511 | |
3 Investment Adviser Fee and Other Transactions with Affiliates
The investment adviser fee is earned by Eaton Vance Management (EVM) as compensation for management and investment advisory services rendered to the Fund. The fee is computed at an annual rate of 1.00% of the Fund’s average daily gross assets and is payable monthly. Gross assets as referred to herein represent net assets plus obligations attributable to investment leverage, if any. For the year ended December 31, 2019, the Fund’s investment adviser fee amounted to $10,947,540. Pursuant to asub-advisory agreement, EVM has delegated a portion of the investment management to Parametric Portfolio Associates LLC (Parametric), a wholly-owned indirect subsidiary of Eaton Vance Corp. EVM pays Parametric a portion of its investment adviser fee forsub-advisory services provided to the Fund. EVM also serves as administrator of the Fund, but receives no compensation.
Trustees and officers of the Fund who are members of EVM’s organization receive remuneration for their services to the Fund out of the investment adviser fee. Trustees of the Fund who are not affiliated with EVM may elect to defer receipt of all or a percentage of their annual fees in accordance with the terms of the Trustees Deferred Compensation Plan. For the year ended December 31, 2019, no significant amounts have been deferred. Certain officers and Trustees of the Fund are officers of EVM.
4 Purchases and Sales of Investments
Purchases and sales of investments, other than short-term obligations, aggregated $25,476,296 and $198,043,087, respectively, for the year ended December 31, 2019.
5 Common Shares of Beneficial Interest and Shelf Offering
The Fund may issue common shares pursuant to its dividend reinvestment plan. There were no common shares issued by the Fund for the year ended December 31, 2019. Common shares issued by the Fund pursuant to its dividend reinvestment plan for the year ended December 31, 2018 were 313,657.
In August 2012, the Board of Trustees initially approved a share repurchase program for the Fund. Pursuant to the reauthorization of the share repurchase program by the Board of Trustees in March 2019, the Fund is authorized to repurchase up to 10% of its common shares outstanding as of the last day of the prior calendar year at market prices when shares are trading at a discount to net asset value. The share repurchase program does not obligate the Fund to purchase a specific amount of shares. There were no repurchases of common shares by the Fund for the years ended December 31, 2019 and December 31, 2018.
Pursuant to a registration statement filed with and declared effective on April 12, 2018 by the SEC, the Fund is authorized to issue up to an additional 12,811,820 common shares through an equity shelf offering program (the “shelf offering”). Under the shelf offering, the Fund, subject to market conditions, may raise additional capital from time to time and in varying amounts and offering methods at a net price at or above the Fund’s net asset value per common share.
During the year ended December 31, 2019, there were no common shares sold by the Fund pursuant to its shelf offering. During the year ended December 31, 2018, the Fund sold 435,555 common shares and received proceeds (net of offering costs) of $5,016,377 through its shelf offering. The net proceeds in excess of the net asset value of the shares sold were $96,719. Offering costs (other than the applicable sales commissions) incurred in connection with the shelf offering were borne directly by EVM.
6 Financial Instruments
The Fund may trade in financial instruments withoff-balance sheet risk in the normal course of its investing activities. These financial instruments may include written options and may involve, to a varying degree, elements of risk in excess of the amounts recognized for financial statement purposes. The notional or contractual amounts of these instruments represent the investment the Fund has in particular classes of financial instruments and do not necessarily represent the amounts potentially subject to risk. The measurement of the risks associated with these instruments is meaningful only when all
Eaton Vance
Tax-Managed Global Buy-Write Opportunities Fund
December 31, 2019
Notes to Financial Statements — continued
related and offsetting transactions are considered. A summary of obligations under these financial instruments at December 31, 2019 is included in the Portfolio of Investments. At December 31, 2019, the Fund had sufficient cash and/or securities to cover commitments under these contracts.
The Fund is subject to equity price risk in the normal course of pursuing its investment objectives. The Fund writes index call options above the current value of the index to generate premium income. In writing index call options, the Fund in effect, sells potential appreciation in the value of the applicable index above the exercise price in exchange for the option premium received. The Fund retains the risk of loss, minus the premium received, should the value of the underlying index decline.
The fair value of open derivative instruments (not considered to be hedging instruments for accounting disclosure purposes) and whose primary underlying risk exposure is equity price risk at December 31, 2019 was as follows:
| | | | | | | | |
| | | Fair Value | |
| Derivative | | Asset Derivative | | | Liability Derivative(1) | |
| | |
Written options | | $ | — | | | $ | (16,966,960 | ) |
| (1) | Statement of Assets and Liabilities location: Written options outstanding, at value. |
The effect of derivative instruments (not considered to be hedging instruments for accounting disclosure purposes) on the Statement of Operations and whose primary underlying risk exposure is equity price risk for the year ended December 31, 2019 was as follows:
| | | | | | | | |
| Derivative | | Realized Gain (Loss) on Derivatives Recognized in Income(1) | | | Change in Unrealized Appreciation (Depreciation) on Derivatives Recognized in Income(2) | |
| | |
Written options | | $ | (99,746,534 | ) | | $ | (7,891,900 | ) |
| (1) | Statement of Operations location: Net realized gain (loss) – Written options. |
| (2) | Statement of Operations location: Change in unrealized appreciation (depreciation) – Written options. |
The average number of written options contracts outstanding during the year ended December 31, 2019, which is indicative of the volume of this derivative type, was 9,214 contracts.
7 Risks Associated with Foreign Investments
Investing in securities issued by companies whose principal business activities are outside the United States may involve significant risks not present in domestic investments. For example, there is generally less publicly available information about foreign companies, particularly those not subject to the disclosure and reporting requirements of the U.S. securities laws. Certain foreign issuers are generally not bound by uniform accounting, auditing, and financial reporting requirements and standards of practice comparable to those applicable to domestic issuers. Investments in foreign securities also involve the risk of possible adverse changes in investment or exchange control regulations, expropriation or confiscatory taxation, limitation on the removal of funds or other assets of the Fund, political or financial instability or diplomatic and other developments which could affect such investments. Foreign securities markets, while growing in volume and sophistication, are generally not as developed as those in the United States, and securities of some foreign issuers (particularly those located in developing countries) may be less liquid and more volatile than securities of comparable U.S. companies. In general, there is less overall governmental supervision and regulation of foreign securities markets, broker/dealers and issuers than in the United States.
8 Fair Value Measurements
Under generally accepted accounting principles for fair value measurements, a three-tier hierarchy to prioritize the assumptions, referred to as inputs, is used in valuation techniques to measure fair value. The three-tier hierarchy of inputs is summarized in the three broad levels listed below.
| • | | Level 1 – quoted prices in active markets for identical investments |
| • | | Level 2 – other significant observable inputs (including quoted prices for similar investments, interest rates, prepayment speeds, credit risk, etc.) |
| • | | Level 3 – significant unobservable inputs (including a fund’s own assumptions in determining the fair value of investments) |
In cases where the inputs used to measure fair value fall in different levels of the fair value hierarchy, the level disclosed is determined based on the lowest level input that is significant to the fair value measurement in its entirety. The inputs or methodology used for valuing securities are not necessarily an indication of the risk associated with investing in those securities.
Eaton Vance
Tax-Managed Global Buy-Write Opportunities Fund
December 31, 2019
Notes to Financial Statements — continued
At December 31, 2019, the hierarchy of inputs used in valuing the Fund’s investments and open derivative instruments, which are carried at value, were as follows:
| | | | | | | | | | | | | | | | |
| Asset Description | | Level 1 | | | Level 2 | | | Level 3 | | | Total | |
| | | | |
Common Stocks | | | | | | | | | | | | | | | | |
| | | | |
Communication Services | | $ | 106,574,469 | | | $ | 24,815,477 | | | $ | — | | | $ | 131,389,946 | |
| | | | |
Consumer Discretionary | | | 78,266,240 | | | | 70,000,949 | | | | — | | | | 148,267,189 | |
| | | | |
Consumer Staples | | | 37,068,734 | | | | 65,927,410 | | | | — | | | | 102,996,144 | |
| | | | |
Energy | | | 11,527,919 | | | | 28,824,565 | | | | — | | | | 40,352,484 | |
| | | | |
Financials | | | 56,594,741 | | | | 72,952,190 | | | | — | | | | 129,546,931 | |
| | | | |
Health Care | | | 74,000,611 | | | | 69,673,245 | | | | — | | | | 143,673,856 | |
| | | | |
Industrials | | | 46,206,656 | | | | 69,716,121 | | | | — | | | | 115,922,777 | |
| | | | |
Information Technology | | | 188,478,889 | | | | 46,565,412 | | | | — | | | | 235,044,301 | |
| | | | |
Materials | | | 9,733,645 | | | | 44,108,664 | | | | — | | | | 53,842,309 | |
| | | | |
Real Estate | | | 9,375,460 | | | | 4,433,895 | | | | — | | | | 13,809,355 | |
| | | | |
Utilities | | | 9,459,541 | | | | 12,957,907 | | | | — | | | | 22,417,448 | |
| | | | |
Total Common Stocks | | $ | 627,286,905 | | | $ | 509,975,835 | * | | $ | — | | | $ | 1,137,262,740 | |
| | | | |
Total Investments | | $ | 627,286,905 | | | $ | 509,975,835 | | | $ | — | | | $ | 1,137,262,740 | |
| | | | |
Liability Description | | | | | | | | | | | | | | | | |
| | | | |
Written Call Options | | $ | (12,686,705 | ) | | $ | (4,280,255 | ) | | $ | — | | | $ | (16,966,960 | ) |
| | | | |
Total | | $ | (12,686,705 | ) | | $ | (4,280,255 | ) | | $ | — | | | $ | (16,966,960 | ) |
| * | Includes foreign equity securities whose values were adjusted to reflect market trading of comparable securities or other correlated instruments that occurred after the close of trading in their applicable foreign markets. |
9 Legal Proceedings
In November 2010, the Fund was named as defendant and a putative member of the proposed defendant class of shareholders in the case entitled Official Committee of Unsecured Creditors (UCC) of the Tribune Company v. FitzSimons, et al. as a result of its ownership of shares in the Tribune Company (Tribune) in 2007 when Tribune effected a leveraged buyout transaction (LBO) and was converted to a privately held company. The UCC, which has been replaced by a Litigation Trustee pursuant to Tribune’s plan of reorganization, seeks to recover payments of the proceeds of the LBO. In June 2011, a group of Tribune creditors filed multiple actions against former Tribune shareholders involving state law constructive fraudulent conveyance claims arising out of the LBO (the “SLFC actions”). The Fund has been named as a defendant in one of the SLFC actions filed in United States District Court — District of Massachusetts by Deutsche Bank Trust Co. Americas seeking to recover the proceeds received in connection with the LBO from former shareholders. The FitzSimons action and the SLFC actions are now part of a multi-district litigation proceeding in the Southern District of New York. The value of the proceeds received by the Fund is approximately $891,000 (equal to 0.08% of net assets at December 31, 2019). The Fund cannot predict the outcome of these proceedings or the effect, if any, on the Fund’s net asset value. The attorneys’ fees and costs related to these actions are expensed by the Fund as incurred.
Eaton Vance
Tax-Managed Global Buy-Write Opportunities Fund
December 31, 2019
Report of Independent Registered Public Accounting Firm
To the Trustees and Shareholders of Eaton VanceTax-Managed GlobalBuy-Write Opportunities Fund:
Opinion on the Financial Statements and Financial Highlights
We have audited the accompanying statement of assets and liabilities of Eaton VanceTax-Managed GlobalBuy-Write Opportunities Fund (the “Fund”), including the portfolio of investments, as of December 31, 2019, the related statement of operations for the year then ended, the statements of changes in net assets for each of the two years in the period then ended, the financial highlights for each of the five years in the period then ended, and the related notes. In our opinion, the financial statements and financial highlights present fairly, in all material respects, the financial position of the Fund as of December 31, 2019, and the results of its operations for the year then ended, the changes in its net assets for each of the two years in the period then ended, and the financial highlights for each of the five years in the period then ended, in conformity with accounting principles generally accepted in the United States of America.
Basis for Opinion
These financial statements and financial highlights are the responsibility of the Fund’s management. Our responsibility is to express an opinion on the Fund’s financial statements and financial highlights based on our audits. We are a public accounting firm registered with the Public Company Accounting Oversight Board (United States) (PCAOB) and are required to be independent with respect to the Fund in accordance with the U.S. federal securities laws and the applicable rules and regulations of the Securities and Exchange Commission and the PCAOB.
We conducted our audits in accordance with the standards of the PCAOB. Those standards require that we plan and perform the audit to obtain reasonable assurance about whether the financial statements and financial highlights are free of material misstatement, whether due to error or fraud. The Fund is not required to have, nor were we engaged to perform, an audit of its internal control over financial reporting. As part of our audits we are required to obtain an understanding of internal control over financial reporting but not for the purpose of expressing an opinion on the effectiveness of the Fund’s internal control over financial reporting. Accordingly, we express no such opinion.
Our audits included performing procedures to assess the risks of material misstatement of the financial statements and financial highlights, whether due to error or fraud, and performing procedures that respond to those risks. Such procedures included examining, on a test basis, evidence regarding the amounts and disclosures in the financial statements and financial highlights. Our audits also included evaluating the accounting principles used and significant estimates made by management, as well as evaluating the overall presentation of the financial statements and financial highlights. Our procedures included confirmation of securities owned as of December 31, 2019, by correspondence with the custodian and brokers; when replies were not received from brokers, we performed other auditing procedures. We believe that our audits provide a reasonable basis for our opinion.
/s/ Deloitte & Touche LLP
Boston, Massachusetts
February 18, 2020
We have served as the auditor of one or more Eaton Vance investment companies since 1959.
Eaton Vance
Tax-Managed Global Buy-Write Opportunities Fund
December 31, 2019
Federal Tax Information (Unaudited)
The Form1099-DIV you received in February 2020 showed the tax status of all distributions paid to your account in calendar year 2019. Shareholders are advised to consult their own tax adviser with respect to the tax consequences of their investment in the Fund. As required by the Internal Revenue Code and/or regulations, shareholders must be notified regarding the status of qualified dividend income for individuals, the dividends received deduction for corporations and capital gains dividends.
Qualified Dividend Income. For the fiscal year ended December 31, 2019, the Fund designates approximately $27,478,010, or up to the maximum amount of such dividends allowable pursuant to the Internal Revenue Code, as qualified dividend income eligible for the reduced tax rate of 15%.
Dividends Received Deduction. Corporate shareholders are generally entitled to take the dividends received deduction on the portion of the Fund’s dividend distribution that qualifies under tax law. For the Fund’s fiscal 2019 ordinary income dividends, 63.12% qualifies for the corporate dividends received deduction.
Capital Gains Dividends. The Fund hereby designates as a capital gain dividend with respect to the taxable year ended December 31, 2019, $9,585,441 or, if subsequently determined to be different, the net capital gain of such year.
Eaton Vance
Tax-Managed Global Buy-Write Opportunities Fund
December 31, 2019
Dividend Reinvestment Plan
The Fund offers a dividend reinvestment plan (Plan) pursuant to which shareholders may elect to have distributions automatically reinvested in common shares (Shares) of the Fund. You may elect to participate in the Plan by completing the Dividend Reinvestment Plan Application Form. If you do not participate, you will receive all distributions in cash paid by check mailed directly to you by American Stock Transfer & Trust Company, LLC (AST) as dividend paying agent. On the distribution payment date, if the NAV per Share is equal to or less than the market price per Share plus estimated brokerage commissions, then new Shares will be issued. The number of Shares shall be determined by the greater of the NAV per Share or 95% of the market price. Otherwise, Shares generally will be purchased on the open market by AST, the Plan agent (Agent). Distributions subject to income tax (if any) are taxable whether or not Shares are reinvested.
If your Shares are in the name of a brokerage firm, bank, or other nominee, you can ask the firm or nominee to participate in the Plan on your behalf. If the nominee does not offer the Plan, you will need to request that the Fund’s transfer agentre-register your Shares in your name or you will not be able to participate.
The Agent’s service fee for handling distributions will be paid by the Fund. Plan participants will be charged their pro rata share of brokerage commissions on all open-market purchases.
Plan participants may withdraw from the Plan at any time by writing to the Agent at the address noted on the following page. If you withdraw, you will receive Shares in your name for all Shares credited to your account under the Plan. If a participant elects by written notice to the Agent to sell part or all of his or her Shares and remit the proceeds, the Agent is authorized to deduct a $5.00 fee plus brokerage commissions from the proceeds.
If you wish to participate in the Plan and your Shares are held in your own name, you may complete the form on the following page and deliver it to the Agent. Any inquiries regarding the Plan can be directed to the Agent at1-866-439-6787.
Eaton Vance
Tax-Managed Global Buy-Write Opportunities Fund
December 31, 2019
Application for Participation in Dividend Reinvestment Plan
This form is for shareholders who hold their common shares in their own names. If your common shares are held in the name of a brokerage firm, bank, or other nominee, you should contact your nominee to see if it will participate in the Plan on your behalf. If you wish to participate in the Plan, but your brokerage firm, bank, or nominee is unable to participate on your behalf, you should request that your common shares bere-registered in your own name which will enable your participation in the Plan.
The following authorization and appointment is given with the understanding that I may terminate it at any time by terminating my participation in the Plan as provided in the terms and conditions of the Plan.
Please print exact name on account
Shareholder signature Date
Shareholder signature Date
Please sign exactly as your common shares are registered. All persons whose names appear on the share certificate must sign.
YOU SHOULD NOT RETURN THIS FORM IF YOU WISH TO RECEIVE YOUR DISTRIBUTIONS IN CASH. THIS IS NOT A PROXY.
This authorization form, when signed, should be mailed to the following address:
Eaton VanceTax-Managed GlobalBuy-Write Opportunities Fund
c/o American Stock Transfer & Trust Company, LLC
P.O. Box 922
Wall Street Station
New York, NY 10269-0560
Eaton Vance
Tax-Managed Global Buy-Write Opportunities Fund
December 31, 2019
Management and Organization
Fund Management. The Trustees of Eaton VanceTax-Managed GlobalBuy-Write Opportunities Fund (the Fund) are responsible for the overall management and supervision of the Fund’s affairs. The Trustees and officers of the Fund are listed below. Except as indicated, each individual has held the office shown or other offices in the same company for the last five years. The “noninterested Trustees” consist of those Trustees who are not “interested persons” of the Fund, as that term is defined under the 1940 Act. The business address of each Trustee and officer is Two International Place, Boston, Massachusetts 02110. As used below, “EVC” refers to Eaton Vance Corp., “EV” refers to Eaton Vance, Inc., “EVM” refers to Eaton Vance Management, “BMR” refers to Boston Management and Research and “EVD” refers to Eaton Vance Distributors, Inc. EVC and EV are the corporate parent and trustee, respectively, of EVM and BMR. EVD is a wholly-owned subsidiary of EVC. Each officer affiliated with Eaton Vance may hold a position with other Eaton Vance affiliates that is comparable to his or her position with EVM listed below. Each Trustee oversees 159 portfolios in the Eaton Vance Complex (including all master and feeder funds in a master feeder structure). Each officer serves as an officer of certain other Eaton Vance funds.
| | | | | | |
| Name and Year of Birth | | Position(s) with the Fund | | Term Expiring; Trustee Since(1) | | Principal Occupation(s) and Directorships During Past Five Years and Other Relevant Experience |
|
| Interested Trustee |
| | | |
Thomas E. Faust Jr. 1958 | | Class I Trustee | | Until 2021. Trustee since 2007. | | Chairman, Chief Executive Officer and President of EVC, Director and President of EV, Chief Executive Officer and President of EVM and BMR, and Director of EVD. Trustee and/or officer of 159 registered investment companies. Mr. Faust is an interested person because of his positions with EVM, BMR, EVD, EVC and EV, which are affiliates of the Fund. Directorships in the Last Five Years. Director of EVC and Hexavest Inc. (investment management firm). |
|
| Noninterested Trustees |
| | | |
Mark R. Fetting 1954 | | Class III Trustee | | Until 2020. Trustee since 2016 | | Private investor. Formerly held various positions at Legg Mason, Inc. (investment management firm) (2000-2012), including President, Chief Executive Officer, Director and Chairman (2008-2012), Senior Executive Vice President
(2004-2008) and Executive Vice President (2001-2004). Formerly, President of Legg Mason family of funds (2001-2008). Formerly, Division President and Senior Officer of Prudential Financial Group, Inc. and related companies (investment management firm) (1991-2000). Other Directorships in the Last Five Years. None. |
| | | |
Cynthia E. Frost 1961 | | Class I Trustee | | Until 2021. Trustee since 2014. | | Private investor. Formerly, Chief Investment Officer of Brown University (university endowment) (2000-2012). Formerly, Portfolio Strategist for Duke Management Company (university endowment manager) (1995-2000). Formerly, Managing Director, Cambridge Associates (investment consulting company) (1989-1995). Formerly, Consultant, Bain and Company (management consulting firm)(1987-1989). Formerly, Senior Equity Analyst, BA Investment Management Company (1983-1985). Other Directorships in the Last Five Years. None. |
| | | |
George J. Gorman 1952 | | Class II Trustee | | Until 2022. Trustee since 2014. | | Principal at George J. Gorman LLC (consulting firm). Formerly, Senior Partner at Ernst & Young LLP (a registered public accounting firm) (1974-2009). Other Directorships in the Last Five Years. Formerly, Trustee of the BofA Funds Series Trust (11 funds) (2011-2014) and of the Ashmore Funds (9 funds)(2010-2014). |
| | | |
Valerie A. Mosley 1960 | | Class III Trustee | | Until 2020. Trustee since 2014. | | Chairwoman and Chief Executive Officer of Valmo Ventures (a consulting and investment firm). Former Partner and Senior Vice President, Portfolio Manager and Investment Strategist at Wellington Management Company, LLP (investment management firm) (1992-2012). Former Chief Investment Officer, PG Corbin Asset Management (1990-1992). Formerly worked in institutional corporate bond sales at Kidder Peabody (1986-1990). Other Directorships in the Last Five Years. Director of Envestnet, Inc. (provider of intelligent systems for wealth management and financial wellness) (since 2018). Director of Dynex Capital, Inc. (mortgage REIT) (since 2013). |
Eaton Vance
Tax-Managed Global Buy-Write Opportunities Fund
December 31, 2019
Management and Organization — continued
| | | | | | |
| Name and Year of Birth | | Position(s) with the Fund | | Term Expiring; Trustee Since(1) | | Principal Occupation(s) and Directorships During Past Five Years and Other Relevant Experience |
|
| Noninterested Trustees (continued) |
| | | |
William H. Park 1947 | | Chairperson of the Board and Class II Trustee | | Until 2022. Chairperson of the Board since 2016 and Trustee since 2003. | | Private investor. Formerly, Consultant (management and transactional)
(2012-2014). Formerly, Chief Financial Officer, Aveon Group L.P. (investment management firm) (2010-2011). Formerly, Vice Chairman, Commercial Industrial Finance Corp. (specialty finance company) (2006-2010). Formerly, President and Chief Executive Officer, Prizm Capital Management, LLC (investment management firm)(2002-2005). Formerly, Executive Vice President and Chief Financial Officer, United Asset Management Corporation (investment management firm) (1982-2001). Formerly, Senior Manager, Price Waterhouse (now PricewaterhouseCoopers) (a registered public accounting firm) (1972-1981). Other Directorships in the Last Five Years. None. |
| | | |
Helen Frame Peters 1948 | | Class III Trustee | | Until 2020. Trustee since 2008. | | Professor of Finance, Carroll School of Management, Boston College. Formerly, Dean, Carroll School of Management, Boston College (2000-2002). Formerly, Chief Investment Officer, Fixed Income, Scudder Kemper Investments (investment management firm) (1998-1999). Formerly, Chief Investment Officer, Equity and Fixed Income, Colonial Management Associates (investment management firm) (1991-1998). Other Directorships in the Last Five Years. None. |
| | | |
Keith Quinton 1958 | | Class II Trustee | | Until 2022. Trustee since 2018. | | Independent Investment Committee Member at New Hampshire Retirement System (since 2017). Advisory Committee member at Northfield Information Services, Inc. (risk management analytics provider) (since 2016). Formerly, Portfolio Manager and Senior Quantitative Analyst at Fidelity Investments (investment management firm) (2001-2014). Other Directorships in the Last Five Years. Director of New Hampshire Municipal Bond Bank (since 2016). |
| | | |
Marcus L. Smith 1966 | | Class III Trustee | | Until 2020. Trustee since 2018. | | Member of Posse Boston Advisory Board (foundation) (since 2015). Trustee at University of Mount Union (since 2008). Formerly, Portfolio Manager at MFS Investment Management (investment management firm) (1994-2017). Other Directorships in the Last Five Years. Director of MSCI Inc. (global provider of investment decision support tools) (since 2017). Formerly, Director of DCT Industrial Trust Inc. (logistics real estate company) (2017-2018). |
| | | |
Susan J. Sutherland 1957 | | Class II Trustee | | Until 2022. Trustee since 2015. | | Private investor. Formerly, Associate, Counsel and Partner at Skadden, Arps, Slate, Meagher & Flom LLP (law firm) (1982-2013). Other Directorships in the Last Five Years. Formerly, Director of Montpelier Re Holdings Ltd. (global provider of customized insurance and reinsurance products) (2013-2015). |
| | | |
Scott E. Wennerholm 1959 | | Class I Trustee | | Until 2021. Trustee since 2016. | | Formerly, Trustee at Wheelock College (postsecondary institution) (2012-2018). Formerly, Consultant at GF Parish Group (executive recruiting firm) (2016-2017). Formerly, Chief Operating Officer and Executive Vice President at BNY Mellon Asset Management (investment management firm) (2005-2011). Formerly, Chief Operating Officer and Chief Financial Officer at Natixis Global Asset Management (investment management firm) (1997-2004). Formerly, Vice President at Fidelity Investments Institutional Services (investment management firm) (1994-1997). Other Directorships in the Last Five Years. None. |
| | | |
| Name and Year of Birth | | Position(s) with the Fund | | Officer Since(2) | | Principal Occupation(s) During Past Five Years |
|
| Principal Officers who are not Trustees |
| | | |
Edward J. Perkin 1972 | | President | | 2014 | | Vice President and Chief Equity Investment Officer of EVM and BMR. Also Vice President of Calvert Research and Management (“CRM”) since 2016. |
| | | |
Maureen A. Gemma 1960 | | Vice President, Secretary and Chief Legal Officer | | 2005 | | Vice President of EVM and BMR. Also Vice President of CRM. |
Eaton Vance
Tax-Managed Global Buy-Write Opportunities Fund
December 31, 2019
Management and Organization — continued
| | | | | | |
| | | |
| Name and Year of Birth | | Position(s) with the Fund | | Officer Since(2) | | Principal Occupation(s) During Past Five Years |
|
| Principal Officers who are not Trustees (continued) |
| | | |
James F. Kirchner 1967 | | Treasurer | | 2007 | | Vice President of EVM and BMR. Also Vice President of CRM. |
| | | |
Richard F. Froio 1968 | | Chief Compliance Officer | | 2017 | | Vice President of EVM and BMR since 2017. Formerly Deputy Chief Compliance Officer (Adviser/Funds) and Chief Compliance Officer (Distribution) at PIMCO (2012-2017) and Managing Director at BlackRock/Barclays Global Investors (2009-2012). |
| (1) | Year first appointed to serve as Trustee for a fund in the Eaton Vance family of funds. Each Trustee has served continuously since appointment unless indicated otherwise. Each Trustee holds office until the annual meeting for the year in which his or her term expires and until his or her successor is elected and qualified, subject to a prior death, resignation, retirement, disqualification or removal. |
| (2) | Year first elected to serve as officer of a fund in the Eaton Vance family of funds when the officer has served continuously. Otherwise, year of most recent election as an officer of a fund in the Eaton Vance family of funds. Titles may have changed since initial election. Each officer serves until his or her successor is elected. |
Eaton Vance Funds
IMPORTANT NOTICES
Privacy. The Eaton Vance organization is committed to ensuring your financial privacy. Each entity listed below has adopted a privacy policy and procedures (“Privacy Program”) Eaton Vance believes is reasonably designed to protect your personal information and to govern when and with whom Eaton Vance may share your personal information.
| • | | At the time of opening an account, Eaton Vance generally requires you to provide us with certain information such as name, address, social security number, tax status, account numbers, and account balances. This information is necessary for us to both open an account for you and to allow us to satisfy legal requirements such as applicable anti-money laundering reviews and know-your-customer requirements. |
| • | | On an ongoing basis, in the normal course of servicing your account, Eaton Vance may share your information with unaffiliated third parties that perform various services for Eaton Vance and/or your account. These third parties include transfer agents, custodians, broker/dealers and our professional advisers, including auditors, accountants, and legal counsel. Eaton Vance may additionally share your personal information with our affiliates. |
| • | | We believe our Privacy Program is reasonably designed to protect the confidentiality of your personal information and to prevent unauthorized access to that information. |
| • | | We reserve the right to change our Privacy Program at any time upon proper notification to you. You may want to review our Privacy Program periodically for changes by accessing the link on our homepage: www.eatonvance.com. |
Our pledge of protecting your personal information applies to the following entities within the Eaton Vance organization: the Eaton Vance Family of Funds, Eaton Vance Management, Eaton Vance Investment Counsel, Eaton Vance Distributors, Inc., Eaton Vance Trust Company, Eaton Vance Management (International) Limited, Eaton Vance Advisers International Limited, Eaton Vance Global Advisors Limited, Eaton Vance Management’s Real Estate Investment Group, Boston Management and Research, Calvert Research and Management, and Calvert Funds. This Privacy Notice supersedes all previously issued privacy disclosures. For more information about our Privacy Program or about how your personal information may be used, please call1-800-262-1122.
Delivery of Shareholder Documents. The Securities and Exchange Commission (SEC) permits funds to deliver only one copy of shareholder documents, including prospectuses, proxy statements and shareholder reports, to fund investors with multiple accounts at the same residential or post office box address. This practice is often called “householding” and it helps eliminate duplicate mailings to shareholders. American Stock Transfer & Trust Company, LLC (“AST”), theclosed-end funds transfer agent, or your financial intermediary, may household the mailing of your documents indefinitely unless you instruct AST, or your financial intermediary, otherwise. If you would prefer that your Eaton Vance documents not be householded, please contact AST or your financial intermediary. Your instructions that householding not apply to delivery of your Eaton Vance documents will typically be effective within 30 days of receipt by AST or your financial intermediary.
Portfolio Holdings. Each Eaton Vance Fund and its underlying Portfolio(s) (if applicable) files a schedule of portfolio holdings on Part F toForm N-PORT with the SEC for the first and third quarters of each fiscal year. The FormN-PORT will be available on the Eaton Vance website at www.eatonvance.com, by calling Eaton Vance at1-800-262-1122 or in the EDGAR database on the SEC’s website at www.sec.gov.
Proxy Voting. From time to time, funds are required to vote proxies related to the securities held by the funds. The Eaton Vance Funds or their underlying Portfolios (if applicable) vote proxies according to a set of policies and procedures approved by the Funds’ and Portfolios’ Boards. You may obtain a description of these policies and procedures and information on how the Funds or Portfolios voted proxies relating to portfolio securities during the most recent12-month period ended June 30, without charge, upon request, by calling1-800-262-1122 and by accessing the SEC’s website at www.sec.gov.
Share Repurchase Program. The Fund’s Board of Trustees has approved a share repurchase program authorizing the Fund to repurchase up to 10% of its common shares outstanding as of the last day of the prior calendar year in open-market transactions at a discount to net asset value. The repurchase program does not obligate the Fund to purchase a specific amount of shares. The Fund’s repurchase activity, including the number of shares purchased, average price and average discount to net asset value, is disclosed in the Fund’s annual and semi-annual reports to shareholders.
Additional Notice to Shareholders. If applicable, a Fund may also redeem or purchase its outstanding preferred shares in order to maintain compliance with regulatory requirements, borrowing or rating agency requirements or for other purposes as it deems appropriate or necessary.
Closed-End Fund Information. Eaton Vanceclosed-end funds make fund performance data and certain information about portfolio characteristics available on the Eaton Vance website shortly after the end of each month. Other information about the funds is available on the website. The funds’ net asset value per share is readily accessible on the Eaton Vance website. Portfolio holdings for the most recentmonth-end are also posted to the website approximately 30 days following the end of the month. This information is available at www.eatonvance.com on the fund information pages under “Individual Investors —Closed-End Funds”.
This Page Intentionally Left Blank
This Page Intentionally Left Blank
Investment Adviser and Administrator
Eaton Vance Management
Two International Place
Boston, MA 02110
InvestmentSub-Adviser
Parametric Portfolio Associates LLC
800 Fifth Avenue, Suite 2800
Seattle, WA 98104
Custodian
State Street Bank and Trust Company
State Street Financial Center, One Lincoln Street
Boston, MA 02111
Transfer Agent
American Stock Transfer & Trust Company, LLC
6201 15th Avenue
Brooklyn, NY 11219
Independent Registered Public Accounting Firm
Deloitte & Touche LLP
200 Berkeley Street
Boston, MA 02116-5022
Fund Offices
Two International Place
Boston, MA 02110

2552 12.31.19
Item 2. Code of Ethics
The registrant has adopted a code of ethics applicable to its Principal Executive Officer, Principal Financial Officer and Principal Accounting Officer. The registrant undertakes to provide a copy of such code of ethics to any person upon request, without charge, by calling1-800-262-1122. The registrant has not amended the code of ethics as described in FormN-CSR during the period covered by this report. The registrant has not granted any waiver, including an implicit waiver, from a provision of the code of ethics as described in FormN-CSR during the period covered by this report.
Item 3. Audit Committee Financial Expert
The registrant’s Board has designated George J. Gorman and William H. Park, each an independent trustee, as audit committee financial experts. Mr. Gorman is a certified public accountant who is the Principal at George J. Gorman LLC (a consulting firm). Previously, Mr. Gorman served in various capacities at Ernst & Young LLP (a registered public accounting firm), including as Senior Partner. Mr. Gorman also has experience serving as an independent trustee and audit committee financial expert of other mutual fund complexes. Mr. Park is a certified public accountant who is a private investor. Previously, he served as a consultant, as the Chief Financial Officer of Aveon Group, L.P. (an investment management firm), as the Vice Chairman of Commercial Industrial Finance Corp. (specialty finance company), as President and Chief Executive Officer of Prizm Capital Management, LLC (investment management firm), as Executive Vice President and Chief Financial Officer of United Asset Management Corporation (an institutional investment management firm) and as a Senior Manager at Price Waterhouse (now PricewaterhouseCoopers) (a registered public accounting firm).
Item 4. Principal Accountant Fees and Services
(a) –(d)
The following table presents the aggregate fees billed to the registrant for the registrant’s fiscal years ended December 31, 2018 and December 31, 2019 by the registrant’s principal accountant, Deloitte & Touche LLP (“D&T”), for professional services rendered for the audit of the registrant’s annual financial statements and fees billed for other services rendered by D&T during such periods.
| | | | | | | | |
Fiscal Years Ended | | 12/31/18 | | | 12/31/19 | |
Audit Fees | | $ | 56,550 | | | $ | 57,450 | |
Audit-Related Fees(1) | | $ | 0 | | | $ | 0 | |
Tax Fees(2) | | $ | 12,994 | | | $ | 11,066 | |
All Other Fees(3) | | $ | 0 | | | $ | 0 | |
| | | | | | | | |
Total | | $ | 69,544 | | | $ | 68,516 | |
| | | | | | | | |
| (1) | Audit-related fees consist of the aggregate fees billed for assurance and related services that are reasonably related to the performance of the audit of financial statements and are not reported under the category of audit fees. |
| (2) | Tax fees consist of the aggregate fees billed for professional services rendered by the principal accountant relating to tax compliance, tax advice, and tax planning and specifically include fees for tax return preparation and other related tax compliance/planning matters. |
| (3) | All other fees consist of the aggregate fees billed for products and services provided by the principal accountant other than audit, audit-related, and tax services. |
(e)(1) The registrant’s audit committee has adopted policies and procedures relating to thepre-approval of services provided by the registrant’s principal accountant (the“Pre-Approval Policies”). ThePre-Approval Policies establish a framework intended to assist the audit committee in the proper discharge of itspre-approval responsibilities. As a general matter, thePre-Approval Policies (i) specify certain types of audit, audit-related, tax, and other services determined to bepre-approved by the audit committee; and (ii) delineate specific procedures governing the mechanics of thepre-approval process, including the approval and monitoring of audit andnon-audit service fees. Unless a service is specificallypre-approved under thePre-Approval Policies, it must be separatelypre-approved by the audit committee.
ThePre-Approval Policies and the types of audit andnon-audit servicespre-approved therein must be reviewed and ratified by the registrant’s audit committee at least annually. The registrant’s audit committee maintains full responsibility for the appointment, compensation, and oversight of the work of the registrant’s principal accountant.
(e)(2) No services described in paragraphs (b)-(d) above were approved by the registrant’s audit committee pursuant to the “de minimis exception” set forth in Rule2-01(c)(7)(i)(C) of RegulationS-X.
(f) Not applicable.
(g)The following table presents (i) the aggregatenon-audit fees (i.e., fees for audit-related, tax, and other services) billed to the registrant by D&T for the registrant’s fiscal years ended December 31, 2018 and December 31, 2019; and (ii) the aggregatenon-audit fees (i.e., fees for audit-related, tax, and other services) billed to the Eaton Vance organization by D&T for the same time periods.
| | | | | | | | |
Fiscal Years Ended | | 12/31/18 | | | 12/31/19 | |
Registrant | | $ | 12,994 | | | $ | 11,066 | |
Eaton Vance(1) | | $ | 126,485 | | | $ | 59,903 | |
| (1) | The investment adviser to the registrant, as well as any of its affiliates that provide ongoing services to the registrant, are subsidiaries of Eaton Vance Corp. |
(h) The registrant’s audit committee has considered whether the provision by the registrant’s principal accountant ofnon-audit services to the registrant’s investment adviser and any entity controlling, controlled by, or under common control with the adviser that provides ongoing services to the registrant that were notpre-approved pursuant to Rule2-01(c)(7)(ii) of RegulationS-X is compatible with maintaining the principal accountant’s independence.
Item 5. Audit Committee of Listed Registrants
The registrant has a separately-designated standing audit committee established in accordance with Section 3(a)(58)(A) of the Securities and Exchange Act of 1934, as amended. George J. Gorman (Chair), William H. Park, Helen Frame Peters and Scott E. Wennerholm are the members of the registrant’s audit committee.
Item 6. Schedule of Investments
Please see schedule of investments contained in the Report to Stockholders included under Item 1 of this FormN-CSR.
Item 7. Disclosure of Proxy Voting Policies and Procedures forClosed-End Management Investment Companies
The Board of Trustees of the Trust has adopted a proxy voting policy and procedure (the “Fund Policy”), pursuant to which the Trustees have delegated proxy voting responsibility to the Fund’s investment adviser and adopted the investment adviser’s proxy voting policies and procedures (the “Policies”) which are described below. The Trustees will review the Fund’s proxy voting records from time to time and will annually consider the Policies for the upcoming year. In the event that a conflict of interest arises between the Fund’s shareholders and the investment adviser, the administrator, or any of their affiliates or any affiliate of the Fund, the investment adviser will generally refrain from voting the proxies related to the companies giving rise to such conflict until it consults with the Board, or any committee,sub-committee or group of Independent Trustees identified by the Board, which will instruct the investment adviser on the appropriate course of action. If the Board Members are unable to meet and the failure to vote a proxy would have a material adverse impact on the Fund, the investment adviser may vote such proxy, provided that it discloses the existence of the material conflict to the Chairperson of the Fund’s Board of Trustees as soon as practicable and to the Board of Trustees at its next meeting.
The Policies are designed to promote accountability of a company’s management to its shareholders and to align the interests of management with those shareholders. An independent proxy voting service (“Agent”), currently Institutional Shareholder Services, Inc., has been retained to assist in the voting of proxies through the provision of vote analysis, implementation and recordkeeping and disclosure services. The investment adviser will generally vote proxies through the Agent. The Agent is required to vote all proxies in accordance with customized proxy voting guidelines (the “Guidelines”) and/or refer them back to the investment adviser pursuant to the Policies.
The Agent is required to establish and maintain adequate internal controls and policies in connection with the provision of proxy voting services, including methods to reasonably ensure that its analysis and recommendations are not influenced by a conflict of interest. The Guidelines include voting guidelines for matters relating to, among other things, the election of directors, approval of independent auditors, executive compensation, corporate structure and anti-takeover defenses. The investment adviser may cause the Fund to abstain from voting from time to time where it determines that the costs associated with voting a proxy outweigh the benefits derived from exercising the right to vote or it is unable to access or access timely ballots or other proxy information, among other stated reasons. The Agent will refer Fund proxies to the investment adviser for instructions under circumstances where, among others: (1) the application of the Guidelines is unclear; (2) a particular proxy question is not covered by the Guidelines; or (3) the Guidelines require input from the investment adviser. When a proxy voting issue has been referred to the investment adviser, the analyst (or portfolio manager if applicable) covering the company subject to the proxy proposal determines the final vote (or decision not to vote) and the investment adviser’s Proxy Administrator (described below) instructs the Agent to vote accordingly for securities held by the Fund. Where more than one analyst covers a particular company and the recommendations of such analysts voting a proposal conflict, the investment adviser’s Global Proxy Group (described below) will review such recommendations and any other available information related to the proposal and determine the manner in which it should be voted, which may result in different recommendations for the Fund that may differ from other clients of the investment adviser.
The investment adviser has appointed a Proxy Administrator to assist in the coordination of the voting of client proxies (including the Fund’s) in accordance with the Guidelines and the Policies. The investment adviser and its affiliates have also established a Global Proxy Group. The Global Proxy Group develops the investment adviser’s positions on all major corporate issues, creates the Guidelines and oversees the proxy voting process. The Proxy Administrator maintains a record of all proxy questions that have been referred by the Agent, all applicable recommendations, analysis and research received and any resolution of the matter. Before instructing the Agent to vote contrary to the Guidelines or the recommendation of the Agent, the Proxy Administrator will provide the Global Proxy Group with the Agent’s recommendation for the proposal along with any other relevant materials, including the basis for the analyst’s recommendation. The Proxy Administrator will then
instruct the Agent to vote the proxy in the manner determined by the Global Proxy Group. A similar process will be followed if the Agent has a conflict of interest with respect to a proxy. The investment adviser will report to the Fund’s Board of Trustees any votes cast contrary to the Guidelines or Agent recommendations, as applicable, no less than annually.
The investment adviser’s Global Proxy Group is responsible for monitoring and resolving possible material conflicts with respect to proxy voting. Because the Guidelines are predetermined and designed to be in the best interests of shareholders, application of the Guidelines to vote client proxies should, in most cases, adequately address any possible conflict of interest. The investment adviser will monitor situations that may result in a conflict of interest between any of its clients and the investment adviser or any of its affiliates by maintaining a list of significant existing and prospective corporate clients. The Proxy Administrator will compare such list with the names of companies of which he or she has been referred a proxy statement (the “Proxy Companies”). If a company on the list is also a Proxy Company, the Proxy Administrator will report that fact to the Global Proxy Group. If the Proxy Administrator intends to instruct the Agent to vote in a manner inconsistent with the Guidelines, the Global Proxy Group will first determine, in consultation with legal counsel if necessary, whether a material conflict exists. If it is determined that a material conflict exists, the investment adviser will seek instruction on how the proxy should be voted from the Fund’s Board of Trustees, or any committee or subcommittee identified by the Board. If a matter is referred to the Global Proxy Group, the decision made and basis for the decision will be documented by the Proxy Administrator and/or Global Proxy Group.
Information on how the Fund voted proxies relating to portfolio securities during the most recent 12 month period ended June 30 is available (1) without charge, upon request, by calling1-800-262-1122, and (2) on the Securities and Exchange Commission’s website athttp://www.sec.gov.
Item 8. Portfolio Managers ofClosed-End Management Investment Companies
Eaton Vance Management (“EVM” or “Eaton Vance”) is the investment adviser of the Fund. EVM has engaged its affiliate, Parametric Portfolio Associates LLC (“Parametric”), as thesub-adviser of the Fund. Michael A. Allison and Thomas C. Seto comprise the investment team responsible for the overall andday-to-day management of the Fund’s investments.
Mr. Allison is a Vice President of EVM, is a member of EVM’s Equity Strategy Committee and has been a portfolio manager of the Fund since June 2015. Mr. Seto is Head of Investment Management at Parametric’s Seattle Investment Center and has been a portfolio manager of the Fund since April 2005. Messrs. Allison and Seto have managed other Eaton Vance portfolios for more than five years. This information is provided as of the date of filing this report.
The following table shows, as of the Fund’s most recent fiscal year end, the number of accounts each portfolio manager managed in each of the listed categories and the total assets (in millions of dollars) in the accounts managed within each category. The table also shows the number of accounts with respect to which the advisory fee is based on the performance of the account, if any, and the total assets (in millions of dollars) in those accounts.
| | | | | | | | | | | | | | | | |
| | | Number of
All
Accounts | | | Total Assets of
All
Accounts | | | Number of
Accounts
Paying a
Performance Fee | | | Total Assets
of Accounts
Paying a
Performance Fee | |
Michael A. Allison(1) | | | | | | | | | | | | | | | | |
Registered Investment Companies | | | 17 | | | $ | 37,711.9 | | | | 0 | | | $ | 0 | |
Other Pooled Investment Vehicles | | | 14 | | | $ | 25,769.3 | (3) | | | 0 | | | $ | 0 | |
Other Accounts | | | 1 | | | $ | 0.4 | | | | 0 | | | $ | 0 | |
| | | | |
Thomas C. Seto | | | | | | | | | | | | | | | | |
Registered Investment Companies | | | 39 | (2) | | $ | 27,039.8 | | | | 0 | | | $ | 0 | |
Other Pooled Investment Vehicles | | | 10 | | | $ | 2,496.9 | | | | 0 | | | $ | 0 | |
Other Accounts | | | 40,734 | | | $ | 134,475.6 | (4) | | | 0 | | | $ | 0 | |
| (1) | This portfolio manager serves as portfolio manager of one or more registered investment companies that invests or may invest in one or more underlying registered investment companies in the Eaton Vance family of funds or other pooled investment vehicles sponsored by Eaton Vance. The underlying investment companies may be managed by this portfolio manager or another portfolio manager. |
| (2) | This portfolio manager provides investment advice with respect to only a portion of the total assets of certain of these accounts. Only the assets allocated to this portfolio manager as of the Fund’s most recent fiscal year end are reflected in the table. |
| (3) | Certain of these “Other Pooled Investment Vehicles” invest a substantial portion of their assets either in a registered investment company in the Eaton Vance family of funds and/or in a separate pooled investment vehicle sponsored by Eaton Vance which may be managed by this portfolio manager or another portfolio manager. |
| (4) | For “Other Accounts” that are part of a wrap or model account program, the number of accounts is the number of sponsors for which the portfolio manager provides advisory services rather than the number of individual customer accounts within each wrap or model account program. |
The following table shows the dollar range of Fund shares beneficially owned by each portfolio manager as of the Fund’s most recent fiscal year end.
| | |
Portfolio Manager | | Dollar Range of Equity Securities
Beneficially Owned in the Fund |
Michael A. Allison | | $1 - $10,000 |
Thomas C. Seto | | None |
Potential for Conflicts of Interest. It is possible that conflicts of interest may arise in connection with a portfolio manager’s management of the Fund’s investments on the one hand and the investments of other accounts for which a portfolio manager is responsible on the other. For example, a portfolio manager may have conflicts of interest in allocating management time, resources and investment opportunities among the Fund and other accounts he advises. In addition, due to differences in the investment strategies or restrictions between the Fund and the other accounts, the portfolio manager may take action with respect to another account that differs from the action taken with respect to the Fund. In some cases, another account managed by a portfolio manager may compensate the investment adviser based on the performance of the securities held by that account. The existence of such a performance based fee may create additional conflicts of interest for the portfolio manager in the allocation of management time, resources and investment opportunities. Whenever conflicts of interest arise, the portfolio manager will endeavor to exercise his discretion in a manner that he believes is equitable to all interested persons. EVM has adopted several policies and procedures designed to address these potential conflicts including a code of ethics and policies that govern the investment adviser’s trading practices, including among other things the aggregation and allocation of trades among clients, brokerage allocations, cross trades and best execution.
Compensation Structure for EVM
Compensation of EVM’s portfolio managers and other investment professionals has the following primary components: (1) a base salary, (2) an annual cash bonus, (3) annualnon-cash compensation consisting of options to purchase shares of Eaton Vance Corp.’s (“EVC”) nonvoting common stock and/or restricted shares of EVC nonvoting common stock that generally are subject to a vesting schedule and (4) (for equity portfolio managers) a Deferred Alpha Incentive Plan, which pays a deferred cash award tied to future excess returns in certain equity strategy portfolios. EVM’s investment professionals also receive certain retirement, insurance and other benefits that are broadly available to EVM’s employees. Compensation of EVM’s investment professionals is reviewed primarily on an annual basis. Cash bonuses, stock-based compensation awards, and adjustments in base salary are typically paid or put into effect at or shortly after the October 31st fiscal year end of EVC.
Method to Determine Compensation. EVM compensates its portfolio managers based primarily on the scale and complexity of their portfolio responsibilities and the total return performance of managed funds and accounts versus the benchmark(s) stated in the prospectus, as well as an appropriate peer group (as described below). In addition to rankings within peer groups of funds on the basis of absolute performance, consideration may also be given to relative risk-adjusted performance. Risk-adjusted performance measures include, but are not limited to Sharpe Ratio, which uses standard deviation and excess return to determine reward per unit of risk. Performance is normally based on periods ending on the September 30th preceding fiscal year end. Fund performance is normally evaluated primarily versus peer groups of funds as determined by Lipper Inc. and/or Morningstar, Inc. When a fund’s peer group as determined by Lipper or Morningstar is deemed by EVM’s management not to provide a fair comparison, performance may instead be evaluated primarily against a custom peer group or market index. In evaluating the performance of a fund and its manager, primary emphasis is normally placed on three-year performance, with secondary consideration of performance over longer and shorter periods. For funds that aretax-managed or otherwise have an objective ofafter-tax returns, performance is measured net of taxes. For other funds, performance is evaluated on apre-tax basis. For funds with an investment objective other than total return (such as current income), consideration will also be given to the fund’s success in achieving its objective. For managers responsible for multiple funds and accounts, investment performance is evaluated on an aggregate basis, based on averages or weighted averages among managed funds and accounts. Funds and accounts that have performance-based advisory fees are not accorded disproportionate weightings in measuring aggregate portfolio manager performance. Pursuant to the Deferred Alpha Incentive Plan, a portion of the compensation payable to equity portfolio managers and investment professionals will be determined based on the ability of one or more accounts managed by such manager, that are not advised by Calvert Management and Research to achieve a specified target average annual gross return over a three year period in excess of the account benchmark. The cash award to be payable at the end of the three year term will be established at the inception of the term and will be adjusted positively or negatively to the extent that the average annual gross return varies from the specified target return.
The compensation of portfolio managers with other job responsibilities (such as heading an investment group or providing analytical support to other portfolios) will include consideration of the scope of such responsibilities and the managers’ performance in meeting them.
EVM seeks to compensate portfolio managers commensurate with their responsibilities and performance, and competitive with other firms within the investment management industry. EVM participates in investment-industry compensation surveys and utilizes survey data as a factor in determining salary, bonus and stock-based compensation levels for portfolio managers and other investment professionals. Salaries, bonuses and stock-based compensation are also influenced by the operating performance of EVM and its parent company. The overall annual cash bonus pool is generally based on a substantially fixed percentage ofpre-bonus adjusted operating income. While the salaries of EVM’s portfolio managers are comparatively fixed, cash bonuses and stock-based compensation may fluctuate significantly from year to year, based on changes in manager performance and other factors as described herein. For a high performing portfolio manager, cash bonuses and stock-based compensation may represent a substantial portion of total compensation.
Compensation Structure for Parametric
Compensation of Parametric portfolio managers and other investment professionals has three primary components: (1) a base salary, (2) an annual cash bonus, and (3) annual equity-based compensation awards that generally are subject to a vesting schedule. Stock-based compensation awards and adjustments in base salary and bonuses are typically paid and/or put into effect at or shortly after, the firm’s fiscalyear-end, October 31.
The firm also maintains the following arrangements:
| | • | | Employment contracts for key investment professionals and senior leadership. |
| | • | | Eligible employees receive Eaton Vance equity grants that vest over a multi-year period from grant date. |
Method to Determine Compensation. Because the Fund’s strategies are rules-based, portfolio managers and other investment professionals primarily are measured with respect to whether a strategy’s rules as implemented delivered on the strategy’s objectives. In evaluating the foregoing, Parametric evaluates the manner in which the strategy is implemented relative to strategy targets, rebalancing portfolio exposures consistent withpre-determined triggers, and judicious trade construction. Portfolio managers are also expected to monitor local market trading practices that may impact implementation of a strategy and to seek potential ways to address them as needed. This is particularly relevant in the emerging markets, where market practices are continuously evolving. If the portfolio manager deviates from the implementation of the rules as defined by the strategy, they are not performing the responsibilities of their role and compensation may be adjusted accordingly.
Item 9. Purchases of Equity Securities byClosed-End Management Investment Company and Affiliated Purchasers
No such purchases this period.
Item 10. Submission of Matters to a Vote of Security Holders
No material changes.
Item 11. Controls and Procedures
(a) It is the conclusion of the registrant’s principal executive officer and principal financial officer that the effectiveness of the registrant’s current disclosure controls and procedures (such disclosure controls and procedures having been evaluated within 90 days of the date of this filing) provide reasonable assurance that the information required to be disclosed by the registrant has been recorded, processed, summarized and reported within the time period specified in the Commission’s rules and forms and that the information required to be disclosed by the registrant has been accumulated and communicated to the registrant’s principal executive officer and principal financial officer in order to allow timely decisions regarding required disclosure.
(b) There have been no changes in the registrant’s internal controls over financial reporting during the period covered by this report that has materially affected, or is reasonably likely to materially affect, the registrant’s internal control over financial reporting.
Item 12. Disclosure of Securities Lending Activities forClosed-End Management Investment Companies
No activity to report for the registrant’s most recent fiscal year end.
Item 13. Exhibits
| | |
(a)(1) | | Registrant’s Code of Ethics – Not applicable (please see Item 2). |
| |
(a)(2)(i) | | Treasurer’s Section 302 certification. |
| |
(a)(2)(ii) | | President’s Section 302 certification. |
| |
(b) | | Combined Section 906 certification. |
| |
(c) | | Registrant’s notices to shareholders pursuant to Registrant’s exemptive order granting an exemption from Section 19(b) of the 1940 Act and Rule19b-1 thereunder regarding distributions paid pursuant to the Registrant’s Managed Distribution Plan. |
Signatures
Pursuant to the requirements of the Securities Exchange Act of 1934 and the Investment Company Act of 1940, the registrant has duly caused this report to be signed on its behalf by the undersigned, thereunto duly authorized.
Eaton VanceTax-Managed GlobalBuy-Write Opportunities Fund
| | |
| By: | | /s/ Edward J. Perkin |
| | Edward J. Perkin |
| | President |
| |
| Date: | | February 24, 2020 |
Pursuant to the requirements of the Securities Exchange Act of 1934 and the Investment Company Act of 1940, this report has been signed below by the following persons on behalf of the registrant and in the capacities and on the dates indicated.
| | |
| By: | | /s/ James F. Kirchner |
| | James F. Kirchner |
| | Treasurer |
| |
| Date: | | February 24, 2020 |
| | |
| By: | | /s/ Edward J. Perkin |
| | Edward J. Perkin |
| | President |
| |
| Date: | | February 24, 2020 |