Washington, D.C. 20549
Check the appropriate box below if the Form 8-K filing is intended to simultaneously satisfy the filing obligation of the registrant under any of the following provisions (see General Instruction A.2. below):
[_] Written communications pursuant to Rule 425 under the Securities Act (17 CFR 230.425)
[_] Soliciting material pursuant to Rule 14a-12 under the Exchange Act (17 CFR 240.14a-12)
On August 9, 2012, the Company posted on its website, www.eagleships.com, under the section entitled "Investors - Webcasts & Presentations" a presentation dated August 9, 2012 of its financial results for the second quarter ended June 30, 2012. A copy of the presentation is hereby furnished to the SEC and is attached as Exhibit 99.2.
Pursuant to the requirements of the Securities Exchange Act of 1934, the registrant has duly caused this report to be signed on its behalf by the undersigned hereunto duly authorized.
NEW YORK, NY, August 8, 2012-- Eagle Bulk Shipping Inc. (Nasdaq: EGLE) today announced its results for the second quarter ended June 30, 2012.
For the Second Quarter:
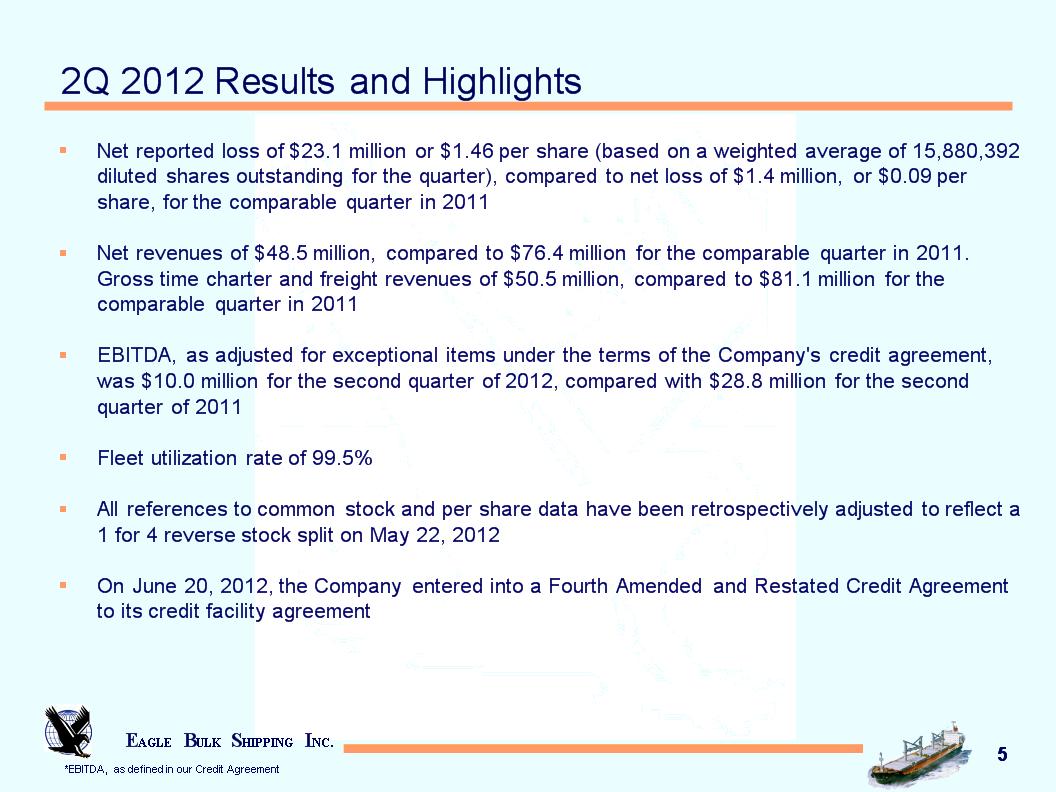
| · | Net reported loss of $23.1 million or $1.46 per share (based on a weighted average of 15,880,392 diluted shares outstanding for the quarter), compared to net loss of $1.4 million, or $0.09 per share, for the comparable quarter in 2011. |
| · | Net revenues of $48.5 million, compared to $76.4 million for the comparable quarter in 2011. Gross time charter and freight revenues of $50.5million, compared to $81.1 million for the comparable quarter in 2011. |
| · | EBITDA, as adjusted for exceptional items under the terms of the Company's credit agreement, was $10.0 million for the second quarter of 2012, compared with $28.8 million for the second quarter of 2011. |
| · | Fleet utilization rate of 99.5%. |
| · | All references to common stock and per share data have been retrospectively adjusted to reflect a 1 for 4 reverse stock split on May 22, 2012. |
| · | On June 20, 2012, the Company entered into a Fourth Amended and Restated Credit Agreement to its credit facility agreement. |
Sophocles N. Zoullas, Chairman and CEO, commented, "Eagle Bulk's second quarter results reflect ongoing instability and weakness in the dry bulk market, with the Baltic Index declining approximately 40% this year alone. Our successfully amended credit agreement represents an important achievement in this environment, as we aligned our balance sheet with the realities of the current market without compromising our competitiveness when the market does recover.
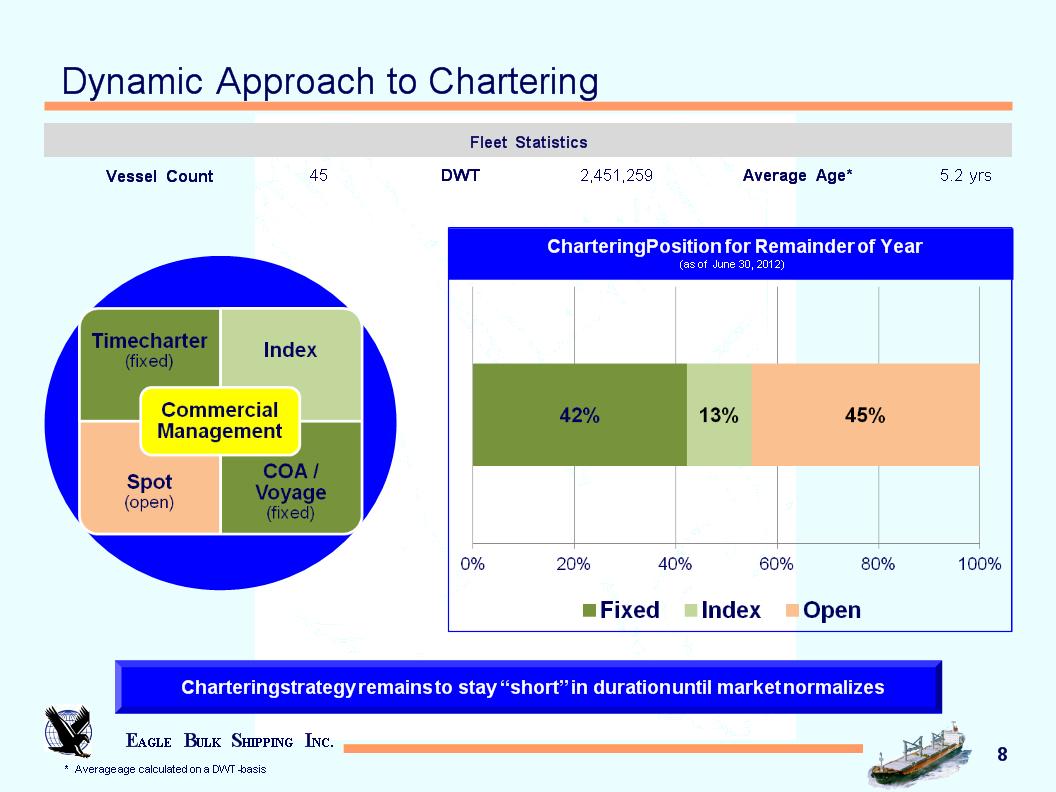
"Going forward, we will continue pursuit of a strategy that maximizes revenue upside through a flexible, opportunistic chartering strategy, a diversified cargo mix that stabilizes earnings, and operational excellence and efficiency."
Amended Credit Agreement
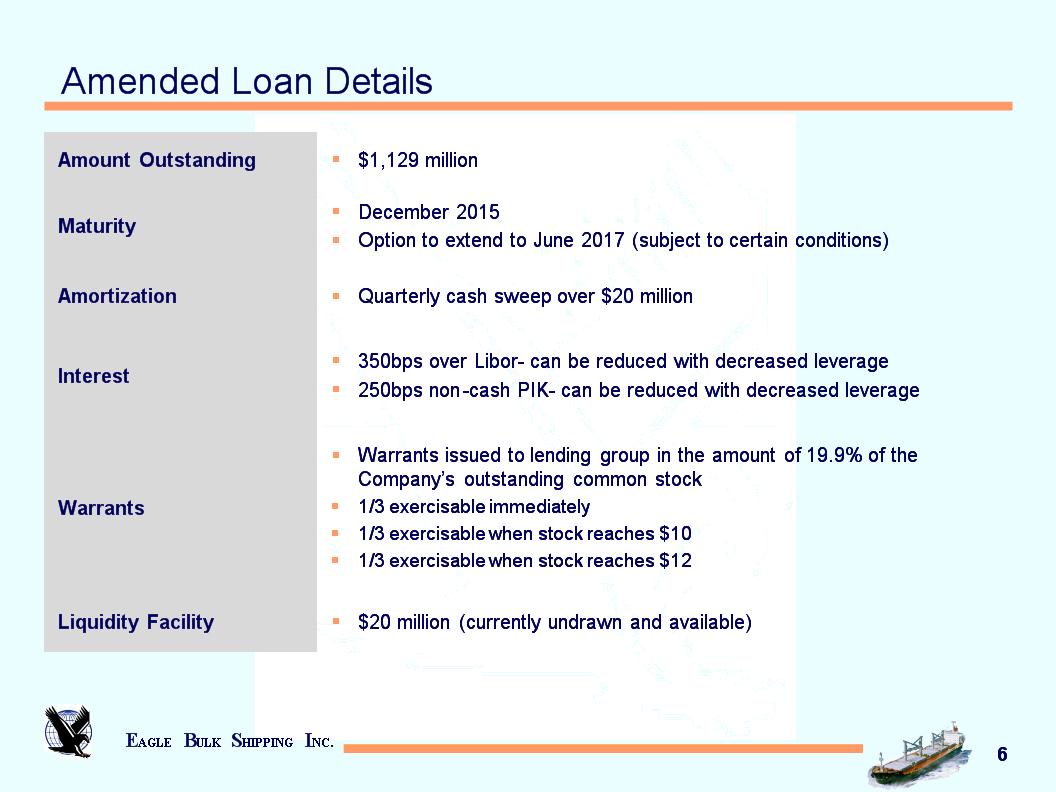
On June 20, 2012, the Company entered into a Fourth Amended and Restated Credit Agreement ("Fourth Amended") to its existing credit facility, dated as of October 19, 2007. Highlights of the agreement include the following:
| · | Permanently waives any purported defaults or events of defaults. |
| · | $1,129,478,741 presently outstanding under the existing revolver will convert into a term loan, with a maturity set to December 31, 2015. Subject to certain conditions, the amendment provides an option to the Company to extend the maturity date an additional 18 months to June 30, 2017. |
| · | Eagle Bulk will have access to a liquidity facility in the aggregate amount of $20,000,000. |
| · | The amendment requires no fixed repayments of principal until maturity, and is subject to a quarterly sweep of cash in excess of $20,000,000. |
| · | All amounts presently outstanding under the existing credit agreement will bear interest at LIBOR plus a cash margin of 3.50% and a payment-in-kind ("PIK") margin of 2.50%. This aggregate margin can be reduced if Company leverage is lowered. |
| · | Replaces all existing financial covenants and substitutes them with covenants that phase-in over the next three years. |
| · | Permits within certain parameters for the purchase or sale of vessels and management of third party vessels. |
| · | Company issued 3,148,584 warrants convertible on a cashless basis into shares of the Company's common stock, par value $0.01 (the "Warrant Shares"), at a strike price of $0.01 per share of common stock. One-third of the warrants are exercisable immediately, the next third of the warrants are exercisable when the price of the Company's common stock reaches $10.00 per share and the last third of the warrants are exercisable when the price of the Company's common stock reaches $12.00 per share. Unexercised warrants will expire on June 20, 2022. |
Additional detail about the amendment can be found in the Company's 8-K Disclosure Statement, a copy of which was filed with the Securities and Exchange Commission on June 20, 2012, and is available at www.sec.gov.
Results of Operations for the three-month period ended June 30, 2012 and 2011
For the second quarter of 2012, the Company reported a net loss of $23,106,239 or $1.46 per share, based on a weighted average of 15,880,392 diluted shares outstanding. In the comparable second quarter of 2011, the Company reported net loss of $1,438,278 or $0.09 per share, based on a weighted average of 15,642,830 diluted shares outstanding.
The Company's revenues were earned from time and voyage charters. Gross time and voyage charter revenues in the quarter ended June 30, 2012 were $50,537,281, compared with $81,135,090 recorded in the comparable quarter in 2011. The decrease in gross revenues is attributable primarily to lower charter rates and a decrease in voyage charter revenues in the quarter ended June 30, 2012. Gross revenues recorded in the quarter ended June 30, 2012 and 2011, include an amount of $1,205,276 and $1,271,810, respectively, relating to the non-cash amortization of fair value below contract value of time charters acquired. Brokerage commissions incurred on revenues earned in the quarter ended June 30, 2012 and 2011 were $2,000,048 and $4,729,702, respectively. Net revenues during the quarter ended June 30, 2012 and 2011, were $48,537,233 and $76,405,388, respectively.
Total operating expenses for the quarter ended June 30, 2012were $59,605,359compared with $66,123,996 recorded in the second quarter of 2011. The Company operated 45 vessels in the second quarter of 2012 compared with 41vessels in the corresponding quarter in 2011. The decrease in operating expenses was primarily due to a reduction in chartered-in days and lower voyage expenses offset by the increase in operating a larger fleet size which includes increases in vessels crew cost, insurances and vessel depreciation expense. The increase in General and Administrative expenses is primarily attributable to the increase in allowance for bad debts.
EBITDA, adjusted for exceptional items under the terms of the Company's credit agreement, decreased by 65% to $9,969,683 for the second quarter of 2012, compared with $28,804,803 for the second quarter of 2011. (Please see below for a reconciliation of EBITDA to net loss).
Results of Operations for the six-month period ended June 30, 2012 and 2011
For the six months ended June 30, 2012, the Company reported net loss of $40,539,768 or $2.56 per share, based on a weighted average of 15,815,594 diluted shares outstanding. In the comparable period of 2011, the Company reported net loss of $7,248,559 or $0.46 per share, based on a weighted average of 15,641,477 diluted shares outstanding.
The Company's revenues were earned from time and voyage charters. Gross revenues for the six-month period ended June 30, 2012were $105,360,411, compared with $171,518,078 recorded in the comparable period in 2011. The decrease in gross revenues is attributable to lower time charter rates and a decrease in voyage revenues in the period, offset marginally by operating a larger fleet. Gross revenues recorded in the six-month period ended June 30, 2012 and 2011, include an amount of $2,434,040 and $2,566,329, respectively, relating to the non-cash amortization of fair value below contract value of time charters acquired. Brokerage commissions incurred on revenues earned in the six-month periods ended June 30, 2012 and 2011 were $4,206,778 and $8,419,914, respectively. Net revenues during the six-month period ended June 30, 2012, decreased 38% to $101,153,633 from $163,098,163 in the comparable period in 2011.
Total operating expenses were $119,723,715 in the six-month period ended June 30, 2012 compared to $148,398,858 recorded in the same period of 2011. The decrease in operating expenses was primarily due to a reduction in chartered-in days and lower voyage expenses offset by the increase in operating a larger fleet size which includes increases in vessels crew cost, insurances and vessel depreciation expense. The decrease in General and Administrative expenses is primarily attributable to lower allowance for bad debts being booked in the six-month period ended June 30, 2012 compared with 2011.
EBITDA, adjusted for exceptional items under the terms of the Company's credit agreement, decreased by 55% to $23,783,682 for the six months ended June 30, 2012 from $52,932,372 for the same period in 2011. (Please see below for a reconciliation of EBITDA to net loss).
Liquidity and Capital Resources
Net cash used in operating activities during the six-month period ended June 30, 2012, was $1,463,360, compared with net cash provided by operating activities of $26,445,490 during the corresponding six-month period ended June 30, 2011. The decrease was primarily due to lower rates on charter renewals and from the operation of a larger fleet offset by a reduction in charter hire expenses and related voyages expenses.
Net cash provided by investing activities during the six-month period ended 2012, was $309,866, compared with net cash used in investing activities of $101,725,929 during the corresponding six-month period ended June 30, 2011. Investing activities during the six-month period ended June 30, 2011, related primarily to making progress payments and incurring related vessel construction expenses for the newbuilding vessels.
Net cash used in financing activities during the six-month period ended June 30, 2012 and 2011 was $6,773,199 and $2,710,177, respectively. The increase was primarily due to additional expenses incurred related to the amendment and restatement of the Company's credit agreement.
As of June 30, 2012, our cash balance was $17,148,510, compared to a cash balance of $25,075,203 at December 31, 2011. Also recorded in Restricted Cash is an amount of $291,891, of which $276,056 collateralizes letters of credit relating to our office leases.
Debt consists of the following:
| | | June 30, 2012 | | December 31, 2011 | |
| | | | | | |
| Credit Facility | | $ | — | | $ | 1,129,478,741 | |
| | | | | | | | |
| Term loan | | 1,129,478,741 | | — | |
| Payment-in-kind loan | | 707,688 | | — | |
| Less: Current portion | | — | | (32,094,006) | |
| Long-term debt | | $ | 1,130,186,429 | | $ | 1,097,384,735 | |
Disclosure of Non-GAAP Financial Measures
EBITDA represents operating earnings before extraordinary items, depreciation and amortization, interest expense, and income taxes, if any. EBITDA is included because it is used by certain investors to measure a company's financial performance. EBITDA is not an item recognized by U.S. GAAP and should not be considered a substitute for net income, cash flow from operating activities and other operations or cash flow statement data prepared in accordance with accounting principles generally accepted in the United States or as a measure of profitability or liquidity. EBITDA is presented to provide additional information with respect to the Company's ability to satisfy its obligations including debt service, capital expenditures, and working capital requirements. While EBITDA is frequently used as a measure of operating results and the ability to meet debt service requirements, the definition of EBITDA used here may not be comparable to that used by other companies due to differences in methods of calculation.
Our term loan agreement require us to comply with financial covenants based on debt and interest ratio with extraordinary or exceptional items, interest, taxes, non-cash compensation, depreciation and amortization (Credit Agreement EBITDA). Therefore, we believe that this non-U.S. GAAP measure is important for our investors as it reflects our ability to meet our covenants. The following table is a reconciliation of net loss, as reflected in the consolidated statements of operations, to the Credit Agreement EBITDA:
| | | Three Months Ended | | | Six Months Ended | |
| | | June 30, 2012 | | | June 30, 2011 | | | June 30, 2012 | | | June 30, 2011 | |
| Net loss | | $ | (23,106,239) | | | $ | (1,438,278) | | | $ | (40,539,768) | | | $ | (7,248,559) | |
| Interest Expense | | | 12,053,342 | | | | 11,672,428 | | | | 23,014,252 | | | | 23,008,907 | |
| Depreciation and Amortization | | | 19,427,957 | | | | 17,640,372 | | | | 38,861,314 | | | | 34,799,216 | |
| Amortization of fair value below contract value of time charter acquired | | | (1,205,276) | | | | (1,271,810 | ) | | | (2,434,040) | | | | (2,566,329 | ) |
| EBITDA | | | 7,169,784 | | | | 26,602,712 | | | | 18,901,758 | | | | 47,993,235 | |
| Adjustments for Exceptional Items: | | | | | | | | | | | | | | | | |
| Non-cash Compensation Expense (1) | | | 2,799,899 | | | | 2,202,091 | | | | 4,881,924 | | | | 4,939,137 | |
| Credit Agreement EBITDA | | $ | 9,969,683 | | | $ | 28,804,803 | | | $ | 23,783,682 | | | $ | 52,932,372 | |
(1) Stock based compensation related to stock options and restricted stock units.
Capital Expenditures and Drydocking
Our capital expenditures relate to the purchase of vessels and capital improvements to our vessels which are expected to enhance the revenue earning capabilities and safety of these vessels.
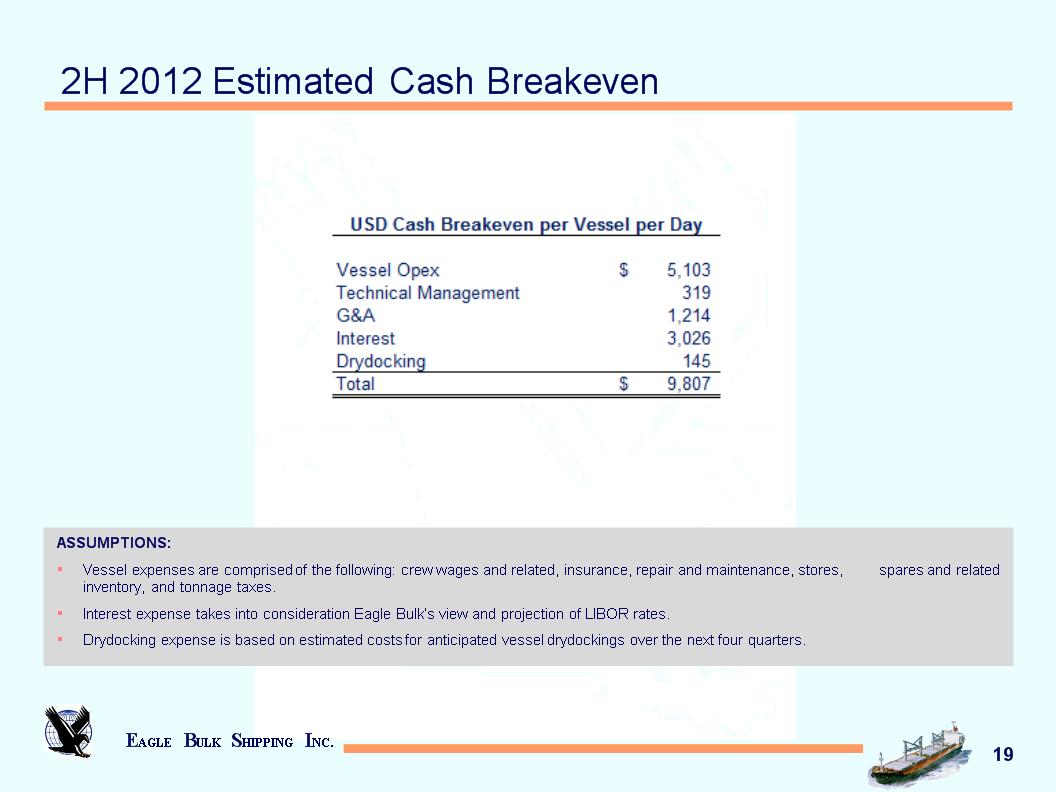
In addition to acquisitions that we may undertake in future periods, the Company's other major capital expenditures include funding the Company's maintenance program of regularly scheduled drydocking necessary to preserve the quality of our vessels as well as to comply with international shipping standards and environmental laws and regulations. Although the Company has some flexibility regarding the timing of its dry docking, the costs are relatively predictable. Management anticipates that vessels are to be drydocked every two and a half years. Funding of these requirements is anticipated to be met with cash from operations. We anticipate that this process of recertification will require us to reposition these vessels from a discharge port to shipyard facilities, which will reduce our available days and operating days during that period.
Drydocking costs incurred are amortized to expense on a straight-line basis over the period through the date the next drydocking for those vessels are scheduled to occur. One vessel was drydocked in the three months ended June 30, 2012. The following table represents certain information about the estimated costs for anticipated vessel drydockings in the next four quarters, along with the anticipated off-hire days:
| Quarter Ending | Off-hire Days(1) | Projected Costs(2) |
September 30, 2012 | - | - |
December 31, 2012 | - | - |
March 31, 2013 | 22 | $0.60 million |
June 30, 2013 | 22 | $0.60 million |
| | | |
(1)Actual duration of drydocking will vary based on the condition of the vessel, yard schedules and other factors. (2)Actual costs will vary based on various factors, including where the drydockings are actually performed. |
Summary Consolidated Financial and Other Data:
The following table summarizes the Company's selected consolidated financial and other data for the periods indicated below.
CONSOLIDATED STATEMENT OF OPERATIONS
| | | Three Months Ended | | | Six Months Ended | |
| | | June 30, 2012 | | | June 30, 2011 | | | June 30, 2012 | | | June 30, 2011 | |
| | | | | | | | | | | | | |
| | | | | | | | | | | | | |
Revenues, net of commissions | | $ | 48,537,233 | | | $ | 76,405,388 | | | $ | 101,153,633 | | | $ | 163,098,163 | |
| | | | | | | | | | | | | | | | | |
Voyage expenses | | | 6,888,920 | | | | 8,125,284 | | | | 13,890,624 | | | | 23,946,796 | |
Vessel expenses | | | 23,869,262 | | | | 21,289,772 | | | | 46,311,324 | | | | 40,763,171 | |
Charter hire expenses | | | — | | | | 11,029,811 | | | | 606,573 | | | | 26,954,493 | |
Depreciation and amortization | | | 19,427,957 | | | | 17,640,372 | | | | 38,861,314 | | | | 34,799,216 | |
General and administrative expenses | | | 9,419,220 | | | | 8,038,757 | | | | 20,053,880 | | | | 21,935,182 | |
Total operating expenses | | | 59,605,359 | | | | 66,123,996 | | | | 119,723,715 | | | | 148,398,858 | |
| | | | | | | | | | | | | | | | | |
| | | | | | | | | | | | | | | | | |
Operating income (loss) | | | (11,068,126 | ) | | | 10,281,392 | | | | (18,570,082 | ) | | | 14,699,305 | |
| | | | | | | | | | | | | | | | | |
Interest expense | | | 12,053,342 | | | | 11,672,428 | | | | 23,014,252 | | | | 23,008,907 | |
Interest income | | | (8,153 | ) | | | (29,464 | ) | | | (16,191 | ) | | | (87,134 | ) |
Other (Income) expense | | | (7,076 | ) | | | 76,706 | | | | (1,028,375 | ) | | | (973,909 | ) |
Total other expense, net | | | 12,038,113 | | | | 11,719,670 | | | | 21,969,686 | | | | 21,947,864 | |
| | | | | | | | | | | | | | | | | |
Net loss | | $ | (23,106,239 | ) | | $ | (1,438,278 | ) | | $ | (40,539,768 | ) | | $ | (7,248,559 | ) |
| | | | | | | | | | | | | | | | | |
Weighted average shares outstanding* : | | | | | | | | | | | | | | | | |
Basic | | | 15,880,392 | | | | 15,642,830 | | | | 15,815,594 | | | | 15,641,477 | |
Diluted | | | 15,880,392 | | | | 15,642,830 | | | | 15,815,594 | | | | 15,641,477 | |
Per share amounts: | | | | | | | | | | | | | | | | |
Basic net loss | | $ | (1.46 | ) | | $ | (0.09 | ) | | $ | (2.56 | ) | | $ | (0.46 | ) |
Diluted net loss | | $ | (1.46 | ) | | $ | (0.09 | ) | | $ | (2.56 | ) | | $ | (0.46 | ) |
| | | | | | | | | | | | | | | | | |
| | | | | | | | | | | | | | | | | |
*Adjusted to give effect to the 1 for 4 reverse stock split that became effective on May 22, 2012.
Fleet Operating Data
| | Three Months Ended | Six Months Ended |
| | June 30, 2012 | June 30, 2011 | June 30, 2012 | June 30, 2011 |
| | | | | |
| Ownership Days | 4,095 | 3,682 | 8,190 | 7,230 |
| Chartered-in under operating lease Days | - | 629 | 32 | 1,658 |
| Available Days | 4,081 | 4,290 | 8,175 | 8,847 |
| Operating Days | 4,062 | 4,268 | 8,103 | 8,779 |
| Fleet Utilization | 99.5% | 99.5% | 99.1% | 99.2% |
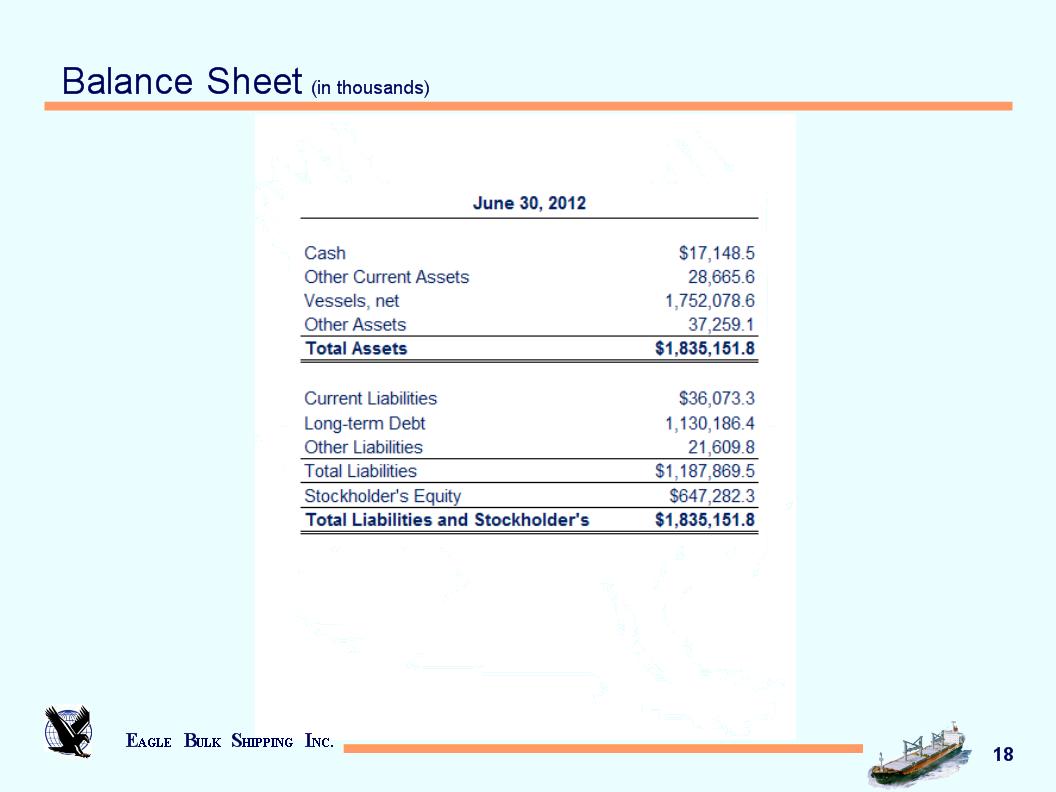
CONSOLIDATED BALANCE SHEETS
| | | June 30, 2012 (unaudited) | | | December 31, 2011 | |
| ASSETS: | | | | | | |
| Current assets: | | | | | | |
Cash and cash equivalents | | $ | 17,148,510 | | | $ | 25,075,203 | |
Accounts receivable, net | | | 10,250,226 | | | | 13,960,777 | |
Prepaid expenses | | | 5,048,180 | | | | 3,969,905 | |
Inventories | | | 12,581,899 | | | | 11,083,331 | |
Investment | | | 227,354 | | | | 988,196 | |
Fair value above contract value of time charters acquired | | | 557,881 | | | | 567,315 | |
Fair value of derivative instruments | | | — | | | | 246,110 | |
Total current assets | | | 45,814,050 | | | | 55,890,837 | |
| Noncurrent assets: | | | | | | | | |
Vessels and vessel improvements, at cost, net of accumulated depreciation of $276,929,765 and $239,568,767, respectively | | | 1,752,078,568 | | | | 1,789,381,046 | |
| Other fixed assets, net of accumulated amortization of $420,668 and $324,691, respectively | | | 519,683 | | | | 605,519 | |
Restricted cash | | | 291,891 | | | | 670,418 | |
Deferred drydock costs | | | 3,067,188 | | | | 3,303,363 | |
Deferred financing costs | | | 28,321,603 | | | | 11,766,779 | |
Fair value above contract value of time charters acquired | | | 2,766,769 | | | | 3,041,496 | |
Other assets | | | 2,292,075 | | | | 2,597,270 | |
Total noncurrent assets | | | 1,789,337,777 | | | | 1,811,365,891 | |
| | | | | | | | | |
Total assets | | $ | 1,835,151,827 | | | $ | 1,867,256,728 | |
| | | | | | | | | |
| LIABILITIES & STOCKHOLDERS' EQUITY | | | | | | | | |
| Current liabilities: | | | | | | | | |
Accounts payable | | $ | 6,629,148 | | | $ | 10,642,831 | |
Accrued interest | | | 3,067,461 | | | | 2,815,665 | |
Other accrued liabilities | | | 17,652,035 | | | | 11,822,582 | |
Current portion of long-term debt | | | — | | | | 32,094,006 | |
| Deferred revenue and fair value below contract value of time charters acquired | | | 4,637,875 | | | | 5,966,698 | |
Unearned charter hire revenue | | | 4,086,738 | | | | 5,779,928 | |
| | | | | | | | | |
Total current liabilities | | | 36,073,257 | | | | 69,121,710 | |
| Noncurrent liabilities: | | | | | | | | |
Long-term debt | | | 1,130,186,429 | | | | 1,097,384,735 | |
| Deferred revenue and fair value below contract value of time charters acquired | | | 15,386,221 | | | | 17,088,464 | |
Fair value of derivative instruments | | | 6,223,622 | | | | 9,486,116 | |
| | | | | | | | | |
Total noncurrent liabilities | | | 1,151,796,272 | | | | 1,123,959,315 | |
Total liabilities | | | 1,187,869,529 | | | | 1,193,081,025 | |
| Commitment and contingencies | | | | | | | | |
| Stockholders' equity: | | | | | | | | |
Preferred stock, $.01 par value, 25,000,000 shares authorized, none issued | | | — | | | | — | |
| Common stock, $.01 par value, 100,000,000 shares authorized, 15,771,496 shares issued and outstanding* | | | 157,715 | | | | 157,508 | |
Additional paid-in capital* | | | 757,090,198 | | | | 745,945,694 | |
Retained earnings (net of dividends declared of $262,118,388 as of June 30, 2012 and December 31, 2011, respectively) | | | (103,014,254 | ) | | | (62,474,486 | ) |
Accumulated other comprehensive loss | | | (6,951,361 | ) | | | (9,453,013 | ) |
| | | | | | | | | |
Total stockholders' equity | | | 647,282,298 | | | | 674,175,703 | |
| | | | | | | | | |
Total liabilities and stockholders' equity | | $ | 1,835,151,827 | | | $ | 1,867,256,728 | |
| | | | | | | | | |
| | | | | | | | | |
| | | | | | | | | |
*Adjusted to give effect to the 1 for 4 reverse stock split that became effective on May 22, 2012.
CONSOLIDATED STATEMENTS OF CASH FLOWS
| | | Six Months Ended | |
| | | June 30, 2012 | | | June 30, 2011 | |
| Cash flows from operating activities: | | | | | | |
Net loss | | $ | (40,539,768 | ) | | $ | (7,248,559 | ) |
| Adjustments to reconcile net loss to net cash (used in) provided by operating activities: | | | | | | | | |
| Items included in net loss not affecting cash flows: | | | | | | | | |
Depreciation | | | 37,456,975 | | | | 33,055,698 | |
Amortization of deferred drydocking costs | | | 1,404,339 | | | | 1,743,518 | |
Amortization of deferred financing costs | | | 2,332,293 | | | | 1,918,410 | |
Amortization of fair value below contract value of time charter acquired | | | (2,434,040 | ) | | | (2,566,329 | ) |
Payment-in-kind interest on debt | | | 707,688 | | | | — | |
Unrealized gain from forward freight agreements, net | | | 246,110 | | | | 308,578 | |
Allowance for accounts receivable | | | 5,339,080 | | | | 6,586,900 | |
Non-cash compensation expense | | | 4,881,924 | | | | 4,939,137 | |
Drydocking expenditures | | | (1,168,164 | ) | | | (1,284,121 | ) |
| Changes in operating assets and liabilities: | | | | | | | | |
Accounts receivable | | | (1,628,529 | ) | | | (11,473,011 | ) |
Other assets | | | 305,195 | | | | (635,571 | ) |
Prepaid expenses | | | (1,078,275 | ) | | | 931,577 | |
Inventories | | | (1,498,568 | ) | | | (5,339,055 | ) |
Accounts payable | | | (4,013,683 | ) | | | 2,373,987 | |
Accrued interest | | �� | 251,796 | | | | (2,339,449 | ) |
Accrued expenses | | | (21,678 | ) | | | 4,433,934 | |
Deferred revenue | | | (312,865 | ) | | | 138,722 | |
Unearned revenue | | | (1,693,190 | ) | | | 901,124 | |
Net cash (used in) provided by operating activities | | | (1,463,360 | ) | | | 26,445,490 | |
| | | | | | | | | |
| Cash flows from investing activities: | | | | | | | | |
Vessels and vessel improvements and advances for vessel construction | | | (58,520 | ) | | | (100,369,716 | ) |
Purchase of other fixed assets | | | (10,141 | ) | | | (198,732 | ) |
Changes in restricted cash | | | 378,527 | | | | (1,157,481 | ) |
Net cash provided by (used in) investing activities | | | 309,866 | | | | (101,725,929 | ) |
| | | | | | | | | |
| Cash flows from financing activities: | | | | | | | | |
Changes in restricted cash | | | — | | | | (1,500,000 | ) |
Deferred financing costs | | | (6,773,199 | ) | | | — | |
| Cash used to settle net share equity awards | | | — | | | | (1,210,177 | ) |
Net cash used in financing activities | | | (6,773,199 | ) | | | (2,710,177 | ) |
| | | | | | | | | |
Net decrease in cash | | | (7,926,693 | ) | | | (77,990,616 | ) |
Cash at beginning of period | | | 25,075,203 | | | | 129,121,680 | |
Cash at end of period | | $ | 17,148,510 | | | $ | 51,131,064 | |
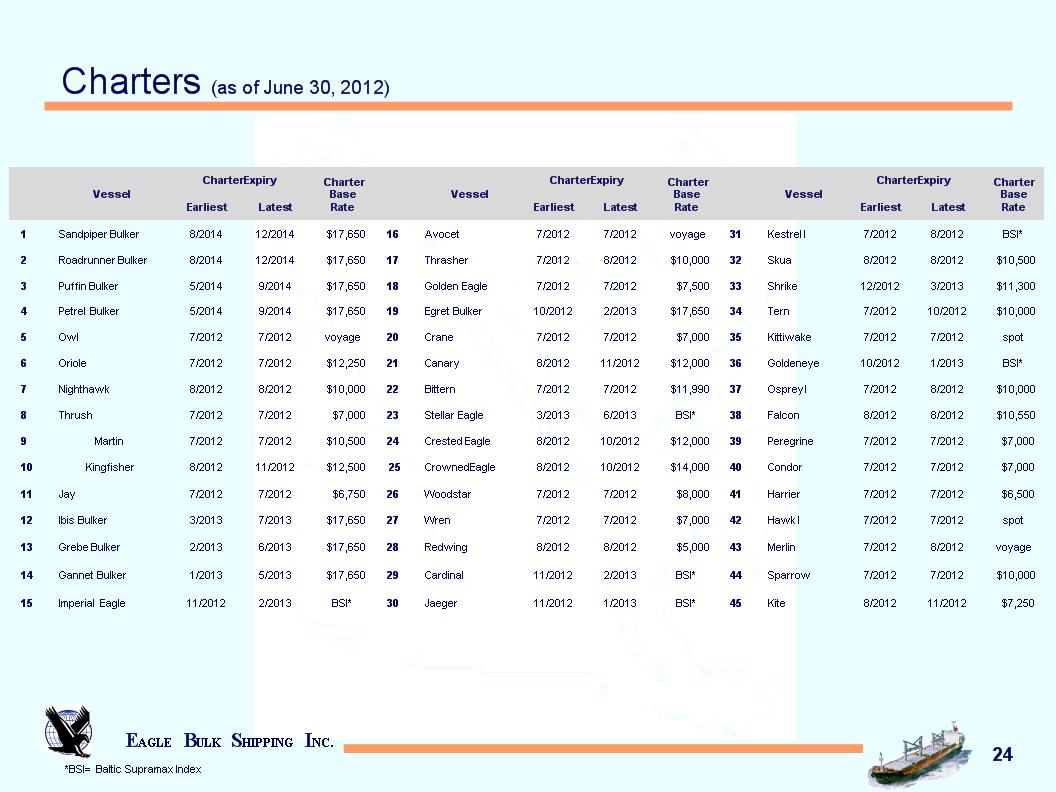
The following table represents certain information about our revenue earning charters on our operating fleet as of June 30, 2012:
| Vessel | | Year Built | | Dwt | | Charter Expiration (1) | | Daily Charter Hire Rate | | |
| | | | | | | | | | | |
Avocet (2) | | 2010 | | | 53,462 | | Jul 2012 | | | Voyage(3) | | |
| | | | | | | | | | | | | |
Bittern (2) | | 2009 | | | 57,809 | | Jul 2012 | | $ | 11,990(3) | | |
| | | | | | | | | | | | | |
Canary (2) | | 2009 | | | 57,809 | | Aug 2012 to Nov 2012 | | $ | 12,000 | | |
| | | | | | | | | | | | | |
| Cardinal | | 2004 | | | 55,362 | | Nov 2012 to Feb 2013 | | | Index(4) | | |
| | | | | | | | | | | | | |
| Condor | | 2001 | | | 50,296 | | Jul 2012 | | $ | 7,000(3) | | |
| | | | | | | | | | | | | |
Crane (2) | | 2010 | | | 57,809 | | Jul 2012 | | $ | 7,000(3) | | |
| | | | | | | | | | | | | |
| Crested Eagle | | 2009 | | | 55,989 | | Aug 2012 to Oct 2012 | | $ | 12,000(3) | | |
| | | | | | | | | | | | | |
| Crowned Eagle | | 2008 | | | 55,940 | | Aug 2012 to Oct 2012 | | $ | 14,000 | | |
| | | | | | | | | | | | | |
Egret Bulker | | 2010 | | | 57,809 | | Oct 2012 to Feb 2013 | | | $17,650(5) (with 50% profit share over $20,000) | | |
| | | | | | | | | | | | | |
| Falcon | | 2001 | | | 50,296 | | Aug 2012 | | $ | 10,550(3) | | |
| | | | | | | | | | | | | |
Gannet Bulker | | 2010 | | | 57,809 | | Jan 2013 to May 2013 | | | $17,650(5) (with 50% profit share over $20,000) | | |
| | | | | | | | | | | | | |
| Golden Eagle | | 2010 | | | 55,989 | | Jul 2012 | | $ | 7,500 | | |
| | | | | | | | | | | | | |
| Goldeneye | | 2002 | | | 52,421 | | Oct 2012 to Jan 2013 | | | Index(4) | | |
| | | | | | | | | | | | | |
Grebe Bulker | | 2010 | | | 57,809 | | Feb 2013 to Jun 2013 | | | $17,650(5) (with 50% profit share over $20,000) | | |
| | | | | | | | | | | | | |
| Harrier | | 2001 | | | 50,296 | | Jul 2012 | | $ | 6,500(3) | | |
| | | | | | | | | | | | | |
| Hawk I | | 2001 | | | 50,296 | | Jul 2012 | | | Spot(3) | | |
| | | | | | | | | | | | | |
Ibis Bulker | | 2010 | | | 57,775 | | Mar 2013 to Jul 2013 | | | $17,650(5) (with 50% profit share over $20,000) | | |
| | | | | | | | | | | | | |
| Imperial Eagle | | 2010 | | | 55,989 | | Nov 2012 to Feb 2013 | | | Index(4) | | |
| | | | | | | | | | | | | |
| Jaeger | | 2004 | | | 52,248 | | Nov 2012 to Jan 2013 | | | Index(4) | | |
| | | | | | | | | | | | | |
Jay(2) | | 2010 | | | 57,802 | | Jul 2012 | | $ | 6,750(3) | | |
| | | | | | | | | | | | | |
| Kestrel I | | 2004 | | | 50,326 | | Jul 2012 to Aug 2012 | | | Index(4) | | |
| | | | | | | | | | | | | |
Kingfisher (2) | | 2010 | | | 57,776 | | Aug 2012 to Nov 2012 | | $ | 12,500 | | |
| | | | | | | | | | | | | |
| Kite | | 1997 | | | 47,195 | | Aug 2012 to Nov 2012 | | $ | 7,250 | | |
| | | | | | | | | | | | | |
| Kittiwake | | 2002 | | | 53,146 | | Jul 2012 | | | Spot(3) | | |
| | | | | | | | | | | | | |
Martin(2) | | 2010 | | | 57,809 | | Jul 2012 | | $ | 10,500(3) | | |
| | | | | | | | | | | | | |
| Merlin | | 2001 | | | 50,296 | | Jul 2012 to Aug 2012 | | | Voyage(3) | | |
| | | | | | | | | | | | | |
Nighthawk(2) | | 2011 | | | 57,809 | | Aug 2012 | | $ | 10,000(3) | | |
| | | | | | | | | | | | | |
Oriole(2) | | 2011 | | | 57,809 | | Jul 2012 | | $ | 12,250(3) | | |
| | | | | | | | | | | | | |
| Osprey I | | 2002 | | | 50,206 | | Jul 2012 to Aug 2012 | | $ | 10,000(3) | | |
| | | | | | | | | | | | | |
Owl(2) | | 2011 | | | 50,809 | | Jul 2012 | | | Voyage(3) | | |
| | | | | | | | | | | | | |
| Peregrine | | 2001 | | | 50,913 | | Jul 2012 | | $ | 7,000(3) | | |
Petrel Bulker | | 2011 | | | 57,809 | | May 2014 to Sep 2014 | | | $17,650(5) (with 50% profit share over $20,000) | | |
| | | | | | | | | | | | | |
Puffin Bulker | | 2011 | | | 57,809 | | May 2014 to Sep 2014 | | | $17,650(5) (with 50% profit share over $20,000) | | |
| | | | | | | | | | | | | |
| Redwing | | 2007 | | | 53,411 | | Aug 2012 | | $ | 5,000(3) | | |
| | | | | | | | | | | | | |
Roadrunner Bulker | �� | 2011 | | | 57,809 | | Aug 2014 to Dec 2014 | | | $17,650(5) (with 50% profit share over $20,000) | | |
| | | | | | | | | | | | | |
Sandpiper Bulker | | 2011 | | | 57,809 | | Aug 2014 to Dec 2014 | | | $17,650(5) (with 50% profit share over $20,000) | | |
| | | | | | | | | | | | | |
| Shrike | | 2003 | | | 53,343 | | Dec 2012 to Mar 2013 | | $ | 11,300(3) | | |
| | | | | | | | | | | | | |
| Skua | | 2003 | | | 53,350 | | Aug 2012 | | $ | 10,500(3) | | |
| | | | | | | | | | | | | |
| Sparrow | | 2000 | | | 48,225 | | Jul 2012 | | $ | 10,000(3) | | |
| | | | | | | | | | | | | |
| Stellar Eagle | | 2009 | | | 55,989 | | Mar 2013 to Jun 2013 | | | Index(4) | | |
| | | | | | | | | | | | | |
| Tern | | 2003 | | | 50,200 | | Jul 2012 to Oct 2012 | | $ | 10,000(3) | | |
| | | | | | | | | | | | |
Thrasher (2) | | 2010 | | | 53,360 | | Jul 2012 to Aug 2012 | | $ | 10,000(3) | | |
| | | | | | | | | | | | |
| Thrush | | 2011 | | | 53,297 | | Jul 2012 | | $ | 7,000(3) | | |
| | | | | | | | | | | | |
Woodstar (2) | | 2008 | | | 53,390 | | Jul 2012 | | $ | 8,000(3) | | |
| | | | | | | | | | | | |
Wren (2) | | 2008 | | | 53,349 | | Jul 2012 | | $ | 7,000(3) | | |
| | (1) | The date range provided represents the earliest and latest date on which the charterer may redeliver the vessel to the Company upon the termination of the charter. The time charter hire rates presented are gross daily charter rates before brokerage commissions, ranging from 0.625% to 6.25%, to third party ship brokers. |
| | (2) | The charter rate does not include any shortfall between the vessels' actual daily earnings and the $17,000 per day for which KLC is responsible. Revenue from KLC will be recognized when collectability is assured. In addition, through December 2015, we are entitled to100% of the profits on earnings between $17,000 to $21,000 per day and a 50% profit share on earnings above $17,000 per day from January 2016 to December 2018. |
| | (3) | Upon conclusion of the previous charter, the vessel will commence a short-term charter for up to six months. |
| | (4) | Index, an average of the trailing Baltic Supramax Index. |
| | (5) | The charterer has an option to extend the charter by two periods of 11 to 13 months each. |
Glossary of Terms:
Ownership days: The Company defines ownership days as the aggregate number of days in a period during which each vessel in its fleet has been owned. Ownership days are an indicator of the size of the fleet over a period and affect both the amount of revenues and the amount of expenses that is recorded during a period.
Chartered-in under operating lease days: The Company defines chartered-in under operating lease days as the aggregate number of days in a period during which the Company chartered-in vessels.
Available days: The Company defines available days as the number of ownership days less the aggregate number of days that its vessels are off-hire due to vessel familiarization upon acquisition, scheduled repairs or repairs under guarantee, vessel upgrades or special surveys and the aggregate amount of time that we spend positioning our vessels. The shipping industry uses available days to measure the number of days in a period during which vessels should be capable of generating revenues.
Operating days: The Company defines operating days as the number of its available days in a period less the aggregate number of days that the vessels are off-hire due to any reason, including unforeseen circumstances. The shipping industry uses operating days to measure the aggregate number of days in a period during which vessels actually generate revenues.
Fleet utilization: The Company calculates fleet utilization by dividing the number of our operating days during a period by the number of our available days during the period. The shipping industry uses fleet utilization to measure a company's efficiency in finding suitable employment for its vessels and minimizing the amount of days that its vessels are off-hire for reasons other than scheduled repairs or repairs under guarantee, vessel upgrades, special surveys or vessel positioning. Our fleet continues to perform at very high utilization rates.
Conference Call Information
As previously announced, members of Eagle Bulk's senior management team will host a teleconference and webcast at 8:30 a.m. ET on Thursday, August 9th to discuss the results.
To participate in the teleconference, investors and analysts are invited to call 800-706-7748 in the U.S., or 617-614-3473 outside of the U.S., and reference participant code 94659453. A simultaneous webcast of the call, including a slide presentation for interested investors and others, may be accessed by visiting http://www.eagleships.com.
A replay will be available following the call until 11:59 PM ET on August 16, 2012. To access the replay, call 888-286-8010 in the U.S., or 617-801-6888 outside of the U.S., and reference passcode 55295308.
About Eagle Bulk Shipping Inc.
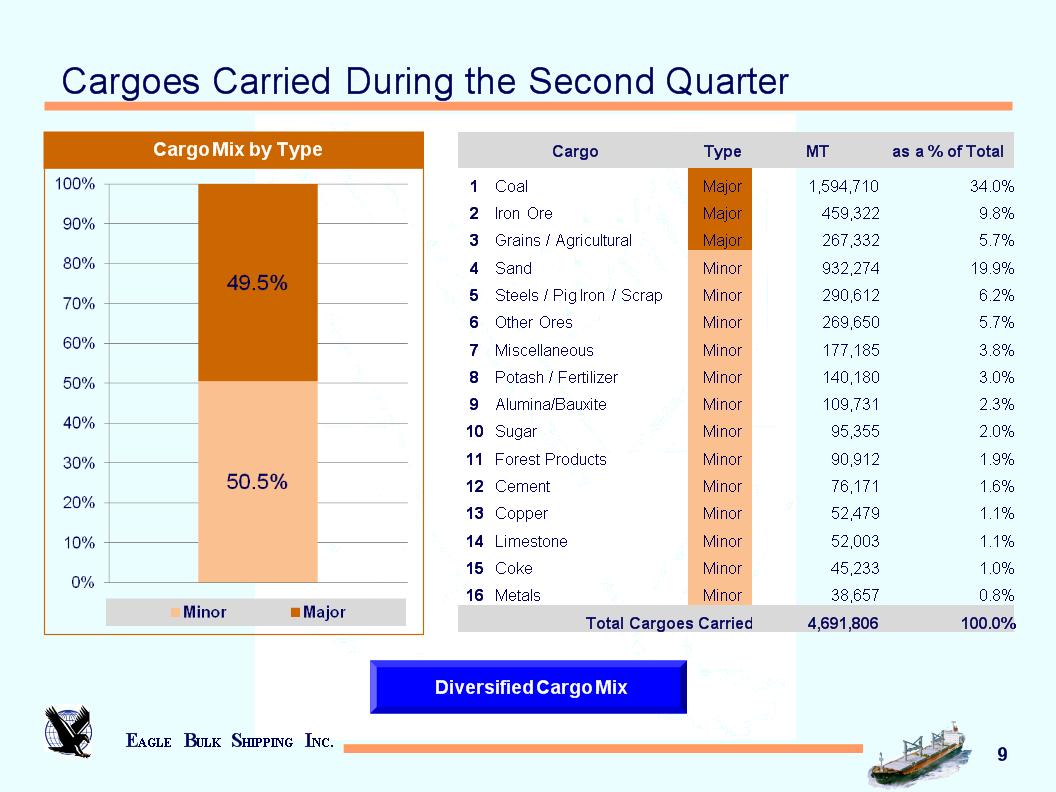
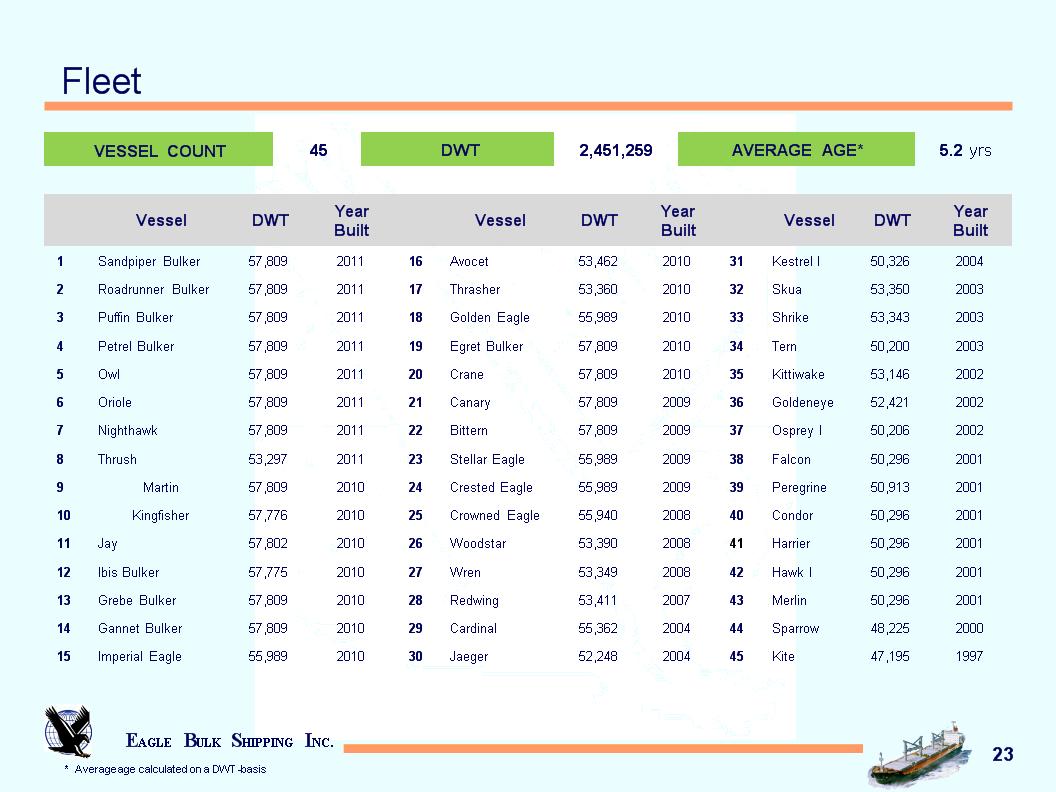
Eagle Bulk Shipping Inc. is a Marshall Islands corporation headquartered in New York. The Company is a leading global owner of Supramax dry bulk vessels that range in size from 50,000 to 60,000 deadweight tons and transport a broad range of major and minor bulk cargoes, including iron ore, coal, grain, cement and fertilizer, along worldwide shipping routes.
Forward-Looking Statements
Matters discussed in this release may constitute forward-looking statements. Forward-looking statements reflect our current views with respect to future events and financial performance and may include statements concerning plans, objectives, goals, strategies, future events or performance, and underlying assumptions and other statements, which are other than statements of historical facts.
The forward-looking statements in this release are based upon various assumptions, many of which are based, in turn, upon further assumptions, including without limitation, management's examination of historical operating trends, data contained in our records and other data available from third parties. Although Eagle Bulk Shipping Inc. believes that these assumptions were reasonable when made, because these assumptions are inherently subject to significant uncertainties and contingencies which are difficult or impossible to predict and are beyond our control, Eagle Bulk Shipping Inc. cannot assure you that it will achieve or accomplish these expectations, beliefs or projections.
Important factors that, in our view, could cause actual results to differ materially from those discussed in the forward-looking statements include the strength of world economies and currencies, general market conditions, including changes in charter hire rates and vessel values, changes in demand that may affect attitudes of time charterers to scheduled and unscheduled drydocking, changes in our vessel operating expenses, including dry-docking and insurance costs, or actions taken by regulatory authorities, potential liability from future litigation, domestic and international political conditions, potential disruption of shipping routes due to accidents and political events or acts by terrorists.
Risks and uncertainties are further described in reports filed by Eagle Bulk Shipping Inc. with the US Securities and Exchange Commission.
Visit our website at www.eagleships.com
Contact:
Company Contact:
Adir Katzav
Chief Financial Officer
Eagle Bulk Shipping Inc.
Tel. +1 212-785-2500
Investor Relations / Media:
Jonathan Morgan
Perry Street Communications, New York
Tel. +1 212-741-0014
--------------------------------------------------------------------------------
Source: Eagle Bulk Shipping Inc.