
Eagle Bulk Shipping Inc.
3Q 2006 Results Presentation
November 9, 2006

Forward Looking Statements
This presentation contains certain statements that may be deemed to be “forward-looking statements” within
the meaning of the Securities Acts. Forward-looking statements reflect management’s current views with
respect to future events and financial performance and may include statements concerning plans, objectives,
goals, strategies, future events or performance, and underlying assumptions and other statements, which are
other than statements of historical facts. The forward-looking statements in this presentation are based upon
various assumptions, many of which are based, in turn, upon further assumptions, including without
limitation, management's examination of historical operating trends, data contained in our records and other
data available from third parties. Although Eagle Bulk Shipping Inc. believes that these assumptions were
reasonable when made, because these assumptions are inherently subject to significant uncertainties and
contingencies which are difficult or impossible to predict and are beyond our control, Eagle Bulk Shipping Inc.
cannot assure you that it will achieve or accomplish these expectations, beliefs or projections. Important
factors that, in our view, could cause actual results to differ materially from those discussed in the forward-
looking statements include the strength of world economies and currencies, general market conditions,
including changes in charterhire rates and vessel values, changes in demand that may affect attitudes of time
charterers to scheduled and unscheduled drydocking, changes in our vessel operating expenses, including
dry-docking and insurance costs, or actions taken by regulatory authorities, ability of our counterparties to
perform their obligations under sales agreements and charter contracts on a timely basis, potential liability
from future litigation, domestic and international political conditions, potential disruption of shipping routes
due to accidents and political events or acts by terrorists. Risks and uncertainties are further described in
reports filed by Eagle Bulk Shipping Inc. with the US Securities and Exchange Commission.
1
Agenda
Third Quarter 2006 Highlights
The Fleet
Industry View
Financial Overview
Conclusion
2

3Q 2006 Highlights
3Q 2006 Highlights
Gross Time Charter Revenues of $30.7 million
Net Income of $9.1 million includes non-dilutive, non-cash
compensation charge of $3.1 million
Excluding the non-cash compensation charge, Adjusted
Net Income was $12.2 million or $0.34 per share
EBITDA1 of $22.1 million
Paid 3Q Cash Earnings Dividend of $0.51 on Nov 2, 2006
Took Delivery of the 3 Supramax vessels acquired for $105
million
Combined take-over time of only 1.3 days before
entering charters
All 3 vessels delivered and on charter within 15 days of
signing purchase contracts
1 EBITDA, as defined by our credit agreement, is Net Income plus Interest Expense, Depreciation and
Amortization, and Exceptional Items.
4
Newbuild Vessels
Fleet Impact*
Contracted for 2 Japanese 56,000
dwt Supramax vessels with IHI
Marine United for an average
contract price of $33.5 million each
Delivery expected in January 2010
and February 2010
Increased credit facility to $500
million from $450 million
Balance sheet remains conservative
at 40% net debt/capitalization
Number of vessels increases from 16
to 18
Cargo carrying capacity expands by
14% to 910,000 dwt
Reduces fleet average age
Increases availability from $235
million to over $260 million
Newbuild Costs to be Capitalized
eliminating any impact on current
cashflows
Recent Events – Investing in Future Cashflow
Quarterly Dividend Cashflow Maintained
* Proforma
5

The Fleet
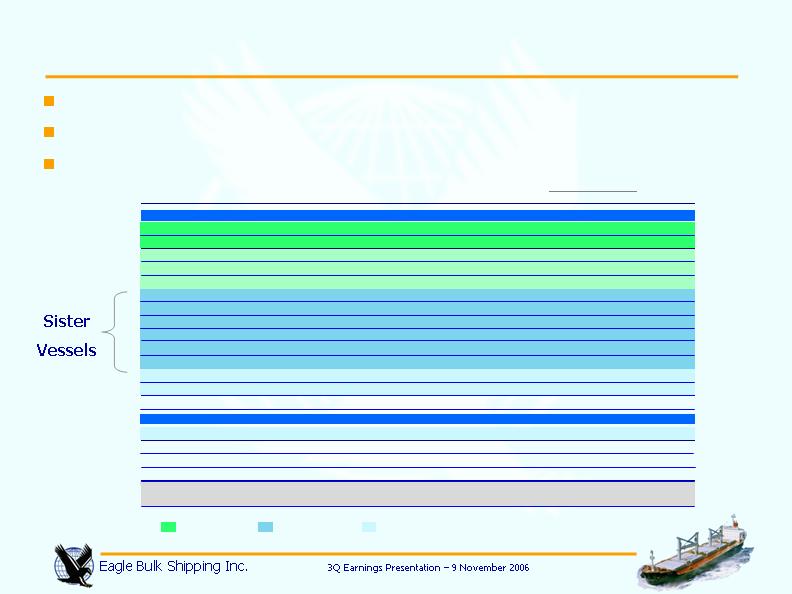
Average fleet age of under 6 years compared to industry average of over 15 years
Sistership strategy provides economies of scale
Cargo cranes and grabs on entire fleet maximizes utility of Eagle’s assets
Modern, High Quality Fleet of Handymax Vessels
7
Deadweight
Year
Length
Ship’s Cargo Gear
Vessel
(
Dwt)
Built
in meters
Cranes
Grabs
SUPRAMAX CLASS
Golden Eagle
56,000
2010
190 m
4 x 30 Tons
4 x 12 m3
Imperial Eagle
56,000
2010
190 m
4 x 30 Tons
Jaeger
52,248
2004
190 m
4 x 30 Tons
Kestrel I
50,326
2004
190 m
4 x 30 Tons
Tern
50,200
2003
190 m
4 x 30 Tons
Condor
50,296
2001
190 m
4 x 30 Tons
Falcon
50,296
2001
190 m
4 x 30 Tons
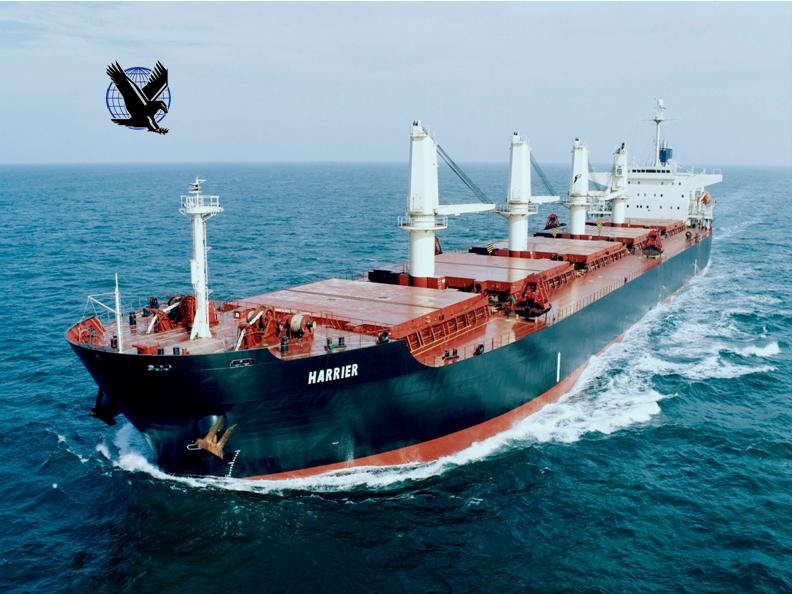
Harrier
50,296
2001
190 m
4 x 30 Tons
Hawk I
50,296
2001
190 m
4 x 30 Tons
Merlin
50,296
2001
190 m
4 x 30 Tons
Osprey I
50,206
2002
190 m
4 x 30 Tons
Cardinal
55,408
2004
190 m
4 x 30 Tons
Peregrine
50,913
2001
190 m
4 x 30 Tons
Heron
52,827
2001
190 m
4 x 30 Tons
HANDYMAX CLASS
Sparrow
48,225
2000
189 m
4 x 30 Tons
Kite
47,195
1997
190 m
4 x 30 Tons
Griffon
46,635
1995
190 m
4 x 30 Tons
Shikra
41,096
1984
185 m
4 x 25 Tons
Fleet Total Dwt
796,663
Fleet Average Age
5.7 years
(excluding Newbuild Vessels)
Newbuildings
Sister Ships
Similar Ships
**Represents Dwt weighted average age
4 x 12 m3
4 x 12 m3
4 x 12 m3
4 x 12 m3
4 x 12 m3
4 x 12 m3
4 x 12 m3
4 x 12 m3
4 x 12 m3
4 x 8 m3
4 x 12.5 m3
4 x 12 m3
4 x 12 m3
4 x 10 m3
4 x 10 m3
4 x 10 m3
4 x 8 m3

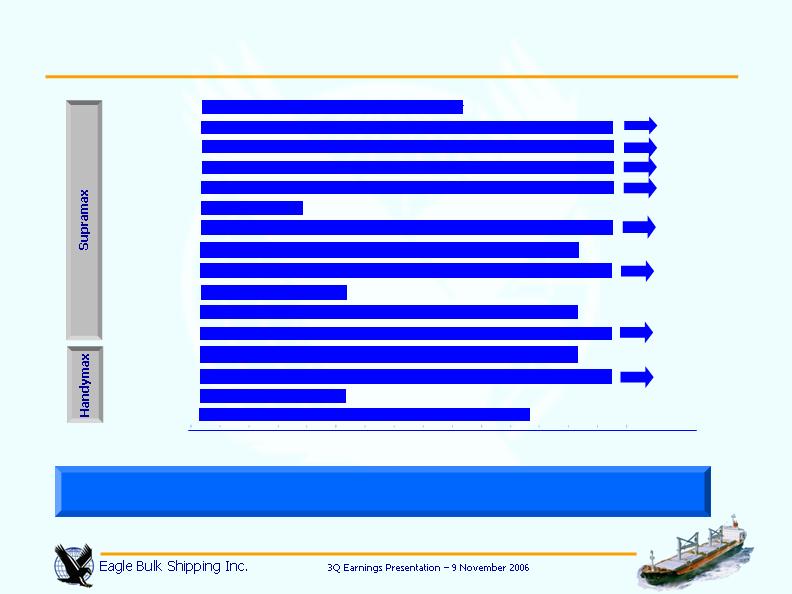
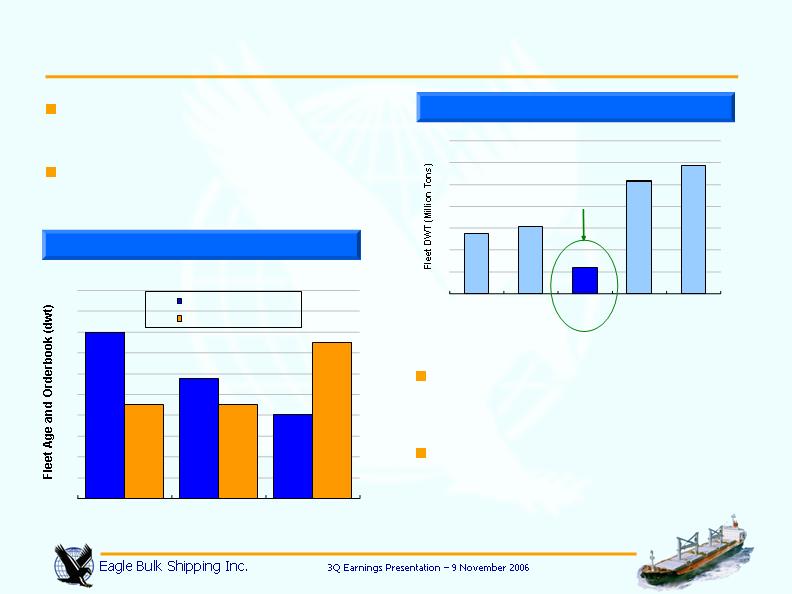
Eagle Captures Today’s Drybulk Values for Extended Periods
Charter renewals at today’s healthy rates extends high cashflow generation
Period cover extends revenue visibility and predictability and limits spot volatility
100% of 2006 fleet covered by contracts
79% of 2007 fleet covered by contracts
Vessel
Charter
Commences
Charter
Period
Charter Rate
Sparrow
Oct 2006 -
Jan 2007
11 - 13 months
$24,000 per day
(floor rate) plus
profit share
Hawk I
Apr 2007
24 - 26 months
$22,000 per day
Condor
Oct 2006 -
Mar 2007
26 - 29 months
$20,500 per day
Griffon
Jan - Apr
2007
24 - 26 months
$20,075 per day
8
Time Charter Contracts Provide Stable and Visible Cashflows
Fleet contracted revenues in excess of $175 million at attractive rates
9
SHIKRA
KITE
GRIFFON
SPARROW
PEREGRINE
HERON
CARDINAL
OSPREY I
MERLIN
HAWK I
HARRIER
FALCON
CONDOR
KESTREL I
TERN
JAEGER
3Q 2007
4Q 2007
4Q 2006
2Q 2006
$18,550
Daily
Charter Rates
$14,800
$20,075
$24,000
$21,000
$22,000
$24,000
$23,750
$20,500
$24,000
$20,500
$26,500
$20,950
$18,750
$19,000
1Q 2007
$14,750
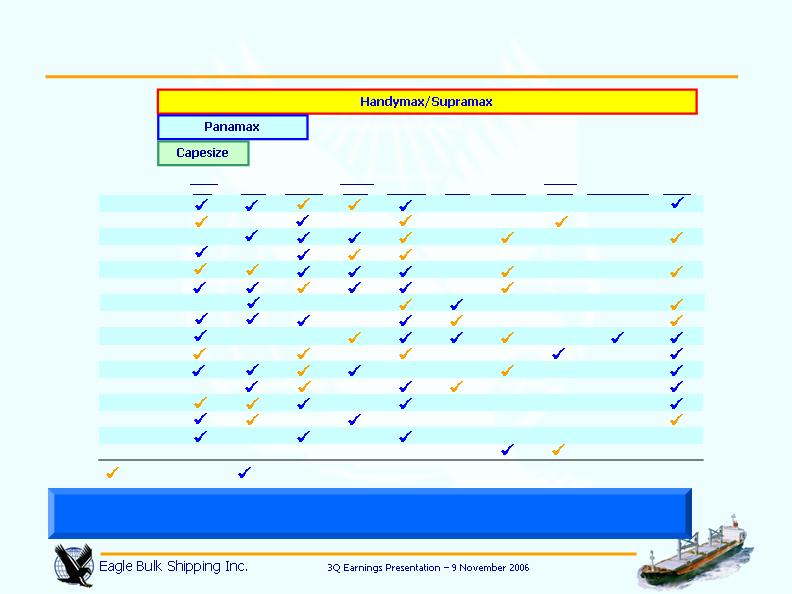
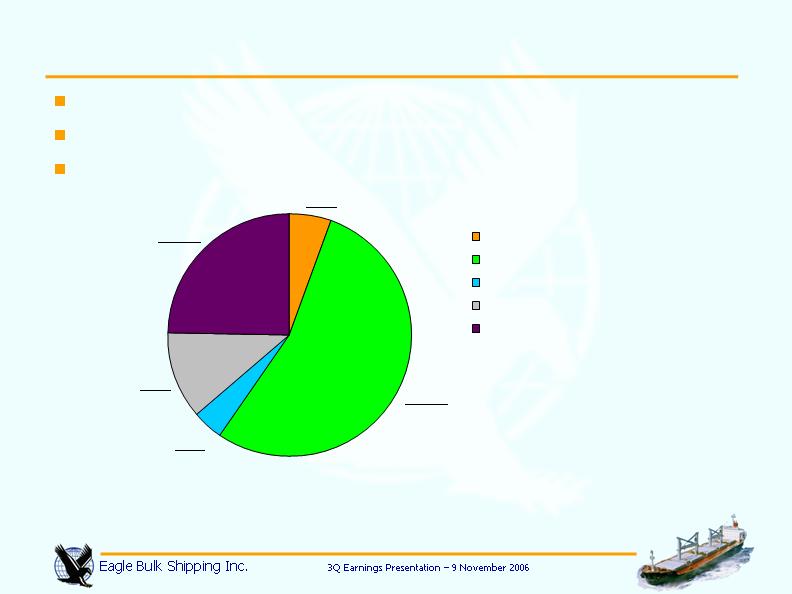
Charterers Attracted by Versatility of Handymax Vessels
MISC. cargoes include Phosrock, Sugar, HBI, and Concentrates
Eagle’s Cargo Carriage Span the Drybulk Sector
3Q 2006 YTD 2006
10
IRON
ORE
COAL
GRAINS
OTHER
ORES
CEMENT
COKE
STEELS
SCRAP
IRON
AGGREGATES
MISC.
Cardinal
Condor
Falcon
Griffon
Harrier
Hawk I
Heron
Kite
Merlin
Osprey I
Peregrine
Shikra
Sparrow
Kestrel I
Tern
Jaeger

Industry View
Drybulk Demand Easily Absorbing Supply
World output growth expected at 5.1% in 2006
and forecast 4.9% in 2007
Strongest 4-year period of global
expansion since early 1970s
China to sustain growth at an average 10% for
2006 and 2007
Emerging Markets growth at 7.3% in 2006 and
7.2% in 2007
India to sustain growth at 8% for 2006
and 2007
Persian Gulf states to invest $100 billion for
infrastructure
Gulf States 2006 GDP growth at 7.2%
24% of the world’s high-rise building
cranes are in Dubai
Shift in trade patterns towards BRIC countries
(Brazil, Russia, India, China) increases ton-mile
demand
Chinese coastal trade, an unreported shipping
statistic, now a major factor
Source: IMF, Financial Times
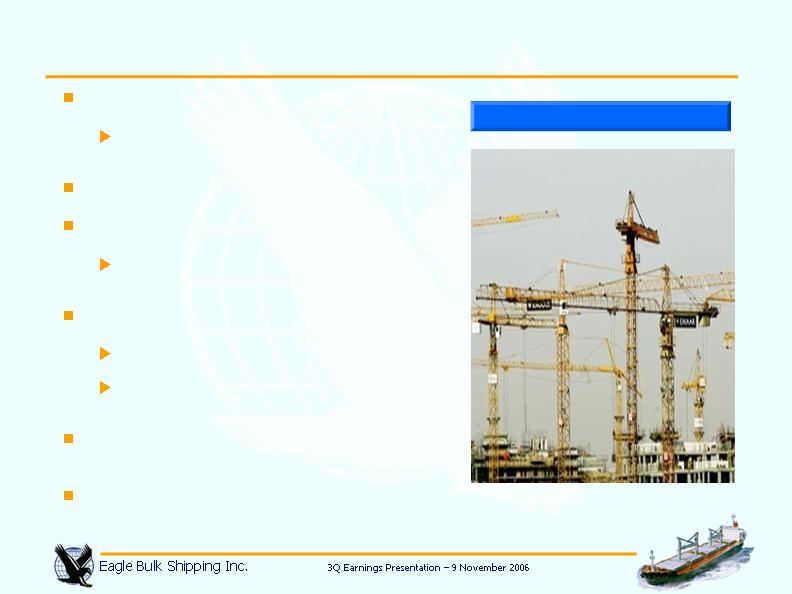
Construction Boom
Dubai
12
Eagle Fleet Well-Positioned for Changing Trade Patterns
Chinese 2006 iron ore imports jump by
16% to 320m tons while cement and steel
exports surge 126% and 58% respectively
– a major boost for Supramax owners
Grain demand into India forecast to
increase by 6m tons* – this equates to an
extra 150 cargoes on Handymax/Supramax
vessels
Approximately 60% of Chinese berths
cannot handle Panamax or Capesize
vessels**
Approximately 25% of Chinese berths
require vessels with cargo gear ** – a
constraint only satisfied by sub-Panamax
sector vessels
Vessel Gear increases flexibility and broadens customer base
Source: * Clarksons ; ** J.E.Hyde
13
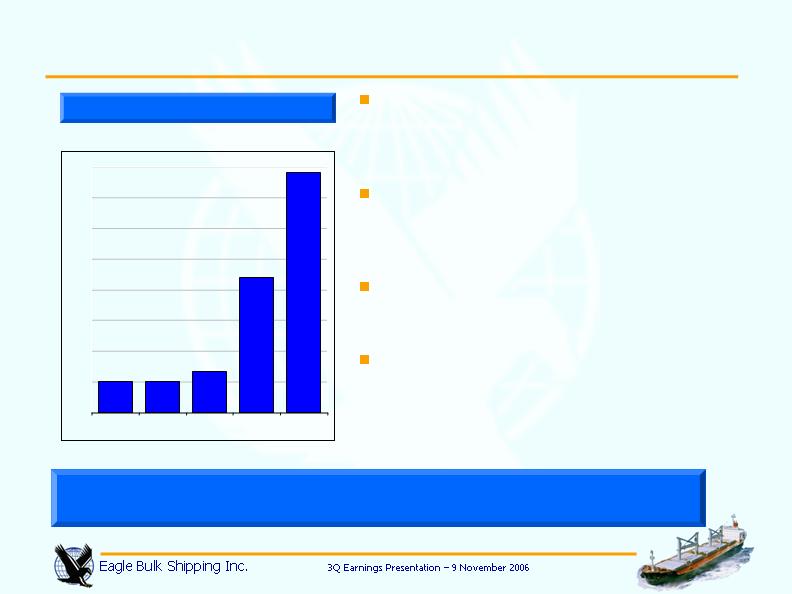
Source: HSBC – July 2006
Chinese Cement Exports
5.0
5.0
6.6
22.0
39.0
-
5
10
15
20
25
30
35
40
2002
2003
2004
2005
2006
(m tons)
Drybulk supply position :
Lowest supply as a percentage
of existing fleet
Lowest orderbook supply in
million dwt
Only sector with consistently
declining orderbook through
2009
Striped Bars = Deliveries through September 2006
14
World Vessel Supply 2006-2009
Source: Clarksons as of October 2006
Drybulk Sector – Best Market to be in the Next 3 Years
9.40
0.42
11.72
1.36
23.30
33.01
1.54
31.62
19.07
14.11
39.22
1.18
Drybulk
(m dwt)
Tankers
(m dwt)
Containers
(m teu)
2006 2007 2008 2009
17.73
17.95
0.94
2006 2007 2008 2009
2006 2007 2008 2009
Supply as % of fleet :
as of
1 Jan 06
1 Oct 06
Drybulk :
19%
21%
Tankers :
25%
34%
Containers:
53%
53%
12 of the 16 vessels owned by the
Company are Supramaxes
Smallest segment of the drybulk
market provides opportunities
New Supramax Asset Class Services Growing Global Needs
Source: Clarksons as of October 2006
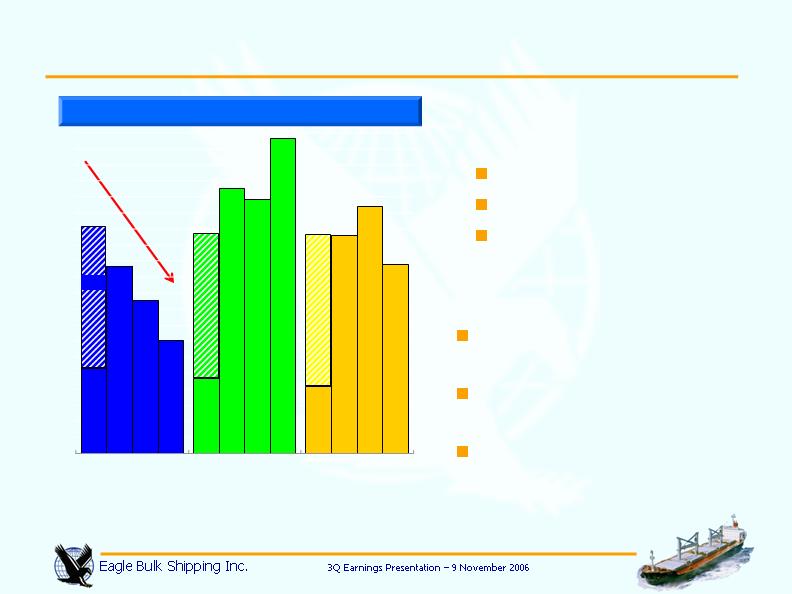
Aging Handymax fleet — 32% of
capacity > 20 years old
Number of Handymax vessels over
20 years old is 200% of the
orderbook
Orderbook and Fleet Age
102.8
23.6
61.0
117.2
55.6
0
20
40
60
80
100
120
140
Handy
(10,000/34,999
dwt)
Handymax
(35,000/49,999
dwt)
Supramax
(50,000/59,999
dwt)
Panamax
(60,000/99,999
dwt)
Capesize
(>100,000 dwt)
2,276 Vsls
445 Vsls
692 Vsls
1,434 Vsls
1,435 Vsls
Eagle’s focus
15
World Dry Bulk Fleet
32%
23%
16%
18%
18%
30%
0%
4%
8%
12%
16%
20%
24%
28%
32%
36%
40%
Handymax
Panamax
Capesize
% of Fleet > 20 years
Orderbook as % of Fleet

Financial Overview
Fleet Data
Ownership days: The Company defines ownership days as the aggregate number of days in a period during which each
vessel in its fleet has been owned.
Available days: The Company defines available days as the number of ownership days less the aggregate number of days
that its vessels are off-hire due to vessel familiarization upon acquisition, scheduled drydocks, repairs or repairs under
guarantee, vessel upgrades or special surveys and the aggregate amount of time that we spend positioning our vessels.
Operating days: The Company defines operating days as the number of its available days in a period less the aggregate
number of days that the vessels are off-hire due to any reason, including unforeseen circumstances.
Drydock days: The Company undertakes major capital expenditures which include a maintenance program of regularly
scheduled drydocking necessary to preserve the quality of our vessels as well as to comply with international shipping
standards and environmental laws and regulations. Although the Company has some flexibility regarding the timing of its
dry docking, management anticipates that vessels are to be drydocked every two and a half years. The Company
anticipates that this process of recertification will require it to reposition these vessels from a discharge port to shipyard
facilities, which will reduce available days and operating days during that period.
Net revenues include billed time charter revenues, deductions for brokerage commissions and amortization of net prepaid
and deferred charter revenue.
Fleet Operating Days
Q1 2006
Q2 2006
Q3 2006
Q4 2006 (E)
Ownership Days
1,170
1,183
1,463
1,472
Less : Drydock Days
44
-
20
-
Available Days
1,126
1,183
1,443
1,472
Operating Days
1,116
1,181
1,437
-
Fleet Utilization
99.1%
99.9%
99.6%
-
Three months ended
17

3rd Quarter 2006 Earnings
($000's)
REVENUES
Net Time Charter Revenues
29,084
78,690
Less : Amortization of Prepaid and Deferred Revenue
725
2,436
Net Revenues
28,359
76,254
EXPENSES
Vessel Expenses
6,118
15,742
Depreciation and Amortization
5,981
15,738
General & Administrative Expenses
1,267
3,365
Non-cash Compensation Expense
3,077
5,768
Total Expenses
16,442
40,614
OPERATING INCOME
11,916
35,639
Interest Expense
3,180
7,364
Interest Income
(365)
(1,010)
NET INCOME
$9,101
$29,285
Basic and Diluted Income per Common Share
$0.25
$0.86
Weighted Average Shares Outstanding
35,900,000
34,086,813
Diluted Shares Outstanding
35,900,678
34,086,848
Adjusted Net Income
(non-GAAP measure)
:
Net Income
$9,101
$29,285
Add : Non-cash Compensation Expense
3,077
5,768
Adjusted Net Income :
$12,177
$35,053
Basic and Diluted Adjusted Net Income per Common Share
$0.34
$1.03
Three-months ended
Sept. 30, 2006
Nine-months ended
Sept. 30, 2006
18
Daily cash breakeven cost of $6,947 per day per vessel (2006E)
Low cost basis enables cash operating margins of 75%
No principal repayments until 2012
Low Breakeven Cost Strategy
The Company is anticipating higher crewing costs and higher costs for oil based supplies including lubes and paints. The
Company is also making allowance for constraints in yard drydocking capacity which has driven up drydocking costs.
19
$384
$3,750
$284
$806
$1,723
Dry-Dock
Vessel Expenses
Technical Mgt Fees
G&A
Cash Interest (net)
Strong Balance Sheet
* Net Debt is pro forma after taking into effect 3Q Dividend payment of $18.31 million.
** Liquidity includes undrawn amounts available under the enhanced credit facility
BALANCE SHEET DATA
Sept. 30, 2006
Newbuild
Acquisitions
Pro forma
Sept. 30, 2006
(in $ 000's)
(unaudited)
Cash
$23,214
-
$23,214
Other Current Assets
6,841
-
6,841
Advances for Vessels
-
25,048
25,048
Vessels, net
507,471
-
507,471
Restricted Cash
6,525
-
6,525
Other Assets
7,833
-
7,833
TOTAL ASSETS
551,884
576,932
Current Liabilities
7,759
-
7,759
Long-term Debt
214,800
25,048
239,848
Stockholders' Equity
329,326
-
329,326
Book Capitalization
569,174
Net Debt / Capitalization*
40.1%
Liquidity **
271,582
20
Revolving Credit Facility increased to $500 million
Interest only until 2012
* Thereafter semi-annual reduction in availability to Balloon
Ample Liquidity for Growth
Credit Facility Increased at Favorable Terms
Amount
$500 million
Maturity
July 2016
Interest Only until (at least)
July 2012
Interest Margin
Libor + 75/85
basis points
Commitment Fees on
undrawn amounts
25 basis points
Availabilty in full for next *
6 years
Balloon
$270 million
21

Conclusion
Poised for Growth
High Dividends
Operate a modern, homogenous
Supramax fleet
Stable and visible cashflows from
1 to 3 year time charters
79% of 2007 fleet days covered
by fixed contracts
Low cash breakeven of
$6,947/day
Strong balance sheet with Net
Debt to Capital of 40%
No debt amortization until 2012
Increased liquidity of $271m
Full cash payout dividend policy
Paid Dividends of $86.4 million or
$2.61 per share to shareholders
since September 2005
Demonstrates Strong Yield
Conclusion - Accretive Growth Strategy
Eagle Bulk – a solid, clear, focused investment story
Dividend Reinvestment Plan in effect
23

Appendix

Reconciliation of Net Income to EBITDA*
* EBITDA is as defined by the Company’s Credit Agreements. EBITDA represents operating earnings before extraordinary items, depreciation
and amortization, interest expense, and income taxes, if any. EBITDA is included because it is used by certain investors to measure a company's
financial performance. EBITDA is not an item recognized by GAAP and should not be considered a substitute for net income, cash flow from
operating activities and other operations or cash flow statement data prepared in accordance with accounting principles generally accepted in the
United States or as a measure of profitability or liquidity. EBITDA is presented to provide additional information with respect to the Company’s
ability to satisfy its obligations including debt service, capital expenditures, and working capital requirements. While EBITDA is frequently used as
a measure of operating results and the ability to meet debt service requirements, the definition of EBITDA used here may not be comparable to
that used by other companies due to differences in methods of calculation. The Company’s revolving credit facility permits it to pay dividends in
amounts up to its earnings before extraordinary or exceptional items, interest, taxes, depreciation and amortization (Credit Agreement EBITDA),
less the aggregate amount of interest incurred and net amounts payable under interest rate hedging agreements during the relevant period and
an agreed upon reserve for dry-docking, provided that there is not a default or breach of loan covenant under the credit facility and the payment of
the dividends would not result in a default or breach of a loan covenant. Therefore, the Company believes that this non-GAAP measure is
important for its investors as it reflects its ability to pay dividends.
Reconciliation of Net Income to Credit Agreement EBITDA
(in $ 000's, rounded)
Net Income
9,101
$
29,285
$
Interest Expense
3,180
7,364
Depreciation and Amortization
5,981
15,738
Amortization of Pre-paid Revenue
725
2,436
EBITDA
18,987
54,822
Adjustments for exceptional items
Non-cash Compensation Expense
3,077
5,768
Credit Agreement EBITDA
22,064
$
60,591
$
Three-months ended
Sept. 30, 2006
Nine-months ended
Sept. 30, 2006
25
Eagle Bulk Shipping Inc.