
Eagle Bulk Shipping Inc.
1Q 2007 Results Presentation
8 May 2007
Forward Looking Statements
This presentation contains certain statements that may be deemed to be “forward-looking statements” within
the meaning of the Securities Acts. Forward-looking statements reflect management’s current views with
respect to future events and financial performance and may include statements concerning plans, objectives,
goals, strategies, future events or performance, and underlying assumptions and other statements, which are
other than statements of historical facts. The forward-looking statements in this presentation are based upon
various assumptions, many of which are based, in turn, upon further assumptions, including without
limitation, management's examination of historical operating trends, data contained in our records and other
data available from third parties. Although Eagle Bulk Shipping Inc. believes that these assumptions were
reasonable when made, because these assumptions are inherently subject to significant uncertainties and
contingencies which are difficult or impossible to predict and are beyond our control, Eagle Bulk Shipping Inc.
cannot assure you that it will achieve or accomplish these expectations, beliefs or projections. Important
factors that, in our view, could cause actual results to differ materially from those discussed in the forward-
looking statements include the strength of world economies and currencies, general market conditions,
including changes in charterhire rates and vessel values, changes in demand that may affect attitudes of time
charterers to scheduled and unscheduled drydocking, changes in our vessel operating expenses, including
dry-docking and insurance costs, or actions taken by regulatory authorities, ability of our counterparties to
perform their obligations under sales agreements and charter contracts on a timely basis, potential liability
from future litigation, domestic and international political conditions, potential disruption of shipping routes
due to accidents and political events or acts by terrorists. Risks and uncertainties are further described in
reports filed by Eagle Bulk Shipping Inc. with the US Securities and Exchange Commission.
1
Agenda
First Quarter 2007 Highlights
The Fleet
Industry View
Financial Overview
Conclusion
2

1Q 2007 Highlights

1Q 2007 Highlights
1Q Gross Time Charter Revenues of $29.5 million
Net Income of $8.5 million includes non-dilutive, non-cash
compensation charge of $3.2 million
Excluding the non-cash compensation charge, Adjusted
Net Income was $11.7 million or $0.31 per share
EBITDA1 of $21.8 million
Declared and paid 1Q Cash Earnings Dividend of $0.50 per
share
Acquired three Supramax vessels for $138.7 million
Sold our oldest and smallest vessel for gain of $0.9 million
Expanded newbuilding program to four Supramax vessels
Raised $110 million in equity
1 EBITDA, as defined by our credit agreement, is Net Income plus Interest Expense, Depreciation and
Amortization, and Exceptional Items.
4
Purchased three modern Supramaxes for $138.7 million:
On April 24, 2007, Shrike, a 53,343 dwt Supramax vessel built in 2003,
delivered and commenced a two-year charter at a daily rate of $24,600.
Skua, a 53,350 dwt Supramax vessel built in 2003, expected to be
delivered in June 2007 and enter into a two-year charter at a daily rate of
$24,200.
Kittiwake, a 53,146 dwt Supramax vessel built in 2002, expected to be
delivered in June 2007 and enter into a one-year charter at a daily rate of
$30,400*.
Accretive transactions funded with a combination of common shares and
drawings from our credit facility, maintaining conservative debt structure.
New incremental commitment of $250 million increases liquidity to
approximately $460 million to help fund future growth.
New Acquisitions – Executing Our Growth Strategy
Young Supramax Fleet Maintains Quarterly Dividends
* The charter rate may reset at the beginning of each month based on the average time charter rate for the Baltic Supramax Index, but
in no case be less than $24,400 per day.
5
In 1Q-07 executed two additional contracts to construct 56,000 dwt
Supramax vessels at IHI Marine United, a pre-eminent Japanese shipyard, at
contract price of $33.2 million each
Company now has signed contracts for construction of four 56,000 dwt
Supramax vessels and placed an aggregate of $51 million in deposits
CROWNED EAGLE to be delivered in November 2008
CRESTED EAGLE to be delivered in February 2009
GOLDEN EAGLE to be delivered in January 2010
IMPERIAL EAGLE to be delivered in February 2010
Subsequent to 1Q-07, signed letter of intent for construction of fifth Japanese
56,000 dwt Supramax at a contract price of $33.6 million. Vessel expected to
be delivered in April 2009.
Investing for the Future – Capturing Growth
Sister Ships enhance operating efficiencies
6

The Fleet
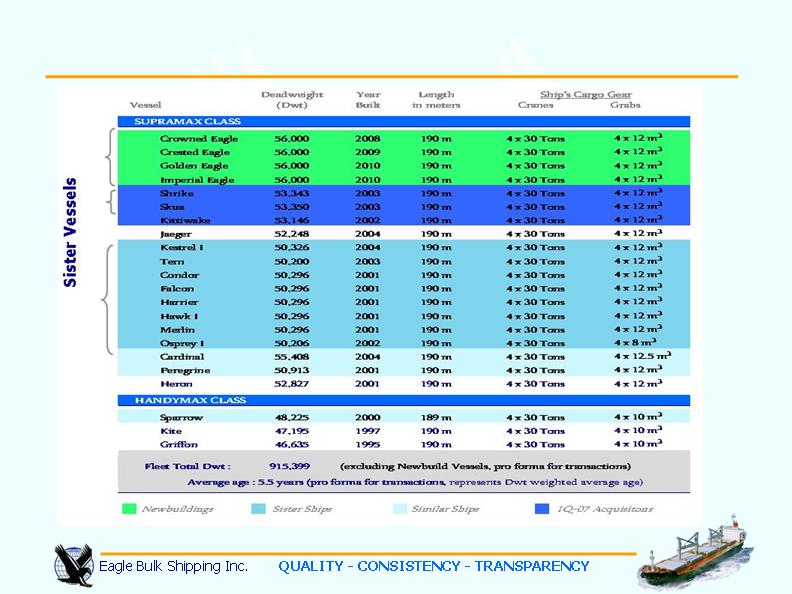
Modern, High Quality Geared Fleet of Supramax Vessels
8
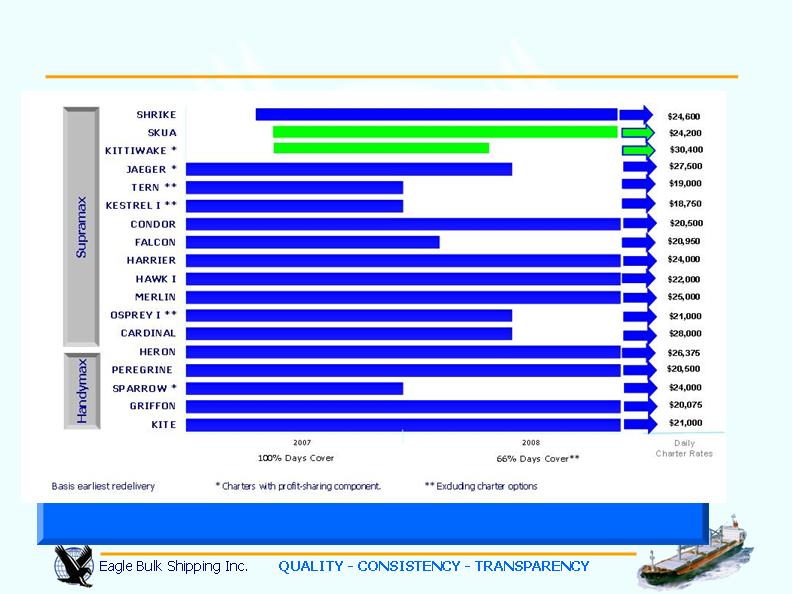
Eagle Captures Today’s Drybulk Values for Extended Periods
Charter renewals at today’s healthy rates extends high cashflow generation
Period cover extends revenue visibility and predictability and limits spot volatility
Secure Cash Flows Provide Stable Dividends
1 The MERLIN charter rate is $27,000 per day for first year, $25,000 per day for the second year, and $23,000 for the third year.
For purposes of revenue recognition, the charter is reflected on a straight-line basis at $25,000 per day for 36 to 39 months in
accordance with generally accepted accounting principles in the United States.
2 KITTIWAKE will deliver to the charterer at time charter rate of $30,400 per day for 11 to 13 months. The charter rate may reset
at the beginning of each month based on the average time charter rate for the Baltic Supramax Index, but in no case be less
than $24,400 per day.
9
Vessel
Charter
Commences
Charter Period
Charter Rate
Merlin
Oct - Dec
2007
36 - 39 months
$25,000 per day
1
Heron
Dec 2007 -
Feb 2008
36 - 39 months
$26,375 per day
Shrike
Apr 2007
24 - 27 months
$24,600 per day
Skua
Jun-07
23 - 25 months
$24,200 per day
Kittiwake
Jun-07
11 - 13 months
$30,400 per day
2
Time Charter Contracts Provide Stable and Visible Cashflows
Contracted gross revenues in excess of $300 million** at attractive rates
Renewal Rates
10

Industry View
Drybulk Demand Easily Absorbing Supply
China’s 1Q-07 GDP growth at 11%
India to invest $500 billion in infrastructure and
manufacturing over the next 3 years
Persian Gulf states investing $100 billion for
infrastructure
1Q-07 trade volume growth up 6.3%
1Q-07 ton-mile growth up
India diverts iron ore production to
internal needs – increasing long haul
supply from Brazil and Australia
Shift in trade patterns towards BRIC
countries (Brazil, Russia, India, China)
increases ton-mile demand
Chinese coastal trade, an unreported shipping
statistic, now a major factor
Source: IMF, Financial Times
Lead Demand Indicator
1Q-07 Chinese steel output
up 22% year-on-year
1Q-07 Chinese iron ore
imports up 24%
Chinese grain stocks down
over 150m tons to 70m
tons since 2000 – more
long haul grain trades
Drybulk fleet cannot keep
pace with demand
12

New Supramax Asset Class Services Growing Global Needs
Approximately 60% of Chinese berths cannot
handle Panamax or Capesize vessels*
Approximately 25% of Chinese berths require
vessels with cargo gear * – a constraint only
satisfied by sub-Panamax sector vessels
Vessel Gear increases flexibility and broadens customer base
Source: * J.E.Hyde
Exports of cement and steel out of China
expected to maintain healthy growth rates in
excess of 20%.
New mining capacities in Australia and Brazil
to increase iron ore output by 70-80 million
tons per annum.
Reduced Indian ore exports increases ton
miles as China increases imports from Brazil.
Protected Market
850m ton sub-Panamax market
13

Charterers Attracted by Versatility of Supramax Vessels
MISC. cargoes include Phosrock, Sugar, HBI, and Concentrates
28% of Eagle’s 1Q-07 Cargoes were “Capesize and Panamax cargoes”
14
Drybulk supply position :
Lowest supply as a
percentage of existing fleet
Lowest orderbook supply in
million dwt
15
Supply as % of fleet :
as of 1 April 07
Drybulk : 30%
Tankers : 40%
Containers: 48%
World Vessel Supply 2007-2009
Source: Clarksons as of April 2007 Deliveries
Drybulk Sector – Best Market to be in the Next 3 Years
33.82
27.00
1.49
22.10
36.70
1.53
1.44
54.02
28.39
Drybulk
(m dwt)
Tankers
(m dwt)
Containers
(m teu)
2007 2008 2009
6.32
0.27
2007 2008 2009
2007 2008 2009
3.6
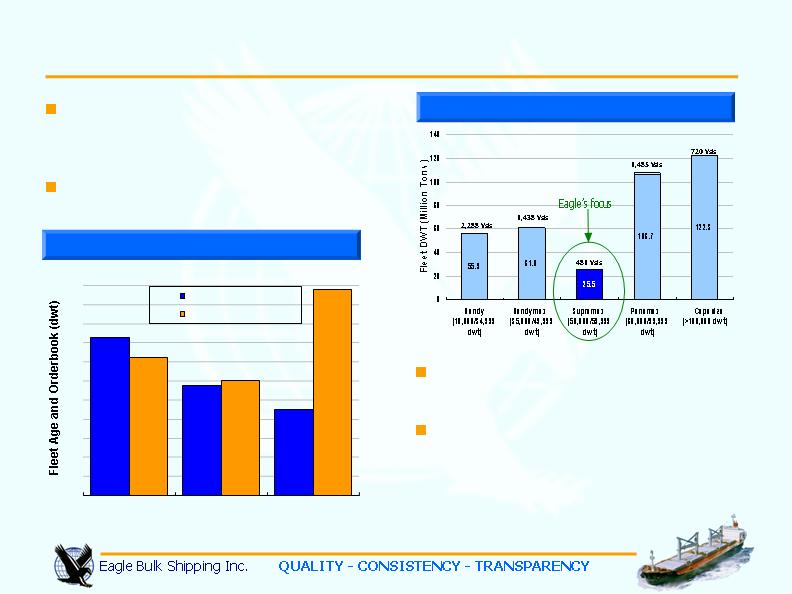
15 of the 18 vessels in the
Company’s on-the-water fleet are
Supramaxes
Smallest segment of the drybulk
market provides opportunities
Aging Handymax Fleet
Source: Clarksons as of April 2007
Aging Handymax fleet — 33% of
capacity > 20 years old
Negligible scrapping since 2003
could see surge of ships removed
from market in 2009-11
Orderbook and Fleet Age
16
World Dry Bulk Fleet
33%
23%
18%
29%
24%
43%
0%
4%
8%
12%
16%
20%
24%
28%
32%
36%
40%
44%
Handymax
Panamax
Capesize
% of Fleet > 20 years
Orderbook as % of Fleet

Financial Overview

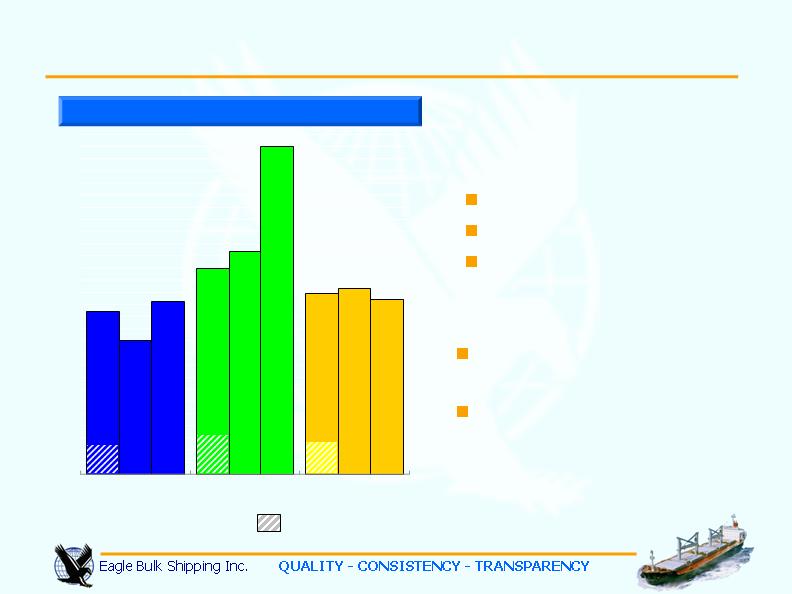
High Utilization Rate = Maximum Revenue
Revenue Growth
18
99.1%
99.4%
Fleet Utilization
1,116
1,387
Operating Days
1,126
1,395
Available Days
44
12*
Less: Drydock Days
1,170
1,407
Ownership Days
1Q-06
1Q-07
* Includes time spent positioning the SHIKRA for sale.
2007(E) - Pro forms for acquisitions
Net revenues based on a pro forma 2007 fleet charter cover
of 100% and assuming earliest charter redelivery rates.
Net revenues include billed time charter revenues, deductions
for brokerage commissions and amortization of net prepaid
and deferred charter revenue. Please refer to our financial
statements for a definition of Ownership days, Available days,
Operating days, and Fleet Utilization.
-
20
40
60
80
100
120
140
2005
2006
2007 (E)
$ m
Net Revenues
1st Quarter Earnings
19
($000's)
REVENUES
Net Time Charter Revenues
27,989
24,727
Less : Amortization of Prepaid and Deferred Revenue
1,080
937
Net Revenues
26,909
23,790
EXPENSES
Vessel Expenses
6,246
4,705
Depreciation and Amortization
5,791
4,820
General & Administrative Expenses
1,644
985
Non-cash Compensation Expense
3,259
753
Gain on Sale of Vessel
(873)
-
Total Expenses
16,067
11,263
OPERATING INCOME
10,842
12,527
Interest Expense
3,152
2,066
Interest Income
(798)
(332)
NET INCOME
$8,488
$10,793
Basic and Diluted Income per Common Share
$0.23
$0.33
Weighted Average Shares Outstanding
37,450,578
33,150,000
Diluted Shares Outstanding
37,453,796
33,150,106
Adjusted Net Income
(non-GAAP measure)
:
Net Income
$8,488
$10,793
Add : Non-cash Compensation Expense
3,259
753
Adjusted Net Income :
$11,747
$11,546
Basic and Diluted Adjusted Net Income per Common Share
$0.31
$0.35
Mar. 31, 2007
Mar. 31, 2006
Three-months ended
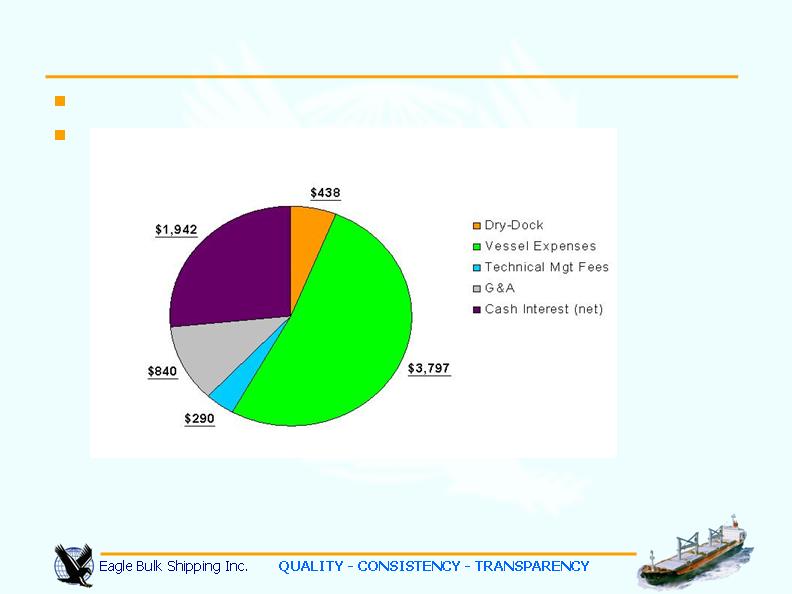
Daily cash breakeven cost of $7,307 per day per vessel (2007E)
No principal repayments until 2012
Low Breakeven Cost Strategy
The Company is anticipating higher crewing costs and higher costs for oil based supplies including lubes and paints. The
Company is also making allowance for constraints in yard drydocking capacity which has driven up drydocking costs.
20
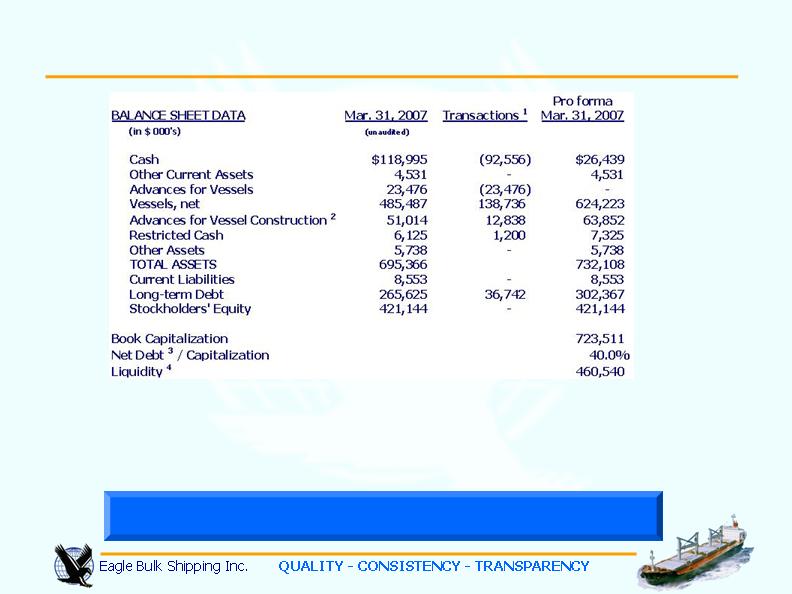
Strong Balance Sheet
1 Purchase of Shrike, Skua and Kittiwake, and deposit for the 5th Newbuild vessel.
2 Newbuild Costs to be Capitalized eliminating any impact on current cash flows.
3 Net Debt is pro forma after taking into effect 1Q-07 Dividend payment of $20.85 million.
4 Liquidity includes amounts available under the newly enhanced credit commitment
Quarterly Dividend Cash Flow Maintained
21
$500m existing Revolving Credit Facility
$250m Incremental Commitment
Interest only until 2012
* Thereafter semi-annual reduction in availability to Balloon
Ample Liquidity for Growth
22
$750 million Commitment at Favorable Terms
Commitment Amount
$750 million
Maturity
July 2016
Interest Only until (at least)
July 2012
Interest Margin
Libor + 75/85
basis points
Commitment Fees on
undrawn revolver
25 basis points
Availabilty in full until *
July 2012
Balloon (fully drawn)
$405 million

Conclusion

Poised for Growth
High Dividends
Operate a modern, homogeneous
Supramax fleet
Stable and visible cashflows from
1 to 3 year time charters
100% of 2007 fleet days1 covered
by fixed contracts
Low cash breakeven of $7,307
per day
Strong balance sheet with Net
Debt to Capital of 40%
No debt amortization until 2012
Accretive acquisition strategy
1 Pro forma for acquisition
Full cash payout dividend policy
Declared Dividends of $125.6 million or
$3.63 per share to shareholders
since September 2005
Demonstrates Strong Yield
Conclusion - Accretive Growth Strategy
Eagle Bulk – a solid, clear, focused investment story
Dividend Reinvestment Plan in effect
24

Appendix
Reconciliation of Net Income to EBITDA*
* EBITDA is as defined by the Company’s Credit Agreements. EBITDA represents operating earnings before extraordinary items, depreciation
and amortization, interest expense, and income taxes, if any. EBITDA is included because it is used by certain investors to measure a company's
financial performance. EBITDA is not an item recognized by GAAP and should not be considered a substitute for net income, cash flow from
operating activities and other operations or cash flow statement data prepared in accordance with accounting principles generally accepted in
the United States or as a measure of profitability or liquidity. EBITDA is presented to provide additional information with respect to the
Company’s ability to satisfy its obligations including debt service, capital expenditures, and working capital requirements. While EBITDA is
frequently used as a measure of operating results and the ability to meet debt service requirements, the definition of EBITDA used here may not
be comparable to that used by other companies due to differences in methods of calculation. The Company’s revolving credit facility permits it to
pay dividends in amounts up to its earnings before extraordinary or exceptional items, interest, taxes, depreciation and amortization (Credit
Agreement EBITDA), less the aggregate amount of interest incurred and net amounts payable under interest rate hedging agreements during
the relevant period and an agreed upon reserve for dry-docking, provided that there is not a default or breach of loan covenant under the credit
facility and the payment of the dividends would not result in a default or breach of a loan covenant. Therefore, the Company believes that this
non-GAAP measure is important for its investors as it reflects its ability to pay dividends.
26
Reconciliation of Net Income to Credit Agreement EBITDA
(in $ 000's, rounded)
Net Income
8,488
$
10,793
$
Interest Expense
3,152
2,066
Depreciation and Amortization
5,791
4,820
Amortization of Pre-paid Revenue
1,080
937
EBITDA
18,511
18,615
Adjustments for exceptional items
Non-cash Compensation Expense
3,259
753
Credit Agreement EBITDA
21,770
$
19,368
$
Mar. 31, 2007
Mar. 31, 2006
Three-months ended
Eagle Bulk Shipping Inc.