UNITED STATES
SECURITIES AND EXCHANGE COMMISSION
Washington, D.C. 20549
FORM N-CSR
CERTIFIED SHAREHOLDER REPORT OF REGISTERED
MANAGEMENT INVESTMENT COMPANIES
Investment Company Act file number 811-21750
Kayne Anderson Energy Total Return Fund, Inc.
(Exact name of registrant as specified in charter)
| | |
| 717 Texas Avenue, Suite 3100, Houston, Texas | | 77002 |
| (Address of principal executive offices) | | (Zip code) |
David Shladovsky, Esq.
KA Fund Advisors, LLC, 717 Texas Avenue, Suite 3100, Houston, Texas 77002
(Name and address of agent for service)
Registrant’s telephone number, including area code: (713) 493-2020
Date of fiscal year end: November 30, 2012
Date of reporting period: November 30, 2012
Form N-CSR is to be used by management investment companies to file reports with the Commission not later than 10 days after the transmission to stockholders of any report that is required to be transmitted to stockholders under Rule 30e-1 under the Investment Company Act of 1940 (17 CFR 270.30e-1). The Commission may use the information provided on Form N-CSR in its regulatory, disclosure review, inspection, and policymaking roles.
A registrant is required to disclose the information specified by Form N-CSR, and the Commission will make this information public. A registrant is not required to respond to the collection of information contained in Form N-CSR unless the Form displays a currently valid Office of Management and Budget (“OMB”) control number. Please direct comments concerning the accuracy of the information collection burden estimate and any suggestions for reducing the burden to Secretary, Securities and Exchange Commission, 450 Fifth Street, NW, Washington, DC 20549-0609. The OMB has reviewed this collection of information under the clearance requirements of 44 U.S.C. § 3507.
Item 1. Reports to Stockholders.
The report of Kayne Anderson Energy Total Return Fund, Inc. (the “Registrant”) to stockholders for the fiscal year ended November 30, 2012 is attached below.

Energy Total Return Fund

KYE Annual Report
November 30, 2012
CONTENTS
CAUTIONARY NOTE REGARDING FORWARD-LOOKING STATEMENTS: This report of Kayne Anderson Energy Total Return Fund, Inc. (the “Fund”) contains “forward-looking statements” as defined under the U.S. federal securities laws. Generally, the words “believe,” “expect,” “intend,” “estimate,” “anticipate,” “project,” “will” and similar expressions identify forward-looking statements, which generally are not historical in nature. Forward-looking statements are subject to certain risks and uncertainties that could cause actual results to materially differ from the Fund’s historical experience and its present expectations or projections indicated in any forward-looking statement. These risks include, but are not limited to, changes in economic and political conditions; regulatory and legal changes; energy industry risk; commodity pricing risk; leverage risk; valuation risk; non-diversification risk; interest rate risk; tax risk; and other risks discussed in the Fund’s filings with the Securities and Exchange Commission (“SEC”). You should not place undue reliance on forward-looking statements, which speak only as of the date they are made. The Fund undertakes no obligation to update or revise any forward-looking statements made herein. There is no assurance that the Fund’s investment objectives will be attained.
KAYNE ANDERSON ENERGY TOTAL RETURN FUND, INC.
LETTER TO STOCKHOLDERS
January 24, 2013
Dear Fellow Stockholders:
In a year marked by renewed uncertainty about the health of the global economy, we are pleased to report that the Fund generated solid returns during fiscal 2012. While our overall performance was positive during the year, market conditions impacted each of the Fund’s investment sub-sectors differently. MLPs and Midstream Companies performed very well, while Income Trusts and Marine Transportation underperformed. We continue to believe in the merits of the Fund’s diversified portfolio and are optimistic about the outlook for the Fund’s portfolio in 2013.
As we highlighted in last year’s annual letter, unconventional reserves, which are commonly referred to as “shale plays,” continue to be the biggest story in the energy sector. Development of these reserves has fundamentally changed the domestic energy market and is having an increasing impact on the global energy market. This “Shale Revolution,” as we like to call it, continues to accelerate and is expected to have a major impact on the domestic economy. We agree with industry sources that expect the energy sector to create over 2.5 million net new jobs by 2020. This economic boon results not only from jobs directly attributable to the energy sector, but also from the re-industrialization of the U.S., as plentiful domestic energy supplies and low natural gas prices are facilitating a resurgence in manufacturing activity. Over the last two years alone, over $90 billion worth of domestic growth projects have been announced by manufacturing companies that are seeking to take advantage of low-cost domestic energy.
The growth in the production of oil, natural gas and natural gas liquids (“NGLs”) from the development of these reserves presents both significant opportunities and challenges for energy companies. For instance, a significant amount of new midstream assets must be built to facilitate transportation of this new production to end-users, which is very positive for MLPs and Midstream Companies. On the other hand, increased production of natural gas and NGLs has exceeded growth in demand and has had a negative impact on market prices for these commodities. These price declines have impacted cash flows for Income Trusts and other energy companies focused on exploration and production activities.
One of the measures we employ to evaluate our performance is Net Asset Value Return, which is equal to the change in net asset value per share plus the cash distributions paid during the period, assuming reinvestment through our dividend reinvestment program. Our Net Asset Value Return was 8.4% for fiscal 2012. During the same period, the MLP market, as measured by the Alerian MLP index, had a total return of 14.4% and the S&P 500 index had a total return of 16.1%. The strong performance of the Fund’s investments in MLPs, Midstream Companies and Energy Debt was offset by the underperformance of our Income Trusts and Marine Transportation holdings.
Another measure of the Fund’s performance is Market Return, which is equal to the change in share price plus the cash distributions paid during the period, assuming reinvestment through our dividend reinvestment program. Our Market Return was 13.0% for fiscal 2012. This measure exceeded our Net Asset Value Return, as the discount of our share price to NAV decreased during fiscal 2012. Our share price traded at a discount to NAV of 5.7% on November 30, 2011 and 1.6% on November 30, 2012.
Energy Market Overview
Development of unconventional reserves or shale plays continues to transform the domestic energy industry. It is the biggest story in the energy business and, arguably, a driving factor in the recovery of the domestic economy. Examples of unconventional shale plays include the Bakken Shale, Eagle Ford Shale, Marcellus Shale and Utica Shale.
1
KAYNE ANDERSON ENERGY TOTAL RETURN FUND, INC.
LETTER TO STOCKHOLDERS
In our opinion, 2012 was the year in which it became clear that development of unconventional reserves could reap huge benefits for the domestic economy. Abundant new supplies of low-cost natural gas and NGLs are spurring a resurgence in domestic manufacturing activity. For instance, petrochemical companies have announced new projects to utilize low-cost ethane and propane as feedstocks in facilities that make higher value chemicals and plastics. In total, industry sources estimate that over $90 billion of new industrial projects are being considered domestically. Energy is truly the bright spot in an otherwise sluggish domestic economy, and we continue to be very excited about the potential job creation and other positive ripple effects of the Shale Revolution.
Driven by the development of the shale plays, domestic production of crude oil, NGLs and natural gas grew in 2012 – the fourth consecutive year the U.S. has increased production levels for each of these commodities. Domestic crude oil production is expected to increase by 780,000 barrels per day in 2012 (a 13.8% increase), which is the largest annual production increase in our country’s history! The U.S. is currently the largest producer of natural gas in the world, and many experts are predicting that it will become the largest producer of crude oil in the next 10 to 15 years. As a result, the U.S. has substantially decreased its dependence on crude oil from foreign sources and has become a large exporter of refined petroleum products. These statistics are pretty amazing when you consider the fact that just 10 years ago most experts believed domestic production was in a secular decline.
This rapid increase in production from unconventional reserves continues to create both opportunities and challenges. Growing supplies require new infrastructure to move the commodities to market, as well as refine, process and fractionate oil, natural gas and NGLs. In addition, there is increasing interest in exporting commodities to access higher value markets abroad. The backlog of infrastructure projects continues to grow and will likely take decades to fully develop.
Growing production also creates challenges for energy companies, especially those companies that have direct exposure to lower commodity prices such as Income Trusts. It is common for demand growth to lag production growth, which can put downward pressure on prices in the interim. We have seen this with natural gas, which bottomed in April 2012 at $1.82/MMbtu (its lowest price in over 10 years). Prices have since strengthened as production growth has moderated and lower prices stimulated growth in demand from power plants switching from coal to natural gas, which has led to declines in coal prices and very challenging market conditions for coal companies. Nevertheless, even with this rebound in the price of natural gas, domestic natural gas trades at a steep discount to international natural gas, a phenomenon which we believe will continue to spur additional sources of demand such as the development of liquefied natural gas (“LNG”) export facilities and new domestic manufacturing projects.
The shift in focus by upstream companies from drilling “dry” gas prospects to drilling “wet” gas prospects (gas wells that produce associated NGLs) over the last couple of years has caused a near-term oversupply of NGLs, particularly the ethane and propane components. As a result, we saw inventories of ethane and propane build throughout 2012 and a corresponding decrease in NGL prices. For propane, this dynamic was exacerbated by an abnormally warm 2011-2012 winter. During calendar 2012, the price of ethane fell 71%, and the price of propane fell 35%. This can impact Income Trusts and Gathering & Processing MLPs with commodity price exposure. We believe that this low NGL price environment is a temporary market dislocation and will resolve itself over the next 12 to 24 months.
Crude oil infrastructure has been one of the most active areas for MLPs and Midstream Companies over the past year. The rapid increase in domestic production has created numerous bottlenecks and dislocations between producing areas and the refiners that consume the crude oil. The most apparent bottleneck is at Cushing, Oklahoma, the pricing point for the domestic benchmark West Texas Intermediate (“WTI”) crude. Increasing supplies in the mid-continent and constraints in capacity to move crude to Gulf Coast refiners have resulted in a
2
KAYNE ANDERSON ENERGY TOTAL RETURN FUND, INC.
LETTER TO STOCKHOLDERS
steep discount in the price of WTI relative to Brent, the international benchmark. This “differential” in prices is expected to persist for the near-term and gradually narrow over time as new pipelines relieve the logistical constraints at Cushing.
We believe, however, that regional crude oil prices will continue to price at wider differentials to benchmarks, which creates tremendous opportunities for many MLPs and Midstream Companies. We have already seen an increased focus on regional crude infrastructure opportunities, including projects to move crude oil via railroads, in areas such as North Dakota (Bakken Shale) and West Texas (Permian Basin), where differentials are much higher than historical averages. This dynamic enables MLPs and Midstream Companies with the capability to move the regionally oversupplied crude to higher value markets to be very profitable.
Income Trusts and other upstream companies, which are often price takers in regional markets, have seen pressure on their profits in areas where they must accept a discount to WTI. We expect these dynamics to continue to change rapidly as pipeline and rail facilities are built to alleviate existing supply bottlenecks, while production growth in new basins creates new supply bottlenecks.
The domestic energy market continues to evolve in response to the varied impacts of the Shale Revolution. While this can create price dislocations in the short-term, we firmly believe markets are efficient. Lower prices will spur demand growth, as well as cause upstream companies to re-allocate capital to higher return projects. Further, abnormally high differentials serve as an incentive for MLPs and Midstream Companies to build the needed infrastructure to reduce the differentials. We are excited to watch these events unfold over the next few years and believe our team of investment professionals is well positioned to identify and capitalize on these trends.
Market Overview
While MLPs performed very well for the year (14.4% total return), the broader markets performed even better, with the S&P 500 generating a total return of 16.1% for the year. Notably, calendar 2012 was the first year since 1999 that MLPs were outperformed by the S&P 500 index. Over that 13-year time period, MLPs generated a total return of over 830% versus a total return of approximately 24% for the S&P 500 index. That level of outperformance over a 13-year period is nothing short of stunning in our opinion! With an average yield of 6.1% for the group as of January 24, 2013 and attractive distribution growth prospects, we continue to view MLPs as a very compelling investment opportunity.
Distribution growth is the most important driver of MLP returns and, we believe, the leading reason for MLPs’ strong relative performance over the last 13 years. MLP distribution growth accelerated during the year, as MLPs benefited from acquisitions and completion of infrastructure development projects. Distributions grew 7.3% during 2012 compared to 6.3% in 2011 and 4.5% in 2010. We believe that prospects for distribution growth in 2013 are also very strong, and we are projecting distributions to grow by 6% to 7%. The development of unconventional reserves and the construction of related infrastructure assets will continue to fuel this distribution growth.
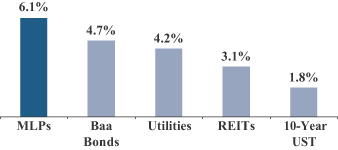
While the MLP market performed well during fiscal 2012, MLPs became even more attractively valued on a relative basis to other income alternatives. At the beginning of the fiscal year, the average MLP yield was 6.4%, which represented a 434 basis point premium (100 basis points equals one percent) to the yield on 10-year U.S. Treasury Bonds. This difference is often referred to as the “spread to Treasuries.” By November 30, 2012, the spread to Treasuries had increased to 473 basis points. As of January 24, 2012, the spread to Treasuries was 426 basis points, which is well above the 334 basis point average since 2000. As illustrated in Figure 1 below, MLP yields compare very favorably to other income-oriented investments. In addition to the spread to Treasuries, current yields for MLPs are much higher than yields for investment grade (BBB) bonds, utilities and REITs. This
3
KAYNE ANDERSON ENERGY TOTAL RETURN FUND, INC.
LETTER TO STOCKHOLDERS
comparison is even more compelling when you take into account the prospect of strong distribution growth for MLPs.
Figure 1. MLP Yields versus Other Income Alternatives (January 24, 2013)
Capital expenditures by MLPs, including both acquisitions and new growth projects, continued at robust levels in 2012. We estimate that MLPs announced over $50 billion in acquisitions during calendar 2012. These acquisitions were a combination of third-party deals and “drop-down” transactions in which an MLP’s general partner sells assets to its affiliated MLP. These drop-down transactions are generally completed at attractive prices that are accretive to the MLP’s cash distributions. We estimate that MLPs also spent over $20 billion on capital projects during the year. We believe these projects are overwhelmingly driven by the need to provide midstream infrastructure to growing oil and natural gas production resulting from the development of unconventional resources. Furthermore, we view these types of projects to be the most reliable way for MLPs to generate returns in excess of their cost of capital when prudently executed by an experienced management team. While it is difficult to predict M&A activity, we expect MLPs to spend in excess of $25 billion on capital projects during 2013.
Capital markets activity for MLPs reached a record high in calendar 2012. During the year, MLPs raised $15 billion in follow-on equity and $28 billion in debt, surpassing activity levels in 2011. We also saw a continuation of the robust IPO market seen in 2011, with 13 IPOs raising approximately $3.3 billion. Like 2011, there was a wide disparity in the quality of the companies going public and in after-market trading performance. Consequently, we chose not to participate in many deals. On average, the IPOs in which we participated are up over 26% from their IPO price. While we expect the IPO market to remain active during 2013, we plan to be very selective in our participation.
During fiscal 2012, we substantially increased our exposure to Midstream Companies, which comprised 13% of our portfolio at year-end. Like MLPs, the Midstream Company sector had a very good year, generating a total return of 14.4%. Our portfolio of Midstream Companies performed even better than the sector as a whole with the Fund’s holdings in this sector delivering a total return in excess of 20%. Midstream Companies benefit from many of the same trends that are contributing to the positive long-term outlook for MLPs, and we believe that Midstream Companies should continue to provide attractive returns for many years to come. We also believe this sector has the highest dividend growth potential of any of the sectors in which the Fund invests.
Fiscal 2012 was a challenging year for the Income Trust sector. The Income Trust sector includes both Canadian companies that were formerly treated as royalty trusts (“Canadian trusts”) and royalty and grantor trusts with properties in the United States (“U.S. trusts”). These entities are engaged in the production of crude oil, NGLs and natural gas and, as a result, have direct exposure to changes in commodity prices.
4
KAYNE ANDERSON ENERGY TOTAL RETURN FUND, INC.
LETTER TO STOCKHOLDERS
The Canadian trust sector generated a total return of negative 11.9% for the year, as low natural gas and NGL prices negatively impacted financial results. Further, many of the higher dividend names in which we invest had weaker than expected operating performance. As a result, several of these names chose to reduce dividends during the year, which caused these names to perform even worse than the sector as a whole. We have substantially reduced our Canadian trust holdings over the last two years (down by $90 million to $56 million) as we see better return prospects in other segments of the energy industry.
The Fund substantially increased its exposure to U.S. trusts during the year, in part by participating in three IPOs during fiscal 2012. While the sector had positive returns for most of our fiscal year, sector performance was terrible during November. This poor performance was attributable to operational issues at certain of the “drilling trusts,” as well as a negative reserve revision that was announced by SandRidge Energy, the sponsor of three drilling trusts. As a result, the U.S. trust sector ended the year with a total return of negative 22.8%. We believe that many of the drilling trusts were oversold at year-end and selectively added to certain positions. In fact, from the end of 2012 to the date of this letter, the drilling trusts have generated a total return of 7.5%.
The Marine Transportation sector generated a positive total return during fiscal 2012 (up 7.6%), but the sector continues to face headwinds. Specifically, global economic activity remains weak, which results in lower demand for shipping. At the same time, the sector continues to work through an oversupply situation as new ship deliveries are still outpacing the “scrapping” of older vessels. Consequently, charter rates for crude oil tankers and dry bulk vessels are well below historical averages. While we expect a recovery in the next 12 to 24 months, we remain very cautious on these two vessel types. We are much more optimistic about the near-term prospects for refined product and LNG vessels and have positioned our portfolio accordingly. Our investments in the Marine Transportation sector will be concentrated in companies with strong balance sheets, secure distributions and the potential for growth.
Energy Debt, as measured by the Merrill Lynch Energy High Yield Index, generated a total return of 12.0% for fiscal 2012. The Fund’s energy debt portfolio outperformed the index by investing in debt securities issued by Upstream companies with exposure to shale plays. These companies have benefited from improved credit quality as they execute on their strategy and “prove up” the value of their underlying reserves. Nevertheless, we remain cautious about the valuation levels for corporate bonds, and accordingly we have maintained a lower allocation to Energy Debt (13% of long-term investments).
2013 Outlook
Our outlook for 2013 is positive. We expect that distribution growth in the 6% to 7% range will lead to another year of low double-digit total returns for the MLP sector. Continued development of unconventional reserves will create plentiful growth opportunities for both MLPs and Midstream Companies, and we believe there is good visibility for distribution growth for an extended period of time in these sectors given the long-term investments required to develop the shale plays. This outlook, coupled with attractive yields for both MLPs and Midstream Companies, reinforces our belief that these companies remain desirable and sound long-term investments.
While we are cautious on the Marine Transportation sector, we believe the Fund’s portfolio is well positioned to benefit from a market recovery in the next 12 to 18 months. We are optimistic on the outlook for LNG tankers, as low domestic gas prices will increase the demand for these vessels to move LNG to higher priced markets. We are also optimistic on the outlook for refined products vessels, as fewer new vessel deliveries and increasing domestic exports of refined products should cause charter rates to increase.
In the Income Trust sector, we believe it will be critical to remain selective in 2013 as both Canadian and U.S. trusts continue to face challenges. We plan to continue to focus on Canadian trusts that offer attractive
5
KAYNE ANDERSON ENERGY TOTAL RETURN FUND, INC.
LETTER TO STOCKHOLDERS
current yields, have strong operating track records and sustainable dividends. Our investments in U.S. trusts will be focused on companies with attractive total return prospects and predictable asset bases.
We look forward to executing on our business plan of achieving high after-tax total returns by investing in a diversified portfolio of MLPs, Midstream Companies, Income Trusts, Marine Transportation and other energy companies. We invite you to visit our website at kaynefunds.com for the latest updates.
Sincerely,

Kevin S. McCarthy
Chairman of the Board of Directors,
President and Chief Executive Officer
6
KAYNE ANDERSON ENERGY TOTAL RETURN FUND, INC.
PORTFOLIO SUMMARY
(UNAUDITED)
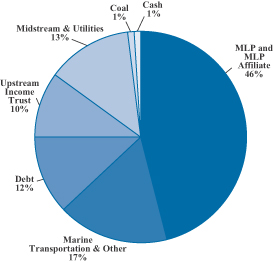
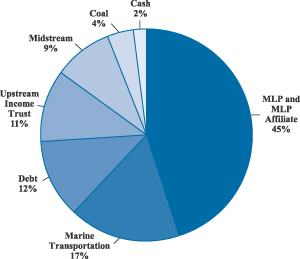
Portfolio Investments by Category
| | |
| November 30, 2012 | | November 30, 2011 |
 | |  |
Top 10 Holdings by Issuer
| | | | | | | | | | | | |
| | | | | Percent of Total
Investments* as of
November 30, |
| Holding | | Sector | | 2012 | | 2011 |
1. Kinder Morgan Management, LLC | | MLP Affiliate | | | | 13.1 | % | | | | 13.1 | % |
2. Enbridge Energy Management, L.L.C. | | MLP Affiliate | | | | 9.3 | | | | | 10.4 | |
3. Plains All American Pipeline, L.P. | | Midstream MLP | | | | 7.6 | | | | | 5.4 | |
4. Golar LNG Partners LP | | Marine Transportation | | | | 4.2 | | | | | 2.7 | |
5. Teekay Offshore Partners L.P. | | Marine Transportation | | | | 4.1 | | | | | 4.3 | |
6. Capital Product Partners L.P. | | Marine Transportation | | | | 4.0 | | | | | 1.8 | |
7. The Williams Companies, Inc. | | Midstream | | | | 2.7 | | | | | 2.2 | |
8. Kinder Morgan, Inc. | | Midstream | | | | 2.6 | | | | | 2.7 | |
9. Navios Maritime Partners L.P. | | Marine Transportation | | | | 2.1 | | | | | 2.3 | |
10. Regency Energy Partners LP | | Midstream MLP | | | | 1.9 | | | | | 1.7 | |
| * | Includes cash and repurchase agreement (if any). |
7
KAYNE ANDERSON ENERGY TOTAL RETURN FUND, INC.
MANAGEMENT DISCUSSION
(UNAUDITED)
Fund Overview
Kayne Anderson Energy Total Return Fund, Inc. is a non-diversified, closed-end fund. Our investment objective is to obtain a high total return with an emphasis on current income. We intend to achieve this objective by investing in a portfolio of companies in the energy sector, which focuses on securities of energy companies, with the majority of our investments in equity securities of master limited partnerships and limited liability companies taxed as partnerships (“MLPs”), MLP affiliates, marine transportation companies, midstream companies and upstream income trusts.
As of November 30, 2012, we had total assets of $1.3 billion, net assets applicable to our common stock of $901.8 million (net asset value per share of $25.43), and 35.5 million shares of common stock outstanding. As of November 30, 2012, we held $1.2 billion in equity investments and $166.5 million in debt investments.
Results of Operations — For the Three Months Ended November 30, 2012
Investment Income. Investment income totaled $9.3 million for the quarter and consisted primarily of net dividends and distributions and interest income on our investments. We received $13.9 million of cash dividends and distributions, of which $8.4 million was treated as a return of capital. Interest income was $3.7 million. Return of capital was increased by $0.8 million during the quarter due to 2011 tax reporting information that we received in fiscal 2012. We received $5.4 million of paid-in-kind dividends during the quarter, which are not included in investment income, but are reflected as an unrealized gain.
Operating Expenses. Operating expenses totaled $9.8 million, including $4.2 million of investment management fees, $3.5 million of interest expense, of which $0.2 million was the non-cash amortization of debt issuance costs, and $0.4 million of other operating expenses. Preferred stock distributions for the quarter were $1.7 million, of which $0.1 million was the non-cash amortization of offering costs.
Net Investment Loss. Our net investment loss totaled $0.5 million.
Net Realized Losses. We had net realized losses of $1.3 million. Net realized losses consisted of $3.0 million of losses from our investments and $1.7 million of gains from option activity.
Net Change in Unrealized Losses. We had a net change in unrealized losses of $8.4 million. The net change consisted of $8.1 million of unrealized losses from investments and $0.3 million of net unrealized losses from option activity.
Net Decrease in Net Assets Resulting from Operations. We had a decrease in net assets resulting from operations of $10.2 million. This decrease was comprised of a net investment loss of $0.5 million; net realized losses of $1.3 million; and net unrealized losses of $8.4 million, as noted above.
Results of Operations — For the Fiscal Year Ended November 30, 2012
Investment Income. Investment income totaled $39.2 million for the fiscal year and consisted primarily of net dividends and distributions and interest income on our investments. We received $56.6 million of cash dividends and distributions, of which $32.6 million was treated as a return of capital. Interest income was $14.5 million. Return of capital was increased by $0.8 million during the fiscal year due to 2011 tax reporting information that we received in fiscal 2012. Other income of $0.7 million includes a structuring fee associated with our Class B Unit investment in Capital Product Partners L.P and commitment fees earned from bridge loans during the fiscal year. We received $21.5 million of paid-in-kind dividends during the fiscal year, which are not included in investment income, but are reflected as an unrealized gain.
Operating Expenses. Operating expenses totaled $40.7 million, including $17.0 million of investment management fees, $15.2 million of interest expense, of which $0.9 million was the non-cash amortization of debt issuance costs, and $1.7 million of other operating expenses. Preferred stock distributions for the fiscal year were $6.8 million, of which $0.3 million was the non-cash amortization of offering costs.
8
KAYNE ANDERSON ENERGY TOTAL RETURN FUND, INC.
MANAGEMENT DISCUSSION
(UNAUDITED)
Net Investment Loss. Our net investment loss totaled $1.5 million.
Net Realized Gains. We had net realized gains of $16.5 million. Net realized gains consisted of $8.8 million of gains from our investments, $7.8 million of gains from option activity and $0.1 million of realized losses from foreign currency related transactions.
Net Change in Unrealized Gains. We had a net change in unrealized gains of $58.3 million. The net change consisted of $58.1 million of unrealized gains from investments and $0.2 million of net unrealized gains from option activity.
Net Increase in Net Assets Resulting from Operations. We had an increase in net assets resulting from operations of $73.3 million for the fiscal year. This increase was comprised of a net investment loss of $1.5 million; net realized gains of $16.5 million; and net unrealized gains of $58.3 million, as noted above.
Distributions to Common Stockholders
We pay quarterly distributions to our common stockholders, generally funded by net distributable income (“NDI”) generated from our portfolio investments. NDI is the amount of income received by us from our portfolio investments less operating expenses, subject to certain adjustments as described below. NDI is not a financial measure under the accounting principles generally accepted in the United States of America (“GAAP”). Refer to the “Reconciliation of NDI to GAAP” section below for a reconciliation of this measure to our results reported under GAAP.
Income from portfolio investments includes (a) cash dividends and distributions, (b) paid-in-kind dividends received (i.e., stock dividends), (c) interest income from debt securities and commitment or structuring fees from private investments in public equity (“PIPE investments”) and (d) net premiums received from the sale of covered calls.
Operating expenses include (a) investment management fees paid to our investment adviser, (b) other expenses (mostly due to fees paid to other service providers) and (c) interest expense and preferred stock distributions.
Net Distributable Income (NDI)
(amounts in millions, except for per share amounts)
| | | | | | | | |
| | | Three Months
Ended
November 30,
2012 | | | Fiscal Year
Ended
November 30,
2012 | |
Distributions and Other Income from Investments | | | | | | | | |
Dividends and Distributions | | $ | 13.9 | | | $ | 56.6 | |
Paid-In-Kind Dividends and Distributions | | | 5.4 | | | | 21.5 | |
Interest and Other Income(1) | | | 3.7 | | | | 15.1 | |
Net Premiums Received from Call Options Written | | | 3.1 | | | | 14.2 | |
| | | | | | | | |
Total Distributions and Other Income from Investments | | | 26.1 | | | | 107.4 | |
Expenses | | | | | | | | |
Investment Management Fee | | | (4.2 | ) | | | (17.0 | ) |
Other Expenses | | | (0.4 | ) | | | (1.7 | ) |
Interest Expense | | | (3.3 | ) | | | (14.4 | ) |
Preferred Stock Distributions | | | (1.6 | ) | | | (6.5 | ) |
| | | | | | | | |
Net Distributable Income (NDI) | | $ | 16.6 | | | $ | 67.8 | |
| | | | | | | | |
Weighted Shares Outstanding | | | 35.4 | | | | 35.2 | |
NDI per Weighted Share Outstanding | | $ | 0.47 | | | $ | 1.93 | |
| | | | | | | | |
Adjusted NDI per Weighted Share Outstanding(2) | | $ | 0.48 | | | $ | 1.93 | |
| | | | | | | | |
Distributions paid per Common Share(3) | | $ | 0.48 | | | $ | 1.92 | |
9
KAYNE ANDERSON ENERGY TOTAL RETURN FUND, INC.
MANAGEMENT DISCUSSION
(UNAUDITED)
| (1) | The fiscal year ended November 30, 2012 includes a $0.6 million structuring fee from Capital Product Partners L.P. related to our Class B Unit investment and $0.1 million of commitment fees from bridge loans. |
| (2) | In each of the last three years, The Williams Companies paid two dividends during our fiscal third quarter and no dividends during our fiscal fourth quarter. For the purposes of determining our dividend, we calculate “Adjusted NDI”, which treats the dividend received late in our fiscal third quarter as if it was received during our fiscal fourth quarter. |
| (3) | The distribution of $0.48 per share for the fourth quarter of fiscal 2012 was paid to common stockholders on January 11, 2013. Distributions for fiscal 2012 include the distributions paid in April 2012, July 2012, October 2012 and January 2013. |
Payment of future distributions is subject to Board of Directors approval, as well as meeting the covenants of our debt agreements and terms of our preferred stock. In determining our quarterly distribution to common stockholders, our Board of Directors considers a number of factors that include, but are not limited to:
| | • | | NDI generated in the current quarter; |
| | • | | Expected NDI over the next twelve months, and |
| | • | | Realized and unrealized gains generated by the portfolio. |
Reconciliation of NDI to GAAP
The difference between distributions and other income from investments in the NDI calculation and total investment income as reported in our Statement of Operations is reconciled as follows:
| | • | | GAAP recognizes that a significant portion of the cash distributions received from MLPs is characterized as a return of capital and therefore excluded from investment income, whereas the NDI calculation includes the return of capital portion of such distributions. |
| | • | | NDI includes the value of paid-in-kind dividends, whereas such amounts are not included as investment income for GAAP purposes, but rather are recorded as unrealized gains upon receipt. |
| | • | | NDI includes commitment fees from PIPE investments, whereas such amounts are generally not included in investment income for GAAP purposes, but rather are recorded as a reduction to the cost of the investment. |
| | • | | Many of our investments in debt securities were purchased at a discount or premium to the par value of such security. When making such investments, we consider the security’s yield to maturity, which factors in the impact of such discount (or premium). Interest income reported under GAAP includes the non-cash accretion of the discount (or amortization of the premium) based on the effective interest method. When we calculate interest income for purposes of determining NDI, in order to better reflect the yield to maturity, the accretion of the discount (or amortization of the premium) is calculated on a straight-line basis to the earlier of the expected call date or the maturity date of the debt security. |
| | • | | We may sell covered call option contracts to generate income or to reduce our ownership of certain securities that we hold. In some cases, we are able to repurchase these call option contracts at a price less than the fee that we received, thereby generating a profit. The amount we received from selling call options, less the amount that we pay to repurchase such call option contracts, is included in NDI. For GAAP purposes, premiums received from call option contracts sold is not included in investment income. See Note 2 — Significant Accounting Policies for a full discussion of the GAAP treatment of option contracts. |
10
KAYNE ANDERSON ENERGY TOTAL RETURN FUND, INC.
MANAGEMENT DISCUSSION
(UNAUDITED)
The treatment of expenses included in NDI also differs from what is reported in the Statement of Operations as follows:
| | • | | The non-cash amortization or write-offs of capitalized debt issuance costs and preferred stock offering costs related to our financings is included in interest expense and distributions on mandatory redeemable preferred stock for GAAP purposes, but is excluded from our calculation of NDI. |
Liquidity and Capital Resources
Total leverage outstanding at November 30, 2012 of $433.0 million was comprised of $273.0 million of senior unsecured notes (“Senior Notes”), $40.0 million of borrowings outstanding under our unsecured revolving credit facility (the “Credit Facility”) and $120.0 million of mandatory redeemable preferred stock. During fiscal 2012, we redeemed $28.0 million of our Senior Notes, funded by borrowings from our Credit Facility. Total leverage represented 32% of total assets at November 30, 2012. As of January 24, 2013, we had $8.0 million of borrowings outstanding under our Credit Facility, and we had $0.9 million of cash.
The Credit Facility matures on June 11, 2013 and has a commitment amount of $100.0 million. The interest rate may vary between LIBOR plus 1.75% and LIBOR plus 3.00%, depending on our asset coverage ratios. Outstanding loan balances accrue interest daily at a rate equal to one-month LIBOR plus 1.75% based on current asset coverage ratios. We pay a commitment fee of 0.40% per annum on any unused amounts of the Credit Facility. We expect to renew our Credit Facility prior to its maturity date. A full copy of our Credit Facility is available on our website, www.kaynefunds.com.
At November 30, 2012, our asset coverage ratios under the Investment Company Act of 1940, as amended (the “1940 Act”), were 426% and 308% for debt and total leverage (debt plus preferred stock), respectively. We currently target an asset coverage ratio with respect to our debt of 415%, but at times may be above or below our target depending upon market conditions.
We had $273.0 million of Senior Notes outstanding at November 30, 2012. During 2013, we have $128.0 million of Senior Notes that mature, which we expect to refinance with new notes. Our remaining Senior Notes mature between 2014 and 2018. As of November 30, 2012, we had $120.0 million of mandatory redeemable preferred stock outstanding, which is subject to mandatory redemption in 2017 and 2018.
As of November 30, 2012, our total leverage consisted of both fixed rate (78%) and floating rate (22%) obligations. As of such date, the weighted average interest rate on our total leverage was 4.60%.
11
KAYNE ANDERSON ENERGY TOTAL RETURN FUND, INC.
SCHEDULE OF INVESTMENTS
NOVEMBER 30, 2012
(amounts in 000’s, except numbers of option contracts)
| | | | | | | | | | | | |
Description | | | | | | No. of
Shares/Units | | | Value | |
Long-Term Investments — 147.2% | | | | | | | | | | | | |
Equity Investments(1) — 128.7% | | | | | | | | | | | | |
United States — 119.2% | | | | | | | | | | | | |
MLP(2)(3) — 35.8% | | | | | | | | | | | | |
Access Midstream Partners, L.P.(4) | | | 48 | | | $ | 1,674 | |
Alliance Holdings GP, L.P. | | | 63 | | | | 2,892 | |
Alliance Resource Partners, L.P.(4) | | | 14 | | | | 813 | |
BreitBurn Energy Partners L.P. | | | 528 | | | | 9,757 | |
Buckeye Partners, L.P.(5) | | | 117 | | | | 5,900 | |
Buckeye Partners, L.P. — Class B Units(5)(6)(7) | | | 206 | | | | 9,789 | |
Crestwood Midstream Partners LP | | | 227 | | | | 5,292 | |
Crosstex Energy, L.P. | | | 377 | | | | 5,691 | |
DCP Midstream Partners, LP(4) | | | 502 | | | | 21,010 | |
Energy Transfer Equity, L.P.(4) | | | 250 | | | | 11,357 | |
Energy Transfer Partners, L.P.(4) | | | 77 | | | | 3,385 | |
Enterprise Products Partners L.P.(4) | | | 186 | | | | 9,661 | |
Exterran Partners, L.P. | | | 688 | | | | 14,984 | |
Global Partners LP | | | 409 | | | | 10,194 | |
Inergy, L.P. | | | 627 | | | | 11,827 | |
Inergy Midstream, L.P. | | | 348 | | | | 8,184 | |
Lehigh Gas Partners LP(8) | | | 18 | | | | 352 | |
MarkWest Energy Partners, L.P.(5) | | | 299 | | | | 15,471 | |
Mid-Con Energy Partners, LP | | | 520 | | | | 10,769 | |
MPLX LP(8) | | | 55 | | | | 1,584 | |
Niska Gas Storage Partners LLC | | | 212 | | | | 2,373 | |
NuStar Energy L.P. | | | 106 | | | | 4,845 | |
ONEOK Partners, L.P.(4) | | | 18 | | | | 1,019 | |
PetroLogistics LP | | | 493 | | | | 5,778 | |
Plains All American Pipeline, L.P.(5) | | | 2,178 | | | | 101,445 | |
PVR Partners, L.P.(5) | | | 428 | | | | 10,319 | |
Regency Energy Partners LP (4) | | | 1,106 | | | | 24,736 | |
Suburban Propane Partners, L.P.(4) | | | 25 | | | | 985 | |
Summit Midstream Partners, LP(8) | | | 126 | | | | 2,492 | |
Western Gas Partners, LP(4) | | | 29 | | | | 1,430 | |
Williams Partners L.P.(4) | | | 139 | | | | 7,072 | |
| | | | | | | | | | | | |
| | | | | | | | | | | 323,080 | |
| | | | | | | | | | | | |
MLP Affiliates — 33.1% | | | | | | | | | | | | |
Enbridge Energy Management, L.L.C.(6) | | | 4,189 | | | | 123,585 | |
Kinder Morgan Management, LLC(4)(6) | | | 2,303 | | | | 174,779 | |
| | | | | | | | | | | | |
| | | | | | | | | | | 298,364 | |
| | | | | | | | | | | | |
Marine Transportation & Other — 25.0% | | | | | | | | | | | | |
Capital Product Partners L.P. | | | 3,866 | | | | 26,175 | |
Capital Product Partners L.P. — Class B Units(7)(9) | | | 3,333 | | | | 27,800 | |
Golar LNG Limited(4) | | | 75 | | | | 2,931 | |
Golar LNG Partners LP | | | 1,869 | | | | 55,876 | |
Kirby Corporation(4)(10) | | | 208 | | | | 12,045 | |
Navios Maritime Partners L.P. | | | 2,096 | | | | 28,070 | |
See accompanying notes to financial statements.
12
KAYNE ANDERSON ENERGY TOTAL RETURN FUND, INC.
SCHEDULE OF INVESTMENTS
NOVEMBER 30, 2012
(amounts in 000’s, except numbers of option contracts)
| | | | | | | | | | | | |
Description | | | | | | No. of
Shares/Units | | | Value | |
Marine Transportation & Other (continued) | | | | | | | | | | |
| | |
Seadrill Limited(4) | | | 307 | | | $ | 11,813 | |
Seadrill Partners LLC(8) | | | 223 | | | | 5,855 | |
Teekay Offshore Partners L.P.(4) | | | 2,040 | | | | 54,329 | |
| | | | | | | | | | | | |
| | | | | | | | | | | 224,894 | |
| | | | | | | | | | | | |
Midstream & Utilities — 15.3% | | | | | | | | | | | | |
CenterPoint Energy, Inc. | | | 50 | | | | 986 | |
Kinder Morgan, Inc.(4) | | | 1,032 | | | | 34,884 | |
Marathon Petroleum Corporation(4) | | | 100 | | | | 5,954 | |
OGE Energy Corp. | | | 102 | | | | 5,816 | |
ONEOK, Inc.(4) | | | 542 | | | | 24,313 | |
Phillips 66(4) | | | 100 | | | | 5,237 | |
The Southern Company | | | 50 | | | | 2,178 | |
Spectra Energy Corp.(4) | | | 639 | | | | 17,857 | |
Targa Resources Corp.(4) | | | 107 | | | | 5,360 | |
The Williams Companies, Inc.(4) | | | 1,095 | | | | 35,947 | |
| | | | | | | | | | | | |
| | | | | | | | | | | 138,532 | |
| | | | | | | | | | | | |
Upstream Income Trust — 8.1% | | | | | | | | | | | | |
Cross Timbers Royalty Trust | | | 73 | | | | 1,938 | |
Enduro Royalty Trust | | | 1,030 | | | | 17,617 | |
Pacific Coast Oil Trust | | | 1,263 | | | | 22,233 | |
SandRidge Mississippian Trust II(11) | | | 427 | | | | 7,146 | |
SandRidge Permian Trust(11) | | | 261 | | | | 4,521 | |
VOC Energy Trust | | | 908 | | | | 12,618 | |
Whiting USA Trust II | | | 422 | | | | 6,877 | |
| | | | | | | | | | | | |
| | | | | | | | | | | 72,950 | |
| | | | | | | | | �� | | | |
Coal — 1.9% | | | | | | | | | | | | |
CONSOL Energy Inc.(4) | | | 239 | | | | 7,483 | |
Peabody Energy Corporation(4) | | | 373 | | | | 9,358 | |
SunCoke Energy, Inc.(4)(10) | | | 15 | | | | 244 | |
| | | | | | | | | | | | |
| | | | | | | | | | | 17,085 | |
| | | | | | | | | | | | |
Total United States (Cost — $747,364) | | | | | | | 1,074,905 | |
| | | | | | | | | | | | |
Canada — 9.5% | | | | | | | | | | | | |
Upstream Income Trust — 6.2% | | | | | | | | | | | | |
Bonavista Corporation(6) | | | 101 | | | | 1,684 | |
Crescent Point Energy Corp. | | | 603 | | | | 23,694 | |
Enerplus Corporation(4)(6) | | | 830 | | | | 11,064 | |
Pengrowth Energy Corporation | | | 3,809 | | | | 19,616 | |
| | | | | | | | | | | | |
| | | | | | | | | | | 56,058 | |
| | | | | | | | | | | | |
Midstream — 3.3% | | | | | | | | | | | | |
Enbridge Inc. | | | 125 | | | | 5,036 | |
Keyera Corp. | | | 53 | | | | 2,515 | |
Pembina Pipeline Corporation | | | 778 | | | | 22,033 | |
| | | | | | | | | | | | |
| | | | | | | | | | | 29,584 | |
| | | | | | | | | | | | |
Total Canada (Cost — $112,403) | | | | 85,642 | |
| | | | | | | | | | | | |
Total Equity Investments (Cost — $859,767) | | | | 1,160,547 | |
| | | | | | | | | | | | |
See accompanying notes to financial statements.
13
KAYNE ANDERSON ENERGY TOTAL RETURN FUND, INC.
SCHEDULE OF INVESTMENTS
NOVEMBER 30, 2012
(amounts in 000’s, except numbers of option contracts)
| | | | | | | | | | | | | | | | |
Description | | Interest
Rate | | | Maturity
Date | | | Principal
Amount | | | Value | |
Debt Instruments — 18.5% | | | | | | | | | | | | | | | | |
United States — 16.1% | | | | | | | | | | | | | | | | |
Upstream — 9.9% | | | | | | | | | | | | | | | | |
Aurora Oil & Gas Limited | | | 9.875 | % | | | 2/15/17 | | | $ | 5,660 | | | $ | 6,000 | |
Carrizo Oil & Gas, Inc. | | | 7.500 | | | | 9/15/20 | | | | 7,750 | | | | 7,905 | |
Clayton Williams Energy Inc. | | | 7.750 | | | | 4/1/19 | | | | 9,625 | | | | 9,649 | |
Comstock Resources, Inc. | | | 7.750 | | | | 4/1/19 | | | | 7,750 | | | | 7,847 | |
Comstock Resources, Inc. | | | 9.500 | | | | 6/15/20 | | | | 3,750 | | | | 4,003 | |
EP Energy LLC | | | 9.375 | | | | 5/1/20 | | | | 9,000 | | | | 10,011 | |
Gulfport Energy Corporation | | | 7.750 | | | | 11/1/20 | | | | 5,000 | | | | 4,975 | |
Halcón Resources Corporation | | | 9.750 | | | | 7/15/20 | | | | 14,500 | | | | 15,443 | |
Halcón Resources Corporation | | | 8.875 | | | | 5/15/21 | | | | 3,250 | | | | 3,372 | |
Midstates Petroleum Company, Inc. | | | 10.750 | | | | 10/1/20 | | | | 3,700 | | | | 3,904 | |
PDC Energy, Inc. | | | 7.750 | | | | 10/15/22 | | | | 6,000 | | | | 6,090 | |
Resolute Energy Corporation | | | 8.500 | | | | 5/1/20 | | | | 9,775 | | | | 10,044 | |
| | | | | | | | | | | | | | | | |
| | | | | | | | | | | | | | | 89,243 | |
| | | | | | | | | | | | | | | | |
Marine Transportation — 3.7% | | | | | | | | | | | | | | | | |
Genco Shipping & Trading Limited(12) | | | 5.000 | | | | 8/15/15 | | | | 5,000 | | | | 1,716 | |
Navios Maritime Holdings Inc. | | | 8.125 | | | | 2/15/19 | | | | 19,102 | | | | 16,905 | |
Teekay Corporation | | | 8.500 | | | | 1/15/20 | | | | 14,165 | | | | 14,979 | |
| | | | | | | | | | | | | | | | |
| | | | | | | | | | | | | | | 33,600 | |
| | | | | | | | | | | | | | | | |
Coal — 2.5% | | | | | | | | | | | | | | | | |
Foresight Energy LLC | | | 9.625 | | | | 8/15/17 | | | | 21,000 | | | | 21,945 | |
| | | | | | | | | | | | | | | | |
Total United States (Cost — $143,845) | | | | | | | | | | | | | | | 144,788 | |
| | | | | | | | | | | | | | | | |
Canada — 2.4% | | | | | | | | | | | | | | | | |
Upstream — 2.4% | | | | | | | | | | | | | | | | |
Athabasca Oil Corporation | | | 7.500 | | | | 11/19/17 | | | | (13) | | | | 7,567 | |
Southern Pacific Resource Corp. | | | (14) | | | | 1/7/16 | | | | 13,915 | | | | 14,123 | |
| | | | | | | | | | | | | | | | |
Total Canada (Cost — $21,496) | | | | 21,690 | |
| | | | | | | | | | | | | | | | |
Total Debt Investments (Cost — $165,341) | | | | 166,478 | |
| | | | | | | | | | | | | | | | |
Total Long-Term Investments (Cost — $1,025,108) | | | | 1,327,025 | |
| | | | | | | | | | | | | | | | |
| | | | | | | | |
| | |
| | | No. of
Contracts | | | | |
Liabilities | | | | | | | | |
Call Option Contracts Written(10) | | | | | | | | |
United States | | | | | | | | |
MLP | | | | | | | | |
Access Midstream Partners, L.P., call option expiring 12/21/12 @ $35.00 | | | 450 | | | | (36 | ) |
Alliance Resource Partners, L.P., call option expiring 12/21/12 @ $60.00 | | | 100 | | | | (3 | ) |
DCP Midstream Partners, LP, call option expiring 12/21/12 @ $45.00 | | | 500 | | | | (2 | ) |
Energy Transfer Equity, L.P., call option expiring 12/21/12 @ $45.00 | | | 1,800 | | | | (198 | ) |
Energy Transfer Partners, L.P., call option expiring 12/21/12 @ $42.50 | | | 600 | | | | (102 | ) |
Enterprise Products Partners L.P., call option expiring 1/18/2013 @ $52.50 | | | 500 | | | | (50 | ) |
ONEOK Partners, L.P., call option expiring 12/21/12 @ $60.00 | | | 100 | | | | (3 | ) |
Regency Energy Partners LP, call option expiring 12/21/12 @ $22.50 | | | 760 | | | | (27 | ) |
Suburban Propane Partners, L.P., call option expiring 12/21/12 @ $40.00 | | | 250 | | | | (8 | ) |
Western Gas Partners, LP, call option expiring 12/21/12 @ $50.00 | | | 250 | | | | (11 | ) |
Williams Partners L.P., call option expiring 12/21/12 @ $50.00 | | | 250 | | | | (36 | ) |
| | | | | | | | |
| | | | | | | (476 | ) |
| | | | | | | | |
See accompanying notes to financial statements.
14
KAYNE ANDERSON ENERGY TOTAL RETURN FUND, INC.
SCHEDULE OF INVESTMENTS
NOVEMBER 30, 2012
(amounts in 000’s, except numbers of option contracts)
| | | | | | | | |
Description | | No. of
Contracts | | | Value | |
MLP Affiliate | | | | | | | | |
Kinder Morgan Management, LLC, call option expiring 12/21/12 @ $75.00 | | | 700 | | | $ | (101) | |
| | |
Marine Transportation & Other | | | | | | | | |
Golar LNG Limited, call option expiring 12/21/12 @ $40.00 | | | 500 | | | | (27) | |
Golar LNG Limited, call option expiring 12/21/12 @ $45.00 | | | 250 | | | | (2) | |
Kirby Corporation, call option expiring 12/21/12 @ $55.00 | | | 525 | | | | (169) | |
Kirby Corporation, call option expiring 12/21/12 @ $60.00 | | | 250 | | | | (12) | |
Kirby Corporation, call option expiring 1/18/13 @ $60.00 | | | 700 | | | | (81) | |
Seadrill Limited, call option expiring 12/21/12 @ $40.00 | | | 300 | | | | (1) | |
Teekay Offshore Partners L.P., call option expiring 12/21/12 @ $27.00 | | | 12 | | | | (0) | |
| | | | | | | | |
| | | | | | | (292) | |
| | | | | | | | |
Midstream & Utilities | | | | | | | | |
Kinder Morgan, Inc., call option expiring 12/21/12 @ $35.00 | | | 500 | | | | (14) | |
Kinder Morgan, Inc., call option expiring 1/18/13 @ $35.00 | | | 1,000 | | | | (65) | |
Marathon Petroleum Corporation, call option expiring 12/21/12 @ $55.00 | | | 250 | | | | (113) | |
Marathon Petroleum Corporation, call option expiring 12/21/12 @ $57.50 | | | 500 | | | | (146) | |
Marathon Petroleum Corporation, call option expiring 12/21/12 @ $60.00 | | | 250 | | | | (33) | |
ONEOK, Inc., call option expiring 12/21/12 @ $45.00 | | | 500 | | | | (35) | |
ONEOK, Inc., call option expiring 1/18/13 @ $47.50 | | | 500 | | | | (9) | |
Phillips 66, call option expiring 12/21/12 @ $49.00 | | | 375 | | | | (143) | |
Phillips 66, call option expiring 12/21/12 @ $50.00 | | | 625 | | | | (188) | |
Spectra Energy Corp., call option expiring 12/21/12 @ $27.00 | | | 1,000 | | | | (100) | |
Targa Resources Corp., call option expiring 12/21/12 @ $48.00 | | | 250 | | | | (58) | |
Targa Resources Corp., call option expiring 12/21/12 @ $50.00 | | | 225 | | | | (21) | |
Targa Resources Corp., call option expiring 1/18/13 @ $50.00 | | | 400 | | | | (64) | |
The Williams Companies, Inc., call option expiring 1/18/13 @ $33.00 | | | 350 | | | | (37) | |
The Williams Companies, Inc., call option expiring 1/18/13 @ $34.00 | | | 350 | | | | (25) | |
The Williams Companies, Inc., call option expiring 1/18/13 @ $35.00 | | | 1,000 | | | | (49) | |
| | | | | | | | |
| | | | | | | (1,100) | |
| | | | | | | | |
Coal | | | | | | | | |
CONSOL Energy Inc., call option expiring 12/21/12 @ $36.00 | | | 1,000 | | | | (6) | |
CONSOL Energy Inc., call option expiring 12/21/12 @ $39.00 | | | 1,000 | | | | (1) | |
Peabody Energy Corporation, call option expiring 12/21/12 @ $28.00 | | | 500 | | | | (7) | |
Peabody Energy Corporation, call option expiring 1/18/13 @ $26.00 | | | 1,500 | | | | (173) | |
SunCoke Energy, Inc., call option expiring 12/21/12 @ $17.50 | | | 150 | | | | (2) | |
| | | | | | | | |
| | | | | | | (189) | |
| | | | | | | | |
Total United States (Premium Received — $2,060) | | | | | | | (2,158) | |
| | | | | | | | |
Canada | | | | | | | | |
Upstream Income Trust | | | | | | | | |
Enerplus Corporation, call option expiring 12/21/12 @ $13.00 | | | 1,000 | | | | (50) | |
| | | | | | | | |
Total Canada (Premium Received — $49) | | | | (50) | |
| | | | | | | | |
Total Call Option Contracts Written (Premium Received — $2,109) | | | | (2,208) | |
| | | | | | | | |
See accompanying notes to financial statements.
15
KAYNE ANDERSON ENERGY TOTAL RETURN FUND, INC.
SCHEDULE OF INVESTMENTS
NOVEMBER 30, 2012
(amounts in 000’s, except number of option contracts)
| | | | | | |
Description | | | | Value | |
Credit Facility | | $ | (40,000 | ) |
Senior Unsecured Notes | | | (273,000 | ) |
Mandatory Redeemable Preferred Stock at Liquidation Value | | | (120,000 | ) |
Other Liabilities | | | (10,406 | ) |
| | | | | | |
Total Liabilities | | | (445,614 | ) |
Other Assets | | | 20,376 | |
| | | | | | |
Total Liabilities in Excess of Other Assets | | | (425,238 | ) |
| | | | | | |
Net Assets Applicable To Common Stockholders | | $ | 901,787 | |
| | | | | | |
| (1) | Unless otherwise noted, equity investments are common units/common shares. |
| (2) | Securities are treated as a publicly-traded partnership for regulated investment company (“RIC”) qualification purposes. To qualify as a RIC for tax purposes, the Fund may directly invest up to 25% of its total assets in equity and debt securities of entities treated as publicly-traded partnerships. The Fund had less than 25% of its total assets invested in publicly-traded partnerships at November 30, 2012. It is the Fund’s intention to be treated as a RIC for tax purposes. |
| (3) | Includes limited liability companies. |
| (4) | Security or a portion thereof is segregated as collateral on option contracts written. |
| (5) | The Fund believes that it is an affiliate of Buckeye Partners, L.P., MarkWest Energy Partners, L.P., Plains All American Pipeline, L.P. and PVR Partners, L.P. See Note 6 — Agreements and Affiliations. |
| (6) | Distributions are paid-in-kind. |
| (7) | Fair valued security, restricted from public sale. See Notes 2, 3 and 7 in Notes to Financial Statements. |
| (8) | Security is not currently paying cash distributions, but is expected to pay cash distributions within the next 12 months. |
| (9) | Security is convertible on a one-for-one basis into common units of Capital Product Partners L.P. and is senior to the common units in terms of liquidation preference and priority of distributions. The Class B units pay quarterly cash distributions of $0.21375 per unit and are convertible at any time at the option of the holder. If Capital Product Partners L.P. does not redeem the Class B units by May 2022, then the distribution increases by 25% per quarter to a maximum of $0.33345 per unit. Capital Product Partners L.P. may force the Class B units to convert into common units after three years (May 2015) if the common unit price exceeds $11.70 per unit, and the Class B units are callable after five years (May 2017) at a price of $9.27 per unit and after seven years (May 2019) at $9.00 per unit. |
| (10) | Security is non-income producing. |
| (11) | Security is treated as a publicly-traded partnership for RIC qualification purposes. |
| (12) | Security is convertible into common shares of the issuer. |
| (13) | Principal amount is 7,500 Canadian dollars. |
| (14) | Floating rate second lien secured term loan. Security pays interest at base rate + 750 basis points (10.75% as of November 30, 2012). |
See accompanying notes to financial statements.
16
KAYNE ANDERSON ENERGY TOTAL RETURN FUND, INC.
STATEMENT OF ASSETS AND LIABILITIES
NOVEMBER 30, 2012
(amounts in 000’s, except share and per share amounts)
| | | | |
ASSETS | | | | |
Investments, at fair value: | | | | |
Non-affiliated (Cost — $973,064) | | $ | 1,184,101 | |
Affiliated (Cost — $52,044) | | | 142,924 | |
| | | | |
Total investments (Cost — $1,025,108) | | | 1,327,025 | |
Cash and cash denominated in foreign currency (Cost — $7,284) | | | 7,288 | |
Deposits with brokers | | | 255 | |
Receivable for securities sold (Cost — $5,106) | | | 5,106 | |
Interest, dividends and distributions receivable (Cost — $4,867) | | | 4,867 | |
Deferred debt issuance and preferred stock offering costs and other assets | | | 2,860 | |
| | | | |
Total Assets | | | 1,347,401 | |
| | | | |
|
LIABILITIES | |
Payable for securities purchased (Cost — $3,349) | | | 3,349 | |
Investment management fee payable | | | 1,375 | |
Call option contracts written (Premiums received — $2,109) | | | 2,208 | |
Accrued directors’ fees and expenses | | | 40 | |
Accrued expenses and other liabilities | | | 5,642 | |
Credit facility | | | 40,000 | |
Senior unsecured notes | | | 273,000 | |
Mandatory redeemable preferred stock, $25.00 liquidation value per share (4,800,000 shares issued and outstanding) | | | 120,000 | |
| | | | |
Total Liabilities | | | 445,614 | |
| | | | |
NET ASSETS APPLICABLE TO COMMON STOCKHOLDERS | | $ | 901,787 | |
| | | | |
NET ASSETS APPLICABLE TO COMMON STOCKHOLDERS CONSIST OF | | | | |
Common stock, $0.001 par value (35,467,035 shares issued and outstanding and 195,200,000 shares authorized) | | $ | 35 | |
Paid-in capital in excess of taxable income | | | 643,919 | |
Accumulated net investment income less distributions not treated as tax return of capital | | | (30,780 | ) |
Accumulated net realized gains less distributions not treated as tax return of capital | | | (13,208 | ) |
Net unrealized gains | | | 301,821 | |
| | | | |
NET ASSETS APPLICABLE TO COMMON STOCKHOLDERS | | $ | 901,787 | |
| | | | |
NET ASSET VALUE PER COMMON SHARE | | $ | 25.43 | |
| | | | |
See accompanying notes to financial statements.
17
KAYNE ANDERSON ENERGY TOTAL RETURN FUND, INC.
STATEMENT OF OPERATIONS
FOR THE FISCAL YEAR ENDED NOVEMBER 30, 2012
(amounts in 000’s)
| | | | |
INVESTMENT INCOME | | | | |
Income | | | | |
Dividends and distributions: | | | | |
Non-affiliated investments | | $ | 49,550 | |
Affiliated investments | | | 7,068 | |
| | | | |
Total dividends and distributions (after foreign taxes withheld of $1,078) | | | 56,618 | |
Return of capital | | | (32,629 | ) |
| | | | |
Net dividends and distributions | | | 23,989 | |
Interest | | | 14,457 | |
Other income | | | 712 | |
| | | | |
Total investment income | | | 39,158 | |
| | | | |
Expenses | | | | |
Investment management fees | | | 16,991 | |
Administration fees | | | 336 | |
Professional fees | | | 463 | |
Reports to stockholders | | | 214 | |
Custodian fees | | | 165 | |
Directors’ fees and expenses | | | 162 | |
Insurance | | | 84 | |
Other expenses | | | 294 | |
| | | | |
Total expenses — before interest expense and preferred distributions | | | 18,709 | |
Interest expense and amortization of debt issuance costs | | | 15,221 | |
Distributions on mandatory redeemable preferred stock and amortization of offering costs | | | 6,768 | |
| | | | |
Total expenses | | | 40,698 | |
| | | | |
Net Investment Loss | | | (1,540 | ) |
| | | | |
REALIZED AND UNREALIZED GAINS (LOSSES) | | | | |
Net Realized Gains (Losses) | | | | |
Investments — non-affiliated | | | 3,702 | |
Investments — affiliated | | | 5,103 | |
Foreign currency transactions | | | (93 | ) |
Options | | | 7,785 | |
| | | | |
Net Realized Gains | | | 16,497 | |
| | | | |
Net Change in Unrealized Gains (Losses) | | | | |
Investments — non-affiliated | | | 30,830 | |
Investments — affiliated | | | 27,330 | |
Foreign currency translations | | | (10 | ) |
Options | | | 181 | |
| | | | |
Net Change in Unrealized Gains | | | 58,331 | |
| | | | |
Net Realized and Unrealized Gains | | | 74,828 | |
| | | | |
NET INCREASE IN NET ASSETS APPLICABLE TO COMMON STOCKHOLDERS RESULTING FROM OPERATIONS | | $ | 73,288 | |
| | | | |
See accompanying notes to financial statements.
18
KAYNE ANDERSON ENERGY TOTAL RETURN FUND, INC.
STATEMENT OF CHANGES IN NET ASSETS APPLICABLE TO COMMON STOCKHOLDERS
(amounts in 000’s, except share amounts)
| | | | | | | | |
| | | For the Fiscal Year Ended
November 30, | |
| | | 2012 | | | 2011 | |
OPERATIONS | | | | | | | | |
Net investment loss(1) | | $ | (1,540 | ) | | $ | (2,702 | ) |
Net realized gains | | | 16,497 | | | | 100,067 | |
Net change in unrealized gains (losses) | | | 58,331 | | | | (75,438 | ) |
| | | | | | | | |
Net Increase in Net Assets Resulting from Operations | | | 73,288 | | | | 21,927 | |
| | | | | | | | |
DIVIDENDS AND DISTRIBUTIONS TO COMMON STOCKHOLDERS(2) | | | | | |
Dividends | | | (24,799 | ) | | | — | |
Distributions — net long-term capital gains | | | — | | | | (66,578 | ) |
Distributions — return of capital | | | (42,717 | ) | | | — | |
| | | | | | | | |
Dividends and Distributions to Common Stockholders | | | (67,516 | ) | | | (66,578 | ) |
| | | | | | | | |
CAPITAL STOCK TRANSACTIONS | | | | | | | | |
Issuance of 74,201 shares of common stock | | | 1,932 | | | | — | |
Underwriting discounts and offering expenses associated with the issuance of common stock | | | (38 | ) | | | — | |
Issuance of 390,359 and 510,293 newly issued shares of common stock from reinvestment of dividends and distributions | | | 10,154 | | | | 13,554 | |
| | | | | | | | |
Net Increase in Net Assets Applicable to Common Stockholders from Capital Stock Transactions | | | 12,048 | | | | 13,554 | |
| | | | | | | | |
Total Increase (Decrease) in Net Assets Applicable to Common Stockholders | | | 17,820 | | | | (31,097 | ) |
| | | | | | | | |
NET ASSETS APPLICABLE TO COMMON STOCKHOLDERS | | | | | | | | |
Beginning of year | | | 883,967 | | | | 915,064 | |
| | | | | | | | |
End of year | | $ | 901,787 | | | $ | 883,967 | |
| | | | | | | | |
| (1) | Distributions on the Fund’s mandatory redeemable preferred stock are treated as an operating expense under GAAP and are included in the calculation of net investment loss. See Note 2 — Significant Accounting Policies. Distributions in the amount of $6,497 paid to mandatory redeemable preferred stockholders for the fiscal year ended November 30, 2012 were characterized as dividend income. Distributions in the amount of $5,796 paid to mandatory redeemable preferred stockholders for the fiscal year ended November 30, 2011 were characterized as long-term capital gains. This characterization is based on the Fund’s earnings and profits. |
| (2) | The information presented in each of these items is a characterization of a portion of the total dividends and distributions paid to common stockholders for the fiscal years ended November 30, 2012 and 2011 as either a dividend (a portion of which may be eligible to be treated as qualified dividend income) or distributions (long-term capital gains or return of capital). This characterization is based on the Fund’s earnings and profits. |
See accompanying notes to financial statements.
19
KAYNE ANDERSON ENERGY TOTAL RETURN FUND, INC.
STATEMENT OF CASH FLOWS
FOR THE FISCAL YEAR ENDED NOVEMBER 30, 2012
(amounts in 000’s)
| | | | |
CASH FLOWS FROM OPERATING ACTIVITIES | | | | |
Net increase in net assets resulting from operations | | $ | 73,288 | |
Adjustments to reconcile net increase in net assets resulting from operations to net cash provided by operating activities: | | | | |
Return of capital distributions | | | 32,629 | |
Net realized gains (excluding foreign currency transactions) | | | (16,590 | ) |
Unrealized gains (excluding impact on cash of foreign currency translations) | | | (58,341 | ) |
Accretion of bond discounts, net | | | (37 | ) |
Purchase of long-term investments | | | (776,908 | ) |
Proceeds from sale of long-term investments | | | 770,104 | |
Increase in deposits with brokers | | | (5 | ) |
Increase in receivable for securities sold | | | (295 | ) |
Increase in interest, dividends and distributions receivable | | | (253 | ) |
Amortization of deferred debt issuance costs | | | 870 | |
Amortization of mandatory redeemable preferred stock offering costs | | | 271 | |
Increase in other assets, net | | | (85 | ) |
Decrease in payable for securities purchased | | | (5,092 | ) |
Increase in investment management fee payable | | | 32 | |
Increase in call option contracts written, net | | | 1,676 | |
Decrease in accrued directors’ fees and expenses | | | (2 | ) |
Decrease in accrued expenses and other liabilities | | | (658 | ) |
| | | | |
Net Cash Provided by Operating Activities | | | 20,604 | |
| | | | |
CASH FLOWS FROM FINANCING ACTIVITIES | | | | |
Issuance of shares of common stock, net of offering costs | | | 1,894 | |
Proceeds from credit facility | | | 40,000 | |
Redemption of senior unsecured notes | | | (28,000 | ) |
Cash distributions paid to common stockholders, net | | | (57,362 | ) |
| | | | |
Net Cash Used in Financing Activities | | | (43,468 | ) |
| | | | |
NET DECREASE IN CASH | | | (22,864 | ) |
CASH — BEGINNING OF YEAR | | | 30,152 | |
| | | | |
CASH — END OF YEAR | | $ | 7,288 | |
| | | | |
Supplemental disclosure of cash flow information:
Non-cash financing activities not included herein consist of reinvestment of distributions of $10,154 pursuant to the Fund’s dividend reinvestment plan. During the fiscal year ended November 30, 2012, interest paid was $14,828, and there were no income taxes paid.
During the fiscal year ended November 30, 2012, the Fund received $21,492 of paid-in-kind dividends. See Note 2 — Significant Accounting Policies.
See accompanying notes to financial statements.
20
KAYNE ANDERSON ENERGY TOTAL RETURN FUND, INC.
FINANCIAL HIGHLIGHTS
(amounts in 000’s, except share and per share amounts)
| | | | | | | | | | | | | | | | | | | | | | | | | | | | | | | | |
| | | For the Fiscal Year Ended
November 30, | | | For the
Period
June 28,
2005(1)
through
November 30,
2005 | |
| | | 2012 | | | 2011 | | | 2010 | | | 2009 | | | 2008 | | | 2007 | | | 2006 | | |
| | | | | | | | | | | | | | | | | | | | | | | | | | | | | | | | |
Per Share of Common Stock(2) | | | | | | | | | | | | | | | | | | | | | | | | | | | | | |
Net asset value, beginning of period | | $ | 25.25 | | | $ | 26.53 | | | $ | 20.04 | | | $ | 13.43 | | | $ | 29.01 | | | $ | 25.44 | | | $ | 24.13 | | | $ | 23.84 | (3) |
Net investment income (loss)(4) | | | (0.04 | ) | | | (0.08 | ) | | | 0.16 | | | | 0.31 | | | | 0.88 | | | | 1.09 | | | | 1.17 | | | | 0.23 | |
Net realized and unrealized gains (losses) | | | 2.14 | | | | 0.71 | | | | 8.24 | | | | 8.26 | | | | (14.09 | ) | | | 4.82 | | | | 2.34 | | | | 0.33 | |
| | | | | | | | | | | | | | | | | | | | | | | | | | | | | | | | |
Total income (loss) from operations | | | 2.10 | | | | 0.63 | | | | 8.40 | | | | 8.57 | | | | (13.21 | ) | | | 5.91 | | | | 3.51 | | | | 0.56 | |
| | | | | | | | | | | | | | | | | | | | | | | | | | | | | | | | |
Dividends and distributions — auction rate preferred(4)(5) | | | — | | | | — | | | | — | | | | — | | | | (0.34 | ) | | | (0.50 | ) | | | (0.44 | ) | | | — | |
| | | | | | | | | | | | | | | | | | | | | | | | | | | | | | | | |
Common dividends(5) | | | (0.71 | ) | | | — | | | | (1.92 | ) | | | (0.62 | ) | | | (0.38 | ) | | | (0.83 | ) | | | (0.86 | ) | | | (0.23 | ) |
Common dividends — short-term capital gains(5) | | | — | | | | — | | | | — | | | | — | | | | — | | | | (0.53 | ) | | | (0.81 | ) | | | (0.04 | ) |
Common distributions — long-term capital gains(5) | | | — | | | | (1.92 | ) | | | — | | | | — | | | | — | | | | (0.48 | ) | | | — | | | | — | |
Common distributions — return of capital(5) | | | (1.21 | ) | | | — | | | | — | | | | (1.34 | ) | | | (1.68 | ) | | | — | | | | (0.03 | ) | | | — | |
| | | | | | | | | | | | | | | | | | | | | | | | | | | | | | | | |
Total dividends and distributions — common | | | (1.92 | ) | | | (1.92 | ) | | | (1.92 | ) | | | (1.96 | ) | | | (2.06 | ) | | | (1.84 | ) | | | (1.70 | ) | | | (0.27 | ) |
| | | | | | | | | | | | | | | | | | | | | | | | | | | | | | | | |
Effect of common stock repurchased | | | — | | | | — | | | | — | | | | — | | | | — | | | | — | | | | 0.05 | | | | — | |
Underwriting discounts and offering costs on the issuance of common and preferred stock | | | — | | | | — | | | | — | | | | — | | | | — | | | | — | | | | (0.11 | ) | | | — | |
Gain on 765 shares of Series B Preferred Stock redeemed at a discount to liquidation value | | | — | | | | — | | | | — | | | | — | | | | 0.03 | | | | — | | | | — | | | | — | |
Effect of shares issued in reinvestment of distributions | | | — | | | | 0.01 | | | | 0.01 | | | | — | | | | — | | | | — | | | | — | | | | — | |
| | | | | | | | | | | | | | | | | | | | | | | | | | | | | | | | |
Total capital stock transactions | | | — | | | | 0.01 | | | | 0.01 | | | | — | | | | 0.03 | | | | — | | | | (0.06 | ) | | | — | |
| | | | | | | | | | | | | | | | | | | | | | | | | | | | | | | | |
Net asset value, end of period | | $ | 25.43 | | | $ | 25.25 | | | $ | 26.53 | | | $ | 20.04 | | | $ | 13.43 | | | $ | 29.01 | | | $ | 25.44 | | | $ | 24.13 | |
| | | | | | | | | | | | | | | | | | | | | | | | | | | | | | | | |
Market value per share of common stock, end of period | | $ | 25.02 | | | $ | 23.82 | | | $ | 28.34 | | | $ | 22.28 | | | $ | 10.53 | | | $ | 25.79 | | | $ | 25.00 | | | $ | 21.10 | |
| | | | | | | | | | | | | | | | | | | | | | | | | | | | | | | | |
Total investment return based on common stock market value(6) | | | 13.0 | % | | | (9.7 | )% | | | 37.9 | % | | | 139.9 | % | | | (55.2 | )% | | | 10.2 | % | | | 27.2 | % | | | (14.6 | )%(7) |
See accompanying notes to financial statements.
21
KAYNE ANDERSON ENERGY TOTAL RETURN FUND, INC.
FINANCIAL HIGHLIGHTS
(amounts in 000’s, except share and per share amounts)
| | | | | | | | | | | | | | | | | | | | | | | | | | | | | | | | |
| | | For the Fiscal Year Ended
November 30, | | | For the
Period
June 28,
2005(1)
through
November 30,
2005 | |
| | | 2012 | | | 2011 | | | 2010 | | | 2009 | | | 2008 | | | 2007 | | | 2006 | | |
| | | | | | | | | | | | | | | | | | | | | | | | | | | | | | | | |
Supplemental Data and Ratios(8) | | | | | | | | | | | | | | | | | | | | | | | | | | | | | | | | |
Net assets applicable to common stockholders, end of period | | $ | 901,787 | | | $ | 883,967 | | | $ | 915,064 | | | $ | 677,678 | | | $ | 437,946 | | | $ | 934,434 | | | $ | 806,063 | | | $ | 776,963 | |
Ratio of expenses to average net assets | | | | | | | | | | | | | | | | | | | | | | | | | | | | | | | | |
Management fees | | | 1.8 | % | | | 1.8 | % | | | 1.7 | % | | | 1.7 | % | | | 1.6 | % | | | 1.7 | % | | | 1.7 | % | | | 1.3 | % |
Other expenses | | | 0.2 | | | | 0.2 | | | | 0.3 | | | | 0.3 | | | | 0.3 | | | | 0.3 | | | | 0.3 | | | | 0.4 | |
| | | | | | | | | | | | | | | | | | | | | | | | | | | | | | | | |
Subtotal | | | 2.0 | | | | 2.0 | | | | 2.0 | | | | 2.0 | | | | 1.9 | | | | 2.0 | | | | 2.0 | | | | 1.7 | |
Interest expense and distributions on mandatory redeemable preferred stock(4) | | | 2.4 | | | | 2.3 | | | | 2.3 | | | | 2.6 | | | | 0.7 | | | | 0.2 | | | | 0.1 | | | | — | |
Management fee waivers | | | — | | | | — | | | | — | | | | — | | | | — | | | | (0.1 | ) | | | (0.3 | ) | | | (0.2 | ) |
| | | | | | | | | | | | | | | | | | | | | | | | | | | | | | | | |
Total expenses | | | 4.4 | % | | | 4.3 | % | | | 4.3 | % | | | 4.6 | % | | | 2.6 | % | | | 2.1 | % | | | 1.8 | % | | | 1.5 | % |
| | | | | | | | | | | | | | | | | | | | | | | | | | | | | | | | |
Ratio of net investment income (loss) to average net assets(4) | | | (0.2 | )% | | | (0.3 | )% | | | 0.7 | % | | | 2.0 | % | | | 3.1 | % | | | 3.8 | % | | | 4.6 | % | | | 2.3 | % |
Net increase (decrease) in net assets applicable to common stockholders resulting from operations to average net assets | | | 7.8 | % | | | 2.3 | % | | | 37.2 | % | | | 55.8 | % | | | (47.7 | )% | | | 19.1 | % | | | 12.3 | % | | | 2.4 | %(7) |
Portfolio turnover rate | | | 57.2 | % | | | 57.6 | % | | | 62.0 | % | | | 88.8 | % | | | 65.0 | % | | | 52.1 | % | | | 63.8 | % | | | 23.2 | %(7) |
Average net assets | | $ | 934,388 | | | $ | 940,587 | | | $ | 771,297 | | | $ | 512,647 | | | $ | 915,456 | | | $ | 906,692 | | | $ | 802,434 | | | $ | 759,550 | |
Senior unsecured notes outstanding, end of period | | | 273,000 | | | | 301,000 | | | | 250,000 | | | | 165,000 | | | | 225,000 | | | | — | | | | — | | | | — | |
Credit facility outstanding, end of period | | | 40,000 | | | | — | | | | 67,000 | | | | 47,000 | | | | — | | | | 41,000 | | | | — | | | | 40,000 | |
Auction rate preferred stock, end of period | | | — | | | | — | | | | — | | | | — | | | | — | | | | 300,000 | | | | 300,000 | | | | — | |
Mandatory redeemable preferred stock, end of period | | | 120,000 | | | | 120,000 | | | | 90,000 | | | | — | | | | — | | | | — | | | | — | | | | — | |
Average shares of common stock outstanding | | | 35,222,412 | | | | 34,742,802 | | | | 34,177,249 | | | | 33,272,958 | | | | 32,258,146 | | | | 32,036,996 | | | | 31,809,344 | | | | 32,204,000 | |
Asset coverage of total debt(9) | | | 426.4 | % | | | 433.5 | % | | | 417.1 | % | | | 419.7 | % | | | 294.6 | %(10) | | | — | | | | — | | | | — | |
Asset coverage of total leverage (debt and preferred stock)(11) | | | 308.3 | % | | | 310.0 | % | | | 324.8 | % | | | 419.7 | % | | | 294.6 | %(10) | | | 374.0 | % | | | 368.7 | % | | | — | |
Average amount of borrowings per share of common stock during the period | | $ | 8.70 | | | $ | 8.92 | | | $ | 7.71 | | | $ | 5.18 | | | $ | 3.53 | | | $ | 0.53 | | | $ | 0.08 | | | | — | |
See accompanying notes to financial statements.
22
KAYNE ANDERSON ENERGY TOTAL RETURN FUND, INC.
FINANCIAL HIGHLIGHTS
(amounts in 000’s, except share and per share amounts)
| (1) | Commencement of operations. |
| (2) | Based on average shares of common stock outstanding. |
| (3) | Initial public offering price of $25.00 per share less underwriting discounts of $1.125 per share and offering costs of $0.04 per share. |
| (4) | Distributions on the Fund’s mandatory redeemable preferred stock are treated as an operating expense under GAAP and are included in the calculation of net investment income (loss). See Note 2 — Significant Accounting Policies. |
| (5) | The information presented for each period is a characterization of the total distributions paid to the preferred stockholders and common stockholders as either a dividend (a portion of which may have been eligible to be treated as qualified dividend income) or a distribution (capital gains or return of capital) and is based on the Fund’s earnings and profits. |
| (6) | Total investment return is calculated assuming a purchase of common stock at the market price on the first day and a sale at the current market price on the last day of the period reported. The calculation also assumes reinvestment of distributions at actual prices pursuant to the Fund’s dividend reinvestment plan. |
| (8) | Unless otherwise noted, ratios are annualized. |
| (9) | Calculated pursuant to section 18(a)(1)(A) of the 1940 Act. Represents the value of total assets less all liabilities not represented by Senior Notes or any other senior securities representing indebtedness and mandatory redeemable preferred stock divided by the aggregate amount of Senior Notes and any other senior securities representing indebtedness. Under the 1940 Act, the Fund may not declare or make any distribution on its common stock nor can it incur additional indebtedness if at the time of such declaration or incurrence its asset coverage with respect to senior securities representing indebtedness would be less than 300%. For purposes of this test, the Credit Facility is considered a senior security representing indebtedness. |
| (10) | At November 30, 2008, the Fund’s asset coverage ratio on total debt pursuant to the 1940 Act was less than 300%. However, on December 2, 2008, the Fund entered into an agreement to repurchase $60,000 of its Senior Notes, which closed on December 5, 2008. Upon the closing of the repurchase of the Senior Notes, the Fund was in compliance with the 1940 Act and with its covenants under the Senior Notes agreements. |
| (11) | Calculated pursuant to section 18(a)(2)(A) of the 1940 Act. Represents the value of total assets less all liabilities not represented by Senior Notes, any other senior securities representing indebtedness and preferred stock divided by the aggregate amount of Senior Notes, any other senior securities representing indebtedness and preferred stock. Under the 1940 Act, the Fund may not declare or make any distribution on its common stock nor can it issue additional preferred stock if at the time of such declaration or issuance, its asset coverage with respect to all senior securities would be less than 200%. In addition to the limitations under the 1940 Act, the Fund, under the terms of its mandatory redeemable preferred stock, would not be able to declare or pay any distributions on its common stock if such declaration would cause its asset coverage with respect to all senior securities to be less than 225%. For purposes of these asset coverage ratio tests, the Credit Facility is considered a senior security representing indebtedness. |
See accompanying notes to financial statements.
23
KAYNE ANDERSON ENERGY TOTAL RETURN FUND, INC.
NOTES TO FINANCIAL STATEMENTS
(amounts in 000’s, except number of option contracts, share and per share amounts)
1. Organization
Kayne Anderson Energy Total Return Fund, Inc. (the “Fund”) was organized as a Maryland corporation on March 31, 2005 and commenced operations on June 28, 2005. The Fund is registered under the Investment Company Act of 1940, as amended (the “1940 Act”), as a non-diversified closed-end investment company. The Fund’s investment objective is to obtain a high total return with an emphasis on current income. The Fund intends to achieve this investment objective by investing in a portfolio of companies in the energy sector. The majority of the Fund’s investments include investments in equity securities of master limited partnerships and limited liability companies taxed as partnerships (“MLPs”), MLP affiliates, energy marine transportation companies and upstream income trusts. The Fund’s shares of common stock are listed on the New York Stock Exchange, Inc. (“NYSE”) under the symbol “KYE.”
2. Significant Accounting Policies
A. Use of Estimates — The preparation of financial statements in conformity with accounting principles generally accepted in the United States of America (“GAAP”) requires management to make estimates and assumptions that affect the reported amount of assets and liabilities and disclosure of contingent assets and liabilities as of the date of the financial statements and the reported amounts of revenue and expenses during the period. Actual results could differ materially from those estimates.
B. Reclassifications — Certain prior year amounts in the accompanying financial statements have been reclassified to conform to the current year’s presentation.
C. Cash and Cash Equivalents — Cash and cash equivalents include short-term, liquid investments with an original maturity of three months or less and include money market fund accounts.
D. Calculation of Net Asset Value — The Fund determines its net asset value no less frequently than as of the last day of each month based on the most recent close of regular session trading on the NYSE, and makes its net asset value available for publication monthly. Currently, the Fund calculates its net asset value on a weekly basis. Net asset value is computed by dividing the value of the Fund’s assets (including accrued interest and distributions), less all of its liabilities (including accrued expenses, distributions payable and any borrowings) and the liquidation value of any outstanding preferred stock by the total number of common shares outstanding.
E. Investment Valuation — Readily marketable portfolio securities listed on any exchange other than the NASDAQ Stock Market, Inc. (“NASDAQ”) are valued, except as indicated below, at the last sale price on the business day as of which such value is being determined. If there has been no sale on such day, the securities are valued at the mean of the most recent bid and ask prices on such day. Securities admitted to trade on the NASDAQ are valued at the NASDAQ official closing price. Portfolio securities traded on more than one securities exchange are valued at the last sale price on the business day as of which such value is being determined at the close of the exchange representing the principal market for such securities.
Equity securities traded in the over-the-counter market, but excluding securities admitted to trading on the NASDAQ, are valued at the closing bid prices. Debt securities that are considered bonds are valued by using the mean of the bid and ask prices provided by an independent pricing service. For debt securities that are considered bank loans, the fair market value is determined by the mean of the bid and ask prices provided by the agent or syndicate bank or principal market maker. When price quotes are not available, fair market value will be based on prices of comparable securities. In certain cases, the Fund may not be able to purchase or sell debt securities at the quoted prices due to the lack of liquidity for these securities.
Exchange-traded options and futures contracts are valued at the last sales price at the close of trading in the market where such contracts are principally traded or, if there was no sale on the applicable exchange on such day, at the mean between the quoted bid and ask price as of the close of such exchange.
24
KAYNE ANDERSON ENERGY TOTAL RETURN FUND, INC.
NOTES TO FINANCIAL STATEMENTS
(amounts in 000’s, except number of option contracts, share and per share amounts)
The Fund holds securities that are privately issued or otherwise restricted as to resale. For these securities, as well as any other portfolio security held by the Fund for which reliable market quotations are not readily available, valuations are determined in a manner that most accurately reflects fair value of the security on the valuation date. Unless otherwise determined by the Board of Directors, the following valuation process is used for such securities:
| | • | | Investment Team Valuation. The applicable investments are valued by senior professionals of KA Fund Advisors, LLC (“KAFA” or the “Adviser”) who are responsible for the portfolio investments. The investments will be valued monthly with new investments valued at the end of the month in which the investment was made. |
| | • | | Investment Team Valuation Documentation. Preliminary valuation conclusions will be determined by senior management of KAFA. Such valuations are submitted to the Valuation Committee (a committee of the Fund’s Board of Directors) or the Board of Directors on a monthly or quarterly basis, as appropriate. |
| | • | | Valuation Committee. The Valuation Committee meets to consider the valuations submitted by KAFA (1) at the end of each month for new investments, if any, and (2) at the end of each quarter for existing investments. Between meetings of the Valuation Committee, a senior officer of KAFA is authorized to make valuation determinations. All valuation determinations of the Valuation Committee are subject to ratification by the Board of Directors at its next regular meeting. |
| | • | | Valuation Firm. No less than quarterly, a third-party valuation firm engaged by the Board of Directors reviews the valuation methodologies and calculations employed for these securities. |
| | • | | Board of Directors Determination. The Board of Directors meets quarterly to consider the valuations provided by KAFA and the Valuation Committee, if applicable, and ratify valuations for the applicable securities. The Board of Directors considers the report provided by the third-party valuation firm in reviewing and determining in good faith the fair value of the applicable portfolio securities. |
As of November 30, 2012, the Fund held 4.2% of its net assets applicable to common stockholders (2.8% of total assets) in securities that were fair valued pursuant to the procedures adopted by the Board of Directors. The aggregate fair value of these securities at November 30, 2012 was $37,589. See Note 3 — Fair Value and Note 7 — Restricted Securities.
F. Repurchase Agreements — From time to time, the Fund has agreed to purchase securities from financial institutions subject to the seller’s agreement to repurchase them at an agreed-upon time and price (“repurchase agreements”). The financial institutions with whom the Fund enters into repurchase agreements are banks and broker/dealers which KAFA considers creditworthy. The seller under a repurchase agreement is required to maintain the value of the securities as collateral, subject to the agreement, at not less than the repurchase price plus accrued interest. KAFA monitors daily the mark-to-market of the value of the collateral, and, if necessary, requires the seller to maintain additional securities, so that the value of the collateral is not less than the repurchase price. Default by or bankruptcy of the seller would, however, expose the Fund to possible loss because of adverse market action or delays in connection with the disposition of the underlying securities. As of November 30, 2012, the Fund did not have any repurchase agreements.
G. Short Sales — A short sale is a transaction in which the Fund sells securities it does not own (but has borrowed) in anticipation of or to hedge against a decline in the market price of the securities. To complete a short sale, the Fund may arrange through a broker to borrow the securities to be delivered to the buyer. The proceeds received by the Fund for the short sale are retained by the broker until the Fund replaces the borrowed securities. In borrowing the securities to be delivered to the buyer, the Fund becomes obligated to replace the securities borrowed at their market price at the time of replacement, whatever the price may be.
25
KAYNE ANDERSON ENERGY TOTAL RETURN FUND, INC.
NOTES TO FINANCIAL STATEMENTS
(amounts in 000’s, except number of option contracts, share and per share amounts)
The Fund’s short sales, if any, are fully collateralized. The Fund is required to maintain assets consisting of cash or liquid securities equal in amount to the liability created by the short sale. These assets are adjusted daily to reflect changes in the value of the securities sold short. The Fund is liable for any dividends or distributions paid on securities sold short.
The Fund may also sell short “against the box” (i.e., the Fund enters into a short sale as described above while holding an offsetting long position in the security which it sold short). If the Fund enters into a short sale “against the box,” the Fund would segregate an equivalent amount of securities owned as collateral while the short sale is outstanding. During the fiscal year ended November 30, 2012, the Fund did not engage in any short sales.
H. Derivative Financial Instruments — The Fund may utilize derivative financial instruments in its operations.
Interest rate swap contracts. The Fund may use hedging techniques such as interest rate swaps to mitigate potential interest rate risk on a portion of the Fund’s leverage. Such interest rate swaps would principally be used to protect the Fund against higher costs on its leverage resulting from increases in short term interest rates. The Fund does not hedge any interest rate risk associated with portfolio holdings. Interest rate transactions the Fund uses for hedging purposes expose it to certain risks that differ from the risks associated with its portfolio holdings. A decline in interest rates may result in a decline in the value of the swap contracts, which, everything else being held constant, would result in a decline in the net assets of the Fund. In addition, if the counterparty to an interest rate swap defaults, the Fund would not be able to use the anticipated net receipts under the interest rate swap to offset its cost of financial leverage.
Interest rate swap contracts are recorded at fair value with changes in value during the reporting period, and amounts accrued under the agreements, included as unrealized gains or losses in the Statement of Operations. Monthly cash settlements under the terms of the interest rate swap agreements or termination payments are recorded as realized gains or losses in the Statement of Operations. The Fund generally values its interest rate swap contracts based on dealer quotations, if available, or by discounting the future cash flows from the stated terms of the interest rate swap agreement by using interest rates currently available in the market. At November 30, 2012, the Fund had no interest rate swap contracts outstanding. See Note 8 — Derivative Financial Instruments.
Option contracts. The Fund is also exposed to financial market risks including changes in the valuations of its investment portfolio. The Fund may purchase or write (sell) call options. A call option on a security is a contract that gives the holder of the option, in return for a premium, the right to buy from the writer of the option the security underlying the option at a specified exercise price at any time during the term of the option.
The Fund would realize a gain on a purchased call option if, during the option period, the value of such securities exceeded the sum of the exercise price, the premium paid and transaction costs; otherwise the Fund would realize either no gain or a loss on the purchased call option. The Fund may also purchase put option contracts. If a purchased put option is exercised, the premium paid increases the cost basis of the securities sold by the Fund.
The Fund may also write (sell) call options with the purpose of generating realized gains or reducing its ownership of certain securities. If the Fund writes a call option on a security, the Fund has the obligation upon exercise of the option to deliver the underlying security upon payment of the exercise price. The Fund will only write call options on securities that the Fund holds in its portfolio (i.e., covered calls).
When the Fund writes a call option, an amount equal to the premium received by the Fund is recorded as a liability and is subsequently adjusted to the current fair value of the option written. Premiums received from writing options that expire unexercised are treated by the Fund on the expiration date as realized gains from investments. If the Fund repurchases a written call option prior to its exercise, the difference between the premium
26
KAYNE ANDERSON ENERGY TOTAL RETURN FUND, INC.
NOTES TO FINANCIAL STATEMENTS
(amounts in 000’s, except number of option contracts, share and per share amounts)
received and the amount paid to repurchase the option is treated as a realized gain or loss. If a call option is exercised, the premium is added to the proceeds from the sale of the underlying security in determining whether the Fund has realized a gain or loss. The Fund, as the writer of an option, bears the market risk of an unfavorable change in the price of the security underlying the written option. See Note 8 — Derivative Financial Instruments.
I. Security Transactions — Security transactions are accounted for on the date these securities are purchased or sold (trade date). Realized gains and losses are reported on an identified cost basis.
J. Return of Capital Estimates — Dividends and distributions received from the Fund’s investments are comprised of income and return of capital. The payments made by MLPs are categorized as “distributions” and payments made by corporations are categorized as “dividends.” At the time such dividends and distributions are received, the Fund estimates the amount of such payments that are considered investment income and the amount that is considered a return of capital. Such estimates are based on historical information available from each investment and other industry sources. These estimates may subsequently be revised based on information received from investments after their tax reporting periods are concluded.
The following table sets forth (1) the components of total dividends and distributions, (2) the percentage of return of capital attributable to each category and (3) the estimated total return of capital portion of the dividends and distributions received from investments and the amounts that are attributable to net realized gains (losses) and net change in unrealized gains (losses). The return of capital portion of the dividends and distributions received is a reduction to investment income, results in an equivalent reduction in the cost basis of the associated investments, and increases net realized gains (losses) and net change in unrealized gains (losses). In accordance with GAAP, the return of capital cost basis reductions for the Fund’s MLP investments are limited to the total amount of the cash distributions received from such investments. For income tax purposes, the cost basis reductions for the Fund’s MLP investments typically exceed cash distributions received from such investments due to allocated losses from these investments.
| | | | |
| | | Fiscal Year
Ended
November 30,
2012 | |
Dividends from investments | | $ | 34,924 | |
Distributions from investments | | | 22,772 | |
| | | | |
Total dividends and distributions from investments
(before foreign taxes withheld of $1,078) | | $ | 57,696 | |
| | | | |
Dividends — % return of capital | | | 40 | % |
Distributions — % return of capital | | | 83 | % |
Total dividends and distributions — % return of capital | | | 57 | % |
Return of capital — attributable to net realized gains (losses) | | $ | 11,628 | |
Return of capital — attributable to net change in unrealized gains (losses) | | | 21,001 | |
| | | | |
Total return of capital | | $ | 32,629 | |
| | | | |
For the fiscal year ended November 30, 2012, the Fund estimated the return of capital portion of distributions received to be $31,843 (55%). This amount was increased by $786 attributable to the 2011 tax reporting information received by the Fund in fiscal 2012. As a result, the return of capital percentage for the fiscal year ended November 30, 2012 was 57%.
K. Investment Income — The Fund records dividends and distributions on the ex-dividend date. Interest income is recognized on the accrual basis, including amortization of premiums and accretion of discounts. When investing in securities with payment in-kind interest, the Fund will accrue interest income during the life of the security even though it will not be receiving cash as the interest is accrued. To the extent that interest income to
27
KAYNE ANDERSON ENERGY TOTAL RETURN FUND, INC.
NOTES TO FINANCIAL STATEMENTS
(amounts in 000’s, except number of option contracts, share and per share amounts)
be received is not expected to be realized, a reserve against income is established. During the fiscal year ended November 30, 2012, the Fund did not have a reserve against interest income, since all interest income accrued is expected to be received.
Many of the debt securities that the Fund holds were purchased at a discount or premium to the par value of the security. The non-cash accretion of a discount to par value increases interest income while the non-cash amortization of a premium to par value decreases interest income. The accretion of a discount and amortization of a premium are based on the effective interest method. The amount of these non-cash adjustments can be found in the Fund’s Statement of Cash Flows. The non-cash accretion of a discount increases the cost basis of the debt security, which results in an offsetting unrealized loss. The non-cash amortization of a premium decreases the cost basis of the debt security which results in an offsetting unrealized gain. To the extent that par value is not expected to be realized, the Fund discontinues accruing the non-cash accretion of the discount to par value of the debt security.
The Fund receives paid-in-kind dividends in the form of additional units or shares from its investments in Bonavista Energy Corporation, Buckeye Partners, L.P. (Class B Units), Enerplus Corporation, Enbridge Energy Management, L.L.C. and Kinder Morgan Management, LLC. The additional units or shares are not reflected in investment income during the period received but are recorded as unrealized gains. During the fiscal year ended November 30, 2012, the Fund received the following paid-in-kind dividends.
| | | | |
| | | Fiscal Year
Ended
November 30,
2012 | |
Bonavista Energy Corporation | | $ | 24 | |
Buckeye Partners, L.P. (Class B Units) | | | 807 | |
Enbridge Energy Management, L.L.C. | | | 9,044 | |
Enerplus Corporation | | | 329 | |
Kinder Morgan Management, LLC | | | 11,288 | |
| | | | |
Total paid-in-kind dividends | | $ | 21,492 | |
| | | | |
L. Distributions to Stockholders — Distributions to common stockholders are recorded on the ex-dividend date. Distributions to mandatory redeemable preferred stockholders are accrued on a daily basis as described in Note 12 — Preferred Stock. As required by the Distinguishing Liabilities from Equity topic of the Financial Accounting Standards Board (the “FASB”) Accounting Standards Codification, the Fund includes the accrued distributions on its mandatory redeemable preferred stock as an operating expense due to the fixed term of this obligation. For tax purposes the payments made to the holders of the Fund’s mandatory redeemable preferred stock are treated as dividends or distributions.
The estimated characterization of the distributions paid to preferred and common stockholders will be either a dividend (ordinary income) or distribution (return of capital). This estimate is based on the Fund’s operating results during the period. The actual characterization of the preferred and common stock distributions made during the current year will not be determinable until after the end of the fiscal year when the Fund can determine earnings and profits and, therefore, the characterization may differ from the preliminary estimates.
M. Partnership Accounting Policy — The Fund records its pro-rata share of the income (loss) and capital gains (losses), to the extent of distributions it has received, allocated from the underlying partnerships and adjusts the cost basis of the underlying partnerships accordingly. These amounts are included in the Fund’s Statement of Operations.
N. Taxes — It is the Fund’s intention to continue to be treated as and to qualify each year for special tax treatment afforded a regulated investment company (“RIC”’) under Subchapter M of the Internal Revenue Code of 1986, as amended. As long as the Fund meets certain requirements that govern its source of income, diversification of assets and timely distribution of earnings to stockholders, the Fund will not be subject to U.S. federal income tax. See Note 4 — Taxes.
28
KAYNE ANDERSON ENERGY TOTAL RETURN FUND, INC.
NOTES TO FINANCIAL STATEMENTS
(amounts in 000’s, except number of option contracts, share and per share amounts)
Dividend income received by the Fund from sources within Canada is subject to a 15% foreign withholding tax. For paid-in-kind dividends from Bonavista Energy Corporation and Enerplus Corporation received during the fiscal year ended November 30, 2012, there was no foreign withholding tax. Interest income on Canadian corporate obligations may be subject to a 10% withholding tax unless an exemption is met. The most common exemption available is for corporate bonds that have a tenor of at least 5 years, provided that not more than 25% of the principal is repayable in the first 5 years and provided that the borrower and lender are not “associated.” Further, interest is exempt if derived from debt obligations guaranteed by the Canadian government.
The Accounting for Uncertainty in Income Taxes Topic of the FASB Accounting Standards Codification defines the threshold for recognizing the benefits of tax-return positions in the financial statements as “more-likely-than-not” to be sustained by the taxing authority and requires measurement of a tax position meeting the more-likely-than-not criterion, based on the largest benefit that is more than 50% likely to be realized.
The Fund’s policy is to classify interest and penalties associated with underpayment of federal and state income taxes, if any, as income tax expense on its Statement of Operations. For the fiscal year ended November 30, 2012, the Fund did not have any interest or penalties associated with the underpayment of any income taxes. The tax years from 2009 through 2012 remain open and subject to examination by tax jurisdictions.
O. Foreign Currency Translations — The books and records of the Fund are maintained in U.S. dollars. Foreign currency amounts are translated into U.S. dollars on the following basis: (i) market value of investment securities, assets and liabilities at the rate of exchange as of the valuation date; and (ii) purchases and sales of investment securities, income and expenses at the relevant rates of exchange prevailing on the respective dates of such transactions.
The Fund does not isolate that portion of gains and losses on investments in equity and debt securities which is due to changes in the foreign exchange rates from that which is due to changes in market prices of equity and debt securities. Accordingly, realized and unrealized foreign currency gains and losses with respect to such securities are included in the reported net realized and unrealized gains and losses on investment transactions balances.
Net realized foreign exchange gains or losses represent gains and losses from transactions in foreign currencies and foreign currency contracts, foreign exchange gains or losses realized between the trade date and settlement date on security transactions, and the difference between the amounts of interest and dividends recorded on the Fund’s books and the U.S. dollar equivalent of such amounts on the payment date.
Net unrealized foreign exchange gains or losses represent the difference between the cost of assets and liabilities (other than investments) recorded on the Fund’s books from the value of the assets and liabilities (other than investments) on the valuation date.
P. Indemnifications — Under the Fund’s organizational documents, its officers and directors are indemnified against certain liabilities arising out of the performance of their duties to the Fund. In addition, in the normal course of business, the Fund enters into contracts that provide general indemnification to other parties. The Fund’s maximum exposure under these arrangements is unknown, as this would involve future claims that may be made against the Fund that have not yet occurred, and may not occur. However, the Fund has not had prior claims or losses pursuant to these contracts and expects the risk of loss to be remote.
3. Fair Value
The Fair Value Measurement Topic of the FASB Accounting Standards Codification (“ASC 820”) defines fair value as the price at which an orderly transaction to sell an asset or to transfer a liability would take place between market participants under current market conditions at the measurement date. As required by ASC 820,
29
KAYNE ANDERSON ENERGY TOTAL RETURN FUND, INC.
NOTES TO FINANCIAL STATEMENTS
(amounts in 000’s, except number of option contracts, share and per share amounts)
the Fund has performed an analysis of all assets and liabilities measured at fair value to determine the significance and character of all inputs to their fair value determination. Inputs are the assumptions, along with considerations of risk, that a market participant would use to value an asset or a liability. In general, observable inputs are based on market data that is readily available, regularly distributed and verifiable that the Fund obtains from independent, third-party sources. Unobservable inputs are developed by the Fund based on its own assumptions of how market participants would value an asset or a liability.
In May 2011, the FASB issued Accounting Standards Update (“ASU”) No. 2011-04 “Amendments to Achieve Common Fair Value Measurement and Disclosure Requirements in U.S. GAAP and IFRSs” which amends ASC 820. The amended guidance clarifies the wording used to describe many requirements in accounting literature for fair value measurement and disclosure to establish consistency between U.S. GAAP and International Financial Reporting Standards (“IFRSs”). The Fund adopted ASU No. 2011-04 in the fiscal second quarter of 2012.
The adoption of ASU No. 2011-04 did not have an impact on the measurement of fair value for the Fund’s assets, but it does require the inclusion of additional disclosures on assumptions used by the Fund to determine fair value. Specifically, for assets measured at fair value using significant unobservable inputs (Level 3), ASU No. 2011-04 requires that the Fund (i) describe the valuation process (ii) disclose quantitative information about unobservable inputs and (iii) provide a qualitative discussion about the sensitivity of the fair value measurement to changes in the unobservable inputs and inter-relationships between the inputs.
The fair value hierarchy prioritizes the inputs to valuation techniques used to measure fair value into the following three broad categories.
| | • | | Level 1 — Valuations based on quoted unadjusted prices for identical instruments in active markets traded on a national exchange to which the Fund has access at the date of measurement. |
| | • | | Level 2 — Valuations based on quoted prices for similar instruments in active markets; quoted prices for identical or similar instruments in markets that are not active; and model-derived valuations in which all significant inputs and significant value drivers are observable in active markets. Level 2 inputs are those in markets for which there are few transactions, the prices are not current, little public information exists or instances where prices vary substantially over time or among brokered market makers. |
| | • | | Level 3 — Model derived valuations in which one or more significant inputs or significant value drivers are unobservable. Unobservable inputs are those inputs that reflect the Fund’s own assumptions that market participants would use to price the asset or liability based on the best available information. |
The following table presents the Fund’s assets and liabilities measured at fair value on a recurring basis at November 30, 2012, and the Fund presents these assets by security type and description on its Schedule of Investments or on its Statement of Assets and Liabilities. Note that the valuation levels below are not necessarily an indication of the risk or liquidity associated with the underlying investment.
| | | | | | | | | | | | | | | | |
| | | Total | | | Quoted Prices in
Active Markets
(Level 1) | | | Prices with Other
Observable Inputs
(Level 2) | | | Unobservable
Inputs
(Level 3) | |
Assets at Fair Value | | | | | | | | | | | | | | | | |
Equity investments | | $ | 1,160,547 | | | $ | 1,122,958 | | | $ | — | | | $ | 37,589 | |
Debt investments | | | 166,478 | | | | — | | | | 166,478 | | | | — | |
| | | | | | | | | | | | | | | | |
Total assets at fair value | | $ | 1,327,025 | | | $ | 1,122,958 | | | $ | 166,478 | | | $ | 37,589 | |
| | | | | | | | | | | | | | | | |
Liabilities at Fair Value | | | | | | | | | | | | | | | | |
Call option contracts written | | $ | 2,208 | | | $ | — | | | $ | 2,208 | | | $ | — | |
| | | | | | | | | | | | | | | | |
30
KAYNE ANDERSON ENERGY TOTAL RETURN FUND, INC.
NOTES TO FINANCIAL STATEMENTS
(amounts in 000’s, except number of option contracts, share and per share amounts)
For the fiscal year ended November 30, 2012, there were no transfers between Level 1 and Level 2.
As of November 30, 2012, the Fund had senior unsecured notes (“Senior Notes”) outstanding with aggregate principal amount of $273,000 and 4,800,000 shares of mandatory redeemable preferred stock outstanding with a total liquidation value of $120,000. The Senior Notes and mandatory redeemable preferred stock were issued in private placements to institutional investors and are not listed on any exchange or automated quotation system. See Note 11 — Senior Unsecured Notes and Note 12 — Preferred Stock. As a result, the Fund categorizes the Senior Notes and mandatory redeemable preferred stock as Level 3 and determines the fair value of these instruments based on estimated market yields and credit spreads for comparable instruments with similar maturity, terms and structure.
The Fund records these instruments on its Statement of Assets and Liabilities at principal amount or liquidation value, and as of November 30, 2012, the estimated fair values of these leverage instruments are as follows.
| | | | | | | | |
Instrument | | Principal Amount /
Liquidation Value | | | Fair Value | |
Senior Notes | | $ | 273,000 | | | $ | 283,100 | |
Mandatory redeemable preferred stock | | $ | 120,000 | | | $ | 128,100 | |
The following table presents the Fund’s assets measured at fair value on a recurring basis using significant unobservable inputs (Level 3) for the fiscal year ended November 30, 2012.
| | | | |
| | | Equity
Investments | |
Balance — November 30, 2011 | | $ | 21,667 | |
Purchases | | | 37,000 | |
Issuances | | | 807 | |
Transfer out | | | (17,856 | ) |
Realized gains (losses) | | | — | |
Unrealized losses, net | | | (4,029 | ) |
| | | | |
Balance — November 30, 2012 | | $ | 37,589 | |
| | | | |
The $4,029 of unrealized losses presented in the table above relates to investments that are still held at November 30, 2012, and the Fund includes these unrealized gains and losses in the Statement of Operations — Net Change in Unrealized Gains (Losses). The purchases of $37,000 relate to the private investment in public equity (“PIPE investment”) in the Class B units of Capital Product Partners L.P. ($30,000), Crosstex Energy, L.P. ($5,000) and DCP Midstream Partners, LP ($2,000). The issuances of $807 relate to the Class B units of Buckeye Partners, L.P. The Fund’s investments in the common units of Teekay Offshore Partners L.P. ($10,856), Crosstex Energy, L.P. ($5,000) and DCP Midstream Partners, LP ($2,000), which are noted as transfers out of Level 3 in the table above, became readily marketable during the fiscal year ended November 30, 2012.
Valuation Techniques and Unobservable Inputs
Unless otherwise determined by the Board of Directors, the Fund values its private investments in public equity (“PIPE”) investments that are convertible into or otherwise will become publicly tradeable (e.g., through subsequent registration or expiration of a restriction on trading) based on the market value of the publicly-traded security less a discount. The discount is initially equal to the discount negotiated at the time the Fund agrees to a purchase price. To the extent that such securities are convertible or otherwise become publicly traded within a time frame that may be reasonably determined, this discount will be amortized on a straight line basis over such estimated time frame.
One of the Fund’s investments is Class B units of Capital Product Partners L.P. (“CPLP”). The Class B units are convertible preferred units (convertible on a one-for-one basis into common units) and are senior to
31
KAYNE ANDERSON ENERGY TOTAL RETURN FUND, INC.
NOTES TO FINANCIAL STATEMENTS
(amounts in 000’s, except number of option contracts, share and per share amounts)
CPLP’s common units in terms of liquidation preference and priority of distributions. The Fund’s Board of Directors has determined that it is appropriate to value the Class B units using a convertible pricing model, which takes into account the unit’s preference relative to the common units as well as its conversion features. This model takes into account the attributes of the Class B units (preferred dividend, conversion ratio and call features) to determine the estimated value of such units. In using this model, the Fund estimates (i) the credit spread for CPLP’s preferred units, which is based on credit spreads for companies in a similar line of business as CPLP and (ii) the expected volatility for CPLP’s common units, which is based on CPLP’s historical volatility as well as historical volatility for publicly traded companies in a similar line of business as CPLP. The Fund applies a discount to the value derived from the convertible pricing model to account for an expected discount in market prices for convertible securities relative to the values calculated using pricing models.
Due to the inherent uncertainty of determining the fair value of investments that do not have a readily available market value, the fair value of the Fund’s investments may fluctuate from period to period. Additionally, the fair value of the Fund’s investments may differ from the values that would have been used had a ready market existed for such investments and may differ materially from the values that the Fund may ultimately realize.
The following table summarizes the significant unobservable inputs that the Fund uses to value its portfolio investments categorized as Level 3 as of November 30, 2012:
Quantitative Table for Valuation Techniques
| | | | | | | | | | | | | | | | | | | | | | |
| | | | | | | | | | Range | | | Weighted | |
Assets at Fair Value | | Fair Value | | | Valuation Technique | | Unobservable Inputs | | Low | | | | | High | | | Average(1) | |
Equity securities of | | $ | 9,789 | | | - Discount to publicly traded | | - Current discount | | | 5.4% | | | | | | 5.4% | | | | 5.4% | |
public companies | | | | | | securities | | | | | | | | | | | | | | | | |
(PIPE) – valued based on a discount to market value | | | | | | | | - Remaining restricted period | | | 414 days | | | | | | 414 days | | | | 414 days | |
| | | | | | | | | | | | | | | | | | | | | | |
Equity securities of | | | 27,800 | | | - Convertible pricing model | | - Credit spread | | | 9.0% | | | | | | 10.0% | | | | 9.5% | |
public companies – not valued based on a discount to market value | | | | | | | | - Volatility | | | 35.0% | | | | | | 40.0% | | | | 37.5% | |
| | | | | | | | - Discount for marketability | | | 2.0% | | | | | | 2.0% | | | | 2.0% | |
| | | | | | | | | | | | | | | | | | | | | | |
Total | | $ | 37,589 | | | | | | | | | | | | | | | | | | | |
| | | | | | | | | | | | | | | | | | | | | | |
| (1) | Weighted average based on the fair value of investments in each category. |
Income and capital gain distributions made by RICs often differ from the aggregate GAAP basis net investment income/(loss) and any net realized gains/(losses). For the Fund, the principal reason for these differences is the return of capital treatment of dividends and distributions from MLPs, upstream income trusts and certain other of its investments. Net investment income and net realized gains for GAAP purposes may differ from taxable income for federal income tax purposes due to disallowed partnership losses from MLPs, wash sales and foreign currency transactions.
As of November 30, 2012, the principal temporary differences were disallowed partnership losses related to the Fund’s MLP investments. For purposes of characterizing the nature of the dividends/distributions to investors, the amounts in excess of the Fund’s earnings and profits for federal income tax purposes are treated as a return of capital. Earnings and profits differ from taxable income due principally to adjustments related to the Fund’s investments in MLPs.
32
KAYNE ANDERSON ENERGY TOTAL RETURN FUND, INC.
NOTES TO FINANCIAL STATEMENTS
(amounts in 000’s, except number of option contracts, share and per share amounts)
During the fiscal year ended November 30, 2012, the Fund reclassified $4,051 from accumulated net investment income to paid-in capital primarily due to distributions in excess of taxable net investment income. The Fund also reclassified $25,063 of accumulated realized gains to accumulated net investment income due to permanent differences between GAAP and tax treatment of certain net realized gains.
The tax basis of the components of distributable earnings can differ from the amounts reflected in the Statement of Assets and Liabilities due to temporary differences between the carrying amounts of assets and liabilities for financial reporting purposes and the amounts used for income tax purposes. The Fund did not have any distributable earnings on a tax basis as of November 30, 2012. The following table sets forth the components of accumulated income on a tax basis for the Fund.
| | | | |
| | | As of
November 30,
2012 | |
Undistributed ordinary income | | $ | — | |
Undistributed long-term capital gains | | | — | |
Capital loss carryforward | | | — | |
Unrealized appreciation of investments | | | 283,665 | |
| | | | |
Total accumulated income | | $ | 283,665 | |
| | | | |
For the fiscal year ended November 30, 2012, the tax character of the total $67,516 distributions paid to common stockholders was $24,799 of dividend income and $42,717 of return of capital. The tax character of the total $6,497 distributions paid to mandatory redeemable preferred stock was all dividend income.
For the fiscal year ended November 30, 2011, the tax character of the total $66,578 distributions paid to common stockholders and the tax character of the total $5,796 distributions paid to mandatory redeemable preferred stock were both long-term capital gains.
Under the Regulated Investment Company Modernization Act of 2010 (the “Act”), net capital losses recognized after December 31, 2010 may be carried forward indefinitely, and their character is retained as short-term and/or long-term losses. Prior to the enactment of the Act, pre-enactment net capital losses were carried forward for eight years and treated as short-term losses. As a transition rule, the Act requires that post-enactment net capital losses be used before pre-enactment net capital losses. As of November 30, 2012, the Fund had no capital loss carryforwards, and the Fund deferred, on a tax basis, late-year ordinary losses of $22,519.
At November 30, 2012, the cost basis of investments for federal income tax purposes was $1,043,264 and the net cash received on option contracts written was $2,109. At November 30, 2012, gross unrealized appreciation and depreciation of investments and options for federal income tax purposes were as follows:
| | | | |
Gross unrealized appreciation of investments (including options) | | $ | 362,174 | |
Gross unrealized depreciation of investments (including options) | | | (78,512 | ) |
| | | | |
Net unrealized appreciation of investments before foreign currency related translations | | | 283,662 | |
Unrealized appreciation on foreign currency related translations | | | 3 | |
| | | | |
Net unrealized appreciation of investments | | $ | 283,665 | |
| | | | |
5. Concentration of Risk
The Fund’s investment objective is to obtain a high level of total return with an emphasis on current income paid to its stockholders. Under normal circumstances, the Fund intends to invest at least 80% of total assets in securities of energy companies. The Fund invests in equity securities such as common stocks, preferred stocks,
33
KAYNE ANDERSON ENERGY TOTAL RETURN FUND, INC.
NOTES TO FINANCIAL STATEMENTS
(amounts in 000’s, except number of option contracts, share and per share amounts)
convertible securities, warrants, depository receipts, and equity interests in MLPs, MLP affiliates, marine transportation companies, upstream income trusts, midstream companies and other energy companies. Additionally, the Fund may invest up to 30% of its total assets in debt securities. It may directly invest up to 25% (or such higher amount as permitted by any applicable tax diversification rules) of its total assets in equity or debt securities of MLPs. The Fund may invest up to 50% of its total assets in unregistered or otherwise restricted securities of energy companies. The Fund will not invest more than 15% of its total assets in any single issuer. The Fund may, for defensive purposes, temporarily invest all or a significant portion of its assets in investment grade securities, short-term debt securities and cash or cash equivalents. To the extent the Fund uses this strategy, it may not achieve its investment objectives.
6. Agreements and Affiliations
A. Administration Agreement — The Fund has entered into an administration agreement with Ultimus Fund Solutions, LLC (“Ultimus”), which may be amended from time to time. Pursuant to the administration agreement, Ultimus will provide certain administrative services for the Fund. The administration agreement has automatic one-year renewals unless earlier terminated by either party as provided under the terms of the administration agreement.
B. Investment Management Agreement — The Fund has entered into an investment management agreement with KAFA under which KAFA, subject to the overall supervision of the Fund’s Board of Directors, manages the day-to-day operations of, and provides investment advisory services to, the Fund. For providing these services, KAFA receives a management fee from the Fund. On June 13, 2012, the Fund renewed its agreement with KAFA for a period of one year. The agreement will expire on October 2, 2013 and may be renewed annually thereafter upon the approval of the Fund’s Board of Directors (including a majority of the Fund’s directors who are not “interested persons” of the Fund, as such term is defined in the 1940 Act).
For the fiscal year ended November 30, 2012, the Fund paid management fees at an annual rate of 1.25% of average monthly total assets of the Fund.
For purposes of calculating the management fee, the “average total assets” for each monthly period are determined by averaging the total assets at the last business day of that month with the total assets at the last business day of the prior month. The total assets of the Fund shall be equal to its average monthly gross asset value (which includes assets attributable to or proceeds from the Fund’s use of preferred stock, commercial paper or notes or other borrowings), minus the sum of the Fund’s accrued and unpaid dividends and distributions on any outstanding common stock and accrued and unpaid dividends and distributions on any outstanding preferred stock and accrued liabilities (other than liabilities associated with borrowing or leverage by the Fund). Liabilities associated with borrowing or leverage include the principal amount of any borrowings, commercial paper or notes issued by the Fund, the liquidation preference of any outstanding preferred stock, and other liabilities from other forms of borrowing or leverage such as short positions and put or call options held or written by the Fund.
C. Portfolio Companies — From time to time, the Fund may “control” or may be an “affiliate” of one or more of its portfolio companies, as each of these terms is defined in the 1940 Act. In general, under the 1940 Act, the Fund would be presumed to “control” a portfolio company if the Fund and its affiliates owned 25% or more of its outstanding voting securities and would be an “affiliate” of a portfolio company if the Fund and its affiliates owned 5% or more of its outstanding voting securities. The 1940 Act contains prohibitions and restrictions relating to transactions between investment companies and their affiliates (including the Fund’s investment adviser), principal underwriters and affiliates of those affiliates or underwriters.
The Fund believes that there are several factors that determine whether or not a security should be considered a “voting security” in complex structures such as limited partnerships of the kind in which the Fund invests. The Fund also notes that the Securities and Exchange Commission (the “SEC”) staff has issued guidance on the circumstances
34
KAYNE ANDERSON ENERGY TOTAL RETURN FUND, INC.
NOTES TO FINANCIAL STATEMENTS
(amounts in 000’s, except number of option contracts, share and per share amounts)
under which it would consider a limited partnership interest to constitute a voting security. Under most partnership agreements, the management of the partnership is vested in the general partner, and the limited partners, individually or collectively, have no rights to manage or influence management of the partnership through such activities as participating in the selection of the managers or the board of the limited partnership or the general partner. As a result, the Fund believes that many of the limited partnership interests in which it invests should not be considered voting securities. However, it is possible that the SEC staff may consider the limited partner interests the Fund holds in certain limited partnerships to be voting securities. If such a determination were made, the Fund may be regarded as a person affiliated with and controlling the issuer(s) of those securities for purposes of Section 17 of the 1940 Act.
In making such a determination as to whether to treat any class of limited partnership interests the Fund holds as a voting security, the Fund considers, among other factors, whether or not the holders of such limited partnership interests have the right to elect the board of directors of the limited partnership or the general partner. If the holders of such limited partnership interests do not have the right to elect the board of directors, the Fund generally has not treated such security as a voting security. In other circumstances, based on the facts and circumstances of those partnership agreements, including the right to elect the directors of the general partner, the Fund has treated those securities as voting securities and, therefore, as affiliates. If the Fund does not consider the security to be a voting security, it will not consider such partnership to be an “affiliate” unless the Fund and its affiliates own more than 25% of the outstanding securities of such partnership.
There is no assurance that the SEC staff will not consider that other limited partnership securities that the Fund owns and does not treat as voting securities are, in fact, voting securities for the purposes of Section 17 of the 1940 Act. If such determination were made, the Fund will be required to abide by the restrictions on “control” or “affiliate” transactions as proscribed in the 1940 Act. The Fund or any portfolio company that it controls, and its affiliates, may from time to time engage in certain of such joint transactions, purchases, sales and loans in reliance upon and in compliance with the conditions of certain exemptive rules promulgated by the SEC. The Fund cannot make assurances, however, that it would be able to satisfy the conditions of these rules with respect to any particular eligible transaction, or even if the Fund were allowed to engage in such a transaction, that the terms would be more or as favorable to the Fund or any company that it controls as those that could be obtained in arm’s length transaction. As a result of these prohibitions, restrictions may be imposed on the size of positions that may be taken for the Fund or on the type of investments that it could make.
As of November 30, 2012, the Fund believes that Buckeye Partners, L.P., MarkWest Energy Partners, L.P. and PVR Partners, L.P. meet the criteria described above and are therefore considered affiliates of the Fund.
Plains All American Pipeline, L.P. — Robert V. Sinnott is Chief Executive Officer of Kayne Anderson Capital Advisors, L.P. (“KACALP”), the managing member of KAFA. Mr. Sinnott also serves as a director on the board of Plains All American GP LLC (“Plains GP”), the general partner of Plains All American Pipeline, L.P. (“PAA”). Members of senior management of KACALP and KAFA and various affiliated funds managed by KACALP own units of Plains GP. The Fund believes that it is an affiliate of PAA under the 1940 Act by virtue of (i) various affiliated Kayne Anderson funds’ ownership interests in the Plains GP and (ii) Mr. Sinnott’s participation on the board of Plains GP.
7. Restricted Securities
From time to time, certain of the Fund’s investments may be restricted as to resale. For instance, private investments that are not registered under the Securities Act of 1933, as amended, cannot be offered for public sale in a non-exempt transaction without first being registered. In other cases, certain of the Fund’s investments have restrictions such as lock-up agreements that preclude the Fund from offering these securities for public sale.
35
KAYNE ANDERSON ENERGY TOTAL RETURN FUND, INC.
NOTES TO FINANCIAL STATEMENTS
(amounts in 000’s, except number of option contracts, share and per share amounts)
At November 30, 2012, the Fund held the following restricted investments:
| | | | | | | | | | | | | | | | | | | | | | | | | | | | |
Investment | | Acquisition
Date | | Type of
Restriction | | Number of
Units,
Principal ($)
(in 000s) | | | Cost
Basis | | | Fair
Value | | | Fair Value
Per Unit | | | Percent
of Net
Assets | | | Percent
of Total
Assets | |
Level 3 Investments(1) | | | | | | | | | | | | | | | | | | | | | | | | | | | | |
Buckeye Partners, L.P. | | | | | | | | | | | | | | | | | | | | | | | | | | | | |
Class B Units | | (2) | | (3) | | | 206 | | | $ | 10,002 | | | $ | 9,789 | | | $ | 47.56 | | | | 1.1 | % | | | 0.7 | % |
Capital Product Partners L.P. | | | | | | | | | | | | | | | | | | | | | | | | | | | | |
Class B Units | | 5/21/12 | | (3) | | | 3,333 | | | | 30,018 | | | | 27,800 | | | | 8.34 | | | | 3.1 | | | | 2.1 | |
| | | | | | | | | | | | | | | | | | | | | | | | | | | | |
Total | | | $ | 40,020 | | | $ | 37,589 | | | | | | | | 4.2 | % | | | 2.8 | % |
| | | | | | | | | | | | | | | | | | | | | | | | | | | | |
Level 2 Investments(4) | | | | | | | | | | | | | | | | | | | | | | | | | | | | |
Senior Notes and Secured Term Loans | | | | | | | | | | | | | | | | | | | | | | | | | | | | |
Athabasca Oil Corporation | | (2) | | (3) | | | (5 | ) | | $ | 7,490 | | | $ | 7,567 | | | | n/a | | | | 0.8 | % | | | 0.6 | % |
Aurora Oil & Gas Limited | | (2) | | (3) | | $ | 5,660 | | | | 5,827 | | | | 6,000 | | | | n/a | | | | 0.7 | | | | 0.4 | |
Foresight Energy LLC | | (2) | | (6) | | | 21,000 | | | | 21,302 | | | | 21,945 | | | | n/a | | | | 2.4 | | | | 1.6 | |
Gulfport Energy Corporation | | (2) | | (3) | | | 5,000 | | | | 4,959 | | | | 4,975 | | | | n/a | | | | 0.6 | | | | 0.4 | |
Halcón Resources Corporation | | (2) | | (3) | | | 3,250 | | | | 3,225 | | | | 3,372 | | | | n/a | | | | 0.4 | | | | 0.3 | |
Halcón Resources Corporation | | (2) | | (3) | | | 14,500 | | | | 14,553 | | | | 15,443 | | | | n/a | | | | 1.7 | | | | 1.1 | |
Midstates Petroleum Company, Inc. | | (2) | | (3) | | | 3,700 | | | | 3,700 | | | | 3,904 | | | | n/a | | | | 0.4 | | | | 0.3 | |
PDC Energy, Inc. | | (2) | | (3) | | | 6,000 | | | | 6,000 | | | | 6,090 | | | | n/a | | | | 0.7 | | | | 0.5 | |
Resolute Energy Corporation | | (2) | | (3) | | | 9,775 | | | | 9,847 | | | | 10,044 | | | | n/a | | | | 1.1 | | | | 0.7 | |
Southern Pacific Resource Corp. | | (2) | | (3) | | | 13,915 | | | | 14,006 | | | | 14,123 | | | | n/a | | | | 1.5 | | | | 1.0 | |
| | | | | | | | | | | | | | | | | | | | | | | | | | | | |
Total | | | $ | 90,909 | | | $ | 93,463 | | | | | | | | 10.3 | % | | | 6.9 | % |
| | | | | | | | | | | | | | | | | | | | | | | | | | | | |
Total of all restricted securities | | | $ | 130,929 | | | $ | 131,052 | | | | | | | | 14.5 | % | | | 9.7 | % |
| | | | | | | | | | | | | | | | | | | | | | | | | | | | |
| (1) | Securities are valued using inputs reflecting the Fund’s own assumptions as more fully described in Note 2 — Significant Accounting Policies and Note 3 — Fair Value. |
| (2) | Security was acquired at various dates during the fiscal year ended November 30, 2012 and/or in prior fiscal years. |
| (3) | Unregistered or restricted security of a publicly traded company. |
| (4) | These securities have a fair market value determined by the mean of the bid and ask prices provided by an agent or a syndicate bank, principal market maker or an independent pricing service as more fully described in Note 2 — Significant Accounting Policies. These securities have limited trading volume and are not listed on a national exchange. |
| (5) | Principal amount is 7,500 Canadian dollars. |
| (6) | Unregistered security of a private company. |
8. Derivative Financial Instruments
As required by the Derivatives and Hedging Topic of the FASB Accounting Standards Codification, the following are the derivative instruments and hedging activities of the Fund. The total number of outstanding options at November 30, 2012 is indicative of the volume of this type of option activity during the period. See Note 2 — Significant Accounting Policies.
36
KAYNE ANDERSON ENERGY TOTAL RETURN FUND, INC.
NOTES TO FINANCIAL STATEMENTS
(amounts in 000’s, except number of option contracts, share and per share amounts)
Option Contracts — Transactions in option contracts for the fiscal year ended November 30, 2012 were as follows:
| | | | | | | | |
| | | Number of
Contracts | | | Premium | |
Call Options Written | | | | | | | | |
Options outstanding — November 30, 2011 | | | 4,050 | | | $ | 433 | |
Options written | | | 205,903 | | | | 19,469 | |
Options subsequently repurchased(1) | | | (123,681 | ) | | | (11,693 | ) |
Options exercised | | | (51,077 | ) | | | (5,088 | ) |
Options expired | | | (13,173 | ) | | | (1,012 | ) |
| | | | | | | | |
Options outstanding — November 30, 2012(2) | | | 22,022 | | | $ | 2,109 | |
| | | | | | | | |
| (1) | The price at which the Fund subsequently repurchased the options was $4,906, which resulted in net realized gains of $6,787. |
| (2) | The percentage of total investments subject to call options written was 6.6% at November 30, 2012. |
Interest Rate Swap Contracts — The Fund may enter into interest rate swap contracts to partially hedge itself from increasing interest expense on its leverage resulting from increasing short-term interest rates. A decline in future interest rates may result in a decline in the value of the swap contracts, which, everything else being held constant, would result in a decline in the net assets of the Fund. In addition, if the counterparty to the interest rate swap contracts defaults, the Fund would not be able to use the anticipated receipts under the swap contracts to offset the interest payments on the Fund’s leverage. At the time the interest rate swap contracts reach their scheduled termination, there is a risk that the Fund would not be able to obtain a replacement transaction or that the terms of the replacement transaction would not be as favorable as on the expiring transaction. In addition, if the Fund is required to terminate any swap contract early, then the Fund could be required to make a termination payment. As of November 30, 2012, the Fund did not have any interest rate swap contracts outstanding.
The following table sets forth the fair value of the Fund’s derivative instruments on the Statement of Assets and Liabilities:
| | | | | | |
Derivatives Not Accounted for as Hedging Instruments | | Statement of Assets and Liabilities Location | | Fair Value as of November 30, 2012 | |
Call options | | Call option contracts written | | $ | | (2,208) |
The following table sets forth the effect of the Fund’s derivative instruments on the Statement of Operations:
| | | | | | | | | | |
Derivatives Not Accounted for as Hedging Instruments | | Location of Gains/(Losses) on
Derivatives Recognized in Income | | For the Fiscal Year
Ended November 30, 2012 | |
| | | Net Realized Gains/(Losses) on Derivatives Recognized in Income | | | Net Change in Unrealized Gains/(Losses) on Derivatives Recognized in Income | |
Call options | | Options | | $ | 7,785 | | | $ | | 181 |
9. Investment Transactions
For the fiscal year ended November 30, 2012, the Fund purchased and sold securities in the amounts of $776,908 and $770,104 (excluding short-term investments and options), respectively.
37
KAYNE ANDERSON ENERGY TOTAL RETURN FUND, INC.
NOTES TO FINANCIAL STATEMENTS
(amounts in 000’s, except number of option contracts, share and per share amounts)
10. Credit Facility
At November 30, 2012, the Fund had a $100,000 unsecured revolving credit facility (the “Credit Facility”). The Credit Facility matures on June 11, 2013. The interest rate may vary between LIBOR plus 1.75% to LIBOR plus 3.00%, depending on the Fund’s asset coverage ratios. Outstanding loan balances accrue interest daily at a rate equal to one-month LIBOR plus 1.75%, based on current asset coverage ratios. The Fund pays a fee of 0.40% per annum on any unused amounts of the Credit Facility. See Financial Highlights for the Fund’s asset coverage ratios under the 1940 Act.
For the fiscal year ended November 30, 2012, the average amount outstanding under the Credit Facility was $13,705 with a weighted average interest rate of 2.51%. As of November 30, 2012, the Fund had $40,000 outstanding under the Credit Facility at an interest rate of 2.06%.
11. Senior Unsecured Notes
At November 30, 2012, the Fund had $273,000 aggregate principal amount of Senior Notes outstanding. The table below sets forth the key terms of each series of Senior Notes.
| | | | | | | | | | | | | | | | | | | | |
| Series | | Principal
Outstanding,
November 30,
2011 | | | Principal
Redeemed(1) | | | Principal
Outstanding,
November 30,
2012 | | | Estimated
Fair Value,
November 30,
2012 | | | Fixed/Floating
Interest Rate | | Maturity |
| B | | $ | 28,000 | | | $ | 28,000 | | | $ | — | | | $ | — | | | 5.90% | | 8/13/12 |
| C | | | 128,000 | | | | — | | | | 128,000 | | | | 133,700 | | | 6.06% | | 8/13/13 |
| D | | | 58,000 | | | | — | | | | 58,000 | | | | 61,100 | | | 4.15% | | 3/5/15 |
| E | | | 27,000 | | | | — | | | | 27,000 | | | | 26,800 | | | 3-month LIBOR + 155 bps | | 3/5/15 |
| F | | | 30,000 | | | | — | | | | 30,000 | | | | 29,500 | | | 3-month LIBOR + 145 bps | | 5/10/16 |
| G | | | 20,000 | | | | — | | | | 20,000 | | | | 21,100 | | | 3.71% | | 5/10/16 |
| H | | | 10,000 | | | | — | | | | 10,000 | | | | 10,900 | | | 4.38% | | 5/10/18 |
| | | | | | | | | | | | | | | | | | | | |
| | $ | 301,000 | | | $ | 28,000 | | | $ | 273,000 | | | $ | 283,100 | | | | | |
| | | | | | | | | | | | | | | | | | | | |
| (1) | The Fund redeemed $28,000 of Series B Senior Notes on August 13, 2012, funded by borrowings on its Credit Facility. |
Holders of the fixed rate Senior Notes are entitled to receive cash interest payments semi-annually (on August 13 and February 13) at the fixed rate. Holders of the floating rate Senior Notes are entitled to receive cash interest payments quarterly (on February 13, May 13, August 13 and November 13) at the floating rate. During the fiscal year ended November 30, 2012, the weighted average interest rate on the outstanding Senior Notes was 4.58%.
As of November 30, 2012, each series of Senior Notes were rated “AAA” by FitchRatings. In the event the credit rating on any series of Senior Notes falls below “A-”, the interest rate on such series will increase by 1% during the period of time such series is rated below “A-”. The Fund is required to maintain a current rating from one rating agency with respect to each series of Senior Notes. Before the third fiscal quarter of 2012, the Fund’s Series B, C, D and E Senior Notes were rated by Moody’s Investors Services, Inc. (“Moody’s”). On July 2, 2012, the Fund requested that Moody’s withdraw its ratings of the Fund’s Series B, C, D and E Senior Notes. On July 12, 2012, Moody’s downgraded the Fund’s Series B, C, D and E Senior Notes from “Aa1” to “A1” and on August 3, 2012, Moody’s withdrew its ratings.
The Senior Notes were issued in private placement offerings to institutional investors and are not listed on any exchange or automated quotation system. The Senior Notes contain various covenants related to other indebtedness, liens and limits on the Fund’s overall leverage. Under the 1940 Act and the terms of the Senior Notes, the Fund may not declare dividends or make other distributions on shares of common stock or purchases
38
KAYNE ANDERSON ENERGY TOTAL RETURN FUND, INC.
NOTES TO FINANCIAL STATEMENTS
(amounts in 000’s, except number of option contracts, share and per share amounts)
of such shares if, at any time of the declaration, distribution or purchase, asset coverage with respect to the outstanding Senior Notes would be less than 300%.
The Senior Notes are redeemable in certain circumstances at the option of the Fund. The Senior Notes are also subject to a mandatory redemption to the extent needed to satisfy certain requirements if the Fund fails to meet an asset coverage ratio required by law and is not able to cure the coverage deficiency by the applicable deadline, or fails to cure a deficiency as stated in the Fund’s rating agency guidelines in a timely manner.
The Senior Notes are unsecured obligations of the Fund and, upon liquidation, dissolution or winding up of the Fund, will rank: (1) senior to all of the Fund’s outstanding preferred shares; (2) senior to all of the Fund’s outstanding common shares; (3) on a parity with any unsecured creditors of the Fund and any unsecured senior securities representing indebtedness of the Fund; and (4) junior to any secured creditors of the Fund.
At November 30, 2012, the Fund was in compliance with all covenants under the agreements of the Senior Notes.
12. Preferred Stock
At November 30, 2012, the Fund had 4,800,000 shares of mandatory redeemable preferred stock outstanding with a total liquidation value of $120,000 ($25.00 per share).
The table below sets forth the key terms of each series of mandatory redeemable preferred stock.
| | | | | | | | | | | | | | | | | | |
| Series | | Shares
Outstanding,
November 30,
2012 | | | Liquidation
Value,
November 30,
2012 | | | Estimated
Fair Value,
November 30,
2012 | | | Rate | | Mandatory
Redemption
Date | |
| A | | | 3,600,000 | | | $ | 90,000 | | | $ | 96,300 | | | 5.48% | | | 3/04/17 | |
| B | | | 1,200,000 | | | | 30,000 | | | | 31,800 | | | 5.13% | | | 5/10/18 | |
| | | | | | | | | | | | | | | | | | |
| | | 4,800,000 | | | $ | 120,000 | | | $ | 128,100 | | | | | | | |
| | | | | | | | | | | | | | | | | | |
Holders of the mandatory redeemable preferred stock are entitled to receive cumulative cash dividend payments on the first business day following each quarterly period (February 28, May 31, August 31 and November 30).
The table below outlines the terms of the mandatory redeemable preferred stock. The dividend rate on the Fund’s mandatory redeemable preferred stock will increase if the credit rating is downgraded below “A” by FitchRatings. Further, the annual dividend rate for all series of mandatory redeemable preferred stock will increase by 4.0% if no ratings are maintained, and the annual dividend rate will increase by 5.0% if the Fund fails to make dividend or certain other payments. The Fund is required to maintain a current rating from one rating agency with respect to each series of mandatory redeemable preferred stock. Before the third fiscal quarter of 2012, the Fund’s Series A mandatory redeemable preferred stock was rated by Moody’s. On July 2, 2012, the Fund requested that Moody’s withdraw its ratings of the Fund’s Series A mandatory redeemable preferred stock. On July 12, 2012, Moody’s downgraded the Fund’s Series A mandatory redeemable preferred stock from “A1” to “A3” and on August 3, 2012, Moody’s withdrew its rating. During the period following the downgrade but prior to the withdrawal of the rating, the distribution rate paid on the Fund’s Series A mandatory redeemable preferred stock increased by 0.5% resulting in an incremental payment of $26 during the period.
39
KAYNE ANDERSON ENERGY TOTAL RETURN FUND, INC.
NOTES TO FINANCIAL STATEMENTS
(amounts in 000’s, except number of option contracts, share and per share amounts)
| | |
| | | Series A and B |
Rating as of November 30, 2012 (FitchRatings) | | “AA” |
Ratings Threshold | | “A” |
Method of Determination | | Lowest Credit Rating |
Increase in Annual Dividend Rate | | 0.5% to 4.0% |
The mandatory redeemable preferred stock ranks senior to all of the Fund’s outstanding common shares and on parity with any other preferred stock. The mandatory redeemable preferred stock is redeemable in certain circumstances at the option of the Fund and is also subject to a mandatory redemption if the Fund fails to meet a total leverage (debt and preferred stock) asset coverage ratio of 225% or fails to maintain its basic maintenance amount as stated in the Fund’s rating agency guidelines.
Under the terms of the mandatory redeemable preferred stock, the Fund may not declare dividends or make other distributions on shares of its common stock or make purchases of such shares if, at any time of the declaration, distribution or purchase, asset coverage with respect to total leverage would be less than 225%.
The holders of the mandatory redeemable preferred stock have one vote per share and will vote together with the holders of common stock as a single class except on matters affecting only the holders of mandatory redeemable preferred stock or the holders of common stock. The holders of the mandatory redeemable preferred stock, voting separately as a single class, have the right to elect at least two directors of the Fund.
At November 30, 2012, the Fund was in compliance with the asset coverage and basic maintenance requirements of its mandatory redeemable preferred stock.
13. Common Stock
At November 30, 2012, the Fund had 195,200,000 shares of common stock authorized and 35,467,035 shares outstanding. As of that date, KACALP owned 4,000 shares. Transactions in common shares for the fiscal year ended November 30, 2012 were as follows:
| | | | |
Shares outstanding at November 30, 2011 | | | 35,002,475 | |
Shares issued through reinvestment of distributions | | | 390,359 | |
Shares issued in connection with offerings of common stock(1) | | | 74,201 | |
| | | | |
Shares outstanding at November 30, 2012 | | | 35,467,035 | |
| | | | |
| (1) | On September 25, 2012, the Fund announced the commencement of an “at-the-market” offering of shares of common stock having an aggregate sales price of up to $50,000. As of November 30, 2012, the Fund had issued 74,201 shares of common stock through this program and received $1,894 in net proceeds from these issuances at an average offering price of $26.04 per share. The Fund pays the sales agent a total commission of up to 2% of the gross sales price per share for shares sold pursuant to the program. |
14. Subsequent Events
On December 11, 2012, the Fund declared its quarterly distribution of $0.48 per common share for the fiscal fourth quarter for a total quarterly distribution payment of $17,024. The distribution was paid on January 11, 2013 to common stockholders of record on December 28, 2012. Of this total, pursuant to the Fund’s dividend reinvestment plan, $2,193 was reinvested into the Fund through the issuance of 87,300 shares of common stock.
The Fund has performed an evaluation of subsequent events through the date the financial statements were issued and has determined that no additional items require recognition or disclosure.
40
KAYNE ANDERSON ENERGY TOTAL RETURN FUND, INC.
REPORT OF INDEPENDENT REGISTERED PUBLIC ACCOUNTING FIRM
To the Board of Directors and Stockholders of
Kayne Anderson Energy Total Return Fund, Inc.
In our opinion, the accompanying statement of assets and liabilities, including the schedule of investments, and the related statements of operations, of changes in net assets applicable to common stockholders and of cash flows and the financial highlights present fairly, in all material respects, the financial position of Kayne Anderson Energy Total Return Fund (the “Fund”) at November 30, 2012, and the results of its operations and cash flows for the year then ended, the changes in its net assets applicable to common stockholders for each of the two years in the period then ended and the financial highlights for each of the periods presented, in conformity with accounting principles generally accepted in the United States of America. These financial statements and financial highlights (hereafter referred to as “financial statements”) are the responsibility of the Fund’s management. Our responsibility is to express an opinion on these financial statements based on our audits. We conducted our audits of these financial statements in accordance with the standards of the Public Company Accounting Oversight Board (United States). Those standards require that we plan and perform the audits to obtain reasonable assurance about whether the financial statements are free of material misstatement. An audit includes examining, on a test basis, evidence supporting the amounts and disclosures in the financial statements, assessing the accounting principles used and significant estimates made by management, and evaluating the overall financial statement presentation. We believe that our audits, which included confirmation of securities at November 30, 2012 by correspondence with the custodian and brokers, provide a reasonable basis for our opinion.
PricewaterhouseCoopers LLP
Los Angeles, California
January 29, 2013
41
KAYNE ANDERSON ENERGY TOTAL RETURN FUND, INC.
PRIVACY POLICY NOTICE
(UNAUDITED)
Rev. 01/2011
| | |
FACTS | | WHAT DOES KAYNE ANDERSON ENERGY TOTAL RETURN FUND, INC. (“KYE”) DO WITH YOUR PERSONAL INFORMATION? |
| | |
Why? | | Financial companies choose how they share your personal information. Federal law gives consumers the right to limit some but not all sharing. Federal law also requires us to tell you how we collect, share, and protect your personal information. Please read this notice carefully to understand what we do. |
| | |
What? | | The types of personal information we collect and share depend on the product or service you have with us. This information can include: n Social Security number and account balances n Payment history and transaction history n Account transactions and wire transfer instructions When you are no longer our customer, we continue to share your information as described in this notice. |
| | |
How? | | All financial companies need to share customers’ personal information to run their everyday business. In the section below, we list the reasons financial companies can share their customers’ personal information; the reasons KYE chooses to share; and whether you can limit this sharing. |
| | | | |
| Reasons we can share your personal information | | Does KYE share? | | Can you limit this sharing? |
For our everyday business purposes —
such as to process your transactions, maintain your account(s), respond to court orders and legal investigations, or report to credit bureaus | | Yes | | No |
For our marketing purposes —
to offer our products and services to you | | No | | No |
| For joint marketing with other financial companies | | No | | We don’t share |
For our affiliates’ everyday business purposes —
information about your transactions and experiences | | No | | We don’t share |
For our affiliates’ everyday business purposes —
information about your creditworthiness | | No | | We don’t share |
| For nonaffiliates to market to you | | No | | We don’t share |
| | |
Questions? | | Call 877-657-3863 or go to http://www.kaynefunds.com |
42
KAYNE ANDERSON ENERGY TOTAL RETURN FUND, INC.
PRIVACY POLICY NOTICE
(UNAUDITED)
| | |
| Who we are |
| Who is providing this notice? | | KYE |
| | |
| What we do |
How does KYE
protect my personal information? | | To protect your personal information from unauthorized access and use, we use security measures that comply with federal law. These measures include computer safeguards and secured files and buildings. Access to your personal information is on a need-to-know basis. KYE has adopted internal policies to protect your non-public personal information. |
How does KYE
collect my personal information? | | We collect your personal information, for example, when you n Open an account or provide account information n Buy securities from us or make a wire transfer n Give us your contact information We also collect your personal information from other companies. |
| Why can’t I limit all sharing? | | Federal law gives you the right to limit only n sharing for affiliates’ everyday business purposes — information about your creditworthiness n affiliates from using your information to market to you n sharing for nonaffiliates to market to you State laws and individual companies may give you additional rights to limit sharing. |
| | |
| Definitions |
| Affiliates | | Companies related by common ownership or control. They can be financial and nonfinancial companies. n KYE does not share with our affiliates. |
| Nonaffiliates | | Companies not related by common ownership or control. They can be financial and nonfinancial companies. n KYE does not share with nonaffiliates so they can market to you. |
| Joint marketing | | A formal agreement between nonaffiliated financial companies that together market financial products or services to you. n KYE does not jointly market. |
| | |
| Other important information |
| None. |
43
KAYNE ANDERSON ENERGY TOTAL RETURN FUND, INC.
DIVIDEND REINVESTMENT PLAN
(UNAUDITED)
Kayne Anderson Energy Total Return Fund, Inc., a Maryland corporation (the “Fund”), has adopted the following plan (the “Plan”) with respect to distributions declared by its Board of Directors (the “Board”) on shares of its Common Stock:
1. Unless a stockholder specifically elects to receive cash as set forth below, all distributions hereafter declared by the Board shall be payable in shares of the Common Stock of the Fund, and no action shall be required on such stockholder’s part to receive a distribution in stock.
2. Such distributions shall be payable on such date or dates as may be fixed from time to time by the Board to stockholders of record at the close of business on the record date(s) established by the Board for the distribution involved.
3. The Fund may use newly-issued shares of its Common Stock or purchase shares in the open market in connection with the implementation of the plan. The number of shares to be issued to a stockholder shall be based on share price equal to 95% of the closing price of the Fund’s Common Stock one day prior to the dividend payment date.
4. The Board may, in its sole discretion, instruct the Fund to purchase shares of its Common Stock in the open market in connection with the implementation of the Plan as follows: If the Fund’s Common Stock is trading below net asset value at the time of valuation, upon notice from the Fund, the Plan Administrator (as defined below) will receive the dividend or distribution in cash and will purchase Common Stock in the open market, on the New York Stock Exchange or elsewhere, for the Participants’ accounts, except that the Plan Administrator will endeavor to terminate purchases in the open market and cause the Fund to issue the remaining shares if, following the commencement of the purchases, the market value of the shares, including brokerage commissions, exceeds the net asset value at the time of valuation. These remaining shares will be issued by the Fund at a price equal to the greater of (i) the net asset value at the time of valuation or (ii) 95% of the then current market price.
5. In a case where the Plan Administrator has terminated open market purchases and caused the issuance of remaining shares by the Fund, the number of shares received by the participant in respect of the cash dividend or distribution will be based on the weighted average of prices paid for shares purchased in the open market, including brokerage commissions, and the price at which the Fund issues remaining shares. To the extent that the Plan Administrator is unable to terminate purchases in the open market before the Plan Administrator has completed its purchases, or remaining shares cannot be issued by the Fund because the Fund declared a dividend or distribution payable only in cash, and the market price exceeds the net asset value of the shares, the average share purchase price paid by the Plan Administrator may exceed the net asset value of the shares, resulting in the acquisition of fewer shares than if the dividend or distribution had been paid in shares issued by the Fund.
6. A stockholder may, however, elect to receive his or its distributions in cash. To exercise this option, such stockholder shall notify American Stock Transfer & Trust Company, the plan administrator and the Fund’s transfer agent and registrar (collectively the “Plan Administrator”), in writing so that such notice is received by the Plan Administrator no later than the record date fixed by the Board for the distribution involved.
7. The Plan Administrator will set up an account for shares acquired pursuant to the Plan for each stockholder who has not so elected to receive dividends and distributions in cash (each, a “Participant”). The Plan Administrator may hold each Participant’s shares, together with the shares of other Participants, in non-certificated form in the Plan Administrator’s name or that of its nominee. Upon request by a Participant, received no later than three (3) days prior to the payable date, the Plan Administrator will, instead of crediting shares to and/or carrying shares in a Participant’s account, issue, without charge to the Participant, a certificate registered in the Participant’s name for the number of whole shares payable to the Participant
44
KAYNE ANDERSON ENERGY TOTAL RETURN FUND, INC.
DIVIDEND REINVESTMENT PLAN
(UNAUDITED)
and a check for any fractional share less a broker commission on the sale of such fractional shares. If a request to terminate a Participant’s participation in the Plan is received less than three (3) days before the payable date, dividends and distributions for that payable date will be reinvested. However, subsequent dividends and distributions will be paid to the Participant in cash.
8. The Plan Administrator will confirm to each Participant each acquisition made pursuant to the Plan as soon as practicable but not later than ten (10) business days after the date thereof. Although each Participant may from time to time have an undivided fractional interest (computed to three decimal places) in a share of Common Stock of the Fund, no certificates for a fractional share will be issued. However, dividends and distributions on fractional shares will be credited to each Participant’s account. In the event of termination of a Participant’s account under the Plan, the Plan Administrator will adjust for any such undivided fractional interest in cash at the market value of the Fund’s shares at the time of termination.
9. The Plan Administrator will forward to each Participant any Fund related proxy solicitation materials and each Corporation report or other communication to stockholders, and will vote any shares held by it under the Plan in accordance with the instructions set forth on proxies returned by Participants to the Fund.
10. In the event that the Fund makes available to its stockholders rights to purchase additional shares or other securities, the shares held by the Plan Administrator for each Participant under the Plan will be added to any other shares held by the Participant in certificated form in calculating the number of rights to be issued to the Participant.
11. The Plan Administrator’s service fee, if any, and expenses for administering the Plan will be paid for by the Fund.
12. Each Participant may terminate his or its account under the Plan by so notifying the Plan Administrator via the Plan Administrator’s website at www.amstock.com, by filling out the transaction request form located at the bottom of the Participant’s Statement and sending it to American Stock Transfer and Trust Company, P.O. Box 922, Wall Street Station, New York, NY 10269-0560 or by calling the Plan Administrator at (866) 669-9899. Such termination will be effective immediately. The Plan may be terminated by the Fund upon notice in writing mailed to each Participant at least 30 days prior to any record date for the payment of any dividend or distribution by the Fund. Upon any termination, the Plan Administrator will cause a certificate or certificates to be issued for the full shares held for the Participant under the Plan and a cash adjustment for any fractional share to be delivered to the Participant without charge to the Participant. If a Participant elects by his or its written notice to the Plan Administrator in advance of termination to have the Plan Administrator sell part or all of his or its shares and remit the proceeds to the Participant, the Plan Administrator is authorized to deduct a $15.00 transaction fee plus a $0.10 per share brokerage commission from the proceeds.
13. These terms and conditions may be amended or supplemented by the Fund at any time but, except when necessary or appropriate to comply with applicable law or the rules or policies of the Securities and Exchange Commission or any other regulatory authority, only by mailing to each Participant appropriate written notice at least 30 days prior to the effective date thereof. The amendment or supplement shall be deemed to be accepted by each Participant unless, prior to the effective date thereof, the Plan Administrator receives written notice of the termination of his or its account under the Plan. Any such amendment may include an appointment by the Plan Administrator in its place and stead of a successor agent under these terms and conditions, with full power and authority to perform all or any of the acts to be performed by the Plan Administrator under these terms and conditions. Upon any such appointment of any agent for the purpose of receiving dividends and distributions, the Fund will be authorized to pay to such successor agent, for each Participant’s account, all dividends and distributions payable on shares of the Fund held in the
45
KAYNE ANDERSON ENERGY TOTAL RETURN FUND, INC.
DIVIDEND REINVESTMENT PLAN
(UNAUDITED)
Participant’s name or under the Plan for retention or application by such successor agent as provided in these terms and conditions.
14. The Plan Administrator will at all times act in good faith and use its best efforts within reasonable limits to ensure its full and timely performance of all services to be performed by it under this Plan and to comply with applicable law, but assumes no responsibility and shall not be liable for loss or damage due to errors unless such error is caused by the Plan Administrator’s negligence, bad faith, or willful misconduct or that of its employees or agents.
15. These terms and conditions shall be governed by the laws of the State of Maryland.
Adopted: June 15, 2005
Amended: December 13, 2005
Amended: March 12, 2009
46
KAYNE ANDERSON ENERGY TOTAL RETURN FUND, INC.
INVESTMENT MANAGEMENT AGREEMENT APPROVAL DISCLOSURE
(UNAUDITED)
The Fund’s Board of Directors on June 13, 2012 approved the continuation of the Fund’s Investment Management Agreement (the “Agreement”) with KA Fund Advisors, LLC (the “Adviser”) for an additional one-year term through October 2, 2013.
During the course of each year and in connection with its consideration of the Agreement, the Board of Directors received various written materials from the Adviser, including (i) information on the advisory personnel of the Adviser; (ii) information on the internal compliance procedures of the Adviser; (iii) comparative information showing how the Fund’s proposed fee schedule compares to other registered investment companies that follow investment strategies similar to those of the Fund; (iv) information regarding brokerage and portfolio transactions; (v) comparative information showing how the Fund’s performance compares to other registered investment companies that follow investment strategies similar to those of the Fund; and (vi) information on any legal proceedings or regulatory audits or investigations affecting the Adviser.
After receiving and reviewing these materials, the Board of Directors, at an in-person meeting called for such purpose, discussed the terms of the Agreement. Representatives from the Adviser attended the meeting and presented additional oral and written information to the Board of Directors to assist in its considerations. The Directors who are not parties to the Agreement or “interested persons” (as defined in the 1940 Act) of any such party (the “Independent Directors”) also met in executive session to further discuss the terms of the Agreement and the information provided by the Adviser.
The Independent Directors reviewed various factors, detailed information provided by the Adviser at the meeting and at other times throughout the year, and other relevant information and factors including the following, no single factor of which was dispositive in their decision whether to approve the Agreement:
The nature, extent, and quality of the services to be provided by the Adviser
The Independent Directors considered the scope and quality of services that have been provided by the Adviser under the Agreement. The Independent Directors considered the quality of the investment research capabilities of the Adviser and the other resources the Adviser has dedicated to performing services for the Fund, including the high caliber of portfolio managers and research analysts involved, the large and experienced team of investment, accounting, legal, trading and compliance professionals at the Adviser dedicated to the Fund, and the continued addition of professionals at the Adviser to broaden its coverage efforts. The quality of other services, including the Adviser’s assistance in the coordination of the activities of some of the Fund’s other service providers, the provision of certain administrative, compliance, reporting and financial services by the Adviser, the call strategy used and the responsible handling of the leverage target, also was considered. The Independent Directors took note of the Adviser’s excellent track record in identifying and executing on key investment themes and in sourcing and negotiating private investments for the Fund as well as the Fund’s best-in-class access to investments and capital markets due in part to the Adviser’s credibility with institutional investors. The Independent Directors also considered the nature and quality of the services provided by the Adviser to the Fund in light of their experience as Directors of the Fund and another investment company managed by the Adviser, their confidence in the Adviser’s integrity and competence gained from that experience and the Adviser’s responsiveness to questions, concerns or requests for information raised or made by them in the past. The Independent Directors noted the high quality of services provided by the Adviser when the market faced significant turmoil and continued to experience various challenges as well as the Adviser’s efforts to maximize returns and its leadership position in the markets in which it invests. The Independent Directors concluded that the Adviser has the quality and depth of personnel and investment methods essential to performing its duties under the Agreement and that the nature and the proposed cost of such advisory services are fair and reasonable in light of the services provided.
47
KAYNE ANDERSON ENERGY TOTAL RETURN FUND, INC.
INVESTMENT MANAGEMENT AGREEMENT APPROVAL DISCLOSURE
(UNAUDITED)
The Fund’s performance under the management of the Adviser
The Independent Directors reviewed information pertaining to the performance of the Fund. This data compared the Fund’s performance to the performance of certain other registered investment companies that follow investment strategies similar to those of the Fund as well as specialized and more general market indexes. The comparative information showed that the performance of the Fund compares favorably to other similar closed-end funds and that the Fund has been a top performer over the last three years. Based upon their review, the Independent Directors concluded that the Fund’s investment performance over time has been consistently above average compared to other closed-end funds that focus on investments in energy companies and that the Fund has generated strong returns for investors. The Independent Directors noted that in addition to the information received for this meeting, the Independent Directors also receive detailed performance information for the Fund at each regular Board of Directors meeting during the year. The Independent Directors considered the investment performance of another investment company managed by the Adviser but did not consider the performance of other accounts of the Adviser as there were no accounts similar enough to be relevant for performance purposes. The Independent Directors then noted that they were supportive of the Adviser’s efforts to increase distributions to stockholders in the future.
The reasonability of the management fee and fall-out benefits
The Independent Directors considered the Fund’s management fee under the Agreement in comparison to the management fees of funds within the Fund’s peer group and believed such comparisons to be acceptable to the Fund. The Independent Directors reviewed the management fees charged by the Adviser to separately managed accounts, which had limited value given the differences in strategy between, and the substantial differences in services provided to, the Fund and such separately managed accounts. The Adviser’s successful handling of the past market downturn and related leverage challenges, the Fund’s participation in private investments, and the Adviser’s successful pricing and timing strategies related to the capital raising for the Fund were also noted by the Independent Directors as relevant considerations in evaluating the reasonableness of the management fee. Based on those comparisons, the Independent Directors concluded that the management fee remains reasonable.
The Independent Directors also considered certain benefits the Adviser realizes due to its relationship with the Fund. In particular, they noted that the Adviser has soft dollar arrangements under which certain brokers may provide industry research to the Adviser’s portfolio managers through the use of a portion of the brokerage commissions generated from the Adviser’s trading activities on behalf of the Fund. The Independent Directors acknowledged that the Fund’s stockholders also benefit from these soft dollar arrangements because the Adviser is able to receive this research, which is used in the management of the Fund’s portfolio, by aggregating securities trades.
The extent to which economies of scale would be realized as the Fund grows and whether fee levels reflect these economies of scale for the benefit of stockholders
The Independent Directors considered economies of scale that are being enjoyed by stockholders of the Fund. In this regard, they noted the extent to which operating expenses declined and noted that the Adviser added professionals to its already robust and high-quality investment team, both of which represented a sharing of those economies of scale. The Independent Directors also considered further possible economies of scale that the Adviser could achieve in its management of the Fund. They considered the anticipated asset levels of the Fund, the information provided by the Adviser relating to its estimated costs, and information comparing the fee rate to be charged by the Adviser with fee rates charged by other unaffiliated investment advisers to their investment company clients. The Independent Directors also considered the Adviser’s commitment to retaining its current professional staff in a competitive environment for investment professionals. The Independent Directors
48
KAYNE ANDERSON ENERGY TOTAL RETURN FUND, INC.
INVESTMENT MANAGEMENT AGREEMENT APPROVAL DISCLOSURE
(UNAUDITED)
concluded that the fee structure was reasonable in view of the information provided by the Adviser. The Independent Directors also noted that the fee structure currently does not provide for a sharing of any economies of scale that might be experienced from substantial future growth of the Fund.
Based on the review of the Board of Directors of the Fund, including their consideration of each of the factors discussed above and the materials requested from and provided by the Adviser, the Board concluded, in agreement with the recommendation of the Independent Directors, that the Fund and its stockholders received reasonable value in return for the advisory fees and other amounts paid to the Adviser by the Fund under the Agreement, that stockholders could expect to receive reasonable value in return for the advisory fees and other amounts proposed to be paid to the Adviser by the Fund under the Agreement and that the approval of the continuation of the Agreement was in the best interests of stockholders of the Fund.
49
KAYNE ANDERSON ENERGY TOTAL RETURN FUND, INC.
INFORMATION CONCERNING DIRECTORS AND CORPORATE OFFICERS
(UNAUDITED)
| | | | | | |
Independent Directors(1) |
| | | |
Name (Year Born) | | Position(s) Held with Fund, Term of Office/ Time of Service | | Principal Occupations During Past Five Years | | Other Directorships Held by
Director/Officer During Past Five Years |
| | | |
Anne K. Costin
(born 1950) | | Director. 3-year term (until the 2013 Annual Meeting of Stockholders)/ served since inception | | Professor at the Amsterdam Institute of Finance since 2007. Adjunct Professor in the Finance and Economics Department of Columbia University Graduate School of Business in New York from 2004 through 2007. As of March 1, 2005, Ms. Costin retired after a 28-year career at Citigroup. During the five years prior to her retirement, Ms. Costin was Managing Director and Global Deputy Head of the Project & Structured Trade Finance product group within Citigroup’s Investment Banking Division. | | Current: •Kayne Anderson MLP Investment Company (“KYN”) |
| | | |
Steven C. Good
(born 1942) | | Director. 3-year term (until the 2015 Annual Meeting of Stockholders)/ served since inception | | Independent consultant since February 2010, when he retired from CohnReznick LLP, where he had been an active partner since 1976. CohnReznick LLP offers accounting, tax and business advisory services to middle market private and publicly-traded companies, their owners and their management. Founded Block, Good and Gagerman in 1976, which later evolved in stages into CohnReznick LLP. | | Current: •KYN •OSI Systems, Inc.
(specialized electronic products) Prior: •California Pizza Kitchen, Inc.
(restaurant chain) •Arden Realty, Inc.
(real estate investment trust) |
| | | |
Gerald I. Isenberg
(born 1940) | | Director. 3-year term (until the 2014 Annual Meeting of Stockholders)/ served since inception | | Professor Emeritus at the University of Southern California School of Cinema-Television since 2007. Chief Financial Officer of Teeccino Caffe Inc., a privately owned beverage manufacturer and distributor. | | Current: •KYN •Teeccino Caffe Inc.
(beverage manufacturer and distributor) •Caucus for Television Producers, Writers & Directors Foundation
(not-for-profit organization) Prior: •Kayne Anderson Rudnick Mutual Funds(2) from 1998 to 2002 |
| | | |
William H. Shea, Jr.
(born 1954) | | Director. 3-year term (until the 2013 Annual Meeting of Stockholders)/served since 2008 | | Chief Executive Officer of the general partner of PVR Partners, L.P. (PVR) since March 2010. Chief Executive Officer and President of the general partner of Penn Virginia GP Holdings, L.P. (PVG) from March 2010 to March 2011. Private investor from June 2007 to March 2010. From September 2000 to June 2007, President, Chief Executive Officer and Director (Chairman from May 2004 to June 2007) of Buckeye Partners L.P. (BPL). From May 2004 to June 2007, President, Chief Executive Officer and Chairman of Buckeye GP Holdings L.P. (BGH) and its predecessors. | | Current: •KYN •PVR
(coal and midstream MLP) •Niska Gas Storage Partners LLC
(natural gas storage MLP) •USA Compression Partners, LP (other MLP) Prior: •BGH
(general partner of BPL) •BPL
(pipeline MLP) •Gibson Energy ULC
(midstream energy) •PVG
(owned general partner of PVR) •Penn Virginia Corporation
(oil and gas exploration, development and production company) |
50
KAYNE ANDERSON ENERGY TOTAL RETURN FUND, INC.
INFORMATION CONCERNING DIRECTORS AND CORPORATE OFFICERS
(UNAUDITED)
| | | | | | |
Interested Director and Non-Director Officers |
| | | |
Name (Year Born) | | Position(s) Held with Fund, Term of Office/ Time of Service | | Principal Occupations During Past Five Years | | Other Directorships Held by Director/Officer During Past Five Years |
| | | |
Kevin S. McCarthy(3)
(born 1959) | | Chairman of the Board of Directors, President and Chief Executive Officer. 3-year term as a director (until the 2015 Annual Meeting of Stockholders), elected annually as an officer/served since inception | | Senior Managing Director of KACALP since June 2004 and of KAFA since 2006. President and Chief Executive Officer of KYN; Kayne Anderson Energy Development Company (“KED”) and Kayne Anderson Midstream/Energy Fund, Inc. (“KMF’) since inception. (KYN inception in 2004; KED inception in 2006 and KMF inception in 2010). Global Head of Energy at UBS Securities LLC from November 2000 to May 2004. | | Current: •KYN •KED •KMF •Range Resources Corporation
(oil and natural gas company) •Direct Fuels Partners, L.P.
(transmix refining and fuels distribution) •ProPetro Services, Inc.
(oilfield services) Prior: •Clearwater Natural Resources, L.P.
(coal mining MLP) •International Resource Partners LP
(coal mining) •K-Sea Transportation Partners LP
(shipping MLP) |
| | | |
James C. Baker
(born 1972) | | Executive Vice President. Elected annually/served as Vice President from June 2005 to June 2008; served as Executive Vice President since June 2008 | | Senior Managing Director of KACALP and KAFA since February 2008, Managing Director of KACALP and KAFA since December 2004 and 2006, respectively. Vice President of KYN from 2005 to 2008 and of KED from 2006 to 2008. Executive Vice President of KYN and KED since June 2008 and of KMF since August 2010. | | Current: •ProPetro Services, Inc.
(oilfield services) Prior: •K-Sea Transportation Partners LP
(shipping MLP) •Petris Technology, Inc.
(data management for energy companies) |
| | | |
J.C. Frey
(born 1968) | | Executive Vice President, Assistant Treasurer and Assistant Secretary. Elected annually/served as Assistant Treasurer and Assistant Secretary since inception; served as Executive Vice President since June 2008 | | Senior Managing Director of KACALP since 2004 and of KAFA since 2006, and Managing Director of KACALP since 2000. Portfolio Manager of KACALP since 2000, Portfolio Manager, Vice President, Assistant Secretary and Assistant Treasurer of KYN since 2004 and of KED since 2006. Executive Vice President of KYN and KED since June 2008, and of KMF since August 2010. | | None |
| | | |
Terry A. Hart
(born 1969) | | Chief Financial Officer and Treasurer. Elected annually/served since 2005 | | Chief Financial Officer and Treasurer of KYN since December 2005; of KED since September 2006 and of KMF since August 2010. Director of Structured Finance, Assistant Treasurer, Senior Vice President and Controller of Dynegy, Inc. from 2000 to 2005. | | Current: •The Source for Women
(not-for-profit organization) |
| | | |
Ron M. Logan, Jr.
(born 1960) | | Senior Vice President. Elected annually/served since 2012 | | Managing Director of KACALP and KAFA since 2006. Independent consultant to several leading energy firms. Senior Vice President of Ferrellgas Inc. from 2003 to 2005. Vice President of Dynegy Midstream Services from 1997 to 2002. | | Current: •VantaCore Partners, LP
(aggregates MLP) |
| | | |
Jody C. Meraz
(born 1978) | | Vice President. Elected annually/served since 2011 | | Senior Vice President of KACALP and KAFA since 2011. Vice President of KACALP from 2007 to 2011. Associate of KACALP and KAFA since 2005 and 2006. Vice President of KYN, KED and KMF since 2011. | | None |
51
KAYNE ANDERSON ENERGY TOTAL RETURN FUND, INC.
INFORMATION CONCERNING DIRECTORS AND CORPORATE OFFICERS
(UNAUDITED)
| | | | | | |
Interested Director and Non-Director Officers |
| | | |
Name (Year Born) | | Position(s) Held with Fund, Term of Office/ Time of Service | | Principal Occupations During Past Five Years | | Other Directorships Held by Director/Officer During Past Five Years |
| | | |
David J. Shladovsky
(born 1960) | | Secretary and Chief Compliance Officer. Elected annually/served since inception | | Managing Director and General Counsel of KACALP since 1997 and of KAFA since 2006. Secretary and Chief Compliance Officer of KYN since 2004; of KED since 2006 and of KMF since August 2010. | | None |
| (1) | The 1940 Act requires the term “Fund Complex” to be defined to include registered investment companies advised by our Adviser, and the Fund Complex includes KYN, KYE, KED and KMF. Each Independent Director oversees two registered investment companies in the Fund Complex, as noted above. |
| (2) | The investment adviser to the Kayne Anderson Rudnick Mutual Funds, Kayne Anderson Rudnick Investment Management, LLC, formerly was an affiliate of KACALP. |
| (3) | Mr. McCarthy is an “interested person” of the Fund by virtue of his employment relationship with KAFA, our investment adviser. |
Additional information regarding the Fund’s directors is contained in the Fund’s Statement of Additional Information, the most recent version of which can be found on the Fund’s website at http://www.kaynefunds.com or is available without charge, upon request, by calling (877) 657-3863.
52
KAYNE ANDERSON ENERGY TOTAL RETURN FUND, INC.
ANNUAL CERTIFICATION
(UNAUDITED)
The Fund’s Chief Executive Officer has filed an annual certification with the NYSE that, as of the date of the certification, he was unaware of any violation by the Fund of the NYSE’s corporate governance listing standards.
PROXY VOTING AND PORTFOLIO HOLDINGS INFORMATION
(UNAUDITED)
The policies and procedures that the Fund uses to determine how to vote proxies relating to its portfolio securities are available:
| | • | | without charge, upon request, by calling (877) 657-3863; |
| | • | | on the Fund’s website, http://www.kaynefunds.com; and |
| | • | | on the website of the Securities and Exchange Commission, http://www.sec.gov. |
Information regarding how the Fund voted proxies relating to portfolio securities during the most recent period ended June 30 is available without charge, upon request, by calling (877) 657-3863, and on the SEC’s website at http://www.sec.gov (see Form N-PX).
The Fund files a complete schedule of its portfolio holdings for the first and third quarters of its fiscal year with the SEC on Form N-Q. The Fund’s Forms N-Q are available on the SEC’s website at http://www.sec.gov and may be reviewed and copied at the SEC’s Public Reference Room in Washington, DC. Information on the operation of the SEC’s Public Reference Room may be obtained by calling 1-800-SEC-0330. The Fund also makes its Forms N-Q available on its website at http://www.kaynefunds.com.
53
KAYNE ANDERSON ENERGY TOTAL RETURN FUND, INC.
INFORMATION REGARDING CHANGES TO INVESTMENT POLICY
(UNAUDITED)
On March 21, 2012, the Fund’s Board of Directors approved a change to its non-fundamental investment policy related to debt securities. The prior policy allowed 5% of the Fund’s total assets to be invested in unrated debt securities. The revised policy allows 5% of the Fund’s total assets to be invested in unrated debt securities or debt securities that are rated less than “B-” (Standard & Poor’s or FitchRatings) / “B3” (Moody’s) of public or private companies.
The revised policy related to debt securities was effective July 1, 2012 as follows:
The Fund may not invest more than 30% of its total assets in debt securities (the “Total Debt Test”), including up to 20% of its total assets in below-investment-grade debt securities which are rated, at the time of investment, at least (i) “B3” by Moody’s Investors Service, Inc., (ii) “B-” by Standard & Poor’s or FitchRatings, or (iii) a comparable rating by another rating agency (the “Sub Investment Grade Test”). Additionally, up to 5% of its total assets may be invested in unrated debt securities or debt securities that are rated less than “B-” / “B3” of public or private companies. For the avoidance of doubt, unrated debt securities or debt securities that are rated less than “B-” / “B3” are not included for the purpose of calculating the Sub Investment Grade Test but are included for the purpose of calculating the Total Debt Test.
REPURCHASE DISCLOSURE
(UNAUDITED)
Notice is hereby given in accordance with Section 23(c) of the 1940 Act, that the Fund may from time to time purchase shares of its common and preferred stock and its Senior Notes in the open market or in privately negotiated transactions.
54
| | |
| Directors and Corporate Officers | | |
| |
| Kevin S. McCarthy | | Chairman of the Board of Directors,
President and Chief Executive Officer |
| |
| Anne K. Costin | | Director |
| |
| Steven C. Good | | Director |
| |
| Gerald I. Isenberg | | Director |
| |
| William H. Shea, Jr. | | Director |
| |
| Terry A. Hart | | Chief Financial Officer and Treasurer |
| |
| David J. Shladovsky | | Chief Compliance Officer and Secretary |
| |
| J.C. Frey | | Executive Vice President, Assistant
Secretary and Assistant Treasurer |
| |
| James C. Baker | | Executive Vice President |
| |
| Ron M. Logan, Jr. | | Senior Vice President |
| |
| Jody C. Meraz | | Vice President |
| |
Investment Adviser
KA Fund Advisors, LLC
717 Texas Avenue, Suite 3100
Houston, TX 77002 | | Administrator
Ultimus Fund Solutions, LLC
350 Jericho Turnpike, Suite 206
Jericho, NY 11753 |
| |
1800 Avenue of the Stars, Third Floor
Los Angeles, CA 90067 | | Stock Transfer Agent and Registrar
American Stock Transfer & Trust Company, LLC
6201 15th Avenue
Brooklyn, NY 11219 |
| |
Custodian
JPMorgan Chase Bank, N.A.
14201 North Dallas Parkway, Second Floor Dallas, TX 75254 | | Independent Registered Public Accounting Firm PricewaterhouseCoopers LLP
350 South Grand Avenue
Los Angeles, CA 90071 |
| |
| | Legal Counsel
Paul Hastings LLP
55 Second Street, 24th Floor
San Francisco, CA 94105 |
Please visit us on the web at http://www.kaynefunds.com or call us toll-free at 1-877-657-3863.

This report, including the financial statements herein, is made available to stockholders of the Fund for their information. It is not a prospectus, circular or representation intended for use in the purchase or sale of shares of the Fund or of any securities mentioned in this report.
Item 2. Code of Ethics.
(a) As of the end of the period covered by this report, the Registrant has adopted a code of ethics that applies to the Registrant’s principal executive officer, principal financial officer, principal accounting officer, or persons performing similar functions.
(c) and (d) During the period covered by this report, there was no amendment to, and no waiver, including implicit waiver, was granted from, any provision of the Registrant’s code of ethics that applies to the Registrant’s principal executive officer, principal financial officer, principal accounting officer, or persons performing similar functions.
(f)(1) Pursuant to Item 12(a)(1), the Registrant is attaching as an exhibit (EX-99.CODE ETH) a copy of its code of ethics that applies to its principal executive officer, principal financial officer, principal accounting officer, or persons performing similar functions.
Item 3. Audit Committee Financial Expert.
(a)(1) The Registrant’s board of directors has determined that the Registrant has one audit committee financial expert serving on its audit committee.
(a)(2) The audit committee financial expert is Steven C. Good. Mr. Good is “independent” for purposes of this Item.
Item 4. Principal Accountant Fees and Services.
(a) through (d) The information in the table below is provided for professional services rendered to the Registrant by its independent registered public accounting firm, PricewaterhouseCoopers LLP, during the Registrant’s (a) last fiscal year ended November 30, 2012, and (b) fiscal year ended November 30, 2011.
| | | | | | | | |
| | | 2012 | | | 2011 | |
Audit Fees | | $ | 207,000 | | | $ | 181,300 | |
Audit-Related Fees | | | 55,800 | | | | 10,000 | |
Tax Fees | | | 157,800 | | | | 146,000 | |
All Other Fees | | | — | | | | — | |
| | | | | | | | |
Total | | $ | 420,600 | | | $ | 337,300 | |
| | | | | | | | |
(e)(1) Audit Committee Pre-Approval Policies and Procedures.
With respect to the table above, “Audit Fees” are the aggregate fees billed for professional services for the audit of the Registrant’s annual financial statements and services provided in connection with statutory and regulatory filings or engagements. “Audit-Related Fees” are the aggregate fees billed for assurance and related services reasonably related to the performance of the audit of the Registrant’s financial statements and are not reported under “Audit Fees.” “Tax Fees” are the aggregate fees billed for professional services for tax compliance, tax advice and tax planning.
(i) Before the auditor is engaged by the Registrant to render audit, audit related or permissible non-audit services to the Registrant or (ii) with respect to non-audit services to be provided by the auditor to the Registrant’s investment adviser or any entity in the Registrant’s investment company complex, if the nature of the services provided relate directly to the operations or financial reporting of the Registrant, either: (a) the Audit Committee shall pre-approve such engagement; or (b) such engagement shall be entered into pursuant to pre-approval policies and procedures established by the Audit Committee. Any such policies and procedures must be detailed as to the particular service and not involve any delegation of the Audit Committee’s responsibilities to the Registrant’s investment adviser. The Audit Committee may delegate to one or more of its members the authority to grant pre-approvals. The pre-approval policies and procedures shall include the requirement that the decisions of any member to whom authority is delegated under this provision be presented to the full Audit Committee at its next scheduled meeting. Under certain limited circumstances, pre-approvals are not required if certain de minimis thresholds are not exceeded, as such thresholds are set forth by the Audit Committee and in accordance with applicable Securities and Exchange Commission rules and regulations.
(e)(2) None of the services provided to the Registrant described in paragraphs (b) through (d) of this Item 4 were pre-approved by the Audit Committee pursuant to paragraph (c)(7)(i)(C) of Rule 2-01 of regulation S-X.
(f) No disclosures are required by this Item 4(f).
(g) The aggregate non-audit fees billed by PricewaterhouseCoopers LLP for services rendered to the Registrant for the fiscal year ended November 30, 2012 was $157,800, and $146,000 for the fiscal year ended November 30, 2011. There were no non-audit fees billed by PricewaterhouseCoopers LLP for services rendered to the Registrant’s investment adviser (not including any sub-adviser whose role is primarily portfolio management and is subcontracted with or overseen by another investment adviser) or any entity controlling, controlled by, or under common control with the investment adviser that provides ongoing services to the Registrant for each of the last two fiscal years.
(h) No disclosures are required by this Item 4(h).
Item 5. Audit Committee of Listed Registrants.
The Registrant has a separately-designated standing Audit Committee established in accordance with Section 3(a)(58)(A) of the Securities and Exchange Act of 1934, as amended (the “Exchange Act”). Steven C. Good (Chair), Anne K. Costin, Gerald I. Isenberg and William H. Shea, Jr. are the members of the Registrant’s Audit Committee.
Item 6. Investments.
Please see the Schedule of Investments contained in the Report to Stockholders included under Item 1 of this Form N-CSR.
Item 7. Disclosure of Proxy Voting Policies and Procedures for Closed-End Management Investment Companies.
The Registrant has delegated the voting of proxies relating to its voting securities to its investment adviser, KA Fund Advisors, LLC (the “Adviser”). The respective Proxy Voting Policies and Procedures of the Registrant and the Adviser are attached as Exhibit 99.VOTEREG and Exhibit 99.VOTEADV hereto.
Item 8. Portfolio Managers of Closed-End Management Investment Companies.
(a)(1) As of November 30, 2012, the following individuals (the “Portfolio Managers”) are primarily responsible for the day-to-day management of the Registrant’s portfolio:
Kevin S. McCarthy is the Registrant’s President, Chief Executive Officer and co-portfolio manager and has served as the President, Chief Executive Officer and co-portfolio manager of Kayne Anderson MLP Investment Company (“KYN”) since June 2004, of Kayne Anderson Energy Development Company (“KED”) since September 2006 and of Kayne Anderson Midstream/Energy Fund, Inc. (“KMF”) since November 2010. Mr. McCarthy has served as a Senior Managing Director of Kayne Anderson Capital Advisors, L.P. (“KACALP”) since June 2004 and of the Adviser (together with KACALP, “Kayne Anderson”) since 2006. Prior to that, he was Global Head of Energy at UBS Securities LLC. In this role, he had senior responsibility for all of UBS’ energy investment banking activities. Mr. McCarthy was with UBS Securities from 2000 to 2004. From 1995 to 2000, Mr. McCarthy led the energy investment banking activities of Dean Witter Reynolds and then PaineWebber Incorporated. He began his investment banking career in 1984. He earned a BA degree in Economics and Geology from Amherst College in 1981, and an MBA degree in Finance from the University of Pennsylvania’s Wharton School in 1984.
J.C. Frey is the Registrant’s Executive Vice President, Assistant Secretary, Assistant Treasurer and co-portfolio manager and a Senior Managing Director of Kayne Anderson. He serves as portfolio manager of Kayne Anderson’s funds investing in master limited partnership (“MLP”) securities, including serving as a co-portfolio manager, Assistant Secretary and Assistant Treasurer of KYN since June 2004 and of KED since September 2006, Vice President of KYN from June 2004 through June 2008 and of KED from September 2006 through July 2008, Executive Vice President of KYN since
2
June 2008 and of KED since July 2008, and Executive Vice President, Assistant Treasurer, Assistant Secretary and co-portfolio manager of KMF since November 2010. Mr. Frey began investing in MLPs on behalf of Kayne Anderson in 1998 and has served as portfolio manager of Kayne Anderson’s MLP funds since their inception in 2000. In addition to the closed-end funds, Mr. Frey manages approximately $4 billion in assets in MLPs and midstream companies and other Kayne Anderson funds. Prior to joining Kayne Anderson in 1997, Mr. Frey was a CPA and audit manager in KPMG Peat Marwick’s financial services group, specializing in banking and finance clients, and loan securitizations. Mr. Frey graduated from Loyola Marymount University with a BS degree in Accounting in 1990. In 1991, he received a Master’s degree in Taxation from the University of Southern California.
(a)(2)(i) and (ii) Other Accounts Managed by Portfolio Managers:
The following table reflects information regarding accounts for which the Portfolio Managers have day-to-day management responsibilities (other than the Registrant). Accounts are grouped into three categories: (i) registered investment companies, (ii) other pooled investment vehicles, and (iii) other accounts. To the extent that any of these accounts pay advisory fees that are based on account performance, this information will be reflected in a separate table below. Information is shown as of November 30, 2012. Asset amounts are approximate and have been rounded.
| | | | | | | | | | | | | | | | | | | | | | | | |
| | | Registered
Investment Companies
(excluding the Registrant) | | | Other Pooled
Investment Vehicles | | | Other Accounts | |
Portfolio Manager | | Number of
Accounts | | | Total Assets
in the Accounts
($ in millions) | | | Number of
Accounts | | | Total Assets
in the Accounts
($ in millions) | | | Number of
Accounts | | | Total Assets
in the Accounts
($ in millions) | |
Kevin S. McCarthy | | | 3 | | | $ | 5,716 | | | | — | | | | N/A | | | | — | | | | N/A | |
J.C. Frey | | | 3 | | | $ | 5,716 | | | | — | | | | N/A | | | | 10 | | | $ | 882 | |
(a)(2)(iii) Other Accounts that Pay Performance-Based Advisory Fees Managed by Portfolio Managers:
The following table reflects information regarding accounts for which the Portfolio Managers have day-to-day management responsibilities (other than the Registrant) and with respect to which the advisory fee is based on the performance of the account. Information is shown as of November 30, 2012. Asset amounts are approximate and have been rounded.
| | | | | | | | | | | | | | | | | | | | | | | | |
| | | Registered
Investment Companies
(excluding the Registrant) | | | Other Pooled
Investment Vehicles | | | Other Accounts | |
Portfolio Manager | | Number of
Accounts | | | Total Assets
in the Accounts
($ in millions) | | | Number of
Accounts | | | Total Assets
in the Accounts
($ in millions) | | | Number of
Accounts | | | Total Assets
in the Accounts
($ in millions) | |
Kevin S. McCarthy | | | — | | | | N/A | | | | 2 | | | $ | 1,007 | | | | 1 | | | $ | 36 | |
J.C. Frey | | | — | | | | N/A | | | | 13 | | | $ | 3,482 | | | | 3 | | | $ | 61 | |
(a)(2)(iv) Potential Material Conflicts of Interest:
Some of the other accounts managed by Messrs. McCarthy and Frey have investment strategies that are similar to those of the Registrant. However, Kayne Anderson manages potential conflicts of interest by allocating investment opportunities in accordance with its written allocation policies and procedures.
(a)(3) Compensation of Each Portfolio Manager, as of November 30, 2012:
Messrs. McCarthy and Frey are compensated by KACALP through partnership distributions from KACALP, based on the amount of assets they manage, and they receive a portion of the advisory fees applicable to those accounts, which, with respect to certain accounts, as noted above, are based in part on the performance of those accounts.
Additional benefits received by Messrs. McCarthy and Frey are normal and customary benefits provided by investment advisers.
3
(a)(4) As of November 30, 2012, the end of the Registrant’s most recently completed fiscal year, the dollar range of equity securities beneficially owned by each Portfolio Manager in the Registrant is shown below:
Kevin S. McCarthy: $500,001-$1,000,000
J.C. Frey: $500,001-$1,000,000
Through their limited partnership interests in KACALP, which owns shares of Registrant’s common stock, Messrs. McCarthy and Frey could be deemed to also indirectly own a portion of Registrant’s securities.
(b) Not Applicable.
Item 9. Purchases of Equity Securities by Closed-End Management Investment Company and Affiliated Purchasers.
None.
Item 10. Submission of Matters to a Vote of Security Holders.
None.
Item 11. Controls and Procedures.
(a) The Registrant’s principal executive and principal financial officers have evaluated the Registrant’s disclosure controls and procedures (as defined in Rule 30a-3(c) under the Investment Company Act of 1940, as amended (the “1940 Act”)) as of a date within 90 days of this filing and have concluded that the Registrant’s disclosure controls and procedures are effective, as of such date, based on the evaluation of these controls and procedures required by Rule 30a-3(b) under the 1940 Act and Rule 13a-15(b) under the Exchange Act.
(b) The Registrant’s principal executive and principal financial officers are aware of no changes in the Registrant’s internal control over financial reporting (as defined in Rule 30a-3(d) under the 1940 Act) that occurred during the second fiscal quarter of the period covered by this report that have materially affected, or are reasonably likely to materially affect, the Registrant’s internal control over financial reporting.
Item 12. Exhibits.
(a)(1) Code of Ethics attached hereto as EX-99.CODE ETH.
(a)(2) Separate certifications of Principal Executive and Principal Financial Officers pursuant to Section 302 of the Sarbanes-Oxley Act of 2002 attached hereto as EX-99.CERT.
(b) Certification of Principal Executive and Principal Financial Officers pursuant to Section 906 of the Sarbanes-Oxley Act of 2002 attached hereto as EX-99.906 CERT.
(99) Proxy Voting Policies of the Registrant attached hereto as EX-99.VOTEREG.
(99) Proxy Voting Policies of the Adviser attached hereto as EX-99.VOTEADV.
4
SIGNATURES
Pursuant to the requirements of the Securities Exchange Act of 1934 and the Investment Company Act of 1940, the Registrant has duly caused this report to be signed on its behalf by the undersigned, thereunto duly authorized.
| | |
KAYNE ANDERSON ENERGY TOTAL RETURN FUND, INC. |
| |
By: | | /S/ KEVIN S. MCCARTHY |
| | Kevin S. McCarthy |
| | Chairman of the Board of Directors, President and Chief Executive Officer |
| | Date: February 5, 2013 |
Pursuant to the requirements of the Securities Exchange Act of 1934 and the Investment Company Act of 1940, this report has been signed below by the following persons on behalf of the Registrant and in the capacities and on the dates indicated.
| | |
By: | | /S/ KEVIN S. MCCARTHY |
| | Kevin S. McCarthy |
| | Chairman of the Board of Directors, President and Chief Executive Officer |
| | Date: February 5, 2013 |
| |
By: | | /S/ TERRY A. HART |
| | Terry A. Hart |
| | Chief Financial Officer and Treasurer |
| | Date: February 5, 2013 |
Exhibit Index
(a)(1) Code of Ethics attached hereto as EX-99.CODE ETH.
(a)(2) Separate certifications of Principal Executive and Principal Financial Officers pursuant to Section 302 of the Sarbanes-Oxley Act of 2002 attached hereto as EX-99.CERT.
(b) Certification of Principal Executive and Principal Financial Officers pursuant to Section 906 of the Sarbanes-Oxley Act of 2002 attached hereto as EX-99.906 CERT.
(99) Proxy Voting Policies of the Registrant attached hereto as EX-99.VOTEREG.
(99) Proxy Voting Policies of the Adviser attached hereto as EX-99.VOTEADV.