UNITED STATES
SECURITIES AND EXCHANGE COMMISSION
Washington D.C. 20549
FORM 10-K/A
Amendment No. 1
ANNUAL REPORT PURSUANT TO SECTION 13 OR 15(d) OF THE
SECURITIES EXCHANGE ACT OF 1934
For the fiscal year ended December 31, 2012
Commission file number: 001-32920

(Exact name of registrant as specified in its charter)
Yukon Territory |
| N/A |
(State or other jurisdiction of |
| (I.R.S. Employer |
1625 Broadway, Suite 250 |
|
|
Denver, Colorado 80202 |
| (303) 592-8075 |
(Address of principal executive offices) |
| (Registrant’s telephone number, including area code) |
Securities pursuant to Section 12(b) of the Act:
Title of Each Class |
| Name of Exchange on Which Registered |
Common Stock |
| New York Stock Exchange |
Securities registered pursuant to Section 12(g) of the Act:
None
Indicate by check mark if the registrant is a well-known seasoned issuer, as defined in Rule 405 of the Securities Act. Yes x No o
Indicate by check mark if the registrant is not required to file reports pursuant to Section 13 or Section 15(d) of the Act. Yes o No x
Indicate by check mark whether the registrant (1) has filed all reports required to be filed by Section 13 or 15(d) of the Securities Exchange Act of 1934 during the preceding 12 months (or for such shorter period that the registrant was required to file such reports), and (2) has been subject to such filing requirements for the past 90 days. Yes x No o
Indicate by check mark whether the registrant has submitted electronically and posted on its corporate Web site, if any, every Interactive Data File required to be submitted and posted pursuant to Rule 405 of Regulation S-T (§ 232.405 of this chapter) during the preceding 12 months (or for such shorter period that the registrant was required to submit and post such files). Yes x No o
Indicate by check mark if disclosure of delinquent filers pursuant to Item 405 of Regulation S-K is not contained herein, and will not be contained, to the best of the registrant’s knowledge, in definitive proxy or information statements incorporated by reference on Part III of this Form 10-K or any amendment to this Form10-K. o
Indicate by check mark whether the registrant is a large accelerated filer, an accelerated filer, a non-accelerated filer, or a smaller reporting company. See the definitions of “large accelerated filer, accelerated filer, and smaller reporting company” in Rule 12b-2 of the Exchange Act. (Check one):
Large accelerated filer x |
| Accelerated filer o |
|
|
|
Non-accelerated filer o |
| Smaller reporting company o |
Indicate by check mark whether the registrant is a shell company (as defined in Rule 12b-2 of the Exchange Act). Yes o No x
At June 29, 2012, the aggregate market value of the registrant’s Common Stock held by non-affiliates of the registrant was approximately $1,794,242,431. The number of shares of the registrant’s Common Stock outstanding as of February 27, 2013, was 265,309,314.
DOCUMENTS INCORPORATED BY REFERENCE
None.
KODIAK OIL & GAS CORP.
FORM 10-K/A
2 | |
|
|
ITEM 10. DIRECTORS, EXECUTIVE OFFICERS AND CORPORATE GOVERNANCE | 2 |
|
|
5 | |
|
|
23 | |
|
|
ITEM 13. CERTAIN RELATIONSHIPS AND RELATED TRANSACTIONS, AND DIRECTOR INDEPENDENCE | 25 |
|
|
26 | |
|
|
27 | |
|
|
27 | |
|
|
31 |
EXPLANATORY NOTE
This Amendment No. 1 to the Annual Report on Form 10-K of Kodiak Oil & Gas Corp. (“Kodiak”, “we”, “our”, “us”, or the “Company”) for the year ended December 31, 2012, which was originally filed with the U.S. Securities and Exchange Commission (“SEC”) on February 28, 2012, is being filed to include the responses to the items required by Part III that we previously intended to incorporate by reference to the proxy statement for our 2012 annual meeting of shareholders. Additionally, pursuant to Rule 12b-15 under the Securities Exchange Act of 1934, as amended (the “Exchange Act”), the Company has filed the certifications required by Rule 13a-14(a) or 15d-14(a) of the Exchange Act. Except as specifically provided otherwise herein, this Amendment No. 1 does not reflect events occurring after February 28, 2013, the date of the filing of our original Form 10-K, or modify or update those disclosures that may have been affected by subsequent events. Accordingly, this Amendment No. 1 should be read in conjunction with the Form 10-K originally filed on February 28, 2013.
ITEM 10. DIRECTORS, EXECUTIVE OFFICERS AND CORPORATE GOVERNANCE
The following table sets forth certain information with respect to our current directors and executive officers. The term for each director expires at our next annual meeting or at such time as his or her successor is appointed and qualified, upon ceasing to meet the qualifications for election as a director, upon death, upon removal by the shareholders or upon delivery or submission to the Company of the director’s written resignation, unless the resignation specifies a later time of resignation. Each executive officer shall hold office until the earlier of the date his resignation becomes effective, the date his successor is appointed or he shall cease to be qualified for that office, or the date he is terminated by the Board. The ages of the directors and executive officers are shown as of December 31, 2012.
Name and Municipality |
| Position and Office Held |
| Director/Officer |
| Age |
|
|
|
|
|
|
|
Executive Officers |
|
|
|
|
|
|
Lynn A. Peterson—Denver, Colorado |
| Director, Chairman of the Board, President & CEO |
| November 2001 |
| 59 |
|
|
|
|
|
|
|
James P. Henderson—Denver, Colorado(1) |
| CFO, Secretary & Treasurer |
| April 2010 |
| 47 |
|
|
|
|
|
|
|
James E. Catlin—Denver, Colorado |
| Director, Executive V.P. of Business Development |
| February 2001 |
| 65 |
Russell A. Branting—Denver, Colorado |
| Executive V.P. of Operations |
| June 2011 |
| 50 |
|
|
|
|
|
|
|
Russ D. Cunningham— Denver, Colorado |
| Executive V.P. of Exploration |
| June 2011 |
| 58 |
|
|
|
|
|
|
|
Directors |
|
|
|
|
|
|
Rodney D. Knutson(2)(3)(4)—Aspen, Colorado |
| Director |
| March 2001 |
| 71 |
|
|
|
|
|
|
|
Herrick K. Lidstone, Jr.(2)(3)(4)—Centennial, Colorado |
| Director |
| March 2006 |
| 63 |
|
|
|
|
|
|
|
William J. Krysiak (2)(3)(4)—Denver, Colorado |
| Director |
| September 2010 |
| 52 |
(1) Mr. Henderson rejoined the Company in April 2010 after having formerly served as the Company’s Chief Financial Officer from May 2007 to May 2008.
(2) Member of the Compensation Committee of the Board.
(3) Member of the Audit Committee of the Board.
(4) Member of the Nominating and Corporate Governance Committee of the Board.
The following is a brief description of the employment background of the Company’s current directors/director nominees and executive officers:
Lynn A. Peterson, co-founder of the Company, has served as a director of the Company since November 2001, President and Chief Executive Officer since July 2002 and Chairman of the Board since June 2011. Mr. Peterson has over 30 years of industry experience. Mr. Peterson was an owner of CP Resources, LLC, an independent oil and natural gas company from 1986 to 2001. Mr. Peterson served as Treasurer of Deca Energy from 1981 to 1986. Mr. Peterson was employed by Ernst and Whinney as a certified public accountant prior to this time. He received a Bachelor of Science in Accounting from the University of Northern Colorado in 1975. Mr. Peterson’s business address is 1625 Broadway, Suite 250, Denver, Colorado 80202. The determination was made that Mr. Peterson should serve on our Board of Directors due to his extensive executive level experience working with oil and natural gas companies. In addition, we believe that it is important that the Board of Directors have the benefit of management’s perspective, and in particular, that of the Chief Executive Officer.
James P. Henderson previously served as the Company’s Chief Financial Officer from May 24, 2007 to May 10, 2008. He rejoined the Company as Chief Financial Officer on April 1, 2010 after two years as director of finance of Aspect Energy LLC, a Denver-based privately held energy company. Prior to May 2007, Mr. Henderson spent 17 years at Western Gas Resources and its successor, Anadarko Petroleum Corp., in its Denver office. During that time, he served as director, accounting services at Anadarko Petroleum Corp. and in various financial roles including director, financial planning and analysis at Western Gas Resources. Mr. Henderson holds a Bachelors degree in Accounting from Texas Tech University and a Master of Business Administration degree from Regis University in Denver. Mr. Henderson’s business address is 1625 Broadway, Suite 250, Denver, Colorado 80202.
James E. Catlin, co-founder of the Company, has served as a director of the Company since February 2001, Chairman of the Board from July 2002 until June 2011, Secretary from July 2002 to May 2008, Chief Operating Officer from June 2006 until June 2011 and Executive Vice President of Business Development since June 2011. Mr. Catlin has nearly 40 years of geologic experience, primarily in the Rocky Mountain Region. Mr. Catlin was an owner of CP Resources LLC, an independent oil and natural gas company from 1986 to 2001. Mr. Catlin was a founder and Vice-President of Deca Energy from 1980 to 1986 and worked as a district geologist for Petroleum Inc. and Fuelco prior to this time. He received a Bachelor of Arts and a Masters degree in Geology from the University of Northern Illinois in 1973. Mr. Catlin’s business address is 1625 Broadway, Suite 250, Denver, Colorado 80202. The determination was made that Mr. Catlin should serve on our Board of Directors due to his extensive training and experience with respect to geology and executive level experience working with oil and natural gas companies.
Dr. Russell A. Branting previously served as the Company’s Operations Manager from June of 2007 to May of 2009 and Vice-President of Operations from May of 2009 until June of 2011. Dr. Branting currently serves as Executive Vice-President of Operations and has served in that capacity since June of 2011. He has more than 20 years of experience focused throughout the Rocky Mountain region, with extensive experience in the Green River Basin in Wyoming. He has served in various positions in petroleum engineering and operations with Western Gas Resources, Inc., Petropro Engineering, Inc., Tesco Underbalanced Drilling Services, Chevron USA, Inc., and Snyder Oil Corporation. He was most recently the Drilling Engineering Manager at Anadarko, where he was responsible for managing all drilling engineering operations ongoing in the Rocky Mountain Region. Dr. Branting earned his Ph. D. in Petroleum Engineering from the University of Wyoming in 1993. Dr. Branting’s business address is 1625 Broadway, Suite 250, Denver, Colorado 80202.
Russ D. Cunningham previously served as the Company’s Northern Rockies Exploration Manager from September of 2004 to December of 2007, Exploration Manager from December of 2007 to May of 2009, and Vice-President of Exploration from May of 2009 to June of 2011. Mr. Cunningham currently serves as Executive Vice-President of Exploration and has served in that capacity since June of 2011. He has over 30 years experience in oil and gas exploration, primarily in the Rocky Mountain Region and the Mid-Continent Region, as well as international experience in Colombia, South America and Russia. Mr. Cunningham was most recently with Cabot Oil and Gas Corporation exploring in Wyoming’s Wind River Basin, the Paradox Basin of Colorado and Utah, and the Williston Basin of Montana and North Dakota. Prior to Cabot, Mr. Cunningham served as Vice-President Exploration for GHK Colombia Company, a subsidiary of Seven Seas Exploration. Mr. Cunningham has a Masters Degree in Geology from the University of Tulsa, Tulsa, Oklahoma and is a member of the American Association of Petroleum Geologists, Society of Economic
Paleontologists and Mineralogists and the Geologic Society of America. Mr. Cunningham’s business address is 1625 Broadway, Suite 250, Denver, Colorado 80202.
Rodney D. Knutson has served as a director of the Company since March 2001. Currently, he is a self-employed attorney in Aspen, Colorado. Prior to this, he had over thirty years of private law practice in Denver, Colorado working with oil, gas and mining companies. Mr. Knutson has a Bachelor of Electrical Engineering (1965) from the University of Minnesota and a Juris Doctor (1972) from the University of Denver. Mr. Knutson is a former president of the Rocky Mountain Mineral Law Foundation. Mr. Knutson’s business address is 1625 Broadway, Suite 250, Denver, Colorado 80202. The determination was made that Mr. Knutson should serve on our Board of Directors due to his extensive experience working with oil, gas and mining companies.
Herrick K. Lidstone, Jr. has served as a director of the Company since March 2006. Mr. Lidstone is an attorney at law in Greenwood Village, Colorado, and is currently with Burns, Figa & Will, P.C., where he practices in corporate and securities law, dealing frequently with mergers and acquisitions, finance transactions, and private and public securities offerings. Mr. Lidstone served on the Securities Board for the Department of Regulatory Agencies in Colorado from 1999 through 2011. He has been Adjunct Professor of Law at the University of Colorado and the University of Denver and has taught continuing education courses for the National Business Institute, CLE in Colorado, Inc., and other CLE providers. He has numerous legal publications and presentations to his credit. Mr. Lidstone received a Bachelor of Arts from Cornell University in 1971 and a Juris Doctor from the University of Colorado School of Law in 1978. Mr. Lidstone’s business address is Suite 1000, 6400 South Fiddler’s Green Circle, Greenwood Village, Colorado 80111. The determination was made that Mr. Lidstone should serve on our Board of Directors due to his extensive business and securities law experience and his experience in representing companies involved in natural resource exploration, development and production.
Mr. Krysiak has served as a director of the Company since September 2010. He is currently the CFO of Southwest Generation Operating Company, LLC, an independent power producer. Prior to his current position, from September 2007 to July 2009, he was the CFO of Aspect Holdings LLC, a Denver-based energy company. Prior to Aspect, he served in various financial-oriented management and officer positions at Western Gas Resources, Inc. from 1985 to 2006, including Chief Financial Officer. Subsequent to the sale of Western Gas Resources to Anadarko, Mr. Krysiak assisted Anadarko in a transition period from August 2006 through June 2007 as the Director of Financial Projects. He earned his BS in business administration with a major in accounting from Colorado State University in 1982 and is a Certified Public Accountant. Mr. Krysiak’s business address is 1625 Broadway, Suite 250, Denver, Colorado 80202. The determination was made that Mr. Krysiak should serve on our Board of Directors due to his substantial financial reporting, compliance, capital markets and oil and gas transactional experience gained by way of his 18 years of experience as a corporate officer responsible for accounting and financial matters and his strong public company experience in the oil and gas industry.
Legal Proceedings
During the past ten years, none of our directors or executive officers has been involved in any legal proceedings that are material to an evaluation of the ability or integrity of such person.
Audit Committee and Audit Committee Financial Expert
Audit Committee and Audit Committee Financial Expert
The Audit Committee was established by the Board in accordance with Section 3(a)(58)(A) of the Exchange Act, to oversee the Company’s corporate accounting and financial reporting processes and audits of its financial statements. The members of our Audit Committee are Messrs. Krysiak, Lidstone and Knutson. Mr. Krysiak is chairman of the Audit Committee. All committee members qualify as independent directors under the applicable New York Stock Exchange standards, SEC rules and MI 52-110. The Board has determined that all current members of the Audit Committee are “financially literate” as interpreted by the Board in its business judgment. Mr. Krysiak further qualifies as an audit committee financial expert, as defined in the applicable rules of the SEC. The Audit Committee held 4 meetings during fiscal year 2012.
The Audit Committee meets periodically with our independent accountants and management to review the scope and results of the annual audit and to review our financial statements and related reporting matters prior to the submission of the financial statements to the Board. In addition, the committee meets with the independent auditors at least on a quarterly basis to review and discuss the annual audit or quarterly review of our financial statements.
We have established an Audit Committee Charter that deals with the establishment of the Audit Committee and sets out its duties and responsibilities. The Audit Committee reviews and reassesses the adequacy of the Audit Committee Charter on an annual basis. The Audit Committee Charter is available on our Company website at http://www.kodiakog.com.
Code of Business Conduct and Ethics
The Board has adopted a Code of Business Conduct and Ethics, applicable to all directors, officers and employees, the full text of which can be found on our website at http://www.kodiakog.com. Any shareholder may request a hard copy, free of charge, of the Company’s Code of Business Conduct and Ethics by making such request in writing to the Company.
Section 16(a) Beneficial Ownership Reporting Compliance
Section 16(a) of the Exchange Act requires the Company’s officers and directors and persons who own more than 10% of a registered class of the Company’s equity securities, to file reports of ownership and changes in ownership on Forms 3, 4 and 5 with the SEC. Officers, directors and such 10% shareholders are required to furnish the Company with copies of all Forms 3, 4 and 5 they file.
Based solely on a review of the reports received by the SEC, furnished to the Company, or written representations from reporting persons that all reportable transactions were reported, the Company believes that, during the fiscal year ended December 31, 2012, the Company’s officers, directors and greater than ten percent owners timely filed all reports they were required to file under Section 16(a), except that Mr Cunningham filed one late report relating to a stock option exercise and sale.
ITEM 11. EXECUTIVE COMPENSATION
COMPENSATION DISCUSSION AND ANALYSIS
The following contains a description of our 2012 compensation programs and objectives with respect to our Named Executive Officers identified in the Summary Compensation table (the “NEOs”).
Executive Summary
The year ended December 31, 2012 (referred to herein as “fiscal 2012”) was another outstanding year for us, with the Company achieving record financial results. The table below summarizes the key Company financial and operational results for fiscal 2012 compared to fiscal 2011.
|
| Fiscal 2012 |
| Fiscal 2011 |
| Percent |
| ||
Proved Reserves (MMBOE) |
| 94.8 |
| 39.8 |
| 138 | % | ||
Adjusted EBITDA(1) |
| $ | 317,054 |
| $ | 76,350 |
| 315 | % |
Sales Volume (BOE) |
| 5,254,000 |
| 1,432,000 |
| 267 | % | ||
(1) “Adjusted EBITDA” is a non-GAAP financial measure. For further information regarding this measure, please see our earnings release furnished on a Form 8-K filed on February 28, 2013.
Consistent with our executive compensation program’s emphasis on pay-for-performance, compensation awarded to the NEOs for fiscal 2012 reflected the Company’s record financial and operational results and significant milestones achieved. Taking into account the foregoing factors, including that the Company exceeded all of the pre-established 2012 performance objectives, the following determinations were made with respect to the at-risk portion of the NEOs’ 2012 compensation:
· Annual Bonus Incentive Program: Each NEO received a payout under our annual bonus incentive program equal to 200% of target.
· Equity-Based Awards: Each NEO earned 200% of the NEO’s target number of restricted stock units that were subject to the 2012 performance criteria.
This Compensation Discussion and Analysis includes an analysis of the following:
· 2012 NEO Pay Mix
· How Executive Compensation is Determined
· Objectives of our Executive Compensation Program
· Base Pay
· Performance-Based Annual Bonus Incentives
· Performance-Based Long-Term Equity Pay
· Post-2012 Changes in Compensation
2012 NEO Pay Mix and Emphasis on Variable Pay
The compensation package for our NEOs is composed of the following elements:
Component |
| Short or |
| At Risk |
| Summary |
Base Pay |
| Short term |
| Not at risk |
| Fixed pay that is not subject to financial performance risk. |
|
|
|
|
|
|
|
Annual Bonus Incentive Program |
| Short term |
| At risk |
| Annual award that is based on corporate performance. |
|
|
|
|
|
|
|
Performance Equity-Based Awards |
| Long term |
| At risk |
| For 2012, the NEOs were awarded a grant of restricted stock units, the vesting of which was tied to corporate performance objectives and subject to additional time-based vesting requirements. For 2013, the NEOs were awarded shares of restricted stock, the vesting of which was again tied to corporate performance objectives and subject to additional time-based vesting requirements. |
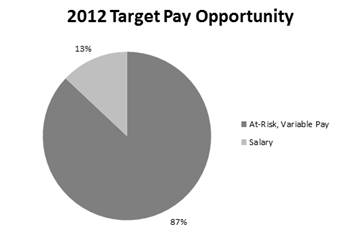
The Company’s executive compensation program is designed to align the interests of the NEOs with shareholders by tying a significant portion of the NEOs’ compensation to the Company’s performance, as measured by a variety of objective factors during the applicable fiscal year. Under the program, the portion of compensation guaranteed to the NEOs for any fiscal year represents only a fraction of the total potential compensation. On average, 13% of the value of the NEOs’ aggregate annual compensation was in the form of base salary, whereas 87% was contingent on the Company’s performance in the form of bonus incentives and equity awards. The following illustrates this pay mix:
How Executive Compensation is Determined and the Role of the Compensation Committee, Management and Consultants; Benchmarking
The compensation review process for determining NEO compensation for the 2012 fiscal year occurred during the fourth quarter of 2011 with a presentation by the Chief Executive Officer to the Compensation Committee of the Company’s current compensation philosophies and programs. The role of the Chief Executive Officer is to provide the Compensation Committee with perspectives on the business context to assist the Compensation Committee in making its decisions. The Chief Executive Officer also discusses with the Compensation Committee the compensation of the other NEOs. After such discussions, the Chief Executive Officer generally does not participate further in Compensation Committee deliberations or determinations regarding NEO compensation. The Compensation Committee makes all final decisions concerning NEO compensation. As discussed in greater detail below, compensation decisions are generally based upon an analysis of competitive benchmarking data and the performance of the Company
overall and, at the sole discretion of the Compensation Committee, may also be based upon other considerations, such as the individual’s performance and the individual’s influence on the performance of the Company.
As part of its evaluation of NEO compensation, the Compensation Committee utilizes outside consulting services. For the analysis of fiscal 2012 executive compensation, the Compensation Committee retained Denver Compensation & Benefits, LLC (“Denver CAB”). The Compensation Committee obtained a report prepared by Denver CAB in connection with the Committee’s determination of the appropriate salary, and the appropriate potential for bonus incentives and equity awards. The Compensation Committee had instructed Denver CAB to conduct a review utilizing peer group data and to make recommendations with respect to compensation levels as part of Denver CAB’s report. The peer group utilized by Denver CAB, based on input from the Compensation Committee, consisted of oil and gas exploration and production companies with, at the time of the Denver CAB report, a total asset size of between $55.5 million and $3.8 billion; revenue between approximately $19.5 million and $854.8 million; market capitalization between approximately $237.4 million and $2.7 billion; and one-year stock appreciation between approximately -10% and 365%. The peer group was composed of the following companies:
Abraxas Petroleum Corp.
Approach Resources, Inc.
Bill Barrett Corporation
Brigham Exploration Company
Carrizo Oil & Gas Co.
EV Energy Partners LP
Forest Oil Corporation
Gastar Exploration, Ltd.
Houston American Energy Corp.
Magnum Hunter Resources Corp.
Northern Oil & Gas, Inc.
Oasis Petroleum, Inc.
Vanguard Natural Resources, LLC
The foregoing peer group was used to set the compensation levels for 2012. At the time of the Denver CAB report, the Company ranked 10th among the 14 peer group companies (including Kodiak) for total assets, 13th among the 14 peer group companies for 2010 revenue, and 11th among the 14 peer group companies for net income among the selected peer group. However, given the Company’s extraordinary growth over the last several years, the Company felt it was important to include companies in the peer group that were reflective of the Company’s strategic goals and long-term outlook for Company performance.
During the fourth quarter of 2012, the Compensation Committee evaluated the Company’s performance in 2011 for total assets, 2011 revenue, and net income, and compared it to the peer group’s corresponding performance and 2011 compensation in order to evaluate the effectiveness of the peer group for setting compensation and the correlation between realized compensation and relative peer group performance. At such time, the Company ranked 7th out of the 14 peer companies for total assets, 10th out of the 14 peer group companies for 2011 revenue, and 11th out of the 14 peer group companies for net income. The Company’s success was further evidenced by the fact that the Company ranked 2nd out of the 14 peer group companies for 1-year revenue growth, 4th out of the 14 peer group companies for market capitalization, 2nd out of the 14 peer group companies for 1-year stock price appreciation, and 3rd out of the 14 peer group companies for 3-year stock appreciation among the select peer group. These factors influenced the Compensation Committee to ensure the NEOs were adequately compensated on a level commensurate with the success of the Company, as discussed in more detail below.
The Application of Internal Equity Considerations
In addition to benchmarking against an industry peer group, the Compensation Committee believes it is appropriate to consider other principles of compensation, and not accept “benchmarking” data as the sole basis for setting compensation levels. Thus, while the Compensation Committee has considered peer group data as described herein, it has also applied other compensation principles, including internal equity, when determining executive compensation.
The CEO’s 2012 total potential compensation ranged from 1.8 to 1.975 times that of the total potential compensation of the other NEOs. The spread between the CEO’s compensation and that of the other NEOs represents the Compensation Committee’s conclusion that Mr. Peterson’s leadership was a significant contribution to the Company’s performance in recent years. In addition, the Compensation Committee determined to treat the CFO, the EVP of Exploration and the EVP of Operations equally with respect to 2012 compensation, due to their relatively equivalent tenure in the oil and gas industry and their relatively equivalent tenures and contribution as executive officers of the Company. The application of internal equity consideration to the various components of compensation is discussed in more detail in the applicable sections below.
Objectives of our Executive Compensation Program
The compensation package for our NEOs is specifically designed to achieve three compensation objectives:
· Attracting and retaining key talent;
· Aligning the interests of our executive officers with the interests of the Company’s shareholders; and
· Providing our executives with reasonable security to motivate them to continue employment with the Company.
The compensation package achieves the goal of attracting and retaining key talent in a highly competitive oil and gas environment through a total compensation package that pays at or above market levels, as described in more detail below. The compensation package achieves the goal of aligning the interests of management and the Company’s shareholders by linking the size of NEO bonus incentive awards and the equity-based long-term incentive awards to the successful performance of the Company, and in turn, to the creation of shareholder value. The compensation package achieves the goal of providing our executives with reasonable security through the provision of moderate termination and change of control benefits, thereby promoting the NEO’s focus on enhancing shareholder value without undue concern about job security, while avoiding excessively liberal provisions that might motivate unnecessary risk taking.
2012 Compensation: The Year in Review
Following is a discussion of the 2012 compensation decisions with respect to Mr. Peterson, our CEO, Mr. Henderson, our CFO, Mr. Catlin, our EVP of Business Development, Dr. Branting, our EVP of Operations, and Mr. Cunningham, our EVP of Exploration.
Base Salary
The Compensation Committee believes that Kodiak’s 2011 success could not have been achieved without the significant contributions and effort put forth by the executive team, and in particular, by the CEO. Further, despite the Company’s relatively low rank among its peers with regard to total assets, revenue, and net income as measured at the time of the establishment of the peer group, the Company ultimately ranked in the top quartile for performance for the 2012 performance period, based on revenue growth and shareholder return, indicating that the Company significantly outperformed the peer companies. Based on the foregoing factors, the Compensation Committee set the annual base salary for Mr. Peterson at approximately the 75th percentile of the peer group, with a salary increase of 25% (from $350,000 in 2011 to $437,500 for 2012, effective January 1, 2012). The annual base salaries for Messrs. Henderson, Branting and Cunningham were increased by 10%, from $250,000 in 2011 to $275,000 for 2012, effective January 1, 2012 which placed each of these NEOs above the peer group median. Pursuant to Mr. Catlin’s desire to somewhat reduce the amount of his time devoted to the Company, the annual base salary for Mr. Catlin was reduced to $200,000 for 2012, effective January 1, 2012.
Annual Incentive Bonuses
The target bonus potential for 2012 remained at 100% of base salary; however, the maximum bonus potential was increased from 100% of each NEO’s base pay in 2011 to 200% of each NEO’s base pay for 2012, as an acknowledgment of the historic performance of the Company, and to continue to motivate performance even after the annual performance targets are achieved. Thus, if the target performance level is achieved, each NEO would be entitled to receive a bonus equal to 100% of his salary and if the maximum level is achieved, each NEO would be entitled to receive a bonus equal to 200% of his salary. The objective was to correlate the potential bonus amounts to peer performance, with a 100% bonus payout approximately equivalent to the peer group median bonus, and a 200% bonus payout reflecting an amount significantly above the peer group median to correlate with superior performance. Among the peer group companies, the prevalent maximum incentive awards ranged from 150% to 200% of base salary. As such, setting a maximum award value of 200% was in-line with the peer group, and is generally consistent with industry best practices.
The 2012 NEO bonuses were subject to the attainment of corporate performance goals, which are described below. The Compensation Committee believes that pre-established goals serve to (1) provide visibility and clarity with respect to the compensation system, including to both the NEOs and shareholders, (2) incentivize the executives throughout the year and (3) focus the NEOs’ attention on the objectives that are critical to the success of the Company and the growth of shareholder value. The Compensation Committee further believes that the objective metrics utilized to determine the bonus payouts are designed to correlate superior performance with increased shareholder value. If superior performance is achieved, the Compensation Committee is of the
view that bonus payments above the peer group median are warranted. Performance levels achieved between the threshold, target and maximum levels result in proportional bonus payouts. A discussion of the specific objectives to which the 2012 bonus payout was subject is set forth below under the heading “2012 Corporate Objectives”.
2012 Long-Term Equity-Based Incentive Awards
For the 2012 compensation period, the Compensation Committee modified the type of annual equity-based incentive awards granted to NEOs by awarding stand-alone restricted stock units (“RSUs”), rather than a combination of RSUs and Performance Awards (“PAs”) (as was the case in 2011). The PAs were awarded in the prior year in order to provide the NEO with cash to satisfy the taxes associated with the RSU grants. For 2012, the Compensation Committee determined to award RSUs that included a “net settlement” provision pursuant to which the executive may surrender shares to the Company in an amount sufficient to cover the associated tax withholding requirements. Accordingly, the Compensation Committee determined to eliminate PAs in 2012.
In prior years, the Company had used stock options as its primary long-term incentive compensation vehicle for NEOs. In 2011, the Company began awarding full-value equity awards (such as RSUs) rather than appreciation awards (such as stock options). The Compensation Committee believes that the value of RSUs to executives is more direct and visible than that of stock options, and because RSUs generally require fewer shares than stock options to deliver comparable value to executives. RSUs are also considered more effective as a retention tool given that they have a more identifiable value. With RSUs, if the performance goals are met, then the executive is assured of receiving some economic value even if the stock price declines or stays constant (as value is realized upon vesting). This is important where the stock price can be impacted by factors beyond the executives’ control or influence.
The vesting schedule established for the 2011 equity-based awards was also used for the 2012 awards, such that the vesting is not solely tied to performance-based conditions. Rather, to the extent that the 2012 corporate objectives are satisfied, only a portion of the awards vests upon the completion of that performance period and the remainder vests ratably over the following three year period, provided the NEO continues to provide requisite services to the Company on the scheduled vesting dates.
The Compensation Committee made the following determinations with regard to the value of the 2012 RSUs awarded to each NEO:
· The target award for the CEO approximated the peer group median.
· With respect to the EVP of Business Development, a downward adjustment to the median was made due to his reduced time commitment to the Company.
· Since the CFO was a relatively recent hire as compared to the CEO and EVP of Business Development, the Compensation Committee decided to target his 2012 RSUs at slightly below the median for CFOs in the peer group.
· As the EVP of Operations and EVP of Exploration had substantial longevity with the Company, the Compensation Committee determined that such NEOs should receive awards slightly above the median for their respective positions, which would also bring them more in alignment with the other NEOs.
· Ultimately, the Compensation Committee decided to treat the CFO, EVP of Operations and EVP of Exploration equally for purposes of the 2012 RSU grant.
Consistent with the foregoing considerations, the Compensation Committee determined that the following number of RSUs could be earned based on actual performance achieved at the threshold, target, or maximum performance levels, respectively:
Name |
| Number of RSUs to be |
| Number of RSUs to be |
| Number of RSUs to be |
|
Lynn A. Peterson |
| 66,412 |
| 132,823 |
| 265,646 |
|
James P. Henderson |
| 28,975 |
| 57,950 |
| 115,901 |
|
James E. Catlin |
| 40,565 |
| 81,131 |
| 162,262 |
|
Russell A. Branting |
| 28,975 |
| 57,950 |
| 115,901 |
|
Russ D. Cunningham |
| 28,975 |
| 57,950 |
| 115,901 |
|
Performance levels achieved in between the threshold, target and maximum levels will result in a proportionate number of RSUs being earned.
To the extent the RSUs are earned based upon the Company’s actual performance, the resulting RSUs will then vest in accordance with the following time-based vesting schedule, provided the NEO continues to provide the requisite services to the Company on the scheduled vesting dates:
· 25% of the RSUs will vest on the date that the Compensation Committee determines the number of RSUs that were actually earned (and in no event later than December 31, 2012); and
· an additional 25% of the granted RSUs will vest thereafter on each of November 1, 2013, November 1, 2014 and November 1, 2015.
As discussed under the next heading, due to the Company’s attainment of all of the pre-established 2012 corporate objectives, as well as the overall outstanding 2012 performance of the Company, 200% of the 2012 target awards were determined earned, with only 25% vested at the time of such determination and the remaining 75% subject to ratable vesting over a three year period. Effectively, therefore, the one year performance period plus the following three year time-based vesting period results in a four year vesting cycle. The Compensation Committee believes that a four-year vesting schedule is appropriate to secure a long-term commitment from each NEO.
2012 Corporate Objectives
As discussed above, the 2012 NEO bonuses and RSU awards were subject to the satisfaction of predetermined corporate objectives. Beginning with the 2011 compensation period and continuing for the 2012 compensation period, the Compensation Committee determined to set the performance period as the twelve month period ending September 30 (as opposed to December 31). This change was made so that the Compensation Committee can make timely decisions on annual NEO compensation prior to the end of the fiscal year, while retaining the benefit of having a full twelve month performance period to review.
For the 2012 compensation period, the Compensation Committee reduced the number of objective performance metrics used to determine the payout of the at-risk compensation (i.e., annual bonus and equity awards) from five to three, such that the three performance categories for 2012 were Adjusted EBITDA, Oil & Gas Sales Volumes and Proved Reserves. In 2011, the Company had also utilized Net Worth, and Income (Loss), in addition to a discretionary component reserved for the Compensation Committee. Beginning in 2012, Net Worth was removed as a performance metric in light of the Company’s frequent capital raises. Likewise, the Income performance metric was also eliminated due to its inherent overlap with the EBITDA performance metric. Finally, the Committee eliminated its discretion to award the final 30% of the incentive awards in order to satisfy certain requirements under Internal Revenue Code Section 162(m).
The Compensation Committee selected the particular measures because they are key indicators of Company performance, are easy to track, and are communicated to shareholders on a quarterly basis through the Company’s earnings press release and conference call.
Based on both the compensation benchmarking findings, as well as prevalent practices among similar sized organizations, Denver CAB recommended, and the Compensation Committee agreed, that threshold, target and maximum payouts should be established relative to the market. The intention and expectation is that payouts should correlate to relative peer group performance (i.e., threshold performance will result in a payout below the median, target performance will result in a payout near the market median, and maximum performance will result in a payout above the market median).
The 2012 corporate objectives to which the payout of the NEO bonuses and RSU awards were subject, as well as the actual results of corporate performance with respect to such objectives are as follows:
Performance Category For the 12 Months Ended |
| Threshold |
| Target |
| Maximum |
| Actual |
| ||||
|
|
|
|
|
|
|
|
|
| ||||
Adjusted EBITDA(1)(4) |
| $ | 46,624,000 |
| $ | 55,948,800 |
| $ | 62,942,400 |
| $ | 245,483,339 |
|
Oil & Gas Sales Volume (BOE)(2) |
| 1,047,619 |
| 1,257,143 |
| 1,414,286 |
| 4,238,552 |
| ||||
Proved Reserves (BOE)(3) |
| 28,842,000 |
| 34,610,400 |
| 38,936,700 |
| 76,843,526 |
| ||||
(1) Adjusted EBITDA had a relative weighting of 25% of the total.
(2) Oil and Gas Sales Volume had a relative weighting of 37.5% of the total.
(3) Proved Reserves had a relative weighting of 37.5% of the total.
(4) “Adjusted EBITDA” is a non-GAAP financial measure. For further information regarding this measure, please see our earnings release furnished on a Form 8-K filed on February 28, 2013.
As a result, (1) 100% of the 2012 bonus was paid out, and (2) 25% of the earned RSUs vested on December 27, 2012 in accordance with terms of the awards, and, provided the NEO continues to provide the requisite services to the Company on the scheduled vesting dates, an additional 25% of the earned RSUs will vest on each of November 1, 2013, November 1, 2014 and November 1, 2015.
Post-2012 Changes in Compensation
Compensation Consultant
As part of its evaluation of fiscal 2013 NEO compensation, the Compensation Committee retained Denver CAB in the fourth quarter of 2012. The Compensation Committee obtained a report prepared by Denver CAB to evaluate the NEOs’ base salaries, bonus and equity award potential (including the performance criteria to which they are subject) and severance benefits in connection with a termination upon a change in control. The Compensation Committee had instructed Denver CAB to conduct a review utilizing peer group data and to make recommendations with respect to compensation levels. The peer group utilized by Denver CAB, based on input from the Compensation Committee, consisted of oil and gas exploration and production companies with a total asset size of between $267.8 million and $10.4 billion, revenue between approximately $107.9 million and $3.7 billion, market capitalization between approximately $906.8 million and $5.3 billion, and one-year stock appreciation between approximately -74.1% and 438.9%, and was composed of the following companies:
Bill Barrett Corporation
Carrizo Oil & Gas, Inc.
EXCO Resources, Inc.
Forest Oil Corporation
Gulfport Energy Corporation
Halcon Resources Corp
Laredo Petroleum Holdings Inc.
Legacy Reserves LP
McMoRan Exploration Co.
Newfield Exploration Co.
Oasis Petroleum Inc.
Rosetta Resources Inc.
SM Energy Co.
Ultra Petroleum Corp.
Vanguard Natural Resources, LLC
Whiting Petroleum
WPX Energy
The Company ranked 12th out of the 18 peer group companies (including Kodiak) for total assets and 13th out of the 18 peer group companies for revenue. In addition, the Company ranked 9th for market capitalization, 2nd for 1-year stock price appreciation, and 2nd for 3-year stock appreciation out of the 18 peer group companies. Given the Company’s significant growth over the last several years, the Company felt it was important to include companies in the peer group that are reflective of the Company’s strategic goals and long-term outlook for Company performance.
Changes to Base Salary
The Compensation Committee believes that the Company would not have achieved the growth and success that it has to date had it not been for the performance and contributions of the CEO. As such, the Compensation Committee set the annual base salary for Mr. Peterson slightly above the median of the peer group, with a salary increase of approximately 23% (from $437,500 in 2012 to $540,000 for 2013, effective January 1, 2013). In addition, the Compensation Committee believes that Kodiak’s 2012 success could not have been achieved without the significant contributions and effort put forth by the other members of executive team. Therefore, the annual base salaries for Messrs. Henderson, Branting and Cunningham were increased by 20%, from $275,000 in 2012 to $330,000 for 2013, effective January 1, 2013. This increase places each of these NEOs base salary at approximately the peer group median for base salary, based on the compensation data from 2011 and 2012. The Compensation Committee believed this to be appropriate due to the extensive experience of the NEOs in the oil and gas industry and their significant and substantially equal contribution to the success of the Company. In prior years Mr. Catlin stated his desire to somewhat reduce the amount of his time devoted to the Company. Accordingly, in recent years, the Compensation Committee had reduced the base salary for Mr. Catlin to
accommodate his reduced hours. For 2013, Mr. Catlin did not intend to further reduce his hours, and as such, no further reduction in base salary was warranted. Ultimately, the Compensation Committee determined to increase Mr. Catlin’s base salary in order to reflect the superior performance of the Company and Mr. Catlin’s role in fostering such success, although the amount of the increase was lower than that of the other NEOs due to Mr. Catlin’s reduced role with Company. Accordingly, Mr. Catlin’s annual base salary for was only increased by 15%, from $200,000 for 2012 to $230,000 for 2013, effective January 1, 2013.
2013 Corporate Objectives
For the 2013 compensation period, the Compensation Committee continued to utilize three objective performance metrics to determine the payout of the at-risk compensation (i.e., annual bonus and equity awards), with the specific objectives set forth in the table below.
As part of the compensation benchmarking findings, Denver CAB recommended, and the Compensation Committee agreed, that threshold, target and maximum payouts should be established for the bonuses and equity-based awards relative to the market, with the expectation that target awards will be consistent with market performance. The Compensation Committee further believes that the objective metrics utilized to determine the bonus payouts are designed to correlate superior performance with increased shareholder value, and therefore if superior performance is achieved, bonus payments above the peer group median are warranted. Performance levels achieved between the threshold, target and maximum levels will result in proportional payouts.
The 2013 corporate objectives to which the payout of the NEO bonuses are subject, and to which the size of the restricted stock awards are tied, are as follows:
Performance Category For the 12 Months Ended |
| Threshold |
| Target |
| Maximum |
| |||
Adjusted EBITDA(1)(4) |
| $ | 245,483,339 |
| $ | 294,580,007 |
| $ | 331,402,508 |
|
Oil & Gas Sales Volume (BOE)(2) |
| 4,238,552 |
| 5,086,262 |
| 5,722,045 |
| |||
Proved Reserves (BOE)(3) |
| 76,843,526 |
| 92,212,231 |
| 103,738,760 |
| |||
(1) Adjusted EBITDA will have a relative weighting of 25% of the total.
(2) Oil and Gas Sales Volume will have a relative weighting of 37.5% of the total.
(3) Proved Reserves will have a relative weighting of 37.5% of the total.
(4) “Adjusted EBITDA” is a non-GAAP financial measure. For further information regarding this measure, please see our earnings release furnished on a Form 8-K filed on February 28, 2013.
The Compensation Committee selected the foregoing particular measures because they are key indicators of Company performance, are easy to track and are communicated to shareholders on a quarterly basis through the Company’s earnings press release and conference call.
Changes to Annual Incentive Bonuses
The target bonus potential for 2013 remained at 100% of base salary. However, the maximum bonus potential for the CEO was set at 200% of base pay, and the maximum bonus potential for the other NEOs was reduced from the 200% of base pay used in 2012 to 150% of base pay for 2013, in order to better align the incentive potential with market compensation levels. Bifurcating the maximum award levels between the CEO and the other NEOs was common among the Company’s peer group and generally in-line with industry best practices. Of the peer group companies that set short-term incentive award levels as a percentage of base salary (11 of the 17 selected peer companies), all 11 differentiated award levels between the CEO and other NEOs. The differentiation between maximum awards is intended to reflect the increased responsibility of the CEO in impacting the success of Company compared to the other NEOs. The objective is to correlate the potential bonus amounts to peer performance, with a 100% bonus payout approximately equivalent with the peer group median, and a 150%/200% bonus payout equaling an amount significantly above the median to correlate with superior performance. Additionally, for all NEOs, performance at the threshold level will result in an incentive payout equal to approximately 50% of base salary. Performance levels achieved between the threshold, target and maximum levels will result in proportional bonus payouts. A discussion of the specific objectives to which the 2013 bonus payout is subject is set forth above under the heading “2013 Corporate Objectives”.
Structure of Long-Term Equity-Based Incentive Awards
For the 2013 compensation period, the Compensation Committee granted restricted shares as the form of annual equity-based incentive awards granted to NEOs. The vesting schedule established in 2011 was continued with respect to the equity-based awards granted for 2013, in that the vesting of the equity-based awards is no longer solely tied to performance-based conditions. Rather, to the extent that the 2013 corporate objectives are satisfied, only a portion will vest upon the completion of that performance period and the remainder will vest ratably over the following three year period, provided the NEO continues to provide the requisite services to the Company on the scheduled vesting dates.
The Compensation Committee made the following determinations with regard to the value of the 2013 restricted shares to be awarded to each NEO:
· The target award for the CEO would approximate the peer group median.
· With respect to the EVP of Business Development, a downward adjustment to the median was made due to his reduced time commitment to the Company.
· With respect to the CFO, the Compensation Committee determined to target his 2013 restricted shares at approximately the median for CFOs in the peer group.
· As the EVP of Operations and EVP of Exploration had substantial longevity with the Company, the Compensation Committee determined that such NEOs should receive awards slightly above the median for their respective positions.
· Ultimately, the Compensation Committee determined to treat the CFO, EVP of Operations and EVP of Exploration equally for purposes of the 2013 restricted shares.
The Compensation Committee set the target long-term incentive award levels as a dollar value based on market levels of long-term incentive (“LTI”) compensation. For each NEO, the Compensation Committee set the threshold levels as 50% of the NEO’s target award, and the maximum level as 150% of the NEO’s target award. The maximum level was reduced to 150% of the NEO’s target award in order to align the maximum potential award with the peer group 75th percentile for long-term incentive compensation. The actual number of shares of restricted stock underlying the 2013 LTI awards earned by each NEO will be determined by dividing the dollar amount earned by each NEO by the five trading day average closing price of one share of the Company’s common stock, as reported by the NYSE, for the period ending December 14, 2012 ($8.98). Consistent with the foregoing considerations, the Compensation Committee determined that the following number of restricted shares will be earned in the event actual performance achieves the maximum, target or threshold performance levels, respectively:
Name |
| Number of Restricted shares |
| Number of Restricted shares |
| Number of Restricted shares |
|
Lynn A. Peterson |
| 164,327 |
| 328,654 |
| 492,981 |
|
James P. Henderson |
| 55,704 |
| 111,408 |
| 167,112 |
|
James E. Catlin |
| 27,852 |
| 55,704 |
| 83,556 |
|
Russell A. Branting |
| 55,704 |
| 111,408 |
| 167,112 |
|
Russ D. Cunningham |
| 55,704 |
| 111,408 |
| 167,112 |
|
Performance levels achieved in between the threshold, target and maximum levels will result in a proportionate number of restricted shares being earned.
To the extent the restricted shares are earned based upon the Company’s actual performance, the resulting restricted shares will then vest in accordance with the following time-based vesting schedule, provided the NEO continues to provide the requisite services to the Company on the scheduled vesting dates:
· 25% of the earned restricted shares will vest on the date that the Compensation Committee determines the amount of earned RSUs (and in no event later than December 31, 2013); and
· an additional 25% of the earned restricted shares will vest thereafter on each of November 1, 2014, November 1, 2015 and November 1, 2016.
Termination/Change of Control Benefits under Amended Employment Agreements
The Company has entered into employment agreements with each of the NEOs. We provide severance arrangements to the NEOs primarily to motivate the NEO to operate in the best interest of the Company, rather than in a manner potentially self-serving to secure employment. The Company has entered into change-in-control agreements with the NEOs because it believes that the occurrence, or potential occurrence, of a change-in-control transaction would create uncertainty and disruption during a critical time for the Company.
In setting the benefits payable under the amended employment agreements in connection with a change of control or in the event an NEO were to be terminated without cause or resigned for good reason, the Compensation Committee noted that the peer group companies varied widely on these benefits, ranging from 1 times base salary to 3 times the sum of base salary plus bonus. Based on the review of the pay practices of peer companies, the views informally expressed to the Company by institutional advisory firms, and the general desire to avoid a windfall to executives in these events, the Compensation Committee determined that it was reasonable and appropriate to set the termination benefits for the CEO and EVP of Business Development at the levels set forth under the heading “Potential Payments Upon Termination/Change of Control”. With respect to Messrs. Henderson, Branting, and Cunningham, the Compensation Committee determined to establish their respective termination/change of control values at lower levels than that of the other two NEOs, due to the fact that Messrs. Henderson, Branting, and Cunningham have a shorter tenure with the Company than do Mr. Peterson and Mr. Catlin.
Consideration of Say-on-Pay Advisory Vote
At the June 2012 Annual Meeting, approximately 92.6% of votes cast indicated approval of the advisory Say-on-Pay proposal in connection with 2011 NEO compensation. The Compensation Committee believes that the vote outcome is an indication that shareholders generally approve of the structure of executive compensation at the Company and, therefore, the Compensation Committee structured executive compensation for 2012 in a way that is generally consistent with 2011. Unless the Board modifies its policy on the frequency of future “say-on-pay” advisory votes, shareholders will have an opportunity annually to cast an advisory vote in connection with executive compensation.
Perquisites and Other Personal Benefits
The Company provides retirement benefits to all employees, including the NEOs, under the terms of a qualified defined-contribution 401(k) retirement plan. Eligible employees may make voluntary contributions not exceeding statutory limitations to the plan. The Company matches 100% of employee contributions up to 3% of the employee’s salary and 50% of an additional 2% of employee contributions. Employees are vested 100% for all contributions upon participation. Potential retirement benefits do not factor into the Compensation Committee’s annual compensation decision process with respect to the NEOs.
Hedging Prohibitions, Claw-Back Provisions and Stock Ownership Requirements
The Company’s current policy regarding hedging and monetization transactions is embodied in the Company’s insider trading policy, which provides that the Company strongly discourages insiders from engaging in certain forms of hedging or monetization transactions, such as zero-cost collars and forward sale contracts. Any insider wishing to enter into such an arrangement must first pre-clear the proposed transaction with the Company’s compliance officer under its insider trading policy. Any request for pre-clearance of a hedging or similar arrangement must be submitted to the compliance officer at least two weeks prior to the proposed execution of documents evidencing the proposed transaction and must set forth a justification for the proposed transaction
Each of the NEO’s employment agreements provide that, if the Company is required to prepare an accounting restatement due to noncompliance with any financial reporting requirement under United States securities laws, then the Company will have the right to require the NEO to reimburse the Company for (a) any bonus or other incentive-based or equity-based compensation received by the NEO from the Company during the 12-month period following the first public issuance or filing with the SEC (whichever first occurs) of the financial documents embodying such financial reporting requirement, (b) any profits realized from the sale of securities of the Company during such 12-month period and (c) such other incentive-based compensation as may be specified by applicable law, regulation or listing standard.
The Company does not currently have a stock ownership requirement with respect to its directors and officers or any other service providers.
Compensation Committee Report
The Compensation Committee has reviewed and discussed with management the Company’s Compensation Discussion and Analysis included herein. Based on such review and discussions, the Compensation Committee has recommended to the Board of Directors that the Compensation Discussion and Analysis be included in the Company’s Annual Report on Form 10-K for the year ended December 31, 2012 and the Company’s 2013 Proxy Statement.
Submitted by the following members of the Compensation Committee of the Board of Directors:
| Herrick K. Lidstone, Jr., Chairman |
Summary Compensation Table
A summary of the compensation paid to our NEOs with respect to the 2010, 2011 and 2012 fiscal years is set forth below. Additional information on the components of the total compensation package, including a discussion of the proportion of each element to total compensation, is discussed in the Compensation Discussion and Analysis.
Name and Principal |
| Year |
| Salary ($) |
| Bonus ($) |
| Stock Awards |
| Option |
| Non-Equity |
| All Other |
| Total $ |
| |||||||
Lynn A. Peterson(5) |
| 2012 |
| $ | 437,500 |
| $ | — |
| $ | 2,401,440 |
| $ | — |
| $ | 875,000 |
| $ | 10,000 |
| $ | 3,723,940 |
|
President & CEO |
| 2011 |
| 350,000 |
| 105,000 | (6) | 742,500 |
| — |
| 245,000 |
| 9,800 |
| 1,452,300 |
| |||||||
|
| 2010 |
| 350,000 |
| 458,640 |
| — |
| 1,075,240 |
| — |
| 9,800 |
| 1,893,680 |
| |||||||
|
|
|
|
|
|
|
|
|
|
|
|
|
|
|
|
|
| |||||||
James P. Henderson(7) |
| 2012 |
| 275,000 |
| — |
| 1,047,745 |
| — |
| 550,000 |
| 10,000 |
| 1,882,745 |
| |||||||
Chief Financial Officer |
| 2011 |
| 250,000 |
| 75,000 | (6)(8) | 495,000 |
| — |
| 175,000 | (8) | 7,313 |
| 1,002,313 |
| |||||||
|
| 2010 |
| 150,003 |
| 232,200 |
| — |
| 436,794 |
|
|
| 6,000 |
| 824,997 |
| |||||||
|
|
|
|
|
|
|
|
|
|
|
|
|
|
|
|
|
| |||||||
James E. Catlin(5) |
| 2012 |
| 200,000 |
| — |
| 1,466,848 |
| — |
| 400,000 |
| 8,000 |
| 2,074,848 |
| |||||||
Executive Vice |
| 2011 |
| 250,000 |
| 75,000 | (6) | 495,000 |
| — |
| 175,000 |
| 9,800 |
| 1,004,800 |
| |||||||
President — Business Development |
| 2010 |
| 240,000 |
| 346,480 |
| — |
| 645,144 |
| — |
| 9,600 |
| 1,241,224 |
| |||||||
|
|
|
|
|
|
|
|
|
|
|
|
|
|
|
|
|
| |||||||
Russell A. Branting(9) |
| 2012 |
| 275,000 |
| — |
| 1,047,745 |
| — |
| 550,000 |
| 10,000 |
| 1,882,745 |
| |||||||
Executive Vice President of Operations |
| 2011 |
| 250,000 |
| 75,000 | (6)(8) | 336,525 |
| — |
| 175,000 | (8) | 9,800 |
| 846,325 |
| |||||||
|
|
|
|
|
|
|
|
|
|
|
|
|
|
|
|
|
| |||||||
Russ D. Cunningham(9) |
| 2012 |
| 275,000 |
| — |
| 1,047,745 |
| — |
| 550,000 |
| 10,000 |
| 1,882,745 |
| |||||||
Executive Vice President of Exploration |
| 2011 |
| 250,000 |
| 75,000 | (6) | 336,525 |
| — |
| 175,000 |
| 9,795 |
| 846,320 |
| |||||||
(1) See “Potential Payments Upon Termination/Change of Control” for a discussion of the material terms of the NEO’s employment agreement.
(2) These amounts represent the aggregate grant date fair value for stock awards (i.e., restricted stock) and option awards under our 2007 Stock Incentive Plan, as amended, calculated according to ASC 718 based on the closing price of our common stock on the NYSE MKT or NYSE, as then applicable on the grant date. The amounts are consistent with the estimate of aggregate compensation cost to be recognized over the service period for accounting purposes for the awards, excluding the effect of estimated forfeitures, and do not necessarily correspond to the actual value that will be recognized by the NEOs. Assumptions used in the calculation of these amounts for fiscal years ended December 31, 2010, 2011 and 2012 are included in footnote 11 to the Company’s audited financial statements for the fiscal year ended December 31, 2012, included in the
Company’s Annual Report on Form 10-K filed with the SEC on February 28, 2013. See “Compensation Discussion and Analysis” for additional information regarding these awards.
(3) Represents cash bonus awards that were tied to performance-based criteria.
(4) The amounts shown in this column represent the 401(k) matching contributions made by the Company to the NEOs.
(5) All compensation reflected in this table for Lynn Peterson and James Catlin was paid in connection with their respective services as officers and not in connection with their services as directors of the Company. The Company does not pay director compensation to directors who are also employees of the Company.
(6) These amounts represent the portion of the 2011 cash incentive award (i.e., 30% of such award) that was subject to the discretion of the Compensation Committee.
(7) Mr. Henderson re-joined the Company as its Chief Financial Officer on April 1, 2010, after having served previously in such role from May 2007 and until May 2008.
(8) Upon the determination of the Compensation Committee of the amount of the cash bonus awards earned by the NEOs, the each of Messrs. Henderson and Branting elected to receive 50% of his respective 2011 award in the form of shares of the Company common stock. Accordingly, Messrs. Henderson and Branting each received 14,487 shares of common stock in settlement of 50% of their cash incentive award.
(9) On June 15, 2011, Messrs. Branting and Cunningham were promoted to officer level positions in the Company.
2012 Grants of Plan-Based Awards
The following table provides information related to grants of plan-based awards to our NEOs with respect to the 2012 fiscal year.
|
|
|
| Estimated Future |
| Estimated Future |
| Estimated Future |
| Estimated Future |
| Grant Date Fair |
|
Name |
| Grant |
| Target |
| Maximum |
| Target |
| Maximum |
| Awards(5) |
|
Lynn A. Peterson |
| 12/6/2011 |
| 437,500 |
| 875,000 |
| 132,823 |
| 265,646 |
| 2,401,440 |
|
James P. Henderson |
| 12/6/2011 |
| 275,000 |
| 550,000 |
| 57,951 |
| 115,901 |
| 1,047,745 |
|
James E. Catlin |
| 12/6/2011 |
| 200,000 |
| 400,000 |
| 81,131 |
| 162,262 |
| 1,466,848 |
|
Russell A. Branting |
| 12/6/2011 |
| 275,000 |
| 550,000 |
| 57,951 |
| 115,901 |
| 1,047,745 |
|
Russ D. Cunningham |
| 12/6/2011 |
| 275,000 |
| 550,000 |
| 57,951 |
| 115,901 |
| 1,047,745 |
|
(1) Amounts reflect total 2012 cash incentive award potential that is subject to pre-established performance objectives. The Compensation Committee approved the bonus potential in December 2011, although the officers earned the bonuses in 2012.
(2) These awards were subject to the 2012 performance-based measures. In December 2012, the Compensation Committee determined that the maximum values for each applicable performance measure were exceeded. Accordingly, the maximum potential awards were determined to be earned. For more information concerning the foregoing vesting criteria, as well as a description of the specific performance measures to which the awards are subject, see “Compensation Discussion and Analysis”.
(3) These awards relate to NEO compensation for the 2012 fiscal year, which awards were granted in advance of the fiscal year in December 2011 but earned in 2012.
(4) This column represents restricted stock units granted pursuant to the Company’s 2007 Stock Incentive Plan, as amended. These awards were subject to performance-based and time-based vesting criteria. In November 2012, the Compensation Committee determined that the maximum values for each applicable performance measure were exceeded. Accordingly, the maximum potential awards were determined to be earned, and in accordance with the terms of the awards, 25% of the awards
vested in December 2012, and the remaining 75% are subject to time-based vesting over the subsequent three-year period. For more information concerning the foregoing vesting criteria, as well as a description of the specific performance measures to which the awards are subject, see “Compensation Discussion and Analysis”.
(5) These amounts represent the aggregate grant date fair value for stock awards (i.e., restricted stock units) granted in respect of the 2012 fiscal year, calculated according to FASB ASC 718 based on the closing price of our common stock on the NYSE on the grant date. The amounts are consistent with the estimate of aggregate compensation cost to be recognized over the service period for accounting purposes for the awards, excluding the effect of estimated forfeitures.
Outstanding Equity Awards at 2012 Fiscal Year-End
The following table provides information related to the outstanding stock option awards and stock awards held by each of our NEOs at December 31, 2012.
Name |
| Number of |
| Number of |
| Option |
| Option |
| Number Held |
| Market |
| Equity |
| Equity |
|
(a) |
| (b) |
| (c) |
| (e) |
| (f) |
| (g) |
| (h) |
| (i) |
| (j) |
|
Lynn A. Peterson |
|
|
|
|
|
|
|
|
| 37,500 | (2) | 331,875 |
|
|
|
|
|
|
|
|
|
|
|
|
|
|
| 18,750 | (3) | 165,938 |
|
|
|
|
|
|
|
|
|
|
|
|
|
|
| 199,235 | (4) | 1,763,225 |
|
|
|
|
|
|
|
|
|
|
|
|
|
|
|
|
|
|
| 328,654 | (5) | 2,908,588 |
|
|
| 497,448 |
| — |
| 1.18 |
| 5/10/2014 |
|
|
|
|
|
|
|
|
|
|
| 197,946 |
| — |
| 3.50 |
| 4/1/2015 |
|
|
|
|
|
|
|
|
|
|
| 251,931 |
| — |
| 3.48 |
| 6/3/2015 |
|
|
|
|
|
|
|
|
|
|
|
|
|
|
|
|
|
|
|
|
|
|
|
|
|
|
|
James P. Henderson |
|
|
|
|
|
|
|
|
| 25,000 | (2) | 221,250 |
|
|
|
|
|
|
|
|
|
|
|
|
|
|
| 12,500 | (3) | 110,625 |
|
|
|
|
|
|
|
|
|
|
|
|
|
|
| 86,926 | (4) | 769,293 |
|
|
|
|
|
|
|
|
|
|
|
|
|
|
|
|
|
|
| 111,408 | (5) | 985,961 |
|
|
|
|
|
|
|
|
|
|
|
|
|
|
|
|
|
|
|
James E. Catlin |
|
|
|
|
|
|
|
|
| 25,000 | (2) | 221,250 |
|
|
|
|
|
|
|
|
|
|
|
|
|
|
| 12,500 | (3) | 110,625 |
|
|
|
|
|
|
|
|
|
|
|
|
|
|
| 121,697 | (4) | 1,077,014 |
|
|
|
|
|
|
|
|
|
|
|
|
|
|
|
|
|
|
| 55,704 | (5) | 492,980 |
|
|
| 118,767 |
| — |
| 3.50 |
| 4/1/2015 |
|
|
|
|
|
|
|
|
|
|
| 151,159 |
| — |
| 3.48 |
| 6/3/2015 |
|
|
|
|
|
|
|
|
|
|
|
|
|
|
|
|
|
|
|
|
|
|
|
|
|
|
|
Russell A. Branting |
|
|
|
|
|
|
|
|
| 17,500 | (2) | 154,875 |
|
|
|
|
|
|
|
|
|
|
|
|
|
|
| 8,750 | (3) | 77,438 |
|
|
|
|
|
|
|
|
|
|
|
|
|
|
| 86,926 | (4) | 769,293 |
|
|
|
|
|
|
|
|
|
|
|
|
|
|
|
|
|
|
| 111,408 | (5) | 985,961 |
|
|
| 100,000 |
| — |
| 0.36 |
| 12/29/2018 |
|
|
|
|
|
|
|
|
|
|
| 125,000 |
| — |
| 2.20 |
| 3/13/2018 |
|
|
|
|
|
|
|
|
|
|
| 26,830 |
| 34,000 | (6) | 2.30 |
| 1/4/2020 |
|
|
|
|
|
|
|
|
|
|
| 80,000 |
| — |
| 6.26 |
| 5/24/2017 |
|
|
|
|
|
|
|
|
|
|
|
|
|
|
|
|
|
|
|
|
|
|
|
|
|
|
|
Russ D. Cunningham |
|
|
|
|
|
|
|
|
| 17,500 | (2) | 154,875 |
|
|
|
|
|
|
|
|
|
|
|
|
|
|
| 8,750 | (3) | 77,438 |
|
|
|
|
|
|
|
|
|
|
|
|
|
|
| 86,926 | (4) | 769,293 |
|
|
|
|
|
|
|
|
|
|
|
|
|
|
|
|
|
|
| 111,408 | (5) | 985,961 |
|
|
| 22,000 |
| 34,000 | (6) | 2.30 |
| 1/4/2020 |
|
|
|
|
|
|
|
|
|
|
| 21,000 |
| — |
| 3.04 |
| 10/15/2017 |
|
|
|
|
|
|
|
|
|
|
| 60,000 |
| — |
| 3.16 |
| 5/1/2018 |
|
|
|
|
|
|
|
|
|
(1) The dollar amounts shown in this column are determined by multiplying the number of equity awards by $8.85 (the closing price of our common stock as reported by the NYSE on the last trading day of fiscal 2012).
(2) These awards, consisting of the unvested portion of the 2011 performance-based RSUs, vest pursuant to the 2011 time-based vesting criteria, with ½ of such remaining unvested RSUs to vest on each of November 15, 2013 and November 15, 2014.
(3) These awards, consisting of the unvested portion of the 2011 performance-based PAs vest pursuant to the 2011 time-based vesting criteria, with ½ of such remaining unvested RSUs to vest on each of November 15, 2013 and November 15, 2014.
(4) These awards, consisting of the unvested portion of the 2012 performance-based restricted stock, are scheduled to vest pursuant to the 2012 time-based vesting criteria, with 1/3 to vest on each of November 15, 2013, November 15, 2014 and November 15, 2015. See “Compensation Discussion and Analysis” for a further discussion of these awards.
(5) These awards, consisting of the 2013 restricted stock awards, are subject to the 2013 performance-based and time-based vesting criteria, with up to 25% of the earned RSUs vesting on the date that the Compensation Committee determines the amount of the award that is earned based upon the results of the performance criteria, which shall in no event be later than December 31, 2013, and up to an additional 25% of the earned RSUs to vest thereafter on each of November 1, 2014, November 1, 2015 and November 1, 2016. The amounts assume the target level of performance is achieved. See “Compensation Discussion and Analysis “ for a further discussion of these awards, including the specific performance criteria to which they are subject and the possible range of potential awards (including the maximum and threshold levels not reflected in the table).
(6) These stock options vested on January 4, 2013.
2012 Option Exercises And Stock Vested
The following table provides information regarding stock that vested and stock options that were exercised by our NEOs during 2012. Option award value realized is calculated by subtracting the aggregate exercise price of the options exercised from the aggregate market value of the shares of common stock acquired on the date of exercise. Stock award value is calculated by multiplying the number of stock awards vested by the market value of the underlying shares on the vesting date.
|
| Option Awards |
| Stock Awards |
| ||||
Name |
| Number of |
| Value |
| Number of Vesting (#) |
| Value Realized on |
|
Lynn A. Peterson |
| — |
| — |
| 85,162 |
| 745,996 |
|
James P. Henderson (1) |
| 179,950 |
| 933,941 |
| 41,475 |
| 361,929 |
|
James E. Catlin |
| 298,469 |
| 2,292,318 |
| 53,066 |
| 464,509 |
|
Russell A. Branting (2) |
| 229,170 |
| 697,013 |
| 37,725 |
| 330,279 |
|
Russ D. Cunningham |
| 171,000 |
| 1,272,270 |
| 37,725 |
| 330,279 |
|
(1) The amounts reflected in the table are not the actual amounts received by Mr. Henderson. The options were exercised pursuant to a net exercise, by which a portion of the shares acquired on exercise were withheld by the Company to pay for the taxes and exercise price associated with such exercise. Therefore, upon exercise, Mr. Henderson actually received 62,741 shares having a value of $545,219.
(2) The amounts reflected in the table are not the actual amounts received by Dr. Branting. A portion of the options were exercised pursuant to a net exercise, by which a portion of those shares acquired on exercise were withheld by the Company to pay for the taxes and exercise price associated with such exercise. Upon exercise, Dr. Branting received 17,080 shares having a value of $146,034.
Potential Payments Upon Termination/Change of Control
Effective January 1, 2012, we entered into new employment agreements with each of our NEOs, and effective January 1, 2013, the Compensation Committee, in connection with its annual review of NEO compensation, approved amendments to the change of control provisions of these agreements, as discussed below. A summary of the termination and change of control benefits under these agreements follows.
A. Termination for Cause/Good Reason
In the event of a termination without “cause,” or in the event an NEO resigns for “good reason,” the Company must pay severance compensation to Messrs. Peterson, Catlin and Henderson in an amount equal to 18 months of his then-current respective base salary, and must pay Messrs. Branting and Cunningham an amount equal to 6 months of his then-current respective base salary. In such event, all unvested incentive compensation previously granted to the NEO will immediately terminate, subject only to the provisions of any applicable award agreement relating to post-termination exercise of stock options.
“Cause” will be determined in the sole discretion of the Company, or in certain cases, the Compensation Committee, and means that the NEO: (i) has materially failed or refused to satisfactorily perform his assigned duties and job responsibilities, (ii) has willfully engaged in conduct that he knew or should have known would be materially injurious to the Company, (iii) has committed an act of fraud, embezzlement or a willful and material breach of a fiduciary duty to the Company, (iv) has breached certain provisions of his employment agreement, (v) has been convicted of (or pleaded no contest to) any crime that (A) is a felony, (B) involves fraud or dishonesty or (C) impugns the character or reputation of the NEO or the Company, or (vi) has violated or caused the Company to violate any law that is harmful to the business reputation of the Company.
The following conditions will constitute “good reason”: (i) the Company’s material breach of the employment agreement or any other material written agreement between the NEO and the Company; (ii) the assignment to the NEO (without the NEO’s consent) of any duties that are substantially inconsistent with or materially diminish the NEO’s position, (iii) a requirement that the NEO (without the NEO’s consent) be based at any office or location more than 50 miles from the NEO’s primary work location immediately prior to a “change of control”, not including reasonable travel by the NEO consistent with the travel obligations of similar executives holding similar positions with similar responsibilities; or (iv) the NEO’s refusal to renew his employment agreement at the time it would otherwise expire, provided that at such time the NEO was willing to renew the employment agreement and was able to continue providing services.
B. Termination on Account of Death or Disability
Upon any termination of the NEO’s employment on account of death or “disability” (as defined in the employment agreements), the Company must pay Messrs. Peterson, Catlin and Henderson an amount equal to 18 months of his then-current respective base salary, and must pay Messrs. Branting and Cunningham an amount equal to 6 months of his then-current respective base salary. Further, each NEO’s outstanding stock options and restricted stock will immediately become fully vested and no longer subject to any restrictions on ownership or exercise. With respect to other forms of incentive compensation, including, but not limited to, restricted stock units and performance awards, the terms of the applicable award agreement will govern vesting. With respect to unvested incentive compensation not granted under an equity-based plan, the Company, or in certain cases, the Compensation Committee, shall, subject to certain limitations, determine whether to vest or provide any payment or compensation on account thereof.
C. Change of Control Benefits
The agreements that were effective through December 31, 2012 provided that, if, within 12 months following a “change of control”, any of Messrs. Peterson, Catlin or Henderson is terminated or if he resigns for “good reason,” the Company would be obligated to pay the respective NEO a lump sum payment equal to his then-current base salary for a period of 24 months plus an amount equal to the greater of his most recent annual cash bonus or the average cash bonus paid to him under his current employment agreement and prior employment agreements. Effective January 1, 2013, Mr. Peterson’s and Mr. Catlin’s agreements were amended to increase the base salary portion of such payment to an amount equal to his then-current base salary for a period of 30 months.
With respect to Messrs. Branting and Cunningham, their agreements that were effective through December 31, 2012 provided that, if, within 12 months following a “change of control”, either were to be terminated or if he were to resign for “good reason,” the Company would be obligated to pay the respective NEO a lump sum payment equal to his then-current base salary for a period of 6 months plus an amount equal to the greater of his most recent annual cash bonus or the average cash bonus paid to him under his current employment agreement and prior employment agreements. Effective January 1, 2013, Mr. Branting’s and Mr. Cunningham’s agreements were amended to increase the base salary portion of such payment to an amount equal to his then-current base salary for a period of 24 months.
Immediately upon the occurrence of a “change of control,” all of the NEOs’ equity-based incentive compensation will immediately vest irrespective of whether his employment continues or is terminated, subject to limitations, if any, arising from Section 409A of the Code.
In addition, effective January 1, 2013, each NEO’s employment agreement was amended to provide limited health insurance benefits in connection with a termination upon a “change of control”. Specifically, in the event the NEO elects continuance of applicable group health insurance within the provisions of the Consolidated Omnibus Budget Reconciliation Act of 1985, as amended (“COBRA”), and state law on a timely basis, and makes the premium payments therefore, the Company (or the applicable successor or surviving entity in the “change of control”) must reimburse the NEO for such premiums for the NEO and his immediate family and/or eligible dependents for a period of 24 months after such termination date.
A “change of control” means any of the following:
(i) Any “person” (as such term is used in Sections 13(d) and 14(d) of the Exchange Act”) becomes the “beneficial owner” (as defined in Rule 13d-3 under the Exchange Act), directly or indirectly, of securities of Company representing more than 50% of the total voting power represented by Company’s then outstanding voting securities;
(ii) A merger or consolidation of Company whether or not approved by the Board, other than a merger or consolidation that would result in the voting securities of Company outstanding immediately prior thereto continuing to represent (either by remaining outstanding or by being converted or into voting securities of the surviving entity) at least 50% of the total voting power represented by the voting securities of Company or such surviving entity (or the parent of any such surviving entity) outstanding immediately after such merger or consolidation, or a change in the ownership of all or substantially all of Company’s assets to a person not related (within the meaning of income tax Regulations Section 1.409A-3(i)(5)(vii)(b)) to the Company; or
(iii) The replacement during any 12-month period of a majority of the members of the Board with directors whose appointment or election was not endorsed by a majority of the members before the date of the appointment or election.
All such termination benefits (except in the case of death of NEO) are subject to the timely execution and delivery of a release agreement in favor of employer, the Company and their respective affiliates. The Compensation Committee evaluated these termination/change of control benefits relative to its 2012 peer group and determined them to be consistent with market practices.
Potential Cost of Termination Payments in the Event of Termination
Name |
| Termination without |
| Termination for death or |
| No termination after |
| Termination after |
| Termination after |
| |
|
| ($) |
| ($) |
| ($) |
| ($) |
| ($) |
| |
|
|
|
|
|
|
|
|
|
|
|
| |
Lynn Peterson |
|
|
|
|
|
|
|
|
|
|
| |
Salary |
| 656,250 |
| 656,250 |
| — |
| 875,000 |
| 1,093,750 |
| |
Bonus payout |
| — |
| — |
| — |
| 875,000 |
| 875,000 |
| |
Medical benefit continuation |
| — |
| — |
| — |
| — |
| — | (2) | |
Equity acceleration |
| — |
| 4,442,479 |
| 6,623,920 |
| 6,623,920 |
| 6,623,920 |
| |
Life insurance |
| — |
| — |
| — |
| — |
| — |
| |
Total |
| 656,250 |
| 5,098,729 |
| 6,623,920 |
| 8,373,920 |
| 8,592,670 |
| |
|
|
|
|
|
|
|
|
|
|
|
| |
James Catlin |
|
|
|
|
|
|
|
|
|
|
| |
Salary |
| 300,000 |
| 300,000 |
| — |
| 400,000 |
| 500,000 |
| |
Bonus payout |
| — |
| — |
| — |
| 400,000 |
| 400,000 |
| |
Medical benefit continuation |
| — |
| — |
| — |
| — |
| 28,632 | (2) | |
Equity acceleration |
| — |
| 1,778,624 |
| 2,148,360 |
| 2,148,360 |
| 2,148,360 |
| |
Life insurance |
| — |
| — |
| — |
| — |
| — |
| |
Total |
| 300,000 |
| 2,078,624 |
| 2,148,360 |
| 2,948,360 |
| 3,076,992 |
| |
|
|
|
|
|
|
|
|
|
|
|
| |
James Henderson |
|
|
|
|
|
|
|
|
|
|
| |
Salary |
| 412,500 |
| 412,500 |
| — |
| 550,000 |
| 550,000 |
| |
Bonus payout |
| — |
| — |
| — |
| 550,000 |
| 550,000 |
| |
Medical benefit continuation |
| — |
| — |
| — |
| — |
| — | (2) | |
Equity acceleration |
| — |
| 1,840,638 |
| 2,580,109 |
| 2,580,109 |
| 2,580,109 |
| |
Life insurance |
| — |
| — |
| — |
| — |
| — |
| |
Total |
| 412,500 |
| 2,253,138 |
| 2,580,109 |
| 3,680,109 |
| 3,680,109 |
| |
|
|
|
|
|
|
|
|
|
|
|
| |
Russell Branting |
|
|
|
|
|
|
|
|
|
|
| |
Salary |
| 137,500 |
| 137,500 |
| — |
| 412,500 |
| 550,000 |
| |
Bonus payout |
| — |
| — |
| — |
| 550,000 |
| 550,000 |
| |
Medical benefit continuation |
| — |
| — |
| — |
| — |
|
| 40,920 | (2) |
Equity acceleration |
| — |
| 1,963,776 |
| 2,703,247 |
| 2,703,247 |
| 2,703,247 |
| |
Life insurance |
| — |
| — |
| — |
| — |
| — |
| |
Total |
| 137,500 |
| 2,101,276 |
| 2,703,247 |
| 3,665,747 |
| 3,844,167 |
| |
|
|
|
|
|
|
|
|
|
|
|
| |
Russ Cunningham |
|
|
|
|
|
|
|
|
|
|
| |
Salary |
| 137,500 |
| 137,500 |
| — |
| 412,500 |
| 550,000 |
| |
Bonus payout |
| — |
| — |
| — |
| 550,000 |
| 550,000 |
| |
Medical benefit continuation |
| — |
| — |
| — |
| — |
| 39,180 | (2) | |
Equity acceleration |
| — |
| 1,963,776 |
| 2,703,247 |
| 2,703,247 |
| 2,703,247 |
| |
Life insurance |
| — |
| — |
| — |
| — |
| — |
| |
Total |
| 137,500 |
| 2,101,276 |
| 2,703,247 |
| 3,665,747 |
| 3,842,427 |
| |
(1) This column is being provided on a supplemental basis to show the effect of the NEO employment agreement amendments that came into effect January 1, 2013. Pursuant to such amendments, the Company agreed to increase the salary portion of the benefits payable to the following NEOs in connection with a termination following a “change of control”, as follows:
Officer |
| Former Salary Portion of |
| Revised Salary Portion of |
|
Mr. Peterson |
| 24 months |
| 30 months |
|
Mr. Catlin |
| 24 months |
| 30 months |
|
Mr. Branting |
| 6 months |
| 24 months |
|
Mr. Cunningham |
| 6 months |
| 24 months |
|
The Company also agreed to amend each NEO’s employment agreement to provide for limited health insurance related benefits in connection with a termination following a “change of control”.
(2) These amounts reflect the value to be realized by the NEO with respect to 24 months of health care coverage for the NEO and his immediate family and/or eligible dependents in the event that, following a termination, the NEO were to properly elect continuance of applicable group health insurance within the provisions of the Consolidated Omnibus Budget Reconciliation Act of 1985, as amended and state law. This benefit is only available to NEOs who, as of the applicable termination date, are then enrolled in the Company’s health insurance program. As of December 31, 2012, Messrs. Peterson and Henderson were not enrolled in the Company’s health insurance program, and thus, had they been terminated as of December 31, 2012, they would not have been eligible for such benefits.
Risk Assessment Regarding Compensation Policies and Practices
The Compensation Committee has reviewed its compensation programs for executives and for non-executives and believes that compensation is structured in a way that does not create risks that would be reasonably likely to have a material, adverse effect on the Company. The Compensation Committee believes it has designed the overall compensation program in such a way as to deter excessive risk taking, to encourage executives to focus on the long-term success of the Company and to align the interests of executives with those of shareholders by:
· encompassing several different financial and operational goals;
· incorporating short-term and long-term performance periods of varying lengths;
· capping short-term bonus incentives;
· scaling compensation to industry; and
· considering internal equity among Company executives.
Report On Repricing Of Options
The Company did not reprice any stock options during the fiscal years ended December 31, 2011 or 2012.
Compensation Committee Interlocks and Insider Participation
There were no compensation committee or board interlocks among the members of our Board during 2012.
DIRECTOR COMPENSATION
Our Compensation Committee charter provides that the Compensation Committee is to recommend to the Board of Directors matters related to director compensation. The 2012 director compensation package for non-employee directors consisted of annual cash compensation and equity-based awards in the form of shares of restricted stock and cash awards, each under the 2007 Stock Incentive Plan, as amended. The value of the cash awards was based on the closing price of one share of the Company’s common stock on the vesting date.
Directors who also chair a committee receive additional cash compensation for their service as a chairperson. For the 2012 fiscal year, Herrick Lidstone, Jr. and William Krysiak received additional cash compensation for his role as chairperson of the Compensation Committee and chairperson of the Audit Committee, respectively. No additional compensation was paid to any director for attending meetings. No employee of the Company is entitled to compensation for service as a director.
The following table provides information related to the compensation of our non-employee directors during fiscal year 2012.
Name |
| Fees Earned or |
| Stock |
| Total |
|
Rodney D. Knutson |
| 41,000 |
| 98,700 |
| 139,700 |
|
William J. Krysiak |
| 46,000 |
| 98,700 |
| 144,700 |
|
Herrick K. Lidstone |
| 46,000 |
| 98,700 |
| 144,700 |
|
(1) Each director received $36,000 in cash compensation for his service as a board member. In addition, the chairman of the Audit Committee, Mr. Krysiak, and the chairman of the Compensation Committee, Mr. Lidstone, each received an additional aggregate amount of $10,000. For 2012, the compensation for the chairman of our newly formed Nominating and Corporate Governance Committee was set at $10,000. In July 2012, Mr. Knutson was appointed to serve as the chairman of the Nominating and Corporate Governance Committee and thus received the prorated amount of $5,000 for his service in that position for a partial year.
(2) The amounts shown in this column represent 10,000 shares of restricted stock subject to our 2007 Stock Incentive Plan, as amended, granted to each director, and reflect the aggregate grant date fair value of the awards granted with respect to the 2012 fiscal year in accordance with the Financial Accounting Standards Board (“FASB”) Accounting Standards Codification Topic 718 for stock-based compensation. These amounts do not necessarily correspond to the actual cash value that will be recognized by the directors when received. Assumptions used in the calculation of this amount are included in footnote 11 to the Company’s audited financial statements for the fiscal year ended December 31, 2012, included in the Company’s Annual Report on Form 10-K filed with the SEC on February 28, 2013.
(3) As of December 31, 2012, the directors had (i) the following number of stock options outstanding: Mr. Knutson: 175,000; Mr. Lidstone 75,000; and Mr. Krysiak: 100,000; and (ii) the following number of shares of restricted stock outstanding: Mr. Knutson: 10,000; Mr. Lidstone 10,000; and Mr. Krysiak: 10,000. The foregoing outstanding restricted stock awards contain a “change of control” provision, which generally provides that, in the event of a qualified “change of control” (as defined in the applicable agreement), any unvested shares will vest irrespective of whether the director’s service to the Company continues or is terminated.
ITEM 12. SECURITY OWNERSHIP OF CERTAIN BENEFICIAL OWNERS AND MANAGEMENT AND RELATED STOCKHOLDER MATTERS
The following table sets forth certain information regarding the beneficial ownership of shares of our common stock as of April 15, 2013 by:
· our NEOs;
· our directors and nominees;
· all of our executive officers and directors as a group; and
· each person who is known by us to beneficially own more than 5% of our issued and outstanding shares of common stock.
Unless otherwise indicated, the shareholders listed possess sole voting and investment power with respect to the shares shown. Our directors and executive officers do not have different voting rights from other shareholders.
Name |
| Business Address |
| Amount and |
| Percentage of |
|
Lynn A. Peterson |
| 1625 Broadway, Suite 250, Denver, Colorado 80202 |
| 4,185,808 | (2) | 1.6 | % |
James E. Catlin |
| 1625 Broadway, Suite 250, Denver, Colorado 80202 |
| 1,970,642 | (3) | * |
|
James P. Henderson |
| 1625 Broadway, Suite 250, Denver, Colorado 80202 |
| 197,653 |
| * |
|
Russell A. Branting |
| 1625 Broadway, Suite 250, Denver, Colorado 80202 |
| 484,623 | (4) | * |
|
Russ D. Cunningham |
| 1625 Broadway, Suite 250, Denver, Colorado 80202 |
| 203,476 | (5) | * |
|
Rodney D. Knutson |
| 1625 Broadway, Suite 250, Denver, Colorado 80202 |
| 239,058 | (6) | * |
|
William J. Krysiak |
| 1625 Broadway, Suite 220, Denver, Colorado 80202 |
| 110,000 | (7) | * |
|
Herrick K. Lidstone, Jr. |
| 6400 South Fiddler’s Green Circle, Suite 1000, Greenwood Village, Colorado 80111 |
| 85,000 | (8) | * |
|
All directors and executive officers as a group (eight individuals) |
|
|
| 7,476,260 |
| 2.8 | % |
BlackRock Inc. |
| 40 East 52nd Street New York, New York 10022 |
| 17,797,282 |
| 6.7 | %(9) |
Citadel LLC |
| 131 S. Dearborn Street, 32nd Floor Chicago, Illinois 60603 |
| 13,590,463 |
| 5.1 | %(10) |
The Vanguard Group |
| 100 Vanguard Boulevard Malvern, Pennsylvania 19355 |
| 14,733,158 |
| 5.6 | %(11) |
* Less than 1%.
(1) Based on 265,403,865 shares outstanding as of April 15, 2013, plus any shares of common stock deemed to be beneficially owned pursuant to options and warrants that are exercisable within 60 days from the above date.
(2) Includes 2,738,483 shares held directly by the individual, 500,000 shares held by individual’s spouse, and 947,325 options exercisable within 60 days of April 15, 2013.
(3) Includes 1,400,716 shares held by the individual, 300,000 shares held by the individual’s wife, and 269,926 options exercisable within 60 days of April 15, 2013.
(4) Includes 365,830 options exercisable within 60 days of April 15, 2013.
(5) Includes 137,000 options exercisable within 60 days of April 15, 2013.
(6) Includes 175,000 options exercisable within 60 days of April��15, 2013.
(7) Includes 100,000 options exercisable within 60 days of April 15, 2013.
(8) Includes 75,000 options exercisable within 60 days of April 15, 2013.
(9) This information is based solely on a Schedule 13G filed with the SEC on February 5, 2013.
(10) This information is based solely on a Schedule 13G filed with the SEC on February 14, 2013.
(11) This information is based solely on a Schedule 13G filed with the SEC on February 13, 2013.
We have no knowledge of any other arrangements, including any pledge by any person of our securities, the operation of which may at a subsequent date result in a change of control of our company.
Equity Compensation Plan Information as of December 31, 2012
|
|
|
|
|
| (c) |
| |
Plan Category |
| (a) |
| (b) |
| Number of securities |
| |
Equity compensation plans approved by security holders |
| 7,605,532 | (1) | $ | 4.83 | (2) | 22,715,143 | (3) |
Equity compensation plans not approved by security holders |
| N/A |
| N/A |
| N/A |
| |
Total |
| 7,605,532 |
| $ | 4.83 |
| 22,715,143 |
|
(1) This number reflects 5,705,951 shares issuable upon the exercise of outstanding stock options, 1,829,581 shares issuable upon the vesting of RSUs or restricted stock awards and 70,000 shares issuable upon the vesting of PAs. The PAs are payable in cash or, in the Nominating and Corporate Governance Committee’s discretion, shares of the Company’s common stock.
(2) The restricted stock, RSUs and PAs do not have an exercise price; accordingly, the weighted average exercise price in this column only reflects the exercise price of the stock options.
(3) This number is based on an aggregate of 36,118,238 million shares of the Company’s common stock authorized for issuance under the 2007 Stock Incentive Plan as of December 31, 2010, as amended. Pursuant to Amendment No. 1 to the 2007 Stock Incentive Plan, adopted by the Company’s shareholders of June 3, 2010, beginning on January 1, 2011, the aggregate number of shares authorized for issuance under the 2007 Stock Incentive Plan, as amended, shall be adjusted to equal 14% of the Company’s issued and outstanding shares of common stock, calculated as of January 1 of the respective year. Such shares included within the 2007 Stock Incentive Plan may be either authorized but unissued shares or shares re-acquired and held in treasury.
ITEM 13. CERTAIN RELATIONSHIPS AND RELATED TRANSACTIONS, AND DIRECTOR INDEPENDENCE
Certain Relationships and Related Transactions
In accordance with our Audit Committee Charter, our Audit Committee is responsible for reviewing, approving and overseeing all related party transactions. Our Code of Business Conduct and Ethics sets forth our written policy regarding related party transactions. Specifically, our Code of Business Conduct and Ethics provides that our directors, officers and employees should not be involved in any activity that creates or gives the appearance of a conflict of interest between their personal interests and the interests of the Company. In particular, our Code of Business Conduct states that, without the specific permission of our Board of Directors (including contracts approved by our Board of Directors), no director, officer or employee, or a member of his or her family shall:
· be a consultant to, or a director, officer or employee of, or otherwise operate an outside business that:
· is in competition with our current or potential business goals and objectives;
· supplies products or services to the Company; or
· has any financial interest, including significant stock ownership, in any entity with which we do business that might create or give the appearance of a conflict of interest;
· seek or accept any personal loan or services from any entity with which we do business, except from financial institutions or service providers offering similar loans or services to third parties under similar terms in the ordinary course of their respective businesses;
· be a consultant to, or a director, officer or employee of, or otherwise operate, an outside business if the demands of the outside business would interfere with the director’s, officer’s or employee’s responsibilities to us;
· accept any personal loan or guarantee of obligations from the Company, except to the extent such arrangements are legally permissible; or
· conduct business on behalf of the Company with immediate family members, which include spouses, children, parents, siblings and persons sharing the same home whether or not legal relatives.
Directors, officers, and employees must immediately notify the Chair of our Audit Committee of the existence of any actual or potential conflict of interest. The circumstances will be reviewed for a decision on whether a conflict of interest is present, and if so, what course of action is to be taken. The Company had no reportable related party transactions during 2012. Further, during 2012, the Company had no transactions where the policies and procedures summarized above did not require review, approval, or ratification, or where such policies and procedures were not followed.
Independence of Directors
The Board of Directors has determined that the following directors qualify as independent under the applicable standards of the New York Stock Exchange, SEC rules and the Multilateral Instrument 52-110 (“MI 52-110”): Rodney D. Knutson, Herrick K. Lidstone, Jr. and William J. Krysiak. The Board has also determined that Messrs. Knutson, Lidstone and Krysiak, as members of the Audit and Compensation Committees, qualify as independent under the New York Stock Exchange and SEC rules applicable to audit and compensation committee members.
ITEM 14. PRINCIPAL ACCOUNTANT FEES AND SERVICES
Fees Billed by Independent Auditors
We paid the following fees to Ernst & Young LLP for the audit of the consolidated financial statements and for other services provided in the years ended December 31, 2012, and 2011. All services and fees, including tax service fees, were pre-approved by the Audit Committee.
Financial Year Ending |
| Audit Fees $ |
| Audit |
| Tax Fees $ |
| All Other |
| Total $ |
|
December 31, 2012 |
| 581,983 |
| — |
| 71,013 |
| — |
| 652,996 |
|
December 31, 2011 |
| 576,373 |
| 78,046 |
| 98,565 |
| — |
| 752,984 |
|
Pre-Approval Policies and Procedures
The Audit Committee Charter provides that the Audit Committee is responsible for the appointment, compensation, retention and oversight of the independent public accountants, and pre-approves all audit services and permissible non-audit services to be provided to the Company by the independent public accountants. The Audit Committee may, in its discretion, delegate the authority to pre-approve all audit services and permissible non-audit services to the Chairman of the Audit Committee provided the Chairman reports any delegated pre-approvals to the Audit Committee at the next meeting thereof. The Audit Committee has not, however, adopted any specific policies and procedures for the engagement of non-audit services. For 2011 and 2012, all of the services related to amounts billed by the Company’s external accountants were pre-approved by the Audit Committee.
Report on Audited Financial Statements
The Audit Committee reviewed and discussed with management and the Company’s independent auditors the audited consolidated financial statements included in the Company’s Annual Report on Form 10-K for the year ended December 31, 2012. The Audit Committee has discussed with the independent registered public accountants matters required to be discussed by Statement on Auditing Standards No. 61 (Communication with Audit Committees), as amended (AICPA, Professional Standards, Vol.1, AU Section 380) as adopted by the Public Company Accounting Oversight Board Rule 3200T. As part of that review, the Committee received the written disclosures and the letter required by applicable requirements of the Public Company Accounting Oversight Board regarding the independent accountant’s communications with the Audit Committee concerning independence, and the Committee has discussed the independent registered public accounting firm’s independence from the Company and its management, including any matters in those written disclosures. Additionally, the Audit Committee considered whether the provision of non-audit services was compatible with maintaining such accountants’ independence. Based on the review and discussions, the Audit Committee recommended to the Board that the audited financial statements be included in the Annual Report on Form 10-K for the year ended December 31, 2012, for filing with the SEC.
| Audit Committee of the Board |
ITEM 15. EXHIBITS AND FINANCIAL STATEMENT SCHEDULES
(b) Exhibits
Exhibit |
| Description |
2.1 |
| Asset Purchase Agreement, entered into October 19, 2010, by and among Peak Grasslands, LLC, Kodiak Oil & Gas (USA) Inc., and Kodiak Oil & Gas Corp. (filed as Exhibit 2.1 to the registrant’s Current Report on Form 8-K filed on October 25, 2010 and incorporated herein by reference) |
2.2 |
| Purchase and Sale Agreement among Ursa Resources Group LLC, Kodiak Oil & Gas (USA) Inc. and Kodiak Oil & Gas Corp. dated May 20, 2011 (filed as Exhibit 2.1 to the registrant’s Current Report on Form 8-K/A filed on June 29, 2011 and incorporated herein by reference) |
2.3 |
| Purchase and Sale Agreement between BTA Oil Producers LLC, and Kodiak Oil & Gas (USA) Inc. dated September 27, 2011 (filed as Exhibit 2.1 to the registrant’s Quarterly Report on Form 10-Q filed on November 3, 2011 and incorporated herein by reference) |
2.4 |
| Purchase and Sale Agreement by and among North Plains Energy, LLC (Seller), Kodiak Oil & Gas (USA) Inc. (Buyer) and Kodiak Oil & Gas Corp. (Parent), dated as of November 14, 2011 (filed as Exhibit 2.1 to the registrant’s Current Report on Form 8-K/A filed on November 17, 2011 and incorporated herein by reference) |
2.5 |
| Purchase and Sale Agreement by and among Mercuria Bakken, LLC (Seller), Kodiak Oil & Gas (USA) Inc. (Buyer) and Kodiak Oil & Gas Corp. (Parent), dated as of November 14, 2011 (filed as Exhibit 2.2 to the registrant’s Current Report on Form 8-K/A filed on November 17, 2011 and incorporated herein by reference) |
3.1 |
| Certificate of Continuance of Kodiak Oil & Gas Corp., dated September 20, 2001 (filed as Exhibit 1.1 to the registrant’s Registration Statement on Form 20-F filed on November 23, 2005 and incorporated herein by reference) |
3.2 |
| Articles of Continuation of Kodiak Oil & Gas Corp. (filed as Exhibit 1.2 to the registrant’s Registration Statement on Form 20-F filed on November 23, 2005 and incorporated herein by reference) |
3.3 |
| Amended and Restated By-Law No. 1 of the Company (filed as Exhibit 3.3 to the registrant’s Quarterly Report on Form 10-Q filed on May 9, 2008 and incorporated herein by reference) |
3.4 |
| Articles of Incorporation of Kodiak Oil and Gas (USA) Inc. (filed as Exhibit 3.3 to the registrant’s Registration Statement on Form S-3 (Registration No. 333-169517) filed on September 22, 2010 and incorporated herein by reference) |
4.1 |
| Form of common stock certificate (filed as Exhibit 4.6 to the registrant’s Registration Statement on Form S-3ASR (Registration No. 333-173520) filed on April 15, 2011 and incorporated herein by reference) |
4.2 |
| Form of senior indenture between Kodiak Oil & Gas Corp. and one or more trustees to be named (filed as Exhibit 4.7 to the registrant’s Registration Statement on Form S-3ASR (Registration No. 333-173520) filed on April 15, 2011 and incorporated herein by reference) |
4.3 |
| Form of subordinated indenture between Kodiak Oil & Gas Corp. and one or more trustees to be named (filed as Exhibit 4.8 to the registrant’s Registration Statement on Form S-3ASR (Registration No. 333-173520) filed on April 15, 2011 and incorporated herein by reference) |
4.4 |
| Indenture, dated November 23, 2011, among Kodiak Oil & Gas Corp., Kodiak Oil & Gas (USA) Inc., U.S. Bank National Association and Computershare Trust Company of Canada (filed as Exhibit 4.2 to the registrant’s Current Report on Form 8-K filed on November 23, 2011 and incorporated herein by reference) |
4.5 |
| Indenture, dated January 15, 2013, among Kodiak Oil & Gas Corp., Kodiak Oil & Gas (USA) Inc., U.S. Bank, National Association, as trustee, and Computershare Trust Company of Canada, as the Canadian trustee (filed as Exhibit 4.2 to the registrant’s Current Report on Form 8-K filed on January 15, 2013 and incorporated herein by reference) |
4.6 |
| Registration Rights Agreement, dated November 23, 2011, among Kodiak Oil & Gas Corp., Kodiak Oil & Gas (USA) Inc., Credit Suisse Securities (USA) LLC, Wells Fargo Securities, LLC, KeyBanc Capital Markets Inc. and RBC Capital Markets, LLC (filed as Exhibit 4.1 to the registrant’s Current Report on Form 8-K filed on November 23, 2011 and incorporated herein by reference) |
4.7 |
| Registration Rights Agreement, dated May 17, 2012, among Kodiak Oil & Gas Corp., Kodiak Oil & Gas (USA) Inc., RBC Capital Markets, LLC, Wells Fargo Securities, LLC, and Credit Suisse Securities (USA) LLC (filed as Exhibit 4.1 to the registrant’s Current Report on Form 8-K filed on May 17, 2012 and incorporated herein by reference) |
4.8 |
| Registration Rights Agreement, dated January 15, 2013, among Kodiak Oil & Gas Corp., Kodiak Oil & Gas (USA) Inc., Wells Fargo Securities, LLC, RBC Capital Markets, LLC and Credit Suisse Securities (USA) LLC (filed as Exhibit 4.1 to the registrant’s Current Report on Form 8-K filed on January 15, 2013 and incorporated herein by reference) |
4.9 |
| Officers’ Certificate of the Company dated as of May 17, 2012 (filed as Exhibit 4.2 to the registrant’s Current Report on Form 8-K filed on May 17, 2012 and incorporated herein by reference) |
10.1 |
| Kodiak Oil & Gas Corp. Incentive Share Option Plan (filed as Exhibit 4.5 to the registrant’s Registration Statement on Form 20-F filed on November 23, 2005 and incorporated herein by reference) |
10.2 |
| Kodiak Oil & Gas Corp. 2007 Stock Incentive Plan (filed as Appendix A to the registrant’s Definitive Proxy Statement filed on April 27, 2007 and incorporated herein by reference) |
10.3 |
| Amendment No. 1 to Kodiak Oil & Gas Corp. 2007 Stock Incentive Plan (filed as Appendix A to the registrant’s Definitive Proxy Statement filed on April 30, 2010 and incorporated herein by reference) |
10.4 |
| Amendment No. 2 to Kodiak Oil & Gas Corp. 2007 Stock Incentive Plan (filed as Appendix A to the registrant’s Definitive Proxy Statement filed on April 28, 2011 and incorporated herein by reference) |
10.5 |
| Form of Incentive Stock Option Agreement for 2007 Stock Incentive Plan (filed as Exhibit 4.2 to the registrant’s Registration Statement on Form S-8 (Registration No. 333-138704) filed on July 26, 2007 and incorporated herein by reference) |
10.6 |
| Form of Employee Non-incentive Stock Option Agreement for 2007 Stock Incentive Plan (filed as Exhibit 4.3 to the registrant’s Registration Statement on Form S-8 (Registration No. 333-138704) filed on July 26, 2007 and incorporated herein by reference) |
10.7 |
| Form of Directors’ Non-incentive Stock Option Agreement for 2007 Stock Incentive Plan (filed as Exhibit 4.4 to the registrant’s Registration Statement on Form S-8 (Registration No. 333-138704) filed on July 26, 2007 and incorporated herein by reference) |
10.8 |
| Form of Non-Incentive Performance-Based Stock Option Agreement for 2007 Stock Incentive Plan (filed as Exhibit 10.1 to the registrant’s Current Report on Form 8-K filed on March 19, 2008 and incorporated herein by reference) |
10.9 |
| Form of Stock Award Agreement for 2007 Stock Incentive Plan (filed as Exhibit 10.8 to the registrant’s Annual Report on Form 10-K for the year ended December 31, 2010 filed on March 3, 2011 and incorporated herein by reference) |
10.10 |
| Form of Restricted Stock Unit and Performance Award Agreement for 2007 Stock Incentive Plan (filed as Exhibit 10.9 to the registrant’s Annual Report on Form 10-K for the year ended December 31, 2010 filed on March 3, 2011 and incorporated herein by reference) |
10.11 |
| Form of Restricted Stock and Cash Award Agreement for 2007 Stock Incentive Plan (filed as Exhibit 10.10 to the registrant’s Annual Report on Form 10-K for the year ended December 31, 2010 filed on March 3, 2011 and incorporated herein by reference) |
10.12 |
| Form of Restricted Stock Unit Award Agreement for 2007 Stock Incentive Plan (filed as Exhibit 10.12 to the registrant’s Annual Report on Form 10-K filed on February 28, 2012 and incorporated herein by reference) |
10.13 |
| Form of Restricted Stock Agreement for 2007 Stock Incentive Plan (filed as Exhibit 10.13 to the registrant’s Annual Report on Form 10-K filed on February 28, 2012 and incorporated herein by reference) |
10.14 |
| Form of Stock Option Termination Agreement (filed as Exhibit 10.1 to the registrant’s Current Report on Form 8-K filed on January 6, 2010 and incorporated herein by reference) |
10.15 |
| Fourth Amendment to Lease, dated February 14, 2007, between Transwestern Broadreach WTC, LLC and Kodiak Oil & Gas (USA) Inc. (filed as Exhibit 10.14 to the registrant’s Annual Report on Form 10-K for the year ended December 31, 2006 filed on March 27, 2007 and incorporated herein by reference) |
10.16 |
| Fifth Amendment to Lease, dated May 31, 2007 between Transwestern Broadreach WTC, LLC and Kodiak Oil & Gas (USA) Inc. (filed as Exhibit 10.3 to the registrant’s Annual Report on Form 10-K for the year ended December 31, 2007 filed on March 14, 2008 and incorporated herein by reference) |
10.17 |
| Executive Employment Agreement, effective January 1, 2011, by and among Lynn A. Peterson, Kodiak Oil & Gas (USA) Inc. and Kodiak Oil & Gas Corp. (filed as Exhibit 10.1 to the registrant’s Current Report on Form 8-K filed on January 6, 2011 and incorporated herein by reference) |
10.18 |
| Amendment No. 1 to Employment Agreement of Lynn A. Peterson effective January 1, 2013 (filed as Exhibit 10.1 to the registrant’s Current Report on Form 8-K filed on January 28, 2013 and incorporated herein by reference) |
10.19 |
| Executive Employment Agreement, effective January 1, 2011, by and among James E. Catlin, Kodiak Oil & Gas (USA) Inc. and Kodiak Oil & Gas Corp. (filed as Exhibit 10.2 to the registrant’s Current Report on Form 8-K filed on January 6, 2011 and incorporated herein by reference) |
10.20 |
| Amendment No. 1 to Employment Agreement of James E. Catlin effective January 1, 2013 (filed as Exhibit 10.3 to the registrant’s Current Report on Form 8-K filed on January 28, 2013 and incorporated herein by reference) |
10.21 |
| Executive Employment Agreement, effective January 1, 2011, by and among James P. Henderson, Kodiak Oil & Gas (USA) Inc. and Kodiak Oil & Gas Corp. (filed as Exhibit 10.3 to the registrant’s Current Report on Form 8-K filed on |
|
| January 6, 2011 and incorporated herein by reference) |
10.22 |
| Amendment No. 1 to Employment Agreement of James P. Henderson effective January 1, 2013 (filed as Exhibit 10.2 to the registrant’s Current Report on Form 8-K filed on January 28, 2013 and incorporated herein by reference) |
10.23 |
| Employment Agreement between Kodiak Oil and Gas Corp. and Russell A. Branting dated January 1, 2011 (filed as Exhibit 10.2 to the registrant’s Quarterly Report on Form 10-Q filed on August 4, 2011 and incorporated herein by reference) |
10.24 |
| Amendment No. 1 to Employment Agreement of Russell A. Branting (filed as Exhibit 10.1 to the registrant’s Current Report on Form 8-K filed on June 22, 2012 and incorporated herein by reference) |
10.25 |
| Amendment No. 2 to Employment Agreement of Russell A. Branting effective January 1, 2013 (filed as Exhibit 10.4 to the registrant’s Current Report on Form 8-K filed on January 28, 2013 and incorporated herein by reference) |
10.26 |
| Employment Agreement between Kodiak Oil and Gas Corp. and Russ D. Cunningham dated January 1, 2011 (filed as Exhibit 10.3 to the registrant’s Quarterly Report on Form 10-Q filed on August 4, 2011 and incorporated herein by reference) |
10.27 |
| Amendment No. 1 to Employment Agreement of Russ D. Cunningham (filed as Exhibit 10.2 to the registrant’s Current Report on Form 8-K filed on June 22, 2012 and incorporated herein by reference) |
10.28 |
| Amendment No. 2 to Employment Agreement of Russ D. Cunningham effective January 1, 2013 (filed as Exhibit 10.5 to the registrant’s Current Report on Form 8-K filed on January 28, 2013 and incorporated herein by reference)) |
10.29 |
| Credit Agreement dated as of May 24, 2010 among Kodiak Oil & Gas (USA) Inc., Wells Fargo Bank, N.A. and The Lenders Signatory Thereto (filed as Exhibit 10.1 to the registrant’s Current Report on Form 8-K filed on May 27, 2010 and incorporated herein by reference) |
10.30 |
| First Amendment to Credit Agreement among Kodiak Oil & Gas (USA) Inc., Wells Fargo Bank, N.A. and The Lenders Signatory Thereto, effective as of November 30, 2010 (filed as Exhibit 10.1 to the registrant’s Current Report on Form 8-K filed on December 2, 2010 and incorporated herein by reference) |
10.31 |
| Second Amendment to Credit Agreement among Kodiak Oil & Gas (USA) Inc., Wells Fargo Bank, N.A., and the Lenders Signatory Thereto, effective as of April 13, 2011 (filed as Exhibit 10.1 to the registrant’s Current Report on Form 8-K filed on April 19, 2011 and incorporated herein by reference) |
10.32 |
| Amended and Restated Credit Agreement, dated as of October 28, 2011, among Kodiak Oil & Gas (USA) Inc., Wells Fargo Bank, N.A. and The Lenders Party Thereto (filed as Exhibit 10.1 to the registrant’s Current Report on Form 8-K filed on November 3, 2011 and incorporated herein by reference) |
10.33 |
| First Amendment and Limited Waiver to Amended and Restated Credit Agreement among Kodiak Oil & Gas (USA) Inc., as Borrower, Wells Fargo Bank, N.A., as Administrative Agent, and The Lenders Signatory Thereto, dated as of November 14, 2011 (filed as Exhibit 10.1 to the registrant’s Current Report on Form 8-K filed on November 14, 2011 and incorporated herein by reference) |
10.34 |
| Second Amendment to Amended and Restated Credit Agreement among Kodiak Oil & Gas (USA) Inc., as Borrower, Wells Fargo Bank, N.A., as Administrative Agent, and The Lenders Signatory Thereto, executed as of November 14, 2011 (filed as Exhibit 10.2 to the registrant’s Current Report on Form 8-K filed on November 14, 2011 and incorporated herein by reference) |
10.35 |
| Third Amendment to Amended and Restated Credit Agreement among Kodiak Oil & Gas (USA) Inc., as Borrower, Wells Fargo Bank, N.A., as Administrative Agent, and The Lenders Signatory Thereto, dated as of January 10, 2012 (filed as Exhibit 10.1 to the registrant’s Current Report on Form 8-K filed on January 17, 2012 and incorporated herein by reference) |
10.36 |
| Fifth Amendment to Amended and Restated Credit Agreement among Kodiak Oil & Gas (USA) Inc., as Borrower, Wells Fargo Bank, N.A., as Administrative Agent, and The Lenders Signatory Thereto, dated as of May 11, 2012 (filed as Exhibit 10.2 to the registrant’s Current Report on Form 8-K filed on May 17, 2012 and incorporated herein by reference) |
10.37 |
| Sixth Amendment to Amended and Restated Credit Agreement among Kodiak Oil & Gas (USA) Inc.; as Borrower, Wells Fargo Bank, N.A., as Administrative Agent, and The Lenders Signatory Thereto, dated as of October 15, 2012 (filed as Exhibit 10.1 to the registrant’s Quarterly Report on Form 10-Q filed on November 1, 2012 and incorporated herein by reference) |
10.38 |
| Seventh Amendment to Amended and Restated Credit Agreement, dated as of January 15, 2013, among Kodiak Oil & Gas (USA) Inc., as Borrower, Wells Fargo Bank, N.A., as Administrative Agent, and the Lenders signatory thereto (filed as Exhibit 10.2 to the registrant’s Current Report on Form 8-K filed on January 15, 2013 and incorporated herein by reference) |
10.39 |
| Guarantee and Collateral Agreement dated as of May 24, 2010 by Kodiak Oil & Gas (USA) Inc. in favor of Wells Fargo Bank, N.A. as administrative agent (filed as Exhibit 10.2 to the registrant’s Current Report on Form 8-K filed on May 27, |
|
| 2010 and incorporated herein by reference) |
10.40 |
| Amended and Restated Guarantee and Collateral Agreement made by each of the Grantors (as defined therein) in favor of Wells Fargo Bank, N.A., dated as of October 28, 2011 (filed as Exhibit 10.3 to the registrant’s Current Report on Form 8-K filed on November 3, 2011 and incorporated herein by reference) |
10.41 |
| Guarantee and Pledge Agreement dated as of May 24, 2010 by Kodiak Oil & Gas Corp. in favor of Wells Fargo Bank, N.A. as administrative agent (filed as Exhibit 10.3 to the registrant’s Current Report on Form 8-K filed on May 27, 2010 and incorporated herein by reference) |
10.42 |
| Amended and Restated Guarantee and Pledge Agreement made by Kodiak Oil & Gas Corp. in favor of Wells Fargo Bank, N.A., dated as of October 28, 2011 (filed as Exhibit 10.2 to the registrant’s Current Report on Form 8-K filed on November 3, 2011 and incorporated herein by reference) |
10.43 |
| Second Lien Credit Agreement, dated as of November 30, 2010, among Kodiak Oil & Gas (USA) Inc., Wells Fargo Energy Capital, Inc. and The Lenders Party Thereto (filed as Exhibit 10.2 to the registrant’s Current Report on Form 8-K filed on December 2, 2010 and incorporated herein by reference) |
10.44 |
| Agreement and Amendment No. 1 to Second Lien Credit Agreement, dated as of July 15, 2011, among Kodiak Oil & Gas (USA) Inc., Kodiak Oil & Gas Corp., as guarantor, the lender parties and Wells Fargo Energy Capital, Inc. (filed as exhibit 10.1 to the registrant’s Current Report on Form 8-K filed on July 18, 2011 and incorporated herein by reference) |
10.45 |
| Amended and Restated Second Lien Credit Agreement, dated as of October 28, 2011, among Kodiak Oil & Gas (USA) Inc., Wells Fargo Energy Capital, Inc. and The Lenders Party Thereto (filed as Exhibit 10.4 to the registrant’s Current Report on Form 8-K filed on November 3, 2011 and incorporated herein by reference) |
10.46 |
| First Amendment and Limited Waiver to Amended and Restated Second Lien Credit Agreement among Kodiak Oil & Gas (USA) Inc., as Borrower, Wells Fargo Energy Capital, Inc., as Administrative Agent, and The Lenders Signatory Thereto, dated as of November 14, 2011 (filed as Exhibit 10.3 to the registrant’s Current Report on Form 8-K filed on November 14, 2011 and incorporated herein by reference) |
10.47 |
| Second Lien Guarantee and Pledge Agreement made by Kodiak Oil & Gas Corp. in favor of Wells Fargo Energy Capital, Inc., dated as of November 30, 2010 (filed as Exhibit 10.3 to the registrant’s Current Report on Form 8-K filed on December 2, 2010 and incorporated herein by reference) |
10.48 |
| Amended and Restated Second Lien Guarantee and Pledge Agreement made by Kodiak Oil & Gas Corp. in favor of Wells Fargo Energy Capital, Inc., dated as of October 28, 2011 (filed as Exhibit 10.5 to the registrant’s Current Report on Form 8-K filed on November 3, 2011 and incorporated herein by reference) |
10.49 |
| Second Lien Guarantee and Collateral Agreement made by each of the Grantors (as defined therein) in favor of Wells Fargo Energy Capital, Inc., dated as of November 30, 2010 (filed as Exhibit 10.4 to the registrant’s Current Report on Form 8-K filed on December 2, 2010 and incorporated herein by reference) |
10.50 |
| Amended and Restated Second Lien Guarantee and Collateral Agreement made by each of the Grantors (as defined therein) in favor of Wells Fargo Energy Capital, Inc., dated as of October 28, 2011. (filed as Exhibit 10.6 to the registrant’s Current Report on Form 8-K filed on November 3, 2011 and incorporated herein by reference) |
10.51 |
| Purchase Agreement, dated November 18, 2011, among Kodiak Oil & Gas Corp., Kodiak Oil & Gas (USA) Inc., and Credit Suisse Securities (USA) LLC, Wells Fargo Securities, LLC, KeyBanc Capital Markets Inc. and RBC Capital Markets, LLC, as representatives of the several purchasers identified therein (filed as Exhibit 10.1 to the registrant’s Current Report on Form 8-K filed on November 23, 2011 and incorporated herein by reference) |
10.52 |
| Purchase Agreement, dated May 14, 2012, among Kodiak Oil & Gas Corp., Kodiak Oil & Gas (USA) Inc., and RBC Capital Markets, LLC, Wells Fargo Securities, LLC, and Credit Suisse Securities (USA) LLC, as representatives of the several purchasers identified therein (filed as Exhibit 10.1 to the registrant’s Current Report on Form 8-K filed on May 17, 2012 and incorporated herein by reference) |
10.53 |
| Purchase Agreement, dated January 10, 2013, among Kodiak Oil & Gas Corp., Kodiak Oil & Gas (USA) Inc., and Wells Fargo Securities, LLC, RBC Capital Markets, LLC and Credit Suisse Securities (USA) LLC, as representatives of the several purchasers identified therein (filed as Exhibit 10.1 to the registrant’s Current Report on Form 8-K filed on January 15, 2013 and incorporated herein by reference) |
12.1+ |
| Computation of Ratio of Earnings to Fixed Charges |
16.1 |
| Letter from Hein & Associates LLP, Independent Registered Public Accounting Firm, to the Securities and Exchange Commission dated April 5, 2011, regarding change in certifying accountant (filed as Exhibit 16.1 to the registrant’s Current Report on Form 8-K filed on April 5, 2011 and incorporated herein by reference) |
21.1+ |
| Subsidiaries of the Registrant |
23.1+ |
| Consent of Ernst & Young LLP |
23.2+ |
| Consent of Hein & Associates LLP |
23.3+ |
| Consent of Netherland Sewell & Associates, Inc. |
31.1+ |
| Certification of the Chief Executive Officer required by Rule 13a-14(a) or Rule 15d-14(a) |
31.2+ |
| Certification of the Chief Financial Officer required by Rule 13a-14(a) or Rule 15d-14(a) |
31.3 |
| Certification of the Chief Executive Officer required by Rule 13a-14(a) or Rule 15d-14(a) |
31.4 |
| Certification of the Chief Financial Officer required by Rule 13a-14(a) or Rule 15d-14(a) |
32.1+ |
| Certification of the Chief Executive Officer pursuant to 18 U.S.C. Section 1350 |
32.2+ |
| Certification of the Chief Financial Officer pursuant to 18 U.S.C. Section 1350 |
99.1+ |
| Reserve Estimate Report of Netherland Sewell & Associates, Inc. |
101+ |
| The following materials are filed herewith: (i) XBRL Instance, (ii) XBRL Taxonomy Extension Schema, (iii) XBRL Taxonomy Extension Calculation, (iv) XBRL Taxonomy Extension Labels, (v) XBRL Taxonomy Extension Presentation, and (vi) XBRL Taxonomy Extension Definition. In accordance with Rule 406T of Regulation S-T, the information in these exhibits is furnished and deemed not filed or a part of a registration statement or prospectus for purposes of Sections 11 or 12 of the Securities Act of 1933, is deemed not filed for purposes of section 18 of the Exchange Act of 1934, and otherwise is not subject to liability under these sections and shall not be incorporated by reference into any registration statement or other document filed under the Securities Act of 1933, as amended, except as expressly set forth by the specific reference in such filing. |
|
|
|
| + | Previously filed on the Registrant’s original Form 10-K for the fiscal year ended December 31, 2012 filed on February 28, 2013. |
Pursuant to the requirements of Section 13 or 15(d) of the Securities Exchange Act of 1934, the registrant has duly caused this report to be signed on its behalf by the undersigned, thereunto duly authorized.
| KODIAK OIL & GAS CORP. | |
| (Registrant) | |
|
|
|
Date: April 30, 2013 | By: | /s/ LYNN A. PETERSON |
|
| Lynn A. Peterson |
|
| President and Chief Executive Officer |
|
| (principal executive officer) |