Table of Contents
Filed Pursuant to Rule 424(b)(3)
Registration No. 333-138030
Prospectus

9,937,568 SHARES OF COMMON STOCK OFFERED BY THE SELLING SHAREHOLDERS
This prospectus relates to the public offer and sale by some of the shareholders of Kodiak Oil & Gas Corp., a Yukon corporation (“KOG”) of 9,937,568 common shares. The selling shareholders may, from time to time, sell any or all of their common shares on any stock exchange, market or trading facility on which the shares are traded or in privately negotiated transactions at fixed prices that may be changed, at market prices prevailing at the time of sale or at negotiated prices.
We will not receive any proceeds from the sale of these shares.
Our common shares are quoted on the AMEX under the symbol “KOG”. On December 4, 2006, the last reported closing price for our common shares as reported by the AMEX was $4.40 per share.
An investment in the common shares offered for sale under this prospectus involves a high degree of risk. See “Risk Factors” beginning on page 7 of this prospectus.
Neither the United States Securities and Exchange Commission or the securities administrator
or similar regulatory authority of any other national, state, provincial or other jurisdiction,
has approved or disapproved of the common shares offered for sale under this prospectus
or the merits of that offering, or has determined that this prospectus is truthful or complete.
Any representation to the contrary is a criminal offense.
The date of this prospectus is December 8, 2006
Table of Contents
Kodiak Oil and Gas Corp.
Green River Basin and Williston Basin
Green River Basin | 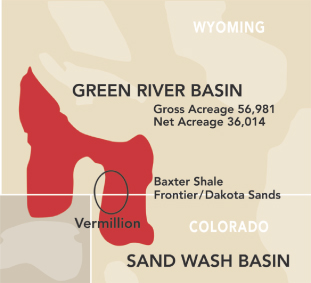 |
| Prospect Location | 2006 Budgeted Costs | September 30, 2006 Expenditures | 2007 Budgeted Costs | ||||||
| Green River Basin | |||||||||
Vermillion Basin Shallow | 2,500,000 | 2,200,000 | – | ||||||
Vermillion Basin Deep | 10,500,000 | – | 33,750,000 | ||||||
Other Projects | 500,000 | – | 2,500,000 | ||||||
Acreage | 8,500,000 | 7,600,000 | 5,000,000 | ||||||
| Total Green River Basin | $ | 22,000,000 | $ | 9,800,000 | $ | 41,250,000 | |||
Williston Basin | 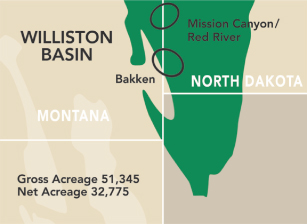 |
| Prospect Location | 2006 Budgeted Costs | September 30, 2006 Expenditures | 2007 Budgeted Costs | ||||||
| Williston Basin | |||||||||
Mission Canyon/Red River | 500,000 | 2,800,000 | 6,000,000 | ||||||
Bakken | 9,800,000 | 7,300,000 | 9,750,000 | ||||||
Acreage | 700,000 | 700,000 | 3,000,000 | ||||||
| Total Williston Basin | $ | 11,000,000 | $ | 10,800,000 | $ | 18,750,000 | |||
Table of Contents
| 1 | ||
| 7 | ||
| 18 | ||
| 19 | ||
| 20 | ||
| 20 | ||
| 21 | ||
| 22 | ||
| 33 | ||
MANAGEMENT’S DISCUSSION AND ANALYSIS OF FINANCIAL CONDITION AND RESULTS OF OPERATIONS | 36 | |
| 46 | ||
| 53 | ||
| 54 | ||
| 54 | ||
| 55 | ||
| 57 | ||
| 59 | ||
| 59 | ||
| 59 | ||
| 68 | ||
| 69 | ||
| 72 | ||
| 72 | ||
| 72 | ||
| F-1 |
You should rely only on the information contained in this prospectus. We have not, and the underwriters have not, authorized anyone to provide you with information different from that contained in this prospectus. We are not, and the underwriters are not, making an offer to sell these securities in any jurisdiction where the offer or sale is not permitted. The information contained in this prospectus is accurate only as of the date of this prospectus.
Table of Contents
This summary highlights information contained elsewhere in this prospectus. Because this is only a summary, it does not contain all of the information that may be important to you. You should read the entire prospectus, including our historical consolidated financial statements and the notes to those financial statements included in this prospectus. You should also carefully consider the matters discussed under “Risk Factors.”
In this prospectus, unless the context otherwise requires, the terms “Kodiak Oil & Gas,” “Kodiak,” “we,” “us” and “our” refer to Kodiak Oil & Gas Corp. and its consolidated subsidiary. We have included definitions of technical terms and abbreviations important to an understanding of our business under “Glossary of Terms” beginning on page 69.
Our functional currency is the United States dollar. All references to “dollars” or “$” in this prospectus refer to United States or U.S. dollars unless specific reference is made to Canadian or CDN dollars. The rate of exchange of Canadian dollars to United States dollars as of November 30, 2006 was CDN $1 to U.S. $0.8762.
Unless we specifically state otherwise, the information in this prospectus does not take into account the sale of up to 1,500,000 shares of common stock by us, which the underwriters have the option to purchase to cover over-allotments.
Our Business
We are an independent energy company focused on the exploration, exploitation, acquisition and production of crude oil and natural gas in the United States. Our oil and natural gas reserves and operations are concentrated in two Rocky Mountain basins. Our corporate strategy is to internally identify prospects, acquire lands encompassing those prospects and evaluate those prospects using subsurface geology and geophysical data and exploratory drilling. Using this strategy, we have developed an oil and natural gas portfolio of proved reserves as well as other conventional and unconventional prospects that we have the opportunity to explore, develop and drill.
We derived natural gas production revenues of $558,768 for the nine months ended September 30, 2006 from six wells in the Green River Basin, three of which we operate and in three of which we have a non-operating economic interest. We derived oil production revenues of $2,252,499 for the same period from seven wells that we operate in the Williston Basin. As of September 30, 2006, we owned natural gas and oil leasehold interests covering approximately 108,326 gross acres and 68,789 net acres, of which 102,726 gross acres and 65,563 net acres are undeveloped.
Our Properties
We have focused our exploration on two geographic areas in the Rocky Mountain Region of the United States. We explore for conventional and unconventional gas plays in the Green River Basin in Wyoming and Colorado, and for oil in the Williston Basin in Montana and North Dakota. Existing oil and natural gas pipeline infrastructure is of critical importance to us in identifying our prospects. In most cases, our natural gas prospects are within a reasonable distance of natural gas pipelines, therefore limiting the construction of gathering systems necessary to tie into existing lines. Our oil is transported mostly by trucks and, if available, pipelines.
Green River Basin
Our primary leaseholdings in the Green River Basin are located in an area referred to as the Vermillion Basin. In this geologic region, we believe there is natural gas trapped in various sands, coals and shales at depths ranging from 2,000 feet to nearly 15,000 feet. The primary targets of our exploration efforts are the Almond
1
Table of Contents
sands at an approximate depth of 5,000 feet, the Baxter shale at approximately 10,000 feet, the Frontier sandstones at 13,000 feet and the Dakota sandstones at 14,000 feet. During the past two years, another exploration and production company has drilled fourteen wells in the Vermillion Basin to evaluate the deeper natural gas potential of this area. We believe that all of these wells are producing hydrocarbons, and that the prospective natural gas bearing zones may be present over a very large geologic area, including most of the area where we have our leaseholds. Based upon the results of this drilling and other wells previously drilled to deeper horizons, we believe that the Baxter shale and the Frontier and Dakota sands are subject to high pressure, which has allowed gas to be produced in rocks with low permeability. While the total productive area and applicable production drainage are unknown, based on the exploration work of other producers in the Green River basin, we believe that 40-acre spacing may be appropriate for optimum drainage on this prospect. Based on the 41,197 gross acres (25,973 net acres) that we control, we may have the potential for several hundred locations, based upon a 40-acre spacing pattern. We are currently drilling and operating our initial well in the prospect area and intend to drill at least one other well with the rig we secured for our initial well.
Williston Basin
Our exploration efforts in the Williston Basin are concentrated on exploiting the oil and natural gas potential of the Mission Canyon Formation at an approximate depth of 8,000 feet, the Bakken Formation at 10,500 feet and the Red River Formation at 11,000 feet. We have acquired an interest in 51,345 gross acres and 32,775 net acres in the Basin. We have been operating one rig in the Williston Basin continuously during the last 18 months.
Our Reserves
Sproule Associates Inc., a petroleum engineering consulting firm, evaluated and reviewed our reserve estimates as of December 31, 2005. All of our reserves are located within the continental United States. Reserve estimates are inherently imprecise and remain subject to revisions based on production history, results of additional exploration and development, prices of oil and natural gas, and other factors. You should read the notes following the table below and the information contained in note 9 to our audited financial statements for the year ended December 31, 2005 included elsewhere in this prospectus in conjunction with the following reserve estimates:
As of December 31, 2005 | |||
Proved Developed Oil Reserves (Thousands of Barrels, or MBbls) | 309.4 | ||
Proved Undeveloped Oil Reserves (MBbls) | 212.3 | ||
Total Proved Oil Reserves (MBbls) | 521.7 | ||
Proved Developed Gas Reserves (Million Cubic Feet, or MMcf) | 1,828.6 | ||
Proved Undeveloped Gas Reserves (MMcf) | 1,006.6 | ||
Total Proved Gas Reserves (MMcf) | 2,835.2 | ||
Total Proved Gas Equivalents (Million Cubic Feet Equivalent, or MMcfe)(1) | 5,965.4 | ||
Present Value of Estimated Future Net Revenues Before Income Taxes, Discounted at 10%(2) | $ | 18,157,000 | |
Present Value of Estimated Future Net Revenues After Income Taxes, Discounted at 10%(3) | $ | 14,202,800 | |
| (1) | We converted oil to Mcf of gas equivalent at a ratio of one barrel to six Mcf. |
| (2) | We calculated the present value of estimated future net revenues as of December 31, 2005 using oil and natural gas prices that were received by each respective property as of that date. The average prices that we utilized for December 31, 2005 were $8.11 per Mcf and $57.57 per barrel of oil. |
| (3) | The Present Value of Estimated Future Net Revenues After Income Taxes, Discounted at 10%, is referred to as the “Standardized Measure.” See Note 9 to our audited financial statements for the year ended December 31, 2005 included elsewhere in this prospectus. |
2
Table of Contents
Capital Expenditures
We made capital expenditures of about $15 million in 2005. The following table sets forth our planned capital expenditures for our principal properties in 2006, together with current-year expenditures through September 30, 2006:
Prospect Location | Working Interest (WI) | Gross Wells | Net Wells | Estimated 2006 Expenditures | Expenditures through September 30, 2006 | ||||||||
Green River Basin | |||||||||||||
Vermillion Basin Shallow | 50.0 | % | 3 | 1.50 | 2,500,000 | 2,200,000 | |||||||
Vermillion Basin Deep | 100 | % | 2 | 2.00 | 10,500,000 | — | |||||||
Other Projects | 50.0 | % | 1 | 0.25 | 500,000 | — | |||||||
Acreage | 8,500,000 | 7,600,000 | |||||||||||
Total Green River Basin | 6 | 3.75 | $ | 22,000,000 | $ | 9,800,000 | |||||||
Williston Basin | |||||||||||||
Mission Canyon/Red River | 50.0 | % | 1 | .50 | 500,000 | 2,800,000 | |||||||
Bakken | 62.5 | % | 3 | 1.88 | 9,800,000 | 7,300,000 | |||||||
Acreage | 700,000 | 700,000 | |||||||||||
Total Williston Basin | 4 | 2.38 | 11,000,000 | 10,800,000 | |||||||||
Total Kodiak Oil & Gas | 10 | 6.13 | $ | 33,000,000 | $ | 20,600,000 | |||||||
Our preliminary 2007 capital expenditures budget is approximately $60 million. The following table sets forth our planned capital expenditures for our principal properties in 2007:
Prospect Location | WI | Gross Wells | Net Wells | Estimated Expenditures | ||||||
Green River Basin | ||||||||||
Vermillion Deep Operated | 100.0 | % | 7 | 7.00 | 31,500,000 | |||||
Vermillion Deep Non-Op | 25.0 | % | 2 | 0.50 | 2,250,000 | |||||
Other Projects | 50.0 | % | 2 | 1.00 | 2,500,000 | |||||
Acreage/Seismic | 5,000,000 | |||||||||
Total Green River Basin | 11 | 8.50 | 41,250,000 | |||||||
Williston Basin | ||||||||||
Mission Canyon / Red River | 50.0 | % | 6 | 3.00 | 6,000,000 | |||||
Bakken | 62.5 | % | 3 | 1.88 | 9,750,000 | |||||
Acreage/Seismic | 3,000,000 | |||||||||
Total Williston Basin | 9 | 4.88 | 18,750,000 | |||||||
Total Kodiak Oil & Gas | 20 | 13.38 | $ | 60,000,000 | ||||||
Our Business Strategy
We aim to increase shareholder value by finding and developing oil and natural gas reserves at costs that provide an attractive rate of return on our investments. The principal elements of our business strategy are:
| • | Develop Our Existing Properties. We believe that our Green River and Williston Basin properties have the potential to provide us with near-term reserve and production growth from numerous drilling locations. We intend to focus our drilling and exploration programs in 2007 in these areas. |
3
Table of Contents
| • | Pursue Selective Acquisitions and Joint Ventures. We expect to lease additional natural gas and oil properties in our areas of operation. We believe that our asset base and technical expertise position us well to attract industry joint venture partners and pursue strategic acquisitions. |
| • | Operate Our Properties and Maintain a High Working Interest in Our Wells. We plan to seek to operate our properties where possible and to maintain a high level of participation in our wells by investing our own capital in drilling operations in our high-growth areas. We believe this will position us to accelerate our growth in production, reserves and cash flows. |
| • | Reduce Unit Costs Through Economies of Scale and Efficient Operations. As we continue to increase our oil and natural gas production and develop our existing properties, we believe that our unit cost structure will benefit from our experience and economies of scale. We anticipate that we will be able to reduce unit costs through better utilization of our existing infrastructure over a larger number of wells. |
Our Competitive Strengths
We believe that our key competitive strengths include:
| • | Significant Production Growth Opportunities. We have acquired a large acreage position in an area where drilling and production activity by other exploration and production companies continues to increase. Based on the drilling results of other producers within our acreage position and our own drilling results on our acreage, we believe we are well-positioned to increase our reserves, production and cash flow. |
| • | Experienced Management Team with Strong Technical Capability. Our senior management team has extensive industry experience and technical expertise in engineering, geoscience, field operations and land acquisition, with an average of more than 25 years of experience in the oil and natural gas industry. |
| • | Financial Flexibility. We plan to maintain a conservative financial position and believe that our operating cash flow and proceeds from this offering will provide us with the financial flexibility to pursue our planned growth through exploration and development activities through 2007. |
| • | Incentivized Management Ownership. Our directors and executive officers are closely aligned with our stockholders. As of September 30, 2006, our directors and executive officers beneficially owned approximately 12% of our outstanding common stock. In addition, we believe that the compensation arrangements for our directors and executive officers are heavily weighted toward future performance-based equity payments rather than cash. |
Recent Events
Operational Update
Vermillion Basin
While we have operated gas wells in the Green River Basin since November 2005, we only recently completed drilling our first gas well in the Vermillion Basin area, the North Trail State #4-36 well located in Sweetwater County, Wyoming. We began drilling in October 2006 and completed drilling operations early in December 2006 at a total depth of 14,625 feet. We have set production casing for the well. We have obtained pipeline right-of-way and will install approximately three-quarters of a mile of pipeline prior to fracture stimulating the well. We operate and have a 100% working and 80% net revenue interest in the well.
Williston Basin
In October 2006, we completed the Grizzly Federal #4-11H well located in McKenzie County, North Dakota. We began drilling in July 2006 and have drilled three lateral well bores totaling 14,000 feet in the
4
Table of Contents
Bakken Formation. In October 2006, we tested the well at a calculated rate of 600 barrels of oil per day, or BOPD, and 300 thousand cubic feet of natural gas per day, or Mcfg/d. We operate and have a 62.5% working and 54.7% net revenue interest in the well.
We began drilling our initial test well, the Kodiak Grizzly #13-6H in May 2006. We have drilled to a depth of 10,500 feet with two lateral well bores totaling 9,000 feet. The well began producing oil in September 2006 and we fracture stimulated it in November. We currently are flow testing the well and expect to put it back on production in December 2006. We operate and have a 62.5% working and 51.3% net revenue interest in the well.
We began drilling a third well, the Grizzly Federal #1-27H well, in September 2006. The well has a single well bore and is located three miles north of our Grizzly Federal #4-11H well. We completed drilling operations on the #1-27H well in December 2006 with one lateral well bore totalling 7,000 feet. We operate and have a 62.5% working and 53.0% net revenue interest in the well.
Management Update
On October 2, 2006, Brian P. Ault joined us as our Manager of Operations. Mr. Ault brings 25 years of extensive Rocky Mountain oil and natural gas experience, most recently as Vice President and Operations Manager for Ultra Petroleum Corporation. While at Ultra from 1998 to 2006, Mr. Ault was responsible for operations in two natural gas fields—the Pinedale Anticline and the Jonah Field.
The Offering
This prospectus covers up to 9,937,568 common shares to be sold by the selling shareholder identified in this prospectus.
Shares offered by the selling shareholders | 9,937,568 common shares |
Offering price | Determined at the time of sale by the selling shareholder. |
Common shares outstanding as of December 8, 2006 | 75,473,426 shares |
Common stock owned by the selling shareholders following this offering if all shares are sold | None |
Use of proceeds | All proceeds of this offering will be received by the selling shareholders for their own account. |
American Stock Exchange and TSX Venture Exchange Symbols | KOG |
Risk factors | An investment in our common stock involves significant risks. You should carefully consider the matters discussed under “Risk Factors” immediately following this prospectus summary before making a decision to buy shares of our common stock. |
| (1) | Excludes common stock that may be issued upon the exercise of outstanding options. See “Shares Eligible for Future Sale.” |
5
Table of Contents
History and Development of the Company
We were incorporated as a company on March 17, 1972 in the Province of British Columbia, Canada, under the name “Pacific Talc Ltd.” pursuant to the Company Act (British Columbia). On November 12, 1998, we changed our name to “Columbia Copper Company Ltd.” and consolidated our share capital on the basis of four old shares for one new share. On September 28, 2001, we were continued from British Columbia to the Yukon Territory and changed our name to “Kodiak Oil & Gas Corp.” On September 23, 2003, we incorporated a wholly-owned subsidiary, Kodiak Oil & Gas (USA) Inc., in Colorado to hold all of our U.S. oil and natural gas properties. Our common shares began trading on the TSX Venture Exchange on September 28, 2001 and on the American Stock Exchange on June 21, 2006.
Our Executive Offices
Our principal executive offices are located at 1625 Broadway, Suite 330, Denver, Colorado 80202, and our telephone number is (303) 592-8075. We maintain a website at http://www.kodiakog.com. The information contained on or accessible through our website is not part of this prospectus, and you should rely only on the information contained in this prospectus when making a decision as to whether or not to invest in our common stock.
6
Table of Contents
Investing in shares of our common stock is highly speculative and involves a high degree of risk. In addition to the other information included in this prospectus, you should carefully consider the risks described below before purchasing shares of our common stock. If any of the following risks actually occur, our business, financial condition and results of operations could materially suffer. As a result, the trading price of our common stock could decline, and you might lose all or part of your investment.
Risks Relating to the Company
We will require significant additional capital, which may not be available to us on favorable terms, or at all.
We will need to expend significant capital in order to explore and develop our properties. Our plan of operation for 2007 contemplates capital expenditures of $60 million for the development of existing properties and anticipated property acquisitions. If our available sources of liquidity are insufficient to fund our expected capital needs for 2007, or our needs are greater than anticipated, we will be required to raise additional funds in the future through private or public sales of equity securities or the incurrence of indebtedness. In addition, we will be required to raise additional funds in the future to fund our plan of operation beyond 2007.
There can be no assurance that we will obtain necessary additional financing on favorable terms or at all. If we borrow additional funds, we likely will be obligated to make periodic interest or other debt service payments and may be subject to additional restrictive covenants. Should we elect to raise additional capital through the issuance and sale of equity securities, the sales may be at prices below the market price of our stock, and our shareholders may suffer significant dilution. Our failure to obtain financing on a timely basis or on favorable terms could result in the loss or substantial dilution of our interests in our properties as disclosed in this prospectus. In addition, the failure of any of our joint venture partners to obtain any required financing could adversely affect our ability to complete the exploration or development of any of our joint venture projects on a timely basis.
We have historically incurred losses and expect to incur additional losses in the future. It is difficult for us to forecast when we will achieve profitability, if ever.
We have historically incurred losses from operations during our limited history in the oil and natural gas business. As at September 30, 2006, we had a cumulative deficit of $7,232,539. While we have developed some of our properties, most of our properties are in the exploration stage and to date we have established a limited volume of proved reserves on our properties. To become profitable, we would need to be successful in our acquisition, exploration, development and production activities, all of which are subject to many risks beyond our control. We cannot assure you that we will successfully implement our business plan or that we will achieve commercial profitability in the future. Even if we become profitable, we cannot assure you that our profitability will be sustainable or increase on a periodic basis. In addition, should we be unable to continue as a going concern, realization of assets and settlement of liabilities in other than the normal course of business may be at amounts significantly different from those in the financial statements included in this prospectus. Finally, due to our limited history in the oil and natural gas business, we have limited historical financial and operating information available to help you evaluate our performance or an investment in our common stock.
We may not be able to successfully drill wells that can produce oil or natural gas in commercially viable quantities.
We cannot assure you that we will be able to successfully drill wells that can produce commercial quantities of oil and natural gas in the future. The total cost of drilling, completing and operating a well is uncertain before drilling commences. Overruns in budgeted expenditures are common risks that can make a particular project uneconomical. The use of seismic data and other technologies and the study of producing fields in the same area
7
Table of Contents
will not enable us to know conclusively prior to drilling whether oil or natural gas will be present or, if present, whether oil or natural gas will be present in commercial quantities. Further, many factors may curtail, delay or cancel drilling, including the following:
| • | our limited history of drilling wells; |
| • | delays and restrictions imposed by or resulting from compliance with regulatory requirements; |
| • | pressure or irregularities in geological formations; |
| • | shortages of or delays in obtaining equipment and qualified personnel; |
| • | equipment failures or accidents; |
| • | adverse weather conditions; |
| • | reductions in oil and natural gas prices; |
| • | land title problems; and |
| • | limitations in the market for oil and natural gas. |
The occurrence of any of these events could negatively affect our ability to successfully drill wells that can produce oil or natural gas in commercially viable quantities.
The actual quantities and present value of our proved reserves may be lower than we have estimated.
This prospectus contains estimates of our proved oil and natural gas reserves and the estimated future net revenues from these reserves. The process of estimating oil and natural gas reserves is complex and requires significant decisions and assumptions in the evaluation of available geological, geophysical, engineering and economic data for each reservoir. Accordingly, these estimates are inherently imprecise. Actual future production, oil and natural gas prices, revenues, taxes, development and operating expenses, and quantities of recoverable oil and natural gas reserves most likely will vary from these estimates and vary over time. Such variations may be significant and could materially affect the estimated quantities and present value of our proved reserves. In addition, we may adjust estimates of proved reserves to reflect production history, results of exploration and development drilling, results of secondary and tertiary recovery applications, prevailing oil and natural gas prices and other factors, many of which are beyond our control.
You should not assume that the present value of future net revenues referred to in this prospectus is the current market value of our estimated oil and natural gas reserves. In accordance with SEC requirements, the estimated discounted future net cash flows from proved reserves are generally based on prices and costs as of the date of the estimate. Actual future prices and costs may be materially higher or lower than the prices and costs as of the date of the estimate. Any change in consumption by oil or natural gas purchasers or in governmental regulations or taxation will also affect actual future net cash flows. The timing of both the production and the expenses from the development and production of our oil and natural gas properties will affect the timing of actual future net cash flows from proved reserves and their present value. In addition, the 10% discount factor, which is required by the SEC to be used in calculating discounted future net cash flows for reporting purposes, is not necessarily the most appropriate discount factor nor does it reflect discount factors used in the market place for the purchase and sale of oil and natural gas.
Our interests are held in the form of leases that we may be unable to retain.
Our properties are held under leases, and working interests in leases. Generally, the leases we are a party to are for a fixed term, but contain a provision that allows us to extend the term of the lease so long as we are producing oil or natural gas in quantities to meet the required payments under the lease. If we or the holder of a lease fails to meet the specific requirements of the lease regarding delay rental payments, continuous production or development, or similar terms, portions of the lease may terminate or expire. There can be no assurance that
8
Table of Contents
any of the obligations required to maintain each lease will be met. The termination or expiration of our leases or the working interests relating to leases may reduce our opportunity to exploit a given prospect for oil and natural gas production and thus have a material adverse effect on our business, results of operation and financial condition.
We have limited control over activities in properties we do not operate, which could reduce our production and revenues.
We do not operate all of the properties in which we have an interest. As of September 30, 2006, we owned a non-operating interest in three wells in the Vermillion Basin and may acquire non-operating interests in additional wells in the future. As a result, we may have a limited ability to exercise influence over normal operating procedures, expenditures or future development of underlying properties and their associated costs. For all of the properties that are operated by others, we are dependent on their decision-making with respect to day-to-day operations over which we have little control. The failure of an operator of wells in which we have an interest to adequately perform operations, or an operator’s breach of applicable agreements, could reduce production and revenues we receive from that well. The success and timing of our drilling and development activities on properties operated by others depend upon a number of factors outside of our control, including:
| • | timing and amount of capital expenditures; |
| • | expertise and financial resources; and |
| • | inclusion of other participants. |
We have a limited experience as an operator of wells.
We are an independent energy company with a limited operating history and limited experience in drilling and operating wells in the Green River Basin and the Williston Basin. We currently conduct some of our oil and natural gas exploration, development and production activities in joint ventures with others. As part of our corporate strategy, we plan to seek to operate our wells where possible and to maintain a high level of participation in our wells by investing our own capital in drilling operations. While our management team has considerable industry experience, to date our company has drilled only one well in the Green River Basin and ten wells in the Williston Basin. Currently, we operate only three wells in the Green River Basin and seven wells in the Williston Basin. If we fail to successfully manage our drilling and exploration programs or fail to successfully operate our wells, we may never become profitable.
The title to our properties may be defective.
It is our practice in acquiring oil and natural gas leases or interests in oil and natural gas leases not to undergo the expense of retaining lawyers to fully examine the title to the interest to be placed under lease or already placed under lease. Rather, we rely upon the judgment of oil and natural gas lease brokers or landmen who actually do the field work in examining records in the appropriate governmental office before attempting to place under lease a specific interest. We believe that this practice is widely followed in the oil and natural gas industry.
Prior to drilling a well for oil and natural gas, it is the normal practice in the oil and natural gas industry for the person or company acting as the operator of the well to hire a lawyer to examine the title to the unit within which the proposed oil and natural gas well is to be drilled. Frequently, as a result of such examination, curative work must be done to correct deficiencies in the marketability of the title. The work entails expense and might include obtaining an affidavit of heirship or causing an estate to be administered. The examination made by the title lawyers may reveal that the oil and natural gas lease or leases are worthless, having been purchased in error from a person who is not the owner of the mineral interest desired. In such instances, the amount paid for such oil and natural gas lease or leases may be lost.
9
Table of Contents
Our officers and directors may become subject to conflicts of interest.
Some of our directors and officers may also become directors, officers, contractors, shareholders or employees of other companies engaged in oil and natural gas exploration and development. To the extent that such other companies may participate in ventures in which we may participate, our directors may have a conflict of interest in negotiating and concluding terms respecting the extent of such participation. In the event that such a conflict of interest arises at a meeting of our directors, a director who has such a conflict will declare his interest and abstain from voting for or against the approval of such participation or such terms. In appropriate cases, we will establish a special committee of independent directors to review a matter in which several directors, or management, may have a conflict. From time to time, several companies may participate in the acquisition, exploration and development of oil and natural gas properties thereby allowing for their participation in larger programs, permitting involvement in a greater number of programs and reducing financial exposure in respect of any one program. A particular company may assign all or a portion of its interest in a particular program to another of these companies due to the financial position of the company making the assignment.
In accordance with the laws of the Yukon Territory, our directors are required to act honestly, in good faith and in the best interests of our company. In determining whether or not we will participate or acquire an interest in a particular program, our officers will primarily consider the potential benefits to our company, the degree of risk to which we may be exposed and our financial position at the time. See “Related Party Transactions.”
We depend on our current management team, the loss of any member of which could delay the further implementation of our business plan or cause business failure.
We are heavily dependent upon the expertise of our management team, especially our executive officers, Lynn Peterson and James Catlin. The loss of Mr. Peterson or Mr. Catlin would have a material adverse effect on us. Neither Mr. Peterson nor Mr. Catlin have entered into an employment agreement with us. In addition, the loss of the services of either of our executive officers, or any other member of our management team, through incapacity or otherwise, would be costly to us and would require us to seek and retain other qualified personnel. We cannot assure you that we could find a suitable replacement for any member of our management team. See “Management.”
Oil and natural gas reserves decline once a property becomes productive, and we may need to find new reserves to sustain revenue growth.
Even if we add oil and natural gas reserves through our exploration activities, our reserves will decline as they are produced. We will be constantly challenged to add new reserves through further exploration and development of our existing properties. We cannot assure you that our exploration and development activities will be successful in adding new reserves. If we fail to replace reserves, our business, results of operations and financial condition will be adversely impacted.
We will need to make substantial financial and man-power investments in order to assess our internal controls over financial reporting and our internal controls over financial reporting may be found to be deficient.
Section 404 of the Sarbanes-Oxley Act of 2002 requires management to assess our internal controls over financial reporting and requires auditors to attest to that assessment. Current regulations of the Securities and Exchange Commission, or SEC, will require us to include this assessment and attestation in our annual report commencing with the annual report we file with the SEC for our fiscal year ended December 31, 2007.
We will incur significant increased costs in implementing and responding to these requirements. In particular, the rules governing the standards that must be met for management to assess its internal controls over financial reporting under Section 404 are complex, and require significant documentation, testing and possible
10
Table of Contents
remediation. Our process of reviewing, documenting and testing our internal controls over financial reporting may cause a significant strain on our management, information systems and resources. We may have to invest in additional accounting and software systems. We may be required to hire additional personnel and to use outside legal, accounting and advisory services. In addition, we will incur additional fees from our auditors as they perform the additional services necessary for them to provide their attestation. If we are unable to favorably assess the effectiveness of our internal control over financial reporting when we are required to, or if our independent auditors are unable to provide an unqualified attestation report on such assessment, we may be required to change our internal control over financial reporting to remediate deficiencies. In addition, investors may lose confidence in the reliability of our financial statements causing our stock price to decline
We are subject to the risks associated with our prior business activities.
Additional risks may exist because of our prior business activities. Prior to current management’s acquisition of control of substantially all of our common stock, we engaged in a number of businesses, including mining operations and marketing of fire retardant operations. For a period of years prior to current management’s acquisition of control of us, we had no business operations. Although current management performed a due diligence review, we may still be exposed to undisclosed liabilities resulting from the prior operations of our company and we could incur losses, damages or other costs as a result.
Our focus on exploration activities exposes us to greater risks than are generally encountered in later-stage oil and natural gas property development businesses.
Much of our current activity involves drilling exploratory wells on properties with no proved oil and natural gas reserves. While all drilling, whether developmental or exploratory, involves risks, exploratory drilling involves greater risks of dry holes or failure to find commercial quantities of oil and natural gas. The economic success of any project will depend on numerous factors, including:
| • | our ability to drill, complete and operate wells; |
| • | our ability to estimate the volumes of recoverable reserves relating to individual projects; |
| • | rates of future production; |
| • | future commodity prices; and |
| • | investment and operating costs and possible environmental liabilities. |
All of these factors may impact whether a project will generate cash flows sufficient to provide a suitable return on investment. If we experience a series of failed drilling projects, our business, results of operations and financial condition could be materially adversely affected.
We rely on independent experts and technical or operational service providers over whom we may have limited control.
We use independent contractors to provide us with technical assistance and services. We rely upon the owners and operators of rigs and drilling equipment, and upon providers of field services, to drill and develop our prospects to production. In addition, we rely upon the services of other third parties to explore or analyze our prospects to determine a method in which the prospects may be developed in a cost-effective manner. Our limited control over the activities and business practices of these providers, any inability on our part to maintain satisfactory commercial relationships with them or their failure to provide quality services could materially and adversely affect our business, results of operations and financial condition.
11
Table of Contents
We have not insured and cannot fully insure against all risks related to our operations, which could result in substantial claims for which we are underinsured or uninsured.
We have not insured and cannot fully insure against all risks and have not attempted to insure fully against risks where coverage is prohibitively expensive. We do not carry business interruption insurance coverage. Our exploration, drilling and other activities are subject to risks such as:
| • | fires and explosions; |
| • | environmental hazards, such as uncontrollable flows of natural gas, oil, brine, well fluids, toxic gas or other pollution into the environment, including groundwater and shoreline contamination; |
| • | abnormally pressured formations; |
| • | mechanical failures of drilling equipment; |
| • | personal injuries and death, including insufficient worker compensation coverage for third-party contractors who provide drilling services; and |
| • | natural disasters, such as adverse weather conditions. |
Losses and liabilities arising from uninsured and underinsured events, which could arise from even one catastrophic accident, could materially and adversely affect our business, results of operations and financial condition.
Our competitors include larger, better financed and more experienced companies.
The oil and natural gas industry is intensely competitive and, as an early-stage company, we must compete against larger companies that may have greater financial and technical resources than us and substantially more experience in our industry. Their competitive advantages may negatively impact our ability to acquire prospective properties, develop reserves, attract and retain quality personnel and raise capital. Their competitive advantages may also better enable our competitors to sustain the impact of higher exploration and production costs, oil and natural gas price volatility, productivity variances among properties, overall industry cycles and other factors related to our industry.
Properties that we acquire may not produce oil or natural gas as projected, and we may be unable to determine reserve potential, identify liabilities associated with the properties or obtain protection from sellers against them, which could cause us to incur losses.
One of our growth strategies is to pursue selective acquisitions of oil and natural gas reserves. If we choose to pursue an acquisition, we will perform a review of the target properties that we believe is consistent with industry practices. However, these reviews are inherently incomplete. Generally, it is not feasible to review in depth every individual property involved in each acquisition. Even a detailed review of records and properties may not necessarily reveal existing or potential problems, nor will it permit a buyer to become sufficiently familiar with the properties to assess fully their deficiencies and potential. We may not perform an inspection on every well, and environmental problems, such as groundwater contamination, are not necessarily observable even when an inspection is undertaken. Even when problems are identified, we may not be able to obtain effective contractual protection against all or part of those problems, and we may assume environmental and other risks and liabilities in connection with the acquired properties.
Our operations in North Dakota, Montana and Wyoming could be adversely affected by abnormally poor weather conditions.
Our operations in North Dakota, Montana and Wyoming are conducted in areas subject to extreme weather conditions and often in difficult terrain. Primarily in the winter and spring, our operations are often curtailed because of cold, snow and wet conditions. Unusually severe weather could further curtail these operations,
12
Table of Contents
including drilling of new wells or production from existing wells, and depending on the severity of the weather, could have a material adverse effect on our business, financial condition and results of operations.
In addition, our federal leases generally include restrictions on drilling during the period of November 15 to April 30. These restrictions are intended to protect big game winter habitat and not to restrict operations or maintenance of production facilities. To the extent that our exploration and drilling program on our federal leases cannot be completed during the period of May 1 through November 14, our drilling program may be delayed.
Market conditions or operational impediments may hinder our access to oil and natural gas markets or delay our production.
We deliver oil and natural gas through gathering systems and pipelines that we do not own. These facilities may not be available to us in the future. Market conditions or the unavailability of satisfactory oil and natural gas transportation arrangements may hinder access to oil and natural gas markets or delay production, if any, at our wells. The availability of a ready market for our future oil and natural gas production will depend on a number of factors, including the demand for and supply of oil and natural gas and the proximity of reserves to pipelines and terminal facilities. Any significant change in our arrangements with gathering system or pipeline owners and operators or other market factors affecting the overall infrastructure facilities servicing our properties would adversely affect our ability to deliver the oil and natural gas we produce to markets in an efficient manner.
Risks Relating to Our Industry
The oil and natural gas industry is subject to significant competition, which may increase costs or otherwise adversely affect our ability to compete.
Oil and natural gas exploration is intensely competitive and involves a high degree of risk. In our efforts to acquire oil and natural gas producing properties, we compete with other companies that have greater resources. Many of these companies not only explore for and produce oil and natural gas, but also conduct refining and petroleum marketing operations on a worldwide basis. Our ability to compete for oil and natural gas producing properties will be affected by the amount of funds available to us, information available to us and any standards established by us for the minimum projected return on investment. Our products will also face competition from alternative fuel sources and technologies.
Oil and natural gas are commodities subject to price volatility based on many factors outside the control of producers, and low prices may make properties uneconomic for future production.
Oil and natural gas are commodities, and, therefore, their prices are subject to wide fluctuations in response to relatively minor changes in supply and demand. Historically, the markets for oil and natural gas have been volatile. These markets will likely continue to be volatile in the future. The prices a producer may expect and its level of production depend on numerous factors beyond its control, such as:
| • | changes in global supply and demand for oil and natural gas; |
| • | economic conditions in the United States and Canada; |
| • | the actions of the Organization of Petroleum Exporting Countries, or OPEC; |
| • | government regulation; |
| • | the price and quantity of imports of foreign oil and natural gas; |
| • | political conditions, including embargoes, in oil- and natural gas-producing regions; |
| • | the level of global oil and natural gas inventories; |
| • | weather conditions; |
13
Table of Contents
| • | technological advances affecting energy consumption; and |
| • | the price and availability of alternative fuels. |
Lower oil and natural gas prices may not only decrease revenues on a per unit basis, but also may reduce the amount of oil and natural gas that can be economically produced. Lower prices will also negatively affect the value of proved reserves.
Exploration and drilling operations are subject to significant environmental regulation, which may increase costs or limit our ability to develop our properties.
We may encounter hazards incident to the exploration and development of oil and natural gas properties such as accidental spills or leakage of petroleum liquids and other unforeseen conditions. We may be subject to liability for pollution and other damages due to hazards that we cannot insure against due to prohibitive premium costs or for other reasons. Governmental regulations relating to environmental matters could also increase the cost of doing business or require alteration or cessation of operations in some areas.
Existing and possible future environmental legislation, regulations and actions could give rise to additional expense, capital expenditures, restrictions and delays in our activities, the extent of which we cannot predict. Regulatory requirements and environmental standards are subject to constant evaluation and may be significantly increased, which could materially and adversely affect our business or our ability to develop our properties on an economically feasible basis. Before development and production can commence on any properties, we must obtain regulatory and environmental approvals. We cannot assure you that we will obtain such approvals on a timely basis or at all. The cost of compliance with changes in governmental regulations has the potential to reduce the profitability of our operations and preclude entirely the economic development of a specific property.
A substantial or extended decline in oil and natural gas prices could reduce our future revenue and earnings.
As with most other companies involved in resource exploration and development, we may be adversely affected by future increases in the costs of conducting exploration, development and resource extraction that may not be fully offset by increases in the price received on sale of oil or natural gas.
Our revenues and growth, and the carrying value of our oil and natural gas properties are substantially dependent on prevailing prices of oil and natural gas. Our ability to obtain additional capital on attractive terms is also substantially dependent upon oil and natural gas prices. Prices for oil and natural gas are subject to large fluctuations in response to relatively minor changes in the supply of and demand for oil and natural gas, market uncertainty and a variety of additional factors beyond our control. These factors include changes in global supply and demand for oil and natural gas, economic conditions in the United States and Canada, the actions of OPEC, governmental regulation, the price and quantity of imports in foreign oil- and natural gas-producing regions, political conditions, including embargoes in oil- and natural gas-producing regions, the level of global oil and natural gas inventories, weather conditions, technological advances affecting energy consumption and the price and availability of alternate fuel sources. Any substantial and extended decline in the price of oil and natural gas would have an adverse effect on our business, financial condition and results of operations.
Volatile oil and natural gas prices make it difficult to estimate the value of producing properties for acquisition and often cause disruption in the market for oil and natural gas producing properties, as buyers and sellers have difficulty agreeing on such value. Price volatility also makes it difficult to budget for and project the return on acquisitions and development and exploitation projects.
Local, national and international economic conditions are beyond our control and may have a substantial adverse affect on our efforts. We cannot guard against the effects of these potential adverse conditions.
14
Table of Contents
Our operations and demand for our products are affected by seasonal factors, which may lead to fluctuations in our operating results.
Our operating results are likely to vary due to seasonal factors. Demand for oil and natural gas products will generally increase during the winter because they are often used as heating fuels. The amount of such increased demand will depend to some extent upon the severity of winter. Because of the seasonality of our business and continuous fluctuations in the prices of our products, our operating results are likely to fluctuate from period to period.
Conducting operations in the oil and natural gas industry subjects us to complex laws and regulations that can have a material adverse affect on the cost, manner and feasibility of doing business.
Companies that explore for and develop, produce and sell oil and natural gas in the United States are subject to extensive federal, state and local laws and regulations, including complex tax and environmental laws and the corresponding regulations, and are required to obtain various permits and approvals from federal, state and local agencies. If these permits are not issued or unfavorable restrictions or conditions are imposed on our drilling activities, we may not be able to conduct our operations as planned. We may be required to make large expenditures to comply with governmental regulations. Matters subject to regulation include:
| • | water discharge and disposal permits for drilling operations; |
| • | drilling bonds; |
| • | drilling permits; |
| • | reports concerning operations; |
| • | air quality, noise levels and related permits; |
| • | spacing of wells; |
| • | rights-of-way and easements; |
| • | unitization and pooling of properties; |
| • | gathering, transportation and marketing of oil and natural gas; |
| • | taxation; and |
| • | waste transport and disposal permits and requirements. |
Failure to comply with these laws may result in the suspension or termination of operations and subject us to liabilities under administrative, civil and criminal penalties. Compliance costs can be significant. Moreover, these laws could change in ways that substantially increase the costs of doing business. Any such liabilities, penalties, suspensions, terminations or regulatory changes could materially and adversely affect our business, financial condition and results of operations.
The unavailability or high cost of drilling rigs, equipment, supplies, personnel and oilfield services could adversely affect our cost of operations or our ability to execute our plans on a timely basis.
Due to domestic drilling activity increases, particularly in fields in which we operate, a general shortage of drilling rigs, equipment, supplies and personnel has developed. As a result, the costs and delivery times of rigs, equipment, supplies or personnel are substantially greater than in previous years. From time to time, these costs have sharply increased and could do so again. The demand for and wage rates of qualified drilling rig crews generally rise in response to the increasing number of active rigs in service and could increase sharply in the event of a shortage. Shortages of drilling rigs, equipment, supplies or personnel could delay or adversely affect our development operations, which could have a material adverse effect on our business, financial condition and results of operations.
15
Table of Contents
Risks Relating to Our Common Stock and this Offering
Our common stock has a limited trading history and may experience price volatility.
Our common stock has been trading on the TSX Venture Exchange, or TSX-V, since September 28, 2001, and on the American Stock Exchange, or AMEX, since June 21, 2006. The volume of trading in our common stock varies greatly and may often be light, resulting in what is known as a “thinly-traded” stock. Until a larger secondary market for our common stock develops, the price of our common stock may fluctuate substantially. The price of our common stock may also be impacted by any of the following, some of which may have little or no relation to our company or industry:
| • | the breadth of our stockholder base and extent to which securities professionals follow our common stock; |
| • | investor perception of us and the oil and natural gas industry, including industry trends; |
| • | domestic and international economic and capital market conditions, including fluctuations in commodity prices; |
| • | responses to quarter-to-quarter variations in our results of operations; |
| • | announcements of significant acquisitions, strategic alliances, joint ventures or capital commitments by us or our competitors; |
| • | additions or departures of key personnel; |
| • | sales or purchases of our common stock by large stockholders or our insiders; |
| • | accounting pronouncements or changes in accounting rules that affect our financial reporting; and |
| • | changes in legal and regulatory compliance unrelated to our performance. |
We have not paid cash dividends on our common stock and do not anticipate paying any dividends on our common stock in the foreseeable future.
We do not anticipate paying cash dividends on our common stock in the foreseeable future. Payment of future cash dividends, if any, will be at the discretion of our board of directors and will depend on our financial condition, results of operations, contractual restrictions, capital requirements, business prospects and other factors that our board of directors considers relevant. Accordingly, investors may only see a return on their investment if the value of our securities appreciates.
Our constating documents permit us to issue an unlimited number of shares without shareholder approval.
Our Articles of Continuation permit us to issue an unlimited number of shares of our common stock. Subject to the requirements of any exchange on which we may be listed, we will not be required to obtain the approval of shareholders for the issuance of additional shares of our common stock. In 2005, we issued 20,671,875 shares of our common stock for gross proceeds of $17,935,173. In February 2006, we issued 19,514,268 shares of our common stock for net proceeds of $36,535,139. We anticipate that we will, from time to time, issue additional
16
Table of Contents
shares of our common stock to provide working capital for future operations. Any further issuances of shares of our common stock from our treasury will result in immediate dilution to existing shareholders and may have an adverse effect on the value of their shareholdings.
17
Table of Contents
This prospectus contains “forward-looking statements” within the meaning of Section 27A of the Securities Act of 1933, as amended, and Section 21E of the Securities Exchange Act of 1934, as amended. All statements, other than statements of historical fact, contained in this prospectus, constitute forward-looking statements. In some cases you can identify forward-looking statements by terms such as “may,” “intend,” “might,” “will,” “should,” “could,” “would,” “expect,” “believe,” “estimate,” “anticipate,” “plans,” “predict,” “project,” “potential,” or the negative of these terms, and similar expressions intended to identify forward-looking statements.
Forward-looking statements are based on assumptions and estimates and are subject to risks and uncertainties. We have identified in this prospectus some of the factors that may cause actual results to differ materially from those expressed or assumed in any of our forward-looking statements. There may be other factors not so identified. Investors should not place undue reliance on our forward-looking statements. Further, any forward-looking statement speaks only as of the date on which it is made and, except as required by law, we undertake no obligation to update any forward-looking statement to reflect events or circumstances after the date on which it is made or to reflect the occurrence of anticipated or unanticipated events or circumstances. New factors emerge from time to time that may cause our business not to develop as we expect, and it is not possible for us to predict all of them. Factors that may cause actual results to differ materially from those expressed or implied by our forward-looking statements include, but are not limited to, those described under the heading “Risk Factors” and the following:
| • | our future financial and operating performance; |
| • | our business strategy; |
| • | the risks of the oil and natural gas industry, such as operational risks in exploring for, developing and producing oil and natural gas; |
| • | market demand; |
| • | risks and uncertainties involving geology of oil and natural gas deposits; |
| • | the uncertainty of reserves estimates and reserves life; |
| • | the uncertainty of estimates and projections relating to production, costs and expenses; |
| • | potential delays or changes in plans with respect to exploration or development projects or capital expenditures; |
| • | our dependence on key personnel; |
| • | fluctuations in oil and natural gas prices, foreign currency exchange rates and interest rates; |
| • | health, safety and environmental risks; |
| • | uncertainties as to the availability and cost of financing; |
| • | unforeseen liabilities arising from litigation; and |
| • | the possibility that government policies or laws may change or governmental approvals may be delayed or withheld. |
18
Table of Contents
Shares of our common stock, no par value, are issued in registered form. The transfer agent for the shares is Computershare Trust Company Inc., 100 University Avenue, 9th Floor, Toronto, Ontario M5J 2Y1. No significant trading suspensions have occurred in our common stock in the last three years. Our common stock has been listed and posted for trading on the TSX-V under our current name since September 28, 2001, and on the AMEX since June 21, 2006.
The following tables set forth the reported high and low closing bid prices for shares of our common stock (i) in United States dollars on the AMEX for our two most recent fiscal quarters and the months of June, July, August, September and October 2006 (ii) in Canadian dollars on the TSX-V for each of our five most recently completed fiscal years, each of the fiscal quarters in our two most recently completed fiscal years and the current fiscal year, and each of the most recent six months.
High and Low Prices for the Five Most
Recent Fiscal Years Expressed in Cdn$
| TSX-V | ||||||
Fiscal Year ended December 31, | High | Low | ||||
2005 | $ | 2.40 | $ | 0.70 | ||
2004 | $ | 1.01 | $ | 0.29 | ||
2003 | $ | 0.40 | $ | 0.05 | ||
2002 | $ | 0.29 | $ | 0.06 | ||
2001 | $ | 0.25 | $ | 0.05 | ||
High and Low Prices for Each Quarter in the Two Most Recent Fiscal Years
and any Subsequent Quarters Expressed in Cdn$ (TSX) and US$ (AMEX)
| TSX-V | AMEX | |||||||||||
Three Months Ended | High | Low | High | Low | ||||||||
September 30, 2006 | $ | 4.90 | $ | 3.65 | $ | 4.46 | $ | 3.25 | ||||
June 30, 2006 | $ | 4.95 | $ | 2.75 | $ | 4.03 | $ | 3.38 | ||||
March 31, 2006 | $ | 3.40 | $ | 2.15 | — | — | ||||||
December 31, 2005 | $ | 2.40 | $ | 0.91 | — | — | ||||||
September 30, 2005 | $ | 1.05 | $ | 0.79 | — | — | ||||||
June 30, 2005 | $ | 1.12 | $ | 0.70 | — | — | ||||||
March 31, 2005 | $ | 1.24 | $ | 0.76 | — | — | ||||||
December 31, 2004 | $ | 0.94 | $ | 0.69 | — | — | ||||||
September 30, 2004 | $ | 1.01 | $ | 0.77 | — | — | ||||||
June 30, 2004 | $ | 0.83 | $ | 0.46 | — | — | ||||||
March 31, 2004 | $ | 0.65 | $ | 0.29 | — | — | ||||||
High and Low Prices for the Six Most Recent
Months Expressed in Cdn$ (TSX) and US$ (AMEX)
| TSX-V | AMEX | |||||||||||
Period | High | Low | High | Low | ||||||||
November 2006 | $ | 4.85 | $ | 4.10 | $ | 4.30 | $ | 3.60 | ||||
October 2006 | $ | 4.25 | $ | 3.53 | $ | 3.81 | $ | 3.12 | ||||
September 2006 | $ | 4.90 | $ | 3.70 | $ | 4.46 | $ | 3.28 | ||||
August 2006 | $ | 4.94 | $ | 4.39 | $ | 4.40 | $ | 3.93 | ||||
July 2006 | $ | 4.60 | $ | 3.65 | $ | 4.12 | $ | 3.25 | ||||
June 2006 | $ | 4.95 | $ | 3.35 | $ | 4.03 | $ | 3.38 | ||||
19
Table of Contents
We have never paid any cash dividends on our common stock and do not anticipate paying any dividends in the foreseeable future. Our current business plan is to retain any future earnings to finance the expansion and development of our business. Any future determination to pay cash dividends will be at the discretion of our board of directors, and will be dependent upon our financial condition, results of operations, capital requirements and other factors as our board may deem relevant at that time.
CAPITALIZATION AND INDEBTEDNESS
The following table shows our cash and cash equivalents and capitalization as of September 30, 2006. You should read this information in conjunction with “Selected Historical Financial Data” and “Management’s Discussion and Analysis of Financial Condition and Results of Operations” and our audited financial statements, including the related notes, included elsewhere in this prospectus.
| September 30, 2006 | ||||
Cash and cash equivalents | $ | 21,432,860 | ||
Total debt liabilities | $ | 2,262,448 | ||
Stockholders’ equity: | ||||
Common stock, no par value; unlimited shares authorized; 74,969,426 shares issued and outstanding | 65,233,481 | |||
Accumulated deficit | $ | (7,232,539 | ) | |
Total stockholders’ equity | $ | 58,000,942 | ||
Total capitalization | $ | 60,263,390 | ||
20
Table of Contents
The following tables set forth the high and low rates of exchange for the Canadian dollar, expressed as U.S. dollars per Canadian dollar, for each of the previous six months and the average of such exchange rates during each of the five most recent fiscal years. The average rates presented in the table below represent the average of the exchange rates on the last day of each month during the period. Exchange rates represent the noon buying rate in New York City for cable transfers payable in foreign currencies as certified for customs purposes by the Federal Reserve Bank of New York. The noon rate of exchange on December 31, 2005 and November 30, 2006 as reported by the United States Federal Reserve Bank of New York for the conversion of Canadian dollars into United States dollars was Cdn$1.00 = U.S.$0.8579 and U.S.$0.8762, respectively.
Canadian Dollar/U.S. Dollar Exchange Rates for Five Most Recent Fiscal Years
| Year Ended December 31, | Seven December 31, 2001 | |||||||||
| 2005 | 2004 | 2003 | 2002 | |||||||
End of period | 0.8579 | 0.8310 | 0.7738 | 0.6329 | 0.6279 | |||||
Average for the period | 0.8282 | 0.7719 | 0.7205 | 0.6370 | 0.6406 | |||||
High during the period | 0.8690 | 0.8493 | 0.7738 | 0.6619 | 0.6622 | |||||
Low during the period | 0.7872 | 0.7158 | 0.6349 | 0.6200 | 0.6241 | |||||
Canadian Dollar/U.S. Dollar Exchange Rates for Previous Six Months
| November 2006 | October 2006 | September 2006 | August 2006 | July 2006 | June 2006 | |||||||
High | 0.8869 | 0.8965 | 0.9048 | 0.9037 | 0.8999 | 0.9098 | ||||||
Low | 0.8715 | 0.8784 | 0.8872 | 0.8840 | 0.8760 | 0.8896 |
21
Table of Contents
History and Development of the Company
We were incorporated as a company on March 17, 1972 in the Province of British Columbia, Canada, under the name “Pacific Talc Ltd.” pursuant to the Company Act (British Columbia). On November 12, 1998, we changed our name to “Columbia Copper Company Ltd.” and consolidated our share capital on the basis of four old shares for one new share. On September 28, 2001, we were continued from British Columbia to the Yukon Territory and changed our name to “Kodiak Oil & Gas Corp.” On September 23, 2003 we incorporated a wholly-owned subsidiary, Kodiak Oil & Gas (USA) Inc., in Colorado. We formed Kodiak Oil & Gas (USA) Inc. to hold all of our U.S. oil and natural gas properties.
We are an independent energy company focused on the exploration, exploitation, acquisition and production of natural gas and crude oil in the United States. Our oil and natural gas reserves and operations are concentrated in two Rocky Mountain Basins. Our corporate strategy is to internally identify prospects, acquire lands encompassing those prospects and evaluate those prospects using subsurface geology and geophysical data and exploratory drilling. Using this strategy, we have developed a portfolio of proved reserves, development and exploratory drilling opportunities on conventional and non-conventional oil and natural gas prospects.
Our current management acquired control of our company early in 2001. Initial operations focused on the acquisition of natural gas prospect lands in Wyoming. Our first project was a coalbed methane project in the Vermillion Basin of southwestern Wyoming, which we refer to as the Pacific Rim CBM Prospect. At the time, we did not have sufficient resources to fulfill our drilling commitments. Accordingly, we entered into an agreement with CP Resources LLC, a private company that was controlled by Messrs. Peterson and Catlin. Under the agreement, CP Resources paid the costs to drill two wells on the Pacific Rim CBM Prospect. Based on the drilling results, a third party entered into an agreement with CP Resources in June 2003 to jointly explore the Pacific Rim CBM Prospect. Under the agreement, the third party paid the first $2,500,000 of exploration expenditures. Subsequent expenditures were paid for in relationship to the parties’ respective working interests. CP Resources subsequently assigned its interest in the Pacific Rim CBM Prospect to our company in exchange for the issuance of 1,000,000 shares of our common stock and the delivery of a promissory note in the amount of $264,000, which represented 120% of the drilling costs incurred by CP Resources on the Pacific Rim CBM Prospect.
In September 2003, we raised net proceeds of $285,620 in a private placement of 3,857,500 units of equity securities. Each unit consisted of one share of common stock and one-half non-transferable share purchase warrant. One whole warrant entitled the holder to purchase one share of common stock at a price of Cdn$0.15 on or before six months from closing. In connection with the private placement, we also issued to the placement agent a warrant for 370,000 shares of common stock exercisable at Cdn$0.115 on or before September 17, 2004. All of the warrants issued to the investors and the placement agent were exercised. We used the net proceeds of the private placement and the exercise of the warrants to fund the Pacific Rim CBM Prospect and for general corporate purposes.
In February 2004, we raised net proceeds of $2,708,260 in a private placement of 11,428,572 units of equity securities. Each unit consisted of one share of common stock and one-half non-transferable share purchase warrant. One whole warrant entitled the holder to purchase one share of our common stock at a price of CDN$0.50 per share on or before twelve months from closing. We paid the placement agent a cash commission of 8% of the subscription proceeds and issued to the placement agent warrants equal to 8% of the number of units sold to purchase one share of our common stock at a price of Cdn$0.50 per share on or before twelve months from closing. In August 2004, we received net proceeds of $2,174,810 from the early exercise of 5,649,286 of the 5,714,286 purchase warrants issued to investors in the private placement. As an incentive to the warrant holders to exercise six months early, we issued an additional one-half non-transferable share purchase warrant, or a total of 2,824,643 bonus warrants, for each share purchase warrant exercised. Each bonus warrant entitled the
22
Table of Contents
holder to purchase one share of our common stock at a price of Cdn$1.00 per share on or before twelve months from closing. In August 2005, we received net proceeds of $2,137,223 from the exercise of 2,561,618 bonus warrants. We used the proceeds from the issuance of the units and the exercise of the warrants in part to fund our exploration and development program and for working capital and general corporate purposes.
In March 2005, we raised net proceeds of $6,859,398 in a non-brokered private placement of 10 million shares of common stock. We used the net proceeds of this transaction to fund our exploration and development program.
In December 2005, we raised net proceeds of $8,492,475 in an unbrokered private placement of 7 million shares of common stock. We have used a portion of the net proceeds, and expect to use the remainder, to fund exploration and drilling programs and for working capital and general corporate purposes.
In March 2006, we raised net proceeds of $36,535,139 in a private placement of 19,514,268 shares of common stock to accredited investors. We have used a portion of the net proceeds, and expect to use the remainder, to fund exploration and drilling programs and for working capital and general corporate purposes.
Business Overview
We have focused our exploration on two geographic areas in the Rocky Mountain Region of the United States. We explore for conventional and unconventional natural gas plays in the Green River Basin in Wyoming and Colorado, and for oil in the Williston Basin in Montana and North Dakota. We are producing oil from our properties in the Williston Basin and natural gas from our properties in the Green River Basin. Existing oil and natural gas pipeline infrastructure is of critical importance to us in identifying our prospects. In most cases, our natural gas prospects are within a reasonable distance of natural gas pipelines, therefore limiting the construction of gathering systems necessary to tie into the existing lines. Our oil is transported mostly by trucks and, if available, pipelines. We sell our extracted oil to crude oil purchasers and our natural gas to natural gas pipeline operators at market prices.
We derived natural gas production revenues of $558,768 for the nine months ended September 30, 2006 from six wells in the Green River Basin, three of which we operate and in three of which we have a non-operating economic interest. We derived oil production revenues of $2,252,499 for the same period from seven wells that we operate in the Williston Basin.
Green River Basin
Our primary leaseholdings in the Green River Basin are located in an area referred to as the Vermillion Basin. In this geologic region, we believe there is natural gas trapped in various sands, coals, and shales at depths ranging from 2,000 feet to nearly 15,000 feet. The primary targets of our exploration efforts are the Almond sands at an approximate depth of 5,000 feet, the Baxter shale at approximately 10,000 feet, the Frontier sandstones at 13,000 feet and the Dakota sandstones at 14,000 feet. During the past two years, another exploration and production company has drilled fourteen wells in the Vermillion Basin to evaluate the deeper natural gas potential of this area. We believe that all of the wells are producing hydrocarbons, and that the prospective gas bearing zones may be present over a large geologic area, including most of the area where we have our leaseholds. Based upon the results of this drilling and other wells previously drilled to deeper horizons, the Baxter shale and the Frontier and Dakota sands have been found to be overpressured allowing gas to be produced in rocks with low permeability. While we do not know the total productive area and applicable production drainage, based on the exploration work of other producers in the Green River Basin, we believe that 40-acre spacing may be appropriate for optimum drainage on this prospect. Based on the 41,197 gross acres and 25,973 net acres that we control and a 40-acre spacing pattern, this prospect has the potential for hundreds of drilling locations.
23
Table of Contents
Williston Basin
Our oil exploration efforts in the Williston Basin are concentrated on the oil and natural gas potential of the Mission Canyon Formation located at an approximate depth of 8,000 feet, the Bakken Formation at 10,500 feet and the Red River Formation at 11,000 feet. We have acquired an interest in 51,345 gross acres and 32,775 net acres in the Williston Basin.
We made capital expenditures of $15 million in 2005. The following table sets forth our planned capital expenditures for our principal properties in 2006, together with current-year expenditures through September 30, 2006. Our anticipated 2006 capital expenditures of approximately $33 million are generally consistent with the $30 million budget we established in January 2006.
Prospect Location | WI | Gross Wells | Net Wells | Estimated 2006 Expenditures | Expenditures through September 30, 2006 | ||||||||
Green River Basin | |||||||||||||
Vermillion Basin Shallow | 50.0 | % | 3 | 1.50 | 2,500,000 | 2,200,000 | |||||||
Vermillion Basin Deep | 100 | % | 2 | 2.00 | 10,500,000 | — | |||||||
Other Properties | 50.0 | % | 1 | 0.25 | 500,000 | — | |||||||
Acreage | 8,500,000 | 7,600,000 | |||||||||||
Total Green River Basin | 6 | 3.75 | $ | 22,000,000 | $ | 9,800,000 | |||||||
Williston Basin | |||||||||||||
Bakken | 62.5 | % | 3 | 1.88 | 10,000,000 | 7,300,000 | |||||||
Mission Canyon Red River | 50.0 | % | 1 | .50 | 500,000 | 2,800,000 | |||||||
Acreage | 500,000 | 700,000 | |||||||||||
Total Williston Basin | 4 | 2.38 | 11,000,000 | 10,800,000 | |||||||||
Total Kodiak Oil & Gas | 10 | 6.13 | $ | 33,000,000 | $ | 20,600,000 | |||||||
Leasing and Property Acquisition Activities
As at September 30, 2006, we had several hundred lease agreements representing approximately 108,326 gross acres and 68,789 net acres. Our leases are located in the Williston Basin in Montana and North Dakota and the Green River Basin in Wyoming and Colorado. We have focused our leasing activities in areas that are serviced by existing pipeline systems and infrastructure.
The majority of our acreage located in the Green River Basin is federal land administered by the U.S. Bureau of Land Management, or the BLM. Typically these lands are acquired through a public auction and have a primary lease term of ten years. The U.S. Department of Interior normally retains a 12.5% royalty interest in these lands. Most of our lands in this area are encompassed within federal operating units approved by the BLM that allow for the orderly exploration and development of the federal lands. In most cases these federal lands require an annual delay rental of $1.50 per net acre.
Our acreage located in the Williston Basin is primarily fee leases. These leases typically carry a primary term three to five years with landowner royalties of 12.5% to 16.6%. In most cases we obtain “paid up” leases that do not require annual delay rentals.
All of our leases grant us the exclusive right to explore for and develop oil, natural gas and other hydrocarbons and minerals that may be produced from wells drilled on the leased property without any depth restrictions. We generally do not acquire leases under which our net revenue interest would be less than 80% of our working interest. Our federal leases generally include restrictions on drilling during the period of November 15 to April 30. These restrictions are intended to protect big game winter habitat and do not restrict operations or maintenance of production facilities.
24
Table of Contents
The following table sets forth our gross and net acres of developed and undeveloped oil and natural gas leases as of September 30, 2006.
| Undeveloped Acreage(1) | Developed Acreage(2) | Total Acreage | ||||||||||
| Gross | Net | Gross | Net | Gross | Net | |||||||
Green River Basin | ||||||||||||
Wyoming | 54,261 | 34,428 | 2,720 | 1,587 | 56,981 | 36,014 | ||||||
Williston Basin | ||||||||||||
Montana | 35,874 | 24,830 | 640 | 320 | 36,514 | 25,150 | ||||||
North Dakota | 12,591 | 6,305 | 2,240 | 1,320 | 14,831 | 7,625 | ||||||
Acreage Totals | 102,726 | 65,563 | 5,600 | 3,227 | 108,326 | 68,789 | ||||||
| (1) | Undeveloped acreage is lease acreage on which wells have not been drilled or completed to a point that would permit the production of commercial quantities of oil and natural gas regardless of whether such acreage includes proved reserves. |
| (2) | Developed acreage is the number of acres that are allocated or assignable to producing wells or wells capable of production. |
Substantially all of the leases summarized in the preceding table will expire at the end of their respective primary terms unless the existing lease is renewed or we have obtained production from the acreage subject to the lease prior to the end of the primary term, in which event the lease will remain in effect until the cessation of production. The following table sets forth the gross and net acres of undeveloped land subject to leases summarized in the preceding table that will expire during the periods indicated:
| Expiring Acreage | ||||
Year Ending | Gross | Net | ||
December 31, 2007 | None | None | ||
December 31, 2008 | 4,720 | 1,883 | ||
December 31, 2009 | 10,068 | 6,385 | ||
Total | 14,788 | 8,268 | ||
Sale of production
Our properties in the Green River Basin are located near existing pipeline systems and processing infrastructure, owned by various operators. For each of our producing natural gas wells, a pipeline must be constructed to connect our well to existing pipeline systems. For certain wells, we construct the pipeline at our own expense. In other cases, we enter into a gas gathering agreement with a pipeline operator under which the pipeline operator agrees to construct the gathering systems. Under such agreements, we agree to reimburse the pipeline operator for the cost of the gathering systems if the transportation fees paid to the pipeline operator do not exceed the cost of the gathering systems over the life of the well.
We believe that these systems have sufficient take away capacity to accommodate our current and anticipated production, and we are not currently aware of any restraints with respect to pipeline availability. However, because of the nature of natural gas development, there may be periods of time when pipeline capacity is inadequate to meet our transportation needs. As new development comes on-line, pipelines are often near or at capacity before new pipelines are built.
We store the oil produced at our Williston Basin properties at the well site in tanks and sell to oil purchasers at market prices. The purchasers transport the oil by truck to various transportation terminals. There are a number of oil purchasers who operate in our market and we believe that such buyers have sufficient capacity to accommodate all of our anticipated oil production.
25
Table of Contents
Prices for oil and natural gas fluctuate fairly widely based on supply and demand. Supply and demand are influenced by weather, foreign policy and industry practices. For example, demand for natural gas has increased in recent years due to a trend in the power plant industry to use natural gas as a fuel source instead of oil and coal because natural gas is a cleaner fuel. Nonetheless, in light of historical fluctuations in prices, there can be no assurance at what price we will be able to sell our oil and natural gas. Prices may be low when our wells are most productive, thereby reducing overall returns.
Governmental Regulations
Our oil and natural gas exploration, production and related operations, when developed, are subject to extensive rules and regulations promulgated by federal, state, tribal and local authorities and agencies. For example, some states in which we may operate require permits for drilling operations, drilling bonds and reports concerning operations, and impose other requirements relating to the exploration for and production of oil and natural gas. Such states may also have statutes or regulations addressing conservation matters, including provisions for the unitization or pooling of oil and natural gas properties, the establishment of maximum rates of production from wells, and the regulation of spacing, plugging and abandonment of wells. Failure to comply with any such rules and regulations can result in substantial penalties. The increasing regulatory burden on the oil and natural gas industry will most likely increase our cost of doing business and may affect our profitability. Although we believe we are currently in substantial compliance with all applicable laws and regulations, because such rules and regulations are frequently amended or reinterpreted, we are unable to predict the future cost or impact of complying with such laws. We may be required to make significant expenditures to comply with governmental laws and regulations, which could have a material adverse effect on our business, financial condition and results of operations.
Our operations are subject to various types of regulation at the federal, state and local levels that:
| • | require permits for the drilling of wells: |
| • | permits to drill wells on federal lands generally require a minimum of 60-120 days, and |
| • | permits to drill wells on state land and fee lands generally require a minimum of 30-60 days; |
| • | mandate that we maintain bonding requirements in order to drill or operate wells; and |
| • | regulate the location of wells, the method of drilling and casing wells, the surface use and restoration of properties upon which wells are drilled, the plugging and abandoning of wells, temporary storage tank operations, air emissions from flaring, compression, and access roads, sour gas management, and the disposal of fluids used in connection with operations. |
Our operations are also subject to various conservation laws and regulations. These regulations govern the size of drilling and spacing units or proration units, the density of wells that may be drilled in oil and natural gas properties, and the unitization or pooling of natural gas and oil properties. In this regard, some states allow the forced pooling or integration of lands and leases to facilitate exploration while other states rely primarily or exclusively on voluntary pooling of lands and leases. In areas where pooling is primarily or exclusively voluntary, it may be more difficult to form units and therefore more difficult to develop a project if the operator owns less than 100% of the leasehold. In addition, state conservation laws establish maximum rates of production from oil and natural gas wells, generally prohibit the venting or flaring of natural gas, and impose specified requirements regarding the ratability of production. On some occasions, tribal and local authorities have imposed moratoria or other restrictions on exploration and production activities that must be addressed before those activities can proceed. The effect of all these regulations may limit the amount of oil and natural gas we can produce from our wells and may limit the number of wells or the locations at which we can drill. Where our operations are located on federal lands, the timing and scope of development may be limited by the National Environmental Policy Act, or environmental or species protection laws and regulations. The regulatory burden on the oil and natural gas industry increases our costs of doing business and, consequently, affects our profitability. Because these laws and regulations are frequently expanded, amended and reinterpreted, we are unable to predict the future cost or impact of complying with applicable environmental and conservation requirements.
26
Table of Contents
The Federal Energy Regulatory Commission, or FERC, regulates interstate natural gas transportation rates and service conditions. Its regulations affect the marketing of natural gas produced by us, as well as the revenues that may be received by us for sales of such production. Since the mid-1980’s, FERC has issued a series of orders, culminating in Order Nos. 636, 636-A and 636-B, collectively, Order 636, that have significantly altered the marketing and transportation of natural gas. Order 636 mandated a fundamental restructuring of interstate pipeline sales and transportation service, including the unbundling by interstate pipelines of the sale, transportation, storage and other services such pipelines previously performed. One of FERC’s purposes in issuing Order 636 was to increase competition within the natural gas industry. The United States Court of Appeals for the District of Columbia Circuit has largely upheld Order 636 and the Supreme Court declined to hear the appeal from that decision. Generally, Order 636 has eliminated or substantially reduced the interstate pipelines’ traditional role as wholesalers of natural gas in favor of providing only storage and transportation service, and has substantially increased competition and volatility in natural gas markets.
The price we receive from the sale of oil and natural gas liquids will be affected by the cost of transporting products to markets. Effective January 1, 1995, FERC implemented regulations establishing an indexing system for transportation rates for oil pipelines, which, generally, index such rates to inflation, subject to certain conditions and limitations. We are not able to predict with certainty the effect, if any, of these regulations on our intended operations. The regulations may, however, increase transportation costs or reduce well head prices for oil and natural gas liquids.
Environmental, Cultural and Historical Matters
Our operations and properties are subject to extensive and changing federal, state and local laws and regulations relating to environmental protection, including the generation, storage, handling, emission, transportation and discharge of materials into the environment, and relating to safety and health. The recent trend in environmental legislation and regulation generally is toward stricter standards, and we expect that this trend will continue. These laws and regulations:
| • | require the acquisition of permits or other authorizations before construction, drilling and certain other activities; |
| • | limit or prohibit construction, drilling and other activities on specified lands within wilderness and other protected areas; and |
| • | impose substantial liabilities for pollution resulting from our operations. |
The permits required for our operations may be subject to revocation, modification and renewal by issuing authorities. Governmental authorities have the power to enforce their regulations, and violations are subject to fines or injunctions, or both. We believe that we are in substantial compliance with current applicable environmental laws and regulations, and have no material commitments for capital expenditures to comply with existing environmental requirements. Nevertheless, changes in existing environmental laws and regulations or in interpretations thereof could have a significant impact on us, as well as the oil and natural gas industry in general.
The Comprehensive Environmental, Response, Compensation, and Liability Act, or CERCLA, and comparable state statutes impose strict, joint and several liability on owners and operators of sites and on persons who disposed of or arranged for the disposal of “hazardous substances” found at such sites. It is not uncommon for neighbouring landowners and other third parties to file claims for personal injury and property damage allegedly caused by hazardous substances released into the environment. The Federal Resource Conservation and Recovery Act, or RCRA, and comparable state statutes govern the disposal of “solid waste” and “hazardous waste” and authorize the imposition of substantial fines and penalties for noncompliance. Although CERCLA currently excludes petroleum from its definition of “hazardous substance,” state laws affecting our operations may impose clean-up liability relating to petroleum and petroleum-related products. In addition, although RCRA classifies certain oil field wastes as “non-hazardous,” such exploration and production wastes could be reclassified as hazardous wastes thereby making such wastes subject to more stringent handling and disposal requirements. CERCLA, RCRA and comparable state statutes can impose liability for clean-up of sites and disposal of substances found on drilling and production sites long after operations on such sites have been completed.
27
Table of Contents
The Endangered Species Act, or ESA, seeks to ensure that activities do not jeopardize endangered or threatened animal, fish and plant species, or destroy or modify the critical habitat of such species. Under the ESA, exploration and production operations, as well as actions by federal agencies, may not significantly impair or jeopardize the species or its habitat. The ESA has been used to prevent or delay drilling activities and provides for criminal penalties for willful violations of its provisions. Other statutes that provide protection to animal and plant species and that may apply to our operations include, without limitation, the Fish and Wildlife Coordination Act, the Fishery Conservation and Management Act, the Migratory Bird Treaty Act, the National Historic Preservation Act and often their state, tribal or local counterparts. Projects can be denied or significantly modified to accommodate tribal burial sites, archeological sites or other historical sites. The National Environmental Policy Act, or NEPA, requires a thorough review of the environmental impacts of “major federal actions” and a determination of whether proposed actions on federal land would result in “significant impact”. For purposes of NEPA, “major federal action” can be something as basic as issuance of a required permit. For oil and gas operations on federal lands or requiring federal permits, NEPA review can increase the time for obtaining approval and impose additional regulatory burdens on the natural gas and oil industry, thereby increasing our costs of doing business and our profitability. Although we believe that our operations are in substantial compliance with these statutes, any change in these statutes or any reclassification of a species as threatened or endangered or re-determination of the extent of “critical habit” could subject us to significant expenses to modify our operations or could force us to discontinue some operations altogether. Any new or additional NEPA analysis could also result in significant changes.
Organizational Structure
We have a single subsidiary, Kodiak Oil & Gas (USA) Inc., which is wholly owned and incorporated under the laws of the State of Colorado.
Property, Plants and Equipment
Set forth below is a description of our material resource properties and their current state of development:
Green River Basin—Wyoming and Colorado
Vermillion Basin Deep-Gas Project—Almond Sands, Baxter Shale and Frontier and Dakota Sandstone
Our primary leaseholdings in the Green River Basin are located in an area referred to as the Vermillion Basin. In this geologic region, we believe there is natural gas trapped in various sands, coals, and shales at depths ranging from 2,000 feet to nearly 15,000 feet. The primary targets of our exploration efforts are the Almond sands at an approximate depth of 5,000 feet, the Baxter shale at approximately 10,000 feet, the Frontier sandstones at 13,000 feet and the Dakota sandstones at 14,000 feet. During the past two years, another exploration and production company has drilled fourteen wells in the Vermillion Basin to evaluate the deeper natural gas potential of this area. We believe that all of the wells are producing hydrocarbons, and that the prospective natural gas bearing zones may be present over a very large geologic area, including most of the area where we have our leaseholds. While the total productive area and applicable production drainage are unknown, based on the exploration work of other producers in the Green River basin, we believe that 40-acre spacing may be appropriate for optimum drainage on this prospect. Using the 40-acre spacing pattern and based on the 41,197 gross acres (25,973 net) that we control, we may have the potential for several hundred locations.
We recently completed drilling operations on the North Trail State #4-36 well at a total depth of 14,625 feet. We have set production casing for the well. Pipeline right of way has been obtained and an approximate three-quarters of a mile of pipeline will be installed prior to the well being fracture stimulated. We operate and have a 100% working and 80% net revenue interest in the well.
We have obtained a permit for the NT #1-33 well located three miles west of the North Trail #4-36. We expect to drill this well immediately following the North Trail State #4-36 in December. Approximately two miles of pipeline will be constructed prior to fracture stimulation procedures to tie the well into our existing gas gathering system. We operate and have a 100% working and 82.5% net revenue interest in the well.
28
Table of Contents
Approximately six miles northwest of the North Trail #4-36 and four miles north of the NT #1-33, we have obtained a permit and built the location for the #1-8 CR Unit well. The proposed total depth is 14,800 feet. We expect to drill this well in 2007. We are seeking permits to drill in nine additional locations in the immediate area. We expect these permits to be approved in early 2007. We will operate and have an approximate 60% working interest and 48.2% net revenue interest in the well.
Southwest of this area, we are seeking permits to drill for four wells in our Horseshoe Basin Unit to test the Baxter Shale and Frontier and Dakota sandstones. The HB Unit #5-3 well will be drilled to a total depth of 13,750 feet. We are in the process of obtaining pipeline right-of-way, and we anticipate that drilling will commence in 2007, after the BLM winter lease stipulations expire. We will operate and have an approximate 65% working interest and 54.4% net revenue interest in the well.
Vermillion Basin Shallow—Almond Sandstone, Almond Coals and Ericson Sandstone
We have participated in the drilling of six vertical wells that evaluated the natural gas potential in the Almond sands. These wells are generally low volume producing wells in the 50-400 Mcfg/d range.
Other Wyoming and Colorado Prospects
We have other geologic prospects that we have generated in Wyoming and are continuing to develop through seismic evaluation and exploratory and development drilling. In some cases we do not operate the properties and therefore cannot determine the time frame when the wells could be drilled. In most cases we do not own a controlling interest in the prospect area. We believe that all of these projects could add to the reserve base and cash flow of the company. One such project is our Sand Wash Basin Prospect Mancos Shale.
Sand Wash Basin Prospect Mancos Shale
In November 2006, we acquired a 100% working interest in 5,406 gross and net acres in an exploratory Cretaceous gas prospect located in the Sand Wash Basin in Moffat County, Colorado. We intend to commit additional capital to this exploratory project area in 2007 in the form of seismic exploration, land acquisition and, potentially, drilling.
Williston Basin—Montana and North Dakota
Our exploration efforts in the Williston Basin are concentrated on exploiting the oil and natural gas potential of the Mission Canyon Formation at an approximate depth of 8,000 feet, the Bakken Formation at 10,500 feet and the Red River at 11,000 feet. We have acquired an interest in 51,345 gross acres and 32,775 net acres in the Basin. We have been operating one rig in the Williston Basin continuously during the last 18 months.
Great Bear Prospect—Red River Dolomite
The Great Bear Prospect is located along the northwest flank of the Williston Basin in Divide County, North Dakota. The main reservoir objective is porous dolomite in the Ordovician Red River Formation.
The Pederson #9H well reached total depth in January 2006. Production facilities have been installed and the well was placed on pump in early September 2006 with inconclusive results. We reinterpreted the seismic data and have identified additional potential locations. We anticipate drilling at least one well on this prospect in early 2007. The well will initially be drilled vertically, after which we will evaluate whether a horizontal leg is warranted. We operate and have a 43.75% working and 35% net revenue interest in the well.
Cinnamon Bear Project—Mission Canyon (Carbonate) and Red River (Dolomite)
This area includes several prospects that have potential primarily for the Mission Canyon and Red River Formations. The initial test well on the Lowell Prospect, the State #8-16, was drilled to a depth of 7,700 feet to
29
Table of Contents
evaluate only the Mission Canyon Formation. We drilled three successful wells at160-acre offsets, the State #6-16, the State #10-16 and the Christensen Trust 15-9, in late 2005. Current field production from the four wells is approximately 400 BOPD and has been relatively stable for the past nine months. We have commenced permitting procedures for two additional development locations in this area. We anticipate at least one of these locations will be drilled in early 2007. We operate and have a 50% working and 40% net revenue interest in the wells.
Further to the west, we recently completed a twenty square mile 3-D seismic program. The seismic data has been processed and evaluated, resulting in several geologic leads. We have obtained a permit for the #2-13 Larsh well to evaluate the Mission Canyon Formation at an approximate depth of 8,000 feet and the Red River Formation at a depth of 11,000 feet. We intend to commence drilling on this well in late 2006. We operate and have a 50% working and 41.67% net revenue interest in the well.
Grizzly Prospect—Bakken Dolomite
Our lands are located in western McKenzie County, North Dakota near the Montana border and part of the Middle Bakken horizontal oil play. The Middle Bakken pay zone is a porous Devonian dolomite sandwiched between the upper Bakken Shale and either a thin lower Bakken shale or the Three Forks Formation. Wells in the zone are generally drilled with one to three 4,000-5,000-foot horizontal lateral well bores or occasionally one longer 8,000-9,000-foot lateral well bore.
In October 2006, we completed the Grizzly Federal #4-11H well located in McKenzie County, North Dakota. We began drilling in July 2006 and have drilled three lateral well bores totaling 14,000 feet in the Bakken Formation. In October 2006, we tested the well at a calculated rate of 600 barrels of oil per day, or BOPD, and 300 thousand cubic feet of natural gas per day, or Mcfg/d. We operate and have a 62.5% working and 54.7% net revenue interest in the well.
We began drilling our initial test well, the Kodiak Grizzly #13-6H in May 2006. We have drilled to a depth of 10,500 feet with two lateral well bores totaling 9,000 feet. The well began producing oil in September 2006 and we fracture stimulated it in November. We currently are flow testing the well and expect to put it back on production in December 2006. We operate and have a 62.5% working and 51.3% net revenue interest in the well.
We began drilling a third well, the Grizzly Federal #1-27H well, in September 2006. The well has a single well bore and is located three miles north of our Grizzly Federal #4-11H well. We completed drilling operations on the #1-27H well in December 2006 with one lateral well bore totalling 7,000 feet. We operate and have a 62.5% working and 53.0% net revenue interest in the well.
Reserves
The reserve estimates at December 31, 2005 presented below were reviewed by Sproule Associates Inc. All reserves are located within the continental United States. The reserve estimates are developed using geological and engineering data and interests and burdens information developed by our company. Reserve estimates are inherently imprecise and are continually subject to revisions based on production history, results of additional exploration and development drilling results of secondary and tertiary recovery applications, prevailing oil and natural gas prices, and other factors. The notes following the table should be read in connection with the reserve estimates.
| As of December 31, 2005 | |||
Proved Developed Oil Reserves (MBbls) | 309.4 | ||
Proved Undeveloped Oil Reserves (MBbls) | 212.3 | ||
Total Proved Oil Reserves (MBbls) | 521.7 | ||
Proved Developed Gas Reserves (MMcf) | 1,828.6 | ||
Proved Undeveloped Gas Reserves (MMcf) | 1,006.6 | ||
Total Proved Gas Reserves (MMcf) | 2,835.2 | ||
Total Proved Gas Equivalents (MMcfe)(1) | 5,965.4 | ||
Present Value of Estimated Future Net Revenues Before Income Taxes, Discounted at 10%(2) | $ | 18,157,000 | |
Present Value of Estimated Future Net Revenues After Income Taxes, Discounted at 10%(3) | $ | 14,202,800 | |
30
Table of Contents
| (1) | Oil is converted to Mcf of gas equivalent at one barrel to 6,000 cubic feet. |
| (2) | We calculated the present value of estimated future net revenues as of December 31, 2005 using oil and natural gas prices that were received by each respective property as of that date. The average prices that we utilized for December 31, 2005 were $8.11 per Mcf and $57.57 per barrel of oil. |
| (3) | The Present Value of Estimated Future Net Revenues After Income Taxes, Discounted at 10%, is referred to as the “Standardized Measure.” See Note 9 to our audited financial statements for the year ended December 31, 2005 included elsewhere in this prospectus. |
Product Prices and Production
Our results of operations and financial condition are significantly affected by oil and natural gas commodity prices, which can fluctuate dramatically. Commodity prices are beyond our control and are difficult to predict. The oil and natural gas volumes that we produced and the prices that we received for that production for the nine months ended September 30, 2005 and 2006 are set forth below. We do not currently hedge any of our production.
| Nine months ended September 30, | ||||||
| 2006 | 2005 | |||||
Volume: | ||||||
Gas (Mcf) | 93,721 | 28,907 | ||||
Oil (Bbls) | 38,223 | 300 | ||||
Price: | ||||||
Gas (Mcf) | $ | 5.96 | $ | 7.14 | ||
Oil (Bbls) | $ | 58.93 | $ | 59.78 | ||
Generally, the demand for and the price of natural gas increase during the colder winter months and decrease during the warmer summer months. Pipelines, utilities, local distribution companies and industrial users utilize natural gas storage facilities and purchase some of their anticipated winter requirements during the summer, which can lessen seasonal demand fluctuations. Crude oil and the demand for heating oil are also impacted by seasonal factors, with generally higher prices in the winter. Seasonal anomalies, such as mild winters, sometimes lessen these fluctuations.
Drilling Activity
All of our drilling activities are conducted on a contract basis by independent drilling contractors. We do not own any drilling equipment. The following table sets forth the number and type of wells that we drilled during the current fiscal year through September 30, 2006.
| 2006 | ||||
| Gross | Net | |||
Development: | ||||
Oil | 2 | 1.25 | ||
Gas | 0 | 0 | ||
Non-Productive | 0 | 0 | ||
Exploratory: | ||||
Oil | 0 | 0 | ||
Gas | 0 | 0 | ||
Non-Productive | 1 | 0.5 | ||
Total | 3 | 1.75 | ||
31
Table of Contents
As part of our corporate strategy, we plan to seek to operate our wells where possible and to maintain a high level of participation in our wells by investing our own capital in drilling operations. While our management team has considerable industry experience, to date our company has drilled one well in the Green River Basin and ten wells in the Williston Basin. Currently, we operate only three wells in the Green River Basin and seven wells in the Williston Basin.
Exploration and Development Costs
The prices received for domestic production of oil and natural gas have increased significantly during the past several years, and are continuing to increase in response to global political issues and domestic shortages, which has resulted in increased demand for the equipment and services that we need to drill, complete and operate wells. As a result of this increased demand for oil field services, shortages have developed, and we have seen an escalation in drilling rig rates, field service costs, material prices and all costs associated with drilling, completing and operating wells. If oil and natural gas prices remain high relative to historical levels, we anticipate that the recent trends toward increasing costs and equipment shortages will continue.
Competition
The oil and gas industry is intensely competitive, particularly with respect to the acquisition of prospective oil and natural gas properties and oil and natural gas reserves. Our ability to effectively compete is dependant on our geological, geophysical and engineering expertise, and our financial resources. We must compete against a substantial number of major and independent oil and natural gas companies that have larger technical staffs and greater financial and operational resources than we do. Many of these companies not only engage in the acquisition, exploration, development and production of oil and natural gas reserves, but also have refining operations, market refined products and generate electricity. We also compete with other oil and natural gas companies to secure drilling rigs and other equipment necessary for drilling and completion of wells. Consequently, drilling equipment may be in short supply from time to time. Currently, access to additional drilling equipment in certain regions is difficult.
32
Table of Contents
SELECTED HISTORICAL FINANCIAL DATA
The following tables set forth selected consolidated financial data as of and for the nine months ended September 30, 2006 and 2005, the fiscal years ended December 31, 2005, 2004, 2003 and 2002, and the seven months ended December 31, 2001. The data as of and for the nine months ended September 30, 2006 and 2005 was derived from our unaudited interim consolidated financial statements included elsewhere in this prospectus, and include, in the opinion of management, all normal and recurring adjustments necessary to present fairly the data for such periods. The data as of and for the fiscal years ended December 31, 2005, 2004 and 2003 was derived from our audited annual consolidated financial statements included elsewhere in this prospectus. The data as of and for the fiscal year ended December 31, 2002 and as of and for the seven months ended December 31, 2001 was derived from our consolidated audited financial statements that are not included in this prospectus.
You should read the following selected consolidated financial data together with our historical consolidated financial statements, including the related notes, and “Management’s Discussion and Analysis of Financial Conditions and Results of Operations” included elsewhere in this prospectus.
| Nine Months Ended September 30, | Year Ended December 31, | Seven Months 2001 | |||||||||||||||||||||||||
| 2006 | 2005 | 2005 | 2004 | 2003 | 2002 | ||||||||||||||||||||||
Income Statement Data: | |||||||||||||||||||||||||||
Revenues | $ | 3,410,552 | $ | 172,243 | $ | 453,135 | $ | 20,449 | -0- | -0- | -0- | ||||||||||||||||
Costs and Expenses | 4,813,464 | 1,040,453 | 2,458,226 | 1,082,549 | $ | 275,683 | $ | 84,419 | $ | 77,491 | |||||||||||||||||
Net Income (Loss) | (1,402,912 | ) | (868,210 | ) | (2,005,091 | ) | (1,062,100 | ) | (275,683 | ) | (87,670 | ) | 289,191 | ||||||||||||||
Net Income (Loss) per Share | $ | (0.02 | ) | $ | (0.02 | ) | $ | (0.05 | ) | $ | (0.04 | ) | $ | (0.02 | ) | $ | (0.01 | ) | $ | 0.04 | |||||||
Other Financial Data: | |||||||||||||||||||||||||||
Adjusted EBITDA(1) | $ | 968,489 | $ | (849,059 | ) | $ | (1,210,248 | ) | $ | (705,765 | ) | $ | (179,896 | ) | $ | (84,419 | ) | $ | 293,975 | ||||||||
| (1) | We define Adjusted EBITDA as net income before (i) interest expense, (ii) income taxes, (iii) depreciation , depletion and amortization, (iv) non-cash expenses relating to share based payments under FAS 123R, (v) pre-tax unrealized gains and losses on foreign currency and (vi) accretion of abandonment liability. We present Adjusted EBITDA because we consider it an important supplemental measure of our performance, in particular because it excludes amounts, such as expenses relating to share-based payments and unrealized gains and losses on foreign currency, that do not relate directly to our operating performance. This term, as we define it, may not be comparable to similarly titled measures employed by other companies and is not a measure of liquidity calculated in accordance with accounting principles generally accepted in the United States, or GAAP. Adjusted EBITDA should not be considered in isolation or as a substitute for operating income, net income, cash flows provided by operating activities or other income or cash flow statement data prepared in accordance with GAAP. See “Non GAAP Financial Measures.” |
33
Table of Contents
As at 2006 | As at December 31, | |||||||||||||||||
| 2005 | 2004 | 2003 | 2002 | 2001 | ||||||||||||||
Balance Sheet Data: | ||||||||||||||||||
Current Assets | $ | 23,128,141 | $ | 7,990,566 | $ | 2,756,745 | $ | 20,384 | $ | 301 | $ | 11,835 | ||||||
Property and Equipment | 36,759,288 | 17,463,269 | 2,357,601 | 685,301 | 99,480 | 95,274 | ||||||||||||
Total Assets | 60,263,390 | 25,790,316 | 5,207,486 | 705,685 | 99,781 | 107,109 | ||||||||||||
Current Liabilities | 2,103,383 | 4,411,572 | 369,008 | 393,825 | 88,951 | 45,481 | ||||||||||||
Long-term Debt | -0- | -0- | -0- | -0- | -0- | -0- | ||||||||||||
Shareholder’s Equity | $ | 58,000,942 | $ | 21,309,671 | $ | 4,838,478 | $ | 311,860 | $ | 10,830 | $ | 61,628 | ||||||
Weighted Average Number of Shares Outstanding | 69,706,082 | 44,447,269 | 27,696,443 | 14,373,675 | 8,076,175 | 6,588,847 | ||||||||||||
No dividends have been declared in any of the periods presented above.
Non-GAAP Financial Measure
We use EBITDA, adjusted as described below, referred to in this prospectus as Adjusted EBITDA, as a supplemental measure or our performance that is not required by, or presented in accordance with, GAAP. We define Adjusted EBITDA as net income before (i) interest expense, (ii) income taxes, (iii) depreciation , depletion and amortization, (iv) non-cash expenses relating to share based payments under FAS 123R, (v) pre-tax unrealized gains and losses on foreign currency and (vi) accretion of abandonment liability. We present Adjusted EBITDA because we consider it an important supplemental measure of our performance, in particular because it excludes amounts, such as expenses relating to share-based payments and unrealized gains and losses on foreign currency, that do not relate directly to our operating performance. Because the use of Adjusted EBITDA facilitates comparisons of our historical operating performance on a more consistent basis, we use this measure for business planning and analysis purposes and in assessing acquisition opportunities and overall rates of return.
Adjusted EBITDA is not a measurement of our financial performance under GAAP and should not be considered as an alternative to net income, operating income or any other performance measure derived in accordance with GAAP, as an alternative to cash flow from operating activities or as a measure of our liquidity. You should not assume that the Adjusted EBITDA amounts shown in this prospectus are comparable to Adjusted EBITDA amounts disclosed by other companies. In evaluating Adjusted EBITDA, you should be aware that it excludes expenses that we will incur in the future on a recurring basis.
Adjusted EBITDA has limitations as an analytical tool, and you should not consider it in isolation. Some of its limitations are:
| • | it does not reflect non-cash costs of our stock incentive plans, which are an ongoing component of our employee compensation program; and |
| • | although depletion, depreciation and amortization are non-cash charges, the assets being depleted, depreciated and amortized will often have to be replaced in the future, and Adjusted EBITDA does not reflect the cost or cash requirements for such replacements. |
34
Table of Contents
We compensate for these limitations by relying primarily on our GAAP results and using Adjusted EBITDA only supplementally. The following table presents a reconciliation of our net income to our Adjusted EBITDA on a historical basis for each of the periods indicated.
| Nine Months Ended September 30 | Year Ended December 31, | Seven Months 2001 | |||||||||||||||||||||||||
| 2006 | 2005 | 2005 | 2004 | 2003 | 2002 | ||||||||||||||||||||||
Net income / (Loss) | $ | (1,402,912 | ) | $ | (868,210 | ) | $ | (2,005,091 | ) | $ | (1,062,100 | ) | $ | (275,683 | ) | $ | (87,670 | ) | $ | 289,191 | |||||||
Add back: | |||||||||||||||||||||||||||
Depreciation, depletion & amortization & abandonment liability accretion expense | 1,374,019 | 29,019 | 157,868 | 13,671 | — | — | — | ||||||||||||||||||||
(Gain) Loss on foreign currency exchange | (374,770 | ) | (9,868 | ) | 95,864 | (68,574 | ) | 2,498 | 3,251 | 4,784 | |||||||||||||||||
Stock-based compensation expense | 1,372,152 | — | 541,111 | 411,238 | 93,289 | — | — | ||||||||||||||||||||
Adjusted EBITDA | $ | 968,489 | $ | (849,059 | ) | $ | (1,210,248 | ) | $ | (705,765 | ) | $ | (179,896 | ) | $ | (84,419 | ) | $ | 293,975 | ||||||||
35
Table of Contents
MANAGEMENT’S DISCUSSION AND ANALYSIS OF FINANCIAL CONDITION AND RESULTS OF OPERATIONS
The following discussion and analysis should be read in conjunction with the “Selected Historical Financial Data” and our historical consolidated financial statements and the accompanying notes included elsewhere in this prospectus.
Overview
We are an independent energy company focused on the exploration, exploitation, acquisition and production of natural gas and crude oil in the United States. Our oil and natural gas reserves and operations are concentrated in two Rocky Mountain basins. Our corporate strategy is to internally identify prospects, acquire lands encompassing those prospects and evaluate those prospects using subsurface geology and geophysical data and exploratory drilling. Using this strategy, we have developed an oil and natural gas portfolio of proved reserves, as well as conventional and unconventional prospects that we have the opportunity to develop, explore and drill.
As of December 31, 2005, we had estimated proved reserves of 6.0 Billion Cubic Feet Equivalent with a PV-10 value of $18.2 million. Our reserves are 62% proved developed and are comprised of 48% natural gas and 52% crude oil. Our fiscal year ended December 31, 2005 marked the first year in which we recorded natural gas and crude oil reserves.
Our results of operations and financial condition are significantly affected by oil and natural gas commodity prices, which can fluctuate dramatically. The commodity prices are beyond our company’s control and are difficult to predict. The first ten months of 2006 have seen volatility in oil and natural gas prices. We believe that spot market prices reflect worldwide concerns about producers’ ability to ensure sufficient supply to meet increasing demand amid a host of uncertainties caused by political instability, a weak U.S. dollar and crude oil refining constraint. During the past several months, commodity prices have declined. Prices on the New York Mercantile Exchange, or NYMEX, for 2006 are stated in the chart below for both oil and natural gas. We receive lower prices for our oil and natural gas than what is posted on the NYMEX as a result of the location of our reserves, transportation costs and adjustments for the gravity or density of the crude oil we produce and other factors. The chart below shows the price differentials received for our products for each of the periods.
2006 | NYMEX West Texas Intermediate | Deducts* | Net Oil | NYMEX Natural Gas Settlement | Deducts* | Net Gas Price | ||||||||||||||
January | $ | 65.49 | $ | (6.90 | ) | $ | 58.59 | $ | 11.43 | $ | (2.63 | ) | $ | 8.80 | ||||||
February | $ | 61.63 | $ | (11.30 | ) | $ | 50.33 | $ | 8.40 | $ | (1.71 | ) | $ | 6.69 | ||||||
March | $ | 62.69 | $ | (13.30 | ) | $ | 49.39 | $ | 6.64 | $ | (0.56 | ) | $ | 6.08 | ||||||
April | $ | 69.44 | $ | (12.30 | ) | $ | 57.14 | $ | 7.23 | $ | (1.66 | ) | $ | 5.57 | ||||||
May | $ | 70.84 | $ | (10.00 | ) | $ | 60.84 | $ | 7.20 | $ | (1.49 | ) | $ | 5.71 | ||||||
June | $ | 70.95 | $ | (7.30 | ) | $ | 63.65 | $ | 5.93 | $ | (1.14 | ) | $ | 4.79 | ||||||
July | $ | 74.41 | $ | (6.35 | ) | $ | 68.06 | $ | 5.80 | $ | (0.82 | ) | $ | 4.98 | ||||||
August | $ | 73.04 | $ | (7.85 | ) | $ | 65.19 | $ | 7.04 | $ | (1.24 | ) | $ | 5.80 | ||||||
September | $ | 63.80 | $ | (8.20 | ) | $ | 55.60 | $ | 6.38 | $ | (1.28 | ) | $ | 5.10 | ||||||
October | $ | 59.14 | $ | (8.45 | ) | $ | 50.69 | $ | 4.20 | $ | (1.55 | ) | $ | 2.65 | ||||||
| * | Deducts include locale differentials, transportation, and gravity adjustments. |
Outlook
We believe that oil and gas prices will remain volatile during the remainder of 2006. As a result of increases in the prices of domestic oil and natural gas over the past several years, and the corresponding increased demand for oil field services, shortages have developed, and we have seen an escalation in rig rates, field service costs,
36
Table of Contents
material prices and all costs associated with drilling, completing and operating wells. If oil and natural gas prices remain high relative to historical levels, we anticipate that the recent trends toward increasing costs and equipment and personnel shortages will continue. While we have identified prospects to drill, our ability to grow could be adversely affected by these shortages and price increases.
We plan to make capital expenditures of approximately $33 million for 2006, which is a slight increase over our original 2006 capital expenditures budget of $30 million. We continuously evaluate our capital expenditures budget and make adjustments from time to time as our results of operations and other factors dictate. Though September 30, 2006, we spent $20.6 million of our capital expenditures budget. Additional detail with respect to our historical and anticipated 2006 capital expenditures are included in the following table:
Prospect Location | WI | Gross Wells | Net Wells | Estimated 2006 Expenditures | Expenditures through September 30, 2006 | ||||||||
Green River Basin | |||||||||||||
Vermillion Basin Shallow | 50.0 | % | 3 | 1.50 | 2,500,000 | 2,200,000 | |||||||
Vermillion Basin Deep | 100 | % | 2 | 2.00 | 10,500,000 | — | |||||||
Frontier Sands | 50.0 | % | 1 | 0.25 | 500,000 | — | |||||||
Acreage | 8,500,000 | 7,600,000 | |||||||||||
Total Green River Basin | 6 | 3.75 | $ | 22,000,000 | $ | 9,800,000 | |||||||
Williston Basin | |||||||||||||
Mission Canyon/Red River | 50.0 | % | 1 | .50 | 500,000 | 2,800,000 | |||||||
Bakken | 62.5 | % | 3 | 1.88 | 9,800,000 | 7,300,000 | |||||||
Acreage | 700,000 | 700,000 | |||||||||||
Total Williston Basin | 4 | 2.38 | 11,000,000 | 10,800,000 | |||||||||
Total Kodiak Oil & Gas | 10 | 6.13 | $ | 33,000,000 | $ | 20,600,000 | |||||||
Our preliminary 2007 capital expenditures budget is approximately $60 million. The following table sets forth our planned capital expenditures for our principal properties in 2007:
Prospect Location | WI | Gross Wells | Net Wells | Estimated 2007 Expenditures | ||||||
Green River Basin | ||||||||||
Vermillion Deep Operated | 100.0 | % | 7 | 7.00 | 31,500,000 | |||||
Vermillion Deep Non-Op | 25.0 | % | 2 | 0.50 | 2,250,000 | |||||
Other Projects | 50.0 | % | 2 | 1.00 | 2,500,000 | |||||
Acreage/Seismic | 5,000,000 | |||||||||
Total Green River Basin | 11 | 8.50 | 41,250,000 | |||||||
Williston Basin | ||||||||||
Mission Canyon | 50.0 | % | 3 | 1.50 | 1,500,000 | |||||
Red River | 50.0 | % | 3 | 1.50 | 4,500,000 | |||||
Bakken | 62.5 | % | 3 | 1.88 | 9,750,000 | |||||
Acreage/Seismic | 3,000,000 | |||||||||
Total Williston Basin | 9 | 4.88 | 18,750,000 | |||||||
Total Kodiak Oil & Gas | 20 | 13.38 | $ | 60,000,000 | ||||||
Critical Accounting Policies and Estimates
The preparation of our consolidated financial statements in conformity with generally accepted accounting principals in the United States, or GAAP, requires our management to make assumptions and estimates that affect the reported amounts of assets, liabilities, revenues and expenses, as well as the disclosure of contingent
37
Table of Contents
assets and liabilities at the date of our financial statements and the reported amounts of revenues and expenses during the reporting period. The following is a summary of the significant accounting policies and related estimates that affect our financial disclosures.
Oil and Natural Gas Reserves
We believe estimated reserve quantities and the related estimates of future net cash flows are the most important estimates made by an exploration and production company such as us because they affect the perceived value of our company, are used in comparative financial analysis ratios, and are used as the basis for the most significant accounting estimates in our financial statements, including the periodic calculation of depletion, depreciation and impairment of our proved oil and natural gas properties. Proved oil and natural gas reserves are the estimated quantities of crude oil, natural gas, and natural gas liquids that geological and engineering data demonstrate with reasonable certainty to be recoverable in future periods from known reservoirs under existing economic and operating conditions. We determine anticipated future cash inflows and future production and development costs by applying benchmark prices and costs, including transportation, quality and basis differentials, in effect at the end of each period to the estimated quantities of oil and natural gas remaining to be produced as of the end of that period. We reduce expected cash flows to present value using a discount rate that depends upon the purpose for which the reserve estimates will be used. For example, the standardized measure calculation required by Statement of Financial Accounting Standards (“SFAS”) No. 69, Disclosures about Oil and Gas Producing Activities, requires us to apply a 10% discount rate. Although reserve estimates are inherently imprecise, and estimates of new discoveries and undeveloped locations are more imprecise than those of established proved producing oil and natural gas properties, we make considerable effort to estimate our reserves, including through the use of independent reserves engineering consultants. Our fiscal year ended December 31, 2005 marked the first year in which we recorded oil and natural gas reserves. We expect that periodic reserve estimates will change in the future as additional information becomes available or as oil and natural gas prices and operating and capital costs change. We evaluate and estimate our oil and natural gas reserves as of December 31 of each year and at other such times throughout the year that we deem appropriate. For purposes of depletion, depreciation, and impairment, we adjust reserve quantities at all interim periods for the estimated impact of acquisitions and dispositions. Changes in depletion, depreciation or impairment calculations caused by changes in reserve quantities or net cash flows are recorded in the period in which the reserves or net cash flow estimate changes.
Impairment of Long-lived Assets
We record our property and equipment at cost. The cost of our unproved properties is withheld from the depletion base as described above, until such a time as the properties are either developed or abandoned. We review these properties periodically for possible impairment. We provide an impairment allowance on unproved property when we determine that the property will not be developed or the carrying value will not be realized. We evaluate the reliability of our proved properties and other long-lived assets whenever events or changes in circumstances indicate that the recording of impairment may be appropriate. Our impairment test compares the expected undiscounted future net revenue from a property, using escalated pricing, with the related net capitalized costs of the property at the end of the applicable period. When the net capitalized costs exceed the undiscounted future net revenue of a property, the cost of the property is added to the full cost pool.
Revenue Recognition
Our revenue recognition policy is significant because revenue is a key component of our results of operations and of the forward-looking statements contained in our analysis of liquidity and capital resources. We derive our revenue primarily from the sale of produced natural gas and crude oil. We report revenue as the gross amounts we receive before taking into account production taxes and transportation costs, which are reported as separate expenses. We record revenue in the month our production is delivered to the purchaser, but payment is
38
Table of Contents
generally received 30 to 90 days after the date of production. At the end of each month, we make estimates of the amount of production that we delivered to the purchaser and the price we will receive. We use our knowledge of our properties, their historical performance, the anticipated effect of weather conditions during the month of production, NYMEX and local spot market prices and other factors as the basis for these estimates. We record the variances between our estimates and the actual amounts we receive in the month payment is received.
Asset Retirement Obligations
We are required to recognize an estimated liability for future costs associated with the abandonment of our oil and gas properties including without limitation the costs of reclamation of our drilling sites, storage and transmission facilities and access roads. We base our estimate of the liability on the industry experience of our management and on our current understanding of federal and state regulatory requirements. Our present value calculations require us to estimate the economic lives of our properties, assume what future inflation rates apply to external estimates and determine the credit-adjusted risk-free rate to use. Our estimated asset retirement obligations are reflected in our depreciation, depletion and amortization calculations over the remaining life of our oil and gas properties.
Stock-Based Compensation
We account for stock-based compensation under the provisions of SFAS No. 123R, Accounting for Stock-Based Compensation. This statement requires us to record expense associated with the fair value of stock-based compensation. We currently use the Black-Scholes option valuation model to calculate stock based compensation.
Oil and Natural Gas Properties—Full Cost Method of Accounting
We use the full cost method of accounting whereby all costs related to the acquisition and development of oil and natural gas properties are capitalized into a single cost center referred to as a full cost pool. These costs include land acquisition costs, geological and geophysical expenses, carrying charges on non-producing properties, costs of drilling and overhead charges directly related to acquisition and exploration activities.
Capitalized costs, together with the costs of production equipment, are depleted and amortized on the unit-of-production method based on the estimated gross proved reserves as determined by independent petroleum engineers. For this purpose, we convert our petroleum products and reserves to a common unit of measure.
Costs of acquiring and evaluating unproved properties are initially excluded from depletion calculations. These unevaluated properties are assessed periodically to ascertain whether impairment has occurred. When proved reserves are assigned or the property is considered to be impaired, the cost of the property or the amount of the impairment is added to the full cost pool and becomes subject to depletion calculations.
Proceeds from the sale of oil and natural gas properties are applied against capitalized costs, with no gain or loss recognized, unless the sale would alter the rate of depletion by more than 25%. Royalties paid, net of any tax credits, received are netted against oil and natural gas sales.
In applying the full cost method, we perform a ceiling test on properties that restricts the capitalized costs less accumulated depletion from exceeding an amount equal to the estimated undiscounted value of future net revenues from proved oil and natural gas reserves, as determined by independent petroleum engineers. The estimated future revenues are based on sales prices achievable under existing contracts and posted average reference prices in effect at the end of the applicable period, and current costs, and after deducting estimated future general and administrative expenses, production related expenses, financing costs, future site restoration costs and income taxes. Under the full cost method of accounting, capitalized oil and natural gas property costs less accumulated depletion and net of deferred income taxes may not exceed an amount equal to the present
39
Table of Contents
value, discounted at 10%, of estimated future net revenues from proved oil and natural gas reserves, plus the cost, or estimated fair value if lower, of unproved properties. Should capitalized costs exceed this ceiling, we would recognize an impairment.
Foreign Currency Fluctuations
Monetary items denominated in a foreign currency, other than U.S. dollars, are converted into U.S. dollars at exchange rates prevailing at the balance sheet date. Foreign currency denomination revenue and expense items are translated at exchange rates prevailing at the transaction date. Gains or losses arising from the translations are included in operations.
Operating Results
Nine Months Ended September 30, 2006 Compared to Nine Months Ended September 30, 2005
Natural Gas production revenues. Natural gas production revenues increased by $479,908 to $558,768 for the nine months ended September 30, 2006 from $78,860 for the same period of 2005. Increased natural gas production volumes more than offset price declines between the periods. Natural gas production volumes were 93,721 Mcf for the nine months ended September 30, 2006 compared to 28,907 Mcf for the same period in 2005, whereas the average price we realized on the sale of our natural gas declined by 16.5% to $5.96 per Mcf for the nine months ended September 30, 2006 from $7.14 per Mcf for the same period of 2005. The increase in gas production volumes is due to an increase in the number of operating wells, from one well at September 30, 2005 to six at September 30, 2006.
Oil production revenues. Oil production revenues increased by $2,229,843 to $2,252,499 for the nine months ended September 30, 2006 from $22,656 for the same period of 2005. Increased oil production volumes more than offset price declines between the periods. Oil production volumes were 38,223 barrels for the nine months ended September 30, 2006 compared to 300 barrels for the same period in 2005, whereas the average price we realized on the sale of our oil declined by 1.42% to $58.93 per barrel for the nine months ended September 30, 2006 from the same period in 2005. The increase in oil production volumes is due to an increase in the number of operating wells, from one well at September 30, 2005 to six at September 30, 2006.
Interest Income. Interest income increased by $528,558 to $599,285 in 2006 for the nine months ended September 30, 2006 from $70,727 for the same period in 2005. The increase was due to the investment of funds received from our March 2006 private placement of shares of our common stock.
Oil and gas production expense.Our oil and gas production expense increased by $413,642 to $543,681 for the nine months ended September 30, 2006 from $130,039 for the same period in 2005. The increase reflects our growing production base and number of producing wells.
Depletion, depreciation, amortization and abandonment liability accretion expense. Our depletion, depreciation, amortization and abandonment liability accretion expense increased by $1,345,000 to $1,374,019 for the nine months ended September 30, 2006 from $29,019 for the same period in 2005.The increase reflects our growing production base and number of producing wells.
General and administrative expense. General and administrative expense increased by $2,379,271 to $3,270,534 for the nine months ended September 30, 2006 from $891,263 for the same period in 2005. Included in the general and administrative expense for the nine months ended September 30, 2006 in accordance with SFAS No. 123R is a stock-based compensation charge of $1,372,152 for options issued to officers, directors and employees. We did not grant any options during the nine months ended September 30, 2005. The increase in general and administrative expenses for the nine months ended September 30, 2006 also reflects an increase in our level of activity and an increase in the number of employees and related salary and payroll expense. During the nine months ended September 30, 2006, we had eleven full-time employees and two part-time employees, an
40
Table of Contents
increase of seven from the same period in 2005. Salary and payroll expense increased by $500,276 to $1,075,595 for the nine months ended September 30, 2006 from $575,319 for the same period in 2005. In 2006, we also incurred additional legal expenses and costs related to outside accounting services, as a result of our filings with the Securities and Exchange Commission, costs associated with our application for trading on the AMEX, and costs incurred in connection with our reporting to shareholders. We commenced trading on the AMEX on June 21, 2006.
Gain on currency exchange. Gain on currency exchange increased by $364,902 to $374,770 for the nine months ended September 30, 2006 from $9,868 for the same period in 2005. We received a portion of the proceeds from our March 2006 private placement of common shares in Canadian dollars. Our decision to maintain such proceeds in Canadian dollars and the subsequent strengthening of the Canadian dollar in relation to the U.S. dollar resulted in the increased gain.
Net loss. Our net loss increased by $534,702 to a net loss of $1,402,912 for the nine months ended September 30, 2006 from a net loss of $868,210 for the same period of 2005. As more fully described above, the increases in our oil and natural gas production revenues, interest income and gain on currency exchange were more than offset by increases in oil and natural gas production expense, depletion, depreciation, amortization and abandonment liability expenses and general and administrative expenses.
Adjusted EBITDA. Our earnings before interest, taxes, depreciation, depletion, amortization and abandonment liability accretion expense, gain on currency exchange and stock-based compensation expense, or Adjusted EBITDA, increased by $1,817,548 to $968,489 for the nine months ended September 30, 2006 from $(849,059) for the same period of 2005. Adjusted EBITDA is not a GAAP measure. We use this non-GAAP measure primarily to compare our results with other companies in the industry that make a similar disclosure. We believe that this measure may also be useful to investors for the same purpose. Investors should not consider this measure in isolation or as a substitute for operating income, or any other measure for determining our operating performance that is calculated in accordance with GAAP. In addition, because Adjusted EBITDA is not a GAAP measure, it may not necessarily be comparable to similarly titled measures employed by other companies. A reconciliation between Adjusted EBITDA and net income is provided in the table below:
| Nine Months Ended September 30, | ||||||||
Reconciliation of Adjusted EBITDA: | 2006 | 2005 | ||||||
Net Loss | $ | (1,402,912 | ) | $ | (868,210 | ) | ||
Add back: | ||||||||
Depreciation, depletion, amortization and abandonment liability accretion expense | 1,374,019 | 29,019 | ||||||
Gain on foreign currency exchange | (374,770 | ) | (9,868 | ) | ||||
Stock based compensation expense | 1,372,152 | — | ||||||
Adjusted EBITDA | $ | 968,489 | $ | (849,059 | ) | |||
Fiscal Year Ended December 31, 2005 as Compared to Fiscal Year Ended December 31, 2004
Natural Gas production revenues. Natural gas production revenues were $225,524 for fiscal year 2005. Natural gas production volumes were 37,751 Mcf, and the average price we realized on the sale of our natural gas was $7.14 per Mcf for fiscal year 2005. The increase in natural gas production volumes reflected the commencement of production from our first operating natural gas well in 2005. We had no natural gas production revenues in fiscal year 2004.
Oil production revenues. Oil production revenues were $140,056 for fiscal year 2005. Oil production volumes were 2,699 barrels, and the average price we realized on the sale of our oil was $51.89 per barrel for fiscal year 2005. The increase in oil production volumes reflected commencement of production from our first operating oil well in 2005. We had no oil production revenues in fiscal year 2004.
41
Table of Contents
Interest income. Interest income increased by $67,106 to $87,555 for fiscal year 2005 from $20,449 for fiscal year 2004. The increase in interest income primarily reflected higher average cash and, cash equivalent and short-term investment balances during fiscal year 2005, mainly as a result of proceeds from our financing activities.
Oil and natural gas production expense. Our oil and natural gas production expense was $201,885 for fiscal year 2004, which reflected the cost of placing wells on production. We had no wells on production in fiscal year 2004.
Depletion, depreciation, amortization and abandonment liability accretion expense. Our depletion, depreciation, amortization and abandonment liability accretion expense increased by $144,197 to $157,868 for fiscal year 2005 from $13,671 for fiscal year 2004. The increase reflects the increase in our production volume in 2005.
General and administrative expense. General and administrative expense increased by $865,157 to $2,002,609 for fiscal year 2005 from $1,137,452 for fiscal year 2004. The increase in general and administrative expense reflected additional salary and payroll expense and office overhead associated with our increased operations. During fiscal year 2005 we had eight employees, an increase of three from fiscal year 2004. The increase in expenses also reflected increased shareholder relations costs as we increased our exposure to the U.S. financial markets and a stock-based compensation charge of $541,111 for stock options issued to employees in fiscal year 2005.
Gain on currency exchange. Gain on currency exchange increased by $164,438 to $95,864 for fiscal year 2005 from a loss of $68,574 for fiscal year 2004. The strengthening of the Canadian dollar against the U.S. dollar resulted in the increased gain.
Net loss. Our net loss increased by $942,991 to a net loss of $2,005,091 for fiscal year 2005 from a net loss of $1,062,100 for fiscal year 2004. As more fully described above, the increases in our oil and natural gas production revenues, interest income and gain on currency exchange were more than offset by increases in oil and gas production expense, depletion, depreciation, amortization and abandonment liability expense and general and administrative expense.
Adjusted EBITDA. Our Adjusted EBITDA declined by $504,483 to $(1,210,248) for fiscal year 2005 from $(705,765) for fiscal year 2004. A reconciliation between Adjusted EBITDA and net income is provided in the table below:
| Year Ended December 31, | ||||||||
Reconciliation of Adjusted EBITDA: | 2005 | 2004 | ||||||
Net Loss | $ | (2,005,091 | ) | $ | (1,062,100 | ) | ||
Add back: | ||||||||
Depreciation, depletion, amortization and abandonment liability accretion expense | 157,868 | 13,671 | ||||||
Gain on foreign currency exchange | 95,864 | (68,574 | ) | |||||
Stock based compensation expense | 541,111 | 411,238 | ||||||
Adjusted EBITDA | $ | (1,210,248 | ) | $ | (705,765 | ) | ||
Fiscal Year Ended December 31, 2004 as Compared to Fiscal Year Ended December 31, 2003
During fiscal year 2004, we began to evaluate and develop additional natural gas prospects in the Green River Basin in southwestern Wyoming and to expand our oil operations into the Williston Basin in Montana and North Dakota. We incurred $399,758 for the acquisition of lands and $1,272,542 for the exploration and development of the properties during fiscal year 2004. This compares to $263,415 and $322,406 for the same expenditures during fiscal year 2003.
42
Table of Contents
Interest income. Interest income was $20,449 for fiscal year 2004. The income was due to the investment of funds received from our financing activity in fiscal year 2004. We had no interest income in 2003.
Depletion, depreciation, amortization and abandonment liability accretion expense. Our depletion, deprecation, amortization and abandonment liability accretion expense was $13,671 for fiscal year 2004. The expense primarily reflected our property acquisitions. We had no depletion, depreciation, amortization, and abandonment liability accretion expense in fiscal year 2003.
General and administrative expenses. General and administrative expenses increased by $864,267 to $1,137,452 for fiscal year 2004 from $273,185 for fiscal year 2003. The increase reflects additional salary and payroll expense and office overhead associated with our increased operations. During fiscal year 2004 we had five employees, an increase of three from fiscal year 2003. The increase in expenses also reflected increased activity level after the closing of a private placement in February 2004 and the exercise of warrants in August 2004.
Gain on currency exchange. Gain on currency exchange declined by $71,072 to $(68,574) for fiscal year 2004 from $2,498 for fiscal year 2003. We received a portion of the proceeds from our 2004 financing activity in Canadian dollars. Our decision to maintain such proceeds in Canadian dollars and the subsequent weakening of the Canadian dollar in relation to the U.S. dollar resulted in the decline.
Net loss. Our net loss increased $786,417 to a net loss of $1,062,100 for fiscal year 2004 from a net loss of $275,683 for fiscal year 2003. As more fully described above, the increase in our interest income was more than offset by increases in depletion, deprecation, amortization and abandonment liability expense and general and administrative expense and a decline in the gain on currency exchange.
Adjusted EBITDA. Our Adjusted EBITDA declined by $525,868 to $(705,765) for fiscal year 2004 from $(179,896) for fiscal year 2003. A reconciliation between Adjusted EBITDA and net income is provided in the table below:
| Year Ended December 31, | ||||||||
Reconciliation of Adjusted EBITDA: | 2004 | 2003 | ||||||
Net Loss | $ | (1,062,100 | ) | $ | (275,683 | ) | ||
Add back: | ||||||||
Depreciation, depletion, amortization and abandonment liability accretion expense | 13,671 | — | ||||||
Gain on foreign currency exchange | (68,574 | ) | 2,498 | |||||
Stock based compensation expense | 411,238 | 93,289 | ||||||
Adjusted EBITDA | $ | (705,765 | ) | $ | (179,896 | ) | ||
Liquidity and Capital Resources
We have financed our operations, property acquisitions and capital investments from the proceeds of private offerings of our equity securities and, more recently, from cash generated from operations. As of September 30, 2006, we had working capital of $21,024,758 and no long-term debt. During the nine months ended September 30, 2006, our additions to oil and natural gas properties were $20,617,392. Included in the expenditures were $6.9 million for the acquisition of mineral leaseholds in the Vermillion Basin. As a result of these property acquisitions, we revised our budgeted capital expenditures to reduce drilling expenditures on lower priority exploration prospects.
We are currently operating two rigs in the Rocky Mountain Region. We have secured one drilling rig for our two-well program in our Vermillion Basin deep-gas project area. We commenced this drilling program in October 2006 and expect to complete drilling of the first well in December 2006 and the second well during the
43
Table of Contents
first quarter of 2007. The drilling rig that we have under contract in the Williston Basin is subject to a sixty-day notice to retain. We plan to move this rig from our Grizzly prospect in McKenzie County, North Dakota to our Lowell/Wrangler prospect in Sheridan County, Montana in the fourth quarter of 2006. We anticipate utilizing this rig into the first quarter of 2007. Our future expenditures will be subject to drilling rig availability and the results of continued production. We anticipate capital expenditures of approximately $12.3 million over the final three months of 2006.
We adopted a preliminary budget for capital expenditures in 2007 of $60 million. We believe that our existing cash and short term investments and cash flow from operations and borrowing from a credit facility that we intend to establish, together with the net proceeds of our planned offering of common shares, will be sufficient to fund our anticipated 2007 exploration and development program and to meet our other cash requirements through 2007. We have filed a registration statement on Form F-1 with the SEC to register 10,000,000 common shares for sale by the Company. We are currently in discussions with a lender to establish a credit facility, and we anticipate that we may have one in place by year end.
Our ability to fund our operations in future periods will depend upon our future operating performance, and more broadly, on the availability of equity and debt financing, which will be affected by prevailing economic conditions in our industry and financial, business and other factors, some of which are beyond our control. We cannot be certain that additional funding will be available on acceptable terms, or at all. If we are unable to raise additional capital when required or on acceptable terms, we may have to significantly delay, scale back or discontinue our drilling or exploration program, seek to enter into a joint venture arrangement with a third party to fund our planned exploration and drilling programs, or seek to sell one or more of our properties.
Financial Instruments and Other Instruments
As at September 30, 2006, we had cash, accounts payable and accrued liabilities which are carried at approximate fair value because of the short maturity date of those instruments. Our management believes that we are not exposed to significant interest, currency or credit risks arising from these financial instruments.
Research and Development
As an exploration stage natural resource company, we do not normally engage in research and there were no development activities, and research and development expenditures made in the last three fiscal years.
Trend Information
Our industry has experienced a significant increase in the cost of drilling rigs and related oil field services. Drilling rigs have been difficult to contract and we cannot be assured that we can secure third party contracts. Commodity prices are at or near all time levels and we cannot be assured that they will continue at these levels. It is difficult to assure that we can retain qualified employees during a competitive period in the industry. Some or all of these situations are likely to have a material effect upon our net sales or revenues, income from continuing operations, profitability, liquidity or capital resources, or cause reported financial information not necessarily to be indicative of future operating results or financial condition.
Off-balance sheet arrangements
We have no off-balance sheet arrangements that have or are reasonably likely to have a current or future effect on our financial condition, changes in financial condition, revenues or expenses, results of operations, liquidity, capital expenditures or capital resources.
44
Table of Contents
Tabular disclosure of contractual obligations
The following table lists as of September 30, 2006 information with respect to our known contractual obligations.
| Payments due by Period | ||||||||||||||
Contractual Obligations | Total | Less than 1 year | 1-3 years | 3-5 years | More than 5 years | |||||||||
Long-Term Obligations—Office Facilities | $ | 268,700 | $ | 65,500 | $ | 144,000 | $ | 59,200 | — | |||||
We have not included asset retirement obligations as discussed in note 2 of the accompanying financial statements, as we cannot determine with accuracy the timing of such payments.
Quantitative and Qualitative Disclosures About Market Risk
Commodity Price Risk
Our primary market risk is market changes in oil and natural gas prices. Prospective revenues from the sale of products or properties will be impacted by oil and natural gas prices. A $1.00 per Mcf change in the market price of natural gas would result in approximately a $94,000 change in our gross gas production revenue for the nine-month period ended September 30, 2006. A $1.00 per barrel change in the market price of oil would result in approximately a $38,000 change in our gross oil production revenue for the nine-month period ended September 30, 2006. The impact on any potential sale of property cannot be readily determined.
Interest Rate Risk
We currently maintain some of our available cash in redeemable short-term investments, classified as cash equivalents, and our reported interest income from these short-term investments could be adversely affected by any material changes in U.S. dollar interest rates. A 1% change in the interest rate would result in approximately a $54,000 change in our interest income for the nine-month period ended September 30, 2006 if all of our cash were invested in interest-bearing notes.
45
Table of Contents
The following table lists the names of our directors, executive officers and senior staff. The directors and senior management have served in their respective capacities since their election or appointment and will serve until the next Annual General Meeting of Shareholders or until a successor is duly elected, unless the office is vacated in accordance with our Articles of Continuation.
Name and Municipality of Residence | Title | Date of Hire | Age | |||
Executive Officers | ||||||
Lynn A. Peterson—Denver, Colorado | Director, President & CEO | November 2001 | 53 | |||
James E. Catlin—Denver, Colorado | Director, Vice-President & COO | February 2001 | 59 | |||
Senior Staff | ||||||
Brian P. Ault—Denver, Colorado | Manager of Operations | October 2006 | 43 | |||
Russ D. Cunningham—Denver, Colorado | Northern Exploration Manager | September 2006 | 52 | |||
John R. Hamilton—Denver, Colorado | Land Manager | September 2006 | 63 | |||
David G. Majewski—Denver, Colorado | Southern Exploration Manager | September 2006 | 61 | |||
Directors | ||||||
Rodney D. Knutson(1), (2)—Denver, Colorado | Director | March 2001 | 64 | |||
Hugh J. Graham(1), (2)—West Vancouver, BC Canada | Director | December 1998 | 57 | |||
Herrick K. Lidstone, Jr.(1), (2)—Centennial, Colorado | Director | March 2006 | 57 | |||
Don McDonald(2)—Denver, Colorado | Director | June 2006 | 44 | |||
| (1) | Member of the Compensation Committee of the Board of Directors. |
| (2) | Member of the Audit Committee of the Board of Directors |
Except as indicated in the following biographical summaries, the business address of each officer, staff member and director is c/o Kodiak Oil & Gas Corp., 1625 Broadway, Suite 330, Denver, Colorado 80202.
Biographical Information
The following is a brief description of the employment background of our company’s directors, executive officers and senior staff:
Lynn A. Peterson has served as a director of our company since November 2001, and President and Chief Executive Officer since July 2002. Mr. Peterson has over 25 years of industry experience. Mr. Peterson was an owner of CP Resources, LLC, an independent oil and natural gas company from 1986 to 2001. Mr. Peterson served as Treasurer of Deca Energy from 1981 to 1986. Mr. Peterson was employed by Ernst and Whinney as a certified public accountant prior to this time. He received a Bachelor of Science in Accounting from the University of Northern Colorado in 1975.
James E. Catlin has served as a director of our company since February 2001 and Vice President and Chief Operating Officer since July 2002. Mr. Catlin has over 30 years of geologic experience, primarily in the Rocky Mountain Region. Mr. Catlin was an owner of CP Resources LLC, an independent oil and natural gas company from 1986 to 2001. Mr. Catlin was a founder and Vice-President of Deca Energy from 1980 to 1986 and worked as a district geologist for Petroleum Inc. and Fuelco prior to this time. He received a Bachelor of Arts and a Masters degree in geology from the University of Northern Illinois in 1973.
Brian P. Ault became Manager of Operations in October 2006. He has 20 years of oil and natural gas experience in the Rocky Mountain Region, most recently as Vice President and Operations Manager for Ultra Petroleum Corporation. While at Ultra from 1998 to 2006, Mr. Ault was responsible for operations in two natural gas fields, the Pinedale Anticline and the Jonah Field. Mr. Ault graduated from Marietta College with a Bachelor of Science in Petroleum Engineering.
46
Table of Contents
Russ D. Cunningham has 27 years experience in oil and natural gas exploration, primarily in the Rocky Mountain Region and the Mid-Continent Region, as well as international experience in Colombia, South America and Russia. Mr. Cunningham was most recently with Cabot Oil and Gas Corporation exploring in Wyoming’s Wind River Basin, the Paradox Basin of Colorado and Utah, and the Williston Basin of Montana and North Dakota. Prior to Cabot, Mr. Cunningham served as Vice-President Exploration for GHK Colombia Company, a subsidiary of Seven Seas Exploration. Mr. Cunningham has a Masters Degree in Geology from the University of Tulsa and is a member of the American Association of Petroleum Geologists, Society of Economic Paleontologists and Mineralogists and the Geologic Society of America.
John R. Hamilton has spent over 38 years in the industry, primarily in the Rocky Mountain Region and the Mid-Continent Region. Mr. Hamilton spent most of his career with Amoco Production Company and was most recently employed by HRF Exploration & Production, Inc. in Denver where he was involved in all phases of land acquisition, prospect generation and operations. Mr. Hamilton attended Pittsburg State College, where he earned a Bachelor of Science in Business Administration. He is a member of various landmen associations.
David G. Majewski has 31 years of experience focused throughout the Rocky Mountain Region. Mr. Majewski joined our company from Cabot Oil and Gas Corporation where his exploration efforts were conducted in Wyoming’s Green River, Winder River, Big Horn and Red Desert Basins. Mr. Majewski has a Masters Degree in Geology from the Northern Illinois University and is a member of the American Association of Petroleum Geologists, Rocky Mountain Association of Geologists and the Society of Economic Paleontologists and Mineralogists.
Rodney D. Knutson has served as a director of our company since March 2001. Mr. Knutson is an attorney at law in a private practice and has over 30 years experience working with oil, gas and mining companies. Mr. Knutson has been in private practice over the past ten years. Mr. Knutson has a Bachelor of Electrical Engineering (1965) from the University of Minnesota and a Juris Doctor (1972) from the University of Denver. Mr. Knutson is a former president of the Rocky Mountain Mineral Law Foundation. Mr. Knutson’s business address is 1208 Quail Street, Lakewood, Colorado 80215.
Hugh J. Graham has served as a director of our company since December 1998. Mr. Graham is the President and Chief Executive Officer of the Murex Corporation located in Vancouver, Canada. Mr. Graham is the former President of Hunter Douglas (Canada) Inc., the Canadian division of an international conglomerate and smelter of aluminum. Mr. Graham currently serves on the board of three international corporations. Mr. Graham’s business address is Suite 200, 100 Park Royal, West Vancouver, B.C., Canada, V7T 1A2.
Herrick K. Lidstone, Jr. has served as a director of our company since March 2006. Mr. Lidstone is an attorney at law in Greenwood Village, Colorado, and is currently with Burns, Figa & Will, P.C., where he practices in corporate and securities law, dealing frequently with mergers and acquisitions, finance transactions, and private and public security offerings. Mr. Lidstone serves on the Securities Board for the Department of Regulatory Agencies in Colorado. He has been Adjunct Professor of Law at the University of Denver and has taught continuing education courses for the National Business Institute and other CLE providers. He has numerous legal publications and presentations to his credit. Mr. Lidstone received a Bachelor of Arts from Cornell University in 1971 and a Juris Doctor from the University of Colorado School of Law in 1978. Mr. Lidstone’s business address is Suite 1000, 6400 Fiddler’s Green Circle, Greenwood, Colorado 80111.
Don McDonald has served as a director of our company since June 2006. He is a certified public accountant with Houston-based Albrecht & Associates, a leading oil and natural gas divestiture firm. Prior to joining Albrecht in 2006, he helped establish the energy lending division for Bank of the West in Denver. Mr. McDonald holds a Master of Science in Accounting from the University of Colorado and a Bachelor of Business Administration in Finance from the University of Iowa. During a 20-year career as a senior financial officer in several regional and super regional financial institutions, McDonald specialized in energy lending, with expertise in financial areas of accounting systems, controller-side stewardship, and debt structuring. McDonald is active in
47
Table of Contents
the Council of Petroleum Accountants Society, the Independent Petroleum Association of Mountain States, the Energy Finance Roundtable and the Colorado Society of Certified Public Accountants. Mr. McDonald’s business address is Suite 2812, 1660 Lincoln Street, Denver, Colorado 80264.
There are no family relationships among the members of the board of directors or the members of senior management of our company. There are no arrangements or understanding with major shareholders, customers, suppliers or others, pursuant to which any member of the board of directors or member of senior management was selected.
Compensation
We have two Executive Officers: Lynn A. Peterson, President and Chief Executive Officer and James E. Catlin, Chief Operating Officer. A summary of the compensation paid to the Chief Executive Officer and all Executive Officers receiving total compensation in excess of $100,000 (collectively “Named Executive Officers”) of the Company for the three most recently completed fiscal years is set forth below:
| Long Term Compensation | |||||||||||||||||
| Annual Compensation | Awards | Payouts | |||||||||||||||
Name and Principal Position and | Fiscal Year | Salary ($) | Bonus ($) | Other Annual Compen- sation($) | Securities Under Option/SARs Granted(#) | Restricted Shares or Restricted Share Units ($) | LTIP Payouts ($) | All Other Compen- sation($) | |||||||||
Lynn A. Peterson President, CEO USA | 2005 | 150,000 | 50,000 | nil | 250,000 | nil | nil | nil | |||||||||
| 2004 | 93,000 | 15,000 | nil | 425,000 | nil | nil | nil | ||||||||||
| 2003 | nil | (1) | nil | nil(2) | 468,000 | nil | nil | nil | |||||||||
James E. Catlin Chairman of the Board, Secretary, USA | 2005 | 150,000 | 50,000 | nil | 250,000 | nil | nil | nil | |||||||||
| 2004 | 93,000 | 15,000 | nil | 425,000 | nil | nil | nil | ||||||||||
| 2003 | nil | (1) | nil | nil(2) | 468,000 | nil | nil | nil | |||||||||
| (1) | Management fees in the amount of $6,412 per month in 2003 were paid to CP Resources LLC, a private company wholly-owned by Mr. Catlin and Mr. Peterson. |
| (2) | Office expenses of $1,500 per month in 2003 were paid to CP Resources LLC for rent, telephone and office expenses. |
We do not provide any pension, retirement plan or other remuneration for our directors or officers, nor are there any plans or arrangements in respect of compensation received or that may be received by Executive Officers to compensate such officers in the event of the termination of employment or a change in control of our company.
Board Practices
Our directors are elected annually and hold office until the next Annual General Meeting of the shareholders of the Company or until their successors in office are duly elected or appointed. All directors are elected for a one-year term. All officers serve at the pleasure of our Board of Directors.
Currently, each outside director is paid a cash fee of $5,000 per quarter for services to our company in addition to reimbursement for expenses. The Audit Committee chairman is paid an additional $1,500 per quarter. Each Board member is annually granted options to purchase shares of our common stock at the trading price of the stock on the date of grant. The number of share options is determined annually.
Our Board of Directors has established an Audit Committee, the members of which are Messrs. McDonald, Lidstone, Graham and Knutson. Mr. McDonald is chairman of the Audit Committee. The Audit Committee
48
Table of Contents
meets periodically with our independent accountants and management to review the scope and results of the annual audit and to review our financial statements and related reporting matters prior to the submission of the financial statements to the Board.
The Audit Committee meets as often as it determines, but not less frequently than quarterly. The committee reviews all financial statements prior to the submission of those statements to the Board of Directors for approval. In addition, the committee meets with the independent auditors at least on an annual basis to review and discuss the audit of the our financial statements. The Audit Committee pre-approves all the audit engagement terms and all non-audit services. Certain services are pre-approved by the Audit Committee on an annual basis.
We have established an Audit Committee charter that deals with the establishment of the Audit Committee and sets out its duties and responsibilities.
Our Board of Directors has established a Compensation Committee, the members of which are Messrs. Knutson, Graham and Lidstone. Mr. Knutson is chairman of the Compensation Committee.
Limitations of Liability and Indemnification
Under the Business Corporations Act (Yukon Territory), or the YBCA, the corporate statute governing us, we may indemnify an individual who:
| • | is or was our director or officer; or |
| • | at our request, is or was a director or officer of, or acted in a similar capacity for, another entity, |
against all costs, charges and expenses, including an amount paid to settle an action or satisfy a judgment reasonably incurred by the individual in respect of any civil, criminal, administrative, investigative or other proceeding in which that individual is involved because of that association with us or other entity.
However, we are prohibited from indemnifying an individual under the YBCA unless:
| • | such individual acted honestly and in good faith with a view to our best interests (or to the best interests of the other entity for which the individual acted as a director or officer or in a similar capacity at our request, as the case may be); and |
| • | in the case of a criminal or administrative action or proceeding that is enforced by a monetary penalty, such individual had reasonable grounds for believing that such individual’s conduct was lawful. |
The YBCA allows us to advance moneys to the individual for the costs, charges and expenses of any civil, criminal, administrative, investigative or other proceeding, but the individual must repay the moneys if the individual does not fulfill the conditions listed above. We may not indemnify or pay the expenses of the individual in respect of an action brought against the individual by or on behalf of us unless such indemnity or payment has been approved by the appropriate court.
We, the individual or other entity may apply to the appropriate court for an order approving indemnity under section 126 of the YBCA and the court may so order or make any further order that it sees fit. The court may order that notice be given to any interested person and that person is entitled to appear and be heard in person or by counsel.
The YBCA provides that we may purchase and maintain insurance for the benefit of any person against any liability incurred by such individual:
| • | in the individual’s capacity as a director or officer of the corporation, except when the liability relates to the individual’s failure to act honestly and in good faith with a view to the best interests of the corporation; or |
49
Table of Contents
| • | in the individual’s capacity as a director or officer of another body corporate if the individual acts or acted in that capacity at the corporation’s request, except when the liability relates to the individual’s failure to act honestly and in good faith with a view to the best interests of the corporation. |
Our General By-law No. 1, or the By-laws, provide that, subject to the limitations of the YBCA, we may purchase and maintain such insurance for the benefit of our directors and officers as our board of directors may determine.
Our By-laws provide that, subject to the YBCA, we may indemnify our directors and officers, our former directors or officers or another individual who acts or acted at our request as a director or officer, or an individual acting in a similar capacity, of another entity, against all costs, charges and expenses, including an amount paid to settle an action or satisfy a judgment, reasonably incurred by the individual in respect of any civil, criminal, administrative, investigative or other proceeding in which the individual is involved because of that association with us or other entity if:
| • | the individual acted honestly and in good faith with a view to our best interest, or as the case may be, to the best interests of the other entity for which the individual acted as director or officer or in a similar capacity at our request; and |
| • | in the case of a criminal or administrative action or proceeding that is enforced by a monetary penalty, the individual had reasonable grounds for believing that the individual’s conduct was lawful. |
We maintain liability insurance which insures our directors and officers against certain losses and that insures us against our obligations to indemnify our directors and officers.
At present, we are not aware of any pending or threatened litigation or proceeding involving any of our directors, officers, employees or agents in which indemnification would be required or permitted.
Employees
As of September 30, 2006, we employed eleven full-time and two part-time employees.
Legal Proceedings
There are no legal proceedings currently pending that could reasonably be expected to have a material adverse effect on our financial condition or results of operations. There are no material legal proceedings currently pending in which any director, any member of senior management, or any of our affiliates is either a party adverse to us or our consolidated subsidiary or has a material interest adverse to us or our consolidated subsidiary.
50
Table of Contents
Share Ownership
Beneficial Ownership of Common Stock
The following table sets forth, as of November 30, 2006, the number of the shares of our common stock beneficially owned by (a) our directors and executive officers, individually, and as a group, and (b) the percentage ownership of our outstanding common stock represented by such shares. The security holders listed below are deemed to be the beneficial owners of common stock underlying options and warrants that are exercisable within 60 days from the above date.
Unless otherwise indicated, the shareholders listed possess sole voting and investment power with respect to the shares shown. Our directors and executive officers do not have different voting rights from other shareholders.
Title of Class | Name of Beneficial Owner | Amount and Nature | Percentage of Class(1) | |||||
Common | Lynn A. Peterson | 4,426,821 | (2) | 5.7 | % | |||
Common | James E. Catlin | 3,044,950 | (3) | 3.9 | % | |||
Common | Rodney D. Knutson | 497,750 | (4) | * | ||||
Common | Hugh J. Graham | 630,676 | (5) | * | ||||
Common | Don McDonald | 30,000 | * | |||||
Common | Herrick K. Lidstone, Jr. | 150,000 | (6) | * | ||||
Common | All Directors and Executive Officers as a group (6 individuals) | 8,780,197 | 11.3 | % |
| (1) | Based on 75,306,426 shares outstanding as of November 30, 2006, plus any shares of common stock deemed to be beneficially owned pursuant to options and warrants which are exercisable within 60 days from the above date. |
| (2) | Includes 3,051,821 shares held directly by the individual, 500,000 shares held by individual’s children, and 875,000 options exercisable within 60 days. |
| (3) | Includes 2,169,950 shares held by individual and 875,000 options exercisable within 60 days. |
| (4) | Includes 247,750 shares held by individual and 250,000 options exercisable within 60 days. |
| (5) | Includes 255,676 shares held by individual and 375,000 options exercisable within 60 days. |
| (6) | Includes 150,000 options exercisable within 60 days. |
| * | Less than 1%. |
Stock Options
We have an Incentive Share Option Plan, or the Plan, that grants stock options to our directors, officers, employees and consultants. Our shareholders approved the Plan at our 2003 shareholders’ meeting and have ratified the Plan at each annual shareholders’ meeting thereafter.
51
Table of Contents
The following table sets forth, as of November 30, 2006, all stock options held by our directors and executive officers, the title and amount of securities called for by the options, the exercise price and the expiration date of the options. All options are presented in U.S. dollars.
Title of Class | Name of Optionee | Exercise Price | Expiration Date | |||
Common | Lynn A. Peterson | 425,000 @ $0.45 250,000 @ $1.08 500,000 @ $3.17 | March 1, 2009 October 16, 2010 April 14, 2011 | |||
Common | James E. Catlin | 425,000 @ $0.45 250,000 @ $1.08 500,000 @ $3.17 | March 1, 2009 October 16, 2010 April 14, 2011 | |||
Common | Rodney D. Knutson | 75,000 @ $0.45 75,000 @ $1.08 100,000 @ 3.17 | March 1, 2009 October 16, 2010 April 14, 2011 | |||
Common | Hugh J. Graham | 125,000 @ $0.14 75,000 @ $0.45 75,000 @ $1.08 100,000 @ 3.17 | December 4, 2008 March 1, 2009 October 16, 2010 April 14, 2011 | |||
Common | Herrick. K. Lidstone, Jr. | 50,000 @ $2.11 100,000 @ 3.17 | March 16, 2011 April 14, 2011 | |||
Common | Don McDonald | 100,000@$4.03 | June 27, 2011 | |||
Stock options are determined by our directors and are granted only in compliance with applicable laws and regulatory policy. The policies of the TSX-V limit the granting of stock options to our directors, officers, employees and consultants, and limit the length, number and exercise price of such options. Under the terms of the Plan, we have authorized the reservation of up to 10% of our issued and outstanding common stock for the grant of options. Some of the significant terms of the Plan are as follows:
(i) Options may be granted on authorized but unissued common stock up to but not in excess of 10% of our issued and outstanding common stock at the time of the grant.
(ii) The total number of shares of common stock reserved for issuance over the trailing 12-month period for any optionee shall not exceed 5% of our issued common stock at the time of grant, except that, as long as our common stock is listed on Tier 2 of the TSX-V, the total number of shares of common stock reserved for issuance over the trailing 12-month period for individuals engaged in an investor relations capacity shall not exceed 2% of our issued common stock at the time of grant. In addition, the total number of shares of common stock reserved for issuance over the trailing 12-month period for an individual consultant shall not exceed 2% of our issued common stock at the time of grant.
(iii) While our common stock is listed on the TSX-V, the purchase price per share of common stock for any option granted under the Plan shall not be less than the discounted market price of our common stock in accordance with the policies of the TSX-V. At such time as our common stock is listed on the Toronto Stock Exchange (the “TSX”), if ever, the purchase price per share of common stock for any option granted under the Plan shall not be less than the fair market value in accordance with the policies of the TSX.
(iv) While our common stock is listed on the Tier 2 of the TSX-V, options granted must expire no later than five years from the date of the grant. At such time as our common stock is listed on Tier 1 of the TSX-V or the TSX, options granted must expire no later than 10 years from the date of grant.
| (v) | Options may be subject to vesting restrictions, to be determined by our Board at the time of grant. |
(vi) All options granted pursuant to the Plan must be non-assignable and non-transferable.
52
Table of Contents
Major Shareholders
A major shareholder of our company is a person that beneficially owns, directly or indirectly, more than 5% of our common stock. The following table sets forth as of November 30, 2006, to the best of our knowledge, the number of shares of our common stock beneficially owned by (a) each of our major shareholders, and (b) the percentage ownership of our outstanding common stock represented by such shares. The major shareholders listed below are deemed to be the beneficial owners of shares of common stock underlying options and warrants that are exercisable within 60 days from the above date. Unless otherwise indicated, to the best of our knowledge, the shareholders listed possess sole voting and investment power with respect to the shares shown.
Name of Beneficial Owner | Common Stock Beneficially Owned | Percentage of Common Stock(1) | |||
Lynn Peterson(2) | 4,426,821 | 5.7 | % | ||
Wellington Management Company, LLP(3) | 11,337,000 | 14.6 | % | ||
Spindrift Partners, L.P.(4) | 4,285,400 | 5.5 | % | ||
Spindrift Investors (Bermuda) L.P.(5) | 5,028,500 | 6.5 | % | ||
Trapeze Asset Management, Inc.(6) | 6,601,300 | 8.5 | % | ||
Trapeze Capital Corp.(7) | 2,573,050 | 3.3 | % |
| (1) | Based on 77,831,426 shares outstanding as of November 30, 2006, plus any shares of common stock deemed to be beneficially owned pursuant to options and warrants which are exercisable within 60 days from the above date. |
| (2) | Includes 3,051,821 shares held directly by Mr. Peterson, 500,000 shares held by his children, and 875,000 issuable pursuant to options exercisable within 60 days. Mr. Peterson’s address is c/o Kodiak Oil & Gas Corp., 1625 Broadway, Suite 330, Denver Colorado 80202. |
| (3) | Wellington Management Company, LLP, or WMC, an investment adviser registered under the Investment Advisors Act of 1940, as amended, shares investment discretion and shares voting power over the securities held by certain of its investment advisory clients. In its capacity as an investment adviser, Wellington Management is deemed to have beneficial ownership over 11,337,000 shares. Of these shares, 5,028,500 are beneficially owned by Spindrift Investors (Bermuda) L.P., and 4,285,400 shares are beneficially owned by Spindrift Partners, L.P. WMC’s address is 75 State Street, Boston, Massachusetts 02109. |
| (4) | WMC acts as investment adviser to Spindrift Partners, L.P. In such capacity, Wellington shares voting and dispositive power over the shares held by this beneficial owner and, therefore, is deemed to share beneficial ownership of the shares. These 4,285,400 shares are also included in the table in the figure of shares beneficially owned by WMC. Its address is c/o Wellington Management Company, LLP 75 State Street, Boston, Massachusetts 02109. |
| (5) | WMC acts as investment adviser to Spindrift Investors (Bermuda) L.P. In such capacity, Wellington shares voting and dispositive power over the shares held by this beneficial owner and, therefore, is deemed to share beneficial ownership of the shares. These 5,028,500 shares are also included in the table in the figure of shares beneficially owned by WMC. Its address is c/o Wellington Management Company, LLP 75 State Street, Boston, Massachusetts 02109. |
| (6) | Trapeze Asset Management Inc. an investment adviser registered under the Investment Advisors Act of 1940, as amended, exercises sole investment discretion and voting power over the securities held by certain of its investment advisory clients. In its capacity as an investment adviser, Trapeze Asset Management Inc. is deemed to have beneficial ownership over 6,601,300 common shares. Its address is 22 St. Clair Avenue East, 18th Floor, Toronto, ON M4T 253, Canada. |
| (7) | Trapeze Capital Corp., a Canadian investment dealer, exercises sole investment discretion and voting power over the securities held by certain of its investment advisory clients. In its capacity as an investment adviser, Trapeze Capital Corp. is deemed to have beneficial ownership over 2,573,050 common shares. Its address is 22 St. Clair Avenue East, 18th Floor, Toronto, ON M4T 253, Canada. |
To the best of our knowledge, there are no arrangements, the operation of which, may result in a change in control of our Company.
53
Table of Contents
We paid $103,950 in 2003 to CP Resources LLC, a private company controlled by Mr. Peterson and Mr. Catlin, for administrative services, rent and salaries. Effective February 1, 2004, we began paying salaries to Mr. Peterson and Mr. Catlin and assumed responsibility for all office expenses. On July 3, 2003, we entered into an interest bearing note payable to CP Resources LLC in the amount of $264,000. The note evidenced a loan made by CP Resources LLC to us to fund our share of the drilling costs incurred on the initial two wells on our Pacific Rim CBM Project. Interest was payable at a rate of 1% over the Wells Fargo Bank prime rate. The promissory note, together with accrued interest of $8,824, was paid in full in February 2004.
SELLING SHAREHOLDERS
The following is a list of the selling shareholders who own an aggregate of 9,937,568 shares of our common stock covered in this prospectus. At December 8, 2006, we had 75,473,426 shares of common stock issued and outstanding.
| Before Offering | After Offering | ||||||||||
Name | Total of Shares | Percentage of Shares Owned | Number of Shares | Shares Owned After Offering | Percentage of Shares owned After Offering | ||||||
University of Texas Intermediate Term Fund All Cap Energy Portfolio | 46,700 | * | 46,700 | 0 | 0 | ||||||
Raytheon Master Pension Trust #2 All Cap Energy Account | 89,700 | * | 89,700 | 0 | 0 | ||||||
Raytheon Combined DB-DC Master Trust All Cap Energy | 114,200 | * | 114,200 | 0 | 0 | ||||||
University of Texas General Endowment Fund All Cap Energy Portfolio | 134,900 | * | 134,900 | 0 | 0 | ||||||
University of Texas Permanent University Fund All Cap Energy Portfolio | 250,500 | * | 250,500 | 0 | 0 | ||||||
Raytheon Combined DB/DC Master Trust Energy Hedge Account | 322,000 | * | 322,000 | 0 | 0 | ||||||
Raytheon Master Pension Trust All Cap Energy Account | 392,973 | * | 392,973 | 0 | 0 | ||||||
All-Cap Energy Hedge Fund | 435,100 | * | 435,100 | 0 | 0 | ||||||
Edison Sources Ltd. | 567,200 | * | 567,200 | 0 | 0 | ||||||
Raytheon Master Pension Trust Energy Hedge Account | 2,045,000 | 2.7 | % | 2,045,000 | 0 | 0 | |||||
SSR Energy and Natural Resources Hedge Fund LLC | 2,918,800 | 3.9 | % | 2,918,800 | 0 | 0 | |||||
Chilton International, L.P | 237,177 | * | 237,177 | 0 | 0 | ||||||
Chilton Global Natural Resource Partners, L.P. | 1,024,911 | 1.3 | % | 1,024,911 | 0 | 0 | |||||
Chilton Investment Partners, L.P | 37,704 | * | 37,704 | 0 | 0 | ||||||
Chilton QP Investment Partners, L.P. | 100,208 | * | 100,208 | 0 | 0 | ||||||
ZLP Master Opportunity Fund, Ltd. | 100,000 | * | 100,000 | 0 | 0 | ||||||
Tommye M. Barnett Trustee Enercom, Inc. Profit Sharing Plan f/b/o Gregory Barnett | 25,000 | * | 25,000 | 0 | 0 | ||||||
David Charles | 47,595 | * | 12,195 | 35,408 | * | ||||||
Satellite Fund II, L.P. | 149,899 | * | 143,979 | 5,920 | * | ||||||
Satellite Overseas Fund, Ltd. | 400,314 | * | 385,334 | 14,980 | * | ||||||
The Apogee Fund, Ltd. | 61,041 | * | 58,281 | 2,760 | * | ||||||
Satellite Fund IV, L.P. | 25,309 | * | 24,169 | 1,140 | * | ||||||
Satellite Overseas Fund V, Ltd. | 32,476 | * | 31,286 | 1,190 | * | ||||||
Satellite Overseas Fund VI, Ltd. | 9,111 | * | 8,701 | 410 | * | ||||||
Satellite Overseas Fund VII, Ltd. | 22,362 | * | 21,742 | 620 | * | ||||||
Satellite Overseas Fund VIII, Ltd. | 29,281 | * | 28,051 | 1,230 | * | ||||||
Satellite Overseas Fund IX, Ltd. | 29,807 | * | 28,457 | 1,350 | * | ||||||
Spindrift Partners L.P. | 353,300 | * | 353,300 | 0 | 0 | ||||||
TOTAL | 10,002,568 | 9,937,568 | 65,000 | * | |||||||
| * | less than 1% |
54
Table of Contents
The selling shareholders of our common stock and any of their pledgees, assignees and successors-in-interest may, from time to time, sell any or all of their shares of common stock on any stock exchange, market or trading facility on which the shares are traded or in private transactions. All proceeds will be received by the selling shareholders for their own account. These sales may be at fixed or negotiated prices. The selling shareholders may use any one or more of the following methods when selling shares:
| • | ordinary brokerage transactions and transactions in which the broker-dealer solicits purchasers; |
| • | block trades in which the broker-dealer will attempt to sell the shares as agent but may position and resell a portion of the block as principal to facilitate the transaction; |
| • | purchases by a broker-dealer as principal and resale by the broker-dealer for its account; |
| • | an exchange distribution in accordance with the rules of the applicable exchange; |
| • | privately negotiated transactions; |
| • | settlement of short sales entered into after the date of this Prospectus; |
| • | broker-dealers may agree with the selling shareholders to sell a specified number of such shares at a stipulated price per share |
| • | through the writing or settlement of options or other hedging transactions, whether through an options exchange or otherwise entered into after the date of this Prospectus; |
| • | one or more underwritten offerings on a firm commitment or best efforts basis; |
| • | any other method permitted pursuant to applicable law; and a combination of any such methods of sale. |
The selling shareholders may also sell shares under Rule 144 under the Securities Act of 1933 (the “Securities Act”), as amended, if available, rather than under this Prospectus, or transfer the securities by gift.
Agents, broker-dealers or underwriters engaged by the selling shareholders may arrange for other broker-dealers to participate in sales. Broker-dealers may receive commissions or discounts from the selling shareholders (or, if any broker-dealer acts as agent for the purchaser of shares, from the purchaser) in amounts to be negotiated. The selling shareholders do not expect these commissions and discounts to exceed what is customary in the types of transactions involved, however compensation to a particular broker-dealer might be in excess of customary commissions. If the broker-dealer is unable to sell securities acting as agent for a selling shareholder, it may purchase as principal any unsold securities at the stipulated price. Broker-dealers who acquire securities as principals may thereafter resell the securities from time to time in transactions on any stock exchange or automated interdealer quotation system on which the securities are then listed, at prices and on terms then prevailing at the time of sale, at prices related to the then-current market price or in negotiated transactions. Broker-dealers may use block transactions and sales to and through broker-dealers, including transactions of the nature described above.
The selling shareholders and any underwriters, brokers, dealers or agents that participate in the distribution of the securities may be deemed to be “underwriters” within the meaning of the Securities Act of 1933, and any discounts, concessions, commissions or fees received by them and any profit on the resale of the securities sold by them may be deemed to be underwriting discounts and commissions.
In connection with the sale of our common stock or interests therein, the selling shareholders after the date of this Prospectus may enter into hedging transactions with broker-dealers or other financial institutions, which may in turn engage in short sales of the common stock in the course of hedging the positions they assume.
The selling shareholders after the date of this Prospectus may also sell shares of our common stock short and deliver these securities to close out their short positions, or loan or pledge the common stock to broker-
55
Table of Contents
dealers that in turn may sell these securities. The selling shareholders may also enter into option or other transactions with broker-dealers or other financial institutions or the creation of one or more derivative securities which require the delivery to such broker-dealer or other financial institution of shares offered by this Prospectus, which shares such broker-dealer or other financial institution may resell pursuant to this Prospectus (as supplemented or amended to reflect such transaction).
The selling shareholders and other persons participating in the sale or distribution of the securities will be subject to applicable provisions of the Securities Exchange Act of 1934, as amended and the rules and regulations thereunder, including Regulation M. This regulation may limit the timing of purchases and sales of any of the securities by the selling shareholders and any other person. The anti-manipulation rules under the Securities Exchange Act of 1934 may apply to sales of securities in the market and to the activities of the selling shareholders and their affiliates. Furthermore, Regulation M may restrict the ability of any person engaged in the distribution of the securities to engage in market-making activities with respect to the particular securities being distributed for a period of up to five business days before the distribution. These restrictions may affect the marketability of the securities and the ability of any person or entity to engage in market-making activities with respect to the securities.
56
Table of Contents
The following summarizes the material provisions of our capital stock and important provisions of our Articles of Continuation, or the Articles, and By-laws. This summary is qualified by our Articles and By-laws, copies of which have been filed as exhibits to the registration statement of which this prospectus is a part, and by provisions of applicable law.
Objects and Purposes of the Company
Our Articles and By-laws place no restrictions upon our objects and purposes.
Directors’ Powers
Our By-laws provide that a director must disclose any material interest in a proposal, arrangement or contract with us, and must refrain from voting on any resolution with respect to such proposal, arrangement or contract except as may be permitted by the Business Corporations Act (Yukon Territory), which we refer to in this prospectus as the YBCA.
Section 4.1 of our By-laws provides that the quorum necessary for the transaction of business at any meeting of the board of directors shall consist of a majority of the directors holding office.
Section 4.18 of our By-laws provides that the remuneration of the directors may be determined from time to time by the directors. There are no restrictions in the By-laws upon the directors’ power, in the absence of an independent quorum, to vote compensation to themselves or any individual director.
Section 2.01 of our By-laws gives directors a broad discretion to borrow money upon the credit of our company; issue, re-issue, sell or pledge bonds, debentures, notes or other evidences of indebtedness or guarantees of our company, whether secured or unsecured; to the extent permitted by the YBCA, give a guarantee on our behalf to secure performance of any present or future indebtedness, liability or obligation of any person; and mortgage, hypothecate, pledge or otherwise create a security interest in all or any of our currently owned or subsequently acquired, real or personal, moveable or immoveable property, including book debts, rights, powers, franchises and undertakings, to secure any of our bonds, debentures, notes or other evidences of indebtedness or guarantees or any other of our present or future indebtedness, liability or obligation.
Qualifications of Directors
There is no provision in our Articles or By-laws imposing a requirement for retirement or non-retirement of directors under an age limit requirement.
Section 4.2 of our By-laws provides that a director shall not be required to hold a share in our capital as qualification for his/her office, but no person shall be qualified for election as a director if he/she is less than 19 years of age, if he/she is of unsound mind and has been so found by a court in Canada or elsewhere; if he/she is not an individual; or if he/she has the status of a bankrupt.
Share Rights
All of our authorized shares of common stock are of the same class and, once issued, rank equally as to dividends, voting powers, and participation in assets and in all other respects on our liquidation, dissolution or winding up, whether voluntary or involuntary, or any other distribution of our assets among our shareholders for
57
Table of Contents
the purpose of winding up our affairs. The issued common stock is not subject to call or assessment rights or any pre-emptive or conversion rights. The holders of common stock are entitled to one vote for each share of common stock on all matters to be voted on by the shareholders. There are no provisions for redemption, purchase for cancellation, surrender or purchase funds.
To change the rights of shareholders, where such rights are attached to an issued class or series of shares, the YBCA requires the consent by a separate resolution of the shareholders of the class or series of shares, as the case may be, by a two-thirds majority of all the shareholders of the class or series entitled to vote on that resolution.
Meetings
The YBCA provides that our directors must call an annual general meeting of shareholders not later than 15 months after the last preceding annual meeting. We must give to our shareholders, directors and auditor entitled to receive notice of a general meeting not less than 21 days and not more than 50 days notice before the meeting, but shareholders and any other person entitled to attend a meeting of shareholders may waive notice for a particular meeting. The YBCA requires management of a corporation, concurrently with giving notice of a meeting of shareholders, to send a form of proxy in a prescribed form to each shareholder who is entitled to receive notice of the meeting. A proxy is not required to be sent, however, if the corporation has no more than 15 shareholders entitled to vote at a meeting of shareholders with two or more joint shareholders being counted as one shareholder, or if all of the shareholders entitled to vote at a meeting waive this requirement.
Limitations on Ownership of Securities
Neither foreign law, the Articles or any other of our constituent documents impose limitations on our right to own securities.
Change in Control of Company
No provision of our Articles or By-laws would have the effect of delaying, deferring, or preventing a change in control of our company.
Ownership Threshold
There are no By-law provisions governing the ownership threshold above which shareholder ownership must be disclosed.
Material Contracts
Other than as already disclosed elsewhere in this prospectus, we have not entered into any material contracts, other than contracts entered into in the ordinary course of business, during the two year period immediately preceding the filing of this prospectus.
58
Table of Contents
Canada has no system of exchange controls. There are no exchange restrictions on borrowing from foreign countries nor on the remittance of dividends, interest, royalties and similar payments, management fees, loan repayments, settlement of trade debts, or the repatriation of capital. However, any dividends remitted to U.S. Holders, as defined below, will be subject to withholding tax. See “Canadian Federal Income Tax Considerations.”
Except as provided in the Investment Canada Act (the “Act”), as amended by the Canada-United States Free Trade Implementation Act (Canada) and the Canada-United States Free Trade Agreement, there are no limitations specific to the rights of non-Canadians to hold or vote our common stock under the laws of Canada or the Yukon Territory or in our charter documents. Our company is not a “Canadian business,” as defined in the Act; therefore, the limitations in the Act do not apply to our company.
MATERIAL INCOME TAX CONSEQUENCES
A brief description of certain provisions of the tax treaty between Canada and the United States is included below, together with a brief outline of certain taxes, including withholding provisions, to which United States security holders are subject under existing laws and regulations of Canada and the United States. The consequences, if any, of provincial, state and local taxes are not considered.
The following information is general and security holders should seek the advice of their own tax advisors, tax counsel or accountants with respect to the applicability or effect on their own individual circumstances of the matters referred to herein and of any provincial, state or local taxes.
U.S. FEDERAL INCOME TAX CONSEQUENCES
The following is a summary of certain material U.S. federal income tax consequences to a U.S. Holder (as defined below) arising from and relating to the acquisition, ownership, and disposition of common shares of the Company (“Common Shares”).
This summary is for general information purposes only and does not purport to be a complete analysis or listing of all potential U.S. federal income tax consequences that may apply to a U.S. Holder as a result of the acquisition, ownership, and disposition of Common Shares. In addition, this summary does not take into account the individual facts and circumstances of any particular U.S. Holder that may affect the U.S. federal income tax consequences of the acquisition, ownership, and disposition of Common Shares. Accordingly, this summary is not intended to be, and should not be construed as, legal or U.S. federal income tax advice with respect to any U.S. Holder. Each U.S. Holder should consult its own tax advisor regarding the U.S. federal income, U.S. state and local, and foreign tax consequences of the acquisition, ownership, and disposition of Common Shares.
Scope of this Summary
Authorities
This summary is based on the Internal Revenue Code of 1986, as amended (the “Code”), Treasury Regulations (whether final, temporary, or proposed), published rulings of the Internal Revenue Service (the “IRS”), published administrative positions of the IRS, the Convention Between Canada and the United States of America with Respect to Taxes on Income and on Capital, signed September 26, 1980, as amended (the “Canada-U.S. Tax Convention”), and U.S. court decisions that are applicable and, in each case, as in effect and available, as of the date of this prospectus. Any of the authorities on which this summary is based could be changed in a material and adverse manner at any time, and any such change could be applied on a retroactive basis. This summary does not discuss the potential effects, whether adverse or beneficial, of any proposed legislation that, if enacted, could be applied on a retroactive basis.
59
Table of Contents
U.S. Holders
For purposes of this summary, a “U.S. Holder” is a beneficial owner of Common Shares that, for U.S. federal income tax purposes, is (a) an individual who is a citizen or resident of the U.S., (b) a corporation, or any other entity classified as a corporation for U.S. federal income tax purposes, that is created or organized in or under the laws of the U.S., any state in the U.S., or the District of Columbia, (c) an estate if the income of such estate is subject to U.S. federal income tax regardless of the source of such income, or (d) a trust if (i) such trust has validly elected to be treated as a U.S. person for U.S. federal income tax purposes or (ii) a U.S. court is able to exercise primary supervision over the administration of such trust and one or more U.S. persons have the authority to control all substantial decisions of such trust.
Non-U.S. Holders
For purposes of this summary, a “non-U.S. Holder” is a beneficial owner of Common Shares other than a U.S. Holder. This summary does not address the U.S. federal income tax consequences of the acquisition, ownership, and disposition of Common Shares to non-U.S. Holders. Accordingly, a non-U.S. Holder should consult its own tax advisor regarding the U.S. federal income, U.S. state and local, and foreign tax consequences (including the potential application of and operation of any income tax treaties) of the acquisition, ownership, and disposition of Common Shares.
U.S. Holders Subject to Special U.S. Federal Income Tax Rules Not Addressed
This summary does not address the U.S. federal income tax consequences of the acquisition, ownership, and disposition of Common Shares to U.S. Holders that are subject to special provisions under the Code, including the following U.S. Holders: (a) U.S. Holders that are tax-exempt organizations, qualified retirement plans, individual retirement accounts, or other tax-deferred accounts; (b) U.S. Holders that are financial institutions, insurance companies, real estate investment trusts, or regulated investment companies; (c) U.S. Holders that are dealers in securities or currencies or U.S. Holders that are traders in securities that elect to apply a mark-to-market accounting method; (d) U.S. Holders that have a “functional currency” other than the U.S. dollar; (e) U.S. Holders that are liable for the alternative minimum tax under the Code; (f) U.S. Holders that own Common Shares as part of a straddle, hedging transaction, conversion transaction, constructive sale, or other arrangement involving more than one position; (g) U.S. Holders that acquired Common Shares in connection with the exercise of employee stock options or otherwise as compensation for services; (h) U.S. Holders that hold Common Shares other than as a capital asset within the meaning of Section 1221 of the Code; or (i) U.S. Holders that own (directly, indirectly, or constructively) 10% or more of the total combined voting power of all classes of shares of the Company entitled to vote. U.S. Holders that are subject to special provisions under the Code, including U.S. Holders described immediately above, should consult their own tax advisors regarding the U.S. federal income tax consequences of the acquisition, ownership, and disposition of Common Shares.
If an entity that is classified as a partnership for U.S. federal income tax purposes holds Common Shares, the U.S. federal income tax consequences of the acquisition, ownership, and disposition of Common Shares to such partnership and the partners of such partnership generally will depend on the activities of the partnership and the status of such partners. Partners of entities that are classified as partnerships for U.S. federal income tax purposes should consult their own tax advisors regarding the U.S. federal income tax consequences of the acquisition, ownership, and disposition of Common Shares.
Tax Consequences Other than U.S. Federal Income Tax Consequences Not Addressed
This summary does not address the U.S. state and local, U.S. federal estate and gift, or foreign tax consequences to U.S. Holders of the acquisition, ownership, and disposition of Common Shares. Each U.S. Holder should consult its own tax advisor regarding the U.S. state and local, U.S. federal estate and gift, and foreign tax consequences of the acquisition, ownership, and disposition of Common Shares.
60
Table of Contents
U.S. Federal Income Tax Consequences of the Acquisition, Ownership, and Disposition of Common Shares
Distributions on Common Shares
General Taxation of Distributions
Subject to the “passive foreign investment company” rules discussed below, a U.S. Holder that receives a distribution, including a constructive distribution, with respect to the Common Shares will be required to include the amount of such distribution in gross income as a dividend (without reduction for any Canadian income tax withheld from such distribution) to the extent of the current or accumulated “earnings and profits” of the Company, as determined for U.S. federal income tax purposes. To the extent that a distribution exceeds the current and accumulated “earnings and profits” of the Company, such distribution will be treated (a) first, as a tax-free return of capital to the extent of a U.S. Holder’s tax basis in the Common Shares and, (b) thereafter, as gain from the sale or exchange of such Common Shares. (See more detailed discussion at “Disposition of Common Shares” below).
Reduced Tax Rates for Certain Dividends
For taxable years beginning before January 1, 2011, a dividend paid by the Company generally will be taxed at the preferential tax rates applicable to long-term capital gains if (a) the Company is a “qualified foreign corporation” (as defined below), (b) the U.S. Holder receiving such dividend is an individual, estate, or trust, and (c) such dividend is paid on Common Shares that have been held by such U.S. Holder for at least 61 days during the 121-day period beginning 60 days before the “ex-dividend date.”
The Company generally will be a “qualified foreign corporation” under Section 1(h)(11) of the Code (a “QFC”) if (a) the Company is eligible for the benefits of the Canada-U.S. Tax Convention, or (b) the Common Shares are readily tradable on an established securities market in the U.S. However, even if the Company satisfies one or more of such requirements, the Company will not be treated as a QFC if the Company is a “passive foreign investment company” (as defined below) for the taxable year during which the Company pays a dividend or for the preceding taxable year.
As discussed below, the Company believes that it may have been a “passive foreign investment company” for the taxable year ended December 31, 2005, and expects that it may be a “passive foreign investment company” for the taxable year ending December 31, 2006. (See more detailed discussion at “Additional Rules that May Apply to U.S. Holders—Passive Foreign Investment Company” below). Accordingly, the Company may not be a QFC for the taxable year ending December 31, 2006.
If the Company is not a QFC, a dividend paid by the Company to a U.S. Holder, including a U.S. Holder that is an individual, estate, or trust, generally will be taxed at ordinary income tax rates (and not at the preferential tax rates applicable to long-term capital gains). The dividend rules are complex, and each U.S. Holder should consult its own tax advisor regarding the dividend rules.
Distributions Paid in Foreign Currency
The amount of a distribution received on the Common Shares in foreign currency generally will be equal to the U.S. dollar value of such distribution based on the exchange rate applicable on the date of receipt. A U.S. Holder that does not convert foreign currency received as a distribution into U.S. dollars on the date of receipt generally will have a tax basis in such foreign currency equal to the U.S. dollar value of such foreign currency on the date of receipt. Such a U.S. Holder generally will recognize ordinary income or loss on the subsequent sale or other taxable disposition of such foreign currency (including an exchange for U.S. dollars).
Dividends Received Deduction
Dividends received on the Common Shares generally will not be eligible for the “dividends received deduction.” The availability of the dividends received deduction is subject to complex limitations that are beyond the scope of this summary, and a U.S. Holder that is a corporation should consult its own tax advisor regarding the dividends received deduction.
61
Table of Contents
Disposition of Common Shares
A U.S. Holder will recognize gain or loss on the sale or other taxable disposition of Common Shares in an amount equal to the difference, if any, between (a) the amount of cash plus the fair market value of any property received and (b) such U.S. Holder’s tax basis in the Common Shares sold or otherwise disposed of. Subject to the “passive foreign investment company” rules discussed below, any such gain or loss generally will be capital gain or loss, which will be long-term capital gain or loss if the Common Shares are held for more than one year.
Preferential tax rates apply to long-term capital gains of a U.S. Holder that is an individual, estate, or trust. There are currently no preferential tax rates for long-term capital gains of a U.S. Holder that is a corporation. Deductions for capital losses are subject to significant limitations under the Code.
Foreign Tax Credit
A U.S. Holder that pays (whether directly or through withholding) Canadian income tax with respect to dividends received on the Common Shares generally will be entitled, at the election of such U.S. Holder, to receive either a deduction or a credit for such Canadian income tax paid. Generally, a credit will reduce a U.S. Holder’s U.S. federal income tax liability on a dollar-for-dollar basis, whereas a deduction will reduce a U.S. Holder’s income subject to U.S. federal income tax. This election is made on a year-by-year basis and applies to all foreign taxes paid (whether directly or through withholding) by a U.S. Holder during a taxable year.
Complex limitations apply to the foreign tax credit, including the general limitation that the credit cannot exceed the proportionate share of a U.S. Holder’s U.S. federal income tax liability that such U.S. Holder’s “foreign source” taxable income bears to such U.S. Holder’s worldwide taxable income. In applying this limitation, a U.S. Holder’s various items of income and deduction must be classified, under complex rules, as either “foreign source” or “U.S. source.” In addition, this limitation is calculated separately with respect to specific categories of income (including “passive income,” “high withholding tax interest,” “financial services income,” “general income,” and certain other categories of income). Gain or loss recognized by a U.S. Holder on the sale or other taxable disposition of Common Shares generally will be treated as “U.S. source” for purposes of applying the foreign tax credit rules. Dividends received on the Common Shares generally will be treated as “foreign source” and generally will be categorized as “passive income” or, in the case of certain U.S. Holders, “financial services income” for purposes of applying the foreign tax credit rules. However, for taxable years beginning after December 31, 2006, the foreign tax credit limitation categories are reduced to “passive category income” and “general category income” (and the other categories of income, including “financial services income,” are eliminated). The foreign tax credit rules are complex, and each U.S. Holder should consult its own tax advisor regarding the foreign tax credit rules.
Information Reporting; Backup Withholding Tax
Payments made within the U.S., or by a U.S. payor or U.S. middleman, of dividends on, or proceeds arising from the sale or other taxable disposition of, Common Shares generally will be subject to information reporting and backup withholding tax, at the rate of 28%, if a U.S. Holder (a) fails to furnish such U.S. Holder’s correct U.S. taxpayer identification number (generally on Form W-9), (b) furnishes an incorrect U.S. taxpayer identification number, (c) is notified by the IRS that such U.S. Holder has previously failed to properly report items subject to backup withholding tax, or (d) fails to certify, under penalty of perjury, that such U.S. Holder has furnished its correct U.S. taxpayer identification number and that the IRS has not notified such U.S. Holder that it is subject to backup withholding tax. However, U.S. Holders that are corporations generally are excluded from these information reporting and backup withholding tax rules. Any amounts withheld under the U.S. backup withholding tax rules will be allowed as a credit against a U.S. Holder’s U.S. federal income tax liability, if any, or will be refunded, if such U.S. Holder furnishes required information to the IRS. Each U.S. Holder should consult its own tax advisor regarding the information reporting and backup withholding tax rules.
62
Table of Contents
Additional Rules that May Apply to U.S. Holders
If the Company is a “controlled foreign corporation” or a “passive foreign investment company” (each as defined below), the preceding sections of this summary may not describe the U.S. federal income tax consequences to a U.S. Holder of the acquisition, ownership, and disposition of Common Shares.
Controlled Foreign Corporation
The Company generally will be a “controlled foreign corporation” under Section 957(a) of the Code (a “CFC”) if more than 50% of the total voting power or the total value of the outstanding shares of the Company is owned, directly or indirectly, by citizens or residents of the U.S., domestic partnerships, domestic corporations, domestic estates, or domestic trusts (each as defined in Section 7701(a)(30) of the Code), each of which own, directly or indirectly, 10% or more of the total voting power of the outstanding shares of the Company (a “10% Shareholder”).
If the Company is a CFC, a 10% Shareholder generally will be subject to current U.S. federal income tax with respect to (a) such 10% Shareholder’s pro rata share of the “subpart F income” (as defined in Section 952 of the Code) of the Company and (b) such 10% Shareholder’s pro rata share of the earnings of the Company invested in “United States property” (as defined in Section 956 of the Code). In addition, under Section 1248 of the Code, any gain recognized on the sale or other taxable disposition of Common Shares by a U.S. Holder that was a 10% Shareholder at any time during the five-year period ending with such sale or other taxable disposition generally will be treated as a dividend to the extent of the “earnings and profits” of the Company that are attributable to such Common Shares. If the Company is both a CFC and a “passive foreign investment company” (as defined below), the Company generally will be treated as a CFC (and not as a “passive foreign investment company”) with respect to any 10% Shareholder.
The Company does not believe that it has previously been, or currently is, a CFC. However, there can be no assurance that the Company will not be a CFC for the current or any subsequent taxable year.
Passive Foreign Investment Company
The Company generally will be a “passive foreign investment company” under Section 1297(a) of the Code (a “PFIC”) if, for a taxable year, (a) 75% or more of the gross income of the Company for such taxable year is passive income or (b) on average, 50% or more of the assets held by the Company either produce passive income or are held for the production of passive income, based on the fair market value of such assets (or on the adjusted tax basis of such assets, if the Company is not publicly traded and either is a “controlled foreign corporation” or makes an election). “Passive income” includes, for example, dividends, interest, certain rents and royalties, certain gains from the sale of stock and securities, and certain gains from commodities transactions. However, for transactions entered into after December 31, 2004, active business gains arising from the sale or exchange of commodities by the Company generally are excluded from “passive income” if substantially all of the Company’s commodities are (a) stock in trade of the Company or other property of a kind that would properly be included in inventory of the Company, or property held by the Company primarily for sale to customers in the ordinary course of business, (b) property used in the trade or business of the Company that would be subject to the allowance for depreciation under section 167 of the Code, or (c) supplies of a type regularly used or consumed by the Company in the ordinary course of its trade or business.
For purposes of the PFIC income test and asset test described above, if the Company owns, directly or indirectly, 25% or more of the total value of the outstanding shares of another corporation, the Company will be treated as if it (a) held a proportionate share of the assets of such other corporation and (b) received directly a proportionate share of the income of such other corporation. In addition, for purposes of the PFIC income test and asset test described above, “passive income” does not include any interest, dividends, rents, or royalties that are received or accrued by the Company from a “related person” (as defined in Section 954(d)(3) of the Code), to the extent such items are properly allocable to the income of such related person that is not passive income.
63
Table of Contents
In addition, if the company is a PFIC and owns shares of another foreign corporation that also is a PFIC, under certain indirect ownership rules, a disposition of the shares of such other foreign corporation or a distribution received from such other foreign corporation generally will be treated as an indirect disposition by a U.S. Holder or an indirect distribution received by a U.S. holder, subject to the rules of Section 1291 of the Code discussed below. To the extent that gain recognized on the actual disposition by a U.S. Holder of the company’s common stock or income recognized by a U.S. Holder on an actual distribution received on the company’s common stock was previously subject to U.S. federal income tax under these indirect ownership rules, such amount generally should not be subject to U.S. federal income tax.
The Company believes that it may have been a PFIC for the taxable year ended December 31, 2005, and expects that it may be a PFIC for the taxable year ending December 31, 2006. The determination of whether the Company was, or will be, a PFIC for a taxable year depends, in part, on the application of complex U.S. federal income tax rules, which are subject to various interpretations. In addition, whether the Company will be a PFIC for the taxable year ending December 31, 2006 and each subsequent taxable year depends on the assets and income of the Company over the course of each such taxable year and, as a result, cannot be predicted with certainty as of the date of this prospectus. Accordingly, there can be no assurance that the IRS will not challenge the determination made by the Company concerning its PFIC status or that the Company was not, or will not be, a PFIC for any taxable year.
Default PFIC Rules Under Section 1291 of the Code
If the Company is a PFIC, the U.S. federal income tax consequences to a U.S. Holder of the acquisition, ownership, and disposition of Common Shares will depend on whether such U.S. Holder makes an election to treat the Company as a “qualified electing fund” or “QEF” under Section 1295 of the Code (a “QEF Election”) or a mark-to-market election under Section 1296 of the Code (a “Mark-to-Market Election”). A U.S. Holder that does not make either a QEF Election or a Mark-to-Market Election will be referred to in this summary as a “Non-Electing U.S. Holder.”
A Non-Electing U.S. Holder will be subject to the rules of Section 1291 of the Code with respect to (a) any gain recognized on the sale or other taxable disposition of Common Shares and (b) any excess distribution received on the Common Shares. A distribution generally will be an “excess distribution” to the extent that such distribution (together with all other distributions received in the current taxable year) exceeds 125% of the average distributions received during the three preceding taxable years (or during a U.S. Holder’s holding period for the Common Shares, if shorter).
Under Section 1291 of the Code, any gain recognized on the sale or other taxable disposition of Common Shares, and any excess distribution received on the Common Shares, must be ratably allocated to each day in a Non-Electing U.S. Holder’s holding period for the Common Shares. The amount of any such gain or excess distribution allocated to prior years of such Non-Electing U.S. Holder’s holding period for the Common Shares (other than years prior to the first taxable year of the Company beginning after December 31, 1986 for which the Company was not a PFIC) will be subject to U.S. federal income tax at the highest tax rate applicable to ordinary income in each such prior year. A Non-Electing U.S. Holder will be required to pay interest on the resulting tax liability for each such prior year, calculated as if such tax liability had been due in each such prior year. Such a Non-Electing U.S. Holder that is not a corporation must treat any such interest paid as “personal interest,” which is not deductible. The amount of any such gain or excess distribution allocated to the current year of such Non-Electing U.S. Holder’s holding period for the Common Shares will be treated as ordinary income in the current year, and no interest charge will be incurred with respect to the resulting tax liability for the current year.
If the Company is a PFIC for any taxable year during which a Non-Electing U.S. Holder holds Common Shares, the Company will continue to be treated as a PFIC with respect to such Non-Electing U.S. Holder, regardless of whether the Company ceases to be a PFIC in one or more subsequent taxable years. A Non-Electing U.S. Holder may terminate this deemed PFIC status by electing to recognize gain (which will be taxed under the rules of Section 1291 of the Code discussed above) as if such Common Shares were sold on the last day of the last taxable year for which the Company was a PFIC.
64
Table of Contents
QEF Election
The procedure for making a QEF Election, and the U.S. federal income tax consequences of making a QEF Election, will depend on whether such QEF Election is timely. A QEF Election generally will be “timely” if it is made for the first year in a U.S. Holder’s holding period for the Common Shares in which the Company is a PFIC. In this case, a U.S. Holder may make a timely QEF Election by filing the appropriate QEF Election documents with such U.S. Holder’s U.S. federal income tax return for such first year. However, if the Company was a PFIC in a prior year in a U.S. Holder’s holding period for the Common Shares, then in order to be treated as making a “timely” QEF Election, such U.S. Holder must elect to recognize gain (which will be taxed under the rules of Section 1291 of the Code discussed above) as if the Common Shares were sold on the qualification date for an amount equal to the fair market value of the Common Shares on the qualification date. The “qualification date” is the first day of the first taxable year in which the Company was a QEF with respect to such U.S. Holder. In addition, under very limited circumstances, a U.S. Holder may make a retroactive QEF Election if such U.S. Holder failed to file the QEF Election documents in a timely manner.
A QEF Election will apply to the taxable year for which such QEF Election is made and to all subsequent taxable years, unless such QEF Election is invalidated or terminated or the IRS consents to revocation of such QEF Election. If a U.S. Holder makes a QEF Election and, in a subsequent taxable year, the Company ceases to be a PFIC, the QEF Election will remain in effect (although it will not be applicable) during those taxable years in which the Company is not a PFIC. Accordingly, if the Company becomes a PFIC in another subsequent taxable year, the QEF Election will be effective and the U.S. Holder will be subject to the QEF rules described above during any such subsequent taxable year in which the Company qualifies as a PFIC. In addition, the QEF Election will remain in effect (although it will not be applicable) with respect to a U.S. Holder even after such U.S. Holder disposes of all of such U.S. Holder’s direct and indirect interest in the Common Shares. Accordingly, if such U.S. Holder reacquires an interest in the Company, such U.S. Holder will be subject to the QEF rules described above for each taxable year in which the Company is a PFIC.
A U.S. Holder that makes a timely QEF Election generally will not be subject to the rules of Section 1291 of the Code discussed above. For example, a U.S. Holder that makes a timely QEF Election generally will recognize capital gain or loss on the sale or other taxable disposition of Common Shares.
However, for each taxable year in which the Company is a PFIC, a U.S. Holder that makes a QEF Election will be subject to U.S. federal income tax on such U.S. Holder’s pro rata share of (a) the net capital gain of the Company, which will be taxed as long-term capital gain to such U.S. Holder, and (b) and the ordinary earnings of the Company, which will be taxed as ordinary income to such U.S. Holder. Generally, “net capital gain” is the excess of (a) net long-term capital gain over (b) net short-term capital loss, and “ordinary earnings” are the excess of (a) “earnings and profits” over (b) net capital gain. A U.S. Holder that makes a QEF Election will be subject to U.S. federal income tax on such amounts for each taxable year in which the Company is a PFIC, regardless of whether such amounts are actually distributed to such U.S. Holder by the Company. However, a U.S. Holder that makes a QEF Election may, subject to certain limitations, elect to defer payment of current U.S. federal income tax on such amounts, subject to an interest charge. If such U.S. Holder is not a corporation, any such interest paid will be treated as “personal interest,” which is not deductible.
A U.S. Holder that makes a QEF Election generally (a) may receive a tax-free distribution from the Company to the extent that such distribution represents “earnings and profits” of the Company that were previously included in income by the U.S. Holder because of such QEF Election and (b) will adjust such U.S. Holder’s tax basis in the Common Shares to reflect the amount included in income or allowed as a tax-free distribution because of such QEF Election.
Each U.S. Holder should consult its own tax advisor regarding the availability of, and procedure for making, a QEF Election. U.S. Holders should be aware that there can be no assurance that the Company will satisfy record keeping requirements that apply to a QEF, or that the Company will supply U.S. Holders with information that such U.S. Holders require to report under the QEF rules, in the event that the Company is a PFIC and a U.S. Holder wishes to make a QEF Election.
65
Table of Contents
Mark-to-Market Election
A U.S. Holder may make a Mark-to-Market Election only if the Common Shares are marketable stock. The Common Shares generally will be “marketable stock” if the Common Shares are regularly traded on a qualified exchange or other market. For this purpose, a “qualified exchange or other market” includes (a) a national securities exchange that is registered with the Securities and Exchange Commission, (b) the national market system established pursuant to section 11A of the Securities and Exchange Act of 1934, or (c) a foreign securities exchange that is regulated or supervised by a governmental authority of the country in which the market is located, provided that (i) such foreign exchange has trading volume, listing, financial disclosure, surveillance, and other requirements designed to prevent fraudulent and manipulative acts and practices, remove impediments to and perfect the mechanism of a free, open, fair, and orderly market, and protect investors (and the laws of the country in which the foreign exchange is located and the rules of the foreign exchange ensure that such requirements are actually enforced) and (ii) the rules of such foreign exchange effectively promote active trading of listed stocks. If the Common Shares are traded on such a qualified exchange or other market, the Common Shares generally will be “regularly traded” for any calendar year during which the Common Shares are traded, other than in de minimis quantities, on at least 15 days during each calendar quarter.
A Mark-to-Market Election applies to the taxable year in which such Mark-to-Market Election is made and to each subsequent taxable year, unless the Common Shares cease to be “marketable stock” or the IRS consents to revocation of such election. Each U.S. Holder should consult its own tax advisor regarding the availability of, and procedure for making, a Mark-to-Market Election.
A U.S. Holder that makes a Mark-to-Market Election generally will not be subject to the rules of Section 1291 of the Code discussed above. However, if a U.S. Holder makes a Mark-to-Market Election after the beginning of such U.S. Holder’s holding period for the Common Shares and such U.S. Holder has not made a timely QEF Election, the rules of Section 1291 of the Code discussed above will apply to certain dispositions of, and distributions on, the Common Shares.
A U.S. Holder that makes a Mark-to-Market Election will include in ordinary income, for each taxable year in which the Company is a PFIC, an amount equal to the excess, if any, of (a) the fair market value of the Common Shares as of the close of such taxable year over (b) such U.S. Holder’s adjusted tax basis in such Common Shares. A U.S. Holder that makes a Mark-to-Market Election will be allowed a deduction in an amount equal to the lesser of (a) the excess, if any, of (i) such U.S. Holder’s adjusted tax basis in the Common Shares over (ii) the fair market value of such Common Shares as of the close of such taxable year or (b) the excess, if any, of (i) the amount included in ordinary income because of such Mark-to-Market Election for prior taxable years over (ii) the amount allowed as a deduction because of such Mark-to-Market Election for prior taxable years.
A U.S. Holder that makes a Mark-to-Market Election generally will adjust such U.S. Holder’s tax basis in the Common Shares to reflect the amount included in gross income or allowed as a deduction because of such Mark-to-Market Election. In addition, upon a sale or other taxable disposition of Common Shares, a U.S. Holder that makes a Mark-to-Market Election will recognize ordinary income or loss (not to exceed the excess, if any, of (a) the amount included in ordinary income because of such Mark-to-Market Election for prior taxable years over (b) the amount allowed as a deduction because of such Mark-to-Market Election for prior taxable years).
Other PFIC Rules
Under Section 1291(f) of the Code, the IRS has issued proposed Treasury Regulations that, subject to certain exceptions, would cause a U.S. Holder that had not made a timely QEF Election to recognize gain (but not loss) upon certain transfers of Common Shares that would otherwise be tax-deferred (such as gifts and exchanges pursuant to tax-deferred reorganizations under Section 368 of the Code). However, the specific U.S. federal income tax consequences to a U.S. Holder may vary based on the manner in which Common Shares are transferred.
66
Table of Contents
Certain additional adverse rules will apply with respect to a U.S. Holder if the Company is a PFIC, regardless of whether such U.S. Holder makes a QEF Election. For example under Section 1298(b)(6) of the Code, a U.S. Holder that uses Common Shares as security for a loan will, except as may be provided in Treasury Regulations, be treated as having made a taxable disposition of such Common Shares.
The PFIC rules are complex, and each U.S. Holder should consult its own tax advisor regarding the PFIC rules and how the PFIC rules may affect the U.S. federal income tax consequences of the acquisition, ownership, and disposition of Common Shares.
67
Table of Contents
CANADIAN FEDERAL INCOME TAX CONSIDERATIONS
The summary below is restricted to the case of a holder (a “Holder”) of one or more Common shares who for the purposes of the Income Tax Act (Canada) (the “Act”) is a non-resident of Canada, holds his Common shares as capital property and deals at arm’s length with the Company.
Dividends
A Holder will be subject to Canadian withholding tax (“Part XIII Tax”) equal to 25%, or such lower rate as may be available under an applicable tax treaty, of the gross amount of any dividend paid or deemed to be paid on these Common shares. Under the 1995 Protocol amending the Canada-U.S. Income Tax Convention (1980) (the “Treaty”) the rate of Part XIII Tax is applicable to a dividend on Common shares paid to a Holder who is a resident of the United States. The Company will be required to withhold the applicable amount of Part XIII Tax from each dividend so paid and remit the withheld amount directly to the Receiver General for Canada for the account of the Holder, which is 15% reduced to 5% if the shareholder owns at least 10% of the outstanding Common shares of the Company.
Disposition of Common Shares
A Holder who disposes of a Common share, including by deemed disposition on death, will not be subject to Canadian tax on any capital gain (or capital loss) thereby realized unless the Common share constituted “taxable Canadian property” as defined by the Act. A capital gain occurs when proceeds from the disposition of a share of other capital property exceeds the original cost. A capital loss occurs when the proceeds from the disposition of a share are less than the original cost. Under the Act, capital gain is effectively taxed at a lower rate as only 50% of the gain is effectively included in the Holder’s taxable income.
Generally, a Common share will not constitute taxable Canadian property of a Holder unless he held the Common shares as capital property used by him carrying on a business (other than an insurance business) in Canada, or he or persons with whom he did not deal at arm’s length alone or together held or held options to acquire, at any time within the five years preceding the disposition, 25% or more of the shares of any class of the capital stock of the Company. The disposition of a Common share that constitutes “taxable Canadian property” of a Holder could also result in a capital loss which can be used to reduce taxable income to the extent that such Holder can offset it against a capital gain. A capital loss cannot be used to reduce all taxable income (only that portion of taxable income derived from a capital gain).
A Holder who is a resident of the United States and realizes a capital gain on disposition of a Common share that was taxable Canadian property will nevertheless, by virtue of the Treaty, generally be exempt from Canadian tax thereon unless (a) more than 50% of the value of the Common share is derived from, or forms an interest in, Canadian real estate, including Canadian mineral resource properties, (b) the Common share formed part of the business property of a permanent establishment that the Holder has or had in Canada within the 12 months preceding disposition, or (c) the Holder (i) was a resident of Canada at any time within the ten years immediately, and for a total of 120 months during the 20 years, preceding the disposition, and (ii) owned the Common share when he ceased to be resident in Canada.
A Holder who is subject to Canadian tax in respect of a capital gain realized on disposition of a Common share must include one-half of the capital gain (taxable capital gain) in computing his taxable income earned in Canada. This Holder may, subject to certain limitations, deduct one-half of any capital loss (allowable capital loss) arising on disposition of taxable Canadian property from taxable capital gains realized in the year of disposition in respect to taxable Canadian property and, to the extent not so deductible, from such taxable capital gains of any of the three preceding years or any subsequent year.
68
Table of Contents
The following technical terms defined in this section are used throughout this prospectus:
(a) “2-D seismic or 2-D data” means seismic data that is acquired and processed to yield a two-dimensional cross-section of the subsurface.
(b) “3-D seismic or 3-D data” means seismic data that is acquired and processed to yield a three-dimensional picture of the subsurface.
(c) “Adsorption” means the action of a body, as charcoal, in condensing and holding a gas or soluble substance upon its surface.
(d) “Bbl” means one stock tank barrel, or 42 U.S. gallons liquid volume, used in reference to oil or other liquid hydrocarbons.
(e) “BOE” means barrels of oil equivalent. Oil equivalents are determined using the ratio of six Mcf of gas (including gas liquids) to one Bbl of oil.
(f) “Bore hole” means the wellbore itself, including the openhole or uncased portion of the well. Bore hole may refer to the inside diameter of the wellbore wall, the rock face that bounds the drilled hole.
(g) “Coalbed methane” is methane gas produced as a result of the coalification process, whereby plant material is progressively converted to coal, generates large quantities of methane-rich gas which are stored within the coal.
(h) “Completion” means the installation of permanent equipment for the production of oil or natural gas.
(i) “Delay rental” means a payment made to the lessor under a non-producing oil and natural gas lease at the end of each year to continue the lease in force for another year during its primary term.
(j) “Developed acreage” means the number of acres that are allocated or assignable to producing wells or wells capable of production.
(k) “Development well” means a well drilled to a known producing formation in a previously discovered field, usually offsetting a producing well on the same or an adjacent oil and natural gas lease.
(l) “Desorption” means the liberation or removal of gas from the surface of adsorbing material.
(m) “Dry hole” means a well found to be incapable of producing either oil or gas in sufficient quantities to justify completion as an oil or gas well.
(n) “Exploratory well” means a well drilled either (a) in search of a new and as yet undiscovered pool of oil or gas or (b) with the hope of significantly extending the limits of a pool already developed (also known as a “wildcat well”).
(o) “Farmin” means an agreement which allows a party to earn a full or partial working interest (also knows as an “earned working interest”) in an oil and natural gas lease in return for providing exploration funds.
(p) “Farmout” means an agreement whereby the owner of the leasehold or working interest agrees to assign a portion of his interest in certain acreage subject to the drilling of one or more specific wells or other performance by the assignee as a condition of the assignment. Under a farmout the owner of the leasehold or working interest may retain some interest such as an overriding royalty interest, an oil and natural gas payment, offset acreage or other type of interest.
(q) “Federal Unit” means acreage under federal oil and natural gas leases subject to an agreement or plan among owners of leasehold interests, which satisfies certain minimum arrangements and has been approved by an authorized representative of the U.S. Secretary of the Interior, to consolidate under a cooperative unit plan or agreement for the development of such acreage comprising a common oil and
69
Table of Contents
natural gas pool, field or like area, without regard to separate leasehold ownership of each participant and providing for the sharing of costs and benefits on a basis as defined in such agreement or plan under the supervision of a designated operator.
(r) “Fee land” means the most extensive interest that can be owned in land, including surface and mineral (including oil and natural gas) rights.
(s) “Field” means an area consisting of a single reservoir or multiple reservoirs all grouped on or related to the same individual geological structural feature or stratigraphic condition.
(t) “Fracturing” means mechanically inducing a crack or surface of breakage within rock not related to foliation or cleavage in metamorphic rock in order to enhance the permeability of rocks greatly by connecting pores together.
(u) “Gas” or “Natural gas” means the lighter hydrocarbons and associated non-hydrocarbon substances occurring naturally in an underground reservoir, which under atmospheric conditions are essentially gases but which may contain liquids.
(v) “Gross Acres” or “Gross Wells” means the total acres or wells, as the case may be, in which we have a working interest.
(w) “Hydraulic fracturing” means a procedure to stimulate production by forcing a mixture of fluid and proppant (usually sand) into the formation under high pressure. This creates artificial fractures in the reservoir rock, which increases permeability and porosity.
(x) “Horizontal drilling” means a well bore that is drilled laterally.
(y) “Landowner royalty” means that interest retained by the holder of a mineral interest upon the execution of an oil and natural gas lease which usually amounts to 1/8 of all gross revenues from oil and natural gas production unencumbered with any expenses of operation, development, or maintenance.
(z) “Leases” means full or partial interests in oil or gas properties authorizing the owner of the lease to drill for, produce and sell oil and natural gas in exchange for any or all of rental, bonus and royalty payments. Leases are generally acquired from private landowners (fee leases) and from federal and state governments on acreage held by them.
(aa) “Mcf” is an abbreviation for “1,000 cubic feet,” which is a unit of measurement of volume for natural gas.
(bb) “Methane” means a colorless, odorless, flammable gas, CH4, the first member of the methane series.
(cc) “Net Acres” or “Net Wells” is the sum of the fractional working interests owned in gross acres or wells, as the case may be, expressed as whole numbers and fractions thereof.
(dd) “Net revenue interest” means all of the working interests less all royalties, overriding royalties, non-participating royalties, net profits interest or similar burdens on or measured by production from oil and natural gas.
(ee) “NYMEX” means New York Mercantile Exchange.
(ff) “Overriding royalty” means an interest in the gross revenues or production over and above the landowner’s royalty carved out of the working interest and also unencumbered with any expenses of operation, development or maintenance.
(gg) “Operator” means the individual or company responsible to the working interest owners for the exploration, development and production of an oil or natural gas well or lease.
(hh) “Paid-Up Lease” means a lease for which the aggregate lease payments are paid in full on or prior to the commencement of the lease term.
70
Table of Contents
(ii) “Payout” means the point in time when the cumulative total of gross income from the production of oil and natural gas from a given well (and any proceeds from the sale of such well) equals the cumulative total cost and expenses of acquiring, drilling, completing, and operating such well, including tangible and intangible drilling and completion costs.
(jj) “Prospect” means a geological area which is believed to have the potential for oil and natural gas production.
(kk) “PV-10 value” means the present value of estimated future gross revenue to be generated from the production of estimated net proved reserves, net of estimated production and future development costs, using prices and costs in effect as of the date indicated (unless such prices or costs are subject to change pursuant to contractual provisions), without giving effect to non-property related expenses such as general and administrative expenses, debt service and future income tax expenses or to depreciation, depletion and amortization, discounted using an annual discount rate of 10 percent. While this measure does not include the effect of income taxes as it would in the use of the standardized measure calculation, it does provide an indicative representation of the relative value of the Company on a comparative basis to other companies and from period to period.
(ll) “Productive well” means a well that is producing oil or gas or that is capable of production.
(mm) “Proved developed reserves” means reserves that can be expected to be recovered through existing wells with existing equipment and operating methods.
(nn) “Proved reserves” means the estimated quantities of oil, gas and gas liquids which geological and engineering data demonstrate with reasonable certainty to be recoverable in future years from known reservoirs under existing economic and operating conditions.
(oo) “Proved undeveloped reserves” means reserves that are expected to be recovered from new wells on undrilled acreage, or from existing wells where a relatively major expenditure is required for recompletion.
(pp) “Recompletion” means the completion for production from an existing wellbore in a formation other than that in which the well has previously been completed.
(qq) “Reserve life” represents the estimated net proved reserves at a specified date divided by actual production for the preceding 12-month period.
(rr) “Royalty” means the share paid to the owner of mineral rights, expressed as a percentage of gross income from oil and natural gas produced and sold unencumbered by expenses relating to the drilling, completing and operating of the affected well.
(ss) “Royalty interest” means an interest in an oil and natural gas property entitling the owner to shares of oil and natural gas production, free of costs of exploration, development and production operations.
(tt) “Scf” means standard cubic feet.
(uu) “Undeveloped acreage” means lease acres on which wells have not been drilled or completed to a point that would permit the production of commercial quantities of oil and gas regardless of whether or not such acreage contains proved reserves.
(vv) “Undeveloped leasehold acreage” means the leased acreage on which wells have not been drilled or completed to a point that would permit the production of commercial quantities of oil and natural gas, regardless of whether such acreage contains estimated net proved reserves.
(ww) “Working interest” means an interest in an oil and natural gas lease entitling the holder at its expense to conduct drilling and production operations on the leased property and to receive the net revenues attributable to such interest, after deducting the landowner’s royalty, any overriding royalties, production costs, taxes and other costs.
71
Table of Contents
WHERE YOU CAN FIND MORE INFORMATION
We have filed a registration statement on Form F-1 with the Securities and Exchange Commission, or SEC, in connection with this offering. We intend to file our annual report on Form 10-K and quarterly reports on Form 10-Q, and file or furnish current reports on Form 8-K pursuant to Section 13(a) or 15(d) of the Securities Exchange Act of 1934, as amended. You may also read and copy the registration statement and any other documents we have filed at the SEC’s Public Reference Room at 100 F Street, N.E., Washington, D.C. 20549. Please call the SEC at 1-800-SEC-0330 for further information on the Public Reference Room. Our SEC filings are also available at the SEC’s Internet website at http://www.sec.gov. You may also inspect the documents described herein at our principal executive offices, 1625 Broadway, Suite 330, Denver, Colorado, 80202, during normal business hours.
In addition, we are subject to the filing requirements prescribed by the securities legislation of all Canadian provinces or territories. You are invited to read and copy any reports, statements or other information that we file with the Canadian provincial securities commissions or other similar regulatory authorities at their respective public reference rooms. These filings are also electronically available from the Canadian System for Electronic Document Analysis and Retrieval at http://www.sedar.com, which is commonly known by the acronym “SEDAR,” the Canadian equivalent of the SEC’s EDGAR system.
As a foreign private issuer, we are exempt from the rules under the Securities Exchange Act of 1934, as amended, prescribing the furnishing and content of proxy statements, and our officers, directors and principal shareholders are exempt from the reporting and short-swing profit recovery provisions contained in Section 16 of the Securities Exchange Act of 1934, as amended.
Certain legal matters relating to Canadian law and the validity of the common stock offered in this offering are being passed upon for us by Miller Thomson LLP, Vancouver, British Columbia.
The consolidated financial statements appearing in this prospectus and Registration Statement have been audited by Hein & Associates LLP, an independent registered public accounting firm, to the extent and for the periods indicated in their report appearing elsewhere herein, and are included in reliance upon such report and upon the authority of such firm as experts in accounting and auditing.
72
Table of Contents
Amisano Hanson,Chartered Accountants, of Vancouver British Columbia, an independent registered public accounting firm, has audited our consolidated balance sheets as at December 31, 2004 and the related consolidated statements of operations, shareholders’ deficiency and cash flows for each of the years ended December 31, 2003 and 2004, as set forth in their report thereon appearing elsewhere herein. We have included our consolidated financial statements in the prospectus in reliance on Amisano Hanson’s report, given on their authority as experts in accounting and auditing.
References in this prospectus to Sproule Associates, Inc. and its analysis relating to our oil and gas reserves are made in reliance on Sproule Associates, Inc.’s authority as an expert in engineering consulting.
73
Table of Contents
Interim Consolidated Financial Statements for the nine-month period ended September 30, 2006 (unaudited) | ||
Consolidated Balance Sheets September 30, 2006 (unaudited) and December 31, 2005 | F-2 | |
| F-3 | ||
Statement of Stockholders’ Equity September 30, 2006 (unaudited) and December 31, 2005 | F-4 | |
Statement of Cash Flows Nine Months Ended September 30, 2006 and 2005 (unaudited) | F-5 | |
Notes to Consolidated Financial Statements September 30, 2006 (unaudited) | F-6 | |
| F-13 | ||
Consolidated Financial Statements For The Three-Year Period Ended December 31, 2005 (Audited) | ||
| F-15 | ||
| F-16 | ||
| F-17 | ||
| F-18 | ||
| F-19 | ||
F-1
Table of Contents
CONSOLIDATED BALANCE SHEETS
| (UNAUDITED) | (AUDITED) | |||||||
| September 30, 2006 | December 31, 2005 | |||||||
ASSETS | ||||||||
Current assets: | ||||||||
Cash and cash equivalents | $ | 21,432,860 | $ | 7,285,548 | ||||
Accounts receivable | ||||||||
Trade | 1,126,530 | 447,981 | ||||||
Accrued Sales | 430,659 | 226,406 | ||||||
Prepaid expenses and other | 138,092 | 30,631 | ||||||
Total Current Assets | 23,128,141 | 7,990,566 | ||||||
Property and equipment (full cost method), at cost: | ||||||||
Proved oil and gas properties | 26,191,988 | 11,277,307 | ||||||
Unproved oil and gas properties | 12,010,614 | 6,307,903 | ||||||
Less-accumulated depletion, depreciation and amortization | (1,443,314 | ) | (121,941 | ) | ||||
| 36,759,288 | 17,463,269 | |||||||
Other property and equipment, net of accumulated depreciation of $95,904 in 2006 and $47,525 in 2005 | 158,561 | 183,481 | ||||||
Restricted Investment | 217,400 | 153,000 | ||||||
Total Assets | $ | 60,263,390 | $ | 25,790,316 | ||||
LIABILITIES AND STOCKHOLDERS’ EQUITY | ||||||||
Current Liabilities: | ||||||||
Accounts payable and accrued liabilities | $ | 2,103,383 | $ | 4,411,572 | ||||
Noncurrent liabilities: | ||||||||
Asset retirement obligation | 159,065 | 69,073 | ||||||
Total Liabilities | 2,262,448 | 4,480,645 | ||||||
Commitments and Contingencies—Note 7 | ||||||||
Stockholders’ equity: | ||||||||
Common stock, $0.01 par value: authorized—100,000,000 Issued: 74,969,426 shares in 2006 and 54,547,158 in 2005 | 749,694 | 545,472 | ||||||
Additional paid in capital | 64,483,787 | 26,593,826 | ||||||
Accumulated deficit | (7,232,539 | ) | (5,829,627 | ) | ||||
Total Stockholders’ Equity | 58,000,942 | 21,309,671 | ||||||
Total Liabilities and Stockholders’ Equity | $ | 60,263,390 | $ | 25,790,316 | ||||
SEE ACCOMPANYING NOTES
F-2
Table of Contents
CONSOLIDATED STATEMENTS OF OPERATIONS
UNAUDITED
| Three months ended September 30, | Nine months ended September 30, | |||||||||||||||
| 2006 | 2005 | 2006 | 2005 | |||||||||||||
Revenues: | ||||||||||||||||
Gas production | $ | 143,504 | $ | 65,315 | $ | 558,768 | $ | 78,860 | ||||||||
Oil production | 897,085 | 22,656 | 2,252,499 | 22,656 | ||||||||||||
Interest | 232,446 | 39,402 | 599,285 | 70,727 | ||||||||||||
Total revenue | 1,273,035 | 127,373 | 3,410,552 | 172,243 | ||||||||||||
Cost and expenses: | ||||||||||||||||
Oil and gas production | 194,021 | 55,693 | 543,681 | 130,039 | ||||||||||||
Depletion, depreciation, amortization and abandonment liability accretion | 494,829 | 15,287 | 1,374,019 | 29,019 | ||||||||||||
General and administrative | 980,100 | 289,791 | 3,270,534 | 891,263 | ||||||||||||
Gain on currency exchange | (6,627 | ) | (181,146 | ) | (374,770 | ) | (9,868 | ) | ||||||||
Total costs and expenses | 1,662,323 | 179,625 | 4,813,464 | 1,040,453 | ||||||||||||
Net loss for the period | $ | (389,288 | ) | $ | (52,252 | ) | $ | (1,402,912 | ) | $ | (868,210 | ) | ||||
Basic & diluted weighted-average common shares outstanding | 74,939,654 | 44,825,221 | 69,706,082 | 42,825,894 | ||||||||||||
Basic & diluted net loss per common share | $ | (0.01 | ) | $ | (0.00 | ) | $ | (0.02 | ) | $ | (0.02 | ) | ||||
SEE ACCOMPANYING NOTES
F-3
Table of Contents
STATEMENT OF STOCKHOLDERS’ EQUITY
UNAUDITED
| Common Stock | Contributed Surplus | Accumulated Deficit | Total Equity | ||||||||||||||
| Shares | Amount | ||||||||||||||||
Balance December 31, 2004: | 33,875,283 | $ | 338,753 | $ | 8,324,261 | $ | (3,824,536 | ) | $ | 4,838,478 | |||||||
Issuance of stocks for cash: | |||||||||||||||||
—pursuant to private placement | 17,000,000 | 170,000 | 15,474,243 | 15,644,243 | |||||||||||||
—pursuant to exercise of warrants | 3,496,875 | 34,969 | 2,480,709 | 2,515,678 | |||||||||||||
—pursuant to exercise of options | 100,000 | 1,000 | 11,122 | 12,122 | |||||||||||||
Stock issuance costs | (292,370 | ) | (292,370 | ) | |||||||||||||
Employee stock options | 75,000 | 750 | 54,750 | 55,500 | |||||||||||||
Stock based compensation | 541,111 | 541,111 | |||||||||||||||
Net loss | (2,005,091 | ) | (2,005,091 | ) | |||||||||||||
Balance December 31, 2005: | 54,547,158 | 545,472 | 26,593,826 | (5,829,627 | ) | 21,309,671 | |||||||||||
Issuance of stocks for cash: | |||||||||||||||||
—pursuant to private placement | 19,514,268 | 195,142 | 39,249,295 | 39,444,437 | |||||||||||||
—pursuant to exercise of options | 908,000 | 9,080 | 177,812 | 186,892 | |||||||||||||
Stock issuance costs | (2,909,298 | ) | (2,909,298 | ) | |||||||||||||
Stock based compensation | 1,372,152 | 1,372,152 | |||||||||||||||
Net loss | (1,402,912 | ) | (1,402,912 | ) | |||||||||||||
Balance September 30, 2006: | 74,969,426 | $ | 749,694 | $ | 64,483,787 | $ | (7,232,539 | ) | $ | 58,000,942 | |||||||
SEE ACCOMPANYING NOTES
F-4
Table of Contents
CONSOLIDATED STATEMENTS OF CASH FLOWS
UNAUDITED
| Nine Months Ended September 30, | ||||||||
| 2006 | 2005 | |||||||
Cash flows from operations | ||||||||
Net loss | $ | (1,402,912 | ) | $ | (868,210 | ) | ||
Reconciliation of net loss to net cash provided by operating activities: | ||||||||
Depletion, depreciation, amortization and abandonment liability accretion | 1,374,019 | 29,019 | ||||||
Stock based compensation | 1,372,152 | — | ||||||
Changes in current assets and liabilities | ||||||||
Accounts receivable—Trade | (678,549 | ) | (19,362 | ) | ||||
Accounts receivable—Accrued Sales | (204,253 | ) | (127,100 | ) | ||||
Prepaid expenses and other | (107,462 | ) | (599,462 | ) | ||||
Accounts payable | (728,440 | ) | 27,005 | |||||
Net cash used by operating activities | (375,445 | ) | (1,558,110 | ) | ||||
Cash flows from investing activities | ||||||||
Oil and gas properties | (22,111,417 | ) | (4,852,896 | ) | ||||
Equipment | (23,457 | ) | (76,512 | ) | ||||
Restricted investment: designated as restricted | (53,800 | ) | — | |||||
Restricted investment: undesignated as restricted | (10,600 | ) | — | |||||
Net cash used for investing activities | (22,199,274 | ) | (4,929,408 | ) | ||||
Cash flows from financing activity | ||||||||
Proceeds from the issuance of shares | 39,631,329 | 9,679,567 | ||||||
Issuance costs | (2,909,298 | ) | (292,370 | ) | ||||
Net cash provided by financing activities | 36,722,031 | 9,387,197 | ||||||
Net change in cash and cash equivalents | 14,147,312 | 2,899,679 | ||||||
Cash and cash equivalents at beginning of the period | 7,285,548 | 2,707,763 | ||||||
Cash and cash equivalents at end of the period | $ | 21,432,860 | $ | 5,607,442 | ||||
Non-cash Items | ||||||||
Oil & Gas Property accrual included in Accounts Payable | $ | 1,726,890 | $ | 325,570 | ||||
Asset retirement obligation | $ | 85,725 | $ | — | ||||
SEE ACCOMPANYING NOTES
F-5
Table of Contents
NOTES TO CONSOLIDATED FINANCIAL STATEMENTS
Note 1—Organization
Description of Operations
Kodiak Oil & Gas Corp. and its subsidiary (“Kodiak” or the “Company”) is a public company dually listed for trading on the American Stock Exchange (AMEX) and the TSX Venture Exchange and whose corporate headquarters are located in Denver, Colorado, USA. The Company is an independent energy company engaged in the exploration, exploitation, development, acquisition and production of natural gas and crude oil in the western United States.
The Company was incorporated (continued) in the Yukon Territory on September 28, 2001.
Note 2—Basis of Presentation and Significant Accounting Policies
Basis of Presentation
The consolidated financial statements include the accounts of the Company and its wholly-owned subsidiary, Kodiak Oil & Gas (USA) Inc. All significant inter-company balances and transactions have been eliminated. The majority of the Corporation’s business is transacted in US dollars and, accordingly, the financial statements are expressed in US dollars. The accompanying unaudited consolidated financial statements have been prepared in accordance with U.S. generally accepted accounting principles for interim financial information. Accordingly, they do not include all of the information and footnotes required by U.S. generally accepted accounting principles for complete financial statements. In the opinion of management, the consolidated financial statements contain all adjustments (consisting of normal recurring adjustments) considered necessary for a fair presentation of the Company’s results for the periods presented. These consolidated financial statements should be read in conjunction with the Company’s Annual Report on Form 20F for the fiscal year ended December 31, 2005. Operating results for the periods presented are not necessarily indicative of the results that may be expected for the full year.
Certain amounts in the 2005 unaudited consolidated financial statements have been reclassified to conform to the 2006 unaudited consolidated financial statement presentation; such reclassifications had no effect on the 2005 net loss.
Use of Estimates in the Preparation of Financial Statements
The preparation of the financial statements in conformity with generally accepted accounting principles requires management to make estimates and assumptions that affect the reported amounts of oil and gas reserves, assets and liabilities and disclosure of contingent assets and liabilities and disclosure of contingent assets and liabilities at the date of the financial statements and the reported amounts of revenues and expenses during the reporting period. The Company bases its estimates on historical experience and on various other assumptions it believes to be reasonable under the circumstances. Although actual results may differ from these estimates under different assumptions or conditions, the Company believes that its estimates are reasonable.
Cash and Cash Equivalents
Cash and cash equivalents consist of all highly liquid investments that are readily convertible to cash and have maturities of three months or less when purchased. The carrying value of cash and cash equivalents approximates fair value due to the short-term nature of these instruments.
Restricted Investment
The restricted investment balance as of September 30, 2006 is comprised of: (a) $175,000 certificate of deposit to collateralize a surety bond to provide for state bonding requirements for plugging and abandonment
F-6
Table of Contents
KODIAK OIL & GAS CORP.
NOTES TO CONSOLIDATED FINANCIAL STATEMENTS—(Continued)
liabilities; and (b) $42,400 certificate of deposit to collateralize the costs of office improvements that will be released over the four year remaining term of the lease at $10,600 per year. At December 31, 2005 the balance was comprised of: (a) $100,000 certificate of deposit to collateralize a surety bond to provide for state bonding requirements for plugging and abandonment liabilities; and (b) $53,000 certificate of deposit to collateralize the costs of office improvements that will be released over the five year term of the lease at $10,600 per year.
Concentration of Credit Risk
The Company’s cash equivalents and short-term investments are exposed to concentrations of credit risk. The Company manages and controls this risk by investing these funds with major financial institutions.
The Company’s receivables are comprised of oil and gas revenue receivables and joint interest billings receivable. The amounts are due from a limited number of entities. Therefore, the collectability is dependent upon the general economic conditions of the few purchasers and joint interest owners. The receivables are not collateralized. However, to date the Company has had minimal bad debts.
Oil and Gas Producing Activities
The Company follows the full cost method of accounting for oil and gas operations whereby all costs related to the exploration and development of oil and gas properties are initially capitalized into a single cost center (“full cost pool”). Such costs include land acquisition costs, geological and geophysical expenses, carrying charges on non-producing properties, and costs of drilling directly related to acquisition and exploration activities. Proceeds from property sales are generally credited to the full cost pool, with no gain or loss recognized, unless such a sale would significantly alter the relationship between capitalized costs and the proved reserves attributable to these costs. A significant alteration would typically involve a sale of 25% or more of the proved reserves related to a single full cost pool.
Costs capitalized, together with the costs of production equipment, are depleted and amortized on the unit-of-production method based on the estimated gross proved reserves as determined by independent petroleum engineers. The costs of unproved properties are withheld from the depletion base until such time as they are either developed or abandoned. When proved reserves are assigned or the property is considered to be impaired, the cost of the property or the amount of the impairment is added to costs subject to depletion calculations.
For depletion and depreciation purposes, relative volumes of oil and gas production and reserves are converted at the energy equivalent rate of six thousand cubic feet of natural gas to one barrel of crude oil.
Under the full cost method of accounting, capitalized oil and gas property costs less accumulated depletion and net of deferred income taxes may not exceed an amount equal to the present value, discounted at 10%, of estimated future net revenues from proved oil and gas reserves plus the cost, or estimated fair value, if lower, of unproved properties. Should capitalized costs exceed this ceiling, an impairment is recognized. The present value of estimated future net revenues is computed by applying current prices of oil and gas to estimated future production of proved oil and gas reserves as of period-end, less estimated future expenditures to be incurred in developing and producing the proved reserves, assuming the continuation of existing economic conditions.
Other Property and Equipment
Other property and equipment such as office furniture and equipment, vehicles, and computer hardware and software are recorded at cost. Costs of renewals and improvements that substantially extend the useful lives of the assets are capitalized. Maintenance and repair costs are expensed when incurred. Depreciation is recorded
F-7
Table of Contents
KODIAK OIL & GAS CORP.
NOTES TO CONSOLIDATED FINANCIAL STATEMENTS—(Continued)
using the straight-line method over the estimated useful lives of three years for computer equipment, and five
years for office equipment and vehicles. When other property and equipment is sold or retired, the capitalized costs and related accumulated depreciation are removed from the accounts.
Fair Value of Financial Instruments
The Company’s financial instruments including cash and cash equivalents, accounts receivable and accounts payable are carried at cost, which approximates fair value due to the short-term maturity of these instruments.
Stock-Based Compensation
The Company has historically accounted for stock-based compensation under the provisions of Statement of Financial Accounting Standards (“SFAS”) No. 123, Accounting for Stock-Based Compensation. This statement requires us to record an expense associated with the fair value of stock-based compensation. We currently use the Black-Scholes option valuation model to calculate stock based compensation at the date of grant. Option pricing models require the input of highly subjective assumptions, including the expected price volatility. Changes in these assumptions can materially affect the fair value estimate.
Asset Retirement Obligation
The Company follows SFAS No. 143, “Accounting for Asset Retirement Obligations,” which requires that the fair value of a liability for an asset retirement obligation be recognized in the period in which it was incurred if a reasonable estimate of fair value could be made. The associated asset retirement costs are capitalized as part of the carrying amount of the long-lived asset. The increase in carrying value of a property associated with the capitalization of an asset retirement cost is included in proved oil and gas properties in the consolidated balance sheets. The Company depletes the amount added to proved oil and gas property costs. The future cash outflows associated with settling the asset retirement obligations that have been accrued in the accompanying balance sheets are excluded from the ceiling test calculations. The Company also depletes the estimated dismantlement and abandonment costs, net of salvage values, associated with future development activities that have not yet been capitalized as asset retirement obligations. These costs are also included in the ceiling test calculation. The asset retirement liability will be allocated to operating expense by using a systematic and rational method. The Company has recorded a net asset of $152,725, a related liability of $159,065 (using a 8.5% discount rate and a 2.97% inflation rate). The information below reconciles the value of the asset retirement obligation for the periods presented.
| Period ended September 30, 2006 | Period ended December 31, 2005 | |||||
Balance beginning of period | $ | 69,073 | $ | — | ||
Liabilities incurred | 84,085 | 67,000 | ||||
Liabilities settled | — | — | ||||
Revisions in estimated cash flows | — | — | ||||
Accretion expense | 5,907 | 2,073 | ||||
Balance end of period | $ | 159,065 | $ | 69,073 | ||
Recently Issued Accounting Pronouncements:
In February 2006, the Financial Accounting Standards Board (FASB) issued SFAS No. 155, “Accounting for Certain Hybrid Financial Instruments-an amendment of FASB Statements No.133 and 140.” SFAS No. 155 amends SFAS No. 133, “Accounting for Derivative Instruments and Hedging
F-8
Table of Contents
KODIAK OIL & GAS CORP.
NOTES TO CONSOLIDATED FINANCIAL STATEMENTS—(Continued)
Activities” and SFAS No. 140, “Accounting for Transfers and Servicing of Financial Assets and Extinguishments of Liabilities,” and also resolves issues addressed in SFAS No. 133 Implementation Issue No. D1, “Application of Statement 133 to Beneficial Interests in Securitized Financial Assets.” SFAS No. 155 was issued to eliminate the exemption from applying SFAS No.133 to interests in securitized financial assets so that similar instruments are accounted for in a similar fashion, regardless of the instrument’s form. The Company does not believe that its financial position, results of operations or cash flows will be impacted by SFAS No.155 as the Company does not currently hold any hybrid financial instruments.
In June 2006, the FASB issued FASB Interpretation (FIN) No. 48, Accounting for Uncertainty in Income Taxes. The interpretation clarifies the accounting for uncertainty in income taxes recognized in a company’s financial statements in accordance with Statement of Financial Accounting Standards No. 109, Accounting for Income Taxes. Specifically, the pronouncement prescribes a recognition threshold and a measurement attribute for the financial statement recognition and measurement of a tax position taken or expected to be taken in a tax return. The interpretation also provides guidance on the related derecognition, classification, interest and penalties, accounting for interim periods, disclosure and transition of uncertain tax positions. The interpretation is effective for fiscal years beginning after December 15, 2006. The adoption of FIN 48 would not have a material impact on the Company’s consolidated financial position, results of operations or cash flows.
In September 2006, the FASB issued Statement of Financial Accounting Standards No. 157, “Fair Value Measurements” (“FAS 157”). This Statement defines fair value as used in numerous accounting pronouncements, establishes a framework for measuring fair value in generally accepted accounting principles and expands disclosure related to the use of fair value measures in financial statements. The Statement is to be effective for the Company’s financial statements issued in 2008; however, earlier application is encouraged. The Company is currently evaluating the timing of adoption and the impact that adoption might have on its financial position or results of operations.
In September 2006, the Securities and Exchange Commission (“SEC”) issued Staff Accounting Bulletin No. 108 (“SAB 108”). Due to diversity in practice among registrants, SAB 108 expresses SEC staff views regarding the process by which misstatements in financial statements are evaluated for purposes of determining whether financial statement restatement is necessary. SAB 108 is effective for fiscal years ending after November 15, 2006, and early application is encouraged. The Company does not believe SAB 108 will have a material impact on its financial position or results from operations.
Note 3—Property Acquisition
In March 2006, the Company completed the acquisition of 10,629 gross (9,566 net) acres of mineral leasehold in Sweetwater County, Wyoming for $6.9 million cash. The acreage is part of the Company’s Vermillion Basin projects.
Note 4—Common Stock
On March 8, 2006, the Company issued 19,514,268 common shares in a private placement to a group of accredited investors for gross proceeds of $39,444,438. The Company paid commissions and expenses of $2,909,298.
F-9
Table of Contents
KODIAK OIL & GAS CORP.
NOTES TO CONSOLIDATED FINANCIAL STATEMENTS—(Continued)
Note 5—Compensation Plan
Stock-based Compensation Plan
The Company has a stock-based compensation plan whereby share purchase options may be granted with an exercise price equal to the trading value when granted. The total number of share purchase options outstanding cannot exceed 10% of the total number of shares issued.
For the three and nine month periods ended September 30, 2006, the Company recorded stock-based compensation of $251,059 and $1,372,152, respectively. The Company did not grant any options during the same periods ended September 30, 2005.
The following assumptions were used for the Black-Scholes model:
| September 30, 2006 | ||||
Risk free rates | 5.09 | % | ||
Dividend yield | 0 | % | ||
Expected volatility | 64.92 | % | ||
Weighted average expected stock option life | 3.2 yrs | |||
The weighted average fair value at the date of grant for stock options granted is as follows: | ||||
Weighted average fair value per share | $ | 1.76 | ||
Total options granted | 1,635,000 | |||
Total weighted average fair value of options granted | $ | 2,446,068 | ||
Note 6—Stock Options
A summary of the stock options outstanding is as follows:
Number of Options | Weighted Average Exercise Price | |||||
Balance outstanding at December 31, 2004 | 3,138,500 | $ | 0.42 | |||
Granted | 900,000 | $ | 1.09 | |||
Exercised | (100,000 | ) | $ | 0.14 | ||
Balance outstanding at December 31, 2005 | 3,938,500 | $ | 0.58 | |||
Granted | 1,635,000 | $ | 3.41 | |||
Exercised | (908,000 | ) | $ | 0.14 | ||
Balance outstanding at September 30, 2006 | 4,665,500 | $ | 1.53 | |||
Options exercisable at September 30, 2006 | 3,530,000 | |||||
F-10
Table of Contents
KODIAK OIL & GAS CORP.
NOTES TO CONSOLIDATED FINANCIAL STATEMENTS—(Continued)
At September 30, 2006, stock options outstanding are as follows:
| Exercise Price | Number of Shares | Expiry Date | |||
| $ | 0.14 | 462,000 | December 4, 2008 | ||
| $ | 0.45 | 1,000,000 | March 1, 2009 | ||
| $ | 0.90 | 668,500 | August 23, 2009 | ||
| $ | 1.09 | 900,000 | October 16, 2010 | ||
| $ | 2.11 | 50,000 | March 12, 2011 | ||
| $ | 3.18 | 1,300,000 | April 14, 2011 | ||
| $ | 4.03 | 285,000 | June 28, 2011 | ||
| 4,665,500 | |||||
All stock option exercise prices have been converted to US dollars based upon the exchange rate at August 31, 2006.
Note 7—Commitments and Contingencies
The Company leases office facilities under an operating lease agreement that expires on June 30, 2010. Rent expense was $48,200 in 2005. The Company has no other capital leases and no other operating lease commitments.
The following table shows the annual rentals per year for the life of the lease:
Years Ending December 31, | |||
2006 | $ | 15,800 | |
2007 | 66,900 | ||
2008 | 70,800 | ||
2009 | 75,300 | ||
2010 | 39,900 | ||
Total | $ | 268,700 | |
During the year ended December 31, 2004, the Company entered into three one-year employment agreements. Each agreement includes the issue of 50,000 common shares, of which 25,000 were issued upon commencement and 25,000 were issued in 2005.
As is customary in the oil and gas industry, the Company may at times have commitments in place to reserve or earn certain acreage positions or wells. If the Company does not pay such commitments, the acreage positions or wells may be lost.
Note 8—Differences Between Canadian and United States Accounting Principles
These financial statements have been prepared in accordance with accounting principles generally accepted in the United States of America which differ in certain respects with those principles and practices that the Company would have followed had its financial statements been prepared in accordance with accounting principles and practices generally accepted in Canada.
F-11
Table of Contents
KODIAK OIL & GAS CORP.
NOTES TO CONSOLIDATED FINANCIAL STATEMENTS—(Continued)
The Company’s accounting principles generally accepted in the United States of America differ from accounting principles generally accepted in Canada as follows:
a) Stock-based Compensation
The Company grants stock options at exercise prices equal to the fair market value of the Company’s stock at the date of the grant. Under Statement of Financial Accounting Standards No. 123, the Company had accounted for its employee stock options under the fair value method. The fair value is determined using an option pricing model that takes into account the stock price at the grant date, the exercise price, the expected life of the option, the volatility of the underlying stock and the expected dividends, and the risk-free interest rate over the expected life of the option.
As a result of the new recommendations of the Canadian Institute of Chartered Accountants regarding accounting for stock-based compensation, there is no difference between Canadian GAAP and US GAAP for the three and nine month periods ended September 30, 2006 or 2005.
b) Comprehensive Loss
US GAAP requires disclosure of comprehensive loss which, for the Company is net loss under US GAAP plus the change in cumulative translation adjustment under US GAAP.
The concept of comprehensive loss does not come into effect until fiscal years beginning on or after October 1, 2006 for Canadian GAAP.
Management does not believe that any recently issued, not yet effective, Canadian accounting standards if currently adopted could have a material effect on the accompanying financial statements.
F-12
Table of Contents
REPORT OF INDEPENDENT REGISTERED PUBLIC ACCOUNTING FIRM
To the Board of Directors
Kodiak Oil & Gas Corp.
Denver, Colorado
We have audited the consolidated balance sheet of Kodiak Oil & Gas Corp. and subsidiaries (the “Company”) as of December 31, 2005, and the related consolidated statements of operations, stockholders’ equity, and cash flows for the year ended December 31, 2005. These financial statements are the responsibility of the Company’s management. Our responsibility is to express an opinion on these financial statements based on our audit.
We conducted our audit in accordance with the standards of the Public Company Accounting Oversight Board (United States). Those standards require that we plan and perform the audit to obtain reasonable assurance about whether the financial statements are free of material misstatement. An audit includes examining, on a test basis, evidence supporting the amounts and disclosures in the financial statements. An audit also includes assessing the accounting principles used and significant estimates made by management, as well as evaluating the overall financial statement presentation. We believe that our audit provides a reasonable basis for our opinion.
In our opinion, the consolidated financial statements referred to above present fairly, in all material respects, the financial position of Kodiak Oil & Gas Corp. and subsidiaries as of December 31, 2005, and the results of their operations and their cash flows for the year ended December 31, 2005, in conformity with U.S. generally accepted accounting principles.
/s/ Hein & Associates LLP
Denver, Colorado
April 26, 2006
F-13
Table of Contents
| A PARTNERSHIP OF INCORPORATED PROFESSIONALS | AMISANO HANSON CHARTERED ACCOUNTANTS |
REPORT OF INDEPENDENT REGISTERED PUBLIC ACCOUNTING FIRM
To the Shareholders,
Kodiak Oil & Gas Corp.
We have audited the consolidated balance sheet of Kodiak Oil & Gas Corp. as at December 31, 2004 and the consolidated statements of operations, stockholders equity and comprehensive income and cash flows for each of the years in the two year period ended December 31, 2004. These consolidated financial statements are the responsibility of the Company’s management. Our responsibility is to express an opinion on these financial statements based on our audits.
We conducted our audits in accordance with Canadian generally accepted auditing standards and the standards of the Public Company Accounting Oversight Board (United States of America). Those standards require that we plan and perform an audit to obtain reasonable assurance whether the financial statements are free of material misstatement. An audit includes examining, on a test basis, evidence supporting the amounts and disclosures in the financial statements. An audit also includes assessing the accounting principles used and significant estimates made by management, as well as evaluating the overall financial statement presentation.
In our opinion, these consolidated financial statements present fairly, in all material respects, the financial position of Kodiak Oil & Gas Corp. as at December 31, 2004 and the results of its operations and its cash flows for each of the years in the two year period ended December 31, 2004 in accordance with Canadian generally accepted accounting principles.
Vancouver, Canada April 12, 2005 | “Amisano Hanson” Chartered Accountants |
750 WEST PENDER STREET, SUITE 604 VANCOUVER CANADA V6C 2T7 | TELEPHONE: 604-689-0188 FACSIMILE: 604-689-9773 E-MAIL: amishan@telus.net |
F-14
Table of Contents
CONSOLIDATED BALANCE SHEETS
| December 31, 2005 | December 31, 2004 | |||||||
ASSETS | ||||||||
Current assets: | ||||||||
Cash and cash equivalents | $ | 7,285,548 | $ | 2,702,763 | ||||
Accounts receivable | 674,387 | 22,565 | ||||||
Prepaid expenses and other | 30,631 | 31,417 | ||||||
Total current assets | 7,990,566 | 2,756,745 | ||||||
Property and equipment (full cost method), at cost: | ||||||||
Proved oil and gas properties | 11,277,307 | |||||||
Unproved oil and gas properties | 6,307,903 | 2,357,601 | ||||||
Less-accumulated depletion, depreciation and amortization | (121,941 | ) | ||||||
| 17,463,269 | 2,357,601 | |||||||
Other property and equipment, net of accumulated depreciation of $47,525 in 2005 and $13,671 in 2004 | 183,481 | 93,140 | ||||||
| 17,646,750 | 2,450,741 | |||||||
Restricted Investment | 153,000 | — | ||||||
Total Assets | $ | 25,790,316 | $ | 5,207,486 | ||||
LIABILITIES AND STOCKHOLDERS’ EQUITY | ||||||||
Current liabilities: | ||||||||
Accounts payable | $ | 1,007,021 | $ | 328,570 | ||||
Accrued expenses | 3,404,551 | 40,438 | ||||||
Total current liabilities | 4,411,572 | 369,008 | ||||||
Noncurrent liabilities: | ||||||||
Asset retirement obligation | 69,073 | — | ||||||
Commitments and Contingencies, Notes 6 and 10 | ||||||||
Stockholders’ equity: | ||||||||
Common stock, $0.01 par value: authorized—100,000,000 Issued: 54,547,158 shares in 2005 and 33,875,283 in 2004 | 545,472 | 338,753 | ||||||
Additional paid in capital | 26,593,826 | 8,324,261 | ||||||
Accumulated deficit | (5,829,627 | ) | (3,824,536 | ) | ||||
Total stockholders’ equity | 21,309,671 | 4,838,478 | ||||||
Total Liabilities and Stockholders’ Equity | $ | 25,790,316 | $ | 5,207,486 | ||||
SEE ACCOMPANYING NOTES
F-15
Table of Contents
CONSOLIDATED STATEMENTS OF OPERATIONS
| For the Years Ended December 31 | ||||||||||||
| 2005 | 2004 | 2003 | ||||||||||
Revenues: | ||||||||||||
Gas production revenues | $ | 225,524 | $ | — | $ | — | ||||||
Oil production revenues | 140,056 | — | — | |||||||||
Interest income | 87,555 | 20,449 | — | |||||||||
Total revenue | 453,135 | 20,449 | — | |||||||||
Costs and expenses: | ||||||||||||
Oil and gas production expenses | 201,885 | — | — | |||||||||
Depletion, depreciation, amortization and abandonment liability accretion | 157,868 | 13,671 | — | |||||||||
General and administrative expenses | 2,002,609 | 1,137,452 | 273,185 | |||||||||
(Gain) / loss on currency exchange | 95,864 | (68,574 | ) | 2,498 | ||||||||
Total costs and expenses | 2,458,226 | 1,082,549 | 275,683 | |||||||||
Net loss for the period | $ | (2,005,091 | ) | $ | (1,062,100 | ) | $ | (275,683 | ) | |||
Basic & diluted weighted-average common share outstanding | 44,447,269 | 27,696,443 | 14,373,675 | |||||||||
Basic & diluted net loss per common share | $ | (0.05 | ) | $ | (0.04 | ) | $ | (0.02 | ) | |||
SEE ACCOMPANYING NOTES
F-16
Table of Contents
STATEMENT OF STOCKHOLDERS’ EQUITY
| Common Stock | Contributed Surplus | Accumulated Deficit | Total Equity | ||||||||||||||
| Shares | Amount | ||||||||||||||||
Balance January 1, 2003: | 8,266,175 | $ | 82,662 | $ | 2,414,921 | $ | (2,486,753 | ) | $ | 10,830 | |||||||
Issuance of stocks for cash: | |||||||||||||||||
—pursuant to private placement | 3,857,500 | 38,575 | 265,015 | 303,590 | |||||||||||||
—pursuant to exercise of warrants | 500,000 | 5,000 | 44,300 | 49,300 | |||||||||||||
—pursuant to exercise of options | 450,000 | 4,500 | 46,735 | 51,235 | |||||||||||||
Stock issuance costs | — | (17,970 | ) | (17,970 | ) | ||||||||||||
Issuance of stocks for property | 1,300,000 | 13,000 | 84,269 | 97,269 | |||||||||||||
Stock based compensation | 93,289 | 93,289 | |||||||||||||||
Net loss | (275,683 | ) | (275,683 | ) | |||||||||||||
Balance December 31, 2003: | 14,373,675 | 143,737 | 2,930,559 | (2,762,436 | ) | 311,860 | |||||||||||
Issuance of stocks for cash: | |||||||||||||||||
—pursuant to private placement | 11,428,572 | 114,286 | 2,857,775 | 2,972,061 | |||||||||||||
—pursuant to exercise of warrants | 7,948,036 | 79,480 | 2,328,578 | 2,408,058 | |||||||||||||
—pursuant to exercise of options | 50,000 | 500 | 5,162 | 5,662 | |||||||||||||
Stock issuance costs | (263,801 | ) | (263,801 | ) | |||||||||||||
Stock based compensation | 411,238 | 411,238 | |||||||||||||||
Employee stock options | 75,000 | 750 | 54,750 | 55,500 | |||||||||||||
Net loss | (1,062,100 | ) | (1,062,100 | ) | |||||||||||||
Balance December 31, 2004: | 33,875,283 | 338,753 | 8,324,261 | (3,824,536 | ) | 4,838,478 | |||||||||||
Issuance of stocks for cash: | |||||||||||||||||
—pursuant to private placement | 17,000,000 | 170,000 | 15,474,243 | 15,644,243 | |||||||||||||
—pursuant to exercise of warrants | 3,496,875 | 34,969 | 2,480,709 | 2,515,678 | |||||||||||||
—pursuant to exercise of options | 100,000 | 1,000 | 11,122 | 12,122 | |||||||||||||
Stock issuance costs | (292,370 | ) | (292,370 | ) | |||||||||||||
Employee stock options | 75,000 | 750 | 54,750 | 55,500 | |||||||||||||
Stock based compensation | 541,111 | 541,111 | |||||||||||||||
Net loss | (2,005,091 | ) | (2,005,091 | ) | |||||||||||||
Balance December 31, 2005: | 54,547,158 | $ | 545,472 | $ | 26,593,826 | $ | (5,829,627 | ) | $ | 21,309,671 | |||||||
SEE ACCOMPANYING NOTES
F-17
Table of Contents
CONSOLIDATED STATEMENTS OF CASH FLOWS
| For the Years Ended December 31 | ||||||||||||
| 2005 | 2004 | 2003 | ||||||||||
Reconciliation of net loss to net cash provided by operating activities: | ||||||||||||
Net loss | $ | (2,005,091 | ) | $ | (1,062,100 | ) | $ | (275,683 | ) | |||
Adjustments to reconcile net loss to net cash provided by operating activities: | ||||||||||||
Depletion, depreciation, amortization and abandonment liability accretion | 157,867 | 13,671 | — | |||||||||
Stock based compensation | 541,111 | 411,238 | 93,289 | |||||||||
Changes in current assets and liabilities | ||||||||||||
Accounts receivable | (424,322 | ) | (53,505 | ) | (302 | ) | ||||||
Other receivables | (227,500 | ) | — | — | ||||||||
Prepaid expenses and other | 786 | — | — | |||||||||
Accounts payable | 678,453 | 281,083 | 38,124 | |||||||||
Accrued expenses | 57,473 | — | — | |||||||||
Due to related party | — | (35,246 | ) | (3,904 | ) | |||||||
Net cash used by operating activities | (1,221,223 | ) | (444,859 | ) | (148,476 | ) | ||||||
Cash flows from investing activities | ||||||||||||
Oil and gas properties | (11,853,969 | ) | (1,672,300 | ) | (488,552 | ) | ||||||
Equipment | (124,196 | ) | (106,811 | ) | — | |||||||
Restricted Investment | (153,000 | ) | — | — | ||||||||
Net cash used for investing activities | (12,131,165 | ) | (1,779,111 | ) | (488,552 | ) | ||||||
Financing Activity | ||||||||||||
Proceeds from the issuance of shares | 18,227,543 | 5,441,281 | 404,125 | |||||||||
Issuance costs | (292,370 | ) | (263,801 | ) | (17,970 | ) | ||||||
Proceeds from (repayment of) related party note payable | — | (270,654 | ) | 270,654 | ||||||||
Net cash provided (used in) financing activities | 17,935,173 | 4,906,826 | 656,809 | |||||||||
Net change in cash and cash equivalents | 4,582,785 | 2,682,856 | 19,781 | |||||||||
Cash and cash equivalents at beginning of year | 2,702,763 | 19,907 | 126 | |||||||||
Cash and cash equivalents at end of the year | $ | 7,285,548 | $ | 2,702,763 | $ | 19,907 | ||||||
Cash paid for interest | $ | — | $ | 8,824 | $ | — | ||||||
Non-cash Items | ||||||||||||
Oil & Gas Property accrual included in Accounts Payable | $ | 3,306,641 | $ | — | $ | — | ||||||
Asset retirement obligation | $ | 67,000 | $ | — | $ | — | ||||||
SEE ACCOMPANYING NOTES
F-18
Table of Contents
NOTES TO CONSOLIDATED FINANCIAL STATEMENTS
December 31, 2005
Note 1—Organization
Description of Operations
Kodiak Oil and Gas Corp. and subsidiaries (“Kodiak” or the “Company”) is a public company listed for trading on the TSX Venture Exchange and whose corporate headquarters are located in Denver, Colorado, USA. The Company is an independent energy company engaged in the exploration, exploitation, development, acquisition and production of natural gas and crude oil in the western United States.
The Company was incorporated (continued) in the Yukon Territory on September 28, 2001.
Note 2— Significant Accounting Policies
Basis of Presentation
The consolidated financial statements include the accounts of the Company and its wholly-owned subsidiary, Kodiak Oil & Gas (USA) Inc. All significant inter-company balances and transactions have been eliminated. The majority of the Corporation’s business is transacted in US dollars and, accordingly, the financial statements are expressed in US dollars.
Use of Estimates in the Preparation of Financial Statements
The financial statements of the Company have been prepared in accordance with accounting principles generally accepted in United States. The preparation of the financial statements requires management to make estimates and assumptions that affect the reported amounts of oil and gas reserves, assets and liabilities and disclosure of contingent assets and liabilities and disclosure of contingent assets and liabilities at the date of the financial statements and the reported amounts of revenues and expenses during the reporting period. Actual results could differ from these estimates. Estimates of oil and gas reserves quantities provide the basis for calculations of depletion, depreciation, and amortization (“DD&A”) and impairment, each of which represents a significant component of the consolidated financial statements.
Cash and Cash Equivalents
Cash and cash equivalents consist of all highly liquid investments that are readily convertible to cash and have maturities of three months or less when purchased. The carrying value of cash and cash equivalents approximates fair value due to the short-term nature of these instruments.
Restricted Investment
The restricted investment balance as of December 31, 2005 is comprised of: (a) $100,000 certificate of deposit to collateralize a surety bond to provide for state bonding requirements for plugging and abandonment liabilities; and (b) $53,000 certificate of deposit to collateralize the costs of office improvements that will be released over the five year term of the lease at $10,600 per year.
Concentration of Credit Risk
The Company’s cash equivalents and short-term investments are exposed to concentrations of credit risk. The Company manages and controls this risk by investing these funds with major financial institutions.
The Company’s receivables are comprised of oil and gas revenue receivables and joint interest billings receivable. The amounts are due from a limited number of entities. Therefore, the collectability is dependent upon the general economic conditions of the few purchasers and joint interest owners. The receivables are not collateralized. However, to date the Company has had minimal bad debts.
F-19
Table of Contents
KODIAK OIL & GAS CORP.
NOTES TO CONSOLIDATED FINANCIAL STATEMENTS—(Continued)
December 31, 2005
Oil and Gas Producing Activities
The Company follows the full cost method of accounting for oil and gas operations whereby all costs related to the exploration and development of oil and gas properties are initially capitalized into a single cost center (“full cost pool”). Such costs include land acquisition costs, geological and geophysical expenses, carrying charges on non-producing properties, costs of drilling directly related to acquisition and exploration activities. Proceeds from property sales are generally credited to the full cost pool, with no gain or loss recognized, unless such a sale would significantly alter the relationship between capitalized costs and the proved reserves attributable to theses costs. A significant alteration would typically involve a sale of 25% or more of the proved reserves related to a single full costs pool.
Costs capitalized, together with the costs of production equipment, are depleted and amortized on the unit-of-production method based on the estimated gross proved reserves as determined by independent petroleum engineers. The costs of unproved properties are withheld from the depletion base until such time as they are either developed or abandoned. When proved reserves are assigned or the property is considered to be impaired, the cost of the property or the amount of the impairment is added to costs subject to depletion calculations.
For depletion and depreciation purposes, relative volumes of oil and gas production and reserves are converted at the energy equivalent rate of six thousand cubic feet of natural gas to one barrel of crude oil.
Under the full costs method of accounting, capitalized oil and gas property costs less accumulated depletion and net of deferred income taxes may not exceed an amount equal to the present value, discounted at 10%, of estimated future net revenues from proved oil and gas reserves plus the cost, or estimated fair value, if lower of unproved properties. Should capitalized costs exceed this ceiling, an impairment is recognized. The present value of estimated future net revenues is computed by applying current prices of oil and gas to estimated future production of proved oil and gas reserves as of period-end, less estimated future expenditures to be incurred in developing and producing the proved reserves assuming the continuation of existing economic conditions.
Other Property and Equipment
Other property and equipment such as office furniture and equipment, vehicles, and computer hardware and software are recorded at cost. Costs of renewals and improvements that substantially extend the useful lives of the assets are capitalized. Maintenance and repair costs are expensed when incurred. Depreciation is recorded using the straight-line method over the estimated useful lives of three years for computer equipment, and five years for office equipment and vehicles. When other property and equipment is sold or retired, the capitalized costs and related accumulated depreciation are removed from the accounts.
Fair Value of Financial Instruments
The Company’s financial instruments including cash and cash equivalents, accounts receivable and accounts payable are carried at cost, which approximates fair value due to the short-tern maturity of these instruments.
Asset Retirement Obligation
The Company follows SFAS No. 143, “Accounting for Asset Retirement Obligations,” which requires that the fair value of a liability for an asset retirement obligation be recognized in the period in which it was incurred if a reasonable estimate of fair value could be made. The associated asset retirement costs are capitalized as part of the carrying amount of the long-lived asset. The increase in carrying value of a property associated with the
F-20
Table of Contents
KODIAK OIL & GAS CORP.
NOTES TO CONSOLIDATED FINANCIAL STATEMENTS—(Continued)
December 31, 2005
capitalization of an asset retirement cost is included in proved oil and gas properties in the consolidated balance sheets. The Company depletes the amount added to proved oil and gas property costs. The future cash outflows associated with settling the asset retirement obligations that have been accrued in the accompanying balance sheets are excluded from the ceiling test calculations. The Company also depletes the estimated dismantlement and abandonment costs, net of salvage values, associated with future development activities that have not yet been capitalized as asset retirement obligations. These costs are also included in the ceiling test calculation. The asset retirement liability will be allocated to operating expense by using a systematic and rational method. The Company has recorded a net asset of $67,000, a related liability of $69,073 (using a 8.5% discount rate and a 2.97% inflation rate) and a nil cumulative effect of change in accounting principle on prior years. The information below reconciles the value of the asset retirement obligation for the periods presented.
| Year ended December 31, 2005 | |||
Balance beginning of period | $ | — | |
Liabilities incurred | 67,000 | ||
Liabilities settled | — | ||
Revisions in estimated cash flows | — | ||
Accretion expense | 2,073 | ||
Balance end of period | $ | 69,073 | |
The Company had no wells prior to January 2005.
Revenue Recognition
Revenues from the sale of oil and gas production are recognized when title passes, net of royalties. The Company may have an interest with other producers in certain properties, in which case the Company uses the sales method to account for gas imbalances. Under this method, revenue is recoded on the basis of gas actually sold by the Company, In addition, the Company records revenue for its share of gas sold by other owners that cannot be volumetrically balanced in the future due to insufficient remaining reserves. The Company also reduces revenue for other owners’ gas sold by the Company that cannot be volumetrically balanced in the future due to insufficient remaining reserves. The Company’s remaining over- and under-produced as balancing positions are considered in the Company’s proved oil and gas reserves. Gas imbalances at December 31, 2005 were not significant.
Basic and Diluted Earnings (Loss) Per Share
Basic net income (loss) per common share of stock is calculated by dividing the income (loss) for the period by the weighted average number of common shares outstanding during each period. Diluted net income (loss) per common share of stock reflect the potential dilution that could occur if potentially dilutive securities were exercised or converted to common stock. The dilutive effect of options and warrants and their equivalent is computed by application of the treasury stock method and the effect of convertible securities by the “if converted” method. Fully diluted amounts are not presented when the effect of the computations are anti-dilutive due to the losses incurred. Accordingly, there is no difference in the amounts presented for basic and diluted loss per share.
F-21
Table of Contents
KODIAK OIL & GAS CORP.
NOTES TO CONSOLIDATED FINANCIAL STATEMENTS—(Continued)
December 31, 2005
Stock-based Compensation Plan
The fair value of all share purchase options granted are expensed over their vesting period with a corresponding increase to contributed surplus. Upon exercise of share purchase options, the consideration paid by the option holder, together with the amount previously recognized in contributed surplus, is recorded as an increase to share capital.
The Company uses the Black-Scholes option valuation model to calculate the fair value of share purchase options at the date of grant. Option pricing models require the input of highly subjective assumptions, including the expected price volatility. Changes in these assumptions can materially affect the fair value estimate and, therefore, the existing models do not necessarily provide a reliable single measure of the fair value of the Company’s share purchase options.
Major Customers
Although the Company sells the majority of its production to a few purchasers, there are numerous other purchasers in the areas in which Kodiak sells it production; therefore, the loss of its significant customer would not adversely affect the Company’s operations. During 2005, Nexen Marketing, Duke Energy Field Services and Questar Gas Marketing individually accounted for 38%, 37% and 25% respectively of the Company’s total oil and gas production revenue.
Income Taxes
The Company follows the asset and liability method of accounting for income taxes. Under this method, current income taxes are recognized for the estimated income taxes payable for the current period. Future income tax assets and liabilities are recognized for temporary differences between the tax and accounting basis of assets and liabilities as well as for the benefit of losses available to be carried forward to future years for tax purposes only if it is more likely than not that they can be realized.
Foreign Currency Translation
Monetary items denominated in a foreign currency, other than US dollars, are translated into US dollars at exchange rates prevailing at the balance sheet date and non-monetary items are translated at exchange rates prevailing when the assets are acquired or obligations incurred. Foreign currency denomination revenue and expense items are recorded at exchange rates prevailing at the transaction date. Gains or losses arising from the transactions are included in operations.
Reclassifications
Certain reclassifications have been to prior years’ amounts to conform to the classifications used in the current year. Such reclassifications had no effect on the Company’s net loss in any of the periods presented.
New Accounting Pronouncements
In June 2005, the FASB issued Statement 154, “Accounting Changes and Error Corrections”which replaces APB Opinion 20 and FASB Statement 3. Statement 154 changes the requirements for the accounting and reporting of a change in accounting principle. Opinion 20 previously required that most voluntary changes in accounting principle be recognized by including the cumulative effect of the new accounting principle in net
F-22
Table of Contents
KODIAK OIL & GAS CORP.
NOTES TO CONSOLIDATED FINANCIAL STATEMENTS—(Continued)
December 31, 2005
income of the period of the change. Statement 154 now requires retrospective application of changes in accounting principle to prior period financial statements, unless it is impracticable to determine either the period-specific effects or the cumulative effect of the change. The Statement is effective for fiscal years beginning after December 15, 2005. We do not expect the adoption of this statement will have a material impact on our results of operations or financial position.
In March 2005, the FASB issued FASB Interpretation (FIN) No. 47, “Accounting for Conditional Asset Retirement Obligations.” This Interpretation clarifies the definition and treatment of conditional asset retirement obligations as discussed in FASB Statement No. 143, “Accounting for Asset Retirement Obligations.” A conditional asset retirement obligation is defined as an asset retirement activity in which the timing and/or method of settlement are dependent on future events that may be outside the control of a company. FIN 47 states that a company must record a liability when incurred for conditional asset retirement obligations if the fair value of the obligation is reasonably estimable. This Interpretation is intended to provide more information about long-lived assets, more information about future cash outflows for these obligations and more consistent recognition of these liabilities. FIN 47 is effective for fiscal years ending after December 15, 2005. We do not believe that our financial position, results of operations or cash flows will be impacted by this Interpretation.
In January 2006, the Financial Accounting Standards Board published FASB Statement of Financial Accounting Standard (SFAS) No. 155,Accounting for Certain Hybrid Financial Instruments—an amendment of FASB Statements No. 133 and 140,to simplify and make more consistent the accounting for certain financial instruments. Specifically, SFAS No. 155 permit fair value remeasurement for any hybrid financial instrument with an embedded derivative that otherwise would require bifurcation, provided that the whole instrument is accounted for on a fair value basis. SFAS No. 155 applies to all financial instruments acquired or issued after the beginning of an entity’s first fiscal year that begins after September 15, 2006, with earlier application allowed. We do not expect the adoption of this statement will have a material impact on our results of operations or finical position.
Note 3—Oil and Gas Properties
The following table presents information regarding the Company’s net costs incurred in the purchase of proved and unproved properties and in the exploration and development activities. The 2005 amounts include $67,000 of capitalized costs associated with asset retirement obligations.
| For the Years Ended December 31 | |||||||||
| 2005 | 2004 | 2003 | |||||||
Property Acquisition costs: | |||||||||
Proved | $ | 613,146 | $ | — | $ | — | |||
Unproved | 6,307,903 | 753,173 | 353,415 | ||||||
Exploration costs | 3,567,871 | 1,604,428 | 331,886 | ||||||
Development costs | 7,096,290 | — | — | ||||||
Total including asset retirement obligation | $ | 17,585,210 | $ | 2,357,601 | $ | 685,301 | |||
Total excluding asset retirement obligation | $ | 17,518,210 | $ | 2,357,601 | $ | 685,301 | |||
Depletion Rates: | |||||||||
Per barrel | $ | 14.45 | $ | — | $ | — | |||
Per Mcf | $ | 2.41 | $ | — | $ | — | |||
F-23
Table of Contents
KODIAK OIL & GAS CORP.
NOTES TO CONSOLIDATED FINANCIAL STATEMENTS—(Continued)
December 31, 2005
At December 31, the Company’s unproved properties consist of leasehold costs in the following areas:
| 2005 | 2004 | 2003 | |||||||
Montana | $ | 70,346 | $ | — | $ | — | |||
North Dakota | 2,915,469 | 3,180 | — | ||||||
Wyoming | 3,322,088 | 749,993 | 353,415 | ||||||
| $ | 6,307,903 | $ | 753,173 | $ | 353,415 | ||||
The following table represents the additions, net of impairments, to unproved acreage from inception through December 31, 2005:
| Net Acquisition Costs | |||
2003 | 353,415 | ||
2004 | 2,004,186 | ||
2005 | 3,950,302 | ||
Unproved Mineral Interest as of December 31, 2005 | $ | 6,307,903 | |
Note 4—Property Acquisitions
In November 2005, the Company acquired unproved oil and gas leases in exchange for $1.6 million in cash.
In December 2005, the Company completed the acquisition of unproved oil and gas properties in exchange for $1.45 million. $145,000 of the purchase price was deposited with the balance of $1.305 million recorded as a liability as of December 31, 2005. The balance was paid in full on January 2006.
In December 2005, the Company completed the acquisition of unproved oil and gas properties in exchange for $2.1 million in cash.
Note 5—Equity
In March 2005, we raised net proceeds of $6,859,398 in a non-brokered private placement of 10 million shares of common stock. We used the net proceeds of this transaction to fund our exploration and development program.
In December 2005, we raised net proceeds of $8,492,475 in an unbrokered private placement of 7 million shares of common stock. We have used a portion of the net proceeds, and expect to use the remainder, to fund exploration and drilling programs and for working capital and general corporate purposes.
In February 2004, we raised net proceeds of $2,972,061 in a private placement of 11,428,572 units of equity securities. Each unit consisted of one share of common stock and one-half non-transferable share purchase warrant. One whole warrant entitled the holder to purchase one share of our common stock at a price of CDN$0.50 per share on or before twelve months from closing. We paid the placement agent a cash commission of 8% of the subscription proceeds and issued to the placement agent warrants equal to 8% of the number of units sold to purchase one share of our common stock at a price of Cdn$0.50 per share on or before twelve months from closing. In August 2004, we received net proceeds of $2,174,810 from the early exercise of 5,649,286 of the 5,714,286 purchase warrants issued to investors in the private placement. As an incentive to the warrant
F-24
Table of Contents
KODIAK OIL & GAS CORP.
NOTES TO CONSOLIDATED FINANCIAL STATEMENTS—(Continued)
December 31, 2005
holders to exercise six months early, we issued an additional one-half non-transferable share purchase warrant, or a total of 2,824,643 bonus warrants, for each share purchase warrant exercised. Each bonus warrant entitled the holder to purchase one share of our common stock at a price of Cdn$1.00 per share on or before twelve months from closing.
Stock-based Compensation Plan
The Company has a stock-based compensation plan whereby share purchase options may be granted with an exercise price equal to the trading value when granted. The total number of share purchase options outstanding cannot exceed 10% of the total number of shares issued. The share purchase options vest when granted except for share purchase options granted to consultants which vest at 25% every three months. During the year ended December 31, 2004, the Company also granted share purchase options to employees which vest at one-third of the amount granted on each anniversary over a three year period.
For the year ended December 31, 2004, the Company recorded stock-based compensation of $411,238. Included in this amount is $6,943 associated with options granted to consultants. For the year ended December 31, 2005, the Company recorded stock based compensation of $541,111.
The following assumptions were used for the Black-Scholes model:
| 2005 | 2004 | |||||||
Risk free rates | 4.3 | % | 3.75 | % | ||||
Dividend yield | 0 | % | 0 | % | ||||
Expected volatility | 81.34 | % | 110.40 | % | ||||
Weighted average expected stock option life | 2.5 yrs | 4 yrs | ||||||
The weighted average fair value at the date of grant for stock options granted is as follows: | ||||||||
Weighted average fair value per share | $ | 0.60 | $ | 0.23 | ||||
Total options granted | 900,000 | 1,751,500 | ||||||
Total weighted average fair value of options granted | $ | 541,111 | $ | 406,031 | ||||
Stock Options
A summary of the stock options outstanding is as follows:
| Number of Options | (CDN$) Weighted Average Exercise Price | |||||
Balance December 31, 2003 | 1,437,000 | $ | 0.15 | |||
Options Granted | 1,751,500 | 0.71 | ||||
Options Exercised | (50,000 | ) | 0.15 | |||
Balance outstanding at December 31, 2004 | 3,138,500 | $ | 0.465 | |||
Options Granted | 900,000 | 1.20 | ||||
Options Exercised | (100,000 | ) | 0.15 | |||
Balance outstanding at December 31, 2005 | 3,938,500 | $ | 0.64 | |||
Options exercisable at December 31, 2005 | 3,688,000 | |||||
F-25
Table of Contents
KODIAK OIL & GAS CORP.
NOTES TO CONSOLIDATED FINANCIAL STATEMENTS—(Continued)
December 31, 2005
At December 31, 2005, stock options outstanding are as follows:
(CDN$) Exercise Price | Number of Shares | Expiry Date | |||
| $ | 0.15 | 100,000 | December 6, 2006 | ||
| $ | 0.15 | 1,187,000 | December 4, 2008 | ||
| $ | 0.50 | 1,000,000 | March 1, 2009 | ||
| $ | 1.00 | 751,500 | August 23, 2009 | ||
| $ | 1.00 | 900,000 | October 16, 2010 | ||
| 3,938,500 | |||||
Share Purchase Warrants
Share purchase warrant transactions are summarized as follows:
| Number of Warrants | (CDN$) Average Exercise Price | |||||
Balance, December 31, 2003 | 2,298,750 | $ | 0.15 | |||
Exercised | (2,298,750 | ) | 0.15 | |||
Granted | 6,628,572 | 0.50 | ||||
Exercised | (5,649,286 | ) | 0.50 | |||
Granted | 2,824,643 | 1.00 | ||||
Balance, December 31, 2004 | 3,803,929 | $ | 0.87 | |||
Exercised | (3,496,875 | ) | 0.75 | |||
Expired | (307,054 | ) | 0.93 | |||
Balance, December 31, 2005 | 0 | $ | — | |||
In August 2005, we received net proceeds of $2,137,223 from the exercise of 2,561,618 bonus warrants. We used the proceeds from the issuance of the units and the exercise of the warrants in part to fund our exploration and development program and for working capital and general corporate purposes.
Note 6—Commitments and Contingencies
The Company leases office facilities under an operating lease agreement that expires on June 30, 2010. Rent expense was $48,200, $29,200, and $19,000 in 2005, 2004, and 2003 respectively. The Company has no other capital leases and no other operating lease commitments.
The following table shows the annual rentals per year for the life of the lease:
Years Ending December 31, | |||
2006 | $ | 69,500 | |
2007 | 73,500 | ||
2008 | 75,400 | ||
2009 | 77,400 | ||
2010 | 39,700 | ||
Total | $ | 335,500 | |
F-26
Table of Contents
KODIAK OIL & GAS CORP.
NOTES TO CONSOLIDATED FINANCIAL STATEMENTS—(Continued)
December 31, 2005
During the year ended December 31, 2004, the Company entered into three one-year employment agreements. Each agreement includes the issue of 50,000 common shares, of which 25,000 were issued upon commencement and 25,000 were issued in 2005.
As is customary in the oil and gas industry, the Company may at times have commitments in place to reserve or earn certain acreage positions or wells. If the Company does not pay such commitments, the acreage positions or wells may be lost.
Note 7—Related Party Transactions
During the year ended December 31, 2003, in connection with oil and gas acquisitions, the Company issued a promissory note for $264,000 payable to CP Resources LLC, a company controlled by directors in common, which bears interest at a rate of 1% over the prime rate of Wells Fargo Bank. The amount was unsecured and had no specific terms of repayment. During the year ended December 31, 2004, the note and accrued interest of $8,824 was repaid and no amounts remain outstanding.
Note 8—Income Taxes
In Canada, the Company has available resource deductions of $2,090,464 and non-capital losses of approximately $1,120,000 that may be carried forward to reduce taxable income in future years. The non-capital losses expire as follows:
2009 | $ | 87,000 | |
2010 | 74,000 | ||
2014 | 959,000 | ||
| $ | 1,120,000 | ||
The Company has operating losses of approximately $1,400,000 in the United States. The Company’s net operating losses may be limited due to changes in ownership.
Significant components of the Company’s future tax assets and liabilities, after applying enacted corporate income tax rates, are as follows:
| 2005 | 2004 | |||||||
Future income tax assets | ||||||||
Net tax losses carried forward | $ | 1,062,000 | $ | 470,100 | ||||
Stock based compensation | 414,000 | — | ||||||
Exploration and development expenses | 149,000 | 744,205 | ||||||
| 1,625,000 | 1,214,305 | |||||||
Valuation allowance for future income tax assets | (1,625,000 | ) | (1,214,305 | ) | ||||
Future income tax assets, net | $ | 0 | $ | 0 | ||||
F-27
Table of Contents
KODIAK OIL & GAS CORP.
NOTES TO CONSOLIDATED FINANCIAL STATEMENTS—(Continued)
December 31, 2005
A reconciliation of the provision (benefit) for income taxes computed at the statutory rate:
| 2005 | 2004 | 2003 | |||||||
Federal | 35.0 | % | 22.1 | % | 24.1 | % | |||
State | 4.5 | % | 13.5 | % | 13.5 | % | |||
Other | — | — | — | ||||||
Valuation Allowance | (39.5 | )% | (35.6 | )% | (37.6 | )% | |||
Net | — | — | — | ||||||
Note 9—Supplemental Oil and Gas Reserve Information
For the years presented, Sproule & Associates (“Sproule”) prepared the reserve information for all of the PV-10 value. The Company engaged Sproule for the first time in 2005. The Company emphasizes that reserve estimates are inherently imprecise and that estimates of new discoveries and undeveloped locations are more imprecise than estimates of established proved producing oil and gas properties. Accordingly, these estimates are expected to change as future information becomes available.
Proved oil and gas reserves are the estimated quantities of crude oil, natural gas and natural gas liquids that geological and engineering data demonstrate with reasonable certainty to be recoverable in future years from know reservoirs under existing economic and operating conditions. Proved developed oil and gas reserves are those expected to be recovered through existing wells with existing equipment and operating methods. All of the Company’s proved reserves are located in the Continental United States.
Presented below is a summary of the changes in estimated reserves of the Company:
| For the Year Ended December 31, 2005 | ||||||
| Oil or Condensate | Gas | |||||
| (Bbl) | (MMcf) | |||||
Developed and undeveloped: | ||||||
Beginning of year | — | — | ||||
Discoveries and extensions | 524,408 | 2,866.9 | ||||
Production | (2,699 | ) | (31.7 | ) | ||
End of year | 521,709 | 2,835.2 | ||||
Standardized Measure of Discounted Future Net Cash Flows (Unaudited):
SFAS No. 69, “Disclosures about Oil and Gas Producing Activities,” prescribes guidelines for computing a standardized measure of future net cash flows and changes therein relating to estimated proved reserves. The Company has followed these guidelines, which are briefly discussed below.
Future cash inflows and future production and development costs are determined by applying benchmark prices and costs, including transportation, quality and basis differentials, in effect at year-end to the year-end estimated quantities of oil and gas to be produced in the future. Each property the Company operates is also charges with field-level overhead in the estimated reserve calculation. Estimated future income taxes are computed using current statutory income tax rates, including consideration for estimated future statutory depletion. The resulting future net cash flows are reduced to present value amounts by applying a 10% annual discount factor.
F-28
Table of Contents
KODIAK OIL & GAS CORP.
NOTES TO CONSOLIDATED FINANCIAL STATEMENTS—(Continued)
December 31, 2005
Future operating costs are determined based on estimates of expenditures to be incurred in developing and producing the proved oil and gas reserves in place at the end of the period, using year-end costs and assuming continuation of existing economic conditions, plus Company overhead incurred attributable to operating activities.
The assumptions used to compute the standardized measure are those prescribed by the FASB and the Securities and Exchange Commission. These assumptions do not necessarily reflect the Company’s expectations of actual revenues to be derived from those reserves, nor their present value. The limitations inherent in the reserve quantity estimation process, as discussed previously, are equally applicable to the standardized measure computations since these estimates are basis for the valuation process. The following prices, as adjusted for transportation, quality and basis differentials, were used in the calculation of the standardized measure: Gas (per Mcf) $7.88; Oil (per Bbl) $55.29.
The following summary sets forth the Company’s future net cash flows relating to proved oil and gas reserves based on the standardized measure prescribed in SFAS No. 69:
| Year ended December 31, 2005 | ||||
Future cash inflows | $ | 51,182,477 | ||
Future production costs | (13,355,083 | ) | ||
Future development costs | (5,342,500 | ) | ||
Future income taxes | (10,980,498 | ) | ||
Future net cash flows | 21,504,396 | |||
10% annual discount | (7,301,589 | ) | ||
Standardized measure of discounted future net cash flows | $ | 14,202,807 | ||
The principle sources of change in the standardized measure of discounted future net cash flows are:
| Year ended December 31, 2005 | ||||
Standardized measure, beginning of year | $ | — | ||
Sales of oil and gas produced, net of Production costs | (163,695 | ) | ||
Extensions, discoveries and other, net of Production costs | 18,320,720 | |||
Net change in income taxes | (3,954,218 | ) | ||
Standardized measure, end of year | $ | 14,202,807 | ||
Note 10—Subsequent Events
On March 8, 2006, the Company issued 19 million common shares at US$2.05 (Cdn$2.33) per share pursuant to a private placement. The Company paid a commissions and expenses of $2,865,800 for net proceeds to the Company of $37,138,452.
F-29
Table of Contents
KODIAK OIL & GAS CORP.
NOTES TO CONSOLIDATED FINANCIAL STATEMENTS—(Continued)
December 31, 2005
Note 11—Quarterly Financial Information (Unaudited)
The Company’s quarterly financial information for fiscal 2005 and 2004 is a follows:
| First Quarter | Second Quarter | Third Quarter | Fourth Quarter | |||||||||
Year Ended December 31, 2005 | ||||||||||||
Total revenue | $ | 8,647 | $ | 36,222 | $ | 127,373 | $ | 280,893 | ||||
Net Revenue from oil and gas operations | $ | — | $ | 13,545 | $ | 87,971 | $ | 264,064 | ||||
Loss from Operations | $ | 327,083 | $ | 488,876 | $ | 52,252 | $ | 1,136,879 | ||||
Basic and diluted net loss per share | $ | 0.01 | $ | 0.01 | $ | 0.01 | $ | 0.01 | ||||
| First Quarter | Second Quarter | Third Quarter | Fourth Quarter | |||||||||
Year Ended December 31, 2004 | ||||||||||||
Total revenue | $ | — | $ | — | $ | 3,931 | $ | — | ||||
Net Revenue from oil and gas operations | $ | — | $ | — | $ | — | $ | — | ||||
Loss from Operations | $ | 396,757 | $ | 152,582 | $ | 130,315 | $ | 382,446 | ||||
Basic and diluted net loss per share | $ | 0.01 | $ | 0.01 | $ | 0.01 | $ | 0.01 | ||||
Note 12—Differences Between Canadian and United States Accounting Principles
These financial statements have been prepared in accordance with accounting principles generally accepted in the United States of America which differ in certain respects with those principles and practices that the Company would have followed had its financial statements been prepared in accordance with accounting principles and practices generally accepted in Canada.
The Company’s accounting principles generally accepted in the United States of American differ from accounting principles generally accepted in Canada as follows:
a) Stock-based Compensation
The Company grants stock options at exercise prices equal to the fair market value of the Company’s stock at the date of the grant. Under Statement of Financial Accounting Standards No. 123 the Company had accounted for its employee stock options under the fair value method. The fair value is determined using an option pricing model that takes into account the stock price at the grant date, the exercise price, the expected life of the option, the volatility of the underlying stock and the expected dividends, and the risk-free interest rate over the expected life of the option.
As a result of the new recommendations of the Canadian Institute of Chartered Accountants regarding accounting for stock-based compensation, there is no difference between Canadian GAAP and US GAAP for the years ended December 31, 2005 or 2004.
b) Comprehensive Loss
US GAAP requires disclosure of comprehensive loss which, for the Company is net loss under US GAAP plus the change in cumulative translation adjustment under US GAAP.
The concept of comprehensive loss does not come into effect until fiscal years beginning on or after October 1, 2006 for Canadian GAAP. New Accounting Standards Management does not believe that any recently issued, not yet effective, accounting standards if currently adopted could have a material effect on the accompanying financial statements.
F-30
Table of Contents
9,937,568 Shares

Common Stock
PROSPECTUS