UNITED STATES
SECURITIES AND EXCHANGE COMMISSION
Washington, D.C. 20549
FORM N-CSR
CERTIFIED SHAREHOLDER REPORT OF REGISTERED MANAGEMENT
INVESTMENT COMPANIES
Investment Company Act file number 811-21751
Lazard World Dividend & Income Fund, Inc.
(Exact name of registrant as specified in charter)
30 Rockefeller Plaza
New York, New York 10112
(Address of principal executive offices) (Zip code)
Nathan A. Paul, Esq.
Lazard Asset Management LLC
30 Rockefeller Plaza
New York, New York 10112
(Name and address of agent for service)
Registrant’s telephone number, including area code: (212) 632-6000
Date of fiscal year end: 12/31
Date of reporting period: 6/30/13
ITEM 1. REPORTS TO STOCKHOLDERS.

Lazard World
Dividend & Income
Fund, Inc.
Semi-Annual Report
J U N E 3 0 , 2 0 1 3
Lazard World Dividend & Income Fund, Inc.
Lazard World Dividend & Income Fund, Inc.
Investment Overview
Dear Stockholders,
We are pleased to present this semi-annual report for Lazard World Dividend & Income Fund, Inc. (“LOR” or the “Fund”), for the period ended June 30, 2013. LOR is a diversified, closed-end management investment company that began trading on the New York Stock Exchange (“NYSE”) on June 28, 2005. Its ticker symbol is “LOR.”
For the second quarter and year-to-date periods ended June 30, 2013, the Fund’s net asset value (“NAV”) performance was behind its benchmark, the Morgan Stanley Capital International (MSCI®) All Country World Index (ACWI®) (the “Index”). However, we are pleased with LOR’s favorable NAV performance over the one-, three-, and five-year periods, as well as since inception. We believe that the Fund has provided investors with an attractive yield and diversification, backed by the extensive experience, commitment, and professional management of Lazard Asset Management LLC (the “Investment Manager” or “Lazard”).
Portfolio Update (as of June 30, 2013)
For the second quarter of 2013, the Fund’s NAV returned -3.0%, underperforming the Index return of -0.4%. For the year-to-date period, the Fund’s NAV returned 0.5%, below the 6.1% return of the Index. However, the Fund’s NAV performance outpaced the Index over the 12 months ended June 30, 2013, gaining 17.6% versus 16.6% for the Index, as well as for the three- and five-year periods then ended. In addition, on an annualized basis since inception, the Fund’s NAV return of 6.5% is ahead of the 5.2% return for the Index. Shares of LOR ended the second quarter of 2013 with a market price of $13.12, representing a 6.7% discount to the Fund’s NAV of $14.06.
The Fund’s net assets were $96.7 million as of June 30, 2013, with total leveraged assets of $133.0 million, representing a 27.3% leverage rate. This leverage rate is lower than that at the end of the first quarter of 2013 (29.2%), and below the maximum permitted leverage rate of 33⅓%.
Within the world equity portfolio, stock selection in the information technology sector, as well as within France and the United Kingdom, helped performance during the second quarter. However, stock selection in the financials and materials sectors hurt performance.
Performance for the smaller, short-duration1 emerging-market currency and debt portion of the Fund was
weak in the second quarter, and has been negative year to date. It has contributed positively to performance since inception.
As of June 30, 2013, 73.4% of the Fund’s total leveraged assets consisted of world equities, 25.7% consisted of emerging market currency and debt instruments, and 0.9% consisted of cash and other net assets.
Declaration of Distributions
Pursuant to LOR’s Level Distribution Policy, the Fund declares, monthly, a distribution equal to 6.5% (on an annualized basis) of the Fund’s NAV on the last business day of the previous year. The current monthly distribution rate per share of $0.07822 represents a distribution yield of 7.2% based on the Fund’s $13.12 market price as of the close of trading on the NYSE on June 30, 2013. It is currently estimated that $0.1524 of the $0.4693 distributed per share year-to-date through June 30, 2013 may represent a return of capital.
Additional Information
Please note that, available on www.LazardNet.com, are frequent updates on the Fund’s performance, press releases, distribution information, and a monthly fact sheet that provides information about the Fund’s major holdings, sector weightings, regional exposures, and other characteristics, including the notices required by Section 19(a) of the Investment Company Act of 1940, as amended. You may also reach Lazard by phone at 1-800-823-6300.
On behalf of Lazard, we thank you for your investment in Lazard World Dividend & Income Fund, Inc. and look forward to continuing to serve your investment needs in the future.
Message from the Portfolio Managers
World Equity Portfolio
(73.4% of total leveraged assets)
The Fund’s world equity portfolio is typically invested in 60 to 90 securities broadly diversified in both developed and emerging-market countries and across the capitalization spectrum. Examples include Pfizer, a research-based, global pharmaceutical company that is based in the United States; Zurich Insurance Group, a Swiss insurance-based financial services provider active in North America, Europe, Asia-Pacific, Latin America, and other markets; and Kumba Iron Ore, an iron ore mining company based in South Africa.
2
Lazard World Dividend & Income Fund, Inc.
Investment Overview (continued)
As of June 30, 2013, 31.2% of these stocks were based in North America, 31.1% were based in continental Europe (not including the United Kingdom), 14.5% were from Asia (not including Japan), 9.1% were from the United Kingdom, 7.6% were based in Africa and the Middle East, 4.8% were based in Latin America, and 1.7% were from Japan. The world equity portfolio is similarly well diversified across a number of industry sectors. The top two sectors, by weight, at June 30, 2013, were: financials (29.5%), which includes banks, insurance companies, and financial services companies; and consumer discretionary (15.9%), which includes automobile and components, consumer durables and apparel, consumer services, media, and retailing companies. Other sectors in the portfolio include consumer staples, energy, health care, industrials, information technology, materials, telecom services, and utilities. The average dividend yield on the securities held in the world equity portfolio was approximately 4.8% as of June 30, 2013.
World Equity Markets Review
The rally in global stocks persisted through most of May before US Federal Reserve (the Fed) Chairman Ben Bernanke’s reference to potentially slowing the pace of quantitative easing (QE)—at some point late this year or early in 2014—led to a sharp increase in volatility and a sell-off in global stocks. However, following a rebound late in June, the global market ended the second quarter broadly flat, and remains in positive territory year-to-date. While central bankers reiterated that any potential slowing in QE would be dependent on continued strength of US economic indicators, particularly those related to employment, investors would not be reassured, and aggressively sold risk assets. This was particularly the case for investments perceived to have been boosted by QE, such as large-cap, developed-market, high-yield equities, as well as emerging-market equities and bonds. While we understand the recent underperformance of large-cap, developed-market income stocks and emerging markets bonds, which have both been strong-performing asset classes with current yields well below longer-term norms, we were surprised by the weakness in emerging markets equities. These have been underperforming developed markets for nearly three years, and look attractively valued both in absolute and relative terms to developed markets, in our opinion. We feel that the Fed is discussing a reduction in QE due to the emergence of clear signs of a more robust recovery in the United States over the past 12 to 18 months, driven by a pronounced rebound
in housing. We also feel that this recovery will ultimately prove to be positive for equity markets, as earnings driven by a truly recovering global economy should warrant a higher valuation multiple than earnings driven by QE. However, the sharp upward move in government bond yields around the world reinforces our concern about the outlook for large-cap, developed-market, defensive income stocks (e.g., bond proxies). These have historically struggled amid rising rates, as they ultimately compete with bonds for income-seeking capital, and currently face the additional hurdle of valuations well above historic averages.
What Helped and What Hurt LOR
The portfolio’s position in auto parts maker Valeo contributed to performance, as shares rose after the company released quarterly sales figures. Although sales were expected to decline amid a weaker European outlook, figures exceeded expectations and displayed sales growth. In addition, despite the company’s domicile in France, Valeo has a global automotive presence with growing sales in Asia and North America. The portfolio was also helped by its position in French insurer AXA, which rose after the company reported quarterly results which exceeded expectations, led by better-than-expected margins and inflows in its asset management business. Investors were also heartened by the rise in rates during the second quarter, which is beneficial to AXA’s variable annuity business. Another contributor to the portfolio was its position in UK insurer Direct Line Insurance Group, which rose after the company announced that its cost-cutting initiative was expected to save twice the amount originally expected. It is anticipated that the initiative will lead to earnings growth and a potential increase in the company’s dividend.
In contrast, the portfolio’s position in Banco do Brasil detracted from returns, as regulatory and Latin American macroeconomic risks continued to weigh on investors. However, we expect Banco do Brasil to capitalize on continued loan growth in Brazil, and we believe the company’s valuation and dividend yield are attractive at current levels. The portfolio was also hurt by its position in US copper miner Southern Copper, as declining global copper prices caused concern. While near-term commodity prices may be volatile, we believe Southern Copper’s plan to increase production while maintaining cash costs will allow the company to remain profitable, and that it will be able to continue to return capital to shareholders through a
3
Lazard World Dividend & Income Fund, Inc.
Investment Overview (continued)
dividend. Another detractor was the portfolio’s position in ICL-Israel Chemicals. The security declined as global macroeconomic uncertainty has pressured potash demand, and regulatory risk in Israel has escalated. We have sold our position in favor of companies with more attractive risk-reward profiles.
Emerging Market Currency and Debt Portfolio
(25.7% of total leveraged assets)
The Fund also seeks enhanced income through investing primarily in high-yielding, short-duration emerging-market forward currency contracts and local currency debt instruments. As of June 30, 2013, this portfolio consisted of forward currency contracts (73.6%) and sovereign debt obligations (26.4%). The average duration of the emerging-market currency and debt portfolio increased from approximately 4 months to approximately 12 months during the second quarter, while the average yield rose from 5.6%2 on March 31, 2013 to 7.1% on June 30, 2013.
Emerging Market Currency and Debt Market Review
Nearly all emerging-market currencies (with the exception of the Chinese renminbi and those in some frontier markets) weakened during the second quarter as expectations for the Fed’s policy were sharply re-priced amid concerns that slowing the pace of QE would remove relative support for emerging-market currencies and perceived risk assets. Disappointing data from China, and its seeming reluctance to provide stimulus, also provided a headwind to some emerging-market currencies (particularly commodity-sensitive ones).
Despite the recent volatility, we believe emerging local market fundamentals have not markedly changed over the last two months. Rather, the market is in the midst of re-assessing the US interest rate environment and assessing its impact on emerging-market prospects. The emerging markets represent a diverse mix of fiscal, monetary and exchange-rate policies, which are likely to become a basis for differentiation once volatility and correlations wane. The Fed’s confidence in US growth, employment, and inflation objectives are pre-conditions for “tapering” stimulus, while actual tightening remains at least two years away, according to the Fed’s current guidance. If the US economy is doing well enough for tapering to occur, it likely means that consumption is solid, which bodes well for several emerging-market countries.
What Helped and What Hurt LOR
Latin America was the worst-performing region during the second quarter, as the greatly reduced risk appetite pressured currencies, causing sharply weaker performance (particularly for countries with balance-of-payment deficits and exposure to China and commodities) despite aggressive central bank intervention in some countries. Among detractors for the second quarter, Brazil was most notable, despite such heavy central bank intervention throughout the month and the elimination of financial transaction taxes (IOF tax) on fixed-income inflows and foreign-exchange derivatives. Disappointing growth, balance-of-payment deterioration, and increased fiscal expenditures created by President Dilma Rousseff’s pledge to increase spending on health services and transportation in the wake of street protests weighed on the real. India also detracted from returns, as the rupee’s loss was aggravated by resurgent concerns over financing the current-account deficit in an environment of tighter global liquidity, slow growth, and high (though moderating) inflation. The Russian ruble hurt performance as capital outflows, negative seasonality for the current account, and an expected easing cycle to support the economy pressured the currency. Other detractors included the Turkish lira, due to the combination of rising inflation and widening current account, and the South African rand, due to a wide current-account deficit, slow growth, rising inflation, and a non-interventionist central bank.
Conversely, the Hungarian forint appreciated during the second quarter due to the country’s current account surplus and recovery from first-quarter weakness despite continued easing. Sizable exposure to the Serbian dinar helped performance, as foreign exchange and local debt rallied on high carry, yield curve compression, improving exports, and current account financing. The Chinese renminbi also added to returns due to its managed currency regime. The Romanian leu helped performance amid compelling yield, a risk-adjusted currency, and local debt prospects. Finally, frontier-market currencies (particularly, the Ugandan shilling, Dominican peso, and Nigerian naira) added to returns for the second quarter, as low foreign-exchange volatility and high yield buoyed relative results and provided uncorrelated alpha.
4
Lazard World Dividend & Income Fund, Inc.
Investment Overview (continued)
Notes to Investment Overview:
| 1 | A measure of the average cash weighted term-to-maturity of the investment holdings. Duration is a measure of the price sensitivity of a bond to interest rate movements. Duration for a forward currency contract is equal to its term-to-maturity. |
| | |
| 2 | The quoted yield does not account for the implicit cost of borrowing on the forward currency contracts, which would reduce the yield shown. |
All returns reflect reinvestment of all dividends and distributions. Past performance is not indicative, or a guarantee, of future results.
The performance data of the Index and other market data have been prepared from sources and data that the Investment Manager believes to be reliable, but no representation is made as to their accuracy. The Index is a free float-adjusted market capitalization weighted index that is designed to measure the equity market performance of global developed and emerging markets. The Index is unmanaged, has no fees or costs and is not available for investment.
The views of the Fund’s Investment Manager and the securities described in this report are as of June 30, 2013; these views and portfolio holdings may have changed subsequent to this date. Nothing herein should be construed as a recommendation to buy, sell, or hold a particular security. There is no assurance that the securities discussed herein will remain in the Fund at the time you receive this report, or that securities sold will not have been repurchased. The specific securities discussed may, in aggregate, represent only a small percentage of the Fund’s holdings. It should not be assumed that securities identified and discussed were, or will be, profitable, or that the investment decisions made in the future will be profitable, or equal the investment performance of the securities discussed herein.
The views and opinions expressed are provided for general information only, and do not constitute specific tax, legal, or investment advice to, or recommendations for, any person. There can be no guarantee as to the accuracy of the outlooks for markets, sectors and securities as discussed herein.
5
Lazard World Dividend & Income Fund, Inc.
Investment Overview (continued)
Comparison of Changes in Value of $10,000 Investment in
LOR and MSCI ACWI Index* (unaudited)
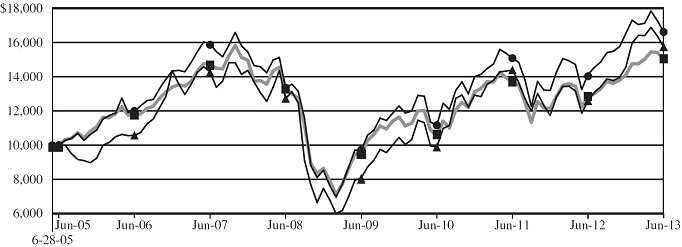
| | | | Value at
6/30/13 | |
 | LOR at Market Price | | | $ | 15,741 | | |
 | LOR at Net Asset Value | | | | 16,612 | | |
 | MSCI ACWI Index | | | | 15,051 | | |
Average Annual Total Returns*
Periods Ended June 30, 2013 (unaudited) | | | | | | | | | | |
| | | One
Year | | Five
Years | | Since
Inception** | |
| Market Price | | | 25.10 | % | | | 4.34 | % | | | 5.83 | % | |
| Net Asset Value | | | 17.64 | % | | | 4.50 | % | | | 6.54 | % | |
| MSCI ACWI Index | | | 16.57 | % | | | 2.30 | % | | | 5.23 | % | |
| * | All returns reflect reinvestment of all dividends and distributions. The performance quoted represents past performance. Current performance may be lower or higher than the performance quoted. Past performance is not indicative, or a guarantee, of future results; the investment return, market price and net asset value of the Fund will fluctuate, so that an investor’s shares in the Fund, when sold, may be worth more or less than their original cost. The returns do not reflect the deduction of taxes that a stockholder would pay on the Fund’s distributions or on the sale of Fund shares. |
| | |
| | The performance data of the Index has been prepared from sources and data that the Investment Manager believes to be reliable, but no representation is made as to its accuracy. The Index is a free float-adjusted market capitalization weighted index that is designed to measure the equity market performance of global developed and emerging markets. The Index is unmanaged, has no fees or costs and is not available for investment. |
| | |
| ** | The Fund’s inception date was June 28, 2005. |
6
Lazard World Dividend & Income Fund, Inc.
Investment Overview (concluded)
| | Ten Largest Equity Holdings
June 30, 2013 (unaudited) | | | | | | | |
| | Security | | Value | | | Percentage of
Net Assets | |
| | CenturyLink, Inc. | | $ | 3,379,460 | | | | 3.5 | % | |
| | Royal Dutch Shell PLC, A Shares | | | 2,851,383 | | | | 2.9 | | |
| | Eni SpA | | | 2,796,648 | | | | 2.9 | | |
| | Atlantia SpA | | | 2,719,572 | | | | 2.8 | | |
| | Vodafone Group PLC | | | 2,361,502 | | | | 2.4 | | |
| | Red Electrica Corporacion SA | | | 2,306,642 | | | | 2.4 | | |
| | Mobile TeleSystems OJSC Sponsored ADR | | | 2,285,679 | | | | 2.4 | | |
| | Banco do Brasil SA | | | 1,969,047 | | | | 2.0 | | |
| | Agricultural Bank of China, Ltd., Class H | | | 1,914,376 | | | | 2.0 | | |
| | Intel Corp. | | | 1,911,685 | | | | 2.0 | | |
| | Portfolio Holdings Presented by Sector
June 30, 2013 (unaudited) | | | | |
| | Sector | | Percentage of
Total
Investments | |
| | Consumer Discretionary | | | 14.1 | % | | |
| | Consumer Staples | | | 1.7 | | | |
| | Energy | | | 9.7 | | | |
| | Financials | | | 26.2 | | | |
| | Health Care | | | 4.8 | | | |
| | Industrials | | | 7.6 | | | |
| | Information Technology | | | 8.0 | | | |
| | Materials | | | 3.0 | | | |
| | Telecommunications Services | | | 10.8 | | | |
| | Utilities | | | 2.9 | | | |
| | Emerging Markets Debt Obligations | | | 10.0 | | | |
| | Short-Term Investment | | | 1.2 | | | |
| | Total Investments | | | 100.0 | % | | |
| | | | | | | |
7
Lazard World Dividend & Income Fund, Inc.
Portfolio of Investments
June 30, 2013 (unaudited)
| Description | | Shares | | | Value | |
| | | | | | | |
| Common Stocks—100.0% | | | | | | | | |
| | | | | | | | | |
| Australia—2.3% | | | | | | | | |
| DUET Group | | | 456,124 | | | $ | 838,468 | |
| Transurban Group | | | 153,743 | | | | 950,494 | |
| Westfield Group REIT | | | 45,600 | | | | 477,088 | |
| | | | | | | | 2,266,050 | |
| | | | | | | | | |
| Belgium—0.8% | | | | | | | | |
| bpost SA | | | 41,150 | | | | 764,878 | |
| | | | | | | | | |
| Brazil—4.8% | | | | | | | | |
| Banco do Brasil SA | | | 198,717 | | | | 1,969,047 | |
| BB Seguridade Participacoes SA | | | 158,400 | | | | 1,246,557 | |
| Cia Hering | | | 46,400 | | | | 655,237 | |
| Direcional Engenharia SA | | | 125,300 | | | | 746,853 | |
| | | | | | | | 4,617,694 | |
| | | | | | | | | |
| Cambodia—0.7% | | | | | | | | |
| NagaCorp, Ltd. | | | 886,000 | | | | 692,254 | |
| | | | | | | | | |
| China—4.1% | | | | | | | | |
Agricultural Bank of China, Ltd.,
Class H | | | 4,640,000 | | | | 1,914,376 | |
China Construction Bank Corp.,
Class H | | | 1,963,180 | | | | 1,389,607 | |
Industrial and Commercial Bank of
China, Ltd., Class H | | | 1,036,440 | | | | 653,450 | |
| | | | | | | | 3,957,433 | |
| | | | | | | | | |
| Finland—1.6% | | | | | | | | |
| Sampo Oyj, A Shares | | | 38,534 | | | | 1,501,723 | |
| | | | | | | | | |
| France—6.9% | | | | | | | | |
| AXA SA | | | 73,034 | | | | 1,435,001 | |
| Rexel SA | | | 42,161 | | | | 948,307 | |
| Sanofi SA | | | 10,758 | | | | 1,114,930 | |
| Total SA | | | 27,541 | | | | 1,344,507 | |
| Valeo SA | | | 28,667 | | | | 1,801,725 | |
| | | | | | | | 6,644,470 | |
| | | | | | | | | |
| Germany—2.2% | | | | | | | | |
| Allianz SE | | | 7,412 | | | | 1,082,968 | |
| Bayerische Motoren Werke AG | | | 11,382 | | | | 995,297 | |
| | | | | | | | 2,078,265 | |
| | | | | | | | | |
| Guernsey—1.1% | | | | | | | | |
| Resolution, Ltd. | | | 239,710 | | | | 1,039,073 | |
| | | | | | | | | |
| Indonesia—0.5% | | | | | | | | |
PT Bank Pembangunan Daerah Jawa
Barat dan Banten Tbk | | | 4,280,500 | | | | 508,916 | |
| | | | | | | | | |
| Israel—1.6% | | | | | | | | |
Bezeq The Israeli Telecommunication
Corp., Ltd. | | | 1,137,912 | | | | 1,520,323 | |
| Description | | Shares | | | Value | |
| | | | | | | |
| Italy—5.7% | | | | | | | | |
| Atlantia SpA | | | 166,746 | | | $ | 2,719,572 | |
| Eni SpA | | | 136,156 | | | | 2,796,648 | |
| | | | | | | | 5,516,220 | |
| | | | | | | | | |
| Japan—1.7% | | | | | | | | |
| Mizuho Financial Group, Inc. | | | 797,300 | | | | 1,656,017 | |
| | | | | | | | | |
| Luxembourg—1.2% | | | | | | | | |
| RTL Group | | | 14,400 | | | | 1,184,230 | |
| | | | | | | | | |
| Macau—3.2% | | | | | | | | |
| Sands China, Ltd. | | | 272,000 | | | | 1,288,800 | |
| Wynn Macau, Ltd. | | | 678,000 | | | | 1,840,099 | |
| | | | | | | | 3,128,899 | |
| | | | | | | | | |
| Mexico—0.5% | | | | | | | | |
Fibra Uno Administracion SA de
CV REIT | | | 154,100 | | | | 517,455 | |
| | | | | | | | | |
| Norway—1.6% | | | | | | | | |
| Orkla ASA | | | 83,828 | | | | 686,704 | |
| Seadrill, Ltd. | | | 21,700 | | | | 884,058 | |
| | | | | | | | 1,570,762 | |
| | | | | | | | | |
| Russia—4.9% | | | | | | | | |
Globaltrans Investment PLC
Sponsored GDR | | | 95,851 | | | | 1,316,993 | |
Mobile TeleSystems OJSC
Sponsored ADR | | | 120,680 | | | | 2,285,679 | |
| Sberbank of Russia GDR (a), (b) | | | 96,808 | | | | 1,102,643 | |
| | | | | | | | 4,705,315 | |
| | | | | | | | | |
| South Africa—4.8% | | | | | | | | |
| AVI, Ltd. | | | 69,309 | | | | 416,834 | |
| Kumba Iron Ore, Ltd. | | | 13,647 | | | | 635,890 | |
| Life Healthcare Group Holdings Pte, Ltd. | | | 333,986 | | | | 1,267,012 | |
| MTN Group, Ltd. | | | 33,660 | | | | 626,546 | |
| Vodacom Group, Ltd. | | | 158,533 | | | | 1,684,274 | |
| | | | | | | | 4,630,556 | |
| | | | | | | | | |
| Spain—2.4% | | | | | | | | |
| Red Electrica Corporacion SA | | | 41,943 | | | | 2,306,642 | |
| | | | | | | | | |
| Sweden—1.8% | | | | | | | | |
| Electrolux AB, Series B | | | 36,909 | | | | 932,343 | |
| Swedbank AB, A Shares | | | 34,245 | | | | 785,387 | |
| | | | | | | | 1,717,730 | |
| | | | | | | | | |
| Switzerland—1.7% | | | | | | | | |
| Swiss Re AG | | | 12,945 | | | | 963,457 | |
| Zurich Insurance Group AG | | | 2,691 | | | | 697,999 | |
| | | | | | | | 1,661,456 | |
The accompanying notes are an integral part of these financial statements.
8
Lazard World Dividend & Income Fund, Inc.
Portfolio of Investments (continued)
June 30, 2013 (unaudited)
| Description | | Shares | | | Value | |
| | | | | | | |
| Taiwan—2.5% | | | | | | | | |
| Radiant Opto-Electronics Corp. | | | 322,000 | | | $ | 1,056,108 | |
| Siliconware Precision Industries Co. | | | 1,108,000 | | | | 1,393,734 | |
| | | | | | | | 2,449,842 | |
| | | | | | | | | |
| Thailand—1.2% | | | | | | | | |
| Dynasty Ceramic Public Co. Ltd. (b) | | | 269,600 | | | | 554,151 | |
| Krung Thai Bank Public Co. Ltd. (b) | | | 548,800 | | | | 359,202 | |
Tisco Financial Group Public Co.
Ltd. (b) | | | 217,800 | | | | 287,919 | |
| | | | | | | | 1,201,272 | |
| | | | | | | | | |
| Turkey—2.1% | | | | | | | | |
| Tofas Turk Otomobil Fabrikasi AS | | | 164,674 | | | | 1,028,839 | |
| Tupras-Turkiye Petrol Rafinerileri AS | | | 41,169 | | | | 1,005,371 | |
| | | | | | | | 2,034,210 | |
| | | | | | | | | |
| United Kingdom—8.1% | | | | | | | | |
| Direct Line Insurance Group PLC | | | 415,484 | | | | 1,472,397 | |
| Ladbrokes PLC | | | 167,471 | | | | 509,175 | |
| Rexam PLC | | | 84,204 | | | | 611,535 | |
| Royal Dutch Shell PLC, A Shares | | | 89,248 | | | | 2,851,383 | |
| Vodafone Group PLC | | | 826,537 | | | | 2,361,502 | |
| | | | | | | | 7,805,992 | |
| | | | | | | | | |
| United States—30.0% | | | | | | | | |
| Apple, Inc. | | | 1,779 | | | | 704,626 | |
| Aviv REIT, Inc. | | | 23,432 | | | | 592,595 | |
Blackstone Mortgage Trust, Inc.,
Class A | | | 48,800 | | | | 1,205,360 | |
| CenturyLink, Inc. | | | 95,600 | | | | 3,379,460 | |
| Cisco Systems, Inc. | | | 72,900 | | | | 1,772,199 | |
| ConocoPhillips | | | 16,560 | | | | 1,001,880 | |
| EPR Properties REIT | | | 17,800 | | | | 894,806 | |
| Harsco Corp. | | | 20,730 | | | | 480,729 | |
| Hasbro, Inc. | | | 40,285 | | | | 1,805,976 | |
| Intel Corp. | | | 78,930 | | | | 1,911,685 | |
| Johnson & Johnson | | | 12,100 | | | | 1,038,906 | |
| Lexington Realty Trust REIT | | | 150,500 | | | | 1,757,840 | |
| Medical Properties Trust, Inc. REIT | | | 44,300 | | | | 634,376 | |
| Microsoft Corp. | | | 46,100 | | | | 1,591,833 | |
| National CineMedia, Inc. | | | 36,600 | | | | 618,174 | |
| Nutrisystem, Inc. | | | 61,300 | | | | 722,114 | |
| People’s United Financial, Inc. | | | 55,700 | | | | 829,930 | |
| Pfizer, Inc. | | | 67,100 | | | | 1,879,471 | |
| Qualcomm, Inc. | | | 7,800 | | | | 476,424 | |
| Republic Services, Inc. | | | 21,500 | | | | 729,710 | |
| Southern Copper Corp. | | | 55,180 | | | | 1,524,072 | |
| STAG Industrial, Inc. REIT | | | 45,600 | | | | 909,720 | |
| Sysco Corp. | | | 54,610 | | | | 1,865,478 | |
| Wynn Resorts, Ltd. | | | 5,400 | | | | 691,200 | |
| | | | | | | | 29,018,564 | |
| Description | | Shares | | | Value | |
| | | | | | | |
Total Common Stocks
(Identified cost $94,044,233) | | | | | | $ | 96,696,241 | |
| | | | | | | | | |
| Preferred Stock—0.9% | | | | | | | | |
| | | | | | | | | |
| United States—0.9% | | | | | | | | |
Capital One Financial Corp.,
Series B
(Identified cost $928,277) | | | 37,205 | | | | 916,731 | |
| Description | | Principal
Amount
(000) (c) | | | Value | |
| | | | | | | |
Foreign Government
Obligations—11.3% | | | | | | | | |
| | | | | | | | | |
| Brazil—2.8% | | | | | | | | |
| Brazil NTN-B: | | | | | | | | |
| 6.00%, 05/15/15 | | | 915 | | | $ | 980,505 | |
| 6.00%, 08/15/16 | | | 273 | | | | 296,992 | |
| 6.00%, 08/15/18 | | | 460 | | | | 504,639 | |
Brazil NTN-F,
10.00%, 01/01/23 | | | 2,044 | | | | 910,487 | |
| | | | | | | | 2,692,623 | |
| | | | | | | | | |
| Colombia—0.1% | | | | | | | | |
Republic of Colombia,
12.00%, 10/22/15 | | | 188,000 | | | | 112,359 | |
| | | | | | | | | |
| Mexico—2.2% | | | | | | | | |
| Mexican Bonos: | | | | | | | | |
| 7.00%, 06/19/14 | | | 13,170 | | | | 1,044,723 | |
| 9.50%, 12/18/14 | | | 9,000 | | | | 746,403 | |
Mexican Udibonos,
5.00%, 06/16/16 | | | 4,308 | | | | 368,777 | |
| | | | | | | | 2,159,903 | |
| | | | | | | | | |
| Romania—1.9% | | | | | | | | |
| Romania Government Bonds: | | | | | | | | |
| 5.85%, 07/28/14 | | | 2,600 | | | | 764,889 | |
| 5.80%, 10/26/15 | | | 1,670 | | | | 492,419 | |
| 5.75%, 01/27/16 | | | 1,050 | | | | 309,605 | |
| 5.90%, 07/26/17 | | | 1,100 | | | | 322,045 | |
| | | | | | | | 1,888,958 | |
| | | | | | | | | |
| Russia—1.9% | | | | | | | | |
| Russia Government Bonds - OFZ: | | | | | | | | |
| 6.90%, 08/03/16 | | | 7,438 | | | | 228,644 | |
| 7.50%, 02/27/19 | | | 6,590 | | | | 203,579 | |
| 7.60%, 04/14/21 | | | 15,289 | | | | 473,719 | |
| 7.60%, 07/20/22 | | | 8,548 | | | | 262,115 | |
| 7.00%, 01/25/23 | | | 11,700 | | | | 343,822 | |
| 8.15%, 02/03/27 | | | 10,700 | | | | 334,454 | |
| | | | | | | | 1,846,333 | |
The accompanying notes are an integral part of these financial statements.
9
Lazard World Dividend & Income Fund, Inc.
Portfolio of Investments (continued)
June 30, 2013 (unaudited)
| Description | | Principal
Amount
(000) (c) | | | Value | |
| | | | | | | |
| South Africa—0.7% | | | | | | | | |
Republic of South Africa,
10.50%, 12/21/26 | | | 5,700 | | | $ | 698,977 | |
| | | | | | | | | |
| Turkey—0.9% | | | | | | | | |
| Turkey Government Bonds: | | | | | | | | |
| 8.00%, 10/09/13 | | | 465 | | | | 242,276 | |
| 10.00%, 12/04/13 | | | 310 | | | | 162,595 | |
| 4.00%, 04/29/15 | | | 808 | | | | 430,742 | |
| | | | | | | | 835,613 | |
| | | | | | | | | |
| Uruguay—0.8% | | | | | | | | |
| Uruguay Monetary Regulation Bills: | | | | | | | | |
| 0.00%, 07/05/13 | | | 11,150 | | | | 545,360 | |
| 0.00%, 07/16/13 | | | 450 | | | | 21,951 | |
| 0.00%, 08/15/13 | | | 3,000 | | | | 145,164 | |
| 0.00%, 01/31/14 | | | 900 | | | | 41,775 | |
| | | | | | | | 754,250 | |
| | | | | | | | | |
Total Foreign Government
Obligations
(Identified cost $11,333,591) | | | | | | | 10,989,016 | |
| | | | | | | |
| | | | | | | |
| Description | | Shares | | | Value | |
| | | | | | | |
| Short-Term Investment—1.4% | | | | | | | | |
State Street Institutional Treasury
Money Market Fund
(Identified cost $1,312,025) | | | 1,312,025 | | | $ | 1,312,025 | |
| | | | | | | | | |
Total Investments—113.6%
(Identified cost $107,618,126) (d), (e) | | | | | | $ | 109,914,013 | |
Liabilities in Excess of Cash and
Other Assets—(13.6)% | | | | | | | (13,189,923 | ) |
| Net Assets—100.0% | | | | | | $ | 96,724,090 | |
The accompanying notes are an integral part of these financial statements.
10
Lazard World Dividend & Income Fund, Inc.
Portfolio of Investments (continued)
June 30, 2013 (unaudited)
Forward Currency Purchase Contracts open at June 30, 2013:
| Currency | | Counterparty | | Expiration
Date | | Foreign
Currency
Amount | | U.S. $ Cost
on Origination
Date | | U.S. $
Current
Value | | Unrealized
Appreciation | | Unrealized
Depreciation | |
| BRL | | BRC | | 07/02/13 | | 693,030 | | $ | 318,049 | | $ | 310,587 | | $ | — | | $ | 7,462 | |
| BRL | | RBC | | 07/02/13 | | 124,137 | | | 58,000 | | | 55,633 | | | — | | | 2,367 | |
| BRL | | RBC | | 07/02/13 | | 343,537 | | | 166,000 | | | 153,959 | | | — | | | 12,041 | |
| CLP | | RBC | | 07/24/13 | | 278,712,000 | | | 553,000 | | | 546,462 | | | — | | | 6,538 | |
| CLP | | UBS | | 07/10/13 | | 251,727,600 | | | 497,240 | | | 494,777 | | | — | | | 2,463 | |
| CLP | | UBS | | 07/15/13 | | 252,899,100 | | | 528,381 | | | 496,640 | | | — | | | 31,741 | |
| CNY | | BRC | | 07/31/13 | | 4,353,804 | | | 702,000 | | | 707,479 | | | 5,479 | | | — | |
| CNY | | HSB | | 07/19/13 | | 4,169,787 | | | 675,181 | | | 678,323 | | | 3,142 | | | — | |
| COP | | CIT | | 08/02/13 | | 885,339,000 | | | 459,737 | | | 459,351 | | | — | | | 386 | |
| COP | | RBC | | 07/24/13 | | 506,800,000 | | | 265,549 | | | 263,182 | | | — | | | 2,367 | |
| COP | | RBC | | 08/08/13 | | 765,107,200 | | | 401,315 | | | 396,736 | | | — | | | 4,579 | |
| COP | | UBS | | 07/03/13 | | 885,339,000 | | | 470,000 | | | 460,710 | | | — | | | 9,290 | |
| COP | | UBS | | 07/15/13 | | 1,124,789,900 | | | 611,000 | | | 584,623 | | | — | | | 26,377 | |
| CZK | | BNP | | 07/08/13 | | 9,650,295 | | | 489,138 | | | 482,871 | | | — | | | 6,267 | |
| CZK | | BNP | | 08/06/13 | | 716,450 | | | 37,424 | | | 35,853 | | | — | | | 1,571 | |
| CZK | | JPM | | 08/06/13 | | 9,936,612 | | | 506,784 | | | 497,264 | | | — | | | 9,520 | |
| CZK | | JPM | | 08/06/13 | | 11,013,724 | | | 560,516 | | | 551,166 | | | — | | | 9,350 | |
| DOP | | CIT | | 07/11/13 | | 5,443,000 | | | 130,465 | | | 130,416 | | | — | | | 49 | |
| DOP | | CIT | | 08/12/13 | | 7,474,950 | | | 178,060 | | | 178,230 | | | 170 | | | — | |
| EUR | | BRC | | 09/23/13 | | 355,273 | | | 468,217 | | | 462,609 | | | — | | | 5,608 | |
| EUR | | BRC | | 09/23/13 | | 803,000 | | | 1,058,286 | | | 1,045,605 | | | — | | | 12,681 | |
| EUR | | CIT | | 09/10/13 | | 400,035 | | | 526,719 | | | 520,862 | | | — | | | 5,857 | |
| EUR | | JPM | | 08/06/13 | | 67,000 | | | 85,885 | | | 87,223 | | | 1,338 | | | — | |
| EUR | | JPM | | 08/06/13 | | 843,000 | | | 1,126,290 | | | 1,097,445 | | | — | | | 28,845 | |
| GHS | | CIT | | 07/24/13 | | 337,000 | | | 165,830 | | | 164,277 | | | — | | | 1,553 | |
| GHS | | SCB | | 08/19/13 | | 86,000 | | | 41,667 | | | 41,381 | | | — | | | 286 | |
| GHS | | SCB | | 08/19/13 | | 1,638,500 | | | 790,324 | | | 788,402 | | | — | | | 1,922 | |
| HUF | | BNP | | 08/26/13 | | 31,134,900 | | | 136,671 | | | 136,654 | | | — | | | 17 | |
| HUF | | JPM | | 07/24/13 | | 192,397,220 | | | 847,640 | | | 847,177 | | | — | | | 463 | |
| HUF | | UBS | | 07/22/13 | | 16,331,040 | | | 72,000 | | | 71,925 | | | — | | | 75 | |
| IDR | | JPM | | 07/30/13 | | 3,697,549,000 | | | 373,000 | | | 371,501 | | | — | | | 1,499 | |
| IDR | | SCB | | 07/03/13 | | 5,915,840,000 | | | 591,584 | | | 595,994 | | | 4,410 | | | — | |
| IDR | | SCB | | 07/17/13 | | 3,085,425,000 | | | 305,488 | | | 310,405 | | | 4,917 | | | — | |
| IDR | | SCB | | 08/02/13 | | 5,366,441,000 | | | 527,000 | | | 539,016 | | | 12,016 | | | — | |
| INR | | JPM | | 07/15/13 | | 31,866,680 | | | 586,000 | | | 535,004 | | | — | | | 50,996 | |
| INR | | JPM | | 02/10/14 | | 54,104,300 | | | 961,000 | | | 879,096 | | | — | | | 81,904 | |
| INR | | SCB | | 07/31/13 | | 25,658,430 | | | 427,000 | | | 429,547 | | | 2,547 | | | — | |
| INR | | UBS | | 07/15/13 | | 428,745 | | | 7,373 | | | 7,198 | | | — | | | 175 | |
| JPY | | HSB | | 07/26/13 | | 7,995,403 | | | 83,630 | | | 80,622 | | | — | | | 3,008 | |
| KRW | | CIT | | 07/22/13 | | 606,558,380 | | | 541,000 | | | 530,559 | | | — | | | 10,441 | |
| KRW | | JPM | | 07/10/13 | | 32,900,030 | | | 28,516 | | | 28,796 | | | 280 | | | — | |
| KRW | | UBS | | 07/10/13 | | 756,452,000 | | | 673,000 | | | 662,087 | | | — | | | 10,913 | |
| KRW | | UBS | | 09/23/13 | | 277,952,500 | | | 245,000 | | | 242,479 | | | — | | | 2,521 | |
| KZT | | CIT | | 09/26/13 | | 51,424,800 | | | 336,000 | | | 334,774 | | | — | | | 1,226 | |
| KZT | | CIT | | 01/06/14 | | 43,187,880 | | | 280,114 | | | 277,357 | | | — | | | 2,757 | |
| KZT | | CIT | | 03/17/14 | | 63,292,260 | | | 404,941 | | | 402,706 | | | — | | | 2,235 | |
| KZT | | HSB | | 07/09/13 | | 20,776,050 | | | 135,419 | | | 136,741 | | | 1,322 | | | — | |
| KZT | | HSB | | 07/09/13 | | 41,900,000 | | | 272,964 | | | 275,772 | | | 2,808 | | | — | |
| KZT | | HSB | | 07/24/13 | | 38,200,000 | | | 251,266 | | | 250,916 | | | — | | | 350 | |
The accompanying notes are an integral part of these financial statements.
11
Lazard World Dividend & Income Fund, Inc.
Portfolio of Investments (continued)
June 30, 2013 (unaudited)
Forward Currency Purchase Contracts open at June 30, 2013 (continued):
| Currency | | Counterparty | | Expiration
Date | | Foreign
Currency
Amount | | U.S. $ Cost
on Origination
Date | | U.S. $
Current
Value | | Unrealized
Appreciation | | Unrealized
Depreciation | |
| KZT | | HSB | | 07/29/13 | | 63,292,260 | | $ | 417,000 | | $ | 415,457 | | $ | — | | $ | 1,543 | |
| KZT | | HSB | | 10/30/13 | | 79,207,200 | | | 513,000 | | | 513,259 | | | 259 | | | — | |
| KZT | | HSB | | 06/16/14 | | 51,424,800 | | | 324,140 | | | 323,209 | | | — | | | 931 | |
| KZT | | HSB | | 06/16/14 | | 79,207,200 | | | 498,849 | | | 497,823 | | | — | | | 1,026 | |
| KZT | | UBS | | 02/28/14 | | 52,830,750 | | | 340,844 | | | 336,901 | | | — | | | 3,943 | |
| MYR | | JPM | | 07/10/13 | | 4,729,721 | | | 1,528,725 | | | 1,496,160 | | | — | | | 32,565 | |
| MYR | | JPM | | 09/18/13 | | 1,511,790 | | | 483,000 | | | 476,094 | | | — | | | 6,906 | |
| NGN | | BRC | | 09/10/13 | | 29,203,550 | | | 178,342 | | | 175,342 | | | — | | | 3,000 | |
| NGN | | BRC | | 06/18/14 | | 20,851,000 | | | 116,000 | | | 114,600 | | | — | | | 1,400 | |
| NGN | | CIT | | 07/23/13 | | 20,350,000 | | | 110,000 | | | 124,279 | | | 14,279 | | | — | |
| NGN | | CIT | | 08/12/13 | | 55,917,000 | | | 343,999 | | | 339,135 | | | — | | | 4,864 | |
| NGN | | CIT | | 09/19/13 | | 21,846,000 | | | 132,000 | | | 130,720 | | | — | | | 1,280 | |
| NGN | | JPM | | 06/17/14 | | 23,400,000 | | | 130,000 | | | 128,649 | | | — | | | 1,351 | |
| NGN | | SCB | | 09/24/13 | | 26,759,200 | | | 162,177 | | | 159,817 | | | — | | | 2,360 | |
| NGN | | SCB | | 10/31/13 | | 23,572,000 | | | 141,065 | | | 139,085 | | | — | | | 1,980 | |
| NGN | | SCB | | 10/31/13 | | 46,469,800 | | | 278,013 | | | 274,192 | | | — | | | 3,821 | |
| NGN | | SCB | | 12/18/13 | | 103,802,600 | | | 610,604 | | | 603,420 | | | — | | | 7,184 | |
| NGN | | SCB | | 03/20/14 | | 85,737,200 | | | 493,452 | | | 484,425 | | | — | | | 9,027 | |
| PEN | | BNP | | 07/24/13 | | 985,559 | | | 371,629 | | | 353,524 | | | — | | | 18,105 | |
| PEN | | BNP | | 08/23/13 | | 1,492,597 | | | 561,000 | | | 534,113 | | | — | | | 26,887 | |
| PEN | | HSB | | 07/18/13 | | 1,302,188 | | | 466,567 | | | 467,365 | | | 798 | | | — | |
| PEN | | JPM | | 08/21/13 | | 893,106 | | | 324,000 | | | 319,638 | | | — | | | 4,362 | |
| PEN | | UBS | | 08/01/13 | | 832,100 | | | 295,501 | | | 298,251 | | | 2,750 | | | — | |
| PHP | | BRC | | 07/18/13 | | 31,565,710 | | | 737,000 | | | 730,516 | | | — | | | 6,484 | |
| PHP | | JPM | | 07/08/13 | | 21,089,020 | | | 502,000 | | | 488,125 | | | — | | | 13,875 | |
| PLN | | BNP | | 07/24/13 | | 1,454,181 | | | 443,497 | | | 437,044 | | | — | | | 6,453 | |
| PLN | | BRC | | 07/22/13 | | 2,493,640 | | | 783,000 | | | 749,540 | | | — | | | 33,460 | |
| RON | | JPM | | 08/21/13 | | 933,553 | | | 276,756 | | | 270,671 | | | — | | | 6,085 | |
| RSD | | BRC | | 08/09/13 | | 77,822,550 | | | 927,011 | | | 882,781 | | | — | | | 44,230 | |
| RSD | | CIT | | 07/31/13 | | 33,269,680 | | | 383,866 | | | 378,177 | | | — | | | 5,689 | |
| RUB | | BNP | | 12/09/13 | | 16,735,950 | | | 506,000 | | | 495,381 | | | — | | | 10,619 | |
| RUB | | BRC | | 09/27/13 | | 24,745,896 | | | 777,000 | | | 741,813 | | | — | | | 35,187 | |
| RUB | | CIT | | 07/01/13 | | 48,284,805 | | | 1,472,995 | | | 1,469,577 | | | — | | | 3,418 | |
| RUB | | JPM | | 07/01/13 | | 1,245,855 | | | 39,000 | | | 37,918 | | | — | | | 1,082 | |
| RUB | | UBS | | 07/01/13 | | 13,767,255 | | | 384,668 | | | 419,015 | | | 34,347 | | | — | |
| RUB | | UBS | | 07/01/13 | | 21,619,770 | | | 660,398 | | | 658,011 | | | — | | | 2,387 | |
| RUB | | UBS | | 09/16/13 | | 15,951,180 | | | 489,000 | | | 479,044 | | | — | | | 9,956 | |
| RUB | | UBS | | 12/13/13 | | 16,238,600 | | | 490,000 | | | 480,327 | | | — | | | 9,673 | |
| SGD | | HSB | | 07/15/13 | | 1,157,864 | | | 924,000 | | | 913,527 | | | — | | | 10,473 | |
| SGD | | HSB | | 07/24/13 | | 728,265 | | | 580,000 | | | 574,594 | | | — | | | 5,406 | |
| THB | | BNP | | 07/18/13 | | 6,644,540 | | | 217,000 | | | 214,067 | | | — | | | 2,933 | |
| THB | | SCB | | 07/18/13 | | 14,760,155 | | | 477,907 | | | 475,527 | | | — | | | 2,380 | |
| THB | | SCB | | 07/23/13 | | 16,530,050 | | | 538,000 | | | 532,408 | | | — | | | 5,592 | |
| TRY | | HSB | | 09/20/13 | | 1,065,613 | | | 558,000 | | | 545,673 | | | — | | | 12,327 | |
| TRY | | JPM | | 07/05/13 | | 71,467 | | | 38,000 | | | 37,031 | | | — | | | 969 | |
| TRY | | JPM | | 07/05/13 | | 436,632 | | | 230,000 | | | 226,247 | | | — | | | 3,753 | |
| TRY | | JPM | | 07/05/13 | | 1,303,390 | | | 721,500 | | | 675,371 | | | — | | | 46,129 | |
| TRY | | JPM | | 07/05/13 | | 1,892,734 | | | 1,003,211 | | | 980,748 | | | — | | | 22,463 | |
| TWD | | HSB | | 07/15/13 | | 14,820,976 | | | 496,000 | | | 494,559 | | | — | | | 1,441 | |
The accompanying notes are an integral part of these financial statements.
12
Lazard World Dividend & Income Fund, Inc.
Portfolio of Investments (continued)
June 30, 2013 (unaudited)
Forward Currency Purchase Contracts open at June 30, 2013 (concluded):
| Currency | | Counterparty | | Expiration
Date | | Foreign
Currency
Amount | | U.S. $ Cost
on Origination
Date | | U.S. $
Current
Value | | Unrealized
Appreciation | | Unrealized
Depreciation | |
| UGX | | BRC | | 08/07/13 | | 1,190,937,000 | | | $ | 453,000 | | | $ | 454,566 | | | $ | 1,566 | | | $ | — | |
| UGX | | CIT | | 07/05/13 | | 1,210,447,000 | | | | 457,118 | | | | 466,410 | | | | 9,292 | | | | — | |
| UYU | | CIT | | 07/29/13 | | 2,880,000 | | | | 137,602 | | | | 139,335 | | | | 1,733 | | | | — | |
| UYU | | CIT | | 07/31/13 | | 1,890,980 | | | | 97,928 | | | | 91,445 | | | | — | | | | 6,483 | |
| UYU | | CIT | | 08/05/13 | | 3,141,000 | | | | 162,830 | | | | 151,722 | | | | — | | | | 11,108 | |
| UYU | | CIT | | 09/09/13 | | 3,222,060 | | | | 166,000 | | | | 154,419 | | | | — | | | | 11,581 | |
| UYU | | HSB | | 07/25/13 | | 1,767,486 | | | | 84,166 | | | | 85,584 | | | | 1,418 | | | | — | |
| ZAR | | BRC | | 08/19/13 | | 1,533,908 | | | | 152,000 | | | | 154,107 | | | | 2,107 | | | | — | |
| ZAR | | BRC | | 08/19/13 | | 7,376,799 | | | | 782,825 | | | | 741,124 | | | | — | | | | 41,701 | |
| ZAR | | JPM | | 07/29/13 | | 2,483,660 | | | | 265,000 | | | | 250,270 | | | | — | | | | 14,730 | |
| ZMW | | BRC | | 07/15/13 | | 1,521,800 | | | | 280,000 | | | | 276,780 | | | | — | | | | 3,220 | |
| ZMW | | BRC | | 08/07/13 | | 2,757,570 | | | | 510,000 | | | | 498,787 | | | | — | | | | 11,213 | |
| ZMW | | SCB | | 08/28/13 | | 2,642,948 | | | | 493,087 | | | | 475,889 | | | | — | | | | 17,198 | |
| ZMW | | SCB | | 09/19/13 | | 1,184,619 | | | | 210,449 | | | | 211,906 | | | | 1,457 | | | | — | |
| ZMW | | SCB | | 12/19/13 | | 789,746 | | | | 137,228 | | | | 137,590 | | | | 362 | | | | — | |
| Total Forward Currency Purchase Contracts | | $ | 47,822,612 | | | $ | 47,021,476 | | | $ | 108,797 | | | $ | 909,933 | |
Forward Currency Sale Contracts open at June 30, 2013:
| Currency | | Counterparty | | Expiration
Date | | Foreign
Currency
Amount | | U.S. $ Cost
on Origination
Date | | U.S. $
Current
Value | | Unrealized
Appreciation | | Unrealized
Depreciation | |
| BRL | | BRC | | 08/02/13 | | 693,030 | | | $ | 315,962 | | | $ | 308,418 | | | $ | 7,544 | | | $ | — | |
| BRL | | RBC | | 07/02/13 | | 1,160,704 | | | | 512,000 | | | | 520,180 | | | | — | | | | 8,180 | |
| CLP | | BNP | | 07/10/13 | | 36,176,040 | | | | 69,764 | | | | 71,105 | | | | — | | | | 1,341 | |
| COP | | CIT | | 07/03/13 | | 885,339,000 | | | | 461,114 | | | | 460,710 | | | | 404 | | | | — | |
| CZK | | BNP | | 07/08/13 | | 680,176 | | | | 33,887 | | | | 34,034 | | | | — | | | | 147 | |
| CZK | | BNP | | 07/08/13 | | 8,970,119 | | | | 468,458 | | | | 448,837 | | | | 19,621 | | | | — | |
| CZK | | JPM | | 08/06/13 | | 21,666,786 | | | | 1,126,290 | | | | 1,084,283 | | | | 42,007 | | | | — | |
| EUR | | BNP | | 07/08/13 | | 377,000 | | | | 489,138 | | | | 490,734 | | | | — | | | | 1,596 | |
| EUR | | BNP | | 07/25/13 | | 356,000 | | | | 469,133 | | | | 463,429 | | | | 5,704 | | | | — | |
| EUR | | BRC | | 08/09/13 | | 689,000 | | | | 927,011 | | | | 896,976 | | | | 30,035 | | | | — | |
| EUR | | BRC | | 09/23/13 | | 616,000 | | | | 825,392 | | | | 802,108 | | | | 23,284 | | | | — | |
| EUR | | CIT | | 07/31/13 | | 289,000 | | | | 383,866 | | | | 376,220 | | | | 7,646 | | | | — | |
| EUR | | HSB | | 07/22/13 | | 105,293 | | | | 136,000 | | | | 137,066 | | | | — | | | | 1,066 | |
| EUR | | HSB | | 07/22/13 | | 116,084 | | | | 152,000 | | | | 151,112 | | | | 888 | | | | — | |
| EUR | | HSB | | 07/22/13 | | 815,399 | | | | 1,070,798 | | | | 1,061,448 | | | | 9,350 | | | | — | |
| EUR | | JPM | | 08/06/13 | | 86,443 | | | | 115,000 | | | | 112,534 | | | | 2,466 | | | | — | |
| EUR | | JPM | | 08/06/13 | | 1,852,173 | | | | 2,395,776 | | | | 2,411,220 | | | | — | | | | 15,444 | |
| EUR | | JPM | | 08/06/13 | | 386,315 | | | | 506,784 | | | | 502,918 | | | | 3,866 | | | | — | |
| EUR | | JPM | | 08/06/13 | | 428,000 | | | | 560,517 | | | | 557,185 | | | | 3,332 | | | | — | |
| EUR | | UBS | | 07/31/13 | | 55,597 | | | | 72,412 | | | | 72,377 | | | | 35 | | | | — | |
| EUR | | UBS | | 07/31/13 | | 181,682 | | | | 242,000 | | | | 236,513 | | | | 5,487 | | | | — | |
| EUR | | UBS | | 07/31/13 | | 183,753 | | | | 244,500 | | | | 239,210 | | | | 5,290 | | | | — | |
| HUF | | BRC | | 07/24/13 | | 234,655,280 | | | | 1,035,868 | | | | 1,033,249 | | | | 2,619 | | | | — | |
| IDR | | SCB | | 07/03/13 | | 5,915,840,000 | | | | 591,702 | | | | 595,994 | | | | — | | | | 4,292 | |
| JPY | | HSB | | 07/26/13 | | 51,898,868 | | | | 529,000 | | | | 523,326 | | | | 5,674 | | | | — | |
| JPY | | SCB | | 07/26/13 | | 88,021,442 | | | | 886,000 | | | | 887,571 | | | | — | | | | 1,571 | |
| JPY | | UBS | | 09/18/13 | | 23,104,235 | | | | 245,000 | | | | 233,036 | | | | 11,964 | | | | — | |
The accompanying notes are an integral part of these financial statements.
13
Lazard World Dividend & Income Fund, Inc.
Portfolio of Investments (concluded)
June 30, 2013 (unaudited)
Forward Currency Sale Contracts open at June 30, 2013 (concluded):
| Currency | | Counterparty | | Expiration
Date | | Foreign
Currency
Amount | | U.S. $ Cost
on Origination
Date | | U.S. $
Current
Value | | Unrealized
Appreciation | | Unrealized
Depreciation | |
| KZT | | CIT | | 07/29/13 | | 63,292,260 | | | $ | 415,849 | | | $ | 415,457 | | | $ | 392 | | | $ | — | |
| KZT | | HSB | | 09/26/13 | | 51,424,800 | | | | 335,015 | | | | 334,774 | | | | 241 | | | | — | |
| KZT | | HSB | | 10/30/13 | | 79,207,200 | | | | 513,499 | | | | 513,259 | | | | 240 | | | | — | |
| MXN | | CIT | | 08/19/13 | | 9,693,116 | | | | 752,454 | | | | 744,895 | | | | 7,559 | | | | — | |
| MYR | | BRC | | 07/08/13 | | 1,518,504 | | | | 471,000 | | | | 480,417 | | | | — | | | | 9,417 | |
| MYR | | BRC | | 07/10/13 | | 834,300 | | | | 270,000 | | | | 263,915 | | | | 6,085 | | | | — | |
| MYR | | JPM | | 07/10/13 | | 786,218 | | | | 249,000 | | | | 248,705 | | | | 295 | | | | — | |
| PHP | | CIT | | 07/18/13 | | 31,565,710 | | | | 716,100 | | | | 730,516 | | | | — | | | | 14,416 | |
| PHP | | JPM | | 07/08/13 | | 21,089,020 | | | | 490,785 | | | | 488,125 | | | | 2,660 | | | | — | |
| RUB | | CIT | | 07/01/13 | | 12,129,390 | | | | 384,950 | | | | 369,165 | | | | 15,785 | | | | — | |
| RUB | | CIT | | 07/01/13 | | 15,781,500 | | | | 501,000 | | | | 480,320 | | | | 20,680 | | | | — | |
| RUB | | CIT | | 09/16/13 | | 8,805,380 | | | | 265,206 | | | | 264,442 | | | | 764 | | | | — | |
| RUB | | CIT | | 09/16/13 | | 48,744,743 | | | | 1,467,000 | | | | 1,463,895 | | | | 3,105 | | | | — | |
| RUB | | JPM | | 07/01/13 | | 1,245,855 | | | | 38,056 | | | | 37,918 | | | | 138 | | | | — | |
| RUB | | UBS | | 07/01/13 | | 35,387,025 | | | | 1,083,000 | | | | 1,077,026 | | | | 5,974 | | | | — | |
| TRY | | BRC | | 07/10/13 | | 78,512 | | | | 40,381 | | | | 40,651 | | | | — | | | | 270 | |
| TRY | | CIT | | 07/10/13 | | 613,301 | | | | 315,322 | | | | 317,547 | | | | — | | | | 2,225 | |
| TRY | | JPM | | 07/05/13 | | 175,211 | | | | 92,000 | | | | 90,788 | | | | 1,212 | | | | — | |
| TRY | | JPM | | 07/05/13 | | 829,226 | | | | 428,098 | | | | 429,676 | | | | — | | | | 1,578 | |
| TRY | | JPM | | 07/05/13 | | 1,393,064 | | | | 728,000 | | | | 721,837 | | | | 6,163 | | | | — | |
| UGX | | CIT | | 07/05/13 | | 83,040,000 | | | | 32,000 | | | | 31,997 | | | | 3 | | | | — | |
| ZAR | | CIT | | 07/29/13 | | 2,401,134 | | | | 238,000 | | | | 241,954 | | | | — | | | | 3,954 | |
| ZAR | | JPM | | 07/29/13 | | 3,412,946 | | | | 348,615 | | | | 343,910 | | | | 4,705 | | | | — | |
| ZAR | | JPM | | 07/29/13 | | 5,332,866 | | | | 539,000 | | | | 537,374 | | | | 1,626 | | | | — | |
| Total Forward Currency Sale Contracts | | | $ | 25,579,702 | | | $ | 25,380,356 | | | $ | 264,843 | | | $ | 65,497 | |
Gross unrealized appreciation/depreciation on Forward Currency
Purchase and Sale Contracts | | | $ | 373,640 | | | $ | 975,430 | |
| BRL | — Brazilian Real | NGN | — Nigerian Naira |
| CLP | — Chilean Peso | PEN | — Peruvian New Sol |
| CNY | — Chinese Renminbi | PHP | — Philippine Peso |
| COP | — Colombian Peso | PLN | — Polish Zloty |
| CZK | — Czech Koruna | RON | — New Romanian Leu |
| DOP | — Dominican Republic Peso | RSD | — Serbian Dinar |
| EUR | — Euro | RUB | — Russian Ruble |
| GHS | — Ghanaian Cedi | SGD | — Singapore Dollar |
| HUF | — Hungarian Forint | THB | — Thai Baht |
| IDR | — Indonesian Rupiah | TRY | — New Turkish Lira |
| INR | — Indian Rupee | TWD | — New Taiwan Dollar |
| JPY | — Japanese Yen | UGX | — Ugandan Shilling |
| KRW | — South Korean Won | UYU | — Uruguayan Peso |
| KZT | — Kazakhstan Tenge | ZAR | — South African Rand |
| MXN | — Mexican New Peso | ZMW | — Zambian Kwacha |
| MYR | — Malaysian Ringgit | |
| Counterparty Abbreviations: | |
| BRC | — Barclays Bank PLC |
| BNP | — BNP Paribas SA |
| CIT | — Citibank NA |
| HSB | — HSBC Bank USA |
| JPM | — JPMorgan Chase Bank |
| RBC | — Royal Bank of Canada |
| SCB | — Standard Chartered Bank |
| UBS | — UBS AG |
The accompanying notes are an integral part of these financial statements.
14
Lazard World Dividend & Income Fund, Inc.
Notes to Portfolio of Investments
June 30, 2013 (unaudited)
| (a) | Pursuant to Rule 144A under the Securities Act of 1933, the security may only be traded among “qualified institutional buyers.” At June 30, 2013, this security amounted to 1.1% of net assets of the Fund, and is considered to be liquid. |
| | |
| (b) | Security valued using Level 2 inputs, based on reference to a similar security from the same issuer which was trading on an active market, under accounting principles generally accepted in the United States of America (“GAAP”) hierarchy – see Note 10. |
| | |
| (c) | Principal amount denominated in respective country’s currency. |
| | |
| (d) | For federal income tax purposes, the aggregate cost was $107,618,126, aggregate gross unrealized appreciation was $7,741,241, aggregate gross unrealized depreciation was $5,445,354, and the net unrealized appreciation was $2,295,887. |
| | |
| (e) | The Fund, at all times, maintains portfolio securities in sufficient amount to cover its obligations related to investments in forward currency contracts. |
| ADR | — American Depositary Receipt |
| GDR | — Global Depositary Receipt |
| NTN-B | — Brazil Sovereign “Nota do Tesouro Nacional” Series B |
| NTN-F | — Brazil Sovereign “Nota do Tesouro Nacional” Series F |
| REIT | — Real Estate Investment Trust |
| Portfolio holdings by industry (as a percentage of net assets): |
| Automotive | | | 4.0 | % |
| Banking | | | 9.3 | |
| Commercial Services | | | 2.4 | |
| Computer Software | | | 1.6 | |
| Consumer Products | | | 2.8 | |
| Electric | | | 3.3 | |
| Energy Integrated | | | 9.3 | |
| Energy Services | | | 0.9 | |
| Financial Services | | | 3.5 | |
| Food & Beverages | | | 1.9 | |
| Forest & Paper Products | | | 0.6 | |
| Health Services | | | 1.3 | |
| Housing | | | 1.3 | |
| Insurance | | | 9.8 | |
| Leisure & Entertainment | | | 7.2 | |
| Manufacturing | | | 1.6 | |
| Metals & Mining | | | 2.2 | |
| Pharmaceutical & Biotechnology | | | 4.2 | |
| Real Estate | | | 7.2 | |
| Retail | | | 0.7 | |
| Semiconductors & Components | | | 4.5 | |
| Technology Hardware | | | 3.1 | |
| Telecommunications | | | 12.3 | |
| Transportation | | | 5.9 | |
| Subtotal | | | 100.9 | |
| Foreign Government Obligations | | | 11.3 | |
| Short-Term Investment | | | 1.4 | |
| Total Investments | | | 113.6 | % |
The accompanying notes are an integral part of these financial statements.
15
Lazard World Dividend & Income Fund, Inc.
Statement of Assets and Liabilities
June 30, 2013 (unaudited)
| ASSETS | | | | |
| Investments in securities, at value (cost $107,618,126) | | $ | 109,914,013 | |
| Foreign currency, at value (cost $1,542,587) | | | 1,542,578 | |
| Dividends and interest receivable | | | 874,317 | |
| Gross unrealized appreciation on forward currency contracts | | | 373,640 | |
| Total assets | | | 112,704,548 | |
| | | | | |
| LIABILITIES | | | | |
| Payables for: | | | | |
| Management fees | | | 102,527 | |
| Investments purchased | | | 189,598 | |
| Line of credit outstanding | | | 14,634,000 | |
| Gross unrealized depreciation on forward currency contracts | | | 975,430 | |
| Other accrued expenses and payables | | | 78,903 | |
| Total liabilities | | | 15,980,458 | |
| Net assets | | $ | 96,724,090 | |
| | | | | |
| NET ASSETS | | | | |
| Paid in capital (Note 2(f)) | | $ | 125,879,889 | |
| Distributions in excess of net investment income (Note 2(f)) | | | (1,584,977 | ) |
| Accumulated net realized loss | | | (29,261,790 | ) |
| Net unrealized appreciation (depreciation) on: | | | | |
| Investments | | | 2,295,887 | |
| Foreign currency and forward currency contracts | | | (604,919 | ) |
| Net assets | | $ | 96,724,090 | |
| | | | | |
| Shares of common stock outstanding* | | | 6,880,183 | |
| Net asset value per share | | $ | 14.06 | |
| Market value per share | | $ | 13.12 | |
* $0.001 par value, 500,000,000 shares authorized for the Fund.
The accompanying notes are an integral part of these financial statements.
16
Lazard World Dividend & Income Fund, Inc.
Statement of Operations
For the Six Months Ended June 30, 2013 (unaudited)
INVESTMENT INCOME
| Income: | | | | |
| Dividends (net of foreign withholding taxes of $300,982) | | $ | 3,310,453 | |
| Interest (net of foreign withholding taxes of $9) | | | 309,899 | |
| Total investment income | | | 3,620,352 | |
| | | | | |
| Expenses: | | | | |
| Management fees (Note 3) | | | 639,771 | |
| Professional services | | | 71,171 | |
| Custodian fees | | | 51,894 | |
| Shareholders’ reports | | | 40,834 | |
| Administration fees | | | 31,168 | |
| Shareholders’ services | | | 21,403 | |
| Shareholders’ meeting | | | 10,321 | |
| Directors’ fees and expenses | | | 3,135 | |
| Other | | | 23,683 | |
| Total expenses before interest expense | | | 893,380 | |
| Interest expense | | | 59,507 | |
| Total expenses | | | 952,887 | |
| Net investment income | | | 2,667,465 | |
| | | | | |
NET REALIZED AND UNREALIZED GAIN (LOSS) ON INVESTMENTS, FOREIGN CURRENCY
AND FORWARD CURRENCY CONTRACTS | | | | |
| Net realized gain on: | | | | |
| Investments | | | 2,380,841 | |
| Foreign currency and forward currency contracts | | | 505,100 | |
| Total net realized gain on investments, foreign currency and forward currency contracts | | | 2,885,941 | |
| Net change in unrealized depreciation on: | | | | |
| Investments | | | (3,839,508 | ) |
| Foreign currency and forward currency contracts | | | (1,129,330 | ) |
Total net change in unrealized depreciation on investments, foreign currency
and forward currency contracts | | | (4,968,838 | ) |
Net realized and unrealized loss on investments, foreign currency
and forward currency contracts | | | (2,082,897 | ) |
| Net increase in net assets resulting from operations | | $ | 584,568 | |
The accompanying notes are an integral part of these financial statements.
17
Lazard World Dividend & Income Fund, Inc.
Statements of Changes in Net Assets
| | | Six Months Ended | | Year Ended | |
| | | June 30, 2013 | | December 31, | |
| | | (unaudited) | | 2012 | |
| INCREASE (DECREASE) IN NET ASSETS | | | | | | | | | |
| | | | | | | | | | |
| Operations: | | | | | | | | | |
| Net investment income | | | $ | 2,667,465 | | | $ | 3,788,406 | |
Net realized gain on investments, foreign currency and forward
currency contracts | | | | 2,885,941 | | | | 4,585,064 | |
Net change in unrealized appreciation (depreciation) on investments,
foreign currency and forward currency contracts | | | | (4,968,838 | ) | | | 12,183,709 | |
| Net increase in net assets resulting from operations | | | | 584,568 | | | | 20,557,179 | |
| Distributions to Stockholders (Note 2(f)): | | | | | | | | | |
| From net investment income | | | | (3,229,008 | ) | | | (5,478,002 | ) |
| Net decrease in net assets resulting from distributions | | | | (3,229,008 | ) | | | (5,478,002 | ) |
| Total increase (decrease) in net assets | | | | (2,644,440 | ) | | | 15,079,177 | |
| Net assets at beginning of period | | | | 99,368,530 | | | | 84,289,353 | |
| Net assets at end of period* | | | $ | 96,724,090 | | | $ | 99,368,530 | |
| * Includes distributions in excess of net investment income of (Note 2(f)) | | | $ | (1,584,977 | ) | | $ | (1,023,434 | ) |
| | | | | | | | | | |
| Transactions in Capital Shares: | | | | | | | | | |
| Common shares outstanding at beginning of period | | | | 6,880,183 | | | | 6,880,183 | |
| Common shares outstanding at end of period | | | | 6,880,183 | | | | 6,880,183 | |
The accompanying notes are an integral part of these financial statements.
18
Lazard World Dividend & Income Fund, Inc.
Statement of Cash Flows
For the Six Months Ended June 30, 2013 (unaudited)
INCREASE (DECREASE) IN CASH AND FOREIGN CURRENCY
| Cash flows from operating activities: | | | | |
| Net increase in net assets resulting from operations | | $ | 584,568 | |
Adjustments to reconcile net increase in net assets resulting from operations
to net cash used in operating activities | | | | |
| Increase in dividends and interest receivable | | | (672,962 | ) |
| Accretion of bond discount and amortization of bond premium | | | (10,383 | ) |
| Inflation index adjustment | | | (36,032 | ) |
| Decrease in other accrued expenses and payables | | | (64,727 | ) |
| Net realized gain on investments, foreign currency and forward currency contracts | | | (2,885,941 | ) |
Net change in unrealized depreciation on investments, foreign currency
and forward currency contracts | | | 4,968,838 | |
| Purchase of long-term investments | | | (44,578,398 | ) |
| Proceeds from disposition of long-term investments | | | 43,114,223 | |
| Purchase of short-term investments, net | | | (1,238,247 | ) |
| Net cash used in operating activities | | | (819,061 | ) |
| Cash flows from financing activities: | | | | |
| Cash distribution paid (Note 2(f)) | | | (3,229,008 | ) |
| Gross drawdowns in line of credit balance | | | 6,470,000 | |
| Gross paydowns in line of credit balance | | | (3,000,000 | ) |
| Net cash provided by financing activities | | | 240,992 | |
| Effect of exchange rate changes on cash | | | 498,872 | |
| Net decrease in cash and foreign currency | | | (79,197 | ) |
| Cash and foreign currency: | | | | |
| Beginning balance | | | 1,621,775 | |
| Ending balance | | $ | 1,542,578 | |
| | | | | |
| Supplemental disclosure of cash flow information: | | | | |
| Cash paid during the period for interest | | $ | (62,279 | ) |
The accompanying notes are an integral part of these financial statements.
19
Lazard World Dividend & Income Fund, Inc.
Financial Highlights
Selected data for a share of common stock outstanding throughout each period
| | | Six Months | | | | | | | | | | | |
| | | Ended | | Year Ended | |
| | | 6/30/13† | | 12/31/12 | | 12/31/11 | | 12/31/10 | | 12/31/09 | | 12/31/08 | |
| Net asset value, beginning of period | | $ | 14.44 | | $ | 12.25 | | $ | 13.90 | | $ | 13.04 | | $ | 9.78 | | $ | 20.21 | |
| Income (loss) from investment operations: | | | | | | | | | | | | | | | | | | | |
| Net investment income | | | 0.39 | | | 0.55 | | | 0.63 | | | 0.62 | | | 0.78 | | | 1.05 | |
| Net realized and unrealized gain (loss) | | | (0.30 | ) | | 2.44 | | | (1.38 | ) | | 1.09 | | | 3.25 | | | (9.63 | ) |
| Total from investment operations | | | 0.09 | | | 2.99 | | | (0.75 | ) | | 1.71 | | | 4.03 | | | (8.58 | ) |
| Less distributions from (Note 2(f)): | | | | | | | | | | | | | | | | | | | |
| Net investment income | | | (0.47 | ) | | (0.80 | ) | | (0.90 | ) | | (0.85 | ) | | (0.55 | ) | | (1.41 | ) |
| Net realized gains | | | — | | | — | | | — | | | — | | | — | | | (0.44 | ) |
| Return of capital | | | — | | | — | | | — | | | — | | | (0.22 | ) | | — | |
| Total distributions | | | (0.47 | ) | | (0.80 | ) | | (0.90 | ) | | (0.85 | ) | | (0.77 | ) | | (1.85 | ) |
| Net asset value, end of period | | $ | 14.06 | | $ | 14.44 | | $ | 12.25 | | $ | 13.90 | | $ | 13.04 | | $ | 9.78 | |
| | | | | | | | | | | | | | | | | | | | |
| Market value, end of period | | $ | 13.12 | | $ | 12.55 | | $ | 10.83 | | $ | 12.82 | | $ | 11.15 | | $ | 8.74 | |
| | | | | | | | | | | | | | | | | | | | |
| Total Return based upon (a): | | | | | | | | | | | | | | | | | | | |
| Net asset value | | | 0.54% | | | 25.18% | | | –5.67% | | | 13.85% | | | 44.18% | | | –44.82% | |
| Market value | | | 8.18% | | | 23.99% | | | –9.17% | | | 23.70% | | | 39.81% | | | –48.02% | |
| | | | | | | | | | | | | | | | | | | | |
| Ratios and Supplemental Data: | | | | | | | | | | | | | | | | | | | |
| Net assets, end of period (in thousands) | | $ | 96,724 | | $ | 99,369 | | $ | 84,289 | | $ | 95,615 | | $ | 89,751 | | $ | 67,262 | |
| Ratios to average net assets (b): | | | | | | | | | | | | | | | | | | | |
| Net expenses | | | 1.89% | | | 1.93% | | | 2.06% | | | 2.11% | | | 2.13% | | | 2.30% | |
| Gross expenses | | | 1.89% | | | 1.93% | | | 2.06% | | | 2.11% | | | 2.13% | | | 2.30% | |
| Net investment income | | | 5.29% | | | 4.15% | | | 4.67% | | | 4.78% | | | 7.21% | | | 6.62% | |
| Portfolio turnover rate | | | 39% | | | 77% | | | 91% | | | 67% | | | 93% | | | 86% | |
| † | Unaudited. |
| (a) | Total return based on per share market price assumes the purchase of common shares at the closing market price on the business day immediately preceding the first day, and sales of common shares at the closing market price on the last day, of each period indicated; dividends and distributions are assumed to be reinvested in accordance with the Fund’s Dividend Reinvestment Plan. The total return based on net asset value, or NAV, assumes the purchase of common shares at the “net asset value, beginning of period” and sales of common shares at the “net asset value, end of period”, for each of the periods indicated; distributions are assumed to be reinvested at NAV. Past performance is not indicative, or a guarantee, of future results; the investment return, market price and net asset value of the Fund will fluctuate, so that an investor’s shares in the Fund, when sold, may be worth more or less than their original cost. The returns do not reflect the deduction of taxes that a stockholder would pay on the Fund’s distributions or on the sale of Fund shares. A period of less than one year is not annualized. |
| (b) | Annualized for a period of less than one year. |
The accompanying notes are an integral part of these financial statements.
20
Lazard World Dividend & Income Fund, Inc.
Notes to Financial Statements
June 30, 2013 (unaudited)
1. Organization
Lazard World Dividend & Income Fund, Inc. (the “Fund”) was incorporated in Maryland on April 6, 2005 and is registered under the Investment Company Act of 1940, as amended (the “Act”), as a diversified, closed-end management investment company. The Fund trades on the NYSE under the ticker symbol LOR and commenced operations on June 28, 2005. The Fund’s investment objective is total return through a combination of net income and capital appreciation.
2. Significant Accounting Policies
The accompanying financial statements are presented in conformity with GAAP. The following is a summary of significant accounting policies:
(a) Valuation of Investments—Market values for securities listed on the NYSE, NASDAQ national market or other US or foreign exchanges or markets are generally based on the last reported sales price on the exchange or market on which the security is principally traded, generally as of the close of regular trading on the NYSE (normally 4:00 p.m. Eastern time) on each valuation date; securities not traded on the valuation date are valued at the most recent quoted bid price. The Fund values NASDAQ-traded securities at the NASDAQ Official Closing Price, which may not be the last reported sales price in certain instances. Forward currency contracts are valued using quotations from an independent pricing service. Investments in money market funds are valued at the fund’s net asset value.
Bonds and other fixed-income securities that are not exchange-traded are valued on the basis of prices provided by independent pricing services which are based primarily on institutional trading in similar groups of securities, or by using brokers’ quotations or a matrix system which considers such factors as other security prices, yields and maturities. Debt securities maturing in 60 days or less are valued at amortized cost, except where to do so would not accurately reflect their fair value, in which case such securities are valued at fair value as determined by, or in accordance with procedures approved by, the Board of Directors (the “Board”).
The Valuation Committee of the Investment Manager, which meets periodically under the direction of the Board, may evaluate a variety of factors to determine the fair value of securities for which market quotations are determined not to be readily available or reliable. These factors include, but are not limited to, the type of security, the value of comparable securities, observations from financial institutions and relevant news events. Input from the Investment Manager’s analysts also will be considered.
If a significant event materially affecting the value of securities occurs between the close of the exchange or market on which the security is principally traded and the time when the Fund’s net asset value is calculated, or when current market quotations otherwise are determined not to be readily available or reliable (including restricted or other illiquid securities such as certain derivative instruments), such securities will be valued at their fair value as determined by, or in accordance with procedures approved by, the Board. The fair value of foreign securities may be determined with the assistance of an independent pricing service using correlations between the movement of prices of such securities and indices of domestic securities and other appropriate indicators, such as closing market prices of relevant ADRs or futures contracts. Foreign securities may trade on days when the Fund is not open for business, thus affecting the value of the Fund’s assets on days when Fund stockholders may not be able to buy or sell Fund shares.
The effect of using fair value pricing is that the net asset value of the Fund will reflect the affected securities’ values as determined in the judgment of the Board or its designee instead of being determined by the market. Using a fair value pricing methodology to price securities may result in a value that is different from the most recent closing price of a security and from the prices used by other investment companies to calculate their portfolios’ net asset values.
(b) Portfolio Securities Transactions and Investment Income—Portfolio securities transactions are accounted for on trade date. Realized gain (loss) on sales of investments are recorded on a specific identification basis. Dividend income is recorded on the ex-dividend date and interest income is accrued daily. The Fund amortizes premiums and accretes discounts on fixed-income securities using the effective yield method.
The Fund may be subject to taxes imposed by foreign countries in which it invests. Such taxes are generally based upon income earned or capital gains (realized or unrealized). The Fund accrues and applies such taxes to net investment income, net realized gains and net unrealized gains concurrent with the recognition of income or capital gains (realized and unrealized) from the applicable portfolio securities.
(c) Leveraging—The Fund uses leverage to invest Fund assets in currency investments, primarily using forward currency contracts and by borrowing under a credit facility with State Street Bank and Trust Company (“State Street”), up to a maximum of 33⅓% of the Fund’s total leveraged assets. If the assets of the Fund decline due to market con-
Lazard World Dividend & Income Fund, Inc.
Notes to Financial Statements (continued)
June 30, 2013 (unaudited)
ditions such that this 33⅓% threshold will be exceeded, leverage risk will increase.
If the Fund is able to realize a higher return on the leveraged portion of its investment portfolio than the cost of such leverage together with other related expenses, the effect of the leverage will be to cause the Fund to realize a higher net return than if the Fund were not so leveraged. There is no assurance that any leveraging strategy the Fund employs will be successful.
Using leverage is a speculative investment technique and involves certain risks. These include higher volatility of net asset value, the likelihood of more volatility in the market value of the Fund’s common stocks and, with respect to borrowings, the possibility either that the Fund’s return will fall if the interest rate on any borrowings rises, or that income will fluctuate because the interest rate of borrowings varies.
If the market value of the Fund’s leveraged currency investments declines, the leverage will result in a greater decrease in net asset value, or less of an increase in net asset value, than if the Fund were not leveraged. To the extent that the Fund is required or elects to prepay any borrowings, the Fund may need to liquidate investments to fund such prepayments. Liquidation at times of adverse economic conditions may result in capital losses and may reduce returns.
(d) Foreign Currency Translation and Forward Currency Contracts—The accounting records of the Fund are maintained in US dollars. Portfolio securities and other assets and liabilities denominated in a foreign currency are translated daily into US dollars at the prevailing rates of exchange. Purchases and sales of securities, income receipts and expense payments are translated into US dollars at the prevailing exchange rates on the respective transaction dates.
The Fund does not isolate the portion of operations resulting from changes in foreign exchange rates on investments from the fluctuations arising from changes in their market prices. Such fluctuations are included in net realized and unrealized gain (loss) on investments. Net realized gain (loss) on foreign currency and forward currency contracts represents net foreign currency gain (loss) from forward currency contracts, disposition of foreign currencies, currency gain (loss) realized between the trade and settlement dates on securities transactions, and the difference between the amount of dividends, interest and foreign withholding taxes recorded on the Fund’s accounting records and the US dollar equivalent amounts actually received or paid. Net change in unrealized appreciation
(depreciation) on foreign currency reflects the impact of changes in exchange rates on the value of assets and liabilities, other than investments in securities, during the period.
A forward currency contract is an agreement between two parties to buy or sell currency at a set price on a future date. Upon entering into these contracts, risks may arise from the potential inability of counterparties to meet the terms of their contracts and from unanticipated movements in the value of the foreign currency relative to the US dollar.
The US dollar value of forward currency contracts is determined using quotations provided by an independent pricing service. Daily fluctuations in the value of such contracts are recorded as unrealized appreciation (depreciation) on forward currency contracts. When the contract is closed, the Fund records a realized gain (loss) equal to the difference between the value at the time it was opened and the value at the time it was closed.
(e) Federal Income Tax Policy—It is the Fund’s policy to comply with the requirements of Subchapter M of the Internal Revenue Code applicable to regulated investment companies and to distribute substantially all of its taxable income to its stockholders. Therefore, no provision for federal income taxes is required. The Fund files tax returns with the US Internal Revenue Service and various states.
At December 31, 2012, the Fund had $2,594,036 and $29,179,195 of unused realized capital loss carryforwards, expiring in 2016 and 2017, respectively.
Under current tax law, certain capital and net foreign currency losses realized after October 31 within the taxable year may be deferred and treated as occurring on the first day of the following tax year. For the tax year ended December 31, 2012, the Fund had no net capital and foreign currency losses arising between November 1, 2012 and December 31, 2012.
On December 22, 2010, the Regulated Investment Company Modernization Act of 2010 (the “RIC Modernization Act”) was signed into law. The RIC Modernization Act includes numerous provisions that generally became effective for taxable years beginning after the date of enactment. Among the new provisions, net capital losses may be carried forward indefinitely, and their character is retained as short-term or long-term. Previously, net capital losses were carried forward for eight years and treated as short-term losses. The RIC Modernization Act also requires that post-enactment net capital losses be used before pre-enactment net capital
Lazard World Dividend & Income Fund, Inc.
Notes to Financial Statements (continued)
June 30, 2013 (unaudited)
losses. As a result, pre-enactment capital loss carryforwards may expire unused.
Management has analyzed the Fund’s tax positions, and has concluded that no liability for unrecognized tax benefits should be recorded related to uncertain tax positions taken on returns filed for open tax years (2009-2011), or expected to be taken in the Fund’s 2012 tax returns.
(f) Dividends and Distributions—The Fund intends to declare and to pay dividends monthly from net investment income. Distributions to stockholders are recorded on the ex-dividend date. During any particular year, net realized gains from investment transactions in excess of available capital loss carryforwards would be taxable to the Fund, if not distributed. The Fund intends to declare and distribute these amounts, at least annually, to stockholders; however, to avoid taxation, a second distribution may be required.
Income dividends and capital gains distributions are determined in accordance with federal income tax regulations which may differ from GAAP. These book/tax differences, which may result in distribution reclassifications, are primarily due to differing treatments of foreign currency transactions, wash sales, and distributions from real estate investment trusts and partnerships. The book/tax differences relating to stockholder distributions resulted in reclassifications among certain capital accounts.
The Fund has implemented a level distribution policy to seek to maintain a stable monthly distribution, subject to oversight of the Fund’s Board. Under the Fund’s level distribution policy, the Fund intends to make regular monthly distributions at a fixed rate per share. If for any monthly distribution, net investment income and net realized short-term capital gain were less than the amount of the distribution, the difference would generally be distributed from the Fund’s assets. In addition, in order to make such distributions, the Fund might have to sell a portion of its investment portfolio at a time when independent investment judgment might not dictate such actions.
In July 2010, the Investment Manager, on behalf of itself and the Fund, received an exemptive order from the Securities and Exchange Commission (the “SEC”) facilitating the implementation of a distribution policy that may include multiple long-term capital gains distributions (“Managed Distribution Policy”). As a result, the Fund may, subject to the determination of its Board, implement a Managed Distribution Policy.
Concurrent with the monthly distributions paid from January 2013 through June 2013, the Fund issued notices pursuant to Section 19(a) of the Act (the “Section 19(a) Notices”) each stating that the Fund had currently esti-
mated that it had distributed more than its net investment income and realized capital gains. Based on these estimates, it is possible that some or all of the amounts distributed may represent a return of capital. The Section 19(a) Notices may also be viewed at www.LazardNet.com.
The amounts and sources of distributions shown on the Section 19(a) Notices are only estimates and are not provided for tax reporting purposes. The actual amounts and sources of the cumulative distributions for tax reporting purposes will depend upon the Fund’s investment experience during the year and may be subject to changes based on tax regulations. The Fund will send stockholders a Form 1099-DIV for the calendar year explaining how to report these distributions for federal income tax purposes.
(g) Estimates—The preparation of financial statements in conformity with GAAP requires the Fund to make estimates and assumptions that affect the reported amounts of assets and liabilities and disclosure of contingent assets and liabilities at the date of the financial statements and the reported amounts of increases and decreases in net assets from operations during the reporting period. Actual results could differ from those estimates.
(h) Subsequent Events—Management has performed its evaluation of subsequent events and has determined that there were no subsequent events requiring adjustment or disclosure in the financial statements.
3. Investment Management Agreement
The Fund has entered into an investment management agreement (the “Management Agreement”) with the Investment Manager. Pursuant to the Management Agreement, the Investment Manager regularly provides the Fund with investment research, advice and supervision and furnishes continuously an investment program for the Fund consistent with its investment objective and policies, including the purchase, retention and disposition of securities.
The Fund has agreed to pay the Investment Manager an annual investment management fee of 0.90% of the Fund’s average daily “Total Leveraged Assets” (the Fund’s total assets including Financial Leverage (defined below)) for the services and facilities provided by the Investment Manager, payable on a monthly basis. The fee paid to the Investment Manager will be higher when the Investment Manager uses Currency Commitments (defined below) and Borrowings (defined below) (“Financial Leverage”) to make Currency Investments (defined below), rather than by reducing the percentage of “Net Assets” (the Fund’s assets without taking into account Financial Leverage) invested in World Equity Investments for the purposes of making
Lazard World Dividend & Income Fund, Inc.
Notes to Financial Statements (continued)
June 30, 2013 (unaudited)
Currency Investments. “World Equity Investments” refers to investments in the Fund’s world equity strategy. “Currency Investments” refers to investments in the Fund’s emerging income strategy, consisting of emerging market currencies (primarily by entering into forward currency contracts), or instruments whose value is derived from the performance of an underlying emerging market currency, but also may invest in debt obligations, including government, government agency and corporate obligations and structured notes denominated in emerging market currencies. “Currency Commitments” are the aggregate financial exposures created by forward currency contracts in excess of that represented in the Fund’s Net Assets, and “Borrowings” refers to the borrowings under the Fund’s credit facility. Assuming Financial Leverage in the amount of 33⅓% of the Fund’s Total Leveraged Assets, the annual fee payable to the Investment Manager would be 1.35% of Net Assets (i.e., not including amounts attributable to Financial Leverage).
The following is an example of this calculation of the Investment Manager’s fee, using very simple illustrations. If the Fund had assets of $1,000, it could invest $1,000 in World Equity Investments and enter into $500 in forward currency contracts (because the Fund would not have to pay money at the time it enters into the currency contracts). Similarly, the Fund could invest $1,000 in World Equity Investments, borrow $500 and invest the $500 in foreign currency denominated bonds. In either case, the Investment Manager’s fee would be calculated based on $1,500 of assets, because the fee is calculated based on Total Leveraged Assets (Net Assets plus Financial Leverage). In our example, the Financial Leverage is in the form of either the forward currency contracts (Currency Commitments) or investments from Borrowings. The amount of the Financial Leverage outstanding, and therefore the amount of Total Leveraged Assets on which the Investment Manager’s fee is based, fluctuates daily based on changes in value of the Fund’s portfolio holdings, including changes in value of the currency involved in the forward currency contracts and foreign currency denominated bonds acquired with the proceeds of Borrowings. However, the Investment Manager’s fee will be the same regardless of whether Currency Investments are made with Currency Commitments or with Borrowings (without taking into account the cost of Borrowings).
This method of calculating the Investment Manager’s fee is different than the way closed-end investment companies typically calculate management fees. Traditionally, closed-end investment companies calculate management fees based on Net Assets plus Borrowings (excluding Financial Leverage obtained through Currency
Commitments). The Investment Manager’s fee is different because the Fund’s leverage strategy is different than the leverage strategy employed by many other closed-end investment companies. Although the Fund may employ Borrowings in making Currency Investments, the Fund’s leverage strategy relies primarily on Currency Commitments, rather than relying exclusively on borrowing money and/or issuing preferred stock, as is the strategy employed by most closed-end investment companies. The Investment Manager’s fee would be lower if its fee were calculated only on Net Assets plus Borrowings, because the Investment Manager would not earn fees on Currency Investments made with Currency Commitments (forward currency contracts). Using the example above, where the Fund has assets of $1,000 and invests $1,000 in World Equity Investments and $500 in forward currency contracts, the following table illustrates how the Investment Manager’s fee would be different if it did not earn management fees on these types of Currency Investments. A discussion of the most recent review and approval by the Fund’s Board of the Management Agreement (including the method of calculating the Investment Manager’s fee) is included under “Other Information—Board Consideration of Management Agreement.”
| Beginning assets of $1,000 | | Fund’s management
fee based on
Total Leveraged
Assets (includes
Currency
Commitments) | | Typical
management
fee formula,
calculated excluding
Currency
Commitments | |
World Equity Investments
(Net Assets) | | | $ | 1,000 | | | | $ | 1,000 | | |
| Currency Commitments | | | $ | 500 | | | | $ | 500 | | |
| Assets used to calculate management fee | | | $ | 1,500 | | | | $ | 1,000 | | |
| Management fee (0.90%) | | | $ | 13.50 | | | | $ | 9.00 | | |
Investment Manager Fee Conflict Risk—The fee paid to the Investment Manager for investment management services will be higher when the Fund uses Financial Leverage, whether through forward currency contracts or Borrowings, because the fee paid will be calculated on the basis of the Fund’s assets including this Financial Leverage. Consequently, the Investment Manager may have a financial interest for the Fund to utilize such Financial Leverage, which may create a conflict of interest between the Investment Manager and the stockholders of the Fund.
The Fund has implemented procedures to monitor this potential conflict.
Lazard World Dividend & Income Fund, Inc.
Notes to Financial Statements (continued)
June 30, 2013 (unaudited)
4. Administration Agreement
The Fund has entered into an administration agreement with State Street to provide certain administrative services. The Fund bears the cost of such services at a fixed annual rate of $42,500, plus 0.02% of average daily net assets up to $1 billion and 0.01% of average daily net assets over $1 billion.
5. Directors’ Compensation
Certain Directors of the Fund are officers of the Investment Manager. Each Director who is not an affiliated person of the Investment Manager or any of its affiliates is paid by the Fund, The Lazard Funds, Inc., Lazard Retirement Series, Inc. and Lazard Global Total Return and Income Fund, Inc. (collectively with the Fund, the “Lazard Funds”), each a registered management investment company advised by the Investment Manager: (1) an annual retainer of $100,000, (2) a per meeting in person regular or special meeting fee of $5,000 ($1,500 for telephonic participation), including Board, committee, subcommittee or other special meetings specifically authorized by the Board and held in connection with delegated Fund business, and (3) a telephone Audit Committee or special Board meeting fee of $1,500, with an additional annual fee for the Audit Committee Chairman of $5,000. Such Directors are also reimbursed for travel and other out-of-pocket expenses for attending Board and committee meetings. No additional compensation is provided in respect of committee meetings held in conjunction with a meeting of the Board. Compensation is, generally, divided among the Lazard Funds based on relative net assets. The Directors do not receive benefits from the Fund pursuant to any pension, retirement or similar arrangement.
6. Securities Transactions and Transactions with Affiliates
Purchases and sales of portfolio securities (excluding short-term investments) for the period ended June 30, 2013 were $44,686,157 and $43,103,413, respectively.
For the period ended June 30, 2013, no brokerage commissions were paid to affiliates of the Investment Manager or other affiliates of the Fund for portfolio transactions executed on behalf of the Fund.
7. Line of Credit
The Fund has a $20 million Line of Credit Agreement (the “Agreement”) with State Street primarily to borrow to invest Fund assets in Currency Investments. The Fund may borrow the lesser of $20 million or 33⅓% of its Total Leveraged Assets. Interest on borrowings was payable at the higher of the Federal Funds rate or Overnight LIBOR
rate plus 0.75% on an annualized basis. Under the Agreement, the Fund has also agreed to pay a 0.15% per annum fee on the unused portion of the commitment, payable quarterly in arrears. For the period ended June 30, 2013, the Fund had borrowings under the Agreement as follows:
Average Daily
Loan Balance* | | Maximum Daily
Loan Outstanding | | Weighted Average
Interest Rate |
| | | | | |
| $14,363,167 | | $15,784,000 | | 0.91% |
| * | For 181 days borrowings were outstanding. |
The line of credit outstanding as of June 30, 2013 approximates its fair value and is categorized as Level 2.
8. Non-US Securities Investment Risks
The Fund invests in securities of foreign entities and in instruments denominated in foreign currencies which involve risks not typically associated with investments in US securities. Non-US securities carry special risks, such as exposure to currency fluctuations, less developed or less efficient trading markets, political instability, a lack of company information, differing auditing and legal standards, and, potentially, less liquidity. In addition, investments denominated in currencies other than US dollars carry the risk that such currencies will decline in value relative to the US dollar and affect the value of these investments held in the Fund. The Fund’s investments in emerging market countries are exposed to additional risks. The Fund’s performance will be influenced by political, social and economic factors affecting companies in emerging market countries. Emerging market countries generally have economic structures that are less diverse and mature, and political systems that are less stable, than those of developed countries.
9. Contractual Obligations
The Fund enters into contracts in the normal course of business that contain a variety of indemnifications. The Fund’s maximum exposure under these arrangements is unknown. Management has reviewed the Fund’s existing contracts and expects the risk of loss to be remote.
10. Fair Value Measurements
Fair value is defined as the price that the Fund would receive to sell an asset, or would pay to transfer a liability, in an orderly transaction between market participants at the date of measurement. The Fair Value Measurements and Disclosures provisions of GAAP also establish a framework for measuring fair value, and a three-level hierarchy for fair value measurement that is based upon the transparency of inputs to the valuation of an asset or liabil-
25
Lazard World Dividend & Income Fund, Inc.
Notes to Financial Statements (continued)
June 30, 2013 (unaudited)
ity. Inputs may be observable or unobservable and refer, broadly, to the assumptions that market participants would use in pricing the asset or liability. Observable inputs reflect the assumptions that market participants would use in pricing the asset or liability based on market data obtained from sources independent of the Fund. Unobservable inputs reflect the Fund’s own assumptions about the assumptions that market participants would use in pricing the asset or liability, developed based on the best information available in the circumstances. Each investment’s fair value measurement level within the fair value hierarchy is based on the lowest level of any input that is significant to the overall fair value measurement. The three-level hierarchy of inputs is summarized below.
| • | Level 1—unadjusted quoted prices in active markets for identical investments |
| | |
| • | Level 2—other significant observable inputs (including unadjusted quoted prices for similar investments, interest rates, prepayment speeds, credit risk, etc.) |
| | |
| • | Level 3—significant unobservable inputs (including the Fund’s own assumptions in determining the fair value of investments) |
The inputs or methodology used for valuing securities are not necessarily an indication of the risks associated with investing in these securities.
The following table summarizes the valuation of the Fund’s investments by each fair value hierarchy level as of June 30, 2013:
| Description | | Unadjusted
Quoted Prices in
Active Markets
for Identical
Investments
(Level 1) | | Significant
Other
Observable
Inputs
(Level 2) | | Significant
Unobservable
Inputs
(Level 3) | | Balance as of
June 30, 2013 | |
| Assets: | | | | | | | | | | | | | | | | | | | | |
| Common Stocks* | | | | | | | | | | | | | | | | | | | | |
| Russia | | $ | 3,602,672 | | | | $ | 1,102,643 | | | | $ | — | | | | $ | 4,705,315 | | |
| Thailand | | | — | | | | | 1,201,272 | | | | | — | | | | | 1,201,272 | | |
| Other | | | 90,789,654 | | | | | — | | | | | — | | | | | 90,789,654 | | |
| Preferred Stock* | | | 916,731 | | | | | — | | | | | — | | | | | 916,731 | | |
| Foreign Government Obligations* | | | — | | | | | 10,989,016 | | | | | — | | | | | 10,989,016 | | |
| Short-Term Investment | | | — | | | | | 1,312,025 | | | | | — | | | | | 1,312,025 | | |
| Other Financial Instruments** | | | | | | | | | | | | | | | | | | | | |
| Forward Currency Contracts | | | — | | | | | 373,640 | | | | | — | | | | | 373,640 | | |
| Total | | $ | 95,309,057 | | | | $ | 14,978,596 | | | | $ | — | | | | $ | 110,287,653 | | |
| | | | | | | | | | | | | | | | | | | | | |
| Liabilities: | | | | | | | | | | | | | | | | | | | | |
| Other Financial Instruments** | | | | | | | | | | | | | | | | | | | | |
| Forward Currency Contracts | | $ | — | | | | $ | (975,430 | ) | | | $ | — | | | | $ | (975,430 | ) | |
| | | | | | | | | | | | | | | | | | | | | | |
| * | Please refer to Portfolio of Investments (page 8 through 10) and Notes to Portfolio of Investments (page 15) for portfolio holdings by country and industry. |
| ** | Other financial instruments are derivative instruments which are valued at their respective unrealized appreciation/depreciation. |
Certain equity securities (see footnote (b) in the Notes to Portfolio of Investments) included in Level 2 were valued based on reference to similar securities from the same issuers which were trading on active markets. The foreign government obligations included in Level 2 were valued on the basis of prices provided by independent pricing services. The forward currency contracts included in Level 2 were valued using quotations provided by an independent pricing service. The short-term investment included in Level 2 (a money market fund) was valued at the fund’s net asset value.
In connection with the periodic implementation of fair value pricing procedures with respect to foreign securities (see Note 2(a)), certain equity securities (other than those securities described in footnote (b) in the Notes to Portfolio of Investments) were transferred from Level 1 to Level 2 as a result of fair value pricing procedure triggers being met and would revert to Level 1 when the fair value pricing procedure triggers are no longer met. There were no other transfers into or out of Levels 1, 2 or 3 during the period ended June 30, 2013.
26
Lazard World Dividend & Income Fund, Inc.
Notes to Financial Statements (continued)
June 30, 2013 (unaudited)
For further information regarding security characteristics see Portfolio of Investments.
11. Derivative Instruments
The Fund may use derivative instruments, including forward currency contracts, to gain exposure to the local currency and interest rates of emerging markets or to hedge certain types of currency exposure.
For the period ended June 30, 2013, the notional amounts of purchases and sales of forward currency contracts were $47,822,612 and $25,579,702, respectively.
The following table summarizes the fair value of derivative instruments on the Statement of Assets and Liabilities as of June 30, 2013:
| | | Fair Value | |
| Asset Derivatives | | | | |
| Foreign Exchange Risk: | | | | |
Gross unrealized appreciation on forward currency
contracts | | $ | 373,640 | |
| | | | | |
| Liability Derivatives | | | | |
| Foreign Exchange Risk: | | | | |
Gross unrealized depreciation on forward currency
contracts | | $ | 975,430 | |
The effect of derivative instruments on the Statement of Operations for the period ended June 30, 2013 was:
| | | Amount | |
| Realized Gain (Loss) on Derivatives Recognized | | | |
| in Income | | | | |
| Foreign Exchange Risk: | | | | |
| Net realized gain on forward currency contracts | | $ | 572,875 | |
| | | Amount | |
| Net Change in Unrealized Appreciation (Depreciation) | | | |
| on Derivatives Recognized in Income | | | | |
| Foreign Exchange Risk: | | | | |
| Net change in unrealized depreciation on forward currency contracts | | $ | (1,123,100 | ) |
See Note 2(d) and the Portfolio of Investments for additional disclosures about derivative instruments.
12. Accounting Standards Updates
On January 31, 2013, the Financial Accounting Standards Board (the “FASB”) issued Accounting Standards Update No. 2013-01, Clarifying the Scope of Disclosures about Offsetting Assets and Liabilities (“ASU 2013-01”). ASU 2013-01 limits the scope of balance sheet offsetting disclosures to derivatives, repurchase agreements, and securities lending transactions to the extent that they are (1) offset in the financial statements or (2) subject to an enforceable master netting arrangement or similar agreement.
In December 2011, the FASB issued Accounting Standards Update No. 2011-11 (“ASU 2011-11”), Balance Sheet (Topic 210): Disclosures about Offsetting Assets and Liabilities. ASU 2011-11 requires disclosure of both gross and net balances for certain investments and transactions entered into under master netting agreements, better aligning US GAAP requirements with International Financial Reporting Standards.
The required information for the Fund is presented in the table below, as of June 30, 2013.
| | | | Gross Amounts Not Offset in the
Statement of Assets & Liabilities | |
| Counterparty | | | Net Amounts
of Assets
Presented in
Statement of
Assets & Liabilities | | Financial
Instrument | | Collateral
Received | | Net Amount
(not less than $0) | |
| Barclays Bank PLC | | | $ | 78,719 | | | | $ | (78,719 | ) | | | $ | — | | | | $ | — | | |
| BNP Paribas SA | | | | 25,325 | | | | | (25,325 | ) | | | | — | | | | | — | | |
| Citibank NA | | | | 81,812 | | | | | (81,812 | ) | | | | — | | | | | — | | |
| HSBC Bank USA | | | | 26,140 | | | | | (26,140 | ) | | | | — | | | | | — | | |
| JPMorgan Chase Bank | | | | 70,088 | | | | | (70,088 | ) | | | | — | | | | | — | | |
| Standard Chartered Bank | | | | 25,709 | | | | | (25,709 | ) | | | | — | | | | | — | | |
| UBS AG | | | | 65,847 | | | | | (65,847 | ) | | | | — | | | | | — | | |
| Total | | | $ | 373,640 | | | | $ | (373,640 | ) | | | $ | — | | | | $ | — | | |
| | | | | | | | | | | | | | | | | | | | | | | |
27
Lazard World Dividend & Income Fund, Inc.
Notes to Financial Statements (concluded)
June 30, 2013 (unaudited)
| | | | Gross Amounts Not Offset in the
Statement of Assets & Liabilities | |
| Counterparty | | | Net Amounts
of Liabilities
Presented in
Statement of
Assets & Liabilities | | Financial
Instrument | | Collateral
Pledged | | Net Amount
(not less than $0) | |
| Barclays Bank PLC | | | $ | 215,333 | | | | $ | (78,719 | ) | | | $ | — | | | | $ | 136,614 | | |
| BNP Paribas SA | | | | 75,936 | | | | | (25,325 | ) | | | | — | | | | | 50,611 | | |
| Citibank NA | | | | 89,522 | | | | | (81,812 | ) | | | | — | | | | | 7,710 | | |
| HSBC Bank USA | | | | 37,571 | | | | | (26,140 | ) | | | | — | | | | | 11,431 | | |
| JPMorgan Chase Bank | | | | 353,869 | | | | | (70,088 | ) | | | | — | | | | | 283,781 | | |
| Royal Bank of Canada | | | | 36,072 | | | | | — | | | | | — | | | | | 36,072 | | |
| Standard Chartered Bank | | | | 57,613 | | | | | (25,709 | ) | | | | — | | | | | 31,904 | | |
| UBS AG | | | | 109,514 | | | | | (65,847 | ) | | | | — | | | | | 43,667 | | |
| Total | | | $ | 975,430 | | | | $ | (373,640 | ) | | | $ | — | | | | $ | 601,790 | | |
| | | | | | | | | | | | | | | | | | | | | | | |
In June 2013, the FASB issued ASU No. 2013-08,
Financial Services – Investment Companies (Topic 946): Amendments to the Scope, Measurement, and Disclosure Requirements. This ASU clarifies the characteristics of an investment company, provides comprehensive guidance to determine whether an entity is an investment company
and sets certain measurement and disclosure requirements. This ASU is effective for interim and annual periods in the fiscal years that begin after December 15, 2013. The Investment Manager does not expect that the adoption of this standard will have a material impact on the financial statements.
28
Lazard World Dividend & Income Fund, Inc.
Proxy Voting Results
(unaudited)
The Annual Meeting of Stockholders was held on April 26, 2013, to vote on the following proposal. The proposal received the required number of votes of stockholders and was adopted.
Election of the following Directors:
| • | Three Class I Directors (Charles L. Carroll, Leon M. Pollack and Robert M. Solmson) each to serve for a three-year term expiring at the 2016 Annual Meeting and/or until his successor is duly elected and qualified. |
| Director | | For | | Withhold Authority |
| Charles L. Carroll | | | 6,356,307 | | | | 100,663 | |
| Leon M. Pollack | | | 6,361,920 | | | | 95,050 | |
| Robert M. Solmson | | | 6,359,191 | | | | 97,779 | |
29
Lazard World Dividend & Income Fund, Inc.
Dividend Reinvestment Plan
(unaudited)
Unless you elect to receive distributions in cash (i.e., opt-out), all dividends, including any capital gain distributions, on your common stock will be automatically reinvested by Computershare, Inc., as dividend disbursing agent (the “Plan Agent”), in additional common stock under the Fund’s Dividend Reinvestment Plan (the “Plan”). You may elect not to participate in the Plan by contacting the Plan Agent. If you do not participate, you will receive all distributions in cash, paid by check mailed directly to you by the Plan Agent.
Under the Plan, the number of shares of common stock you will receive will be determined on the dividend or distribution payment date, as follows:
| (1) | If the common stock is trading at or above net asset value at the time of valuation, the Fund will issue new shares at a price equal to the greater of (i) net asset value per common share on that date or (ii) 95% of the common stock’s market price on that date. |
| | |
| (2) | If the common stock is trading below net asset value at the time of valuation, the Plan Agent will receive the dividend or distribution in cash and will purchase common stock in the open market, on the NYSE or elsewhere, for the participants’ accounts. It is possible that the market price for the common stock may increase before the Plan Agent has completed its purchases. Therefore, the average purchase price per share paid by the Plan Agent may exceed the market price at the time of valuation, resulting in the purchase of fewer shares than if the dividend or distribution had been paid in common stock issued by the Fund. The Plan Agent will use all dividends and distributions received in cash to purchase common stock in the open market within 30 days of the valuation date. Interest will not be paid on any uninvested cash payments. |
You may withdraw from the Plan at any time by giving written notice to the Plan Agent. If you withdraw or the
Plan is terminated, you will receive whole shares in your account under the Plan and you will receive a cash payment for any fraction of a share in your account. If you wish, the Plan Agent will sell your shares and send you the proceeds, minus an initial $15 service fee plus $0.12 per share being liquidated (for processing and brokerage expenses).
The Plan Agent maintains all stockholders’ accounts in the Plan and gives written confirmation of all transactions in the accounts, including information you may need for tax records. Shares of common stock in your account will be held by the Plan Agent in non-certificated form. Any proxy you receive will include all common stock you have received under the Plan.
There is no brokerage charge for reinvestment of your dividends or distributions in newly-issued shares of common stock. However, all participants will pay a pro rata share of brokerage commissions incurred by the Plan Agent when it makes open market purchases.
Automatically reinvesting dividends and distributions does not mean that you do not have to pay income taxes due upon receiving dividends and distributions.
If you hold your common stock with a brokerage firm that does not participate in the Plan, you will not be able to participate in the Plan and any dividend reinvestment may be effected on different terms than those described above. Consult your financial advisor for more information.
The Fund reserves the right to amend or terminate the Plan if, in the judgment of the Board, the change is warranted. There is no direct service charge to participants in the Plan (other than the service charge when you direct the Plan Agent to sell your common stock held in a dividend reinvestment account); however, the Fund reserves the right to amend the Plan to include a service charge payable by the participants. Additional information about the Plan may be obtained from the Plan Agent at P.O. Box 43010, Providence, Rhode Island 02940-3010.
30
Lazard World Dividend & Income Fund, Inc.
Board of Directors and Officers Information
(unaudited)
Name (Age)
Address(1) | | Position(s) with the Fund
(Since) and Term(2) | | Principal Occupation(s) and Other Public Company
Directorships Held During the Past Five Years(2) |
| | | | | |
| Board of Directors: | | | | |
| | | | | |
| Class I – Directors with Term Expiring in 2016 | | |
| | | |
| Independent Directors(3): | | | | |
| | | | | |
| Leon M. Pollack (72) | | Director
(August 2006) | | Private Investor |
| | | | | |
| Robert M. Solmson (65) | | Director
(April 2005) | | Fairwood Capital, LLC, a private investment corporation engaged primarily in real estate and hotel investments, President (2008 - present) |
| | | | | |
| Interested Director(4): | | | | |
| | | | | |
| Charles L. Carroll (52) | | Chief Executive Officer,
President and Director
(April 2005) | | Investment Manager, Deputy Chairman and Head of Global Marketing (2004 - present) |
| | | | | |
| | | | | |
| Class II – Directors with Term Expiring in 2014 | | |
| | | |
| Independent Directors(3): | | | | |
| | | | | |
| Kenneth S. Davidson (68) | | Director
(April 2005) | | Davidson Capital Management Corporation, an investment manager, President (1978 - present) |
| | | | | |
| | | | | Balestra Capital, Ltd., an investment manager and adviser, Senior Advisor (July 2012 - present) |
| | | | | |
| | | | | Aquiline Holdings LLC, an investment manager, Partner (2006 - June 2012) |
| | | | | |
| Nancy A. Eckl (50) | | Director
(February 2007) | | College Retirement Equities Fund (eight accounts), Trustee (2007 - present) |
| | | | | TIAA-CREF Funds (59 funds) and TIAA-CREF Life Funds (10 funds), Trustee (2007 - present) |
| | | | | |
| | | | | TIAA Separate Account VA-1, Member of the Management Committee (2007 - present) |
| | | | | |
| | | | | American Beacon Advisors, Inc. (“American Beacon”) and certain funds advised by American Beacon, Vice President (1990 - 2006) |
| | | | | |
| Lester Z. Lieberman (83) | | Director
(April 2005) | | Private Investor |
| | | | | |
| | | | | |
| Class III – Directors with Term Expiring in 2015 | | |
| | | | | |
| Independent Director(3): | | | | |
| | | | | |
| Richard Reiss, Jr. (69) | | Director
(April 2005) | | Georgica Advisors LLC, an investment manager, Chairman (1997 - present) |
| | | | | O’Charley’s, Inc., a restaurant chain, Director (1984 - 2012) |
| | | | | |
| Interested Director(4): | | | | |
| | | | | |
| Ashish Bhutani (53) | | Director
(July 2005) | | Investment Manager, Chief Executive Officer (2004 - present) |
| | | | | Lazard Ltd, Vice Chairman and Director (2010 - present) |
| (1) | The address of each Director of the Fund is Lazard Asset Management LLC, 30 Rockefeller Plaza, New York, New York 10112-6300. |
| | |
| (2) | Each Director serves as a Director for each of the Lazard Funds (comprised of, as of July 31, 2013, 29 active investment portfolios). Each Director serves an indefinite term, until his or her successor is elected, and each Director serves in the same capacity for the other Lazard Funds. All of the Independent Directors (as defined below), except Mr. Lieberman, are also board members of Lazard Alternative Strategies Fund, L.L.C. and Lazard Alternative Strategies 1099 Fund, closed-end registered management investment companies advised by an affiliate of the Investment Manager. |
| | |
| (3) | “Independent Directors” are not “interested persons” (as defined in the Act) of the Fund. |
| | |
| (4) | Messrs. Bhutani and Carroll are “interested persons” (as defined in the Act) of the Fund because of their positions with the Investment Manager. |
31
Lazard World Dividend & Income Fund, Inc.
Board of Directors and Officers Information (concluded)
(unaudited)
Name (Age)
Address(1) | | Position(s) with the Fund
(Since) and Term(2) | | Principal Occupation(s) During the Past Five Years |
| | | | | |
| Officers(3): | | | | |
| | | | | |
| Nathan A. Paul (40) | | Vice President and Secretary
(April 2005) | | Managing Director and General Counsel of the Investment Manager |
| | | | | |
| Stephen St. Clair (54) | | Treasurer
(April 2005) | | Vice President of the Investment Manager |
| | | | | |
| Brian D. Simon (51) | | Chief Compliance Officer
(January 2009) and
Assistant Secretary
(April 2005) | | Managing Director (since February 2011, previously Director) of the Investment Manager and Chief Compliance Officer (since January 2009) of the Investment Manager and the Fund |
| | | | | |
| Tamar Goldstein (38) | | Assistant Secretary
(February 2009) | | Senior Vice President (since February 2012, previously Vice President and Counsel) of the Investment Manager |
| | | | | |
| Cesar A. Trelles (38) | | Assistant Treasurer
(April 2005) | | Vice President (since February 2011, previously Fund Administration Manager) of the Investment Manager |
| (1) | The address of each officer of the Fund is Lazard Asset Management LLC, 30 Rockefeller Plaza, New York, New York 10112-6300. |
| | |
| (2) | Each officer serves for an indefinite term, until his or her successor is elected and qualifies or until his or her earlier resignation or removal. Each officer serves in the same capacity for the other Lazard Funds. |
| | |
| (3) | In addition to Charles L. Carroll, President, whose information is included in the Class I Interested Director section. |
32
Lazard World Dividend & Income Fund, Inc.
Other Information
(unaudited)
Proxy Voting
A description of the policies and procedures used to determine how proxies relating to Fund portfolio securities are voted is available (1) without charge, upon request, by calling (800) 823-6300 or (2) on the SEC’s website at http://www.sec.gov.
The Fund’s proxy voting record for the most recent 12-month period ended June 30 is available (1) without charge, upon request, by calling (800) 823-6300 or (2) on the SEC’s website at http://www.sec.gov. Information as of June 30 each year will generally be available by the following August 31.
Form N-Q
The Fund files a complete schedule of its portfolio holdings for the first and third quarters of its fiscal year with the SEC on Form N-Q. The Fund’s Forms N-Q are available on the SEC’s website at http://www.sec.gov and may be reviewed and copied at the SEC’s Public Reference Room in Washington, D.C. Information on the operation of the SEC’s Public Reference Room may be obtained by calling 1-800-SEC-0330.
Board Consideration of Management Agreement
At a meeting of the Board held on June 4-5, 2013, the Board considered the approval, for an additional annual period, of the Management Agreement between the Fund and the Investment Manager. The Independent Directors were assisted in their review by independent legal counsel and met with counsel in executive session separate from representatives of the Investment Manager.
Services Provided
Representatives of the Investment Manager discussed with the Board the Investment Manager’s written presentation provided in advance of the meeting addressing, among other matters, the nature, extent and quality of services that the Investment Manager provides the Fund, including a discussion of the Investment Manager and its clients (of which the Lazard Funds complex of 28 active funds comprises approximately $22 billion, and the Fund and the other publicly-traded closed-end fund managed by the Investment Manager comprise approximately $289 million, of the approximately $155.7 billion of total assets under the management of the Investment Manager and its global affiliates as of March 31, 2013). The representatives of the Investment Manager noted that the Investment Manager believes that the Fund continues to benefit significantly from the infrastructure and services provided by the Investment Manager’s global investment management platform and technology, operational and legal and compli-
ance support. The Directors also considered information provided by the Investment Manager regarding its personnel, resources, financial condition and experience.
The Directors considered the various services provided by the Investment Manager including the Investment Manager’s research and portfolio management capabilities and oversight of day-to-day operations, including supervision of fund accounting and administration-related services and assistance in meeting legal and regulatory requirements. The Directors also considered the Investment Manager’s infrastructure and agreed that the Fund benefits from the services and infrastructure provided by the Investment Manager. The Directors accepted management’s assertion that such services and infrastructure are greater than those typically provided to a $22 billion fund complex not managed by a large, global firm such as the Investment Manager.
Comparative Management Fee, Expense Ratio and Performance Information
The Directors reviewed comparative management fee, expense ratio and performance (through March 31, 2013) information prepared by Lipper, Inc. (“Lipper”), noting the limitations of the Lipper comparison group (the “Group”) and broader universe (the “Universe”). Lipper’s materials stated that Lipper’s reports are specifically designed to provide boards of directors the necessary fee, expense and investment performance information to assist in fulfilling their advisory contract renewal responsibilities under Section 15(c) of the Act.
The Directors also discussed the actual and contractual management fees and expense ratios (leveraged and unleveraged) for the Fund. They noted the methodology and assumptions used by Lipper, including that management fee comparisons and the rankings used therein include administrative fees (which are paid to the Fund’s third party administrator that is not affiliated with the Investment Manager).
In reviewing Lipper’s analysis, it was noted that, as calculated by Lipper, the contractual management fee was above the Group median and the expense ratios (at both leveraged and unleveraged asset levels) were above the Group and Universe medians and ranked in the fifth quintile of the Group, with the expense ratio for leveraged assets at the highest of the Group. The Directors noted management’s explanation regarding the lack of comparability of funds within the Group due to the Fund’s unique strategy of achieving leverage through currency investments. It also was noted that the Fund had the lowest average net assets in the Group (at both leveraged and unleveraged assets levels) and that its expense ratios were
33
Lazard World Dividend & Income Fund, Inc.
Other Information (continued)
(unaudited)
close to the expense ratios of the other similarly-sized fund in the Group.
The Directors noted that the Fund’s total annualized return (based on net asset value) ranked first or second of the four funds in the Fund’s Group (three funds for the since inception period) and at or above the median for four of the six periods ended March 31, 2013. The Directors, however, noted that no funds in the Group or Universe pursued a strategy similar to that of the Fund’s strategy of investing in world equity securities and in emerging markets currencies primarily through forward currency contracts and debt obligations denominated in emerging markets currencies. They also were advised that the Investment Manager did not manage any funds, separate accounts or other accounts with investment objectives, policies and strategies similar to those of the Fund. The Directors also were provided with the Fund’s market price performance and market discounts to net asset value.
Fee Calculation
The Board considered that the method of calculating management fees is based on the Fund’s Total Leveraged Assets, pursuant to which the management fee borne by stockholders will increase to the extent the Investment Manager makes Currency Investments by incurring Financial Leverage rather than reducing the percentage of Net Assets invested in World Equity Investments for the purposes of making Currency Investments, and considered the potential advantages of increased investment exposure through Financial Leverage. The Board considered the economic equivalence, and the similarities, from an investment management perspective, of Currency Investments (1) made with Currency Commitments and (2) made with the proceeds of Borrowings.
The Board considered that (1) this method of calculating management fees is different than the way closed-end investment companies typically calculate management fees, (2) traditionally closed-end funds calculate management fees based on Net Assets plus Borrowings (excluding Financial Leverage obtained through Currency Commitments) and (3) the Investment Manager’s fee would be lower if its fee were calculated only on Net Assets plus Borrowings, because the Investment Manager would not earn fees on Currency Investments made with Currency Commitments (forward currency contracts or other derivative instruments whose value is derived from the performance of an underlying emerging market currency). The Board considered that the Investment Manager’s fee is different because the Fund’s leverage strategy is different than the strategy employed by many other leveraged closed-end investment companies—that although the Fund may
employ Borrowings in making Currency Investments, the Fund’s leverage strategy relies primarily on Currency Commitments rather than relying exclusively on borrowing money and/or issuing preferred stock. The Board considered the Fund’s use of Currency Commitments for leverage (rather than relying exclusively on borrowing money and/or issuing preferred stock) and the Investment Manager’s belief that forward currency contracts, or other derivative instruments whose value is derived from the performance of an underlying emerging market currency, often offer a more attractive way to gain exposure to emerging market interest rate opportunities and currencies than investments in debt obligations and the fact that there might not be a viable debt market in certain emerging market countries. The Board also considered the Investment Manager’s view that foreign currency contracts present less counterparty and custody risks and the Investment Manager’s extensive expertise with these instruments, as discussed in detail in previous Board meetings.
Procedures adopted by the Investment Manager to evaluate possible conflicts of interest that may arise from the fee calculation methodology, include the following: (1) no less frequently than monthly, decisions regarding the amount of the Fund’s allocation to Currency Investments must be reviewed by a Managing Director of the Investment Manager not involved in the decision-making process and the Fund’s Chief Compliance Officer, and that such review be documented to include the basis therefor, documentation to be retained for six years, the first two years in an easily accessible place, (2) the Investment Manager must provide the Board with a quarterly report regarding these decisions and the reasons therefor and (3) the Investment Manager must deliver a quarterly certification to the Board, signed by a Managing Director of the Investment Manager and the Fund’s or the Investment Manager’s Chief Compliance Officer (as applicable), that the procedures had been complied with during the previous quarter. The Investment Manager’s representatives stated that such procedures had been followed and that the Investment Manager would continue to follow those procedures.
Investment Manager Profitability and Economies of Scale
The Directors reviewed for the Fund information prepared by the Investment Manager concerning profits realized by the Investment Manager and its affiliates resulting from the Management Agreement, calculated using the actual revenues received for the calendar year ended December 31, 2012 and the Investment Manager’s cost allocation methodology to compute an estimate of the Fund’s expenses. The Investment Manager’s representatives stated that neither the Investment Manager nor its affiliates receive any significant indirect benefits from the
34
Lazard World Dividend & Income Fund, Inc.
Other Information (concluded)
(unaudited)
Investment Manager acting as investment adviser to the Fund. The Investment Manager’s representatives stated that the broker-dealer that is treated as an affiliate of the Investment Manager did not effect trades for the Fund in the period under review. The Investment Manager’s representatives reviewed with the Board information provided on the Investment Manager’s brokerage practices and the Fund’s brokerage allocation, commission payments and soft dollar commissions and benefits.
The profitability percentages were within ranges determined by relevant court cases not to be so disproportionately large that they bore no reasonable relationship to the services rendered. Representatives of the Investment Manager stated that the Investment Manager believed the profits are not unreasonable in light of the services provided and other factors. The Directors considered the Investment Manager’s estimated profitability with respect to the Fund as part of their evaluation of whether the Fund’s fee under the Management Agreement bears a reasonable relationship to the mix of services provided by the Investment Manager, including the nature, extent and quality of such services, and evaluated profitability in light of the relevant circumstances for the Fund. It was noted that, because the Fund is a closed-end fund without daily inflows and outflows of capital, there were not at this time significant economies of scale to be realized by the Investment Manager in managing the Fund’s assets.
At the conclusion of these discussions, each of the Directors expressed the opinion that he or she had been furnished with sufficient information to make an informed
business decision with respect to the renewal of the Fund’s Management Agreement. Based on its discussions and considerations as described above, the Board made the following conclusions and determinations.
| • | The Board concluded that the nature, extent and quality of the services provided by the Investment Manager are adequate and appropriate, noting the benefits of advisory and research services and other services and infrastructure (as discussed above) associated with an approximately $155.7 billion global asset management business. |
| | |
| • | The Board was generally satisfied with the Fund’s overall performance, in light of the considerations described above. |
| | |
| • | The Board concluded that the Fund’s fee paid to the Investment Manager was reasonable in light of the considerations discussed above. |
| | |
| • | The Board determined that because the Fund is a closed-end fund without daily inflows and outflows of capital the Fund’s fee schedule is reasonable in light of current economies of scale considerations and that there were not at this time significant economies of scale to be realized by the Investment Manager. |
The Board considered these conclusions and determinations in their totality and, without any one factor being dispositive, determined that approval of the Fund’s Management Agreement was in the best interests of the Fund and its stockholders.
35
Lazard World Dividend & Income Fund, Inc.
30 Rockefeller Plaza
New York, New York 10112-6300
Telephone: 800-823-6300
http://www.LazardNet.com
Investment Manager
Lazard Asset Management LLC
30 Rockefeller Plaza
New York, New York 10112-6300
Telephone: 800-823-6300
Custodian
State Street Bank and Trust Company
One Lincoln Street
Boston, Massachusetts 02111
Transfer Agent and Registrar
Computershare Trust Company, N.A.
P.O. Box 43010
Providence, Rhode Island 02940-3010
Dividend Disbursing Agent
Computershare, Inc.
P.O. Box 43010
Providence, Rhode Island 02940-3010
Independent Registered Public Accounting Firm
Deloitte & Touche LLP
Two World Financial Center
New York, New York 10281-1414
Legal Counsel
Stroock & Stroock & Lavan LLP
180 Maiden Lane
New York, New York 10038-4982
http://www.stroock.com

This report is intended only for the information of stockholders of common stock of Lazard World Dividend & Income Fund, Inc.
Lazard Asset Management LLC 30 Rockefeller Plaza www.lazardnet.com
New York, NY 10112
ITEM 2. CODE OF ETHICS.
Not applicable.
ITEM 3. AUDIT COMMITTEE FINANCIAL EXPERT.
Not applicable.
ITEM 4. PRINCIPAL ACCOUNTANT FEES AND SERVICES.
Not applicable.
ITEM 5. AUDIT COMMITTEE OF LISTED REGISTRANTS.
Not applicable.
ITEM 6. INVESTMENTS
Not applicable.
ITEM 7. DISCLOSURE OF PROXY VOTING POLICIES AND PROCEDURES FOR CLOSED END MANAGEMENT INVESTMENT COMPANIES.
Not applicable.
ITEM 8. PORTFOLIO MANAGERS OF CLOSED-END MANAGEMENT INVESTMENT COMPANIES.
Not applicable.
ITEM 9. PURCHASES OF EQUITY SECURITIES BY CLOSED-END MANAGEMENT INVESTMENT COMPANY AND AFFILIATED PURCHASERS.
Not applicable.
ITEM 10. SUBMISSION OF MATTERS TO A VOTE OF SECURITY HOLDERS.
There were no material changes to the procedures by which shareholders may recommend nominees to the Registrant’s Board of Directors during the period covered by this report. A description of these procedures can be found in the proxy statement for the Registrant’s most recent shareholder meeting, which is available at www.sec.gov.
ITEM 11. CONTROLS AND PROCEDURES.
(a) The Registrant’s principal executive and principal financial officers have concluded, based on their evaluation of the Registrant’s disclosure controls and procedures as of a date within 90 days of the filing date of this report, that the Registrant’s disclosure controls and procedures are reasonably designed to ensure that information required to be disclosed by the Registrant on Form N-CSR is recorded, processed, summarized and reported within the required time periods and that information required to be disclosed by the Registrant in the reports that it files or submits on Form N-CSR is accumulated and communicated to the Registrant’s management, including its principal executive and principal financial officers, as appropriate to allow timely decisions regarding required disclosure.
(b) There were no changes to the Registrant’s internal control over financial reporting that occurred during the second fiscal quarter of the period covered by this report that have materially affected, or are reasonably likely to materially affect, the Registrant’s internal control over financial reporting.
ITEM 12. EXHIBITS.
(a)(1) Not applicable.
(a)(2) Certifications of principal executive and principal financial officers as required by Rule 30a-2(a) under the Investment Company Act of 1940.
(a)(3) Not applicable.
(b) Certifications of principal executive and principal financial officers as required by Rule 30a-2(b) under the Investment Company Act of 1940.
SIGNATURES
Pursuant to the requirements of the Securities Exchange Act of 1934 and the Investment Company Act of 1940, the registrant has duly caused this report to be signed on its behalf by the undersigned, thereunto duly authorized.
Lazard World Dividend & Income Fund, Inc.
| By | /s/ Charles L. Carroll | |
| | Charles L. Carroll | |
| | Chief Executive Officer | |
| | | |
| Date | September 6, 2013 | |
Pursuant to the requirements of the Securities Exchange Act of 1934 and the Investment Company Act of 1940, this report has been signed below by the following persons on behalf of the registrant and in the capacities and on the dates indicated.
| By | /s/ Charles L. Carroll | |
| | Charles L. Carroll | |
| | Chief Executive Officer | |
| | | |
| Date | September 6, 2013 | |
| | | |
| By | /s/ Stephen St. Clair | |
| | Stephen St. Clair | |
| | Chief Financial Officer | |
| | | |
| Date | September 6, 2013 | |