SILVER WHEATON CORP.
Technical Report
on the
Mineral Reserves and Mineral Resources
of the
Salobo Copper-Gold Mine
Carajás, Pará State, Brazil
![]()
19 March, 2013
Effective date of Report: 31 December, 2012
Jason Ché Osmond, C.Geol., FGS, EurGeol
Barnard Foo, P.Eng.
James Turner, CEng, MIMMM
Christopher Jacobs, CEng ,MIMMM
SUITE 900 - 390 BAY STREET, TORONTO ONTARIO, CANADA M5H 2Y2
Telephone (1) (416) 362-5135 Fax (1) (416) 362 5763
i
ii
iii
iv
v
vi
vii
viii
ix
x
xi
xii
xiii
1.0 SUMMARY
The Salobo Mine is operated by a subsidiary of Vale S.A. (Vale). On 5 February, 2013, Silver Wheaton Corp. (Silver Wheaton) announced that it had entered into a binding term sheet to acquire an amount of gold equivalent to 25% of the life-of-mine (LOM) gold production from the Salobo Mine.
Micon International Limited (Micon) has been retained by Silver Wheaton to prepare a Technical Report in accordance with Canadian National Instrument (NI) 43-101 to support the disclosure of mineral resources and reserves for Vale’s Salobo Mine.
This report includes technical information which requires subsequent calculations or estimates to derive sub-totals, totals and weighted averages. Such calculations or estimations inherently involve a degree of rounding and consequently introduce a margin of error. Where these occur, Micon does not consider them to be material.
This report is intended to be used by Silver Wheaton subject to the terms and conditions of its agreement with Micon. Subject to the authors consent, that agreement permits Silver Wheaton to file this report as a Canadian National Instrument (NI) 43-101 Technical Report on SEDAR (sedar.com) pursuant to provincial securities legislation. Except for the purposes legislated under provincial securities laws, any other use of this report, by any third party, is at that party’s sole risk.
The conclusions and recommendations in this report reflect the authors’ best judgment in light of the information available to them at the time of writing. The authors and Micon reserve the right, but will not be obliged, to revise this report and conclusions if additional information becomes known to them subsequent to the date of this report. Use of this report acknowledges acceptance of the foregoing conditions.
All financial values are reported in US currency ($) while the metric system has been used for the units of measure except where, by convention, metal contents are expressed as pounds avoirdupois (for copper) and troy ounces (for gold).
1.1 LOCATION AND HISTORY
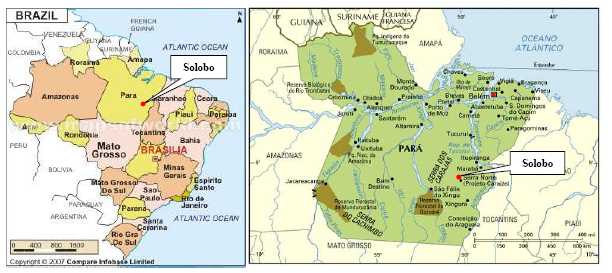
The Salobo Mine is a copper-gold deposit located approximately 80 km northwest of Carajás, Pará State in northern Brazil. Geographic coordinates for the property are 5°47’25” S latitude and 50°32’5” W longitude (see Figure 1.1) .
The area is well-served by railroads and highways that connect the seaport and other cities. Air service is available at the Carajás airport, which is approximately 70 km southeast of Salobo and is capable of receiving commercial aircraft. There are regular flights to Belém (capital city of Pará state, population 2 million) and to other Brazilian cities. The city of Marabá is approximately 240 km east-northeast from Salobo by highway.
1
Figure 1.1
Location Plan
![]()
The Salobo copper deposit was discovered in 1974 during exploration carried out by CVRD personnel.In 1977, a detailed exploration program commenced and in 1978 the presence of copper sulphides associated with magnetic schist was confirmed and the first drill hole was completed that intersected a mineralized interval of 140 m at 0.45% Cu.
From 1985 to 1987, a pilot-scale study was carried out at Salobo and, in July, 1987, mining rights were awarded to CVRD. On 29 June, 1993, Salobo Metais S.A. (SMSA) was created as a joint venture between CVRD and Morro Velho Mining, to further study the economic viability of the deposit. In 1997, almost 30,000 m of drilling was completed and a pre-feasibility study was completed by MRDI. This was followed in 1998 with the first Feasibility Study. In 2001, a revised Feasibility Study was completed by Kvaerner which was updated in 2002 by AMEC. CVRD acquired a controlling interest in the property in June, 2002.
The period 2002 and 2003 saw an additional 72,000 m of drilling completed. There followed a number of independent mineral resource models and audits by Snowden (2003), Golder and AMEC (2004), Pincock, Allen and Holt (2005 and 2008), and Golder (2010). The latter went on to prepare the current (2012) block model and mineral resource estimate. The definitive Feasibility Study was completed by Fluor JPS in June, 2004. In 2007, CVRD changed its name to Vale S.A.
2
Pre-stripping operations were commenced at the Salobo Mine in 2009, and the Phase I process plant commenced commissioning and ramp-up in June, 2012. Phase II construction is now well advanced and is expected to be complete in 2014.
1.2 GEOLOGY AND MINERALIZATION
The Carajás mining district is located in the southeast of the Pará State, Brazil, and is associated with a late Archean basin deformed into a sigmoid shape, trending west-northwest to east-southeast. This shape is defined by several major west-northwest to east-southeast lineaments including the Carajás and Cigano left lateral (sinistral) fault zones. In addition, northeast and northwest fault systems also crosscut the region. The Carajás units are intruded by Archean intrusive units, like the calc-alkaline Plaquê Suite (2.77 Ga), alkaline Salobo and Estrela granites (2.5 Ga), and are known to have a strong correlation with the copper–gold mineralization in Carajás.
The Igarapé Salobo Group has Fe-rich sediments associated with quartzites and gneisses, and amphibolite facies of metamorphism, which includes the Cu-Au (Mo) deposit at Salobo.
The sulphide mineralization consists of assemblages of magnetite-chalcopyrite-bornite and magnetite-bornite-chalcocite. Variable amounts of molybdenite, cobaltite, safflorite, gold and silver also exist, hosted by rocks which contain magnetite, fayalite, grunerite, garnet, biotite, quartz and plagioclase. The mineralization is related to Fe-rich rocks and occurs in lenticular shear and hydrothermally altered orebodies. The chalcopyrite is associated with magnetite schists rich in fayalite and magnetite.
Different styles of mineralization can be found: disseminated, with planar structures (stringers) parallel to rock, associated with local concentrations of magnetite and/or garnet, filling or surrounding the fractures of mineral grains (stockwork); in cleavages of amphiboles and platy minerals, consisting a centimetres massive sulphide, parallel to bedding of hosted rocks in some cases, as well as remobilized mineralization in shear zones. Chalcopyrite, bornite, and chalcocite occur interstitially to silicate minerals. These sulphide minerals are commonly found filling cleavage planes of biotite and grunerite.
1.3 MINERAL RESOURCE ESTIMATES
Mineral resource model blocks are classified as Measured, Indicated or Inferred mineral resources, in accordance with the Canadian Institute of Mining, Metallurgy and Petroleum (CIM) guidelines. Vale’s long-term mine planning and design process then converts Measured and Indicated mineral resources within the current LOM open pit design into Proven and Probable mineral reserves, respectively.
Therefore, Mineral Resources at Salobo Mine are stated exclusive of Mineral Reserves. Mineral Resources at Salobo Mine thus comprise:
3
Measured, Indicated and Inferred Mineral Resources outside, but adjacent to, the current LOM open pit design, that Micon considers to have reasonable prospects for economic extraction based on its analysis of an optimized pit shell generated using three-year trailing average metal prices of $3.67/lb for copper and $1,500/oz for gold, with all other pit optimization parameters kept the same as for the current LOM open pit optimization described in Section 15.0 of this report.
Inferred Mineral Resources located within the current LOM open pit design that are considered too speculative geologically to have the economic considerations applied to them that would enable them to be categorized as Mineral Reserves. In the LOM open pit production schedule, this Inferred Resource material is planned to be stockpiled separately.
Mineral Resource and Mineral Reserve estimates are classified according to the CIM Definition Standards of Mineral Resources and Mineral Reserves and CIM Best Practice Guidelines, dated 27 November, 2010. Mineral Resources that are not Mineral Reserves do not have demonstrated economic viability.
Table 1.1 summarizes the estimate of mineral resources at Salobo as of 31 December, 2012. These resources are stated exclusive of the Mineral Reserves, and are reported using a copper equivalent cut-off grade of 0.296% Cu, using the same assumptions as the Mineral Reserves reported in Table 1.2.
Table 1.1
Salobo Mineral Resources as at 31 December, 2012 above Cut-off 0.296% CuEq
| Classification | Units | Measured | Indicated | Measured and Indicated | Inferred |
| Within Current LOM Open Pit | Mt | - | - | - | 15 |
| % Cu | - | - | - | 0.6 | |
| Au g/t | - | - | - | 0.3 | |
| Adjacent to Current LOM Pit | Mt | 49.1 | 195.4 | 244.5 | 133 |
| % Cu | 0.82 | 0.72 | 0.74 | 0.6 | |
| Au g/t | 0.47 | 0.37 | 0.39 | 0.3 | |
| Total | Mt | 49.1 | 195.4 | 244.5 | 148 |
| % Cu | 0.82 | 0.72 | 0.74 | 0.6 | |
| Au g/t | 0.47 | 0.37 | 0.39 | 0.3 |
| 1. | Mineral Resources stated as at 31 December, 2012. | |
| 2. | Mineral Resources are classified according to CIM guidelines. | |
| 3. | Mineral Resources are reported exclusive of Mineral Reserves. | |
| 4. | Figures may not compute due to rounding and to reflect that mineral resources are an estimate. | |
| 5. | Mineral Resource is constrained within an optimized pit shell based on rolling three-year average prices for copper ($3.67/lb) and gold ($1,500/oz). | |
| 6. | A cut-off grade of 0.296% Cu was applied to CuEq grades calculated in the block model using a copper price of $3.45/lb and a gold price of $1,150/oz. | |
| 7. | There are no known legal, political, environmental or other risks that could materially affect the potential development of the mineral resources. |
4
1.4 MINERAL RESERVE ESTIMATES
The mineral reserve for the Salobo Mine was estimated by converting the 2012 Measured and Indicated resources contained within the designed pit to Proven and Probable reserves with the appropriate technical and economic parameters. The mineral reserve estimate as of 31 December, 2012 for the Salobo Mine is presented in Table 1.2.
Table 1.2
Salobo Mineral Reserves as of 31 December, 2012above Cut-off 0.296% CuEq
| Mine / Period | Mineral Reserves, 31 December, 2012 | |||
| Proven | Probable | Total | ||
| Salobo Pit | Mt | 635.0 | 485.8 | 1,120.9 |
| Cu (%) | 0.77 | 0.66 | 0.72 | |
| Au (g/t) | 0.42 | 0.32 | 0.38 | |
| Stockpiles | Mt | 1.8 | - | 1.8 |
| Cu (%) | 0.61 | - | 0.61 | |
| Au (g/t) | 0.36 | - | 0.36 | |
| Total | Mt | 636.8 | 485.8 | 1,122.6 |
| Cu (%) | 0.77 | 0.66 | 0.72 | |
| Au (g/t) | 0.42 | 0.32 | 0.38 | |
Vale, 2013.
The mineral reserve is reported above a copper equivalent cut-off grade of 0.296%, with copper equivalent grades calculated using metal prices of $3.45/lb for copper and $1,150/oz for gold. Micon has reviewed these and other assumptions used in the reserve estimation process and concludes that they remain appropriate for the determination of a mineral reserve. The mineral reserve includes planned mining dilution of 5% with 100% recovery.
To the best of Micon’s knowledge there are no legal, political, environmental, or other issues which would materially affect development of the Mineral Reserve estimated above.
1.5 MINING METHODS
The mineral reserve at the Salobo Mine is being extracted using conventional open pit mining methods consisting of shovels, trucks and drills as the major mining equipment. Pre-stripping of the site has been completed and production is expected to ramp up to 12 Mt/y by 2014 and eventually reach 24 Mt/y by 2016.
The mine plan was generated based on the Proven and Probable Reserves contained in Vale’s 2012 resource model (Figure 1.2). Reserves are reported above a copper equivalent cut-off grade of 0.296%.
The ultimate pit was subdivided into seven internal phases targeting the highest grade, lowest cost areas of the ultimate pit first. Details of the material quantities for each of the phase are presented in Table 1.3. The Salobo mine life spans approximately 29 years ending in 2042. However, the process plant will continue operations, milling stockpile material, for another 22 years until 2064 (Figure 1.3) .
5
Phasing of the open pit development and application of the cut-off grade strategy allows higher grade ore (above 1.00% Cu) to be mined in the initial years of the operation. This is followed, from years 2025 to 2033, by the mining of progressively lower grade material averaging 0.48% Cu. The copper grade improves again during the final phases of pit development, then decreases as production ramps down towards the processing the lower grade stockpile material.
Figure 1.2
Salobo Mine Complex
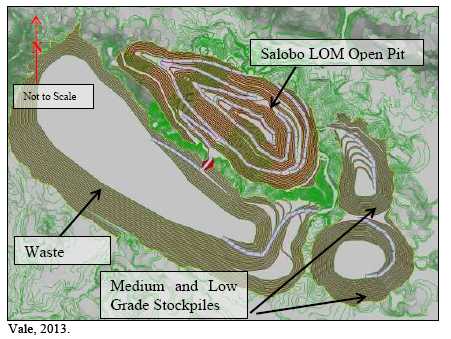
Table 1.3
Material within each Open Pit Phase
| Phase | Ore | Waste | Total Moved (000 t) | Waste: Ore Ratio | ||||
| Mined (000 t) | Cu (%) | Au (g/t) | Saprolite (000 t) | Weathered (000 t) | Rock (000 t) | |||
| Phase I | 18,067 | 0.9 | 0.56 | 1,204 | 383 | 6,090 | 25,744 | 0.42 |
| Phase II | 32,905 | 0.85 | 0.44 | 32,832 | 5,066 | 17,256 | 88,059 | 1.68 |
| Phase III | 137,607 | 0.74 | 0.42 | 24,796 | 11,537 | 55,214 | 229,154 | 0.67 |
| Phase IV | 187,919 | 0.72 | 0.38 | 54,318 | 15,181 | 171,774 | 429,192 | 1.28 |
| Phase V | 126,208 | 0.75 | 0.36 | 50,520 | 14,859 | 145,205 | 336,792 | 1.67 |
| Phase VI | 284,273 | 0.67 | 0.39 | 63,274 | 16,191 | 367,131 | 730,869 | 1.57 |
| Phase VII | 333,985 | 0.72 | 0.34 | 84,035 | 20,284 | 550,899 | 989,203 | 1.96 |
| TOTAL | 1,120,964 | 0.72 | 0.38 | 310,979 | 83,501 | 1,313,569 | 2,829,013 | 1.52 |
Vale, 2013.
6
Figure 1.3
Salobo Life of Mine Plan
![]()
During mining, the ore placed on the stockpiles is classified according to the following grade categories:
- Medium grade ore: 0.60 to 0.85% CuEq
- Low grade ore: 0.30 to 0.60% CuEq
1.6 RECOVERY METHODS
Mineral reserves at Salobo indicate total reserve grades of approximately 0.72% Cu and 0.38 g/t Au. Copper occurs primarily as the minerals chalcocite, bornite and chalcopyrite. Average levels of magnetite and chlorite are 5% and 10% respectively. Potential deleterious elements include fluorine at approximately 0.40% and uranium at approximately 16 ppm.
The main lithologies for hosting the copper sulphide mineralisation are magnetite schists (XMT) and biotite schists (BDX). In general, higher copper values are associated with the magnetite schists, containing greater than 10% magnetite, with values typically greater than 0.6% Cu. Biotite schists generally contain lower copper values, typically in the range of 0.2% -0.6% Cu. Low grade ore is currently stockpiled.
Gold values are predominantly associated with the copper sulphides.
7
Phase I of the Salobo plant is designed to process 12 Mt/y of ore to produce approximately 100,000 t of copper in a copper-gold concentrate annually. Production commenced in June, 2012. Phase II of the Salobo plant expansion involves doubling the throughput to 24 Mt/y with annualized copper in concentrate production rising to approximately 200,000 t. Construction of Phase II is well advanced and is basically a mirror-image of Phase I, i.e. essentially two identical production lines. Production from Phase II is scheduled to start in 2014.
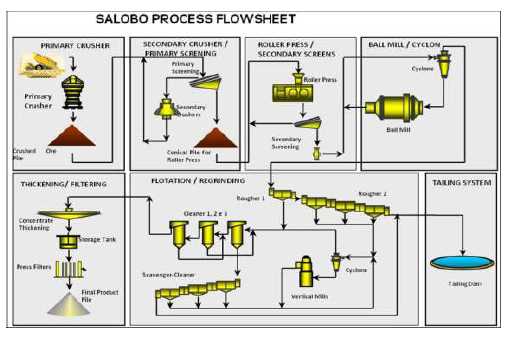
Currently, Phase I is designed to operate 365 days per year, 24 hours per day and at 90% availability to process an average 1,522 t/h. The overall simplified process flow diagram is illustrated in Figure 1.4.
Figure 1.4
Simplified Process Flowsheet for Salobo Plant
To date, monthly achieved throughputs are below design, generally a direct consequence of low available operating hours. A number of commissioning, engineering and operating issues have been identified that have resulted in general process instability and operational downtime affecting plant availability, throughput and metallurgical recovery. Such issues are to be expected when commissioning a plant of this scale, and all have been addressed within a comprehensive Action Plan that has been developed and which is scheduled for completion by the end of July, 2013. Most of the items with the plan are scheduled to be completed by the end of May, 2013.
It is Micon’s opinion that the design of the Salobo processing plant flowsheet is generally robust, based on the extensive metallurgical testwork reported under Section 13.0. The circuit is conventional to the copper industry, with the exception of the use of an HPGR/Ball Mill circuit rather than a more conventional SAG/Ball Mill circuit. The reasons for this selection are described in Section 13.0.
8
It is Micon’s opinion that stable operating conditions will probably only be achieved towards the end of 2013. Assuming that all the items in the Action Plan are successfully implemented, there is a reasonable expectation that the design throughputs and metallurgical recoveries for copper and gold as described in Section 13.0 can be achieved. It is likely that, as copper recoveries improve, gold recoveries will also improve in proportion. Major short-term objectives to improve recovery will be stable plant operation, optimized reagent dosing and commissioning of the sodium sulphide and lime addition circuits.
A number of issues have the potential for longer-term impact on production and recovery. These include the amount of soluble copper present in the plant feed and use of high-pressure water sprays to break up the compacted HPGR crushed product that could increase the HPGR feed moisture above the design of 5%, thereby impacting on throughput and liner wear life.
Vale appears to have the required level of dedication and resources from its staff, most of whom have experience in plant start-up activities from the nearby Sossego Mine, to successfully resolve the current plant production issues.
1.7 INFRASTRUCTURE
Electrical energy is supplied from Tucuruí, a 8,370 MW hydroelectric generating station on the Tocantins River, 200 km north of Marabá, and 250 km due north of Parauapebas. An 87-km overhead transmission line (230 kV) supplies the Salobo site. There is no ring feed.
Process make-up water comprises runoff and direct precipitation within the tailings storage basin. This raw water is pumped up to the plant together with return water from tailings deposited in the storage facility. At the time of Micon’s visit, excess water was being discharged from the tailings storage facility (TSF). However, if the process plant requires additional makeup water, this can be abstracted from Igarapé Mamão (Pawpaw creek) via a floating intake within the project site, using vertical pumps.
Concentrate produced at Salobo Mine is transported 85 km by road to a rail load-out facility near the town of Parauapebas. There it is loaded onto cars for rail transport 870 km northeast, to the Ponta da Madeira Marine Terminalat the seaport of São Luis.
The Salobo TSF, comprising an earth dam and concrete-lined spillway, was designed for Vale by Brazilian engineering company BVP Engenharia to withstand a 1 in 10,000 year event. The TSF, when completed to a height of 280 masl, will have sufficient capacity to store tailings resulting from the entire mineral reserve planned over the life of the mine. At present, work is underway to lift the impoundment from 170 masl to an intermediate design height of 220 masl. Potentially, the TSF site could also store tailings from the material presently identified as mineral resources.
9
1.8 SOCIAL AND ENVIRONMENTAL ISSUES
The Preliminary Licence No. 33/94 was issued for the Salobo project in September, 1994 following preparation and submission of the Environmental Impact Analysis/Report on Environmental Impact (EIA/RIMA) in 1992. During the course of preparing the initial Feasibility Study for the project, the project definition changed and a revision was made to the Preliminary License for the first renewal. The Preliminary Licence renewal was received in September, 2001, valid for two years. An application for an Installation License was submitted in May, 2003. Following a review process by the agencies, Installation Licence No. 416/2006 was issued by IBAMA on 28 December, 2006 and then renewed on 2 March, 2011, valid for a period of 18 months. The Installation Licence renewal was received 5 November, 2012 (Nº 889/2012), and is valid for three years. The licence has 24 specific conditions to be met by SMSA.
The Salobo Mine received its first Operating Licence on 5 November, 2012 (No. 1096/2012), valid for four years. The license has 15 specific conditions to be met by SMSA. The current license refers to the research, mining and mineral processing as well as all administrative and support facilities, including workshops, waste storage area, warehouse, dining hall, transportation, storage and shipment of copper concentrate.
An Environmental Control Plan is in place for the mine that includes the following components:
- Project Description
- Environmental Management System
- Vegetation Clearing and Stripping
- Erosion Control
- Water and Effluent Management
- Waste Management
- Atmospheric Emissions
- Noise and Vibration
- Environmental Emergencies
- Disease Control
- Archaeology Protection and Salvage
- Rehabilitation Plan
- Environmental Compensation and Social Inclusion
- Environmental Education
- Environmental Monitoring
- Closure Plan
These social and environmental management plans detail best practices and reflect Brazilian legislation to prevent and mitigate potential impacts and manage compliance specifically for the Salobo Mine. Effective implementation of the management system should support ongoing permit compliance and project support.
10
1.9 CAPITAL AND OPERATING COSTS
1.9.1 Capital Costs
Construction of the 12 Mt/y Salobo Phase I is essentially complete, and the capital cost of this phase is treated as a sunk cost for the purpose of this evaluation.
Phase II, which includes expansion of the mine and processing plant capacity to 24 Mt/y, is well underway. Micon estimates that approximately $686 million has already been spent on the expansion and, as of 1 January, 2013, it is estimated that $882 million remains to be spent to complete the project. The latter amount has been included in Micon’s cash flow forecast.
In addition, further investment is required over the life of the open pit mining operation to expand and maintain the mining fleet capacity. Over the 30 years to 2042, Micon has forecast this to total approximately $1,732 million, for an average of around $57.7 million per year.
The tailings dam must be raised to its final height, at a further cost of approximately $36 million, starting in 2016. This cost may be allocated over several years.
An allowance for mine closure and decommissioning of $193 million at the end of the LOM period is also reflected in the cash flow forecast.
1.9.2 Operating Costs
Operating costs have been forecast by Micon, based on equipment usage, maintenance, consumables and labour required to meet the production schedule. Table 1.4 shows the resulting unit costs.
Table 1.4
Direct Operating Costs Summary
| Description | Unit | 2013 | 2014 | 2015 | 2016 | 2017 | Avg. Costs (2018- 2042) | Avg. Cost (2043- 2064) | LOM Avg. Costs |
| Mining | $/t milled | 23.30 | 16.97 | 13.82 | 14.00 | 13.96 | 15.49 | - | 9.26 |
| Processing | $/t milled | 14.85 | 13.59 | 13.59 | 13.59 | 13.59 | 13.60 | 14.09 | 13.81 |
| G&A | $/t milled | 6.94 | 4.40 | 2.98 | 2.74 | 2.74 | 2.74 | 2.74 | 2.80 |
| Total | $/t milled | 45.09 | 34.96 | 30.40 | 30.34 | 30.29 | 31.84 | 16.83 | 25.87 |
1.10 ECONOMIC ANALYSIS
Base case metal prices for the evaluation have been selected by Micon to represent a three-year trailing average price for both copper and gold. These values are $3.70/lb for copper and $1,485/oz for gold, respectively.
11
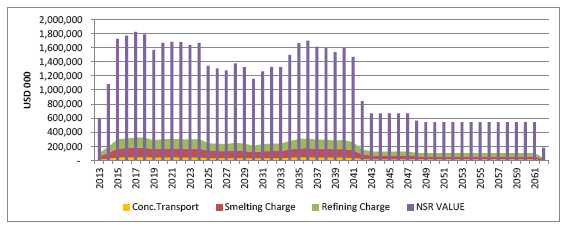
Copper-gold concentrate produced at the mine will be shipped to overseas buyers for smelting and refining. The costs of this have been taken into account in Micon’s cash flow projection, based on its understanding of the terms offered by a range of off-takers. Figure 1.5 shows the net smelter return (NSR) value of the ore in comparison to transport, treatment and refining costs.
Figure 1.5
Concentrate NSR Value
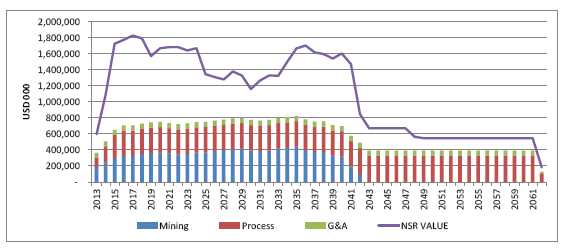
At base case metal prices, the Salobo Mine is forecast to enjoy a healthy operating margin, averaging around 50% while the open pit is producing high grade ore. Once the processing of medium- and low-grade stockpiles takes place, however, the operating margin narrows significantly, to average around 27% over the period 2043-2062, as shown in Figure 1.6.
Figure 1.6
LOM NSR vs Operating Costs
Micon’s cash flow forecast, based on mineral reserves only, is presented graphically in Figure 1.7, before accounting for the revenue adjustment implied by the gold streaming agreement with Silver Wheaton. Applying a discount rate of 10%, Micon estimates the net present value of the after-tax cash flow (NPV10) to be $4.85 billion, as of 1 January, 2013.
12
Given that much of the capital cost is now sunk, estimates of internal rate of return (IRR) and payback period are not considered meaningful.
Figure 1.7
LOM Annual Cash Flow Forecast

Using base case metal prices, Micon’s estimate of LOM unit revenues and costs are presented in Table 1.5, which shows the impact on operating margin related to the gold streaming agreement with Silver Wheaton.
Table 1.5
Base Case Revenue and Operating Costs
| Before Streaming | After Streaming | |||
| $/t milled | Cash Operating Margin (%) | $/t milled | Cash Operating Margin (%) | |
| Net Smelt | 49.12 | 100 | 47.18 | 100 |
| Direct Site Costs: | ||||
| Mining | 9.26 | 9.26 | ||
| Processing | 13.81 | 13.81 | ||
| G&A | 2.80 | 2.80 | ||
| S/T D | 25.87 | 47 | 25.87 | 45 |
| Transport, TC/RC | 8.98 | 8.97 | ||
| S/T Cash Operating Costs | 34.85 | 29 | 34.84 | 26 |
| Royalties and Production Taxes | 0.98 | 0.94 | ||
| Total Cash Costs | 35.83 | 27 | 35.78 | 24 |
13
The gold streaming arrangement is thus seen to reduce cash operating margin by approximately 3% at base case prices, which the mine can readily absorb. Therefore, Micon concludes that the gold streaming arrangement should have no material impact on the economic cut-off grade used in the mine plan, and thus the estimate of mineral reserves remains valid.
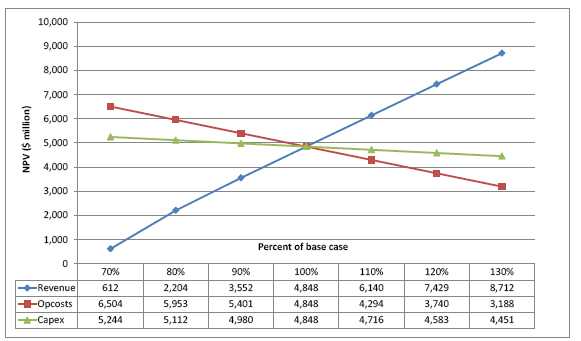
Micon has made an analysis of the sensitivity of the project to changes in revenue factors, (such as metal prices, grades and recoveries), capital and operating costs (see Figure 1.8) . As is typical, the project is most sensitive to changes in revenue factors, but is able to withstand a 30% adverse change before NPV10is reduced to $0.61 billion. That point is equivalent to a copper price of $2.59/lb.
The mine is less sensitive to operating costs, with a 30% increase in costs resulting in a reduction of 34% in NPV10 to $3.19 billion. Owing to the large proportion of sunk capital, the project is not sensitive to capital cost increases. A 30% capital increase results in an 8% drop in NPV10to $4.45 billion.
Figure 1.8
Sensitivity Diagram
1.11 CONCLUSIONS AND RECOMMENDATIONS
Micon concludes that this analysis demonstrates the viability of the mine (including the Phase II expansion which is presently underway), and that the proposed gold streaming agreement with Silver Wheaton should have no material impact on the mine’s estimate of mineral reserves.
14
2.0 INTRODUCTION
The Salobo Mine is based on a copper-gold deposit, operated by a subsidiary of Vale S.A. (Vale) and is located approximately 80 km northwest of Carajás, Pará State, in northern Brazil. It is approximately 240 km by highway from the city of Marabá.
On 5 February, 2013, Silver Wheaton issued a press release announcing that it has entered into a binding term sheet to acquire an amount of gold equal to 25% of the life of mine gold production from Vale’s Salobo Mine. This press release can be found on Silver Wheaton’s website atwww.silverwheaton.com and under its profile on SEDAR atwww.sedar.com.
Micon has been retained by Silver Wheaton to prepare a Technical Report in accordance with Canadian National Instrument (NI) 43-101 to support the disclosure of mineral resource and reserve estimates for the Salobo Mine.
Micon does not have, nor has it previously had, any material interest in Silver Wheaton, Vale, or related entities or interests of either party to the transaction. The relationship with Silver Wheaton is solely a professional association between client and independent consultant. This report is prepared in return for fees based upon agreed commercial rates and the payment of these fees is in no way contingent on the results of this report.
This report includes technical information which requires subsequent calculations or estimates to derive sub-totals, totals and weighted averages. Such calculations or estimations inherently involve a degree of rounding and consequently introduce a margin of error. Where these occur, Micon does not consider them to be material.
This report is intended to be used by Silver Wheaton subject to the terms and conditions of its agreement with Micon. That agreement permits Silver Wheaton to file this report as an NI 43-101 Technical Report on SEDAR (www.sedar.com) pursuant to provincial securities legislation. Except for the purposes legislated under provincial securities laws, any other use of this report, by any third party, is at that party’s sole risk.
The conclusions and recommendations in this report reflect the authors’ best judgment in light of the information available to them at the time of writing. The authors and Micon reserve the right, but will not be obliged, to revise this report and conclusions if additional information becomes known to them subsequent to the date of this report. Use of this report acknowledges acceptance of the foregoing conditions.
2.1 PURPOSE OF REPORT
The purpose of this report is to provide a summary of technical information supporting estimates of mineral reserves and mineral resources for Vale’s Salobo Mine. The format and content of this report is consistent the requirements of NI 43-101 Form F1.This document focuses on the fundamental scientific and technical information necessary to support the disclosure of mineral resources and mineral reserves in accordance with NI 43-101.
15
2.2 TERMS OF REFERENCE
Micon was appointed to prepare this report on the mineral resources and mineral reserves at the Salobo Mine as an independent consultant to Silver Wheaton. Micon undertook the work using full-time staff based in its Toronto, Vancouver and UK offices. Micon wishes to acknowledge the helpful cooperation of the technical and operational staff at the Salobo Mine, all of whom are employees of Vale.
In order to complete this assignment, Micon staff visited the Salobo Mine and met with senior mine management and technical staff. Geological, mine planning and metallurgical data, permits, licences and other documents were reviewed. For the most part, subject to its review, Micon has adopted the estimates and forecasts prepared by Salobo Mine staff.
However, in certain cases where the mine operator’s information was deemed to be commercially sensitive or proprietary (such as the precise terms of concentrate sales), and where it deemed appropriate, Micon has made its own estimates or formed an opinion based on its experience elsewhere. Micon considers the non-disclosure of confidential information to be within the exemption provided under item 9.2 (3) (a) of NI 43-101.
For this reason, production, sales and cost forecasts presented herein are Micon’s, and do not necessarily reflect the views of Vale as the mine operator.
Nevertheless, taken as a whole, Micon considers the accuracy of the technical information in this report meets or exceeds the standards normally expected of in the mineral industry, and is therefore appropriate to use as a basis for the declaration of a mineral reserve.
2.3 QUALIFIED PERSONS
The Qualified Persons (QPs) who prepared this report are listed in Table 2.1. All the listed QPs visited the Salobo Mine on 8–9 February, 2013. Further details of the site visit are provided in Section 12.1 of this report.
Table 2.1
List of Qualified Persons
| Qualified Person | Responsibility for Sections of this Report |
| Jason Ché Osmond, C.Geol, FGS, EurGeol | 6 to 12, 14 and portions of 1, 25, and 26 |
| Barnard Foo, P.Eng. | 15 and 16 and portions of 1, 21, 23, 25, and 26 |
| James Turner, CEng. MIMMM | 13 and 17 and portions of 1, 25, and 26 |
| Christopher Jacobs, CEng. MIMMM | 2 to 5, 18 to 24, 28 and portions of 1, 25, and 26 |
2.4 USE OF REPORT
This report is intended to be used by Silver Wheaton subject to the terms and conditions of its agreement with Micon. Silver Wheaton may file this report as an NI 43-101 Technical Report with the Canadian Securities Administrators (CSA) pursuant to provincial securities legislation. Except for the purposes legislated under provincial securities laws, any other use of this report, by any third party, is at that party’s sole risk.
16
The conclusions and recommendations in this report reflect the authors’ best judgment in light of the information available to them at the time of writing. The authors and Micon reserve the right, but will not be obliged, to revise this report and conclusions if additional information becomes known to them subsequent to the date of this report. Use of this report acknowledges acceptance of the foregoing conditions.
2.5 UNITS, CURRENCY AND ABBREVIATIONS
All financial values are reported in US currency ($) while units are reported in the Système Internationale d’Unités (SI) for example, metric tonnes (t), kilograms (kg) and grams (g) for weight, kilometres (km) or metres (m) for distance and hectares (ha) for area. By convention, precious metal quantities, prices and grades are typically given in troy ounces (oz), US dollars per troy ounce ($/oz) and grams per metric tonne (g/t), respectively. Precious metal grades may also be expressed in parts per million (ppm) or parts per billion (ppb). Base metal quantities, prices and grades are quoted in pounds avoirdupois (lb), dollars per pound ($/lb) and percentage metal (%) by mass.
The following conversion factors are used in the preparation of this report:
- 1 troy ounce = 31.1035 g.
- 1 tonne = 2,204.627 lb.
Table 2.2 contains a list of acronyms and abbreviations used in this report.
Table 2.2
Acronyms and Abbreviations
| Abbreviation | Term |
| Ag | Silver |
| Au | Gold |
| ALS | ALS Minerals (formerly ALS Chemex Labs Ltd). |
| AMEC | AMEC E&C Services Inc. |
| ANA | National Water Agency [Brazil] |
| ANFO | Ammonium Nitrate /Fuel Oil |
| ARD | Acid Rock Drainage |
| BIF | Banded Iron Formation |
| BNDES | Brazilian Development Bank |
| BRL | Brazilian Real currency |
| CFEM | Compensation for Financial Exploitation of Mineral Resources |
| CIM | Canadian Institute of Mining, Metallurgy and Petroleum |
| cm | Centimetre(s) |
| cm/s | Centimetres per second |
| COG | Cut-off Grade |
| CONAMA | Conselho Nacional de Meio Ambiente – Brazilian Environmental Council |
| Cu | Copper |
17
| Abbreviation | Term |
| CuEq | Copper Equivalent |
| CVRD | Companhia Vale do Rio Doce, now known as Vale S.A. |
| DIOC | South Atlantic Operational Copper Department |
| DNPM | Brazil National Department of Mineral Production |
| d/y | Days per Year |
| DOCEGEO | CVRD (now Vale) Exploration Division |
| EIA | Environmental Impact Assessment |
| EPCM | Engineering, procurement and construction management services |
| ft | foot, feet |
| g | gram(s) |
| g/t | grams/tonne |
| Ga | Billion years old/ago |
| G&A | General and Administrative Costs |
| GAL | Golder Associates Ltd. |
| GALOY | Geology and Mine Planning Management – Long Term |
| GAMAY | Environmental Management |
| GEOSY | General Support Management |
| h | Hour(s) |
| h/d | Hours per Day |
| ha | Hectare(s) |
| HPGR | High Pressure Grinding Rolls |
| IBAMA | Brazilian Institute of Environment and Renewable Natural Resources |
| IMC | Independent Mining Consultants Incorporated |
| in | inch(es) |
| Inco | International Nickel Company (now Vale Inco) |
| Income Tax Act | Income Tax Act (Canada) |
| Independent Audit | The independent audit carried out on the mineral resources and mineral reserves. |
| IRR | Internal Rate of Return |
| kV | Kilovolt (1,000 V) |
| Kwh/t | Kilowatthours per tonne |
| L | Litre |
| L/s/km2 | Litres per Second per Square Kilometre |
| lb | Pounds avoirdupois |
| LCT | Locked Cycle Test |
| LOM | Life of Mine |
| m | Metre(s) |
| m3 | Cubic Metre(s) |
| Ma | Million years old/ago |
| masl | Metres Above Sea Level |
| min | Minute(s) |
| mm | Millimetre(s) |
| Mm3 | Million Cubic Metres |
| MPa | Megapascal(s) |
| Mt | Million tonnes |
| MW | Megawatt(s) |
| NI 43-101 | Canadian National Instrument 43-101 |
| NOS | National Operator of [Brazilian Electrical] System |
| NPV | Net Present Value |
| NSR | Net Smelter Return |
| OK | Ordinary Kriging |
| oz | Troy ounce |
18
| Abbreviation | Term |
| PAH | Pincock Allen and Holt |
| pH | Logarithmic scale of acidity |
| PAX | Potassium Amyl Xanthate |
| ppm/ ppb | Parts per million /parts per billion |
| RIMA | See EIA |
| RQD | Rock Quality Designation |
| SAG | Semi-Autogenous Grinding |
| SBC | Sergio Brito Consulting |
| SG | Specific Gravity |
| SGS | Lakefield SGS Lakefield Research Ltd. |
| SMSA | Salobo Metais S.A. |
| TC/RC | Treatment and Refining Charges |
| t | Metric tonne(s) (2,204.63 lbs) |
| ton | Avoirdupois ton (2,240 lbs) |
| TSF | Tailings Storage Facility |
| UCS | Uniaxial Compressive Strength |
| yd3 | Cubic Yard(s) |
| Vale | Vale S.A. |
| VTD | Vale Technology Development (Canada) Limited |
| $ | United States Dollars |
| µm | Micron(s) |
19
3.0 RELIANCE ON OTHER EXPERTS
Micon has reviewed and analyzed data provided by Silver Wheaton, Vale, and its consultants, and has drawn its own conclusions therefrom, augmented by its direct field examination. Micon has not carried out any independent exploration work, drilled any holes or carried out any sampling and assaying on the property.
While exercising all reasonable diligence in checking, confirming and testing it, Micon has relied upon Silver Wheaton’s presentation of the project data from Vale and its predecessors and the operator’s mining and exploration experience at the Salobo Mine in formulating its opinion.
Micon has not reviewed any of the documents or agreements under which Vale holds title to the Salobo Mine or the underlying mineral concessions and Micon offers no opinion as to the validity of the mineral titles claimed. A description of the properties, and ownership thereof, is provided for general information purposes only. The existing environmental conditions, liabilities and remediation have been described where required by NI 43-101 regulations. These statements also are provided for information purposes only and Micon offers no opinion in this regard.
The descriptions of geology, mineralization and exploration are taken from reports prepared by various companies or their contracted consultants. The conclusions of this report rely on data available in published and unpublished reports, information supplied by the various companies which have conducted exploration on the property, and information supplied by Silver Wheaton. Where applicable, the source is noted in the text of this report and a list of references is provided in Section 28.0. The information provided to Silver Wheaton was gathered by reputable companies and, having reviewed the information, Micon has no reason to doubt its validity.
Some figures and tables for this report were reproduced or derived from reports written by or for Vale and most of the photographs were taken during the Micon site visit. Where the figures and tables are derived from sources other than Micon, the source is acknowledged below the figure or table, or in the text.
20
4.0 PROPERTY DESCRIPTION AND LOCATION
4.1 LOCATION AND ACCESS
The Salobo Mine is based on a copper-gold deposit located approximately 80 km northwest of Carajás, situated along the southern edge of the Amazon Basin, northern central Brazil, in the southeastern part of the State of Pará. It is located in the Parauapebas micro-region in the municipality of Marabá.
The Salobo deposit lies within the Carajás mineral province, which is host to major iron ore mines, and significant deposits of manganese, gold, copper sulphide and lateritic nickel.
The Carajás area has excellent infrastructure. Hydro-electrical power is supplied from generators at the Tucuruí Dam. The Salobo Mine is connected via an all-weather road network to the cities of Parauapebas (80 km), Marabá (240 km), and the commercial airport at Carajás (70 km), from where regular scheduled services fly to the city of Belém (the Pará state capital) and several other Brazilian cities. The area is well-served by railroads linking Carajás with the port city of São Luis. There are abundant water resources, well developed settlements, and social institutions.
Figure 4.1
Location of the Salobo Mine
4.2 REGULATORY
4.2.1 Mineral Rights and Land Ownership
The Salobo Mine comprises a single claim and is permitted for mining copper and gold under DNPM (National Department of Mineral Production) 807.426/74. The area of the property is 9,180.61 ha, as defined by Exploration Permit no. 1121, dated 14 July, 1987.
21
Brazilian legislation separates the ownership of the surface rights from mineral ownership. A mining company can operate a mine even if does not own the surface, provided it owns the minerals. In this case it is necessary to pay a royalty to the surface owner. The royalty is calculated as 50% of the CFEM (Compensation for Financial Exploitation of Mineral Resources), which is paid to the government. The mining concessions are updated every year on presentation by Vale of the annual report of mining production to the DNPM.
4.2.2 Permits and Environmental Liabilities
The application for the Installation License (LI) was submitted in May, 2003. The LI stage isthe second phase of environmental licensing, during which the company must produce an Environmental Control Plan (PCA). Following an extensive review process by the responsible agencies, Installation License Nº 889/2012 (valid for 3 years) was issued by the Brazilian Institute of Environment and Renewable Natural Resources (IBAMA) on 5 November, 2012.
The Salobo Mine received its first Operating Licence No. 1096/2012 on 5 November, 2012, valid for four years.
Vale maintains that the company holds clear mineral title to the deposit areas and has the necessary permits for operation of the mine.
The cost of decommissioning and reclamation to manage environmental liabilities of the Salobo Mine, process plant and associated facilities are discussed in Section 21.1.3 below.
Micon knows of no other significant factors or risks that may affect access, title, or the right or ability of Vale to perform work on the property.
22
5.0 ACCESSIBILITY, CLIMATE, LOCAL RESOURCES, INFRASTRUCTURE AND PHYSIOGRAPHY
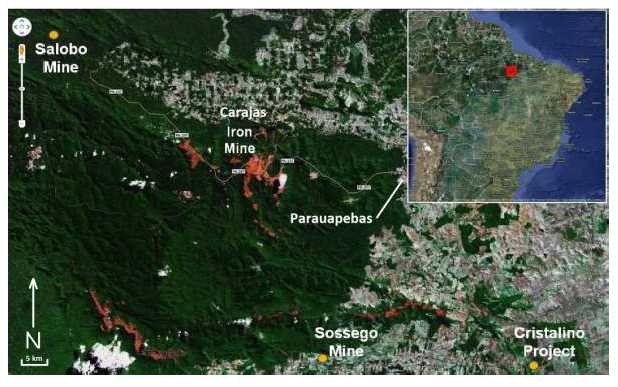
The Salobo Mine is an open pit copper-gold operation located approximately 80 km by road northwest of Carajás village, in the northern part of the Brazil in Pará state. Geographic coordinates for the Project are 5º47’25” south latitude and 50º32’5” west longitude. Figure 5.1 provides a general location map for Brazil and the Carajás region.
Figure 5.1
Property Location
The tropical climate, typical of the Amazon region, is humid and hot with a temperature ranging from 17° C to 32° C, and averaging 27° C. The average humidity is about 76% and the average annual rainfall is approximately 192 cm. The rainy season extends from December to April, with most rainfall occurring in February and March.
In the Salobo Mine area, surface elevations range from 190 to 520 m, compared to the elevation of 850 m attained on the Carajás Ridge to the southeast. The topography is fairly steep: the Salobo ridge, where the deposit is located, has a nominal slope of 2.5H:1.0V. On either side of the Salobo ridge are the Cinzento and Salobo Rivers, respectively, both of which flow into the Itacaiúnas River. The latter flows into the Tocantins River close to the city of Marabá.
Salobo is within the Flona de Tapirape-Aquiri national forest which is 190,000 ha in area. The deposit is in the northwestern portion of the Carajás Reserve. The main ecosystem is tropical forest, which is dominated by relatively dense trees with substantial brush in the under-storey.
23
Mining is the primary industry of the area. As well as Salobo, Vale also operates a very large iron ore mine at Carajás, and the established Sossego copper mine.
A 230 kV power line runs from Parauapebas to the Salobo mine site.
Concentrate produced at the mine is hauled by 40 ton (gross weight) highway trucks 85 km on the highway to a rail-loading site located approximately 10 km north of the town of Parauapebas. From there, it is transported by train 870 km to Itaqui port located near the coastal city of São Luís in the State of Maranhão.
For a description of regional transport and other infrastructure, see Section 4.1.
24
6.0 HISTORY
The Salobo copper deposit was discovered in 1974 during a systematic program of geochemical, geophysical and geological exploration in the Carajás region carried out by the exploration division of CVRD (DOCEGEO).However, it was not until 1977 that a detailed exploration plan was developed, involving geochemical sampling and geophysical prospecting using magnetometer and induced polarization (100 m by 50 m grid) surveys. During this exploration program, anomalies of up to 2,700 ppm copper were detected in stream sediments collected from tributaries of the Igarapé Salobo (Cascade Cave). In 1978 the original target area was revisited, and the presence of copper sulphides associated with magnetic schist was found. The first drill hole was also completed that intersected a mineralized interval of 140 m at 0.45% Cu.
Additional drilling programs and the development of two exploration adits provided data for a preliminary assessment of the Salobo deposit in 1981. At that time, it was estimated that the deposit contained around 1,100 Mt with an average grade of 0.84% Cu.
As a result of this initial assessment the Carajás copper project team submitted the Exploitation Economical Plan of the Salobo deposit to National Department of Mineral Production (DNPM) in June, 1981.
From 1985 to 1987, a study was carried out at Salobo to obtain more details regarding the geometry of the mineralized zone and types of minerals present. During this period, based on an agreement between CVRD and BNDES (Brazilian Development Bank), definition drilling programs were conducted on the southeastern section of the deposit and a further approximately 1,000 m of exploration adit was driven. This made it possible to access other exploration targets thought to be potentially rich in sulphides, as well as to establish basic technological parameters for processing the ore.
Subsequently, in July, 1987, MME (Mining and Energy Ministry) Ordinance No. 1121 was granted giving CVRD the right to mine the Salobo deposit (DNPM No. 807.426/74) . In 1988 Bechtel completed a pre-feasibility study.
On 29 June, 1993, Salobo Metais S.A. (SMSA) was created. This was a joint venture, between CVRD and Morro Velho Mining, established to further study the economic viability of the deposit using underground mining methods and producing copper cathode.
Almost 30,000 m of drilling was completed in 1997 to verify the previous studies and work towards a pre-feasibility study completed by MRDI in the same year. This was followed in 1998 with the first Feasibility Study completed by Minorco that identified an initial Mineral Resource of 1.297 Mt at 0.74% Cu and 0.43 g/t Au, at a cut-off grade of 0.4% Cu. In 2001, a revised Feasibility Study was completed by Aker Kvaerner and this was updated in 2002 by AMEC. The period 2002 and 2003 also generated a final period of drilling (over 72,000 m) from which the final database was produced and resulted in a period of independent mineral resource block modelling and audits by Snowden (2003), Golder and AMEC (2004), Pincock, Allen and Holt (2005 and 2008), and Golder (2010), where the latter went on to define the current (2012) block model and mineral resource estimate. The definitive Feasibility Study was completed by Fluor JPS in June, 2004.
25
DNPM issued a letter, dated 4 April, 2002, that approved changes to the Exploitation Economic Plan (PAE) of the Salobo Area, authorizing mining of gold and silver, which had not originally been included in the decree No. 1121 MME.
In June, 2002, the Brazilian Council for Economic Defense - Cade (Conselho Administrativo de Defesa Economica) approved the acquisition by CVRD of the 50% of SMSA formerly held by Anglo American Brasil Ltda., CVRD becoming the largest shareholder.
In 2007 CVRD changed its name to Vale S.A.
The mineral resource estimate for Salobo has been refined over time and been subject to several independent audits. The most significant mineral resource estimates are summarized in Table 6.1.
Table 6.1
Significant Mineral Resource Estimates for the Salobo Project
| Date | Author | Cut-off (% Cu) | Tonnes (Mt) | Cu (%) | Au (g/t) | Ag (g/t) |
| 1998 | Minorco | 0.4 | 1,297 | 0.74 | 0.43 | - |
| 0.6 | 746 | 0.93 | 0.56 | - | ||
| 2003 | CVRD | 0.4 | 1,904 | 0.75 | 0.41 | - |
| 0.6 | 1,185 | 0.91 | 0.52 | - | ||
| 2006 | CVRD | 0.4 | 1,114 | 0.76 | 0.45 | - |
| 2007 | CVRD | 0.4 | 1,243 | 0.76 | 0.43 | 2.53 |
| 0.6 | 788 | 0.92 | 0.54 | 2.82 | ||
| 2011 | Vale | 0.3 | 1,113 | 0.69 | 0.43 | - |
Pre-stripping at the Salobo Mine commenced in 2009 and production is currently part-way through a ramp-up phase with ore processing having commenced in June, 2012. In the eight months to January, 2013, some 2.3 Mt of ore was processed at Salobo with grades averaging 1.1% Cu, 0.72 g/t Au, and 4.01 g/t Ag. Further production details are presented in Sections 16.0 and 17.0.
26
7.0 GEOLOGICAL SETTING AND MINERALIZATION
7.1 REGIONAL GEOLOGY
The Carajás Mining District, located in the southeast of Pará State, Brazil, is a unique geologic feature covering an area of about 30,000 km2 (300 km by 100 km), between the Xingu and Tocantins / Araguaia Rivers (Figure 7.1) .
Figure 7.1
Geological Map of the Carajás Mineral Province Showing the Division into the Itacaiúnas Belt and
Rio Maria Granitoid–Greenstone Terrain
![]()
27
The Carajás Province is a major late Archean basin, deformed into a sigmoid shape, trending west-northwest – east-southeast. The Carajás sigmoid shape is further defined by several major west-northwest – east-southeast lineaments such as the Carajás and Cigano sinistral fault zones. Northeast and northwest fault systems crosscut the region.
The Carajás Archean volcano-sedimentary sequence is composed mainly of bimodal volcanic, chemical sediments, including the gigantic banded iron formations (BIF) that host the largest iron deposits in the world, and pyroclastic and clastic sediments. Several Archean intrusive units, the calc-alkaline Plaquê Suite (2.77 Ga), and the alkaline Salobo and Estrela granites (2.5 Ga), are known to have a strong correlation with copper–gold mineralization in Carajás. There are many generations of mafic bodies including some that are post-mineral dykes. A Proterozoic suite (1.88 Ga) of alkaline granites, the central Carajás granite, Cigano, and Pojuca granites, also intrude the Carajás sequence. Several generations of younger mafic dykes crosscut the entire sequence.
The Carajás volcano-sedimentary sequence has been locally named the Itacaiúnas Supergroup, which has been tentatively divided from top to the bottom into:
| i. | Igarapé Bahia Group– is composed of mafic volcanic: lavas, tuffs and breccias, meta-sediments and BIF, with deposits of Cu, Cu-Fe, Cu-Au-Mo-Ag including the Igarapé Bahia (18 Mt at 4.0g/t Au in the weathering profile) and Alemão/Bahia deposits (120 Mt at 1.1% Cu and 1.5 g/t Au). The Serra Pelada oxide-gold deposit is hosted by an overlying clastic metasedimentary sequence. | |
| ii. | Grão Pará Group- consists of the basal Parauapebas Formation made up of bimodal volcanic rocks with various degrees of hydrothermal alteration, metamorphism and deformation. The Parauapebas is overlain by the Carajás Formation, which hosts the gigantic Fe deposits (18 Bt at 15% Fe). | |
| iii. | Igarapé Pojuca Group -comprises basic to intermediate volcanics (frequently with cordierite-anthophyllite alteration), amphibolites, gneisses and chemical sediments (cherts), BIF of oxide-silicate facies and schists of various compositions. The BIF unit hosts the Pojuca Cu-Zn deposit. | |
| iv. | The Igarapé Salobo Group– is composed of Fe-rich sediments associated with quartzites and gneisses, amphibolite facies of metamorphism, which includes the Salobo Cu-Au deposit, see Figure 7.2. |
The basement of the Carajás sequence comprises a gneissic terrain with remnants of Archean greenstone belts. Copper and gold mineralization within the province is associated with Archean felsic intrusives (Plaquê and Estrela Granites). Proterozoic anorogenic felsic intrusives (dykes) and Mesozoic mafic dykes crosscut the Carajás Sequence and the gneissic terrain.
28
Figure 7.2
Simplified Geological Map of the Itacaiúnas Belt

The Salobo and Sossego gold–copper deposits lie within the Carajás belt of the Amazon craton. Basement rocks comprise gneisses and migmatites of the Xingu Complex and orthogranulites of the Pium Complex that were metamorphosed at about 2.8 Ga. In the Carajás belt, the basement assemblage defines a broad, steeply dipping, east-west trending ductile shear zone (Itacaiúnas shear zone), which experienced multiple episodes of reactivation during the Achaean and Palaeoproterozoic. Unconformably overlying the basement is a sequence of volcano-sedimentary rocks of Archaean age (2.75 Ga), the Itacaiúnas Supergroup. The basal unit is the Grão Pará Group that includes greenschist-facies metamorphosed metavolcanic rocks and BIF.
29
Sandstone and siltstone deposited in a shallow marine to fluvial environment (Águas Claras Formation), dated at 2.645 Ga to 2.681 Ga, overlie the volcanic rocks of the Grão Pará Group. The volcano-sedimentary sequence has been intruded by granitic rocks of various ages. Palaeoproterozoic intrusions (ca. 1.88 Ga) include several anorogenic granitic plutons, such as the Central Carajás and Cigano granitoids. Achaean intrusions include granitoids and diorites of the Plaquê Suite (ca. 2.74 Ga), younger alkaline granitoids (ca. 2.57 Ga), such as the Estrela Complex, the Old Salobo Granite (2.573 ± 0.002 Ga) and the Itacaiúnas Granite.
7.2 PROPERTY GEOLOGY– LITHOLOGY
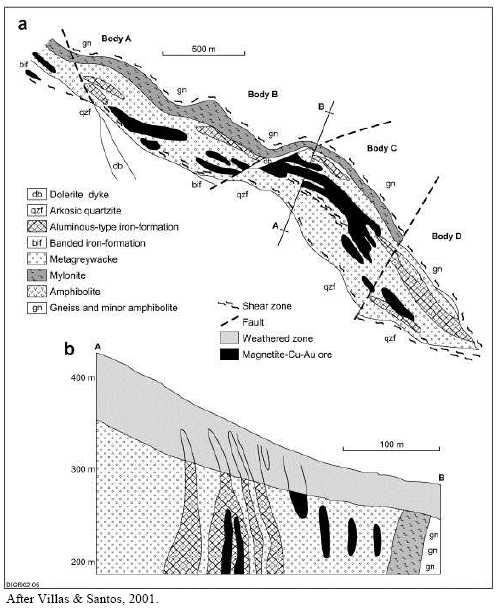
The Salobo mineralization is hosted in the biotite-magnetite (BDX) and amphibolite magnetite schists (XMT) along the trend of a steeply dipping sequence of metamorphic rocks. Granitic intrusives (granitoid, GR) occur adjacent to the north side of the sequence of rocks and a series of much younger diorite dykes (diabase, DB) crosscut the mineralization forming barren zones (Figure 7.3). Copper mineralization occurs as chalcocite and bornite, with subordinate quantities of chalcopyrite, together with variable proportions of molybdenite, cobaltite, covellite, gold and silver, contained in schists with variable proportions of magnetite, amphibole, olivine, garnet, biotite, quartz and plagioclase. Brittle-ductile shear zoned deformation has resulted in lenticular shaped ore shoots that characteristically show close associations between copper mineralization and magnetite contents.
Near-surface weathering of the bedrock in the deposit area has produced a humid, clayey saprolite surface layer. The sulphide mineralization in the upper 20 m to 25 m part of the saprolite has been oxidized, while the lower 5 m to 10 m of the saprolite contains variable sulphides, and is transitional downward into fresh, sulphide-bearing bedrock. The oxide saprolite layer has been partially leached by groundwater resulting in a significant reduction in the copper and gold content. The sulphide saprolite is a transitional unit for which leaching has also reduced the copper and gold content, but to a lesser degree than the oxide saprolite. The lack of sulphides and the reduced grade in the oxide saprolite prohibits it from currently being considered of economic interest.
7.2.1 Magnetite Schist (XMT)
XMT is represented by massive, foliated and banded rocks, with predominant magnetite, fayalite, grunerite, almandine and secondary biotite. Granoblastic textures with polygonal contacts in magnetite and fayalite are common. The presence of fayalite is marked by the replacement of grunerite and greenalite and transformation into magnetite and other sulphides. Iron-potassic alteration is common, creating schistosity in biotite units.
30
The southeast portion of the deposit hosts hastingsite, replaced partially by actinolite, grunerite and sulphide minerals. Fluorite, apatite, graphite and uranium oxides are associated with this assemblage, Fe-silicate minerals and alteration products of fayalite.
Figure 7.3
Geological Plan and Simplified Cross Section of the Salobo Deposit
7.2.2 Garnet-Grunerite Schist (DGRX)
These are massive rocks with local development of schistosity. The rocks with significant almandine and grunerite content have isotropic texture or very few schistosity structures, with nematoblastic and granoblastic texture. The main mineralogical composition consists of almandine and cummingtonite-grunerite, with magnetite, hematite, ilmenite, biotite, quartz, chlorite, tourmaline and subordinate allanite. Fluorite and uraninite generally occur in veinlets related to stilpnomelane, calcite and grunerite.
31
7.2.3 Biotite Schist (BDX)
This unit is the most common lithology at Salobo and consists of medium to coarse-grained material with anastomosed foliation. The mineral assembly is characterized by biotite (responsible for the foliation observed within the rocks), garnet, quartz, magnetite and chlorite. The assemblage with garnet, magnetite, grunerite and biotite is partially replaced by a second generation of biotite and magnetite with chlorite, K feldspar, quartz, hematite and sulphides. Tourmaline, apatite, allanite, graphite and fluorite generally occur throughout this unit.
7.2.4 Feldspar-Chlorite Mylonite (ML)
The feldspar-chlorite-quartz mylonite is characterized by mylonitic foliation, produced by the orientation of rims of chloritized deformed biotite, hastingsite, elongated quartz and saussuritized plagioclase (K-feldspar, epidote and muscovite alteration). Porphyroblastic garnet is partially or totally replaced by chlorite and epidote. Allanite and apatite generally occur throughout this lithology.
7.2.5 Metavolcanic Basic (MTB)
This group of massive coarse-grained rocks is characterized by Fe-hastingsite and/or hornblende and plagioclase with chlorite alteration. It occurs irregularly in the system, but is concordant with other lithotypes in abrupt contacts, probably hydrothermally altered intrusive basic relicts within the package of volcanic rocks.
7.2.6 Quartz Mylonites (QML)
Quartz mylonites are grey or white in colour, passing through green to red. Where present, Fe-oxides are medium to fine grained, foliated and composed predominantly of quartz, muscovite, sericite, sillimanite and chlorite. Accessories, such as biotite, feldspar, magnetite, almandine, tourmaline, zircon and allanite are common. It is possible to differentiate: (a) red quartz-feldspathic rocks formed by K-feldspar and quartz and which may be a product of shearing between the gneissic basement and the supracrustal rocks; and (b) chlorite schists, mainly composed of chlorite and quartz, that represent intense hydrothermal alteration. This unit is found near the southern border of the deposits, close to important brittle shear zones, which may be interpreted as conduits for hydrothermal fluids.
7.2.7 Old Salobo Granite (GR)
The Old Salobo Granite occurs as a stockwork of approximately 2,573 ±2 Ma. The rocks appear colorless-pink to grey, coarse grained and with mylonitization in some areas. The main mineralogy is composed of K-feldspar (orthoclase-microcline), oligoclase, quartz, augite, hornblende, chlorite and, rarely, magnetite. There is no evidence of contact metamorphism with the host rocks. The mylonitic aspects that appear both in granite and host rocks are likely to have formed during the deformation phase.
32
7.2.8 Young Salobo Granite (GR)
The Young Salobo Granite occurs as small northwest-trending sills, hosted by the supracrustal sequence and by the gneisses of basement. It corresponds to the youngest granitic intrusion detected by drilling in the Salobo area. In some porphyritic portions, the matrix is aphanitic, containing a porphyry of red albite (Fe-oxide in micro-fractures) and chlorite pseudomorphed by biotite. This mineral assemblage is composed of fine to medium grained, equigranular, hypidiomorphic grains of albite/oligoclase, orthoclase, quartz, chlorite, with minor epidote, zircon, fluorite, magnetite, chalcopyrite and pyrite. Deformation was not observed and the structure is isotropic. Age dating indicates an age of 1,880 ±80 Ma.
7.2.9 Diabase (DB)
Diabase is located in southeast of the deposit, striking at approximately N70°E, while in the northwest of the deposit striking near to N20°W. The predominant minerals comprising the rock type are augite, plagioclase, magnetite, ilmenite and quartz. The fine grained diabase has an age of 553 ±32 Ma, while the more granular margins are dated at 561 ±16 Ma. This unit represent the last magmatic event of the area. The dykes are set within shear/fault lateral geometries to (N70°E) and frontal geometries (N20°W), probably developed before the intrusions, in a compressional regime modified by an extensive regime.
7.2.10 Rhyolite (RIO)
Rhyolite dykes are grey-reddish in colour, porphyritic in texture within an aphanitic matrix. The majority are composed of K-feldspars, plagioclase, quartz, amphibole in a matrix cut by quartz veinlets. In drill holes the occurrence is rare or an ultimate phase.
7.3 TECTONIC SETTING
The Carajás region lies on the southeastern margin of Archean Amazon Craton, being limited in the east portion by the Neoproterozoic Araguaia fold belt and in the west by overlying Proterozoic sequences. To the north, it is surrounded by Proterozoic and Cenozoic sedimentary rocks of the Amazon Basin, and in the south is in contact with the Rio Maria granitoid-greenstone terrain.
The Salobo deposit is hosted by the Archean rocks of Salobo Group, which consists of a sequence of amphibolites, BIF, meta-graywake and quartzite. This sequence thickness ranges are from 300 m to 600 m, striking approximately N70°W, with subvertical dip. The Old Salobo and Young Salobo granites intrude rocks of the Salobo Group. The Old Salobo Granite is alkaline and metaluminous, within a planar granite whereas the Young Salobo Granite is an alkaline, metaluminous, anorogenic syenite sill.
33
The Salobo deposit is situated within the Cinzento strike-slip system, which post-dates the formation of the Itacaiúnas shear zone, and was developed under ductile-brittle to brittle conditions. The tectonic evolution of the Salobo area includes sinistral transpressive ductile deformation developed under upper amphibolite facies conditions, followed by sinistral transtesive ductile-brittle to brittle shear deformation (Figure 7.4) . The ductile deformation along the Itacaiúnas shear zone, that has affected the basement rocks and rocks of the Salobo Group, probably occurred between 2,850 Ma and 2,760 Ma. It produced widespread, subvertical, northwest-southeast schistosity, which affects all lithologies in the deposit, except the Young Salobo Granite and the diabase dykes. The transtensive deformation along the Cinzento strike-slip fault system reactivated old structures. This forms a subparellel ductile-brittle shear zone in the northern part of the deposit at about 2,550Ma and the brittle shear zone in the south (2,497 ±5Ma).
Figure 7.4
Structural Model of Salobo Mine (Schematic drawing not to scale)

7.4 SALOBO DEPOSIT MINERALIZATION
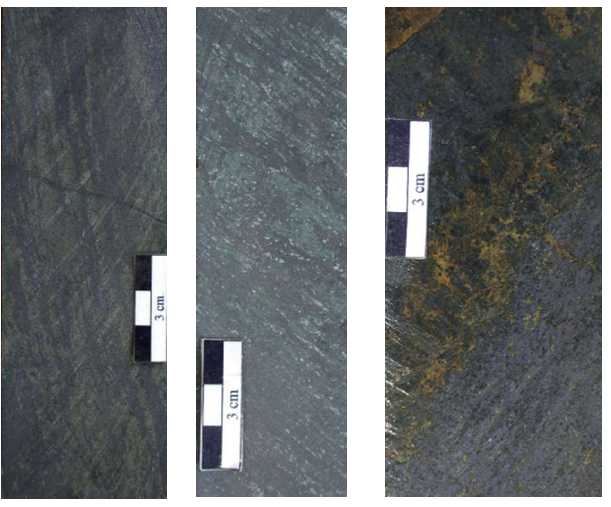
The sulphide mineralization consists of assemblages of magnetite-chalcopyrite-bornite and magnetite bornite- chalcocite. Variable amounts of molybdenite, cobaltite, safflorite, gold and silver, also exist hosted by rocks which contain magnetite, fayalite, grunerite, garnet, biotite, quartz and plagioclase. The mineralization is related to Fe-rich rocks and occurs in lenticular shears and hydrothermally altered zones. The chalcopyrite is associated with magnetite schists (XMT) rich in fayalite and magnetite (Figure 7.5) .
34
Figure 7.5
XMT Samples Showing Banded Structure Defined by Levels of Magnetite and Iron-rich Silicates
Native gold grains are observed locally, mainly occurring as inclusions in cobaltite and safflorite or interstitial to bornite. In addition, ilmenite, uraninite, allanite, fluorite and apatite occur as accessory minerals. The above textural relationships indicate that mineralization was firstly marked by an oxide stage, with a subsequent sulphide stage.
35
Figure 7.6
Massive Bornite Mineralization
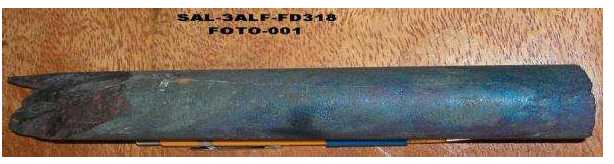
Figure 7.7
Chalcocite and Bornite Stockwork (a) style and Chalcopyrite and Bornite in Veins (b)
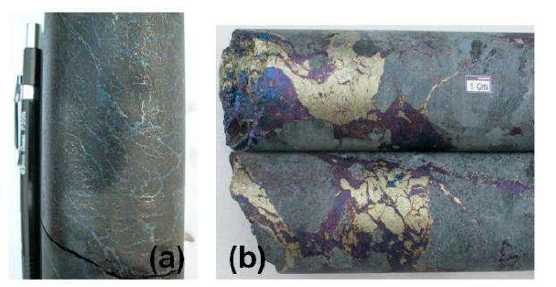
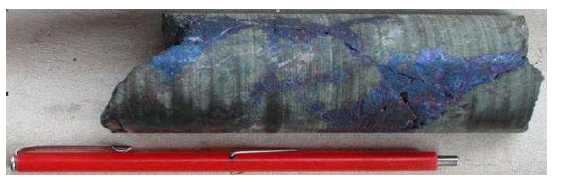
Figure 7.8
Bornite Vein
36
Molybdenite occurs interstitial to magnetite, and shows cleavages planes filled with chalcopyrite and bornite. In mylonitic samples, molybdenite forms kinked stringers with marked variable extinction, the result of in-lath recrystallization.
Magnetite occurs mainly as idiomorphic to sub-diomorphic grains, interstitial to silicate minerals or in fractures, or forms bands in mylonitic rocks.
The gangue minerals are almandine, garnet, grunerite and tourmaline, reflecting the intense iron-metasomatism. Minor amounts of fayalite and hastingsite are pseudomorphed by grunerite and magnetite. Tourmaline, with a dominant schorlitic composition occurs as idiomorphic crystals preferentially oriented parallel to mylonitic foliation, in association with biotite, garnet and grunerite.
Biotite sub-diomorphic crystals, commonly kinked, are associated with potassic alteration and spatially related to the copper-gold mineralization. In addition, uraninite and zircon inclusions may be locally abundant in biotite. Quartz shows undulose extinction, and is associated with biotite in ore samples or constitutes concordant veins within the host rocks.
Hydrothermal alteration appears to be much more important than previously recognized. The spatial distribution of hydrothermal alteration in the Salobo deposit shows that areas affected by intense irons and potassic-metasomatism host most of the iron oxide copper-gold ore.
In general, the massive magnetite associated with the mineralization is the core of the hydrothermal system and is surrounded by less intensely altered rocks. Within the massive magnetite body are small veins and irregular masses of secondary biotite. Garnet is completely replaced by magnetite, forming obvious pseudomorphs. Away from the massive magnetite, the magnetite gradually diminishes, giving way to biotite garnet schist and/or garnet grunerite schist. When not obscured by magnetite, biotite-garnet schist and garnet-grunerite schist are very distinctive and easily logged. Alkali-metasomatism is recognized in the amphibolite rocks of the Salobo deposit. It is expressed by weak sodium with intense superimposed potassium alteration (≤ 4.6 wt% of K2O).
Potassium–felsdpar, biotite and oligoclase are in the main alteration minerals. A significant increase in the FeO content (≤35 wt%) accompanied the potassium alteration in amphibolite and was marked by the replacement of calcic-amphibole (mostly magnesium-hornblende and hastingsite) by iron-magnesium amphibole (cummingtonite), and by formation of biotite and magnetite. The chemistry of the meta-graywackes at the deposit indicates that they also underwent significant iron and potassium alteration. Alteration assemblages are characterized by almandine, garnet, biotite and grunerite, subordinate tourmaline and minor magnetite. The richest ore zone, located in the central part of the deposit, corresponds to the most altered area.
37
7.4.1 Summary
The copper mineralization is hosted by iron formation and it consists of bornite-chalcocite and bornite-chalcopyrite disseminations in magnetite rich zones. The biotite schist (BDX) is the predominant mineralized host rock, with mineralization in the amphibolite schist (XMT) being subordinate. The ore occurs in pressure shadows of the minerals, fills microfractures of olivine, magnetite, and garnet or encloses them, fills fractures in the iron formations, quartzites and schists, and exists as inclusions as well. The tectonometamorphic processes were responsible for the copper redistribution into brittle structures. The copper content is > 0.8 % in magnetite-schist (XMT) and iron formation, while in gneisses and schists (BDX and DGRX) it is < 0.8 %. There is a positive correlation between copper and uranium content in the deposit.
Copper is broadly disseminated, with higher grades along the core of the axis with highest grades associated with massive magnetite replacement of a garnet-amphibolite-biotite schist. Gold occurs as fine particles closely associated with the sulphide mineralization. Gold grades are more unevenly distributed than copper.
38
8.0 DEPOSIT TYPES
8.1 INTRODUCTION
There appear to be two classes of copper–gold deposit in the Carajás region. The first group includes Cu–Au–(W–Bi–Sn) deposits which contain quartz veins, and may or may not have associated iron oxides and are genetically related to the cooling of Palaeoproterozoic (ca. 1.88 Ga) granites. The second group includes iron oxide Cu–Au (±U–rare earth elements) deposits (e.g., Salobo, Sossego, Cristalino, 118 and Igarapé Bahia) that may be related to more alkaline rocks, including the ca. 2.57 Ga alkaline complexes of the Carajás belt (e.g., Estrela Complex, Old Salobo Granite) and the base metal mineralization-associated 1.88 Ga intrusives. The second group of deposits are commonly referred to as iron oxide copper gold deposits (IOCG). These IOCG deposits, including Salobo, are characterized by:
Intense Fe metasomatism leading to the formation of fayalite, grunerite, and/or Fe oxides (magnetite and/or hematite).
Extensive carbonate alteration (mainly siderite), at least in the lower temperature deposits.
Iron-rich sediments associated with quartzite and gneisses.
Amphibolite facies metamorphism.
Massive, foliated and banded rocks with predominant magnetite, fayalite, grunerite, almandine and subordinate biotite.
Hydrothermal alteration with areas affected by intense iron and potash metasomatism hosting most of the iron oxide copper-gold ore.
Sulphur-deficient nature of the ore sulphides (chalcopyrite, bornite, and primary chalcocite).
Quartz-deficient nature of the gangue.
Extremely low rare earth element (REE) enrichment.
Enrichment in uranium and cobalt.
8.2 COMMON FEATURES AND CONTRASTS AMONG DEPOSITS OF THE IOCG GROUP
The major features of the four most important deposits in the Archean Fe-oxide Cu–Au group of the Itacaiúnas Belt are shown below in Table 8.1. They are all situated in brecciated lower volcanic to volcanosedimentary Itacaiúnas Supergroup rocks, although Igarapé Bahia–Alemão lies at the contact with the overlying Águas Claras Formation. Most are in greenschist facies rocks, although the host rocks at Salobo are amphibolite facies, presumably implying a deeper crustal level. The precise alteration mineralogy, particularly of the Fe-rich minerals, varies with crustal depth, but alteration at all deposits has involved Fe–K ±Na metasomatism with chloritization and carbonatization in the majority. Ore mineralogy is generally chalcopyrite–bornite with variable pyrite, and all deposits are characteristically enriched in As, Co, F (± Cl), light rare earth elements (LREE), Mo, P, Th and U as well as Cu and Au. Their brecciated host rocks, ore and alteration mineralogy and geochemistry are all typical of deposits of the Fe-oxide Cu–Au group (e.g., Hitzman et al., 1992).
39
Table 8.1
Comparison of the Archean Deposits of the IOCG Group from the Itacaiãnas Belt
| Deposit | Salobo | Igarapé Bahia- Alemão | Cristalino | Sossego-Sequerinho |
| Type | Fe-oxide Cu-Au (± Mo, Ag, U, REE) | Fe-oxide Cu-Au (±Mo, Ag, U, REE) | Fe-oxide Cu-Au (± Mo, Ag, U, REE) | Fe-oxide Cu-Au (±Mo, Ag, U, REE) |
| Age | ~2.57 Ga | ~2.57 Ga | ~2.5 Ga (?) | ~2.5 Ga (?) |
| Size (approx.) | 789 Mt | 219 Mt | > 500 Mt | 355 Mt |
| Grade (approx.) | 0.96 % Cu; 0.52 g/t Au | 1.4 % Cu; 0.86 g/t Au | 1.0 % Cu 0.3 g/t Au | 1.1% Cu 0.28 g/t Au |
| Host rocks | Brecciated volcano- sedimentary rocks of amphibolite facies | Brecciated volcano- sedimentary rocks of greenschist facies | Brecciated intermediate to felsic metavolcanic rocks and BIF of greenschist facies | Brecciated felsic and intermediate/mafic intrusive and felsic to mafic metavolcanic rocks of greenschist facies |
| Hydrothermalalteration | Chloritisation, K-Fe metasomatism | Chloritisation carbonation, K-Fe metasomatism | Chloritisation, carbonation, K-Fe- Na metasomatism | Biotite alteration, K- Fe metasomatism, carbonation |
| Sulphideassociation | Chalcopyrite + bornite ± chalcocite | Chalcopyrite ± bornite | Chalcopyrite ± pyrite, bravoite, millerite, vaesite | Chalcopyrite ± pyrite |
| Au-Ag | Native Au | Native Au (~12% Ag), hessite, muthmannite | Native Au (+ Ag) | Native Au |
| Fe-silicate/Fe-oxideassemblage | Fayalite, grunerite, magnetite | Grunerite, magnetite | Magnetite | Grunerite, magnetite |
| U-Th | Uraninite | Uraninite, uranofano, thorite, thorianite | Uraninite | Uraninite, thorite (?) |
| F-Cl | Fluorite | Fluorite, scapolite, ferropirosmalite | Fluorite | (?) |
| REE-P | Allanite, apatite | Allanite, parasite, bastnãsite, monazite, apatite | Allanite, apatite | Monazite, allanite, apatite (?) |
| Mo | Molybdenite | Molybdenite | Molybdenite | Molybdenite |
| As-Co | Co-pentlandite, cobaltite, safflorite | Cobaltite | Cobaltite | (?) |
40
| Deposit | Salobo | Igarapé Bahia- Alemão | Cristalino | Sossego-Sequerinho |
| GangueMinerals | Biotite, almandine, quartz, chlorite, greenalite | Siderite, biotite, chlorite, stilpnomelane, tourmaline | Biotite, microcline, albite, scapolite, sericite, quartz | Biotite, amphibole, epidote, quartz |
| References | Lindenmayer, 1990, Figueiredo et al., 1993, Requia & Xavier, 1995 & Ronzé et al., 2000 | Tallarico et al. (2005) | Huhn et al. (1999a) | Fanton et al., 2001 & Marschik et al., 2003 |
Grainger et al., 2006.
41
9.0 EXPLORATION
The discovery of the Salobo copper deposit occurred during a systematic program of geochemical, geophysical and geological exploration in the Carajás region, initiated by CVRD/DOCEGEO in 1974.
In 1977 a program of detailed geological and geochemical work explored magnetic anomalies existing in the basin of Igarapé Salobo (Salobo stream). Anomalies of up to 2,700 ppm copper were detected in stream sediments collected from tributaries of Igarapé Salobo. These anomalies lead to the development of detailed work in the area, involving geological, geochemical and geophysical prospecting. In 1978, exploration revealed the presence of copper sulphides associated with magnetic schist and the first phase of several drilling programs was initiated.
A detailed description of the history, including exploration and development of Salobo, is presented in Section 6.0.
The primary method employed in the exploration and evaluation of the Salobo deposit is diamond core drilling, details of which are presented in Section 10.0.
42
10.0 DRILLING
10.1 INTRODUCTION
The geochemical and geophysical anomalies identified at Salobo were initially tested by nine exploratory drill holes by DOCEGEO in 1978, including a mineralized interval of 140 m at 0.45% Cu. A successive drilling campaign (the first of five major campaigns), to follow-up this promising mineralization, was conducted on a 400 m by 200 m drill grid, subsequently reduced to 200 m by 200 m and then to 200 m by 100 m. This initial campaign completed 65 diamond drill holes for 29,322 m between March, 1978 and May, 1983.
The second campaign (January, 1986 to June, 1987) was jointly undertaken by CVRD/GICOR that reduced the grid to 100 m by 100 m in the core of the deposit with further drilling undertaken in the southeast of the deposit from the adit (G-3). This phase completed 9,033 m of diamond drilling from 60 drill holes.
In 1993, and to accompany an economic feasibility study by SMSA, a third campaign was initiated. The primary objective was to investigate the best probable location in the deposit in which to commence mining and to optimize the first five years of production as well as investigate mineralized continuity at depth. Between July, 1993 and February, 1994 a total of 65 drill holes had been completed for 14,585 m.
In 1997, the fourth drilling campaign commenced, accounting for 25,491 m from 88 holes.
The fifth drilling campaign completed 190 drill holes for 66,243 m in 2002 and a further 2,047 m in 2003 that brought the grand total for the Salobo deposit to almost 147,000 m of geological drilling.
By the end of the campaigns in 2003, some areas were drilled a little more densely (50 m by 50 m), including the area around the adit.
The surface drilling was initiated with a diameter of HQ and the minimum diameters were BX and BQ. The underground drilling was carried throughout with BX diameter. The drilling system used included the traditional and wireline methods. Down hole surveys were carried with the R-F DDI (reflex fotobor dip and direction pointer), Fotobor DDI and Maxbor units were used to prevent errors in azimuth readings due to the influence of natural magnetic properties within the rocks. Core recoveries of 80% in weathered rock and 90% in fresh rock were achieved by the drilling companies during the campaigns.
The drill hole types are summarized in Table 10.1 and their locations are shown in Figure 10.1. The majority of the core recovered is NQ size (47.1 mm) with a lesser amount of (Imperial) BQ size (31.5 mm).
43
Table 10.1
Drill Hole Types
| Type (ID) | Description |
| Geological (FD) | Geological exploratory drill hole |
| Geotechnical (FG) | Geotechnical exploratory drill hole |
Figure 10.1
Drill Hole Locations
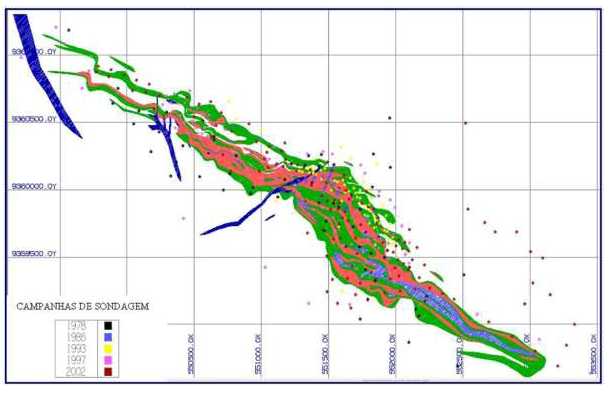
Since the commencement of mining, blast hole cuttings have been sampled for grade control and short term mine planning purposes.
Diamond drill hole (DDH) core makes up the majority sample type for geological modelling and mineral resource estimation at Salobo. Blast holes (BH) have been drilled since 2009 but are used only for short term planning.
The sample length used at Salobo is generally 1.0 m in mineralized zones, but may be modified according to the ore type, sector and/or weathering.
Drill hole orientation is variable from vertical to south-southwest orientation with dips ranging between 60° to 70°. A set of underground holes drilled from the adit were also completed. One campaign included drilling oriented in a north-northeast bearing with dips varying from 60° to 70° as can be seen in Figure 10.2.
44
Figure 10.2
Drill Hole Distribution (Section 3,000 SE)
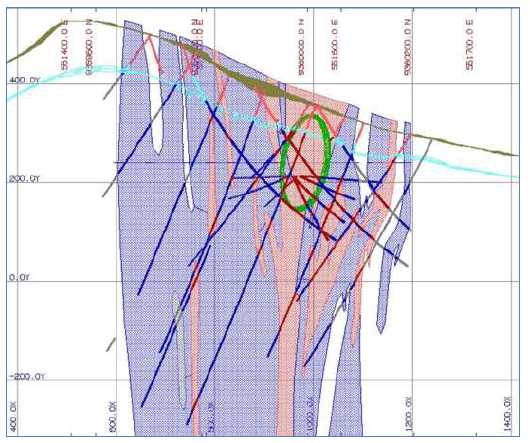
10.1.1 Annual Diamond Drilling
Table 10.2 shows a summary of diamond drilling at Salobo between 1978 and 2003.
Table 10.2
Summary of Diamond Drilling at Salobo
| Period | Type (ID) | Drill hole ID | Length (m) | Percentage |
| 1978 | Geological (FD) | SAL-2ALF-FD001 to 065 | 29,275 | 18.98 |
| 1986 | Geological (FD) | SAL-SALF-FD066 to 125 | 9,033 | 5.86 |
| 1993 | Geological (FD) | SAL-3ALF-FD126 to 189 | 14,585 | 9.45 |
| 1997 | Geological (FD) | SAL-3ALF-FD190 to 277 | 25,491 | 16.52 |
| 2002 | Geological (FD) | SAL-3ALF-FD278 to 410 | 66,243 | 42.94 |
| 2003 | Geological (FD) | SAL-3ALF-FD411 to 416 | 2,047 | 1.33 |
| 1997 | Geotechnical (FG) | SAL-3ALF-FG001 to 007 | 3,847 | 2.49 |
| 2003 | Geotechnical (FG) | SAL-3ALF-FG008 to 013 | 3,743 | 2.43 |
| Total length of geological drilling | 146,675 | 95.08 | ||
| Total length of geotechnical drilling | 7,591 | 4.92 | ||
| Total length of exploration drilling | 154,266 | 100.00 | ||
45
One additional geotechnical drill hole was completed in 2004 (SAL-3ALF-FG014) but was used for logging and check purposes only. No samples were taken for analysis.
No exploratory drilling has been completed at Salobo since 2004.
10.2 DRILLING PROCEDURES
Drill hole collar locations are determined with a total station. Collar verification is completed by plotting hole locations on plan and in cross-section and comparing with topographic surface. Down hole surveys are verified against the original survey data and on cross-section plots.
10.2.1 Core Handling, and Storage
The diamond drill core was collected and placed in wooden boxes and delivered by the drilling contractor to the core logging/storage area where geological and geotechnical logging was carried out. The wooden core boxes were marked with wood blocks and metal plates (Figure 10.3) . Before logging, all of the core boxes were photographed.
At the core logging facility (Figure 10.4), core recovery and physical properties were measured and recorded by Vale technicians and geologists. Geological logs were prepared, and sample intervals were marked. Sample intervals average 1.0 m in mineralization and between 2.0 m and 4.0 m in barren zones. Sample lengths vary from these standards to honour significant geological boundaries. Core reception, handling and logging follows Vale operational procedures, guidelines and standards.
After logging, the mineralized core was cut in half using an electric diamond saw, where one half of the core was retained for further studies and audit purposes, and the other half was submitted for sample preparation and analysis.
Facilities for drill core storage consist of several purpose-built warehouses located at the project site. Pulps were stored in paper envelopes grouped in plastic bags, while the coarse rejects were stored in plastic bags. Both were organized well and the entire system was catalogued.
Figure 10.5 shows an example of the paper storage envelope used for pulps, in this case a pulp reject, and the bar code labelling used.
46
Figure 10.3
Example of DDH Core Labelling (SAL-3ALF-FG014) (left) and Drill Core Storage (right)
![]()
Figure 10.4
Core Logging Facility (left) and Core Storage Catalogue System (right)
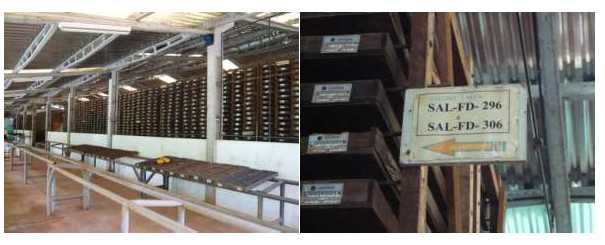
Figure 10.5
Paper Envelope Containing Pulp Reject
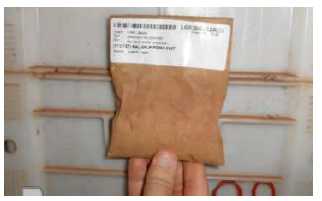
47
10.2.2 Core Recovery
Based on the recovery data from drill holes SAL-3ALF-FD 278 to 410 (2002 and 2003), core recovery averaged 97.6% .
10.2.3 Core Logging
Logging was carried out by Vale geologists using customized log sheets for drill core logging. The information was then entered into the electronic database. The geologists record the major code for lithology, alteration, mineralization, and textural characteristic of the interval every 1.0 m, with 10 cm as the definition unit. Geological contacts were logged with higher precision.
In addition to a general description including core recovery, color, texture, mineralogy, and rock type, geologists also specify mineralized intervals and estimate the copper grade for later comparison and assay data validation.
Geotechnical logging (and sampling) was performed at Salobo on a continual basis and included the determination of rock quality designation (RQD) (PRO 004436_Coleta de medida de RQD.doc).
The results of geotechnical logging are stored in the GEM drill hole database.
Table 10.3 shows the key codes for geotechnical information.
Table 10.3
Geotechnical Logging Codes
| Geotechnical Code | Geotechnical Resistance | Degree of Alteration | |||
| Weathering Number | Description | Resistance | Description | Weathering Degree | Description |
| 0 | Covering | R0 | Very Highly Weak | W1 | Fresh Rock |
| 1 | Soil | R1 | Highly Weak | W2 | Slightly Weathered |
| 2 | Mottled Zone | R2 | Weak | W3 | Moderately Weathered |
| 3 | Friable Saprolite | R3 | Moderately Resistant | W4 | Highly Weathered |
| 4 | Saprolite | R4 | Resistant | W5 | Completely Weathered |
| 5 | Weathered Rock | R5 | Highly Resistant | W6 | Residual Soil |
| 6 | Fresh Rock | R6 | Very Highly Resistant | ||
| 7 | Laterite | ||||
10.2.4 Determination of Specific Gravity
Salobo Mine personnel routinely measured the specific gravity (SG) of core samples. Measurements are taken in both mineralized and barren units according to standard Vale procedures (PRO 004430_ensaios de densidade- rocha sã document).
48
SG was determined by cleaning the sample, weighing it when the surface of the sample is dry and then weighing it in water. The fresh rock samples were not dried prior to the procedure, because of the lack of porosity and permeability in bedrock. SG is then estimated as follows:
SG = xA/ (xA– xW) where:
xA= weight of core in air
xW= weight of core completely submerged in water
At Salobo, SG was measured on approximately 79,000 samples collected across the entire deposit, the locations of drill holes used for density determinations along with the SG values grouped into bins are shown in Figure 10.6. Due to variations in porosity and permeability, the difference between samples taken in the weathered waste rock and those collected in bedrock was recorded.
Figure 10.6
Density Distribution
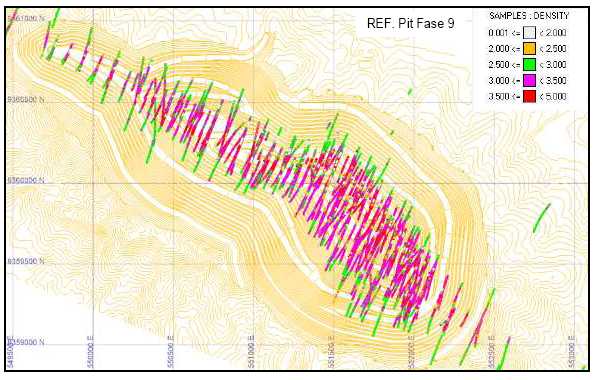
Density determinations for the different rock types according to the geological model are summarized in Table 10.4.
49
Table 10.4
Density (SG) by Rock Type
| Description | Main Lithological Types | Assay Intervals | ||
| LITHO CODE | Litho_NUMB | Number of Samples | Density Average (g/cm3) | |
| Cover | COB | 5 | 31 | 2.09 |
| Biotite-Granade-Schist | BDX | 10 | 36,930 | 3.28 |
| Diabase | DB | 20 | 1,319 | 2.99 |
| Granade-Grunerite-Schist | DGRX | 30 | 5,979 | 3.47 |
| Granitoid | GM | 40 | 2,162 | 2.75 |
| Riolite | RIO | 45 | 4 | 2.80 |
| Granite | GR | 50 | 134 | 2.72 |
| Hidrotermalite | HD | 60 | 3,571 | 2.98 |
| Clorite-Schist | CX | 65 | 44 | 2.95 |
| Milonite | ML | 70 | 5,826 | 2.90 |
| Metabasic | MTB | 80 | 286 | 3.04 |
| Quartz-Milonite | QML | 90 | 3,711 | 2.86 |
| Quartzite | QZ | 90 | 29 | 2.66 |
| Magnetic Schist | XMT | 110 | 12,041 | 3.75 |
| Saprolite | SP | SP | 4,876 | 2.34 |
| Semi-Weathered Rock | ZT | ZT | 2,303 | 3.00 |
| Total | 79,245 | 3.22 | ||
10.2.5 Procedural Reviews
Regular reviews and audits of the drilling procedures are done both by Salobo personnel and via independent audits.
10.3 MICON OPINION
At the time of the personal inspection, no core drilling was being undertaken so it was not possible to review the process of core drilling and sampling. The last geological diamond drill hole was completed in 2003. However, based on review of various reports and audits, Micon considers that the procedures used for drilling (and sampling) conducted on the project are acceptable for mineral resource and mineral reserve modelling. The CVRD drilling data that represents a majority of the data is complete and was conducted using standard exploration techniques. Minorco similarly concluded in their 1998 report that the sampling procedures used by CVRD and predecessor companies, which represent around half of the drilling forming the database, have provided representative samples of the deposit.
50
11.0 SAMPLE PREPARATION, ANALYSES AND SECURITY
11.1 SAMPLE PREPARATION
Core is delivered by the drilling contractor to the core logging/storage area. After the core is photographed and logged, sample intervals are marked; the sample intervals average 1.0 m in mineralized zones and two or four meters in barren zones. Sample lengths may vary depending on geological and lithological/structural criteria (geologic boundaries, lithological/mineralogical changes, faults and shear zones, etc.) The core is cut by a diamond saw and one half is submitted for sample preparation and assaying while the other half is kept in the core storage facility for further reference.
The sampling procedure at Salobo is summarized as follows:
Cutting: drill core cut in half using a diamond saw, packaged, labelled and sent for mechanical preparation. Samples labelled with bar code system.
Drying: samples are dried in an electric oven at 105°C.
Primary Crushing: the entire sample is crushed to approximately 95% <4 mm size; granulometric test carried to check particle size on 1 in 20 samples.
Sample homogenization.
Splitting: sample passed through a Jones splitter; one half collected for analysis and the other stored as a coarse reject.
Pulverization: sample pulverized to 95% <0.105 mm.
Sample homogenization.
Splitting: using a rotary splitter three samples of 100 g collected, one for each laboratory.
The remaining materials stored as pulp reject.
The samples packed in a paper envelopes, labelled with bar code, and sent to the chemical laboratory for assay.
The sample preparation flowchart is illustrated in Figure 11.1.
51
Figure 11.1
Sample Preparation Flowchart
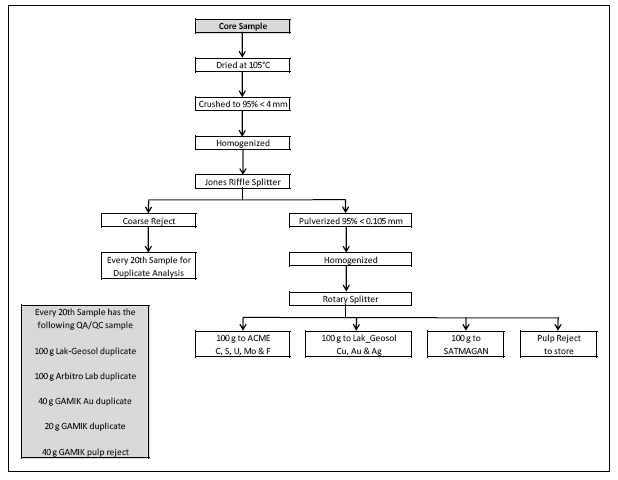
11.2 SAMPLE ANALYSIS
11.2.1 Laboratories Used
Routine chemical analysis is by Atomic Absorption (AA) for copper, silver and fluorite. Gold is analysed by fire assay (FA) methods. According to Vale personnel, the laboratories used for sample analysis have changed over time. Table 11.1 summarizes the primary laboratories used for chemical analysis and the main analysis methods.
11.2.2 Sample Receipt and Preparation
Upon receipt of samples, the preparation laboratory personnel referenced (scanned) the bar code label attached to the sample bag. The weight of sample was electronically recorded together with information such as date, time, equipment used and operator name. The scanning process allowed for complete traceability of the sample through the entire laboratory process.
52
Table 11.1
Summary of Laboratories Used for Assay Analysis for Salobo
| Campaign | No. of Samples | Laboratory | Cu Method | Au Method |
| DOCEGEO (1978 - 1981) | 28,582 | DG, SU | 0.5 g AA | 10 g AA |
| CVRD (1985 - 1987) | 8,891 | DG, PP | 0.5 g AA | 10 g AA |
| SML (1993 - 1994) | 13,281 | MMV | 0.5 g AA | 100 g AA |
| SMSA (1997) | 24,824 | MMV | 0.5 g AA | 100 g AA |
| CVRD (2002 - 2003) | 37,358 | Geosol | AATM | Au FA 20 |
| Total | 112,935 |
DG – DOCEGEO, Belém.
SU – SUTEC, Santa Luzia.
PP – Lab. Planta Piloto do Salobo.
MMV – Mineração Morro Velho.
AATM – Atomic Absorption & Fire Assay 20 g.
The use of bar codes and scanning at several stages along the sample preparation and analysis process is often referred to a Laboratory Information Management System (LIMS), sometimes to a Laboratory Information System (LIS) or Laboratory Management System (LMS). This structure is a software-based laboratory and information management system that offers a set of key features that support a modern and efficient operation. Key features include, but are not limited to, workflow and data tracking support, flexible architecture, and smart data exchange interfaces, which fully support its use in regulated environments.
11.2.3 Assay Methodology
The samples (a 5g aliquot) were routinely analyzed for Cu, Ag and Fe by atomic absorption spectrometry (AAS). Gold was determined by a lead collection fire assay/AAS technique on a 30g sample. In the early stages of the exploration program Pd, Pt, Ni, Mo, and U were also analyzed but later were excluded from the analytical package.
11.3 SAMPLE SECURITY
All drill core was brought from the drill site at the end of shift, and stored in a purpose built logging and storage facility. Core undergoes a standard logging procedure before being sawn at the adjacent diamond saw building. Mineralized sample boxes are returned to the storage facility where they are kept under lock and key. The core storage and logging facility is kept locked when unoccupied. Unshipped samples are also stored in a secure facility at the same location.
11.4 QUALITY ASSURANCE AND QUALITY CONTROL
The Quality Assurance and Quality Control (QA/QC) program implemented for Salobo is complex due the implementation of different schemes of QA over a prolonged period of time.
53
Lakefield was used for the routine analysis of Cu, Au and Ag, while Acme analysed for Mo, U, F, S and C. The Gamik laboratory was used as a secondary laboratory to check the results obtained from the primary laboratory (Lakefield and/or Acme). Initially, SMSA allowed the laboratory the responsibility on the insertion of standards, blanks and duplicates samples. Consequently, in the absence of robust QA/QC data, and in an attempt to validate the results related to campaigns before 2002, a total of 51,768 of the original 75,577 samples drilled prior to 2002 were re-assayed to corroborate the original results. The re-analysis considered pulps and coarse rejects materials when possible. However, they are not identified separately as repeats or duplicate in order to evaluate precision and sample preparation respectively. Based on the results obtained, Vale applied an adjustment factor to original sample grades.
For the 2002 to 2003 samples, SMSA produced internal standards, but they were only available at the end of drilling program. Because of this, a special lot of 1,500 samples from the 2002 to 2003 drilling program were sent for reanalysis. A total of 76 aliquots were inserted in blind form for both standards B5B and B3E3C3 (Salobo CMR) of the project.
The QC protocol at Salobo operations includes the following control samples:
In-house standard reference materials inserted at about 2.5% frequency.
Coarse preparation blanks inserted at approximately 2.5% frequency.
Pulp duplicates carried out by the primary laboratory at about 5% frequency.
External assay checks by the secondary laboratory on up to 5% of randomly selected original pulps analyzed previously by the primary laboratory.
11.4.1 Standards
The certified reference materials used for Gamik to monitoring the Cu and Au assays are presented in Table 11.2.
Table 11.2
Copper and Gold Standards Used by GAMIK at Salobo
| Material | Standard | Cu % | Au ppm | ||
| Mean | Std Dev | Mean | Std Dev | ||
| Sulphides | GBW07237 | 0.71 | 0.039 | ||
| GBW07233 | 1.15 | 0.061 | |||
| GBW07234 | 0.19 | 0.020 | |||
| NBS330 | 0.84 | 0.042 | |||
| SNS331 | 0.09 | 0.007 | |||
| B5B | 0.29 | 0.006 | 0.11 | 0.001 | |
| B3E3C3 | 2.51 | 0.017 | 1.61 | 0.020 | |
54
The standards GBW07233, GBW07234, GBW07237, NBS330 and NBS331 correspond to international standards used by Vale, while the standards B5B and B3E3C3 correspond to internal standards made from material from the project, but only used for 2002 to 2003 samples. In-house standard reference material samples used at Salobo (a total of nine) where derived from both the sulphide and oxide mineralization and incorporate a significant spread in the copper and gold grades. The recommended values for standard reference material samples were established from a set of analytical results provided by three laboratories (the former Bondar Clegg laboratory, GAMIK and SGS Lakefield Geosol). Each laboratory analyzed 10 aliquots of each reference material sample.
The standards B5B and B3E3C3 were used as control samples for the 1,500 samples from the 2002 to 2003 drilling program.
The analysis of the standard samples carried out for copper show excellent accuracy and precision. According to the summary shown in Table 11.3, averaged HARD values for copper are <5%, indicating an excellent precision. Ideally, 90% of the sample should have a half absolute relative difference or HARD (Shaw, 1997) value <10%. The cumulative HARD graphs show that 90% of samples have HARD values <5% in all cases except for standard B3E3C3 where 90% of population have HARD values <10% indicating a good precision. According to averaged HARD values, no obvious bias was observed.
The standard analysis carried out for gold show an acceptable precision with HARD values < 10%. According to averaged HRD values, no obvious bias was observed. The results are expected due to mineralizing pattern of gold, which may occur as nuggets or as fine grains.
Table 11.3
Standards Analysis at the Salobo Project
| Element | Standard | No. of Samples | Avg_HARD (%) | Avg_HRD (%) | Bias |
Cu | GBW07237 | 247 | 1.01 | -0.09 | -1.78 % |
| GBW07233 | 391 | 0.69 | 0.41 | 0.83 % | |
| GBW07234 | 13 | 1.01 | 0.81 | 1.66 % | |
| NBS330 | 14 | 0.63 | 0.46 | 0.94 % | |
| NBS331 | 9 | 1.40 | -0.21 | -0.37 % | |
| B3E3C3 | 37 | 3.39 | 0.16 | 0.85 % | |
| B5B | 39 | 2.61 | 0.97 | 2.16 % | |
| Au | B3E3C3 | 34 | 2.88 | -1.12 | -1.59 ppm |
| B5B | 38 | 7.48 | -1.55 | -1.22 ppm |
11.4.2 Blanks
Blanks samples are materials with an expected grade of zero, and are used to detect contamination from sample preparation equipment, laboratory hardware, or reagents. The analysis carried out indicates limited anomalous values.
55
According to Vale geologists, when anomalous values of blanks occur a re-analysis with the samples and standards were done.
Blank sample data for Cu and Au for the 2002 to 2003 campaign (drill holes FD278 to FD410) has been reviewed. The analysis carried out indicates limited anomalous values. An example of this analysis is shown in Figure 11.2.
Figure 11.2
Blanks Analysis Carried out for Copper Grades

11.4.3 Duplicates
Different methods for duplicates have been carried out. They include:
Pulp duplicates, part of the internal QA program of Lakefield.
Inter-laboratory duplicates, part of the Salobo QA program. The majority of the pulp duplicates were sent as a special batch to a secondary laboratory (GAMIK) at the end of the program.
A set of 1,500 samples from 2002 to 2003 drilling program was re-analysed to confirm the quality of the primary laboratory. Included standards.
The results are summarized in Table 11.4. For Cu, the results demonstrate acceptable precision with average HARD values between 3% and 7%. This value is consistent with precision observed at 83.4% where values >20% indicate moderate precision. The Au results indicate marginal to poor precision with average HARD values >10%. This is consistent with precision observed at 83.4% where values are >30%, although this may be expected due to its mineralizing pattern (nugget or fines) and therefore the levels of precision observed may be considered as acceptable.
56
Bias is measured in terms of averaged HRD values. The results are summarized in Table 11.4 and indicate no obvious bias for copper, while for gold, a slightly negative bias was detected.
Table 11.4
Summary of Precision for Duplicates Analysis
| Element | Laboratories | Type | No. Data | Avg_HARD (%) | Avg_HRD (%) | Avg. Bias | Precision (at 83.4%) |
| Cu | Lakefield vs Lakefield | blind | 515 | 7.37 | 0.06 | 0.01 | 28.7 |
| Lakefield vs Gamik | blind | 724 | 6.49 | 0.49 | 0.02 | 24.4 | |
| Lakefield vs Lakefield | non blind | 429 | 3.16 | -1.00 | -0.01 | 21.2 | |
| Lakefield vs Gamik | non blind | 667 | 6.32 | 1.28 | 0.00 | 23.7 | |
| Lakefield vs Gamik | spec lot | 1502 | 6.47 | -0.46 | 0.01 | 28.7 | |
| Au | Lakefield vs Lakefield | blind | 515 | 16.98 | 5.97 | -0.01 | 46.9 |
| Lakefield vs Gamik | blind | 537 | 15.92 | -9.72 | -0.05 | 41.3 | |
| Lakefield vs Lakefield | non blind | 367 | 8.45 | -0.68 | 0.00 | 32.2 | |
| Lakefield vs Gamik | non blind | 355 | 21.46 | -17.92 | -0.09 | 46.2 | |
| Lakefield vs Gamik | spec lot | 1417 | 13.88 | -2.31 | -0.04 | 42.8 |
11.4.4 Re-assay
A total of 51,768 of the original 75,577 samples drilled prior to 2002 were re-assayed to evaluate the original results.
Golder (2010) compared original versus re-assayed copper data to characterize the correlation between both sets of data. Scatter plots shown in Figure 11.3 indicates that the correlation of 0.978 is excellent.
57
Figure 11.3
CuT Scatter Plot Comparing Original and Re-Assayed Data
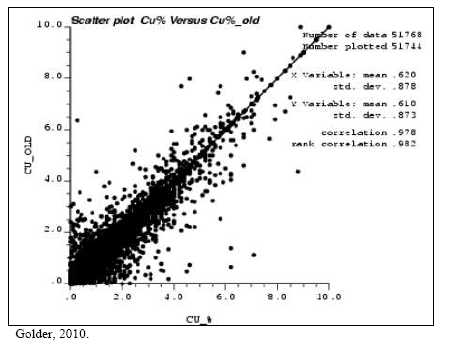
Also a comparison using quantile-quantile graphs was completed, see Figure 11.4 (for simplification each point in the graph represents one hundred points). Linear and logarithmic graphs indicate that both data sets are almost identical. A slight bias is observed at copper grades lower than 0.07%, representing 7% of data. The exercise confirmed that the impact of the re-assays data set is not significant.
58
Figure 11.4
CuT Quantile-Quantile Graphs Comparing Original and Re-Assay Data Distributions
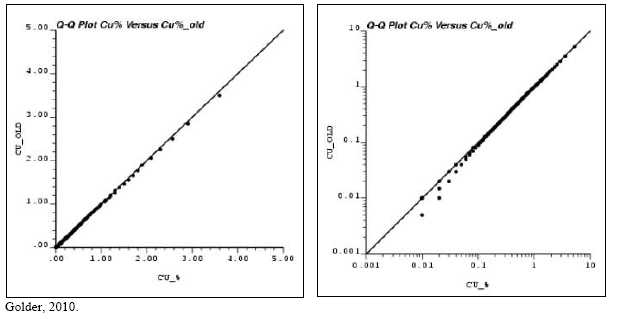
Finally, re-assays were compared with old copper data set considering them as duplicates. The average HARD value found is about 10% indicating good precision. The average HRD value found is about 5% indicating slight bias between both data sets.
In Golder’s opinion it is unnecessary to apply a correction factor to copper data due the low bias (about 2%). Also the correction implies a data manipulation which should be avoided. However, Vale concluded that the external assay check review revealed bias for copper and gold assay results obtained by Nomos and GAMIK laboratories. Prior to use in block modelling and mineral resource estimation, the copper and gold analytical data were adjusted as appropriate (Tables 11.5 and 11.6, respectively).
Table 11.5
Adjustment for Copper Assays for pre-2002 Drilling Programs
| Campaign | Holes | Number | Outliers | Interval | Regression | Corr Coef | |
| DOCEGEO | D-001 to 065 | 10,833 | 126 | 1% | >0.01 | Cu adj=(1.029*Cu)+0.007 | 0.98 |
| CVRD | D-066 to 125 | 3,609 | 113 | 3% | >0.02 | Cu adj=(1.068*Cu)-0.02 | 0.98 |
| SML | D-126 to 189 | 400 | 46 | 12% | >0.01 | Cu adj=(0.98*Cu)+0.023 | 0.97 |
| SMSA | D-190 to 277 | 12,453 | 489 | 4% | >0.01 | Cu adj=(1.014*Cu)-0.005 | 0.97 |
| LKGEOSOL | D-278 to 410 | 1,440 | 33 | 2% | >0.01 | Cu adj2=(0.997*Cuadj)-0.003 | 0.99 |
59
Table 11.6
Adjustment for Gold Assays for pre-2002 Drilling Programs
| Campaign | Holes | Number | Outliers | Interval | Regression | Corr Coef | |
| DOCEGEO +CVRD+SML | D-001 to 189 | 26,760 | 522 | 2% | >0.01 | Au adj=(1.027-Au)+0.008 | 0.94 |
| SMSA | D-190 to 277 | 11,519 | 257 | 2% | >0.01 | Au adj=(1.018-Au)+0.005 | 0.85 |
11.5 MICON OPINION
Micon believes that the CVRD quality control program at Salobo had some issues (as noted by AMEC) but that overall the laboratory analytical results were accurate enough to meet mining industry standards. The more recent work (2002 onwards) is of a higher standard and the re-evaluation of 51,768 of the original 75,577 samples drilled prior to 2002 has gone some way to mitigate any shortcomings and is commendable. However, the decision by Vale to adjust these data (Tables 11.5 and 11.6) in light of the results is considered unnecessary by Micon.
60
12.0 DATA VERIFICATION
12.1 SITE VISIT AND INDEPENDENT SAMPLING
In order to prepare this Technical Report, Micon completed a visit to Vale’s South Atlantic Base Metal Operation office (Directoria de Operações de Metais Básicos Atlântico Sul) in Carajás, Pará State, in northern Brazil and to the Salobo open pit mine located approximately 80 km northwest of Carajás.
The site visit was performed by Micon’s technical staff from 7 – 9 February, 2013. Micon’s technical team comprised Jason Ché Osmond (Senior Geologist), Barnard Foo (Senior Mining Engineer), James Turner (Senior Metallurgist), and Christopher Jacobs (Mineral Economist). Also present during the visit were representatives from Silver Wheaton, Messrs. Samuel Mah (mining engineer) and Maurice Tagami (metallurgist).
During the 2½ days of site visit, the technical team discussed, gathered information and evaluated the appropriateness of the data, methodologies and assumptions used to estimate the mineral resources and reserves, metallurgical recoveries, mine design, infrastructure and cost estimates with Vale’s senior mine site and technical staff.
The technical team also made a visit to the Salobo Mine site to see first-hand the Salobo open pit operation, process plant, and infrastructure to support the production plan, as well as taking the opportunity to discuss operational aspects of the mine with the Salobo Mine’s operation management team. Among Vale’s senior technical and operational personnel taking part in the visit were:
- Roberto Albuquerque e Silva, General Manager of Copper Mine Planning and Quality Control
- Paulo Henrique de Godoy, General Manager of Salobo Mine Operation
- Cássio Diedrich, Principal Geostatistician/Mining Engineer
- Tobias Cabral Carvalho Machado de Andrade, Chemical Engineer
- Luis Clauzio de Renno Machado, Senior Engineer
- Anderson Miranda Mendonça, Process Engineer
- Wellington Paula, Long Term Mine Planning Engineer
- Fabrício Araújo Silva, Geotechnical Engineer
Micon wishes to acknowledge the helpful cooperation of all Vale’s staff during the visit.
Detailed discussions were held with specialists in relevant disciplines covering geological, geotechnical, resource estimation, reserves and mine planning; processing, metallurgical testing and recoveries; site infrastructure; and project capital and operating cost estimates.
Micon did not collect any verification samples as the Salobo Mine is already into a ramp-up production phase and has produced a saleable concentrate product. Therefore, the presence of copper and gold mineralization is not in doubt.
61
12.2 RECEIPT OF DATA
Following receipt of assays from the laboratory, results are merged with the drill logs electronically to prevent transcription errors. The geologist reviews the results and compares them to the visual copper grade estimate made at the time of logging. The logging geologist may request re-assays on this basis but must review the log before it is released to the GEMS database for use in interpretation and modelling. A response to the database coordinator is required, indicating overall comments of data vs. estimates, as well as any samples to be re-assayed. The name of the geologist is then entered into the QA/QC Checker field of the Header.
The procedure for the receipt of assay results can be found in the Salobo standard procedure (PRO 004444_Recebimento de resultados de análises químicas.doc).
12.3 DATABASE
The drill hole database used for mineral resource estimation is stored in the GEMS database. This is a secure database that contains holes drilled by Vale on the Salobo project.
Since August, 2009 the evaluation drilling and mine information are integrated on a single database in the SQL platform (GEMS SQL Server), this innovation allows geologists and mine engineers more security and the end of needless copies of the database, user access permitting control is another key item.
The most important tables in the database are: Header (drill hole collar information), Survey (down-hole deviations), Assays, Lithology, Geotec_oxi (Weathering, oxidation and geotechnical classification of materials), Oxide (Oxidation codes), Alteration and RQD. Drill hole collar survey was checked by plotting drill hole locations on plan and cross-section, and comparing these with topographic elevations. Collar coordinates were adjusted using correction factors where necessary.
Other tables in the database were validated as follows: Geologic codes, such as lithology, that are stored as both numeric codes and alpha-numeric descriptors, were cross checked for consistency. Discrepancies between the two were edited.
Oxidation and weathering codes are sequential based on vertical position. Deviations from this vertical sequence were checked and edited.
For assay intervals with duplicate assays, all intervals grading either >0.1% Cu or >0.1 g/t Au, where the difference between the original and duplicate assay is >10%, were checked and edited as necessary. Density values stored in the GEMS data base are derived from measurements made on half-core samples.
Drill hole collar, survey, assay and lithology data is collated from the various sources. Analytical data is provided digitally by the assay laboratories. Lithology and alteration data is entered into spreadsheets by the field geologists and checked by the database manager. Standard codes are used for the description of weathering, lithology, alteration and mineralization. Assay results are checked for compatibility with the logging codes and are also checked against hard copy data.
62
The primary database comprises Excel spreadsheets containing fifty drill holes per file. Standard import procedures from Excel to GEMS are used to transfer data. Special symbols (such as <, >, NC, NS, IS, NE) are standardized and coded as appropriate within GEMS.
A summary table within GEMS is validated internally for basic errors such as intervals out of sequence, overlaps, missed intervals, different lengths for different drill holes in different tables, assay data out of detection limits, undefined codes. Corrections are made to the Excel data base and this is re-imported to GEMS.
During the import onto GEMS database following validation are done:
- FORMAT:INDEX COLM
- NO MATCHING INDEX
- DUPLICATE KEY FIELD VALUE
- LIMIT - below minimum
- LIMIT - Above maximum
Using the GEMS validation routines it is possible to find:
- Zero length intervals
- No interval defined
- Out of sequence interval
- Negative length intervals
- TO value > than hole length
- FROM or TO value not entered
The tables used in database are summarized in Tables 12.1, 12.2 and 12.3.
Table 12.1
Quality Control Database Description
| Table | Description |
| CQBRPROJ | Project Blanks |
| CQPDPROJ | Project Standards |
| CQDPPROJ | Primary Laboratory Duplicates |
| CQDPOXI | Primary Laboratory Duplicates (oxides) |
63
Table 12.2
Drilling Database Description
| Table | Description |
| ALTERACAO | Stored data related to the percentage of hydrothermal minerals |
| ASSAYAV07 | Drill hole assays, original sampling lengths of the 2007 resource evaluation |
| INTEMPERI | Weathering described on the drill hole logs |
| RECUPERA | Core recovery from 2002 campaign |
| COMP_02M | Two m comps for resource estimation |
| DENS07 | Dry density analysis from 2007 |
| LITOLOGIA | Reviewed lithology |
| CODE_MIN07 | Estimation codes |
| SULFETOS | Sulphide quantification - 2002 campaign |
| UMIDADE | Humidity of the oxide material |
| GEOPHYSIC | Geophysical data (U, Th and K) |
| HEADER | Drill hole identification, location and other information |
| ESTRUTURAL | Structures |
| SURVEY | Downhole surveys |
Table 12.3
Assay Database Description
| Field | Description | Minimum | Maximum | Decimals |
| FROM | Starting position of interval | - | - | 2 |
| TO | Ending position of interval | - | - | 2 |
| AG_CAPIM | Silver (ppm) with capping | 0.5 | 500 | 3 |
| AG_FIM | Silver (ppm) before capping | 0.5 | 500 | 3 |
| AU_GT | Gold (ppm) -Final Analysis validated 2007 | 0.005 | 100 | 3 |
| AU_ADJ | Gold adjusted for the 2003 campaign | 0.005 | 100 | 3 |
| AU_CAPFIM | Gold (ppm) with capping | 0.005 | 100 | 3 |
| C_CAPFIM | Carbon (ppm) with capping | 0.005 | 100 | 3 |
| CFIM | C(%) before capping | 0.005 | 100 | 3 |
| CODE_MIN | Combination of the sector, weathering and rock code | 0 | 1000000 | 0 |
| CODE_MIN | Rock Code | 0 | 1000000 | 0 |
| CU_ADJ | Copper (%) adjusted for the 2003 campaign | 0.005 | 100 | 3 |
| CU_ADJ2 | Copper (%) adjusted due to laboratories deviation | 0.005 | 100 | 3 |
| CU_CAPFIM | Cu (%) with capping | 0.005 | 100 | 3 |
| CU_% | Final Cu (%) Analysis, validated 2007 | 0.005 | 100 | 3 |
| DENSCAPFIM | De (g/cm3) with capping | 1 | 10 | 3 |
| DENSCAPFIM | Original Density | 1 | 10 | 3 |
| F_CAPFIM | Fluorine (%) with capping | 0.01 | 100000 | 3 |
| F_FIM | Fluorine (%) before capping | 0.01 | 100000 | 3 |
| INTEMP_COD | Weathering: SAP=1, ZTR=2 FRF=3 | 0 | 1000000 | 0 |
| LENGTH | Sample length | 0.01 | 1000000 | 2 |
| MO_CAPFIM | Molybdenum (ppm) with capping | 0.05 | 10000 | 3 |
| MO_FIM | Molybdenum (ppm) before capping | 0.05 | 10000 | 3 |
| MT_CAPFIM | Magnetite (%) with capping | 0.005 | 100 | 3 |
| MT_FIM | Magnetite (%) with before capping | 0.005 | 100 | 3 |
| LITO | Lithology code string | - | - | - |
64
| Field | Description | Minimum | Maximum | Decimals |
| S_CAPFIM | Sulphur (%) with capping | 0.005 | 100 | 3 |
| S_FIM | Sulphur (%) before capping | 0.005 | 100 | 3 |
| SETOR | Sectors: SE=1000 NW=2000 | 0 | 10000 | 0 |
| U_CAPFIM | Uranium (%) with capping | 0.005 | 10000 | 3 |
| U_FIL | Uranium (%) before capping | 0.005 | 10000 | 3 |
| FASELAB_AU | Chemical Analyses used for Gold (laboratory) | - | - | - |
| FASELAB_CU | Chemical Analyses used for Copper (laboratory) | - | - | - |
Vale’s IT department (DITI), through external consultants (EDS), maintain the hardware and software on site. They are responsible for the network, software, equipment installation, passwords, permissions and backups. They need permission from Vale managers to implement any changes.
12.4 ASSAY VALIDATION PROCEDURE
Several steps are employed to validate data and ensure the integrity of the GEMS database as laid out in a standard Vale protocol. Most of these checks are performed by software validation routines that rigorously verify data at various stages prior to it being uploaded to GEMS. For instance, the drill hole logging program forces compliance with the use of certain codes and checks from/to interval and other common sources of error before accepting the drill log. The database coordinator checks the ALS logged weight against the actual weight to ensure that no mix-up has occurred at the laboratory. Geologists also review logs after assay merging for consistency of result. Assay files are also validated and, in the event of errors, the sample import is rejected until the assays are verified.
On a monthly basis, the QA/QC designate compares the laboratory results to the geologist’s estimates and the laboratory weight to an equivalent weight based on the sample length and an estimated SG. Significant differences are reported for possible follow-up. Prior to use in mineral resource estimation, data is extracted from GEMS into a project file and reviewed again for improbable entries and high values. These errors are usually data entry errors and the boreholes are flagged and corrected.
There are no known major failures or results exceeding the expected error rate.
12.5 MICON OPINION
Micon was provided with the drill hole data for the Salobo deposit and is satisfied that they are suitable for the present mineral resource estimate. All drill core is stored in wooden boxes with proper numbering to indicate the drill hole number and metreage. The data submitted to Micon appear reliable in light of the checks it has carried out. Micon has not independently verified the statements and data contained in historical reports or in assay data provided to Micon for the purpose of this mineral resource estimate, other than those steps described herein. Notwithstanding the above Micon is satisfied that the data are suitable for use in the subsequent mineral resource estimate.
65
13.0 MINERAL PROCESSING AND METALLURGICAL TESTING
13.1 ORE CHARACTERIZATION
Salobo’s mineral reserves indicate total reserve grades of approximately 0.72% Cu and 0.38 g/t Au. Copper occurs primarily as the minerals chalcocite, bornite and chalcopyrite. Average levels of magnetite and chlorite are 5% and 10%, respectively. Potential deleterious elements include fluorine at approximately 0.40% and uranium at approximately 16 ppm.
The main lithologies for hosting the copper sulphide mineralisation are magnetite schists (XMT) and biotite schists (BDX). In general, higher copper values are associated with the magnetite schists, containing greater than 10% magnetite, with values typically greater than 0.6% . Biotite schists generally contain lower copper values, typically in the range of 0.2% - 0.6% Cu. Low grade ore is currently stockpiled.
Gold values are predominantly associated with the copper sulphides.
13.2 METALLURGICAL TESTWORK PROGRAMS
There has been extensive metallurgical testwork carried out on Salobo ore over the last few decades since the deposit was discovered in 1977.
Five distinct phases of testwork include a CVRD testwork program in 1978 -1981; a testwork program by CVRD and Anglo American from 1986 – 1987, from which Bechtel prepared a Pre-feasibility Study in 1988 (fluorine was identified as a potential significant contaminant of flotation concentrate in this phase); a testwork program by SMSA in 1993 - 1998 including a pilot plant campaign at the CVRD Research Centre, from which Bechtel prepared a final Feasibility Study; an extensive testwork program conducted from 2003 – 2004, including locked-cycle flotation tests, flotation variability and grinding studies, from which Fluor Daniel prepared a second Feasibility Study in 2004 for both 12 Mt/y and 24 Mt/y scenarios; and finally a program conducted in 2005 – 2006 looking at the potential inclusion of HPGR for tertiary crushing as an alternative to conventional SAG milling. A trade-off study was prepared by Aker Kvaerner in 2006.
Of particular relevance to this review are the pilot plant campaign of 1994, the extensive variability studies of 2004 – 2005 and the HPGR trade-off study.
Samples for the pilot plant study in 1994 were obtained by driving the G-3 adit into the area of the Salobo deposit considered to represent the area to be mined in the first five years of operation. Of note is that many of the pilot campaigns included two-stage grinding, as it had been found that single stage grinding to 90%t passing 150 µm resulted in uncontrollable froth and excessive graphite flotation. This concept was eliminated during later extensive studies. Two trial campaigns, evaluating the SMM and SML-04 circuits, were conducted using primary grinding only and the flowsheet for the SML-04 campaign was similar to the flowsheet finally selected for Salobo and the 2004 Fluor Daniel Feasibility Study was essentially based on the SML-04 flowsheet. However, it is important to note that the results of this campaign (only five runs) were subjected to professional adjustment of the recoveries as the column cells used for cleaning were under development during the campaign, resulting in the production of some low copper grades and recoveries. It is unclear to what extent the recoveries were adjusted.
66
For the 2004 variability test programs, 251 variability rougher flotation tests were conducted on samples obtained from drill core representing a wide range of ore grades and lithology. These are listed in Table 13.1 below:
Table 13.1
Primary Ore Lithology and Average Grades Used in Locked Cycle Tests
| Lithology Type | No. of Samples | % of Samples | Average Grade | Cu/S | Magnetite (%) | ||||
| Cu (%) | Au (ppm) | C (%) | F (ppm) | U (ppm) | |||||
| XMT | 118 | 47 | 1.58 | 1.28 | 0.12 | 4,909 | 34.13 | 2.58 | 27.79 |
| BDX | 103 | 41 | 0.66 | 0.29 | 0.11 | 2,166 | 11.50 | 2.76 | 6.69 |
| DGRX | 14 | 5.6 | 0.56 | 0.56 | 0.06 | 1,880 | 16.01 | 2.58 | 11.68 |
| HD | 12 | 4.8 | 0.36 | 0.36 | 0.15 | 1,022 | 23.88 | 2.99 | 2.54 |
| Other | 4 | 1.6 | 0.15 | 0.15 | 0.30 | 386 | 32.75 | 2.57 | 7.02 |
| TOTAL | 251 | 100 | 0.77 | 0.77 | 0.11 | 3,409 | 23.30 | 2.67 | 16.89 |
Of the 251 samples, 189 correspond to the southeast (SE) sector and 62 to the northwest (NW) sector.
In addition, 59 Locked Cycle Tests (LCT) were carried out at Minas Gerais Technological Centre (CETEC) in Belo Horizonte, of which 30 samples were characterized as BDX and 16 samples as XMT lithology.
Two major metallurgical improvements were incorporated into all these tests. Firstly, a reagent scheme was adopted using a blend of two collectors, namely A350 (potassium amyl xanthate) and A3477 (sodium di-isobutyl dithiophosphate). This resulted in improved metallurgy and stable flotation conditions. During the 1994 pilot plant trials, only A350 was used, resulting in unstable flotation conditions and the evaluation of a two-stage grinding circuit. Secondly, the addition of sodium sulphide during rougher/scavenger flotation was important for the flotation of bornite, which tends to oxidize and tarnish quickly and require higher collector addition.
Table 13.2 summarizes the reagent conditions that are understood to have been used for all these tests.
67
Table 13.2
2004 Variability Testwork Reagent Conditions
| Stage | Time (min) | Reagents (g/t) | |||
| Na2S | A350 | A3477 | D14 | ||
| (10% p/p) | (1% p/p) | (1% p/p) | (1% p/p) | ||
| Conditioner-1 | 3 | 150 | |||
| Conditioner-2 | 2 | 36 | 10 | ||
| Conditioner-3 | 1 | 30 | |||
| Rougher-Float | 3 | ||||
| Conditioner-4 | 2 | 100 | |||
| Conditioner-5 | 1 | 36 | 8 | ||
| Scavenger-Float | 12 | 30 |
13.3 METALLURGICAL TEST WORK RESULTS
13.3.1 Evaluation of Copper and Gold Recovery
A consolidation of the 1994 plant trial results and later variability study results was undertaken by U.I. Minerals (UIM) of the UK in a report dated December, 2003. During this process, a number of filters were applied to the results:
For the 251 variability rougher flotation tests, samples were rejected below 0.6% Cu and greater than 1.50% Cu head grade and with Cu/S ratios outside the range of 1.75-3.20, resulting in the acceptance of 14-BDX, 5-DRGX and 27-XMT results. For the 59 LCT tests and applying the same filters, 5-XMT, 3-BDX, 1- DGRX/XMT/BDX and 1-HD/BDX results were accepted.
For the 1994 pilot plant trials (PP94), considering that the process was based on a grind of 90% passing 150 µm, it was decided to use the results based on SML-03A and SML-04 for the rougher performance resulting in a total of 15 test results.
The SML-03A data were not considered for the scavenger and the final concentrate comparisons since this involved secondary grinding of the rougher tails prior to scavenger flotation. Consequently, six tests were used from PP94 for scavenger and final concentrate evaluations for which Bilmat balances were available.
Figure 13.1 summarizes graphically the filtered data results for copper recovery from the UIM report. Figure 13.2 summarizes graphically the filtered data results from the UIM consolidation report for gold recovery. Based on these results, equations for copper and gold recovery have been developed for use by Vale in its mine planning and production forecasts. The equations developed by Vale are considered to be confidential. Nevertheless, Micon has reviewed the resulting recovery factors and considers them to be consistent with the data presented and to be reasonable and appropriate for use in planning and forecasting.
68
Overall, for the total reserve copper head grade of 0.72% Cu, expected recovery was 84.2%, and for the total reserve gold head grade of 0.38 g/t, expected recovery was 61.9% .
Figure 13.1
Filtered UIM Results of Copper Recovery vs. Head Grade
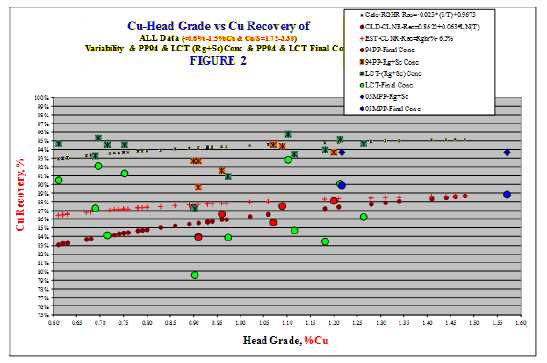
Figure 13.2
Filtered UIM Results of Gold Recovery vs. Head Grade
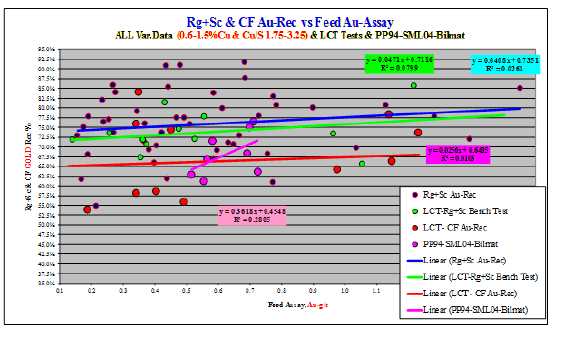
69
Figure 13.3 illustrates the metallurgical recovery results for copper for all the 251 variability rougher tests, i.e., unfiltered results, but differentiated by samples from the southeast (SE) and northwest (NW) areas. A relatively large scatter is apparent.
Figure 13.3
Unfiltered Metallurgical Recovery Results for Copper
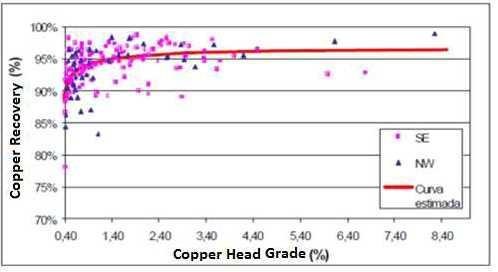
In a similar manner, Figure 13.4 illustrates the unfiltered metallurgical recovery results for gold with the samples again differentiated by SE and NW areas. The scatter is evidently greater than that for copper.
Figure 13.4
Unfiltered Metallurgical Recovery Results for Gold
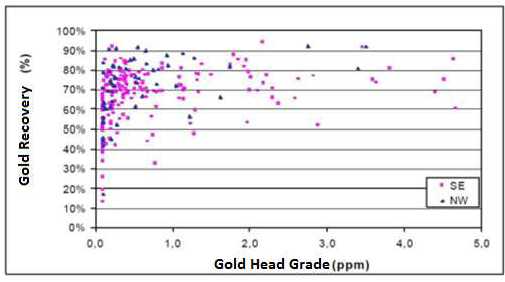
70
13.3.2 Concentrate Quality
Target copper grades in concentrate are 35-42% Cu with a typical value of 38% Cu. Target gold grade in concentrate is 17 g/t with an upper limit of 40 g/t.
Vale reports that, with two concentrate shipments delivered to-date, the concentrate is typically averages 38% Cu and 21 g/t Au.
There are three deleterious elements of potential concern in the copper concentrate, namely fluorine, chlorine and uranium. Of these, fluorine is the most significant. In general, smelters will tend to reject concentrates with high fluorine content due to problems in the smelter’s sulphuric acid plants. However, there are smelters that can accept high fluorine contents, although they are few in number. Vale has advised it has secured contracts with four smelters (in Poland, India, Sweden and Germany) which are able to accept concentrates with an anticipated average fluorine content of 1,800 ppm and a maximum content of 4,000 ppm. It is highly likely that penalties will be charged at these levels, although this is company-sensitive information and was not available for review.
Vale has advised that of two concentrate shipments sent to-date, the last shipment had an average fluorine content of 3,250 ppm. Vale has advised, also, that the smelter or smelters have been satisfied with the concentrate quality and have not rejected any concentrate.
Vale advised further that, since concentrate lots are segregated by grade (lower, medium and high grades) the blending of material is possible, should it ever be necessary. Therefore, with the potential blending strategy and the securing of contracts with four smelters which accept concentrates with high fluorine content up to 4,000 ppm, the risk of concentrate rejection is significantly reduced.
Testwork was conducted as part of the 1994 pilot plant campaign and continued by CVRD in 1995 to evaluate the potential for acid leaching of the concentrate to reduce fluorine levels. This was apparently unsuccessful due to insufficient removal of fluorine, high dissolution of copper and difficulty in filtering the leach residue.
Anticipated levels of chlorine in Salobo concentrate, typically at 550 ppm to a maximum of 1,200 ppm are on the threshold of being a concern, with smelters generally imposing a chlorine penalty above 500 ppm. Details of any such penalties were not available for review.
Details of the typical uranium content in Salobo concentrates were not made available for review although it has been reported that typical uranium content is projected to average 27 ppm. At such levels, this should not be a major concern.
13.3.3 HPGR and Grinding Circuit Evaluation (2005– 2006)
The feasibility study conducted by Fluor Daniel in 2004 incorporated a conventional primary crushing circuit, a standard SAG Mill/Ball Mill grinding circuit and a conventional copper flotation circuit. However, several unique problems with Salobo ore led to the evaluation of an alternative to standard SAG mill grinding.
71
Firstly, the high magnetite content (potentially exceeding 20% at times) presents a difficulty in the SAG mill circuit due to the need to remove and crush the critical size pebbles in a pebble crusher. The use of a magnet to remove tramp steel ahead of the crusher would invariably remove magnetite pebbles with a resulting loss of the associated copper and gold values (the higher grade copper is associated with the magnetite schists). There would then be additional design and cost implications to rehandle and process the magnetite pebbles.
Secondly, significant variations in hardness, density and abrasivity are expected for Salobo ore and conventional SAG milling circuits are sensitive to such variations, resulting in potential significant variability in mill throughput and performance.
As a result of these concerns, an extensive evaluation of an alternative comminution circuit was conducted that included primary crushing, secondary cone crushing and tertiary HPGR crushing followed by conventional ball milling. This was the circuit ultimately adopted by CVRD. Although HPGR is relatively new to the copper and gold industry (although more established in the diamond and iron ore industries), there is a growing acceptance where the benefits can be economically demonstrated. These are generally either power savings (compared to conventional SAG milling) and/or recovery/grindability improvements due to the generation of micro-fractures within the crushed rock. In addition, HPGR units are less susceptible to variations in hardness and abrasivity. Either way, extensive testwork is normally required to demonstrate any such benefits are economical and considering the relatively high capital and operating costs of HPGR units. Early perception was negative as a result of significant mechanical wear to the liners. However, there have been significant advances in HPGR liner design that have considerably improved wear rates and liner consumption, e.g. the use of studded liners.
Polysius conducted two separate HPGR evaluations in 2005 and 2006. The 2005 program tested pilot ore from the G3 adit at a top feed size of 32 mm and the 2006 program tested two samples to represent typical ore for the first five years of mining and hard ore. Top feed sizes tested were 25 mm and 32 mm. The Bond Ball Mill Work Index for the hard ore sample was 21.4 kWh/t.
General observations from this testwork program were that there was a decline in specific throughput as the roll speed increased and as the feed moisture content was increased. For the first five-year sample, there was an 18% reduction in specific throughput when the feed moisture content was increased from 0.1% to 4.0% . Abrasion testing and specific wear rates on all samples indicate that Salobo ore has low abrasion characteristics, although it should be noted that scale-up factors of the abrasion index used in design take into consideration a wide range of operating parameters. In practice, actual wear rate projections are based upon a large empirical database of industrial HPGR ore treatment by the HPGR manufacturer.
72
Grindability tests were conducted on samples of HPGR product at <6 mm and conventionally crusher material at <6 mm of the pilot ore sample from the 2005 program. The results indicated a very similar Bond Ball Mill Work Index for both samples (19.4 kWh/t and 19.2 kWh/t, respectively), indicating no micro-fracturing of the rock and therefore no grindability advantage attributed to HPGR. Although an 8% energy advantage was noted, this was attributed entirely to the finer product sizing of the HPGR crushed material and therefore, any potential energy advantage should not be included in the design calculations.
SMCC was retained as an independent reviewer of the Polysius test program and to size both the HPGR and Ball Mill units. Pertinent conclusions from this review are summarized below:
The design used the 80thpercentile values to derive the Bond Ball Mill Work Index of 21.3 kWh/t and the Drop Weight Index (DWi) of 8.94 (indicative of HPGR performance). The value of 8.94 was derived from taking the 80thpercentile from the results of 123 drop-weight tests conducted on Salobo drill core. In addition, the DWi value correlates almost exactly with that obtained from the 2005 Polysius testwork program.
Confirmation that specific throughput decreases with increasing roll speed and increasing feed moisture content. In addition, specific throughput increases with increasing ore SG.
The final adjusted specific throughput used for the HPGR design was 244 t/m3h at 2 m/s roll speed. This was calculated by taking as a starting point the specific throughput of 292 t/m3h obtained from the Polysius test on hard ore at a moisture content of 4% and at a roll speed of 0.29 m/s. Allowing for the reduction of specific throughput with increasing roll speed, for a design speed of 2.0 m/s for an industrial scale unit, the specific throughout was decreased by 24%. Finally, a positive adjustment of 10% was made to allow for the Polysius claim that specific throughputs of industrial HPGR units are typically 10-20% higher than the pilot plant tests indicate.
SMCC derived the size of the required units to process 12 Mt/y as 2 m x 1.5 m for the HPGR unit and 26 ft x 39 ft for the Ball Mill.
SMCC also performed some modelling scenarios looking at the effects of using 6 mm, 8 mm and 10 mm aperture sizings for the HPGR product screen, the maximum throughput possible and the maximum hardness possible to treat 12 Mt/y. A screen size of 6 mm was used in the design criteria and it was concluded that the circuit could accommodate a 10% increase in ore hardness to maintain throughput at 12 Mt/y. A maximum throughput of 15 Mt/y could be achieved using the average design values.
Finally, Aker Kvaerner conducted a trade-off study using the results of the Polysius testwork programs and the SMCC review in 2006. The Aker Kvaerner report summarizes the advantages and disadvantages for selected characteristics comparing the SAG and HPGR options as shown in Table 13.3.
73
After reviewing all the above work, Vale decided to implement the HPGR option based on the technical and economic benefits compared to conventional SAG milling and considering the issues of the high magnetite content and hardness variability of Salobo ore.
Table 13.3
Aker Kvaerner Summary of SAG and HPGR alternatives
| CHARACTERISTICS | AG/SAG | HPGR |
| 1 Lay Out on Selected Area | Same | Same |
| 2 Proven Industrial Application in Copper Ore | Much Higher | None |
| 3 Size Reduction Operations Complexity | Higher | Lower |
| 4 Size Classification (Screening) Operations Complexity | Lower | Higher |
| 5 Bulk Material Handling Complexity | Lower | Higher |
| 6 Sensitivity To Ore Characteristics Variation | Much Higher | Much Lower |
| 7 Knowledge on Line Wear | Higher | Lower |
| 8 Ability To Handle Magnetite Pebbles | Much Lower | Not Required |
| 9 Energy Consumption on Size Reduction Operations and Total | Higher | Lower |
| 10 Effect of Large Power Motors on the Regional Electrical System | Higher | Lower |
| 11 Complexity of Structural Solutions for Foundations | Higher | Lower |
| 12 Possibility of Correction in Case of Under Productivity | Much Lower | Much Higher |
| 13 Control of harmonic electrical pollution to grid | Yes | No |
13.3.4 Additional Testwork Programs
There has been significant historical and current metallurgical testwork performed by CVRD/Vale staff which generally supports and confirms the target recoveries and grades for copper and gold in concentrate. These tests have included locked cycle tests (LCT) and pilot plant campaigns.
UIM produced a further report in March, 2005 summarizing the characteristics of Salobo concentrates from the results of the various LCT and 1994 pilot plant tests conducted. From this report, the following Figures 13.5 and 13.6 summarize the final copper concentrate grades and recoveries achieved against the copper head grade.
It is important to note the significant scatter in the results for both copper concentrate grade and final recovery. The UIM report concludes that the production of stable and constant concentrate from Salobo operations would be difficult and that comprehensive control systems would be required in mining and processing operations, grade control and concentrate blending.
74
Figure 13.5
Final Copper Concentrate Grades for Historical LCT and PP94 Tests
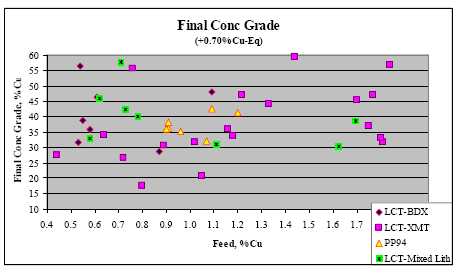
Figure 13.6
Final Copper Recoveries for Historical LCT and PP94 Tests
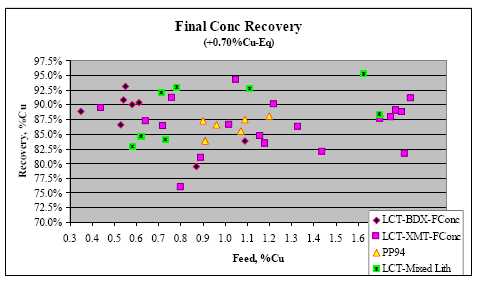
An historical testwork report (Fonseca, 2006) is useful for demonstrating the benefits of sodium sulphide addition and the influence of pH on rougher flotation performance. The report was produced in September, 2006 and the relevant results are shown in the following tables, with Table 13.4 summarizing the reagent conditions used and Table 13.5 summarising the results for copper recovery to rougher concentrate.
It is important to note that the sample was a backup sample from the 2006 HPGR testwork program representing the first five years of mining operations. The sample had been left for some time and therefore a high degree of oxidation had occurred. The copper head grade was high at 2.56% Cu with 33.5% of this as soluble copper due to the oxidation. The grind was slightly coarser than design at 80% passing 190 µm. In the two tests where lime was added, the pH was raised from 7.5 to 9.5.
75
Table 13.4
Reagent Conditions for Copper Rougher Flotation Tests
| TEST | Reagents | ||||||
| Dosage Point | Collectors | Frothers | Modifiers | ||||
| Xanthate (g/t) | Dithio- phosphate (g/t) | MIBC (g/t) | Polyglycolic alcohol (g/t) | CaO (g/t) | NASH (g/t) | ||
| Test 01 | Mill | 25 | 27 | - | - | - | - |
| Rougher | - | - | 15 | 15 | - | - | |
| Test 02 | Mill | - | - | - | - | - | - |
| Rougher | 25 | 27 | 15 | 15 | - | 150 | |
| Test 03 | Mill | 25 | 27 | - | - | - | 150 |
| Rougher | - | - | 15 | 15 | - | - | |
| Test 04 | Mill | - | - | - | - | - | - |
| Rougher | 25 | 27 | 15 | 15 | 400 | - | |
| Test 05 | Mill | 25 | 27 | - | - | 400 | - |
| Rougher | - | - | 15 | 15 | - | ||
Table 13.5
Summary Results of Copper Flotation Rougher Recovery
| Test | Reagent | CuT (%) | Mass Recovery (%) | Cu Recovery (%) |
| T-01 | Baseline test (no addition) | 12.23 | 16.64 | 81.91 |
| T-02 | Collector with NASH into Rougher feed | 11.38 | 17.93 | 82.15 |
| T-03 | Collector with NASH into Milling | 10.68 | 19.05 | 84.17 |
| T-04 | Collector with lime into Rougher feed | 10.34 | 21.86 | 87.98 |
| T-05 | Collector with lime into Milling | 10.69 | 21.87 | 89.07 |
The results clearly indicate the benefit of adding sodium sulphide for oxidized copper ores and, most importantly, of adding lime to increase the pH of rougher flotation. The benefits of both these reagents were improved by adding them to the milling circuit ahead of rougher flotation. For example, just adding lime to the milling circuit (without sodium sulphide addition) to increase the pH from 7.5 to 9.5, increased rougher flotation recovery by 7.2% .
13.4 MICON OPINION
It is Micon’s opinion that the processing recovery equations for copper and gold developed for the Salobo Mine are reasonable based on the extensive metallurgical test work programs that have been carried out to-date. This has included rougher flotation variability tests, LCTs and pilot plant campaigns.
76
The progression of the testwork programs has led to logical decisions being made on the Salobo process flowsheet development, e.g. HPGR for tertiary crushing followed by conventional single-stage ball milling, an optimized reagent suite of A350 and A3477 collectors, addition of sodium sulphide for bornite/oxidized copper flotation and a lime circuit to increase rougher flotation circuit pH.
However, it is important and significant to note that, in developing the recovery equations (largely based on UIM’s 2003 consolidation report), they are a best fit from data points that have significant scatter. In practice therefore, variations in copper and gold recovery, potentially significant at times, can be expected. In addition, a further report by UIM in 2005 to evaluate the historical LCT and Pilot Plant campaign test results concludes that production of stable and constant concentrates may be difficult, requiring significant controls in mining and processing operations, grade control and concentrate blending. Micon supports this view.
It is noted that two concentrate shipments have been delivered and accepted to-date with no apparent or reported issues, although any penalty deductions are unknown as this is company-sensitive information. Average concentrate grades are reportedly approximately 38% Cu and 21 g/t Au.
The high fluorine content of the Salobo concentrate is potentially a cause for concern. However, Vale has secured contracts with four smelters which are willing to accept concentrates with an anticipated maximum fluorine content of 4,000 ppm. Details of any penalties being charged for the high fluorine content were not available for review. The most recent Salobo concentrate shipment had an average fluorine content of 3,250 ppm. With the potential strategy to blend Salobo concentrate with concentrate from Vale’s nearby Sossego operation, which has a much lower fluorine content of typically 200-300 ppm, it is Micon’s view that the risk of concentrate rejection has been significantly reduced.
Micon has reviewed the extensive testwork carried out by Polysius, SMCC and Aker Kvaerner in evaluating the HPGR alternative to conventional SAG milling. This was due to problems with the high magnetite content and expected hardness variability of the ore that would affect the design, cost, operability and throughput of a conventional SAG milling circuit. SMCC derived the size of the alternative required units to process 12 Mt/y as 2 m x 1.5 m for the HPGR units and 26 ft x 39 ft for the Ball Mills. Two HPGR and two Ball Mill units are required.
It is Micon’s view that the testwork programs and their interpretation for the design of the alternative HPGR/Ball Mill circuit are reasonable and appropriate. Particularly useful was the review by SMCC, world experts on the subject of comminution design and modelling.
77
14.0 MINERAL RESOURCE ESTIMATES
The Mineral Resource estimate has been produced and classified using the 27 November, 2010, CIM Definition Standards for Mineral Resources and Mineral Reserves, as required by NI 43-101.
Micon considers that the mineral resource estimate for the Salobo Mine has been prepared according to the current CIM standards and definitions for estimating mineral resources.
The process of mineral resource estimation includes technical information which requires subsequent calculations or estimates to derive sub-totals, totals and weighted averages. Such calculations or estimations inherently involve a degree of rounding and consequently introduce a margin of error. Where these occur, Micon does not consider them to be material. The mineral resource figures have been rounded to reflect that they are estimates.
Mineral resources that are not mineral reserves do not have demonstrated economic viability. Micon is not aware of any known legal, political, environmental, or other risks that could materially affect the potential development of the mineral resources.
There has been insufficient exploration to classify the Inferred resources as an Indicated or Measured mineral resource. The extent to which further exploration may result in upgrading them to an Indicated or Measured mineral resource category is uncertain at this time.
14.1 INTRODUCTION
The mineral resource model for Salobo incorporates drilling data, enhanced knowledge of metallurgical processing, geology and mineralization, and refined interpolation parameters. The geologic and mineral resource models were constructed using GEMS™ and Isatis® software. The estimated mineral resources are then converted to mineral reserves using long term mine planning techniques and quoted above a cut-off grade of 0.296% Cu equivalent (CuEq).
Only diamond drill hole composites form the database and are considered in building the mineral resource model for the Salobo deposit.
Block models were used to classify mineral resources as Measured, Indicated and Inferred in accordance with CIM standards. Vale’s geologic and block models have been peer reviewed via external audits. None of the inferred resource is converted to mineral reserves.
Table 14.1 summarizes the estimated mineral resources at the Salobo Mine as of 31 December, 2012.
78
Table 14.1
Salobo Mineral Resources as at 31 December, 2012 above Cut-off 0.296% CuEq
| Classification | Units | Measured | Indicated | Measured and Indicated | Inferred |
| Within Current LOM Open Pit | Mt | - | - | - | 14.6 |
| % Cu | - | - | - | 0.57 | |
| Au g/t | - | - | - | 0.26 | |
| Adjacent to Current LOM Pit | Mt | 49.1 | 195.4 | 244.5 | 133.4 |
| % Cu | 0.82 | 0.72 | 0.74 | 0.63 | |
| Au g/t | 0.47 | 0.37 | 0.39 | 0.32 | |
| Total | Mt | 49.1 | 195.4 | 244.5 | 148.0 |
| % Cu | 0.82 | 0.72 | 0.74 | 0.62 | |
| Au g/t | 0.47 | 0.37 | 0.39 | 0.31 |
| 1. | Mineral Resources stated as at 31 December, 2012. | |
| 2. | Mineral Resources are classified according to CIM guidelines. | |
| 3. | Mineral Resources are reported exclusive of Mineral Reserves. | |
| 4. | Figures may not compute due to rounding and to reflect that mineral resources are an estimate. | |
| 5. | Mineral Resource is constrained within an optimized pit shell based on rolling three year average prices for copper ($3.67/lb) and gold ($1,500/oz). | |
| 6. | A cut-off grade of 0.296% Cu was applied to CuEq grades calculated in the block model using a copper price of $3.45/lb and a gold price of $1,150/oz. | |
| 7. | There are no known legal, political, environmental, or other risks that could materially affect the potential development of the mineral resources |
14.2 RESOURCE ESTIMATION PROCESS
14.2.1 Data Validation and Geologic Model
Resource estimates are based on a three-dimensional computer block model utilizing GEMS™ software. Horizontal and vertical block sizes were chosen to adequately model the geometry of mineralized zones, and to approximate the selective mining unit (SMU) based on the proposed mining fleet. The resource model was estimated using a regular block model with block sizes of 15.0 m by 15.0 m by 15.0 m.
The geologic models for lithology and mineralization were produced by Vale geologists and were based on their experience of the geological features of the deposit, including structure, hydrothermal alteration minerals, lithologies and mineralization.
The following two zones were interpreted:
Disseminated zone, usually grading above 0.2% Cu cut-off grade, corresponding to the structurally controlled alteration halo (low grade).
Sulphide breccia zone, generally grading in excess of 0.6% Cu (high grade).
In general, a minimum drill-intercept width of 8.0 m was used to define the two mineralized zones and internal barren or weakly mineralized zones. Thus, isolated intervals below 0.2% Cu are included in mineralized zones to provide continuity of geometry from hole to hole and section to section. Likewise, narrow isolated intervals grading above 0.2% Cu are generally not interpreted as mineralized zones.
79
Other than at the intersection of the diabase dyke little, or minimal, structural disturbance is observed within the Salobo deposit and, for the purpose of mineral resource modelling, has not been included. The presence of any faulting is noted but, due to the orientation of these faults, Vale has taken the decision not to model these at this time as they are not thought to materially impact the mineral resource model and estimate.
Cross-sections were used to construct mid-bench level plans. Selected levels were interpreted on screen. After digitizing the paper plans and screen interpretation of the remaining levels, plan intersections were reviewed in cross-section to validate the interpretation and correct dip anomalies of the geologic zones. Several iterations were done to give a consistent set of level plans.
The resource estimates was undertaken by applying a good knowledge of the deposit and local variations within each domain that control the spatial grade variation, this is further investigated by testing the search parameters in order to provide a robust estimation. The known method of ordinary kriging (OK) was used to provide accurate global estimates. In general, estimation for all variables was performed using a three-pass OK approach by estimation domain. One additional pass was performed for domains to allow the estimation of all blocks. A block discretization of 5 m by 5 m by 5 m was adopted for the 15 m block bench height.
Salobo was divided in two sectors from west to east to account for changes in the orientation and style of the mineralized zone along strike. Polygonal shapes were used to create solids to code the other sectors, based on level plan views of the mineralized zones.
Triangulated solid models were also created for each of the waste rock types using generalized geologic sections and level plans. In the case of late-stage, unmineralized units such as mafic dykes, the solids were used to overwrite mineralization codes in the block model.
For oxide ore, two main zones were interpreted: green ore (copper mineral: malachite) and red ore (clay mineral with adsorbed copper). Both zones are divided into saprolite and transition zone (oxidized rock). The red (oxide) ore lies above the sulphide ore body.
14.2.2 Domaining
The estimation domains are based on units defined for total copper and gold and are the result of a combination of sector, ore code and weathering variables. The subdivision between NW and SE sectors is defined by difference in deformation and hydrothermal alteration. The existence of a diabase dyke with strike N70°E defines the border between sectors. Another relevant aspect is the dip of the lithological units. In the SE sector, the dip is subvertical to southwest and in the NW sector the dip is subvertical to northeast.
80
Domain codes as they relate to sectors and grade groups are shown in Table 14.2 and Table 14.3.
Table 14.2
Domains and Codes
| Oxide | Sulphide | ||||
| Code | Sector | Description | Code | Sector | Description |
| 1121 | Southeast | Low Grade -Saprolite | 1103 | Southeast | Low Grade -Fresh Rock |
| 1122 | Low Grade -Semi-Weathered | ||||
| 1221 | High Grade -Saprolite | 1203 | High Grade -Fresh Rock | ||
| 1222 | High Grade -Semi-Weathered | ||||
| 2121 | Northwest | Low Grade -Saprolite | 2103 | Northwest | Low Grade -Fresh Rock |
| 2122 | Low Grade -Semi-Weathered | ||||
| 2221 | High Grade -Saprolite | 2203 | High Grade -Fresh Rock | ||
| 2222 | High Grade -Semi-Weathered | ||||
Table 14.3
Ore Codes for Block Model
| Code | Description |
| 1 | Oxidized (SAP) |
| 2 | Transition Ore (ZTR) |
| 3 | Sulphide Ore (RFR) |
Contact plots for copper are shown in Figures 14.1 and 14.2 (southeast and northwest sectors, respectively) and for gold in Figures 14.3 and 14.4 (southeast and northwest sectors, respectively). The contact plots for both copper and gold indicate unique populations between the high and low grade domains defined by a sharp contact.
81
Figure 14.1
Copper Contact Plot Analysis for the SE Sector
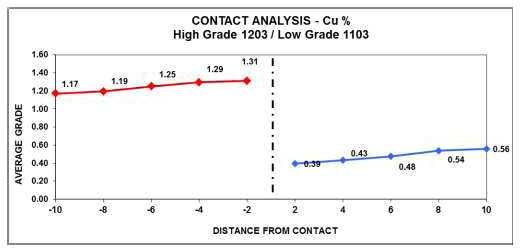
Figure 14.2
Copper Contact Plot Analysis for the NW Sector
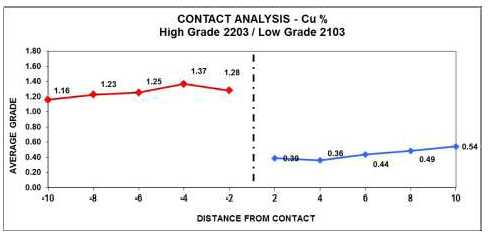
82
Figure 14.3
Gold Contact Plot Analysis for the SE Sector
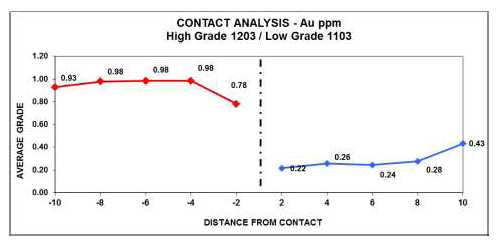
Figure 14.4
Gold Contact Plot Analysis for the NW Sector
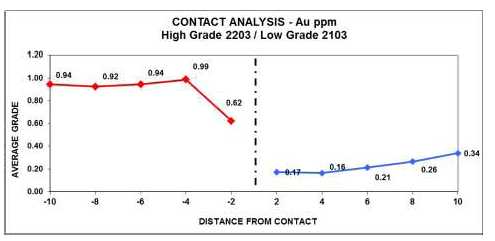
Figures 14.5, 14.6, 14.7 and 14.8 show the similarity in copper and gold grade distributions between the two low grade domains. The comparison is not quite as tight for gold as it is for copper but the plots show them to be very similar in distribution and distinct from the low grade domains.
14.2.3 Correlation Analyses
Grade correlation analyses were performed to determine the degree of correlation of the various variables and provide evidence for the multivariate assumptions used to produce the block estimates. Table 14.4 and Table 14.5, respectively, show correlation analyses for the southeast and northwest sectors, grouping the low and high grade domains. Cu-Au displays a strong correlation in both sectors with Cu-Ag and Cu-S having the strongest correlation. Not surprisingly, Cu-Mag and Cu-Density are also strongly correlated.
83
Table 14.4
Correlation Matrix for Each Domain, SE Sector
| Variable | Cu | Au | Ag | Density | F | C | Mag | Mo | S | U |
| Cu | 100% | |||||||||
| Au | 52% | 100% | ||||||||
| Ag | 81% | 39% | 100% | |||||||
| Density | 45% | 37% | 30% | 100% | ||||||
| F | 38% | 33% | 25% | 47% | 100% | |||||
| C | 20% | 10% | 19% | 10% | 14% | 100% | ||||
| Mag | 60% | 49% | 41% | 72% | 53% | 12% | 100% | |||
| Mo | 49% | 39% | 36% | 44% | 47% | 11% | 57% | 100% | ||
| S | 84% | 54% | 62% | 47% | 34% | 17% | 66% | 48% | 100% | |
| U | 36% | 24% | 25% | 13% | 6% | 10% | 27% | 22% | 43% | 100% |
Table 14.5
Correlation Matrix for Each Domain, NW Sector)
| Variable | Cu | Au | Ag | Density | F | C | Mag | Mo | S | U |
| Cu | 100% | |||||||||
| Au | 44% | 100% | ||||||||
| Ag | 85% | 42% | 100% | |||||||
| Density | 40% | 27% | 39% | 100% | ||||||
| F | 36% | 29% | 31% | 45% | 100% | |||||
| C | 6% | 0% | 4% | -9% | -5% | 100% | ||||
| Mag | 51% | 36% | 46% | 67% | 51% | -3% | 100% | |||
| Mo | 60% | 40% | 55% | 50% | 59% | -5% | 66% | 100% | ||
| S | 90% | 45% | 77% | 42% | 42% | 6% | 56% | 66% | 100% | |
| U | 49% | 28% | 42% | 18% | 18% | 6% | 29% | 38% | 51% | 100% |
Figure 14.5
Cumulative Log Probability for Copper
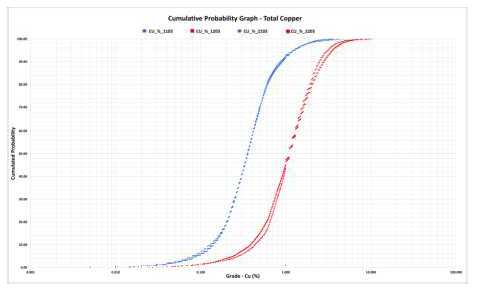
84
Figure 14.6
Cumulative Log Probability for Gold
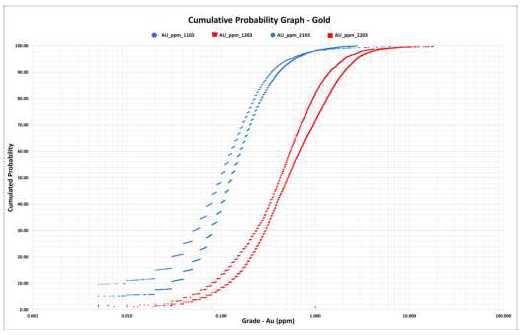
Figure 14.7
Domain Definition for Copper
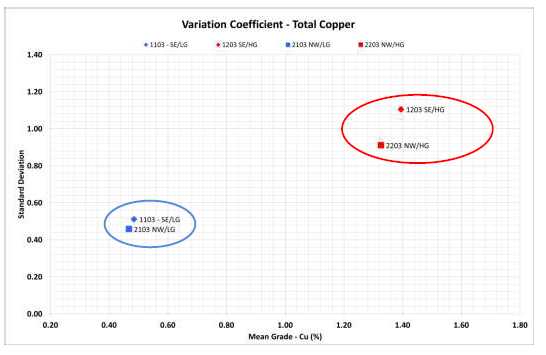
85
Figure 14.8
Domain Definition for Gold
![]()
14.2.4 High Grade Capping
The high grade capping analyses was performed according to a standard statistical analysis and spatial variability of the copper variable and continuities. The confidence intervals were calculated based on the amount of available data within each quantile required to achieve consistency in the grade variability, the spatial continuity and the persistence of high grades values over the field. In addition, the intrinsic connectivity of the coefficient variation and its influence on grade variation and the association with data spacing were verified.
Prior to the sample compositing procedure, capping (top cut) was applied to the raw assays values (Table 14.6) .
Table 14.6
Capping Factors
| Code | Domain | |||
| 1103 | 1203 | 2103 | 2203 | |
| Cu (%) | 7.4 | 10.5 | 4.7 | 6.9 |
| Cum Freq | >99% | >99% | >99% | >99% |
| Au (ppm) | 15.64 | 17.95 | 16.12 | 17.37 |
| Cum Freq | >99% | >99% | >99% | >99% |
| Ag (ppm) | 24 | 29 | 11 | 17 |
86
| Code | Domain | |||
| 1103 | 1203 | 2103 | 2203 | |
| Cum Freq | >99% | >99% | >99% | >99% |
| C (%) | 1.84 | 2.24 | 1.84 | 2.53 |
| Cum Freq | >99% | >99% | >99% | >99% |
| F (ppm) | 15,410 | 39,010 | 7,880 | 15,690 |
| Cum Freq | >99% | >99% | >99% | >99% |
| Mo (ppm) | 373 | 584.2 | 369.7 | 438.4 |
| Cum Freq | >99% | >99% | >99% | >99% |
| S (%) | 3.14 | 3.94 | 2.03 | 2.37 |
| Cum Freq | >99% | >99% | >99% | >99% |
| U (ppm) | 692.8 | 315.3 | 243.3 | 164.1 |
| Cum Freq | >99% | >99% | >99% | >99% |
14.2.5 Compositing
The typical sampling interval length is 1.0 m but lengths vary according to lithology, length of mineralized intersection and geologic contacts. Table 14.7 displays the assay length statistics by lithology. Assay lengths for the most relevant lithologies (biotite-granite, granite-grunerite and magnetite schists) average greater than 1.5 m with a median length of 2.0 m. A composite length of 2.0 m was chosen to provide the greatest detail for modelling mineralized zones and to provide greater flexibility in dilution control and number of composite samples used for interpolation. Down-hole composites of 2.0 m were created in GEMS using the Run Length tool for use in statistical and geostatistical analysis and grade interpolation. The compositing process considered breaks in the presence of non-assayed intervals or in ore/waste contacts, weighted by density value during regularization.
Table 14.7
Assay Length by Lithology
| Litho | Description | No. Samples | Min | Max | Mean | Median | St Dev |
| All | All | 88,713 | 0.01 | 5 | 1.59 | 2 | 0.5 |
| BDX | Biotite-Granite-Schist | 34,008 | 0.04 | 5 | 1.72 | 2 | 0.46 |
| COB | Cover | 1,228 | 0.04 | 3.19 | 1.01 | 1 | 0.11 |
| CX | Chlorite-Schist | 31 | 2 | 2.38 | 2.01 | 2 | 0.07 |
| DB | Diabase | 1,079 | 0.1 | 4 | 1.89 | 2 | 0.43 |
| DGRX | Granite-Grunerite- Schist | 5,562 | 0.05 | 3.05 | 1.81 | 2 | 0.4 |
| GM | Granitoid | 3,836 | 0.18 | 3 | 1.77 | 2 | 0.44 |
| GR | Granite | 111 | 1 | 2.2 | 1.68 | 2 | 0.47 |
| HD | Hydrothermal | 4,596 | 0.8 | 4.55 | 1.96 | 2 | 0.22 |
| ML | Mylonite | 5,065 | 0.07 | 2.95 | 1.7 | 2 | 0.47 |
| MTB | Metabasic | 529 | 0.95 | 2.36 | 1.93 | 2 | 0.26 |
| QML | Quartz-Mylonite | 3,715 | 0.1 | 5 | 1.68 | 2 | 0.49 |
| QZ | Quartzite | 28 | 2 | 2 | 2 | 2 | 0 |
| RIO | Rhyolite | 4 | 2 | 2 | 2 | 2 | 0 |
| SP | Saprolite | 14,411 | 0.01 | 5 | 1.02 | 1 | 0.15 |
87
| Litho | Description | No. Samples | Min | Max | Mean | Median | St Dev |
| XMT | Magnetite Schist | 11,353 | 0.05 | 4 | 1.72 | 2 | 0.45 |
| ZT | Semi-Weathered Rock | 3,157 | 0.2 | 4.55 | 1.08 | 1 | 0.29 |
Samples were composited to 2.0 m and the compositing process considered breaks in the presence of non-assayed intervals or in ore/waste contacts, weighted by density value during regularization.
Analysis of composite length versus grade distribution was completed to ensure that bias is not being introduced by including samples with lengths that varied significantly from the composite length. The compositing procedure produces length values that range from 0.04 m to 2.0 m. It is common practice to reject the use of composites shorter than 25%-50% of the composite size. Analyses were performed breaking the composite database with a length threshold of 0.5 m and 1.0 m.
Table 14.8 shows there are no significant difference (mean values and coef. var,) between the length>0.5 m and the length>0.5 m<1.0 m. For the values lower than 1.0 m length a length restriction was applied for estimation purposes.
Table 14.8
Composite Statistics by Length Interval
| Variable | Length Set | No. | Min | Max | Mean | St Dev | Coef Var |
| Cu (%) | Length<0.5m | 162 | 0.010 | 4.44 | 0.73 | 0.66 | 0.90 |
| Length<1m | 463 | 0.010 | 9.50 | 0.80 | 0.91 | 1.13 | |
| Length>1m | 39,088 | 0.005 | 10.50 | 0.82 | 0.88 | 1.07 | |
| Length 0.5m><1m | 310 | 0.020 | 9.50 | 0.84 | 1.00 | 1.20 | |
| Length>0.5m | 39,190 | 0.005 | 10.50 | 0.82 | 0.88 | 1.07 | |
| Au (ppm) | Length<0.5m | 162 | 0.005 | 17.95 | 0.46 | 1.48 | 3.22 |
| Length<1m | 463 | 0.005 | 17.95 | 0.46 | 1.51 | 3.28 | |
| Length>1m | 39,089 | 0.005 | 17.95 | 0.45 | 0.90 | 1.97 | |
| Length 0.5m><1m | 310 | 0.005 | 17.95 | 0.46 | 1.50 | 3.30 | |
| Length>0.5m | 39,191 | 0.005 | 17.95 | 0.45 | 0.90 | 1.98 | |
| Density (g/cm3) | Length<0.5m | 165 | 2.630 | 4.55 | 3.34 | 0.39 | 0.12 |
| Length<1m | 466 | 2.510 | 4.79 | 3.36 | 0.39 | 0.12 | |
| Length>1m | 39,456 | 1.320 | 8.76 | 3.38 | 0.40 | 0.12 | |
| Length 0.5m><1m | 310 | 2.510 | 4.79 | 3.37 | 0.39 | 0.12 | |
| Length>0.5m | 39,558 | 1.320 | 8.76 | 3.38 | 0.40 | 0.12 |
14.2.6 Univariate Statistics
presents the univariate statistics related to raw variable, 2.0 m clustered composite, and 2.0 m declustered composites values for each related domain.
88
Table 14.9
Assay and 2.0 m Composite Statistics
(Copper, Gold, Silver and Density)
| Domain | Variable | Assay Data | Composite Data | ||||||||||||
| Count | Min | Max | Mean | St Dev | Coef Var | Count | Min | Max | Mean | St Dev | Coef Var | Declus Mean | Declus St Dev | ||
1103 | Cu (%) | 20,452 | 0.001 | 7.4 | 0.49 | 0.56 | 1.15 | 17,825 | 0.005 | 7.4 | 0.48 | 0.51 | 1.06 | 0.48 | 0.51 |
| Au (ppm) | 20,456 | 0.001 | 15.64 | 0.23 | 0.58 | 2.51 | 17,826 | 0.005 | 15.64 | 0.23 | 0.53 | 2.34 | 0.22 | 0.54 | |
| Ag (ppm) | 15,550 | 1 | 24 | 1.35 | 1.36 | 1.01 | 15,640 | 0.5 | 24 | 1.01 | 1.45 | 1.44 | 0.91 | 1.28 | |
| Density (g/cm3) | 20,576 | 1.71 | 8.76 | 3.3 | 0.31 | 0.1 | 17,963 | 1.71 | 8.76 | 3.29 | 0.3 | 0.09 | 3.21 | 0.32 | |
| 1203 | Cu (%) | 12,692 | 0.01 | 10.5 | 1.4 | 1.19 | 0.84 | 10,615 | 0.005 | 10.5 | 1.39 | 1.11 | 0.79 | 1.28 | 1.01 |
| Au (ppm) | 12,692 | 0.01 | 17.95 | 0.9 | 1.25 | 1.4 | 10,614 | 0.005 | 17.95 | 0.89 | 1.21 | 1.35 | 0.79 | 1.25 | |
| Ag (ppm) | 9,021 | 1 | 29 | 2.88 | 2.78 | 0.96 | 9,015 | 0.5 | 29 | 2.77 | 2.83 | 1.02 | 2.6 | 2.98 | |
| Density (g/cm3) | 12,794 | 1.32 | 5.81 | 3.63 | 0.48 | 0.13 | 10,747 | 1.32 | 5.62 | 3.62 | 0.46 | 0.13 | 3.57 | 0.46 | |
| 2103 | Cu (%) | 6,780 | 0.01 | 4.7 | 0.47 | 0.49 | 1.04 | 6,209 | 0.005 | 4.7 | 0.47 | 0.46 | 0.98 | 0.46 | 0.43 |
| Au (ppm) | 6,781 | 0.01 | 16.12 | 0.2 | 0.66 | 3.32 | 6,210 | 0.005 | 16.12 | 0.2 | 0.59 | 3.03 | 0.18 | 0.5 | |
| Ag (ppm) | 5,740 | 1 | 11 | 1.37 | 1.08 | 0.79 | 5,750 | 0.5 | 11 | 1.04 | 1.18 | 1.14 | 1.02 | 1.14 | |
| Density (g/cm3) | 6,821 | 211 | 5.24 | 3.17 | 0.34 | 0.11 | 6,262 | 2.11 | 4.7 | 3.17 | 0.33 | 0.1 | 3.12 | 0.34 | |
| 2203 | Cu (%) | 4,999 | 0.01 | 6.9 | 1.34 | 0.97 | 0.72 | 4,425 | 0.005 | 6.9 | 1.33 | 0.91 | 0.69 | 1.26 | 0.88 |
| Au (ppm) | 4,999 | 0.01 | 17.37 | 0.7 | 1.14 | 1.63 | 4,425 | 0.005 | 17.37 | 0.69 | 1.07 | 1.56 | 0.59 | 0.97 | |
| Ag (ppm) | 4,005 | 1 | 17 | 3.53 | 2.57 | 0.73 | 4,015 | 0.5 | 17 | 3.47 | 2.61 | 0.75 | 3.35 | 2.61 | |
| Density (g/cm3) | 5,034 | 2 | 5.54 | 3.47 | 0.39 | 0.11 | 4,470 | 2 | 5.14 | 3.46 | 0.37 | 0.11 | 3.4 | 0.38 | |
89
Both the assay and composite statistics show much lower copper and gold grade variability in the high grade domains (1203 and 2203) than the low grade domains (1103 and 2103). It can also be seen how the compositing process reduces the grade variability.
14.2.7 Variogram Analysis
Correlograms were selected as the tool to measure the grade variability and continuity. Correlograms are less sensitive to local high variability than the variogram and show better results for the spatial continuity modeling.
Correlograms were calculated and modeled for Cu, Au, Density, Ag, C, S, Mo, F, U using composites from the four domains.
14.2.7.1 Down the Hole Correlogram Models
Down the hole correlograms were performed along the drill hole line with composite data, lag spacing of 2.0 m and tolerance of 50%. Figures 14.9 and 14.10 present the correlograms applied for down-the-hole analysis for copper and gold, respectively.
Figure 14.9
Down-the-Hole Copper Correlogram
![]()
90
Figure 14.10
Down-the-Hole Gold Correlogram
![]()
14.2.7.2 Directional Correlogram Models
Three-dimensional grade continuity was modelled using directional correlograms. The nested sills and ranges modeled define the continuity applied during the OK block grade interpolation. Figure 14.11 is an example of a copper correlogram modeled for the 1203 domain.
Table 14.10 details the variographic parameters modelled for copper, gold and density for each of the four domains.
91
Figure 14.11
Directional Correlogram for the Three Main Anisotropic Directions with Parameters
![]()
92
Table 14.10
Variographic Parameters for Copper, Gold and Density - Directional Models and Domains
| Domain | Variable | Direction | Nugget | Sill 1 | Range 1 | Sill 2 | Range 2 |
| 1103 | Cu | N130/90 | 0.65 | 0.28 | 10 | 0.07 | 100 |
| N130/0 | 10 | 65 | |||||
| N220/0 | 5 | 55 | |||||
| Au | N135/80 | 0.82 | 0.13 | 10 | 0.05 | 150 | |
| N135/-10 | 10 | 100 | |||||
| N225/0 | 5 | 50 | |||||
| Density | N135/-10 | 0.43 | 0.32 | 60 | 0.25 | 400 | |
| N135/80 | 60 | 350 | |||||
| N45/-5 | 60 | 160 | |||||
| 1203 | Cu | N115/90 | 0.40 | 0.40 | 25 | 0.20 | 125 |
| N115/0 | 15 | 75 | |||||
| N205/0 | 10 | 40 | |||||
| Au | N130/90 | 0.64 | 0.26 | 25 | 0.10 | 130 | |
| N130/0 | 15 | 115 | |||||
| N220/0 | 9 | 40 | |||||
| Density | N135/-10 | 0.40 | 0.50 | 30 | 0.10 | 350 | |
| N135/80 | 40 | 270 | |||||
| N45/-5 | 25 | 40 | |||||
| 2103 | Cu | N110/90 | 0.70 | 0.27 | 10 | 0.03 | 130 |
| N110/0 | 15 | 60 | |||||
| N200/0 | 5 | 55 | |||||
| Au | N120/90 | 0.85 | 0.11 | 15 | 0.04 | 200 | |
| N120/0 | 20 | 150 | |||||
| N210/0 | 5 | 25 | |||||
| Density | N120/30 | 0.25 | 0.35 | 30 | 0.40 | 900 | |
| N35/80 | 60 | 450 | |||||
| N35/-10 | 60 | 100 | |||||
| 2203 | Cu | N110/90 | 0.45 | 0.30 | 10 | 0.25 | 200 |
| N110/0 | 40 | 120 | |||||
| N200/0 | 5 | 80 | |||||
| Au | N100/80 | 0.70 | 0.10 | 70 | 0.20 | 400 | |
| N100/-10 | 30 | 160 | |||||
| N190/0 | 20 | 60 | |||||
| Density | N120/10 | 0.35 | 0.40 | 20 | 0.25 | 550 | |
| N35/80 | 40 | 350 | |||||
| N35/-10 | 20 | 120 |
14.2.8 Boundary Conditions
Table 14.11 details the boundary conditions that were applied to the model with respect to the sharing of composites between domains. A soft boundary was used between the low grade domains 1103 and 2103 during the estimation of Cu, Au, Ag and S grades. Hard boundaries were applied to the estimation of density and all other elements in the low grade domains. Hard boundaries were used in estimating grades for all elements and density within the high grade 1203 and 2203 domains.
93
Table 14.11
Block Model Boundary Conditions
| Sector | Ore Definition | Ore Code | Cu (%) | Au (ppm) | Ag (ppm) | S (%) | De (g/cm3) | C (%) | F (ppm) | Mo (ppm) | U (ppm) |
| SE | Low Grade (Biotite Schist) | 1103 | 1103 & 2103 | 1103 | |||||||
| NW | 2103 | 2103 | |||||||||
| SE | High Grade (Magnetite Schist) | 1203 | 1203 | ||||||||
| NW | 2203 | 2203 | |||||||||
14.2.9 Resource Estimation
Block estimation for all variables was performed using a three passes of OK. An additional pass was performed to estimate uninformed blocks and is used to define exploration targets only (no blocks from this last pass were classified as resources). Block discretization was set to 5 x 5 x 5 discretization points for the 15 x 15 x 15 m blocks. Table 14.12 shows the block model set up parameters.
Table 14.12
Parameters Used in the Block Modeling Process
| Direction | Origin | Block Dimension (m) | No. of Blocks | Interpolation Method |
| X | 548,540 | 15 | 348 | |
| Y | 9,359,800 | 15 | 150 | OK |
| Z | -21.27 | 15 | 67 |
The most recent independent auditing process and peer review prior to this technical report was conducted by Golder in 2010.
14.2.10 Model Validation
The final mineral resource block models are validated using a number of checks. The first check is a visual comparison to ensure that interpolation honours the data and the interpolation envelope (wireframe). Figures 14.12 and 14.13 show the main lithologies and grade (high and low) envelopes for section 100 southeast; the lithology and mineralized models both show reasonably good correlation with drill hole information.
94
Figure 14.12
Vertical Section (100SE) Showing Principal Lithologies
![]()
Figure 14.13
Vertical Section (100SE) showing Low Grade (Blue) and High Grade (Red) Intersection
![]()
As part of the sectional validation process, the input composite samples are compared to the block model grades within a series of coordinate slices, or swaths of 15.0 m (matching the SMU size). The results of which are then displayed on graphs to check for visual discrepancies between grades with orientation slices through the deposit.
Swath plots (trend analysis) showing average grades of the block model against Cu and Au grades in samples according to easting, northing, and elevation slices are presented for the NW sector for copper in Figure 14.14, and for the southeast sector in Figure 14.15, respectively. The corresponding plots for gold are shown in Figure 14.16 and Figure 14.17, respectively. The resultant plots show a reasonable correlation between the block model grades and the original data, as would be expected.
95
Figure 14.14
Copper Validation Plot for the NW Sector
(Easting, Northing, and Elevation)
![]()
Figure 14.15
Copper Validation Plot for the SE Sector
(Easting, Northing, and Elevation)
![]()
96
Figure 14.16
Gold Validation Plot for the NW Sector
(Easting, Northing and Elevation)
![]()
Figure 14.17
Gold Validation Plot for the SE Sector
(Easting, Northing and Elevation)
![]()
The samples statistics validation are used to establish a better understanding of any changes in terms of composites samples against respective estimation evaluation using OK and Nearest Neighbour (see Table 14.13) .
The solids validation is previously used for a better understanding of what changed in terms of the constructed and redefined solids and their respective volume and number of solids generated about remodeling ore boundaries. The trend analysis is useful to compare the data variability and values along coordinates (X, Y, Z) over the deposit and estimates values. The scatter diagrams are performed to provide punctual comparison between data samples and block estimates on the sample location.
The global grade estimate for the block model should be similar to the global grade estimated from the samples and any discrepancies are investigated and resolved. There is reasonable agreement among the various samples and block model data sets.
97
Table 14.13
Univariate Statistics of Raw Data and Estimations (OK, Nearest Neighbour)
![]()
98
As can be seen in Figure 14.18, the OK evaluation for copper grade is slightly greater than the raw data (within 2%) whilst that for gold is slightly underestimated against raw data.
Figure 14.18
Global Comparison of Raw Declustered Composite Data and OK Estimate
![]()
14.3 MICON OPINION
Micon’s review found that the degree of geological evaluation by Vale personnel is appropriate and that the geology, mineral controls and geometry of mineral zone are adequately delineated from exploration work. Geologic interpretation is reasonable, with consistent correlations of mineral zones between cross sections. Furthermore, Micon concludes that the mineralization within the Salobo deposit is quite predictable and relatively uniform within the modelling parameters which were used to create the mineral resource models.
14.4 MINERAL RESOURCE CLASSIFICATION
14.4.1 General
Mineral resource model blocks are classified as Measured, Indicated or Inferred mineral resources, in accordance with CIM guidelines. Vale’s long-term mine planning and design process then converts Measured and Indicated mineral resources within the current LOM open pit design into Proven and Probable mineral reserves, respectively.
99
Therefore, Mineral Resources at Salobo Mine are stated exclusive of Mineral Reserves. Mineral Resources at Salobo Mine thus comprise:
Measured, Indicated and Inferred Mineral Resources outside, but adjacent to, the current LOM open pit design, that Micon considers to have reasonable prospects for economic extraction based on its analysis of an optimized pit shell generated using three-year trailing average metal prices of $3.67/lb for copper and $1,500/oz for gold, with all other pit optimization parameters kept the same as for the current LOM open pit optimization described in Section 15.0 of this report. Figure 14.20 shows a cross-section of this ‘Phase 8’ resource shell relative to the operational LOM pit design (Phase 7) and the mineral resources contained in this envelope.
Inferred Mineral Resources located within the current LOM open pit design that are considered too speculative geologically to have the economic considerations applied to them that would enable them to be categorized as Mineral Reserves. In the LOM open pit production schedule, this Inferred Resource material is planned to be stockpiled separately.
Figure 14.19
Optimized Pit Shell Constraining Resource Estimate Compared to LOM Pit Design
![]()
The economic cut-off of 0.296% Cu has been calculated using the following equation and the parameters in Table 14.14:
![]()
100
Table 14.14
Cut-off Grade Parameters
| Parameter | Description | Units | Value |
| CPT | Total cost of the processing, G&A and stockpile reclaim | US$/t | See note below |
| PrCu | Copper Price | US$/lb | 3.45 |
| CvCu | Copper Sales Cost | US$/lb | See note below |
| RCCu | Average Copper Recovery to Concentrate | % | See note below |
| RFCu | Smelter Copper Recovery | % | See note below |
| PT | Loss in Concentrate Transport | % | See note below |
| 22.0462 | Conversion factor tonnes to lbs (000) | factor | 22.0462 |
It should be noted that Vale considers the values of these parameters to be confidential. Nevertheless, Micon has reviewed the cut-off grade calculation and considers it to be reasonable.
The equivalent copper grade (CuEq) has been calculated for each block individually and stored into the following block model using the following equation using the parameters listed in Table 14.15:
![]()
Table 14.15
CuEq Cut-off GradeParameters
| Parameter | Description | Units | Value |
| Cu | Copper grade in block model | US$/t | From Model |
| Au | Gold grade in block model | g/t | From Model |
| PrCu | Copper Price | US$/lb | 3.45 |
| PrAu | Gold Price | US$/oz | 1,150 |
| CvCu | Copper Sales Cost | US$/lb | See note below |
| CvAu | Gold Sales Cost | US$/oz | See note below |
| RCCu | Copper Recovery to Concentrate | % | Calculated |
| RCAu | Gold Recovery to Copper Concentrate | % | Calculated |
| RFCu | Smelter Copper Recovery | % | 96.70 |
| RFAu | Smelter Gold Recovery | % | 93.94 |
| 31.103 | Conversion factor troy oz to g | g/oz | 31.103 |
| 22.0462 | Conversion factor tonnes x grade (% Cu) to lbs Cu | factor | 22.0462 |
It should be noted that Vale considers the values of these parameters to be confidential. Nevertheless, Micon has reviewed the copper equivalent grade calculations and considers them to be reasonable.
The copper and gold recoveries are calculated with using equations derived from an empirical relationship between head grade and recovery into concentrate. The calculated recovery values are stored for each block in the block model. Vale considers these grade/recovery equations to be confidential. Nevertheless, Micon has reviewed the recovery calculations and considers them to be reasonable.
101
The resource classification procedure is basically related to the geometric configuration of the data in the kriging neighborhood. The determination of uncertainty measurements from simulations has the advantage of also depending on the structure of spatial variability.
14.4.2 Measured Mineral Resources
The current parameters used to define Measured mineral resources at Salobo (see Table 14.16) are as follows: First neighbourhood (1st pass based generally on 95% of the sill of the 1.0 x correlogram range) with the anisotropic distance of the nearest sample less than 1/2 range of Cu correlogram (generally based on 95% and 100% of the sill related to 1.0 x correlogram range), number of samples (minimum 2 holes) greater than 16 for wide mineralization with wide structural control.
Table 14.16
Geometric Parameters for the 1st Running Pass of Variographic Domains (Measured)
| Domain | Min. Number of Samples | First Pass–1 x Correlogram Range = Measured | ||||||
| Number of Angular Sectors | Optimum Number of Samples per Sector | Select all samples in the Target Block? | Block Disc-ret | Use AnisotropicDistances According to Search Ellipsoid | Min Dist between 2 selected Samples (m) | Max dist w/o any Sample (half p 100% range (m) | ||
| 1103 | 16 | 8 | 3 | Yes | 5x5x5 | Yes | 4 m | 50 m) |
| 1203 | 16 | 8 | 3 | Yes | 5x5x5 | Yes | 4 m | 65 m) |
| 2103 | 16 | 8 | 3 | Yes | 5x5x5 | Yes | 4 m | 65 m |
| 2203 | 16 | 8 | 3 | Yes | 5x5x5 | Yes | 4 m | 100 m |
14.4.3 Indicated Mineral Resources
The current parameters used to define Indicated mineral resources (Table 14.17) at Salobo is follows: Second neighbourhood (2nd pass 2.0 x correlogram range) based generally on 95% of the sill of the 2.0 x correlogram range, number of samples (minimum 2 holes) greater than 16 for wide mineralization with wide structural control).
14.4.4 Inferred Mineral Resources
The current parameters used to define Inferred mineral resources (Table 14.18) at Salobo is as follows: Third neighbourhood (3rd pass) within the third anisotropic neighbourhood ellipsoid of 3.0 x correlogram range based generally on 95% of the sill of 1.0 x correlogram range plus number of samples greater than 4.
102
Table 14.17
Geometric Parameters for the 2nd Running Pass of Variographic Domains (Indicated Mineral Resources)
| Domain | Min. Number of Samples | Second Pass–2 x Correlogram Range = Indicated | ||||||
| Number of Angular Sectors | Optimum Number of Samples per Sector | Select all samples in the Target Block? | Block Discret | Use Anisotropic Distances According to Search Ellipsoid? | Min Dist between 2 selected Samples (m) | Max dist w/o any Sample (half p 100% range (m) | ||
| 1103 | 16 | 8 | 3 | Yes | 5x5x5 | Yes | 4 | 80 |
| 1203 | 16 | 8 | 3 | Yes | 5x5x5 | Yes | 4 | 100 |
| 2103 | 16 | 8 | 3 | Yes | 5x5x5 | Yes | 4 | 85 |
| 2203 | 16 | 8 | 3 | Yes | 5x5x5 | Yes | 4 | 130 |
Table 14.18
Geometric Parameters for the 3rd Running Pass of Variographic Domains (Inferred Mineral Resources)
| Domain | Min. Number of Samples | Third Pass–3 x Correlogram Range = Inferred | ||||||
| Number of Angular Sectors | Optimum Number of Samples per Sector | Select all samples in the Target Block? | Block Discret | Use Anisotropic Distances According to Search Ellipsoid? | Min Dist between 2 selected Samples (m) | Max dist w/o any Sample (half p 100% range (m) | ||
| 1103 | 4 | 8 | 3 | Yes | 5x5x5 | Yes | 4 | - |
| 1203 | 4 | 8 | 3 | Yes | 5x5x5 | Yes | 4 | - |
| 2103 | 4 | 8 | 3 | Yes | 5x5x5 | Yes | 4 | - |
| 2203 | 4 | 8 | 3 | Yes | 5x5x5 | Yes | 4 | - |
14.5 LOCATION OF MINERAL RESOURCES
Figure 14.20 illustrates the relative horizontal location of Measured (red), Indicated (blue) and Inferred (grey) mineral resources at the Salobo deposit within the current LOM open pit design. All Measured and Indicated mineral resources within that pit design have been converted to Proven and Probable mineral reserves. The current LOM open pit design contains Inferred mineral resources that, at the time of preparing the mineral resource estimate, do not have sufficient data and confidence to convert to Indicated or Measured mineral resources.
Figure 14.21 and Figure 14.22 show the mean distances established from the OK estimation for the main running processes for Cu and Au variables, respectively. It can be seen that both examples display a good grade continuity for the gold variable as well, indicated by a wider mean distance grid categorization related to the geometric and spatial gold control.
103
Figure 14.20
General Overview of the Mineral Resource Classification (Horizontal Profile)
![]()
Figure 14.21
Mean Distances in the OK Block Modeling Process for Copper Variable
![]()
104
Figure 14.22
Mean Distances in the OK Block Modeling Process for Gold Variable
![]()
14.6 DETERMINATION OF PROSPECTS FOR ECONOMIC EXTRACTION
The following methodology was used to derive an optimized pit shell to constrain the mineral resource estimate, and to determine its potential viability:
Three-year rolling average copper and gold price were used in a Whittle optimization.
Determine reasonableness of mineral resource pit extents, especially any impact on planned mine infrastructure (e.g., waste lay down areas and processing facilities).
Consideration of the distribution of deleterious minerals.
Consideration of adequacy of waste storage capacity, etc.
Apply a cut-off grade of 0.296% CuEq, consistent with the cut-off grade used for mineral reserves.
Prepare a provisional extension of the LOM production schedule to include material above this cut-off grade.
Apply price and exchange rate assumptions to forecast cash flows, including appropriate provision for sustaining capital and operating costs.
105
- Determine if the mineral resource estimate demonstrates a positive cash flow.
Based on this analysis, Micon is satisfied that the mineral resource stated below has reasonable prospects for economic extraction.
14.7 MINERAL RESOURCE STATEMENT
A summary of the mineral resources for the Salobo Mine is presented in Table 14.19.
Table 14.19
Salobo Mineral Resources as at 31 December, 2012 Above Cut-off 0.296% CuEq
| Classification | Units | Measured | Indicated | Measured and Indicated | Inferred |
| Within Current LOM Open Pit | Mt | - | - | - | 15 |
| % Cu | - | - | - | 0.6 | |
| Au g/t | - | - | - | 0.3 | |
| Adjacent to Current LOM Pit | Mt | 49.1 | 195.4 | 244.5 | 133 |
| % Cu | 0.82 | 0.72 | 0.74 | 0.6 | |
| Au g/t | 0.47 | 0.37 | 0.39 | 0.3 | |
| Total | Mt | 49.1 | 195.4 | 244.5 | 148 |
| % Cu | 0.82 | 0.72 | 0.74 | 0.6 | |
| Au g/t | 0.47 | 0.37 | 0.39 | 0.3 |
| 1. | Mineral Resources stated as at 31 December, 2012. | |
| 2. | Mineral Resources are classified according to CIM guidelines. | |
| 3. | Mineral Resources are reported exclusive of Mineral Reserves. | |
| 4. | Figures may not compute due to rounding and to reflect that mineral resources are an estimate. | |
| 5. | Mineral Resource is constrained within an optimized pit shell based on rolling three year average prices for copper ($3.67/lb) and gold ($1,500/oz). | |
| 6. | A cut-off grade of 0.296% Cu was applied to CuEq grades calculated in the block model using a copper price of $3.45/lb and a gold price of $1,150/oz. | |
| 7. | There are no known legal, political, environmental, or other risks that could materially affect the potential development of the mineral resources |
Mineral Resource and Mineral Reserve estimates are classified according to the Canadian Institute of Mining, Metallurgy and Petroleum (CIM) Definition Standards of Mineral Resources and Mineral Reserves and CIM Best Practice Guidelines. Mineral Resources that are not Mineral Reserves do not have demonstrated economic viability.
The Measured and Indicated mineral resources estimated within the Salobo open pit are converted to mineral reserves through long-term mine planning and are excluded from the resources stated above.
14.8 MICON OPINION
To the best knowledge of the author the stated mineral resources are not materially affected by any known environmental, permitting, legal, title, taxation, socio-economic, marketing, political or other relevant issues, unless stated elsewhere in this report. There are no known mining, metallurgical, infrastructure or other factors that materially affect this mineral resource estimate.
106
The mineral resource estimate presented herein was completed by Cássio Diedrich, Geostatistician for Vale, and reviewed herein by Jason Ché Osmond, C.Geol., Senior Geologist for Micon, who accepts responsibility for the estimate presented in this technical report. It is prepared in accordance with the current standards and definitions required under NI 43-101 and is, therefore, reportable as a mineral resource.
Micon reviewed the sample information and plots of the composites and resource model, along with the various reports and reviews by other consultants. Micon was provided full access to all of the files used and results obtained in establishing this mineral resource model and estimate. Based on this available information, Micon concludes that the Salobo mineral resource modelling has been conducted using standard industry methods and is believed to reasonably represent the deposit tonnage and copper and gold grades. The protracted generation of check estimates also shows that the estimate is relatively robust, with potential modifications to the modelling parameters generally resulting in relatively minor changes to the overall mineral resource (particularly over the last seven years). Micon believes that the mineral resource model is an acceptable basis for the subsequent estimation of mineral reserves. This mineral resource estimate is current as of 31 December, 2012.
107
15.0 MINERAL RESERVE ESTIMATES
15.1 STATEMENT OF MINERAL RESERVES
Vale’s 2012 block model forms the basis of Salobo’s mineral reserves and resources. Mineral reserve estimates are derived from this block model by applying the appropriate technical and economic parameters, within the 2011 ultimate pit design. Key parameters are calculated separately for each discrete mining block, based on geometry and mining method, as detailed in this Section of the technical report. Copper equivalent grades were calculated using metal prices of $3.45/lb for copper and $1,150/oz for gold. The cut-off grade of 0.296% Cu applied to the 2012 block model reflects Vale’s forecasts of direct operating costs, recoveries and metal prices, etc. The mineral reserve includes planned mining dilution of 5% with 100% recovery. Micon has reviewed these and other assumptions used in the reserve estimation process and concludes that they remain appropriate for the determination of a mineral reserve.
The change in mineral reserves reported in 2011 and 2012 is less than 1% (Vale, 2013). In Micon’s opinion, therefore, the optimized pit shell generated in 2011 remains valid as a basis for the final open pit mine design, from within which the mineral reserves reported in this Technical Report are derived.
The mineral reserve estimate for the Salobo Mine as of 31 December, 2012 is presented in Table 15.1. The figures in the table are rounded to reflect that the numbers are estimates. The conversion of mineral resources to mineral reserves includes technical information that requires subsequent calculations or estimates to derive sub-totals, totals and weighted averages. Such calculations or estimations inherently involve a degree of rounding and consequently introduce a margin of error. Where these occur, Micon does not consider them to be material.
Table 15.1
Mineral Reserves as of 31 December, 2012 above Cut-off 0.296% CuEq
| Mine / Period | 2012 | |||
| Proven | Probable | �� Total | ||
| Salobo Pit | Mt | 635.0 | 485.8 | 1,120.9 |
| Cu (%) | 0.77 | 0.66 | 0.72 | |
| Au (g/t) | 0.42 | 0.32 | 0.38 | |
| Stockpiles | Mt | 1.8 | - | 1.8 |
| Cu (%) | 0.61 | - | 0.61 | |
| Au (g/t) | 0.36 | - | 0.36 | |
| Total | Mt | 636.8 | 485.8 | 1,122.6 |
| Cu (%) | 0.77 | 0.66 | 0.72 | |
| Au (g/t) | 0.42 | 0.32 | 0.38 | |
Vale, 2013.
To the best of Micon’s knowledge there are no legal, political, environmental, or other issues which would materially affect development of the Mineral Reserve estimated above.
108
15.2 MINERAL RESERVE ESTIMATION METHODOLOGY
Data exported from the resource block model is used in Whittle Four-XTM (Whittle) for pit optimization. The Whittle pit optimization inputs include:
- Estimated on-site operating costs
- Technical constraints (production limits, mine recovery, dilution, geotechnical)
- Metallurgical recovery
- Metal prices and exchange rates
The Whittle optimization generated a set of incremental nested pit shells from which the ultimate pit shell was selected. This ultimate pit shell was then exported back into GEMS in order to develop a detailed design of the pit limits and phased pushbacks. The pushbacks were chosen based on tonnage, grades, stripping ratio and/or other operational constraints. In addition, other technical and economic parameters were incorporated into the final designed pit.
From this pit design, a schedule of waste and ore production was prepared by Vale using Mine Plan v2.037 software. Using appropriate software, Vale also developed a waste dump design and estimated equipment fleet size. A forecast of mine unit costs was then made.
Micon has reviewed the schedules and estimates and has confirmed the economic viability of the resulting mineral reserve estimate using a cash flow model, discussed further in Section 22.0 of this report.
15.3 PIT OPTIMIZATION PARAMETERS
15.3.1 Metal Price and Exchange Rates
Vale’s strategic view of long term metal prices and exchange rates is considered confidential.
Nevertheless, Micon has reviewed the metal prices and exchange rate assumptions used in the pit optimization process and concludes that they remain appropriate for the determination of a mineral reserve.
15.3.2 Mine Recovery and Dilution
A mine recovery factor of 100% and a dilution factor of 5% are deemed appropriate for bulk mining of this type of deposit in a large-scale open pit operation, such as Salobo.
15.3.3 Geotechnical
Geotechnical studies have been conducted by independent consultants, as described in Section 16.1.1 of this report. The slope parameters applied in the open pit optimization and design are in accordance with the findings of those studies.
109
15.3.4 Production Constraints
Nominal capacity of Salobo’s Phase I process plant is 12 Mt/y. A Phase II expansion is currently underway which is expected to double capacity to 24 Mt/y. Therefore, the mine will need to prepare in advance sufficient working faces to supply this feed tonnage.
Excess production capacity is required to allow for stockpiling of low to medium grade material. A mining fleet capacity limit of 126 Mt/y has been anticipated.
15.3.5 Metallurgical Recovery
The methods used to forecast recovery of copper and gold into copper concentrate are discussed in Section 13.3.1. Appropriate recoveries for copper and gold were applied to each block in the resource model using these regression formulae.
The highest copper grade present inside the block model is 3.59% which is predicted to provide a maximum copper recovery of 89.6% . As for gold, the highest grade inside the block model is 4.15 g/t, corresponding to a maximum gold recovery of 75.5% .
Appropriate factors for determining payable metal recovered during smelting and refining were also applied for copper and gold.
15.3.6 Operating Costs
Vale’s strategic forecast of mine site direct costs and off-site costs is considered confidential. Nevertheless, Micon has reviewed the cost assumptions used in the pit optimization process and concludes that they remain appropriate for the determination of a mineral reserve.
15.4 PIT OPTIMIZATION
Open pit optimization was performed using Whittle Four-XTMv4.4. A 5%, zero-grade material dilution factor was included and a 100% material recovery was assumed for pit optimization, to account for selectivity when mining at the contacts of the ore body. Also, a Mining Cost Adjustment Factor (MCAF) was applied to account for incremental increases in haulage cost with depth. The resulting cost increases above and below the 250 masl datum are $0.016/t and $0.046/t, respectively. In addition to the above, a discount factor of 8% per year was included to account for the time value of money, assuming an annual drop-down rate of five benches.
Sensitivity of the pit to metal price assumptions was determined by generating a set of 100 nested pit shells by varying the copper price from 50% of the base price to 150% of the base price.
During its review, Micon independently generated a series of 25 pit shells corresponding to possible pit phases. This enabled Micon to confirm that the copper price assumption used to generate the ultimate pit shell (used to guide Vale’s final mine design) is reasonable and appropriate. Figure 15.1 illustrates the results obtained in Micon’s pit optimization showing mined material (waste and ore) and undiscounted cash flow for each pit shell.
110
Figure 15.1
Micon Pit Optimization Chart for Salobo Mine
![]()
An annual mine production schedule was prepared using Vale’s pit design and phases. The annual mine production schedule was prepared by strategically targeting the grades and tonnages to be produced. This includes the feed to the processing plant, material stockpile and the provision of moving waste material.
Micon notes that even when a copper price of $5.10/lb is used in the optimization, none of Salobo Mine’s infrastructure or operational facilities such as stockpiles, waste management facilities or tailings storage facility fall within the pit shell. This condemnation pit limit provides a buffer against unexpected costs arising in any future redesign of the open pit. The pit shell that Micon has used to constrain the reported mineral resources lies within this condemnation pit limit. Figure 15.2 presents a graphical representation of the condemnation pit limit compared to the current LOM open pit design.
111
Figure 15.2
Comparison of Current LOM Open Pit Design and Condemnation Pit Limits
![]()
15.5 MICON OPINION
Table 15.2 shows the comparison of the tonnages for the Micon-generated optimized pit shell as compared to the designed final pit from Vale. The designed pit has 9% more waste and 7% less ore than the Whittle shell. While Micon considers these changes to be reasonable, it is possible that further refinement of the pit design may enable Vale to match the optimized pit shell more closely.
Table 15.2
Comparison of Pit Design and Whittle Pit Shell
(Million tonnes)
| Vale Pit Design | Whittle Shell | Change (%) | |
| Measured | 569 | 603 | -6 |
| Indicated | 544 | 595 | -9 |
| Measured+Indicated | 1,113 | 1,198 | -7 |
| Waste | 1,927 | 1,768 | 9 |
| Total Material | 3,040 | 2,966 | 3 |
| Strip Ratio | 1.73 | 1.48 | 17 |
Micon believes the key assumptions, parameters and methods used to convert mineral resource to mineral reserve are appropriate. There are no known mining, metallurgical, infrastructure, permitting or other relevant factors that may materially affect the mineral reserve estimate.
112
The various plans and presentations provided by Vale demonstrate that this work is being carried out to industry standard. The Salobo Mine planning processes are sound and appear to be competently carried out.
By duplicating Vale’s results, Micon was able to independently confirm that the Whittle pit results are consistent with Vale’s stated assumptions and design parameters.
113
16.0 MINING METHODS
The mineral reserve at the Salobo Mine is being extracted using conventional open pit mining methods using shovels, trucks and drills. Pre-stripping of the site has been completed and the mine is forecast to ramp up ore production to the Phase I target of 12 Mt/y in 2014 and, with the Phase II expansion, to 24 Mt/y by 2016 (see Figure 16.1). Note: these figures include a 3% allowance for moisture content; tonnages shown in the chart are on dry basis.
Figure 16.1
Projected Ore Mining Ramp-Up
![]()
The mining equipment presently includes three Bucyrus rope shovels (42 yd3/32 m3), a Komatsu hydraulic excavator (38 yd3), two LeTourneau wheel loaders (33 yd3), and a fleet of Komatsu (240-t) and Caterpillar (360-t) haul trucks for material removal from the pit.
The drilling fleet consists of electrical and diesel powered Atlas Copco and Bucyrus-Erie single pass rotary drills equipped for drilling 311 mm holes. Cuttings from the drilled holes are assayed for grade control. Auxiliary drilling requirements such as pre-splitting are performed by smaller drills with capacity for drilling 114 to 250 mm holes.
Various bulldozers (track and wheel), graders, fuel and water trucks and other ancillary equipment maintain the pit benches, production areas and haul roads, construct waste piles, and generally support mine production.
Blasting at the Salobo Mine uses either heavy ANFO or emulsion explosives. The blasted material is loaded by cable shovels, wheel-loaders or hydraulic excavator onto haul trucks (218 and 327 tonne capacity) to the waste dump, the primary crusher, or stockpiles, as appropriate. Low (0.30 -0.60% CuEq) and medium (0.60 -0.85% CuEq) grade ore is stockpiled for later processing.
114
After the ore is crushed at the primary/secondary crushers, the material is then transported 1.5 km on a pipe conveyor belt to the crushed ore stockpile located near the processing plant.
16.1 MINE DESIGN CRITERIA
Table 16.1 shows the general pit design criteria for Salobo Mine.
Table16.1
Pit Design Criteria
| Criteria | Units | |
| Bench height - Saprolite | m | 7.5 |
| Bench height - Single | m | 15.0 |
| Bench height - Double | m | 30.0 |
| Berm in Bedrock | m | 8.0 – 12.5 |
| Ramp width | m | 35 – 42 |
| Ramp decline grade | % | 10 |
BVP, 2007.
A plan view of the Salobo Mine complex showing the ultimate pit is presented in Figure 16.2.
Figure 16.2
Salobo Mine Complex
![]()
115
16.1.1 Geotechnical Analysis and Slope Design
Early geotechnical studies, begun in the late 1980s, comprised primarily structural and discontinuity mapping. In 1993, Sergio Brito Consulting (SBC) in conjunction with Piteau and Associates were contracted to assess the rockmass and define bench face and overall slope angles at a pre-feasibility level. This work identified several geotechnical slope domains for design in an open pit.
In 1994, SBC reported hydraulic conductivity data that showed the rock mass to be either impermeable or low permeability, almost 90% having a permeability of less than 10-5 cm/s.
In 1997, a 7-hole geotechnical drill program collected 3,847 m of NQ core for analysis. SBC conducted field-work, data collection and laboratory testwork to determine the intact rockmass strength characteristics. Golder Associates was commissioned to oversee the data collection and data analysis to support a feasibility study.
SBC prepared a compilation of data and seven additional geotechnical holes (FGEOT 8-14) were drilled between 2003 and 2004, comprising 3,743 m of oriented core. New stereographic interpretations were generated for 6,500 data points that identified a sixth joint set. Kinematic assessment identified the likely pit slope failure modes to be planar, toppling and discrete wedges
In 2007, BVP consolidated all available geotechnical information and provided recommendations for a 24 Mt/y pit design.
The intact rock was reported to be ‘strong’ with Uniaxial Compressive Strength (UCS) results (excluding weathered material) ranging from 50 to 200 MPa. Shear resistance laboratory testing was performed and found friction angles of 33° for foliation, 38° for joint sets and approximately 27° for fault/shear zones after testing the various unweathered rock types. Figure 16.3 shows a typical rock face in the open pit.
Other geotechnical studies conducted are as follows:
- Installing wells and completing pumping tests in fault systems.
- Performing surface seismic refraction testing.
- Geotechnical mapping in the exploration drift.
- Outcrop mapping.
- Kinematic analysis of rock discontinuity data,
- Limit equilibrium analysis for pit slopes.
- Hydrogeological modeling for evaluation of pit dewatering equipment.
116
Figure 16.3
Evidence of Competent Rock Mass (Half barrels)
![]()
Based on the updated geotechnical information and reassessment, BVP concluded that there is general trend of the foliation and the pit can be divided into two new structural domains, northwest and southeast domains as presented in Figure 16.4, which also shows the location of the geotechnical drill holes.
Figure 16.4
Salobo Mine Proposed Structural Domains
![]()
117
The open pit is divided into seven sectors (Sector I-VII) following the geotechnical design parameters recommended by BVP for the Salobo pit, as presented in Table 16.2 and illustrated in Figure 16.5.
Table 16.2
Geotechnical Design Sectors for Salobo Mine
| Sector | Vertical Berm Spacing (m) | Face Angle (degree) | Berm Width (m) | Inter Ramp Angle (degree) | |
| Saprolite and semi-weathered material | 7.5 or 15 | 52 | 10 | 35.0 | |
| Sector I | I | 15 | 70 | 8 | 48.1 |
| IA | 15 | 70 | 8 | 48.1 | |
| IB | 30 | 70 | 12.5 | 52.0 | |
| IC | 30 | 70 | 12.5 | 52.0 | |
| Sector II | II | 30 | 70 | 12.5 | 52.0 |
| IIA | 15 | 70 | 8 | 48.1 | |
| IIB | 30 | 70 | 12.5 | 52.0 | |
| Sector III | III | 30 | 70 | 12.5 | 52.0 |
| Sector IV | IV | 30 | 70 | 12.5 | 52.0 |
| Sector V | V | 30 | 70 | 12.5 | 52.0 |
| VA | 15 | 70 | 8 | 48.1 | |
| Sector VI | VI | 30 | 70 | 12.5 | 52.0 |
| VIA | 15 | 70 | 8 | 48.1 | |
| VIB | 30 | 70 | 12.5 | 52.0 | |
| VIC | 30 | 70 | 12.5 | 52.0 | |
| VID | 15 | 70 | 8 | 48.1 | |
| Sector VII | VII | 30 | 70 | 12.5 | 52.0 |
Figure 16.5
Geotechnical Design Sectors of the Salobo Pit, Plan View
![]()
118
In 2009, an independent geotechnical review was performed by Peter Stacey of Stacey Mining Geotechnical Ltd (Stacey, 2009) for both of Vale’s Sossego and Salobo projects in Carajás. Stacey recommended additional on-site geotechnical data collection and investigations.
Micon is in agreement with Stacey’s opinion, and considers the quantity of geotechnical and data and investigations at Salobo to be less than for other projects of similar size and stage of development. Nevertheless, having reviewed some of the drill core (see Figure 16.6) and conducted a bench inspection on site, in Micon’s opinion the rockmass does appear to be competent and in line with the assessment made by Vale’s consultants. A further review of the slope design should be completed as the open pit develops, to complement the existing geotechnical model and data collected.
Figure 16.6
Geotechnical Drill Hole FGEOT 14 (Approx. 357–366 m)
![]()
During the site visit, Salobo Mine staff indicated that face mapping and other measures to address the geotechnical recommendations proposed by Vale’s consultants are being implemented.
16.1.2 Drill and Blast Design
Drilling is accomplished with a fleet of rotary blast hole drills, both electric and diesel powered. Patterns are variable based on rock type. For example, drill pattern ranges from 5.5 m x 8.0 m in the schists, 9.0 m x 9.0 m pattern in the oxide saprolites and 4.5 m x 4.5 m in ore.
Normal drill hole diameter is 311 mm (diesel and electric) with 251 mm perimeter drilling using a smaller, diesel powered drill. Drilling is performed vertically with total drill hole length of 17 m (15 m bench and 2 m sub-drill). ANFO and emulsion are used to create a blended emulsion as the primary explosive. The resulting high powder factors (500-750 g/t) result in fine fragmentation, off-setting crushing costs attributable to the abrasiveness and hardness of the ore.
119
Once the mining and milling operation achieve steady state production, Micon suggests that the cost/benefit of the current fine blast fragmentation using a high powder factor in comparison to increased crushing costs with coarser ROM ore be reassessed.
16.1.3 Mining Recovery and Mining Dilution
Mining recovery is a measure of the resource tonnage that is extracted, with losses resulting from planned or unplanned events. For instance, selectivity of the mining equipment is expected to be low due to the size and handling capability of the shovel and loaders. Therefore, it is reasonable to assign a high mine recovery factor in large open pit operations. A 100% mining recovery factor has been applied in the conversion from mineral resource to mineral reserve tonnage.
Internal or planned dilution represents zones of mineralization below the cut-off grade that is unavoidably mined along with mineralization above the cut-off grade due to the selectivity of the equipment. Planned dilution is included in the conversion from mineral resource tonnage and grade to mineral reserve tonnage and grade.
External or unplanned dilution represents avoidable waste tonnage (i.e. blasting) that can typically be controlled as a function of cost-benefit analysis. For example, blast damage can be reduced by decreasing the powder factor (i.e. explosive types), increasing drill density (i.e. wall control) and preventing sympathetic detonation (i.e. electronic detonators). Unplanned dilution is also included in the conversion from mineral resource tonnage and grade to mineral reserve tonnage and grade.
All dilution tonnages are assigned zero grade, which is conservative. A summary of the dilution and mining recovery factors is given in Table 16.3. Current mine planning assumes 100% mining recovery, which is acceptable. However, this assumption may need to be reviewed once further ore reserve reconciliations have been prepared, since Micon would expect that at least 1-2% of material losses may occur due to loss of fines generated by the high blasting fragmentation and during rehandling at the stockpile area.
Table 16.3
Dilution and Mining Recovery Factors
| Units | Comments | ||
| Unplanned Dilution | (%) | 5 | Applied in Whittle to generate the pit shell |
| Operating Dilution | (%) | 5 | .Applied in production schedule |
| Mine Recovery | (%) | 100 | Open pit mining method and loading equipment are non-selective |
| Source: Vale, 2013. |
120
16.1.4 Cut-Off Grade Determination
The break even cut-off grade, as calculated by Whittle on a block-by-block basis, was used to determine the ultimate pit shell, containing the largest volume of material that may be mined and recovered economically.
For reporting purposes, a cut-off grade (COG) for copper was then computed to distinguish waste from ore when material is delivered to the open pit crest. A script was used in the block model to calculate the copper equivalent grade (CuEq) as a function of operating costs, metal prices and metallurgical recoveries of the process plant. The general expression for the equivalent copper grade is given in equation (1):
![]()
| Where: | Cu = Copper grade (%) |
| Au = Gold grade (g/t) | |
| PrAu = Gold Selling price (US$/oz) | |
| CvAu = Gold Selling cost (US$/oz) | |
| RCAu= Gold Flotation recovery (%) | |
| RFAu= Gold Smelting recovery (%) | |
| PrCu = Copper Selling price (US$/lb) | |
| CvCu = Copper Selling cost (US$/lb) | |
| RCCu= Copper Flotation recovery (%) | |
| RFCu= Copper Smelting recovery (%) | |
| 31.103 = Conversion factor: oz (troy) to grams | |
| 2,204.62 = Conversion factor: tonne to lb (avoirdupois) |
This cut-off grade was determined to be 0.296% Cu, applied against the material’s copper equivalent grade (CuEq). For operational purposes, the cut-off grade is rounded to 0.30% Cu.
Strategic planning at the Salobo Mine optimizes the project’s economic value through the application of a higher mill-feed cut-off grade and accelerated mining schedule to allow the mine to generate higher grade ore to fully utilize mill capacity while stockpiling low-medium grade ore for later treatment.
16.2 PRODUCTION SCHEDULE
An objective of Salobo Mine’s production schedule is to expose ore in phases to balance the material handling limits of the fleet. The mine plan is expected to provide steady production at an average of 24 Mt/y feed to the process plant by 2014. Including waste mining, overall materials handling is constrained by fleet capacity to a rate of 126 Mt/y.
121
An annual mine production schedule is prepared by dividing each mining phase in smaller increments, taking into account feed to the processing plant, stockpiling of lower grade ore, pre-stripping and removal of other waste material. Moisture content for run of mine material ranges 2-3% for fresh rock and 9% for saprolite.
Mining operations are scheduled to operate on a continuous basis, 365 days per year.
16.2.1 Pit Phases
The ultimate pit was subdivided into seven internal phases targeting the highest grade, lowest cost areas of the ultimate pit first. Details of the material quantities for each of the phases are presented in Table 16.4. The open pit phases are shown schematically in Figure 16.7 and in plan in Figures 16.8 to 16.14 (see below).
Table 16.4
Material Within Each Open Pit Phase
| Phase | Ore | Waste | Total Moved (000 t) | Waste: Ore Ratio | ||||
| Mined (000 t) | Cu (%) | Au (g/t) | Ore Ratio | Weathered (000 t) | Rock (000 t) | |||
| Phase I | 18,067 | 0.9 | 0.56 | 1,204 | 383 | 6,090 | 25,744 | 0.42 |
| Phase II | 32,905 | 0.85 | 0.44 | 32,832 | 5,066 | 17,256 | 88,059 | 1.68 |
| Phase III | 137,607 | 0.74 | 0.42 | 24,796 | 11,537 | 55,214 | 229,154 | 0.67 |
| Phase IV | 187,919 | 0.72 | 0.38 | 54,318 | 15,181 | 171,774 | 429,192 | 1.28 |
| Phase V | 126,208 | 0.75 | 0.36 | 50,520 | 14,859 | 145,205 | 336,792 | 1.67 |
| Phase VI | 284,273 | 0.67 | 0.39 | 63,274 | 16,191 | 367,131 | 730,869 | 1.57 |
| Phase VII | 333,985 | 0.72 | 0.34 | 84,035 | 20,284 | 550,899 | 989,203 | 1.96 |
| TOTAL | 1,120,964 | 0.72 | 0.38 | 310,979 | 83,501 | 1,313,569 | 2,829,013 | 1.52 |
Vale, 2013.
Figure 16.7
Salobo Mining Phases
![]()
122
Figure 16.8
Salobo Open Pit Phase I
![]()
Figure 16.9
Salobo Open Pit Phase II
![]()
123
Figure 16.10
Salobo Open Pit Phase III
![]()
Figure 16.11
Salobo Open Pit Phase IV
![]()
124
Figure 16.12
Salobo Open Pit Phase V
![]()
Figure 16.13
Salobo Open Pit Phase VI
![]()
125
Figure 16.14
Salobo Open Pit Phase VII
![]()
16.2.2 Life of Mine Plan
The Salobo Mine LOM production schedule is presented in Figure 16.15.
Figure 16.15
2012 Life of Mine Plan
![]()
126
The open pit mine life spans approximately 29 years ending in 2042. However, the process plant will continue operations, milling stockpile material, for another 22 years until 2064. Phasing of the open pit development and application of the cut-off grade strategy allows higher grade ore (above 1.00% Cu) to be processed in the initial years of the operation. This is followed, from years 2025 to 2033, by the mining of progressively lower grade material averaging 0.48% Cu. The copper grade improves again during the final phases of pit development, then decreases as production ramps down towards the processing the lower grade stockpile material. During mining, the ore placed on the stockpiles is classified according to the following grade categories:
- Medium grade ore: 0.60 to 0.85 % CuEq
- Low grade ore: 0.30 to 0.60 % CuEq
Detailed planning, carried out by the operating team at Salobo Mine, covers a rolling 5-year period. A summary of the mining plan for the next five years are presented in Table 16.5.
Table 16.5
Salobo Five-year Mine Plan
| Units | 2013 | 2014 | 2015 | 2016 | 2017 | |
| HG Ore to Plant | kt | 7,083 | 13,797 | 20,538 | 22,167 | 22,057 |
| MG to Stockpile | kt | 407 | 3,176 | 9,419 | 18,963 | 7,066 |
| LG to Stockpile | kt | 3,110 | 16,325 | 20,151 | 9,757 | 24,821 |
| Total Ore mined | kt | 10,600 | 33,299 | 50,108 | 50,886 | 53,944 |
| Copper Grade | % | 0.83 | 0.66 | 0.69 | 0.71 | 0.68 |
| Gold Grade | g/t | 0.49 | 0.35 | 0.39 | 0.40 | 0.37 |
| Overburden | kt | 12,085 | 33,672 | 35,083 | 42,334 | 37,134 |
| Waste Rock | kt | 30,443 | 24,221 | 22,884 | 14,720 | 16,862 |
Vale, 2013.
16.3 MINING FLEET
Salobo’s bulk mining operations rely heavily on the electric (rope) shovels for ore and waste production. An hydraulic shovel is used for the oxide saprolites and transition material where a lower ground pressure is required. A wheel loader is used for miscellaneous cleanup jobs and for backup of the shovels when needed.
The diesel powered and wheeled equipment is selected mainly for ore exploitation to take advantage of mobility and flexibility. In particular, the wheel loaders are used in narrow working areas and to start opening of new accesses. Conversely, the electrically powered and tracked equipment may be used for either bulk waste removal or ore recovery.
A fleet of off-road haul trucks is used to transport the material to either the waste dump or the primary crusher stockpiles. Low-medium grade ore is stockpiled near the open pit. Cycle times for haulage calculations are determined for each mining period using the Mine Haul software.
127
The track dozers are assigned to maintain the production areas, waste dumps and cleaning up the benches. Wheeled dozers, road graders and water trucks complete the remainder of the auxiliary equipment fleet.
Salobo’s principal mining equipment fleet is shown in Table 16.6.
Table 16.6
Principal Mining Equipment
| Equipment Make and Model | Capacity | Specifications | |
| Loading | |||
| Bucyrus International (CAT) | Electric 495 HD | 32 m3 | Rope shovel |
| Bucyrus International (CAT) | Electric 495 HR | 48 m3 | Rope shovel |
| Komatsu | PC 5500 | 29 m3 | Hydraulic shovel |
| Letourneau | L 1850 | 25 m3 | Front end loader |
| Komatsu | WA 600-6 | 7 m³ | Front end loader |
| Haulage | |||
| Komatsu | 830E-AC | 218 t | |
| Caterpillar | 797F | 327 t | |
| Caterpillar | 785C | 136 t | |
| Drilling | |||
| Atlas Copco | Pit Viper 351 | 311 mm | Single pass, diesel or electric |
| Bucyrus International | 49 HR | 311 mm | Single pass, diesel or electric |
| Atlas Copco | T4 BH | 251 mm | Multi-pass, DTH |
| Atlas Copco | ROC-L8 | 165 mm | DTH, diesel |
| Atlas Copco | ROC-D7 | 114 mm | Top Hammer, diesel |
| Auxiliary | |||
| Komatsu | D475A-2 | 582 kW | Track dozer |
| Komatsu | D375A | 451 kW | Track dozer |
| Caterpillar | D6R | 141 kW | Track dozer |
| Komatsu | WD 600 | 362 kW | Wheel dozer |
| Komatsu | WD 900 | 637 kW | Wheel dozer |
| Komatsu | GD 825 | 209 kW | Grader |
| Komatsu | PC450-7 | 232 kW | Excavator |
| Scania | 6x4 | 27 t | General dump truck |
| Caterpillar | 777D | 100 t | Water truck |
Heavy equipment scheduling uses an 85% mechanical availability for the shovels and 80% mechanical availability for the haul trucks and drills. Included in this availability is time allotted for major overhauls (1 week/year), preventative maintenance (12 h/4 weeks) and unscheduled maintenance for breakdowns. The estimated utilization is currently at 80% for the shovels, 78% for the haul trucks and 74% for the drills.
Table 16.7 shows the mobile equipment fleet requirements to support the planned production rate.
128
Table 16.7
Mobile Fleet Requirements– Five-year Plan
| Equipment | 2013 | 2014 | 2015 | 2016 | 2017 |
| Production Drill | 8 | 17 | 20 | 20 | 21 |
| Secondary Drill | 5 | 5 | 5 | 5 | 5 |
| Loading Equipment | 7 | 8 | 9 | 11 | 12 |
| Haul Truck | 31 | 46 | 50 | 55 | 55 |
| Auxiliary Equipment: | |||||
| Dozer | 17 | 17 | 24 | 27 | 28 |
| Grader | 8 | 8 | 8 | 8 | 8 |
| Excavator | 5 | 5 | 5 | 5 | 5 |
| General Dump Truck | 9 | 9 | 9 | 9 | 9 |
| Water Truck | 2 | 2 | 3 | 3 | 3 |
Micon has reviewed the mobile equipment production rates and considers them appropriate, notwithstanding below forecast utilisation values (60-70%) achieved to date. Since lower utilization is common during ramp-up, it is expected to improve once the operation gets into steady state production.
The LOM production and development schedules require the average productivities listed in Table 16.8.
Table 16.8
LOM Equipment Productivity
| Rate / Capacity Assumption | Unit | |
| Blast hole drilling – average LOM | m/day/drill | 149 |
| Haulage truck capacity – average LOM | tonnes/day/truck | 6,003 |
| Shovel Loading capacity – average LOM | tonnes/day/shovel | 29,150 |
| Vale, 2013. |
16.4 MANPOWER
The mine operates on a continuous schedule with three shifts per day of 8 hours each. Approximately 10 days per year are planned as lost production delays due to poor weather conditions (i.e., rain and fog).
A maintenance worker ratio of 0.85 per item of major equipment is used as a guideline for staffing the mechanics, electricians and other journeymen.
Forecast mine manpower utilization takes into account delays for training, blast moves and other operational delays. The overall utilization ranges from 60-70%, which Micon considers to be below industry average, and hence a conservative planning assumption. Resulting manpower requirements are shown in Figure 16.16.
129
Figure 16.16
Mining Manpower Requirements– Five-year Plan
![]()
16.5 GRADE CONTROL AND PRODUCTION MONITORING
Grade control for the Salobo Mine uses samples of drill cuttings collected from blast-holes and applies procedures developed at Vale’s nearby Sossego mine. All ore blast-holes are sampled and the grade control geologist determines which waste blast-holes are sampled to ensure mineralization matches the interpretation in the geological model.
Surveyors measure drill-hole collar locations using high precision global positioning system (GPS) equipment.
Samples of drill cuttings are collected from the entire length of the blast-hole, including the sub-drill. The sample is homogenized and reduced to 2 kg using a Jones splitter before it is bagged and numbered prior to dispatch to the analytical laboratory.
Blast hole samples are currently being sent to Vale’s laboratory at Sossego for assaying and the results are forwarded to the Salobo geology department to be entered into the ore control database. The turnaround time for sampling ranges from 8 h for copper assaying to 24 h for the gold assaying or 36 hr for the additional elements such as Ag, Pt, Cl, F and U.
An analytical laboratory is being constructed at the Salobo Mine, which will improve turnaround time.
Ore polygons are defined, based on the assay results and taking account of where the blasted material was thrown. This information is uploaded to the GPS units of the operating shovels and loaders to guide the mucking operations.
130
A dispatch system is used to control the activities of all mine equipment, and compliance to the mine plan is monitored on a monthly basis. Adherence to the mine plan is recognized as key to achieving the overall production forecast.
16.6 RECONCILIATION STUDIES
Reconciliation exercises are conducted to determine how well the block model relates to the blast-hole samples collected in the field.
The reconciliation process is performed by determining the mining call factors between different points of measurements. The key points of measurements include: long term model (LTM), short term model (STM), production (PRDT), total ore sent to crusher (TSC) and processed ore (PO).
The reconciliation factors obtained for the Salobo Mine over the past 12 months are within acceptable tolerances and there does not appear to be any material bias in the mineral reserve estimates.
16.7 WASTE STORAGE
Low-medium grade ore and waste rock from the mine are stored in three locations along the perimeter of the pit. The main waste rock dump is to the west of the pit and contains both oxidized and fresh rock. Geotechnical investigations were conducted to develop the dump design parameters. A 35% of swell factor is used to compute the required storage volumes in the stockpiles and waste dumps.
Material is end-dumped in 20 m high lifts with 10 m berms between lifts. The bench face angles are expected to range from 32 to 35 degrees, depending on the angle of repose for the material. Including the berms, the overall slope of the dumps ranges from 2H:1V to 2.5H:1V. The resulting slopes were shown to have an estimated 1.5 factor of safety against large scale circular slip failures.
Table 16.9
Design Parameters - Waste Rock Dump and Stockpiles
| Parameter | Units | Waste | Ore Stockpile |
| Lift Height | m | 20 | 10 |
| Angle of Repose | degrees | 32-35 | 34 |
| Berm Width | m | 10 | 15 |
| Overall Slope | degrees | 20 | 25 |
The resulting overall face angle of the waste dumps is 20°, while low-medium grade stockpiles have an overall slope angle of 25°. The Salobo Mine waste dump is estimated to have a capacity of 878 x 106 m³ and the sulphide stockpile is estimated at 147 x 106 m³ capacity.
131
The waste materials and the low-medium grade ore have been characterized as having low acid rock drainage (ARD) potential (Brandt, 2003). However, there is a concern with fluorine leaching from the finer grained oxidized materials (saprolite). Accordingly, mineralized saprolite material is encapsulated within the waste rock dump to control infiltration of surface water and minimize resultant leaching.
The long-term storage of the medium and low grade material in a tropical environment may lead to some oxidation of contained sulphide minerals, impacting recovery of metals during eventual processing of the stockpiles.
16.8 MINE SERVICES
Water management (including pit dewatering, and control of runoff within the open pit and surrounding area) is a significant concern during the rainy season. With over 1.92 m of rainfall each year, sumps and pumps need to be well managed to maintain the roads and pit working surfaces. Vale recognizes this and has allocated appropriate resources to this task.
During the dry season, dust control in maintained through the use of water trucks. Evaluations are on-going to determine the effectiveness of additives, such as calcium chloride for dust control.
16.9 MICON OPINION
Micon’s review of the mine planning practices at the Salobo Mine suggests these are in accordance with expected industry standards.
132
17.0 RECOVERY METHODS
17.1 PROCESS DESCRIPTION
Phase I of the Salobo plant is designed to process 12 Mt/y of ore to produce approximately 100, 000 t of copper in concentrate annually. Production commenced in June, 2012. Phase II of the Salobo plant expansion involves doubling the throughput to 24 Mt/y with an annualized copper in concentrate production of approximately 200,000 t. Construction of Phase II is well advanced and is basically a mirror-image of Phase I, i.e. essentially two identical production lines. Production from Phase II is scheduled to start in 2014.
Currently, Phase I is designed to operate 365 days per year, 24 hours per day and at 90% availability to process an average 1,522 t/h.
Apart from the inclusion of HPGR for tertiary crushing ahead of ball milling, the circuit is very conventional to the copper industry. The use of conventional SAG milling is generally considered within Vale’s operating philosophy but the reasons for the design and selection of the HPGR/Ball Milling circuit has been explained in Section 13 Mineral Processing and Metallurgical Testing. This was due mainly to the high magnetite (and copper) content of critical size pebbles that would have been removed with the magnet protecting the pebble crusher and therefore requiring additional processing and the expected variability in ore hardness that would cause variability in SAG mill throughput in a typical SAG mill, ball mill, pebble crusher circuit.
The overall simplified process flow diagram is illustrated in Figure 17.1.
Figure 17.1
Simplified Process Flowsheet for Salobo
![]()
133
Run-of-mine ore at 2.5 m top size is hauled in 240-tonne trucks and crushed in a 60 in x 89 in primary gyratory crusher (600 kW motor), rated for 1,826 t/h, to a product 80% passing 152 mm (Figure 17.2) . The dump pocket volume capacity is equivalent to the volume of 2.5 trucks. Primary crushed ore is conveyed to a crushed ore stockpile which has a live capacity of approximately 24,800 t and a total capacity of 73,400 t.
Figure17.2
Primary Gyratory Crusher
![]()
Coarse ore stockpile reclaim feeders are used to feed onto the primary screen feed conveyor which feeds two operating double-deck vibrating screens. The screens have a 100 mm aperture top deck and 55 mm aperture bottom deck to produce a product sizing 80% passing 38 mm. Screen oversize is crushed in two MP-1000 cone crushers (746 kW motors) in a standard closed circuit. The nominal throughput for each crusher is 1,198 t/h.
Secondary crushed product is then conveyed in a 2 km long pipe conveyor running at a speed of 2.5 m/s to the secondary crushed ore stockpile feeding the HPGR units. This stockpile has a total capacity of approximately 171,000 t and a live capacity of about 58,400 t (Figure 17.3).
Four operating reclaim feeders are then used to reclaim the crushed ore and deliver it to the HPGR circuit via the stockpile reclaim conveyor and silo feed conveyor, equipped with a shuttle head. This delivers ore into one of two concrete silos, providing approximately 20 minutes nominal capacity. A reversible feed belt conveyor and feed belt feeders then feed each of the two HPGR units.
134
Figure 17.3
Crushed Ore Stockpile
![]()
Each HPGR unit has a drum 2.0 m diameter by 1.5 m wide (Figure 17.4) . The maximum feed size is 55 mm and the product is 80% passing 17 mm. The crushed HPGR product is discharged as a compressed cake and, via the product collection conveyor, is then screened at 8 mm aperture and broken up with high pressure water sprays. There are a total of four operating screens. The screen undersize, at 80% passing 6 mm, discharges directly into a Ball Mill discharge sump. The screen oversize is recirculated back via the screen oversize collection conveyor to the silo feed conveyor and further HPGR crushing.
Figure 17.4
Worn HPGR Drum
![]()
135
Slurry in the Ball Mill discharge sump is pumped to a battery of 10 26 in hydrocyclones of which seven are operating. Hydrocyclone underflow is fed by gravity to an overflow Ball Mill (7.9 m diameter x 12.2 m long) equipped with a 17 MW gearless motor. There are two Ball Mills operating in closed circuit, each with a hydrocyclone cluster, i.e., two production lines. Ball Mill discharge feeds into the discharge sump for recirculation to the hydrocyclones. The design grind is 80% passing 105 µm. Hydrocyclone overflow advances to the copper flotation circuit at approximately 42% solids by weight. The Ball Mills are designed to operate at a 30-35% ball charge using 76 mm diameter steel balls and with a recirculating load of approximately 300%.
Figure 17.5
Ball Mill
![]()
The flotation circuit is of conventional design. Rougher 1 flotation is carried out in two lines (one for each Ball Mill) using two cells, one for each line. The cells are mechanically agitated Outotec cells of 200 m3 capacity to provide 6 minutes design retention time. The rougher 1 concentrate advances to the cleaner circuit. The rougher 1 flotation tailings advances to the rougher 2 (scavenger) circuit consisting of two lines, each line containing six mechanically agitated 200 m3 cells, for a nominal retention time of 39 minutes.
136
Rougher scavenger (rougher 2) tailings gravitate to the Tailings Storage Facility (TSF).
Rougher 2 (scavenger) concentrate advances to the regrind circuit.
Rougher 1 concentrate advances to the cleaner circuit which is divided into cleaner 1, 2 and 3 circuits. Cleaner 1 circuit consists of eight column cells, each 6 m diameter x 14 m height, arranged in two lines of four cells each (Figure 17.6) . Design residence time is 39 minutes. The concentrate from the cleaner 1 circuit advances to the cleaner 2 circuit, consisting of four cells, in two lines of two cells each, each column 4.3 m diameter x 14 m height for a design retention time of 34 minutes (see Figure 17.7). Concentrate from the cleaner 2 circuit advances to the cleaner 3 circuit, consisting of two cells, in two lines of one cell each, each column 4.3 m diameter x 14 m height for a design retention time of 39 minutes. Cleaner 3 tailings recirculates back to the feed of cleaner 2 and cleaner 2 tailings recirculates back to the feed of cleaner 1.
Figure 17.6
Flotation Circuit Rougher, Rougher Scavenger and Cleaner Scavenger Tanks
![]()
137
Figure 17.7
Flotation Cleaner Circuits
![]()
Cleaner 3 concentrate (final concentrate) advances to the concentrate dewatering circuit.
Cleaner 1 tailings advances to the cleaner-scavenger circuit which consists of 10 200 m3 mechanically agitated cells, arranged in two lines of five cells each, for a design residence time of 22 minutes. Cleaner-scavenger tailings reports to the final tailings with the rougher scavenger tailings.
Cleaner-scavenger concentrate is reground in the regrind circuit together with the rougher 2 (scavenger) concentrate. The regrind circuit consists of four parallel tower mills fitted with 1,120 kW motors and operated in closed circuit (one cluster per mill) with seven 250 mm (10 in) diameter hydrocyclones. The product of the regrinding process is nominally 80% passing 21 to 23 µm and advances to the cleaner 1 circuit.
The final concentrate dewatering circuit consists of a 15 m diameter, high-capacity thickener, producing a pulp at 60% solids with a flocculant addition rate of 10 g/t Magnafloc. The slurry is then transferred into a 1,360 m3 stock tank and cyclically pumped into two horizontal frame pressure filters. The filtrate solution returns to the thickener and thickener overflow is pumped to the plant process water tank.
138
The filtered concentrate has a residual moisture content of about 9.5% . It is stockpiled below the filters in a covered concentrate storage area.
Concentrate is reclaimed by front-end loader and loaded into trucks. Each loader bucket (approximately 7t) is sampled and a composite, representative sample for about 125 t of concentrate is taken for assay. The copper concentrate is weighed in the trucks using a static scale and delivered to a rail spur storage area, 85 km away at the town of Parauapebas. The warehouse can hold 16 kt of concentrate which is reclaimed by front-end loader and loaded into railcars carrying it to the port of Itaqui, in S o Lu s, about 900 km from Parauapebas. Further sampling is carried out here.
Flotation reagents used include potassium amyl xanthate (PAX) and sodium dithiophosphate as primary and secondary collectors respectively, poliglycolic alcohol and methyl isobutyl carbinol (MIBC) as frothers, quicklime for pH modification and sodium sulphide for oxidized or easily oxidized copper minerals, e.g. bornite.
The combined flotation circuit tailings (rougher and cleaner–scavenger tailings) flow by gravity from the plant to the tailings deposition area, located directly north of the processing plant. Tailings are dumped from a single-point discharge and create a beach on the south side of the dam. Over the mine life, several phases of dam raising with mine waste will be required to provide the required storage volume. Vertical pumps installed on pontoons pump recycled tailings dam water back to the process plant, accounting for approximately 95% of the total process water requirements.
17.2 OPERATING RESULTS
Table 17.1 presents a simplified summary of the operational results available from the Salobo operation since start-up in June, 2012 and including data for January, 2013. Commissioning of the first production line actually started in March, 2012. To date, two concentrate shipments have been delivered to and accepted by the smelters.
Table 17.1
Simplified Summary of Salobo Operating Data
| Feed | Concentrate | % Rec (calc) | % Sol Cu | ||||||||||||
| Month | Milled t | h | t/h | Cu % | Au g/t | Ag g/t | T (calc) | Cu % | Au g/t | Ag g/t | Cu | Au | Ag | Feed | Conc |
| Jun-12 | 150,916 | 281 | 536 | 0.74 | 0.45 | 2.70 | 1672 | 42.1 | 19.3 | 103.4 | 64.7 | 54.4 | 39.9 | 39.0 | 4.5 |
| Jul-12 | 203,127 | 351 | 579 | 0.96 | 0.58 | 4.19 | 1963 | 49.9 | 24.0 | 115.7 | 51.8 | 60.9 | 39.6 | 31.6 | 3.6 |
| Aug-12 | 253,326 | 256 | 992 | 1.00 | 0.58 | 3.86 | 3982 | 40.4 | 17.8 | 82.0 | 65.3 | 50.2 | 34.4 | 34.4 | 5.1 |
| Sep-12 | 266,886 | 232 | 1149 | 1.33 | 0.76 | 4.68 | 5227 | 41.2 | 18.9 | 87.8 | 62.5 | 49.9 | 37.9 | 32.0 | 4.6 |
| Oct-12 | 344,750 | 332 | 1040 | 1.22 | 0.95 | 4.50 | 6755 | 39.8 | 22.1 | 66.5 | 66.0 | 47.2 | 31.1 | 29.2 | 3.9 |
| Nov-12 | 293,956 | 234 | 1256 | 1.30 | 0.98 | 4.82 | 6305 | 41.0 | 22.7 | 82.5 | 69.8 | 51.2 | 37.8 | 26.6 | 3.5 |
| Dec-12 | 359,185 | 306 | 1175 | 1.09 | 0.66 | 3.70 | 6787 | 38.8 | 18.5 | 71.3 | 69.0 | 54.5 | 37.6 | 27.1 | 3.4 |
| Jan-13 | 409,280 | 362 | 1130 | 1.14 | 0.76 | 3.60 | 8453 | 42.5 | 21.8 | 78.0 | 65.9 | 51.1 | 38.3 | 28.2 | 4.3 |
139
Key results from the operational summary are as follows:
Throughput has steadily improved during the ramp-up phase, peaking at 409,280 t in January, 2013.
Consistent hourly throughputs have been achieved since September, 2012 with the highest average operating throughput achieved, 1,256 t/h, in November, 2012, as compared to a design capacity of 1,489 t/h.
The highest monthly operating hours (362 h) was achieved in January, 2013.
Copper and gold head grades are generally within the expected ranges with average concentrate grades of 41.1% copper, 20.2 g/t gold.
Copper recovery has averaged 66%. The soluble copper in the feed averaged 31% compared to 4.1% in the concentrate.
The throughputs achieved are below monthly designs and are generally a direct consequence of the low available operating hours. There are a large number of commissioning, engineering and operating issues that have been identified and result in general process instability and operational downtime.
All of these issues have been addressed within a comprehensive Action Plan that has been developed and which is scheduled to be completed by the end of July, 2013. Most of the items are planned to be completed by the end of May, 2013.
Major construction work is occurring on site for Phase II of the Salobo expansion. This renders commissioning and ramp up operations of Phase I more difficult and complex from a logistics point of view as compared to typical concentrator ramp up periods.
In terms of recovery, the significant percentage of soluble copper present in the feed and the corresponding low amount of the same copper species in the concentrate represents upside potential for copper recovery. A sodium sulphide reagent circuit is one of the items in the Action Plan. The incorporation of this reagent into the process will aid in the recovery of soluble copper minerals. A new lime circuit is also being installed as part of the Action Plan to increase rougher flotation circuit pH from the current value of approximately 8 to the design of value of 10. Previous testwork as reported in Section 13.0 has highlighted the benefit to recovery of the increase in pH.
An Outotec Courier Analyser system is not yet operational, due to challenges in calibrating a reference curve for metals. The assay laboratory at Salobo is not yet commissioned and as a result, all samples are taken to the nearby Sossego laboratory, where results are typically obtained in 36 hours. Once the Courier On-Stream Analyser has been calibrated with sufficient Salobo stream sampling and assaying, the process control of the flotation circuit is expected to improve.
140
It is reportedly estimated that approximately half of the copper unrecovered is lost in the cleaner-scavenger circuit with the remaining half in the rougher scavenger tailings.
Reagents dosages are reported as approximately 20 g/t for PAX, 10 g/t for dithiophosphate and 15 g/t for each of the frothers. Higher collector dosages can be used to compensate for copper recovery until the sodium sulphide and lime circuits are functional, after which optimal reagent dosages can be re-assessed.
The HPGR units are experiencing higher than expected wear on the roll liners, reportedly lasting for only approximately 25% of the design life. This directly impacts downtime (throughput) and operating cost. Figure 17.4 illustrates one of the badly worn rollers. An action plan which includes modified engineering design and more sensitive metal detectors has been produced and this is designed to remove tramp metal from the feed to the HPGR units.
17.3 MICON OPINION
The processing plant was unfortunately shut down for maintenance during the Micon plant visit on 8 February, 2013.
It is Micon’s opinion that the design of the Salobo processing plant flowsheet is generally robust, based on the extensive metallurgical testwork reported under Section 13.0. The circuit is conventional to the copper industry, with the exception of the use of an HPGR/Ball Mill circuit rather than a more conventional SAG/Ball Milling circuit. However, the reasons for this adoption have been well described in Section 13.0.
Significant commissioning, engineering and operational issues have been identified during the ramp up phase resulting in generally unstable plant operating conditions and directly affecting plant availability, production and metallurgical recovery. Many of these issues are to be expected when commissioning a plant of this scale. A detailed Action Plan has been developed by Vale and targeted for completion by the end of July, 2013. It is Micon’s opinion that stable operating conditions will probably only be achieved towards the end of 2013. Assuming that all the items in the Action Plan are successfully remedied, there is a reasonable expectation that the design throughputs and metallurgical recoveries for copper and gold as described in Section 13.0 can be achieved. It is likely that, as copper recoveries improve, gold recoveries will also improve in relative proportion. Major short-term objectives to improve recovery will be stable plant operation, optimized reagent dosing and commissioning of the sodium sulphide and lime addition circuits.
A number of issues have the potential for longer-term impact on production and recovery. These include the amount of soluble copper present in the plant feed and use of high-pressure water sprays to break up the compacted HPGR crushed product that could increase the HPGR feed moisture above the design of 5%, thereby impacting on throughput and liner wear life.
141
Vale appears to have the dedication and resources from its staff, most of whom have experience in plant start-up activities from the nearby Sossego Mine, to successfully resolve the current plant production issues.
Any engineering changes implemented in Phase I should be implemented in Phase II. This is not currently the case, so there are likely to be some cost implications in the future.
142
18.0 PROJECT INFRASTRUCTURE
18.1 ELECTRICAL POWER SUPPLY
In accordance with recent legislation governing the Brazilian electrical power sector, the Salobo Mine is supplied by the Eletronorte division of Eletrobras, responsible for the northern region of Brazil, operating and maintaining the system on behalf of the National Operator of the Electrical System (NOS).
Electrical energy is supplied from Tucuruí, a 8,370 MW hydroelectric generating station on the Tocantins River, 200 km north of Marabá, and 250 km due north of Parauapebas. An overhead transmission line (230 kV) of 87 km supplies the Salobo Mine. There is no ring feed. Figure 18.1 shows the principal transmission lines in Pará State.
Figure 18.1
Eletronorte Power, Pará State
![]()
The electric energy demand for Phase I was 71 MW, rising to a total demand of 150 MW after including Phase II.
18.2 WATER SUPPLY
Process make-up water comprises runoff and direct precipitation within the tailings storage basin. This raw water is pumped up to the plant together with return water from tailings deposited in the storage facility. At the time of Micon’s visit, excess water was being discharged from the TSF. However, if the plant requires additional makeup water, this can be abstracted from Igarapé Mamão (Pawpaw creek) via a floating intake within the project site, using vertical pumps.
143
18.3 TRANSPORT
Concentrate produced at Salobo Mine is transported 85 km by road to a rail load-out facility near the town of Parauapebas. There it is loaded onto cars for rail transport 870 km northeast, to the Ponta da Madeira Marine Terminalat the seaport of São Luis. Figure 18.2 shows an aerial view of the concentrate load-out.
Figure 18.2
Concentrate Load Out, Parauapebas
![]()
Regularly scheduled air service is available in Marabá approximately 225 km from Salobo by highway. Most flights connect to the capital, Brasilia. Regional jets connect the nearby urban centre of Carajás with Belo Horizonte. The Carajás airport is located 15 km from the city of Parauapebas which is the largest community in the local region, having a population of approximately 200,000.
Vale has a contract with local transportation company, JSL, to transport permanent employees and contractors living in Carajás, Parauapebas and Canaã dos Carajás to the Salobo Mine each day. Employees also use a fleet of company-owned vehicles for transportation on site. For safety, all these vehicles have a system called BlueTec which registers vehicle and engine speeds, and any abrupt stops. The system alerts the driver when the vehicle is travelling above the allowed speed. Figure 18.3 shows some of the buses used for staff transport.
144
Figure 18.3
Contracted Staff Transport Fleet
![]()
Road vehicle refueling is carried out at a purpose-built filling station. The area is equipped with drainage and spillage control (see Figure 18.4)
Figure 18.4
Road Vehicle Refueling Station
![]()
18.4 HOUSING
Local housing is available for employees within the Carajás urban centre and Parauapebas. There are adequate schools, medical services and businesses to support the work force. The mine sites have medical facilities to handle certain emergencies. In addition, medical facilities are available in to support the mine’s additional needs.
Vale has invested significantly in the regional infrastructure, building a 130 km paved road to Parauapebas and a 20 km sewage system, together with a school, hospital, and day care centre.
145
18.5 MINE SITE
Among the facilities located at Salobo are the following:
- Plant Maintenance Workshops
- Mine Vehicle Workshops
- Light Vehicle Workshop
- Warehouse
- Offices,
- Changehouse
- Cafeteria
- Security/ Access Control Gate
- Training Centre
- Medical Clinic
18.6 COMMUNICATIONS
Telephone communications are available over land-lines, and via a cellular network. Internet communications are also available at the mine site.
18.7 TAILINGS STORAGE FACILITY
The Salobo tailings storage facility (TSF), comprising an earth dam and concrete-lined spillway, was designed for Vale by Brazilian engineering company, BVP Engenharia, to withstand a 1 in 10,000 year event. The current design was completed in July, 2010, see Figures 18.5 and 18.6.
The TSF, when completed to a height to 280 masl, will have sufficient capacity to store the entire mineral reserve planned over the life of the mine. At present, work is underway to lift the impoundment from 170 masl to an intermediate design height of 220 masl. Potentially, the TSF site could also store the material presently identified as mineral resources. Figure 18.7 shows work in progress on raising the impoundment. Figure 18.8 shows the present spillway.
146
Figure 18.5
Salobo Tailings Storage Facility– Final Limits
![]()
Figure 18.6
Tailings Storage Capacity and Area versus Impoundment Height
![]()
147
Figure 18.7
Tailings Storage Facility– Construction in Progress
![]()
Figure 18.8
Tailings Storage Facility– Spillway
![]()
148
19.0 MARKET STUDIES AND CONTRACTS
Off-take agreements have been entered into for the sale of concentrate production from Salobo Mine. The terms of these agreements are considered to be confidential and Micon has not been provided with access to complete copies of these documents. Nevertheless, the expected costs of these agreements are in line with Micon’s expectations based on experience elsewhere.
It is noted that NI 43-101 item 9.2 (3) (a) provides an exemption for such cases.
Since much of the construction work is well advanced on the Phase II expansion, Micon did not consider the terms of the construction contracts to be material in this case.
Except for the proposed gold streaming agreement with Silver Wheaton which is discussed elsewhere in this report, there are no other material contracts associated with Salobo Mine.
149
20.0 ENVIRONMENTAL STUDIES, PERMITTING AND SOCIAL OR COMMUNITY IMPACT
The following summary is based on information and reports provided by Vale’s subsidiary, Salobo Metais S.A. (Salobo), including permits, previous studies, company records, impact assessment and environmental and social management documents as listed in Section 28, References.
20.1 ENVIRONMENTAL STUDIES AND ISSUES
The project is located in the Carajás mountain range in the eastern Amazon humid tropical rainforest. Temperatures range from 20.8°C to 37.8°C with an average relative humidity of 80.5% . Mean annual rainfall is 1920 mm and evaporation is 1500 mm. Winds are predominantly from the north and west.
The project lies in part of Salobo Creek and the Cinzento River basins which are tributary to the Itacaiúnas River. The long-term average unit runoff for the project site is 13.5 L/s/km2.
Water in most creeks around the project site has naturally elevated iron and aluminum concentrations typical of streams in areas with laterite soils. Coliform (particularly streptococcus) and nutrient concentrations are occasionally elevated, typical of a tropical rainforest where there are high densities of plant and animal life. Baseline oil and grease levels were detectable; however, these were not in areas where machines or equipment were used and are likely from natural sources from seeds, vegetation and blue-green algae. Water quality at the project site naturally has some constituents higher than CONAMA’s Class 2 criteria concentrations (Brandt, 2003).
Waste characterization studies were completed by CVRD and BC Research for ore, tailings, laterite, saprolite, transition and fresh rock. Static acid base accounting and NAG testwork concluded that all wastes were non-acid forming (CVRD, 1997). It is understood that low grade oxides will be comingled with non-PAG waste rock within the centre of the dump as a preventive measure to neutralize potential acid generation for low grade oxides. Micon recommends that waste characterization studies be updated to verify the acid drainage potential of waste rock types in the latest mine plans and to further characterize neutral mine drainage to determine if any further water management measures should be employed.
The mine site is within the Tapirapé-Aquiri National Forest and the access road crosses the Carajás National Forest and lies adjacent to the Igarapé Gelado Protected Area (Figure 20.1) . As a requirement of the installation licence, an agreement was signed between the Chico Mendes Biodiversity Conservation Institute and Salobo to provide payment and support towards management of the Tapirapé-Aquiri National Forest (ICMBio, 2007). Salobo also has a commitment to offset effects by planting seedlings in the Igarapé Gelado Protected Area (National Press, 2007).
150
Vegetation in the project area is structurally complex with a dense understorey and a variety of vegetation associations depending on slope and soil moisture. This provides a variety of habitats that support the growth and reproduction of many species. Baseline studies identified many bird species including 10 classified as endemic, four regionally rare, four in danger of extinction, and three vulnerable species. Of the mammals identified, eight were considered threatened with extinction including the giant armadillo, giant anteater, howler monkey, jaguar, puma and ocelot. Baseline studies captured 105 species of fish in the local rivers including four migratory species and 32 species of commercial value. Various amphibians and reptiles inhabit the area, none of which is considered endemic or at risk. Many insects occur in the area including species that can transmit malaria, yellow fever, dengue, leishmaniasis, chagas and other diseases.
Figure 20.1
Salobo Mine Location Relative to National Forests
![]()
20.2 ENVIRONMENTAL MANAGEMENT
The Salobo Mine has an Environmental Control Plan (Brandt, 2003) that includes the following components:
- Project Description
- Environmental Management System
- Vegetation Clearing and Stripping
151
- Erosion Control
- Water and Effluent Management
- Waste Management
- Atmospheric Emissions
- Noise and Vibration
- Environmental Emergencies
- Disease Control
- Archaeology Protection and Salvage
- Rehabilitation Plan
- Environmental Compensation and Social Inclusion
- Environmental Education
- Environmental Monitoring
- Closure Plan
These social and environmental management plans detail best practices and Brazilian legislation to prevent and mitigate potential impacts and manage compliance specifically for the Salobo Mine. The waste and water management are key environmental components that are described in more detail below.
20.2.1 Waste Management
Waste rock and tailings characterization tests indicated that these materials have low acid rock drainage potential (CVRD, 1997). However, fluorine leaching is of potential concern from low grade oxide material (PAH, 2007). As above, additional studies are needed to verify acid generation and neutral metal leaching potential in waste rock types likely to be encountered with the latest mining plan and, if necessary, update the waste management strategy.
Waste rock dumps and the tailings impoundment have been engineered to contain these materials and manage runoff and seepage. The tailings impoundment is within the Mirim creek basin and has been designed in phases to have an ultimate capacity of 543 Mm3 that will contain tailings for the planned 40 years of production and have an ultimate dam crest height of 285 m. The waste rock dump is designed to store 878 Mm3.
All industrial, domestic, and hazardous waste generated from the Salobo Mine are collected, classified, transported and stored according to existing Brazilian technical standards and legislation.
20.2.2 Water Management
Clean water is diverted around the mine, tailings and waste rock facilities where possible. Diversion channels, a 2.6 km tunnel and dykes were constructed to transfer water from Salobo creek to Mirim creek via Mano creek and then back to its original watercourse to prevent this water from being affected by the mine.
152
Water is collected from Mirim and Salobo creeks and either treated for use as potable water, used as make-up water for the process plant, reserved for fire suppression, or for other uses around site.
A dam was constructed on Cotia creek to contain tailings within an impoundment. Water is reclaimed from the impoundment and transferred via a pipeline to the plant along the left side of Cinzento creek. Water collected from the pit and reclaim water from the tailings impoundment are used in the plant. The project water balance volumes and flow rates vary depending on the stage of the project. During operations, the plant requires approximately 4,400 m3/h of water, most of which comes from the tailings reclaim line (Brandt, 2003, Water and Effluent Management). There are no scheduled discharges from the tailings impoundment during operations.
Sediment control ponds were constructed on Salobo creek to collect fine sediments from site runoff, temporary ore stockpiles and the waste rock dump prior to discharge to downstream waters. These designs should be reviewed once further waste characterization tests are completed to determine if any further water management measures are needed. Sewage from site is collected and treated in a sewage lagoon.
Oil traps are located in vehicle wash and fueling areas and in hydrocarbon storage areas. Fueling and storage areas have impermeable foundations. Oil traps are cleaned out periodically and contaminated material is stored in barrels and transferred along with used oil filters to a registered disposal facility.
Laboratory effluents are treated as necessary, depending on the source and quality. Some effluents are treated with flocculent, neutralized and filtered to remove metals and suspended solids. Cyanide is treated with oxidation and hexavalent chromium is reduced. Tailings samples are transferred to the tailings impoundment.
20.3 PERMITTING REQUIREMENTS
20.3.1 Regulatory, Legal and Policy Framework
Brazil is a federal republic, and its legal system is based on Civil Law tradition, characterized by codification of legal requirements. The Federal Constitution (October, 1988) is the basis of the legal system. Key applicable legislation for construction, operation and closure of the project includes the following:
Mining Code (Decree-Law No. 227, 28 February, 1967) and its Regulations (Decree No. 62934, 2 July, 1968).
Forest Code (Law No. 4771, 15 September, 1965).
National Environmental Policy Law (Law No. 6938, 31 August, 1981).
153
CONAMA (National Environment Council) Resolutions Nos. 1/86, 23/86, 9/90, 10/90 and 237/97.
National Water Resources Policy Law (Law No. 9433, 8 January, 1997).
An Installation Licence is required for construction and an Operations Licence is required for mine operations. The operations permit is granted following review and approval of an environmental impact assessment (EIA/RIMA). The lead agency for environmental permitting is IBAMA, the Brazilian Institute for Environment and Renewable Resources. There are a number of other federal, state and municipal permits governing forest clearing, water rights, natural resource protection, waste management, etc. that must also be obtained and maintained for operations.
Although the project is located in the Tapirapé-Aquiri National Forest, the forest management plan allows for mining provided that the operation meets the required environmental protection objectives.
20.3.2 Permitting Status and Compliance
Installation Licence No. 889/2012 for construction of the expansion to 24 Mt/y and Operations Licence No. 1096/2012 for the current operations were granted by IBAMA in November, 2012. Installation Licence No. 886/2012 was received in June, 2012 authorizing construction of an expansion of the fueling station for heavy machinery. Operating permits for the expanded operation will be applied for in 2014. Each licence includes a number of specific conditions.
Four vegetation removal permits were granted in 2012 authorizing clearing of a total of 1947 ha for project development.
A water rights permit was received from the National Water Agency (ANA) in October, 2006, Resolution No. 427, that authorized construction and operation of the various components affecting waterways including the tailings dam and impoundment, dykes, diversions and sediment control ponds. Another water rights permit was received from ANA in June, 2012, Resolution No. 233, that authorizes two treated effluent discharges (total discharge of 433,620 m3 meeting criteria for biological oxygen demand, phosphorus and temperature) and four water intake points (total annual uptake of 2,934,044 m3) for the Salobo Mine.
A number of environmental violations occurred from 2010 to 2012 including issues such as illegal use of a refuelling kit, an oil spill from a truck accident, construction damage, accidental sewage release due to a pump failure, etc. Salobo has completed or is working through legal aspects of these incidents to clarify cause, responsibility, corrective action and pay any fines due (Silveira, Athias, Soriano de Mello, Guimarães, Pinheiro & Scaff, pers. comm., 2013). It is understood that Salobo implemented appropriate corrective actions and mitigation measures in all cases.
154
In Micon’s opinion, the frequency of non-compliant events is not atypical of construction and early mine operations and appropriate corrective actions are being implemented to mitigate these events. Nevertheless, it is desirable for the operation to improve environmental performance to maintain permit compliance and reduce the risk of penalties.
20.4 SOCIAL AND COMMUNITY ASPECTS, STAKEHOLDER CONSULTATION
The Salobo Mine’s area of influence is located in the southeast Paraense mesoregion, in the municipalities of Marabá and Parauapebas. These regions are considered to have moderate human development indices for the level of health, education and living conditions, based on data from 2000. The extractive industry accounts for 23.5% of the economic activity in the state of Pará, with 17.9% other industrial activities, 52.0% services and 6.6% farming and ranching based on 2010 data (IBGE, 2013).
The project is not located on indigenous lands. The nearest indigenous lands include the river Tapirapé Tuere, Trincheira Bacaja and Xicrin do Cateté, all located 25 km or more from the project. Nonetheless, the Xikrin indigenous peoples traditionally use the project area for food collection. CVRD signed an agreement with the Xicrin do Cateté indigenous community in 1989 (Convenio No. 453/89; FUNAI, 1989). In 2001, a forest management program was implemented between the indigenous communities and government associations to sustainably harvest the forest in the project area in a manner that benefitted the indigenous community in capacity building and financial resources. The company currently maintains a Communication Plan that commits to continued communication with the local indigenous to maintain community health and safety, cultural preservation, transparency of activities and harmony between the workers and the indigenous community. The terms of the Installation Licence require the company to allow access for the Xikrin to continue with food collection from January to April (Vale, 2012).
Archaeological studies were completed prior to project development and identified 12 ceramic artifacts resulting from indigenous populations, likely Tupi-Guarani. Of these, six were determined to be archaeological sites and two were archaeological occurrences: all sites were registered with IPHAN (National Institute of Historic and Artistic Heritage). The Salobo Mine has an archaeological protection and salvage management plan to protect these resources during construction and operations (Brandt, 2003).
There is no artisanal mining on or near the property.
20.5 SOCIAL MANAGEMENT PROGRAM
There are a number of social management plans carried out by the Social Communications Department. The Environmental Compensation and Social Inclusion plan objectives are to support sustainable development by capitalizing on the positive effects of project development and minimizing the potential negative effects. In addition, this plan is supported by a Social Communications program that facilitates information exchange and works to improve relations between Salobo and the diverse social segments of the surrounding communities.
155
An Environmental Education program was developed between the Department of Environment and Sustainable Development (DIAM), Vale Education and the municipality of Parauapebas. The program seeks to spread the principles of sustainability recognized as environmental, social and economic responsibility through educational activities geared towards Vale’s employees and contractors and the surrounding community. The program aims to strengthen and expand environmental education in the municipal education program and the community.
20.6 RECLAMATION AND MINE CLOSURE REQUIREMENTS
A closure plan is included in the Environmental Control Plan. The overall objective is to return the project area to a natural condition to support the local vegetation and wildlife biodiversity of the Tapirapé-Aquiri National Forest.
There are no reclamation bonds required for the mine. Closure costs have been estimated by Salobo at approximately $193 million scheduled over a five year closure period. Closure costs are to be reviewed annually and are included as indirect costs in each operational centre for budgeting, expenditure tracking and financial planning (Vale, 2011). Rehabilitation and revegetation work is also ongoing during operations.
20.7 ENVIRONMENTAL AND SOCIAL OPERATIONS BUDGET
The environmental management team includes the Environmental Manager, Environmental Supervisor and seven other environmental staff to monitor and manage permits and carry out the Environmental Control Plans.
The 2013 budget for environmental programs is estimated at approximately $3 million. The social program’s operating costs and compensation payments to ICMBio and the Xikrin are understood to included elsewhere in the operation’s G&A costs.
20.8 MICON OPINION
In Micon’s opinion, the environmental and social management plans are appropriate for the Salobo Mine but need to be updated. The required permits are in place. Effective implementation of the management system should support ongoing permit compliance and project support.
156
21.0 CAPITAL AND OPERATING COSTS
21.1 CAPITAL COSTS
21.1.1 Initial and Expansion Capital
Construction of the 12 Mt/y Salobo Phase I is essentially complete, and the capital cost of this phase is treated as a sunk cost for the purpose of the economic evaluation in this report.
Salobo’s Phase II, which includes expansion of the mine and processing plant capacity to 24 Mt/y is well underway. Micon estimates that approximately $686 million has already been spent on the expansion and, as of 1 January, 2013, it is estimated that $882 million remains to be spent to complete the project. The unspent amount has been provided for in Micon’s cash flow forecast.
21.1.2 Sustaining Capital
In addition to the construction capital discussed above, further investment is required over the life of the open pit mining operation to expand and maintain the mining fleet capacity. Over the 30 years to 2042, Micon expects this to total approximately $1,732 million, for an average of around $57.7 million per year.
In addition, the tailings dam must be raised to its final height, at a cost of approximately $36 million. This cost may be spread over several years, starting in 2016.
21.1.3 Mine Closure Capital
Operating costs include allowances for progressive rehabilitation of disturbed areas during the course of operations. Micon’s economic model includes an allowance for closure or decommissioning of approximately $193 million over six years following the end of the mine life. A breakdown of these costs is presented in Table 21.1.
Table 21.1
Estimated Mine Closure Costs
| Operational Unit | Estimated Costs for Demobilization (million $/y) | Total ($ million) | |||||
| 0 | 1 | 2 | 3 | 4 | 5 | ||
| Pit | 4.52 | 1.50 | 1.13 | 0.75 | 0.38 | 0.08 | 8.36 |
| Waste Dumps | 6.02 | 2.31 | 1.73 | 1.15 | 0.58 | 0.12 | 11.91 |
| Tailings Dam | 10.11 | 2.42 | 1.82 | 1.21 | 0.60 | 0.12 | 16.29 |
| Industrial Facilities | 92.95 | 2.23 | 1.67 | 1.12 | 0.56 | 0.11 | 98.63 |
| Infrastructure | 55.60 | 0.82 | 0.61 | 0.41 | 0.20 | 0.04 | 57.68 |
| Total | 169.20 | 9.28 | 6.96 | 4.64 | 2.32 | 0.47 | 192.87 |
157
21.2 OPERATING COST ESTIMATES
21.2.1 Mine Operating Costs
The Salobo Mine operating cost forecast was estimated by Micon based on a review of unit costs and the scheduled production requirement and operating capacity (Table 21.2) . The estimate is categorized in the following major activities: drilling, blasting, loading, hauling, miscellaneous or sundries and mining technical staff. The mine labour and maintenance crew costs are included in the categories above with the exception of the mine technical staff, the latter cost forming part of the mine General and Administrative costs.
There are no mining operating costs from years 2043 to 2064 because mining of the open pit will have been completed and the processing plant will be fed from the medium and low grade stockpiles. Rehandling from stockpiles is included in processing costs for that period.
The percentage breakdown of the LOM average mining costs is presented in Figure 21.1.
Table 21.2
Forecast Mining Operating Costs– Five-year Plan and LOM
| Description | Unit | 2013 | 2014 | 2015 | 2016 | 2017 | Avg. Costs (2018- 2042) | Avg. Cost (2043- 2064) | LOM Avg. Costs |
| Drilling | $/t mined | 0.30 | 0.44 | 0.47 | 0.50 | 0.51 | 0.48 | - | 0.48 |
| Blasting | $/t mined | 0.28 | 0.38 | 0.40 | 0.42 | 0.42 | 0.41 | - | 0.41 |
| Loading | $/t mined | 0.39 | 0.24 | 0.24 | 0.30 | 0.34 | 0.43 | - | 0.41 |
| Hauling | $/t mined | 0.84 | 0.52 | 0.55 | 0.66 | 0.60 | 1.16 | - | 1.07 |
| Miscellaneous | $/t mined | 0.93 | 0.64 | 0.65 | 0.70 | 0.70 | 0.88 | - | 0.85 |
| Mining Technical Staff | $/t mined | 0.80 | 0.48 | 0.43 | 0.44 | 0.44 | 0.48 | - | 0.48 |
| Total | $/t mined | 3.54 | 2.70 | 2.74 | 3.02 | 3.01 | 3.84 | - | 3.69 |
Mine operating and maintenance labour costs are included in unit costs for each area.
Figure 21.1
Salobo Mine– Breakdown of Mining Cost Estimate
![]()
158
21.2.2 Process Operating Costs
The Salobo Mine annual process operating cost was forecast by Micon based on its understanding of unit costs, the ramp-up schedule for Phases I and II, and planned LOM steady state throughput. Micon has assumed that, at a steady-state throughput of 24 Mt/y, process operating costs over the LOM period will remain constant at $13.59/t milled (dry basis), with an additional provision of $0.50/t for material rehandled from the long-term stockpiles once open pit mining ceases. Table 21.3 shows the average unit costs during the ramp-up period, during steady state operations treating fresh ore, and later during reclaim from the medium and low grade stockpiles.
The percentage breakdown of the LOM average processing cost is presented in Figure 21.2
Table 21.3
Forecast Process Operating Costs– Five-year Plan and LOM
| Description | Unit | 2013 | 2014 | 2015 | 2016 | 2017 | Avg. Costs (2018- 2042) | Avg. Cost (2043- 2064) | LOM Avg. Costs |
| S/P Rehandle | $/t milled | nil | nil | nil | nil | nil | nil | 0.50 | $0.20 |
| Crushing | $/t milled | 0.58 | 0.51 | 0.51 | 0.51 | 0.51 | 0.51 | 0.51 | $0.51 |
| HPGR | $/t milled | 1.09 | 0.95 | 0.95 | 0.95 | 0.95 | 0.95 | 0.95 | $0.95 |
| Milling | 5.42 | 5.43 | 5.43 | 5.43 | 5.43 | 5.43 | 5.43 | $5.43 | |
| Flotation | $/t milled | 1.29 | 1.46 | 1.46 | 1.46 | 1.46 | 1.46 | 1.46 | $1.46 |
| Utilities | $/t milled | 0.42 | 0.42 | 0.42 | 0.42 | 0.42 | 0.42 | 0.42 | $0.42 |
| Maintenance Plant | $/t milled | 2.07 | 1.81 | 1.81 | 1.81 | 1.81 | 1.81 | 1.81 | $1.81 |
| Others | $/t milled | 3.98 | 3.01 | 3.01 | 3.01 | 3.01 | 3.01 | 3.01 | $3.02 |
| Total | $/t milled | 14.85 | 13.59 | 13.59 | 13.59 | 13.59 | 13.59 | 14.09 | $13.81 |
Process operating and maintenance labour costs are included in unit costs for each area.
Figure 21.2
Salobo Mine– Breakdown of Process Cost Estimate
![]()
159
21.2.3 General and Administrative Costs
Micon’s forecast of G&A operating costs at Salobo is comprised mainly of administrative and technical support services provided to the production departments. Table 21.4 shows the average unit costs during the ramp-up period, during steady state operations treating fresh ore, and later during reclaim from the medium and low grade stockpiles. Except during the ramp-up period, G&A costs are forecast to remain steady through the LOM period.
The percentage breakdown of the LOM average G&A cost is presented in Figure 21.3.
Table 21.4
Forecast G&A Operating Costs– Five-year Plan and LOM
| Description | Unit | 2013 | 2014 | 2015 | 2016 | 2017 | Avg. Costs (2018-2042) | Avg. Cost (2043-2064) | LOM Avg. Costs |
| Personnel | $/t milled | 0.79 | 0.51 | 0.35 | 0.32 | 0.32 | 0.32 | 0.32 | $0.33 |
| Materials | $/t milled | 0.66 | 0.42 | 0.28 | 0.26 | 0.26 | 0.26 | 0.26 | $0.27 |
| Services | $/t milled | 3.03 | 1.92 | 1.30 | 1.20 | 1.20 | 1.20 | 1.20 | $1.22 |
| Taxes | $/t milled | 0.09 | 0.09 | 0.06 | 0.06 | 0.06 | 0.06 | 0.06 | $0.06 |
| Travels | $/t milled | 0.06 | 0.04 | 0.03 | 0.02 | 0.02 | 0.02 | 0.02 | $0.03 |
| Others | $/t milled | 2.31 | 1.42 | 0.96 | 0.89 | 0.89 | 0.89 | 0.89 | $0.91 |
| Total | $/t milled | 6.94 | 4.40 | 2.98 | 2.74 | 2.74 | 2.74 | 2.74 | $2.80 |
Figure 21.3
Salobo Mine– Breakdown of G&A Cost Estimate
![]()
21.2.4 Operating Cost Summary
Table 21.5 shows a summary of unit direct operating costs for the LOM.
160
Table 21.5
Direct Operating Costs Summary
| Description | Unit | 2013 | 2014 | 2015 | 2016 | 2017 | Avg. Costs (2018- 2042) | Avg. Cost (2043- 2064) | LOM Avg. Costs |
| Mining | $/t milled | 23.30 | 16.97 | 13.82 | 14.00 | 13.96 | 15.49 | - | 9.26 |
| Processing | $/t milled | 14.85 | 13.59 | 13.59 | 13.59 | 13.59 | 13.60 | 14.09 | 13.81 |
| G&A | $/t milled | 6.94 | 4.40 | 2.98 | 2.74 | 2.74 | 2.74 | 2.74 | 2.80 |
| Total | $/t milled | 45.09 | 34.96 | 30.40 | 30.34 | 30.29 | 31.84 | 16.83 | 25.87 |
161
22.0 ECONOMIC ANALYSIS
22.1 BASIS OF EVALUATION
Micon has prepared its assessment of the Salobo Mine on the basis of a discounted cash flow model, from which Net Present Value (NPV), Internal Rate of Return (IRR), payback and other measures of project viability can be determined. Assessments of NPV are generally accepted within the mining industry as representing the economic value of a project after allowing for the cost of capital invested.
The objective of the study was to determine the viability of the open pit mine and process plant to exploit the Salobo deposit. In order to do this, the cash flow arising from the base case has been forecast, enabling a computation of the NPV to be made. The sensitivity of this NPV to changes in the base case assumptions is then examined.
Silver Wheaton’s agreement with Vale takes the form of a binding term sheet under which, in return for a cash consideration of $1,330 million and a number of Silver Wheaton warrants, it will acquire 25% of the gold production of Salobo at a price which is the lesser of $400/oz (subject to a 1% annual inflation adjustment from 2016) and the prevailing market price of gold. Production will accrue retroactively to Silver Wheaton as of 1 January, 2013.
The consequential reduction in annual operating revenue at the Salobo Mine is examined to determine its impact on the project economics and hence the viability of the mineral reserve.
22.2 MACRO-ECONOMIC ASSUMPTIONS
22.2.1 Exchange Rate and Inflation
All results are expressed in United States dollars. Cost estimates and other inputs to the cash flow model for the project have been prepared using constant, 2012 money terms, i.e., without provision for escalation or inflation.
22.2.2 Weighted Average Cost of Capital
Micon has selected a base case discount rate of 10% for its evaluation of the mine, and presents results over a range of values above and below this base case rate.
22.2.3 Expected Metal Prices
Figure 22.1 shows copper and gold prices over the past ten years. Base case metal prices for the evaluation have been selected to represent a three-year trailing average price for both copper and gold. These values are $3.70/lb Cu and $1,485/oz gold respectively.
162
Figure 22.1
Copper and Gold Prices
![]()
22.2.4 Royalty
Micon understands there are no third-party royalties applicable to the property.
22.2.5 Taxation Regime
In computing taxes applicable to Salobo, Micon has assumed that the mine’s net income is taxed on a stand-alone basis. Micon understands that Brazilian Federal and State income taxes comprise the following:
Corporate Income tax, IRPJ – Normally charged at 25%. Until 2021, Salobo benefits from an incentive scheme and will pay only 25% of the normal rate, i.e., 6.25%.
Social Contribution, CSLL – Charged at 9% of pre-tax profits.
Mineral exploitation tax, CFEM – Charged at 2% of net revenue.
Micon has also assumed that since all concentrate sales from Salobo are exported, Brazilian and Pará state value-added taxes arenot applicable to sales and, to the extent they are paid on equipment and consumable supplies, they are absorbed in mine operating costs. Those taxes are:
Social Security Contribution, COFINS – charged on gross revenue, less a 7.6% credit on expenses.
Profit Participation Program, PIS – 1.65% on same basis as COFINS.
163
- State Sales Tax, ICMS – 12.0%, on same basis as COFINS.
22.3 TECHNICAL ASSUMPTIONS
The technical parameters, production forecasts and estimates described elsewhere in this report are reflected in the base case cash flow model. These inputs to the model are summarized below.
The measures used in the study are metric tonnes, pounds avoirdupois and troy ounces. Where applicable, the metric equivalents of these are given here for reference only.
22.3.1 Mine Production Schedule
The mining schedule is designed to produce sufficient high grade run-of-mine material to utilize the 24 Mt/y expanded capacity of the process plant, with lower (MG and LG) material being stockpiled for later use. See Figure 22.2.
Figure 22.2
Open Pit Mine Production Schedule
![]()
The stockpiled MG and LG material will be rehandled from the long-term stockpiles and fed into the process plant once all the high grade ore from the open pit is consumed. Figure 22.3 shows the LOM milling schedule.
164
Figure22.3
LOM Processing Schedule
![]()
22.3.2 Selling Expenses
Copper-gold concentrate produced at the mine will be shipped to overseas buyers for smelting and refining. The costs of this have been taken into account in Micon’s cash flow projection, based on its understanding of the terms offered by a range of off-takers. Micon is not privy to the commercially sensitive details of the agreements in place between Vale and its customers at this time. Nevertheless, based on its experience elsewhere, Micon considers the overall transport, treatment and refining costs forecast by Vale to be reasonable, with an average of 15% of the gross value of metal in concentrate absorbed by concentrate transport, smelting and refining charges over the LOM period, using base case metal prices. Figure 22.4 shows the NSR value of the ore in comparison to these costs.
165
Figure 22.4
Concentrate NSR Value
![]()
22.3.3 Closure Costs
As noted elsewhere in this report, mine closure costs have been estimated at $193 million, and are reflected in Micon’s cash flow forecast at the end of the LOM period.
22.3.4 Operating Costs
After adjusting the long-term cost forecast provided by Vale, Micon estimates that operating costs will average $25.87/t milled over the LOM period, made up as shown in Table 22.1.
Table 22.1
LOM Operating Costs
| Operating Cost Area | $/t milled |
| Mining | 9.26 |
| Processing | 13.81 |
| G&A | 2.80 |
| Direct Site Operating Costs | $ 25.87 |
At base case metal prices, the Salobo Mine is forecast to enjoy a healthy operating margin, averaging around 50% while the open pit is producing high grade ore. Once the processing of medium- and low-grade stockpiles commences, though, the operating margin narrows significantly, to average around 27% over the period 2043-2062, as shown in Figure 22.5.
166
Figure 22.5
LOM NSR vs Operating Costs
![]()
The gold streaming agreement with Silver Wheaton will reduce Salobo’s cash operating margins over the life of mine period. At base case metal prices, Micon estimates that margins will be reduced from 50% to 47% during the open pit mining phase to 2042, and thereafter from 25% to 22%, while the process plant treats medium- and low-grade stockpile material.
22.3.5 Capital Costs
The capital costs of construction for Salobo Phase I are sunk, except for minor modifications in the process plant currently underway. Phase II capital costs are also largely either sunk or committed, with approximately $882 million remaining to be spent in 2013/2014. Of this amount, approximately $275 million has already been committed.
Thereafter, sustaining capital costs in Micon’s cash flow forecast comprise mainly additional and replacement mining equipment over the period 2013 to 2042 ($1,730 million), and raising of the tailings impoundment to its final height, starting in 2016 ($36 million).
22.4 BASE CASE EVALUATION
Micon has prepared its cash flow forecast bases on a review of Vale’s plans and forecasts, adjusted at its discretion to reflect the base case presented in this report.
Micon’s cash flow forecast, based on mineral reserves only, is presented graphically in Figure 22.6, before accounting for the revenue adjustment implied by the gold streaming agreement with Silver Wheaton.
167
Figure 22.6
LOM Annual Cash Flow Forecast
![]()
Table 22.2 shows LOM annual production and cash flows.
168
Table 22.2
LOM Annual Cash Flows
![]()
Applying a discount rate of 10%, Micon estimates the NPV of the after-tax cash flow (NPV10) to be $4.85billion, as of 1 January, 2013.
169
Given that much of the capital cost is now sunk, estimates of IRR and payback period are not considered meaningful.
Using base case metal prices, Micon’s estimate of LOM unit revenues and costs are presented in Table 22.3, which shows the impact on operating margin related to the gold streaming agreement with Silver Wheaton.
Table 22.3
Base Case Revenue and Operating Costs
| Before Streaming | After Streaming | |||
| $/t milled | Cash Operating Margin (%) | $/t milled | Cash Operating Margin (%) | |
| Net Smelter Return | 49.12 | 100 | 47.18 | 100 |
| Direct Site Costs: | ||||
| Mining | 9.26 | 9.26 | ||
| Processing | 13.81 | 13.81 | ||
| G&A | 2.80 | 2.80 | ||
| S/T Direct site costs | 25.87 | 47 | 25.87 | 45 |
| Transport, TC/RC | 8.98 | 8.97 | ||
| S/T Cash Operating Costs | 34.85 | 29 | 34.84 | 26 |
| Royalties and Production Taxes | 0.98 | 0.94 | ||
| Total Cash Costs | 35.83 | 27 | 35.78 | 24 |
The gold streaming arrangement is thus seen to reduce cash operating margin by approximately 3% at base case prices, which the mine can readily absorb. Therefore, Micon concludes that the gold streaming arrangement should have no material impact on economic cut-off grade used in the mine plan, and thus the estimate of mineral reserves remains valid.
22.5 SENSITIVITY
Micon has made an analysis of the sensitivity of the project to changes in revenue factors, (such as metal prices, grades and recoveries), capital and operating costs (see Figure 22.7) . As is typical, the project is most sensitive to changes in revenue factors, but is able to withstand a 30% adverse change before NPV10is reduced to $0.61 billion. That point is equivalent to a copper price of $2.59/lb.
The mine is less sensitive to operating costs, with a 30% increase in costs resulting in a reduction of 34% in NPV10to $3.19 billion. Owing to the large proportion of sunk capital, the project is not sensitive to capital cost increases. A 30% capital increase results in an 8% drop in NPV10to $4.45 billion.
170
Figure 22.7
Sensitivity Diagram
![]()
22.6 CONCLUSION
Micon concludes that this analysis demonstrates the viability of the mine (including the Phase II expansion which is presently underway), and that the proposed gold streaming agreement with Silver Wheaton should have no material impact on the mine’s estimate of mineral reserves.
171
23.0 ADJACENT PROPERTIES
There are no mineral properties adjacent to Salobo Mine.
172
24.0 OTHER RELEVANT DATA AND INFORMATION
There is no other relevant data and information to disclose.
173
25.0 INTERPRETATION AND CONCLUSIONS
25.1 GEOLOGY AND MINERAL RESOURCES
Based on its review of various reports and audits, Micon considers that the procedures used for drilling and sampling conducted on the project are acceptable for mineral resource and mineral reserve modelling. The CVRD drilling data that represents a majority of the data is complete and was conducted using standard exploration techniques. Minorco similarly concluded in the 1998 report that the sampling procedures used by CVRD and predecessor companies have provided representative samples of the deposit.
Micon believes that the quality control program at Salobo had some issues (as noted by AMEC) but that, overall, the laboratory analytical results were accurate enough to meet mining industry standards. The more recent work (2002 onwards) is of a higher standard and the re-evaluation of 51,768 of the original 75,577 samples drilled prior to 2002 has gone some way to mitigate any shortcomings and is commendable. However, the decision by Vale to adjust these data (Tables 11.5 and 11.6) in light of the results is considered unnecessary by Micon.
All drill core is stored in wooden boxes with proper numbering to indicate the drill hole number and metreage. The data submitted to Micon appear reliable in light of the checks it has carried out. Micon has not independently verified the statements and data contained in historical reports or in assay data provided to Micon for the purpose of this mineral resource estimate, other than those steps described herein. Notwithstanding the above Micon is satisfied that the drill hole data for the Salobo deposit is suitable for use in the mineral resource estimate.
Micon’s review found that the degree of geological evaluation by Vale personnel is appropriate and that the geology, mineral controls and geometry of mineral zone are adequately delineated from exploration work. Geologic interpretation is reasonable, with consistent correlations of mineral zones between cross sections. Furthermore, Micon concludes that the mineralization within the Salobo deposit is quite predictable and relatively uniform within the modelling parameters which were used to create the mineral resource models. Micon concludes that the Salobo mineral resource modelling has been conducted using standard industry methods and is believed to reasonably represent the deposit tonnage and copper and gold grades. Micon believes that the mineral resource model is an acceptable basis for the subsequent estimation of mineral reserves.
The reported mineral resources lie within (i.e., they are constrained by) an open pit optimization shell generated using metal prices of $3.67/lb for copper and $1,500/oz for gold, with all other parameters kept the same as for the current LOM open pit optimization described in Section 15.0 of this report. In Micon’s opinion, the reported mineral resources thus satisfy the requirement for having reasonable prospects for economic extraction.
174
25.2 MINING AND MINERAL RESERVES
Vale’s 2012 block model forms the basis of Salobo’s mineral reserves and resources. The cut-off grade applied to the 2012 block model reflects Vale’s forecasts of direct operating costs, recoveries and metal prices, etc. The change in mineral reserves reported in 2011and 2012 is less than 1% (Vale, 2013). In Micon’s opinion, therefore, the optimized pit shell generated in 2011 remains valid as a basis for the final open pit mine design, from within which the mineral reserves reported in this Technical Report. The various plans and presentations provided by Vale demonstrate that mine planning work is being carried out to industry standards, and that the mine planning processes are sound and appear to be competently carried out.
Micon believes the key assumptions, parameters and methods used to convert mineral resource to mineral reserve are appropriate. There are no known mining, metallurgical, infrastructure, permitting or other relevant factors that may affect the mineral reserve estimate materially.
Micon considers the quantity of geotechnical and data and investigations at Salobo to be less than typical for other projects of similar size and stage of development. Nevertheless, in Micon’s opinion the rockmass appears to be competent and in line with the assessment made by Vale’s consultants.
25.3 METALLURGY AND PROCESSING
It is Micon’s opinion that the processing recovery equations for copper and gold developed for the Salobo Mine are reasonable based on the extensive metallurgical test work programs that have been carried out to-date. Notwithstanding this opinion, the recovery curves are a best fit from data points that have significant scatter. In practice therefore, variations in copper and gold recovery, potentially significant at times, can be expected. Moreover, Micon supports the view that production of stable and constant concentrates may be difficult, requiring significant controls in mining and processing operations, grade control and concentrate blending.
The high fluorine content in Salobo concentrate is potentially a cause for concern. However, this is mitigated by the potential to blend Salobo production with concentrates having lower fluorine content, which should significantly reduce the risk of concentrate rejection.
It is Micon’s view that the testwork programs and their interpretation for the design of the alternative HPGR/Ball Mill circuit are reasonable and appropriate. In particular, the review by SMCC, recognized experts on the subject of comminution design and modelling, is reliable.
The design of the Salobo processing plant flowsheet is generally robust, based on the extensive metallurgical testwork reports. The circuit is conventional to the copper industry, with the exception of the use of an HPGR/Ball Mill circuit rather than a more conventional SAG/Ball Milling circuit. The reasons for this selection are described in Section 13.0.
175
Significant commissioning, engineering and operational issues have been identified during the ramp-up phase to date resulting in generally unstable plant operating conditions and directly affecting plant availability, production and metallurgical recovery. Such issues are to be expected, and a detailed Action Plan developed by Vale is targeted for completion by the end of July, 2013. It is Micon’s opinion that stable operating conditions will probably only be achieved towards the end of 2013. Assuming that all the items in the Action Plan are successfully remedied, there is a reasonable expectation that the design throughputs and target recoveries of copper and gold can be achieved. It is likely that, as copper recoveries improve, gold recoveries will also improve in relative proportion.
Among issues having the potential for longer-term impact on production and recovery are the amount of soluble copper present in the plant feed, and use of high-pressure water sprays to break up the compacted HPGR crushed product that could increase the HPGR feed moisture above the design of 5%, thereby impacting on throughput and liner wear life.
25.4 SOCIAL AND ENVIRONMENTAL ISSUES
All required permits are in place for mine operations.
In Micon’s opinion, the 2003 environmental and social management plans are appropriate for the Salobo Mine, but need to be updated.
The company currently maintains and implements a Communication Plan that commits to continued communication with the local indigenous to maintain community health and safety, cultural preservation, transparency of activities and harmony between the workers and the indigenous community.
A number of environmental permit violations have been recorded. In Micon’s opinion, the indicated frequency of non-compliant events is not atypical of construction and early mine operations and appropriate corrective actions are being implemented to mitigate these events. Nevertheless, it is desirable for Salobo to improve environmental performance to maintain permit compliance and reduce the risk of penalties. Effective implementation of updated Environmental Control Plans should support ongoing permit compliance and project support.
25.5 ECONOMIC EVALUATION
Micon’s economic analysis demonstrates the viability of the mine (including the Phase II expansion which is presently underway), and validates the mineral reserve supporting the mine plan.
The gold streaming arrangement is expected reduce Salobo’s cash operating margin by approximately 3% at base case prices, which the mine can readily absorb. Therefore, Micon concludes that the gold streaming arrangement should have no material impact on economic cut-off grade used in the mine plan, and thus the estimate of mineral reserves remains valid.
176
26.0 RECOMMENDATIONS
26.1 GEOLOGY AND MINERAL RESOURCE ESTIMATION
The Salobo deposit has been explored over a protracted period of time and any further exploration is unlikely to provide any significant increase to the mineral resource base. The geological setting and characteristics are well understood and mineralization is quite predictable and relatively uniform, but the structural properties may be underestimated due to drill hole spacing and orientation. However, in-pit mapping and blast hole data will provide important information that should augment and improve these deficiencies and develop the structural model. Furthermore, this data, along with reconciliation, should be utilized to evaluate the accuracy of the resource estimate and block model.
Whilst it is not considered a serious issue, it would be prudent to investigate the presence of grunerite (and cummingtonite) in more detail; grunerite is present in several of the geological units including magnetite schist, garnet grunerite schist, and biotite schist. Grunerite is a mineral of the amphibole group of minerals and forms as fibrous, columnar or massive aggregates of crystals. Should the fibrous form be shown to occur at Salobo Mine, additional measures to control its release may be advisable.
26.2 MINING AND MINERAL RESERVES
Currently the mine is using a 100% mining recovery which is acceptable. However, at least 1-2% of material losses are recommended to be included into the mine plan to account for some material losses due to fines contributed by the high blasting fragmentation and material losses during secondary handling at the stockpile area.
Micon considers the quantity of geotechnical data and investigations performed at the Salobo Mine is low in comparison to other projects of similar size and recommends that additional investigations be performed as recommended by Vale’s geotechnical consultants. Site geotechnical mapping can be facilitate with modern photogrammetry instruments such as the Sirovision® to increase the speed of rock face mapping and analysis of geological structure compared to the traditional scanline mapping with a geological compass.
A further review of the slope design should be completed as the open pit develops, to complement the existing geotechnical model and data collected. Also, further geotechnical studies for the ultimate waste rock dump need to be finalized.
As the mining and milling operation achieve steady state production, it is recommended that Salobo Mine perform a technical evaluation on the cost benefits between excessive blast fragmentation to crushing to reduce to the overall explosive consumption and costs.
Micon has reviewed the mobile equipment production rates and considers them appropriate even though the overall heaving equipment utilization values (60-70%) on site are currently lower than the estimated figures and industry averages. This is common during ramping up stage, however it is recommended that Vale established a systematic procedure to address the major contributing factors to the low utilization with the current new fleet of mining equipment in preparation for the steady state production.
177
26.3 PROCESSING AND INFRASTRUCTURE
Any engineering changes implemented in Phase I should be implemented in Phase II. This is not currently the case, so there are likely to be some cost implications in the future.
26.4 ENVIRONMENTAL MANAGEMENT
Micon recommends that waste characterization studies be updated to verify the acid drainage potential of waste rock types in the latest mine plans and to further characterize neutral mine drainage to determine if any further waste and water management measures should be employed.
Micon recommends that the 2003 Environmental Control Plans be updated to reflect any changes in operations from the original plans and thereafter should be updated on a regular basis as part of the goal of continual improvement. Additionally, it is recommended that Salobo identify and address areas where the implementation and performance of its Environmental Control Plans can be improved to gain consistency in compliance with its operating permits.
26.5 ECONOMICS
Micon’s analysis of the project economics demonstrates the viability of the Salobo mine plan and the declared mineral reserves. Strategic mine planning has been carried out to identify an optimal open pit mine design and a sequence of open pit phases for its implementation, together with a stockpiling strategy for enhance the grade of process feed in the early years of the project. Micon recommends that the ultimate pit shell, phases and stockpile cut-off grades be regularly reviewed to ensure these remain optimal once ramp-up has been completed and ore reserve reconciliation and actual operating cost data become available.
178
27.0 DATE AND SIGNATURE PAGE
The effective date of the mineral resource and mineral reserve estimates presented in this report is 31 December, 2012.
Jason Ché Osmond {signed and sealed]
Jason Ché Osmond, C.Geol, FGS, EurGeol.
Micon International Co. Limited
Signing Date: 19 March, 2013
Barnard Foo {signed and sealed}
Barnard Foo., P.Eng.
Micon International Limited
Signing Date: 19 March, 2013
James Turner {signed and sealed}
James Turner, C.Eng. MIMMM
Micon International Co. Limited
Signing Date: 19 March, 2013
Christopher Jacobs {signed and sealed}
Christopher Jacobs, CEng, MIMMM
Micon International Limited
Signing Date: 19 March, 2013
179
28.0 REFERENCES
AMEC, 2002. Feasibility Study and block model, September, 2002.
ANA, 2012. Resolucão No. 233, de 20 de Junho de 2012. Water use permit. Granted to Salobo Metais S.A. by Agéncia Nacional de Águas.
AUSIMM. Australian Institute of Geoscientists and Minerals Council of Australia. Australasian Code for Reporting of Mineral Resources and Ore Reserves (The JORC Code): 2004 edition. Joint Ore Reserves Committee of the Australasian Institute of Mining and Metallurgy, 2004, 20 p.
Brandt, 2003. Plano de Controle Ambiental – PCA, Programs A to P. Prepared for Salobo Metais S.A. Prepared by Brandt Meio Ambiente. April, 2003.
BVP Engenharia, 2007. Project Detalhado Mina Revisão Dos Taludes da Cava.
CVRD, 1997. Projeto Cobre Salobo Investigacão da Drenagem Ácida, Testes Complementares. Final report, revision 1. Annex 4 of the Water and Effluent Management program of the Salobo Environmental Control Plan, Brandt, 2003.
Fonseca, 2006. Testes de flotação rougher com adição de NASH e CaO para minério de cobre sulfetado do depósito Salobo. Ronaldo Fonseca, Salobo Process Department, September, 2006.
FUNAI, 1989. Convenio No. 453/89 Que Entre si Cele Bram a Comunidade Indígena Xicrin do Cateté Assistida Pela Fundacão Nacional do Indio – FUNAI e a CVRD – Companhia Vale do Rio Doce. Fundacão Nacional do Indio, Brasilia, D.F.
Golder, 2004. SEC ore reserve audit.
Golder, 2006. Projecto Salobo, Relatório de Impacto Ambiental – RIMA. Prepared for Salobo Metais S/A, Belo Horizonte. Prepared by Golder Associates Brasil Consultoria e Projectos Ltda.. 67 pp.
Golder, 2006. Prognóstico com Identificacão e Avaliacão dos Impactos Ambientais, Projecto Salobo. Prepared for Salobo Metais S/A, Belo Horizonte. Prepared by Golder Associates Brasil Consultoria e Projectos Ltda.. 73 pp.
Golder S.A, 2010. SEC audit ore reserve, June, 2010.
IBAMA, 2012a. Licenca de Instalacão No. 889/2012.
IBAMA 2012b. Licenca de Operacão no. 1096/2012.
IBGE, 2013. Participacão das atividades economicas no valor adicionado bruto a precos básicos, por Unadidas da Federacão - 2010. Regional Accounts of Brazil 2010. ftp://ftp.ibge.gov.br/Contas_Regionais/2010/pdf/tab04.pdf. Accessed February, 2013.
180
ICMBio, 2007. Convenio que Celebram o Instituto Chico Mendes de Conservacão da Biodiversidade e a Salobo Metais S.A. – Salobo, Objetivando o Cumprimento do Disposto na Condicinante 2.2, da Licenca de Instalacão No. 416/06 para
Apoio Integral a Gestão da Floresta Nacional de Tapirapé-Aquiri.
Kvaerner, 2001. Feasibility Study.
MRDI, 1999. Pre- Feasibility Study.
National Press, 2007. Extrato de Compromisso. Diário Oficial da União. No. 182, 20 September, 2007. ISSN 1677-7069.
PAH, 2005. SEC ore reserve audit, March, 2005.
PAH, 2007. Salobo Copper Gold Project, Reserve Audit, Para State, Brazil, Prepared by Pincock, Allen & Holt for Companhia Vale do Rio Doce.
PAH, 2008. SEC ore reserve audit.
SBC, 2003. Sérgio Brito Consultoria, Revisão do Dimensionamento Preliminar Dos Tauldes Da Cava, 2003.
Snowden, 2003. Resource Block Model and Database, February, 2003.
Stacey, 2009. Mining Geotechnical Review – DIOC LR 01-09. Parauapebas, PA. Stacey Mining Geotechnical Ltd., 2009.
Vale, 2011. Desmobilizacão de ativos e liberacão da provisão para desmbolso financeiro. Department of Environmenta and Sustainable Development.
Vale, 2012a. Relatório Anual das Condicionantes do Meio Social no ambito do Projeto Salobo, referente a renovacão da Licenca No. 416/2006 – IBAMA/DILIC – Brasília – DF. Annual social report. January, 2012.
Vale, 2012b. Mina do Salobo, Relatório do Plano Plurianual de Produção – 24 Mtpa, Relatório Técnico Novembro de 2012.
Vale, 2012c. Mina do Salobo, Aderêmcia e reconciliação Período: Outubro a Dezembro de 2012, Novembro de 2012.
Vale, 2013. Vale South Atlantic Base Metals Salobo Operations Consolidated Statement, 2012 MRMR Supplementary Document, Confidential, 10 January, 2013.
181
29.0 CERTIFICATES
182
CERTIFICATE OF AUTHOR
Jason Ché Osmond
As co-author of this report entitled “Technical Report on the Mineral Reserves and Mineral Resources of the Salobo Copper-Gold Mine, Carajás, Pará State, Brazil”, with an effective date of 31 December, 2012 (the “Technical Report”), I, Jason Ché Osmond, do hereby certify that:
| 1. | I am employed as a Senior Geologist by, and carried out this assignment for: |
Micon International Co Limited, Tremough Innovation Centre, Tremough Campus, Penryn, Cornwall, TR10 9TA, UK |
| 2. | I hold the following academic qualifications: |
B. Sc. (Hons) Geology and Cartography, Oxford Brookes University, 1995; | |
M. Sc., Mining Geology, Camborne School of Mines, University of Exeter, 1997. | |
| |
| 3. | I am a Chartered Geologist and Fellow of the Geological Society registered with The Geological Society of the U.K. (Fellowship number: 1016839); |
| |
Also, I am a registeredEuropean Geologist, Professional Graduate Member of The Institute of Materials, Minerals, and Mining (Membership No. 99301379), and Master of the Camborne School of Mines; | |
| |
| 4. | I have worked in the minerals industry for 15 years; my work experience includes 4 years as an exploration geologist/consultant in gold and base metal deposits, and 8 years as a consulting geologist on a variety of precious and base metals and industrial minerals; |
| |
| 5. | I do, by reason of education, experience and professional registration, fulfill the requirements of a Qualified Person as defined in NI 43-101; |
| 6. | I visited the Salobo Mine on 8 – 9 February, 2013; |
| 7. | I am responsible for the preparation of Sections 6, 7, 8, 9, 10, 11, 12 and 14, and the portions of Sections 1, 25 and 26 summarized therefrom, of the Technical Report; |
| 8. | I am independent of Silver Wheaton Corp. and Vale S.A., in terms of Section 1.5 of NI 43-101; |
| 9. | I have had no previous involvement with the property; |
| 10. | I have read NI 43-101 and the portions of the Technical Report for which I am responsible have been prepared in compliance with the instrument; |
| 11. | As of the date of this certificate to the best of my knowledge, information and belief, the sections of this Technical Report for which I am responsible contain all scientific and technical information that is required to be disclosed to make the Technical Report not misleading. |
Dated this 19th day of March, 2013
“Jason Ché Osmond” {signed and sealed}
Jason Ché Osmond, B.Sc. (Hons), M.Sc., EurGeol, C.Geol,, FGS
Senior Geologist
183
CERTIFICATE OF AUTHOR
Barnard Foo
As co-author of this report entitled “Technical Report on the Mineral Reserves and Mineral Resources of the Salobo Copper-Gold Mine, Carajás, Pará State, Brazil”, with an effective date of 31 December, 2012 (the “Technical Report”), I, Barnard Foo, do hereby certify that:
| 1. | I am a Senior Mining Engineer, employed by, and carried out this assignment for Micon International Limited, Suite 205, 700 West Pender, Vancouver, British Columbia, V6C 1GB. Tel: 1-604-647-6463 Fax: 1-604-647-6455 |
| 2. | I hold the following academic qualifications: |
| Laurentian University, B.Eng., Mining Engineering | 1998 | |
| University of British Columbia, M.Eng., Rock Mechanics | 2007 | |
| University of Northern British Columbia, Executive MBA | 2010 |
| 3. | I am a registered Professional Engineers of Ontario (Membership # 100052925); |
| 4. | I have worked as a mining engineer in the minerals industry for 15 years; |
| 5. | I am familiar with NI 43-101 and, by reason of education, experience and professional registration; I fulfill the requirements of a Qualified Person as defined in NI 43-101. My work experience includes 4 years as an mining engineer in cassiterite, base and precious metal deposits, 5 years in underground and open pit geotechnical engineering and 5 years with in mine design and mining project evaluations for the mineral industry; |
| 6. | I visited the Salobo Mine on 8 – 9 February, 2013; |
| 7. | I am responsible for the preparation of Section 15 and 16, and the portions of Sections 1, 25 and 26 summarized therefrom, of the Technical Report; |
| 8. | I am independent of Silver Wheaton Corp. and Vale S.A. in terms of Section 1.5 of NI 43-101; |
| 9. | I have read the NI 43-101 and this Technical Report has been prepared in compliance with the Instrument; |
| 10. | As of the date of this certificate to the best of my knowledge, information and belief, the sections of this Technical Report for which I am responsible contain all scientific and technical information that is required to be disclosed to make the Technical Report not misleading. |
Dated this 19th day of March, 2013.
“Barnard Foo” {signed and sealed}
Barnard Foo, M.Eng., P.Eng., MBA.
Senior Mining Engineer
184
CERTIFICATE OF AUTHOR
James Turner
As co-author of this report entitled “Technical Report on the Mineral Reserves and Mineral Resources of the Salobo Copper-Gold Mine, Carajás, Pará State, Brazil”, with an effective date of 31 December, 2012 (the “Technical Report”), I, James Turner, do hereby certify that:
| 1. | I am employed as a Senior Mineral Processing Engineer by, and carried out this assignment for: Micon International Co Limited, Tremough Innovation Centre, Tremough Campus, Penryn, Cornwall, TR10 9TA, UK. |
| 2. | I hold the following academic qualifications: |
B.Sc. (Hons) Mineral Processing Technology, Camborne School of Mines, 1984; MSc Minerals Engineering, Camborne School of Mines, 1993; | |
| 3. | I am a Chartered Engineer registered with the Engineering Council of the U.K. (registration number 413242); |
Also, I am a professional member in good standing of: The Institute of Materials, Minerals and Mining; | |
| 4. | I am a Chartered Mineral Processing Engineer and Camborne School of Mines graduate with 30 years experience specialising in Gold CIP/CIL/Heap/Dump Leaching and Tin Gravity and Flotation processes. Experience to-date has principally been in site operational management to Process Manager level, together with extensive commissioning and consultancy experience, including due diligence and feasibility studies. I have been specifically involved in greenfield start-ups in Mauritania, Guinea, Ghana, Kazakhstan, Venezuela, Brazil and South Africa; |
| 5. | I do, by reason of education, experience and professional registration, fulfill the requirements of a Qualified Person as defined in NI 43-101; |
| 6. | I visited the Salobo Mine on 8 – 9 February, 2013; |
| 7. | I am responsible for the preparation of Sections 13 and 17 and the portions of Sections 1, 25 and 26 summarized therefrom, of the Technical Report; |
| 8. | I am independent of Silver Wheaton Corp. and Vale S.A. in terms of Section 1.5 of NI 43-101; |
| 9. | I have had no previous involvement with the property; |
| 10. | I have read NI 43-101 and the portions of the Technical Report for which I am responsible have been prepared in compliance with the instrument; |
| 11. | As of the date of this certificate to the best of my knowledge, information and belief, the sections of this Technical Report for which I am responsible contain all scientific and technical information that is required to be disclosed to make the Technical Report not misleading. |
Dated this 19th day of March, 2013
“JamesTurner” {signed and sealed}
James Turner, BSc (Hons) MSc. CEng, MIMMM
Senior Mineral Processing Engineer
185
CERTIFICATE OF AUTHOR
Christopher Jacobs
As co-author of this report entitled “Technical Report on the Mineral Reserves and Mineral Resources of the Salobo Copper-Gold Mine, Carajás, Pará State, Brazil”, with an effective date of 31 December, 2012 (the “Technical Report”), I, Christopher Jacobs, do hereby certify that:
| 1. | I am employed as a mineral economist by, and carried out this assignment for: Micon International Limited, Suite 900 – 390 Bay Street, Toronto, ON, M5H 2Y2 |
| 2. | I hold the following academic qualifications: |
| B. Sc. (Hons) Geochemistry, University of Reading, 1980; | |
| M. B.A., Gordon Institute of Business Science, University of Pretoria, 2004. | |
| 3. | I am a Chartered Engineer registered with the Engineering Council of the U.K. (registration number 369178); |
Also, I am a professional member in good standing of: The Institute of Materials, Minerals and Mining; and The Canadian Institute of Mining, Metallurgy and Petroleum (Member); | |
| 4. | I have worked in the minerals industry for over 30 years; my work experience includes 10 years as an exploration and mining geologist on gold, platinum, copper/nickel and chromite deposits; 10 years as a technical/operations manager in both open pit and underground mines; 3 years as strategic (mine) planning manager and the remainder as an independent consultant when I have worked on a variety of precious and base metal deposits; |
| 5. | I do, by reason of education, experience and professional registration, fulfill the requirements of a Qualified Person as defined in NI 43-101; |
| 6. | I visited the Salobo Mine on 8 – 9 February, 2013; |
| 7. | I am responsible for the preparation of Sections 2 to 5, 18 to 24, 28, and the portions of Sections 1, 25 and 26 summarized therefrom, of the Technical Report. |
| 8. | I am independent of Silver Wheaton Corp. and Vale S.A. in terms of Section 1.5 of NI 43-101; |
| 9. | I have had no previous involvement with the property; |
| 10. | I have read NI 43-101 and the portions of the Technical Report for which I am responsible have been prepared in compliance with the instrument; |
| 11. | As of the date of this certificate to the best of my knowledge, information and belief, the sections of this Technical Report for which I am responsible contain all scientific and technical information that is required to be disclosed to make the Technical Report not misleading. |
Dated this 19th day of March, 2013
“ChristopherJacobs” {signed and sealed}
Christopher Jacobs, CEng, MIMMM
186