![]()
SILVER WHEATON IS A PURE
PRECIOUS METALS COMPANY
WITH A GROWTH PROFILE DRIVEN
BY LOW-COST AND LONG-LIFE
ASSETS. WHILE OUR CAPITAL
EXPENSES ARE FIXED, WE PROVIDE
SHAREHOLDERS WITH EXPOSURE
TO EXPLORATION AND EXPANSION
SUCCESS. 2013 WAS A STRONG
YEAR FOR US, AND WE CONTINUE
TO SEE OPPORTUNITIES IN
2014 AND BEYOND.
| CORPORATE PROFILE | 2 |
| LETTER FROM THE PRESIDENT & CEO | 4 |
| GLOBAL ASSETS | 8 |
| CORNERSTONE ASSETS | 9 |
| PERFORMANCE HIGHLIGHTS | 12 |
| PRECIOUS METALS STREAMING | 13 |
| THE PRECIOUS METALS MARKET | 14 |
| CORPORATE SOCIAL RESPONSIBILITY | 15 |
| MANAGEMENT’S DISCUSSION AND ANALYSIS & FINANCIAL STATEMENTS | 17 |
CORPORATE
PROFILE

| SILVER WHEATON IS THE LARGEST PRECIOUS METALS STREAMING COMPANY IN THE WORLD. OUR EXPERIENCED MANAGEMENT TEAM BRINGS TOGETHER DECADES OF EXTENSIVE INDUSTRY KNOWLEDGE. WE HAVE A STRONG TRACK RECORD OF SUCCESS AND BELIEVE OUR CURRENT PORTFOLIO OF STREAMING AGREEMENTS POSITIONS US WELL FOR 2014 AND BEYOND. WE CONTINUE TO STRIVE TO BE THE PREMIER INVESTMENT VEHICLE FOR PRECIOUS METALS INVESTORS WORLDWIDE. | |
| From left to right: | |
| RANDY SMALLWOOD | |
| President & Chief Executive Officer | |
| GARY BROWN | |
| Senior Vice President & Chief Financial Officer | |
| CURT BERNARDI | |
| Senior Vice President, Legal & Corporate Secretary | |
| HAYTHAM HODALY | |
| Senior Vice President, Corporate Development | |
| PATRICK DROUIN | |
| Senior Vice President, Investor Relations | |
| MAURICE TAGAMI | |
| Vice President, Mining Operations | |
| BETTINA CHARPENTIER | |
| Vice President, Tax | |
| NEIL BURNS | |
| Vice President, Technical Services |
2
2013 WAS ANOTHER YEAR OF RECORD PRODUCTION AND SALES VOLUME.
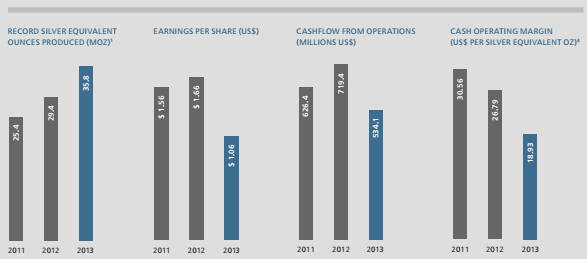
Silver Wheaton’s production and sales volume increased22% and 10% respectively, leading to another record year in 2013. Attributable production increased for the fifth consecutive year, to 35.8 million silver equivalent ounces, resulting in net earnings of $375.5 million ($1.06 per share) and operating cash flows of $534.1 million ($1.50 per share). With an average annual realized silver equivalent price of $23.58 per ounce, and operating costs of $4.65 per silver equivalent ounce, our cash operating margin in 2013 was $18.93 per silver equivalent ounce.
In 2014, based upon the company’s current portfolio of low-cost, long-life assets, attributable production is forecast to be approximately 36 million silver equivalent ounces, including 155,000 ounces of gold. By 2018, annual attributable production is anticipated to increase nearly 35% to approximately 48 million silver equivalent ounces, including 250,000 ounces of gold.
Silver Wheaton’s growth profile is driven by, expansions at Vale’s Salobo and Sudbury operations and the start-up of Hudbay’s Constancia project and Augusta’s Rosemont project.
Our unique business model creates shareholder value by providing:
- Direct leverage to increases in the price of silver and gold;
- Additional growth through the accretive acquisition of new streams;
- A dividend yield tied to precious metal prices and our organic growth; and,
- Participation in the exploration success of the mines underlying our streams.
Silver Wheaton offers these benefits while at the same time reducing many of the downside risks faced by traditional mining companies. In particular, Silver Wheaton offers its investors both capital and operating cost certainty. Other than the initial upfront payment, the company typically has no ongoing capital or exploration costs. Furthermore, our operating costs have been historically fixed at around $4 per ounce of silver produced and $400 per ounce of gold produced.

SILVER WHEATON 2013 ANNUAL REPORT 3
LETTER FROM
THE PRESIDENT & CEO
With silver and gold prices down around 30% in 2013, it was a challenging year in the precious metals space and few, if any, mining companies were left unscathed. While Silver Wheaton was not immune to the pressures caused by the weakness in commodity prices, our streaming business model was designed to shine through all phases of the commodity price cycle. Our company benefits from the low periods by looking to expand our portfolio of assets, and, when prices rebound, we typically profit with higher cash flows from an increased production base. Accordingly, Silver Wheaton invested over $2 billion in 2013 into four new precious metal streams and did so without diluting shareholder equity. We believe our current portfolio of streaming agreements positions us well for 2014 and beyond, and we remain well-positioned to pursue further accretive acquisitions going forward.
Silver Wheaton’s attributable production grew for the fifth consecutive year in 2013 to a record 35.8 million silver equivalent ounces, a 22% increase over 2012. The company also set a new record for sales at 30.0 million ounces. As precious metal prices came under significant pressure throughout the year, our average realized silver equivalent price of $23.58 was 24% below 2012, directly impacting revenue, earnings and cash flow. However, despite the significant fall in precious metal prices, we maintained strong cash operating margins, of around 80%, given our relatively fixed and very low cash cost structure.
The company’s 2013 production growth was mainly a result of three key contributors: Hudbay’s 777 mine and Vale’s Salobo and Sudbury mines. Acquired in August 2012, 777, located in Canada, delivered its first full year of silver and gold production to Silver Wheaton. Furthermore, in February 2013, Silver Wheaton acquired 25% of the life of mine gold production from Salobo, the largest copper deposit ever found in Brazil, as well as 70% of the gold production from Vale’s Canadian Sudbury mines for a 20-year term. These agreements provided immediate cash flow and epitomize our policy of investing in low-cost, high-quality assets.
Primero’s San Dimas mine had another very strong year, contributing 6.5 million ounces to our company. Primero is well on track with their expansion to increase the mine’s throughput capacity from 2,150 to 2,500 tonnes per day (tpd) by the end of the first quarter of 2014, and continues to evaluate a further expansion to 3,000 tpd. As Silver Wheaton’s original asset, the San Dimas mine continues to be our largest producer and one of our cornerstone assets.
Another of our cornerstone assets, Goldcorp’s Peñasquito mine, produced over 6.2 million ounces of silver for us in 2013, despite having mill throughput limited by water shortages. During the year, Goldcorp began implementing a comprehensive plan to alleviate water issues caused by an unprecedented regional drought. They commenced construction of the Northern Well Field and expect to have this additional water source on line by the end of 2014. Silver Wheaton’s current five-year guidance is based on the mine operating at 110,000 to 115,000 tpd, below design capacity of 130,000 tpd, and we believe that Peñasquito has ample opportunity for continued improvement.
In late 2013, Barrick announced that it would temporarily suspend construction activities at Pascua-Lama, and that it no longer expected production to begin by mid-2016. As a result, Silver Wheaton agreed to extend our entitlement to 100% of the silver production from three of Barrick’s currently producing mines by one year, until the end of 2016, and to extend the Pascua-Lama completion test deadline an additional year to the end of 2017. Though the suspension is not ideal, we view the additional year of silver as adequate compensation for extending the deadline. Given the low cash costs anticipated for Pascua-Lama once it is in production, we are confident this world-class project will be developed.
Additionally, in November 2013, we expanded our existing agreement with Hudbay to acquire 50% of the life of mine gold production from the Constancia project. The original agreement, signed in 2012, included 100% of Constancia’s life of mine silver production. Located in southern Peru, the mine is scheduled to start production in late 2014, and is expected to increase our average annual silver equivalent production by approximately 4.5 million ounces in its first five years of full production.
While our business model has many strengths, we continue to innovate and evolve, and in late 2013 signed our first Early Deposit Gold Stream Agreement with Sandspring Resources, which provides us the right to purchase 10% of the life of mine gold production from the Toroparu project, located in the Republic of Guyana, South America. While the total upfront payment is $148.5 million, we have advanced only $13.5 million and can elect to continue with the purchase should Sandspring receive a favourable bankable feasibility study, permits, and the like. If we choose not to proceed with the stream, we can receive either a return of $11.5 million, or a reduced stream. Early Deposit Agreements provide our shareholders exposure to precious metals production from high-potential development projects while minimizing the capital risk.
4
While our primary goal is to create superior shareholder returns by increasing future production through new partnerships and strong organic growth, Silver Wheaton also strives to provide meaningful, sustainable dividends. In 2013, our annualized cash dividend increased 29% to $0.45 per share, from $0.35 in 2012. We amended the dividend policy in May in order to decrease the volatility associated with our quarterly distribution and now pay our shareholders a sustainable 20% of the average of the trailing four quarters’ operating cash flow. This measure should dampen the variable timing of concentrate shipments as well as the volatility seen as a result of commodity price fluctuations.
|  |

SILVER WHEATON 2013 ANNUAL REPORT 5


8
CORNERSTONE
ASSETS
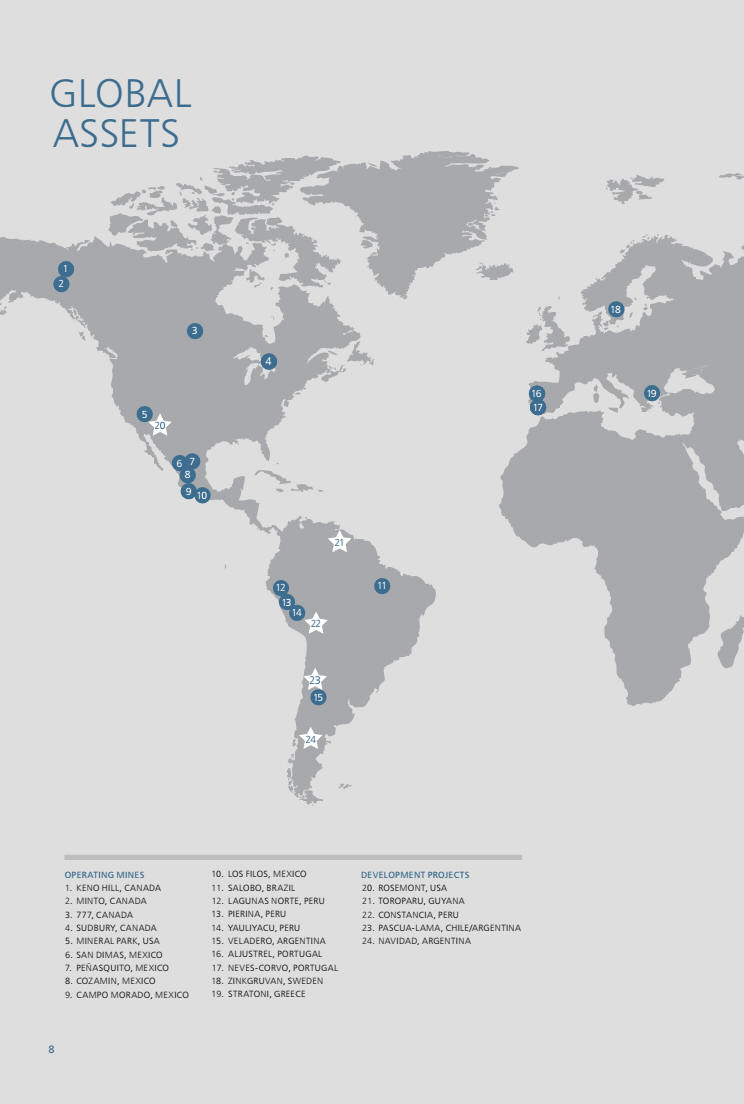
SILVER WHEATON’S DIVERSIFIED PORTFOLIO OF PRECIOUS METALS STREAMS INCLUDES 19 OPERATING MINES AND FIVE DEVELOPMENT PROJECTS. CORNERSTONE ASSETS IN 2013 INCLUDED THE SAN DIMAS AND PEÑASQUITO MINES. TWO NEW CORNERSTONE ASSETS WERE ADDED IN EARLY 2013, WHEN SILVER WHEATON ACQUIRED GOLD STREAMS ON THE SALOBO AND SUDBURY MINES.
SAN DIMAS
Primero’s San Dimas mine had another very strong year in 2013, contributing 6.5 million ounces to Silver Wheaton. Primero is well on track with a planned expansion to increase the mine’s throughput capacity from 2,150 tonnes per day (tpd) to 2,500 tpd in the first quarter of 2014. Primero continues to evaluate a further expansion to 3,000 tpd.
PEÑASQUITO
Goldcorp’s Peñasquito mine produced over 6.2 million ounces of silver for Silver Wheaton in 2013 as water issues caused by an unprecedented drought limited ore throughput. A detailed water study completed in 2013 identified a new well field, the Northern Well Field, which should alleviate current water constraints. Goldcorp commenced construction of the Northern Well Field in 2013 and is expected to have this additional water source on line later in 2014.
SALOBO AND SUDBURY
In February 2013, Silver Wheaton acquired from Vale S.A. gold streams from the Salobo and Sudbury mines. The Salobo mine, the largest copper deposit ever found in Brazil, began operating in 2012 at a capacity of 12 million tons per annum (mtpa), and an expansion to 24 mtpa is scheduled to be complete in mid-2014. Salobo produced over 29 thousand ounces of gold for Silver Wheaton in 2013 and is expected to produce approximately 70 thousand ounces annually for the first ten years of full production.
Vale’s integrated nickel operation in Sudbury is amongst the largest and lowest cost in the world. One of the development projects, the Totten mine, began commissioning in late 2013 and is expected to ramp up production through 2014. Sudbury produced over 32 thousand ounces of gold for Silver Wheaton in 2013 and is expected to contribute on average 50 thousand ounces annually.
LONG-TERM GROWTH
We anticipate production growth of nearly 35%— to 48 million silver equivalent ounces—over the next five years as expansions at Sudbury and Salobo come on line and the Constancia and Rosemont mines are commissioned.

SILVER WHEATON 2013 ANNUAL REPORT 9


PERFORMANCE
HIGHLIGHTS
| 2013 | 2012 | 2011 | |||||||
(As of December 31 for each year) | |||||||||
Financials | |||||||||
Revenue ($000’s) | $ | 706,472 | $ | 849,560 | $ | 729,997 | |||
Net earnings ($000’s) | $ | 375,495 | $ | 586,036 | $ | 550,028 | |||
Operating cash flow ($000’s) | $ | 534,133 | $ | 719,404 | $ | 626,427 | |||
Earnings per share | |||||||||
basic | $ | 1.06 | $ | 1.66 | $ | 1.56 | |||
diluted | $ | 1.05 | $ | 1.65 | $ | 1.55 | |||
Operating cash flow per share1 | $ | 1.50 | $ | 2.03 | $ | 1.77 | |||
Dividends paid ($000’s) | $ | 160,013 | $ | 123,852 | $ | 63,612 | |||
Dividends paid per share | $ | 0.45 | $ | 0.35 | $ | 0.18 | |||
Cash and cash equivalents ($000’s) | $ | 95,823 | $ | 778,216 | $ | 840,201 | |||
Weighted average basic number of shares outstanding (000’s) | 355,588 | 353,874 | 353,249 | ||||||
Share price (NYSE) | $ | 20.19 | $ | 36.08 | $ | 28.96 | |||
| |||||||||
Operating | |||||||||
Attributable silver ounces produced (000’s) | 26,754 | 26,669 | 24,557 | ||||||
Attributable gold ounces produced | 151,041 | 50,482 | 18,436 | ||||||
Attributable silver equivalent ounces produced (000’s)2 | 35,823 | 29,372 | 25,374 | ||||||
Silver ounces sold (000’s) | 22,823 | 24,850 | 20,247 | ||||||
Gold ounces sold | 117,319 | 46,094 | 18,256 | ||||||
Silver equivalent ounces sold (000’s)2 | 29,963 | 27,328 | 21,069 | ||||||
Average realized silver price per ounce sold | $ | 23.86 | $ | 31.03 | $ | 34.60 | |||
Average realized gold price per ounce sold | $ | 1,380 | $ | 1,701 | $ | 1,609 | |||
Average silver cash cost per ounce sold3 | $ | 4.12 | $ | 4.06 | $ | 3.99 | |||
Average gold cash cost per ounce sold3 | $ | 386 | $ | 362 | $ | 300 |
| |
| 1 | Refer to discussion on non-IFRS measure (i) on page 42 of the MD&A. |
| 2 | Gold ounces produced and sold are converted to a silver equivalent basis based on either (i) the ratio of the average silver price received to the average gold price received during the period from the assets that produce both gold and silver; or (ii) the ratio of the price of silver to the price of gold on the date of sale as per the London Bullion Metal Exchange for the assets which produce only gold. |
| 3 | Refer to discussion on non-IFRS measure (ii) on page 43 of the MD&A. |
| 4 | Refer to discussion on non-IFRS measure (iii) on page 44 of MD&A. |
12
PRECIOUS METALS
STREAMING
AT SILVER WHEATON, OUR GOAL IS TO CREATE SUPERIOR SHAREHOLDER VALUE BY ACQUIRING PRECIOUS METALS BURIED WITHIN TRADITIONAL MINING COMPANIES AND UNLOCKING ITS VALUE.
UNLOCKING VALUE
Streaming allows Silver Wheaton to purchase, in exchange for an upfront payment, a fixed percentage of the silver and/or gold produced from a mine. Once an agreement is entered into, Silver Wheaton has the right to purchase the precious metal at a predetermined price as it is delivered. The production payment is set at a level which is meant to offset our partners’ typical cost to produce an ounce of silver or gold. Silver Wheaton does not own or operate mines, but our agreements are typically for the life of the operation, thereby giving us exposure to future expansions and exploration success.
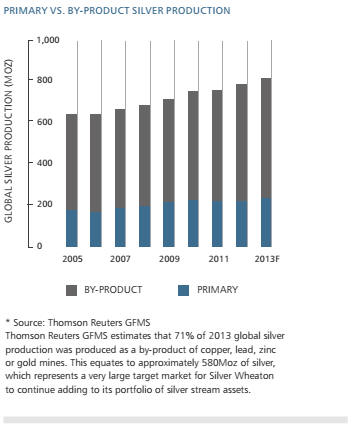
With 70% of worldwide silver produced as a by-product, it is generally considered to be a non-core asset at the mine that produces it. In many large base metal operations, gold production represents only a small fraction of the overall economics of the mine and is therefore also considered non-core. Precious metal streaming provides mining companies with a value-enhancing tool to turn their future silver and gold production profits into an upfront payment today.
Benefits to Silver Wheaton’s Shareholders:
The key benefit of streaming to Silver Wheaton and its shareholders is cost certainty, which translates into direct leverage to increases in precious metal prices. Inflationary cost pressures have plagued the mining industry for the past few years, driving capital and operating costs higher for traditional miners and cutting into profit margins. Once the upfront payment is made, Silver Wheaton typically has no ongoing capital or exploration costs; we do, however, benefit from the expansion and exploration success that result from our partners’ expenditures. Furthermore, Silver Wheaton’s operating costs are set at the time a stream is entered into at a predetermined, fixed production payment, historically at around $4 per ounce of silver and $400 per ounce of gold with a small inflationary adjustment. Fixed costs allow us to consistently deliver amongst the highest cash operating margins in the mining industry.
Benefits to Partner Mining Company’s Shareholders:
At Silver Wheaton, our focus is first and foremost to generate superior returns for our shareholders; however, we recognize that the sustainability of our model is dependent on uncovering value for all parties involved in a streaming agreement. We are able to do this by unlocking the value of silver or gold produced as a by-product. By entering into a streaming agreement, mining companies can receive greater value for their non-core asset than what is reflected in the market. These companies can use the upfront payment to continue growing their core business, either through exploration, production expansions or acquisitions, or, alternatively, the proceeds can be used to strengthen their balance sheet. In short, mining companies are able to sell non-core assets at attractive prices in order to grow their core business.
SILVER WHEATON 2013 ANNUAL REPORT 13
THE PRECIOUS
METALS MARKET
THE PRECIOUS METALS MARKET
Silver and gold prices are the core drivers to Silver Wheaton’s profitability and cash flow generation, and as evidenced in 2013, precious metals prices can be extremely volatile. Silver traded between $18.23 and $32.48 per ounce, averaging $23.79 per ounce in 2013, while gold traded in an equally wide range from $1,181 to $1,696 per ounce, averaging $1,411 per ounce for the year. Average prices were down 32% and 16% for silver and gold, respectively, over 2012, primarily driven by perceived incremental improvements in macroeconomic conditions and expected changes in fiscal and monetary policies, primarily in the United States.
SUPPLY
There is currently an estimated 896 million ounces of silver mine production capacity in existence. CPM Group forecasts that 239 million ounces will be added over the next 10 years, raising capacity to 1.1 billion ounces by the end of 2022. 35% of the additional capacity is expected to come from primary silver mining, an increase from the current 25%.
![]()
For gold, mine supply is forecast to grow slightly over the coming years, but more significantly, supply from official and secondary channels is seen to be contracting. For the fourth consecutive year, global central banks were in fact net buyers of gold as Russia, Turkey, South Korea and others added to their gold reserves while the Central Bank Gold Agreement signatory countries sold only around five tonnes of gold, less than 2% of the maximum allowed.
INVESTMENT & JEWELRY DEMAND
Exchange traded products’ (ETP) physical gold holdings fell dramatically in 2013 with outflows of around 27.7 million ounces (-32%). In contrast, despite the incredibly challenging year for the precious metals space, there were very little outflows of Silver ETP holdings. Since the March 2013 physical silver holdings peak of roughly 644 million ounces, there has only been a reduction of approximately 27 million ounces (-4%) in overall silver ETP holdings.
In 2013, we once again saw buoyant precious metal coin demand. Sales of US Eagle silver coins were over 26% higher than the already high 2013 levels. Total US Mint gold coin sales to dealers were up 24% over 2012 levels.
India and China were once again the two largest consumers of gold jewelry in 2013, accounting for an estimated 1,200 tonnes (57%) of total jewelry demand.
Indian demand for physical silver was strong as consumers moved towards other precious metals amid measures to curb gold imports. Official statistics show that net imports of silver to India rose sharply on a year on year basis. The most recent CPM Group data shows that from January to October 2013, the country’s net imports rose to 152.2 million ounces of silver, more than doubling from the same period the previous year.
GROWING INDUSTRIAL DEMAND FOR SILVER
Silver’s industrial demand is driven primarily by economic activity and is generally price-inelastic given its relatively unique chemical properties. Silver’s unique anti-microbial properties are generating incremental industrial demand growth. Biocide application demand grew from 1 million ounces in 2002 to 7 million ounces in 2012, and it is expected to quadruple in the next 10 years. Silver contained in electronics and batteries cannot be easily substituted as silver is the most conductive metal. Steady growth is expected to be posted in the electronics sector, the second largest silver end user, as virtually every consumer electronic device contains some silver content. The continued explosion of smartphone, tablets, and so forth will further drive silver demand.
14
CORPORATE SOCIAL
RESPONSIBILITY
SILVER WHEATON IS COMMITTED TO POSITIVELY INFLUENCING THE COMMUNITIES WHERE ITS EMPLOYEES LIVE AND WORK. WE ARE SUPPORTING A NUMBER OF EXTREMELY WORTHY CAUSES, INCLUDING ONE VERY SPECIAL ONE: CANCER RESEARCH.
Silver Wheaton is proud to be the Presenting Sponsor of the 2014 BCRide to Conquer Cancer, the largest cycling fundraiser in British Columbia’s history.We are helping to make a positive impact on the lives of British Columbians diagnosed with cancer today and well into the future.
Silver Wheaton is a long-time supporter of the Ride. Randy Smallwood, Silver Wheaton’s President and CEO, and several other employees have experienced firsthand the compelling movement of thousands of riders hitting the pavement and pedaling more than 250 km from Vancouver to Seattle over two days in support of research that is helping to improve the way cancer is prevented, detected and treated.
Over five years, participants in theRide to Conquer Cancerhave raised $50 million for the BC Cancer Foundation, which supports life-saving research at the BC Cancer Agency.Ridedollars are hard at work in the hands of expert scientists and clinicians at the BC Cancer Agency who are leading major world-first breakthroughs to advance new understandings of cancer for the development of improved treatment options.
With a staggering one in three British Columbians diagnosed with cancer in their lifetime, this cause is personal for many of Silver Wheaton employees and their families. Our company is honoured to be supporting the BC Cancer Foundation’s vision for a world free from cancer.
The 2014 BCRide to Conquer Cancer, presented by Silver Wheaton, takes place on June 14 and 15, 2014.
SILVER WHEATON 2013 ANNUAL REPORT 15
FINANCIALS
| MANAGEMENT’S DISCUSSION AND ANALYSIS | 17 |
| FINANCIAL STATEMENTS | 66 |
MANAGEMENT’S
DISCUSSION AND ANALYSIS
Management’s Discussion and Analysis of Results of Operations and Financial Condition for the Year Ended December 31, 2013
This Management’s Discussion and Analysis (“MD&A”) should be read in conjunction with Silver Wheaton Corp.’s (“Silver Wheaton” or the “Company”) consolidated financial statements for the year ended December 31, 2013 and related notes thereto which have been prepared in accordance with International Financial Reporting Standards (“IFRS”) as issued by the International Accounting Standards Board (“IASB”). This MD&A contains “forward looking” statements that are subject to risk factors set out in the cautionary note contained on page 62 of this MD&A as well as throughout this document. All figures are presented in United States dollars unless otherwise noted. This MD&A has been prepared as of March 20, 2014.
Highlights
Operations
| · | Record attributable silver equivalent production for the three months and year ended December 31, 2013 of 9.7 million ounces (7.3 million ounces of silver and 40,700 ounces of gold) and 35.8 million ounces (26.8 million ounces of silver and 151,000 ounces of gold), respectively, representing an increase of 17% and 22% over the comparable periods in 2012. |
| · | Attributable silver equivalent sales volume for the three months and year ended December 31, 2013 of 8.0 million ounces (6.1 million ounces of silver and 31,200 ounces of gold) and 30.0 million ounces (22.8 million ounces of silver and 117,300 ounces of gold), respectively, representing a decrease of 13% during the three month period and an increase of 10% during the twelve month period as compared to the comparable periods in 2012, with ounces sold for the most recently completed year representing a record for the Company. |
| · | Average realized sale price per silver equivalent ounce sold for the three months and year ended December 31, 2013 of $21.00 ($21.03 per ounce of silver and $1,277 per ounce of gold) and $23.58 ($23.86 per ounce of silver and $1,380 per ounce of gold), representing a decrease of 33% and 24%, respectively, as compared to the comparable periods of 2012. |
| · | Revenue for the three months and year ended December 31, 2013 of $167.4 million and $706.5 million, respectively, compared with $287.2 million and $849.6 million for the comparable periods in 2012, representing a decrease of 42% and 17%, respectively. |
| · | Net earnings for the three months and year ended December 31, 2013 of $93.9 million ($0.26 per share) and $375.5 million ($1.06 per share), respectively, compared with $177.7 million ($0.50 per share) and $586.0 million ($1.66 per share) for the comparable periods in 2012, representing a decrease of 47% and 36%, respectively. |
| · | Operating cash flows for the three months and year ended December 31, 2013 of $124.6 million ($0.35 per share¹) and $534.1 million ($1.50 per share¹), respectively, compared with $254.0 million ($0.72 per share¹) and $719.4 million ($2.03 per share¹) for the comparable periods in 2012, representing a decrease of 51% and 26%, respectively. |
| · | On March 20, 2014, the Board of Directors declared a dividend in the amount of $0.07 per common share as per the Company’s stated dividend policy whereby the quarterly dividend will be equal to 20% of the average of the previous four quarters operating cash flow. This dividend is payable to shareholders of record on April 4, 2014 and is expected to be distributed on or about April 15, 2014. |
| · | Average cash costs² for the three months and year ended December 31, 2013 of $4.70 and $4.65 per silver equivalent ounce, respectively, as compared with $4.70 and $4.30 during the comparable periods of 2012. |
· | Cash operating margin³ for the three months and year ended December 31, 2013 of $16.30 and $18.93 per silver equivalent ounce, respectively, representing a decrease of 39% and 29% relative to the comparable periods in 2012. |
| · | As at December 31, 2013, approximately 6.4 million payable silver equivalent ounces attributable to the Company have been produced at the various mines and will be recognized in future sales as they are delivered to the Company under the terms of their contracts. |
___________________________________
1 Refer to discussion on non-IFRS measure (i) on page 42 of this MD&A.
2 Refer to discussion on non-IFRS measure (ii) on page 43 of this MD&A.
3 Refer to discussion on non-IFRS measure (iii) on page 44 of this MD&A.
SILVER WHEATON 2013 ANNUAL REPORT [17]
This represents an increase of 1.1 million payable silver equivalent ounces during the three month period ended December 31, 2013.
Corporate Development
| · | On February 28, 2013, the Company announced that it had entered into a definitive agreement to acquire from Vale S.A. ("Vale") an amount of gold equal to 25% of the life of mine gold production from its Brazilian Salobo mine, as well as 70% of the gold production, for a 20 year term, from certain of its Canadian Sudbury mines. |
| · | On November 4, 2013, the Company announced that it had amended its precious metal purchase agreement with Hudbay Minerals Inc. (“Hudbay”) to include the acquisition of an amount equal to 50% of the gold production from its Constancia project in Peru for the life of mine. |
| · | On November 11, 2013, the Company announced that it had entered into an Early Deposit Gold Stream Agreement to acquire from Sandspring Resources Ltd. ("Sandspring") an amount of gold equal to 10% of the life of mine gold production from its Toroparu project located in the Republic of Guyana, South America. |
Other
| · | On February 28, 2013, the Company entered into two new credit facilities, comprised of (i) a $1 billion revolving credit facility (“Revolving Facility”) having a 5-year term; and (ii) a $1.5 billion bridge financing facility (“Bridge Facility”) having a 1-year term, as more fully described in Note 12 to the financial statements. These facilities replaced the pre-existing $400 million revolving credit facility and the $200 million non-revolving term loan (the “Term Loan”), with the Company repaying the $50.1 million outstanding balance on the Term Loan during the three months ended March 31, 2013. |
| · | On May 28, 2013, the Company entered into a $1 billion non-revolving term loan ("NRT Loan") with a 3-year term, extendable by 1 year with the unanimous consent of lenders. The $1 billion proceeds were used to repay the remaining balance of $560 million under the Company’s $1.5 billion Bridge Facility and $440 million outstanding under the Company’s Revolving Facility. The Bridge Facility was terminated following the repayment of the outstanding balance. |
| · | As per Barrick Gold Corp.’s (“Barrick”) Q3 2013 MD&A, Barrick has decided to temporarily suspend construction activities at its Pascua-Lama project (“Pascua-Lama”), except those required for environmental protection and regulatory compliance, and to place the project on care and maintenance. Barrick also stated that the decision to re-start construction activities will depend on improved project economics such as go-forward costs, the outlook for metal prices, and reduced uncertainty associated with legal and other regulatory requirements. As a result of the suspension, Barrick no longer expects production by mid-2016. |
| · | On October 31, 2013, the Company announced that, as a result of Barrick’s decision to temporarily suspend construction activities at Pascua-Lama, the Company has amended its silver purchase agreement with Barrick. The amendment entails Silver Wheaton being entitled to 100% of the silver production from Barrick’s Lagunas Norte, Pierina and Veladero mines until the end of 2016 - an extension of one year, and extending the completion test deadline an additional year to December 31, 2017. As a reminder, if the requirements of the completion test have not been satisfied by the amended completion date, the agreement may be terminated by Silver Wheaton. In such an event, Silver Wheaton will be entitled to the return of the upfront cash consideration of $625 million less a credit for any silver delivered up to that date. |
| · | On March 20, 2014, the Company announced that it will be implementing a dividend reinvestment plan whereby shareholders can elect to have dividends reinvested directly into additional Silver Wheaton common shares. It is intended that the plan will be effective commencing with the second dividend of 2014 which will be paid after the announcement of the First Quarter 2014 Earnings Results. The plan remains subject to regulatory approval. |
SILVER WHEATON 2013 ANNUAL REPORT [18]
Overview
Silver Wheaton Corp. is a mining company which generates its revenue primarily from the sale of silver and gold. The Company is listed on the New York Stock Exchange and the Toronto Stock Exchange and trades under the symbol SLW.
To date, the Company has entered into 20 long-term purchase agreements and one early deposit long-term purchase agreement associated with silver and/or gold (“Precious Metal Purchase Agreements”), relating to 24 different mining assets, whereby Silver Wheaton acquires silver and gold production from the counterparties for a per ounce cash payment which is fixed by contract, generally at or below the prevailing market price. Attributable silver and gold as referred to in this MD&A and financial statements is the silver and gold production to which Silver Wheaton is entitled pursuant to the various purchase agreements. During the year ended December 31, 2013, the per ounce price paid by the Company for silver and gold under the agreements averaged $4.12 and $386, respectively. The primary drivers of the Company’s financial results are the volume of silver and gold production at the various mines to which the Precious Metal Purchase Agreements relate and the price of silver and gold realized by Silver Wheaton upon the sale of silver and gold received.
Outlook1
Silver Wheaton is the largest precious metals streaming company in the world. Based upon its current agreements, forecast 2014 attributable production is approximately 36 million silver equivalent ounces, including 155,000 ounces of gold. By 2018, annual attributable production is anticipated to increase significantly to approximately 48 million silver equivalent ounces, including 250,000 ounces of gold. Growth from 2014 to 2018 is driven by the Company’s portfolio of low-cost and long-life assets, including the recently acquired gold streams on Vale S.A.’s (“Vale”) Salobo and Sudbury mines in addition to the silver and gold stream on Hudbay’s Constancia project.
The $96 million of cash and cash equivalents as at December 31, 2013 combined with the liquidity provided by the available credit under the undrawn $1 billion Revolving Facility and ongoing operating cashflows, positions the Company well to fund all outstanding commitments as well as providing flexibility to acquire additional accretive precious metal stream interests.
1 Statements made in this section contain forward-looking information. Please see “Cautionary Note Regarding Forward-Looking Statements” for material risks, assumptions and important disclosure associated with this information. |
SILVER WHEATON 2013 ANNUAL REPORT [19]
Silver and Gold Interests1
The following table summarizes the silver and gold interests currently owned by the Company:
Silver and Gold Interests | Mine Owner | Location of Mine | Upfront Consideration ¹ | Attributable Production to be Purchased | Term of Agreement | Date of Contract | |
Silver | Gold | ||||||
| San Dimas | Primero ² | Mexico | $ 189,799 | 100% ² | 0% | Life of Mine | 15-Oct-04 |
| Yauliyacu | Glencore | Peru | $ 285,000 | 100% ³ | 0% | 20 years | 23-Mar-06 |
| Peñasquito | Goldcorp | Mexico | $ 485,000 | 25% | 0% | Life of Mine | 24-Jul-07 |
| 777 | Hudbay | Canada | $ 455,100 | 100% | 100%/50% ⁴ | Life of Mine | 8-Aug-12 |
| Salobo | Vale | Brazil | $ 1,330,000 ⁵ | 0% | 25% | Life of Mine | 28-Feb-13 |
| Sudbury | Vale | Canada | $ 623,572 ⁶ | 0% | 70% | 20 years | 28-Feb-13 |
| Barrick | $ 625,000 | ||||||
| Pascua-Lama | Barrick | Chile/Argentina | 25% | 0% | Life of Mine | 8-Sep-09 | |
| Lagunas Norte | Barrick | Peru | 100% | 0% | 6 years ⁷ | 8-Sep-09 | |
| Pierina | Barrick | Peru | 100% | 0% | 6 years ⁷ | 8-Sep-09 | |
| Veladero | Barrick | Argentina | 100% ⁸ | 0% | 6 years ⁷ | 8-Sep-09 | |
| Other | $ 1,148,833 | ||||||
| Los Filos | Goldcorp | Mexico | $ 4,463 | 100% | 0% | 25 years | 15-Oct-04 |
| Zinkgruvan | Lundin | Sweden | $ 77,866 | 100% | 0% | Life of Mine | 8-Dec-04 |
| Stratoni | Eldorado Gold ⁹ | Greece | $ 57,500 | 100% | 0% | Life of Mine | 23-Apr-07 |
| Minto | Capstone | Canada | $ 54,805 | 100% | 100% ¹⁰ | Life of Mine | 20-Nov-08 |
| Cozamin | Capstone | Mexico | $ 41,959 | 100% | 0% | 10 years | 4-Apr-07 |
| Neves-Corvo | Lundin | Portugal | $ 35,350 | 100% | 0% | 50 years | 5-Jun-07 |
| Aljustrel | I'M SGPS | Portugal | $ 2,451 | 100% | 0% | 50 years | 5-Jun-07 |
| Mineral Park | Mercator ¹¹ | United States | $ 42,000 | 100% | 0% | Life of Mine | 17-Mar-08 |
| Campo Morado | Nyrstar NV | Mexico | $ 79,250 | 75% | 0% | Life of Mine | 13-May-08 |
| Keno Hill | Alexco | Canada | $ 50,000 | 25% | 0% | Life of Mine | 2-Oct-08 |
| Rosemont | Augusta | United States | $ 230,000 ¹² | 100% | 100% | Life of Mine | 10-Feb-10 |
| Loma de La Plata | Pan American | Argentina | $ 43,289 ¹³ | 12.5% | 0% | Life of Mine | n/a ¹⁴ |
| Constancia | Hudbay | Peru | $ 429,900 ¹⁵ | 100% | 50% ¹⁶ | Life of Mine | 8-Aug-12 |
| Early Deposit | |||||||
| Toroparu | Sandspring | Guyana | $ 148,500 ¹⁷ | 0% | 10% ¹⁷ | Life of Mine | 8-Nov-13 |
| 1) | Expressed in United States dollars, rounded to the nearest thousand; excludes closing costs and capitalized interest, where applicable. |
| 2) | Until August 6, 2014, Primero will deliver to Silver Wheaton a per annum amount equal to the first 3.5 million ounces of payable silver produced at San Dimas and 50% of any excess, plus Silver Wheaton will receive an additional 1.5 million ounces of silver per annum to be delivered by Goldcorp. After August 6, 2014, Primero will deliver a per annum amount to Silver Wheaton equal to the first 6 million ounces of payable silver produced at San Dimas and 50% of any excess. |
| 3) | To a maximum of 4.75 million ounces per annum. In the event that silver sold and delivered to Silver Wheaton in any year totals less than 4.75 million ounces, the amount sold and delivered to Silver Wheaton in subsequent years will be increased to make up for any cumulative shortfall, to the extent production permits. |
| 4) | Silver Wheaton is entitled to acquire 100% of the life of mine gold production from Hudbay’s 777 mine until Hudbay’s Constancia project satisfies a completion test, or the end of 2016, whichever is later. At that point, Silver Wheaton’s share of gold production from 777 will be reduced to 50% for the life of the mine. |
| 5) | Does not include the contingent payment related to the Salobo mine expansion. Vale is in the process of expanding the mill throughput capacity at the Salobo mine to 24 million tonnes per annum ("Mtpa") from its current 12 Mtpa. If throughput capacity is expanded above 28 Mtpa within a predetermined period, Silver Wheaton will be required to make an additional payment to Vale based on a set fee schedule ranging from $67 million if throughput capacity is expanded to 28 Mtpa by January 1, 2031 up to $400 million if throughput capacity is expanded to 40 Mtpa prior to January 1, 2021. |
| 6) | Comprised of a $570 million upfront cash payment plus warrants to purchase 10 million shares of Silver Wheaton common stock at a strike price of $65, with a term of 10 years. |
| 7) | Barrick will deliver to Silver Wheaton silver production from the currently producing mines until December 31, 2016. |
| 8) | Silver Wheaton's attributable silver production is subject to a maximum of 8% of the silver contained in the ore processed at Veladero during the period. |
| 9) | 95% owned by Eldorado Gold Corporation. |
| 10) | The Company is entitled to acquire 100% of the first 30,000 ounces of gold produced per annum and 50% thereafter. |
| 11) | On December 12, 2013, Mercator announced that they had entered a plan of arrangement with Intergeo MMC Ltd. to combine and create a new copper focused metals company. Mercator has also indicated that it is anticipated that the plan of arrangement transaction will be completed in Q2 2014. |
| 12) | Currently reflected as a contingent obligation, payable on an installment basis to partially fund construction of the Rosemont mine once certain milestones are achieved, including the receipt of key permits and securing the necessary financing to complete construction of the mine. |
| 13) | Comprised of $10.9 million allocated to the silver interest upon the Company’s acquisition of Silverstone Resources Corp. in addition to a contingent liability of $32.4 million, payable upon the satisfaction of certain conditions, including Pan American receiving all necessary permits to proceed with the mine construction. |
| 14) | Definitive terms of the agreement to be finalized. |
| 15) | Comprised of $169.9 million which has been paid to date, with further payments of $125 million and $135 million to be made once $1 billion and $1.35 billion, respectively, in capital expenditures have been incurred at Constancia. |
| 16) | Gold recoveries will be set at 55% for the Constancia deposit and 70% for the Pampacancha deposit until 265,000 ounces of gold have been delivered to the Company. |
| 17) | Comprised of $13.5 million paid to date in addition to $135 million to be payable on an installment basis to partially fund construction of the mine. During the 90 day period following the delivery of a bankable definitive feasibility study, environmental study and impact assessment, and other related documents (collectively, the “Feasibility Documentation”), or after December 31, 2015 if the Feasibility Documentation has not been delivered to Silver Wheaton by such date, Silver Wheaton may elect not to proceed with the precious metal purchase agreement, at which time Silver Wheaton will be entitled to a return of the early deposit of $11.5 million (on the basis that $2 million of the advanced $13.5 million is non-refundable) or, at Sandspring’s option, the stream percentage will be reduced from 10% to 0.774% (equivalent to the pro-rata stream based on a full purchase price of $11.5 million). |
1 | Statements made in this section contain forward-looking information. Please see “Cautionary Note Regarding Forward-Looking Statements” for material risks, assumptions and important disclosure associated with this information. |
SILVER WHEATON 2013 ANNUAL REPORT [20]
San Dimas
On October 15, 2004, the Company entered into an agreement with Goldcorp Inc. (“Goldcorp”) to acquire an amount equal to 100% of the silver produced by Goldcorp’s Luismin mining operations in Mexico (owned at the date of the transaction) for a period of 25 years. The Luismin mining operations consisted primarily of the San Dimas and the Los Filos mines.
On August 6, 2010, Goldcorp completed the sale of the San Dimas mine to Primero Mining Corp. (“Primero”). In conjunction with the sale, Silver Wheaton amended its silver purchase agreement relating to the mine. The term of the agreement, as it relates to San Dimas, was extended to the life of mine. During the first four years following the closing of the transaction, Primero will deliver to Silver Wheaton a per annum amount equal to the first 3.5 million ounces of payable silver produced at San Dimas and 50% of any excess, plus Silver Wheaton will receive an additional 1.5 million ounces of silver per annum to be delivered by Goldcorp. Beginning in the fifth year after closing, Primero will deliver a per annum amount to Silver Wheaton equal to the first 6 million ounces of payable silver produced at San Dimas and 50% of any excess. Goldcorp will continue to guarantee the delivery by Primero of all silver produced and owing to the Company until 2029. Primero has provided Silver Wheaton with a right of first refusal on any metal stream or similar transaction it enters into.
As per Primero’s March 5, 2014, news release, reserves at the San Dimas mine increased substantially year over year given their substantial exploration success in 2013. Silver reserves increased to 49.5 million ounces from 39.4 million ounces despite the lowering of metal price assumptions used in calculating reserves (December 31, 2013 reserves were calculated using $1,250 per ounce gold and $20 per ounce silver compared to $1,400 per ounce gold and $25 per ounce silver used for reserve calculations at the end of 2012). Primero’s 2013 exploration program significantly expanded one of the new high-grade veins, named the Victoria vein, which was discovered in 2012. Due to its close proximity to infrastructure, Primero expects to access the highest grade portion of the Victoria vein within the next 18 months. According to Primero, expansion of the San Dimas mine from 2,150 tonnes per day (“tpd”) to 2,500 tpd is on track for commissioning during the first quarter of 2014, and they continue to review the option to further expand the San Dimas mine to 3,000 tpd.
As at December 31, 2013, the Company has received approximately 57.5 million ounces of silver related to San Dimas under the agreement, generating cumulative operating cash flows of approximately $808 million. As at December 31, 2013, the San Dimas mine had proven and probable silver reserves of 49.5 million ounces and inferred silver resources of 73.0 million ounces (as described in the Attributable Reserves and Resources section of this MD&A).
Yauliyacu
On March 23, 2006, the Company entered into an agreement with Glencore International AG (“Glencore”) to acquire an amount equal to 100% of the silver produced from Glencore’s Yauliyacu mining operations in Peru, up to a maximum of 4.75 million ounces per year, for a period of 20 years. In the event that silver sold and delivered to Silver Wheaton in any year totals less than 4.75 million ounces, the amount sold and delivered to Silver Wheaton in subsequent years will be increased to make up for any cumulative shortfall, to the extent production permits. The cumulative shortfall as at March 23, 2013, representing the seven year anniversary, was 15.2 million ounces. During the term of the agreement, Silver Wheaton has a right of first refusal on any future sales of silver streams from the Yauliyacu mine and a right of first offer on future sales of silver streams from any other mine owned by Glencore at the time of the initial transaction.
Since mid-2009, concentrate shipments from the Yauliyacu mine have been affected by the shut-down of the Doe Run Peru La Oroya smelter, historically the largest buyer of the silver bearing concentrate produced at the mine. Since that time, alternative arrangements have been made by Glencore, though sales of the bulk concentrate continue to have an inconsistent delivery schedule. As at December 31, 2013, approximately 1.5 million ounces of cumulative payable silver ounces have been produced at Yauliyacu but not yet delivered to the Company, representing a decrease of 0.1 million payable silver ounces during the three month period ended December 31, 2013.
As at December 31, 2013, the Company has received approximately 19.3 million ounces of silver related to the Yauliyacu mine under the agreement, generating cumulative operating cash flows of approximately $294 million. As at December 31, 2013, the Company's share of the Yauliyacu proven and probable silver reserves was 15.3 million ounces, measured and indicated silver resources was 42.2 million ounces and inferred silver resources was 33.5 million ounces (as described in the Attributable Reserves and Resources section of this MD&A).
SILVER WHEATON 2013 ANNUAL REPORT [21]
Peñasquito
On July 24, 2007, the Company entered into an agreement with Goldcorp to acquire an amount equal to 25% of the silver produced from Goldcorp’s Peñasquito mining operations in Mexico for the life of mine.
As stated in Goldcorp’s year end 2013 MD&A, Peñasquito continued to incrementally increase its fresh water production in 2013 from 69,500 to 77,000 cubic meters per day with the addition of eight new wells in the Torres-Vergel area and four new wells in the mine operations area. These new wells not only supplied water to replace the declining production in the existing well field, but also allowed water production to increase above 2012 year end levels. This increase in water production combined with rigorous control of tailings management and improved efficiencies in the primary crusher and augmented feed circuit, allowed an increase in plant throughput from 99,945 tonnes per day in 2012 to 106,200 tonnes per day in 2013. The Northern Well Field project, which will add 25 new production wells, is expected to be operational in the fourth quarter of 2014.
As detailed in Goldcorp’s February 12, 2014, news release, Goldcorp has completed a new life-of-mine plan at Peñasquito that positively affected the 2014 and five-year production profile. As a result of this work, proven and probable silver mineral reserves attributable to Silver Wheaton decreased to 151.3 million ounces from 227.9 million ounces. The decrease was a result of higher strip ratio pushbacks and the classification of mineral reserves that require higher commodity prices to be economically processed as mineral resources. In 2014, exploration at Peñasquito will continue to focus on defining the high-grade core of the copper-gold, sulphide-rich skarn mineralization located below and adjacent to current mineral reserves. In addition to exploration, Goldcorp is investigating the potential for producing a saleable copper concentrate at Peñasquito. An additional study is also underway to assess the viability of leaching a pyrite concentrate from the zinc flotation tailings. Successful implementation of one or both of these new process improvements has the potential to significantly improve the overall economics and add to the mineral reserves of Peñasquito through addition of another saleable product, and increasing gold and silver recoveries.
As at December 31, 2013, approximately 1.6 million ounces of cumulative payable silver ounces have been produced at Peñasquito but not yet delivered to the Company, representing an increase of 0.5 million payable silver ounces during the three month period ended December 31, 2013.
As at December 31, 2013, the Company has received approximately 19.3 million ounces of silver related to the Peñasquito mine under the agreement, generating cumulative operating cash flows of approximately $456 million. As at December 31, 2013, the Company’s 25% share of the Peñasquito proven and probable silver reserves was 151.3 million ounces, measured and indicated silver resources was 68.1 million ounces and inferred silver resources was 10.3 million ounces (as described in the Attributable Reserves and Resources section of this MD&A).
Ejido Land Claims
As per Goldcorp’s year end 2013 MD&A, in 2005, prior to construction of the Peñasquito mine, an agreement was negotiated with the Cerro Gordo Ejido for the use of 600 hectares (approximately 1,483 acres) of surface land which includes 60% of the mine pit area, the waste rock facility and explosive magazine storage area and is located within the confines of the proposed Peñasquito mine site. The terms of the agreement were based on comparable surface valuations in the region as well as on similar agreements at the Peñasquito mine and other Mexican mining operations. In 2009, the Cerro Gordo Ejido commenced an action against Minera Peñasquito in Mexico’s agrarian courts challenging the land use agreement. Following a series of legal proceedings, the agrarian courts ruled on June 18, 2013, that the land use agreement was null and ordered the land to be returned to the Cerro Gordo Ejido for payment of 2.4 million pesos. Three separate claims are currently proceeding in the First District Court of Zacatecas by the Cedros and Mazapil Ejidos and a local transportation union which have resulted in the suspension of the agrarian court’s ruling, pending resolution of the three claims. The Cerro Gordo Ejido has appealed the suspension.
Goldcorp also stated that negotiations are taking place under the official observation of the office of the Mexican Secretary of the Economy and Goldcorp believes that proper representatives of both parties are currently engaged in a constructive process with a view to reaching a mutually beneficial settlement of the land claim. Goldcorp has filed with the office of the Secretaria De Desarrollo Agrario Territorial y Urbano (“SEDATU”) the required filings to expropriate the disputed lands. In addition, Goldcorp has stated that they will continue to employ all legal means at its disposal to ensure continuity of operations and to protect Goldcorp’s mineral concession rights consistent with Mexican law. Goldcorp notes that operations at the Peñasquito mine have not been impacted, however, in the event the suspensions of the agrarian court ruling are revoked or the claims by the Ejido Cedros, Ejido Mazapil and transportation union are ultimately rejected, Ejido Cerro Gordo would, absent any other intervening event be entitled to possession of the Cerro Gordo lands. Should this occur, Goldcorp states that mine operations would be adversely impacted, with the ultimate resolution of this matter being indeterminable at this time.
SILVER WHEATON 2013 ANNUAL REPORT [22]
Barrick
On September 8, 2009, the Company entered into an agreement with Barrick to acquire an amount equal to 25% of the life of mine silver production from its Pascua-Lama project which is located in Chile and Argentina, as well as 100% of the silver production from its Lagunas Norte mine and Pierina mine, which are both located in Peru, and its Veladero1 mine which is located in Argentina (collectively referred to as the “Barrick mines”) until the end of 2013.
As per Barrick’s year end 2013 MD&A, during the fourth quarter of 2013, Barrick decided to temporarily suspend construction activities at Pascua-Lama, except those required for environmental protection and regulatory compliance, and to place the project on care and maintenance. As disclosed by Barrick, Barrick’s decision to re-start will depend on improved economics and reduced uncertainty associated with legal and other regulatory requirements, and that remaining development will take place in distinct stages with specific work programs and budgets.
As part of the original agreement, Barrick provided Silver Wheaton with a completion guarantee, requiring Barrick to complete Pascua-Lama to at least 75% of design capacity by December 31, 2015, which was subsequently extended to December 31, 2016. During 2014 and 2015, Silver Wheaton was to be entitled to the silver production from the currently producing mines to the extent of any production shortfall at Pascua-Lama, until Barrick satisfies the completion guarantee. As a result of Barrick’s decision to temporarily suspend construction activities at Pascua-Lama, the Company has amended its silver purchase agreement with Barrick. The amendment entails Silver Wheaton being entitled to 100% of the silver production from Barrick’s Lagunas Norte, Pierina and Veladero mines until the end of 2016 - an extension of one year. In addition, Silver Wheaton has agreed to extend the completion test deadline an additional year to the end of December 31, 2017. If the requirements of the completion guarantee have not been satisfied by the revised outside completion date, the agreement may be terminated by Silver Wheaton. In such an event, Silver Wheaton will be entitled to the return of the upfront cash consideration of $625 million less a credit for silver delivered up to that date.
Once in production, Pascua-Lama is forecast to be one of the largest and lowest cost gold mines in the world with an expected mine life in excess of 25 years. In its first full five years of operation, Silver Wheaton’s silver production attributable to Pascua-Lama is expected to average 9 million ounces annually.
As at December 31, 2013, the Company has received approximately 11.0 million ounces of silver related to the Barrick mines under the agreement, generating cumulative operating cash flows of approximately $261 million. As at December 31, 2013, the Company’s 25% share of the Pascua-Lama proven and probable silver reserves was 168.7 million ounces, measured and indicated silver resources was 28.7 million ounces and inferred silver resources was 3.2 million ounces (as described in the Attributable Reserves and Resources section of this MD&A). In addition, the Company’s estimated share of the proven and probable silver reserves contained in the Lagunas Norte and Veladero mines is 53.2 million ounces.
Update on Matters Relating to Project Development
| i. | Pascua-Lama Challenge to SMA Regulatory Sanction |
As per Barrick’s year end 2013 MD&A, in June 2013, a group of local farmers and indigenous communities challenged the resolution issued by Chile’s Superintendence of the Environment (Superintendencia del Medio Ambiente or “SMA”) in May 2013 (the “Resolution”). The challenge, which was brought in the Environmental Court of Santiago, Chile (the “Environmental Court”), claims that the fine was inadequate and requests more severe sanctions against CMN, Barrick’s Chilean subsidiary that holds the Chilean portion of the Pascua-Lama project, including the revocation of the Pascua-Lama project’s environmental permit. The SMA presented its defense of the Resolution in July 2013. Barrick stated that in August, 2013, CMN joined as a party to this proceeding and has vigorously defended the Resolution. The hearing was held before the Environmental Court on September 4, 2013, and a court ordered inspection of the Pascua-Lama project site took place on December 5, 2013. On January 15, 2014, CMN presented additional environmental information to the Environmental Court. The decision of the Court is pending.
| ii. | Pascua-Lama Environmental Damage Claim |
As per Barrick’s year end 2013 MD&A, in June 2013, a group of local farmers filed an environmental damage claim against CMN in the Environmental Court, alleging that CMN has damaged glaciers located in the Pascua-Lama project area. The plaintiffs are seeking a court order requiring CMN to remedy the alleged damage and implement measures to prevent such environmental impact from continuing, including by halting construction of the Pascua-Lama project in Chile. CMN presented its defense on October 9, 2013. A settlement and evidentiary hearing took place on January 8, 2014.
1 | Silver Wheaton's attributable silver production is subject to a maximum of 8% of the silver contained in the ore processed at Veladero during the period. |
SILVER WHEATON 2013 ANNUAL REPORT [23]
Barrick stated that, as the parties failed to reach a settlement during that hearing, the parties proceeded to present documentary evidence and witness testimony to the Environmental Court, and that the hearing will resume in late February 2014.
| iii. | Constitutional Protection Actions |
As per Barrick’s year end 2013 MD&A, on September 25, 2013, the Chilean Supreme Court rejected the plaintiffs’ appeal and confirmed the July 15, 2013 decision of the Court of Appeals of Copiapo, which ruled that CMN must complete the Pascua-Lama project’s water management system in compliance with the environmental permit to the satisfaction of Chile’s environmental regulator, the SMA, before resuming construction activities in Chile.
Barrick also stated that in September 2013, a new constitutional protection action was filed against CMN alleging that the company is conducting activities at the Pascua-Lama project that are not authorized by the July 15, 2013 decision of the Court of Appeals of Copiapo or the May 2013 resolution of the SMA (for more information on the SMA resolution see “Pascua-Lama SMA Regulatory Sanction” on page 6 of the Company’s second quarter 2013 MD&A). Barrick stated that the Court of Appeals of Antofagasta admitted the case for review but declined to issue the preliminary injunction requested by the plaintiff. The challenged activities include the Pascua-Lama project’s environmental monitoring as well as the operation and maintenance of facilities in connection with the completion of the Pascua-Lama project’s water management system. The plaintiff, a lawyer acting on her own behalf, alleges that these activities infringe her constitutional right to life and to live in an environment free of contamination. The relief sought in the action is the complete suspension of these activities and the adoption by the SMA of administrative measures to, among other things, inspect the works and commence sanction proceedings against CMN as appropriate. Barrick states that on October 22, 2013, the SMA informed the Court that CMN is authorized to perform all of the activities challenged by the plaintiff. Barrick has stated that they intend to vigorously defend this matter.
| iv. | Argentine Glacier Legislation and Constitutional Litigation |
In November 2010, a federal glacier protection law came into force that bans new mining exploration and exploitation activities on glaciers and in the “peri-glacial” environment, and subjects ongoing mining activities to an environmental audit. If such an audit identifies significant impacts on glaciers and the peri-glacial environment, the relevant authority is empowered to take action, which, according to the legislation, could include the suspension or relocation of the activity. In the case of the Veladero mine and the Pascua-Lama project, the competent authority is the Province of San Juan. In late January 2013, the Province of San Juan announced that it had completed the required environmental audit, which concluded that Veladero and Pascua-Lama do not impact glaciers or peri-glaciers. The constitutionality of the federal glacier law is the subject of a challenge before the National Supreme Court of Argentina, which has not yet ruled on the issue.
777
On August 8, 2012, the Company entered into an agreement with Hudbay Minerals Inc. ("Hudbay") to acquire an amount equal to 100% of the life of mine silver and gold production from its currently producing 777 mine, located in Canada. Silver Wheaton’s share of gold production at 777 will remain at 100% until the later of the end of 2016 or the satisfaction of a completion test relating to Hudbay’s Constancia project, after which it will be reduced to 50% for the remainder of the mine life. Hudbay has granted Silver Wheaton a right of first refusal on any future streaming agreement, royalty agreement, or similar transaction related to the production of silver or gold from 777. The silver production, sales and related costs associated with this agreement are reflected in this MD&A and financial statements as part of Other mines.
As at December 31, 2013, the Company has received approximately 0.9 million ounces of silver and 94,000 ounces of gold related to the 777 mine under the agreement, generating cumulative operating cash flows of approximately $87 million. As at December 31, 2012, the Company's share of 777's proven and probable reserves was 10.3 million ounces of silver and 520,000 ounces of gold and inferred resources was 0.8 million ounces of silver and 20,000 ounces of gold (as described in the Attributable Reserves and Resources section of this MD&A).
Salobo
On February 28, 2013, the Company entered into an agreement to acquire from Vale an amount of gold equal to 25% of the life of mine gold production from its currently producing Salobo mine, located in Brazil. Silver Wheaton made a total upfront cash payment of $1.33 billion on March 12, 2013 and, in addition, will make ongoing payments of the lesser of $400 per ounce of gold (subject to an inflationary adjustment of 1% beginning in the fourth year) or the prevailing market price per ounce of gold delivered.
SILVER WHEATON 2013 ANNUAL REPORT [24]
Vale is in the process of expanding the mill throughput capacity at the Salobo mine to 24 million tonnes per annum (“Mtpa”) from its current 12 Mtpa. If the expansion to 24 Mtpa is not completed by December 31, 2016, Silver Wheaton would be entitled to a gross up (a temporary increased percentage of gold production) based on the pro-rata achievement of the target production. If throughput capacity is expanded above 28 Mtpa within a predetermined period, Silver Wheaton will be required to make an additional payment to Vale based on a set fee schedule ranging from $67 million if throughput capacity is expanded to 28 Mtpa by January 1, 2031 up to $400 million if throughput capacity is expanded to 40 Mtpa prior to January 1, 2021.
As of December 31, 2013, the Company has received approximately 16,900 ounces of gold related to the Salobo mine under the agreement, generating cumulative operating cash flows of approximately $16 million. As at December 31, 2013, the Company's 25% share of the Salobo proven and probable gold reserves was 3.4 million ounces, measured and indicated gold resources was 770,000 ounces and inferred gold resources was 370,000 ounces (as described in the Attributable Reserves and Resources section of this MD&A).
Sudbury
On February 28, 2013, the Company entered into an agreement to acquire from Vale an amount of gold equal to 70% of the gold production from certain of its currently producing Sudbury mines located in Canada, including the Coleman mine, Copper Cliff mine, Garson mine, Stobie mine, Creighton mine, Totten mine and the Victor project (the “Sudbury mines”) for a period of 20 years. Silver Wheaton made a total upfront cash payment on March 12, 2013 of $570 million plus warrants to purchase 10 million shares of Silver Wheaton common stock at a strike price of $65 per warrant, with a term of 10 years. In addition, Silver Wheaton will make ongoing payments of the lesser of $400 per ounce of gold or the prevailing market price per ounce of gold delivered.
As at December 31, 2013, approximately 0.7 million cumulative payable silver equivalent ounces (approximately 12,300 cumulative payable ounces of gold) have been produced at Sudbury but not yet delivered to the Company, representing an increase of 0.1 million payable silver equivalent ounces during the three month period ended December 31, 2013.
As of December 31, 2013, the Company has received approximately 17,400 ounces of gold related to the Sudbury mines under the agreement, generating cumulative operating cash flows of approximately $16 million. As at December 31, 2012, the Company's 70% share of the Sudbury mines proven and probable gold reserves was 720,000 ounces, measured and indicated gold resources was 400,000 ounces and inferred gold resources was 190,000 ounces (as described in the Attributable Reserves and Resources section of this MD&A).
Other
Other silver and gold interests consist of the following:
| i. | As part of the agreement with Goldcorp to acquire silver from the Luismin mining operations, on October 15, 2004, the Company entered into an agreement with Goldcorp to acquire 100% of the silver production from its Los Filos mine in Mexico for a period of 25 years, commencing October 15, 2004. In addition, pursuant to Goldcorp’s sale of the San Dimas mine, Goldcorp is obligated to deliver to Silver Wheaton 1.5 million ounces of silver per year until August 6, 2014, which is reflected in this MD&A and financial statements as part of the silver production and sales relating to San Dimas; |
| ii. | On December 8, 2004, the Company entered into an agreement with Lundin Mining Corporation (“Lundin”) to acquire 100% of the silver produced by Lundin’s Zinkgruvan mining operations in Sweden for the life of mine; |
| iii. | On April 23, 2007, the Company entered into an agreement with European Goldfields Limited, which was acquired by Eldorado Gold Corporation (“Eldorado Gold”) on February 24, 2012, to acquire 100% of the life of mine silver production from its 95% owned Stratoni mine in Greece; |
| iv. | On March 17, 2008, the Company entered into an agreement with Mercator Minerals Ltd. (“Mercator”) to acquire an amount equal to 100% of the life of mine silver production from its Mineral Park mine in the United States; |
| v. | On May 13, 2008, the Company entered into an agreement with Farallon Mining Ltd., which was acquired by Nyrstar NV (“Nyrstar”) on January 5, 2011, to acquire an amount equal to 75% of the life of mine silver production from its Campo Morado mine in Mexico; |
SILVER WHEATON 2013 ANNUAL REPORT [25]
| vi. | On October 2, 2008, the Company entered into an agreement with Alexco Resource Corp. (“Alexco”) to acquire an amount equal to 25% of the life of mine silver production from its Keno Hill silver district in Canada, including the Bellekeno mine; |
| vii. | On May 21, 2009, the Company completed the acquisition of Silverstone Resources Corp. (the “Silverstone Acquisition”). As part of the Silverstone Acquisition, the Company acquired a precious metal purchase agreement with Capstone Mining Corp. (“Capstone”) to acquire 100% of the silver and gold produced (subject to certain thresholds) from Capstone’s Minto mine in Canada for the life of mine. The Company is entitled to acquire 100% of all the silver produced and 100% of the first 30,000 ounces of gold produced per annum and 50% thereafter. |
| viii. | As part of the Silverstone Acquisition, the Company acquired a silver purchase agreement with Capstone to acquire 100% of the silver produced from Capstone’s Cozamin mine in Mexico for a period of 10 years, commencing on April 4, 2007; |
| ix. | As part of the Silverstone Acquisition, the Company acquired an agreement with Lundin to acquire 100% of the silver production from its Neves-Corvo mine in Portugal for a period of 50 years, commencing June 5, 2007; |
| x. | As part of the Silverstone Acquisition, the Company acquired an agreement with I’M SGPS to acquire 100% of the silver production from its Aljustrel mine in Portugal for a period of 50 years, commencing June 5, 2007; |
| xi. | As part of the Silverstone Acquisition, the Company acquired an agreement with Aquiline Resources Inc., which was acquired by Pan American Silver Corp. (“Pan American”) on December 22, 2009, to acquire an amount equal to 12.5% of the life of mine silver production from the Loma de La Plata zone of the Navidad project in Argentina, the definitive terms of which are to be finalized. The Company is committed to pay Pan American total upfront cash payments of $32.4 million following the satisfaction of certain conditions, including Pan American receiving all necessary permits to proceed with the mine construction; |
| xii. | On February 10, 2010, the Company entered into an agreement with Augusta Resource Corporation (“Augusta”) to acquire an amount equal to 100% of the life of mine silver and gold production from the Rosemont Copper project (“Rosemont”) in the United States. The Company is committed to pay Augusta total upfront cash payments of $230 million, payable on an installment basis to partially fund construction of the Rosemont mine once certain milestones are achieved, including the receipt of key permits and securing the necessary financing to complete construction of the mine; and |
| xiii. | On August 8, 2012, the Company entered into an agreement with Hudbay to acquire an amount equal to 100% of the life of mine silver production from the Constancia project (“Constancia”) in Peru. On November 4, 2013, the Company amended its agreement with Hudbay to include the acquisition of an amount equal to 50%1 of the life of mine gold production from Constancia. Under the amended agreement, Silver Wheaton will pay Hudbay total cash consideration of $429.9 million, of which $169.9 million has been paid as at December 31, 2013, with additional payments of $125 million and $135 million to be made once capital expenditures of $1 billion and $1.35 billion, respectively, have been incurred at Constancia. Silver Wheaton has the option to make the $135 million payment in either cash or Silver Wheaton shares, with the number of shares to be determined at the time the payment is made2. In addition, Silver Wheaton will make ongoing payments of the lesser of $5.90 per ounce of silver and $400 per ounce of gold (both subject to an inflationary adjustment of 1% beginning in the fourth year) or the prevailing market price per ounce of silver and gold delivered. If the Constancia processing plant fails to achieve at least 90% of expected throughput and silver recovery by December 31, 2016, Silver Wheaton would be entitled to continued delivery of 100% of the gold production from Hudbay’s 777 mine. If the completion test has not been satisfied by December 31, 2020, Silver Wheaton would be entitled to a proportionate return of the upfront cash consideration relating to Constancia. In addition, Silver Wheaton would be entitled to additional compensation in respect of the gold stream should there be a delay in achieving completion or mining the Pampacancha deposit beyond the end of 2018. Hudbay has granted Silver Wheaton a right of first refusal on any future streaming agreement, royalty agreement, or similar transaction related to the production of silver or gold from Constancia. |
1 | Gold recoveries will be set at 55% for the Constancia deposit and 70% for the Pampacancha deposit until 265,000 ounces of gold have been delivered to the Company. |
2 | If Silver Wheaton shares are used, the number of common shares will be calculated based on the volume weighted average trading price of the Company on the Toronto Stock Exchange for the ten consecutive trading days immediately prior to the date the consideration is payable. |
SILVER WHEATON 2013 ANNUAL REPORT [26]
As disclosed in Alexco’s September 23, 2013 press release, as a result of a decline in silver prices, operations at the Bellekeno mine were suspended in early September under the previously-announced winter suspension plan. Alexco has previously stated that they plan to use the winter period to significantly restructure the underlying fixed costs at Keno Hill and plan to re-open the mine and mill after the winter, providing that the silver market has improved from current levels and that the underlying fixed costs related to Keno Hill have been reduced.
As per Mercator’s press release dated September 30, 2013, in light of the commodity price environment, capital market conditions and the challenges these pose for Mercator, Mercator’s board of directors has advanced and accelerated its ongoing process to review strategic alternatives. In conjunction with this, pursuant to an amendment to the Mineral Park silver purchase agreement, Mercator exercised its option to defer delivery of 50% of the required silver deliveries for one year starting July 1, 2013. All deferred silver will be delivered in equal installments over 18 months after the one year deferral period. Mercator will compensate Silver Wheaton for any shortfall arising from a decrease in the silver spot price between the time of the original delivery date and the date of actual delivery, including a 12% annualized interest rate. The amendment also grants Silver Wheaton a right of first refusal on any future precious metals streams relating to the El Creston project. To December 31, 2013, Mercator has deferred delivery of approximately 104,000 ounces.
On December 12, 2013, Mercator announced that they had entered a plan of arrangement with Intergeo MMC Ltd. (“Intergeo”) to combine and create a new copper focused metals company. In addition, on December 23, 2013, Mercator announced that it had secured $10 million bridge loan financing from the controlling shareholder of Intergeo. Mercator has indicated that it is anticipated that the plan of arrangement transaction will complete in Q2 2014.
As at December 31, 2013, the Company has received approximately 41.6 million ounces of silver and 97,000 ounces of gold under these agreements, generating cumulative operating cash flows of approximately $906 million.
As at December 31, 20131, unless otherwise noted, these silver and gold interests had proven and probable reserves of 358.7 million ounces of silver and 740,000 ounces of gold, measured and indicated resources of 415.4 million ounces of silver and 680,000 ounces of gold and inferred resources of 209.5 million ounces of silver and 300,000 ounces of gold (as described in the Attributable Reserves and Resources section of this MD&A).
Early Deposit Gold Interest
On November 11, 2013, the Company entered into a life of mine early deposit precious metal purchase agreement (the “Early Deposit Agreement”) to acquire from Sandspring an amount of gold equal to 10% of the gold production from its Toroparu project located in the Republic of Guyana, South America. Silver Wheaton will pay Sandspring total cash consideration of $148.5 million, of which $13.5 million has been paid to date, with the additional $135 million to be payable on an installment basis to partially fund construction of the mine. In addition, Silver Wheaton will make ongoing payments of the lesser of $400 per ounce of gold (subject to an inflationary adjustment of 1% beginning in the fourth year) or the prevailing market price per ounce of gold delivered. Under the Early Deposit Agreement, there will be a 90 day period following the delivery of a bankable definitive feasibility study, environmental study and impact assessment, and other related documents (collectively, the “Feasibility Documentation”), or after December 31, 2015 if the Feasibility Documentation has not been delivered to Silver Wheaton by such date, where Silver Wheaton may elect not to proceed with the precious metal purchase agreement, at which time Silver Wheaton will be entitled to a return of the early deposit of $11.5 million (on the basis that $2 million of the advanced $13.5 million is non-refundable) or, at Sandspring’s option, the stream percentage will be reduced from 10% to 0.774% (equivalent to the pro-rata stream based on a full purchase price of $11.5 million).
As at March 31, 2013, the Company's 10% share of the Toroparu proven and probable gold reserves was 410,000 ounces, measured and indicated gold resources was 240,000 ounces and inferred gold resources was 310,000 ounces (as described in the Attributable Reserves and Resources section of this MD&A).
1 | Mineral reserves and mineral resources are reported as of December 31, 2013, other than as disclosed in footnote 6 to the Attributable Reserves and Resources tables on page 60 of this MD&A. |
SILVER WHEATON 2013 ANNUAL REPORT [27]
Long-Term Investments
The Company will, from time to time, invest in securities of publicly listed mining companies for strategic purposes. The Company held the following investments as at December 31, 2013:
| December 31 | December 31 | |||
| (in thousands) | 2013 | 2012 | ||
Common shares held | $ | 40,801 | $ | 118,683 |
| Warrants held | - | 2,694 | ||
| $ | 40,801 | $ | 121,377 | |
Common Shares Held
| Dec 31, 2013 | Three Months Ended Dec 31, 2013 | Year Ended Dec 31, 2013 | |
(in thousands) | Fair Value | Fair Value Adjustment Losses Included in OCI | |
Bear Creek | $ 18,208 | $ (11,713) | $ (25,922) |
| Revett | 3,827 | (2,186) | (10,997) |
| Sabina | 8,030 | (1,980) | (23,133) |
| Other | 10,736 | (1,962) | (17,829) |
| $ 40,801 | $ (17,841) | $ (77,881) | |
| Dec 31, 2012 | Three Months Ended Dec 31, 2012 | Year Ended Dec 31, 2012 | |
(in thousands) | Fair Value | Fair Value Adjustment Losses Included in OCI | |
Bear Creek | $ 44,130 | $ (5,896) | $ (2,041) |
| Revett | 14,824 | (4,092) | (9,747) |
| Sabina | 31,164 | (7,848) | (13,013) |
| Other | 28,565 | (10,239) | (6,333) |
| $ 118,683 | $ (28,075) | $ (31,134) | |
SILVER WHEATON 2013 ANNUAL REPORT [28]
Warrants Held
| Dec 31, 2013 | Three Months Ended Dec 31, 2013 | Year Ended Dec 31, 2013 | |
(in thousands) | Fair Value | Fair Value Adjustment Losses Included in Net Earnings | |
Warrants held | $ - | $ - | $ (2,694) |
| Dec 31, 2012 | Three Months Ended Dec 31, 2012 | Year Ended Dec 31, 2012 | |
(in thousands) | Fair Value | Fair Value Adjustment (Losses) Gains Included in Net Earnings | |
Warrants held | $ 2,694 | $ (1,441) | $ 496 |
The Company’s long-term investments in common shares (“LTI’s”) are held for long-term strategic purposes and not for trading purposes. As such, the Company has elected to reflect any fair value adjustments as a component of other comprehensive income (“OCI”).
While long-term investments in warrants are also held for long-term strategic purposes, they meet the definition of a derivative and therefore are classified as financial assets with fair value adjustments being recorded as a component of net earnings under the classification Other Expense (Income). Warrants that do not have a quoted market price have been valued using a Black-Scholes option pricing model.
By holding these long-term investments, the Company is inherently exposed to various risk factors including currency risk, market price risk and liquidity risk.
During the year ended December 31, 2013, the value of the Company’s LTI’s decreased by $77.9 million. As a result of this decrease, the deferred income tax liability attributable to the LTI’s was reduced and during year ended December 31, 2013, the Company recorded a deferred income tax recovery in OCI of $1.8 million. The reduction in the deferred income tax liability attributable to the LTI’s resulted in the reversal of previously recognized deferred income tax assets which increased the deferred income tax expense reflected in net earnings.
Bear Creek
At December 31, 2013, Silver Wheaton owned approximately 13.3 million (December 31, 2012 – 13.3 million) common shares of Bear Creek Mining Corporation (“Bear Creek”), representing approximately 14% (December 31, 2012 – 14%) of the outstanding shares of Bear Creek. At December 31, 2013, the fair value of the Company’s investment in Bear Creek was $18.2 million (December 31, 2012 - $44.1 million).
Revett
At December 31, 2013, Silver Wheaton owned 5.3 million (December 31, 2012 – 5.3 million) common shares of Revett Minerals Inc. (“Revett”), representing approximately 15% (December 31, 2012 – 15%) of the outstanding shares of Revett. During the year ended December 31, 2012, the Company acquired 0.3 million common shares of Revett from the exercise of 0.3 million Revett warrants for total consideration of $0.4 million. At December 31, 2013, the fair value of the Company’s investment in Revett was $3.8 million (December 31, 2012 - $14.8 million).
Sabina
At December 31, 2013, Silver Wheaton owned 11.7 million (December 31, 2012 – 11.7 million) common shares of Sabina Gold & Silver Corp. (“Sabina”), representing approximately 6% (December 31, 2012 – 7%) of the outstanding shares of Sabina.
SILVER WHEATON 2013 ANNUAL REPORT [29]
At December 31, 2013, the fair value of the Company’s investment in Sabina was $8.0 million (December 31, 2012 - $31.2 million).
Other
At December 31, 2013, Silver Wheaton owned common shares and common share purchase warrants of several other publicly traded mineral exploration, development and mining companies. As Silver Wheaton’s investment represents less than 10% of the outstanding shares of each of the respective companies and is not considered material to Silver Wheaton’s overall financial position, these investments have been reflected in this MD&A and financial statements as part of Other long-term investments.
At December 31, 2013, the fair value of the Other long-term investments was $10.7 million (December 31, 2012 - $31.3 million).
SILVER WHEATON 2013 ANNUAL REPORT [30]
Summarized Financial Results
| 2013 | 2012 | 2011 | ||||
Silver equivalent production 1 | ||||||
| Attributable silver ounces produced (000’s) | 26,754 | 26,669 | 24,557 | |||
| Attributable gold ounces produced | 151,041 | 50,482 | 18,436 | |||
Attributable silver equivalent ounces produced (000’s) 1 | 35,823 | 29,372 | 25,374 | |||
Silver equivalent sales 1 | ||||||
| Silver ounces sold (000’s) | 22,823 | 24,850 | 20,247 | |||
| Gold ounces sold | 117,319 | 46,094 | 18,256 | |||
Silver equivalent ounces sold (000’s) 1 | 29,963 | 27,328 | 21,069 | |||
Average realized price ($'s per ounce) | ||||||
| Average realized silver price | $ | 23.86 | $ | 31.03 | $ | 34.60 |
| Average realized gold price | $ | 1,380 | $ | 1,701 | $ | 1,609 |
Average realized silver equivalent price 1 | $ | 23.58 | $ | 31.09 | $ | 34.65 |
Average cash cost ($'s per ounce) 2 | ||||||
| Average silver cash cost | $ | 4.12 | $ | 4.06 | $ | 3.99 |
| Average gold cash cost | $ | 386 | $ | 362 | $ | 300 |
Average silver equivalent cash cost 1 | $ | 4.65 | $ | 4.30 | $ | 4.09 |
Total revenue ($000's) | $ | 706,472 | $ | 849,560 | $ | 729,997 |
Net earnings ($000's) | $ | 375,495 | $ | 586,036 | $ | 550,028 |
Earnings per share | ||||||
| Basic | $ | 1.06 | $ | 1.66 | $ | 1.56 |
| Diluted | $ | 1.05 | $ | 1.65 | $ | 1.55 |
Cash flow from operations ($000's) | $ | 534,133 | $ | 719,404 | $ | 626,427 |
Dividends | ||||||
| Dividends paid ($000's) | $ | 160,013 | $ | 123,852 | $ | 63,612 |
| Dividends paid per share | $ | 0.45 | $ | 0.35 | $ | 0.18 |
Total assets ($000's) | $ | 4,389,844 | $ | 3,189,337 | $ | 2,872,335 |
Total non-current financial liabilities ($000’s) | $ | 999,973 | $ | 23,555 | $ | 50,424 |
Total other liabilities ($000’s) | $ | 23,325 | $ | 58,708 | $ | 167,694 |
Shareholders' equity ($000's) | $ | 3,366,546 | $ | 3,107,074 | $ | 2,654,217 |
Shares outstanding | 357,396,778 | 354,375,852 | 353,499,816 | |||
| 1) | Gold ounces produced and sold are converted to a silver equivalent basis based on either (i) the ratio of the average silver price received to the average gold price received during the period from the assets that produce both gold and silver, or (ii) the ratio of the price of silver to the price of gold on the date of sale as per the London Bullion Metal Exchange for the assets which produce only gold. |
| 2) | Refer to discussion on non-IFRS measure (ii) on page 43 of this MD&A. |
SILVER WHEATON 2013 ANNUAL REPORT [31]
Summary of Ounces Produced and Sold
| 2013 | 2012 | |||||||
| Q4 | Q3 | Q2 | Q1 | Q4 | Q3 | Q2 | Q1 | |
Silver ounces produced ² | ||||||||
| San Dimas ³ | 1,979 | 1,660 | 1,160 | 1,743 | 1,694 | 1,288 | 1,231 | 1,692 |
| Yauliyacu ² | 687 | 639 | 668 | 624 | 616 | 640 | 606 | 550 |
| Peñasquito | 2,047 | 1,636 | 1,440 | 1,093 | 1,445 | 1,940 | 1,822 | 1,365 |
Barrick ⁴ | 423 | 465 | 556 | 741 | 769 | 617 | 455 | 630 |
Other ⁵ | 2,119 | 2,450 | 2,586 | 2,038 | 2,345 | 2,251 | 2,378 | 2,335 |
Total silver ounces produced | 7,255 | 6,850 | 6,410 | 6,239 | 6,869 | 6,736 | 6,492 | 6,572 |
Gold ounces produced ² | ||||||||
| 777 | 14,134 | 18,259 | 16,986 | 16,951 | 19,615 | 11,824⁸ | - | - |
| Sudbury | 6,920 | 7,341 | 8,840 | 9,846 | - | - | - | - |
| Salobo | 10,067 | 8,061 | 6,342 | 4,677 | - | - | - | - |
Other ⁶ | 9,530 | 2,894 | 4,226 | 5,967 | 6,785 | 5,200 | 3,710 | 3,348 |
Total gold ounces produced | 40,651 | 36,555 | 36,394 | 37,441 | 26,400 | 17,024 | 3,710 | 3,348 |
Silver equivalent ounces of gold produced ⁷ | 2,468 | 2,237 | 2,269 | 2,095 | 1,432 | 881 | 218 | 172 |
Silver equivalent ounces produced ⁷ | 9,723 | 9,087 | 8,679 | 8,334 | 8,301 | 7,617 | 6,710 | 6,744 |
Silver ounces sold | ||||||||
| San Dimas ³ | 2,071 | 1,560 | 1,194 | 1,850 | 1,629 | 1,178 | 1,295 | 1,701 |
| Yauliyacu | 674 | 13 | 559 | 149 | 1,097 | 184 | 1,155 | 497 |
| Peñasquito | 1,412 | 1,388 | 1,058 | 1,459 | 1,642 | 1,304 | 1,845 | 1,189 |
Barrick ⁴ | 397 | 447 | 560 | 753 | 826 | 528 | 470 | 656 |
Other ⁵ | 1,510 | 2,257 | 1,771 | 1,741 | 2,153 | 1,592 | 2,024 | 1,885 |
Total silver ounces sold | 6,064 | 5,665 | 5,142 | 5,952 | 7,347 | 4,786 | 6,789 | 5,928 |
Gold ounces sold | ||||||||
| 777 | 15,889 | 16,972 | 23,483 | 9,414 | 28,084 | - | - | - |
| Sudbury | 6,551 | 6,534 | 4,184 | 111 | - | - | - | - |
| Salobo | 6,944 | 6,490 | 2,793 | 720 | - | - | - | - |
Other ⁶ | 1,840 | 5,287 | 3,409 | 6,698 | 4,876 | 6,905 | 2,369 | 3,860 |
Total gold ounces sold | 31,224 | 35,283 | 33,869 | 16,943 | 32,960 | 6,905 | 2,369 | 3,860 |
Silver equivalent ounces of gold sold ⁷ | 1,909 | 2,163 | 2,097 | 971 | 1,784 | 357 | 139 | 198 |
Silver equivalent ounces sold⁷ | 7,973 | 7,828 | 7,239 | 6,923 | 9,131 | 5,143 | 6,928 | 6,126 |
Gold / silver ratio ⁷ | 61.1 | 61.3 | 61.9 | 57.3 | 54.1 | 51.7 | 58.7 | 51.2 |
Cumulative payable silver equivalent ounces produced but not yet delivered ⁹ | 6,392 | 5,289 | 5,022 | 4,051 | 3,824 | 5,195 | 3,212 | 4,166 |
| 1) | All figures in thousands except gold ounces produced and sold. |
| 2) | Ounces produced represent the quantity of silver and gold contained in concentrate or doré prior to smelting or refining deductions. Production figures are based on information provided by the operators of the mining operations to which the silver or gold interests relate or management estimates in those situations where other information is not available. Certain production figures may be updated in future periods as additional information is received. The Company has been informed by Glencore that reported production related to the Yauliyacu mine may have been overstated by a total of approximately 200,000 ounces for all or some portion of the period between April 1, 2011 and June 30, 2012. The required adjustments to production, if any, related to the Yauliyacu mine for these periods will be made once management completes a review of the timing and amount of any production variance. |
| 3) | The ounces produced and sold include ounces received from Goldcorp in connection with Goldcorp’s four year commitment to deliver to Silver Wheaton 1.5 million ounces of silver per annum resulting from their sale of San Dimas to Primero. |
| 4) | Comprised of the Lagunas Norte, Pierina and Veladero silver interests. |
| 5) | Comprised of the Los Filos, Zinkgruvan, Keno Hill, Mineral Park, Cozamin, Neves-Corvo, Stratoni, Minto, 777, Aljustrel and Campo Morado silver interests. |
| 6) | Comprised of the Minto gold interest. |
| 7) | Gold ounces produced and sold are converted to a silver equivalent basis based on either (i) the ratio of the average silver price received to the average gold price received during the period from the assets that produce both gold and silver; or (ii) the ratio of the price of silver to the price of gold on the date of sale as per the London Bullion Metal Exchange for the assets which produce only gold. |
| 8) | Represents production for the period August 8, 2012 to September 30, 2012. |
| 9) | Based on management estimates. |
SILVER WHEATON 2013 ANNUAL REPORT [32]
Quarterly Financial Review
| 2013 | 2012 | |||||||||||||||||||||||
| Q4 | Q3 | Q2 | Q1 | Q4 | Q3 | Q2 | Q1 | |||||||||||||||||
Total silver ounces sold (000's) | 6,064 | 5,665 | 5,142 | 5,952 | 7,347 | 4,786 | 6,789 | 5,928 | ||||||||||||||||
Average realized silver price¹ | $ | 21.03 | $ | 21.22 | $ | 23.12 | $ | 29.89 | $ | 31.47 | $ | 31.16 | $ | 29.12 | $ | 32.58 | ||||||||
Silver sales (000's) | $ | 127,549 | $ | 120,255 | $ | 118,885 | $ | 177,898 | $ | 231,226 | $ | 149,086 | $ | 197,694 | $ | 193,162 | ||||||||
Total gold ounces sold | 31,224 | 35,283 | 33,869 | 16,943 | 32,960 | 6,905 | 2,369 | 3,860 | ||||||||||||||||
Average realized gold price¹ | $ | 1,277 | $ | 1,308 | $ | 1,417 | $ | 1,645 | $ | 1,699 | $ | 1,765 | $ | 1,568 | $ | 1,678 | ||||||||
Gold sales (000's) | $ | 39,867 | $ | 46,150 | $ | 48,005 | $ | 27,863 | $ | 56,015 | $ | 12,187 | $ | 3,714 | $ | 6,476 | ||||||||
Total silver equivalent ounces sold (000's) 2 | 7,973 | 7,828 | 7,239 | 6,923 | 9,131 | 5,143 | 6,928 | 6,126 | ||||||||||||||||
Average realized silver equivalent price 1, 2 | $ | 21.00 | $ | 21.26 | $ | 23.05 | $ | 29.72 | $ | 31.46 | $ | 31.36 | $ | 29.07 | $ | 32.59 | ||||||||
Total sales (000's) | $ | 167,416 | $ | 166,405 | $ | 166,890 | $ | 205,761 | $ | 287,241 | $ | 161,273 | $ | 201,408 | $ | 199,638 | ||||||||
Average cash cost, silver 1, 3 | $ | 4.14 | $ | 4.13 | $ | 4.14 | $ | 4.08 | $ | 4.12 | $ | 4.04 | $ | 4.04 | $ | 4.02 | ||||||||
Average cash cost, gold 1, 3 | $ | 394 | $ | 386 | $ | 391 | $ | 362 | $ | 386 | $ | 303 | $ | 303 | $ | 303 | ||||||||
Average cash cost, silver equivalent 1, 2, 3 | $ | 4.70 | $ | 4.73 | $ | 4.77 | $ | 4.39 | $ | 4.70 | $ | 4.16 | $ | 4.06 | $ | 4.08 | ||||||||
Net earnings (000's) | $ | 93,900 | $ | 77,057 | $ | 71,117 | $ | 133,421 | $ | 177,744 | $ | 119,697 | $ | 141,414 | $ | 147,181 | ||||||||
Earnings per share | ||||||||||||||||||||||||
| Basic | $ | 0.26 | $ | 0.22 | $ | 0.20 | $ | 0.38 | $ | 0.50 | $ | 0.34 | $ | 0.40 | $ | 0.42 | ||||||||
| Diluted | $ | 0.26 | $ | 0.22 | $ | 0.20 | $ | 0.37 | $ | 0.50 | $ | 0.34 | $ | 0.40 | $ | 0.41 | ||||||||
Cash flow from operations (000's) | $ | 124,591 | $ | 118,672 | $ | 125,258 | $ | 165,612 | $ | 254,026 | $ | 128,651 | $ | 172,916 | $ | 163,811 | ||||||||
Cash flow from operations per share 4 | ||||||||||||||||||||||||
| Basic | $ | 0.35 | $ | 0.33 | $ | 0.35 | $ | 0.47 | $ | 0.72 | $ | 0.36 | $ | 0.49 | $ | 0.46 | ||||||||
| Diluted | $ | 0.35 | $ | 0.33 | $ | 0.35 | $ | 0.46 | $ | 0.71 | $ | 0.36 | $ | 0.49 | $ | 0.46 | ||||||||
Dividends | ||||||||||||||||||||||||
| Dividends declared (000's) | $ | 32,165 | $ | 35,629 | $ | 42,573 | $ | 49,646 ⁵ | $ | 24,806 | $ | 35,388 | $ | 31,829 | $ | 31,829 ⁶ | ||||||||
| Dividends declared per share | $ | 0.09 | $ | 0.10 | $ | 0.12 | $ | 0.14 | $ | 0.07 | $ | 0.10 | $ | 0.09 | $ | 0.09 | ||||||||
Total assets (000's) | $ | 4,389,844 | $ | 4,398,445 | $ | 4,396,012 | $ | 4,400,253 | $ | 3,189,337 | $ | 3,046,564 | $ | 3,056,825 | $ | 3,005,839 | ||||||||
Total liabilities (000's) | $ | 1,023,298 | $ | 1,078,137 | $ | 1,178,859 | $ | 1,174,470 | $ | 82,263 | $ | 71,076 | $ | 212,147 | $ | 242,873 | ||||||||
Total shareholders' equity (000's) | $ | 3,366,546 | $ | 3,320,308 | $ | 3,217,153 | $ | 3,225,783 | $ | 3,107,074 | $ | 2,975,488 | $ | 2,844,678 | $ | 2,762,966 | ||||||||
| 1) | Expressed as United States dollars per ounce. |
| 2) | Gold ounces produced and sold are converted to a silver equivalent basis based on either (i) the ratio of the average silver price received to the average gold price received during the period from the assets that produce both gold and silver; or (ii) the ratio of the price of silver to the price of gold on the date of sale as per the London Bullion Metal Exchange for the assets which produce only gold. |
| 3) | Refer to discussion on non-IFRS measure (ii) on page 43 of this MD&A. |
| 4) | Refer to discussion on non-IFRS measure (i) on page 42 of this MD&A. |
| 5) | On March 21, 2013, the Company declared dividends of $0.14 per common share for total dividends of $49.6 million, which was paid on April 12, 2013. |
| 6) | On March 22, 2012, the Company declared dividends of $0.09 per common share for total dividends of $31.8 million, which was paid on April 17, 2012. |
Changes in sales, net earnings and cash flow from operations from quarter to quarter are affected primarily by fluctuations in production at the mines, the timing of shipments, changes in the price of silver or gold, the commencement of operations of mines under construction, as well as acquisitions of precious metal purchase agreements and any related capital raising activities.
SILVER WHEATON 2013 ANNUAL REPORT [33]
Results of Operations and Operational Review
The Company currently has nine reportable operating segments: the silver produced by the San Dimas, Yauliyacu, Peñasquito and Barrick mines, the gold produced by the 777, Sudbury and Salobo mines, the silver and gold produced by the Other mines and corporate operations.
| Three Months Ended December 31, 2013 | ||||||||||||||||
Ounces Produced² | Ounces Sold | Sales | Average Realized Price ($'s Per Ounce) | Average Cash Cost ($'s Per Ounce)3 | Average Depletion ($'s Per Ounce) | Net Earnings | Cash Flow From Operations | Total Assets | ||||||||
Silver | ||||||||||||||||
San Dimas 4 | 1,979 | 2,071 | $ | 42,071 | $ | 20.32 | $ | 4.17 | $ | 0.82 | $ | 31,753 | $ | 33,443 | $ | 157,492 |
| Yauliyacu | 687 | 674 | 14,681 | 21.78 | 4.12 | 5.75 | 8,030 | 11,904 | 207,277 | |||||||
| Peñasquito | 2,047 | 1,412 | 30,508 | 21.61 | 4.02 | 2.96 | 20,647 | 24,832 | 472,289 | |||||||
Barrick 5 | 423 | 397 | 8,629 | 21.72 | 3.90 | 3.31 | 5,765 | 6,891 | 601,107 | |||||||
Other 6 | 2,119 | 1,510 | 31,660 | 20.96 | 4.30 | 4.66 | 18,127 | 25,803 | 549,927 | |||||||
| 7,255 | 6,064 | $ | 127,549 | $ | 21.03 | $ | 4.14 | $ | 2.99 | $ | 84,322 | $ | 102,873 | $ | 1,988,092 | |
Gold | ||||||||||||||||
| 777 | 14,134 | 15,889 | $ | 20,127 | $ | 1,267 | $ | 400 | $ | 802 | $ | 1,036 | $ | 13,771 | $ | 280,026 |
| Sudbury | 6,920 | 6,551 | 8,363 | 1,277 | 400 | 829 | 311 | 5,743 | 1,322,483 | |||||||
| Salobo | 10,067 | 6,944 | 9,025 | 1,300 | 400 | 462 | 3,039 | 6,247 | 609,454 | |||||||
Other ⁷ | 9,530 | 1,840 | 2,352 | 1,278 | 306 | 115 | 1,577 | 2,192 | 28,429 | |||||||
| 40,651 | 31,224 | $ | 39,867 | $ | 1,277 | $ | 394 | $ | 691 | $ | 5,963 | $ | 27,953 | $ | 2,240,392 | |
Silver equivalent ⁸ | 9,723 | 7,973 | $ | 167,416 | $ | 21.00 | $ | 4.70 | $ | 4.98 | $ | 90,285 | $ | 130,826 | $ | 4,228,484 |
Corporate | ||||||||||||||||
| General and administrative | $ | (7,150) | ||||||||||||||
| Other | 10,765 | |||||||||||||||
Total corporate | $ | 3,615 | $ | (6,235) | $ | 161,360 | ||||||||||
| 9,723 | 7,973 | $ | 167,416 | $ | 21.00 | $ | 4.70 | $ | 4.98 | $ | 93,900 | $ | 124,591 | $ | 4,389,844 | |
| 1) | All figures in thousands except gold ounces produced and sold and per ounce amounts. |
| 2) | Ounces produced represent the quantity of silver and gold contained in concentrate or doré prior to smelting or refining deductions. Production figures are based on information provided by the operators of the mining operations to which the silver or gold interests relate or management estimates in those situations where other information is not available. Certain production figures may be updated in future periods as additional information is received. |
| 3) | Refer to discussion on non-IFRS measure (ii) on page 43 of this MD&A. |
| 4) | Results for San Dimas include 375,000 ounces received from Goldcorp in connection with Goldcorp’s four year commitment to deliver to Silver Wheaton 1.5 million ounces of silver per annum resulting from their sale of San Dimas to Primero. |
| 5) | Comprised of the operating Lagunas Norte, Pierina and Veladero silver interests in addition to the non-operating Pascua-Lama silver interest. |
| 6) | Comprised of the operating Los Filos, Zinkgruvan, Keno Hill, Mineral Park, Cozamin, Neves-Corvo, Stratoni, Campo Morado, Minto, 777 and Aljustrel silver interests in addition to the non-operating Rosemont, Loma de La Plata and Constancia silver interests. |
| 7) | Comprised of the operating Minto gold interest in addition to the non-operating Rosemont and Constancia gold interests. |
| 8) | Gold ounces produced and sold are converted to a silver equivalent basis based on either (i) the ratio of the average silver price received to the average gold price received during the period from the assets that produce both gold and silver; or (ii) the ratio of the price of silver to the price of gold on the date of sale as per the London Bullion Metal Exchange for the assets which produce only gold. |
SILVER WHEATON 2013 ANNUAL REPORT [34]
| Three Months Ended December 31, 2012 | ||||||||||||||||
Ounces Produced² | Ounces Sold | Sales | Average Realized Price ($'s Per Ounce) | Average Cash Cost ($'s Per Ounce)3 | Average Depletion ($'s Per Ounce) | Net Earnings | Cash Flow From Operations | Total Assets | ||||||||
Silver | ||||||||||||||||
San Dimas 4 | 1,694 | 1,629 | $ | 52,080 | $ | 31.97 | $ | 4.13 | $ | 0.79 | $ | 44,059 | $ | 45,351 | $ | 162,936 |
| Yauliyacu | 616 | 1,097 | 30,753 | 28.03 | 4.08 | 5.02 | 20,773 | 32,106 | 215,295 | |||||||
| Peñasquito | 1,445 | 1,642 | 53,697 | 32.71 | 3.99 | 2.96 | 42,287 | 47,147 | 487,272 | |||||||
Barrick 5 | 769 | 826 | 26,920 | 32.59 | 3.90 | 4.34 | 20,112 | 23,561 | 597,736 | |||||||
Other 6 | 2,345 | 2,153 | 67,776 | 31.48 | 4.30 | 4.72 | 48,344 | 61,837 | 454,677 | |||||||
| 6,869 | 7,347 | $ | 231,226 | $ | 31.47 | $ | 4.12 | $ | 3.46 | $ | 175,575 | $ | 210,002 | $ | 1,917,916 | |
Gold | ||||||||||||||||
| 777 | 19,615 | 28,084 | $ | 47,768 | $ | 1,701 | $ | 400 | $ | 773 | $ | 14,813 | $ | 40,507 | $ | 332,732 |
Other ⁷ | 6,785 | 4,876 | 8,247 | 1,691 | 303 | 171 | 5,937 | 8,052 | 30,586 | |||||||
| 26,400 | 32,960 | $ | 56,015 | $ | 1,699 | $ | 386 | $ | 684 | $ | 20,750 | $ | 48,559 | $ | 363,318 | |
Silver equivalent ⁸ | 8,301 | 9,131 | $ | 287,241 | $ | 31.46 | $ | 4.70 | $ | 5.25 | $ | 196,325 | $ | 258,561 | $ | 2,281,234 |
Corporate | ||||||||||||||||
| General and administrative | $ | (9,159) | ||||||||||||||
| Other | (9,422) | |||||||||||||||
| Total corporate | $ | (18,581) | $ | (4,535) | $ | 908,103 | ||||||||||
| 8,301 | 9,131 | $ | 287,241 | $ | 31.46 | $ | 4.70 | $ | 5.25 | $ | 177,744 | $ | 254,026 | $ | 3,189,337 | |
| 1) | All figures in thousands except gold ounces produced and sold and per ounce amounts. |
| 2) | Ounces produced represent the quantity of silver and gold contained in concentrate or doré prior to smelting or refining deductions. Production figures are based on information provided by the operators of the mining operations to which the silver or gold interests relate or management estimates in those situations where other information is not available. Certain production figures may be updated in future periods as additional information is received. |
| 3) | Refer to discussion on non-IFRS measure (ii) on page 43 of this MD&A. |
| 4) | Results for San Dimas include 375,000 ounces received from Goldcorp in connection with Goldcorp’s four year commitment to deliver to Silver Wheaton 1.5 million ounces of silver per annum resulting from their sale of San Dimas to Primero. |
| 5) | Comprised of the operating Lagunas Norte, Pierina and Veladero silver interests in addition to the non-operating Pascua-Lama silver interest. |
| 6) | Comprised of the operating Los Filos, Zinkgruvan, Keno Hill, Mineral Park, Cozamin, Neves-Corvo, Stratoni, Campo Morado, Minto, 777 and Aljustrel silver interests in addition to the non-operating Rosemont, Loma de La Plata and Constancia silver interests. |
| 7) | Comprised of the operating Minto gold interest in addition to the non-operating Rosemont gold interest. |
| 8) | Gold ounces produced and sold are converted to a silver equivalent basis based on either (i) the ratio of the average silver price received to the average gold price received during the period from the assets that produce both gold and silver; or (ii) the ratio of the price of silver to the price of gold on the date of sale as per the London Bullion Metal Exchange for the assets which produce only gold. |
For the three months ended December 31, 2013, attributable silver equivalent production was 9.7 million ounces (7.3 million ounces of silver and 40,700 ounces of gold), compared with 8.3 million ounces (6.9 million ounces of silver and 26,400 ounces of gold) for the comparable period in 2012, with the 1.4 million ounce increase being primarily attributable to the following factors:
• | 1,053,000 silver equivalent ounces of gold production (17,000 ounces of gold) from the recently acquired Sudbury and Salobo mines; |
• | 285,000 ounce (17%) increase related to the San Dimas mine, due to higher grades; |
• | 602,000 ounce (42%) increase related to the Peñasquito mine, due primarily to higher throughput and higher grades resulting from the completion of higher grade ore benches of Phase 4 and the implementation of operational improvements in the flotation cells; |
• | 182,000 silver equivalent ounce (49%) increase related to gold production at the Minto mine (2,700 gold ounces), due primarily to a combination of higher throughput and higher grades; partially offset by |
• | 226,000 ounce (10%) decrease related to Other mines, due primarily to silver production at the Campo Morado and Keno Hill mines, with operations at the Keno Hill mine being temporarily suspended in early September 2013; |
SILVER WHEATON 2013 ANNUAL REPORT [35]
• | 200,000 silver equivalent ounce (19%) decrease related to gold production at the 777 mine (5,500 gold ounces), primarily due to lower grades; and |
• | 345,000 ounce (45%) decrease related to the Barrick mines, due primarily to lower grades at Veladero. |
For the three months ended December 31, 2013, net earnings and cash flow from operations were $93.9 million and $124.6 million, respectively, compared with $177.7 million and $254.0 million for the comparable period in 2012, with the $83.8 million decrease in net earnings being primarily attributable to the following factors:
• | $7.9 million increase related to payable silver production; and |
• | $4.9 million increase related to payable gold production; and |
• | $46.5 million decrease as a result of the timing of shipments of stockpiled concentrate and doré, primarily attributable to the following factors: |
| i. | $20.2 million decrease relating to the Peñasquito mine having stockpiled concentrate produced during the three months ended December 31, 2013 compared with having sold concentrate produced in prior periods during the comparable period of the prior year; |
| ii. | $9.0 million decrease relating to the Yauliyacu mine, which continues to have an inconsistent delivery schedule as a result of the shut-down of the Doe Run Peru La Oroya smelter; |
| iii. | $7.7 million decrease relating to Other mines, primarily attributable to the Zinkgruvan and Cozamin mines having stockpiled concentrate produced during the three months ended December 31, 2013 compared with having sold concentrate produced in prior periods during the comparable period of the prior year; and |
| iv. | $6.9 million decrease relating to gold production at the Minto mine having stockpiled concentrate produced during the three months ended December 31, 2013; and |
• | $72.3 million decrease due to a reduction in the operating margin per ounce, due primarily to a 33% decrease in the average realized selling price per silver equivalent ounce sold; and |
• | $22.2 million increase as a result of a decrease in corporate costs, as explained in the Corporate Costs section of this MD&A ($1.7 million decrease from a cash flow perspective). |
SILVER WHEATON 2013 ANNUAL REPORT [36]
| Year Ended December 31, 2013 | ||||||||||||||||
Ounces Produced² | Ounces Sold | Sales | Average Realized Price ($'s Per Ounce) | Average Cash Cost ($'s Per Ounce)3 | Average Depletion ($'s Per Ounce) | Net Earnings | Cash Flow From Operations | Total Assets | ||||||||
Silver | ||||||||||||||||
San Dimas 4 | 6,542 | 6,675 | $ | 157,150 | $ | 23.54 | $ | 4.15 | $ | 0.82 | $ | 124,003 | $ | 129,447 | $ | 157,492 |
| Yauliyacu | 2,618 | 1,395 | 33,053 | 23.69 | 4.12 | 5.75 | 19,293 | 27,311 | 207,277 | |||||||
| Peñasquito | 6,216 | 5,317 | 126,587 | 23.81 | 4.02 | 2.82 | 90,229 | 105,213 | 472,289 | |||||||
Barrick 5 | 2,185 | 2,157 | 56,834 | 26.35 | 3.90 | 3.04 | 41,860 | 49,597 | 601,107 | |||||||
Other 6 | 9,193 | 7,279 | 170,963 | 23.49 | 4.23 | 4.37 | 108,303 | 141,020 | 549,927 | |||||||
| 26,754 | 22,823 | $ | 544,587 | $ | 23.86 | $ | 4.12 | $ | 2.93 | $ | 383,688 | $ | 452,588 | $ | 1,988,092 | |
Gold | ||||||||||||||||
| 777 | 66,330 | 65,758 | $ | 91,412 | $ | 1,390 | $ | 400 | $ | 802 | $ | 12,398 | $ | 61,136 | $ | 280,026 |
| Sudbury | 32,947 | 17,380 | �� | 23,001 | 1,324 | 400 | 829 | 1,639 | 16,050 | 1,322,483 | ||||||
| Salobo | 29,147 | 16,947 | 22,552 | 1,331 | 400 | 462 | 7,945 | 15,774 | 609,454 | |||||||
Other ⁷ | 22,617 | 17,234 | 24,920 | 1,446 | 305 | 137 | 17,297 | 19,923 | 28,429 | |||||||
| 151,041 | 117,319 | $ | 161,885 | $ | 1,380 | $ | 386 | $ | 659 | $ | 39,279 | $ | 112,883 | $ | 2,240,392 | |
Silver equivalent ⁸ | 35,823 | 29,963 | $ | 706,472 | $ | 23.58 | $ | 4.65 | $ | 4.81 | $ | 422,967 | $ | 565,471 | $ | 4,228,484 |
Corporate | ||||||||||||||||
| General and administrative | $ | (35,308) | ||||||||||||||
| Other | (12,164) | |||||||||||||||
| Total corporate | $ | (47,472) | $ | (31,338) | $ | 161,360 | ||||||||||
| 35,823 | 29,963 | $ | 706,472 | $ | 23.58 | $ | 4.65 | $ | 4.81 | $ | 375,495 | $ | 534,133 | $ | 4,389,844 | |
| 1) | All figures in thousands except gold ounces produced and sold and per ounce amounts. |
| 2) | Ounces produced represent the quantity of silver and gold contained in concentrate or doré prior to smelting or refining deductions. Production figures are based on information provided by the operators of the mining operations to which the silver or gold interests relate or management estimates in those situations where other information is not available. Certain production figures may be updated in future periods as additional information is received. |
| 3) | Refer to discussion on non-IFRS measure (ii) on page 43 of this MD&A. |
| 4) | Results for San Dimas include 1.5 million ounces received from Goldcorp in connection with Goldcorp’s four year commitment to deliver to Silver Wheaton 1.5 million ounces of silver per annum resulting from their sale of San Dimas to Primero. |
| 5) | Comprised of the operating Lagunas Norte, Pierina and Veladero silver interests in addition to the non-operating Pascua-Lama silver interest. |
| 6) | Comprised of the operating Los Filos, Zinkgruvan, Keno Hill, Mineral Park, Cozamin, Neves-Corvo, Stratoni, Campo Morado, Minto, 777 and Aljustrel silver interests in addition to the non-operating Rosemont, Loma de La Plata and Constancia silver interests. |
7) | Comprised of the operating Minto gold interest in addition to the non-operating Rosemont and Constancia gold interests. |
| 8) | Gold ounces produced and sold are converted to a silver equivalent basis based on either (i) the ratio of the average silver price received to the average gold price received during the period from the assets that produce both gold and silver; or (ii) the ratio of the price of silver to the price of gold on the date of sale as per the London Bullion Metal Exchange for the assets which produce only gold. |
SILVER WHEATON 2013 ANNUAL REPORT [37]
| Year Ended December 31, 2012 | ||||||||||||||||
Ounces Produced² | Ounces Sold | Sales | Average Realized Price ($'s Per Ounce) | Average Cash Cost ($'s Per Ounce)3 | Average Depletion ($'s Per Ounce) | Net Earnings | Cash Flow From Operations | Total Assets | ||||||||
Silver | ||||||||||||||||
San Dimas 4 | 5,905 | 5,803 | $ | 181,906 | $ | 31.35 | $ | 4.11 | $ | 0.79 | $ | 153,469 | $ | 158,060 | $ | 162,936 |
| Yauliyacu | 2,412 | 2,933 | 86,185 | 29.38 | 4.07 | 5.02 | 59,531 | 80,077 | 215,295 | |||||||
| Peñasquito | 6,572 | 5,980 | 186,085 | 31.12 | 3.99 | 2.96 | 144,524 | 162,225 | 487,272 | |||||||
Barrick 5 | 2,471 | 2,480 | 78,359 | 31.60 | 3.90 | 4.34 | 57,926 | 69,504 | 597,736 | |||||||
Other 6 | 9,309 | 7,654 | 238,633 | 31.18 | 4.11 | 3.74 | 178,486 | 204,206 | 454,677 | |||||||
| 26,669 | 24,850 | $ | 771,168 | $ | 31.03 | $ | 4.06 | $ | 3.08 | $ | 593,936 | $ | 674,072 | $ | 1,917,916 | |
Gold | ||||||||||||||||
| 777 | 31,439 | 28,084 | $ | 47,768 | $ | 1,701 | $ | 400 | $ | 773 | $ | 14,812 | $ | 40,507 | $ | 332,732 |
Other ⁷ | 19,043 | 18,010 | 30,624 | 1,700 | 303 | 171 | 22,094 | 25,059 | 30,586 | |||||||
| 50,482 | 46,094 | $ | 78,392 | $ | 1,701 | $ | 362 | $ | 538 | $ | 36,906 | $ | 65,566 | $ | 363,318 | |
Silver equivalent ⁸ | 29,372 | 27,328 | $ | 849,560 | $ | 31.09 | $ | 4.30 | $ | 3.70 | $ | 630,842 | $ | 739,638 | $ | 2,281,234 |
Corporate | ||||||||||||||||
| General and administrative | $ | (30,839) | ||||||||||||||
| Other | (13,967) | |||||||||||||||
| Total corporate | $ | (44,806) | $ | (20,234) | $ | 908,103 | ||||||||||
| 29,372 | 27,328 | $ | 849,560 | $ | 31.09 | $ | 4.30 | $ | 3.70 | $ | 586,036 | $ | 719,404 | $ | 3,189,337 | |
1) | All figures in thousands except gold ounces produced and sold and per ounce amounts. |
| 2) | Ounces produced represent the quantity of silver and gold contained in concentrate or doré prior to smelting or refining deductions. Production figures are based on information provided by the operators of the mining operations to which the silver or gold interests relate or management estimates in those situations where other information is not available. Certain production figures may be updated in future periods as additional information is received. |
| 3) | Refer to discussion on non-IFRS measure (ii) on page 43 of this MD&A. |
| 4) | Results for San Dimas include 1.5 million ounces received from Goldcorp in connection with Goldcorp’s four year commitment to deliver to Silver Wheaton 1.5 million ounces of silver per annum resulting from their sale of San Dimas to Primero. |
| 5) | Comprised of the operating Lagunas Norte, Pierina and Veladero silver interests in addition to the non-operating Pascua-Lama silver interest. |
| 6) | Comprised of the operating Los Filos, Zinkgruvan, Keno Hill, Mineral Park, Cozamin, Neves-Corvo, Stratoni, Campo Morado, Minto, 777 and Aljustrel silver interests in addition to the non-operating Rosemont, Loma de La Plata and Constancia silver interests. |
7) | Comprised of the operating Minto gold interest in addition to the non-operating Rosemont gold interest. |
| 8) | Gold ounces produced and sold are converted to a silver equivalent basis based on either (i) the ratio of the average silver price received to the average gold price received during the period from the assets that produce both gold and silver; or (ii) the ratio of the price of silver to the price of gold on the date of sale as per the London Bullion Metal Exchange for the assets which produce only gold. |
For the year ended December 31, 2013, attributable silver equivalent production was 35.8 million ounces (26.8 million ounces of silver and 151,000 ounces of gold), compared with 29.4 million ounces (26.7 million ounces of silver and 50,500 ounces of gold) for the comparable period in 2012, with the 6.5 million ounce increase being primarily attributable to the following factors:
• | 6.0 million silver equivalent ounces of gold production (97,000 ounces of gold) from the 777 gold interest, which was acquired in August 2012, along with the Sudbury and Salobo gold interests, which were acquired in early 2013; |
• | 637,000 silver ounce (11%) increase related to the San Dimas mine, due primarily to higher grades which resulted from reduced mining dilution as well as the mining of high grade pillars; partially offset by |
• | 355,000 silver ounce (5%) decrease related to the Peñasquito mine, due primarily to lower grades, partially offset by higher processed tonnage; and |
• | 285,000 silver ounce (12%) decrease related to the Barrick mines, primarily due to lower grades at Veladero. |
For the year ended December 31, 2013, net earnings and cash flow from operations were $375.5 million and $534.1 million, respectively, compared with $586.0 million and $719.4 million for the comparable period in 2012, with the $210.5 million decrease in net earnings being primarily attributable to the following factors:
SILVER WHEATON 2013 ANNUAL REPORT [38]
• | $10.5 million decrease related to a 1% decrease in payable silver ounces produced during the year ended December 31, 2013; and |
• | $37.8 million increase related to payable gold production; and |
• | $43.1 million decrease as a result of the timing of shipments of stockpiled concentrate and doré, primarily attributable to: |
| i. | $34.8 million decrease relating to the Yauliyacu mine, which continues to have an inconsistent delivery schedule; |
| ii. | $8.4 million decrease relating to the Peñasquito mine having stockpiled concentrate produced during the year ended December 31, 2013 compared with having sold concentrate produced in prior periods during the comparable period of the prior year; |
| iii. | $5.1 million decrease relating to gold production at the Minto mine having stockpiled concentrate produced during the year ended December 31, 2013; and |
| iv. | $5.1 million decrease relating to the Salobo mine having stockpiled concentrate produced during the year ended December 31, 2013; partially offset by |
| v. | $6.3 million increase relating to the San Dimas mine having sold doré produced in prior periods during the year ended December 31, 2013 as compared to stockpiling doré during the comparable period of the previous year; and |
| vi. | $4.0 million increase relating to the Other mines, primarily attributable to the Campo Morado and Neves-Corvo mines; and |
• | $192.1 million decrease due to a reduction in the operating margin per ounce, due primarily to a 23% decrease in the average realized selling price per silver equivalent ounce sold; and |
• | $2.7 million decrease as a result of an increase in corporate costs, as explained in the Corporate Costs section of this MD&A ($11.1 million decrease from a cash flow perspective). |
Corporate Costs
Three Months Ended December 31 | Year Ended December 31 | |||
(in thousands) | 2013 | 2012 | 2013 | 2012 |
General and administrative | $ 7,150 | $ 9,159 | $ 35,308 | $ 30,839 |
| Foreign exchange (gain) loss | (233) | (57) | (348) | 29 |
| Interest expense | 1,226 | - | 6,083 | - |
| Other expense (income) | 920 | 1,335 | 11,550 | (817) |
| Income tax (recovery) expense | (12,678) | 8,144 | (5,121) | 14,755 |
Total corporate costs | $ (3,615) | $ 18,581 | $ 47,472 | $ 44,806 |
SILVER WHEATON 2013 ANNUAL REPORT [39]
General and Administrative
Three Months Ended December 31 | Year Ended December 31 | |||
(in thousands) | 2013 | 2012 | 2013 | 2012 |
| Salaries and benefits | ||||
| Salaries and benefits, excluding PSUs | $ 2,926 | $ 3,663 | $ 11,522 | $ 10,173 |
| PSUs | (803) | 472 | 646 | 1,685 |
| Total salaries and benefits | $ 2,123 | $ 4,135 | $ 12,168 | $ 11,858 |
| Depreciation | 71 | 49 | 240 | 228 |
| Charitable donations | 81 | 649 | 2,710 | 1,857 |
| Professional fees | 694 | 840 | 3,981 | 2,981 |
| Other | 1,903 | 1,914 | 7,820 | 7,495 |
| Cash settled general and administrative | $ 4,872 | $ 7,587 | $ 26,919 | $ 24,419 |
| Equity settled stock based compensation (a non-cash expense) | 2,278 | 1,572 | 8,389 | 6,420 |
Total general and administrative | $ 7,150 | $ 9,159 | $ 35,308 | $ 30,839 |
For the three months ended December 31, 2013, general and administrative expense decreased by $2.0 million relative to the comparable period in the previous year, with the decrease being primarily due to lower charitable donations in addition to the reversal of accrued costs associated with the Company’s performance share unit plan.
For the year ended December 31, 2013, general and administrative expense increased by $4.5 million relative to the comparable period in the previous year, with this increase being primarily attributable to increases in charitable donations, professional fees and salaries and benefits (including stock based compensation). The increase in salaries and benefits is primarily attributable to the increase in the number of employees from an average of 25 during 2012 as compared to an average of 28 during 2013.
Other Expense (Income)
Three Months Ended December 31 | Year Ended December 31 | |||
(in thousands) | 2013 | 2012 | 2013 | 2012 |
| Dividend income | $ (57) | $ (23) | $ (227) | $ (80) |
| Interest income | (15) | (238) | (204) | (1,222) |
| Stand-by fees | 721 | 214 | 2,758 | 897 |
| Loss (gain) on long-term investments - share purchase warrants held | - | 1,441 | 2,694 | (496) |
| Amortization of credit facility origination fees - undrawn facilities | 253 | - | 1,910 | - |
| Write off of credit facility origination fees upon the cancellation of the Bridge Facility | - | - | 4,490 | - |
| Other | 18 | (59) | 129 | 84 |
Total other expense (income) | $ 920 | $ 1,335 | $ 11,550 | $ (817) |
During the three months and year ended December 31, 2013, other expense was $0.9 million and $11.6 million, respectively, as compared to other expense of $1.3 million and other income of $0.8 million during the comparable periods of the previous year, with the change during the twelve month period being primarily the result of:
| · | A $2.7 million unrealized loss related to the fair value adjustment in warrants held during the current period as compared to a $0.5 million unrealized gain during the comparable period of the previous year; |
| · | As further explained in Note 12 to the financial statements, on February 28, 2013, the Company entered into two new unsecured credit facilities, comprised of (i) a $1 billion revolving credit facility having a 5-year term; and (ii) a $1.5 billion bridge financing facility having a 1-year term (the “Bridge Facility”). The Company paid |
SILVER WHEATON 2013 ANNUAL REPORT [40]
upfront costs of $11.7 million in connection with these new facilities which have been recorded under Other assets and are being amortized over the life of the respective credit facilities. On May 28, 2013, the Bridge Facility was terminated, with the remaining unamortized upfront costs of $4.5 million associated with this credit facility being fully expensed on that date;
| · | The amortization of debt origination fees in the amount of $1.9 million during the current period associated with the undrawn portion of the Bridge Facility and the Revolving Facility; and |
| · | Stand-by fees in the amount of $2.8 million during the current period as compared to $0.9 during the comparable period of the previous year, with the increase being primarily attributable to the Company replacing its pre-existing $400 million revolving credit facility with the new $1 billion Revolving Facility on February 28, 2013 (see above), which was fully undrawn as at December 31, 2013. |
Interest Costs
During the three months ended December 31, 2013, the Company incurred interest costs of $4.4 million at an effective interest rate of 1.70%, of which $3.2 million has been capitalized in relation to the Barrick and Constancia silver interests, with the remainder being expensed. During the three months ended December 31, 2012, the Company incurred interest costs of $0.1 million at an effective interest rate of 1.11%, all of which was capitalized in relation to the Barrick silver interest.
During the year ended December 31, 2013, the Company incurred interest costs of $18.0 million on bank debt at an effective interest rate of 2.04%, of which $11.9 million has been capitalized in relation to the Barrick and Constancia silver interests, with the remainder being expensed. During the year ended December 31, 2012, the Company incurred interest costs of $7.4 million, comprised of $0.7 million on bank debt at an effective interest rate of 1.12%, and $6.7 million of accreted interest on the future payments due in relation to the Barrick silver interest. All of the interest costs incurred during the year ended December 31, 2012 were capitalized in relation to the Barrick silver interest.
Income Tax Expense
Three Months Ended December 31 | Year Ended December 31 | |||
(in thousands) | 2013 | 2012 | 2013 | 2012 |
Current income tax expense related to foreign jurisdictions | $ 40 | $ 40 | $ 154 | $ 725 |
Deferred income tax expense (recovery) related to: | ||||
| Origination and reversal of temporary differences | $ (12,718) | $ 6,159 | $ (7,381) | $ 11,614 |
| Write down (reversal of write down) of previously recognized temporary differences | - | 1,945 | 2,106 | 2,416 |
| $ (12,718) | $ 8,104 | $ (5,275) | $ 14,030 | |
Total income tax (recovery) expense | $ (12,678) | $ 8,144 | $ (5,121) | $ 14,755 |
For the three months and year ended December 31, 2013, income tax expense decreased by $20.8 and $19.9 million, respectively, relative to the comparable periods in the previous year. Income tax expense is, for the most part, comprised of the change in deferred income tax assets recognized, which is primarily affected by the change in unrealized gains in long-term investments in common shares held, and the change in deferred income tax expense associated with income from Canadian operations. In addition, during the three months ended December 31, 2013, the Company changed its estimated tax rate associated with the temporary difference related to capitalized interest on certain of the Company’s precious metal purchase agreements, resulting in the reversal of a deferred tax liability in the amount of $9.9 million for the year ended December 31, 2013.
SILVER WHEATON 2013 ANNUAL REPORT [41]
Non-IFRS Measures
Silver Wheaton has included, throughout this document, certain non-IFRS performance measures, including (i) operating cash flow per share (basic and diluted); (ii) average cash costs of silver and gold on a per ounce basis; and (iii) cash operating margin.
| i. | Operating cash flow per share (basic and diluted) is calculated by dividing cash generated by operating activities by the weighted average number of shares outstanding (basic and diluted). The Company presents operating cash flow per share as management and certain investors use this information to evaluate the Company’s performance in comparison to other companies in the precious metals mining industry who present results on a similar basis. |
The following table provides a reconciliation of operating cash flow per share (basic and diluted).
Three Months Ended December 31 | Year Ended December 31 | |||||||||||
(in thousands, except for per share amounts) | 2013 | 2012 | 2013 | 2012 | ||||||||
Cash generated by operating activities | $ | 124,591 | $ | 254,026 | $ | 534,133 | $ | 719,404 | ||||
Divided by: | ||||||||||||
| Basic weighted average number of shares outstanding | 357,389 | 354,301 | 355,588 | 353,874 | ||||||||
| Diluted weighted average number of shares outstanding | 357,869 | 356,566 | 356,595 | 356,008 | ||||||||
Equals: | ||||||||||||
| Operating cash flow per share - basic | $ | 0.35 | $ | 0.72 | $ | 1.50 | $ | 2.03 | ||||
| Operating cash flow per share - diluted | $ | 0.35 | $ | 0.71 | $ | 1.50 | $ | 2.02 | ||||
SILVER WHEATON 2013 ANNUAL REPORT [42]
| ii. | Average cash cost of silver and gold on a per ounce basis is calculated by dividing the total cost of sales, less depletion, by the ounces sold. In the precious metals mining industry, this is a common performance measure but does not have any standardized meaning. In addition to conventional measures prepared in accordance with IFRS, management and certain investors use this information to evaluate the Company’s performance and ability to generate cash flow. |
The following table provides a reconciliation of average cash cost of silver and gold on a per ounce basis.
Three Months Ended December 31 | Year Ended December 31 | |||||||||||||
(in thousands, except for gold ounces sold and per ounce amounts) | 2013 | 2012 | 2013 | 2012 | ||||||||||
Cost of sales | $ | 77,131 | $ | 90,916 | $ | 283,505 | $ | 218,718 | ||||||
| Less: depletion | (39,694) | (47,968) | (144,153) | (101,229) | ||||||||||
Cash cost of sales | $ | 37,437 | $ | 42,948 | $ | 139,352 | $ | 117,489 | ||||||
Cash cost of sales is comprised of: | ||||||||||||||
| Total cash cost of silver sold | $ | 25,121 | $ | 30,237 | $ | 94,054 | $ | 100,798 | ||||||
| Total cash cost of gold sold | 12,316 | 12,711 | 45,298 | 16,691 | ||||||||||
Total cash cost of sales | $ | 37,437 | $ | 42,948 | $ | 139,352 | $ | 117,489 | ||||||
Divided by: | ||||||||||||||
| Total silver ounces sold | 6,064 | 7,347 | 22,823 | 24,850 | ||||||||||
| Total gold ounces sold | 31,224 | 32,960 | 117,319 | 46,094 | ||||||||||
Total silver equivalent ounces sold 1 | 7,973 | 9,131 | 29,963 | 27,328 | ||||||||||
Equals: | ||||||||||||||
| Average cash cost of silver (per ounce) | $ | 4.14 | $ | 4.12 | $ | 4.12 | $ | 4.06 | ||||||
| Average cash cost of gold (per ounce) | $ | 394 | $ | 386 | $ | 386 | $ | 362 | ||||||
Average cash cost (per silver equivalent ounce 1) | $ | 4.70 | $ | 4.70 | $ | 4.65 | $ | 4.30 | ||||||
| 1) | Gold ounces produced and sold are converted to a silver equivalent basis based on either (i) the ratio of the average silver price received to the average gold price received during the period from the assets that produce both gold and silver; or (ii) the ratio of the price of silver to the price of gold on the date of sale as per the London Bullion Metal Exchange for the assets which produce only gold. |
SILVER WHEATON 2013 ANNUAL REPORT [43]
| iii. | Cash operating margin is calculated by subtracting the average cash cost of silver and gold on a per ounce basis from the average realized selling price of silver and gold on a per ounce basis. The Company presents cash operating margin as management and certain investors use this information to evaluate the Company’s performance in comparison to other companies in the precious metals mining industry who present results on a similar basis. |
The following table provides a reconciliation of cash operating margin.
Three Months Ended December 31 | Year Ended December 31 | |||||||
(in thousands, except for per ounce amounts) | 2013 | 2012 | 2013 | 2012 | ||||
| Average realized selling price of silver and gold | ||||||||
| Sales | $ | 167,416 | $ | 287,241 | $ | 706,472 | $ | 849,560 |
Divided by - total silver equivalent ounces sold 1 | 7,973 | 9,131 | 29,963 | 27,328 | ||||
Equals - average realized price ($'s per silver equivalent ounce 1) | $ | 21.00 | $ | 31.46 | $ | 23.58 | $ | 31.09 |
Less - average cash cost ($'s per silver equivalent ounce 1, 2) | (4.70) | (4.70) | (4.65) | (4.30) | ||||
Cash operating margin per silver equivalent ounce 1 | $ | 16.30 | $ | 26.76 | $ | 18.93 | $ | 26.79 |
| 1) | Gold ounces produced and sold are converted to a silver equivalent basis based on either (i) the ratio of the average silver price received to the average gold price received during the period from the assets that produce both gold and silver; or (ii) the ratio of the price of silver to the price of gold on the date of sale as per the London Bullion Metal Exchange for the assets which produce only gold. |
| 2) | Refer to discussion on non-IFRS measure (ii) on page 43 of this MD&A. |
These non-IFRS measures do not have any standardized meaning prescribed by IFRS, and other companies may calculate these measures differently. The presentation of these non-IFRS measures is intended to provide additional information and should not be considered in isolation or as a substitute for measures of performance prepared in accordance with IFRS.
SILVER WHEATON 2013 ANNUAL REPORT [44]
Liquidity and Capital Resources1
As at December 31, 2013, the Company had cash and cash equivalents of $95.8 million (December 31, 2012 - $778.2 million) and working capital of $80.2 million (December 31, 2012 – working capital of $735.9 million).
On February 28, 2013, the Company entered into two new unsecured credit facilities, comprised of (i) a $1 billion Revolving Facility having a 5-year term; and (ii) a $1.5 billion Bridge Facility having a 1-year term. On May 28, 2013, the Company cancelled the Bridge Facility, replacing it with a $1 billion non-revolving term loan ("NRT Loan") with a 3-year term, extendable by 1 year with the unanimous consent of lenders. These facilities replaced the pre-existing $400 million revolving credit facility and the debt outstanding relative to the $200 million Term Loan.
During the year ended December 31, 2013, the Company generated operating cash flows of $534.1 million compared with $719.4 million during the comparable period of 2012, with the decrease being primarily related to a decrease in the price realized on the sale of silver equivalent ounces sold, partially offset by an increase in the number of silver equivalent ounces sold.
During the year ended December 31, 2013, the Company had net cash inflows from financing activities of $834.1 million, which was primarily the result of a net drawdown under the Company’s credit facilities of $1.0 billion and $58.0 million in proceeds from share purchase options and share purchase warrants exercised during the period, partially offset by $14.0 million of upfront costs related to the new credit facilities and dividend payments totaling $160.0 million. During the year ended December 31, 2012, the Company had net cash outflows from financing activities of $139.5 million, which was comprised of dividend payments of $123.9 million and scheduled principal repayments of $28.6 million relating to the Company’s previously outstanding term loan, partially offset by proceeds in the amount of $12.9 million from share purchase options and share purchase warrants exercised during the year.
During the year ended December 31, 2013, the Company had net cash outflows from investing activities of $2.1 billion, primarily related to (i) the upfront cash payment to Vale totaling $1.9 billion related to the Company’s Salobo and Sudbury gold interests; (ii) a $125 million upfront cash payment to Hudbay related to the second installment on the Constancia silver interest, which was due once capital expenditures of $500 million had been incurred at Constancia; and (iii) a $13.5 million upfront cash payment to Sandspring associated with the Toroparu early deposit gold interest. During the year ended December 31, 2012, the Company had net cash outflows from investing activities of $641.9 million, which was primarily related to upfront payments to Hudbay totaling $500 million related to the Company’s 777 silver and gold interest and Constancia silver interest, in addition to the scheduled final upfront payment of $137.5 million to Barrick.
In the opinion of management, the $95.8 million of cash and cash equivalents as at December 31, 2013, combined with the liquidity provided by the credit available under the undrawn $1 billion Revolving Facility and ongoing operating cashflows positions the Company well to fund all outstanding commitments as well as providing flexibility to acquire additional accretive precious metal stream interests.
| 1 | Statements made in this section contain forward-looking information with respect to funding outstanding commitments and continuing to acquire accretive precious metal stream interests. Please see “Cautionary Note Regarding Forward-Looking Statements” for material risks, assumptions and important disclosure associated with this information. |
SILVER WHEATON 2013 ANNUAL REPORT [45]
Contractual Obligations and Contingencies1
Silver and Gold Interests
The following table summarizes the Company’s commitments to pay for silver and gold to which it has the contractual right pursuant to the precious metal purchase agreements:
Silver and Gold Interests | Attributable Payable Production to be Purchased | Per Ounce Cash Payment 1, 2 | Term of Agreement | Date of Contract | ||||
Silver | Gold | Silver | Gold | |||||
| San Dimas | 100% ³ | 0% | $ | 4.16 | n/a | Life of Mine | 15-Oct-04 | |
| Yauliyacu | 100% ⁴ | 0% | $ | 4.12 | n/a | 20 years | 23-Mar-06 | |
| Peñasquito | 25% | 0% | $ | 4.02 | n/a | Life of Mine | 24-Jul-07 | |
| 777 | 100% | 100%/50% ⁵ | $ | 5.90⁶ | $ | 400⁶ | Life of Mine | 8-Aug-12 |
| Salobo | 0% | 25% | n/a | $ | 400 | Life of Mine | 28-Feb-13 | |
| Sudbury | 0% | 70% | n/a | $ | 400 | 20 years | 28-Feb-13 | |
| Barrick | ||||||||
| Pascua-Lama | 25% | 0% | $ | 3.90 | n/a | Life of Mine | 8-Sep-09 | |
| Lagunas Norte | 100% | 0% | $ | 3.90 | n/a | 6 years ⁷ | 8-Sep-09 | |
| Pierina | 100% | 0% | $ | 3.90 | n/a | 6 years ⁷ | 8-Sep-09 | |
| Veladero | 100% ⁸ | 0% | $ | 3.90 | n/a | 6 years ⁷ | 8-Sep-09 | |
| Other | ||||||||
Los Filos 3 | 100% | 0% | $ | 4.20 | n/a | 25 years | 15-Oct-04 | |
| Zinkgruvan | 100% | 0% | $ | 4.21 | n/a | Life of Mine | 8-Dec-04 | |
| Stratoni | 100% | 0% | $ | 4.06 | n/a | Life of Mine | 23-Apr-07 | |
| Minto | 100% | 100% ⁹ | $ | 4.02 | $ | 309 | Life of Mine | 20-Nov-08 |
| Cozamin | 100% | 0% | $ | 4.16 | n/a | 10 years | 4-Apr-07 | |
| Neves-Corvo | 100% | 0% | $ | 4.06 | n/a | 50 years | 5-Jun-07 | |
| Aljustrel | 100% | 0% | $ | 4.02 | n/a | 50 years | 5-Jun-07 | |
| Mineral Park | 100% | 0% | $ | 3.94 | n/a | Life of Mine | 17-Mar-08 | |
| Campo Morado | 75% | 0% | $ | 3.98 | n/a | Life of Mine | 13-May-08 | |
| Keno Hill | 25% | 0% | $ | 3.90 | n/a | Life of Mine | 2-Oct-08 | |
| Rosemont | 100% | 100% | $ | 3.90 | $ | 450 | Life of Mine | 10-Feb-10 |
| Loma de La Plata | 12.5% | 0% | $ | 4.00 | n/a | Life of Mine | n/a ¹⁰ | |
| Constancia | 100% | 50% ¹¹ | $ | 5.90⁶ | $ | 400⁶ | Life of Mine | 8-Aug-12 |
| Early Deposit | ||||||||
| Toroparu | 100% | 10% ¹² | n/a | $ | 400 | Life of Mine | 11-Nov-13 | |
| 1) | Subject to an annual inflationary adjustment with the exception of Loma de La Plata and Sudbury. |
| 2) | Should the prevailing market price for silver or gold be lower than this amount, the per ounce cash payment will be reduced to the prevailing market price, with the exception of Yauliyacu. |
| 3) | Until August 6, 2014, Silver Wheaton is committed to purchase from Primero a per annum amount equal to the first 3.5 million ounces of payable silver produced at San Dimas and 50% of any excess, plus Silver Wheaton is committed to purchase an additional 1.5 million ounces of silver per annum to be delivered by Goldcorp for a per ounce cash payment equal to that applicable under the Los Filos silver purchase agreement. After August 6, 2014, Silver Wheaton is committed to purchase from Primero a per annum amount equal to the first 6 million ounces of payable silver produced at San Dimas and 50% of any excess. |
| 4) | To a maximum of 4.75 million ounces per annum. In the event that silver sold and delivered to Silver Wheaton in any year totals less than 4.75 million ounces, the amount sold and delivered to Silver Wheaton in subsequent years will be increased to make up for any cumulative shortfall, to the extent production permits. The cumulative shortfall as at March 23, 2013, representing the seven year anniversary, was 15.2 million ounces. |
| 5) | The Company’s share of gold production at 777 will remain at 100% until the later of the end of 2016 or the satisfaction of a completion test relating to Hudbay’s Constancia project, after which it will be reduced to 50% for the remainder of the mine life. |
| 6) | Subject to an increase to $9.90 per ounce of silver and $550 per ounce of gold after the initial 40 year term. |
| 7) | The Company is committed to purchase silver production from the currently producing mines until December 31, 2016. |
| 8) | Silver Wheaton's attributable silver production is subject to a maximum of 8% of the silver contained in the ore processed at Veladero during the period. |
| 9) | The Company is committed to acquire 100% of the first 30,000 ounces of gold produced per annum and 50% thereafter. |
| 10) | Terms of the agreement not yet finalized. |
| 11) | Gold recoveries will be set at 55% for the Constancia deposit and 70% for the Pampacancha deposit until 265,000 ounces of gold have been delivered to the Company. |
| 12) | During the 90 day period following the delivery of a bankable definitive feasibility study, environmental study and impact assessment, and other related documents (collectively, the “Feasibility Documentation”), or after December 31, 2015 if the Feasibility Documentation has not been delivered to Silver Wheaton by such date, Silver Wheaton may elect not to proceed with the precious metal purchase agreement, at which time Silver Wheaton will be entitled to a return of the early deposit of $11.5 million (on the basis that $2 million of the advanced $13.5 million is non-refundable) or, at Sandspring’s option, the stream percentage will be reduced from 10% to 0.774% (equivalent to the pro-rata stream based on a full purchase price of $11.5 million). |
| 1 | Statements made in this section contain forward-looking information. Please see “Cautionary Note Regarding Forward-Looking Statements” for material risks, assumptions and important disclosure associated with this information. |
SILVER WHEATON 2013 ANNUAL REPORT [46]
Other Contractual Obligations and Contingencies
| Obligations With Scheduled Payment Dates | Other Commitments | |||||||||||||
(in thousands) | 2014 | 2015 - 2017 | 2018 - 2019 | After 2019 | Sub-Total | Total | ||||||||
Bank debt ¹ | $ | - | $ | 1,000,000 | $ | - | $ | - | $ | 1,000,000 | $ | - | $ | 1,000,000 |
| Interest ² | 14,620 | 23,620 | - | - | 38,240 | - | 38,240 | |||||||
| Silver and gold interest payments ³ | ||||||||||||||
Rosemont 4 | - | - | - | - | - | 231,150 | 231,150 | |||||||
| Loma de La Plata | - | - | - | - | - | 32,400 | 32,400 | |||||||
| Constancia | - | - | - | - | - | 260,000 | 260,000 | |||||||
| Toroparu | - | - | - | - | - | 135,000 | 135,000 | |||||||
| Operating leases | 485 | 3,500 | 2,162 | 5,680 | 11,827 | - | 11,827 | |||||||
Total contractual obligations | $ | 15,105 | $ | 1,027,120 | $ | 2,162 | $ | 5,680 | $ | 1,050,067 | $ | 658,550 | $ | 1,708,617 |
| 1) | At December 31, 2013, the Company had $1.0 billion outstanding on the NRT Loan and $Nil outstanding on the Revolving Facility. |
| 2) | As the applicable interest rates are floating in nature, the interest charges are estimated based on market-based forward interest rate curves at the end of the reporting period. |
| 3) | Does not reflect the contingent payment due related to the Salobo gold purchase agreement (see the Salobo section, below). |
| 4) | Includes contingent transaction costs of $1.1 million. |
Rosemont
In connection with the Rosemont precious metal purchase agreement, the Company is committed to pay Augusta total upfront cash payments of $230 million, payable on an installment basis to partially fund construction of the Rosemont mine once certain milestones are achieved, including the receipt of key permits and securing the necessary financing to complete construction of the mine.
Loma de La Plata
In connection with the Company’s election to convert the debenture with Pan American into a silver purchase agreement, the Company is committed to pay Pan American total upfront cash payments of $32.4 million following the satisfaction of certain conditions, including Pan American receiving all necessary permits to proceed with the mine construction.
Constancia
In connection with the Constancia precious metal purchase agreement, the Company is committed to pay Hudbay additional payments of $125 million and $135 million to be made once capital expenditures of $1 billion and $1.35 billion, respectively, have been incurred at Constancia. Silver Wheaton has the option to make the $135 million payment in either cash or Silver Wheaton shares, with the number of shares to be determined at the time the payment is made1.
Salobo
Vale is in the process of expanding the mill throughput capacity at the Salobo mine to 24 million tonnes per annum (“Mtpa”) from its current 12 Mtpa. If throughput capacity is expanded above 28 Mtpa within a predetermined period, Silver Wheaton will be required to make an additional payment to Vale based on a set fee schedule ranging from $67 million if throughput capacity is expanded to 28 Mtpa by January 1, 2031 up to $400 million if throughput capacity is expanded to 40 Mtpa prior to January 1, 2021.
Toroparu
In connection with the Toroparu early deposit precious metal purchase agreement, the Company is committed to pay Sandspring additional payments of $135 million on an installment basis to partially fund construction of the mine.
| 1 | If Silver Wheaton shares are used, the number of common shares will be calculated based on the volume weighted average trading price of the Company on the Toronto Stock Exchange for the ten consecutive trading days immediately prior to the date the consideration is payable. |
SILVER WHEATON 2013 ANNUAL REPORT [47]
During the 90 day period following the delivery of the Feasibility Documentation, or after December 31, 2015 if the Feasibility Documentation has not been delivered to Silver Wheaton by such date, Silver Wheaton may elect not to proceed with the precious metal purchase agreement, at which time Silver Wheaton will be entitled to a return of the early deposit of $11.5 million (on the basis that $2 million of the advanced $13.5 million is non-refundable) or, at Sandspring’s option, the stream percentage will be reduced from 10% to 0.774% (equivalent to the pro-rata stream based on a full purchase price of $11.5 million).
Other1
Due to the size, complexity and nature of the Company’s operations, various legal and tax matters are outstanding from time to time, including an audit (the “CRA Audit”) by the Canada Revenue Agency (the “CRA”) of the Company’s international transactions covering the 2005 to 2010 taxation years, which is currently ongoing. The Company has not received any notice of reassessment for the 2005 to 2010 taxation years in connection with the CRA Audit. In the event that CRA issues one or more notices of reassessment for material amounts of tax, interest and penalties, the Company is prepared to vigorously defend its position.
By their nature, contingencies will only be resolved when one or more future events occur or fail to occur. The assessment of contingencies inherently involves the exercise of significant judgment and estimates of the outcome of future events. Based on information available to management at March 20, 2014, the outstanding legal and tax matters are not expected to have a material adverse effect on the Company. However, if the Company is unable to resolve any of these matters favorably, or if CRA issues one or more notices of reassessment for material amounts of tax, interest and penalties, there may be a material adverse impact on the Company’s financial performance, cash flows or results of operations. In the event that management’s estimate of the future resolution of these matters changes, the Company will recognize the effects of the changes in its consolidated financial statements in the appropriate period relative to when such changes occur.
Share Capital
During the year ended December 31, 2013, the Company received cash proceeds of $6.4 million from the exercise of 415,133 share purchase options at a weighted average exercise price of Cdn$15.65 per option. For the comparable period in 2012, the Company received cash proceeds of $11.0 million from the exercise of 721,632 share purchase options at a weighted average exercise price of Cdn$15.17 per option.
During the year ended December 31, 2013, the Company received cash proceeds of $51.7 million from the exercise of 2,586,794 share purchase warrants at a weighted average exercise price of $20.00 per warrant. For the comparable period in 2012, the Company received cash proceeds of $1.9 million from the exercise of 93,897 share purchase warrants with an exercise price of $20.00 per warrant.
As of March 20, 2014, there were 357,396,778 outstanding common shares, 3,029,762 share purchase options, 148,692 restricted share units and 10,000,000 share purchase warrants.
Risks and Uncertainties
The primary risk factors affecting the Company are set forth below. For discussion of additional risk factors, please refer to the Company’s Annual Information Form, which is available on the Company’s website, www.silverwheaton.com, and on SEDAR, www.sedar.com, or is available upon request from the Company.
Commodity Prices
The price of the common shares and the Company’s financial results may be significantly adversely affected by a decline in the price of silver or gold. The price of silver and gold fluctuates widely, especially in recent years, and is affected by numerous factors beyond the Company’s control, including, but not limited to, the sale or purchase of silver and gold by various central banks and financial institutions, interest rates, exchange rates, inflation or deflation, fluctuation in the value of the United States dollar and foreign currencies, global and regional supply and demand, and the political and economic conditions of major silver and gold producing countries throughout the world.
1 | The assessment by management of the expected impact of the CRA Audit on the Company is “forward-looking information”. Statements in respect of the impact of the CRA Audit are based on the expectation that the Company will be successful in challenging any assessment by CRA. Statements in respect of the CRA Audit are subject to known and unknown risks including that the Company’s interpretation of, or compliance with, tax laws, is found to be incorrect. Please see “Cautionary Note Regarding Forward-Looking Statements” for material risks, assumptions and important disclosure associated with this information. |
SILVER WHEATON 2013 ANNUAL REPORT [48]
In the event that the prevailing market price of silver or gold is at or below the price at which the Company can purchase such pursuant to the terms of the agreements associated with its silver and gold interests, the Company will not generate positive cash flow or earnings.
The “Mining Operations” consist of the San Dimas mine, the Zinkgruvan mine, the Yauliyacu mine, the Stratoni mine, the Mineral Park mine, the Los Filos mine, the Peñasquito mine, the Campo Morado mine, the Keno Hill mine, the Neves-Corvo mine, the Cozamin mine, the Minto mine, the Barrick mines (including the Pascua-Lama project), the Aljustrel mine, the 777 mine, the Salobo mine, the Sudbury mines, the Rosemont project, the Loma de La Plata project, the Constancia project and the Toroparu project. Silver and gold are by-product metals at all of the Mining Operations, other than at the Keno Hill mine, the Loma de La Plata project and the Toroparu project, and therefore, the economic cut-off applied to the reporting of silver and gold reserves and resources will be influenced by changes in the commodity prices of other metals at the mines.
Risks Relating to Mining Operations
To the extent that they relate to the production of silver and gold from, or the continued operation of, the Mining Operations, the Company will be subject to the risk factors applicable to the operators of such mines or projects, including the following as more fully described in the Company’s Annual Information Form: government regulations; international operations; exploration, development and operating risks; environmental regulation; permitting; compliance with laws; infrastructure; mineral reserve and mineral resource estimates; need for additional mineral reserves; land title; commodity price fluctuations; additional capital; and permitting, construction, development and expansion risk.
No Control Over Mining Operations
The Company has agreed to purchase a certain percentage of the silver and / or gold produced by the Mining Operations. The Company is not directly involved in the ownership or operation of mines and has no contractual rights relating to the operation of the Mining Operations. As a result, the cash flow of the Company is dependent upon the activities of third parties which creates the risk that at any time those third parties may: (i) have business interests or targets that are inconsistent with those of the Company, (ii) take action contrary to the Company’s policies or objectives, (iii) be unable or unwilling to fulfill their obligations under their agreements with the Company, or (iv) experience financial, operational or other difficulties, including insolvency, which could limit a third party’s ability to perform its obligations under the precious metal purchase agreements. Except in limited circumstances, the Company will not be entitled to any material compensation if such operations do not meet their forecasted silver or gold production targets in any specified period or if the operations shut down, suspend or discontinue on a temporary or permanent basis. There can be no assurance that the silver or gold production from such properties will ultimately meet forecasts or targets. At any time, any of the operators of the Mining Operations may decide to suspend or discontinue operations.
Taxes
A significant portion of the Company’s operating profit is derived from its subsidiaries, Silver Wheaton (Caymans) Ltd. which is incorporated and operated in the Cayman Islands and, historically, Silverstone Resources (Barbados) Corp, which was incorporated and operated in Barbados, such that the Company’s profits are subject to low income tax.
The introduction of new tax laws or regulations, or changes to, or differing interpretation of, or application of, existing tax laws or regulations in Canada, the Cayman Islands, Luxembourg, Barbados, the Netherlands or any of the countries in which the Mining Operations are located or to which shipments of silver or gold are made, could result in an increase in the Company’s taxes, or other governmental charges, duties or impositions. Due to the size, complexity and nature of the Company’s operations, various tax matters are outstanding from time to time, including an audit by the CRA of the Company’s international transactions covering the 2005 to 2010 taxation years. No assurance can be given that new tax laws or regulations will not be enacted or that existing tax laws or regulations will not be changed, interpreted or applied in a manner which could have a material adverse effect on the Company.
Credit and Liquidity Risk
The Company is exposed to various counterparty risks and liquidity risks including, but not limited to: (i) through the companies with which the Company has precious metal purchase agreements; (ii) through financial institutions that hold the Company’s cash and cash equivalents; (iii) through companies that have payables to the Company, including concentrate customers; (iv) through the Company’s insurance providers; and (v) through the Company’s lenders. The Company is also exposed to liquidity risks in meeting its operating expenditure requirements in instances where cash positions are unable to be maintained or appropriate financing is unavailable. These factors may impact the ability of the Company to obtain loans and other credit facilities in the future and, if obtained, on terms favourable to the Company.
SILVER WHEATON 2013 ANNUAL REPORT [49]
If these risks materialize, the Company’s operations could be adversely impacted and the trading price of the common shares could be adversely affected.
Hedging Risk
The Company has a policy that permits hedging its foreign exchange and interest rate exposures to reduce the risks associated with currency and interest rate fluctuations. The Company also has adopted a policy to allow the forward sale of forecast silver and gold deliveries provided that such sales shall not extend beyond the end of a financial quarter of the Company.
Hedging involves certain inherent risks including: (a) credit risk - the risk that the creditworthiness of a counterparty may adversely affect its ability to perform its payment and other obligations under its agreement with the Company or adversely affect the financial and other terms the counterparty is able to offer the Company; (b) market liquidity risk – the risk that the Company has entered into a hedging position that cannot be closed out quickly, by either liquidating such hedging instrument or by establishing an offsetting position; (c) unrealized fair value adjustment risk – the risk that, in respect of certain hedging products, an adverse change in market prices for commodities, currencies or interest rates will result in the Company incurring losses in respect of such hedging products being out of the money on their settlement dates.
There is no assurance that a hedging program designed to reduce the risks associated with currency and interest rate fluctuations will be successful. In the case of a silver and gold forward sales program, if the metal price rises above the price at which future production has been committed under a forward sales hedge program, the Company may have an opportunity loss. However, if the metal price falls below that committed price, revenues will be protected to the extent of such committed production. There can be no assurance that the Company will be able to achieve future realized prices for silver and gold that exceed the spot price as a result of any forward sales hedge program.
Competition
The Company competes with other companies for precious metal purchase agreements and similar transactions. Some of these companies may possess greater financial and technical resources than the Company. Such competition may result in the Company being unable to enter into desirable precious metal purchase agreements or similar transactions, to recruit or retain qualified employees or to acquire the capital necessary to fund its precious metal purchase agreements. Existing or future competition in the mining industry could materially adversely affect the Company’s prospects for entering into additional precious metal purchase agreements in the future.
Acquisition Strategy
As part of the Company’s business strategy, it has sought and will continue to seek new exploration, development and mining opportunities in the resource industry. In pursuit of such opportunities, the Company may fail to select appropriate acquisition candidates or negotiate acceptable arrangements, including arrangements to finance acquisitions or integrate the acquired businesses and their personnel into the Company. The Company cannot assure that it can complete any acquisition or business arrangement that it pursues, or is pursuing, on favourable terms, or that any acquisitions or business arrangements completed will ultimately benefit the Company.
In the event that the Company chooses to raise debt capital to finance any acquisition, the Company’s leverage will be increased. In addition, if the Company chooses to complete an equity financing to finance any acquisition, shareholders may suffer dilution.
In addition, the introduction of new tax laws or regulations or accounting rules or policies or rating agency policies, or changes to, or differing interpretations of, or application of, existing tax laws or regulations or accounting rules or policies or rating agency policies, could make precious metal purchase agreements less attractive to counterparties. Such changes could adversely affect the Company's ability to enter into new precious metal purchase agreements.
Market Price of the Common Shares
The common shares are listed and posted for trading on the Toronto Stock Exchange and on the New York Stock Exchange. An investment in the Company’s securities is highly speculative. Securities of companies involved in the resource industry have experienced substantial volatility in the past, often based on factors unrelated to the financial performance or prospects of the companies involved. The price of the common shares are also likely to be significantly affected by short-term changes in silver and gold prices, the Company’s financial condition or results of operations as reflected in its quarterly earnings reports, currency exchange fluctuations and the other risk factors identified herein.
SILVER WHEATON 2013 ANNUAL REPORT [50]
Equity Price Risk
The Company is exposed to equity price risk as a result of holding long-term investments in other exploration and mining companies. Just as investing in the Company is inherent with risks such as those set out in this MD&A, by investing in these other companies, the Company is exposed to the risks associated with owning equity securities and those risks inherent in the investee companies. The Company does not actively trade these investments.
Dividend Policy
The declaration, timing, amount and payment of dividends is at the discretion of the Board of Directors. There can be no assurance that the Company will continue to declare a dividend on a quarterly, annual or other basis.
Dependence Upon Key Management Personnel
The Company is dependent on the services of a small number of key executives who are highly skilled and experienced. The loss of these employees or the Company’s inability to attract and retain additional highly skilled employees may adversely affect its business and future operations.
Litigation
The Company is from time to time involved in various claims, legal proceedings and disputes arising in the ordinary course of business. If the Company is unable to resolve these disputes favorably, it may have a material adverse impact on the Company’s financial performance, cash flow or results of operations.
Other Risks
Critical Accounting Estimates
The preparation of financial statements in conformity with IFRS requires management to make estimates and assumptions that affect the reported amount of assets and liabilities and disclosure of contingent liabilities at the date of the financial statements, and the reported amounts of revenues and expenditures during the reporting period. Note 2 of the Company’s consolidated financial statements describes all of the significant accounting policies.
Silver and Gold Interests
Attributable Reserve and Resource Estimates
Silver and gold interests are significant assets of the Company, with a carrying value of $4.2 billion at December 31, 2013. This amount represents the capitalized expenditures related to the acquisition of the silver and gold interests, net of accumulated depletion. The Company estimates the reserves and resources relating to each agreement. Reserves are estimates of the amount of silver or gold that can be economically and legally extracted from the mining properties at which the Company has precious metal purchase agreements, adjusted where applicable to reflect the Company’s percentage entitlement to silver and gold produced from such mines. The Company estimates its reserves and resources based on information compiled by appropriately qualified persons relating to the geological data on the size, depth and shape of the ore body, and require complex geological judgments to interpret the data. The estimation of recoverable reserves is based upon factors such as estimates of foreign exchange rates, commodity prices, future capital requirements, and production costs along with geological assumptions and judgments made in estimating the size and grade of the ore body. Changes in the reserve or resource estimates may impact upon the carrying value of the Company’s silver and gold interests and depletion charges.
Depletion
As described above, the cost of these silver and gold interests is separately allocated to reserves, resources and exploration potential. The value allocated to reserves is classified as depletable and is depleted on a unit-of-sale basis over the estimated recoverable proven and probable reserves at the mine corresponding to the specific agreement. The value associated with resources and exploration potential is the value beyond proven and probable reserves at acquisition and is classified as non-depletable until such time as it is transferred to the depletable category as a result of the conversion of resources and / or exploration potential into reserves. These calculations require the use of estimates and assumptions, including the amount of recoverable reserves. Changes in the estimated recoverable reserves, resources or exploration potential will directly impact the depletion rate used. Changes to depletion rates are accounted for prospectively.
SILVER WHEATON 2013 ANNUAL REPORT [51]
Impairment of Assets
Management considers each precious metal purchase agreement to be a separate cash generating unit, which is the lowest level for which cash inflows are largely independent of those of other assets. At the end of each reporting period, the Company assesses each precious metal purchase agreement to determine whether any indication of impairment exists. If such an indication exists, the recoverable amount of the precious metal purchase agreement is estimated in order to determine the extent of the impairment (if any). The recoverable amount of each precious metal purchase agreement is the higher of fair value less costs to sell (“Fair Value Approach”) and value in use (“Value-In-Use Approach”).
Under the Fair Value Approach, the net asset value (“NAV”) methodology is used to determine the fair value that could be received from each precious metal purchase agreement in an arm’s length transaction at the measurement date. NAV is estimated by using an appropriate discount rate to calculate the present value of expected future cash flows associated with each mineral category. The discount rates used across the portfolio of precious metal purchase agreements range from 5% to 12%. The values are adjusted for each mineral category dependent on the likelihood of conversion from resources to reserves. A market multiple is applied to the NAV computed in order to assess the estimated fair value. Silver and precious metals companies typically trade at a market capitalization that is based on a multiple of their underlying NAV. Consequently, a market participant would generally apply a NAV multiple when estimating the fair value of a silver and gold interest.
Under the Value-In-Use Approach, the net present value (“NPV”) methodology is used. NPV is estimated by using a nominal discount rate to calculate the present value of expected future cash flows. The nominal discount rate is based on the Company’s weighted average cost of capital, adjusted for any differences assessed in the risk profile associated with the relevant precious metal purchase agreement relative to the risk profile associated with the overall portfolio of precious metal purchase agreements. The nominal discount rates used across the portfolio of precious metal purchase agreements range from 5% to 19%.
The expected future cash flows are management’s best estimates of expected future revenues and costs. Under each method, expected future revenues reflect an estimate of future production for each mine at which the Company has a precious metal purchase agreement based on detailed life of mine plans received from each of the partners. Expected future revenues also reflect management’s estimated long-term metal prices. Under the Fair Value Approach, silver and gold prices used range from $20 to $21 and $1,250 to $1,300, respectively. Under the Value-In-Use Approach, nominal silver and gold prices of $20 and $1,250 are used for the current year, with a 2% inflationary factor thereafter. Estimated future cash costs are fixed based on the terms of each precious metal purchase agreement, as disclosed in Note 21 to the financial statements.
If the carrying amount of the asset exceeds its recoverable amount, the asset is considered impaired and an impairment charge is reflected as a component of net earnings so as to reduce the carrying amount to its recoverable value. A previously recognized impairment charge is reversed only if there has been a change in the estimates used to determine the asset’s recoverable amount since the last impairment charge was recognized. If this is the case, the carrying amount of the asset is increased to its recoverable amount. The increased amount cannot exceed the carrying amount that would have been determined, net of depletion, had no impairment charge been recognized for the asset in prior years. Such reversal is reflected as a component of net earnings.
No impairment charge was required at December 31, 2013 and December 31, 2012
As part of the annual review of the recoverable amounts, the Company performs a sensitivity analysis on silver and gold prices, which are key assumptions that impact the impairment calculations. Assuming a negative 10% change relative to current silver and gold price assumptions, while holding all other assumptions constant, no impairment charge was required at December 31, 2013.
Valuation of Stock Based Compensation
The Company has various forms of stock based compensation, including share purchase options, restricted share units (“RSUs”) and performance share units (“PSUs”). The calculation of the fair value of share purchase options, RSUs and PSUs issued requires the use of estimates as more fully described below.
The Company recognizes a stock based compensation expense for all share purchase options and RSUs awarded to employees, officers and directors based on the fair values of the share purchase options and RSUs at the date of grant. The fair values of share purchase options and RSUs at the date of grant are expensed over the vesting periods of the share purchase options and RSUs, respectively, with a corresponding increase to equity. The fair value of share purchase options is determined using the Black-Scholes option pricing model with market related inputs as of the date of grant. Share purchase options with graded vesting schedules are accounted for as separate grants with different vesting periods and fair values. The fair value of RSUs is the market value of the underlying shares at the date of grant.
SILVER WHEATON 2013 ANNUAL REPORT [52]
At the end of each reporting period, the Company re-assesses its estimates of the number of awards that are expected to vest and recognizes the impact of any revisions to this estimate in the consolidated statement of earnings.
The Company recognizes a stock based compensation expense for PSUs which are awarded to eligible employees and are settled in cash. The related expense is based on the value of the anticipated settlement and multiplier for current performance at the end of the associated performance periods. This estimated expense is reflected as a component of net earnings over the vesting period of the PSUs with the related obligation recorded as a liability on the balance sheet. The amount of compensation expense is adjusted at the end of each reporting period to reflect the fair market value of common shares and the number of PSUs anticipated to vest based on the anticipated performance factor.
Revenue Recognition
Revenue from the sale of silver and gold is recognized in the accounts when persuasive evidence of an arrangement exists, title and risk passes to the buyer, collection is reasonably assured and the price is reasonably determinable. Selling prices are determined at the point revenue is recognized by reference to active and freely traded commodity markets, for example the London Bullion Market for commodities, in an identical form to the product sold.
Where the Company acquires silver or gold in concentrate form, final silver or gold prices are set on a specified future quotational period (the “Quotational Period”) pursuant to the concentrate sales contracts with third-party smelters, typically one to three months after the shipment date, based on market prices for silver or gold. Revenues and the associated cost of sales are recorded on a gross basis under these contracts at the time title passes to the buyer based on the forward price for the expected settlement period. The contracts, in general, provide for a provisional payment of 90% of the estimated value of the silver and/or gold sold under the concentrate sales contract based upon provisional assays and quoted silver and gold prices, with the 10% holdback being payable upon final settlement, which is based upon the average applicable price for the Quotational Period applied to the actual number of silver or gold ounces recovered calculated using confirmed smelter weights and settlement assays. This 10% holdback is reflected as a component of Accounts Receivable in the Company’s consolidated balance sheet. Final settlement generally occurs from three to six months after shipment. The Company’s provisionally priced sales contain an embedded derivative that is required to be separated from the host contract for accounting purposes. The host contract is the receivable from the sale of concentrates measured at the forward price at the time of sale. The embedded derivative does not qualify for hedge accounting. The embedded derivative is recorded on the balance sheet as a derivative asset in Accounts Receivable or as a derivative liability in Accounts Payable and Accrued Liabilities and is adjusted to fair value through revenue each period until the date of final settlement.
At December 31, 2013, the Company had outstanding provisionally priced sales of $6.6 million (December 31, 2012 - $12.7 million) where the quotational period pricing was estimated based on the forward price for silver. These sales consisted of 0.3 million ounces of silver (December 31, 2012 - 0.4 million ounces of silver) which had a fair value gain adjustment of approximately $0.2 million (December 31, 2012 - fair value loss adjustment of $1.1 million) associated with the embedded derivative. For each one cent per ounce increase or decrease in the realized silver price, revenue would increase or decrease by approximately $3,400 (December 31, 2012 - $3,800).
Financial Instruments
In order to mitigate the effect of short-term volatility in silver and gold prices, the Company will occasionally enter into forward contracts in relation to silver and gold deliveries that it is highly confident will occur within a given quarter. The Company does not hedge its long-term exposure to commodity prices. Other than these very short-term forward contracts, the Company has not used derivative financial instruments to manage the risks associated with its operations and therefore, in the normal course of business, it is inherently exposed to currency, interest rate and commodity price fluctuations. No forward contracts were outstanding at December 31, 2013 and December 31, 2012.
The Company owns equity interests in several publicly traded mineral exploration, development and mining companies as long-term investments and therefore is inherently exposed to various risk factors including currency risk, market price risk and liquidity risk.
SILVER WHEATON 2013 ANNUAL REPORT [53]
Changes in Accounting Policies
IAS 1 - Presentation of Financial Statements (amended 2011)
In June 2011, the International Accounting Standards Board (“IASB”) issued amendments to IAS 1 - Presentation of Financial Statements (“IAS 1”) that require an entity to group items presented in the statement of other comprehensive income on the basis of whether they may be reclassified to profit or loss subsequent to initial recognition. For those items presented before tax, the amendments to IAS 1 also require that the tax related to the two separate groups be presented separately. The adoption of this amended standard did not result in a material impact on the Company’s consolidated financial statements.
IFRS 10 - Consolidated Financial Statements (“IFRS 10”)
In May 2011, the IASB issued IFRS 10 - Consolidated Financial Statements to replace IAS 27 - Consolidated and Separate Financial Statements and SIC 12 - Consolidation – Special Purpose Entities. The new consolidation standard changes the definition of control so that the same criteria apply to all entities, both operating and special purpose entities, to determine control. The revised definition focuses on the need to have both power over the investee to direct relevant activities and exposure to variable returns before control is present. The adoption of this new standard did not result in a material impact on the Company’s consolidated financial statements.
IFRS 11 - Joint Arrangements (“IFRS 11”)
In May 2011, the IASB issued IFRS 11 - Joint Arrangements to replace IAS 31 - Interests in Joint Ventures. The new standard defines two types of arrangements: Joint Operations and Joint Ventures. Focus is on the rights and obligations of the parties to the joint arrangement, thereby requiring parties to recognize the individual assets and liabilities to which they have rights or for which they are responsible, even if the joint arrangement operates in a separate legal entity. The adoption of this new standard did not result in a material impact on the Company’s consolidated financial statements.
IFRS 12 - Disclosure of Interests in Other Entities (“IFRS 12”)
In May 2011, the IASB issued IFRS 12 - Disclosure of Interests in Other Entities to create a comprehensive disclosure standard to address the requirements for subsidiaries, joint arrangements and associates and the reporting entity’s involvement with other entities. It also includes the requirements for unconsolidated structured entities (i.e. special purpose entities). The adoption of this new standard did not result in a material impact on the Company’s consolidated financial statements.
IFRS 13 - Fair Value Measurement
In May 2011, the IASB issued IFRS 13 - Fair Value Measurement as a single source of guidance for all fair value measurements required by IFRS to reduce the complexity and improve consistency across its application. The standard provides a definition of fair value and guidance on how to measure fair value as well as a requirement for enhanced disclosures. The adoption of this new standard did not result in a material impact on the Company’s consolidated financial statements.
Future Changes in Accounting Policies
The IASB has issued the following new or amended standards:
Standards required to be applied for periods beginning on or after January 1, 2014:
| · | IAS 32 – Financial Instruments: Presentation (amended 2011) |
Standards required with effective date to be determined:
| · | IFRS 9 (2013) – Financial Instruments (amended 2013): The IASB recently suspended the originally planned effective date of January 1, 2015 and at present the effective date has not been determined. |
The Company adopted IFRS 9 (2009) – Financial Instruments effective January 1, 2010. Early adoption of the above standards is permitted.
Based upon its current facts and circumstances, the Company does not expect to be materially affected by the application of these new standards.
SILVER WHEATON 2013 ANNUAL REPORT [54]
Subsequent Events
Declaration of Dividend
On March 20, 2014, the Board of Directors declared a dividend in the amount of $0.07 per common share as per the Company’s stated dividend policy whereby the quarterly dividend will be equal to 20% of the average of the previous four quarters operating cash flow. This dividend is payable to shareholders of record on April 4, 2014 and is expected to be distributed on or about April 15, 2014.
Dividend Reinvestment Plan
On March 20, 2014, the Company announced that it will be implementing a dividend reinvestment plan whereby shareholders can elect to have dividends reinvested directly into additional Silver Wheaton common shares. It is intended that the plan will be effective commencing with the second dividend of 2014 which will be paid after the announcement of the First Quarter 2014 Earnings Results. The plan remains subject to regulatory approval.
Controls and Procedures
Disclosure Controls and Procedures
Silver Wheaton’s management, with the participation of its Chief Executive Officer and Chief Financial Officer, has evaluated the design and effectiveness of Silver Wheaton’s disclosure controls and procedures, as defined in the rules of the U.S. Securities and Exchange Commission and Canadian Securities Administrators, as of December 31, 2013. Based on that evaluation, the Company’s Chief Executive Officer and Chief Financial Officer have concluded that Silver Wheaton’s disclosure controls and procedures were effective at the reasonable assurance level as of December 31, 2013.
Internal Control Over Financial Reporting
The Company’s management, with the participation of its Chief Executive Officer and Chief Financial Officer, are responsible for establishing and maintaining adequate internal control over financial reporting. Under the supervision of the Chief Financial Officer, the Company’s internal control over financial reporting is a process designed to provide reasonable assurance regarding the reliability of financial reporting and the preparation of financial statements for external purposes in accordance with IFRS. The Company’s controls include policies and procedures that:
| · | pertain to the maintenance of records that, in reasonable detail, accurately and fairly reflect the transactions and dispositions of the assets of the Company; |
· | provide reasonable assurance that transactions are recorded as necessary to permit preparation of financial statements in accordance with IFRS, and that receipts and expenditures of the Company are being made only in accordance with authorizations of the Company’s management and directors; and, |
| · | provide reasonable assurance regarding prevention or timely detection of unauthorized acquisition, use or disposition of the Company’s assets that could have a material effect on the annual financial statements or interim financial statements. |
There have been no changes in the Company’s internal control over financial reporting during the year ended December 31, 2013 that would materially affect, or is reasonably likely to materially affect, the Company’s internal control over financial reporting.
The Company’s management, including its Chief Executive Officer and Chief Financial Officer, has evaluated the effectiveness of the Company’s internal control over financial reporting using the framework and criteria established in Internal Control – Integrated Framework (1992), issued by the Committee of Sponsoring Organizations of the Treadway Commission. Based on this evaluation, management has concluded that the internal control over financial reporting was effective at the reasonable assurance level as of December 31, 2013.
SILVER WHEATON 2013 ANNUAL REPORT [55]
Limitation of Controls and Procedures
The Company’s management, including its Chief Executive Officer and Chief Financial Officer, believe that any disclosure controls and procedures or internal control over financial reporting, no matter how well conceived and operated, can provide only reasonable, not absolute, assurance that the objectives of the control system are met. Further, the design of a control system must reflect the fact that there are resource constraints, and the benefits of controls must be considered relative to their costs. Because of the inherent limitations in all control systems, they cannot provide absolute assurance that all control issues and instances of fraud, if any, within the Company have been prevented or detected. These inherent limitations include the realities that judgments in decision-making can be faulty, and that breakdowns can occur because of simple error or mistake. Additionally, controls can be circumvented by the individual acts of some persons, by collusion of two or more people, or by unauthorized override of the controls. The design of any system of controls also is based in part upon certain assumptions about the likelihood of future events, and there can be no assurance that any design will succeed in achieving its stated goals under all potential future conditions. Accordingly, because of the inherent limitations in a cost effective control system, misstatements due to error or fraud may occur and not be detected.
SILVER WHEATON 2013 ANNUAL REPORT [56]
Attributable Reserves and Resources (1)
The following tables set forth the estimated Mineral Reserves and Mineral Resources (silver and/or gold only) for the mines relating to which the Company has purchase agreements, adjusted where applicable to reflect the Company’s percentage entitlement to silver and/or gold produced from such mines, as of December 31, 2013, unless otherwise noted. The tables are based on information available to the Company as of the date of this document, and therefore will not reflect updates, if any, after such date. The most current Mineral Reserves and Mineral Resources will be available on the Company’s website.
Attributable Proven and Probable Reserves (1,2,3,8,18)
As of December 31, 2013 unless otherwise noted (6)
| Proven | Probable | Proven & Probable | ||||||||
| Tonnage | Grade | Contained | Tonnage | Grade | Contained | Tonnage | Grade | Contained | Process Recovery % (7) | |
| Mt | g/t | Moz | Mt | g/t | Moz | Mt | g/t | Moz | ||
Silver | ||||||||||
Peñasquito (25%) (14) | ||||||||||
| Mill | 83.8 | 34.7 | 93.4 | 48.7 | 24.7 | 38.7 | 132.5 | 31.0 | 132.1 | 53-65% |
| Heap Leach | 10.5 | 32.7 | 11.0 | 10.4 | 24.6 | 8.2 | 20.9 | 28.7 | 19.2 | 22-28% |
San Dimas (10, 14) | 0.9 | 345.2 | 10.3 | 4.0 | 307.3 | 39.2 | 4.9 | 314.5 | 49.5 | 94% |
Pascua-Lama (25%) (14) | 8.0 | 69.8 | 17.9 | 73.2 | 64.1 | 150.8 | 81.2 | 64.7 | 168.7 | 82% |
Lagunas Norte (11) | 9.8 | 3.8 | 1.2 | 52.1 | 3.8 | 6.4 | 61.9 | 3.8 | 7.6 | 19% |
Veladero (11) | 7.3 | 14.3 | 3.4 | 92.0 | 14.3 | 42.2 | 99.4 | 14.3 | 45.6 | 6% |
Yauliyacu (11, 12) | 1.1 | 106.0 | 3.6 | 3.3 | 110.0 | 11.7 | 4.4 | 109.0 | 15.3 | 85% |
777 (13, 14) | 5.0 | 27.3 | 4.4 | 6.4 | 28.5 | 5.9 | 11.4 | 28.0 | 10.3 | 64% |
| Neves-Corvo | ||||||||||
| Copper | 5.8 | 41.0 | 7.7 | 21.2 | 36.0 | 24.5 | 27.0 | 37.1 | 32.2 | 35% |
| Zinc | 10.7 | 74.0 | 25.5 | 12.6 | 67.0 | 27.1 | 23.3 | 70.2 | 52.6 | 20% |
Rosemont (15) | 279.5 | 4.1 | 37.0 | 325.8 | 4.1 | 43.1 | 605.3 | 4.1 | 80.1 | 76% |
| Constancia | 359.0 | 3.3 | 38.3 | 91.0 | 3.6 | 10.6 | 450.0 | 3.4 | 48.9 | 71% |
Mineral Park (15) | 189.5 | 2.8 | 16.9 | 145.2 | 3.0 | 14.0 | 334.7 | 2.9 | 30.9 | 49% |
| Zinkgruvan | ||||||||||
| Zinc | 8.5 | 86.0 | 23.5 | 3.3 | 51.0 | 5.4 | 11.8 | 76.2 | 28.9 | 87% |
| Copper | 3.8 | 31.0 | 3.8 | 0.1 | 35.0 | 0.1 | 3.9 | 31.1 | 3.9 | 78% |
| Aljustrel | ||||||||||
| Copper | 2.2 | 19.2 | 1.3 | 8.4 | 15.3 | 4.1 | 10.6 | 16.1 | 5.5 | 25% |
| Campo Morado (75%) | 0.8 | 158.2 | 4.0 | 0.2 | 133.3 | 0.6 | 0.9 | 154.3 | 4.7 | 45% |
| Stratoni | 0.8 | 172.0 | 4.2 | 0.4 | 176.0 | 2.1 | 1.1 | 173.3 | 6.3 | 84% |
| Minto | 6.0 | 5.1 | 1.0 | 7.0 | 5.2 | 1.2 | 13.0 | 5.1 | 2.2 | 78% |
Cozamin (11) | ||||||||||
| Copper | 1.8 | 61.3 | 3.6 | 3.2 | 45.4 | 4.6 | 5.0 | 51.2 | 8.2 | 72% |
| Los Filos | 67.2 | 5.6 | 12.2 | 243.2 | 5.4 | 42.3 | 310.4 | 5.5 | 54.5 | 5% |
Total Silver | 324.1 | 482.9 | 807.0 | |||||||
Gold | ||||||||||
Salobo (25%) (16) | 160.4 | 0.41 | 2.12 | 123.7 | 0.32 | 1.27 | 284.1 | 0.37 | 3.39 | 66% |
Sudbury (70%) (11) | 37.2 | 0.36 | 0.43 | 25.8 | 0.36 | 0.30 | 63.0 | 0.36 | 0.72 | 81% |
777 (13, 14) | 3.7 | 1.89 | 0.23 | 4.9 | 1.89 | 0.30 | 8.6 | 1.89 | 0.52 | 73% |
| Constancia (50%) | 179.5 | 0.05 | 0.29 | 45.5 | 0.13 | 0.19 | 225.0 | 0.07 | 0.49 | 61% |
| Minto | 6.0 | 0.66 | 0.13 | 7.0 | 0.54 | 0.12 | 13.0 | 0.60 | 0.25 | 74% |
Toroparu (10%) (17) | 3.0 | 1.10 | 0.10 | 9.7 | 0.98 | 0.31 | 12.7 | 1.01 | 0.41 | 89% |
Total Gold | 3.30 | 2.49 | 5.79 | |||||||
SILVER WHEATON 2013 ANNUAL REPORT [57]
Attributable Measured & Indicated Resources (1,2,3,4,5,9,18)
As of December 31, 2013 unless otherwise noted (6)
| Measured | Indicated | Measured & Indicated | |||||||
| Tonnage | Grade | Contained | Tonnage | Grade | Contained | Tonnage | Grade | Contained | |
| Mt | g/t | Moz | Mt | g/t | Moz | Mt | g/t | Moz | |
Silver | |||||||||
Peñasquito (25%) (14) | |||||||||
| Mill | 8.1 | 23.5 | 6.1 | 62.1 | 30.8 | 61.5 | 70.2 | 30.0 | 67.6 |
| Heap Leach | 0.1 | 11.1 | 0.02 | 1.0 | 15.8 | 0.5 | 1.0 | 15.6 | 0.5 |
Pascua-Lama (25%) (14) | 3.7 | 26.4 | 3.1 | 35.7 | 22.3 | 25.5 | 39.4 | 22.7 | 28.7 |
Yauliyacu (11, 12) | 0.7 | 120.4 | 2.6 | 5.4 | 228.5 | 39.6 | 6.1 | 216.5 | 42.2 |
| Neves-Corvo | |||||||||
| Copper | 4.8 | 49.4 | 7.7 | 24.6 | 52.8 | 41.7 | 29.4 | 52.2 | 49.4 |
| Zinc | 13.3 | 60.5 | 25.9 | 55.3 | 55.3 | 98.3 | 68.6 | 56.3 | 124.2 |
Rosemont (15) | 38.5 | 3.0 | 3.7 | 197.7 | 2.7 | 17.1 | 236.2 | 2.7 | 20.8 |
| Constancia | 119.3 | 2.3 | 8.6 | 344.1 | 2.0 | 21.9 | 463.3 | 2.0 | 30.5 |
Mineral Park (15) | - | - | - | 539.4 | 2.3 | 40.5 | 539.4 | 2.3 | 40.5 |
| Zinkgruvan | |||||||||
| Zinc | 0.7 | 146.4 | 3.5 | 3.4 | 123.5 | 13.5 | 4.1 | 127.6 | 17.0 |
| Copper | 1.4 | 23.3 | 1.0 | 0.6 | 37.0 | 0.7 | 1.9 | 27.2 | 1.7 |
| Aljustrel | |||||||||
| Zinc | 1.3 | 65.6 | 2.7 | 20.5 | 60.3 | 39.7 | 21.8 | 60.7 | 42.4 |
| Copper | - | - | - | 0.1 | 11.7 | 0.04 | 0.1 | 11.7 | 0.04 |
| Campo Morado (75%) | 5.0 | 128.9 | 20.6 | 2.4 | 123.5 | 9.7 | 7.4 | 127.1 | 30.2 |
| Stratoni | 0.2 | 213.9 | 1.1 | 0.2 | 224.3 | 1.3 | 0.3 | 219.4 | 2.3 |
| Minto | 7.4 | 3.9 | 0.9 | 31.2 | 3.4 | 3.4 | 38.6 | 3.5 | 4.3 |
| Keno Hill (25%) | |||||||||
| Underground | - | - | - | 0.7 | 479.0 | 10.0 | 0.7 | 479.0 | 10.0 |
| Elsa Tailings | - | - | - | 0.6 | 119.0 | 2.4 | 0.6 | 119.0 | 2.4 |
| Los Filos | 9.9 | 11.5 | 3.6 | 71.4 | 7.1 | 16.2 | 81.3 | 7.6 | 19.8 |
| Loma de La Plata (12.5%) | - | - | - | 3.6 | 169.0 | 19.8 | 3.6 | 169.0 | 19.8 |
Total Silver | 91.2 | 463.2 | 554.4 | ||||||
Gold | |||||||||
Salobo (25%) (16) | 12.3 | 0.47 | 0.19 | 48.8 | 0.37 | 0.58 | 61.1 | 0.39 | 0.77 |
Sudbury (70%) (11) | - | - | - | 26.5 | 0.47 | 0.40 | 26.5 | 0.47 | 0.40 |
| Constancia (50%) | 59.6 | 0.04 | 0.07 | 172.0 | 0.03 | 0.19 | 231.7 | 0.03 | 0.26 |
| Minto | 7.4 | 0.44 | 0.10 | 31.2 | 0.32 | 0.32 | 38.6 | 0.34 | 0.42 |
Toroparu (10%) (17) | 0.9 | 0.87 | 0.03 | 7.9 | 0.83 | 0.21 | 8.8 | 0.84 | 0.24 |
Total Gold | 0.39 | 1.70 | 2.09 | ||||||
SILVER WHEATON 2013 ANNUAL REPORT [58]
Attributable Inferred Resources (1,2,3,4,5,9,18)
As of December 31, 2013 unless otherwise noted (6)
| Inferred | |||
| Tonnage | Grade | Contained | |
| Mt | g/t | Moz | |
Silver | |||
Peñasquito (25%) (14) | |||
| Mill | 10.2 | 30.8 | 10.1 |
| Heap Leach | 0.4 | 14.5 | 0.2 |
San Dimas (10, 14) | 7.3 | 309.5 | 73.0 |
Pascua-Lama (25%) (14) | 4.9 | 20.1 | 3.2 |
Yauliyacu (11, 12) | 5.8 | 180.8 | 33.5 |
777 (13, 14) | 0.8 | 31.1 | 0.8 |
| Neves-Corvo | |||
| Copper | 24.7 | 44.7 | 35.5 |
| Zinc | 22.5 | 51.0 | 36.9 |
Rosemont (15) | 104.5 | 3.3 | 11.1 |
| Constancia | 222.9 | 1.9 | 13.4 |
Mineral Park (15) | 362.2 | 2.7 | 31.1 |
| Zinkgruvan | |||
| Zinc | 5.0 | 83.0 | 13.3 |
| Copper | 0.6 | 34.0 | 0.7 |
| Aljustrel | |||
| Zinc | 8.7 | 50.4 | 14.0 |
| Copper | 4.7 | 16.0 | 2.4 |
| Campo Morado (75%) | 1.7 | 128.9 | 7.1 |
| Stratoni | 0.5 | 169.0 | 2.7 |
| Minto | 16.2 | 3.2 | 1.7 |
| Keno Hill (25%) | |||
| Underground | 0.2 | 368.9 | 2.5 |
| Los Filos | 191.7 | 6.0 | 36.8 |
| Loma de La Plata (12.5%) | 0.2 | 76.0 | 0.4 |
Total Silver | 330.2 | ||
Gold | |||
Salobo (25%) (16) | 37.0 | 0.31 | 0.37 |
Sudbury (70%) (11) | 12.6 | 0.47 | 0.19 |
777 (13, 14) | 0.4 | 1.75 | 0.02 |
| Constancia (50%) | 111.5 | 0.03 | 0.13 |
| Minto | 16.2 | 0.34 | 0.18 |
Toroparu (10%) (17) | 13.0 | 0.74 | 0.31 |
Total Gold | 1.19 | ||
SILVER WHEATON 2013 ANNUAL REPORT [59]
Notes:
| 1. | All Mineral Reserves and Mineral Resources have been calculated in accordance with the CIM Standards and NI 43-101, or the AusIMM JORC equivalent. |
| 2. | Mineral Reserves and Mineral Resources are reported above in millions of metric tonnes (“Mt”), grams per metric tonne (“g/t”) and millions of ounces (“Moz”). |
| 3. | Individual qualified persons (“QPs”), as defined by the NI 43-101, for the technical information contained in this document (including the Mineral Reserve and Mineral Resource estimates) for the following operations are as follows: |
| a. | Salobo – Christopher Jacobs, CEng MIMMM (Vice President and Mining Economist), James Turner, CEng MIMMM (Senior Mineral Process Engineer), Barnard Foo, M.Eng., P. Eng., MBA (Senior Mining Engineer) and Jason Ché Osmond, FGS, C.Geol, EurGeol (Senior Geologist) all of whom are employees of Micon International Ltd. |
| b. | All other operations and development projects: the Company’s QPs Neil Burns, M.Sc., P.Geo. (Vice President, Technical Services); Samuel Mah, M.A.Sc., P.Eng. (Senior Director, Project Evaluations), both employees of the Company (the “Company’s QPs”). |
| 4. | The Mineral Resources reported in the above tables are exclusive of Mineral Reserves. The Minto, Campo Morado, Mineral Park, Neves-Corvo, Zinkgruvan and Aljustrel mines report Mineral Resources inclusive of Mineral Reserves. The Company’s QPs have made the exclusive Mineral Resource estimates for these mines based on average mine recoveries and dilution. |
| 5. | Mineral Resources which are not Mineral Reserves do not have demonstrated economic viability. |
| 6. | Other than as detailed below, Mineral Reserves and Mineral Resources are reported as of December 31, 2013 based on information available to the Company as of the date of this document, and therefore will not reflect updates, if any, after such date. |
| a. | Resources and Reserves for 777, Sudbury, Cozamin, Minto and Campo Morado’s G-9 are reported as of December 31, 2012. |
| b. | Resources and Reserves for Toroparu are reported as of March 31, 2013. |
| c. | Resources and Reserves for Neves-Corvo and Zinkgruvan are reported as of June 30, 2013. |
| d. | Resources and Reserves for Mineral Park are reported as of June 1, 2013. |
| e. | Resources and Reserves for Rosemont are reported as of August 28, 2012. |
| f. | Resources for the Constancia and Pampacancha deposits are reported as of August 23, 2011 and April 2, 2012, respectively. Reserves for both Constancia and Pampacancha deposits are reported as of August 8, 2012. |
| g. | Resources and Reserves for Aljustrel’s Feitais and Moinho deposits are reported as of November 30, 2010, Resources for the Estaçao deposit are reported as of December 31, 2007. |
| h. | Resources for Campo Morado’s El Largo, El Rey, Naranjo and Reforma deposits are reported as of October 13, 2005. |
| i. | Resources for Keno Hill’s Elsa Tailings are reported as of April 22, 2010, Lucky Queen and Onek deposits as of July 27, 2011, Bermingham as of June 27, 2012, Flame and Moth as of January 30, 2013, Bellekeno Inferred Resources as of May 31, 2012 and Bellekeno Indicated Resources as of September 30, 2013. |
| j. | Resources for Loma de La Plata are reported as of May 20, 2009. |
| 7. | Process recoveries are the average percentage of silver or gold in a saleable product (doré or concentrate) recovered from mined ore at the applicable site process plants as reported by the operators. |
| 8. | Mineral Reserves are estimated using appropriate process recovery rates and the following commodity prices: |
| a. | Peñasquito $1,300 per ounce gold, $22 per ounce silver, $3.00 per pound copper, $0.90 per pound lead and $0.90 per pound zinc. |
| b. | San Dimas - 2.7 grams per tonne Au equivalent cut-off assuming $1,250 per ounce gold and $20.00 per ounce silver. |
| c. | Pascua-Lama, Lagunas Norte and Veladero - $1,100 per ounce gold, $21.00 per ounce silver and $3.00 per pound copper. |
| d. | Yauliyacu - $22.00 per ounce silver, $3.27 per pound copper, $0.98 per pound lead and $0.91 per pound zinc. |
| e. | 777 – $1,250 per ounce gold, $25.00 per ounce silver, $2.75 per pound copper and $1.01 per pound zinc. |
| f. | Neves-Corvo – 1.6% Cu cut-off for the copper Reserve and 4.8% Zn cut-off for all the zinc Reserves. |
| g. | Rosemont - $4.90 per ton NSR cut-off assuming $20.00 per ounce silver, $2.50 per pound copper and $15.00 per pound molybdenum. |
| h. | Constancia - $1,150 per ounce gold, $23.00 per ounce silver, $2.75 per pound copper and $14.00 per pound molybdenum. |
| i. | Mineral Park – 0.21% Cu equivalent cut-off assuming $3.90 per ounce silver, $2.60 per pound copper and $9.95 per pound molybdenum. |
| j. | Zinkgruvan – 3.8% Zn equivalent cut-off for the zinc Reserve assuming $2.50 per pound copper and $1.00 per pound lead and zinc and 1.5% Cu cut-off for the copper Reserve. |
| k. | Aljustrel – 1.5% Cu cut-off for all copper Reserves, 4.5% Zn cut-off for all zinc Reserves. |
| l. | Campo Morado - $18.92 per ounce silver for the G-9 zones. |
| m. | Stratoni – 16.85% Zn equivalent assuming $1,250 per ounce gold, $16.50 per ounce silver, $3.00 per pound copper, $0.95 per pound lead and $0.86 per pound zinc. |
| n. | Minto – 0.5% Cu cut-off for Open Pit and $64.4 per tonne NSR cut-off for Underground assuming $300 per ounce gold, $3.90 per ounce silver and $2.50 per pound copper. |
| o. | Cozamin - $40 per tonne NSR cut-off assuming $20.00 per ounce silver, $2.50 per pound copper, $0.85 per pound lead and $0.80 per pound zinc. |
| p. | Los Filos - $1,300 per ounce gold and $22.00 per ounce silver. |
| q. | Salobo – 0.249% Cu equivalent cut-off assuming $1,200 per ounce gold and $3.45 per pound copper. |
| r. | Sudbury - $1,150 per ounce gold, $9.41 per pound nickel, $3.67 per pound copper, $1,650 per ounce platinum, $703 per ounce palladium and $15.66 per pound cobalt. |
| s. | Toroparu - $1,070 per ounce gold for fresh rock and $970 per ounce gold for saprolite. |
| 9. | Mineral Resources are estimated using appropriate recovery rates and the following commodity prices: |
| a. | Peñasquito - $1,500 per ounce gold, $24.00 per ounce silver, $3.50 per pound copper, $1.00 per pound lead and $1.00 per pound zinc. |
| b. | San Dimas – 0.2 grams per tonne Au equivalent assuming $1,300 per ounce gold and $20.00 per ounce silver. |
SILVER WHEATON 2013 ANNUAL REPORT [60]
| c. | Pascua-Lama – $1,500 per ounce gold, $24.00 per ounce silver and $3.50 per pound copper. |
| d. | Yauliyacu – $22.00 per ounce silver, $3.27 per pound copper, $0.98 per pound lead and $0.91 per pound zinc. |
| e. | 777 – $1,250 per ounce gold, $25.00 per ounce silver, $2.75 per pound copper and $1.01 per pound zinc. |
| f. | Neves-Corvo – 1.0% Cu cut-off for the copper Resource and 3.0% Zn cut-off for the zinc Resource. |
| g. | Rosemont – 0.30% Cu equivalent cut-off for Mixed and 0.15% Cu equivalent for Sulfide assuming $20.00 per ounce silver, $2.50 per pound copper and $15.00 per pound molybdenum. |
| h. | Constancia – 0.12% Cu cut-off for Constancia and 0.20% Cu cut-off for Pampacancha. |
| i. | Mineral Park – 0.126% Cu equivalent cut-off assuming $3.90 per ounce silver, $3.66 per pound copper and $13.65 per pound molybdenum. |
| j. | Zinkgruvan – 3.8% Zn equivalent cut-off for the zinc Resource assuming $2.50 per pound copper and $1.00 per pound lead and zinc and 1.0% Cu cut-off for the copper Resource. |
| k. | Aljustrel – 1.5% Cu cut-off for all copper Resources, 4.5% Zn cut-off for Feitais and Moinho zinc Resources and 4.0% for Estação zinc Resources. |
| l. | Campo Morado – $18.92 per ounce silver for the G-9 zones and 5% Zn cut-off for the El Largo, El Rey, Naranjo and Reforma deposits. |
| m. | Stratoni - $1,250 per ounce gold, $16.50 per ounce silver, $3.00 per pound copper, $0.95 per pound lead and $0.86 per pound zinc. |
| n. | Minto – 0.5% Cu cut-off. |
| o. | Cozamin – $35 per tonne NSR cut-off assuming $20.00 per ounce silver, $2.50 per pound copper, $0.85 per pound lead and $0.80 per pound zinc. |
| p. | Keno Hill |
| i. | Bellekeno and Flame and Moth - $185 per tonne NSR cut-off assuming $1,400 per ounce gold, $22.50 per ounce silver, $0.95 per ounce lead and $0.85 per ounce zinc. |
| ii. | Bermingham - $185 per tonne NSR cut-off assuming $1,350 per ounce gold, $23.00 per ounce silver, $0.95 per pound lead and $0.85 per pound zinc. |
| iii. | Lucky Queen and Onek - $185 per tonne NSR cut-off assuming $1,100 per ounce gold, $18.50 per ounce silver, $0.95 per pound lead and $0.90 per pound zinc. |
| iv. | Elsa Tailings – 50 g/t Ag cut-off. |
| q. | Los Filos - $1,500 per ounce gold and $24.00 per ounce silver. |
| r. | Loma de La Plata – $12.50 per ounce silver and $0.50 per pound lead. |
| s. | Salobo – 0.296% Cu equivalent assuming $1,500 per ounce gold $3.67 per pound copper. |
| t. | Sudbury - $1,150 per ounce gold, $9.41 per pound nickel, $3.67 per pound copper, $1,650 per ounce platinum, $702 per ounce palladium and $15.66 per pound cobalt. |
| u. | Toroparu - $1,350 per ounce gold. |
| 10. | The San Dimas silver purchase agreement provides that from August 6, 2010 until August 5, 2014, Primero Mining Corp. (“Primero”) will deliver to the Company a per annum amount equal to the first 3.5 million ounces of payable silver produced at San Dimas and 50% of any excess, plus the Company will receive an additional 1.5 million ounces of silver per annum to be delivered by Goldcorp Inc. (“Goldcorp”). Beginning August 6, 2014, Primero will deliver to the Company a per annum amount equal to the first 6.0 million ounces of payable silver produced at San Dimas and 50% of any excess, for the life of the mine. |
| 11. | The Company’s attributable Resources and Reserves for Lagunas Norte, Veladero, Cozamin and Yauliyacu silver interests, in addition to the Sudbury and 777 gold interests, have been constrained to the production expected for the various contracts. |
| 12. | The Company’s Yauliyacu silver purchase agreement (March 2006) with Glencore International AG provides for the delivery of up to 4.75 million ounces of silver per year for 20 years. In the event that silver sold and delivered to Silver Wheaton in any year totals less than 4.75 million ounces, the amount sold and delivered to Silver Wheaton in subsequent years will be increased to make up for any cumulative shortfall, to the extent production permits. Depending upon production levels, it is possible that the Company’s current attributable tonnage may not be mined before the agreement expires. |
| 13. | The 777 purchase agreement provides that Hudbay Minerals Inc. (“Hudbay”) will deliver 100% of the payable silver for the life of the mine and 100% of the payable gold until completion of the Constancia project, after which the gold stream will reduce to 50%. The gold figures in this table represent the attributable 777 Resources and Reserves constrained to the production expected for the 777 contract. |
| 14. | The scientific and technical information in this document regarding Peñasquito, San Dimas and Pascua-Lama was sourced by the Company from the following SEDAR (www.sedar.com) filed documents: |
| a. | Peñasquito - Goldcorp amended MD&A on February 14, 2014; |
| b. | San Dimas - Primero news release filed on March 5, 2014; and |
| c. | Pascua-Lama - Barrick Gold Corp. amended MD&A filed on March 6, 2014. |
The Company QP’s have approved the disclosure of scientific and technical information in respect of Peñasquito, San Dimas and Pascua-Lama in this document.
| 15. | The Mineral Park and Rosemont Resources and Reserves do not include the SX/EW leach material since this process does not recover silver. |
| 16. | The Company has filed a technical report for Salobo, which is available on SEDAR at www.sedar.com. |
17. | As more fully described in the Early Deposit Gold Interest section of the MD&A, the Company’s agreement with Sandspring is an early deposit structure whereby the Company will have the option to secure a 10% gold stream on Toroparu following the delivery of a bankable definitive feasibility study. |
| 18. | Silver and gold are produced as by-product metal at all operations with the exception of silver at the Keno Hill mine and Loma de La Plata project and gold at the Toroparu project; therefore, the economic cut-off applied to the reporting of silver and gold Resources and Reserves will be influenced by changes in the commodity prices of other metals at the time. |
Statements made in this section contain forward-looking information. Please see “Cautionary Note Regarding Forward-Looking Statements” for material risks, assumptions and important disclosure associated with this information.
SILVER WHEATON 2013 ANNUAL REPORT [61]
Cautionary Note Regarding Forward-Looking Statements
The information contained herein contains “forward-looking statements” within the meaning of the United States Private Securities Litigation Reform Act of 1995 and “forward-looking information” within the meaning of applicable Canadian securities legislation. Forward-looking statements, which are all statements other than statements of historical fact, include, but are not limited to, statements with respect to the future price of silver or gold, the estimation of mineral reserves and resources, the realization of mineral reserve estimates, the timing and amount of estimated future production, costs of production, reserve determination, reserve conversion rates, statements as to any future dividends, the ability to fund outstanding commitments and continue to acquire accretive precious metal stream interests and assessments of the impact of various legal and tax matters. Generally, these forward-looking statements can be identified by the use of forward-looking terminology such as “plans”, “expects” or “does not expect”, “is expected”, “budget”, “scheduled”, “estimates”, “forecasts”, “intends”, “anticipates” or “does not anticipate”, or “believes”, or variations of such words and phrases or statements that certain actions, events or results “may”, “could”, “would”, “might” or “will be taken”, “occur” or “be achieved”. Forward-looking statements are subject to known and unknown risks, uncertainties and other factors that may cause the actual results, operations, level of activity, performance or achievements of Silver Wheaton to be materially different from those expressed or implied by such forward-looking statements, including but not limited to: fluctuations in the price of silver or gold; the absence of control over mining operations from which Silver Wheaton purchases silver and gold and risks related to these mining operations including risks related to fluctuations in the price of the primary commodities mined at such operations, actual results of mining and exploration activities, environmental, economic and political risks of the jurisdictions in which the mining operations are located and changes in project parameters as plans continue to be refined; differences in the interpretation or application of tax laws and regulations; and the Company’s interpretation of, or compliance with, tax laws, is found to be incorrect; as well as those factors discussed in the section entitled “Description of the Business - Risk Factors” in Silver Wheaton's Annual Information Form available on SEDAR at www.sedar.com and in Silver Wheaton's Form 40-F on file with the U.S. Securities and Exchange Commission in Washington, D.C. Forward-looking statements are based on assumptions management believes to be reasonable, including but not limited to: the continued operation of the mining operations from which Silver Wheaton purchases silver and gold, no material adverse change in the market price of commodities, that the mining operations will operate and the mining projects will be completed in accordance with their public statements and achieve their stated production outcomes, the continuing ability to fund or obtain funding for outstanding commitments, the ability to source and obtain accretive precious metal stream interests, expectations regarding the resolution of legal and tax matters, that the Company will be successful in challenging any reassessment by the CRA and such other assumptions and factors as set out herein. Although Silver Wheaton has attempted to identify important factors that could cause actual results to differ materially from those contained in forward-looking statements, there may be other factors that cause results not to be as anticipated, estimated or intended. There can be no assurance that forward-looking statements will prove to be accurate. Accordingly, readers should not place undue reliance on forward-looking statements and are cautioned that actual outcomes may vary. Silver Wheaton does not undertake to update any forward-looking statements that are included or incorporated by reference herein, except in accordance with applicable securities laws.
Cautionary Language Regarding Reserves And Resources
For further information on Mineral Reserves and Mineral Resources and on Silver Wheaton more generally, readers should refer to Silver Wheaton’s Annual Information Form for the year ended December 31, 2013 and other continuous disclosure documents filed by Silver Wheaton since January 1, 2014, available on SEDAR at www.sedar.com. Silver Wheaton’s Mineral Reserves and Mineral Resources are subject to the qualifications and notes set forth therein. Mineral Resources which are not Mineral Reserves do not have demonstrated economic viability.
Cautionary Note to United States Investors Concerning Estimates of Measured, Indicated and Inferred Resources: The information contained herein uses the terms “Measured”, “Indicated” and “Inferred” Mineral Resources. United States investors are advised that while such terms are recognized and required by Canadian regulations, the United States Securities and Exchange Commission does not recognize them and expressly prohibits U.S. registered companies from including such terms in their filings with the SEC. “Inferred Mineral Resources” have a great amount of uncertainty as to their existence, and as to their economic and legal feasibility. It cannot be assumed that all or any part of an Inferred Mineral Resource will ever be upgraded to a higher category. Under Canadian rules, estimates of Inferred Mineral Resources may not form the basis of feasibility or other economic studies. United States investors are cautioned not to assume that all or any part of Measured or Indicated Mineral Resources will ever be converted into Mineral Reserves. United States investors are also cautioned not to assume that all or any part of an Inferred Mineral Resource exists, or is economically or legally mineable. United States investors are urged to consider closely the disclosure in Silver Wheaton’s Form 40-F, a copy of which may be obtained from Silver Wheaton or from http://www.sec.gov/edgar.shtml.
SILVER WHEATON 2013 ANNUAL REPORT [62]
Management’s Responsibility for Financial Reporting
The accompanying consolidated financial statements of Silver Wheaton Corp. (“Silver Wheaton”) were prepared by management, which is responsible for the integrity and fairness of the information presented, including the many amounts that must of necessity be based on estimates and judgments. These consolidated financial statements were prepared in accordance with International Financial Reporting Standards (“IFRS”) as issued by the International Accounting Standards Board. Financial information appearing throughout our Management’s Discussion and Analysis (“MD&A”) is consistent with these consolidated financial statements.
In discharging our responsibility for the integrity and fairness of the consolidated financial statements and for the accounting systems from which they are derived, we maintain and rely on a comprehensive system of internal controls designed to ensure that transactions are authorized, assets are safeguarded and proper records are maintained. These controls include business planning; delegation of authority; careful selection and hiring of staff; accountability for performance within appropriate and well-defined areas of responsibility; and the communication of policies and guidelines of business conduct throughout the company.
The Board of Directors oversees management’s responsibilities for financial reporting through the Audit Committee, which is composed entirely of directors who are neither officers nor employees of Silver Wheaton. The Audit Committee reviews Silver Wheaton’s interim and annual consolidated financial statements and MD&A and recommends them for approval by the Board of Directors. Other key responsibilities of the Audit Committee include monitoring Silver Wheaton’s system of internal controls, monitoring its compliance with legal and regulatory requirements, selecting the external auditors and reviewing the qualifications, independence and performance of the external auditors.
Deloitte LLP, Independent Registered Public Accounting Firm, appointed by the shareholders of Silver Wheaton upon the recommendation of the Audit Committee and Board, have performed an independent audit of the consolidated financial statements and their report follows. The auditors have full and unrestricted access to the Audit Committee to discuss their audit and related findings.
| /s/ Randy Smallwood | /s/ Gary Brown |
| Randy Smallwood | Gary Brown |
| President & Chief Executive Officer | Senior Vice President & Chief Financial Officer |
March 20, 2014
SILVER WHEATON 2013 ANNUAL REPORT [63]
Report of Independent Registered Public Accounting Firm
To the Board of Directors and Shareholders of Silver Wheaton Corp.
We have audited the accompanying consolidated financial statements of Silver Wheaton Corp. and subsidiaries (the “Company”), which comprise the consolidated balance sheets as at December 31, 2013 and December 31, 2012, and the consolidated statements of earnings, consolidated statements of comprehensive income, consolidated statements of cash flows and consolidated statements of shareholders’ equity for the years then ended, and a summary of significant accounting policies and other explanatory information.
Management's Responsibility for the Consolidated Financial Statements
Management is responsible for the preparation and fair presentation of these consolidated financial statements in accordance with International Financial Reporting Standards as issued by the International Accounting Standards Board, and for such internal control as management determines is necessary to enable the preparation of consolidated financial statements that are free from material misstatement, whether due to fraud or error.
Auditor's Responsibility
Our responsibility is to express an opinion on these consolidated financial statements based on our audits. We conducted our audits in accordance with Canadian generally accepted auditing standards and the standards of the Public Company Accounting Oversight Board (United States). Those standards require that we comply with ethical requirements and plan and perform the audit to obtain reasonable assurance about whether the consolidated financial statements are free from material misstatement.
An audit involves performing procedures to obtain audit evidence about the amounts and disclosures in the consolidated financial statements. The procedures selected depend on the auditor's judgment, including the assessment of the risks of material misstatement of the consolidated financial statements, whether due to fraud or error. In making those risk assessments, the auditor considers internal control relevant to the entity's preparation and fair presentation of the consolidated financial statements in order to design audit procedures that are appropriate in the circumstances. An audit also includes evaluating the appropriateness of accounting policies used and the reasonableness of accounting estimates made by management, as well as evaluating the overall presentation of the consolidated financial statements.
We believe that the audit evidence we have obtained in our audits is sufficient and appropriate to provide a basis for our audit opinion.
Opinion
In our opinion, the consolidated financial statements present fairly, in all material respects, the financial position of Silver Wheaton Corp. and subsidiaries as at December 31, 2013 and December 31, 2012 and their financial performance and their cash flows for the years then ended in accordance with International Financial Reporting Standards as issued by the International Accounting Standards Board.
Other Matter
We have also audited, in accordance with the standards of the Public Company Accounting Oversight Board (United States), the Company’s internal control over financial reporting as of December 31, 2013, based on the criteria established in Internal Control — Integrated Framework (1992) issued by the Committee of Sponsoring Organizations of the Treadway Commission and our report dated March 20, 2014 expressed an unqualified opinion on the Company’s internal control over financial reporting.
/s/ Deloitte LLP
Chartered Accountants
Vancouver, Canada
March 20, 2014
SILVER WHEATON 2013 ANNUAL REPORT [64]
Management’s Report on Internal Control Over Financial Reporting
Management of Silver Wheaton Corp. (“Silver Wheaton”) is responsible for establishing and maintaining adequate internal control over financial reporting. Internal control over financial reporting is a process designed by, or under the supervision of the Chief Executive Officer and the Chief Financial Officer and effected by the Board of Directors, management and other personnel to provide reasonable assurance regarding the reliability of financial reporting and the preparation of financial statements for external purposes in accordance with International Financial Reporting Standards (“IFRS”) as issued by the International Accounting Standards Board. It includes those policies and procedures that:
| i. | pertain to the maintenance of records that accurately and fairly reflect, in reasonable detail, the transactions related to Silver Wheaton’s assets |
| ii. | provide reasonable assurance that transactions are recorded as necessary to permit preparation of financial statements in accordance with IFRS, and Silver Wheaton receipts and expenditures are made only in accordance with authorizations of management and Silver Wheaton’s directors |
| iii. | provide reasonable assurance regarding prevention or timely detection of unauthorized acquisition, use, or disposition of Silver Wheaton’s assets that could have a material effect on Silver Wheaton’s financial statements. |
Due to its inherent limitations, internal control over financial reporting may not prevent or detect misstatements on a timely basis. Also, projections of any evaluation of the effectiveness of internal control over financial reporting to future periods are subject to the risk that the controls may become inadequate because of changes in conditions, or that the degree of compliance with the policies or procedures may deteriorate.
Management assessed the effectiveness of Silver Wheaton’s internal control over financial reporting as of December 31, 2013, based on the criteria set forth in Internal Control — Integrated Framework (1992) issued by the Committee of Sponsoring Organizations of the Treadway Commission (COSO). Based on this assessment, management has concluded that, as of December 31, 2013, Silver Wheaton’s internal control over financial reporting was effective.
The effectiveness of Silver Wheaton’s internal control over financial reporting, as of December 31, 2013, has been audited by Deloitte LLP, Independent Registered Public Accounting Firm, as stated in their report which appears on the following page.
| /s/ Randy Smallwood | /s/ Gary Brown |
| Randy Smallwood | Gary Brown |
| President & Chief Executive Officer | Senior Vice President & Chief Financial Officer |
March 20, 2014
SILVER WHEATON 2013 ANNUAL REPORT [65]
Report of Independent Registered Public Accounting Firm
To the Board of Directors and Shareholders of Silver Wheaton Corp.
We have audited the internal control over financial reporting of Silver Wheaton Corp. and subsidiaries (the “Company”) as of December 31, 2013, based on the criteria established Internal Control—Integrated Framework (1992) issued by the Committee of Sponsoring Organizations of the Treadway Commission. The Company’s management is responsible for maintaining effective internal control over financial reporting and for its assessment of the effectiveness of internal control over financial reporting, included in the accompanying Management’s Report on Internal Control over Financial Reporting. Our responsibility is to express an opinion on the Company’s internal control over financial reporting based on our audit.
We conducted our audit in accordance with the standards of the Public Company Accounting Oversight Board (United States). Those standards require that we plan and perform the audit to obtain reasonable assurance about whether effective internal control over financial reporting was maintained in all material respects. Our audit included obtaining an understanding of internal control over financial reporting, assessing the risk that a material weakness exists, testing and evaluating the design and operating effectiveness of internal control based on the assessed risk, and performing such other procedures as we considered necessary in the circumstances. We believe that our audit provides a reasonable basis for our opinion.
A company’s internal control over financial reporting is a process designed by, or under the supervision of, the company’s principal executive and principal financial officers, or persons performing similar functions, and effected by the company’s board of directors, management, and other personnel to provide reasonable assurance regarding the reliability of financial reporting and the preparation of financial statements for external purposes in accordance with International Financial Reporting Standards as issued by the International Accounting Standards Board. A company’s internal control over financial reporting includes those policies and procedures that (1) pertain to the maintenance of records that, in reasonable detail, accurately and fairly reflect the transactions and dispositions of the assets of the company; (2) provide reasonable assurance that transactions are recorded as necessary to permit preparation of financial statements in accordance with International Financial Reporting Standards as issued by the International Accounting Standards Board, and that receipts and expenditures of the company are being made only in accordance with authorizations of management and directors of the company; and (3) provide reasonable assurance regarding prevention or timely detection of unauthorized acquisition, use, or disposition of the company’s assets that could have a material effect on the financial statements.
Because of the inherent limitations of internal control over financial reporting, including the possibility of collusion or improper management override of controls, material misstatements due to error or fraud may not be prevented or detected on a timely basis. Also, projections of any evaluation of the effectiveness of the internal control over financial reporting to future periods are subject to the risk that the controls may become inadequate because of changes in conditions, or that the degree of compliance with the policies or procedures may deteriorate.
In our opinion, the Company maintained, in all material respects, effective internal control over financial reporting as of December 31, 2013, based on the criteria established in Internal Control — Integrated Framework (1992) issued by the Committee of Sponsoring Organizations of the Treadway Commission.
We have also audited, in accordance with Public Company Accounting Oversight Board (United States), the consolidated financial statements as of and for the year ended December 31, 2013 of the Company and our report dated March 20, 2014 expressed an unqualified opinion on those financial statements.
/s/ Deloitte LLP
Chartered Accountants
Vancouver, Canada
March 20, 2014
SILVER WHEATON 2013 ANNUAL REPORT [66]
Consolidated Statements of Earnings
| Years Ended December 31 | |||||
(US dollars and shares in thousands, except per share amounts) | Note | 2013 | 2012 | ||
Sales | 5 | $ | 706,472 | $ | 849,560 |
Cost of sales | |||||
| Cost of sales, excluding depletion | $ | 139,352 | $ | 117,489 | |
| Depletion | 144,153 | 101,229 | |||
Total cost of sales | $ | 283,505 | $ | 218,718 | |
Earnings from operations | $ | 422,967 | $ | 630,842 | |
Expenses and other income | |||||
General and administrative 1 | 6 | $ | 35,308 | $ | 30,839 |
| Foreign exchange (gain) loss | (348) | 29 | |||
| Interest expense | 12 | 6,083 | - | ||
| Other expense (income) | 7 | 11,550 | (817) | ||
| $ | 52,593 | $ | 30,051 | ||
Earnings before income taxes | $ | 370,374 | $ | 600,791 | |
| Income tax recovery (expense) | 20 | 5,121 | (14,755) | ||
Net earnings | $ | 375,495 | $ | 586,036 | |
| Basic earnings per share | $ | 1.06 | $ | 1.66 | |
| Diluted earnings per share | $ | 1.05 | $ | 1.65 | |
Weighted average number of shares outstanding | |||||
| Basic | 16 | 355,588 | 353,874 | ||
| Diluted | 16 | 356,595 | 356,008 | ||
1) Equity settled stock based compensation (a non-cash item) included in general and administrative expenses. | $ | 8,389 | $ | 6,420 | |
The accompanying notes form an integral part of these consolidated financial statements.
SILVER WHEATON 2013 ANNUAL REPORT [67]
Consolidated Statements of Comprehensive Income
| Years Ended December 31 | |||||
(US dollars in thousands) | Note | 2013 | 2012 | ||
Net earnings | $ | 375,495 | $ | 586,036 | |
| Other comprehensive income (loss) | |||||
| Items that will not be reclassified to net earnings | |||||
| Loss on long-term investments - common shares held | 9 | $ | (77,881) | $ | (31,134) |
| Deferred income tax recovery | 20 | 1,784 | 2,479 | ||
Total other comprehensive loss | $ | (76,097) | $ | (28,655) | |
Total comprehensive income | $ | 299,398 | $ | 557,381 | |
The accompanying notes form an integral part of these consolidated financial statements.
SILVER WHEATON 2013 ANNUAL REPORT [68]
Consolidated Balance Sheets
| Note | December 31 | December 31 | |||
| (US dollars in thousands) | 2013 | 2012 | |||
Assets | |||||
| Current assets | |||||
| Cash and cash equivalents | 17 | $ | 95,823 | $ | 778,216 |
| Accounts receivable | 8 | 4,619 | 6,197 | ||
| Other | 845 | 966 | |||
Total current assets | $ | 101,287 | $ | 785,379 | |
Non-current assets | |||||
| Silver and gold interests | 10 | $ | 4,228,484 | $ | 2,281,234 |
| Early deposit - gold interest | 11 | 13,602 | - | ||
| Long-term investments | 9 | 40,801 | 121,377 | ||
| Other | 5,670 | 1,347 | |||
Total non-current assets | $ | 4,288,557 | $ | 2,403,958 | |
Total assets | $ | 4,389,844 | $ | 3,189,337 | |
Liabilities | |||||
| Current liabilities | |||||
| Accounts payable and accrued liabilities | $ | 20,416 | $ | 20,898 | |
| Current portion of bank debt | 12 | - | 28,560 | ||
| Current portion of performance share units | 15.1 | 718 | - | ||
Total current liabilities | $ | 21,134 | $ | 49,458 | |
Non-current liabilities | |||||
| Long-term portion of bank debt | 12 | $ | 998,136 | $ | 21,500 |
| Deferred income taxes | 20 | 2,191 | 9,250 | ||
| Performance share units | 15.1 | 1,837 | 2,055 | ||
Total non-current liabilities | $ | 1,002,164 | $ | 32,805 | |
Total liabilities | $ | 1,023,298 | $ | 82,263 | |
Shareholders' equity | |||||
| Issued capital | 13 | $ | 1,879,475 | $ | 1,811,577 |
| Reserves | 14 | (25,618) | (1,710) | ||
| Retained earnings | 1,512,689 | 1,297,207 | |||
Total shareholders' equity | $ | 3,366,546 | $ | 3,107,074 | |
Total liabilities and shareholders' equity | $ | 4,389,844 | $ | 3,189,337 | |
Commitments and contingencies | 12, 21 | ||||
| /s/ Randy Smallwood | /s/ John Brough | |
| Randy Smallwood | John Brough | |
| Director | Director |
The accompanying notes form an integral part of these consolidated financial statements.
SILVER WHEATON 2013 ANNUAL REPORT [69]
Consolidated Statements of Cash Flows
| Years Ended December 31 | |||||
(US dollars in thousands) | Note | 2013 | 2012 | ||
Operating activities | |||||
| Net earnings | $ | 375,495 | $ | 586,036 | |
| Adjustments for | |||||
| Depreciation and depletion | 144,393 | 101,457 | |||
| Amortization of credit facility origination fees: | |||||
| Interest expense | 558 | - | |||
| Amortization of credit facility origination fees - undrawn facilities | 7 | 1,910 | - | ||
| Write off of credit facility origination fees upon the cancellation of the Bridge Facility | 7 | 4,490 | - | ||
| Interest expense | 5,525 | - | |||
| Equity settled stock based compensation | 8,389 | 6,420 | |||
| Performance share units | 15.1 | 646 | 1,685 | ||
| Deferred income tax (recovery) expense | 20 | (5,275) | 14,030 | ||
| Loss (gain) on fair value adjustment of share purchase warrants held | 9 | 2,694 | (496) | ||
| Investment income recognized in net earnings | (431) | (1,367) | |||
| Other | (69) | (14) | |||
| Change in non-cash working capital | 17 | 1,088 | 10,366 | ||
| Cash generated from operations | $ | 539,413 | $ | 718,117 | |
| Interest paid - expensed | (5,513) | - | |||
| Interest received | 233 | 1,287 | |||
Cash generated from operating activities | $ | 534,133 | $ | 719,404 | |
Financing activities | |||||
| Bank debt repaid | 12 | $ | (1,725,060) | $ | (28,560) |
| Bank debt drawn | 12 | 2,675,000 | - | ||
| Credit facility origination fees | (14,003) | - | |||
| Share purchase warrants exercised | 51,736 | 1,878 | |||
| Share purchase options exercised | 6,390 | 11,030 | |||
| Dividends paid | 13.2 | (160,013) | (123,852) | ||
Cash generated from (applied to) financing activities | $ | 834,050 | $ | (139,504) | |
Investing activities | |||||
| Silver and gold interests | 10 | $ | (2,025,973) | $ | (640,718) |
| Interest paid - capitalized to silver interests | (10,954) | (671) | |||
| Silver and gold interests - early deposit | 11 | (13,450) | - | ||
| Acquisition of long-term investments | 9 | - | (395) | ||
| Dividend income received | 227 | 80 | |||
| Other | (304) | (192) | |||
Cash applied to investing activities | $ | (2,050,454) | $ | (641,896) | |
Effect of exchange rate changes on cash and cash equivalents | $ | (122) | $ | 11 | |
Decrease in cash and cash equivalents | $ | (682,393) | $ | (61,985) | |
| Cash and cash equivalents, beginning of year | 778,216 | 840,201 | |||
Cash and cash equivalents, end of year | 17 | $ | 95,823 | $ | 778,216 |
The accompanying notes form an integral part of these consolidated financial statements.
SILVER WHEATON 2013 ANNUAL REPORT [70]
| Reserves | |||||||||||||||||
(US dollars in thousands) | Number of Shares | Issued Capital | Share Purchase Warrants Reserve | Share Purchase Options Reserve | Restricted Share Units Reserve | Long-Term Investment Revaluation Reserve (Net of Tax) | Total Reserves | Retained Earnings | Total | ||||||||
At January 1, 2012 | 353,500 | $ | 1,793,772 | $ | 7,457 | $ | 12,314 | $ | 2,510 | $ | 3,141 | $ | 25,422 | $ | 835,023 | $ | 2,654,217 |
| Total comprehensive income | |||||||||||||||||
| Net earnings | $ | - | $ | - | $ | - | $ | - | $ | - | $ | - | $ | 586,036 | $ | 586,036 | |
OCI 1 | - | - | - | - | (28,655) | (28,655) | - | (28,655) | |||||||||
Total comprehensive income (loss) | $ | - | $ | - | $ | - | $ | - | $ | (28,655) | $ | (28,655) | $ | 586,036 | $ | 557,381 | |
Fair value of SBC 1 | $ | - | $ | - | $ | 5,191 | $ | 1,229 | $ | - | $ | 6,420 | $ | - | $ | 6,420 | |
Options 1 exercised | 721 | 14,485 | - | (3,455) | - | - | (3,455) | - | 11,030 | ||||||||
RSUs 1 released | 61 | 1,186 | - | - | (1,186) | - | (1,186) | - | - | ||||||||
Warrants 1 exercised | 94 | 2,134 | (256) | - | - | - | (256) | - | 1,878 | ||||||||
| Dividends | - | - | - | - | - | - | (123,852) | (123,852) | |||||||||
At December 31, 2012 | 354,376 | $ | 1,811,577 | $ | 7,201 | $ | 14,050 | $ | 2,553 | $ | (25,514) | $ | (1,710) | $ | 1,297,207 | $ | 3,107,074 |
| Total comprehensive income | |||||||||||||||||
| Net earnings | $ | - | $ | - | $ | - | $ | - | $ | - | $ | - | $ | 375,495 | $ | 375,495 | |
OCI 1 | - | - | - | - | (76,097) | (76,097) | - | (76,097) | |||||||||
Total comprehensive income | $ | - | $ | - | $ | - | $ | - | $ | (76,097) | $ | (76,097) | $ | 375,495 | $ | 299,398 | |
Fair value of SBC 1 | $ | - | $ | - | $ | 7,454 | $ | 935 | $ | - | $ | 8,389 | $ | - | $ | 8,389 | |
Options 1 exercised | 415 | 8,451 | - | (2,061) | - | - | (2,061) | - | 6,390 | ||||||||
RSUs 1 released | 19 | 655 | - | - | (655) | - | (655) | - | - | ||||||||
Warrants 1 issued | - | 53,572 | - | - | - | 53,572 | - | 53,572 | |||||||||
Warrants 1 exercised | 2,587 | 58,792 | (7,056) | - | - | - | (7,056) | - | 51,736 | ||||||||
| Dividends (Note 13.2) | - | - | - | - | - | - | (160,013) | (160,013) | |||||||||
At December 31, 2013 | 357,397 | $ | 1,879,475 | $ | 53,717 | $ | 19,443 | $ | 2,833 | $ | (101,611) | $ | (25,618) | $ | 1,512,689 | $ | 3,366,546 |
| 1) | Definitions as follows: “OCI” = Other Comprehensive Income (Loss); “SBC” = Equity Settled Stock Based Compensation; “Options” = Share Purchase Options; “RSUs” = Restricted Share Units; “Warrants” = Share Purchase Warrants. |
The accompanying notes form an integral part of these consolidated financial statements.
SILVER WHEATON 2013 ANNUAL REPORT [71]
Notes to the Consolidated Financial Statements
Years Ended December 31, 2013 and 2012 (US Dollars)
| 1. | Description of Business and Nature of Operations |
Silver Wheaton Corp. (“Silver Wheaton” or the “Company”) is a mining company which generates its revenue primarily from the sale of silver and gold. Silver Wheaton Corp., which is the ultimate parent company of its consolidated group, is incorporated and domiciled in Canada, and its principle place of business is at Suite 3150 – 666 Burrard Street, Vancouver, British Columbia, V6C 2X8. The Company trades on the Toronto Stock Exchange (“TSX”) and the New York Stock Exchange (“NYSE”) under the symbol SLW.
The Company has entered into 20 long-term purchase agreements and one early deposit long-term purchase agreement associated with silver and/or gold (“precious metal purchase agreements”), relating to 24 different mining assets, whereby Silver Wheaton acquires silver and gold production from the counterparties for a per ounce cash payment which is fixed by contract, generally at or below the prevailing market price. During the year ended December 31, 2013, the per ounce price paid by the Company for silver and gold under the agreements averaged $4.12 and $386, respectively. The primary drivers of the Company’s financial results are the volume of silver and gold production at the various mines and the price of silver and gold realized by Silver Wheaton upon sale.
The consolidated financial statements of the Company for year ended December 31, 2013 were authorized for issue in accordance with a resolution of the Board of Directors dated March 20, 2014.
| 2. | Significant Accounting Policies |
| 2.1. | Basis of Presentation |
These consolidated financial statements have been prepared in accordance with International Financial Reporting Standards as issued by the International Accounting Standards Board (“IFRS”) on a historical cost basis, except for financial assets which are not held for the purpose of collecting contractual cash flows on specified dates, derivative assets and derivative liabilities which have been measured at fair value as at the relevant balance sheet date. The consolidated financial statements are presented in United States (“US”) dollars, which is the Company’s functional currency, and all values are rounded to the nearest thousand US dollars (US$ 000’s) unless otherwise noted. References to “Cdn$” refer to Canadian dollars.
| 2.2. | Statement of Compliance |
These consolidated financial statements have been prepared in accordance with IFRS as issued by the International Accounting Standards Board (“IASB”).
The preparation of financial statements in accordance with IFRS requires the use of certain accounting estimates. It also requires management to exercise judgment in applying the Company’s accounting policies. The areas involving a higher degree of judgment or complexity, or areas where assumptions and estimates are significant to the financial statements, are disclosed in Note 3.
| 2.3. | Principles of Consolidation |
The consolidated financial statements include the accounts of the Company and its 100% owned subsidiaries Silver Wheaton (Caymans) Ltd. (“SW Caymans”), Silver Wheaton Luxembourg S.a.r.l. (“Silver Wheaton Luxembourg”) and, prior to the current year, Silverstone Resources (Barbados) Corp. (“SST Barbados”) which was liquidated into Silver Wheaton Caymans as of December 31, 2012.
Subsidiaries are fully consolidated from the date on which the Company obtains a controlling interest. Control is defined as an investor’s power over an investee with exposure, or rights, to variable returns from the investee and the ability to affect the investor’s returns through its power over the investee. Subsidiaries are included in the consolidated financial results of the Company from the effective date of acquisition up to the effective date of disposition or loss of control.
The financial statements of the subsidiaries are prepared for the same reporting period as the parent company, using consistent accounting policies. Balances, transactions, income and expenses between the Company and its subsidiaries are eliminated on consolidation.
SILVER WHEATON 2013 ANNUAL REPORT [72]
Notes to the Consolidated Financial Statements
Years Ended December 31, 2013 and 2012 (US Dollars)
| 2.4. | Cash and Cash Equivalents |
Cash and cash equivalents include cash and highly liquid money market investments including short-term deposits, treasury bills, commercial paper, bankers’ depository notes and bankers’ acceptances with terms to maturity of less than three months.
| 2.5. | Revenue Recognition |
Revenue from the sale of silver and gold is recognized when persuasive evidence of an arrangement exists, title and risk passes to the buyer, collection is reasonably assured and the price is reasonably determinable. Selling prices are determined at the point revenue is recognized by reference to active and freely traded commodity markets, for example the London Bullion Market for commodities, in an identical form to the product sold.
Where the Company acquires silver or gold in concentrate form, final silver or gold prices are set on a specified future quotational period (the “Quotational Period”) pursuant to the concentrate sales contracts with third-party smelters, typically one to three months after the shipment date, based on market prices for silver or gold. Revenues and the associated cost of sales are recorded on a gross basis under these contracts at the time title passes to the buyer based on the forward price for the expected settlement period. The contracts, in general, provide for a provisional payment based upon provisional assays and quoted silver and gold prices. Final settlement is based upon the average applicable price for the Quotational Period applied to the actual number of silver or gold ounces recovered calculated using confirmed smelter weights and settlement assays. Final settlement generally occurs from three to six months after shipment. The Company’s provisionally priced sales contain an embedded derivative that is required to be separated from the host contract for accounting purposes. The host contract is the receivable from the sale of concentrates measured at the forward price at the time of sale. The embedded derivative is recorded on the balance sheet as a derivative asset in Accounts Receivable or as a derivative liability in Accounts Payable and Accrued Liabilities and is adjusted to fair value through revenue each period until the date of final settlement.
| 2.6. | Financial Instruments |
In November 2009, the IASB introduced IFRS 9, Financial Instruments (“IFRS 9”), which is part of a project to replace IAS 39, Financial Instruments: Recognition and Measurement. The IASB recently suspended the originally planned effective date of January 1, 2015 and at present the effective date has not been determined. The Company has elected to adopt IFRS 9 (2009) and the related consequential amendments effective January 1, 2010.
Financial assets and financial liabilities are recognized when the Company becomes a party to the contractual provisions of the instrument.
Financial assets and financial liabilities are initially measured at fair value. Transaction costs that are directly attributable to the acquisition or issue of financial assets and financial liabilities (other than financial assets and financial liabilities at fair value through net earnings) are added to or deducted from the fair value of the financial assets or financial liabilities, as appropriate, on initial recognition. Transaction costs directly attributable to the acquisition of financial assets or financial liabilities at fair value through net earnings are recognized immediately in net earnings.
| 2.7. | Financial Assets |
Financial assets are subsequently measured at either amortized cost or fair value, depending on the classification of the financial assets.
Financial Assets at Fair Value Through Other Comprehensive Income (“FVTOCI”)
The Company’s long-term investments in common shares held are for long-term strategic purposes and not for trading. Upon the adoption of IFRS 9, the Company made an irrevocable election to designate these long-term investments in common shares held as FVTOCI as it believes that this provides a more meaningful presentation for long-term strategic investments, rather than reflecting changes in fair value immediately in net earnings.
Long-term investments in common shares held are initially measured at fair value plus transaction costs. Subsequently, they are measured at fair value with gains and losses arising from changes in fair value recognized as a component of other comprehensive income (“OCI”) and accumulated in the long-term investment revaluation reserve. The cumulative gain or loss will not be reclassified to net earnings on disposal of these long-term investments.
SILVER WHEATON 2013 ANNUAL REPORT [73]
Notes to the Consolidated Financial Statements
Years Ended December 31, 2013 and 2012 (US Dollars)
Dividends on these long-term investments in common shares held are recognized as a component of net earnings in the period they are received under the classification Other (Income) Expense.
Financial Assets at Fair Value Through Net Earnings (“FVTNE”)
Warrants held by the Company for long-term investment purposes are classified as FVTNE. These warrants are measured at fair value at the end of each reporting period, with any gains or losses arising on remeasurement recognized as a component of net earnings under the classification Other (Income) Expense.
As discussed in Note 2.5, the Company’s provisionally priced sales contain an embedded derivative that is remeasured at fair value at the end of each reporting period. Fair value gains and losses related to the embedded derivative are included in revenue in the period they occur.
Financial Assets at Amortized Cost
Cash and cash equivalents are stated at amortized cost. Other receivables are non-interest bearing and are stated at amortized cost, which approximate fair values due to the short terms to maturity. Where necessary, other receivables are reported net of allowances for uncollectable amounts.
Foreign Exchange Gains and Losses
The fair value of financial assets denominated in a foreign currency is determined in that foreign currency and translated at the spot rate at the end of each reporting period. The foreign exchange component forms part of its fair value gain or loss. Therefore,
| · | For financial assets that are classified as FVTNE, the foreign exchange component is recognized as a component of net earnings, and |
| · | For financial assets that are classified as FVTOCI, the foreign exchange component is recognized as a component of OCI. |
Derecognition of Financial Assets
The Company derecognizes a financial asset only when the contractual rights to cash flows from the asset expire, or when it transfers the financial asset and substantially all the risks and rewards of ownership of the asset to another entity. If the Company neither transfers nor retains substantially all the risks and rewards of ownership and continues to control the transferred asset, the Company recognizes its retained interest in the asset and an associated liability for amounts it may have to pay. If the Company retains substantially all the risks and rewards of ownership of a transferred financial asset, the Company continues to recognize the financial asset and also recognizes a collateralized borrowing for the proceeds received.
On derecognition of a financial asset that is classified as FVTOCI, the cumulative gain or loss (net of tax) previously accumulated in the long-term investment revaluation reserve is not reclassified to net earnings, but is reclassified to retained earnings.
| 2.8. | Financial Liabilities and Equity Instruments |
Debt and equity instruments issued by the Company are classified as either financial liabilities or as equity in accordance with the substance of the contractual arrangements and the definition of a financial liability and equity instrument. All financial liabilities are subsequently measured at amortized cost using the effective interest method or at FVTNE, depending on the classification of the instrument.
Equity Instruments
An equity instrument is a contract that evidences a residual interest in the assets of an entity after deducting all of its liabilities. Equity instruments issued by the Company are recognized at the proceeds received less direct issue costs (net of any current or deferred income tax recovery attributable to such costs).
SILVER WHEATON 2013 ANNUAL REPORT [74]
Notes to the Consolidated Financial Statements
Years Ended December 31, 2013 and 2012 (US Dollars)
Share Purchase Warrants Issued
Share purchase warrants issued with an exercise price denominated in the Company’s functional currency (US dollars) are considered equity instruments with the consideration received reflected within shareholders’ equity under the classification of share purchase warrants reserve. Upon exercise, the original consideration is reallocated from share purchase warrants reserve to issued share capital along with the associated exercise price.
Other Financial Liabilities
Accounts payable and accrued liabilities, silver interest payments due and bank debt are initially measured at fair value, net of transaction costs, and are subsequently measured at amortized cost using the effective interest method. The effective interest method is a method of calculating the amortized cost of a financial liability and of allocating interest expense over the relevant period. The effective interest rate is the rate that exactly discounts estimated future cash payments through the expected life of the financial liability, or (where appropriate) a shorter period, to the net carrying amount on initial recognition.
Foreign Exchange Gains and Losses
The fair value of financial liabilities denominated in a foreign currency is determined in that foreign currency and translated at the spot rate at the end of each reporting period. Therefore,
| · | For financial liabilities that are denominated in a foreign currency and are measured at amortized cost at the end of each reporting period, the foreign exchange gains and losses are determined based on the amortized cost of the instruments and are recognized as a component of net earnings, and |
| · | For financial liabilities that are classified as FVTNE, the foreign exchange component forms part of the fair value gains or losses and is recognized as a component of net earnings. |
Derecognition of Financial Liabilities
The Company derecognizes financial liabilities when the Company’s obligations are discharged, cancelled or they expire. The difference between the carrying amount of the financial liability derecognized and the consideration paid and payable, including any non-cash assets transferred or liabilities assumed, is recognized as a component of net earnings.
| 2.9. | Silver and Gold Interests |
Agreements for which settlement is called for in silver and/or gold, the amount of which is based on production at the mines, are stated at cost less accumulated depletion and accumulated impairment charges, if any.
The cost of the asset is comprised of its purchase price, any closing costs directly attributable to acquiring the asset, and, for qualifying assets, borrowing costs. The purchase price is the aggregate cash amount paid and the fair value of any other non-cash consideration given to acquire the asset.
Depletion
The cost of these silver and gold interests is separately allocated to reserves, resources and exploration potential. The value allocated to reserves is classified as depletable and is depleted on a unit-of-sale basis over the estimated recoverable proven and probable reserves at the mine corresponding to the specific agreement. The value associated with resources and exploration potential is the value beyond proven and probable reserves at acquisition and is classified as non-depletable until such time as it is transferred to the depletable category as a result of the conversion of resources and/or exploration potential into reserves.
SILVER WHEATON 2013 ANNUAL REPORT [75]
Notes to the Consolidated Financial Statements
Years Ended December 31, 2013 and 2012 (US Dollars)
Asset Impairment
Management considers each precious metal purchase agreement to be a separate cash generating unit, which is the lowest level for which cash inflows are largely independent of those of other assets. At the end of each reporting period, the Company assesses each precious metal purchase agreement to determine whether any indication of impairment exists. If such an indication exists, the recoverable amount of the precious metal purchase agreement is estimated in order to determine the extent of the impairment (if any). The recoverable amount of each precious metal purchase agreement is the higher of fair value less costs to sell (“Fair Value Approach”) and value in use (“Value-In-Use Approach”).
Under the Fair Value Approach, the net asset value (“NAV”) methodology is used to determine the fair value that could be received from each precious metal purchase agreement in an arm’s length transaction at the measurement date. NAV is estimated by using an appropriate discount rate to calculate the present value of expected future cash flows associated with each mineral category. The discount rates used across the portfolio of precious metal purchase agreements range from 5% to 12%. The values are adjusted for each mineral category dependent on the likelihood of conversion from resources to reserves. A market multiple is applied to the NAV computed in order to assess the estimated fair value. Silver and precious metals companies typically trade at a market capitalization that is based on a multiple of their underlying NAV. Consequently, a market participant would generally apply a NAV multiple when estimating the fair value of a silver and gold interest.
Under the Value-In-Use Approach, the net present value (“NPV”) methodology is used. NPV is estimated by using a nominal discount rate to calculate the present value of expected future cash flows. The nominal discount rate is based on the Company’s weighted average cost of capital, adjusted for any differences assessed in the risk profile associated with the relevant precious metal purchase agreement relative to the risk profile associated with the overall portfolio of precious metal purchase agreements. The nominal discount rates used across the portfolio of precious metal purchase agreements range from 5% to 19%.
The expected future cash flows are management’s best estimates of expected future revenues and costs. Under each method, expected future revenues reflect an estimate of future production for each mine at which the Company has a precious metal purchase agreement based on detailed life of mine plans received from each of the partners. Expected future revenues also reflect management’s estimated long-term metal prices. Under the Fair Value Approach, silver and gold prices used range from $20 to $21 and $1,250 to $1,300, respectively. Under the Value-In-Use Approach, nominal silver and gold prices of $20 and $1,250 are used for the current year, with a 2% inflationary factor thereafter. Estimated future cash costs are fixed based on the terms of each precious metal purchase agreement, as disclosed in Note 21.
If the carrying amount of the asset exceeds its recoverable amount, the asset is considered impaired and an impairment charge is reflected as a component of net earnings so as to reduce the carrying amount to its recoverable value. A previously recognized impairment charge is reversed only if there has been a change in the estimates used to determine the asset’s recoverable amount since the last impairment charge was recognized. If this is the case, the carrying amount of the asset is increased to its recoverable amount. The increased amount cannot exceed the carrying amount that would have been determined, net of depletion, had no impairment charge been recognized for the asset in prior years. Such reversal is reflected as a component of net earnings.
No impairment charge was required at December 31, 2013 and December 31, 2012
As part of the annual review of the recoverable amounts, the Company performs a sensitivity analysis on silver and gold prices, which are key assumptions that impact the impairment calculations. Assuming a negative 10% change relative to current silver and gold price assumptions, while holding all other assumptions constant, no impairment charge was required at December 31, 2013.
| 2.10. | Borrowing and Debt Issue Costs |
Borrowing costs allocable to qualifying assets, which are assets that necessarily take a substantial period of preparation for their intended use, are capitalized and included in the carrying amounts of the related assets until such time as the assets are substantially ready for their intended use. Borrowing costs that do not relate to the acquisition or construction of qualifying assets are reflected as a component of net earnings under the classification Interest Expense, as incurred.
For the purposes of determining whether borrowing costs are allocable to qualifying assets, general borrowings are first considered to relate to qualifying assets to the extent of the cumulative investment made by the Company.
SILVER WHEATON 2013 ANNUAL REPORT [76]
Notes to the Consolidated Financial Statements
Years Ended December 31, 2013 and 2012 (US Dollars)
Debt issue costs on non-revolving facilities are treated as an adjustment to the carrying amount of the original liability and are amortized over the life of the new or modified liability. Debt issue costs on revolving facilities are recorded as an asset under the classification Other long-term assets and are amortized over the life of the new or modified credit facility.
| 2.11. | Stock Based Payment Transactions |
The Company recognizes a stock based compensation expense for all share purchase options and restricted share units (“RSUs”) awarded to employees, officers and directors based on the fair values of the share purchase options and RSUs at the date of grant. The fair values of share purchase options and RSUs at the date of grant are expensed over the vesting periods of the share purchase options and RSUs, respectively, with a corresponding increase to equity. The fair value of share purchase options is determined using the Black-Scholes option pricing model with market related inputs as of the date of grant. Share purchase options with graded vesting schedules are accounted for as separate grants with different vesting periods and fair values. The fair value of RSUs is the market value of the underlying shares at the date of grant. At the end of each reporting period, the Company re-assesses its estimates of the number of awards that are expected to vest and recognizes the impact of any revisions to this estimate in the consolidated statement of earnings.
The Company recognizes a stock based compensation expense for performance share units (“PSUs”) which are awarded to eligible employees and are settled in cash. Compensation expense for the PSUs is recorded on a straight-line basis over the three year vesting period. This estimated expense is reflected as a component of net earnings over the vesting period of the PSUs with the related obligation recorded as a liability on the balance sheet. The amount of compensation expense is adjusted at the end of each reporting period to reflect (i) the fair market value of common shares; (ii) the number of PSUs anticipated to vest; and (iii) the anticipated performance factor.
| 2.12. | Income Taxes |
Income tax expense comprises current and deferred income tax. Current and deferred income taxes are recognized as a component of net earnings except to the extent that it relates to items recognized directly in equity or as a component of OCI.
Current income tax is the expected tax payable on the taxable income for the year, using tax rates enacted or substantively enacted at the end of the reporting period, and any adjustment to tax payable in respect of previous years.
Deferred income tax is recognized using the liability method on temporary differences arising between the tax bases of assets and liabilities and their carrying amounts in the consolidated financial statements. Deferred income tax assets and liabilities are measured using tax rates and laws that have been enacted or substantively enacted at the end of the reporting period and which are expected to apply when the related deferred income tax assets are realized or the deferred income tax liabilities are settled.
Deferred income tax liabilities are generally recognized for all taxable temporary differences. Deferred income tax assets are generally recognized for all deductible temporary differences and the carry forward of unused tax losses and tax credits to the extent that it is probable that there will be sufficient taxable income against which those deductible temporary differences and the carry forward of unused tax losses and tax credits can be utilized.
Deferred income tax liabilities are recognized for taxable temporary differences arising on investments in subsidiaries except where the reversal of the temporary difference can be controlled and it is probable that the difference will not reverse in the foreseeable future. Deferred income tax assets arising from deductible temporary differences associated with such investments are only recognized to the extent that it is probable that there will be sufficient taxable income against which to utilize the benefits of the temporary differences and they are expected to reverse in the foreseeable future.
The carrying amount of deferred income tax assets are reviewed at the end of each reporting period and reduced to the extent that it is no longer probable that sufficient taxable income will be available to allow all or part of the deferred income tax assets to be recovered.
Deferred income tax assets and liabilities are not recognized for temporary differences arising from the initial recognition (other than in a business combination) of assets and liabilities in a transaction which does not affect either the accounting income or the taxable income. In addition, deferred income tax liabilities are not recognized if the temporary difference arises from the initial recognition of goodwill.
SILVER WHEATON 2013 ANNUAL REPORT [77]
Notes to the Consolidated Financial Statements
Years Ended December 31, 2013 and 2012 (US Dollars)
| 2.13. | Earnings Per Share |
Earnings per share calculations are based on the weighted average number of common shares and common share equivalents issued and outstanding during the year. Diluted earnings per share is calculated using the treasury method which requires the calculation of diluted earnings per share by assuming that outstanding share purchase options and warrants, with an average market price that exceeds the average exercise prices of the options and warrants for the year, are exercised and the proceeds are used to repurchase shares of the Company at the average market price of the common shares for the year.
| 2.14. | Foreign Currency Translation |
The functional currency is the currency of the primary economic environment in which the Company operates. The consolidated financial statements are presented in US dollars, which is the Company’s functional currency. Foreign currency monetary assets and liabilities are translated into US dollars at the exchange rates prevailing at the balance sheet date. Non-monetary assets denominated in foreign currencies are translated using the rate of exchange at the transaction date. Foreign currency transactions are translated at the US dollar rate prevailing on the transaction dates. Foreign exchange gains and losses are included in the determination of net earnings except for the foreign exchange gains and losses on the Company’s long-term investments in common shares held which are reflected as a component of OCI and accumulated in a separate component of the investments revaluation reserve which is a component of shareholders’ equity until they are realized as a result of a sale, at which time the accumulated foreign exchange gain or loss is reallocated from the investments reserve to retained earnings.
| 2.15. | Leasing |
Leases are classified as finance leases whenever the terms of the lease transfer substantially all of the risks and rewards of ownership to the lessee. All other leases are classified as operating leases. At December 31, 2013 and December 31, 2012, the Company was not a party to any finance leases.
The Company as the Lessee
Operating lease payments are recognized on a straight-line basis over the term of the lease, except where another systematic basis is more representative of the time pattern in which economic benefits from the leased assets are consumed.
In the event that lease incentives are received to enter into operating leases, such incentives are recognized as a liability. The aggregate benefit of incentives is recognized as a reduction to rental expense on a straight-line basis, except where another systematic basis is more representative of the time pattern in which economic benefits from the leased assets are consumed.
| 2.16. | Provisions |
Provisions are recognized when the Company has a present obligation (legal or constructive) as a result of a past event, it is probable that the Company will be required to settle the obligation, and a reliable estimate can be made of the amount required to settle the obligation.
The amount recognized as a provision is the best estimate of the consideration required to settle the present obligation at the end of the reporting period, taking into account the risks and uncertainties surrounding the obligation. Where a provision is measured using the cash flows estimated to settle the present obligation, its carrying amount is the present value of those cash flows.
When some or all of the economic benefits required to settle a provision are expected to be recovered from a third party, a receivable is recognized as an asset if it is virtually certain that reimbursement will be received and the amount of the receivable can be measured reliably.
SILVER WHEATON 2013 ANNUAL REPORT [78]
Notes to the Consolidated Financial Statements
Years Ended December 31, 2013 and 2012 (US Dollars)
| 2.17. | Changes in Accounting Policies |
Accounting Policies Implemented Effective January 1, 2013
IAS 1 - Presentation of Financial Statements (amended 2011)
In June 2011, the IASB issued amendments to IAS 1 - Presentation of Financial Statements (“IAS 1”) that require an entity to group items presented in the statement of other comprehensive income on the basis of whether they may be reclassified to profit or loss subsequent to initial recognition. For those items presented before tax, the amendments to IAS 1 also require that the tax related to the two separate groups be presented separately. The adoption of this amended standard did not result in a material impact on the Company’s consolidated financial statements.
IFRS 10 - Consolidated Financial Statements (“IFRS 10”)
In May 2011, the IASB issued IFRS 10 - Consolidated Financial Statements to replace IAS 27 - Consolidated and Separate Financial Statements and SIC 12 - Consolidation – Special Purpose Entities. The new consolidation standard changes the definition of control so that the same criteria apply to all entities, both operating and special purpose entities, to determine control. The revised definition focuses on the need to have both power over the investee to direct relevant activities and exposure to variable returns before control is present. The adoption of this new standard did not result in a material impact on the Company’s consolidated financial statements.
IFRS 11 - Joint Arrangements (“IFRS 11”)
In May 2011, the IASB issued IFRS 11 - Joint Arrangements to replace IAS 31 - Interests in Joint Ventures. The new standard defines two types of arrangements: Joint Operations and Joint Ventures. Focus is on the rights and obligations of the parties to the joint arrangement, thereby requiring parties to recognize the individual assets and liabilities to which they have rights or for which they are responsible, even if the joint arrangement operates in a separate legal entity. The adoption of this new standard did not result in a material impact on the Company’s consolidated financial statements.
IFRS 12 - Disclosure of Interests in Other Entities (“IFRS 12”)
In May 2011, the IASB issued IFRS 12 - Disclosure of Interests in Other Entities to create a comprehensive disclosure standard to address the requirements for subsidiaries, joint arrangements and associates and the reporting entity’s involvement with other entities. It also includes the requirements for unconsolidated structured entities (i.e. special purpose entities). The adoption of this new standard did not result in a material impact on the Company’s consolidated financial statements.
IFRS 13 - Fair Value Measurement
In May 2011, the IASB issued IFRS 13 - Fair Value Measurement as a single source of guidance for all fair value measurements required by IFRS to reduce the complexity and improve consistency across its application. The standard provides a definition of fair value and guidance on how to measure fair value as well as a requirement for enhanced disclosures. The adoption of this new standard did not result in a material impact on the Company’s consolidated financial statements.
| 2.18. | Future Changes in Accounting Policies |
The IASB has issued the following new or amended standards:
Standards required to be applied for periods beginning on or after January 1, 2014:
| · | IAS 32 – Financial Instruments: Presentation (amended 2011) |
Standards required with effective date to be determined:
| · | IFRS 9 (2013) – Financial Instruments (amended 2013): The IASB recently suspended the originally planned effective date of January 1, 2015 and at present the effective date has not been determined. |
SILVER WHEATON 2013 ANNUAL REPORT [79]
Notes to the Consolidated Financial Statements
Years Ended December 31, 2013 and 2012 (US Dollars)
The Company adopted IFRS 9 (2009) – Financial Instruments effective January 1, 2010. Early adoption of the above standards is permitted.
Based upon its current facts and circumstances, the Company does not expect to be materially affected by the application of these new standards.
| 3. | Key Sources of Estimation Uncertainty and Critical Accounting Judgments |
The preparation of the Company’s consolidated financial statements in conformity with IFRS requires management to make judgments, estimates and assumptions that affect the reported amounts of assets, liabilities and contingent liabilities at the date of the consolidated financial statements and reported amounts of revenues and expenses during the reporting period. Estimates and assumptions are continuously evaluated and are based on management’s experience and other factors, including expectations of future events that are believed to be reasonable under the circumstances. However, actual outcomes can differ from these estimates.
Information about significant areas of estimation uncertainty and judgments made by management in preparing the consolidated financial statements are described below.
Key Sources of Estimation Uncertainty1
| 3.1. | Attributable Reserve and Resource Estimates |
Silver and gold interests are significant assets of the Company, with a carrying value of $4.2 billion at December 31, 2013. This amount represents the capitalized expenditures related to the acquisition of the silver and gold interests, net of accumulated depletion. The Company estimates the reserves and resources relating to each agreement. Reserves are estimates of the amount of silver or gold that can be economically and legally extracted from the mining properties at which the Company has precious metal purchase agreements, adjusted where applicable to reflect the Company’s percentage entitlement to silver and gold produced from such mines. The Company estimates its reserves and resources based on information compiled by appropriately qualified persons relating to the geological data on the size, depth and shape of the ore body, and require complex geological judgments to interpret the data. The estimation of recoverable reserves is based upon factors such as estimates of foreign exchange rates, commodity prices, future capital requirements, and production costs along with geological assumptions and judgments made in estimating the size and grade of the ore body. Changes in the reserve or resource estimates may impact upon the carrying value of the Company’s silver and gold interests and depletion charges.
| 3.2. | Depletion |
As described in Note 2.9, the Company’s silver and gold interests are separately allocated to reserves, resources and exploration potential. The value allocated to reserves is classified as depletable and is depleted on a unit-of-sale basis over the estimated recoverable proven and probable reserves at the mine corresponding to the specific agreement. To make this allocation, the Company estimates the recoverable reserves, resources and exploration potential at each mining operation. These calculations require the use of estimates and assumptions, including the amount of contained silver and gold, recovery rates and payable rates. Changes to these assumptions may impact the estimated recoverable reserves, resources or exploration potential which could directly impact the depletion rates used. Changes to depletion rates are accounted for prospectively.
| 3.3. | Impairment of Assets |
As more fully described in Note 2.9, the Company assesses each silver and gold interest at the end of every reporting period to determine whether any indication of impairment exists. The calculation of the recoverable amount requires the use of estimates and assumptions such as long-term commodity prices, discount rates, recoverable ounces of silver and gold, and operating performance.
1 Statements made in this section contain forward-looking information. Please see “Cautionary Note Regarding Forward-Looking Statements” in the Management’s Discussion and Analysis (“MD&A”) for material risks, assumptions and important disclosure associated with this information. |
SILVER WHEATON 2013 ANNUAL REPORT [80]
Notes to the Consolidated Financial Statements
Years Ended December 31, 2013 and 2012 (US Dollars)
| 3.4. | Valuation of Stock Based Compensation |
As more fully described in Note 2.11, the Company has various forms of stock based compensation, including share purchase options, restricted share units (“RSUs”) and performance share units (“PSUs”). The calculation of the fair value of share purchase options, RSUs and PSUs issued requires the use of estimates as more fully described in Notes 14.2, 14.3, and 15.1, respectively.
| 3.5. | Provisionally Priced Concentrate Sales |
As discussed in Note 5, the Company’s provisionally priced sales contain an embedded derivative that is required to be separated from the host contract for accounting purposes and adjusted to fair value through revenue each reporting period, until the date of final settlement. The calculation of the fair value of the embedded derivative requires the use of estimates and assumptions related to the future price of silver and/or gold.
| 3.6. | Contingencies |
Due to the size, complexity and nature of the Company’s operations, various legal and tax matters are outstanding from time to time, including an audit (the “CRA Audit”) by the Canada Revenue Agency (“CRA”) of the Company’s international transactions covering the 2005 to 2010 taxation years. By their nature, contingencies will only be resolved when one or more future events occur or fail to occur. The assessment of contingencies inherently involves the exercise of significant judgment and estimates of the outcome of future events. If the Company is unable to resolve any of these matters favorably, there may be a material adverse impact on the Company’s financial performance, cash flows or results of operations. In the event that management’s estimate of the future resolution of these matters changes, the Company will recognize the effects of the changes in its consolidated financial statements in the appropriate period relative to when such changes occur.
Critical Accounting Judgments1
| 3.7. | Functional Currency |
The functional currency for each of the Company’s subsidiaries is the currency of the primary economic environment in which the entity operates. As a result of the following factors, the Company has determined that the functional currency of each entity is the US dollar:
| · | The Company’s revenue is denominated in US dollars; |
| · | The Company’s cash cost of sales is denominated in US dollars; |
| · | The majority of the Company’s cash is held in US dollars; and |
| · | The Company generally seeks to raise capital in US dollars. |
Determination of the functional currency may involve certain judgments to determine the primary economic environment and the Company reconsiders the functional currency of its entities if there is a change in events and conditions which determined the primary economic environment.
| 3.8. | Income Taxes |
The interpretation and application of existing tax laws or regulations in Canada, the Cayman Islands, Luxembourg, Barbados, the Netherlands or any of the countries in which the mining operations are located or to which shipments of silver or gold are made requires the use of judgment. Differing interpretation of these laws or regulations could result in an increase in the Company’s taxes, or other governmental charges, duties or impositions. In assessing the probability of realizing deferred income tax assets, management makes estimates related to expectations of future taxable income and expected timing of reversals of existing temporary differences. Such estimates are based on forecasted cash flows.
1 Statements made in this section contain forward-looking information. Please see “Cautionary Note Regarding Forward-Looking Statements” in the Management’s Discussion and Analysis (“MD&A”) for material risks, assumptions and important disclosure associated with this information. |
SILVER WHEATON 2013 ANNUAL REPORT [81]
Notes to the Consolidated Financial Statements
Years Ended December 31, 2013 and 2012 (US Dollars)
| 4. | Financial Instruments |
The Company thoroughly examines the various financial instrument risks to which it is exposed and assesses the impact and likelihood of those risks. These risks may include credit risk, liquidity risk, currency risk, interest rate risk, commodity price risk and other price risks. Where material, these risks are reviewed and monitored by the Board of Directors.
| 4.1. | Capital Risk Management |
The Company manages its capital to ensure that it will be able to continue as a going concern while maximizing the return to stakeholders through the optimization of the debt and equity balance.
The capital structure of the Company consists of debt (Note 12) and equity attributable to common shareholders, comprising of issued capital (Note 13), accumulated reserves (Note 14) and retained earnings.
The Company is not subject to any externally imposed capital requirements with the exception of complying with the minimum tangible net worth covenant under the credit agreement governing bank debt (Note 12).
The Company is in compliance with the debt covenants at December 31, 2013, as described in Note 12.
| 4.2. | Categories of Financial Assets and Liabilities |
Cash and cash equivalents are reported at amortized cost. Other receivables are non-interest bearing and are stated at amortized cost, which approximate fair values due to the short terms to maturity. Where necessary, other receivables are reported net of allowances for uncollectable amounts. All other financial assets are reported at fair value. Fair value adjustments on financial assets are reflected as a component of net earnings with the exception of fair value adjustments associated with the Company’s long-term investments in common shares held. As these long-term investments are held for strategic purposes and not for trading, the Company has made a one time, irrevocable election to reflect the fair value adjustments associated with these investments as a component of OCI. Financial liabilities are reported at amortized cost using the effective interest method, except for derivative liabilities which are measured at fair value through net earnings. The following table summarizes the classification of the Company’s financial assets and liabilities:
SILVER WHEATON 2013 ANNUAL REPORT [82]
Notes to the Consolidated Financial Statements
Years Ended December 31, 2013 and 2012 (US Dollars)
| Note | December 31 | December 31 | ||||
| (in thousands) | 2013 | 2012 | ||||
Financial assets | ||||||
| Fair value through net earnings | ||||||
| Long-term investments - warrants held | 9 | $ | - | $ | 2,694 | |
| Trade receivables from provisional concentrate sales, net of fair value adjustment | 5 | 2,457 | 5,909 | |||
| Fair value through other comprehensive income | ||||||
| Long-term investments - common shares held | 9 | 40,801 | 118,683 | |||
| Amortized cost | ||||||
| Cash and cash equivalents | 95,823 | 778,216 | ||||
| Other accounts receivable | 8 | 2,162 | 288 | |||
| $ | 141,243 | $ | 905,790 | |||
Financial liabilities | ||||||
| Fair value through net earnings | ||||||
| Accrued liabilities from provisional concentrate sales related to fair value adjustment, net of trade receivable | 5 | $ | - | $ | 634 | |
| Amortized cost | ||||||
| Accounts payable and accrued liabilities | 16,198 | 19,094 | ||||
| Bank debt | 12 | 998,136 | 50,060 | |||
| $ | 1,014,334 | $ | 69,788 | |||
| 4.3. | Credit Risk |
Credit risk is the risk that the counterparty to a financial instrument will cause a financial loss for the Company by failing to discharge its obligations. To mitigate exposure to credit risk on financial assets, the Company has established policies to limit the concentration of credit risk, to ensure counterparties demonstrate minimum acceptable credit worthiness and to ensure liquidity of available funds.
The Company closely monitors its financial assets and does not have any significant concentration of credit risk. The Company invests surplus cash in short-term, high credit quality, money market instruments. In addition, counterparties used to sell silver and gold are all large, international organizations with strong credit ratings and the balance of trade receivables owed to the Company in the ordinary course of business is not significant. Therefore, the Company is not exposed to significant credit risk and, overall, the Company’s credit risk has not changed significantly from the prior year.
At December 31, 2013 and December 31, 2012, there were no significant trade receivables owed to the Company which were past due. The Company’s maximum exposure to credit risk related to its financial assets is as follows:
| December 31 | December 31 | ||||
(in thousands) | Note | 2013 | 2012 | ||
Cash and cash equivalents | $ | 95,823 | $ | 778,216 | |
| Trade receivables from provisional concentrate sales, net of fair value adjustment | 8 | 2,457 | 5,909 | ||
| Other receivables | 8 | 2,162 | 288 | ||
| $ | 100,442 | $ | 784,413 | ||
SILVER WHEATON 2013 ANNUAL REPORT [83]
Notes to the Consolidated Financial Statements
Years Ended December 31, 2013 and 2012 (US Dollars)
| 4.4. | Liquidity Risk |
The Company has in place a rigorous planning and budgeting process to help determine the funds required to support the Company’s normal operating requirements on an ongoing basis and its expansionary plans. The Company ensures that there are sufficient committed loan facilities to meet its short-term business requirements, taking into account its anticipated cash flows from operations and its holdings of cash and cash equivalents. As at December 31, 2013, the Company had cash and cash equivalents of $95.8 million (December 31, 2012 - $778.2 million) and working capital of $80.2 million (December 31, 2012 - $735.9 million). The Company invests surplus cash in short-term, high credit quality money market instruments.
Silver Wheaton holds common shares and common share purchase warrants of several publicly traded mineral exploration, development and mining companies (Note 9) with a combined market value at December 31, 2013 of $40.8 million (December 31, 2012 - $121.4 million). The daily exchange traded volume of these shares, including the shares underlying the warrants, is not sufficient for the Company to liquidate its position in a short period of time without potentially affecting the market value of the shares. These shares and warrants are held for strategic purposes and are considered long-term investments and therefore, as part of the Company’s planning, budgeting and liquidity analysis process, these investments are not relied upon to provide operational liquidity.
The following tables summarize the timing associated with the Company’s remaining contractual payments relating to its financial liabilities and commitments. The tables reflect the undiscounted cash flows of financial liabilities based on the earliest date on which the Company can be required to pay (assuming that the Company is in compliance with all of its obligations). The tables include both interest and principal cash flows. To the extent that applicable interest rates are floating in nature, the interest charges are estimated based on market-based forward interest rate curves at the end of the reporting period. The contractual maturity date of these financial liabilities and commitments is based on the earliest date on which the Company may be required to pay.
SILVER WHEATON 2013 ANNUAL REPORT [84]
Notes to the Consolidated Financial Statements
Years Ended December 31, 2013 and 2012 (US Dollars)
| As at December 31, 2013 | ||||||||||||||||
(in thousands) | 2014 | 2015 | 2016 | 2017 | 2018 | Thereafter | Commitments | Total | ||||||||
Non-derivative financial liabilities and commitments | ||||||||||||||||
| Bank debt | $ | - | $ | - | $ | 1,000,000 | $ | - | $ | - | $ | - | $ | - | $ | 1,000,000 |
Interest on bank debt ¹ | 14,620 | 16,119 | 7,501 | - | - | - | - | 38,240 | ||||||||
Silver and gold interest payments ² | ||||||||||||||||
Constancia ³ | - | - | - | - | - | - | 260,000 | 260,000 | ||||||||
Rosemont ⁴ | - | - | - | - | - | - | 231,150 | 231,150 | ||||||||
Loma de La Plata ⁵ | - | - | - | - | - | - | 32,400 | 32,400 | ||||||||
Toroparu ⁶ | - | - | - | - | - | - | 135,000 | 135,000 | ||||||||
| Accounts payable and accrued liabilities | 16,198 | - | - | - | - | - | - | 16,198 | ||||||||
| Performance share units | 718 | 1,121 | 716 | - | - | - | - | 2,555 | ||||||||
Total | $ | 31,536 | $ | 17,240 | $ | 1,008,217 | $ | - | $ | - | $ | - | $ | 658,550 | $ | 1,715,543 |
| 1) | As the applicable interest rates are floating in nature, the interest charges are estimated based on market-based forward interest rate curves at the end of the reporting period. |
| 2) | Vale is in the process of expanding the mill throughput capacity at the Salobo mine (Note 10) to 24 million tonnes per annum (“Mtpa”) from its current 12 Mtpa. If throughput capacity is expanded above 28 Mtpa within a predetermined period, Silver Wheaton will be required to make an additional payment to Vale based on a set fee schedule ranging from $67 million if throughput capacity is expanded to 28 Mtpa by January 1, 2031 up to $400 million if throughput capacity is expanded to 40 Mtpa prior to January 1, 2021. This contingent liability is not reflected in the above table. |
| 3) | In connection with the Constancia precious metal purchase agreement, the Company is committed to pay Hudbay two further payments of $125 million and $135 million to be made once capital expenditures of $1 billion and $1.35 billion, respectively, have been incurred at Constancia. Silver Wheaton has the option to make the $135 million payment in either cash or Silver Wheaton shares, with the number of shares to be determined at the time the payment is made. |
| 4) | In connection with the Rosemont precious metal purchase agreement, the Company is committed to pay contingent transaction costs of $1.1 million in addition to a commitment to pay Augusta total upfront cash payments of $230 million, payable on an installment basis, to partially fund construction of the Rosemont mine once certain milestones are achieved, including the receipt of key permits and securing the necessary financing to complete construction of the mine. |
| 5) | In connection with the Company’s election to convert the debenture with Pan American into a silver purchase agreement, the Company is committed to pay Pan American total upfront cash payments of $32.4 million following the satisfaction of certain conditions, including Pan American receiving all necessary permits to proceed with the mine construction. |
| 6) | During the 90 day period following the delivery of a bankable definitive feasibility study, environmental study and impact assessment, and other related documents (collectively, the “Feasibility Documentation”), or after December 31, 2015 if the Feasibility Documentation has not been delivered to Silver Wheaton by such date, Silver Wheaton may elect not to proceed with the precious metal purchase agreement, at which time Silver Wheaton will be entitled to a return of the early deposit of $11.5 million (on the basis that $2 million of the advanced $13.5 million is non-refundable) or, at Sandspring’s option, the stream percentage will be reduced from 10% to 0.774% (equivalent to the pro-rata stream based on a full purchase price of $11.5 million). |
SILVER WHEATON 2013 ANNUAL REPORT [85]
Notes to the Consolidated Financial Statements
Years Ended December 31, 2013 and 2012 (US Dollars)
| As at December 31, 2012 | ||||||||||||||||
(in thousands) | 2013 | 2014 | 2015 | 2016 | 2017 | Thereafter | Commitments | Total | ||||||||
Non-derivative financial liabilities and commitments | ||||||||||||||||
Bank debt ¹ | $ | 28,560 | $ | 21,500 | $ | - | $ | - | $ | - | $ | - | $ | - | $ | 50,060 |
Interest on bank debt ² | 472 | 145 | - | - | - | - | - | 617 | ||||||||
| Silver and gold interest payments | ||||||||||||||||
Constancia 3 | - | - | - | - | - | - | 250,000 | 250,000 | ||||||||
Rosemont 4 | - | - | - | - | - | - | 230,000 | 230,000 | ||||||||
Loma de La Plata 5 | - | - | - | - | - | - | 32,400 | 32,400 | ||||||||
| Accounts payable and accrued liabilities | 19,094 | - | - | - | - | - | - | 19,094 | ||||||||
| Performance share units | - | 1,064 | 991 | - | - | - | - | 2,055 | ||||||||
Derivative financial liabilities | ||||||||||||||||
| Accrued liabilities from provisional concentrate sales related to fair value adjustment, net of trade receivable | 634 | - | - | - | - | - | - | 634 | ||||||||
Total | $ | 48,760 | $ | 22,709 | $ | 991 | $ | - | $ | - | $ | - | $ | 512,400 | $ | 584,860 |
| 1) | As more fully disclosed in Note 12, the bank debt was repaid in full on February 22, 2013. |
| 2) | As the applicable interest rates are floating in nature, the interest charges are estimated based on market-based forward interest rate curves at the end of the reporting period. |
| 3) | In connection with the Constancia silver purchase agreement, at December 31, 2012 the Company was committed to pay Hudbay two further payments of $125 million to be made once capital expenditures of $500 million and $1 billion have been incurred at Constancia. |
| 4) | In connection with the Rosemont precious metal purchase agreement, the Company is committed to pay contingent transaction costs of $1.1 million in addition to a commitment to pay Augusta total upfront cash payments of $230 million, payable on an installment basis, to partially fund construction of the Rosemont mine once certain milestones are achieved, including the receipt of key permits and securing the necessary financing to complete construction of the mine. |
| 5) | In connection with the Company’s election to convert the debenture with Pan American into a silver purchase agreement, the Company is committed to pay Pan American total upfront cash payments of $32.4 million following the satisfaction of certain conditions, including Pan American receiving all necessary permits to proceed with the mine construction. |
SILVER WHEATON 2013 ANNUAL REPORT [86]
Notes to the Consolidated Financial Statements
Years Ended December 31, 2013 and 2012 (US Dollars)
| 4.5. | Currency Risk |
The Company undertakes certain transactions denominated in Canadian dollars, including certain operating expenses and the acquisition of strategic long-term investments. As a result, the Company is exposed to fluctuations in the value of the Canadian dollar relative to the US dollar. The carrying amounts of the Company’s Canadian dollar denominated monetary assets and monetary liabilities at the end of the reporting period are as follows:
| December 31 | December 31 | |||
| (in thousands) | 2013 | 2012 | ||
Monetary assets | ||||
| Cash and cash equivalents | $ | 1,029 | $ | 1,007 |
| Accounts receivable | 41 | 127 | ||
| Long-term investments - common shares held | 39,301 | 116,108 | ||
| Long-term investments - warrants held | - | 2,694 | ||
| $ | 40,371 | $ | 119,936 | |
Monetary liabilities | ||||
| Accounts payable and accrued liabilities | $ | 5,724 | $ | 5,785 |
| Performance share units | 2,367 | 1,923 | ||
| $ | 8,091 | $ | 7,708 | |
The following tables detail the Company’s sensitivity to a 10% increase or decrease in the Canadian dollar relative to the United States dollar, representing the sensitivity used when reporting foreign currency risk internally to key management personnel and represents management’s assessment of the reasonably possible change in exchange rates.
| As at December 31, 2013 | ||||
| Change in Canadian Dollar | ||||
| (in thousands) | 10% Increase | 10% Decrease | ||
Increase (decrease) in net earnings | $ | (702) | $ | 702 |
| Increase (decrease) in other comprehensive income | 3,930 | (3,930) | ||
Increase (decrease) in total comprehensive income | $ | 3,228 | $ | (3,228) |
| As at December 31, 2012 | ||||
| Change in Canadian Dollar | ||||
| (in thousands) | 10% Increase | 10% Decrease | ||
Increase (decrease) in net earnings | $ | (388) | $ | 388 |
| Increase (decrease) in other comprehensive income | 11,611 | (11,611) | ||
Increase (decrease) in total comprehensive income | $ | 11,223 | $ | (11,223) |
SILVER WHEATON 2013 ANNUAL REPORT [87]
Notes to the Consolidated Financial Statements
Years Ended December 31, 2013 and 2012 (US Dollars)
| 4.6. | Interest Rate Risk |
The Company is exposed to interest rate risk on its outstanding borrowings and short-term investments. Presently, all of the Company’s outstanding borrowings are at floating interest rates and all of its interest-bearing investments have terms of less than three months. The Company monitors its exposure to interest rates and has not entered into any derivative contracts to manage this risk. During the year ended December 31, 2013, the weighted average effective interest rate paid by the Company on its outstanding borrowings was 2.04% (2012 – 1.12%).
For the year ended December 31, 2013, a portion of the interest incurred by the Company has been capitalized as it relates to the acquisition of the Barrick and Constancia silver interests, both of which were under development during the period, with the remainder being reflected as a component of net earnings. For the year ended December 31, 2012, all of the interest incurred by the Company has been capitalized as it relates to the acquisition of the Barrick and Constancia silver interests, both of which were under development during the period. A fluctuation in interest rates of 100 basis points (1 percent) would have impacted the amount of interest capitalized during the year ended December 31, 2013 by approximately $3.9 million (2012 - $0.6 million) and the amount of interest expensed by $2.0 million (2012 - $Nil).
| 4.7. | Commodity Price Risk |
The price of the Company’s common shares and its financial results may be significantly adversely affected by a decline in the price of silver or gold. The price of silver and gold can fluctuate widely, and is affected by numerous factors beyond the Company’s control, including but not limited to, the sale or purchase of silver and gold by various central banks and financial institutions, interest rates, exchange rates, inflation or deflation, fluctuation in the value of the US dollar and foreign currencies, global and regional supply and demand, and the political and economic conditions of major silver and gold producing countries throughout the world.
In the event that the prevailing market price of silver or gold is at or below the price at which the Company can purchase such, pursuant to the terms of the agreements associated with its silver and gold interests, the Company may not generate positive cash flow or earnings.
| 4.8. | Other Price Risk |
The Company is exposed to equity price risk as a result of holding long-term investments in other exploration and mining companies. The Company does not actively trade these investments.
The sensitivity analysis below has been determined based on the exposure to equity price risks at December 31, 2013.
If equity prices had been 10% higher or lower:
| · | Net earnings for the year ended December 31, 2013 would not have been affected by changes in the fair value of share purchase warrants held (2012 – net income would have increased/decreased by approximately $0.3 million as a result of changes in the fair value of share purchase warrants held); and |
| · | Other comprehensive income for the year ended December 31, 2013 would have increased/decreased by approximately $4.1 million (2012 - $11.9 million) as a result of changes in the fair value of common shares held. |
| 4.9. | Fair Value Estimation |
The Company classifies its fair value measurements within a fair value hierarchy, which reflects the significance of the inputs used in making the measurements as defined in IFRS 13 – Fair Value Measurements (“IFRS 13”).
| Level 1 - | Unadjusted quoted prices at the measurement date for identical assets or liabilities in active markets. |
Level 2 - | Observable inputs other than quoted prices included in Level 1, such as quoted prices for similar assets and liabilities in active markets; quoted prices for identical or similar assets and liabilities in markets that are not active; or other inputs that are observable or can be corroborated by observable market data. |
| Level 3 - | Unobservable inputs which are supported by little or no market activity. |
SILVER WHEATON 2013 ANNUAL REPORT [88]
Notes to the Consolidated Financial Statements
Years Ended December 31, 2013 and 2012 (US Dollars)
The following table sets forth the Company’s financial assets and liabilities measured at fair value by level within the fair value hierarchy. As required by IFRS 7, assets and liabilities are classified in their entirety based on the lowest level of input that is significant to the fair value measurement.
| December 31, 2013 | ||||||||
(in thousands) | Total | Level 1 | Level 2 | Level 3 | ||||
Trade receivables from provisional concentrate sales, net of fair value adjustment | $ | 2,457 | $ | - | $ | 2,457 | $ | - |
| Long-term investments - common shares held | 40,801 | 40,801 | - | - | ||||
| Long-term investments - warrants held | - | - | - | - | ||||
| $ | 43,258 | $ | 40,801 | $ | 2,457 | $ | - | |
| December 31, 2012 | ||||||||
(in thousands) | Total | Level 1 | Level 2 | Level 3 | ||||
Trade receivables from provisional concentrate sales, net of fair value adjustment | $ | 5,909 | $ | - | $ | 5,909 | $ | - |
| Accrued liabilities from provisional concentrate sales related to fair value adjustment, net of trade receivable | (634) | - | (634) | - | ||||
| Long-term investments - common shares held | 118,683 | 118,683 | - | - | ||||
| Long-term investments - warrants held | 2,694 | - | 2,694 | - | ||||
| $ | 126,652 | $ | 118,683 | $ | 7,969 | $ | - | |
The Company’s trade receivables and accrued liabilities from provisional concentrate sales are valued based on forward prices of silver and gold until the date of final settlement (Note 5). As such, these receivables and / or liabilities are classified within Level 2 of the fair value hierarchy.
The Company’s long-term investments in common shares held are valued using quoted market prices in active markets and, as such, are classified within Level 1 of the fair value hierarchy. The fair value of the long-term investments in common shares held is calculated as the quoted market price of the common share multiplied by the quantity of shares held by the Company.
The fair value of the Company’s long-term investments in warrants held that do not have a quoted market price is determined by using a Black-Scholes model based on assumptions including risk free interest rate, expected dividend yield, expected volatility and expected warrant life which are supported by observable current market conditions and as such are classified within Level 2 of the fair value hierarchy. The use of reasonably possible alternative assumptions would not significantly affect the Company’s results.
Cash and cash equivalents are reported at amortized cost. Other accounts receivables and accounts payables and accrued liabilities are non-interest bearing and are stated at carrying values, which approximate fair values due to the short terms to maturity. Where necessary, other receivables are reported net of allowances for uncollectable amounts.
The Company’s bank debt (Note 12) is reported at amortized cost using the effective interest method. The carrying value of the bank debt approximates its fair value.
SILVER WHEATON 2013 ANNUAL REPORT [89]
Notes to the Consolidated Financial Statements
Years Ended December 31, 2013 and 2012 (US Dollars)
| 5. | Revenue1 |
| Years Ended December 31 | ||||||
(in thousands) | 2013 | 2012 | ||||
Sales | ||||||
| Silver bullion sales | ||||||
| Silver credit sales | $ | 428,587 | 61% | $ | 611,468 | 72% |
| Concentrate sales | 116,000 | 16% | 159,700 | 19% | ||
| $ | 544,587 | 77% | $ | 771,168 | 91% | |
Gold bullion sales | ||||||
| Gold credit sales | $ | 136,965 | 19% | $ | 47,768 | 6% |
| Concentrate sales | 24,920 | 4% | 30,624 | 3% | ||
| $ | 161,885 | 23% | $ | 78,392 | 9% | |
Total sales revenue | $ | 706,472 | 100% | $ | 849,560 | 100% |
Silver and Gold Credit Sales
Under certain precious metal purchase agreements, silver and/or gold is acquired from the mine operator in the form of silver or gold credits, which is then sold through a network of third party brokers or dealers. Revenue from silver and gold credit sales is recognized at the time of the sale of such credits, which is also the date that title to the silver or gold passes to the third party dealer or broker. The Company will occasionally enter into forward contracts in relation to silver or gold deliveries that it is highly confident will occur within a given quarter. No forward contracts were outstanding at December 31, 2013 or December 31, 2012. The sales price is fixed at the delivery date based on either the terms of these short-term forward sales contracts or the spot price of silver or gold.
Concentrate Sales
Under certain precious metal purchase agreements, silver and/or gold is acquired from the mine operator in concentrate form, which is then sold under the terms of the concentrate sales contracts to third-party smelters or traders. Where the Company acquires silver or gold in concentrate form, final silver or gold prices are set on a specified future quotational period (the “Quotational Period”) pursuant to the concentrate sales contracts with third-party smelters, typically one to three months after the shipment date, based on market prices for silver or gold. Revenues and the associated cost of sales are recorded on a gross basis under these contracts at the time title passes to the buyer based on the forward price for the expected settlement period. The contracts, in general, provide for a provisional payment based upon provisional assays and quoted silver and gold prices. Final settlement is based upon the average applicable price for the Quotational Period applied to the actual number of silver or gold ounces recovered calculated using confirmed smelter weights and settlement assays. Final settlement generally occurs from three to six months after shipment. The Company’s provisionally priced sales contain an embedded derivative that is required to be separated from the host contract for accounting purposes. The host contract is the receivable from the sale of concentrates measured at the forward price at the time of sale. The embedded derivative does not qualify for hedge accounting. The embedded derivative is recorded on the balance sheet as a derivative asset in Accounts Receivable or as a derivative liability in Accounts Payable and Accrued Liabilities and is adjusted to fair value through revenue each period until the date of final settlement.
At December 31, 2013, the Company had outstanding provisionally priced sales of $6.6 million (December 31, 2012 - $12.7 million) where the quotational period pricing was estimated based on the forward price for silver. These sales consisted of 0.3 million ounces of silver (December 31, 2012 - 0.4 million ounces of silver) which had a fair value gain adjustment of approximately $0.2 million (December 31, 2012 - fair value loss adjustment of $1.1 million) associated with the embedded derivative.
1 Statements made in this section contain forward-looking information. Please see “Cautionary Note Regarding Forward-Looking Statements” in the MD&A for material risks, assumptions and important disclosure associated with this information. |
SILVER WHEATON 2013 ANNUAL REPORT [90]
Notes to the Consolidated Financial Statements
Years Ended December 31, 2013 and 2012 (US Dollars)
For each one cent per ounce increase or decrease in the realized silver price, revenue would increase or decrease by approximately $3,400 (December 31, 2012 - $3,800).
| 6. | General and Administrative |
| Years Ended December 31 | |||||
(in thousands) | Note | 2013 | 2012 | ||
Salaries and benefits | |||||
| Salaries and benefits, excluding PSUs | $ | 11,522 | $ | 10,173 | |
| PSUs | 15.1 | 646 | 1,685 | ||
| Total salaries and benefits | $ | 12,168 | $ | 11,858 | |
| Depreciation | 240 | 228 | |||
| Charitable donations | 2,710 | 1,857 | |||
| Professional fees | 3,981 | 2,981 | |||
| Other | 7,820 | 7,495 | |||
| Cash settled general and administrative | $ | 26,919 | $ | 24,419 | |
| Equity settled stock based compensation (a non-cash expense) | 8,389 | 6,420 | |||
Total general and administrative | $ | 35,308 | $ | 30,839 | |
| 7. | Other Expense (Income) |
| Years Ended December 31 | |||||
(in thousands) | Note | 2013 | 2012 | ||
Dividend income | $ | (227) | $ | (80) | |
| Interest income | (204) | (1,222) | |||
| Stand-by fees | 2,758 | 897 | |||
| Loss (gain) on long-term investments - share purchase warrants held | 9 | 2,694 | (496) | ||
| Amortization of credit facility origination fees - undrawn facilities | 12 | 1,910 | - | ||
| Write off of credit facility origination fees upon the cancellation of the Bridge Facility | 12 | 4,490 | - | ||
| Other | 129 | 84 | |||
Total other expense (income) | $ | 11,550 | $ | (817) | |
Write off of credit facility origination fees upon the cancellation of the Bridge Facility
As further explained in Note 12, on February 28, 2013, the Company entered into two new unsecured credit facilities, comprised of (i) a $1 billion revolving credit facility having a 5-year term (the “Revolving Facility”); and (ii) a $1.5 billion bridge financing facility having a 1-year term (the “Bridge Facility”). The Company paid upfront costs of $11.7 million in connection with these new facilities which have been recorded under Other assets and are being amortized over the life of the respective credit facilities. On May 28, 2013, the Bridge Facility was terminated, with the remaining unamortized upfront costs of $4.5 million associated with this credit facility being fully expensed on that date.
SILVER WHEATON 2013 ANNUAL REPORT [91]
Notes to the Consolidated Financial Statements
Years Ended December 31, 2013 and 2012 (US Dollars)
| 8. | Accounts Receivable |
| December 31 | December 31 | ||||
(in thousands) | Note | 2013 | 2012 | ||
Trade receivables from provisional concentrate sales, net of fair value adjustment | 5 | $ | 2,457 | $ | 5,909 |
| Other receivables | 2,162 | 288 | |||
Total accounts receivable | $ | 4,619 | $ | 6,197 | |
| 9. | Long-Term Investments |
| December 31 | December 31 | |||
(in thousands) | 2013 | 2012 | ||
Common shares held | $ | 40,801 | $ | 118,683 |
| Warrants held | - | 2,694 | ||
| $ | 40,801 | $ | 121,377 | |
Common Shares Held
| December 31, 2013 | ||||
| (in thousands) | Fair Value | Fair Value Adjustment Losses Included in OCI | ||
Bear Creek | $ | 18,208 | $ | (25,922) |
| Revett | 3,827 | (10,997) | ||
| Sabina | 8,030 | (23,133) | ||
| Other | 10,736 | (17,829) | ||
| $ | 40,801 | $ | (77,881) | |
SILVER WHEATON 2013 ANNUAL REPORT [92]
Notes to the Consolidated Financial Statements
Years Ended December 31, 2013 and 2012 (US Dollars)
| December 31, 2012 | ||||
| (in thousands) | Fair Value | Fair Value Adjustment Losses Included in OCI | ||
Bear Creek | $ | 44,130 | $ | (2,041) |
| Revett | 14,824 | (9,747) | ||
| Sabina | 31,164 | (13,013) | ||
| Other | 28,565 | (6,333) | ||
| $ | 118,683 | $ | (31,134) | |
Warrants Held
| December 31, 2013 | ||||
| (in thousands) | Fair Value | Fair Value Adjustment Losses Included in Net Earnings | ||
Other | $ | - | $ | (2,694) |
| December 31, 2012 | ||||
| (in thousands) | Fair Value | Fair Value Adjustment Gains Included in Net Earnings | ||
Other | $ | 2,694 | $ | 496 |
The Company’s long-term investments in common shares (“LTI’s”) are held for long-term strategic purposes and not for trading purposes. As such, the Company has elected to reflect any fair value adjustments as a component of other comprehensive income (“OCI”).
While long-term investments in warrants are also held for long-term strategic purposes, they meet the definition of a derivative and therefore are classified as financial assets with fair value adjustments being recorded as a component of net earnings under the classification Other Expense (Income). Warrants that do not have a quoted market price have been valued using a Black-Scholes option pricing model.
By holding these long-term investments, the Company is inherently exposed to various risk factors including currency risk, market price risk and liquidity risk.
During the year ended December 31, 2013, the value of the Company’s LTI’s decreased by $77.9 million. As a result of this decrease, the deferred income tax liability attributable to the LTI’s was reduced and during year ended December 31, 2013, the Company recorded a deferred income tax recovery in OCI of $1.8 million.
SILVER WHEATON 2013 ANNUAL REPORT [93]
Notes to the Consolidated Financial Statements
Years Ended December 31, 2013 and 2012 (US Dollars)
The reduction in the deferred income tax liability attributable to the LTI’s resulted in the reversal of previously recognized deferred income tax assets which increased the deferred income tax expense reflected in net earnings.
Bear Creek
At December 31, 2013, Silver Wheaton owned approximately 13.3 million (December 31, 2012 – 13.3 million) common shares of Bear Creek Mining Corporation (“Bear Creek”), representing approximately 14% (December 31, 2012 – 14%) of the outstanding shares of Bear Creek. At December 31, 2013, the fair value of the Company’s investment in Bear Creek was $18.2 million (December 31, 2012 - $44.1 million).
Revett
At December 31, 2013, Silver Wheaton owned 5.3 million (December 31, 2012 – 5.3 million) common shares of Revett Minerals Inc. (“Revett”), representing approximately 15% (December 31, 2012 – 15%) of the outstanding shares of Revett. During the year ended December 31, 2012, the Company acquired 0.3 million common shares of Revett from the exercise of 0.3 million Revett warrants for total consideration of $0.4 million. At December 31, 2013, the fair value of the Company’s investment in Revett was $3.8 million (December 31, 2012 - $14.8 million).
Sabina
At December 31, 2013, Silver Wheaton owned 11.7 million (December 31, 2012 – 11.7 million) common shares of Sabina Gold & Silver Corp. (“Sabina”), representing approximately 6% (December 31, 2012 – 7%) of the outstanding shares of Sabina. At December 31, 2013, the fair value of the Company’s investment in Sabina was $8.0 million (December 31, 2012 - $31.2 million).
Other
At December 31, 2013, Silver Wheaton owned common shares and common share purchase warrants of several other publicly traded mineral exploration, development and mining companies. As Silver Wheaton’s investment represents less than 10% of the outstanding shares of each of the respective companies and is not considered material to Silver Wheaton’s overall financial position, these investments have been reflected in the financial statements as part of Other long-term investments.
At December 31, 2013, the fair value of the Other long-term investments was $10.7 million (December 31, 2012 - $31.3 million).
SILVER WHEATON 2013 ANNUAL REPORT [94]
Notes to the Consolidated Financial Statements
Years Ended December 31, 2013 and 2012 (US Dollars)
| 10. | Silver and Gold Interests |
| December 31, 2013 | ||||||||||||||
Cost | Accumulated Depletion | Carrying Amount Dec 31, 2013 | ||||||||||||
| (in thousands) | Balance Jan 1, 2013 | Additions | Balance Dec 31, 2013 | Balance Jan 1, 2013 | Depletion | Balance Dec 31, 2013 | ||||||||
Silver interests | ||||||||||||||
| San Dimas | $ | 190,331 | $ | - | $ | 190,331 | $ | (27,395) | $ | (5,444) | $ | (32,839) | $ | 157,492 |
| Yauliyacu | 285,292 | - | 285,292 | (69,997) | (8,018) | (78,015) | 207,277 | |||||||
| Peñasquito | 524,626 | - | 524,626 | (37,354) | (14,983) | (52,337) | 472,289 | |||||||
| Barrick ¹ | 631,223 | 9,932 | 641,155 | (33,487) | (6,561) | (40,048) | 601,107 | |||||||
| Other ² | 563,114 | 127,068 | 690,182 | (108,437) | (31,818) | (140,255) | 549,927 | |||||||
| $ | 2,194,586 | $ | 137,000 | $ | 2,331,586 | $ | (276,670) | $ | (66,824) | $ | (343,494) | $ | 1,988,092 | |
Gold interests | ||||||||||||||
| 777 | $ | 354,454 | $ | 5 | $ | 354,459 | $ | (21,722) | $ | (52,711) | (74,433) | $ | 280,026 | |
| Sudbury | - | 623,864 | 623,864 | - | (14,410) | (14,410) | 609,454 | |||||||
| Salobo | - | 1,330,311 | 1,330,311 | - | (7,828) | (7,828) | 1,322,483 | |||||||
| Other ³ | 47,774 | 202 | 47,976 | (17,188) | (2,359) | (19,547) | 28,429 | |||||||
| $ | 402,228 | $ | 1,954,382 | $ | 2,356,610 | $ | (38,910) | $ | (77,308) | $ | (116,218) | $ | 2,240,392 | |
| $ | 2,596,814 | $ | 2,091,382 | $ | 4,688,196 | $ | (315,580) | $ | (144,132) | $ | (459,712) | $ | 4,228,484 | |
| 1) | Comprised of the Pascua-Lama, Lagunas Norte, Pierina and Veladero silver interests. |
| 2) | Comprised of the Los Filos, Zinkgruvan, Keno Hill, Mineral Park, Cozamin, Neves-Corvo, Stratoni, Campo Morado, Minto, 777, Aljustrel, Loma de La Plata, Constancia and Rosemont silver interests. |
| 3) | Comprised of the Minto, Constancia and Rosemont gold interests. |
| December 31, 2012 | ||||||||||||||
Cost | Accumulated Depletion | Carrying Amount Dec 31, 2012 | ||||||||||||
| (in thousands) | Balance Jan 1, 2012 | Additions | Balance Dec 31, 2012 | Balance Jan 1, 2012 | Depletion | Balance Dec 31, 2012 | ||||||||
Silver interests | ||||||||||||||
| San Dimas | $ | 190,331 | $ | - | $ | 190,331 | $ | (22,804) | $ | (4,591) | $ | (27,395) | $ | 162,936 |
| Yauliyacu | 285,292 | - | 285,292 | (55,280) | (14,717) | (69,997) | 215,295 | |||||||
| Peñasquito | 524,626 | - | 524,626 | (19,653) | (17,701) | (37,354) | 487,272 | |||||||
| Barrick ¹ | 623,809 | 7,414 | 631,223 | (22,724) | (10,763) | (33,487) | 597,736 | |||||||
| Other ² | 414,245 | 148,869 | 563,114 | (79,775) | (28,662) | (108,437) | 454,677 | |||||||
| $ | 2,038,303 | $ | 156,283 | $ | 2,194,586 | $ | (200,236) | $ | (76,434) | $ | (276,670) | $ | 1,917,916 | |
Gold interests | ||||||||||||||
| 777 | $ | - | $ | 354,454 | $ | 354,454 | $ | - | $ | (21,722) | $ | (21,722) | $ | 332,732 |
| Other ³ | 47,774 | - | 47,774 | (14,115) | (3,073) | (17,188) | 30,586 | |||||||
| $ | 47,774 | $ | 354,454 | $ | 402,228 | $ | (14,115) | $ | (24,795) | $ | (38,910) | $ | 363,318 | |
| $ | 2,086,077 | $ | 510,737 | $ | 2,596,814 | $ | (214,351) | $ | (101,229) | $ | (315,580) | $ | 2,281,234 | |
| 1) | Comprised of the Pascua-Lama, Lagunas Norte, Pierina and Veladero silver interests. |
| 2) | Comprised of the Los Filos, Zinkgruvan, Keno Hill, Mineral Park, Cozamin, Neves-Corvo, Stratoni, Campo Morado, Minto, 777, Aljustrel, Constancia, Loma de La Plata and Rosemont silver interests. |
| 3) | Comprised of the Minto and Rosemont gold interests. |
SILVER WHEATON 2013 ANNUAL REPORT [95]
Notes to the Consolidated Financial Statements
Years Ended December 31, 2013 and 2012 (US Dollars)
The value allocated to reserves is classified as depletable upon a mining operation achieving commercial production and is depleted on a unit-of-sale basis over the estimated recoverable proven and probable reserves at the mine. The value associated with resources and exploration potential is allocated at acquisition and is classified as non-depletable until such time as it is transferred to the depletable category, generally as a result of the conversion of resources or exploration potential into reserves.
| December 31, 2013 | December 31, 2012 | |||||||||||
| (in thousands) | Depletable | Non- Depletable | Total | Depletable | Non- Depletable | Total | ||||||
Silver interests | ||||||||||||
| San Dimas | $ | 26,842 | $ | 130,650 | $ | 157,492 | $ | 22,127 | $ | 140,809 | $ | 162,936 |
| Yauliyacu | 45,229 | 162,048 | 207,277 | 24,722 | 190,573 | 215,295 | ||||||
| Peñasquito | 408,420 | 63,869 | 472,289 | 380,145 | 107,127 | 487,272 | ||||||
Barrick 1, 2 | 10,356 | 590,751 | 601,107 | 13,422 | 584,314 | 597,736 | ||||||
Other 3 | 209,395 | 340,532 | 549,927 | 222,928 | 231,749 | 454,677 | ||||||
| $ | 700,242 | $ | 1,287,850 | $ | 1,988,092 | $ | 663,344 | $ | 1,254,572 | $ | 1,917,916 | |
Gold interests | ||||||||||||
| 777 | $ | 231,925 | $ | 48,101 | $ | 280,026 | $ | 281,344 | $ | 51,388 | $ | 332,732 |
| Sudbury | 421,512 | 187,942 | 609,454 | - | - | - | ||||||
| Salobo | 971,504 | 350,979 | 1,322,483 | - | - | - | ||||||
Other 4 | 20,570 | 7,859 | 28,429 | 22,281 | 8,305 | 30,586 | ||||||
| $ | 1,645,511 | $ | 594,881 | $ | 2,240,392 | $ | 303,625 | $ | 59,693 | $ | 363,318 | |
| $ | 2,345,753 | $ | 1,882,731 | $ | 4,228,484 | $ | 966,969 | $ | 1,314,265 | $ | 2,281,234 | |
| 1) | Comprised of the Pascua-Lama, Lagunas Norte, Pierina and Veladero silver interests. |
| 2) | The amount reflected as depletable is based on the value of the reserves relating to the Lagunas Norte, Pierina and Veladero silver interests. |
| 3) | Comprised of the Los Filos, Zinkgruvan, Keno Hill, Mineral Park, Cozamin, Neves-Corvo, Stratoni, Campo Morado, Minto, 777, Aljustrel, Loma de La Plata, Constancia and Rosemont silver interests. |
| 4) | Comprised of the Minto, Constancia and Rosemont gold interests. |
Salobo
On February 28, 2013, the Company entered into an agreement to acquire from Vale S.A. ("Vale") an amount of gold equal to 25% of the life of mine gold production from its currently producing Salobo mine, located in Brazil. Silver Wheaton made a total upfront cash payment of $1.33 billion on March 12, 2013 and, in addition, will make ongoing payments of the lesser of $400 per ounce of gold (subject to an inflationary adjustment of 1% beginning in the fourth year) or the prevailing market price per ounce of gold delivered.
Vale is in the process of expanding the mill throughput at the Salobo mine to 24 million tonnes per annum (“Mtpa”) from its current 12 Mtpa. If the expansion to 24 Mtpa is not completed by December 31, 2016, Silver Wheaton would be entitled to a gross up (a temporary increased percentage of gold production) based on the pro-rata achievement of the target production. If throughput capacity is expanded above 28 Mtpa within a predetermined period, Silver Wheaton will be required to make an additional payment to Vale based on a set fee schedule ranging from $67 million if throughput capacity is expanded to 28 Mtpa by January 1, 2031 up to $400 million if throughput capacity is expanded to 40 Mtpa prior to January 1, 2021.
SILVER WHEATON 2013 ANNUAL REPORT [96]
Notes to the Consolidated Financial Statements
Years Ended December 31, 2013 and 2012 (US Dollars)
The cost of the gold interest acquired is comprised of the following:
| (in thousands) | ||
| Cost: | ||
| Cash | $ | 1,330,000 |
Acquisition costs | 311 | |
| $ | 1,330,311 |
Sudbury
On February 28, 2013, the Company entered into an agreement to acquire from Vale an amount of gold equal to 70% of the gold production from certain of its currently producing Sudbury mines located in Canada, including the Coleman mine, Copper Cliff mine, Garson mine, Stobie mine, Creighton mine, Totten mine and the Victor project for a period of 20 years. Silver Wheaton made a total upfront cash payment on March 12, 2013 of $570 million plus warrants to purchase 10 million shares of Silver Wheaton common stock at a strike price of $65 per warrant, with a term of 10 years (Note 14.1). In addition, Silver Wheaton will make ongoing payments of the lesser of $400 per ounce of gold or the prevailing market price per ounce of gold delivered.
The cost of the gold interest acquired is comprised of the following:
| (in thousands) | ||
| Cost: | ||
| Cash | $ | 570,000 |
Warrants issued ¹ | 53,572 | |
Acquisition costs | 292 | |
| $ | 623,864 |
1) | The warrants issued have been valued using a Black-Scholes option pricing model with the following assumptions: (i) expected life – 10 years; (ii) expected annual volatility – 30%; (iii) risk free interest rate -1.91%; and (iv) expected dividend yield – 1.2%. |
Constancia
On August 8, 2012, the Company entered into an agreement with Hudbay Minerals Inc. ("Hudbay") to acquire an amount equal to 100% of the life of mine silver production from the Constancia project (“Constancia”) in Peru. Silver Wheaton will pay Hudbay total cash consideration of $294.9 million, of which $169.9.9 million has been paid to date, with a further payment of $125 million to be made once capital expenditures of $1 billion have been incurred at Constancia. In addition, Silver Wheaton will make ongoing payments of the lesser of $5.90 per ounce of silver (subject to an inflationary adjustment of 1% beginning in the fourth year) or the prevailing market price per ounce of silver delivered.
On November 4, 2013, the Company amended the agreement with Hudbay to include the acquisition of an amount equal to 50%1 of the gold production from Constancia for the life of mine. Silver Wheaton will pay Hudbay a total upfront cash payment of $135 million for the gold interest, which will be due once $1.35 billion in capital expenditures have been incurred at Constancia. Silver Wheaton has the option to make the $135 million payment in either cash or Silver Wheaton shares, with the number of shares to be determined at the time the payment is made2. In addition, Silver Wheaton will make ongoing payments of the lesser of $400 per ounce of gold (subject to an inflationary adjustment of 1% beginning in the fourth year) or the prevailing market price per ounce of gold delivered.
| 1 | Gold recoveries will be set at 55% for the Constancia deposit and 70% for the Pampacancha deposit until 265,000 ounces of gold have been delivered to the Company. |
| 2 | If Silver Wheaton shares are used, the number of common shares will be calculated based on the volume weighted average trading price of the Company on the Toronto Stock Exchange for the ten consecutive trading days immediately prior to the date the consideration is payable. |
SILVER WHEATON 2013 ANNUAL REPORT [97]
Notes to the Consolidated Financial Statements
Years Ended December 31, 2013 and 2012 (US Dollars)
If the Constancia processing plant fails to achieve at least 90% of expected throughput and recovery by December 31, 2020, Silver Wheaton would be entitled to a proportionate return of the upfront cash consideration relating to Constancia. Silver Wheaton will also be entitled to additional compensation in respect of the gold stream should there be a delay in achieving completion or mining the Pampacancha deposit beyond the end of 2018.
Hudbay has granted Silver Wheaton a right of first refusal on any future streaming agreement, royalty agreement, or similar transaction related to the production of silver from Constancia.
The allocation of the cost of the asset acquisition is summarized in the table below
| (in thousands) | ||
Cost: | ||
Silver Interest 1 | ||
| Cash | $ | 169,900 |
| Acquisition costs | 1,527 | |
Total paid to December 31, 2013 | $ | 171,427 |
Contingent liability 2 | 125,000 | |
Total cost | $ | 296,427 |
Gold Interest 3 | ||
| Acquisition costs | $ | 134 |
Contingent liability 2 | 135,000 | |
Total cost | $ | 135,134 |
| Total | $ | 431,561 |
1) | The cost of the Constancia silver interest is included under Other silver interests. |
2) | The Company is committed to pay Hudbay additional payments of $125 million and $135 million to be made once capital expenditures of $1 billion and $1.35 billion, respectively, have been incurred at Constancia. Silver Wheaton has the option to make the $135 million payment in either cash or Silver Wheaton shares. If Silver Wheaton shares are used, the number of common shares will be calculated based on the volume weighted average trading price of the Company on the Toronto Stock Exchange for the ten consecutive trading days immediately prior to the date the consideration is payable. |
3) | The cost of the Constancia gold interest is included under Other gold interests. |
777
On August 8, 2012, the Company entered into an agreement with Hudbay to acquire an amount equal to 100% of the life of mine silver and gold production from its currently producing 777 mine, located in Canada. Silver Wheaton’s share of gold production at 777 will remain at 100% until the later of the end of 2016 or the satisfaction of a completion test relating to Hudbay’s Constancia project, after which it will be reduced to 50% for the remainder of the mine life. Silver Wheaton made an upfront cash payment of $455.1 million on the closing date of September 28, 2012 and, in addition, will make ongoing payments of the lesser of $5.90 per ounce of silver and $400 per ounce of gold (both subject to an inflationary adjustment of 1% beginning in the fourth year) or the prevailing market price per ounce of silver and gold delivered. Hudbay has granted Silver Wheaton a right of first refusal on any future streaming agreement, royalty agreement, or similar transaction related to the production of silver or gold from 777.
SILVER WHEATON 2013 ANNUAL REPORT [98]
The allocation of the cost of the asset acquisition is summarized in the table below:
| (in thousands) | ||
Cost: | ||
| Cash | $ | 455,100 |
| Acquisition costs | 1,805 | |
| $ | 456,905 | |
Allocated as follows: | ||
| Silver interest ¹ | $ | 102,446 |
| Gold interest | 354,459 | |
| $ | 456,905 |
| 1) | The cost of the 777 silver interest is included under Other silver interests. |
| 11. | Early Deposit – Gold Interest |
On November 11, 2013, the Company entered into a life of mine early deposit precious metal purchase agreement (the “Early Deposit Agreement”) to acquire from Sandspring Resources Ltd. (“Sandspring”) an amount of gold equal to 10% of the gold production from its Toroparu project located in the Republic of Guyana, South America. Silver Wheaton will pay Sandspring total cash consideration of $148.5 million, of which $13.5 million has been paid to date, with the additional $135 million to be payable on an installment basis to partially fund construction of the mine. In addition, Silver Wheaton will make ongoing payments of the lesser of $400 per ounce of gold (subject to an inflationary adjustment of 1% beginning in the fourth year) or the prevailing market price per ounce of gold delivered. Under the Early Deposit Agreement, there will be a 90 day period following the delivery of a bankable definitive feasibility study, environmental study and impact assessment, and other related documents (collectively, the “Feasibility Documentation”), or after December 31, 2015 if the Feasibility Documentation has not been delivered to Silver Wheaton by such date, where Silver Wheaton may elect not to proceed with the precious metal purchase agreement, at which time Silver Wheaton will be entitled to a return of the early deposit of $11.5 million (on the basis that $2 million of the advanced $13.5 million is non-refundable) or, at Sandspring’s option, the stream percentage will be reduced from 10% to 0.774% (equivalent to the pro-rata stream based on a full purchase price of $11.5 million).
| 12. | Bank Debt |
| December 31, 2013 | ||||||||||
(in thousands) | Term Loan | NRT Loan | Revolving Facility | Bridge Facility | Total | |||||
| Current portion | $ | - | $ | - | $ | - | $ | - | $ | - |
| Long-term portion | - | 1,000,000 | - | - | 1,000,000 | |||||
Gross bank debt outstanding | $ | - | $ | 1,000,000 | $ | - | $ | - | $ | 1,000,000 |
| Less: unamortized debt issue costs¹ | - | (1,864) | - | - | (1,864) | |||||
Net bank debt outstanding | $ | - | $ | 998,136 | $ | - | $ | - | $ | 998,136 |
Interest capitalized during the period | $ | 75 | $ | 7,331 | $ | 41 | $ | 4,425 | $ | 11,872 |
| Interest expensed during the period | - | 2,958 | 1,407 | 1,718 | 6,083 | |||||
Total interest incurred during the period | $ | 75 | $ | 10,289² | $ | 1,448³ | $ | 6,143⁴ | $ | 17,955 |
| Effective interest rate | 1.11% | 1.71% | 1.87% | 3.16% | 2.04% | |||||
1) | In addition to the $1.9 million unamortized debt issue costs associated with the NRT Loan, there is $4.2 million unamortized debt issue costs associated with the Revolving Facility which have been recorded as an asset under the classification Other. |
2) | Interest costs incurred under the NRT Loan during year ended December 31, 2013 includes the amortization of debt issue costs in the amount of $456,000. |
| 3) | Interest costs incurred under the Revolving Facility during the year ended December 31, 2013 includes the amortization of debt issue costs in the amount of $77,000. |
| 4) | Interest costs incurred under the Bridge Facility during year ended December 31, 2013 includes the amortization of debt issue costs in the amount of $973,000, in addition to a funding fee of $1.5 million, with the latter representing 0.25% of the outstanding amount under the Bridge Facility at April 30, 2013. |
SILVER WHEATON 2013 ANNUAL REPORT [99]
Notes to the Consolidated Financial Statements
Years Ended December 31, 2013 and 2012 (US Dollars)
| December 31, 2012 | ||||||
(in thousands) | Term Loan | Revolving Loan | Total | |||
| Current portion | $ | 28,560 | $ | - | $ | 28,560 |
| Long-term portion | 21,500 | - | 21,500 | |||
| $ | 50,060 | $ | - | $ | 50,060 | |
Interest capitalized during the year | $ | 714 | $ | - | $ | 714 |
| Effective interest rate | 1.12% | 0.00% | 1.12% | |||
On February 28, 2013, the Company entered into two new unsecured credit facilities, comprised of (i) a $1 billion revolving credit facility having a 5-year term (the “Revolving Facility”); and (ii) a $1.5 billion bridge financing facility having a 1-year term (the “Bridge Facility”). The Revolving Facility and Bridge Facility replaced the $400 million revolving term loan and the $200 million non-revolving term loan (the “Term Loan”), with the Company repaying the $50.1 million outstanding balance on the Term Loan during the three months ended March 31, 2013. The Company paid upfront costs of $11.7 million in connection with these new facilities which have been recorded as an asset under the classification Other and are being amortized over the life of the respective credit facility.
On March 11, 2013, the Company made a drawdown on the Bridge Facility of $1.09 billion to partially fund the upfront cash payment on the acquisition of the Sudbury and Salobo gold interests (Note 10). On April 8, 2013, the Company elected to reduce the amount available under the Bridge Facility to the then outstanding balance of $1.09 billion. On April 29, 2013, the Company made a drawdown of $500 million under the Revolving Facility, using the proceeds to partially repay the amounts outstanding under the Bridge Facility, with a further repayment of $30 million being made under the Bridge Facility on May 10, 2013.
On May 28, 2013, the Company entered into a $1 billion non-revolving term loan ("NRT Loan") with a 3-year term extendable by 1 year with the unanimous consent of lenders. The $1 billion proceeds were used to repay the remaining outstanding balance of $560 million under the Bridge Facility and $440 million of the balance outstanding under the Revolving Facility. The Bridge Facility was terminated following the repayment of the outstanding balance.
The NRT Loan has been presented net of unamortized transaction costs in the amount of $1.9 million. The transaction costs are being amortized as a component of interest over the life of the facility.
The Revolving Facility can be drawn down at any time to finance acquisitions, investments or for general corporate purposes.
Amounts drawn under the Bridge Facility incurred interest at LIBOR plus 1.70%. A funding fee of 0.25% was applicable to any amounts outstanding under the Bridge Facility at April 30, 2013.
At the Company’s option, amounts drawn under the Revolving Facility and the NRT Loan incur interest based on the Company’s leverage ratio at either (i) LIBOR plus 1.20% to 2.20% or; (ii) the Bank of Nova Scotia’s Base Rate plus 0.20% to 1.20%.
SILVER WHEATON 2013 ANNUAL REPORT [100]
Notes to the Consolidated Financial Statements
Years Ended December 31, 2013 and 2012 (US Dollars)
Undrawn amounts under the Revolving Facility are subject to a stand-by fee of 0.24% to 0.44% per annum, dependent on the Company’s leverage ratio.
Under the new credit facilities, the Company is required to maintain a leverage ratio less than or equal to 3.5:1 (4.5:1 during the six month period following any acquisition greater than $400 million) and a tangible net worth greater than 80% of the tangible net worth at September 30, 2012 plus 50% of the positive net earnings for each fiscal quarter thereafter.
The Company is in compliance with the debt covenants described above.
The Company’s bank debt is classified as a financial liability and reported at amortized cost using the effective interest method.
The required principal payments under the NRT Loan and the Revolving Facility over the remaining terms are as follows:
| Fiscal Year | NRT Loan | Revolving Facility | Total | |||
| 2014 | $ | - | $ | - | $ | - |
| 2015 | - | - | - | |||
| 2016 | 1,000,000 | - | 1,000,000 | |||
| 2017 | - | - | - | |||
| 2018 | - | - | - | |||
| $ | 1,000,000 | $ | - | $ | 1,000,000 | |
SILVER WHEATON 2013 ANNUAL REPORT [101]
Notes to the Consolidated Financial Statements
Years Ended December 31, 2013 and 2012 (US Dollars)
| 13. | Issued Capital |
| | December 31 | December 31 | |||
| (US dollars in thousands) | Note | 2013 | 2012 | ||
Issued capital | |||||
Share capital issued and outstanding: 357,396,778 common shares (December 31, 2012: 354,375,852 common shares) | 13.1 | $ | 1,879,475 | $ | 1,811,577 |
| 13.1. | Shares Issued |
The Company is authorized to issue an unlimited number of common shares having no par value and an unlimited number of preference shares issuable in series. As at December 31, 2013, the Company had no preference shares outstanding.
A continuity schedule of the Company’s issued and outstanding common shares from January 1, 2012 to December 31, 2013 is presented below:
Number of Shares | Weighted Average Price | |
At January 1, 2012 | 353,499,816 | |
| Share purchase options exercised | 721,632 | Cdn$15.17 |
| Share purchase warrants exercised | 93,897 | US$20.00 |
| Restricted share units released | 60,507 | $0.00 |
At December 31, 2012 | 354,375,852 | |
| Share purchase options exercised | 415,133 | Cdn$15.65 |
| Share purchase warrants exercised | 2,586,794 | US$20.00 |
| Restricted share units released | 18,999 | $0.00 |
At December 31, 2013 | 357,396,778 |
SILVER WHEATON 2013 ANNUAL REPORT [102]
Notes to the Consolidated Financial Statements
Years Ended December 31, 2013 and 2012 (US Dollars)
| 13.2. | Dividends Declared |
During the year ended December 31, 2013, the Company declared and paid to its shareholders dividends in the amount of $0.45 per common share for total dividends of $160.0 million (2012 - $0.35 per common share for total dividends of $123.9 million).
| 14. | Reserves |
| Note | December 31 | December 31 | |||
(in thousands) | 2013 | 2012 | |||
Reserves | |||||
| Share purchase warrants | 14.1 | $ | 53,717 | $ | 7,201 |
| Share purchase options | 14.2 | 19,443 | 14,050 | ||
| Restricted share units | 14.3 | 2,833 | 2,553 | ||
| Long-term investment revaluation reserve, net of tax | 14.4 | (101,611) | (25,514) | ||
Total reserves | $ | (25,618) | $ | (1,710) | |
| 14.1. | Share Purchase Warrants |
A continuity schedule of the Company’s share purchase warrants (“warrants”) from January 1, 2012 to December 31, 2013 is presented below:
Warrants Outstanding | Weighted Average Exercise Price | Exchange Ratio | Share Purchase Warrants Reserve | ||
At January 1, 2012 | 2,713,237 | $20.00 | 1.00 | $ | 7,457 |
| Exercised | (93,897) | 20.00 | 1.00 | (256) | |
| At December 31, 2012 | 2,619,340 | $20.00 | 1.00 | $ | 7,201 |
| Issued | 10,000,000 | 65.00 | 1.00 | 53,572 | |
| Exercised | (2,586,794) | 20.00 | 1.00 | (7,056) | |
| Expired | (32,546) | 20.00 | 1.00 | - | |
At December 31, 2013 | 10,000,000 | $65.00 | 1.00 | $ | 53,717 |
The warrants with an exercise price of $20.00, which traded on the TSX under the symbol SLW.WT.U, expired on September 5, 2013.
In connection with the Company’s acquisition of the Sudbury gold purchase agreement (Note 10), on February 28, 2013, the Company issued to Vale warrants to purchase 10 million shares of Silver Wheaton common stock at an exercise price of $65 per warrant. The warrants, which expire on February 28, 2023, were valued using a Black-Scholes option pricing model.
Each warrant entitles the holder the right to purchase one of the Company’s common shares.
| 14.2. | Share Purchase Options |
The Company has established an equity settled share purchase option plan whereby the Company’s Board of Directors may, from time to time, grant options to employees or consultants. The maximum term of any share purchase option may be ten years, but generally options are granted for five years. The exercise price of an option is not less than the closing price on the TSX on the last trading day preceding the grant date. The vesting period of the options is determined at the discretion of the Company’s Board of Directors at the time the options are granted, but generally vest over a period of two years.
SILVER WHEATON 2013 ANNUAL REPORT [103]
Notes to the Consolidated Financial Statements
Years Ended December 31, 2013 and 2012 (US Dollars)
Each share purchase option converts into one ordinary share of Silver Wheaton on exercise. No amounts are paid or payable by the recipient on receipt of the option. The options do not carry rights to dividends or voting rights. Options may be exercised at any time from the date of vesting to the date of their expiry, subject to certain black-out periods.
The Company expenses the fair value of share purchase options that are expected to vest on a straight-line basis over the vesting period using the Black-Scholes option pricing model to estimate the fair value for each option at the date of grant. The Black-Scholes model was developed for use in estimating the fair value of traded options that have no vesting restrictions. The model requires the use of subjective assumptions, including expected stock price volatility; historical data has been considered in setting the assumptions. Expected volatility is determined by considering the trailing 30-month historic average share price volatility. The weighted average fair value of share purchase options granted and principal assumptions used in applying the Black-Scholes option pricing model are as follows:
| Years Ended December 31 | ||
| 2013 | 2012 | |
Black-Scholes weighted average assumptions | ||
| Grant date share price and exercise price | Cdn$31.29 | Cdn$32.29 |
| Expected dividend yield | 1.12% | 1.21% |
| Expected volatility | 40% | 45% |
| Risk-free interest rate | 1.07% | 1.20% |
| Expected option life, in years | 2.5 | 2.5 |
Weighted average fair value per option granted | Cdn$7.50 | Cdn$8.66 |
A continuity schedule of the Company’s share purchase options reserve from January 1, 2012 to December 31, 2013 is presented below:
| (in thousands) | Share Purchase Options Reserve |
At January 1, 2012 | $ 12,314 |
| Recognition of fair value of share purchase options issued | 5,191 |
| Share purchase options exercised | (3,455) |
| At December 31, 2012 | $ 14,050 |
| Recognition of fair value of share purchase options issued | 7,454 |
| Share purchase options exercised | (2,061) |
At December 31, 2013 | $ 19,443 |
During the year ended December 31, 2013, the Company issued 1,213,000 share purchase options with a weighted average exercise price of Cdn$31.29 and a fair value of $8.9 million or Cdn$7.50 per option. For the comparable period in 2012, the Company issued 591,000 share purchase options with a weighted average exercise price of Cdn$32.29 and a fair value of $5.1 million or Cdn$8.66 per option.
Equity settled stock based compensation expense during the year ended December 31, 2013 included the recognition of $7.5 million of the fair value of the share purchase options issued, compared to $5.2 million during the comparable period in 2012.
SILVER WHEATON 2013 ANNUAL REPORT [104]
Notes to the Consolidated Financial Statements
Years Ended December 31, 2013 and 2012 (US Dollars)
At December 31, 2013, there were 3,029,762 share purchase options outstanding with a weighted average exercise price of Cdn$27.28 per option. For the comparable period in 2012, there were 2,331,695 share purchase options outstanding with a weighted average exercise price of Cdn$23.91 per option.
The following table summarizes information about the options outstanding and exercisable at December 31, 2013:
Exercise Price (Cdn$) | Exercisable Options | Non-Exercisable Options | Total Options Outstanding | Weighted Average Remaining Contractual Life |
$9.08 | 261,665 | - | 261,665 | 0.1 years |
| $15.89 | 534,164 | - | 534,164 | 1.2 years |
| $15.95 | 33,333 | - | 33,333 | 1.2 years |
| $23.45 | - | 70,000 | 70,000 | 4.4 years |
| $23.80 | - | 3,000 | 3,000 | 4.4 years |
| $25.72 | - | 20,000 | 20,000 | 4.7 years |
| $28.14 | 40,000 | 40,000 | 80,000 | 3.5 years |
| $28.59 | 40,000 | 40,000 | 80,000 | 3.4 years |
| $29.50 | 100,000 | - | 100,000 | 3.0 years |
| $30.51 | 7,500 | 7,500 | 15,000 | 3.6 years |
| $31.20 | - | 109,000 | 109,000 | 4.2 years |
| $31.88 | - | 1,011,000 | 1,011,000 | 4.2 years |
| $33.03 | 10,000 | - | 10,000 | 2.4 years |
| $33.71 | 178,450 | 178,450 | 356,900 | 3.2 years |
| $34.17 | 118,100 | - | 118,100 | 2.4 years |
| $34.55 | 5,000 | 5,000 | 10,000 | 4.0 years |
| $39.25 | 5,000 | 5,000 | 10,000 | 3.9 years |
| $41.58 | 207,600 | - | 207,600 | 2.2 years |
| 1,540,812 | 1,488,950 | 3,029,762 | 2.9 years |
SILVER WHEATON 2013 ANNUAL REPORT [105]
Notes to the Consolidated Financial Statements
Years Ended December 31, 2013 and 2012 (US Dollars)
A continuity schedule of the Company’s outstanding share purchase options from January 1, 2012 to December 31, 2013 is presented below:
Number of Options Outstanding | Weighted Average Exercise Price | |
At January 1, 2012 | 2,561,127 | Cdn$19.60 |
| Granted (fair value - $5.1 million or Cdn$8.66 per option) | 591,000 | 32.29 |
| Exercised | (721,632) | 15.17 |
| Forfeited | (98,800) | 35.76 |
| At December 31, 2012 | 2,331,695 | Cdn$23.91 |
| Granted (fair value - $8.9 million or Cdn$7.50 per option) | 1,213,000 | 31.29 |
| Exercised | (415,133) | 15.65 |
| Expired | (92,000) | 41.58 |
| Forfeited | (7,800) | 35.85 |
At December 31, 2013 | 3,029,762 | Cdn$27.28 |
As it relates to share purchase options, during the year ended December 31, 2013, the weighted average share price at the time of exercise was Cdn$28.37 per share, as compared to Cdn$34.49 per share during the comparable period in 2012.
| 14.3. | Restricted Share Units (“RSUs”) |
RSUs give the holder the right to receive a specified number of common shares at the specified vesting date. RSUs generally vest over a period of two years. Compensation expense related to RSUs is recognized over the vesting period based upon the fair value of the Company’s common shares on the grant date and the awards that are expected to vest. The fair value is calculated with reference to the closing price of the Company’s common shares on the TSX on the business day prior to the date of grant.
RSU holders receive a cash payment based on the dividends paid on the Company’s common shares in the event that the holder of a vested RSU has elected to defer the release of the RSU to a future date. This cash payment is reflected as a component of net earnings under the classification General and Administrative.
A continuity schedule of the Company’s restricted share units reserve from January 1, 2012 to December 31, 2013 is presented below:
| (in thousands) | Restricted Share Units Reserve |
At January 1, 2012 | $ 2,510 |
| Amortization of fair value of RSUs issued | 1,229 |
| Restricted share units released | (1,186) |
| At December 31, 2012 | $ 2,553 |
| Amortization of fair value of RSUs issued | 935 |
| Restricted share units released | (655) |
At December 31, 2013 | $ 2,833 |
During the year ended December 31, 2013, the Company issued 37,500 RSUs with a fair value of $1.1 million or Cdn$30.85 per RSU. For the same period in 2012, the Company issued 33,500 RSUs with a fair value of $1.1 million or Cdn$33.71 per RSU.
SILVER WHEATON 2013 ANNUAL REPORT [106]
Notes to the Consolidated Financial Statements
Years Ended December 31, 2013 and 2012 (US Dollars)
Equity settled stock based compensation expense during the year ended December 31, 2013 included the recognition of $0.9 million of the fair value of RSUs issued, compared to $1.2 million during the comparable period in 2012.
At December 31, 2013, there were 148,692 RSUs outstanding. For the comparable period in 2012, there were 130,191 RSUs outstanding.
| 14.4. | Long-Term Investment Revaluation Reserve |
The Company’s long-term investments in common shares (Note 9) are held for long-term strategic purposes and not for trading purposes. Upon the application of IFRS 9, Financial Instruments, the Company has chosen to designate these long-term investments in common shares as financial assets with fair value adjustments being recorded as a component of OCI as it believes that this provides a more meaningful presentation for long-term strategic investments, rather than reflecting changes in fair value as a component of net earnings. As some of these long-term investments are denominated in Canadian dollars, changes in their fair value is affected by both the change in share price in addition to changes in the Cdn$/US$ exchange rate.
Where the fair value of a long-term investment in common shares held exceeds its tax cost, the Company recognizes a deferred income tax liability. To the extent that the value of the long-term investment subsequently declines, the deferred income tax liability is reduced. However, where the fair value of the long-term investment decreases below the tax cost, the Company does not recognize a deferred income tax asset on the unrealized capital loss unless it is probable that the Company will generate future capital gains to offset the loss.
A continuity schedule of the Company’s long-term investment revaluation reserve from January 1, 2012 to December 31, 2013 is presented below:
Change in Fair Value due to: | ||||
| (in thousands) | Share Price | Foreign Exchange | Tax Effect | Total |
At January 1, 2012 | $ (14,862) | $ 21,726 | $ (3,723) | $ 3,141 |
Unrealized (loss) gain on LTI's 1 | (34,806) | 3,672 | - | (31,134) |
| Deferred income tax recovery | - | - | 2,479 | 2,479 |
| At December 31, 2012 | $ (49,668) | $ 25,398 | $ (1,244) | $ (25,514) |
Unrealized loss on LTI's 1 | (74,076) | (3,805) | - | (77,881) |
| Deferred income tax recovery | - | - | 1,784 | 1,784 |
At December 31, 2013 | $(123,744) | $ 21,593 | $ 540 | $(101,611) |
1) | LTI’s refers to long-term investments in common shares held. |
| 15. | Stock Based Compensation |
The Company’s stock based compensation consists of share purchase options (Note 14.2), restricted share units (Note 14.3) and performance share units (Note 15.1). The accrued value of share purchase options and restricted share units are reflected as reserves in the shareholder’s equity section of the Company’s balance sheet while the accrued value associated with performance share units is reflected as an accrued liability.
| 15.1. | Performance Share Units (���PSUs”) |
The Company has established a Performance Share Unit Plan (“the PSU plan”) whereby PSUs will be issued to eligible employees as determined by the Company’s Board of Directors or the Company’s Compensation Committee. PSUs issued under the PSU plan entitle the holder to a cash payment at the end of a three year performance period equal to the number of PSUs granted, multiplied by a performance factor and multiplied by the fair market value of a Silver Wheaton common share on the expiry of the performance period.
SILVER WHEATON 2013 ANNUAL REPORT [107]
Notes to the Consolidated Financial Statements
Years Ended December 31, 2013 and 2012 (US Dollars)
The performance factor can range from 0% to 200% and is determined by comparing the Company’s total shareholder return to those achieved by various peer companies, the price of silver and the Philadelphia Gold and Silver Index.
The PSUs accumulate dividend equivalents in the form of additional units based on the dividends paid on the Company’s common shares. Compensation expense for the PSUs is recorded on a straight-line basis over the three year vesting period. The amount of compensation expense is adjusted at the end of each reporting period to reflect (i) the fair value of common shares; (ii) the number of PSUs anticipated to vest; and (iii) the anticipated performance factor.
During the year ended December 31, 2013, the Company issued 163,000 PSUs as compared to 76,700 PSUs during the comparable period of the previous year.
General and administrative expense during the year ended December 31, 2013 included a $0.6 million accrual related to the anticipated fair value of the PSUs issued using a performance factor ranging from 85% to 144%, compared to a $1.7 million accrual during the comparable period in 2012 using a performance factor ranging from 132% to 167%.
A continuity schedule of the Company’s outstanding PSUs (assuming a performance factor of 100% is achieved over the performance period) from January 1, 2012 to December 31, 2013 is presented below:
Number of PSUs outstanding | |
At January 1, 2012 | 41,913 |
| Granted | 76,700 |
| Forfeited | (10,774) |
| Dividend equivalent participation | 1,172 |
| At December 31, 2012 | 109,011 |
| Granted | 163,000 |
| Dividend equivalent participation | 4,901 |
At December 31, 2013 | 276,912 |
| 16. | Earnings Per Share (“EPS”) and Diluted Earnings Per Share (“Diluted EPS”) |
Diluted earnings per share is calculated using the treasury method which assumes that outstanding share purchase options and warrants, with exercise prices that are lower than the average market price for the relevant period, are exercised and the proceeds are used to purchase shares of the Company at the average market price of the common shares for the relevant period.
Diluted EPS is calculated based on the following weighted average number of shares outstanding:
| Years Ended December 31 | ||
(in thousands) | 2013 | 2012 |
Basic weighted average number of shares outstanding | 355,588 | 353,874 |
| Effect of dilutive securities | ||
| Share purchase options | 463 | 934 |
| Share purchase warrants | 402 | 1,061 |
| Restricted share units | 142 | 139 |
Diluted weighted average number of shares outstanding | 356,595 | 356,008 |
SILVER WHEATON 2013 ANNUAL REPORT [108]
Notes to the Consolidated Financial Statements
Years Ended December 31, 2013 and 2012 (US Dollars)
The following table lists the number of share purchase options and share purchase warrants excluded from the computation of diluted earnings per share because the exercise prices exceeded the average market value of the common shares of Cdn$26.41, compared to Cdn$32.95 for the comparable period in 2012.
| Years Ended December 31 | ||
(in thousands) | 2013 | 2012 |
Share purchase options | 2,108 | 812 |
| Share purchase warrants | 10,000 | - |
Total | 12,108 | 812 |
| 17. | Supplemental Cash Flow Information |
| Years Ended December 31 | ||||
(in thousands) | 2013 | 2012 | ||
Change in non-cash working capital | ||||
| Accounts receivable | $ | 1,549 | $ | (2,307) |
| Accounts payable and accrued liabilities | (582) | 12,418 | ||
| Other | 121 | 255 | ||
Total change in non-cash working capital | $ | 1,088 | $ | 10,366 |
| December 31 | December 31 | ||||
(in thousands) | 2013 | 2012 | |||
Cash and cash equivalents comprised of: | |||||
| Cash | $ | 95,823 | $ | 375,262 | |
| Cash equivalents | - | 402,954 | |||
Total cash and cash equivalents | $ | 95,823 | $ | 778,216 | |
Cash equivalents include short-term deposits, treasury bills, commercial paper, bankers’ depository notes and bankers’ acceptances with terms to maturity of less than three months.
SILVER WHEATON 2013 ANNUAL REPORT [109]
Notes to the Consolidated Financial Statements
Years Ended December 31, 2013 and 2012 (US Dollars)
| 18. | Related Party Transactions |
Compensation of Key Management Personnel
Key management personnel compensation, including directors, is as follows:
| Years Ended December 31 | |||||
(in thousands) | 2013 | 2012 | |||
Short-term benefits 1 | $ | 6,480 | $ | 6,678 | |
| Post-employment benefits | 47 | 57 | |||
| Cash settled stock based compensation | 423 | 1,311 | |||
| Equity settled stock based compensation (a non-cash expense) | 5,273 | 4,232 | |||
Total executive compensation | $ | 12,223 | $ | 12,278 | |
1) Short-term employee benefits include salaries, bonuses payable within twelve months of the balance sheet date and other annual employee benefits. | |||||
| 19. | Post-Employment Benefit Costs |
The Company sponsors a Group Registered Retirement Savings Plan (“RRSP”) for all qualified employees. Participants in the plan can elect to contribute up to the lesser of (i) 50% of the RRSP contribution limit as established under the Canadian Income Tax Act or (ii) 9% of their annual base salary, and the Company will match this contribution. The assets of the Group RRSP are held separately from those of the Company in independently administered funds.
General and administrative expense during 2013 included $208,000 of contributions to the Group RRSP plan made by the Company, as compared to $197,000 during 2012.
| 20. | Income Taxes |
Income tax recognized in net earnings is comprised of the following:
| Years Ended December 31 | ||||
(in thousands) | 2013 | 2012 | ||
Current income tax expense related to foreign jurisdictions | $ | 154 | $ | 725 |
Deferred income tax (recovery) expense | ||||
Origination and reversal of temporary differences 1 | $ | (7,381) | $ | 11,614 |
| Write down (reversal of write down) of previously recognized temporary differences | 2,106 | 2,416 | ||
| $ | (5,275) | $ | 14,030 | |
Income tax (recovery) expense recognized in net earnings | $ | (5,121) | $ | 14,755 |
1) | During the year ended December 31, 2013, the Company changed its estimated tax rate associated with the temporary difference related to capitalized interest on certain of the Company’s precious metal purchase agreements, resulting in the reversal of a deferred tax liability in the amount of $9.9 million. |
SILVER WHEATON 2013 ANNUAL REPORT [110]
Notes to the Consolidated Financial Statements
Years Ended December 31, 2013 and 2012 (US Dollars)
Income tax recognized in OCI is comprised of the following:
| Years Ended December 31 | ||||
(in thousands) | 2013 | 2012 | ||
Deferred income tax recovery related to the losses on long-term investments - common shares held | $ | (1,784) | $ | (2,479) |
The provision for income taxes differs from the amount that would be obtained by applying the statutory income tax rate to consolidated earnings before income taxes due to the following:
| Years Ended December 31 | ||||
(in thousands) | 2013 | 2012 | ||
Earnings before income taxes | $ | 370,374 | $ | 600,791 |
| Canadian federal and provincial income tax rates¹ | 25.75% | 25.00% | ||
| Income tax expense based on above rates | $ | 95,371 | $ | 150,198 |
| Non-deductible portion of capital losses (non-taxable portion of capital gains) | 347 | (62) | ||
| Non-deductible stock based compensation and other | 2,533 | 1,639 | ||
| Differences in tax rates in foreign jurisdictions | (105,498) | (139,436) | ||
| Impact of tax rate changes | (66) | - | ||
| Change in unrecognized temporary differences | 2,192 | 2,416 | ||
Income tax (recovery) expense | $ | (5,121) | $ | 14,755 |
1) | The BC corporate tax rate increased from 10% to 11% on April 1, 2013, resulting in an increase in the Company’s statutory tax rate from 25% to 25.75% for 2013. |
The majority of the Company’s income generating activities, including the sale of silver and gold, is conducted by its 100% owned subsidiaries SW Caymans and, prior to the current year, SST Barbados. SW Caymans operates in the Cayman Islands and is subject to a statutory tax rate of 0% and SST Barbados operated in Barbados and was subject to a statutory tax rate of between 0.5% and 2.5%.
SILVER WHEATON 2013 ANNUAL REPORT [111]
Notes to the Consolidated Financial Statements
Years Ended December 31, 2013 and 2012 (US Dollars)
The movement in deferred income tax assets and liabilities for the years ended December 31, 2013 and December 31, 2012 is shown below:
| Year Ended December 31, 2013 | ||||||||||
Opening Balance | Recovery (Expense) Recognized In Net Earnings | Recovery Recognized In OCI | Recognized In Shareholders' Equity | Closing Balance | ||||||
| Recognized deferred income tax assets and liabilities | ||||||||||
Deferred tax assets | ||||||||||
| Non-capital losses | $ | 9,419 | $ | 3,018 | $ | - | $ | - | $ | 12,437 |
| Financing fees | 1,279 | 446 | - | - | 1,725 | |||||
| Capital losses | 2,304 | (2,304) | - | - | - | |||||
| Other | 669 | 664 | - | - | 1,333 | |||||
| Deferred tax liabilities | ||||||||||
| Interest capitalized for accounting | (9,949) | 9,865 | - | - | (84) | |||||
| Foreign exchange on debt | (268) | 268 | - | - | - | |||||
| Long-term investments | (2,036) | 252 | 1,784 | - | - | |||||
| Silver and gold interests | (10,668) | (6,879) | - | - | (17,547) | |||||
| Other | - | (55) | - | - | (55) | |||||
Total | $ | (9,250) | $ | 5,275 | $ | 1,784 | $ | - | $ | (2,191) |
| Year Ended December 31, 2012 | ||||||||||
| Recognized deferred income tax assets and liabilities | Opening Balance | Recovery (Expense) Recognized In Net Earnings | Recovery Recognized In OCI | Recognized In Shareholders' Equity | Closing Balance | |||||
Deferred tax assets | ||||||||||
| Non-capital losses | $ | 12,738 | $ | (3,319) | $ | - | $ | - | $ | 9,419 |
| Financing fees | 2,695 | (1,416) | - | - | 1,279 | |||||
| Capital losses | 4,846 | (2,542) | - | - | 2,304 | |||||
| Other | 290 | 379 | - | - | 669 | |||||
| Deferred tax liabilities | ||||||||||
| Interest capitalized for accounting | (10,129) | 180 | - | - | (9,949) | |||||
| Foreign exchange on debt | (421) | 153 | - | - | (268) | |||||
| Long-term investments | (4,425) | (90) | 2,479 | - | (2,036) | |||||
| Silver and gold interests | (3,293) | (7,375) | - | - | (10,668) | |||||
Total | $ | 2,301 | $ | (14,030) | $ | 2,479 | $ | - | $ | (9,250) |
SILVER WHEATON 2013 ANNUAL REPORT [112]
Notes to the Consolidated Financial Statements
Years Ended December 31, 2013 and 2012 (US Dollars)
The recognized deferred income tax assets and liabilities are offset on the balance sheet. Deferred income tax assets in Canada not recognized are shown below:
| December 31 | December 31 | |||
| 2013 | 2012 | |||
Capital losses | $ | 8,747 | $ | 6,386 |
| Unrealized losses on long-term investments | 14,298 | 5,712 | ||
Total | $ | 23,045 | $ | 12,098 |
The temporary difference relating to investments in foreign subsidiaries that would be taxable on repatriation is $27 million. As the Company can control the timing of and manner in which funds are repatriated and it does not plan to repatriate funds to Canada in the foreseeable future that would be subject to tax, no deferred income tax liability has been recognized.
At December 31, 2013, the Company has available non-capital losses for Canadian income tax purposes which may be carried forward to reduce taxable income in future years. If not utilized, the non-capital losses in the amount of $47.9 million will expire as follows: 2028 – $27.8 million, 2029 - $9.4 million, 2033 - $10.7 million. In addition, the Company has available net capital losses of $33.6 million for Canadian income tax purposes which may be carried forward indefinitely to reduce taxable capital gains in future years.
SILVER WHEATON 2013 ANNUAL REPORT [113]
Notes to the Consolidated Financial Statements
Years Ended December 31, 2013 and 2012 (US Dollars)
| 21. | Commitments and Contingencies1 |
The following table summarizes the Company’s commitments to pay for silver and gold to which it has the contractual right pursuant to the precious metal purchase agreements:
Silver and Gold Interests | Attributable Payable Production to be Purchased | Per Ounce Cash Payment 1, 2 | Term of Agreement | Date of Contract | ||||
Silver | Gold | Silver | Gold | |||||
San Dimas | 100% ³ | 0% | $ | 4.16 | n/a | Life of Mine | 15-Oct-04 | |
| Yauliyacu | 100% ⁴ | 0% | $ | 4.12 | n/a | 20 years | 23-Mar-06 | |
| Peñasquito | 25% | 0% | $ | 4.02 | n/a | Life of Mine | 24-Jul-07 | |
| 777 | 100% | 100%/50% ⁵ | $ | 5.90⁶ | $ | 400⁶ | Life of Mine | 8-Aug-12 |
| Salobo | 0% | 25% | n/a | $ | 400 | Life of Mine | 28-Feb-13 | |
| Sudbury | 0% | 70% | n/a | $ | 400 | 20 years | 28-Feb-13 | |
| Barrick | ||||||||
| Pascua-Lama | 25% | 0% | $ | 3.90 | n/a | Life of Mine | 8-Sep-09 | |
| Lagunas Norte | 100% | 0% | $ | 3.90 | n/a | 6 years ⁷ | 8-Sep-09 | |
| Pierina | 100% | 0% | $ | 3.90 | n/a | 6 years ⁷ | 8-Sep-09 | |
| Veladero | 100% ⁸ | 0% | $ | 3.90 | n/a | 6 years ⁷ | 8-Sep-09 | |
| Other | ||||||||
Los Filos 3 | 100% | 0% | $ | 4.20 | n/a | 25 years | 15-Oct-04 | |
| Zinkgruvan | 100% | 0% | $ | 4.21 | n/a | Life of Mine | 8-Dec-04 | |
| Stratoni | 100% | 0% | $ | 4.06 | n/a | Life of Mine | 23-Apr-07 | |
| Minto | 100% | 100% ⁹ | $ | 4.02 | $ | 309 | Life of Mine | 20-Nov-08 |
| Cozamin | 100% | 0% | $ | 4.16 | n/a | 10 years | 4-Apr-07 | |
| Neves-Corvo | 100% | 0% | $ | 4.06 | n/a | 50 years | 5-Jun-07 | |
| Aljustrel | 100% | 0% | $ | 4.02 | n/a | 50 years | 5-Jun-07 | |
| Mineral Park | 100% | 0% | $ | 3.94 | n/a | Life of Mine | 17-Mar-08 | |
| Campo Morado | 75% | 0% | $ | 3.98 | n/a | Life of Mine | 13-May-08 | |
| Keno Hill | 25% | 0% | $ | 3.90 | n/a | Life of Mine | 2-Oct-08 | |
| Rosemont | 100% | 100% | $ | 3.90 | $ | 450 | Life of Mine | 10-Feb-10 |
| Loma de La Plata | 12.5% | 0% | $ | 4.00 | n/a | Life of Mine | n/a ¹⁰ | |
| Constancia | 100% | 50% ¹¹ | $ | 5.90⁶ | $ | 400⁶ | Life of Mine | 8-Aug-12 |
| Early Deposit | ||||||||
| Toroparu | 100% | 10% ¹² | n/a | $ | 400 | Life of Mine | 11-Nov-13 | |
| 1) | Subject to an annual inflationary adjustment with the exception of Loma de La Plata and Sudbury. |
| 2) | Should the prevailing market price for silver or gold be lower than this amount, the per ounce cash payment will be reduced to the prevailing market price, with the exception of Yauliyacu. |
| 3) | Until August 6, 2014, Silver Wheaton is committed to purchase from Primero a per annum amount equal to the first 3.5 million ounces of payable silver produced at San Dimas and 50% of any excess, plus Silver Wheaton is committed to purchase an additional 1.5 million ounces of silver per annum to be delivered by Goldcorp for a per ounce cash payment equal to that applicable under the Los Filos silver purchase agreement. After August 6, 2014, Silver Wheaton is committed to purchase from Primero a per annum amount equal to the first 6 million ounces of payable silver produced at San Dimas and 50% of any excess. |
| 4) | To a maximum of 4.75 million ounces per annum. In the event that silver sold and delivered to Silver Wheaton in any year totals less than 4.75 million ounces, the amount sold and delivered to Silver Wheaton in subsequent years will be increased to make up for any cumulative shortfall, to the extent production permits. The cumulative shortfall as at March 23, 2013, representing the seven year anniversary, was 15.2 million ounces. |
| 5) | The Company’s share of gold production at 777 will remain at 100% until the later of the end of 2016 or the satisfaction of a completion test relating to Hudbay’s Constancia project, after which it will be reduced to 50% for the remainder of the mine life. |
| 6) | Subject to an increase to $9.90 per ounce of silver and $550 per ounce of gold after the initial 40 year term. |
| 7) | The Company is committed to purchase silver production from the currently producing mines until December 31, 2016. |
| 8) | Silver Wheaton's attributable silver production is subject to a maximum of 8% of the silver contained in the ore processed at Veladero during the period. |
| 9) | The Company is committed to acquire 100% of the first 30,000 ounces of gold produced per annum and 50% thereafter. |
| 10) | Terms of the agreement not yet finalized. |
| 11) | Gold recoveries will be set at 55% for the Constancia deposit and 70% for the Pampacancha deposit until 265,000 ounces of gold have been delivered to the Company. |
| 12) | During the 90 day period following the delivery of a bankable definitive feasibility study, environmental study and impact assessment, and other related documents (collectively, the “Feasibility Documentation”), or after December 31, 2015 if the Feasibility Documentation has not been delivered to Silver Wheaton by such date, Silver Wheaton may elect not to proceed with the precious metal purchase agreement, at which time Silver Wheaton will be entitled to a return of the early deposit of $11.5 million (on the basis that $2 million of the advanced $13.5 million is non-refundable) or, at Sandspring’s option, the stream percentage will be reduced from 10% to 0.774% (equivalent to the pro-rata stream based on a full purchase price of $11.5 million). |
1 | Statements made in this section contain forward-looking information. Please see “Cautionary Note Regarding Forward-Looking Statements” in the MD&A for material risks, assumptions and important disclosure associated with this information. |
SILVER WHEATON 2013 ANNUAL REPORT [114]
Notes to the Consolidated Financial Statements
Years Ended December 31, 2013 and 2012 (US Dollars)
Other Contractual Obligations and Contingencies
| Obligations With Scheduled Payment Dates | Other Commitments | |||||||||||||
(in thousands) | 2014 | 2015 - 2017 | 2018 - 2019 | After 2019 | Sub-Total | Total | ||||||||
Bank debt ¹ | $ | - | $ | 1,000,000 | $ | - | $ | - | $ | 1,000,000 | $ | - | $ | 1,000,000 |
| Interest ² | 14,620 | 23,620 | - | - | 38,240 | - | 38,240 | |||||||
| Silver and gold interest payments ³ | ||||||||||||||
| Rosemont | - | - | - | - | - | 231,150 | 231,150 | |||||||
| Loma de La Plata | - | - | - | - | - | 32,400 | 32,400 | |||||||
| Constancia | - | - | - | - | - | 260,000 | 260,000 | |||||||
| Toroparu | - | - | - | - | - | 135,000 | 135,000 | |||||||
| Operating leases | 485 | 3,500 | 2,162 | 5,680 | 11,827 | - | 11,827 | |||||||
Total contractual obligations | $ | 15,105 | $ | 1,027,120 | $ | 2,162 | $ | 5,680 | $ | 1,050,067 | $ | 658,550 | $ | 1,708,617 |
| 1) | At December 31, 2013, the Company had $1.0 billion outstanding on the NRT Loan and $Nil outstanding on the Revolving Facility. |
| 2) | As the applicable interest rates are floating in nature, the interest charges are estimated based on market-based forward interest rate curves at the end of the reporting period. |
| 3) | Does not reflect the contingent payment due related to the Salobo gold purchase agreement (see Salobo section, below). |
| 4) | Includes contingent transaction costs of $1.1 million. |
Rosemont
In connection with the Rosemont precious metal purchase agreement, the Company is committed to pay Augusta Resource Corporation total upfront cash payments of $230 million, payable on an installment basis to partially fund construction of the Rosemont mine once certain milestones are achieved, including the receipt of key permits and securing the necessary financing to complete construction of the mine.
Loma de La Plata
In connection with the Company’s election to convert the debenture with Pan American Silver Corp. (“Pan American”) into a silver purchase agreement, the Company is committed to pay Pan American total upfront cash payments of $32.4 million following the satisfaction of certain conditions, including Pan American receiving all necessary permits to proceed with the mine construction.
Constancia
In connection with the Constancia precious metal purchase agreement, the Company is committed to pay Hudbay additional payments of $125 million and $135 million to be made once capital expenditures of $1 billion and $1.35 billion, respectively, have been incurred at Constancia. Silver Wheaton has the option to make the $135 million payment in either cash or Silver Wheaton shares, with the number of shares to be determined at the time the payment is made1.
Salobo
Vale is in the process of expanding the mill throughput capacity at the Salobo mine (Note 10) to 24 million tonnes per annum (“Mtpa”) from its current 12 Mtpa. If throughput capacity is expanded above 28 Mtpa within a predetermined period, Silver Wheaton will be required to make an additional payment to Vale based on a set fee schedule ranging from $67 million if throughput capacity is expanded to 28 Mtpa by January 1, 2031 up to $400 million if throughput capacity is expanded to 40 Mtpa prior to January 1, 2021.
| 1 | If Silver Wheaton shares are used, the number of common shares will be calculated based on the volume weighted average trading price of the Company on the Toronto Stock Exchange for the ten consecutive trading days immediately prior to the date the consideration is payable. |
SILVER WHEATON 2013 ANNUAL REPORT [115]
Notes to the Consolidated Financial Statements
Years Ended December 31, 2013 and 2012 (US Dollars)
Toroparu
In connection with the Toroparu early deposit precious metal purchase agreement, the Company is committed to pay Sandspring additional payments of $135 million on an installment basis to partially fund construction of the mine. During the 90 day period following the delivery of the Feasibility Documentation, or after December 31, 2015 if the Feasibility Documentation has not been delivered to Silver Wheaton by such date, Silver Wheaton may elect not to proceed with the precious metal purchase agreement, at which time Silver Wheaton will be entitled to a return of the early deposit of $11.5 million (on the basis that $2 million of the advanced $13.5 million is non-refundable) or, at Sandspring’s option, the stream percentage will be reduced from 10% to 0.774% (equivalent to the pro-rata stream based on a full purchase price of $11.5 million).
Other1
Due to the size, complexity and nature of the Company’s operations, various legal and tax matters are outstanding from time to time, including an audit (the “CRA Audit”) by the Canada Revenue Agency (the “CRA”) of the Company’s international transactions covering the 2005 to 2010 taxation years, which is currently ongoing. The Company has not received any notice of reassessment for the 2005 to 2010 taxation years in connection with the CRA Audit. In the event that CRA issues one or more notices of reassessment for material amounts of tax, interest and penalties, the Company is prepared to vigorously defend its position.
By their nature, contingencies will only be resolved when one or more future events occur or fail to occur. The assessment of contingencies inherently involves the exercise of significant judgment and estimates of the outcome of future events. Based on information available to management at March 20, 2014, the outstanding legal and tax matters are not expected to have a material adverse effect on the Company. However, if the Company is unable to resolve any of these matters favorably, or if CRA issues one or more notices of reassessment for material amounts of tax, interest and penalties, there may be a material adverse impact on the Company’s financial performance, cash flows or results of operations. In the event that management’s estimate of the future resolution of these matters changes, the Company will recognize the effects of the changes in its consolidated financial statements in the appropriate period relative to when such changes occur.
| 1 | The assessment by management of the expected impact of the CRA Audit on the Company is “forward-looking information”. Statements in respect of the impact of the CRA Audit are based on the expectation that the Company will be successful in challenging any assessment by CRA. Statements in respect of the CRA Audit are subject to known and unknown risks including that the Company’s interpretation of, or compliance with, tax laws, is found to be incorrect. Please see “Cautionary Note Regarding Forward-Looking Statements” in the MD&A for material risks, assumptions and important disclosure associated with this information. |
SILVER WHEATON 2013 ANNUAL REPORT [116]
Notes to the Consolidated Financial Statements
Years Ended December 31, 2013 and 2012 (US Dollars)
| 22. | Segmented Information |
Operating Segments
The Company’s reportable operating segments, which are the components of the Company’s business where separate financial information is available and which are evaluated on a regular basis by the Company’s CEO, who is the Company’s chief operating decision maker, for the purpose of assessing performance, are summarized in the tables below:
| Year Ended December 31, 2013 | ||||||||||||
| Sales | Cost of Sales | Depletion | Net Earnings | Cash Flow From Operations | Total Assets | |||||||
| (in thousands) | ||||||||||||
Silver | ||||||||||||
San Dimas 1 | $ | 157,150 | $ | 27,703 | $ | 5,444 | $ | 124,003 | $ | 129,447 | $ | 157,492 |
| Yauliyacu | 33,053 | 5,742 | 8,018 | 19,293 | 27,311 | 207,277 | ||||||
| Peñasquito | 126,587 | 21,375 | 14,983 | 90,229 | 105,213 | 472,289 | ||||||
Barrick 2 | 56,834 | 8,413 | 6,561 | 41,860 | 49,597 | 601,107 | ||||||
Other 3 | 170,963 | 30,821 | 31,839 | 108,303 | 141,020 | 549,927 | ||||||
| $ | 544,587 | $ | 94,054 | $ | 66,845 | $ | 383,688 | $ | 452,588 | $ | 1,988,092 | |
Gold | ||||||||||||
| 777 | $ | 91,412 | $ | 26,303 | $ | 52,711 | $ | 12,398 | $ | 61,136 | $ | 280,026 |
| Sudbury | 23,001 | 6,952 | 14,410 | 1,639 | 16,050 | 1,322,483 | ||||||
| Salobo | 22,552 | 6,779 | 7,828 | 7,945 | 15,774 | 609,454 | ||||||
Other 4 | 24,920 | 5,264 | 2,359 | 17,297 | 19,923 | 28,429 | ||||||
| $ | 161,885 | $ | 45,298 | $ | 77,308 | $ | 39,279 | $ | 112,883 | $ | 2,240,392 | |
Total silver and gold interests | $ | 706,472 | $ | 139,352 | $ | 144,153 | $ | 422,967 | $ | 565,471 | $ | 4,228,484 |
Corporate | ||||||||||||
| General and administrative | $ | (35,308) | ||||||||||
| Other | (12,164) | |||||||||||
Total corporate | $ | (47,472) | $ | (31,338) | $ | 161,360 | ||||||
Consolidated | $ | 706,472 | $ | 139,352 | $ | 144,153 | $ | 375,495 | $ | 534,133 | $ | 4,389,844 |
| 1) | Results for San Dimas include 1.5 million ounces received from Goldcorp in connection with Goldcorp’s four year commitment to deliver to Silver Wheaton 1.5 million ounces of silver per annum resulting from their sale of San Dimas to Primero. |
| 2) | Comprised of the operating Lagunas Norte, Pierina and Veladero silver interests in addition to the non-operating Pascua-Lama silver interest. |
| 3) | Comprised of the operating Los Filos, Zinkgruvan, Keno Hill, Mineral Park, Cozamin, Neves-Corvo, Stratoni, Campo Morado, Minto, 777 and Aljustrel silver interests in addition to the non-operating Rosemont, Loma de La Plata and Constancia silver interests. |
| 4) | Comprised of the operating Minto gold interest and the non-operating Rosemont and Constancia gold interests. |
SILVER WHEATON 2013 ANNUAL REPORT [117]
Notes to the Consolidated Financial Statements
Years Ended December 31, 2013 and 2012 (US Dollars)
| Year Ended December 31, 2012 | ||||||||||||
| Sales | Cost of Sales | Depletion | Net Earnings | Cash Flow From Operations | Total Assets | |||||||
| (in thousands) | ||||||||||||
Silver | ||||||||||||
San Dimas 1 | $ | 181,906 | $ | 23,846 | $ | 4,591 | $ | 153,469 | $ | 158,060 | $ | 162,936 |
| Yauliyacu | 86,185 | 11,937 | 14,717 | 59,531 | 80,077 | 215,295 | ||||||
| Peñasquito | 186,085 | 23,860 | 17,701 | 144,524 | 162,225 | 487,272 | ||||||
Barrick 2 | 78,359 | 9,670 | 10,763 | 57,926 | 69,504 | 597,736 | ||||||
Other 3 | 238,633 | 31,485 | 28,662 | 178,486 | 204,206 | 454,677 | ||||||
| $ | 771,168 | $ | 100,798 | $ | 76,434 | $ | 593,936 | $ | 674,072 | $ | 1,917,916 | |
Gold | ||||||||||||
| 777 | $ | 47,768 | $ | 11,234 | $ | 21,722 | $ | 14,812 | $ | 40,507 | $ | 332,732 |
Other 4 | 30,624 | 5,457 | 3,073 | 22,094 | 25,059 | 30,586 | ||||||
| $ | 78,392 | $ | 16,691 | $ | 24,795 | $ | 36,906 | $ | 65,566 | $ | 363,318 | |
Total silver and gold interests | $ | 849,560 | $ | 117,489 | $ | 101,229 | $ | 630,842 | $ | 739,638 | $ | 2,281,234 |
Corporate | ||||||||||||
| General and administrative | $ | (30,839) | ||||||||||
| Other | (13,967) | |||||||||||
Total corporate | $ | (44,806) | $ | (20,234) | $ | 908,103 | ||||||
Consolidated | $ | 849,560 | $ | 117,489 | $ | 101,229 | $ | 586,036 | $ | 719,404 | $ | 3,189,337 |
| 1) | Results for San Dimas include 1.5 million ounces received from Goldcorp in connection with Goldcorp’s four year commitment to deliver to Silver Wheaton 1.5 million ounces of silver per annum resulting from their sale of San Dimas to Primero. |
| 2) | Comprised of the operating Lagunas Norte, Pierina and Veladero silver interests in addition to the non-operating Pascua-Lama silver interest. |
| 3) | Comprised of the operating Los Filos, Zinkgruvan, Keno Hill, Mineral Park, Cozamin, Neves-Corvo, Stratoni, Campo Morado, Minto, 777 and Aljustrel silver interests in addition to the non-operating Rosemont, Loma de La Plata and Constancia silver interests. |
| 4) | Comprised of the operating Minto gold interest and the non-operating Rosemont gold interest. |
SILVER WHEATON 2013 ANNUAL REPORT [118]
Notes to the Consolidated Financial Statements
Years Ended December 31, 2013 and 2012 (US Dollars)
Geographic Segments
The Company’s geographical segments, which are based on the location of the mining operations to which the silver or gold interests relate, are summarized in the tables below:
| Year Ended December 31, 2013 | ||||||
| Sales | Carrying Amount | |||||
(in thousands) | Silver Interests | Gold Interests | ||||
North America | ||||||
| Canada | $ | 165,816 | $ | 139,141 | $ | 917,707 |
| United States | 8,973 | 37,948 | - | |||
| Mexico | 342,177 | 705,062 | - | |||
| Europe | ||||||
| Greece | 17,763 | 31,854 | - | |||
| Portugal | 17,686 | 30,487 | - | |||
| Sweden | 41,618 | 51,015 | - | |||
| South America | ||||||
Argentina / Chile 1 | 28,864 | 604,384 | - | |||
| Brazil | 22,552 | - | 1,322,483 | |||
| Peru | 61,023 | 388,201 | 202 | |||
| Republic of Guyana | - | - | 13,602 | |||
Consolidated | $ | 706,472 | $ | 1,988,092 | $ | 2,253,994 |
| 1) | Includes the Pascua-Lama project, which straddles the border of Argentina and Chile. |
| Year Ended December 31, 2012 | ||||||
| Sales | Carrying Amount | |||||
| (in thousands) | Silver Interests | Gold Interests | ||||
North America | ||||||
| Canada | $ | 108,390 | $ | 149,078 | $ | 363,318 |
| United States | 17,650 | 39,018 | - | |||
| Mexico | 450,394 | 735,736 | - | |||
| Europe | ||||||
| Greece | 25,962 | 37,788 | - | |||
| Portugal | 16,707 | 32,056 | - | |||
| Sweden | 65,914 | 54,075 | - | |||
| South America | ||||||
Argentina / Chile 1 | 39,106 | 597,390 | - | |||
| Peru | 125,437 | 272,775 | - | |||
Consolidated | $ | 849,560 | $ | 1,917,916 | $ | 363,318 |
| 1) | Includes the Pascua-Lama project, which straddles the border of Argentina and Chile. |
SILVER WHEATON 2013 ANNUAL REPORT [119]
Notes to the Consolidated Financial Statements
Years Ended December 31, 2013 and 2012 (US Dollars)
| 23. | Subsequent Events |
Declaration of Dividend
On March 20, 2014, the Board of Directors declared a dividend in the amount of $0.07 per common share as per the Company’s stated dividend policy whereby the quarterly dividend will be equal to 20% of the average of the previous four quarters operating cash flow. This dividend is payable to shareholders of record on April 4, 2014 and is expected to be distributed on or about April 15, 2014.
Dividend Reinvestment Plan
On March 20, 2014, the Company announced that it will be implementing a dividend reinvestment plan whereby shareholders can elect to have dividends reinvested directly into additional Silver Wheaton common shares. It is intended that the plan will be effective commencing with the second dividend of 2014 which will be paid after the announcement of the First Quarter 2014 Earnings Results. The plan remains subject to regulatory approval.
SILVER WHEATON 2013 ANNUAL REPORT [120]
CORPORATE
INFORMATION
CANADA – HEAD OFFICE SILVER WHEATON CORP. Park Place, Suite 3150 666 Burrard Street Vancouver, BC V6C 2X8 Canada T: 1 604 684 9648 F: 1 604 684 3123 CAYMAN ISLANDS OFFICE SILVER WHEATON (CAYMANS) LTD. Unit #5 - 201 Governors Square 23 Lime Tree Bay Avenue P.O. Box 1791 George Town, Grand Cayman Cayman Islands KY1-1109 STOCK EXCHANGE LISTING Toronto Stock Exchange: SLW New York Stock Exchange: SLW DIRECTORS LAWRENCE BELL GEORGE BRACK JOHN BROUGH PETER GILLIN CHANTAL GOSSELIN DOUGLAS HOLTBY, CHAIRMAN EDUARDO LUNA WADE NESMITH RANDY SMALLWOOD OFFICERS RANDY SMALLWOOD President & Chief Executive Officer CURT BERNARDI Senior Vice President, Legal & Corporate Secretary GARY BROWN Senior Vice President & Chief Financial Officer PATRICK DROUIN Senior Vice President, Investor Relations HAYTHAM HODALY Senior Vice President, Corporate Development | TRANSFER AGENT CST TRUST COMPANY 1600 - 1066 West Hastings Street Vancouver, BC V6E 3X1 Toll-free in Canada and the United States: 1 800 387 0825 Outside of Canada and the United States: 1 416 682 3860 E: inquiries@canstockta.com AUDITORS DELOITTE LLP Vancouver, BC INVESTOR RELATIONS PATRICK DROUIN Senior Vice President, Investor Relations T: 1 604 684 9648 TF: 1 800 380 8687 E: info@silverwheaton.com | |
SILVER WHEATON CORP.
666 BURRARD STREET, SUITE 3150, VANCOUVER, BC V6C 2X8, CANADA
T: 1 604 684 9648 F: 1 604 684 3123 WWW.SILVERWHEATON.COM