CORPORATE
PROFILE
SILVER WHEATON IS THE WORLD’S LARGEST PURE PRECIOUS METALS STREAMING COMPANY. IT OFFERS INVESTORS COST CERTAINTY, LEVERAGE TO INCREASING SILVER AND GOLD PRICES, AND GROWTH FROM A HIGH-QUALITY ASSET BASE. ITS BUSINESS MODEL IS BASED ON PAYING LOW, PREDICTABLE COSTS FOR PRECIOUS METALS FROM STREAMS ON A DIVERSE PORTFOLIO OF MINES, WITH ANY INCREASES IN PRECIOUS METAL PRICES FLOWING DIRECTLY TO THE BOTTOM LINE.

2
2015 REVIEW
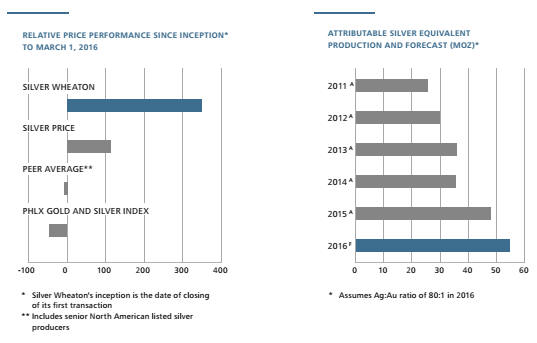
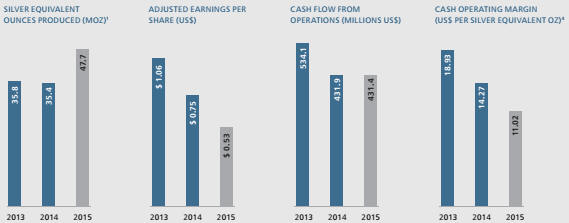
Silver Wheaton’s year over year production increased 35% and sales volume increased 26% in 2015. Attributable production was 47.7 million silver equivalent ounces, resulting in adjusted net earnings of $210.4 million ($0.53 per share) and operating cash flows of $431.4 million ($1.09 per share). With an average annual realized silver equivalent price of $15.60 per ounce, and cash operating costs1 of $4.58 per silver equivalent ounce, the cash operating margin1 in 2015 was $11.02 per silver equivalent ounce, or over 70%.
In 2016, based upon the company’s current portfolio of low-cost, long-life assets, attributable production is forecast to be approximately 54 million silver equivalent ounces, including 265,000 ounces of gold. Estimated average annual attributable production over the next five years is anticipated to be approximately 52 million silver equivalent ounces per year, including 260,000 ounces of gold.
Silver Wheaton’s future growth profile is expected to be driven by precious metal and gold streams on the Antamina, Salobo, Peñasquito and Constancia mines.
The company’s unique business model creates shareholder value by providing:
Leverage to increases in the price of silver and gold;
Organic growth through the acquisition of new streams;
A dividend yield tied to precious metal prices and our organic growth; and,
Participation in the expansion and exploration success of the mines underlying its current agreements.
Silver Wheaton offers these benefits, while seeking to reduce many of the downside risks faced by traditional mining companies. In particular, Silver Wheaton offers its investors both capital and operating cost certainty. Other than the initial upfront payment, the company typically has no ongoing capital or exploration costs. Furthermore, operating costs have been historically fixed at around $4 per ounce of silver produced and $400 per ounce of gold produced, subject to defined inflationary adjustments.
1 Refer to discussion on non-IFRS measures in the MD&A.
SILVER WHEATON 2015 ANNUAL REPORT 3
LETTER FROM
THE PRESIDENT & CEO

2015 WAS ANOTHER RECORD-BREAKING YEAR FOR SILVER WHEATON AS THE COMPANY’S ATTRIBUTABLE PRODUCTION INCREASED BY OVER 12 MILLION SILVER EQUIVALENT OUNCES AND WE CONTINUED TO GENERATE SOLID CASH FLOWS WITH CASH OPERATING MARGINS OF OVER 70%. THIS UNPRECEDENTED GROWTH WAS DRIVEN BOTH BY OUR EXISTING PORTFOLIO OF HIGH-QUALITY ASSETS AS WELL AS TACTICAL AND TIMELY ACQUISITIONS THAT DELIVERED IMMEDIATE RESULTS.
We achieved record production of 47.7 million silver equivalent ounces in 2015, significantly beating our 44.5 million forecast. This growth was driven organically by our fully-funded, high-quality portfolio of assets, along with our acquisitions of precious metals from two of the world’s best copper assets: the Salobo mine in Brazil and the Antamina mine in Peru.
While record sales volumes throughout the year were offset by significantly weaker commodity prices, Silver Wheaton was able to generate operating cash flows in line with 2014. Net earnings were below 2014 results due to non-cash charges being taken over the year on a few of our smaller streams.
While our assets performed well in 2015, the year was not without challenges. Along with downward pressure on precious metals prices through the year, in September we received Notices of Reassessment from the Canada Revenue Agency (CRA) for the years 2005 to 2010. We continue to vigorously defend our position and work towards the quickest avenue for resolution, and in January 2016 filed a Notice of Appeal with the Tax Court of Canada electing to pursue resolution of the matters through a judicial court process rather than to continue to pursue the CRA’s internal appeals process. We firmly believe in the strong underlying value of our shares, and, as such, initiated our first ever normal course issuer bid during the third quarter of 2015.
4
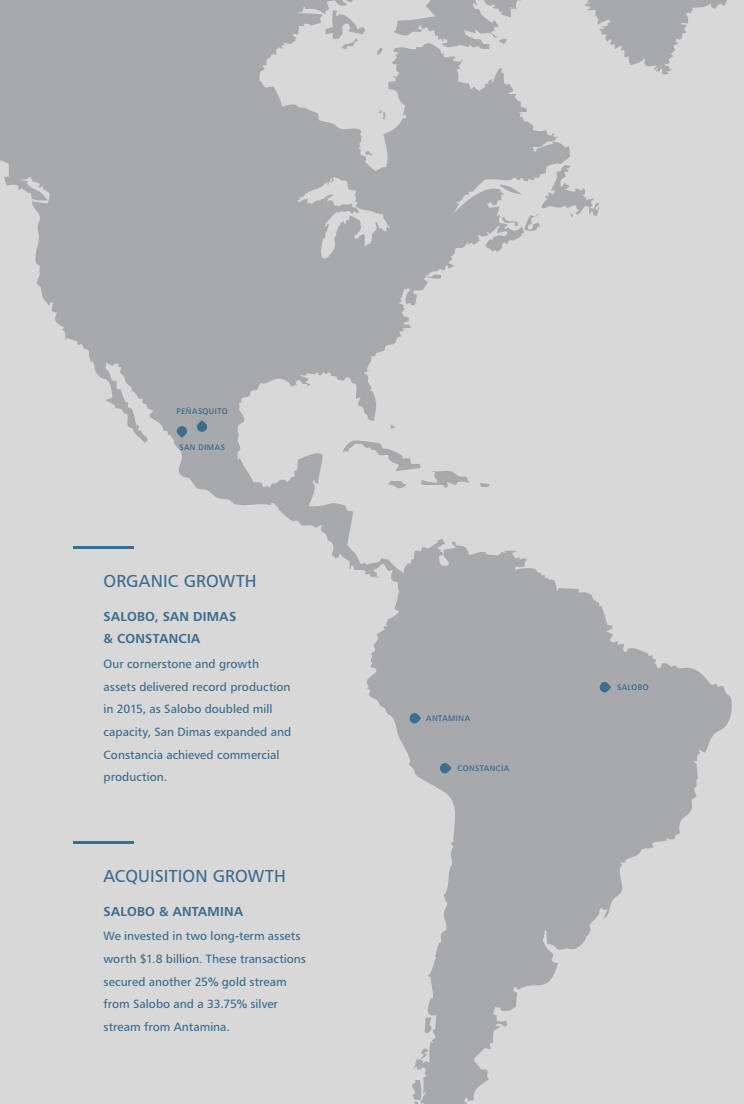
The strength of our portfolio should not be overshadowed by the dark clouds of the reassessment and weak commodity prices. Even in these times of depressed commodity prices, we continued to see growth and reinvestment in our cornerstone assets in 2015, underscoring the importance of investing in tier-one assets. We are proud of the strong performance of the San Dimas, Salobo and Peñasquito mines, and our new cornerstone addition, the Antamina mine. San Dimas, our first ever asset, had a record fourth quarter and an excellent year in 2015. It completed an expansion to 2,500 tonnes per day in the first quarter, ran well above this for most of the year, and expects to complete a further expansion to 3,000 tonnes per day in the second quarter of 2016. San Dimas has proven itself to be a great foundation asset.
Early in 2013, we acquired 25% of the gold production from the Salobo mine, the largest copper deposit ever found in Brazil. 2015 was a pivotal year for our Salobo stream, as Vale successfully ramped up the mine’s expansion, doubling its throughput. We also doubled our exposure by acquiring an additional 25% of the gold. In turn, Salobo was a key driver of our record production in 2015, and, with its significant expansion and exploration potential, we expect it to be a lead contributor going forward for many years.
In 2015, the Peñasquito mine had record production as higher grades were encountered in the core of the deposit. Goldcorp continues to construct the Northern Well Field, which should resolve water shortage issues caused by the unprecedented drought. In addition, we are excited about Goldcorp’s feasibility study on the Metallurgical Enhancement Project at Peñasquito, which has the potential to substantially increase the silver we receive over the life of the mine.
In November 2015, Silver Wheaton acquired a silver stream from Glencore tied to the Antamina mine in Peru. Antamina’s quality and scale make it the fourth cornerstone in our portfolio, as it is not only the eighth largest copper mine in the world but it is also one of the lowest cost copper mines in the world. This stream provided us with almost immediate production and operating cash flow from a proven and well-established asset, again with significant mine life ahead of it.
While our record year was driven in great part by the above-mentioned cornerstone mines, we also benefitted from the first contributions of gold and silver from Hudbay’s Constancia mine in Peru. Constancia achieved commercial production in April 2015, and Hudbay has done an excellent job of bringing the mine online and ramping up production. We have been very encouraged by Hudbay’s mine building ability, especially as they are also our partner on the Rosemont project.
Going forward, we forecast that Silver Wheaton will continue to grow from a fully-funded portfolio of streams, with most of the growth front-end loaded as a full-year of contributions from Antamina and a fully-ramped Salobo and Constancia are realized. We estimate average annual attributable production over the next five years to be approximately 52 million silver equivalent ounces per year. This does not include the optionality we have from streams such as Pascua-Lama or Rosemont, which total over an additional 19 million ounces of production per year.
On the corporate development front, we are happy to see that streaming is now a major consideration for miners seeking capital. We continue to see a number of high-quality, accretive opportunities, many from existing producers looking for funds to strengthen their balance sheets or to assist in acquisitions. While we are in a position to be able to grow, we will continue to acquire strategically and to search for well-managed, high-quality assets operating in the lowest-half of their respective cost-curves.
As we continue to grow, we also continue to give back to our communities. Since 2014, we have provided financial support for our partners’ social projects in mining communities near our partners’ mines. We are proud to be the leader in the streaming and royalty space by directly investing into the communities where we receive our precious metals. Our first projects supported Primero, to build new community facilities near San Dimas, and Barrick, to implement irrigation systems near Veladero and Pascua-Lama. We are now helping Barrick to expand their irrigation project, Goldcorp to improve education facilities near Peñasquito, and Vale to enhance medical services near Salobo. We believe these projects will have positive, long-term and sustainable benefits to these mining communities, and will also further reinforce the strength of our partnerships.
2015 was fundamentally a year of growth for Silver Wheaton, both organically and from an acquisition perspective. With record production and sector-leading cash flows, and with what we believe is the strongest asset base in the industry, we are optimistic for the future and will continue to focus on delivering growth while maintaining one of the lowest-cost profiles in the industry.
To our shareholders, partners, board of directors and employees: thank you once again for your continued commitment and support as we strive to make Silver Wheaton the premier investment vehicle for precious metals investors worldwide.
/s/ Randy Smallwood
RANDY SMALLWOOD, President & CEO
March 16, 2016
SILVER WHEATON 2015 ANNUAL REPORT 5
CORNERSTONE
ASSETS
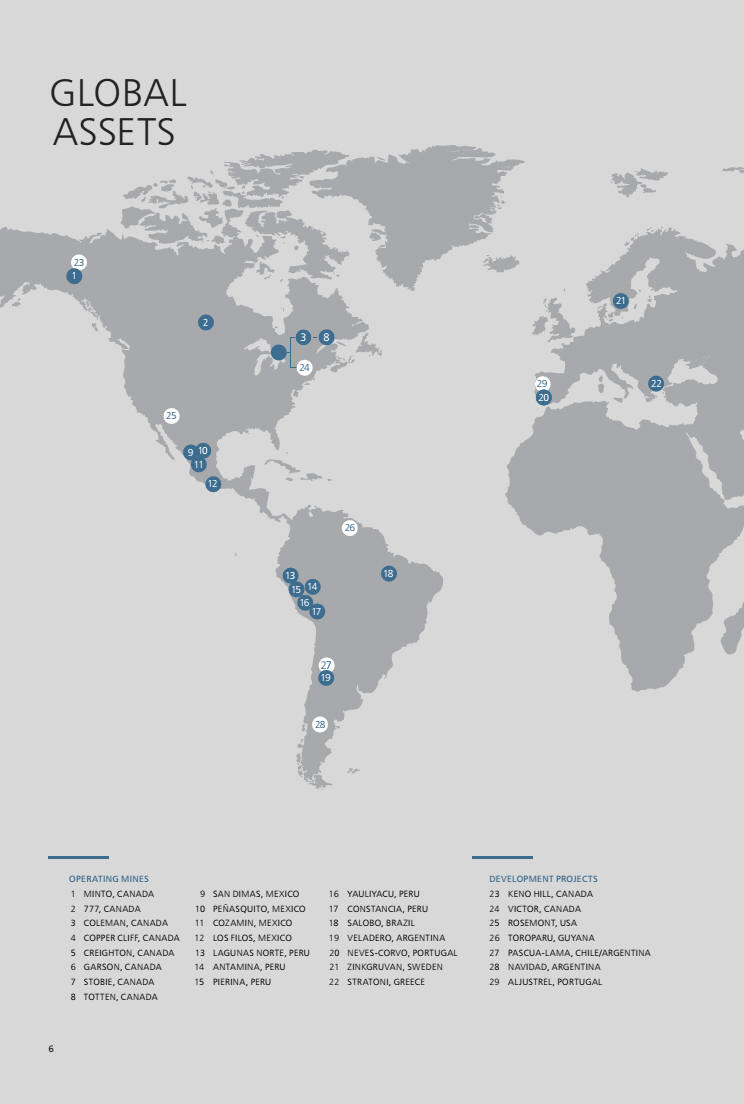
Silver Wheaton’s diversified portfolio of precious metal streams includes 22 operating mines and seven developmentprojects. With the acquisitions we made this year, we now have four cornerstone assets: the San Dimas, Peñasquito, Salobo and Antamina mines.
SAN DIMAS
Primero’s San Dimas mine had a great year, contributing 7.4 million silver ounces to Silver Wheaton in 2015, well above the forecast of 6.6 million ounces. The mine completed its expansion to 2,500 tonnes per day (tpd) in the first quarter of 2015, and was running well above nameplate capacity for most of the year. Primero is on track to complete its further expansion to 3,000 tpd in the first half of 2016.
PEÑASQUITO
Goldcorp’s Peñasquito mine produced 7.2 million ounces of silver for Silver Wheaton in 2015. Goldcorp continues to pursue the completion of the Northern Well Field, which will resolve water shortage issues caused by an unprecedented drought. The Metallurgical Enhancement Project feasibility study shows the potential to increase silver recoveries and is likely to result in a new life of mine plan.
SALOBO
Vale’s Salobo mine, the largest copper deposit in Brazil, produced a record 125,600 ounces of gold in 2015 for Silver Wheaton. With the acquisition of an additional 25% in March 2015, Silver Wheaton now receives 50% of the life of mine gold production from Salobo. Vale, furthermore, successfully ramped up Salobo II in 2015, which doubled mill throughput capacity, and is currently considering Salobo III, an additional 12Mtpa expansion. Silver Wheaton’s average attributable production forecast for the first 10 years is 140,000 ounces of gold per year.
ANTAMINA
In November 2015, Silver Wheaton acquired from Glencore Plc a silver stream tied to the Antamina mine. Antamina is one of the lowest cost copper mines globally, and it is also the eighth largest copper mine in the world. The mine is jointly owned by Glencore, BHP, Teck and Mitsubishi. The acquisition from Glencore immediately increased Silver Wheaton’s production and cash flow profile by adding expected average silver production of 5.1 million ounces per year in 2016 and 2017 and 4.7 million ounces per year over the first 20 years.
GROWTH
In 2016, based upon Silver Wheaton’s current portfolio of low-cost, long-life assets, attributable production is forecast to be approximately 54 million silver equivalent ounces, including 265,000 ounces of gold. Estimated average annual attributable production over the next five years is anticipated to be approximately 52 million silver equivalent ounces per year, including 260,000 ounces of gold.
SILVER WHEATON 2015 ANNUAL REPORT 7
PERFORMANCE
HIGHLIGHTS
| 2015 | 2014 | 2013 | |||||||
| (As of December 31 for each year) | |||||||||
| Financials | |||||||||
| Revenue ($000’s) | $ | 648,687 | $ | 620,176 | $ | 706,472 | |||
| Net (loss) earnings ($000’s) | $ | (162,042) | $ | 199,826 | $ | 375,495 | |||
| Adjusted net earnings1($000’s) | $ | 210,357 | $ | 267,977 | $ | 375,495 | |||
| Operating cash flow ($000’s) | $ | 431,359 | $ | 431,873 | $ | 534,133 | |||
| Net (loss) earnings per share | |||||||||
| Basic | $ | (0.41) | $ | 0.56 | $ | 1.06 | |||
| Diluted | $ | (0.41) | $ | 0.56 | $ | 1.05 | |||
| Adjusted earnings1per share | |||||||||
| Basic | $ | 0.53 | $ | 0.75 | $ | 1.06 | |||
| Diluted | $ | 0.53 | $ | 0.74 | $ | 1.05 | |||
| Operating cash flow per share2 | $ | 1.09 | $ | 1.20 | $ | 1.50 | |||
| Dividends paid ($000’s) | $ | 80,809 | $ | 93,400 | $ | 160,013 | |||
| Dividends paid per share | $ | 0.20 | $ | 0.26 | $ | 0.45 | |||
| Cash and cash equivalents ($000’s) | $ | 103,297 | $ | 308,098 | $ | 95,823 | |||
| Weighted average basic number of shares outstanding (000’s) | 395,755 | 359,401 | 355,588 | ||||||
| Share price (NYSE) | $ | 12.42 | $ | 20.33 | $ | 20.19 | |||
| Operating | |||||||||
| Attributable silver ounces produced (000’s) | 30,717 | 25,674 | 26,754 | ||||||
| Attributable gold ounces produced | 228,764 | 144,395 | 151,204 | ||||||
| Attributable silver equivalent ounces produced (000’s)3 | 47,697 | 35,400 | 35,832 | ||||||
| Silver ounces sold (000’s) | 26,566 | 23,484 | 22,823 | ||||||
| Gold ounces sold | 202,349 | 139,522 | 117,319 | ||||||
| Silver equivalent ounces sold (000’s)3 | 41,574 | 32,891 | 29,963 | ||||||
| Average realized silver price per ounce sold | $ | 15.64 | $ | 18.92 | $ | 23.86 | |||
| Average realized gold price per ounce sold | $ | 1,152 | $ | 1,261 | $ | 1,380 | |||
| Average silver cash cost per ounce sold4 | $ | 4.17 | $ | 4.14 | $ | 4.12 | |||
| Average gold cash cost per ounce sold4 | $ | 393 | $ | 386 | $ | 386 |
| 1 | Refer to discussion on non-IFRS measure (i) on page 42 of the MD&A. |
| 2 | Refer to discussion on non-IFRS measure (ii) on page 43 of the MD&A. |
| 3 | Gold ounces produced and sold are converted to a silver equivalent basis based on either (i) the ratio of the average silver price received to the average gold price received during theperiod from the assets that produce both gold and silver; or (ii) the ratio of the price of silver to the price of gold on the date of sale as per the London Bullion Metal Exchange for the assets which produce only gold. |
| 4 | Refer to discussion on non-IFRS measure (iii) on page 44 of the MD&A. |
8
PRECIOUS METALS
STREAMING
SILVER WHEATON CREATED PRECIOUS METALS STREAMING IN ORDER TO UNLOCK HIDDEN VALUE BY ACQUIRING BY-PRODUCT PRECIOUS METAL FROM HIGH-QUALITY, LOW-COST MINES, WITH A GOAL OF PROVIDING INVESTORS SUPERIOR RETURNS AND SOME OF THE HIGHEST MARGINS IN THE INDUSTRY.
PRECIOUS METAL STREAMING – UNLOCKING VALUE
Silver Wheaton introduced the streaming model in 2004 after recognizing that silver produced as a by-product was not being fully valued by the financial markets. Streaming was created to unlock this value, both for Silver Wheaton’s shareholders and for Silver Wheaton’s partner mine owners. Since its introduction, the streaming model has also been applied to gold and other precious metals.
Streaming allows Silver Wheaton to purchase, in exchange for an upfront payment, a fixed percentage of the precious metals produced from a mine. Once an agreement is entered into, Silver Wheaton has the right to purchase the precious metal at a predetermined price as it is delivered. The production payment is set at a level intended to offset Silver Wheaton’s partners’ typical cost to produce an ounce of silver or gold.
Silver Wheaton does not own or operate mines and is therefore not exposed to rising capital and operating costs. However, the company’s agreements are typically for the life of the operation, giving Silver Wheaton exposure to the mine’s future expansions and exploration success.
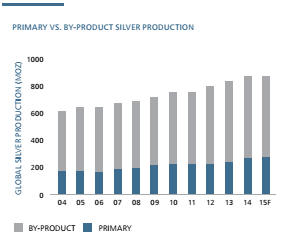
Silver remains a core focus of streaming, as 70% of worldwide silver is produced as a by-product and is therefore generally considered to be a non-core asset at the mine where it is produced. In many large base metal operations, gold production represents only a small fraction of the overall economics of the mine and it is therefore also considered non-core. While Silver Wheaton believes streaming creates the most value when targeting byproduct precious metals, given its value-enhancement and flexibility, the streaming model has also proven successful with primary metal production.
Benefits to Silver Wheaton’s Shareholders:
The key benefit of streaming to Silver Wheaton’s shareholders is cost certainty, which translates into direct leverage to increases in precious metal prices. Inflationary cost pressures have historically plagued the mining industry, driving capital and operating costs higher for traditional miners and cutting into their profit margins. Once Silver Wheaton makes the upfront payment, the company typically has no ongoing capital or exploration costs. Furthermore, Silver Wheaton’s operating costs are set at the time a stream is entered into at a predetermined production payment, allowing us to consistently deliver amongst the highest cash operating margins in the mining industry.
Benefits to Partner Mining Company’s Shareholders:
At Silver Wheaton, our goal is first and foremost to generate superior returns for our shareholders; however, we recognize that the sustainability of our model is dependent on uncovering value for all of the parties involved in a streaming agreement. Silver Wheaton is able to do this by unlocking the value of silver and gold produced as a by-product. By entering into a streaming agreement, mining companies can receive greater value for their precious metals than what is reflected in the market. These companies can use the upfront payment to continue growing their core business, either through exploration, production expansions or acquisitions, or, alternatively, the proceeds can be used to strengthen their balance sheet.
 | ||
| Source: Thomson Reuters GFMS | ||
| Thomson Reuters GFMS estimates that 68% of 2015 global silver production was produced as a by-product of copper, lead, zinc or gold mines. This equates to almost 600Moz of silver, which represents a very large potential target market for Silver Wheaton to continue adding to its portfolio of silver stream assets. |
SILVER WHEATON 2015 ANNUAL REPORT 9
CORPORATE SOCIAL
RESPONSIBILITY

SILVER WHEATON HAS PRECIOUS METALS STREAMS WITH MINES LOCATED IN CANADA AND AROUND THE WORLD. AS THE COMPANY HAS GROWN, OUR FOCUS ON HELPING OTHERS HAS ALSO GROWN. LAST YEAR WE HAD THE GOOD FORTUNE TO ONCE AGAIN SUPPORT A NUMBER OF WORTHY PROJECTS IN CANADA AND BEYOND.
Since 2014, we have been investing directly into the communities from where we receive our precious metals. In 2015, we once again provided financial support for our partners’ social projects in mining communities located near our partners’ mines. We are proud to be the leader in the streaming and royalty space with this initiative, and hope that we inspire others to follow suit.
We began this program by supporting projects led by Primero, to build new community facilities near the San Dimas mine in Mexico, and by Barrick, to implement irrigation systems near the Veladero mine and Pascua-Lama project in Argentina. These projects were successfully completed in 2015 as planned.
We are now helping Barrick to expand their highly successful irrigation project in Argentina. We are also providing financial support to Goldcorp to improve educational facilities and increase student learning opportunities at a vocational college near the Peñasquito mine in Mexico. Furthermore, we are assisting Vale in their efforts to promote healthy practices and to improve the type and quality of medical services provided in the community near the Salobo mine in Brazil.
We believe these projects will have positive, long-term and sustainable benefits to the mining communities in Argentina, Brazil and Mexico. We are proud of our mining partnerships, and are committed to supporting new projects with existing and future mining partners.
10
| FINANCIALS | ||
| MANAGEMENT'S DISCUSSION AND ANALYSIS | 13 | |
| FINANCIAL STATEMENTS | 76 |

| · | Record attributable silver equivalent production for the three months and year ended December 31, 2015 of 15.5 million ounces (10.3 million ounces of silver and 69,200 ounces of gold) and 47.7 million ounces (30.7 million ounces of silver and 228,800 ounces of gold), respectively, representing an increase of 70% and 35% over the comparable periods in 2014. |
| · | Record silver equivalent sales volume for the three months and year ended December 31, 2015 of 13.6 million ounces (8.8 million ounces of silver and 64,900 ounces of gold) and 41.6 million ounces (26.6 million ounces of silver and 202,300 ounces of gold), respectively, representing an increase of 59% and 26% over the comparable periods in 2014. |
| · | As at December 31, 2015, approximately 6.9 million payable silver equivalent ounces attributable to the Company have been produced at the various mines and will be recognized in future sales as they are delivered to the Company under the terms of their contracts. This represents an increase of 0.5 million payable silver equivalent ounces during the three month period ended December 31, 2015. Payable ounces produced but not yet delivered to Silver Wheaton are expected to average approximately 2 to 3 months of annualized production but may vary from quarter to quarter due to a number of factors including mine ramp-up, delays in shipments, etc.1 |
| · | Average realized sale price per silver equivalent ounce sold for the three months and year ended December 31, 2015 of $14.73 ($14.75 per ounce of silver and $1,100 per ounce of gold) and $15.60 ($15.64 per ounce of silver and $1,152 per ounce of gold), compared with $16.43 and $18.86 for the comparable periods in 2014, representing a decrease of 10% and 17%, respectively. |
| · | Revenue for the three months and year ended December 31, 2015 of $200.5 million and $648.7 million, respectively, compared with $140.4 million and $620.2 million for the comparable periods in 2014, representing an increase of 43% and 5%, respectively. |
| · | Net loss for the three months and year ended December 31, 2015 was $169.3 million ($0.42 per share) and $162.0 million ($0.41 per share), respectively, compared with net earnings of $52.0 million ($0.14 per share) and $199.8 million ($0.56 per share) for the comparable periods in 2014. |
| · | During the three months and year ended December 31, 2015, the Company recognized impairment charges of $230.9 million and $384.9 million, respectively. |
| · | After removing the after tax impact of the impairment charge, adjusted net earnings² for the three months and year ended December 31, 2015 of $57.4 million ($0.14 per share) and $210.4 million ($0.53 per share), respectively, compared with adjusted net earnings² of $52.0 million ($0.14 per share) and $268.0 million ($0.75 per share) for the comparable periods in 2014, representing an increase of 10% during the three month period and a decrease of 22% during the twelve month period as compared to the comparable periods in 2014. |
| · | Operating cash flows for the three months and year ended December 31, 2015 of $133.4 million ($0.33 per share¹) and $431.4 million ($1.09 per share¹), respectively, compared with $94.1 million ($0.26 per share¹) and $431.9 million ($1.20 per share¹) for the comparable periods in 2014, representing an increase of 42% during the quarter while the annual cashflow was virtually unchanged as compared to the prior year.1 |
| · | On March 16, 2016, the Board of Directors declared a dividend in the amount of $0.05 per common share as per the Company's stated dividend policy whereby the quarterly dividend will be equal to 20% of the average of the operating cash flow of the previous four quarters. This dividend is payable to shareholders of record on March 31, 2016 and is expected to be distributed on or about April 14, 2016. The Company has implemented a dividend reinvestment plan ("DRIP") whereby shareholders can elect to have dividends reinvested directly into additional Silver Wheaton common shares at a discount of 3% of the Average Market Price, as defined in the DRIP. |
| · | Average cash costs² for the three months and year ended December 31, 2015 of $4.50 and $4.58 per silver equivalent ounce, respectively.2 |
| · | Cash operating margin³ for the three months and year ended December 31, 2015 of $10.23 and $11.02 per silver equivalent ounce, respectively, representing a decrease of 14% and 23% relative to the comparable periods in 2014. |
| · | On March 2, 2015, the Company announced that it had agreed to amend its agreement with Vale S.A ("Vale") to acquire an additional amount of gold equal to 25% of the life of mine gold production from any minerals from the Salobo mine that enter the Salobo mineral processing facility from and after January 1, 2015. This acquisition is in addition to the 25% of the Salobo mine gold production that the Company acquired pursuant to its agreement in 2013. |
| · | On April 22, 2015, the Company amended its early deposit precious metal purchase agreement with Sandspring Resources Ltd. ("Sandspring") to include the acquisition of an amount equal to 50% of the silver production from its Toroparu project located in the Republic of Guyana, South America. |
| · | On November 3, 2015, the Company announced that it had agreed to acquire from a subsidiary of Glencore plc ("Glencore") an amount of silver equal to 33.75% of the Antamina silver production until the delivery of 140 million ounces of silver and 22.5% of silver production thereafter for the life of mine at a fixed 100% payable rate for a total upfront cash payment of $900 million. In addition, Silver Wheaton will make ongoing payments of 20% of spot price per silver ounce delivered under the agreement. |
| · | On January 27, 2016, the Company announced that it had signed a nonbinding term sheet with Panoro Minerals Ltd. ("Panoro") to enter into an Early Deposit Precious Metal Purchase Agreement for the Cotabambas project located in Peru. |
| · | On July 6, 2015, the Company announced that it had received a proposal letter (the "Proposal") from the Canada Revenue Agency ("CRA") in which the CRA was proposing to reassess Silver Wheaton under the transfer pricing provisions contained in the Income Tax Act (Canada) (the "Act"). Subsequent to the issuance of the Proposal, on September 24, 2015, the Company announced that it had received Notices of Reassessment (the "Reassessments") from the CRA for the 2005-2010 taxation years. The Reassessments are consistent with the Proposal and seek to increase the Company's income subject to tax in Canada for the 2005-2010 taxation years by approximately Cdn$715.3 million which would result in federal and provincial taxes of approximately Cdn$201.3 million. In addition, the CRA is seeking to impose transfer pricing penalties of approximately Cdn$71.5 million and interest and other penalties of Cdn$80.6 million (calculated to September 24, 2015) for the 2005-2010 taxation years. Total tax, interest and penalties sought by the CRA for the 2005-2010 taxation years is Cdn$353.4 million. Management believes that the Company has filed its tax returns and paid applicable taxes in compliance with Canadian tax law, and as a result, no amounts have been recorded for any potential liability arising from this matter. Silver Wheaton intends to vigorously defend its tax filing positions. |
| · | On October 8, 2015, Silver Wheaton filed a notice of objection for each of the 2005-2010 taxation years. Silver Wheaton is required to make a deposit of 50% of the reassessed amounts of tax, interest and penalties. On March 1, 2016, Silver Wheaton received approval from the CRA to post security in the form of a letter of guarantee as opposed to a cash deposit. The letter of guarantee is to be in the amount of Cdn$191.7 million which includes interest accrued to-date plus estimated interest for the following year. |
| · | On January 8, 2016, Silver Wheaton filed a Notice of Appeal with the Tax Court of Canada, electing to pursue resolution of the matters relating to the Reassessments for the 2005-2010 taxation years through a judicial court process rather than continue to pursue the CRA's internal appeals process. On January 19, 2016, Silver Wheaton received correspondence advising that the CRA would be commencing an audit of the Company's international transactions covering the 2011-2013 taxation years. This correspondence is not a proposal or notice of reassessment and the Company is not in a position to determine what, if any, position the CRA will take in respect of the 2011-2013 taxation years. Taxation years subsequent to 2013 also remain open to audit by the CRA. |
| · | On January 5, 2015, the Company announced that it had amended its silver purchase agreement related to Barrick Gold Corporation's ("Barrick") Pascua-Lama project ("Pascua-Lama"). The amendment entails Silver Wheaton being entitled to 100% of the silver production from Barrick's Lagunas Norte, Pierina and Veladero mines until March 31, 2018 - an extension of 1 ¼ years, and extending the completion test deadline an additional 2 ½ years to June 30, 2020. As a reminder, if the requirements of the completion test have not been satisfied by the amended completion date, the agreement may be terminated by Silver Wheaton. In such an event, Silver Wheaton will be entitled to the return of the upfront cash consideration of $625 million less a credit for any silver delivered up to that date. |
| · | On February 27, 2015, the Company announced that it had amended its $1 billion revolving credit facility (the "Revolving Facility") by increasing the available credit from $1 billion to $2 billion and extending the term by 2 years. The Company used proceeds drawn from this amended Revolving Facility together with cash on hand to repay the non-revolving term loan. |
| · | On March 2, 2015, the Company announced that, in connection with the amended Salobo precious metal purchase agreement, it had entered into an agreement with a syndicate of underwriters led by Scotiabank, pursuant to which they agreed to purchase, on a bought deal basis, 38,930,000 common shares of Silver Wheaton at a price of $20.55 per share (the "Offering"), for aggregate gross proceeds to Silver Wheaton of approximately $800 million. |
| · | On March 17, 2015, the Company announced that it had closed the Offering and received $800 million in gross proceeds (net proceeds of approximately $769 million after payment of underwriters' fees and expenses). |
| · | On September 18, 2015, the Company announced that it had received approval from the Toronto Stock Exchange ("TSX") to purchase up to 20,229,671 common shares (representing 5% of the Company's 404,593,425 total issued and outstanding common shares as of September 11, 2015) over a period of twelve months commencing on September 23, 2015. The normal course issuer bid ("NCIB") will expire no later than September 22, 2016. To date, the Company has repurchased 2,887,854 common shares under the NCIB at an average price of $13.58 per share, including 2,123,065 purchased subsequent to December 31, 2015. On January 27, 2016, Silver Wheaton announced that it had entered into an automatic securities purchase plan (the "Plan") with a broker in order to facilitate repurchases of its Common Shares under the NCIB. Purchases under the Plan will be made by Silver Wheaton's broker based on the parameters prescribed by the TSX and the NYSE, applicable Canadian securities laws and the terms of the parties' written agreement. Under the Plan, the broker may purchase Common Shares under the NCIB when Silver Wheaton would ordinarily not be permitted. The Plan commences on January 27, 2016 and expires on September 22, 2016, and has been approved by the TSX. |
| · | On March 15, 2016, the Company was notified that its lenders had agreed to extend the term of the Revolving Facility by an additional year, with the facility now maturing on February 27, 2021. |
Silver and Gold Interests | Mine Owner | Location of Mine | Upfront Consideration 1 | Attributable Production to be Purchased | Term of Agreement | Date of Original Contract | |
| Silver | Gold | ||||||
| San Dimas | Primero | Mexico | $ 189,799 | 100% 2 | 0% | Life of Mine | 15-Oct-04 |
| Yauliyacu | Glencore | Peru | $ 285,000 | variable 3 | 0% | Life of Mine 3 | 23-Mar-06 |
| Peñasquito | Goldcorp | Mexico | $ 485,000 | 25% | 0% | Life of Mine | 24-Jul-07 |
| Salobo | Vale | Brazil | $ 2,230,000 4 | 0% | 50% | Life of Mine | 28-Feb-13 |
| Sudbury | $ 623,572 5 | ||||||
| Coleman | Vale | Canada | 0% | 70% | 20 years | 28-Feb-13 | |
| Copper Cliff | Vale | Canada | 0% | 70% | 20 years | 28-Feb-13 | |
| Garson | Vale | Canada | 0% | 70% | 20 years | 28-Feb-13 | |
| Stobie | Vale | Canada | 0% | 70% | 20 years | 28-Feb-13 | |
| Creighton | Vale | Canada | 0% | 70% | 20 years | 28-Feb-13 | |
| Totten | Vale | Canada | 0% | 70% | 20 years | 28-Feb-13 | |
| Victor | Vale | Canada | 0% | 70% | 20 years | 28-Feb-13 | |
| Barrick | $ 625,000 | ||||||
| Pascua-Lama | Barrick | Chile/Argentina | 25% | 0% | Life of Mine | 8-Sep-09 | |
| Lagunas Norte | Barrick | Peru | 100% | 0% | 8.5 years | 8-Sep-09 | |
| Pierina | Barrick | Peru | 100% | 0% | 8.5 years 6 | 8-Sep-09 | |
| Veladero | Barrick | Argentina | 100% 7 | 0% | 8.5 years | 8-Sep-09 | |
| Antamina | Glencore | Peru | $ 900,000 | 33.75% 8 | 0% | Life of Mine | 3-Nov-15 |
| Other | $ 1,482,683 | ||||||
| Los Filos | Goldcorp | Mexico | $ 4,463 | 100% | 0% | 25 years | 15-Oct-04 |
| Zinkgruvan | Lundin | Sweden | $ 77,866 | 100% | 0% | Life of Mine | 8-Dec-04 |
| Stratoni | Eldorado Gold 9 | Greece | $ 57,500 | 100% | 0% | Life of Mine | 23-Apr-07 |
| Minto | Capstone | Canada | $ 54,805 | 100% | 100% 10 | Life of Mine | 20-Nov-08 |
| Cozamin | Capstone | Mexico | $ 41,959 | 100% | 0% | 10 years | 4-Apr-07 |
| Neves-Corvo | Lundin | Portugal | $ 35,350 | 100% | 0% | 50 years | 5-Jun-07 |
| Aljustrel | I'M SGPS | Portugal | $ 2,451 | 100% 11 | 0% | 50 years | 5-Jun-07 |
| Keno Hill | Alexco | Canada | $ 50,000 | 25% | 0% | Life of Mine | 2-Oct-08 |
| Rosemont | Hudbay | United States | $ 230,000 12 | 100% | 100% | Life of Mine | 10-Feb-10 |
| Loma de La Plata | Pan American | Argentina | $ 43,289 13 | 12.5% | 0% | Life of Mine | n/a 14 |
| 777 | Hudbay | Canada | $ 455,100 | 100% | 100%/50% 15 | Life of Mine | 8-Aug-12 |
| Constancia | Hudbay | Peru | $ 429,900 | 100% | 50% 16 | Life of Mine | 8-Aug-12 |
| Early Deposit | |||||||
| Toroparu | Sandspring | Guyana | $ 153,500 17 | 50% 17 | 10% 17 | Life of Mine | 11-Nov-13 |
| Cotabambas | Panoro | Peru | $ 140,000 18 | 100% 19 | 25% 19 | Life of Mine | n/a 20 |
| 1) | Expressed in United States dollars, rounded to the nearest thousand; excludes closing costs and capitalized interest, where applicable. |
| 2) | Until August 6, 2014, Primero delivered to Silver Wheaton a per annum amount equal to the first 3.5 million ounces of payable silver produced at San Dimas and 50% of any excess, plus Silver Wheaton received an additional 1.5 million ounces of silver per annum which was delivered by Goldcorp. Beginning August 6, 2014, Primero will deliver a per annum amount to Silver Wheaton equal to the first 6 million ounces of payable silver produced at San Dimas and 50% of any excess. |
| 3) | On November 30, 2015, the Company amended its silver purchase agreement with Glencore. The term of the agreement, which was set to expire in 2026, was extended to the life of mine. Glencore will deliver a per annum amount to Silver Wheaton equal to the first 1.5 million ounces of payable silver produced at Yauliyacu and 50% of any excess. |
| 4) | Does not include the contingent payment related to the Salobo mine expansion. Vale has completed the expansion of the mill throughput capacity at the Salobo mine to 24 million tonnes per annum ("Mtpa") from its previous 12 Mtpa. If actual throughput is expanded above 28 Mtpa within a predetermined period, Silver Wheaton will be required to make an additional payment to Vale based on a set fee schedule ranging from $88 million if throughput is expanded beyond 28 Mtpa by January 1, 2036, up to $720 million if throughput is expanded beyond 40 Mtpa by January 1, 2018. |
| 5) | Comprised of a $570 million upfront cash payment plus warrants to purchase 10 million common shares of Silver Wheaton at a strike price of $65, with a term of 10 years. |
| 6) | As per Barrick's disclosure, closure activities were initiated at Pierina in August 2013. |
| 7) | Silver Wheaton's attributable silver production is subject to a maximum of 8% of the silver contained in the ore processed at Veladero during the period. |
| 8) | Once the Company has received 140 million ounces of silver under the Antamina agreement, the Company's attributable silver production to be purchased will be reduced to 22.5%. |
| 9) | 95% owned by Eldorado Gold Corporation. |
| 10) | The Company is entitled to acquire 100% of the first 30,000 ounces of gold produced per annum and 50% thereafter. |
| 11) | Silver Wheaton only has the rights to silver contained in concentrate containing less than 15% copper at the Aljustrel mine. |
| 12) | The upfront consideration is currently reflected as a contingent obligation, payable on an installment basis to partially fund construction of the Rosemont mine once certain milestones are achieved, including the receipt of key permits and securing the necessary financing to complete construction of the mine. |
| 13) | Comprised of $10.9 million allocated to the silver interest upon the Company's acquisition of Silverstone Resources Corp. in addition to a contingent liability of $32.4 million, payable upon the satisfaction of certain conditions, including Pan American receiving all necessary permits to proceed with the mine construction. |
| 14) | Definitive terms of the agreement to be finalized. |
| 15) | Silver Wheaton is entitled to acquire 100% of the life of mine gold production from Hudbay's 777 mine until Hudbay's Constancia mine satisfies a completion test, or the end of 2016, whichever is later. At that point, Silver Wheaton's share of gold production from 777 will be reduced to 50% for the life of the mine. |
| 16) | Gold recoveries will be set at 55% for the Constancia deposit and 70% for the Pampacancha deposit until 265,000 ounces of gold have been delivered to the Company. |
| 17) | Comprised of $15.5 million paid to date and $138.0 million to be payable on an installment basis to partially fund construction of the mine. During the 60 day period following the delivery of a feasibility study, environmental study and impact assessment, and other related documents (collectively, the "Toroparu Feasibility Documentation"), or after December 31, 2016 if the Toroparu Feasibility Documentation has not been delivered to Silver Wheaton by such date, Silver Wheaton may elect not to proceed with the precious metal purchase agreement, at which time Silver Wheaton will be entitled to a return of the amounts advanced less $2 million which is non-refundable or, at Sandspring's option, the gold stream percentage will be reduced from 10% to 0.909% and the silver stream percentage will be reduced from 50% to nil. Silver Wheaton may also elect to terminate the Toroparu Early Deposit Agreement upon the occurrence of certain events prior to the payment of any initial construction payment and elect to reduce the stream percentages or obtain a return of the amounts advanced less $2 million. |
| 18) | The upfront consideration is currently reflected as a contingent obligation. Once certain conditions have been met, Silver Wheaton will advance $14 million to Panoro, spread over up to nine years. Following the delivery of certain feasibility documentation, Silver Wheaton may elect to terminate the Cotabambas Early Deposit Agreement. If Silver Wheaton elects to terminate, Silver Wheaton will be entitled to a return of the portion of the $14 million paid less $2 million payable upon certain triggering events occurring. Until January 1, 2020, Panoro has a one-time option to repurchase 50% of the precious metals stream on a change of control for an amount based on a calculated rate of return for Silver Wheaton. |
| 19) | Once 90 million silver equivalent ounces attributable to Silver Wheaton have been produced, the attributable production to be purchased will decrease to 66.67% of silver production and 16.67% of gold production for the life of mine. |
| 20) | The entering into of the Cotabambas Early Deposit Agreement is subject to the negotiation and completion of definitive documentation. There can be no assurance that the Cotabambas Early Deposit Agreement will be completed on the terms set out in the non-binding term sheet, or at all. |
| i. | Pascua-Lama SMA Regulatory Sanctions |
| ii. | Pascua-Lama Constitutional Protection Action |
| iii. | Pascua-Lama Chilean Environmental Court Ruling |
| iv. | Argentine Glacier Legislation |
| i. | As part of the agreement with Goldcorp to acquire silver from the Luismin mining operations, on October 15, 2004, the Company entered into an agreement with Goldcorp to acquire 100% of the silver production from its Los Filos mine in Mexico for a period of 25 years, commencing October 15, 2004. In addition, pursuant to Goldcorp's sale of the San Dimas mine, Goldcorp delivered to Silver Wheaton 1.5 million ounces of silver per year until August 6, 2014, which is reflected in this MD&A and financial statements as part of the silver production and sales relating to San Dimas; |
| ii. | On December 8, 2004, the Company entered into an agreement with Lundin Mining Corporation ("Lundin") to acquire 100% of the silver produced by Lundin's Zinkgruvan mining operations in Sweden for the life of mine; |
| iii. | On April 23, 2007, the Company entered into an agreement with European Goldfields Limited (which was acquired by Eldorado Gold Corporation ("Eldorado Gold") on February 24, 2012), to acquire 100% of the life of mine silver production from its 95% owned Stratoni mine in Greece (see additional discussion below); |
| iv. | On October 2, 2008, the Company entered into an agreement with Alexco Resource Corp. ("Alexco") to acquire an amount equal to 25% of the life of mine silver production from its Keno Hill silver district in Canada, including the Bellekeno mine (see additional discussion below); |
| v. | On May 21, 2009, the Company completed the acquisition of Silverstone Resources Corp. (the "Silverstone Acquisition"). As part of the Silverstone Acquisition, the Company acquired a precious metal purchase agreement with Capstone Mining Corp. ("Capstone") to acquire 100% of the silver and gold produced (subject to certain thresholds) from Capstone's Minto mine in Canada for the life of mine. The Company is entitled to acquire 100% of all the silver produced and 100% of the first 30,000 ounces of gold produced per annum and 50% thereafter; |
| vi. | As part of the Silverstone Acquisition, the Company acquired a silver purchase agreement with Capstone to acquire 100% of the silver produced from Capstone's Cozamin mine in Mexico for a period of 10 years, commencing on April 4, 2007; |
| vii. | As part of the Silverstone Acquisition, the Company acquired an agreement with Lundin to acquire 100% of the silver production from its Neves-Corvo mine in Portugal for a period of 50 years, commencing June 5, 2007; |
| viii. | As part of the Silverstone Acquisition, the Company acquired an agreement with I'M SGPS to acquire 100% of the silver production from its Aljustrel mine in Portugal for a period of 50 years, commencing June 5, 2007. As part of an agreement with I'M SGPS dated July 16, 2014, Silver Wheaton agreed to limit its rights to only silver contained in concentrates containing less than 15% copper; |
| ix. | As part of the Silverstone Acquisition, the Company acquired an agreement with Aquiline Resources Inc., which was acquired by Pan American Silver Corp. ("Pan American") on December 22, 2009, to acquire an amount equal to 12.5% of the life of mine silver production from the Loma de La Plata zone of the Navidad project in Argentina, the definitive terms of which are to be finalized. The Company is committed to pay Pan American total upfront cash payments of $32.4 million following the satisfaction of certain conditions, including Pan American receiving all necessary permits to proceed with the mine construction; |
| x. | On February 10, 2010, the Company entered into an agreement with Augusta Resource Corporation, which was acquired by Hudbay on July 16, 2014, to acquire an amount equal to 100% of the life of mine silver and gold production from the Rosemont Copper project ("Rosemont") in the United States. The Company is committed to pay Hudbay total upfront cash payments of $230 million, payable on an installment basis to partially fund construction of the Rosemont mine once certain milestones are achieved, including the receipt of key permits and securing the necessary financing to complete construction of the mine; and |
| xi. | On August 8, 2012, the Company entered into an agreement with Hudbay to acquire an amount equal to 100% of the life of mine silver and gold production from its 777 mine, located in Canada. Silver Wheaton's share of gold production at 777 will remain at 100% until the later of the end of 2016 or the satisfaction of a completion test relating to Hudbay's Constancia mine (see Other silver and gold interest xii, below), after which it will be reduced to 50% for the remainder of the mine life. |
| xii. | On August 8, 2012, the Company entered into an agreement with Hudbay to acquire an amount equal to 100% of the life of mine silver production from the Constancia mine ("Constancia") in Peru. On November 4, 2013, the Company amended its agreement with Hudbay to include the acquisition of an amount equal to 50%1 of the life of mine gold production from Constancia. If the Constancia processing plant fails to achieve at least 90% of expected throughput and silver recovery by December 31, 2016, Silver Wheaton would be entitled to continued delivery of 100% of the gold production from Hudbay's 777 mine. If the completion test has not been satisfied by December 31, 2020, Silver Wheaton would be entitled to a proportionate return of the upfront cash consideration relating to Constancia. In addition, Silver Wheaton would be entitled to additional compensation in respect of the gold stream should there be a delay in achieving completion or mining the Pampacancha deposit beyond the end of 2018. Hudbay has granted Silver Wheaton a right of first refusal on any future streaming agreement, royalty agreement, or similar transaction related to the production of silver or gold from Constancia. |
| Dec 31, 2015 | Three Months Ended Dec 31, 2015 | Year Ended Dec 31, 2015 | Year Ended Dec 31, 2015 | |
| (in thousands) | Fair Value | Fair Value Adjustment Gains (Losses) Included in OCI | Realized Loss on Disposal | |
Bear Creek | $ 5,558 | $ (1,572) | $ (10,678) | $ - |
| Revett | - | - | (1,401) | (11,870) |
| Other | 14,218 | 3,793 | (1,006) | (2,781) |
Total common shares held | $ 19,776 | $ 2,221 | $ (13,085) | $ (14,651) |
| Dec 31, 2014 | Three Months Ended Dec 31, 2014 | Year Ended Dec 31, 2014 | |
| (in thousands) | Fair Value | Fair Value Adjustment Gains (Losses) Included in OCI | |
Bear Creek | $ 16,236 | $ (5,658) | $ (1,972) |
| Revett | 3,873 | (2,022) | 47 |
| Other | 12,763 | (3,469) | (6,004) |
Total common shares held | $ 32,872 | $ (11,149) | $ (7,929) |
2015 | 2014 | 2013 | ||||
Silver equivalent production 1 | ||||||
| Attributable silver ounces produced (000's) | 30,717 | 25,674 | 26,754 | |||
| Attributable gold ounces produced | 228,764 | 144,395 | 151,204 | |||
Attributable silver equivalent ounces produced (000's) 1 | 47,697 | 35,400 | 35,832 | |||
Silver equivalent sales 1 | ||||||
| Silver ounces sold (000's) | 26,566 | 23,484 | 22,823 | |||
| Gold ounces sold | 202,349 | 139,522 | 117,319 | |||
Silver equivalent ounces sold (000's) 1 | 41,574 | 32,891 | 29,963 | |||
| Average realized price ($'s per ounce) | ||||||
| Average realized silver price | $ | 15.64 | $ | 18.92 | $ | 23.86 |
| Average realized gold price | $ | 1,152 | $ | 1,261 | $ | 1,380 |
Average realized silver equivalent price 1 | $ | 15.60 | $ | 18.86 | $ | 23.58 |
Average cash cost ($'s per ounce) 2 | ||||||
| Average silver cash cost | $ | 4.17 | $ | 4.14 | $ | 4.12 |
| Average gold cash cost | $ | 393 | $ | 386 | $ | 386 |
Average silver equivalent cash cost 1 | $ | 4.58 | $ | 4.59 | $ | 4.65 |
Total revenue ($000's) | $ | 648,687 | $ | 620,176 | $ | 706,472 |
Net (loss) earnings ($000's) | $ | (162,042) | $ | 199,826 | $ | 375,495 |
| Add back - impairment loss, net of tax | 372,399 | 68,151 | - | |||
Adjusted net earnings 3 ($000's) | $ | 210,357 | $ | 267,977 | $ | 375,495 |
| (Loss) earnings per share | ||||||
| Basic | $ | (0.41) | $ | 0.56 | $ | 1.06 |
| Diluted | $ | (0.41) | $ | 0.56 | $ | 1.05 |
Adjusted earnings per share 3 | ||||||
| Basic | $ | 0.53 | $ | 0.75 | $ | 1.06 |
| Diluted | $ | 0.53 | $ | 0.74 | $ | 1.05 |
Cash flow from operations ($000's) | $ | 431,359 | $ | 431,873 | $ | 534,133 |
| Dividends | ||||||
| Dividends paid ($000's) | $ | 80,809⁴ | $ | 93,400⁴ | $ | 160,013 |
| Dividends paid per share | $ | 0.20 | $ | 0.26 | $ | 0.45 |
Total assets ($000's) | $ | 5,632,211 | $ | 4,647,763 | $ | 4,389,844 |
Total non-current financial liabilities ($000's) | $ | 1,468,732 | $ | 1,001,914 | $ | 999,973 |
Total other liabilities ($000's) | $ | 12,744 | $ | 17,113 | $ | 23,325 |
Shareholders' equity ($000's) | $ | 4,150,735 | $ | 3,628,736 | $ | 3,366,546 |
Shares outstanding | 404,039,065 | 364,777,928 | 357,396,778 |
| 1) | Gold ounces produced and sold are converted to a silver equivalent basis based on either (i) the ratio of the average silver price received to the average gold price received during the period from the assets that produce both gold and silver; or (ii) the ratio of the price of silver to the price of gold on the date of sale as per the London Bullion Metal Exchange for the assets which produce only gold. |
| 2) | Refer to discussion on non-IFRS measure (iii) on page 44 of this MD&A. |
| 3) | Refer to discussion on non-IFRS measure (i) on page 42 of this MD&A. |
| 4) | During the year ended December 31, 2015, the Company declared and paid dividends to its shareholders in the amount of $0.20 per common share for total dividends of $80.8 million, with the payment being comprised of $68.6 million in cash and $12.2 million in common shares issued, with the Company issuing 847,064 common shares under the Company's dividend reinvestment plan. For the comparable period in 2014, the Company declared and paid dividends to its shareholders in the amount of $0.26 per common share for total dividends of $93.4 million, with the payment being comprised of $79.8 million in cash and $13.6 million in common shares issued, with the Company issuing 646,618 common shares under the Company's dividend reinvestment plan. . |
| 2015 | 2014 | |||||||
Q4 | Q3 | Q2 | Q1 | Q4 | Q3 | Q2 | Q1 | |
Silver ounces produced 2 | ||||||||
San Dimas 3 | 2,317 | 1,418 | 1,786 | 1,928 | 1,744 | 1,290 | 1,118 | 1,608 |
| Yauliyacu | 749 | 696 | 696 | 576 | 687 | 875 | 658 | 718 |
| Peñasquito | 1,766 | 2,092 | 1,932 | 1,447 | 1,582 | 1,630 | 2,054 | 2,052 |
| Antamina | 2,403 | - | - | - | - | - | - | - |
Barrick 4 | 627 | 506 | 610 | 640 | 690 | 397 | 299 | 301 |
Other 5 | 2,422 | 2,178 | 2,177 | 1,751 | 1,701 | 1,903 | 2,182 | 2,185 |
| Total silver ounces produced | 10,284 | 6,890 | 7,201 | 6,342 | 6,404 | 6,095 | 6,311 | 6,864 |
Gold ounces produced 2 | ||||||||
Sudbury 6 | 12,203 | 7,300 | 8,195 | 8,666 | 9,924 | 12,196 | 7,473 | 6,426 |
| Salobo | 37,680 | 32,954 | 27,805 | 27,185 | 12,253 | 10,415 | 8,486 | 8,903 |
Other 7 | 19,293 | 15,592 | 14,082 | 17,809 | 13,925 | 19,064 | 16,796 | 18,534 |
| Total gold ounces produced | 69,176 | 55,846 | 50,082 | 53,660 | 36,102 | 41,675 | 32,755 | 33,863 |
Silver equivalent ounces of gold produced 8 | 5,179 | 4,203 | 3,672 | 3,926 | 2,675 | 2,786 | 2,144 | 2,121 |
Silver equivalent ounces produced 8 | 15,463 | 11,093 | 10,873 | 10,268 | 9,079 | 8,881 | 8,455 | 8,985 |
Silver equivalent ounces produced - as originally reported 2, 8 | n.a. | 10,993 | 10,904 | 10,371 | 8,964 | 8,447 | 8,365 | 8,977 |
Increase (Decrease) 2 | n.a. | 100 | (31) | (103) | 115 | 434 | 90 | 8 |
| Silver ounces sold | ||||||||
San Dimas 3 | 2,097 | 2,014 | 1,265 | 1,901 | 1,555 | 1,295 | 1,194 | 1,529 |
| Yauliyacu | 987 | 428 | 809 | 320 | 761 | 1,373 | 111 | 1,097 |
| Peñasquito | 2,086 | 2,053 | 1,420 | 1,573 | 1,640 | 1,662 | 1,958 | 1,840 |
| Antamina | 1,340 | - | - | - | - | - | - | - |
Barrick 4 | 569 | 514 | 633 | 648 | 671 | 377 | 291 | 361 |
Other 5 | 1,672 | 1,566 | 1,448 | 1,223 | 1,106 | 1,592 | 1,673 | 1,398 |
| Total silver ounces sold | 8,751 | 6,575 | 5,575 | 5,665 | 5,733 | 6,299 | 5,227 | 6,225 |
| Gold ounces sold | ||||||||
Sudbury 6 | 6,256 | 6,674 | 12,518 | 8,033 | 11,251 | 5,566 | 6,718 | 6,878 |
| Salobo | 44,491 | 21,957 | 32,156 | 9,794 | 14,270 | 7,180 | 11,902 | 10,560 |
Other 7 | 14,152 | 19,446 | 16,300 | 10,572 | 12,383 | 23,972 | 16,158 | 12,684 |
| Total gold ounces sold | 64,899 | 48,077 | 60,974 | 28,399 | 37,904 | 36,718 | 34,778 | 30,122 |
Silver equivalent ounces of gold sold 8 | 4,863 | 3,619 | 4,468 | 2,058 | 2,808 | 2,441 | 2,267 | 1,891 |
Silver equivalent ounces sold8 | 13,614 | 10,194 | 10,043 | 7,723 | 8,541 | 8,740 | 7,494 | 8,116 |
Gold / silver ratio 8 | 74.9 | 75.3 | 73.3 | 72.5 | 74.1 | 66.5 | 65.2 | 62.8 |
Cumulative payable silver equivalent ounces produced but not yet delivered 9 | 6,891 | 6,380 | 6,398 | 6,445 | 4,952 | 5,147 | 5,996 | 6,042 |
| 1) | All figures in thousands except gold ounces produced and sold. |
| 2) | Ounces produced represent the quantity of silver and gold contained in concentrate or doré prior to smelting or refining deductions. Production figures are based on information provided by the operators of the mining operations to which the silver or gold interests relate or management estimates in those situations where other information is not available. Certain production figures may be updated in future periods as additional information is received. |
| 3) | The ounces produced and sold include ounces received from Goldcorp in connection with Goldcorp's four year commitment, commencing August 6, 2010, to deliver to Silver Wheaton 1.5 million ounces of silver per annum resulting from their sale of San Dimas to Primero. |
| 4) | Comprised of the Lagunas Norte, Pierina and Veladero silver interests. |
| 5) | Comprised of the Los Filos, Zinkgruvan, Keno Hill, Cozamin, Neves-Corvo, Stratoni, Minto, 777, Aljustrel and Constancia silver interests in addition to the previously owned Campo Morado and Mineral Park silver interests. |
| 6) | Comprised of the Coleman, Copper Cliff, Garson, Stobie, Creighton and Totten gold interests. |
| 7) | Comprised of the Minto, 777 and Constancia gold interests. |
| 8) | Gold ounces produced and sold are converted to a silver equivalent basis based on either (i) the ratio of the average silver price received to the average gold price received during the period from the assets that produce both gold and silver; or (ii) the ratio of the price of silver to the price of gold on the date of sale as per the London Bullion Metal Exchange for the assets which produce only gold. |
| 9) | Payable silver equivalent ounces produced but not yet delivered are based on management estimates. These figures may be updated in future periods as additional information is received. |
| 2015 | 2014 | |||||||||||||||||||||||
Q4 | Q3 | Q2 | Q1 | Q4 | Q3 | Q2 | Q1 | |||||||||||||||||
| Total silver ounces sold (000's) | 8,751 | 6,575 | 5,575 | 5,665 | 5,733 | 6,299 | 5,227 | 6,225 | ||||||||||||||||
Average realized silver price¹ | $ | 14.75 | $ | 15.05 | $ | 16.42 | $ | 16.95 | $ | 16.46 | $ | 18.98 | $ | 19.81 | $ | 20.36 | ||||||||
| Silver sales (000's) | $ | 129,087 | $ | 98,926 | $ | 91,552 | $ | 96,012 | $ | 94,395 | $ | 119,535 | $ | 103,540 | $ | 126,744 | ||||||||
| Total gold ounces sold | 64,899 | 48,077 | 60,974 | 28,399 | 37,904 | 36,718 | 34,778 | 30,122 | ||||||||||||||||
Average realized gold price¹ | $ | 1,100 | $ | 1,130 | $ | 1,195 | $ | 1,214 | $ | 1,213 | $ | 1,261 | $ | 1,295 | $ | 1,283 | ||||||||
| Gold sales (000's) | $ | 71,409 | $ | 54,325 | $ | 72,883 | $ | 34,492 | $ | 45,980 | $ | 46,317 | $ | 45,030 | $ | 38,635 | ||||||||
Total silver equivalent ounces sold (000's) 2 | 13,614 | 10,194 | 10,043 | 7,723 | 8,541 | 8,740 | 7,494 | 8,116 | ||||||||||||||||
Average realized silver equivalent price 1, 2 | $ | 14.73 | $ | 15.03 | $ | 16.38 | $ | 16.90 | $ | 16.43 | $ | 18.98 | $ | 19.83 | $ | 20.38 | ||||||||
| Total sales (000's) | $ | 200,496 | $ | 153,251 | $ | 164,435 | $ | 130,504 | $ | 140,375 | $ | 165,852 | $ | 148,570 | $ | 165,379 | ||||||||
Average cash cost, silver 1, 3 | $ | 4.06 | $ | 4.26 | $ | 4.26 | $ | 4.14 | $ | 4.13 | $ | 4.16 | $ | 4.15 | $ | 4.12 | ||||||||
Average cash cost, gold 1, 3 | $ | 396 | $ | 389 | $ | 395 | $ | 388 | $ | 391 | $ | 378 | $ | 393 | $ | 381 | ||||||||
Average cash cost, silver equivalent 1, 2, 3 | $ | 4.50 | $ | 4.58 | $ | 4.76 | $ | 4.46 | $ | 4.51 | $ | 4.59 | $ | 4.72 | $ | 4.57 | ||||||||
| Net (loss) earnings (000's) | $ | (169,263) | $ | (95,925) | $ | 53,726 | $ | 49,419 | $ | 52,030 | $ | 4,496 | $ | 63,492 | $ | 79,809 | ||||||||
| Add back - impairment loss (net of tax) | 226,673 | 145,726 | - | - | - | 68,151 | - | - | ||||||||||||||||
Adjusted net earnings 4 (000's) | $ | 57,410 | $ | 49,801 | $ | 53,726 | $ | 49,419 | $ | 52,030 | $ | 72,647 | $ | 63,492 | $ | 79,809 | ||||||||
| (Loss) earnings per share | ||||||||||||||||||||||||
| Basic | $ | (0.42) | $ | (0.24) | $ | 0.13 | $ | 0.13 | $ | 0.14 | $ | 0.01 | $ | 0.18 | $ | 0.22 | ||||||||
| Diluted | $ | (0.42) | $ | (0.24) | $ | 0.13 | $ | 0.13 | $ | 0.14 | $ | 0.01 | $ | 0.18 | $ | 0.22 | ||||||||
Adjusted earnings per share 4 | ||||||||||||||||||||||||
| Basic | $ | 0.14 | $ | 0.12 | $ | 0.13 | $ | 0.13 | $ | 0.14 | $ | 0.20 | $ | 0.18 | $ | 0.22 | ||||||||
| Diluted | $ | 0.14 | $ | 0.12 | $ | 0.13 | $ | 0.13 | $ | 0.14 | $ | 0.20 | $ | 0.18 | $ | 0.22 | ||||||||
| Cash flow from operations (000's) | $ | 133,389 | $ | 99,547 | $ | 109,292 | $ | 89,131 | $ | 94,120 | $ | 120,379 | $ | 102,543 | $ | 114,832 | ||||||||
Cash flow from operations per share 5 | ||||||||||||||||||||||||
| Basic | $ | 0.33 | $ | 0.25 | $ | 0.27 | $ | 0.24 | $ | 0.26 | $ | 0.34 | $ | 0.29 | $ | 0.32 | ||||||||
| Diluted | $ | 0.33 | $ | 0.25 | $ | 0.27 | $ | 0.24 | $ | 0.26 | $ | 0.34 | $ | 0.29 | $ | 0.32 | ||||||||
| Dividends | ||||||||||||||||||||||||
| Dividends declared (000's) | $ | 20,192 | $ | 20,214 | $ | 20,205 | $ | 20,198 6 | $ | 21,861 | $ | 21,484 | $ | 25,035 | $ | 25,020 7 | ||||||||
| Dividends declared per share | $ | 0.05 | $ | 0.05 | $ | 0.05 | $ | 0.05 | $ | 0.06 | $ | 0.06 | $ | 0.07 | $ | 0.07 | ||||||||
Total assets (000's) | $ | 5,632,211 | $ | 5,009,177 | $ | 5,203,371 | $ | 5,268,074 | $ | 4,647,763 | $ | 4,618,131 | $ | 4,521,595 | $ | 4,476,865 | ||||||||
Total liabilities (000's) | $ | 1,481,476 | $ | 666,356 | $ | 735,672 | $ | 840,578 | $ | 1,019,027 | $ | 1,017,815 | $ | 1,021,391 | $ | 1,045,190 | ||||||||
Total shareholders' equity (000's) | $ | 4,150,735 | $ | 4,342,821 | $ | 4,467,699 | $ | 4,427,496 | $ | 3,628,736 | $ | 3,600,316 | $ | 3,500,204 | $ | 3,431,675 | ||||||||
| 1) | Expressed as United States dollars per ounce. |
| 2) | Gold ounces produced and sold are converted to a silver equivalent basis based on either (i) the ratio of the average silver price received to the average gold price received during the period from the assets that produce both gold and silver; or (ii) the ratio of the price of silver to the price of gold on the date of sale as per the London Bullion Metal Exchange for the assets which produce only gold. |
| 3) | Refer to discussion on non-IFRS measure (iii) on page 44 of this MD&A. |
| 4) | Refer to discussion on non-IFRS measure (i) on page 42 of this MD&A |
| 5) | Refer to discussion on non-IFRS measure (ii) on page 43 of this MD&A. |
| 6) | On March 18, 2015, the Company declared dividends of $0.05 per common share for total dividends of $20.2 million, which was paid on April 14, 2015. |
| 7) | On March 20, 2014, the Company declared dividends of $0.07 per common share for total dividends of $25.0 million, which was paid on April 15, 2014. |
| Three Months Ended December 31, 2015 | ||||||||||||||||||||||
Ounces Produced² | Ounces Sold | Sales | Average Realized Price ($'s Per Ounce) | Average Cash Cost ($'s Per Ounce)3 | Average Depletion ($'s Per Ounce) | Gross Margin | Impairment Charges 4 | Other | Net Earnings | Cash Flow From Operations | Total Assets | |||||||||||
| Silver | ||||||||||||||||||||||
| San Dimas | 2,317 | 2,097 | $ | 29,954 | $ | 14.28 | $ | 4.24 | $ | 0.88 | $ | 19,218 | $ | - | $ | - | $ | 19,218 | $ | 21,061 | $ | 146,555 |
| Yauliyacu | 749 | 987 | 15,189 | 15.39 | 4.20 | 6.43 | 4,693 | - | - | 4,693 | 11,044 | 165,282 | ||||||||||
| Peñasquito | 1,766 | 2,086 | 32,125 | 15.40 | 4.07 | 2.85 | 17,700 | - | - | 17,700 | 23,636 | 430,847 | ||||||||||
| Antamina | 2,403 | 1,340 | 18,858 | 14.07 | 2.80 | 9.93 | 1,802 | - | - | 1,802 | 15,110 | 886,981 | ||||||||||
Barrick 5 | 627 | 569 | 8,231 | 14.47 | 3.90 | 3.24 | 4,171 | (109,723) | - | (105,552) | 5,595 | 498,090 | ||||||||||
Other 6 | 2,422 | 1,672 | 24,730 | 14.79 | 4.82 | 4.32 | 9,449 | (20,569) | - | (11,120) | 17,208 | 458,911 | ||||||||||
| 10,284 | 8,751 | $ | 129,087 | $ | 14.75 | $ | 4.06 | $ | 4.17 | $ | 57,033 | $ | (130,292) | $ | - | $ | (73,259) | $ | 93,654 | $ | 2,586,666 | |
| Gold | ||||||||||||||||||||||
Sudbury 7 | 12,203 | 6,256 | $ | 6,965 | $ | 1,113 | $ | 400 | $ | 841 | $ | (801) | $ | (49,439) | $ | - | $ | (50,240) | $ | 4,463 | $ | 506,250 |
| Salobo | 37,680 | 44,491 | 49,051 | 1,103 | 400 | 420 | 12,579 | - | - | 12,579 | 31,255 | 2,156,757 | ||||||||||
Other 8 | 19,293 | 14,152 | 15,393 | 1,088 | 381 | 531 | 2,476 | (51,170) | - | (48,694) | 10,090 | 219,739 | ||||||||||
| 69,176 | 64,899 | $ | 71,409 | $ | 1,100 | $ | 396 | $ | 485 | $ | 14,254 | $ | (100,609) | $ | - | $ | (86,355) | $ | 45,808 | $ | 2,882,746 | |
Silver equivalent 9 | 15,463 | 13,614 | $ | 200,496 | $ | 14.73 | $ | 4.50 | $ | 4.99 | $ | 71,287 | $ | (230,901) | $ | - | $ | (159,614) | $ | 139,462 | $ | 5,469,412 |
| Corporate | ||||||||||||||||||||||
| General and administrative | $ | (9,011) | $ | (9,011) | ||||||||||||||||||
| Other | (638) | (638) | ||||||||||||||||||||
| Total corporate | $ | (9,649) | $ | (9,649) | $ | (6,073) | $ | 162,799 | ||||||||||||||
| 15,463 | 13,614 | $ | 200,496 | $ | 14.73 | $ | 4.50 | $ | 4.99 | $ | 71,287 | $ | (230,901) | $ | (9,649) | $ | (169,263) | $ | 133,389 | $ | 5,632,211 | |
| 1) | All figures in thousands except gold ounces produced and sold and per ounce amounts. |
| 2) | Ounces produced represent the quantity of silver and gold contained in concentrate or doré prior to smelting or refining deductions. Production figures are based on information provided by the operators of the mining operations to which the silver or gold interests relate or management estimates in those situations where other information is not available. Certain production figures may be updated in future periods as additional information is received. |
| 3) | Refer to discussion on non-IFRS measure (iii) on page 44 of this MD&A. |
| 4) | Please see Impairment of Silver and Gold Interests section in this MD&A for further information. |
| 5) | Comprised of the operating Lagunas Norte, Pierina and Veladero silver interests in addition to the non-operating Pascua-Lama silver interest. |
| 6) | Comprised of the operating Los Filos, Zinkgruvan, Cozamin, Neves-Corvo, Stratoni, Minto, 777 and Constancia silver interests in addition to the non-operating Keno Hill, Rosemont, Aljustrel and Loma de La Plata silver interests. |
| 7) | Comprised of the operating Coleman, Copper Cliff, Garson, Stobie, Creighton and Totten gold interests in addition to the non-operating Victor gold interest. |
| 8) | Comprised of the operating Minto, 777 and Constancia gold interests in addition to the non-operating Rosemont gold interest. |
| 9) | Gold ounces produced and sold are converted to a silver equivalent basis based on either (i) the ratio of the average silver price received to the average gold price received during the period from the assets that produce both gold and silver; or (ii) the ratio of the price of silver to the price of gold on the date of sale as per the London Bullion Metal Exchange for the assets which produce only gold. The gold / silver ratio during the three months ended December 31, 2015 was 74.9. |
| Three Months Ended December 31, 2014 | ||||||||||||||||||||
Ounces Produced² | Ounces Sold | Sales | Average Realized Price ($'s Per Ounce) | Average Cash Cost ($'s Per Ounce)3 | Average Depletion ($'s Per Ounce) | Gross Margin | Other | Net Earnings | Cash Flow From Operations | Total Assets | ||||||||||
| Silver | ||||||||||||||||||||
| San Dimas | 1,744 | 1,555 | $ | 25,571 | $ | 16.44 | $ | 4.20 | $ | 0.81 | $ | 17,773 | $ | - | $ | 17,773 | $ | 19,040 | $ | 152,951 |
| Yauliyacu | 687 | 761 | 11,896 | 15.63 | 4.16 | 5.92 | 4,221 | - | 4,221 | 8,730 | 187,478 | |||||||||
| Peñasquito | 1,582 | 1,640 | 27,493 | 16.76 | 4.05 | 2.98 | 15,966 | - | 15,966 | 20,851 | 451,145 | |||||||||
Barrick 4 | 690 | 671 | 11,216 | 16.72 | 3.90 | 3.26 | 6,411 | - | 6,411 | 8,600 | 605,328 | |||||||||
Other 5 | 1,701 | 1,106 | 18,219 | 16.47 | 4.29 | 3.95 | 9,101 | - | 9,101 | 12,929 | 559,747 | |||||||||
| 6,404 | 5,733 | $ | 94,395 | $ | 16.46 | $ | 4.13 | $ | 3.00 | $ | 53,472 | $ | - | $ | 53,472 | $ | 70,150 | $ | 1,956,649 | |
| Gold | ||||||||||||||||||||
Sudbury 6 | 9,924 | 11,251 | $ | 14,231 | $ | 1,265 | $ | 400 | $ | 841 | $ | 263 | $ | - | $ | 263 | $ | 10,168 | $ | 583,862 |
| Salobo | 12,253 | 14,270 | 16,924 | 1,186 | 400 | 462 | 4,625 | - | 4,625 | 11,216 | 1,302,202 | |||||||||
Other 7 | 13,925 | 12,383 | 14,825 | 1,197 | 373 | 616 | 2,573 | - | 2,573 | 10,316 | 405,552 | |||||||||
| 36,102 | 37,904 | $ | 45,980 | $ | 1,213 | $ | 391 | $ | 625 | $ | 7,461 | $ | - | $ | 7,461 | $ | 31,700 | $ | 2,291,616 | |
Silver equivalent 8 | 9,079 | 8,541 | $ | 140,375 | $ | 16.43 | $ | 4.51 | $ | 4.79 | $ | 60,933 | $ | - | $ | 60,933 | $ | 101,850 | $ | 4,248,265 |
| Corporate | ||||||||||||||||||||
| General and administrative | $ | (8,992) | $ | (8,992) | ||||||||||||||||
| Other | 89 | 89 | ||||||||||||||||||
| Total corporate | $ | (8,903) | $ | (8,903) | $ | (7,730) | $ | 399,498 | ||||||||||||
| 9,079 | 8,541 | $ | 140,375 | $ | 16.43 | $ | 4.51 | $ | 4.79 | $ | 60,933 | $ | (8,903) | $ | 52,030 | $ | 94,120 | $ | 4,647,763 | |
| 1) | All figures in thousands except gold ounces produced and sold and per ounce amounts. |
| 2) | Ounces produced represent the quantity of silver and gold contained in concentrate or doré prior to smelting or refining deductions. Production figures are based on information provided by the operators of the mining operations to which the silver or gold interests relate or management estimates in those situations where other information is not available. Certain production figures may be updated in future periods as additional information is received. |
| 3) | Refer to discussion on non-IFRS measure (iii) on page 44 of this MD&A. |
| 4) | Comprised of the operating Lagunas Norte, Pierina and Veladero silver interests in addition to the non-operating Pascua-Lama silver interest. |
| 5) | Comprised of the operating Los Filos, Zinkgruvan, Cozamin, Neves-Corvo, Stratoni, Minto, Constancia, 777 and Aljustrel silver interests, the non-operating Rosemont, Keno Hill and Loma de La Plata silver interests; and the previously owned Campo Morado and Mineral Park silver interests. |
| 6) | Comprised of the operating Coleman, Copper Cliff, Garson, Stobie, Totten and Creighton gold interests in addition to the non-operating Victor gold interest. |
| 7) | Comprised of the operating Minto, Constancia and 777 gold interests in addition to the non-operating Rosemont gold interest. |
| 8) | Gold ounces produced and sold are converted to a silver equivalent basis based on either (i) the ratio of the average silver price received to the average gold price received during the period from the assets that produce both gold and silver; or (ii) the ratio of the price of silver to the price of gold on the date of sale as per the London Bullion Metal Exchange for the assets which produce only gold. The gold / silver ratio during the three months ended December 31, 2014 was 74.1. |
| 9) | Certain comparative figures have been reclassified to conform with the financial statement presentation adopted for the current year. |
| · | 2.4 million ounce increase related to the recently acquired silver stream at the Antamina mine; |
| · | 1.9 million silver equivalent ounce (210%) increase related to gold production at the Salobo mine (25,400 gold ounces), with the increase in gold production being primarily due to higher throughput as a result of the continuing ramp up of the first 12 Mtpa line, the commissioning of the second 12 Mtpa line which commenced late in the second quarter of 2014, and the acquisition of an additional 25% gold interest in the Salobo mine as explained in the Silver and Gold interests section of this MD&A; |
| · | 722,000 ounce (42%) increase related to silver production at the Other mines, due primarily to the ramping up of production at the Constancia mine; |
| · | 573,000 ounce (33%) increase related to the San Dimas mine, due primarily to the mining of higher grade material; and |
| · | 391,000 silver equivalent ounce (38%) increase related to gold production at the Other mines (5,400 gold ounces), due primarily to ramping up of production at the Constancia mine. |
| · | $36.0 million increase related to a 68% increase in payable silver ounces produced; and |
| · | $6.2 million increase related to a 92% increase in payable gold ounces produced; and |
| · | $0.5 million increase related to the composition of mines from which silver is produced; and |
| · | $3.4 million increase related to the composition of mines from which gold is produced; and |
| · | $6.7 million decrease as a result of the timing of shipments of stockpiled concentrate and doré, primarily attributable to the following factors: |
| i. | $9.9 million decrease relating to the Antamina mine; partially offset by |
| ii. | $2.3 million increase relating to the Peñasquito mine; and |
| iii. | $1.9 million increase relating to the Salobo mine. |
| · | $29.1 million decrease due to a reduction in the operating margin per ounce, due primarily to a 10% decrease in the average realized selling price per silver equivalent ounce sold; and |
| · | $230.9 million decrease as a result of an impairment charge taken during the period, as more fully explained in the Impairment of Silver and Gold Interests section of this MD&A; and |
| · | $0.7 million decrease as a result of an increase in corporate costs as explained in the Corporate Costs section of the MD&A ($1.7 million increase from a cash flow perspective). |
| Year Ended December 31, 2015 | ||||||||||||||||||||||
Ounces Produced² | Ounces Sold | Sales | Average Realized Price ($'s Per Ounce) | Average Cash Cost ($'s Per Ounce)3 | Average Depletion ($'s Per Ounce) | Gross Margin | Impairment Charges 4 | Other | Net Earnings | Cash Flow From Operations | Total Assets | |||||||||||
| Silver | ||||||||||||||||||||||
| San Dimas | 7,449 | 7,277 | $ | 113,198 | $ | 15.56 | $ | 4.22 | $ | 0.88 | $ | 76,122 | $ | - | $ | - | $ | 76,122 | $ | 82,518 | $ | 146,555 |
| Yauliyacu | 2,717 | 2,544 | 40,079 | 15.75 | 4.19 | 6.43 | 13,040 | - | - | 13,040 | 29,407 | 165,282 | ||||||||||
| Peñasquito | 7,237 | 7,132 | 114,083 | 16.00 | 4.07 | 2.85 | 64,759 | - | - | 64,759 | 85,057 | 430,847 | ||||||||||
| Antamina | 2,403 | 1,340 | 18,858 | 14.07 | 2.80 | 9.93 | 1,802 | - | - | 1,802 | 15,110 | 886,981 | ||||||||||
Barrick 5 | 2,383 | 2,364 | 37,103 | 15.70 | 3.90 | 3.24 | 20,237 | (109,723) | - | (89,486) | 27,887 | 498,090 | ||||||||||
Other 6 | 8,528 | 5,909 | 92,257 | 15.61 | 4.63 | 4.49 | 38,328 | (74,291) | - | (35,963) | 65,899 | 458,911 | ||||||||||
| 30,717 | 26,566 | $ | 415,578 | $ | 15.64 | $ | 4.17 | $ | 3.41 | $ | 214,288 | $ | (184,014) | $ | - | $ | 30,274 | $ | 305,878 | $ | 2,586,666 | |
| Gold | ||||||||||||||||||||||
Sudbury 7 | 36,364 | 33,481 | $ | 39,201 | $ | 1,171 | $ | 400 | $ | 841 | $ | (2,364) | $ | (49,439) | $ | - | $ | (51,803) | $ | 25,371 | $ | 506,250 |
| Salobo | 125,624 | 108,398 | 124,250 | 1,146 | 400 | 420 | 35,389 | - | - | 35,389 | 80,890 | 2,156,757 | ||||||||||
Other 8 | 66,776 | 60,470 | 69,658 | 1,152 | 376 | 568 | 12,579 | (151,469) | - | (138,890) | 46,595 | 219,739 | ||||||||||
| 228,764 | 202,349 | $ | 233,109 | $ | 1,152 | $ | 393 | $ | 534 | $ | 45,604 | $ | (200,908) | $ | - | $ | (155,304) | $ | 152,856 | $ | 2,882,746 | |
Silver equivalent 9 | 47,697 | 41,574 | $ | 648,687 | $ | 15.60 | $ | 4.58 | $ | 4.78 | $ | 259,892 | $ | (384,922) | $ | - | $ | (125,030) | $ | 458,734 | $ | 5,469,412 |
| Corporate | ||||||||||||||||||||||
| General and administrative | $ | (32,237) | $ | (32,237) | ||||||||||||||||||
| Other | (4,775) | (4,775) | ||||||||||||||||||||
| Total corporate | $ | (37,012) | $ | (37,012) | $ | (27,375) | $ | 162,799 | ||||||||||||||
| 47,697 | 41,574 | $ | 648,687 | $ | 15.60 | $ | 4.58 | $ | 4.78 | $ | 259,892 | $ | (384,922) | $ | (37,012) | $ | (162,042) | $ | 431,359 | $ | 5,632,211 | |
| 1) | All figures in thousands except gold ounces produced and sold and per ounce amounts. |
| 2) | Ounces produced represent the quantity of silver and gold contained in concentrate or doré prior to smelting or refining deductions. Production figures are based on information provided by the operators of the mining operations to which the silver or gold interests relate or management estimates in those situations where other information is not available. Certain production figures may be updated in future periods as additional information is received. |
| 3) | Refer to discussion on non-IFRS measure (iii) on page 44 of this MD&A. |
| 4) | Please see Impairment of Silver and Gold Interests section in this MD&A for further information. |
| 5) | Comprised of the operating Lagunas Norte, Pierina and Veladero silver interests in addition to the non-operating Pascua-Lama silver interest. |
| 6) | Comprised of the operating Los Filos, Zinkgruvan, Cozamin, Neves-Corvo, Stratoni, Minto, 777 and Constancia silver interests in addition to the non-operating Keno Hill, Rosemont, Aljustrel and Loma de La Plata silver interests. |
| 7) | Comprised of the operating Coleman, Copper Cliff, Garson, Stobie, Creighton and Totten gold interests in addition to the non-operating Victor gold interest. |
| 8) | Comprised of the operating Minto, 777 and Constancia gold interests in addition to the non-operating Rosemont gold interest. |
| 9) | Gold ounces produced and sold are converted to a silver equivalent basis based on either (i) the ratio of the average silver price received to the average gold price received during the period from the assets that produce both gold and silver; or (ii) the ratio of the price of silver to the price of gold on the date of sale as per the London Bullion Metal Exchange for the assets which produce only gold. The gold / silver ratio during the year ended December 31, 2015 was 74.2. |
| Year Ended December 31, 2014 | ||||||||||||||||||||||
Ounces Produced² | Ounces Sold | Sales | Average Realized Price ($'s Per Ounce) | Average Cash Cost ($'s Per Ounce)3 | Average Depletion ($'s Per Ounce) | Gross Margin | Impairment Charges 4 | Other | Net Earnings | Cash Flow From Operations | Total Assets | |||||||||||
| Silver | ||||||||||||||||||||||
San Dimas 5 | 5,760 | 5,573 | $ | 104,095 | $ | 18.68 | $ | 4.19 | $ | 0.81 | $ | 76,228 | $ | - | $ | - | $ | 76,228 | $ | 80,769 | $ | 152,951 |
| Yauliyacu | 2,938 | 3,342 | 64,011 | 19.15 | 4.15 | 5.92 | 30,353 | - | - | 30,353 | 50,152 | 187,478 | ||||||||||
| Peñasquito | 7,318 | 7,100 | 134,757 | 18.98 | 4.05 | 2.98 | 84,860 | - | - | 84,860 | 106,004 | 451,145 | ||||||||||
Barrick 6 | 1,687 | 1,700 | 31,687 | 18.64 | 3.90 | 3.26 | 19,508 | - | - | 19,508 | 23,065 | 605,328 | ||||||||||
Other 7 | 7,971 | 5,769 | 109,664 | 19.01 | 4.27 | 4.25 | 60,495 | (68,151) | - | (7,656) | 86,161 | 559,747 | ||||||||||
| 25,674 | 23,484 | $ | 444,214 | $ | 18.92 | $ | 4.14 | $ | 3.22 | $ | 271,444 | $ | (68,151) | $ | - | $ | 203,293 | $ | 346,151 | $ | 1,956,649 | |
| Gold | ||||||||||||||||||||||
Sudbury 8 | 36,019 | 30,413 | $ | 38,720 | $ | 1,273 | $ | 400 | $ | 841 | $ | 962 | $ | - | $ | - | $ | 962 | $ | 26,993 | $ | 583,862 |
| Salobo | 40,057 | 43,912 | 54,762 | 1,247 | 400 | 462 | 16,917 | - | - | 16,917 | 37,198 | 1,302,202 | ||||||||||
Other 9 | 68,319 | 65,197 | 82,480 | 1,265 | 370 | 594 | 19,576 | - | - | 19,576 | 58,254 | 405,552 | ||||||||||
| 144,395 | 139,522 | $ | 175,962 | $ | 1,261 | $ | 386 | $ | 607 | $ | 37,455 | $ | - | $ | - | $ | 37,455 | $ | 122,445 | $ | 2,291,616 | |
Silver equivalent 10 | 35,400 | 32,891 | $ | 620,176 | $ | 18.86 | $ | 4.59 | $ | 4.87 | $ | 308,899 | $ | (68,151) | $ | - | $ | 240,748 | $ | 468,596 | $ | 4,248,265 |
| Corporate | ||||||||||||||||||||||
| General and administrative | $ | (37,860) | $ | (37,860) | ||||||||||||||||||
| Other | (3,062) | (3,062) | ||||||||||||||||||||
| Total corporate | $ | (40,922) | $ | (40,922) | $ | (36,723) | $ | 399,498 | ||||||||||||||
| 35,400 | 32,891 | $ | 620,176 | $ | 18.86 | $ | 4.59 | $ | 4.87 | $ | 308,899 | $ | (68,151) | $ | (40,922) | $ | 199,826 | $ | 431,873 | $ | 4,647,763 | |
| 1) | All figures in thousands except gold ounces produced and sold and per ounce amounts. |
| 2) | Ounces produced represent the quantity of silver and gold contained in concentrate or doré prior to smelting or refining deductions. Production figures are based on information provided by the operators of the mining operations to which the silver or gold interests relate or management estimates in those situations where other information is not available. Certain production figures may be updated in future periods as additional information is received. |
| 3) | Refer to discussion on non-IFRS measure (iii) on page 44 of this MD&A. |
| 4) | During the year ended December 31, 2014, the Company recognized an impairment charge of $68.2 million related to its previously owned Mineral Park and Campo Morado silver interests. |
| 5) | Results for San Dimas include 875,000 ounces received from Goldcorp in connection with Goldcorp's four year commitment, commencing August 6, 2010, to deliver to Silver Wheaton 1.5 million ounces of silver per annum resulting from their sale of San Dimas to Primero. |
| 6) | Comprised of the operating Lagunas Norte, Pierina and Veladero silver interests in addition to the non-operating Pascua-Lama silver interest. |
| 7) | Comprised of the operating Los Filos, Zinkgruvan, Cozamin, Neves-Corvo, Stratoni, Minto, Constancia, 777 and Aljustrel silver interests, the non-operating Rosemont, Keno Hill and Loma de La Plata silver interests; and the previously owned Campo Morado and Mineral Park silver interests. |
| 8) | Comprised of the operating Coleman, Copper Cliff, Garson, Stobie and Creighton gold interests in addition to the non-operating Totten and Victor gold interests. |
| 9) | Comprised of the operating Minto, Constancia and 777 gold interests in addition to the non-operating Rosemont gold interests. |
| 10) | Gold ounces produced and sold are converted to a silver equivalent basis based on either (i) the ratio of the average silver price received to the average gold price received during the period from the assets that produce both gold and silver; or (ii) the ratio of the price of silver to the price of gold on the date of sale as per the London Bullion Metal Exchange for the assets which produce only gold. The gold / silver ratio during the year ended December 31, 2014 was 67.4. |
| 11) | Certain comparative figures have been reclassified to conform with the financial statement presentation adopted for the current year. |
| · | 6.6 million silver equivalent ounce (242%) increase related to gold production at the Salobo mine (85,600 gold ounces), with the increase in gold production being primarily due to higher throughput as a result of the continuing ramp up of the first 12 Mtpa line, the commissioning of the second 12 Mtpa line which commenced late in the second quarter of 2014, and the acquisition of an additional 25% gold interest in the Salobo mine as explained in the Silver and Gold interests section of this MD&A, partially offset by lower grades; |
| · | 2.4 million ounce increase related to the recently acquired silver stream at the Antamina mine; and |
| · | 1.7 million ounce (29%) increase related to the San Dimas mine, due to a combination of (i) the annual sharing threshold increasing from 3.5 million ounces to 6.0 million ounces per year, effective August 6, 2014; and (ii) an 11% increase in mill throughput as a result of the expansion to 2,500 tonnes per day which was completed early in 2014; and (iii) the mining of higher grade material; partially offset by (iv) the cessation on August 6, 2014 of Goldcorp's obligation to deliver 1.5 million ounces of silver to the Company annually; |
| · | $60.5 million increase related to a 23% increase in payable silver ounces produced; and |
| · | $21.0 million increase related to a 57% increase in payable gold ounces produced; and |
| · | $3.9 million increase related to the composition of mines from which silver is produced; and |
| · | $9.2 million increase related to the composition of mines from which gold is produced; and |
| · | $28.8 million decrease as a result of the timing of shipments of stockpiled concentrate and doré, primarily attributable to the following factors: |
| i. | $12.3 million decrease relating to the Antamina mine; |
| ii. | $6.4 million decrease relating to the Salobo mine; |
| iii. | $5.5 million decrease relating to the Yauliyacu mine; and |
| iv. | $5.4 million decrease relating to the Other mines, primarily attributable to Constancia; and |
| · | $114.8 million decrease due to a reduction in the operating margin per ounce, due primarily to a 17% decrease in the average realized selling price per silver equivalent ounce sold; and |
| · | $316.8 million decrease as a result of an impairment charge totaling $384.9 million as compared to $68.2 million in the comparable period of the prior year, as more fully explained in the Impairment of Silver and Gold Interests section of this MD&A; and |
| · | $3.9 million increase as a result of a decrease in corporate costs as explained in the Corporate Costs section of this MD&A ($9.3 million increase from a cash flow perspective). |
Three Months Ended December 31 | Years Ended December 31 | |||
| (in thousands) | 2015 | 2014 | 2015 | 2014 |
| Silver interests | ||||
| Barrick | $109,723 | $ - | $109,723 | $ - |
| Other silver interests | ||||
| 777 | 10,056 | - | 63,778 | - |
| Keno Hill | 10,513 | - | 10,513 | - |
| Campo Morado | - | - | - | 31,091 |
| Mineral Park | - | - | - | 37,060 |
| Gold interests | ||||
| Sudbury | 49,439 | - | 49,439 | - |
| Other gold interests | ||||
| 777 | 51,170 | - | 151,469 | - |
Total impairment charges | $230,901 | $ - | $384,922 | $ 68,151 |
Three Months Ended December 31 | Years Ended December 31 | |||
| (in thousands) | 2015 | 2014 | 2015 | 2014 |
| General and administrative | $ 9,011 | $ 8,992 | $ 32,237 | $ 37,860 |
| Other | ||||
| Other expense | $ 396 | $ 723 | $ 4,076 | $ 1,830 |
| Interest expense | 1,364 | (6) | 4,090 | 2,277 |
| Income tax recovery | (1,122) | (806) | (3,391) | (1,045) |
| Total other corporate costs | $ 638 | $ (89) | $ 4,775 | $ 3,062 |
Total corporate costs | $ 9,649 | $ 8,903 | $ 37,012 | $ 40,922 |
Three Months Ended December 31 | Years Ended December 31 | |||
(in thousands) | 2015 | 2014 | 2015 | 2014 |
| Salaries and benefits | ||||
| Salaries and benefits, excluding PSUs | $ 2,807 | $ 1,689 | $ 11,456 | $ 11,662 |
| PSUs | 949 | 972 | 1,975 | 3,508 |
| Total salaries and benefits | $ 3,756 | $ 2,661 | $ 13,431 | $ 15,170 |
| Depreciation | 244 | 97 | 621 | 326 |
| Charitable donations | 181 | 1,174 | 1,965 | 3,187 |
| Other | 3,431 | 3,068 | 10,060 | 10,983 |
| Cash settled general and administrative | $ 7,612 | $ 7,000 | $ 26,077 | $ 29,666 |
| Equity settled stock based compensation (a non-cash expense) | 1,399 | 1,992 | 6,160 | 8,194 |
Total general and administrative | $ 9,011 | $ 8,992 | $ 32,237 | $ 37,860 |
Three Months Ended December 31 | Years Ended December 31 | |||
| (in thousands) | 2015 | 2014 | 2015 | 2014 |
Dividend income | $ (23) | $ (57) | $ (126) | $ (228) |
| Interest income | (17) | (46) | (122) | (123) |
| Stand-by fees | 810 | 731 | 3,462 | 2,900 |
| Foreign exchange gain | (248) | (193) | (1,133) | (609) |
| Amortization of credit facility origination fees - undrawn facilities | 205 | 256 | 923 | 1,020 |
| Write off of credit facility origination fees upon the repayment of the NRT Loan | - | - | 1,315 | - |
| Other | (331) | 32 | (243) | (1,130) |
Total other expense | $ 396 | $ 723 | $ 4,076 | $ 1,830 |
Three Months Ended December 31 | Years Ended December 31 | |||
| (in thousands) | 2015 | 2014 | 2015 | 2014 |
Current income tax expense related to foreign jurisdictions | $ 60 | $ 44 | $ 208 | $ 204 |
| Deferred income tax (recovery) expense related to: | ||||
| Origination and reversal of temporary differences | $ (4,403) | $ (850) | $ (13,089) | $ (1,249) |
| Write down (reversal of write down) of previously recognized temporary differences | 3,221 | - | 9,490 | - |
| Total deferred income tax (recovery) expense | $ (1,182) | $ (850) | $ (3,599) | $ (1,249) |
Income tax recovery recognized in net earnings | $ (1,122) | $ (806) | $ (3,391) | $ (1,045) |
| i. | Adjusted net earnings and adjusted net earnings per share are calculated by removing the effects of the non-cash impairment charges. The Company believes that, in addition to conventional measures prepared in accordance with IFRS, management and certain investors use this information to evaluate the Company's performance. |
Three Months Ended December 31 | Years Ended December 31 | |||||||||||
| (in thousands, except for per share amounts) | 2015 | 2014 | 2015 | 2014 | ||||||||
Net earnings (loss) | $ | (169,263) | $ | 52,030 | $ | (162,042) | $ | 199,826 | ||||
| Add back - impairment loss, net of tax | 226,673 | - | 372,399 | 68,151 | ||||||||
Adjusted net earnings | $ | 57,410 | $ | 52,030 | $ | 210,357 | $ | 267,977 | ||||
| Divided by: | ||||||||||||
| Basic weighted average number of shares outstanding | 403,909 | 364,436 | 395,755 | 359,401 | ||||||||
| Diluted weighted average number of shares outstanding | 404,079 | 364,718 | 395,938 | 359,804 | ||||||||
| Equals: | ||||||||||||
| Adjusted earnings per share - basic | $ | 0.14 | $ | 0.14 | $ | 0.53 | $ | 0.75 | ||||
| Adjusted earnings per share - diluted | $ | 0.14 | $ | 0.14 | $ | 0.53 | $ | 0.74 | ||||
| ii. | Operating cash flow per share (basic and diluted) is calculated by dividing cash generated by operating activities by the weighted average number of shares outstanding (basic and diluted). The Company presents operating cash flow per share as management and certain investors use this information to evaluate the Company's performance in comparison to other companies in the precious metal mining industry who present results on a similar basis. |
Three Months Ended December 31 | Years Ended December 31 | |||||||||||
| (in thousands, except for per share amounts) | 2015 | 2014 | 2015 | 2014 | ||||||||
Cash generated by operating activities | $ | 133,389 | $ | 94,120 | $ | 431,359 | $ | 431,873 | ||||
| Divided by: | ||||||||||||
| Basic weighted average number of shares outstanding | 403,909 | 364,436 | 395,755 | 359,401 | ||||||||
| Diluted weighted average number of shares outstanding | 404,079 | 364,718 | 395,938 | 359,804 | ||||||||
| Equals: | ||||||||||||
| Operating cash flow per share - basic | $ | 0.33 | $ | 0.26 | $ | 1.09 | $ | 1.20 | ||||
| Operating cash flow per share - diluted | $ | 0.33 | $ | 0.26 | $ | 1.09 | $ | 1.20 | ||||
| iii. | Average cash cost of silver and gold on a per ounce basis is calculated by dividing the total cost of sales, less depletion, by the ounces sold. In the precious metal mining industry, this is a common performance measure but does not have any standardized meaning. In addition to conventional measures prepared in accordance with IFRS, management and certain investors use this information to evaluate the Company's performance and ability to generate cash flow. |
Three Months Ended December 31 | Years Ended December 31 | |||||||||||
| (in thousands, except for gold ounces sold and per ounce amounts) | 2015 | 2014 | 2015 | 2014 | ||||||||
Cost of sales | $ | 129,209 | $ | 79,442 | $ | 388,795 | $ | 311,277 | ||||
| Less: depletion | (67,962) | (40,910) | (198,581) | (160,180) | ||||||||
| Cash cost of sales | $ | 61,247 | $ | 38,532 | $ | 190,214 | $ | 151,097 | ||||
| Cash cost of sales is comprised of: | ||||||||||||
| Total cash cost of silver sold | $ | 35,551 | $ | 23,698 | $ | 110,728 | $ | 97,221 | ||||
| Total cash cost of gold sold | 25,696 | 14,834 | 79,486 | 53,876 | ||||||||
| Total cash cost of sales | $ | 61,247 | $ | 38,532 | $ | 190,214 | $ | 151,097 | ||||
| Divided by: | ||||||||||||
| Total silver ounces sold | 8,751 | 5,733 | 26,566 | 23,484 | ||||||||
| Total gold ounces sold | 64,899 | 37,904 | 202,349 | 139,522 | ||||||||
Total silver equivalent ounces sold 1 | 13,614 | 8,541 | 41,574 | 32,891 | ||||||||
| Equals: | ||||||||||||
| Average cash cost of silver (per ounce) | $ | 4.06 | $ | 4.13 | $ | 4.17 | $ | 4.14 | ||||
| Average cash cost of gold (per ounce) | $ | 396 | $ | 391 | $ | 393 | $ | 386 | ||||
Average cash cost (per silver equivalent ounce 1) | $ | 4.50 | $ | 4.51 | $ | 4.58 | $ | 4.59 | ||||
| 1) | Gold ounces produced and sold are converted to a silver equivalent basis based on either (i) the ratio of the average silver price received to the average gold price received during the period from the assets that produce both gold and silver; or (ii) the ratio of the price of silver to the price of gold on the date of sale as per the London Bullion Metal Exchange for the assets which produce only gold. |
| iv. | Cash operating margin is calculated by subtracting the average cash cost of silver and gold on a per ounce basis from the average realized selling price of silver and gold on a per ounce basis. The Company presents cash operating margin as management and certain investors use this information to evaluate the Company's performance in comparison to other companies in the precious metal mining industry who present results on a similar basis. |
Three Months Ended December 31 | Years Ended December 31 | |||||||||||
| (in thousands, except for per ounce amounts) | 2015 | 2014 | 2015 | 2014 | ||||||||
| Average realized selling price of silver and gold | ||||||||||||
| Sales | $ | 200,496 | $ | 140,375 | $ | 648,687 | $ | 620,176 | ||||
Divided by - total silver equivalent ounces sold 1 | 13,614 | 8,541 | 41,574 | 32,891 | ||||||||
Equals - average realized price ($'s per silver equivalent ounce 1) | $ | 14.73 | $ | 16.43 | $ | 15.60 | $ | 18.86 | ||||
Less - average cash cost ($'s per silver equivalent ounce 1, 2) | (4.50) | (4.51) | (4.58) | (4.59) | ||||||||
Cash operating margin per silver equivalent ounce 1 | $ | 10.23 | $ | 11.92 | $ | 11.02 | $ | 14.27 | ||||
| 1) | Gold ounces produced and sold are converted to a silver equivalent basis based on either (i) the ratio of the average silver price received to the average gold price received during the period from the assets that produce both gold and silver; or (ii) the ratio of the price of silver to the price of gold on the date of sale as per the London Bullion Metal Exchange for the assets which produce only gold. |
| 2) | Refer to discussion on non-IFRS measure (iii) on page 44 of this MD&A. |
| Silver and Gold Interests | Attributable Payable Production to be Purchased | Per Ounce Cash Payment 1, 2 | Term of Agreement | Date of Original Contract | ||||
| Silver | Gold | Silver | Gold | |||||
| San Dimas | 100% 3 | 0% | $ | 4.24 | n/a | Life of Mine | 15-Oct-04 | |
| Yauliyacu | variable 4 | 0% | $ | 8.70 5 | n/a | Life of Mine 4 | 23-Mar-06 | |
| Peñasquito | 25% | 0% | $ | 4.09 | n/a | Life of Mine | 24-Jul-07 | |
| Salobo | 0% | 50% | n/a | $ | 400 | Life of Mine | 28-Feb-13 | |
| Sudbury | 0% | 70% | n/a | $ | 400 | 20 years | 28-Feb-13 | |
| Antamina | 33.75% | 0% | 20% of Spot | n/a | Life of Mine | 3-Nov-15 | ||
| Barrick | ||||||||
| Pascua-Lama | 25% | 0% | $ | 3.90 | n/a | Life of Mine | 8-Sep-09 | |
| Lagunas Norte | 100% | 0% | $ | 3.90 | n/a | 8.5 years | 8-Sep-09 | |
| Pierina | 100% | 0% | $ | 3.90 | n/a | 8.5 years 6 | 8-Sep-09 | |
| Veladero | 100% 7 | 0% | $ | 3.90 | n/a | 8.5 years | 8-Sep-09 | |
| Other | ||||||||
| Los Filos | 100% | 0% | $ | 4.26 | n/a | 25 years | 15-Oct-04 | |
| Zinkgruvan | 100% | 0% | $ | 4.27 | n/a | Life of Mine | 8-Dec-04 | |
| Stratoni | 100% | 0% | $ | 4.14 8 | n/a | Life of Mine | 23-Apr-07 | |
| Minto | 100% | 100% 9 | $ | 4.10 | $ | 315 | Life of Mine | 20-Nov-08 |
| Cozamin | 100% | 0% | $ | 4.24 | n/a | 10 years | 4-Apr-07 | |
| Neves-Corvo | 100% | 0% | $ | 4.14 | n/a | 50 years | 5-Jun-07 | |
| Aljustrel | 100% 10 | 0% | $ | 4.06 | n/a | 50 years | 5-Jun-07 | |
| Keno Hill | 25% | 0% | $ | 3.90 11 | n/a | Life of Mine | 2-Oct-08 | |
| Rosemont | 100% | 100% | $ | 3.90 | $ | 450 | Life of Mine | 10-Feb-10 |
| Loma de La Plata | 12.5% | 0% | $ | 4.00 | n/a | Life of Mine | n/a ¹² | |
| 777 | 100% | 100%/50% 13 | $ | 5.96 14 | $ | 404 14 | Life of Mine | 8-Aug-12 |
| Constancia | 100% | 50% 15 | $ | 5.90 14 | $ | 400 14 | Life of Mine | 8-Aug-12 |
| Early Deposit | ||||||||
| Toroparu | 50% 16 | 10% 16 | $ | 3.90 | $ | 400 | Life of Mine | 11-Nov-13 |
| Cotabambas | 100% 17 | 25% 17 | $ | 5.90 | $ | 450 | Life of Mine | n/a 18 |
| 1) | Subject to an annual inflationary adjustment with the exception of Loma de La Plata and Sudbury. |
| 2) | Should the prevailing market price for silver or gold be lower than this amount, the per ounce cash payment will be reduced to the prevailing market price, with the exception of Yauliyacu where the per ounce cash payment will not be reduced below $4.20 per ounce, subject to an annual inflationary factor. |
| 3) | Silver Wheaton is committed to purchase from Primero a per annum amount equal to the first 6 million ounces of payable silver produced at San Dimas and 50% of any excess. |
| 4) | On November 30, 2015, the Company amended its silver purchase agreement with Glencore. The term of the agreement, which was set to expire in 2026, was extended to the life of mine. Silver Wheaton is committed to purchase from Glencore a per annum amount equal to the first 1.5 million ounces of payable silver produced at Yauliyacu and 50% of any excess. |
| 5) | The price paid will be increased from the current $4.20 per ounce of silver delivered to $8.70 per ounce once all silver which had been produced at Yauliyacu as at December 31, 2015 has been delivered to the Company. As at December 31, 2015, this figure is approximately 0.4 million ounces. Should the market price of silver exceed $20 per ounce, in addition to the $8.70 per ounce, the Company is committed to pay Glencore an additional amount for each ounce of silver delivered equal to 50% of the excess, to a maximum of $10 per ounce. |
| 6) | As per Barrick's disclosure, closure activities were initiated at Pierina in August 2013. |
| 7) | Silver Wheaton's attributable silver production is subject to a maximum of 8% of the silver contained in the ore processed at Veladero during the period. |
| 8) | In October 2015, in order to incentivize additional exploration and potentially extend the limited remaining mine life of Stratoni, Silver Wheaton and Eldorado agreed to modify the Stratoni silver purchase agreement. The primary modification is to increase the production price per ounce of silver delivered to Silver Wheaton over the current fixed price by one of the following amounts: (i) $2.50 per ounce of silver delivered if 10,000 meters of drilling is completed outside of the existing ore body and within Silver Wheaton's defined area of interest ("Expansion Drilling"); (ii) $5.00 per ounce of silver delivered if 20,000 meters of Expansion Drilling is completed; and (iii) $7.00 per ounce of silver delivered if 30,000 meters of Expansion Drilling is completed. Drilling in all three cases must be completed by December 31, 2020, in order for the agreed upon increase in production price to be initiated. |
| 9) | The Company is committed to acquire 100% of the first 30,000 ounces of gold produced per annum and 50% thereafter. |
| 10) | Silver Wheaton only has the rights to silver contained in concentrate containing less than 15% copper at the Aljustrel mine. |
| 11) | In June 2014, the Company amended its silver purchase agreement with Alexco to increase the production payment to be a function of the silver price at the time of delivery. In addition, the area of interest was expanded to include properties currently owned by Alexco and properties acquired by Alexco in the future which fall within a one kilometer radius of existing Alexco holdings in the Keno Hill Silver District. The amended agreement is conditional on Alexco paying Silver Wheaton $20 million by December 31, 2015, or at Alexco's option, up to December 31, 2016. |
| 12) | Terms of the agreement not yet finalized. |
| 13) | The Company's share of gold production at 777 will remain at 100% until the later of the end of 2016 or the satisfaction of a completion test relating to Hudbay's Constancia mine, after which it will be reduced to 50% for the remainder of the mine life. |
| 14) | Subject to an increase to $9.90 per ounce of silver and $550 per ounce of gold after the initial 40 year term. |
| 15) | Gold recoveries will be set at 55% for the Constancia deposit and 70% for the Pampacancha deposit until 265,000 ounces of gold have been delivered to the Company. |
| 16) | During the 60 day period following the delivery of a feasibility study, environmental study and impact assessment, and other related documents (collectively, the "Toroparu Feasibility Documentation"), or after December 31, 2016 if the Toroparu Feasibility Documentation has not been delivered to Silver Wheaton by such date, Silver Wheaton may elect not to proceed with the precious metal purchase agreement, at which time Silver Wheaton will be entitled to a return of the amounts advanced less $2.0 million which is non-refundable or, at Sandspring's option, the gold stream percentage will be reduced from 10% to 0.909% and the silver stream percentage will be reduced from 50% to nil. Silver Wheaton may also elect to terminate the Toroparu Early Deposit Agreement upon the occurrence of certain events prior to the payment of any initial construction payment and elect to reduce the stream percentages or obtain a return of the amounts advanced less $2.0 million. |
| 17) | Following the delivery of certain feasibility documentation, the Company may elect to terminate the Cotabambas Early Deposit Agreement. Once 90 million silver equivalent ounces attributable to Silver Wheaton have been produced, the attributable production to be purchased will decrease to 66.67% of silver production and 16.67% of gold production for the life of mine. |
| 18) | The entering into of the Cotabambas Early Deposit Agreement is subject to the negotiation and completion of definitive documentation. There can be no assurance that the Cotabambas Early Deposit Agreement will be completed on the terms set out in the non-binding term sheet, or at all |
| Obligations With Scheduled Payment Dates | Other Commitments | ||||||||||||||
(in thousands) | 2016 | 2017 - 2019 | 2020 - 2021 | After 2021 | Sub-Total | Total | |||||||||
Bank debt 1 | $ | - | $ | - | $ | 1,466,000 | $ | - | $ | 1,466,000 | $ | - | $ | 1,466,000 | |
Interest 2 | 34,675 | 124,328 | 6,499 | - | 165,502 | - | 165,502 | ||||||||
Silver and gold interest payments 3 | |||||||||||||||
Rosemont 4 | - | - | - | - | - | 231,150 | 231,150 | ||||||||
| Loma de La Plata | - | - | - | - | - | 32,400 | 32,400 | ||||||||
| Toroparu | - | - | - | - | - | 138,000 | 138,000 | ||||||||
Cotabambas 5 | - | - | - | - | - | 140,000 | 140,000 | ||||||||
| Operating leases | 1,193 | 3,634 | 1,880 | 2,691 | 9,398 | - | 9,398 | ||||||||
Total contractual obligations | $ | 35,868 | $ | 127,962 | $ | 1,474,379 | $ | 2,691 | $ | 1,640,900 | $ | 541,550 | $ | 2,182,450 | |
| 1) | At December 31, 2015, the Company had $1.466 billion drawn and outstanding on the Revolving Facility. |
| 2) | As the applicable interest rates are floating in nature, the interest charges are estimated based on market-based forward interest rate curves at the end of the reporting period. |
| 3) | Does not reflect the contingent payment due related to the Salobo gold purchase agreement (see the Salobo section, below). |
| 4) | Includes contingent transaction costs of $1.1 million. |
| 5) | The entering into of the Cotabambas Early Deposit Agreement is subject to the negotiation and completion of definitive documentation. There can be no assurance that the Cotabambas Early Deposit Agreement will be completed on the terms set out in the non-binding term sheet, or at all. |
CRA Position/Status | Potential Income Inclusion | Potential Income Tax Payable | Payments Made/Pending | Timing | |
2005-2010 Taxation Years | Transfer pricing provisions of the Act should apply such that Silver Wheaton's income subject to tax in Canada should be increased by an amount equal to substantially all of the income earned outside of Canada by Silver Wheaton's foreign subsidiaries. | CRA has reassessed Silver Wheaton and is seeking to increase Silver Wheaton's income subject to tax in Canada by Cdn$715.3 million. | CRA has reassessed Silver Wheaton and is seeking to impose income tax of Cdn$201.3 million, transfer pricing penalties of Cdn$71.5 million and interest (calculated to September 24, 2015) and other penalties of Cdn$80.6 million for total of Cdn$353.4 million.(1) | Silver Wheaton has received approval from the CRA to post security in the form of a letter of guarantee in the amount of Cdn$191.7 million which includes interest accrued to-date plus estimated interest for the following year.(1) | Notice of Appeal filed January 8, 2016. Timing of resolution of the matter in court is uncertain. |
2011-2013 Taxation Years | CRA Audit commenced January 19, 2016. CRA has not issued a proposal or reassessment. | If CRA were to reassess on similar basis as 2005-2010 taxation years, CRA would seek to increase Silver Wheaton's income subject to tax in Canada by approximately $1.2 billion. (2) | If CRA were to reassess on similar basis as 2005-2010 taxation years, CRA would seek to impose income tax of approximately $310 million.(2), (3) | N/A | Time to complete CRA audit unknown. |
2014-2015 Taxation Years | Remain open to audit by CRA. | If CRA were to audit and then reassess on similar basis as 2005-2010 taxation years, CRA would seek to increase Silver Wheaton's income subject to tax in Canada by approximately $410 million. (2) | If CRA were to audit and then reassess on similar basis as 2005-2010 taxation years, CRA would seek to impose income tax of approximately $106 million. (2), (3) | N/A | N/A |
| · | IFRS 9 (2014) – Financial Instruments (amended 2014): In July 2014, the IASB issued the final version of IFRS 9 – Financial Instruments ("IFRS 9"). The Company adopted IFRS 9 (2009) – Financial Instruments effective January 1, 2010. The Company is currently evaluating the impact this amended standard is expected to have on its consolidated financial statements. |
| · | IFRS 15 – Revenue from Contracts with Customers: In May 2014 the IASB and the Financial Accounting Standards Board ("FASB") completed its joint project to clarify the principles for recognizing revenue and to develop a common revenue standard for IFRS and US GAAP. IFRS 15 establishes principles to address the nature, amount, timing and uncertainty of revenue and cash flows arising from an entity's contracts with customers. The Company is currently evaluating the impact this standard is expected to have on its consolidated financial statements. |
| · | IFRS 16 – Leases: In January 2016 the IASB and the FASB completed its joint project to address concerns by users of financial statements in respect of reduced comparability between financial statements due to the different accounting treatment applied to operating leases as compared to finance leases by removing the distinction between operating leases and finance leases and rather having all leases accounted for as a finance lease, subject to limited exceptions for short-term leases and leases of low value assets. The Company is currently evaluating the impact this standard is expected to have on its consolidated financial statements. |
| · | pertain to the maintenance of records that, in reasonable detail, accurately and fairly reflect the transactions and dispositions of the assets of the Company; |
| · | provide reasonable assurance that transactions are recorded as necessary to permit preparation of financial statements in accordance with IFRS, and that receipts and expenditures of the Company are being made only in accordance with authorizations of the Company's management and directors; and, |
| · | provide reasonable assurance regarding prevention or timely detection of unauthorized acquisition, use or disposition of the Company's assets that could have a material effect on the annual financial statements or interim financial statements. |
Proven | Probable | Proven & Probable | ||||||||
Tonnage | Grade | Contained | Tonnage | Grade | Contained | Tonnage | Grade | Contained | Process Recovery % (7) | |
| Mt | g/t | Moz | Mt | g/t | Moz | Mt | g/t | Moz | ||
| Silver | ||||||||||
Peñasquito (25%) (10) | ||||||||||
| Mill | 99.6 | 32.6 | 104.5 | 47.1 | 24.5 | 37.2 | 146.7 | 30.0 | 141.6 | 75-80% |
| Heap Leach | 4.1 | 22.7 | 3.0 | 1.4 | 19.9 | 0.9 | 5.4 | 22.0 | 3.9 | 22-28% |
San Dimas (10, 11) | 1.2 | 411.7 | 16.3 | 3.2 | 329.6 | 34.2 | 4.5 | 352.3 | 50.5 | 94% |
Antamina (33.75%) (12,13) | 64.5 | 11.0 | 22.7 | 137.4 | 10.5 | 46.2 | 201.8 | 10.6 | 68.9 | 71% |
| Pascua-Lama (25%) | 8.0 | 69.8 | 17.9 | 73.2 | 64.1 | 150.8 | 81.2 | 64.7 | 168.7 | 82% |
Veladero (12) | 3.7 | 12.8 | 1.5 | 66.1 | 12.8 | 27.3 | 69.8 | 12.8 | 28.8 | 8% |
Lagunas Norte (12) | 7.0 | 4.1 | 0.9 | 25.2 | 4.1 | 3.3 | 32.2 | 4.1 | 4.2 | 34% |
| Constancia | 506.0 | 3.1 | 50.3 | 114.0 | 2.9 | 10.8 | 620.0 | 3.1 | 61.1 | 71% |
| Zinkgruvan | ||||||||||
| Zinc | 8.1 | 80.0 | 20.7 | 3.7 | 51.0 | 6.0 | 11.7 | 70.9 | 26.7 | 87% |
| Copper | 3.5 | 35.0 | 3.9 | - | - | - | 3.5 | 35.0 | 3.9 | 65% |
| Neves-Corvo | ||||||||||
| Copper | 6.3 | 39.0 | 7.9 | 19.7 | 36.0 | 22.8 | 25.9 | 36.7 | 30.6 | 35% |
| Zinc | 11.5 | 71.5 | 26.4 | 13.9 | 62.0 | 27.6 | 25.3 | 66.3 | 54.0 | 20% |
Yauliyacu (14) | 0.7 | 136.6 | 3.1 | 3.2 | 137.9 | 14.1 | 3.9 | 137.6 | 17.1 | 85% |
777 (15) | 3.7 | 27.4 | 3.3 | 3.9 | 24.1 | 3.1 | 7.7 | 25.7 | 6.3 | 50% |
| Stratoni | 0.4 | 172.0 | 2.4 | 0.2 | 184.0 | 1.3 | 0.7 | 176.2 | 3.7 | 84% |
Cozamin (12) | - | - | - | 2.8 | 41.9 | 3.8 | 2.8 | 41.9 | 3.8 | 72% |
| Minto | 2.9 | 6.4 | 0.6 | 4.8 | 5.8 | 0.9 | 7.7 | 6.0 | 1.5 | 78% |
| Los Filos | 20.0 | 7.1 | 4.6 | 20.5 | 9.1 | 6.0 | 40.5 | 8.1 | 10.5 | 5% |
Rosemont (16) | 279.5 | 4.1 | 37.0 | 325.8 | 4.1 | 43.1 | 605.3 | 4.1 | 80.1 | 76% |
Metates Royalty (17) | 4.1 | 18.0 | 2.3 | 13.2 | 13.1 | 5.5 | 17.2 | 14.2 | 7.9 | 76% |
Total Silver | 329.2 | 444.8 | 774.0 | |||||||
| Gold | ||||||||||
Salobo (50%) (18) | 327.2 | 0.38 | 4.02 | 251.1 | 0.31 | 2.48 | 578.4 | 0.35 | 6.50 | 66% |
Sudbury (70%) (12) | - | - | - | 47.4 | 0.43 | 0.66 | 47.4 | 0.43 | 0.66 | 72% |
| Constancia (50%) | 253.0 | 0.05 | 0.42 | 57.0 | 0.07 | 0.14 | 310.0 | 0.06 | 0.56 | 61% |
777 (12,15) | 2.6 | 1.78 | 0.15 | 2.8 | 1.78 | 0.16 | 5.4 | 1.78 | 0.31 | 55% |
| Minto | 2.9 | 0.93 | 0.09 | 4.8 | 0.63 | 0.10 | 7.7 | 0.74 | 0.18 | 74% |
Toroparu (10%) (19) | 3.0 | 1.10 | 0.10 | 9.7 | 0.98 | 0.31 | 12.7 | 1.01 | 0.41 | 89% |
Metates Royalty (17) | 4.1 | 0.68 | 0.09 | 13.2 | 0.44 | 0.19 | 17.2 | 0.50 | 0.28 | 89% |
Total Gold | 4.87 | 4.02 | 8.89 | |||||||
Measured | Indicated | Measured & Indicated | |||||||
| Tonnage | Grade | Contained | Tonnage | Grade | Contained | Tonnage | Grade | Contained | |
| Mt | g/t | Moz | Mt | g/t | Moz | Mt | g/t | Moz | |
| Silver | |||||||||
Peñasquito (25%) (10) | |||||||||
| Mill | 23.6 | 30.5 | 23.2 | 37.7 | 24.6 | 29.9 | 61.3 | 26.9 | 53.0 |
| Heap Leach | 3.1 | 25.5 | 2.6 | 8.7 | 17.0 | 4.8 | 11.9 | 19.3 | 7.4 |
San Dimas (10, 11) | 0.3 | 154.3 | 1.5 | 0.9 | 161.1 | 4.9 | 1.2 | 159.5 | 6.4 |
Antamina (33.75%) (12,13) | 21.9 | 9.5 | 6.7 | 146.5 | 11.1 | 52.3 | 168.4 | 10.9 | 59.1 |
| Pascua-Lama (25%) | 3.7 | 26.4 | 3.1 | 35.7 | 22.3 | 25.5 | 39.4 | 22.7 | 28.7 |
| Constancia | 73.0 | 2.4 | 5.6 | 299.0 | 2.0 | 19.4 | 372.0 | 2.1 | 25.0 |
| Zinkgruvan | |||||||||
| Zinc | 1.5 | 62.1 | 3.0 | 5.1 | 95.0 | 15.7 | 6.7 | 87.5 | 18.8 |
| Copper | 1.6 | 22.8 | 1.2 | 0.6 | 49.0 | 0.9 | 2.2 | 29.8 | 2.1 |
| Neves-Corvo | |||||||||
| Copper | 8.2 | 51.4 | 13.6 | 36.3 | 48.7 | 56.9 | 44.5 | 49.2 | 70.5 |
| Zinc | 11.2 | 53.1 | 19.0 | 71.4 | 55.5 | 127.4 | 82.5 | 55.2 | 146.4 |
Yauliyacu (14) | 1.3 | 162.2 | 6.7 | 7.0 | 199.3 | 44.6 | 8.2 | 193.5 | 51.3 |
777 (15) | - | - | - | 0.7 | 26.1 | 0.6 | 0.7 | 26.1 | 0.6 |
| Stratoni | 0.3 | 193.5 | 1.7 | 0.2 | 203.8 | 1.4 | 0.5 | 198.0 | 3.1 |
| Minto | 8.0 | 3.3 | 0.8 | 32.3 | 3.4 | 3.5 | 40.3 | 3.4 | 4.4 |
| Los Filos | 81.6 | 6.7 | 17.6 | 276.3 | 7.9 | 70.0 | 357.9 | 7.6 | 87.6 |
Rosemont (16) | 38.5 | 3.0 | 3.7 | 197.7 | 2.7 | 17.1 | 236.2 | 2.7 | 20.8 |
Aljustrel (20) | 1.3 | 65.6 | 2.7 | 20.5 | 60.3 | 39.7 | 21.8 | 60.7 | 42.4 |
| Keno Hill (25%) | |||||||||
| Underground | - | - | - | 0.8 | 467.2 | 11.5 | 0.8 | 467.2 | 11.5 |
| Elsa Tailings | - | - | - | 0.6 | 119.0 | 2.4 | 0.6 | 119.0 | 2.4 |
| Loma de La Plata (12.5%) | - | - | - | 3.6 | 169.0 | 19.8 | 3.6 | 169.0 | 19.8 |
Cotabambas (21) | - | - | - | 117.1 | 2.7 | 10.3 | 117.1 | 2.7 | 10.3 |
Toroparu (50%) (20) | 22.2 | 1.2 | 0.8 | 97.9 | 0.7 | 2.3 | 120.1 | 0.8 | 3.1 |
Total Silver | 113.6 | 560.9 | 674.6 | ||||||
| Gold | |||||||||
Salobo (50%) (18) | 22.1 | 0.48 | 0.34 | 92.5 | 0.37 | 1.10 | 114.6 | 0.39 | 1.44 |
Sudbury (70%) (12) | - | - | - | 16.2 | 0.22 | 0.12 | 16.2 | 0.22 | 0.12 |
| Constancia (50%) | 36.5 | 0.05 | 0.06 | 149.5 | 0.04 | 0.18 | 186.0 | 0.04 | 0.23 |
777 (12,15) | - | - | - | 0.4 | 1.81 | 0.02 | 0.4 | 1.81 | 0.02 |
| Minto | 8.0 | 0.39 | 0.10 | 32.3 | 0.32 | 0.34 | 40.3 | 0.34 | 0.44 |
Cotabambas (25%) (21) | - | - | - | 29.3 | 0.23 | 0.21 | 29.3 | 0.23 | 0.21 |
Toroparu (10%) (19) | 0.9 | 0.87 | 0.03 | 7.9 | 0.83 | 0.21 | 8.8 | 0.84 | 0.24 |
Total Gold | 0.53 | 2.18 | 2.70 | ||||||
Inferred | |||
| Tonnage | Grade | Contained | |
| Mt | g/t | Moz | |
| Silver | |||
Peñasquito (25%) (10) | |||
| Mill | 4.9 | 20.6 | 3.2 |
| Heap Leach | 0.1 | 15.5 | 0.1 |
San Dimas (10, 11) | 6.5 | 292.7 | 61.3 |
Antamina (33.75) (12,13) | 351.1 | 11.1 | 125.3 |
| Pascua-Lama (25%) | 4.9 | 20.1 | 3.2 |
| Constancia | 200.0 | 1.9 | 12.0 |
| Zinkgruvan | |||
| Zinc | 7.3 | 83.0 | 19.4 |
| Copper | 0.2 | 39.0 | 0.2 |
| Neves-Corvo | |||
| Copper | 13.4 | 37.0 | 15.9 |
| Zinc | 12.6 | 55.0 | 22.3 |
Yauliyacu (14) | 13.5 | 177.6 | 76.9 |
777 (15) | 0.7 | 32.9 | 0.8 |
| Stratoni | 0.5 | 169.0 | 2.7 |
| Minto | 16.2 | 3.2 | 1.6 |
| Los Filos | 141.0 | 9.2 | 41.6 |
Rosemont (16) | 104.5 | 3.3 | 11.1 |
Aljustrel (20) | 8.7 | 50.4 | 14.0 |
| Keno Hill (25%) | |||
| Underground | 0.3 | 363.4 | 3.0 |
| Loma de La Plata (12.5%) | 0.2 | 76.0 | 0.4 |
Cotabambas (21) | 605.3 | 2.3 | 45.4 |
Toroparu (50%) (19) | 64.8 | 0.1 | 0.2 |
Metates Royalty (17) | 1.0 | 9.7 | 0.3 |
Total Silver | 460.9 | ||
| Gold | |||
Salobo (50%) (18) | 74.4 | 0.31 | 0.74 |
Sudbury (70%) (12) | 12.0 | 0.52 | 0.20 |
| Constancia (50%) | 100.0 | 0.03 | 0.10 |
777 (12, 15) | 0.4 | 1.79 | 0.02 |
| Minto | 16.2 | 0.30 | 0.16 |
Cotabambas (25%) (21) | 151.3 | 0.17 | 0.84 |
Toroparu (10%) (19) | 13.0 | 0.74 | 0.31 |
Metates Royalty (17) | 1.0 | 0.38 | 0.01 |
Total Gold | 2.38 | ||
| 1. | All Mineral Reserves and Mineral Resources have been estimated in accordance with the 2014 Canadian Institute of Mining, Metallurgy and Petroleum (CIM) Standards for Mineral Resources and Mineral Reserves and National Instrument 43-101 – Standards for Disclosure for Mineral Projects ("NI 43-101"), or the 2012 Australasian Joint Ore Reserves Committee (JORC) Code for Reporting of Exploration Results, Mineral Resources and Ore Reserves. |
| 2. | Mineral Reserves and Mineral Resources are reported above in millions of metric tonnes ("Mt"), grams per metric tonne ("g/t") and millions of ounces ("Moz"). |
| 3. | Individual qualified persons ("QPs"), as defined by the NI 43-101, for the technical information contained in this document (including the Mineral Reserve and Mineral Resource estimates) for the following operations are as follows: |
| a. | Salobo mine – Gerrit Vos, P.Eng., Dr. Georges Verly, P.Eng., Dr. Armando Simon, P.Geo., Pierre Lacombe, P.Eng., Donald Hickson, P.Eng., Vikram Khera, P.Eng. and Stella Searston, RM SME, all of whom are employees of Amec Foster Wheeler Americas Limited (Amec Foster Wheeler). |
| b. | All other operations and development projects: the Company's QPs Neil Burns, M.Sc., P.Geo. (Vice President, Technical Services); Samuel Mah, M.A.Sc., P.Eng. (Senior Director, Project Evaluations), both employees of the Company (the "Company's QPs"). |
| 4. | The Mineral Resources reported in the above tables are exclusive of Mineral Reserves. The San Dimas mine, Minto mine, Neves-Corvo mine, Zinkgruvan mine, Stratoni mine and Toroparu project (gold only) report Mineral Resources inclusive of Mineral Reserves. The Company's QPs have made the exclusive Mineral Resource estimates for these mines based on average mine recoveries and dilution. |
| 5. | Mineral Resources which are not Mineral Reserves do not have demonstrated economic viability. |
| 6. | Other than as detailed below, Mineral Reserves and Mineral Resources are reported as of December 31, 2015 based on information available to the Company as of the date of this document, and therefore will not reflect updates, if any, after such date. |
| a. | Mineral Resources and Mineral Reserves for the San Dimas, 777, Cozamin and Minto mines are reported as of December 31, 2014. |
| b. | Mineral Resources and Mineral Reserves for the Pascua-Lama project are reported as of December 31, 2013. |
| c. | Mineral Resources for the Constancia mine (including the Pampacancha deposit) are reported as of September 30, 2013 and Mineral Reserves as of December 31, 2013. |
| d. | Mineral Resources and Mineral Reserves for the Neves-Corvo and Zinkgruvan mines are reported as of June 30, 2015. |
| e. | Mineral Resources and Mineral Reserves for the Rosemont project are reported as of August 28, 2012. |
| f. | Mineral Resources for Aljustrel's Feitais and Moinho mines are reported as of November 30, 2010. Mineral Resources for the Estaçao project are reported as of December 31, 2007. |
| g. | Mineral Resources for Keno Hill's Elsa Tailings project are reported as of April 22, 2010, Lucky Queen project as of July 27, 2011, Onek project as of October 15, 2014, Flame and Moth and Bermingham projects as of April 28, 2015, Bellekeno mine Inferred Mineral Resources as of September 30, 2012 and Bellekeno mine Indicated Mineral Resources as of September 30, 2013. |
| h. | Mineral Resources for the Loma de La Plata project are reported as of May 20, 2009. |
| i. | Mineral Resources for the Cotabambas project are reported as of June 20, 2013. |
| j. | Mineral Resources and Mineral Reserves for gold at the Toroparu project are reported as of March 31, 2013 and Mineral Resources for silver are reported as of September 1, 2014. |
| k. | Mineral Resources for the Metates royalty are reported as of February 16, 2012 and Mineral Reserves as of March 18, 2013. |
| 7. | Process recoveries are the average percentage of silver or gold in a saleable product (doré or concentrate) recovered from mined ore at the applicable site process plants as reported by the operators. |
| 8. | Mineral Reserves are estimated using appropriate process and mine recovery rates, dilution, operating costs and the following commodity prices: |
| a. | Antamina mine - $2.96 per pound copper, $0.99 per pound zinc, $11.91 per pound molybdenum and $21.34 per ounce silver. |
| b. | Constancia mine - $1,250 per ounce gold, $25.00 per ounce silver, $3.00 per pound copper and $14.00 per pound molybdenum. |
| c. | Cozamin mine - $42.50 per tonne NSR cut-off assuming $20.00 per ounce silver, $2.50 per pound copper, $0.85 per pound lead and $0.80 per pound zinc. |
| d. | Lagunas Norte and Veladero mines - $1,000 per ounce gold and $15.00 per ounce silver. |
| e. | Los Filos mine - $1,100 per ounce gold and $16.50 per ounce silver. |
| f. | Metates royalty – 0.35 grams per tonne gold equivalent cut-off assuming $1,200 per ounce gold and $24.00 per ounce silver. |
| g. | Minto mine – 0.5% copper cut-off for Open Pit and $64.40 per tonne NSR cut-off for Underground assuming $300 per ounce gold, $3.90 per ounce silver and $2.50 per pound copper. |
| h. | Neves-Corvo mine – 1.6% copper cut-off for the copper Reserve and 4.8% zinc equivalent cut-off for all the zinc Reserves, both assuming $2.50 per pound copper, $1.00 per pound lead and zinc. |
| i. | Pascua-Lama project - $1,100 per ounce gold, $21.00 per ounce silver and $3.00 per pound copper. |
| j. | Peñasquito mine - $1,100 per ounce gold, $16.50 per ounce silver, $0.90 per pound lead and $0.95 per pound zinc. |
| k. | Rosemont project - $4.90 per ton NSR cut-off assuming $20.00 per ounce silver, $2.50 per pound copper and $15.00 per pound molybdenum. |
| l. | Salobo mine – 0.253% copper equivalent cut-off assuming $1,250 per ounce gold and $3.45 per pound copper. |
| m. | San Dimas mine – 2.94 grams per tonne gold equivalent cut-off assuming $1,200 per ounce gold and $18.00 per ounce silver. |
| n. | Stratoni mine – 15.54% zinc equivalent cut-off assuming $0.91 per pound lead and zinc. |
| o. | Sudbury mines - $1,250 per ounce gold, $18.50 per ounce silver, $9.07 per pound nickel, $2.95 per pound copper, $1,550 per ounce platinum, $875 per ounce palladium and $12.50 per pound cobalt. |
| p. | Toroparu project – 0.38 grams per tonne gold cut-off assuming $1,070 per ounce gold for fresh rock and 0.35 grams per tonne gold cut-off assuming $970 per ounce gold for saprolite. |
| q. | Yauliyacu mine - $17.20 per ounce silver, $2.83 per pound copper, $0.91 per pound lead and $1.02 per pound zinc. |
| r. | Zinkgruvan mine – 3.98% zinc equivalent cut-off for the zinc Reserve and 1.5% copper cut-off for the copper Reserve, both assuming $2.50 per pound copper and $1.00 per pound lead and zinc. |
| s. | 777 mine – $1,260 per ounce gold, $21.00 per ounce silver, $3.15 per pound copper and $1.07 per pound zinc. |
| 9. | Mineral Resources are estimated using appropriate recovery rates and the following commodity prices: |
| a. | Aljustrel mine – 4.5% zinc cut-off for Feitais and Moinho mines zinc Resources and 4.0% zinc cut-off for Estação zinc Resources. |
| b. | Antamina mine - $2.96 per pound copper $0.99 per pound zinc, $11.91 per pound molybdenum and $21.34 per ounce silver. |
| c. | Constancia mine – 0.12% copper cut-off for Constancia and 0.10% copper cut-off for Pampacancha. |
| d. | Cotabambas project – 0.2% copper equivalent cut-off assuming $1,350 per ounce gold, $23,00 per ounce silver, $3.20 per pound copper and $12,50 per pound molybdenum. |
| e. | Keno Hill mines: |
| i. | Bellekeno mine - $185 per tonne NSR cut-off assuming $22.50 per ounce silver, $0.85 per pound lead and $0.95 per pound zinc. |
| ii. | Flame and Moth and Bermingham projects - $185 per tonne NSR cut-off assuming $1,300 per ounce gold, $20.00 per ounce silver, $0.94 per pound lead and $1.00 per pound zinc. |
| iii. | Lucky Queen project - $185 per tonne NSR cut-off assuming $1,100 per ounce gold, $18.50 per ounce silver, $0.90 per pound lead and $0.95 per pound zinc. |
| iv. | Onek project - $185 per tonne NSR cut-off assuming $1,250 per ounce gold, $20.00 per ounce silver, $0.90 per pound lead and $0.95 per pound zinc. |
| v. | Elsa Tailings project – 50 grams per tonne silver cut-off. |
| f. | Loma de La Plata project – 50 gram per tonne silver equivalent cut-off assuming $12.50 per ounce silver and $0.50 per pound lead. |
| g. | Los Filos mine - $1,300 per ounce gold and $19.00 per ounce silver. |
| h. | Metates royalty - 0.35 grams per tonne gold equivalent cut-off assuming $1,200 per ounce gold and $24.00 per ounce silver. |
| i. | Neves-Corvo mine – 1.0% copper cut-off for the copper Resource and 3.0% zinc cut-off for the zinc Resource, both assuming $2.50 per pound copper and $1.00 per pound lead and zinc. |
| j. | Pascua-Lama project – $1,500 per ounce gold, $24.00 per ounce silver and $3.50 per pound copper. |
| k. | Peñasquito mine - $1,300 per ounce gold, $19.00 per ounce silver, $1.00 per pound lead and $1.00 per pound zinc. |
| l. | Salobo mine – 0.286% copper equivalent cut-off assuming $1,500 per ounce gold $3.67 per pound copper. |
| m. | San Dimas mine – 2.00 grams per tonne gold equivalent cut-off assuming $1,200 per ounce gold and $18.00 per ounce silver. |
| n. | Stratoni mine – 15.54% zinc equivalent cut-off assuming $0.91 per pound lead and zinc |
| o. | Sudbury mines - $1,250 per ounce gold, $18.50 per ounce silver, $9.07 per pound nickel, $2.95 per pound copper, $1,550 per ounce platinum, $875 per ounce palladium and $12.50 per pound cobalt. |
| p. | Minto mine – 0.5% copper cut-off. |
| q. | Rosemont project – 0.30% copper equivalent cut-off for Mixed and 0.15% copper equivalent for Sulfide assuming $20.00 per ounce silver, $2.50 per pound copper and $15.00 per pound molybdenum. |
| r. | Toroparu project – 0.30 grams per tonne gold cut-off assuming $1,350 per ounce gold. |
| s. | Yauliyacu mine – $17.20 per ounce silver, $2.83 per pound copper and $0.91 per pound lead and $1.02 per pound zinc. |
| t. | Zinkgruvan mine – 3.8% zinc equivalent cut-off for the zinc Resource and 1.0% copper cut-off for the copper Resource, both assuming $2.50 per pound copper and $1.00 per pound lead and zinc. |
| u. | 777 mine – $1,260 per ounce gold, $21.00 per ounce silver, $3.15 per pound copper and $1.07 per pound zinc. |
| 10. | The scientific and technical information in this document regarding the Peñasquito mine and the San Dimas mine was sourced by the Company from the following SEDAR (www.sedar.com) filed documents: |
| a. | Peñasquito - Goldcorp's MD&A dated February 25, 2016; and |
| b. | San Dimas - Primero annual information form filed on March 31, 2015. |
| 11. | The San Dimas silver purchase agreement provides that Primero will deliver to the Company a per annum amount equal to the first 6.0 million ounces of payable silver produced at the San Dimas mine and 50% of any excess, for the life of mine. |
| 12. | The Company's attributable Mineral Resources and Mineral Reserves for the Lagunas Norte, Veladero, Cozamin, and Antamina silver interests, in addition to the Sudbury and 777 gold interests, have been constrained to the production expected for the various contracts. |
| 13. | The Glencore Silver Purchase Agreement in respect to the Antamina mine (November 3, 2015) provides that Glencore will deliver 33.75% of the silver production until 140 million ounces are delivered and 22.5% of silver production thereafter, for a 50 year term that can be extended in increments of 10 years at the Company's discretion. Attributable reserves and resources have been calculated on the 33.75% / 22.5% basis. |
| 14. | On November 30, 2015, the Company amended its silver purchase agreement with Glencore in respect to the Yauliyacu mine. The term of the agreement which was set to expire in 2026, was extended to life of mine. Additionally, effective January 1, 2016, Glencore will deliver to the Company a per annum amount equal to the first 1.5 million ounces of payable silver produced at Yauliyacu and 50% of any excess. |
| 15. | The 777 precious metal purchase agreement provides that Hudbay will deliver 100% of the payable silver for the life of mine and 100% of the payable gold until completion of the Constancia mine, after which the gold stream will reduce to 50%. The gold figures in this table represent the attributable 777 mine Mineral Resources and Mineral Reserves constrained to the production expected for the 777 precious metal purchase agreement. |
| 16. | The Rosemont mine Mineral Resources and Mineral Reserves do not include the SX/EW leach material since this process does not recover silver. |
| 17. | Effective August 7, 2014, the Company entered into an agreement for a 1.5% net smelter returns royalty on Chesapeake Gold Corp's (Chesapeake) Metates property, located in Mexico. As part of the agreement, Chesapeake will have the right at any time for a period of five years to repurchase two-thirds of the royalty, with the Company retaining a 0.5% royalty interest. |
| 18. | The Company will file an updated technical report for the Salobo mine prepared by Amec Foster Wheeler within 15 days on www.sedar.com. |
| 19. | The Company's agreement with Sandspring is an early deposit structure whereby the Company will have the option not to proceed with the 10% gold stream and 50% silver stream on the Toroparu project following the delivery of a bankable definitive feasibility study. |
| 20. | The Company only has the rights to silver contained in concentrates containing less than 15% copper at the Aljustrel mine. |
| 21. | Under the terms of the proposed Cotabambas Early Deposit Agreement, the Company will be entitled to purchase 100% of the silver production and 25% of the gold production from the Cotabambas project until 90 million silver equivalent ounces attributable to the Company have been produced, at which point the stream will decrease to 66.67% of silver production and 16.67% of gold production for the life of mine. The Company's agreement with Panoro is an early deposit structure whereby, following the delivery of certain feasibility documentation, Silver Wheaton may elect to terminate the proposed Cotabambas Early Deposit Agreement. The entering into of the Cotabambas Early Deposit Agreement is subject to the negotiation and completion of definitive documentation. There can be no assurance that the Cotabambas Early Deposit Agreement will be completed on the terms set out in the non-binding term sheet or at all. |
| 22. | Silver and gold are produced as by-product metal at all operations with the exception of silver at the Keno Hill mines and Loma de La Plata project and gold at the Toroparu project; therefore, the economic cut-off applied to the reporting of silver and gold Mineral Resources and Mineral Reserves will be influenced by changes in the commodity prices of other metals at the time of reporting. |
| · | the normal course issuer bid ("NCIB") and the number of shares that may be purchased under the NCIB; |
| · | projected increases to Silver Wheaton's production and cash flow profile; |
| · | statements with respect to the entering into and completion of the Cotabambas Early Deposit Agreement, including the satisfaction and completion of definitive documentation and the payments to be made thereunder; |
| · | the expansion and exploration potential at the Salobo mine; |
| · | projected changes to Silver Wheaton's production mix; |
| · | anticipated increases in total throughput at the Salobo mine; |
| · | the effect of the SAT legal claim on Primero's business, financial condition, results of operations and cash flows for 2010-2014 and 2015-2019; |
| · | the estimated future production; |
| · | the future price of commodities; |
| · | the estimation of mineral reserves and mineral resources; |
| · | the realization of mineral reserve estimates; |
| · | the timing and amount of estimated future production (including 2016 and average attributable annual production over the next five years); |
| · | the costs of future production; |
| · | reserve determination; |
| · | estimated reserve conversion rates; |
| · | any statements as to future dividends, the ability to fund outstanding commitments and the ability to continue to acquire accretive precious metal stream interests; |
| · | confidence in the Company's business structure; |
| · | the Company's position relating to any dispute with the CRA and the Company's intention to defend reassessments issued by the CRA; the impact of potential taxes, penalties and interest payable to the CRA; possible audits for taxation years subsequent to 2013; estimates as to amounts that may be reassessed by the CRA in respect of taxation years subsequent to 2010; amounts that may be payable in respect of penalties and interest; the Company's intention to file future tax returns in a manner consistent with previous filings; that the CRA will continue to accept the Company posting security for amounts sought by the CRA under notices of reassessment for the 2005-2010 taxation years or will accept posting security for any other amounts that may be sought by the CRA under other notices of reassessment; the length of time it would take to resolve any dispute with the CRA or an objection to a reassessment; and assessments of the impact and resolution of various tax matters, including outstanding audits, proceedings with the CRA and proceedings before the courts; and |
| · | assessments of the impact and resolution of various legal and tax matters. |
| · | fluctuations in the price of commodities; |
| · | the absence of control over the Mining Operations from which Silver Wheaton purchases silver or gold and risks related to these Mining Operations including risks related to fluctuations in the price of the primary commodities mined at such operations, actual results of mining and exploration activities, environmental, economic and political risks of the jurisdictions in which the Mining Operations are located, and changes in project parameters as plans continue to be refined; |
| · | risks relating to having to rely on the accuracy of the public disclosure and other information Silver Wheaton receives from the owners and operators of the Mining Operations as the basis for its analyses, forecasts and assessments relating to its own business; |
| · | risks relating to production estimates from Mining Operations including anticipated timing of the commencement of production by certain Mining Operations; |
| · | differences in the interpretation or application of tax laws and regulations or accounting policies and rules; and Silver Wheaton's interpretation of, or compliance with, tax laws and regulations or accounting policies and rules, is found to be incorrect; |
| · | the Company's business or ability to enter into precious metal purchase agreements is materially impacted as a result of any CRA reassessment; |
| · | any challenge by the CRA of the Company's tax filings is successful and the potential negative impact to the Company's previous and future tax filings; |
| · | the tax impact to the Company's business operations is materially different than currently contemplated; |
| · | any reassessment of the Company's tax filings and the continuation or timing of any such process is outside the Company's control; |
| · | any requirement to pay reassessed tax; |
| · | the Company is not assessed taxes on its foreign subsidiary's income on the same basis that the Company pays taxes on its Canadian income, if taxable in Canada; |
| · | interest and penalties associated with a CRA reassessment having an adverse impact on the Company's financial position; |
| · | litigation risk associated with a challenge to the Company's tax filings; |
| · | litigation risk associated with outstanding legal matters; |
| · | credit and liquidity risks; |
| · | hedging risk; |
| · | competition in the mining industry; |
| · | risks related to the entering into and completion of the Cotabambas Early Deposit Agreement; |
| · | risks related to the ability of the companies with which the Company has precious metal purchase agreements to perform their obligations under those precious metal purchase agreements in the event of a material adverse effect on the results of operations, financial condition, cash flows or business of such companies; |
| · | risks related to Silver Wheaton's acquisition strategy; |
| · | risks related to the market price of the common shares of Silver Wheaton (the "Common Shares") , including with respect to the market price of the Common Shares being too high to ensure that purchases under the NCIB benefit Silver Wheaton or its shareholders; |
| · | risks related to Silver Wheaton's holding of long‑term investments in other exploration and mining companies; |
| · | risks related to the declaration, timing and payment of dividends; |
| · | the ability of Silver Wheaton and the Mining Operations to retain key management employees or procure the services of skilled and experienced personnel; |
| · | risks related to claims and legal proceedings against Silver Wheaton or the Mining Operations; |
| · | risks relating to unknown defects and impairments; |
| · | risks relating to security over underlying assets; |
| · | challenges related to ensuring the security and safety of information systems, including cyber security risks; |
| · | risks related to the adequacy of internal control over financial reporting; |
| · | risks related to governmental regulations, including environmental regulations and climate change; |
| · | risks related to international operations of Silver Wheaton and the Mining Operations; |
| · | risks relating to exploration, development and operations at the Mining Operations; |
| · | the ability of Silver Wheaton and the Mining Operations to obtain and maintain necessary licenses, permits, approvals and rulings; |
| · | the ability of Silver Wheaton and the Mining Operations to comply with applicable laws, regulations and permitting requirements; |
| · | lack of suitable infrastructure and employees to support the Mining Operations; |
| · | uncertainty in the accuracy of mineral reserves and mineral resources estimates; |
| · | risks relating to production estimates from Mining Operations; |
| · | inability to replace and expand mineral reserves; |
| · | risks relating to the calculation of production forecasts; |
| · | uncertainties related to title and indigenous rights with respect to the mineral properties of the Mining Operations; |
| · | the ability of Silver Wheaton and the Mining Operations to obtain adequate financing; |
| · | the ability of Mining Operations to complete permitting, construction, development and expansion; |
| · | challenges related to global financial conditions; and |
| · | risks relating to future sales or the issuance of equity securities; |
| · | Common Shares trading below their value from time to time; |
| · | Silver Wheaton will enter into definitive documentation for the Cotabambas Early Deposit Agreement and make the payments set out therein; |
| · | no material adverse change in the market price of commodities; |
| · | that the Mining Operations will continue to operate and the mining projects will be completed in accordance with public statements and achieve their stated production estimates; |
| · | no material adverse effect on the results of operations, financial condition, cash flows or business of the companies with which the Company has precious metal purchase agreements; |
| · | the continuing ability to fund or obtain funding for outstanding commitments; |
| · | Silver Wheaton's ability to source and obtain accretive precious metal stream interests; |
| · | expectations regarding the resolution of legal and tax matters, including the ongoing class action litigation involving the Company; |
| · | Silver Wheaton will be successful in challenging any reassessment by the CRA; |
| · | Silver Wheaton has properly considered the application of Canadian tax law to its structure and operations; |
| · | Silver Wheaton will continue to be permitted to post security for amounts sought by the CRA under notices of reassessment; |
| · | Silver Wheaton has filed its tax returns and paid applicable taxes in compliance with Canadian tax law; |
| · | Silver Wheaton will not change its business as a result of any CRA reassessment; |
| · | Silver Wheaton's ability to enter into new precious metal purchase agreements will not be impacted by any CRA reassessment; |
| · | expectations and assumptions concerning prevailing tax laws and the potential amount that could be reassessed as additional tax, penalties and interest by the CRA; |
| · | any foreign subsidiary income, if taxable in Canada, would be subject to the same or similar tax calculations as Silver Wheaton's Canadian income, including the Company's position, in respect of precious metal purchase agreements with upfront payments paid in the form of a deposit, that the estimates of income subject to tax is based on the cost of precious metal acquired under such precious metal purchase agreements being equal to the market value of such precious metal. |
| · | the estimate of the recoverable amount for any precious metal purchase agreement with an indicator of impairment; and |
| · | such other assumptions and factors as set out in the Disclosure. |
| i. | pertain to the maintenance of records that accurately and fairly reflect, in reasonable detail, the transactions related to Silver Wheaton's assets |
| ii. | provide reasonable assurance that transactions are recorded as necessary to permit preparation of financial statements in accordance with IFRS, and Silver Wheaton receipts and expenditures are made only in accordance with authorizations of management and Silver Wheaton's directors |
| iii. | provide reasonable assurance regarding prevention or timely detection of unauthorized acquisition, use, or disposition of Silver Wheaton's assets that could have a material effect on Silver Wheaton's financial statements. |
| Years Ended December 31 | |||||
| (US dollars and shares in thousands, except per share amounts) | Note | 2015 | 2014 | ||
Sales | 5 | $ | 648,687 | $ | 620,176 |
| Cost of sales | |||||
| Cost of sales, excluding depletion | $ | 190,214 | $ | 151,097 | |
| Depletion | 198,581 | 160,180 | |||
| Total cost of sales | $ | 388,795 | $ | 311,277 | |
Gross Margin | $ | 259,892 | $ | 308,899 | |
| Expenses and other income | |||||
General and administrative 1 | 6 | $ | 32,237 | $ | 37,860 |
| Impairment charges | 11 | 384,922 | 68,151 | ||
| Interest expense | 14 | 4,090 | 2,277 | ||
| Other expense | 7 | 4,076 | 1,830 | ||
| $ | 425,325 | $ | 110,118 | ||
| (Loss) earnings before income taxes | $ | (165,433) | $ | 198,781 | |
| Income tax recovery | 22 | 3,391 | 1,045 | ||
Net (loss) earnings | $ | (162,042) | $ | 199,826 | |
| Basic (loss) earnings per share | $ | (0.41) | $ | 0.56 | |
| Diluted (loss) earnings per share | $ | (0.41) | $ | 0.56 | |
| Weighted average number of shares outstanding | |||||
| Basic | 18 | 395,755 | 359,401 | ||
| Diluted | 18 | 395,938 | 359,804 | ||
| 1) Equity settled stock based compensation (a non-cash item) included in general and administrative expenses | $ | 6,160 | $ | 8,194 | |
| Years Ended December 31 | |||||
| (US dollars in thousands) | Note | 2015 | 2014 | ||
Net (loss) earnings | $ | (162,042) | $ | 199,826 | |
| Other comprehensive (loss) income | |||||
| Items that will not be reclassified to net earnings | |||||
| Loss on long-term investments - common shares held | 9 | (13,085) | (7,929) | ||
Total comprehensive (loss) income | $ | (175,127) | $ | 191,897 | |
| Note | December 31 | December 31 | |||
| (US dollars in thousands) | 2015 | 2014 | |||
Assets | |||||
| Current assets | |||||
| Cash and cash equivalents | 19 | $ | 103,297 | $ | 308,098 |
| Accounts receivable | 8 | 1,124 | 4,132 | ||
| Other | 10 | 1,455 | 26,263 | ||
| Total current assets | $ | 105,876 | $ | 338,493 | |
| Non-current assets | |||||
| Silver and gold interests | 10,11 | $ | 5,469,412 | $ | 4,248,265 |
| Early deposit - silver and gold interest | 12 | 15,725 | 13,599 | ||
| Royalty interest | 13 | 9,107 | 9,107 | ||
| Long-term investments | 9 | 19,776 | 32,872 | ||
| Other | 14 | 12,315 | 5,427 | ||
| Total non-current assets | $ | 5,526,335 | $ | 4,309,270 | |
Total assets | $ | 5,632,211 | $ | 4,647,763 | |
Liabilities | |||||
| Current liabilities | |||||
| Accounts payable and accrued liabilities | $ | 10,664 | $ | 14,798 | |
| Current portion of performance share units | 17.1 | 1,904 | 1,373 | ||
| Total current liabilities | $ | 12,568 | $ | 16,171 | |
| Non-current liabilities | |||||
| Bank debt | 14 | $ | 1,466,000 | $ | 998,518 |
| Deferred income taxes | 22 | 176 | 942 | ||
| Performance share units | 17.1 | 2,732 | 3,396 | ||
| Total non-current liabilities | $ | 1,468,908 | $ | 1,002,856 | |
| Total liabilities | $ | 1,481,476 | $ | 1,019,027 | |
| Shareholders' equity | |||||
| Issued capital | 15 | $ | 2,815,569 | $ | 2,037,923 |
| Reserves | 16 | (23,197) | (28,841) | ||
| Retained earnings | 1,358,363 | 1,619,654 | |||
| Total shareholders' equity | $ | 4,150,735 | $ | 3,628,736 | |
Total liabilities and shareholders' equity | $ | 5,632,211 | $ | 4,647,763 | |
Commitments and contingencies | 14, 23 | ||||
| /s/ Randy Smallwood | /s/ John Brough | |
| Randy Smallwood | John Brough | |
| Director | Director |
| Years Ended December 31 | |||||
| (US dollars in thousands) | Note | 2015 | 2014 | ||
| Operating activities | |||||
| Net (loss) earnings | $ | (162,042) | $ | 199,826 | |
| Adjustments for | |||||
| Depreciation and depletion | 199,202 | 160,506 | |||
| Amortization of credit facility origination fees: | |||||
| Interest expense | 238 | 125 | |||
| Amortization of credit facility origination fees - undrawn facilities | 7 | 923 | 1,020 | ||
| Write off of credit facility origination fees upon repayment of NRT Loan | 7 | 1,315 | - | ||
| Gain on disposal of silver interest | 10 | - | (1,260) | ||
| Impairment charges | 11 | 384,922 | 68,151 | ||
| Interest expense | 3,852 | 2,151 | |||
| Equity settled stock based compensation | 6,160 | 8,194 | |||
| Performance share units | 17.1 | 534 | 2,516 | ||
| Deferred income tax recovery | 22 | (3,599) | (1,249) | ||
| Investment income recognized in net earnings | (247) | (351) | |||
| Other | (509) | (155) | |||
| Change in non-cash working capital | 19 | 3,185 | (5,561) | ||
| Cash generated from operations | $ | 433,934 | $ | 433,913 | |
| Interest paid - expensed | (2,697) | (2,163) | |||
| Interest received | 122 | 123 | |||
| Cash generated from operating activities | $ | 431,359 | $ | 431,873 | |
| Financing activities | |||||
| Bank debt repaid | 14 | $ | (1,174,000) | $ | - |
| Bank debt drawn | 14 | 1,640,000 | - | ||
| Credit facility origination fees | 14 | (4,242) | (621) | ||
| Shares issued | 15 | 800,000 | - | ||
| Share issue costs | (31,785) | (152) | |||
| Redemption of share capital | (9,120) | - | |||
| Share purchase options exercised | 2,887 | 7,026 | |||
| Dividends paid | 15.2 | (68,593) | (79,775) | ||
| Cash generated from (applied to) financing activities | $ | 1,155,147 | $ | (73,522) | |
| Investing activities | |||||
| Silver and gold interests | 10 | $ | (1,800,117) | $ | (125,321) |
| Interest paid - capitalized to silver interests | (9,213) | (14,063) | |||
| Silver and gold interests - early deposit | 12 | (2,125) | (150) | ||
| Royalty interest | 13 | - | (9,107) | ||
| Proceeds on disposal of silver interest | 10,11 | 25,000 | 3,408 | ||
| Proceeds on disposal of long-term investments | 9 | 12 | - | ||
| Dividend income received | 126 | 228 | |||
| Other | (4,832) | (1,016) | |||
| Cash applied to investing activities | $ | (1,791,149) | $ | (146,021) | |
| Effect of exchange rate changes on cash and cash equivalents | $ | (158) | $ | (55) | |
| (Decrease) increase in cash and cash equivalents | $ | (204,801) | $ | 212,275 | |
| Cash and cash equivalents, beginning of year | 308,098 | 95,823 | |||
Cash and cash equivalents, end of year | 19 | $ | 103,297 | $ | 308,098 |
Reserves | |||||||||||||||||
| (US dollars in thousands) | Number of Shares (000's) | Issued Capital | Share Purchase Warrants Reserve | Share Purchase Options Reserve | Restricted Share Units Reserve | Long-Term Investment Revaluation Reserve (Net of Tax) | Total Reserves | Retained Earnings | Total | ||||||||
| At January 1, 2014 | 357,397 | $ | 1,879,475 | $ | 53,717 | $ | 19,443 | $ | 2,833 | $ | (101,611) | $ | (25,618) | $ | 1,512,689 | $ | 3,366,546 |
| Total comprehensive income | |||||||||||||||||
| Net earnings | $ | - | $ | - | $ | - | $ | - | $ | - | $ | - | $ | 199,826 | $ | 199,826 | |
OCI 1 | - | - | - | - | (7,929) | (7,929) | - | (7,929) | |||||||||
| Total comprehensive income | $ | - | $ | - | $ | - | $ | - | $ | (7,929) | $ | (7,929) | $ | 199,826 | $ | 191,897 | |
Fair value of SBC 1 | $ | - | $ | - | $ | 7,199 | $ | 995 | $ | - | $ | 8,194 | $ | - | $ | 8,194 | |
Options 1 exercised | 600 | 9,454 | - | (2,428) | - | - | (2,428) | - | 7,026 | ||||||||
RSUs 1 released | 22 | 521 | - | - | (521) | - | (521) | - | - | ||||||||
| Shares issued | 6,112 | 135,000 | - | - | - | - | - | - | 135,000 | ||||||||
| Share issue costs | (152) | - | - | - | - | - | - | (152) | |||||||||
DRIP 1 | 647 | 13,625 | - | - | - | - | - | - | 13,625 | ||||||||
| Dividends (Note 15.2) | - | - | - | - | - | - | (93,400) | (93,400) | |||||||||
| Reallocation | - | - | - | - | (539) | (539) | 539 | - | |||||||||
| At December 31, 2014 | 364,778 | $ | 2,037,923 | $ | 53,717 | $ | 24,214 | $ | 3,307 | $ | (110,079) | $ | (28,841) | $ | 1,619,654 | $ | 3,628,736 |
| Total comprehensive income | |||||||||||||||||
| Net loss | $ | - | $ | - | $ | - | $ | - | $ | - | $ | - | $ | (162,042) | $ | (162,042) | |
OCI 1 | - | - | - | - | (13,085) | (13,085) | - | (13,085) | |||||||||
| Total comprehensive loss | $ | - | $ | - | $ | - | $ | - | $ | (13,085) | $ | (13,085) | $ | (162,042) | $ | (175,127) | |
Fair value of SBC 1 | $ | - | $ | - | $ | 5,312 | $ | 848 | $ | - | $ | 6,160 | $ | - | $ | 6,160 | |
Options 1 exercised | 229 | 4,127 | - | (1,240) | - | - | (1,240) | - | 2,887 | ||||||||
RSUs 1 released | 32 | 842 | - | - | (842) | - | (842) | - | - | ||||||||
| Shares issued | 38,930 | 800,000 | - | - | - | - | - | - | 800,000 | ||||||||
| Shares cancelled | (777) | (5,331) | - | - | - | - | - | (3,789) | (9,120) | ||||||||
| Share issue costs | (31,375) | - | - | - | - | - | - | (31,375) | |||||||||
DIT 1 expense | (2,833) | - | - | - | - | - | - | (2,833) | |||||||||
DRIP 1 | 847 | 12,216 | - | - | - | - | - | - | 12,216 | ||||||||
| Dividends (Note 15.2) | - | - | - | - | - | - | (80,809) | (80,809) | |||||||||
Realized loss on disposal of LTI's 1 (Note 9) | - | - | - | - | 14,651 | 14,651 | (14,651) | - | |||||||||
At December 31, 2015 | 404,039 | $ | 2,815,569 | $ | 53,717 | $ | 28,286 | $ | 3,313 | $ | (108,513) | $ | (23,197) | $ | 1,358,363 | $ | 4,150,735 |
| 1) | Definitions as follows: "OCI" = Other Comprehensive Income (Loss); "SBC" = Equity Settled Stock Based Compensation; "Options" = Share Purchase Options; "RSUs" = Restricted Share Units; "DRIP" = Dividend Reinvestment Plan; "DIT" = Deferred Income Taxes; "LTI's" = Long-Term Investments. |
| 1. | Description of Business and Nature of Operations |
| 2. | Significant Accounting Policies |
| 2.1. | Basis of Presentation |
| 2.2. | Statement of Compliance |
| 2.3. | Principles of Consolidation |
| 2.4. | Cash and Cash Equivalents |
| 2.5. | Revenue Recognition |
| 2.6. | Financial Instruments |
| 2.7. | Financial Assets |
| · | For financial assets that are classified as FVTNE, the foreign exchange component is recognized as a component of net earnings; |
| · | For financial assets that are classified as FVTOCI, the foreign exchange component is recognized as a component of OCI; and |
| · | For financial assets that are denominated in a foreign currency and are measured at amortized cost at the end of each reporting period, the foreign exchange gains and losses are determined based on the amortized cost of the instruments and are recognized as a component of net earnings. |
| 2.8. | Financial Liabilities and Equity Instruments |
| · | For financial liabilities that are denominated in a foreign currency and are measured at amortized cost at the end of each reporting period, the foreign exchange gains and losses are determined based on the amortized cost of the instruments and are recognized as a component of net earnings, and |
| · | For financial liabilities that are classified as FVTNE, the foreign exchange component forms part of the fair value gains or losses and is recognized as a component of net earnings. |
| 2.9. | Silver and Gold Interests |
| 2.10. | Borrowing and Debt Issue Costs |
| 2.11. | Stock Based Payment Transactions |
| 2.12. | Income Taxes |
| 2.13. | Earnings Per Share |
| 2.14. | Foreign Currency Translation |
| 2.15. | Leasing |
| 2.16. | Provisions |
| 2.17. | Future Changes in Accounting Policies |
| · | IFRS 9 (2014) – Financial Instruments (amended 2014): In July 2014, the IASB issued the final version of IFRS 9 – Financial Instruments ("IFRS 9"). The Company adopted IFRS 9 (2009) – Financial Instruments effective January 1, 2010. The Company is currently evaluating the impact this amended standard is expected to have on its consolidated financial statements. |
| · | IFRS 15 – Revenue from Contracts with Customers: In May 2014 the IASB and the Financial Accounting Standards Board ("FASB") completed its joint project to clarify the principles for recognizing revenue and to develop a common revenue standard for IFRS and US GAAP. IFRS 15 establishes principles to address the nature, amount, timing and uncertainty of revenue and cash flows arising from an entity's contracts with customers. The Company is currently evaluating the impact this standard is expected to have on its consolidated financial statements. |
| · | IFRS 16 – Leases: In January 2016 the IASB and FASB completed its joint project to address concerns by users of financial statements in respect of reduced comparability between financial statements due to the different accounting treatment applied to operating leases as compared to finance leases by removing the distinction between operating leases and finance leases and rather having all leases accounted for as a finance lease, subject to limited exceptions for short-term leases and leases of low value assets. The Company is currently evaluating the impact this standard is expected to have on its consolidated financial statements. |
| 3. | Key Sources of Estimation Uncertainty and Critical Accounting Judgments |
| 3.1. | Attributable Reserve, Resource and Exploration Potential Estimates |
| 3.2. | Depletion |
| 3.3. | Impairment of Assets |
| 3.4. | Valuation of Stock Based Compensation |
| 3.5. | Provisionally Priced Concentrate Sales |
| 3.6. | Contingencies |
| 3.7. | Functional Currency |
| · | The entities' revenues are denominated in US dollars; |
| · | The entities' cash cost of sales are denominated in US dollars; |
| · | The majority of the entities' cash is held in US dollars; and |
| · | The Company generally seeks to raise capital in US dollars. |
| 3.8. | Income Taxes |
| 4. | Financial Instruments |
| 4.1. | Capital Risk Management |
| 4.2. | Categories of Financial Assets and Liabilities |
| Note | December 31 | December 31 | ||||
| (in thousands) | 2015 | 2014 | ||||
| Financial assets | ||||||
| Fair value through net earnings | ||||||
| Trade receivables from provisional concentrate sales, net of fair value adjustment | 5 | $ | 815 | $ | 2,343 | |
| Fair value through other comprehensive income | ||||||
| Long-term investments - common shares held | 9 | 19,776 | 32,872 | |||
| Amortized cost | ||||||
| Cash and cash equivalents | 103,297 | 308,098 | ||||
| Other accounts receivable | 8 | 309 | 1,789 | |||
| Termination payment re: Campo Morado silver interest | 11 | - | 25,000 | |||
| $ | 124,197 | $ | 370,102 | |||
| Financial liabilities | ||||||
| Amortized cost | ||||||
| Accounts payable and accrued liabilities | 10,614 | 14,698 | ||||
| Bank debt | 14 | 1,466,000 | 998,518 | |||
| $ | 1,476,614 | $ | 1,013,216 | |||
| 4.3. | Credit Risk |
| December 31 | December 31 | ||||
| (in thousands) | Note | 2015 | 2014 | ||
| Cash and cash equivalents | $ | 103,297 | $ | 308,098 | |
| Trade receivables from provisional concentrate sales, net of fair value adjustment | 8 | 815 | 2,343 | ||
| Termination payment re: Campo Morado silver interest | 11 | - | 25,000 | ||
| Other accounts receivables | 8 | 309 | 1,789 | ||
| $ | 104,421 | $ | 337,230 | ||
| 4.4. | Liquidity Risk |
| As at December 31, 2015 | ||||||||||||||||
(in thousands) | 2016 | 2017 | 2018 | 2019 | 2020 | Thereafter | Commitments | Total | ||||||||
| Non-derivative financial liabilities and commitments | ||||||||||||||||
| Bank debt | $ | - | $ | - | $ | - | $ | - | $ | 1,466,000 | $ | - | $ | - | $ | 1,466,000 |
Interest on bank debt 1 | 34,675 | 39,997 | 41,612 | 42,719 | 6,499 | - | - | 165,502 | ||||||||
Silver and gold interest payments 2 | ||||||||||||||||
Rosemont 3 | - | - | - | - | - | - | 231,150 | 231,150 | ||||||||
Loma de La Plata 4 | - | - | - | - | - | - | 32,400 | 32,400 | ||||||||
Toroparu 5 | - | - | - | - | - | - | 138,000 | 138,000 | ||||||||
| Accounts payable and accrued liabilities | 10,614 | - | - | - | - | - | - | 10,614 | ||||||||
| Performance share units | 1,905 | 2,027 | 704 | - | - | - | - | 4,636 | ||||||||
Total | $ | 47,194 | $ | 42,024 | $ | 42,316 | $ | 42,719 | $ | 1,472,499 | $ | - | $ | 401,550 | $ | 2,048,302 |
| 1) | As the applicable interest rates are floating in nature, the interest charges are estimated based on market-based forward interest rate curves at the end of the reporting period. |
| 2) | Vale has recently expanded the mill throughput capacity at the Salobo mine (Note 10) to 24 million tonnes per annum ("Mtpa") from 12 Mtpa. If actual throughput is expanded above 28 Mtpa within a predetermined period, Silver Wheaton will be required to make an additional payment to Vale based on a set fee schedule ranging from $88 million if throughput is expanded beyond 28 Mtpa by January 1, 2036, up to $720 million if throughput is expanded beyond 40 Mtpa by January 1, 2018. This contingent liability is not reflected in the above table. |
| 3) | In connection with the Rosemont precious metal purchase agreement, the Company is committed to pay contingent transaction costs of $1.1 million in addition to a commitment to pay Hudbay total upfront cash payments of $230 million, payable on an installment basis, to partially fund construction of the Rosemont mine once certain milestones are achieved, including the receipt of key permits and securing the necessary financing to complete construction of the mine. |
| 4) | In connection with the Company's election to convert the debenture with Pan American into a silver purchase agreement, the Company is committed to pay total upfront cash payments of $32.4 million following the satisfaction of certain conditions, including Pan American receiving all necessary permits to proceed with the mine construction. |
| 5) | During the 60 day period following the delivery of a bankable definitive feasibility study, environmental study and impact assessment, and other related documents (collectively, the "Feasibility Documentation"), or after December 31, 2016 if the Feasibility Documentation has not been delivered to Silver Wheaton by such date, Silver Wheaton may elect not to proceed with the precious metal purchase agreement, at which time Silver Wheaton will be entitled to a return of the amounts advanced less $2 million which is non-refundable or, at Sandspring's option, the gold stream percentage will be reduced from 10% to 0.909% and the silver stream percentage will be reduced from 50% to nil. |
| As at December 31, 2014 | |||||||||||||||||
(in thousands) | 2015 | 2016 | 2017 | 2018 | 2019 | Thereafter | Commitments | Total | |||||||||
| Non-derivative financial liabilities and commitments | |||||||||||||||||
Bank debt 1 | $ | - | $ | - | $ | 1,000,000 | $ | - | $ | - | $ | - | $ | - | $ | 1,000,000 | |
Interest on bank debt 2 | 15,103 | 18,332 | 8,358 | - | - | - | - | 41,793 | |||||||||
Silver and gold interest payments 3 | |||||||||||||||||
Rosemont 4 | - | - | - | - | - | - | 231,150 | 231,150 | |||||||||
Loma de La Plata 5 | - | - | - | - | - | - | 32,400 | 32,400 | |||||||||
Toroparu 6 | - | - | - | - | - | - | 135,000 | 135,000 | |||||||||
| Accounts payable and accrued liabilities | 14,698 | - | - | - | - | - | - | 14,698 | |||||||||
| Performance share units | 1,373 | 1,975 | 1,421 | - | - | - | - | 4,769 | |||||||||
Total | $ | 31,174 | $ | 20,307 | $ | 1,009,779 | $ | - | $ | - | $ | - | $ | 398,550 | $ | 1,459,810 | |
| 1) | As more fully disclosed in Note 14, on February 27, 2015 the Company expanded its Revolving Facility by $1 billion and then used proceeds drawn from this amended Revolving Facility together with cash on hand to repay the NRT Loan. |
| 2) | As the applicable interest rates are floating in nature, the interest charges are estimated based on market-based forward interest rate curves at the end of the reporting period. |
| 3) | Vale has recently expanded the mill throughput capacity at the Salobo mine (Note 10) to 24 million tonnes per annum ("Mtpa") from 12 Mtpa. If actual throughput is expanded above 28 Mtpa within a predetermined period, Silver Wheaton will be required to make an additional payment to Vale based on a set fee schedule ranging from $88 million if throughput is expanded beyond 28 Mtpa by January 1, 2036, up to $720 million if throughput is expanded beyond 40 Mtpa by January 1, 2018. This contingent liability is not reflected in the above table. |
| 4) | In connection with the Rosemont precious metal purchase agreement, the Company is committed to pay contingent transaction costs of $1.1 million in addition to a commitment to pay Hudbay total upfront cash payments of $230 million, payable on an installment basis, to partially fund construction of the Rosemont mine once certain milestones are achieved, including the receipt of key permits and securing the necessary financing to complete construction of the mine. |
| 5) | In connection with the Company's election to convert the debenture with Pan American into a silver purchase agreement, the Company is committed to pay total upfront cash payments of $32.4 million following the satisfaction of certain conditions, including Pan American receiving all necessary permits to proceed with the mine construction. |
| 6) | During the 60 day period following the delivery of a bankable definitive feasibility study, environmental study and impact assessment, and other related documents (collectively, the "Feasibility Documentation"), or after December 31, 2016 if the Feasibility Documentation has not been delivered to Silver Wheaton by such date, Silver Wheaton may elect not to proceed with the precious metal purchase agreement, at which time Silver Wheaton will be entitled to a return of the amounts advanced less $2 million which is non-refundable or, at Sandspring's option, the gold stream percentage will be reduced from 10% to 0.909% and the silver stream percentage will be reduced from 50% to nil. |
| 4.5. | Currency Risk |
| December 31 | December 31 | |||
| (in thousands) | 2015 | 2014 | ||
Monetary assets | ||||
| Cash and cash equivalents | $ | 932 | $ | 707 |
| Accounts receivable | 103 | 1,477 | ||
| Long-term investments - common shares held | 17,205 | 31,697 | ||
| Other long-term assets | 68 | - | ||
| $ | 18,308 | $ | 33,881 | |
Monetary liabilities | ||||
| Accounts payable and accrued liabilities | $ | 5,331 | $ | 4,676 |
| Performance share units | 4,130 | 4,347 | ||
| $ | 9,461 | $ | 9,023 | |
| As at December 31, 2015 | ||||
Change in Canadian Dollar | ||||
| (in thousands) | 10% Increase | 10% Decrease | ||
| Increase (decrease) in net earnings | $ | (836) | $ | 836 |
| Increase (decrease) in other comprehensive income | 1,721 | (1,721) | ||
Increase (decrease) in total comprehensive income | $ | 885 | $ | (885) |
| As at December 31, 2014 | ||||
Change in Canadian Dollar | ||||
| (in thousands) | 10% Increase | 10% Decrease | ||
| Increase (decrease) in net earnings | $ | (684) | $ | 684 |
| Increase (decrease) in other comprehensive income | 3,170 | (3,170) | ||
Increase (decrease) in total comprehensive income | $ | 2,486 | $ | (2,486) |
| 4.6. | Interest Rate Risk |
| 4.7. | Other Price Risk |
| · | Net earnings for the year ended December 31, 2014 would not have been affected by changes in the fair value of share purchase warrants held; and |
| · | Other comprehensive income for the years ended December 31, 2015 and December 31, 2014 would have increased/decreased by approximately $1.7 million and $3.3 million, respectively, as a result of changes in the fair value of common shares held. |
| 4.8. | Fair Value Estimation |
Level 1 - | Unadjusted quoted prices at the measurement date for identical assets or liabilities in active markets. |
Level 2 - | Observable inputs other than quoted prices included in Level 1, such as quoted prices for similar assets and liabilities in active markets; quoted prices for identical or similar assets and liabilities in markets that are not active; or other inputs that are observable or can be corroborated by observable market data. |
Level 3 - | Unobservable inputs which are supported by little or no market activity. |
The following table sets forth the Company's financial assets and liabilities measured at fair value by level within the fair value hierarchy. As required by IFRS 13, assets and liabilities are classified in their entirety based on the lowest level of input that is significant to the fair value measurement.
December 31, 2015 | ||||||||
| (in thousands) | Total | Level 1 | Level 2 | Level 3 | ||||
Trade receivables from provisional concentrate sales, net of fair value adjustment | $ | 815 | $ | - | $ | 815 | $ | - |
| Long-term investments - common shares held | 19,776 | 19,776 | - | - | ||||
| $ | 20,591 | $ | 19,776 | $ | 815 | $ | - | |
December 31, 2014 | ||||||||
| (in thousands) | Total | Level 1 | Level 2 | Level 3 | ||||
Trade receivables from provisional concentrate sales, net of fair value adjustment | $ | 2,343 | $ | - | $ | 2,343 | $ | - |
| Long-term investments - common shares held | 32,872 | 32,872 | - | - | ||||
| $ | 35,215 | $ | 32,872 | $ | 2,343 | $ | - | |
| 5. | Revenue |
Years Ended December 31 | ||||||
| (in thousands) | 2015 | 2014 | ||||
| Sales | ||||||
| Silver | ||||||
| Silver credit sales | $ | 349,644 | 54% | $ | 358,011 | 58% |
| Concentrate sales | 65,934 | 10% | 86,203 | 14% | ||
| $ | 415,578 | 64% | $ | 444,214 | 72% | |
| Gold | ||||||
| Gold credit sales | $ | 213,414 | 33% | $ | 149,017 | 24% |
| Concentrate sales | 19,695 | 3% | 26,945 | 4% | ||
| $ | 233,109 | 36% | $ | 175,962 | 28% | |
Total sales revenue | $ | 648,687 | 100% | $ | 620,176 | 100% |
| 6. | General and Administrative |
Years Ended December 31 | |||||
| (in thousands) | Note | 2015 | 2014 | ||
Salaries and benefits | |||||
| Salaries and benefits, excluding PSUs | $ | 11,456 | $ | 11,662 | |
| PSUs | 17.1 | 1,975 | 3,508 | ||
| Total salaries and benefits | $ | 13,431 | $ | 15,170 | |
| Depreciation | 621 | 326 | |||
| Charitable donations | 1,965 | 3,187 | |||
| Other | 10,060 | 10,983 | |||
| Cash settled general and administrative | $ | 26,077 | $ | 29,666 | |
| Equity settled stock based compensation (a non-cash expense) | 6,160 | 8,194 | |||
Total general and administrative | $ | 32,237 | $ | 37,860 | |
| 7. | Other Expense (Income) |
Years Ended December 31 | |||||
| (in thousands) | Note | 2015 | 2014 | ||
Dividend income | $ | (126) | $ | (228) | |
| Interest income | (122) | (123) | |||
| Stand-by fees | 14 | 3,462 | 2,900 | ||
| Foreign exchange gain | (1,133) | (609) | |||
| Amortization of credit facility origination fees - undrawn facilities | 14 | 923 | 1,020 | ||
| Write off of credit facility origination fees upon the repayment of the NRT Loan | 14 | 1,315 | - | ||
| Other | (243) | (1,130) | |||
Total other expense (income) | $ | 4,076 | $ | 1,830 | |
| 8. | Accounts Receivable |
December 31 | December 31 | ||||
| (in thousands) | Note | 2015 | 2014 | ||
Trade receivables from provisional concentrate sales, net of fair value adjustment | 5 | $ | 815 | $ | 2,343 |
| Other accounts receivables | 309 | 1,789 | |||
Total accounts receivable | $ | 1,124 | $ | 4,132 | |
| 9. | Long-Term Investments |
December 31, 2015 | ||||||
| (in thousands) | Fair Value | Fair Value Adjustment Losses Included in OCI | Realized Loss on Disposal | |||
| Bear Creek | $ | 5,558 | $ | (10,678) | $ | - |
| Revett | - | (1,401) | (11,870) | |||
| Other | 14,218 | (1,006) | (2,781) | |||
Total common shares held | $ | 19,776 | $ | (13,085) | $ | (14,651) |
December 31, 2014 | ||||
| (in thousands) | Fair Value | Fair Value Adjustment Gains (Losses) Included in OCI | ||
| Bear Creek | $ | 16,236 | $ | (1,972) |
| Revett | 3,873 | 47 | ||
| Other | 12,763 | (6,004) | ||
Total common shares held | $ | 32,872 | $ | (7,929) |
| 10. | Silver and Gold Interests |
Year Ended December 31, 2015 | ||||||||||||||||
Cost | Accumulated Depletion & Impairment | Carrying Amount Dec 31, 2015 | ||||||||||||||
| (in thousands) | Balance Jan 1, 2015 | Additions (Reductions) | Balance Dec 31, 2015 | Balance Jan 1, 2015 | Depletion | Impairment | Balance Dec 31, 2015 | |||||||||
Silver interests | ||||||||||||||||
| San Dimas | $ | 190,331 | $ | - | $ | 190,331 | $ | (37,380) | $ | (6,396) | $ | - | $ | (43,776) | $ | 146,555 |
Yauliyacu 1 | 285,292 | (5,829) | 279,463 | (97,814) | (16,367) | - | (114,181) | 165,282 | ||||||||
| Peñasquito | 524,626 | - | 524,626 | (73,481) | (20,298) | - | (93,779) | 430,847 | ||||||||
| Antamina | - | 900,289 | 900,289 | - | (13,308) | - | (13,308) | 886,981 | ||||||||
Barrick 2 | 650,924 | 10,133 | 661,057 | (45,596) | (7,648) | (109,723) | (162,967) | 498,090 | ||||||||
Other 3 | 692,159 | - | 692,159 | (132,412) | (26,545) | (74,291) | (233,248) | 458,911 | ||||||||
| $ | 2,343,332 | $ | 904,593 | $ | 3,247,925 | $ | (386,683) | $ | (90,562) | $ | (184,014) | $ | (661,259) | $ | 2,586,666 | |
Gold interests | ||||||||||||||||
Sudbury 4 | $ | 623,864 | $ | - | $ | 623,864 | $ | (40,002) | $ | (28,173) | $ | (49,439) | $ | (117,614) | $ | 506,250 |
| Salobo | 1,330,311 | 900,057 | 2,230,368 | (28,109) | (45,502) | - | (73,611) | 2,156,757 | ||||||||
Other 5 | 538,290 | - | 538,290 | (132,738) | (34,344) | (151,469) | (318,551) | 219,739 | ||||||||
| $ | 2,492,465 | $ | 900,057 | $ | 3,392,522 | $ | (200,849) | $ | (108,019) | $ | (200,908) | $ | (509,776) | $ | 2,882,746 | |
| $ | 4,835,797 | $ | 1,804,650 | $ | 6,640,447 | $ | (587,532) | $ | (198,581) | $ | (384,922) | $ | (1,171,035) | $ | 5,469,412 | |
| 1) | On November 30, 2015, the Company amended its silver purchase agreement with Glencore. The term of the agreement, which was set to expire in 2026, was extended to the life of mine. Glencore will deliver a per annum amount to Silver Wheaton equal to the first 1.5 million ounces of payable silver produced at Yauliyacu and 50% of any excess. In conjunction with this amendment, Glencore agreed to waive amounts totaling $5.9 million which were due under the original agreement. The Company has treated this waiver as a reduction to the cost base of the silver interest. |
| 2) | Comprised of the Pascua-Lama, Lagunas Norte, Pierina and Veladero silver interests. |
| 3) | Comprised of the Los Filos, Zinkgruvan, Keno Hill, Cozamin, Neves-Corvo, Stratoni, Minto, 777, Aljustrel, Loma de La Plata, Constancia and Rosemont silver interests. |
| 4) | Comprised of the Coleman, Copper Cliff, Garson, Stobie, Creighton, Totten and Victor gold interests. |
| 5) | Comprised of the Minto, 777, Constancia and Rosemont gold interests. |
Year Ended December 31, 2014 | ||||||||||||||||||
Cost | Accumulated Depletion & Impairment | Carrying Amount Dec 31, 2014 | ||||||||||||||||
| (in thousands) | Balance Jan 1, 2014 | Additions | Disposal | Balance Dec 31, 2014 | Balance Jan 1, 2014 | Depletion & Impairment | Disposal | Balance Dec 31, 2014 | ||||||||||
Silver interests | ||||||||||||||||||
| San Dimas | $ | 190,331 | $ | - | $ | - | $ | 190,331 | $ | (32,839) | $ | (4,541) | $ | - | $ | (37,380) | $ | 152,951 |
| Yauliyacu | 285,292 | - | - | 285,292 | (78,015) | (19,799) | - | (97,814) | 187,478 | |||||||||
| Peñasquito | 524,626 | - | - | 524,626 | (52,337) | (21,144) | - | (73,481) | 451,145 | |||||||||
| Barrick ¹ | 641,155 | 9,769 | - | 650,924 | (40,048) | (5,548) | - | (45,596) | 605,328 | |||||||||
Other 2, 3, 4, 5 | 690,182 | 129,636 | (127,659) | 692,159 | (140,255) | (92,668) | 100,511 | (132,412) | 559,747 | |||||||||
| $ | 2,331,586 | $ | 139,405 | $ | (127,659) | $ | 2,343,332 | $ | (343,494) | $ | (143,700) | $ | 100,511 | $ | (386,683) | $ | 1,956,649 | |
Gold interests | ||||||||||||||||||
Sudbury 6 | $ | 623,864 | $ | - | $ | - | $ | 623,864 | $ | (14,410) | $ | (25,592) | $ | - | $ | (40,002) | $ | 583,862 |
| Salobo | 1,330,311 | - | - | 1,330,311 | (7,828) | (20,281) | - | (28,109) | 1,302,202 | |||||||||
Other 7 | 402,435 | 135,855 | - | 538,290 | (93,980) | (38,758) | - | (132,738) | 405,552 | |||||||||
| $ | 2,356,610 | $ | 135,855 | $ | - | $ | 2,492,465 | $ | (116,218) | $ | (84,631) | $ | - | $ | (200,849) | $ | 2,291,616 | |
| $ | 4,688,196 | $ | 275,260 | $ | (127,659) | $ | 4,835,797 | $ | (459,712) | $ | (228,331) | $ | 100,511 | $ | (587,532) | $ | 4,248,265 | |
| 1) | Comprised of the Pascua-Lama, Lagunas Norte, Pierina and Veladero silver interests. |
| 2) | Comprised of the Los Filos, Zinkgruvan, Keno Hill, Mineral Park, Cozamin, Neves-Corvo, Stratoni, Campo Morado, Minto, 777, Aljustrel, Constancia, Loma de La Plata and Rosemont silver interests. |
| 3) | As part of an agreement with I'M SGPS dated July 16, 2014, Silver Wheaton agreed to waive its rights to silver contained in copper concentrate at the Aljustrel mine. The Company has reported this agreement as a disposal of the portion of the silver interest related to silver contained in copper concentrate. The Aljustrel mine has been reflected as a component of Other silver interests in these financial statements. The Company has not waived its rights to the silver contained in zinc concentrate at the Aljustrel mine. |
| 4) | Silver Wheaton entered an agreement with Nyrstar Mining Ltd. resulting in the cancellation of the silver purchase agreement relating to the Campo Morado mine in Mexico in exchange for cash consideration of $25 million. This amount due under the agreement, which was classified on the balance sheet at December 31, 2014 as a component of Other current assets, was received on January 30, 2015. |
| 5) | On November 4, 2014, the United States Bankruptcy Court for the District of Delaware approved a settlement agreement which provides for the termination of any claim Silver Wheaton may have against the Mineral Park mine. |
| 6) | Comprised of the Coleman, Copper Cliff, Garson, Stobie, Creighton, Totten and Victor gold interests. |
| 7) | Comprised of the Minto, 777, Constancia and Rosemont gold interests. |
December 31, 2015 | December 31, 2014 | |||||||||||
| (in thousands) | Depletable | Non- Depletable | Total | Depletable | Non- Depletable | Total | ||||||
| Silver interests | ||||||||||||
| San Dimas | $ | 19,443 | $ | 127,112 | $ | 146,555 | $ | 35,099 | $ | 117,852 | $ | 152,951 |
| Yauliyacu | 17,814 | 147,468 | 165,282 | 51,052 | 136,426 | 187,478 | ||||||
| Peñasquito | 251,133 | 179,714 | 430,847 | 260,082 | 191,063 | 451,145 | ||||||
| Antamina | 502,115 | 384,866 | 886,981 | - | - | - | ||||||
Barrick 1, 2 | 10,278 | 487,812 | 498,090 | 11,681 | 593,647 | 605,328 | ||||||
Other 3 | 362,634 | 96,277 | 458,911 | 151,410 | 408,337 | 559,747 | ||||||
| $ | 1,163,417 | $ | 1,423,249 | $ | 2,586,666 | $ | 509,324 | $ | 1,447,325 | $ | 1,956,649 | |
| Gold interests | ||||||||||||
Sudbury 4 | $ | 366,480 | $ | 139,770 | $ | 506,250 | $ | 474,330 | $ | 109,532 | $ | 583,862 |
| Salobo | 1,765,166 | 391,591 | 2,156,757 | 961,852 | 340,350 | 1,302,202 | ||||||
Other 5 | 205,007 | 14,732 | 219,739 | 219,066 | 186,486 | 405,552 | ||||||
| $ | 2,336,653 | $ | 546,093 | $ | 2,882,746 | $ | 1,655,248 | $ | 636,368 | $ | 2,291,616 | |
| $ | 3,500,070 | $ | 1,969,342 | $ | 5,469,412 | $ | 2,164,572 | $ | 2,083,693 | $ | 4,248,265 | |
| 1) | Comprised of the Pascua-Lama, Lagunas Norte, Pierina and Veladero silver interests. |
| 2) | The amount reflected as depletable is based on the value of the reserves relating to the Lagunas Norte, Pierina and Veladero silver interests. |
| 3) | Comprised of the Los Filos, Zinkgruvan, Keno Hill, Cozamin, Neves-Corvo, Stratoni, Minto, 777, Aljustrel, Loma de La Plata, Constancia and Rosemont silver interests. |
| 4) | Comprised of the Coleman, Copper Cliff, Garson, Stobie, Creighton, Totten and Victor gold interests. |
| 5) | Comprised of the Minto, 777, Constancia and Rosemont gold interests. |
| (in thousands) | ||
| Cost: | ||
| Cash | $ | 900,000 |
| Acquisition costs | 289 | |
| $ | 900,289 |
| 11. | Impairment of Silver and Gold Interests |
Years Ended December 31 | |||||
| (in thousands) | 2015 | 2014 | |||
| Silver interests | |||||
| Barrick | $ | 109,723 | $ | - | |
| Other Silver Interests | |||||
| 777 | 63,778 | - | |||
| Keno Hill | 10,513 | - | |||
| Campo Morado | - | 31,091 | |||
| Mineral Park | - | 37,060 | |||
| Gold interests | |||||
| Sudbury | 49,439 | - | |||
| Other Gold Interests | |||||
| 777 | 151,469 | - | |||
Total impairment charges | $ | 384,922 | $ | 68,151 | |
| 12. | Early Deposit – Silver and Gold Interests |
| 13. | Royalty Agreement |
| 14. | Bank Debt |
December 31, 2015 | ||||||
| (in thousands) | NRT Loan 1 | Revolving Facility 2 | Total | |||
Current portion | $ | - | $ | - | $ | - |
| Long-term portion | - | 1,466,000 | 1,466,000 | |||
Gross bank debt outstanding 3 | $ | - | $ | 1,466,000 | $ | 1,466,000 |
Year ended December 31, 2015: | ||||||
| Interest capitalized during the period | $ | 1,533 | $ | 8,600 | $ | 10,133 |
| Interest expensed during the period | 1,332 | 2,758 | 4,090 | |||
Total interest incurred during the period | $ | 2,865 4 | $ | 11,358 | $ | 14,223 |
Effective interest rate | 1.72% | 1.75% | 1.74% | |||
| 1) | The NRT Loan was fully repaid on February 27, 2015. |
| 2) | The Company incurred stand-by fees of $3.5 million related to the undrawn portion of the Revolving Facility during the year ended December 31, 2015. |
| 3) | There is $6.1 million unamortized debt issue costs associated with the Revolving Facility which have been recorded as an asset under the classification Other. |
| 4) | Interest costs incurred under the NRT Loan and the Revolving Facility during the year ended December 31, 2015 includes the amortization of debt issue costs in the amount of $631,000. |
December 31, 2014 | ||||||
| (in thousands) | NRT Loan | Revolving Facility 1 | Total | |||
Current portion | $ | - | $ | - | $ | - |
| Long-term portion | 1,000,000 | - | 1,000,000 | |||
| Gross bank debt outstanding | $ | 1,000,000 | $ | - | $ | 1,000,000 |
Less: unamortized debt issue costs² | (1,482) | - | (1,482) | |||
| Net bank debt outstanding | $ | 998,518 | $ | - | $ | 998,518 |
Year ended December 31, 2014: | ||||||
| Interest capitalized during the period | $ | 14,997 | $ | - | $ | 14,997 |
| Interest expensed during the period | 2,277 | - | 2,277 | |||
Total interest incurred during the period | $ | 17,274³ | $ | - | $ | 17,274 |
Effective interest rate | 1.70% | n/a | 1.70% | |||
| 1) | The Company incurred stand-by fees of $2.9 million related to the undrawn portion of the Revolving Facility during the year ended December 31, 2014. |
| 2) | In addition to the $1.5 million unamortized debt issue costs associated with the NRT Loan, there was $3.2 million unamortized debt issue costs at December 31, 2014 associated with the Revolving Facility which have been recorded as an asset under the classification Other. |
| 3) | Interest costs incurred under the NRT Loan during the year ended December 31, 2014 includes the amortization of debt issue costs in the amount of $1.0 million. |
| 15. | Issued Capital |
| Note | December 31 | December 31 | |||
| (US dollars in thousands) | 2015 | 2014 | |||
Issued capital | |||||
Share capital issued and outstanding: 404,039,065 common shares (December 31, 2014: 364,777,928 common shares) | 15.1 | $ | 2,815,569 | $ | 2,037,923 |
| 15.1. | Shares Issued |
Number of Shares | Weighted Average Price | |
At January 1, 2014 | 357,396,778 | |
Shares issued 1 | 6,112,282 | US$22.09 |
| Share purchase options exercised ² | 600,162 | Cdn$13.02 |
| Restricted share units released ² | 22,088 | $0.00 |
| Dividend reinvestment plan ³ | 646,618 | US$21.08 |
| At December 31, 2014 | 364,777,928 | |
Shares issued 4 | 38,930,000 | US$20.55 |
Shares cancelled 5, 6 | (777,214) | US$6.86 |
| Share purchase options exercised ² | 229,000 | Cdn$15.89 |
| Restricted share units released ² | 32,287 | $0.00 |
| Dividend reinvestment plan ³ | 847,064 | US$14.42 |
At December 31, 2015 | 404,039,065 |
| 1) | The Company issued 6,112,282 common shares at an average price of $22.09 per share in satisfaction of the $135 million upfront cash payment to Hudbay Minerals Inc. for the Constancia gold interest, which was due once capital expenditures of $1.35 billion had been incurred at Constancia. |
| 2) | The weighted average price of share purchase options exercised and restricted share units released represents the respective exercise price. |
| 3) | The Company has implemented a dividend reinvestment plan ("DRIP") whereby shareholders can elect to have dividends reinvested directly into additional Silver Wheaton common shares. The weighted average price for common shares issued under the DRIP represents the volume weighted average price of the common shares on the five trading days preceding the dividend payment date, less a discount of 3%. |
| 4) | In connection with the amended Salobo precious metal purchase agreement (Note 10), the Company raised gross proceeds of $800 million through the issuance of 38,930,000 common shares at $20.55 per share. |
| 5) | Includes 764,789 common shares purchased and cancelled in accordance with the NCIB in addition to 12,425 common shares which were cancelled in accordance with the terms of the May 21, 2009 acquisition of Silverstone Resources Corp. |
| 6) | The weighted average price of shares cancelled represents the weighted average price of the Company's common shares when originally issued. |
| 15.2. | Dividends Declared |
| 16. | Reserves |
| Note | December 31 | December 31 | |||
| (in thousands) | 2015 | 2014 | |||
Reserves | |||||
| Share purchase warrants | 16.1 | $ | 53,717 | $ | 53,717 |
| Share purchase options | 16.2 | 28,286 | 24,214 | ||
| Restricted share units | 16.3 | 3,313 | 3,307 | ||
| Long-term investment revaluation reserve, net of tax | 16.4 | (108,513) | (110,079) | ||
Total reserves | $ | (23,197) | $ | (28,841) | |
| 16.1. | Share Purchase Warrants |
Warrants Outstanding | Weighted Average Exercise Price | Exchange Ratio | Share Purchase Warrants Reserve | ||
At December 31, 2014 and December 31, 2015 | 10,000,000 | $65.00 | 1.00 | $ | 53,717 |
| 16.2. | Share Purchase Options |
Years Ended December 31 | ||
2015 | 2014 | |
Black-Scholes weighted average assumptions | ||
| Grant date share price and exercise price | Cdn$25.48 | Cdn$26.09 |
| Expected dividend yield | 1.06% | 1.18% |
| Expected volatility | 35% | 40% |
| Risk-free interest rate | 0.44% | 1.15% |
| Expected option life, in years | 2.5 | 2.5 |
Weighted average fair value per option granted | Cdn$5.23 | Cdn$6.25 |
| (in thousands) | Share Purchase Options Reserve |
| At January 1, 2014 | $ 19,443 |
| Recognition of fair value of share purchase options issued | 7,199 |
| Share purchase options exercised | (2,428) |
| At December 31, 2014 | $ 24,214 |
| Recognition of fair value of share purchase options issued | 5,312 |
| Share purchase options exercised | (1,240) |
At December 31, 2015 | $ 28,286 |
Exercise Price (Cdn$) | Exercisable Options | Non-Exercisable Options | Total Options Outstanding | Weighted Average Remaining Contractual Life |
| $23.80 | 3,000 | - | 3,000 | 2.4 years |
| $25.48 | - | 860,100 | 860,100 | 4.2 years |
| $25.55 | 2,000 | 2,000 | 4,000 | 3.7 years |
| $25.72 | 20,000 | - | 20,000 | 2.8 years |
| $26.07 | 476,750 | 476,750 | 953,500 | 3.2 years |
| $28.14 | 80,000 | - | 80,000 | 1.5 years |
| $28.59 | 80,000 | - | 80,000 | 1.4 years |
| $29.50 | 100,000 | - | 100,000 | 1.0 years |
| $30.51 | 15,000 | - | 15,000 | 1.6 years |
| $31.88 | 1,011,000 | - | 1,011,000 | 2.2 years |
| $32.21 | 72,250 | 224,850 | 297,100 | 3.2 years |
| $32.46 | 70,000 | - | 70,000 | 2.4 years |
| $33.03 | 10,000 | - | 10,000 | 0.4 years |
| $33.71 | 314,500 | - | 314,500 | 1.2 years |
| $34.17 | 93,800 | - | 93,800 | 0.4 years |
| $34.55 | 10,000 | - | 10,000 | 2.0 years |
| $35.36 | 6,500 | 6,500 | 13,000 | 3.6 years |
| $39.25 | 10,000 | - | 10,000 | 1.9 years |
| $41.58 | 169,800 | - | 169,800 | 0.2 years |
| $43.18 | 86,000 | - | 86,000 | 2.2 years |
| $47.03 | 33,500 | - | 33,500 | 1.2 years |
| $48.58 | 19,000 | - | 19,000 | 0.4 years |
| $58.92 | 32,000 | - | 32,000 | 0.2 years |
| 2,715,100 | 1,570,200 | 4,285,300 | 2.7 years |
Number of Options Outstanding | Weighted Average Exercise Price | |
At January 1, 2014 | 3,029,762 | Cdn$27.28 |
| Granted (fair value - $6.2 million or Cdn$6.25 per option) | 1,115,000 | 26.09 |
| Exercised | (600,162) | 13.02 |
| Forfeited | (43,000) | 33.85 |
| At December 31, 2014 | 3,501,600 | Cdn$28.93 |
| Granted (fair value - $4.2 million or Cdn$5.23 per option) | 1,012,700 | 25.48 |
| Exercised | (229,000) | 15.89 |
At December 31, 2015 | 4,285,300 | Cdn$28.17 |
| 16.3. | Restricted Share Units ("RSUs") |
(in thousands) | Restricted Share Units Reserve |
At January 1, 2014 | $ 2,833 |
| Recognition of fair value of RSUs issued | 995 |
| Restricted share units released | (521) |
| At December 31, 2014 | $ 3,307 |
| Recognition of fair value of RSUs issued | 848 |
| Restricted share units released | (842) |
At December 31, 2015 | $ 3,313 |
| 16.4. | Long-Term Investment Revaluation Reserve |
Change in Fair Value Due To: | ||||
| (in thousands) | Share Price | Foreign Exchange | Tax Effect | Total |
| At January 1, 2014 | $(123,744) | $ 21,594 | $ 539 | $(101,611) |
Unrealized loss on LTIs 1 | (4,984) | (2,945) | - | (7,929) |
| Reallocate reserve to retained earnings | - | - | (539) | (539) |
| At December 31, 2014 | $(128,728) | $ 18,649 | $ - | $(110,079) |
Unrealized loss on LTIs 1 | (9,467) | (3,618) | - | (13,085) |
Reallocate reserve to retained earnings upon disposal of LTIs 1 | 16,783 | (2,132) | - | 14,651 |
At December 31, 2015 | $(121,412) | $ 12,899 | $ - | $(108,513) |
| 1) | LTIs refers to long-term investments in common shares held. |
| 17. | Stock Based Compensation |
| 17.1. | Performance Share Units ("PSUs") |
Number of PSUs Outstanding | |
At January 1, 2014 | 276,912 |
| Granted | 270,750 |
| Dividend equivalent participation | 5,875 |
| Paid | (38,497) |
| Forfeited | (3,089) |
| At December 31, 2014 | 511,951 |
| Granted | 216,200 |
| Dividend equivalent participation | 8,556 |
| Paid | (73,411) |
At December 31, 2015 | 663,296 |
| 18. | Earnings per Share ("EPS") and Diluted Earnings per Share ("Diluted EPS") |
| Years Ended December 31 | ||
| (in thousands) | 2015 | 2014 |
Basic weighted average number of shares outstanding | 395,755 | 359,401 |
| Effect of dilutive securities | ||
| Share purchase options | 14 | 242 |
| Share purchase warrants | - | - |
| Restricted share units | 169 | 161 |
Diluted weighted average number of shares outstanding | 395,938 | 359,804 |
Years Ended December 31 | ||
| (in thousands) | 2015 | 2014 |
Share purchase options | 4,285 | 3,270 |
| Share purchase warrants | 10,000 | 10,000 |
Total | 14,285 | 13,270 |
| 19. | Supplemental Cash Flow Information |
| Years Ended December 31 | ||||
(in thousands) | 2015 | 2014 | ||
| Change in non-cash working capital | ||||
| Accounts receivable | $ | 3,007 | $ | 488 |
| Accounts payable and accrued liabilities | (39) | (5,630) | ||
| Other | 217 | (419) | ||
Total change in non-cash working capital | $ | 3,185 | $ | (5,561) |
| December 31 | December 31 | ||||
(in thousands) | 2015 | 2014 | |||
Cash and cash equivalents comprised of: | |||||
| Cash | $ | 103,297 | $ | 118,832 | |
| Cash equivalents | - | 189,266 | |||
Total cash and cash equivalents | $ | 103,297 | $ | 308,098 | |
| 20. | Related Party Transactions |
| Years Ended December 31 | ||||
(in thousands) | 2015 | 2014 | ||
Short-term benefits 1 | $ | 6,133 | $ | 6,754 |
| Post-employment benefits | 49 | 54 | ||
| PSUs | 1,784 | 2,321 | ||
| Equity settled stock based compensation (a non-cash expense) | 4,184 | 5,620 | ||
Total executive compensation | $ | 12,150 | $ | 14,749 |
| 1) Short-term employee benefits include salaries, bonuses payable within twelve months of the balance sheet date and other annual employee benefits. | ||||
| 21. | Post-Employment Benefit Costs |
| 22. | Income Taxes |
Years Ended December 31 | ||||
| (in thousands) | 2015 | 2014 | ||
Current income tax expense related to foreign jurisdictions | $ | 208 | $ | 204 |
Deferred income tax (recovery) expense related to: | ||||
| Origination and reversal of temporary differences | $ | (13,089) | $ | (1,249) |
| Write down of previously recognized temporary differences | 9,490 | - | ||
Total deferred income tax recovery | $ | (3,599) | $ | (1,249) |
Income tax recovery recognized in net earnings | $ | (3,391) | $ | (1,045) |
Years Ended December 31 | ||||
| (in thousands) | 2015 | 2014 | ||
Deferred income tax (recovery) expense related to: | ||||
| Origination and reversal of temporary differences | $ | (725) | $ | - |
| Write down of previously recognized temporary differences | 3,558 | - | ||
Deferred income tax expense recognized in equity | $ | 2,833 | $ | - |
Years Ended December 31 | ||||
| (in thousands) | 2015 | 2014 | ||
Earnings before income taxes | $ | (165,433) | $ | 198,781 |
| Canadian federal and provincial income tax rates | 26.00% | 26.00% | ||
| Income tax (recovery) expense based on above rates | $ | (43,013) | $ | 51,683 |
| Non-deductible stock based compensation and other | 3,083 | 2,645 | ||
| Differences in tax rates in foreign jurisdictions | (34,880) | (55,373) | ||
| Current period unrecognized temporary differences - impairments | 57,925 | - | ||
| Current period unrecognized temporary differences - other | 4,004 | - | ||
| Write down of previously recognized temporary differences | 9,490 | - | ||
Income tax recovery | $ | (3,391) | $ | (1,045) |
Year Ended December 31, 2015 | ||||||||
Opening Balance | Recovery (Expense) Recognized In Net Earnings | Recovery (Expense) Recognized In Shareholders' Equity | Closing Balance | |||||
| Recognized deferred income tax assets and liabilities | ||||||||
Deferred tax assets | ||||||||
| Non-capital losses | $ | 14,069 | $ | (7,025) | $ | (3,558) | $ | 3,486 |
| Financing fees | 1,422 | (1,168) | 725 | 979 | ||||
| Other | 2,111 | (1,835) | - | 276 | ||||
| Deferred tax liabilities | ||||||||
| Interest capitalized for accounting | (84) | - | - | (84) | ||||
| Silver and gold interests | (18,348) | 13,691 | - | (4,657) | ||||
| Other | (112) | (64) | - | (176) | ||||
Total | $ | (942) | $ | 3,599 | $ | (2,833) | $ | (176) |
Year Ended December 31, 2014 | ||||||||
| Recognized deferred income tax assets and liabilities | Opening Balance | Recovery (Expense) Recognized In Net Earnings | Recognized In Shareholders' Equity | Closing Balance | ||||
Deferred tax assets | ||||||||
| Non-capital losses | $ | 12,437 | $ | 1,632 | $ | - | $ | 14,069 |
| Financing fees | 1,725 | (303) | - | 1,422 | ||||
| Other | 1,333 | 778 | - | 2,111 | ||||
| Deferred tax liabilities | ||||||||
| Interest capitalized for accounting | (84) | - | - | (84) | ||||
| Silver and gold interests | (17,547) | (801) | - | (18,348) | ||||
| Other | (55) | (57) | - | (112) | ||||
Total | $ | (2,191) | $ | 1,249 | $ | - | $ | (942) |
| December 31 | December 31 | |||
| 2015 | 2014 | |||
Non-capital losses | $ | 16,020 | $ | - |
| Financing fees | 6,618 | - | ||
| Silver and gold interests | 57,925 | - | ||
| Other | 1,835 | - | ||
| Capital losses | 11,033 | 8,947 | ||
| Unrealized losses on long-term investments | 14,744 | 15,129 | ||
Total | $ | 108,175 | $ | 24,076 |
| 23. | Commitments and Contingencies |
| Silver and Gold Interests | Attributable Payable Production to be Purchased | Per Ounce Cash Payment 1, 2 | Term of Agreement | Date of Original Contract | ||||
Silver | Gold | Silver | Gold | |||||
| San Dimas | 100% 3 | 0% | $ | 4.24 | n/a | Life of Mine | 15-Oct-04 | |
| Yauliyacu | variable 4 | 0% | $ | 8.70 5 | n/a | Life of Mine 4 | 23-Mar-06 | |
| Peñasquito | 25% | 0% | $ | 4.09 | n/a | Life of Mine | 24-Jul-07 | |
| Salobo | 0% | 50% | n/a | $ | 400 | Life of Mine | 28-Feb-13 | |
| Sudbury | 0% | 70% | n/a | $ | 400 | 20 years | 28-Feb-13 | |
| Antamina | 33.75% | 0% | 20% of Spot | n/a | Life of Mine | 3-Nov-15 | ||
| Barrick | ||||||||
| Pascua-Lama | 25% | 0% | $ | 3.90 | n/a | Life of Mine | 8-Sep-09 | |
| Lagunas Norte | 100% | 0% | $ | 3.90 | n/a | 8.5 years | 8-Sep-09 | |
| Pierina | 100% | 0% | $ | 3.90 | n/a | 8.5 years 6 | 8-Sep-09 | |
| Veladero | 100% 7 | 0% | $ | 3.90 | n/a | 8.5 years | 8-Sep-09 | |
| Other | ||||||||
| Los Filos | 100% | 0% | $ | 4.26 | n/a | 25 years | 15-Oct-04 | |
| Zinkgruvan | 100% | 0% | $ | 4.27 | n/a | Life of Mine | 8-Dec-04 | |
| Stratoni | 100% | 0% | $ | 4.14 8 | n/a | Life of Mine | 23-Apr-07 | |
| Minto | 100% | 100% 9 | $ | 4.10 | $ | 315 | Life of Mine | 20-Nov-08 |
| Cozamin | 100% | 0% | $ | 4.24 | n/a | 10 years | 4-Apr-07 | |
| Neves-Corvo | 100% | 0% | $ | 4.14 | n/a | 50 years | 5-Jun-07 | |
| Aljustrel | 100% 10 | 0% | $ | 4.06 | n/a | 50 years | 5-Jun-07 | |
| Keno Hill | 25% | 0% | $ | 3.90 11 | n/a | Life of Mine | 2-Oct-08 | |
| Rosemont | 100% | 100% | $ | 3.90 | $ | 450 | Life of Mine | 10-Feb-10 |
| Loma de La Plata | 12.5% | 0% | $ | 4.00 | n/a | Life of Mine | n/a 12 | |
| 777 | 100% | 100%/50% 13 | $ | 5.96 14 | $ | 404 14 | Life of Mine | 8-Aug-12 |
| Constancia | 100% | 50% 15 | $ | 5.90 14 | $ | 400 14 | Life of Mine | 8-Aug-12 |
| Early Deposit | ||||||||
| Toroparu | 50% 16 | 10% 16 | $ | 3.90 | $ | 400 | Life of Mine | 11-Nov-13 |
| Cotabambas | 100% 17 | 25% 17 | $ | 5.90 | $ | 450 | Life of Mine | n/a 18 |
| 1) | Subject to an annual inflationary adjustment with the exception of Loma de La Plata and Sudbury. |
| 2) | Should the prevailing market price for silver or gold be lower than this amount, the per ounce cash payment will be reduced to the prevailing market price, with the exception of Yauliyacu where the per ounce cash payment will not be reduced below $4.20 per ounce, subject to an annual inflationary factor. |
| 3) | Silver Wheaton is committed to purchase from Primero a per annum amount equal to the first 6 million ounces of payable silver produced at San Dimas and 50% of any excess. |
| 4) | On November 30, 2015, the Company amended its silver purchase agreement with Glencore. The term of the agreement, which was set to expire in 2026, was extended to the life of mine. Silver Wheaton is committed to purchase from Glencore a per annum amount equal to the first 1.5 million ounces of payable silver produced at Yauliyacu and 50% of any excess. |
| 5) | The price paid will be increased from the current $4.20 per ounce of silver delivered to $8.70 per ounce once all silver which had been produced at Yauliyacu as at December 31, 2015 has been delivered to the Company. As at December 31, 2015, this figure is approximately 0.4 million ounces. Should the market price of silver exceed $20 per ounce, in addition to the $8.70 per ounce, the Company is committed to pay Glencore an additional amount for each ounce of silver delivered equal to 50% of the excess, to a maximum of $10 per ounce |
| 6) | As per Barrick's disclosure, closure activities were initiated at Pierina in August 2013. |
| 7) | Silver Wheaton's attributable silver production is subject to a maximum of 8% of the silver contained in the ore processed at Veladero during the period. |
| 8) | In October 2015, in order to incentivize additional exploration and potentially extend the limited remaining mine life of Stratoni, Silver Wheaton and Eldorado agreed to modify the Stratoni silver purchase agreement. The primary modification is to increase the production price per ounce of silver delivered to Silver Wheaton over the current fixed price by one of the following amounts: (i) $2.50 per ounce of silver delivered if 10,000 meters of drilling is completed outside of the existing ore body and within Silver Wheaton's defined area of interest ("Expansion Drilling"); (ii) $5.00 per ounce of silver delivered if 20,000 meters of Expansion Drilling is completed; and (iii) $7.00 per ounce of silver delivered if 30,000 meters of Expansion Drilling is completed. Drilling in all three cases must be completed by December 31, 2020, in order for the agreed upon increase in production price to be initiated. |
| 9) | The Company is committed to acquire 100% of the first 30,000 ounces of gold produced per annum and 50% thereafter. |
| 10) | Silver Wheaton only has the rights to silver contained in concentrate containing less than 15% copper at the Aljustrel mine. |
| 11) | In June 2014, the Company amended its silver purchase agreement with Alexco to increase the production payment to be a function of the silver price at the time of delivery. In addition, the area of interest was expanded to include properties currently owned by Alexco and properties acquired by Alexco in the future which fall within a one kilometer radius of existing Alexco holdings in the Keno Hill Silver District. The amended agreement is conditional on Alexco paying Silver Wheaton $20 million by December 31, 2015, or at Alexco's option, up to December 31, 2016. |
| 12) | Terms of the agreement not yet finalized. |
| 13) | The Company's share of gold production at 777 will remain at 100% until the later of the end of 2016 or the satisfaction of a completion test relating to Hudbay's Constancia mine, after which it will be reduced to 50% for the remainder of the mine life. |
| 14) | Subject to an increase to $9.90 per ounce of silver and $550 per ounce of gold after the initial 40 year term. |
| 15) | Gold recoveries will be set at 55% for the Constancia deposit and 70% for the Pampacancha deposit until 265,000 ounces of gold have been delivered to the Company. |
| 16) | During the 60 day period following the delivery of a feasibility study, environmental study and impact assessment, and other related documents (collectively, the "Toroparu Feasibility Documentation"), or after December 31, 2016 if the Toroparu Feasibility Documentation has not been delivered to Silver Wheaton by such date, Silver Wheaton may elect not to proceed with the precious metal purchase agreement, at which time Silver Wheaton will be entitled to a return of the amounts advanced less $2.0 million which is non-refundable or, at Sandspring's option, the gold stream percentage will be reduced from 10% to 0.909% and the silver stream percentage will be reduced from 50% to nil. Silver Wheaton may also elect to terminate the Toroparu Early Deposit Agreement upon the occurrence of certain events prior to the payment of any initial construction payment and elect to reduce the stream percentages or obtain a return of the amounts advanced less $2.0 million. |
| 17) | Following the delivery of certain feasibility documentation, the Company may elect to terminate the Cotabambas Early Deposit Agreement. Once 90 million silver equivalent ounces attributable to Silver Wheaton have been produced, the attributable production to be purchased will decrease to 66.67% of silver production and 16.67% of gold production for the life of mine. |
| 18) | The entering into of the Cotabambas Early Deposit Agreement is subject to the negotiation and completion of definitive documentation. There can be no assurance that the Cotabambas Early Deposit Agreement will be completed on the terms set out in the non-binding term sheet, or at all. |
| Obligations With Scheduled Payment Dates | Other Commitments | |||||||||||||
| (in thousands) | 2016 | 2017 - 2019 | 2020 - 2021 | After 2021 | Sub-Total | Total | ||||||||
Bank debt 1 | $ | - | $ | - | $ | 1,466,000 | $ | - | $ | 1,466,000 | $ | - | $ | 1,466,000 |
Interest 2 | 34,675 | 124,328 | 6,499 | - | 165,502 | - | 165,502 | |||||||
Silver and gold interest payments 3 | ||||||||||||||
Rosemont 4 | - | - | - | - | - | 231,150 | 231,150 | |||||||
| Loma de La Plata | - | - | - | - | - | 32,400 | 32,400 | |||||||
| Toroparu | - | - | - | - | - | 138,000 | 138,000 | |||||||
Cotabambas 5 | - | - | - | - | - | 140,000 | 140,000 | |||||||
| Operating leases | 1,193 | 3,634 | 1,880 | 2,691 | 9,398 | - | 9,398 | |||||||
Total contractual obligations | $ | 35,868 | $ | 127,962 | $ | 1,474,379 | $ | 2,691 | $ | 1,640,900 | $ | 541,550 | $ | 2,182,450 |
| 1) | At December 31, 2015, the Company had $1.466 billion drawn and outstanding on the Revolving Facility. |
| 2) | As the applicable interest rates are floating in nature, the interest charges are estimated based on market-based forward interest rate curves at the end of the reporting period. |
| 3) | Does not reflect the contingent payment due related to the Salobo gold purchase agreement (see the Salobo section, below). |
| 4) | Includes contingent transaction costs of $1.1 million. |
| 5) | The entering into of the Cotabambas Early Deposit Agreement is subject to the negotiation and completion of definitive documentation. There can be no assurance that the Cotabambas Early Deposit Agreement will be completed on the terms set out in the non-binding term sheet, or at all. |
Rosemont
CRA Position/Status | Potential Income Inclusion | Potential Income Tax Payable | Payments Made/Pending | Timing | |
2005-2010 Taxation Years | Transfer pricing provisions of the Act should apply such that Silver Wheaton's income subject to tax in Canada should be increased by an amount equal to substantially all of the income earned outside of Canada by Silver Wheaton's foreign subsidiaries. | CRA has reassessed Silver Wheaton and is seeking to increase Silver Wheaton's income subject to tax in Canada by Cdn$715.3 million. | CRA has reassessed Silver Wheaton and is seeking to impose income tax of Cdn$201.3 million, transfer pricing penalties of Cdn$71.5 million and interest (calculated to September 24, 2015) and other penalties of Cdn$80.6 million for total of Cdn$353.4 million.(1) | Silver Wheaton has received approval from the CRA to post security in the form of a letter of guarantee in the amount of Cdn$191.7 million which includes interest accrued to-date plus estimated interest for the following year.(1) | Notice of Appeal filed January 8, 2016. Timing of resolution of the matter in court is uncertain. |
2011-2013 Taxation Years | CRA Audit commenced January 19, 2016. CRA has not issued a proposal or reassessment. | If CRA were to reassess on similar basis as 2005-2010 taxation years, CRA would seek to increase Silver Wheaton's income subject to tax in Canada by approximately $1.2 billion. (2) | If CRA were to reassess on similar basis as 2005-2010 taxation years, CRA would seek to impose income tax of approximately $310 million.(2), (3) | N/A | Time to complete CRA audit unknown. |
2014-2015 Taxation Years | Remain open to audit by CRA. | If CRA were to audit and then reassess on similar basis as 2005-2010 taxation years, CRA would seek to increase Silver Wheaton's income subject to tax in Canada by approximately $410 million. (2) | If CRA were to audit and then reassess on similar basis as 2005-2010 taxation years, CRA would seek to impose income tax of approximately $106 million. (2), (3) | N/A | N/A |
| 24. | Segmented Information |
Year Ended December 31, 2015 | ||||||||||||||||||
(in thousand | Sales | Cost of Sales | Depletion | Gross Margin | Impairment Charges 1 | Other | Net Earnings | Cash Flow From Operations | Total Assets | |||||||||
Silver | ||||||||||||||||||
| San Dimas | $ | 113,198 | $ | 30,680 | $ | 6,396 | $ | 76,122 | $ | - | $ | - | $ | 76,122 | $ | 82,518 | $ | 146,555 |
| Yauliyacu | 40,079 | 10,672 | 16,367 | 13,040 | - | - | 13,040 | 29,407 | 165,282 | |||||||||
| Peñasquito | 114,083 | 29,026 | 20,298 | 64,759 | - | - | 64,759 | 85,057 | 430,847 | |||||||||
| Antamina | 18,858 | 3,748 | 13,308 | 1,802 | - | - | 1,802 | 15,110 | 886,981 | |||||||||
Barrick 2 | 37,103 | 9,218 | 7,648 | 20,237 | (109,723) | - | (89,486) | 27,887 | 498,090 | |||||||||
Other 3 | 92,257 | 27,384 | 26,545 | 38,328 | (74,291) | - | (35,963) | 65,899 | 458,911 | |||||||||
| $ | 415,578 | $ | 110,728 | $ | 90,562 | $ | 214,288 | $ | (184,014) | $ | - | $ | 30,274 | $ | 305,878 | $ | 2,586,666 | |
Gold | ||||||||||||||||||
Sudbury 4 | $ | 39,201 | $ | 13,392 | $ | 28,173 | $ | (2,364) | $ | (49,439) | $ | - | $ | (51,803) | $ | 25,371 | $ | 506,250 |
| Salobo | 124,250 | 43,359 | 45,502 | 35,389 | - | - | 35,389 | 80,890 | 2,156,757 | |||||||||
Other 5 | 69,658 | 22,735 | 34,344 | 12,579 | (151,469) | - | (138,890) | 46,595 | 219,739 | |||||||||
| $ | 233,109 | $ | 79,486 | $ | 108,019 | $ | 45,604 | $ | (200,908) | $ | - | $ | (155,304) | $ | 152,856 | $ | 2,882,746 | |
Total silver and gold interests | $ | 648,687 | $ | 190,214 | $ | 198,581 | $ | 259,892 | $ | (384,922) | $ | - | $ | (125,030) | $ | 458,734 | $ | 5,469,412 |
Corporate | ||||||||||||||||||
| General and administrative | $ | (32,237) | $ | (32,237) | ||||||||||||||
| Other | (4,775) | (4,775) | ||||||||||||||||
Total corporate | $ | (37,012) | $ | (37,012) | $ | (27,375) | $ | 162,799 | ||||||||||
Consolidated | $ | 648,687 | $ | 190,214 | $ | 198,581 | $ | 259,892 | $ | (384,922) | $ | (37,012) | $ | (162,042) | $ | 431,359 | $ | 5,632,211 |
| 1) | See Note 11 for further information. |
| 2) | Comprised of the operating Lagunas Norte, Pierina and Veladero silver interests in addition to the non-operating Pascua-Lama silver interest. |
| 3) | Where a silver interest represents less than 10% of the Company's sales, gross margin or aggregate asset book value and is not evaluated on a regular basis by the Company's CEO for the purpose of assessing performance, the silver interest has been summarized under Other silver interests. Other silver interests are comprised of the operating Los Filos, Zinkgruvan, Cozamin, Neves-Corvo, Stratoni, Minto, 777, Constancia silver interests in addition to the non-operating Keno Hill, Aljustrel, Rosemont and Loma de La Plata silver interests. |
| 4) | Comprised of the operating Coleman, Copper Cliff, Garson, Stobie, Creighton and Totten gold interests in addition to the non-operating Victor gold interest. |
| 5) | Where a gold interest represents less than 10% of the Company's sales, gross margin or aggregate asset book value and is not evaluated on a regular basis by the Company's CEO for the purpose of assessing performance, the gold interest has been summarized under Other gold interests. Other gold interests are comprised of the operating Minto, 777 and Constancia gold interests and the non-operating Rosemont gold interest. |
Year Ended December 31, 2014 | ||||||||||||||||||
| Sales | Cost of Sales | Depletion | Gross Margin | Impairment Charges 1 | Other | Net Earnings | Cash Flow From Operations | Total Assets | ||||||||||
| (in thousands) | ||||||||||||||||||
Silver | ||||||||||||||||||
San Dimas 2 | $ | 104,095 | $ | 23,326 | $ | 4,541 | $ | 76,228 | $ | - | $ | - | $ | 76,228 | $ | 80,769 | $ | 152,951 |
| Yauliyacu | 64,011 | 13,859 | 19,799 | 30,353 | - | - | 30,353 | 50,152 | 187,478 | |||||||||
| Peñasquito | 134,757 | 28,753 | 21,144 | 84,860 | - | - | 84,860 | 106,004 | 451,145 | |||||||||
Barrick 3 | 31,687 | 6,631 | 5,548 | 19,508 | - | - | 19,508 | 23,065 | 605,328 | |||||||||
Other 4 | 109,664 | 24,652 | 24,517 | 60,495 | (68,151) | - | (7,656) | 86,161 | 559,747 | |||||||||
| $ | 444,214 | $ | 97,221 | $ | 75,549 | $ | 271,444 | $ | (68,151) | $ | - | $ | 203,293 | $ | 346,151 | $ | 1,956,649 | |
Gold | ||||||||||||||||||
Sudbury 5 | $ | 38,720 | $ | 12,166 | $ | 25,592 | $ | 962 | $ | - | $ | - | $ | 962 | $ | 26,993 | $ | 583,862 |
| Salobo | 54,762 | 17,564 | 20,281 | 16,917 | - | - | 16,917 | 37,198 | 1,302,202 | |||||||||
Other 6 | 82,480 | 24,146 | 38,758 | 19,576 | - | - | 19,576 | 58,254 | 405,552 | |||||||||
| $ | 175,962 | $ | 53,876 | $ | 84,631 | $ | 37,455 | $ | - | $ | - | $ | 37,455 | $ | 122,445 | $ | 2,291,616 | |
Total silver and gold interests | $ | 620,176 | $ | 151,097 | $ | 160,180 | $ | 308,899 | $ | (68,151) | $ | - | $ | 240,748 | $ | 468,596 | $ | 4,248,265 |
Corporate | ||||||||||||||||||
| General and administrative | $ | (37,860) | $ | (37,860) | ||||||||||||||
| Other | (3,062) | (3,062) | ||||||||||||||||
Total corporate | $ | (40,922) | $ | (40,922) | $ | (36,723) | $ | 399,498 | ||||||||||
Consolidated | $ | 620,176 | $ | 151,097 | $ | 160,180 | $ | 308,899 | $ | (68,151) | $ | (40,922) | $ | 199,826 | $ | 431,873 | $ | 4,647,763 |
| 1) | See Note 11 for further information. |
| 2) | Results for San Dimas include 875,000 ounces received from Goldcorp in connection with Goldcorp's four year commitment, commencing August 6, 2010, to deliver to Silver Wheaton 1.5 million ounces of silver per annum resulting from their sale of San Dimas to Primero. |
| 3) | Comprised of the operating Lagunas Norte, Pierina and Veladero silver interests in addition to the non-operating Pascua-Lama silver interest. |
| 4) | Where a silver interest represents less than 10% of the Company's sales, gross margin or aggregate asset book value and is not evaluated on a regular basis by the Company's CEO for the purpose of assessing performance, the silver interest has been summarized under Other silver interests. Other silver interests are comprised of the operating Los Filos, Zinkgruvan, Cozamin, Neves-Corvo, Stratoni, Minto, Constancia, 777 and Aljustrel silver interests; the non-operating Rosemont, Keno Hill and Loma de La Plata silver interests; and the previously owned Mineral Park and Campo Morado silver interests. |
| 5) | Comprised of the operating Coleman, Copper Cliff, Garson, Stobie, Totten and Creighton gold interests in addition to the non-operating Victor gold interest. |
| 6) | Where a gold interest represents less than 10% of the Company's sales, gross margin or aggregate asset book value and is not evaluated on a regular basis by the Company's CEO for the purpose of assessing performance, the gold interest has been summarized under Other gold interests. Other gold interests are comprised of the operating Minto, Constancia and 777 gold interests and the non-operating Rosemont gold interest. |
| 7) | Certain comparative figures have been reclassified to conform with the financial statement presentation adopted for the current year. |
Year Ended December 31, 2015 | ||||||
| Sales | Carrying Amount | |||||
| (in thousands) | Silver Interests | Gold Interests | ||||
North America | ||||||
| Canada | $ | 103,153 | $ | 52,547 | $ | 594,064 |
| United States | - | 433 | - | |||
| Mexico | 247,636 | 585,293 | - | |||
| Europe | ||||||
| Greece | 8,529 | 22,589 | - | |||
| Portugal | 9,610 | 25,391 | - | |||
| Sweden | 29,558 | 45,241 | - | |||
| South America | ||||||
Argentina / Chile 1 | 19,203 | 506,137 | - | |||
| Brazil | 124,249 | - | 2,156,757 | |||
| Peru | 106,749 | 1,349,035 | 131,925 | |||
Consolidated | $ | 648,687 | $ | 2,586,666 | $ | 2,882,746 |
1) Includes the Pascua-Lama project, which straddles the border of Argentina and Chile. | ||||||
Year Ended December 31, 2014 | ||||||
| Sales | Carrying Amount | |||||
| (in thousands) | Silver Interests | Gold Interests | ||||
North America | ||||||
| Canada | $ | 132,704 | $ | 131,790 | $ | 853,358 |
| United States | 3,354 | 433 | - | |||
| Mexico | 277,176 | 615,629 | - | |||
| Europe | ||||||
| Greece | 12,874 | 27,437 | - | |||
| Portugal | 13,560 | 26,329 | - | |||
| Sweden | 30,048 | 48,388 | - | |||
| South America | ||||||
Argentina / Chile 1 | 13,639 | 613,091 | - | |||
| Brazil | 54,762 | - | 1,302,201 | |||
| Peru | 82,059 | 493,552 | 136,057 | |||
Consolidated | $ | 620,176 | $ | 1,956,649 | $ | 2,291,616 |
1) Includes the Pascua-Lama project, which straddles the border of Argentina and Chile. | ||||||
| 25. | Subsequent Events |
| CORPORATE |
| INFORMATION |
CANADA – HEAD OFFICE | TRANSFER AGENT |
SILVER WHEATON CORP. | CST Trust Company |
Suite 3500 | 1600 – 1066 West Hastings Street |
1021 West Hastings Street | Vancouver, BC V6E 3X1 |
Vancouver, BC V6E 0C3 | |
| Canada | Toll-free in Canada and the United States: |
T: 1 604 684 9648 | 1 800 387 0825 |
F: 1 604 684 3123 | |
| Outside of Canada and the United States: | |
CAYMAN ISLANDS OFFICE | 1 416 682 3860 |
Silver Wheaton (Caymans) Ltd. | |
Suite 300, 94 Solaris Avenue | E: inquiries@canstockta.com |
| Camana Bay | |
| P.O. Box 1791 GT, Grand Cayman | AUDITORS |
Cayman Islands KY1-1109 | Deloitte LLP |
Vancouver, BC | |
STOCK EXCHANGE LISTING | |
Toronto Stock Exchange: SLW | INVESTOR RELATIONS |
New York Stock Exchange: SLW | PATRICK DROUIN |
Senior Vice President, Investor Relations | |
DIRECTORS | T: 1 604 684 9648 |
LAWRENCE BELL | TF: 1 800 380 8687 |
| GEORGE BRACK | E: info@silverwheaton.com |
JOHN BROUGH PETER GILLIN CHANTAL GOSSELIN DOUGLAS HOLTBY, Chairman EDUARDO LUNA WADE NESMITH RANDY SMALLWOOD | |
OFFICERS RANDY SMALLWOOD President & Chief Executive Officer CURT BERNARDI Senior Vice President, Legal & Corporate Secretary GARY BROWN Senior Vice President & Chief Financial Officer PATRICK DROUIN Senior Vice President, Investor Relations HAYTHAM HODALY Senior Vice President, Corporate Development | |
Silver Wheaton® is a registered trademark of Silver Wheaton Corp. in Canada, the United States and certain other jurisdictions. |