
March 14, 2014
Mr. David Matheson
Chief Financial Officer, CFO
Dejour Energy (USA) Corp.
1100-808 West Hastings Street
Vancouver, BC
V6C 2X4
Canada
Subject: | Reserve Estimate and Financial Forecast as to Dejour’s Interests in the Kokopelli Field Area, Garfield County, Colorado. |
Dear David:
As you requested, Gustavson Associates has completed reserves and economics as to Dejour Energy’s interests in future oil and gas production associated with the Kokopelli Field Area located in Garfield County. Reserves have been estimated based on analysis of analogous well production data. Estimates and projections have been made as of January 1, 2014. Reserves have been estimated in accordance with the US Securities and Exchange Commission’s (SEC) definitions and guidelines, and the report was prepared for the purpose of inclusion as an exhibit in a filing made with the SEC. This report was completed on March 5, 2014.
In general, Proved Developed Producing (PDP) reserves have been assigned to the four Kokopelli Federal wells, and Proved Undeveloped (PUD) reserves have been assigned to 139 well locations. Gustavson is of the opinion that no current regulations, and no anticipated changes to regulations, would inhibit the ability of Dejour to recover the estimated reserves in the manner projected herein. It is our understanding that the reserves estimated herein represent all of Dejour’s US reserves.
The estimated net reserves volumes and associated net cash flow estimates are summarized in Table 1 below.
5757 Central Ave. Suite D Boulder, Co. 80301 USA 1-303-443-2209 FAX 1-303-443-3156 http:/ / www.gustavson.com
Mr. David Matheson
March 14, 2014
Page 2
Table 1 Summary of Net Reserves and Projected Before Tax Cash Flow
| Reserves Category | Net Gas
Reserves
(MMCF) | Net Light
Crude Oil
Reserves
(MBO) | Net NGL
Reserves
(MBO) | Net Present Value, thousands of US$
Discounted at
|
| 0% | 10% | 15% |
| Proved Developed Producing | 367.1 | 2.5 | 15.2 | $1,450.5 | $1,069.6 | $956.3 |
| Proved Developed Non-Producing | - | - | - | $0.0 | $0.0 | $0.0 |
| Proved Undeveloped | 86,243.3 | 587.3 | 3,580.3 | $247,444.2 | $83,588.3 | $53,379.4 |
| Total Proved | 86,610.4 | 589.8 | 3,595.6 | $248,894.7 | $84,657.9 | $54,335.7 |
The proportion of the Company’s total reserves represented by the reserves included in this report is shown below.
| Location of Reserves | | | | | | Proportion of |
| | | Gas | Light Crude Oil | NGL | Oil Equivalent | Oil Equiv. |
| Country | Area | (MMCF) | (MBBL) | (MBBL) | (MBOE) | Reserves |
| | | | | | | |
| United States | Colorado | 86,610 | 590 | 3,596 | 18,620 | 99% |
| Total Company | | | | | 18,815 | 100% |
Kokopelli Field Area Assumptions, Garfield County, Colorado
Gustavson Associates has performed an evaluation of the reserves associated with both developed and undeveloped locations located in the Kokopelli Field Project Area, Garfield County, Colorado. Proved Developed Producing (PDP) Reserves have been assigned to the Federal 6/7-16-21, Federal 6/7-14-21, Federal 6/7-15-21, and Federal 6/7-13-21 wells, which began producing in July and August of 2013. Logs for these well were reviewed and found to indicate similar response in the target formations to the response in analogous producing wells. Proved Undeveloped reserves have been assigned to locations within the area delineated by successful wells and logged net pay, comprising of 139 locations. The 139 PUD locations and the PDP locations are displayed in Figure 1.
Dejour entered into a farmout agreement on December 31, 2012 with a private Denver-based drilling fund for a four-well drilling and completion program which included all the aforementioned PDP locations. The drilling of these four locations was completed in mid-2013. Dejour will have a 22.23% working interest (WI) and 17.78% net revenue interest (NRI) before payout of 150% of the capital investments (BPO), and 41.67% WI and 33.34% NRI APO, in the joint venture for three of the wells. For the Federal 6/7 16-21 well, Dejour maintains a 15.88% working interest (WI) and 12.70% net revenue interest (NRI) before payout of 150% of the capital investments (BPO), and 29.77% WI and 23.81% NRI APO, in the joint venture. Payout of 150% of investment is expected to occur in 2023. Dejour’s interests in these four wells can be found in Table 2 below:
Mr. David Matheson
March 14, 2014
Page 3
Table 2 Farmout and Non Farmout Working Interests and Net Revenue Interests
Company
| No Farmout | Farmout |
| Federal 6/7 13, 14, & 15-21 | Federal 6/716-21 well |
| BPO | APO | BPO | APO |
| WI | NRI | WI | NRI | WI | NRI | WI | NRI | WI | NRI |
| Dejour | 71.43 | 57.14 | 22.23 | 17.78 | 41.67 | 33.34 | 15.88 | 12.70 | 29.77 | 23.81 |
| Brownstone | 28.57 | 22.86 | 0.00 | 0.00 | 0.00 | 0.00 | 28.57 | 22.86 | 28.57 | 22.86 |
| Drilling Fund | 0.00 | 0.00 | 77.77 | 62.22 | 58.33 | 46.66 | 55.55 | 44.44 | 41.66 | 33.33 |
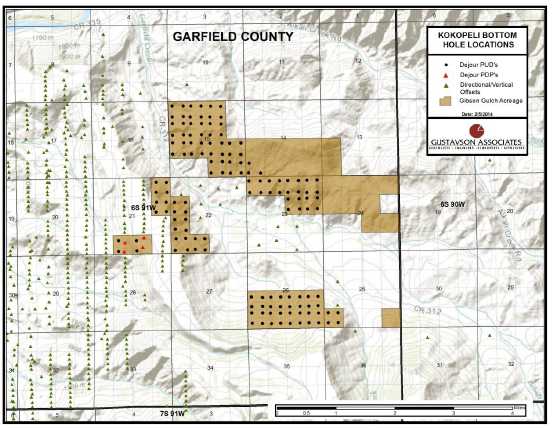
Figure 1 Map of Dejour PDP, PUD, and Offset Well Locations
Dejour expects to start the remainder of their drilling program with 54 wells drilled per year, beginning 2014 through 2017. On this schedule, the last PUD location will be drilled in November 2016. The estimated ultimate recovery (EUR) for each location was based on the average performance of wells in the immediate area. Many of these wells were completed in multiple zones, including Williams Fork, Rollins, Cozette, and Corcoran. Figure 1 also displays the locations of Dejour’s PDP wells, and offsetting producing wells. All of the PUD locations are within 1.5 miles and flanked by producing wells.
Mr. David Matheson
March 14, 2014
Page 4
The type curve utilized for the undeveloped locations was the same as that determined in the Dejour 2012 year-end reserve report. While there have been some new wells drilled and completed in the area, their performance on average appears to have been negatively impacted by operator completion practices in 2013, namely, the smaller size of fracture treatments. Dejour has stated their intentions to maintain the larger fracture treatments; therefore, we have stayed with the type curve based on the wells drilled prior to 2013. The average EUR was based on the average composite performance of the total well production from each well. When the economic parameters were considered, this EUR was found to be approximately 1.15 BCF. This average reserve per well is dry gas after a shrinkage of 5% is deducted. The Proved Undeveloped location type curve can be found in Figure 2 below. The estimated net reserves volumes and associated net cash flow estimates are summarized in Table 1 above.
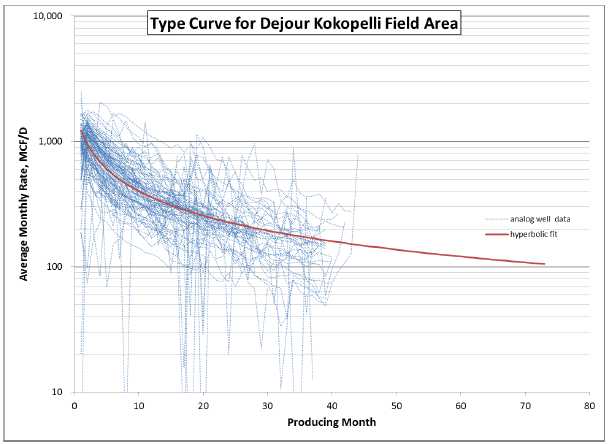
Figure 2 Composite Type Curve, Kokopelli Area
Oil and Gas Pricing
In order to determine the flat pricing in accordance with SEC guidelines, the Dejour’s revenue statements were analyzed. A differential was calculated based on the price that Dejour was paid versus the West Texas Intermediate (WTI) and Henry Hub (HH) spot prices averaged for that given month. These differentials were then applied to the WTI and HH spot prices for the first day of each month in 2013 in order to estimate prices for Dejour’s products on the first day of the month, per SEC guidelines. These values were averaged and applied in the cash flows presented herein.
Mr. David Matheson
March 14, 2014
Page 5
The oil prices were determined to be 11% lower than WTI prices. Gas prices were determined to be 9% higher than Henry Hub prices. NGL’s were found to be sold at 79.5% the price of Dejour’s paid price for oil. The utilized flat hydrocarbon pricing can be found in the table below.
| Flat Price Forecast For Effective Date of January 1, 2014 |
| Oil, Gas & NGL Pricing Includes Differentials |
| Piceance
Oil, $/B | Piceance
Gas, $/MCF | Piceance
NGL, $/B |
| Flat Pricing | $86.58 | $4.09 | $68.84 |
Expenses
The drilling and completion costs utilized for the first 50 undeveloped locations is $1.65 million per well; the next 50 locations is $1.50 million per well; and the remaining locations have a drilling and completion cost of $1.40 million per well. Operating costs for the PDPs and first 50 undeveloped locations is estimated at $3,759 per well per month; the next 50 locations utilize a monthly operational expense of $3,000 per well; the remaining undeveloped locations have an anticipated monthly operational expense of $2,500 per well. This is based on information provided by Dejour and is consistent with our experience with similar wells in the area. The reduction in costs reflects economies of scale and contractual advantages expected to be gained when a large drilling program is executed. Severance tax and conservation taxes are deducted at the rate of 1.07% of revenue. County ad valorem tax was estimated at approximately 3.35% of revenue after discussion with Garfield County personnel. NGL yield of 39 Bbl/MMCF and condensate/gas ratio of 6.5 Bbl/MMCF were based on actual 2013 sales. Contractual gas transportation, gathering, and processing fees of $0.71/MCF were deducted as operating costs.
Capital and operating costs were held flat. Abandonment costs of $15,000 per well was assumed. Dejour’s interests in the property are reported to be 71.43% working interest with a 20% royalty burden for net revenue interest of 57.14%, with the exception of the four PDP wells included in the farmout as described previously.
Detailed cash flow projections by category are shown in Table 3 and Table 4 below. Note that the NGL volumes shown in these tables represent total NGL sales as expected based on the revenue statements provided by the Client.1
____________________________________________
1 In some previous reports, ethane and heavier NGLs were reported separately. Here they are reported together.
Mr. David Matheson
March 14, 2014
Page 6
Limiting Conditions and Disclaimers
The accuracy of any reserve report or resource evaluation is a function of available data and of engineering and geologic interpretation and judgment. While the evaluation presented herein is believed to be reasonable, it should be viewed with the understanding that subsequent reservoir performance or changes in pricing structure, market demand, or other economic parameters may justify its revision. The assumptions, data, methods, and procedures used are appropriate for the purpose served by the report. Gustavson has used all methods and procedures as we considered necessary under the circumstances to prepare the report.
Gustavson Associates, LLC, holds neither direct nor indirect financial interest in the subject property, the company operating the subject acreage, or in any other affiliated companies.
All data and work files utilized in the preparation of this report are available for examination in our offices. Please contact us if we can be of assistance. We appreciate the opportunity to be of service and look forward to further serving Dejour Energy (USA) Corp.
Sincerely,

Table 3 Summary Cash Flow Forecast, Proved Developed Producing Reserves
| TOTAL PROVED DEVELOPED | DATE | : 03/05/2014 |
| KOKOPELLI FIELD | TIME | : 16:03:42 |
| GARFIELD COUNTY, COLORADO | DBS | : Dejour1-12 |
| TO THE INTERESTS OF DEJOUR ENERGY | SETTINGS | : SETDATA |
| | SCENARIO | : Dejour |
R E S E R V E S A N D E C O N O M I C S
EFF DATE: 01/2014
PW DATE: 01/2014
| --END-- | GROSS OIL | GROSS GAS | GROSS NGL | NET OIL | NET GAS | NET NGL | NET OIL | NET GAS | NET NGL | TOTAL |
| MO-YEAR | PRODUCTION | PRODUCTION | PRODUCTION | PRODUCTION | PRODUCTION | PRODUCTION | REVENUE | REVENUE | REVENUE | REVENUE |
-------
| ---MBBLS--- | ----MMCF--- | ---MBBLS--- | ---MBBLS-- | ----MMCF-- | ---MBBLS-- | ---M$--- | ---M$--- | ---M$--- | ----M$--- |
| | | | | | | | | | | |
| 12-2014 | 3.091 | 478.730 | 18.845 | 0.508 | 74.568 | 3.096 | 43.966 | 304.982 | 213.103 | 562.050 |
| 12-2015 | 1.757 | 272.050 | 10.709 | 0.288 | 42.320 | 1.757 | 24.952 | 173.090 | 120.945 | 318.987 |
| 12-2016 | 1.297 | 200.848 | 7.906 | 0.213 | 31.235 | 1.297 | 18.416 | 127.749 | 89.263 | 235.429 |
| 12-2017 | 1.050 | 162.634 | 6.402 | 0.172 | 25.288 | 1.050 | 14.910 | 103.429 | 72.270 | 190.609 |
| 12-2018 | 0.893 | 138.266 | 5.443 | 0.146 | 21.498 | 0.892 | 12.675 | 87.925 | 61.436 | 162.036 |
| | | | | | | | | | | |
| 12-2019 | 0.782 | 121.165 | 4.770 | 0.128 | 18.838 | 0.782 | 11.107 | 77.046 | 53.835 | 141.988 |
| 12-2020 | 0.700 | 108.402 | 4.267 | 0.115 | 16.853 | 0.700 | 9.936 | 68.928 | 48.162 | 127.026 |
| 12-2021 | 0.636 | 98.456 | 3.876 | 0.104 | 15.306 | 0.635 | 9.024 | 62.602 | 43.742 | 115.368 |
| 12-2022 | 0.584 | 90.453 | 3.561 | 0.096 | 14.062 | 0.584 | 8.291 | 57.512 | 40.186 | 105.989 |
| 12-2023 | 0.541 | 83.854 | 3.301 | 0.089 | 13.035 | 0.541 | 7.686 | 53.315 | 37.253 | 98.254 |
| | | | | | | | | | | |
| 12-2024 | 0.506 | 78.304 | 3.082 | 0.083 | 12.173 | 0.505 | 7.177 | 49.786 | 34.787 | 91.750 |
| 12-2025 | 0.475 | 73.561 | 2.896 | 0.078 | 11.435 | 0.475 | 6.742 | 46.770 | 32.680 | 86.192 |
| 12-2026 | 0.448 | 69.455 | 2.734 | 0.074 | 10.797 | 0.448 | 6.366 | 44.159 | 30.855 | 81.379 |
| 12-2027 | 0.425 | 65.853 | 2.592 | 0.070 | 10.237 | 0.425 | 6.036 | 41.868 | 29.255 | 77.159 |
| 12-2028 | 0.404 | 62.556 | 2.462 | 0.066 | 9.724 | 0.404 | 5.733 | 39.772 | 27.790 | 73.296 |
| | | | | | | | | | | |
| S TOT | 13.590 | 2104.586 | 82.845 | 2.229 | 327.367 | 13.590 | 193.017 | 1338.932 | 935.562 | 2467.512 |
| | | | | | | | | | | |
| AFTER | 1.694 | 262.365 | 10.328 | 0.271 | 39.753 | 1.650 | 23.439 | 162.591 | 113.609 | 299.639 |
| | | | | | | | | | | |
| TOTAL | 15.284 | 2366.952 | 93.172 | 2.500 | 367.121 | 15.241 | 216.456 | 1501.524 | 1049.171 | 2767.151 |
| --END-- | NET OIL | NET GAS | NET NGL | SEVERANCE | AD VALOREM | NET OPER | OPERATING | EQUITY | UNDISC NET | DISC NET |
| MO-YEAR | PRICE | PRICE | PRICE | TAXES | TAXES | EXPENSES | CASH FLOW | INVESTMENT | CASH FLOW | CASH FLOW |
| ------- | ---M$--- | ---M$--- | ---M$--- | -----M$---- | -----M$---- | ----M$---- | ----M$---- | ----M$---- | -----M$---- | -----M$---- |
| | | | | | | | | | | |
| 12-2014 | 86.58 | 4.09 | 68.84 | 3.734 | 18.704 | 104.167 | 435.446 | 0.000 | 435.446 | 415.181 |
| 12-2015 | 86.58 | 4.09 | 68.84 | 2.119 | 10.615 | 76.307 | 229.946 | 0.000 | 229.946 | 199.313 |
| 12-2016 | 86.58 | 4.09 | 68.84 | 1.564 | 7.834 | 67.244 | 158.787 | 0.000 | 158.787 | 125.122 |
| 12-2017 | 86.58 | 4.09 | 68.84 | 1.266 | 6.343 | 62.757 | 120.243 | 0.000 | 120.243 | 86.136 |
| 12-2018 | 86.58 | 4.09 | 68.84 | 1.076 | 5.392 | 60.199 | 95.369 | 0.000 | 95.369 | 62.107 |
| | | | | | | | | | | |
| 12-2019 | 86.58 | 4.09 | 68.84 | 0.943 | 4.725 | 58.661 | 77.659 | 0.000 | 77.659 | 45.976 |
| 12-2020 | 86.58 | 4.09 | 68.84 | 0.844 | 4.227 | 57.738 | 64.218 | 0.000 | 64.218 | 34.562 |
| 12-2021 | 86.58 | 4.09 | 68.84 | 0.766 | 3.839 | 57.221 | 53.542 | 0.000 | 53.542 | 26.197 |
| 12-2022 | 86.58 | 4.09 | 68.84 | 0.704 | 3.527 | 56.989 | 44.769 | 0.000 | 44.769 | 19.913 |
| 12-2023 | 86.58 | 4.09 | 68.84 | 0.653 | 3.270 | 56.968 | 37.363 | 0.000 | 37.363 | 15.108 |
| | | | | | | | | | | |
| 12-2024 | 86.58 | 4.09 | 68.84 | 0.610 | 3.053 | 57.111 | 30.977 | 0.000 | 30.977 | 11.387 |
| 12-2025 | 86.58 | 4.09 | 68.84 | 0.573 | 2.868 | 57.382 | 25.369 | 0.000 | 25.369 | 8.478 |
| 12-2026 | 86.58 | 4.09 | 68.84 | 0.541 | 2.708 | 56.816 | 21.315 | 0.000 | 21.315 | 6.476 |
| 12-2027 | 86.58 | 4.09 | 68.84 | 0.513 | 2.568 | 56.319 | 17.760 | 0.000 | 17.760 | 4.905 |
| 12-2028 | 86.58 | 4.09 | 68.84 | 0.487 | 2.439 | 55.864 | 14.506 | 4.229 | 10.277 | 2.622 |
| | | | | | | | | | | |
| S TOT | 86.58 | 4.09 | 68.84 | 16.392 | 82.113 | 941.741 | 1427.267 | 4.229 | 1423.038 | 1063.483 |
| | | | | | | | | | | |
| AFTER | 86.58 | 4.09 | 68.84 | 1.991 | 9.971 | 248.741 | 38.936 | 11.478 | 27.458 | 6.137 |
| | | | | | | | | | | |
| TOTAL | 86.58 | 4.09 | 68.84 | 18.382 | 92.084 | 1190.481 | 1466.203 | 15.707 | 1450.496 | 1069.620 |
| | OIL | GAS | | | | P.W. % | P.W., M$ |
| | --------- | --------- | | | | ------ | -------- |
| GROSS WELLS | 0.0 | 4.0 | | LIFE, YRS. | 22.25 | 5.00 | 1225.246 |
| GROSS ULT., MB & MMF | 15.284 | 2790.128 | | DISCOUNT % | 10.00 | 10.00 | 1069.620 |
| GROSS CUM., MB & MMF | 0.000 | 423.177 | | UNDISCOUNTED PAYOUT, YRS. | 0.00 | 15.00 | 956.298 |
| GROSS RES., MB & MMF | 15.284 | 2366.951 | | DISCOUNTED PAYOUT, YRS. | 0.00 | 20.00 | 870.137 |
| NET RES., MB & MMF | 2.500 | 367.121 | | UNDISCOUNTED NET/INVEST. | 93.35 | 25.00 | 802.291 |
| NET REVENUE, M$ | 216.456 | 1501.524 | | DISCOUNTED NET/INVEST. | 418.07 | 30.00 | 747.328 |
| INITIAL PRICE, $ | 86.580 | 4.090 | | RATE-OF-RETURN, PCT. | 100.00 | 40.00 | 663.265 |
| INITIAL N.I., PCT. | 16.427 | 16.427 | | INITIAL W.I., PCT. | 20.564 | 60.00 | 553.783 |
| | | | | | | 80.00 | 484.132 |
| | | | | | | 100.00 | 435.050 |
Table 4 Summary Cash Flow Forecast, Proved Undeveloped Reserves
| TOTAL PROVED UNDEVELOPED | DATE | : 03/05/2014 |
| KOKOPELLI FIELD | TIME | : 16:04:03 |
| GARFIELD COUNTY, COLORADO | DBS | : Dejour1-12 |
| TO THE INTERESTS OF DEJOUR ENERGY | SETTINGS | : SETDATA |
| | SCENARIO | : Dejour |
R E S E R V E S A N D E C O N O M I C S
EFF DATE: 01/2014
PW DATE: 01/2014
| --END-- | GROSS OIL | GROSS GAS | GROSS NGL | NET OIL | NET GAS | NET NGL | NET OIL | NET GAS | NET NGL | TOTAL |
| MO-YEAR | PRODUCTION | PRODUCTION | PRODUCTION | PRODUCTION | PRODUCTION | PRODUCTION | REVENUE | REVENUE | REVENUE | REVENUE |
| ------- | ---MBBLS--- | ----MMCF--- | ---MBBLS--- | ---MBBLS--- | ----MMCF-- | ---MBBLS-- | ---M$--- | ---M$--- | ---M$--- | ----M$--- |
| | | | | | | | | | | |
| 12-2014 | 38.329 | 5935.913 | 233.660 | 21.901 | 3216.090 | 133.513 | 1896.223 | 13153.798 | 9191.061 | 24241.100 |
| 12-2015 | 91.965 | 14242.327 | 560.633 | 52.549 | 7716.526 | 320.345 | 4549.700 | 31560.566 | 22052.543 | 58162.863 |
| 12-2016 | 114.939 | 17800.160 | 700.682 | 65.676 | 9644.151 | 400.370 | 5686.247 | 39444.645 | 27561.430 | 72692.297 |
| 12-2017 | 78.662 | 12182.042 | 479.531 | 44.947 | 6600.252 | 274.004 | 3891.543 | 26995.006 | 18862.451 | 49749.000 |
| 12-2018 | 56.993 | 8826.265 | 347.436 | 32.566 | 4782.093 | 198.525 | 2819.544 | 19558.771 | 13666.435 | 36044.746 |
| | | | | | | | | | | |
| 12-2019 | 46.206 | 7155.794 | 281.679 | 26.402 | 3877.023 | 160.951 | 2285.913 | 15857.042 | 11079.906 | 29222.842 |
| 12-2020 | 39.406 | 6102.697 | 240.226 | 22.517 | 3306.453 | 137.265 | 1949.505 | 13523.406 | 9449.306 | 24922.217 |
| 12-2021 | 34.636 | 5363.999 | 211.147 | 19.791 | 2906.224 | 120.650 | 1713.525 | 11886.456 | 8305.516 | 21905.492 |
| 12-2022 | 31.068 | 4811.355 | 189.393 | 17.752 | 2606.805 | 108.219 | 1536.984 | 10661.817 | 7449.817 | 19648.643 |
| 12-2023 | 28.279 | 4379.393 | 172.390 | 16.158 | 2372.763 | 98.503 | 1398.996 | 9704.614 | 6780.972 | 17884.580 |
| | | | | | | | | | | |
| 12-2024 | 26.028 | 4030.797 | 158.667 | 14.872 | 2183.895 | 90.663 | 1287.635 | 8932.122 | 6241.211 | 16460.971 |
| 12-2025 | 24.166 | 3742.518 | 147.320 | 13.809 | 2027.702 | 84.178 | 1195.544 | 8293.302 | 5794.843 | 15283.692 |
| 12-2026 | 22.597 | 3499.462 | 137.752 | 12.912 | 1896.014 | 78.712 | 1117.901 | 7754.699 | 5418.498 | 14291.104 |
| 12-2027 | 21.253 | 3291.287 | 129.558 | 12.144 | 1783.228 | 74.029 | 1051.401 | 7293.401 | 5096.180 | 13440.983 |
| 12-2028 | 20.120 | 3115.849 | 122.652 | 11.496 | 1688.173 | 70.083 | 995.355 | 6904.632 | 4824.523 | 12724.509 |
| | | | | | | | | | | |
| S TOT | 674.647 | 104479.859 | 4112.725 | 385.493 | 56607.391 | 2350.010 | 33376.012 | 231524.281 | 161774.688 | 426675.000 |
| | | | | | | | | | | |
| AFTER | 353.201 | 54698.793 | 2153.152 | 201.819 | 29635.916 | 1230.311 | 17473.492 | 121210.906 | 84694.617 | 223378.984 |
| | | | | | | | | | | |
| TOTAL | 1027.848 | 159178.656 | 6265.877 | 587.312 | 86243.312 | 3580.321 | 50849.504 | 352735.188 | 246469.312 | 650054.000 |
| --END-- | NET OIL | NET GAS | NET NGL | SEVERANCE | AD VALOREM | NET OPER | OPERATING | EQUITY | UNDISC NET | DISC NET |
| MO-YEAR | PRICE | PRICE | PRICE | TAXES | TAXES | EXPENSES | CASH FLOW | INVESTMENT | CASH FLOW | CASH FLOW |
| ------- | ---M$--- | ---M$--- | ---M$--- | -----M$---- | -----M$---- | ----M$---- | ----M$---- | ----M$---- | -----M$---- | -----M$---- |
| | | | | | | | | | | |
| 12-2014 | 86.58 | 4.09 | 68.84 | 161.035 | 806.682 | 3362.669 | 19910.703 | 56756.844 | -36846.148 | -35410.023 |
| 12-2015 | 86.58 | 4.09 | 68.84 | 386.380 | 1935.510 | 8608.683 | 47232.273 | 56182.695 | -8950.458 | -7973.347 |
| 12-2016 | 86.58 | 4.09 | 68.84 | 482.900 | 2419.014 | 11520.249 | 58270.145 | 32898.117 | 25372.057 | 19405.477 |
| 12-2017 | 86.58 | 4.09 | 68.84 | 330.486 | 1655.521 | 9188.992 | 38573.988 | 0.000 | 38573.988 | 27632.482 |
| 12-2018 | 86.58 | 4.09 | 68.84 | 239.448 | 1199.477 | 7641.883 | 26963.900 | 0.000 | 26963.900 | 17559.641 |
| | | | | | | | | | | |
| 12-2019 | 86.58 | 4.09 | 68.84 | 194.129 | 972.462 | 6906.530 | 21149.725 | 0.000 | 21149.725 | 12521.168 |
| 12-2020 | 86.58 | 4.09 | 68.84 | 165.560 | 829.348 | 6469.428 | 17457.881 | 0.000 | 17457.881 | 9395.918 |
| 12-2021 | 86.58 | 4.09 | 68.84 | 145.520 | 728.959 | 6184.893 | 14846.141 | 0.000 | 14846.141 | 7263.873 |
| 12-2022 | 86.58 | 4.09 | 68.84 | 130.527 | 653.856 | 5991.237 | 12872.992 | 0.000 | 12872.992 | 5725.878 |
| 12-2023 | 86.58 | 4.09 | 68.84 | 118.809 | 595.154 | 5857.071 | 11313.544 | 0.000 | 11313.544 | 4574.756 |
| | | | | | | | | | | |
| 12-2024 | 86.58 | 4.09 | 68.84 | 109.351 | 547.779 | 5764.457 | 10039.385 | 0.000 | 10039.385 | 3690.489 |
| 12-2025 | 86.58 | 4.09 | 68.84 | 101.531 | 508.602 | 5702.350 | 8971.216 | 0.000 | 8971.216 | 2998.025 |
| 12-2026 | 86.58 | 4.09 | 68.84 | 94.937 | 475.571 | 5585.466 | 8135.127 | 0.000 | 8135.127 | 2471.471 |
| 12-2027 | 86.58 | 4.09 | 68.84 | 89.289 | 447.281 | 5485.363 | 7419.042 | 0.000 | 7419.042 | 2049.022 |
| 12-2028 | 86.58 | 4.09 | 68.84 | 84.530 | 423.440 | 5400.999 | 6815.539 | 0.000 | 6815.539 | 1711.221 |
| | | | | | | | | | | |
| S TOT | 86.58 | 4.09 | 68.84 | 2834.433 | 14198.656 | 99670.266 | 309971.656 | 145837.641 | 164133.922 | 73616.055 |
| | | | | | | | | | | |
| AFTER | 86.58 | 4.09 | 68.84 | 1483.923 | 7433.485 | 129262.508 | 85199.086 | 1888.811 | 83310.281 | 9972.262 |
| | | | | | | | | | | |
| TOTAL | 86.58 | 4.09 | 68.84 | 4318.356 | 21632.141 | 228932.766 | 395170.750 | 147726.469 | 247444.188 | 83588.320 |
| | OIL | GAS | | | | P.W. % | P.W., M$ |
| | --------- | --------- | | | | ------ | -------- |
| GROSS WELLS | 0.0 | 139.0 | | LIFE, YRS. | 42.83 | 5.00 | 136375.953 |
| GROSS ULT., MB & MMF | 1027.848 | 159178.656 | | DISCOUNT % | 10.00 | 10.00 | 83588.328 |
| GROSS CUM., MB & MMF | 0.000 | 0.000 | | UNDISCOUNTED PAYOUT, YRS. | 3.53 | 15.00 | 53379.430 |
| GROSS RES., MB & MMF | 1027.848 | 159178.656 | | DISCOUNTED PAYOUT, YRS. | 3.87 | 20.00 | 33964.258 |
| NET RES., MB & MMF | 587.313 | 86243.352 | | UNDISCOUNTED NET/INVEST. | 2.68 | 25.00 | 20544.215 |
| NET REVENUE, M$ | 50849.547 | 352735.250 | | DISCOUNTED NET/INVEST. | 1.64 | 30.00 | 10813.058 |
| INITIAL PRICE, $ | 86.580 | 4.090 | | RATE-OF-RETURN, PCT. | 38.14 | 40.00 | -2086.993 |
| INITIAL N.I., PCT. | 57.140 | 57.140 | | INITIAL W.I., PCT. | 71.430 | 60.00 | -15022.593 |
| | | | | | | 80.00 | -20700.264 |
| | | | | | | 100.00 | -23389.502 |