
February 17, 2015
Mr. David Matheson
Chief Financial Officer, CF
O Dejour Energy (USA) Corp.
598, 999 Canada Place
Vancouver, BC
V6C 3E1
Canada
| Subject: | Reserve Estimate and Financial Forecast as to Dejour’s Interests in the Kokopelli Field Area, Garfield County, Colorado. |
|
Dear David:
As you requested, Gustavson Associates has completed reserves and economics as to Dejour Energy’s interests in future oil and gas production associated with the Kokopelli Field Area located in Garfield County. Reserves have been estimated based on analysis of analogous well production data. Estimates and projections have been made as of January 1, 2015. Reserves have been estimated in accordance with the US Securities and Exchange Commission’s (SEC) definitions and guidelines, and the report was prepared for the purpose of inclusion as an exhibit in a filing made with the SEC. This report was completed on February 17, 2015.
In general, Proved Developed Producing (PDP) reserves have been assigned to the four Kokopelli Federal wells, Proved Developed Non-Producing reserves were assigned to eight locations, and Proved Undeveloped (PUD) reserves have been assigned to 131 well locations. Gustavson is of the opinion that no current regulations, and no anticipated changes to regulations, would inhibit the ability of Dejour to recover the estimated reserves in the manner projected herein. It is our understanding that the reserves estimated herein represent all of Dejour’s US reserves.
The estimated net reserves volumes and associated net cash flow estimates are summarized in Table 1 below.
| 5757 Central Ave. | Suite D | Boulder, Co. 80301 USA | 1-303-443-2209 | FAX 1-303-443-3156 | http://www.gustavson.com |
Mr. David Matheson
February 17, 2015
Page 2
Table 1 Summary of Net Reserves and Projected Before Tax Cash Flow
Reserves Category
| Net Gas
Reserves,
MMcf | Net
Condensate
Reserves
(MBO) | Net NGL
Reserves
(MBO) | Before Tax Net Present Value,
thousands of US$ Discounted at |
| 0% | 10% | 15% |
| Proved Developed Producing | 136.1 | 0.9 | 7.9 | $773 | $447 | $376 |
| Proved Developed Non-Producing | 1,737.4 | 11.8 | 100.8 | $9,834 | $4,990 | $4,090 |
| Proved Undeveloped | 28,449.3 | 193.7 | 1,650.2 | $135,079 | $46,965 | $32,135 |
| Total Proved | 30,322.8 | 206.5 | 1,758.9 | $145,686 | $52,402 | $36,601 |
The portion of the Company’s total reserves represented by the reserves included in this report is shown below.
| LocationofReserves | | | | | | Proportion of |
| | | Gas | Condensate | NGL | OilEquivalent | Oil Equiv. |
| Country | Area | (MMCF) | (MBBL) | (MBBL) | (MBOE) | Reserves |
| United States | Colorado | 30,323 | 207 | 1,758 | 7,019 | 95% |
| Total Company | | | | | 7,417 | 100% |
Gustavson Associates has performed an evaluation of the reserves associated with both developed and undeveloped locations located in the Kokopelli Field Project Area, Garfield County, Colorado. Proved Developed Producing (PDP) Reserves have been assigned to the Federal 6/7-16-21, Federal 6/7-14-21, Federal 6/7-15-21, and Federal 6/7-13-21 wells, which began producing in July and August of 2013. Proved Developed Non-Producing reserves were assigned to eight wells which as of the effective date were waiting on completion. Proved Undeveloped reserves have been assigned to locations within the area delineated by successful wells and logged net pay, comprising of 131 locations. The 131 PUD locations, eight PDNP locations, and the four PDP locations are displayed in Figure 1.
Mr. David Matheson
February 17,
2015 Page 3
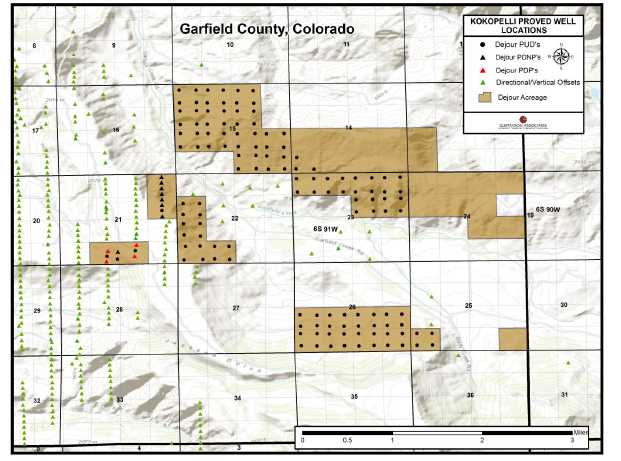
Figure 1 Map of Dejour PDP, PDNP, PUD, and Offset Well Locations
Dejour expects 18 wells to come on line in 2015 (eight PDNP and ten PUD). For the remainder of the drilling program, they expect 50 wells drilled per year for 2016 and 2017, and 21 in 2018. Although Coachman Energy is now the operator of this property, and plans a more conservative drilling schedule than Dejour, the Joint Operating Agreement (JOA) which has been signed by the Parties grants Dejour USA the right to nominate independent operations and continue drilling. The reserves and economic projections in this Report are based on the assumption that all wells are drilled according to Dejour’s schedule and that Coachman elects to participate.
The type curve utilized for the undeveloped locations was the same as that determined in the Dejour 2012 and 2013 Year End Reserve Report. No additional wells, other than the Dejour PDNP wells, have been drilled since the 2013 Report. The average EUR was based on the average composite performance of the total well production from each well. When the economic parameters were considered, this EUR was found to be approximately 1.15 BCF. This average reserve per well is dry gas after a shrinkage of 5% is deducted. The Proved Undeveloped location type curve can be found in Figure 2 below. The estimated net reserves volumes and associated net cash flow estimates are summarized in Table 1 above.
Mr. David Matheson
February 17, 2015
Page 4
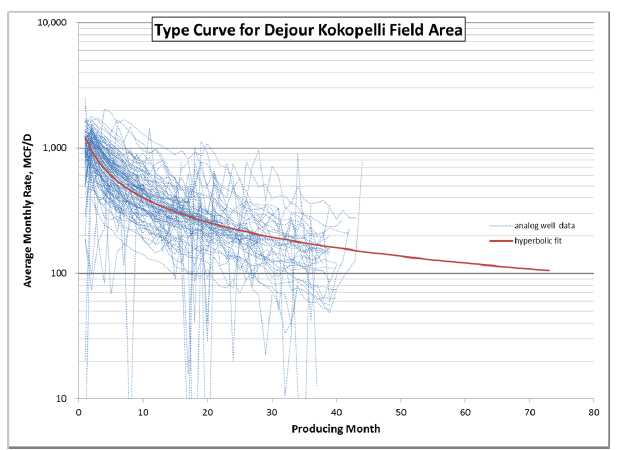
Figure 2 Composite Type Curve, Kokopelli Area
Oil and Gas Pricing
In order to determine the flat pricing in accordance with SEC guidelines, the Dejour’s revenue statements were analyzed. A differential was calculated based on the price that Dejour was paid versus the West Texas Intermediate (WTI) and Henry Hub (HH) spot prices averaged for that given month. These differentials were then applied to the WTI and HH spot prices for the first day of each month in 2014 in order to estimate prices for Dejour’s products on the first day of the month, per SEC guidelines. These values were averaged and applied in the cash flows presented herein.
The oil prices were determined to be 11% lower than WTI prices. Gas prices were determined to be 9% higher than Henry Hub prices. NGL’s were found to be sold at 82% the price of Dejour’s paid price for oil. The utilized flat hydrocarbon pricing can be found in the table below.
Mr. David Matheson
February 17, 2015
Page 5
| Flat Pricing For Effective date of January 1, 2015 |
| Oil, Gas & NGL Pricing Includes Differentials |
2014 Avg
WTI | 2014 Avg.
HH | Piceance
Oil, $/B | Piceance
Gas,
$/MCF
| Piceance
NGL, $/B |
|
|
| 94.56 | 4.55 | 84.16 | 4.98 | 69.01 |
Expenses
The drilling and completion costs utilized for the undeveloped locations is $1.53 million per well. Operating expenses for all locations was estimated at $2,500 per well. This is based on information provided by Dejour and is consistent with our experience with similar wells in the area. Severance tax and conservation taxes are deducted at the rate of 1.07% of revenue. County ad valorem tax was estimated at approximately 3.35% of revenue after discussion with Garfield County personnel. NGL yield of 55 Bbl/MMCF and condensate/gas ratio of 6.5 Bbl/MMCF were based on actual 2013 sales. Contractual gas transportation, gathering, and processing fees of $0.71/MCF were deducted as operating costs.
Capital and operating costs were held flat. Abandonment costs of $15,000 per well was assumed. Dejour’s interests in the PDNP and PUD properties are reported to be 25.0% working interest with a 20.0% royalty burden for net revenue interest of 20.0% . Dejour maintains a 7.25% working interest and 5.80% net revenue interest in the four Kokopelli PDP properties.
Detailed cash flow projections by category are shown in Table 2, Table 3, and Table 4 below.
Note that the NGL volumes shown in these tables represent total NGL sales as expected based on the revenue statements provided by the Client.1
Limiting Conditions and Disclaimers
The accuracy of any reserve report or resource evaluation is a function of available data and of engineering and geologic interpretation and judgment. While the evaluation presented herein is believed to be reasonable, it should be viewed with the understanding that subsequent reservoir performance or changes in pricing structure, market demand, or other economic parameters may justify its revision. The assumptions, data, methods, and procedures used are appropriate for the purpose served by the report. Gustavson has used all methods and procedures as we considered necessary under the circumstances to prepare the report.
Gustavson Associates, LLC, holds neither direct nor indirect financial interest in the subject property, the company operating the subject acreage, or in any other affiliated companies.
_______________________________________
1 In some previous reports, ethane and heavier NGLs were reported separately. Here they are reported together.
Mr. David Matheson
February 17, 2015
Page 6
All data and work files utilized in the preparation of this report are available for examination in our offices. Please contact us if we can be of assistance. We appreciate the opportunity to be of service and look forward to further serving Dejour Energy (USA) Corp.
Sincerely,

Letha C. Lencioni, P.E.
GUSTAVSON ASSOCIATES, LLC.
Vice-President, Petroleum Engineering
Registered Professional Engineer, State of Colorado, # 29506
Table 2 Summary Cash Flow Forecast, Proved Developed Producing Reserves
RESERVESANDECONOMICS
| TOTALPROVEDDEVELOPEDPRODUCING | DATE | : 01/13/2015 |
| KOKOPELLIFIELD | TIME | : 17:24:53 |
| GARFIELDCOUNTY,COLORADO | DBS | : Dejour1-12 |
| TOTHEINTERESTSOFDEJOURENERGY | SETTINGS | : SETDATA |
| SCENARIO | : Dejourflat |
EFFDATE : 01/2015
PWDATE : 01/2015
--END--
MO-YEAR | GROSS OIL
PRODUCTION
---MBBLS--- | GROSS GAS
PRODUCTION
---MMCF--- | GROSS NGL
PRODUCTION
---MBBLS--- | NET OIL
PRODUCTION
---MBBLS-- | NET GAS
PRODUCTION
----MMCF--- | NET NGLR
PODUCTION
---MBBLS-- | NET OIL
REVENUE
---M$--- | NET GAS
REVENUE
---M$--- | NET NGL
REVENUE
---M$--- | TOTAL
REVENUE
----M$--- |
| | | | | | | | | | | |
| 12-2015 | 1.818 | 281.560 | 15.486 | 0.105 | 15.485 | 0.898 | 8.875 | 77.113 | 61.983 | 147.971 |
| 12-2016 | 1.351 | 209.223 | 11.507 | 0.078 | 11.506 | 0.667 | 6.595 | 57.302 | 46.059 | 109.955 |
| 12-2017 | 1.097 | 169.933 | 9.346 | 0.064 | 9.346 | 0.542 | 5.356 | 46.541 | 37.409 | 89.306 |
| 12-2018 | 0.935 | 144.729 | 7.960 | 0.054 | 7.959 | 0.462 | 4.562 | 39.638 | 31.861 | 76.061 |
| 12-2019 | 0.820 | 126.978 | 6.984 | 0.048 | 6.983 | 0.405 | 4.002 | 34.776 | 27.953 | 66.732 |
| | | | | | | | | | | |
| 12-2020 | 0.734 | 113.696 | 6.253 | 0.043 | 6.253 | 0.363 | 3.584 | 31.139 | 25.029 | 59.752 |
| 12-2021 | 0.667 | 103.328 | 5.683 | 0.039 | 5.683 | 0.330 | 3.257 | 28.299 | 22.747 | 54.303 |
| 12-2022 | 0.613 | 94.975 | 5.224 | 0.036 | 5.223 | 0.303 | 2.994 | 26.012 | 20.908 | 49.913 |
| 12-2023 | 0.569 | 88.080 | 4.844 | 0.033 | 4.844 | 0.281 | 2.776 | 24.123 | 19.390 | 46.289 |
| 12-2024 | 0.531 | 82.276 | 4.525 | 0.031 | 4.525 | 0.262 | 2.593 | 22.534 | 18.112 | 43.239 |
| | | | | | | | | | | |
| 12-2025 | 0.499 | 77.313 | 4.252 | 0.029 | 4.252 | 0.247 | 2.437 | 21.174 | 17.020 | 40.631 |
| 12-2026 | 0.471 | 73.013 | 4.016 | 0.027 | 4.015 | 0.233 | 2.301 | 19.997 | 16.073 | 38.371 |
| 12-2027 | 0.447 | 69.238 | 3.808 | 0.026 | 3.808 | 0.221 | 2.182 | 18.963 | 15.242 | 36.387 |
| 12-2028 | 0.425 | 65.773 | 3.617 | 0.025 | 3.617 | 0.210 | 2.073 | 18.014 | 14.479 | 34.566 |
| 12-2029 | 0.403 | 62.484 | 3.437 | 0.023 | 3.436 | 0.199 | 1.969 | 17.113 | 13.755 | 32.838 |
| | | | | | | | | | | |
| S TOT | 11.381 | 1762.597 | 96.943 | 0.660 | 96.935 | 5.623 | 55.556 | 482.737 | 388.022 | 926.315 |
| | | | | | | | | | | |
| AFTER | 4.602 | 712.633 | 39.195 | 0.267 | 39.192 | 2.273 | 22.462 | 195.175 | 156.880 | 374.517 |
| | | | | | | | | | | |
| TOTAL | 15.983 | 2475.230 | 136.138 | 0.927 | 136.127 | 7.896 | 78.018 | 677.912 | 544.902 | 1300.832 |
--END--
MO-YEAR
------- | NET OIL
PRICE
---M$--- | NET GAS
PRICE
---M$--- | SEVERANCE
TAXES
-----M$---- | AD VALOREM
TAXES
-----M$---- | NET OPER
EXPENSES
----M$---- | OPERATING
CASH FLOW
----M$---- | EQUITY
INVESTMENT
----M$---- | UNDISC NET
CASH FLOW
-----M$---- | DISC NET
CASH FLOW
-----M$---- |
| | | | | | | | | | |
| 12-2015 | 84.16 | 4.98 | 1.583 | 4.904 | 22.794 | 118.690 | 0.000 | 118.690 | 113.166 |
| 12-2016 | 84.16 | 4.98 | 1.177 | 3.644 | 19.444 | 85.690 | 0.000 | 85.690 | 74.275 |
| 12-2017 | 84.16 | 4.98 | 0.956 | 2.960 | 17.711 | 67.680 | 0.000 | 67.680 | 53.331 |
| 12-2018 | 84.16 | 4.98 | 0.814 | 2.521 | 16.670 | 56.057 | 0.000 | 56.057 | 40.156 |
| 12-2019 | 84.16 | 4.98 | 0.714 | 2.212 | 15.995 | 47.811 | 0.000 | 47.811 | 31.136 |
| | | | | | | | | | |
| 12-2020 | 84.16 | 4.98 | 0.639 | 1.980 | 15.543 | 41.589 | 0.000 | 41.589 | 24.622 |
| 12-2021 | 84.16 | 4.98 | 0.581 | 1.800 | 15.237 | 36.686 | 0.000 | 36.686 | 19.744 |
| 12-2022 | 84.16 | 4.98 | 0.534 | 1.654 | 15.033 | 32.692 | 0.000 | 32.692 | 15.995 |
| 12-2023 | 84.16 | 4.98 | 0.495 | 1.534 | 14.904 | 29.356 | 0.000 | 29.356 | 13.057 |
| 12-2024 | 84.16 | 4.98 | 0.463 | 1.433 | 14.833 | 26.510 | 0.000 | 26.510 | 10.720 |
| | | | | | | | | | |
| 12-2025 | 84.16 | 4.98 | 0.435 | 1.347 | 14.807 | 24.042 | 0.000 | 24.042 | 8.838 |
| 12-2026 | 84.16 | 4.98 | 0.411 | 1.272 | 14.597 | 22.091 | 0.000 | 22.091 | 7.383 |
| 12-2027 | 84.16 | 4.98 | 0.389 | 1.206 | 14.413 | 20.379 | 0.000 | 20.379 | 6.191 |
| 12-2028 | 84.16 | 4.98 | 0.370 | 1.146 | 14.244 | 18.807 | 0.000 | 18.807 | 5.194 |
| 12-2029 | 84.16 | 4.98 | 0.351 | 1.088 | 14.083 | 17.315 | 0.000 | 17.315 | 4.347 |
| | | | | | | | | | |
| S TOT | 84.16 | 4.98 | 9.912 | 30.700 | 240.310 | 645.394 | 0.000 | 645.394 | 428.156 |
| | | | | | | | | | |
| AFTER | 84.16 | 4.98 | 4.007 | 12.412 | 226.263 | 131.834 | 4.350 | 127.484 | 19.167 |
| | | | | | | | | | |
| TOTAL | 84.16 | 4.98 | 13.919 | 43.112 | 466.573 | 777.228 | 4.350 | 772.878 | 447.323 |
| | OIL | GAS | | | | P.W. % | P.W., M$ |
| | --------- | --------- | | | | ------ | -------- |
| GROSS WELLS | 0.0 | 4.0 | | LIFE, YRS. | 39.33 | 5.00 | 562.113 |
| GROSS ULT., MB& MMF | 20.854 | 3369.340 | | DISCOUNT % | 10.00 | 9.00 | 465.777 |
| GROSS CUM., MB& MMF | 4.871 | 894.109 | | UNDISCOUNTED PAYOUT, YRS. | 0.00 | 10.00 | 447.323 |
| GROSS RES., MB& MMF | 15.983 | 2475.230 | | DISCOUNTED PAYOUT, YRS. | 0.00 | 15.00 | 376.174 |
| NET RES., MB& MMF | 0.927 | 136.127 | | UNDISCOUNTED NET/INVEST. | 178.67 | 20.00 | 327.775 |
| NET REVENUE, M$ | 78.018 | 677.912 | | DISCOUNTED NET/INVEST. | 2055.59 | 25.00 | 292.579 |
| INITIAL PRICE,$ | 84.160 | 4.980 | | RATE-OF-RETURN, PCT. | 90.00 | 35.00 | 244.424 |
| INITIAL N.I., PCT. | 5.800 | 5.800 | | INITIAL W.I., PCT. | 7.250 | 50.00 | 200.428 |
| | | | | | | | 70.00 | 165.510 |
| | | | | | | | 90.00 | 143.307 |
Table 3 Summary Cash Flow Forecast, Proved Developed Non-Producing Reserves
| TOTAL PROVED DEVELOPED NON-PRODUCING | DATE | : 01/13/2015 |
| KOKOPELLI FIELD | TIME | : 17:24:55 |
| GARFIELD COUNTY, COLORADO | DBS | : Dejour1-12 |
| TO THE INTERESTS OF DEJOUR ENERGY | SETTINGS : SETDATA |
| | SCENARIO : Dejour flat |
R E S E R V E S A N D E C O N O M I C S
EFF DATE : 01/2015
PW DATE : 01/2015
--END--
MO-YEAR | GROSS OIL
PRODUCTION
---MBBLS--- | GROSS GAS
PRODUCTION
----MMCF--- | GROSS NGL
PRODUCTION
---MBBLS--- | NET OIL
PRODUCTION
---MBBLS-- | NET GAS
PRODUCTION
----MMCF--- | NET NGL
PRODUCTION
--------MBBLS---- | NET OIL
REVENUE
---M$--- | NET GAS
REVENUE
---M$--- | NET NGL
REVENUE
---M$--- | TOTAL
REVENUE
----M$--- |
| | | | | | | | | | | |
| 12-2015 | 10.324 | 1598.792 | 87.934 | 2.065 | 303.195 | 17.587 | 173.769 | 1509.911 | 1213.658 | 2897.338 |
| 12-2016 | 5.611 | 868.888 | 47.789 | 1.122 | 164.776 | 9.558 | 94.437 | 820.585 | 659.582 | 1574.604 |
| 12-2017 | 3.832 | 593.446 | 32.640 | 0.766 | 112.541 | 6.528 | 64.500 | 560.455 | 450.491 | 1075.447 |
| 12-2018 | 3.000 | 464.584 | 25.552 | 0.600 | 88.104 | 5.110 | 50.495 | 438.757 | 352.671 | 841.922 |
| 12-2019 | 2.502 | 387.519 | 21.314 | 0.500 | 73.489 | 4.263 | 42.119 | 365.976 | 294.170 | 702.264 |
| | | | | | | | | | | |
| 12-2020 | 2.166 | 335.447 | 18.450 | 0.433 | 63.614 | 3.690 | 36.459 | 316.799 | 254.641 | 607.899 |
| 12-2021 | 1.921 | 297.547 | 16.365 | 0.384 | 56.427 | 3.273 | 32.340 | 281.005 | 225.871 | 539.216 |
| 12-2022 | 1.734 | 268.538 | 14.770 | 0.347 | 50.926 | 2.954 | 29.187 | 253.609 | 203.850 | 486.645 |
| 12-2023 | 1.585 | 245.510 | 13.503 | 0.317 | 46.559 | 2.701 | 26.684 | 231.862 | 186.369 | 444.915 |
| 12-2024 | 1.464 | 226.719 | 12.470 | 0.293 | 42.995 | 2.494 | 24.642 | 214.116 | 172.105 | 410.862 |
| | | | | | | | | | | |
| 12-2025 | 1.363 | 211.049 | 11.608 | 0.273 | 40.023 | 2.322 | 22.938 | 199.317 | 160.210 | 382.464 |
| 12-2026 | 1.277 | 197.751 | 10.876 | 0.255 | 37.502 | 2.175 | 21.493 | 186.758 | 150.115 | 358.365 |
| 12-2027 | 1.203 | 186.302 | 10.247 | 0.241 | 35.330 | 2.049 | 20.249 | 175.945 | 141.424 | 337.618 |
| 12-2028 | 1.139 | 176.338 | 9.699 | 0.228 | 33.441 | 1.940 | 19.166 | 166.535 | 133.860 | 319.561 |
| 12-2029 | 1.094 | 169.458 | 9.320 | 0.219 | 32.136 | 1.864 | 18.418 | 160.037 | 128.637 | 307.092 |
| | | | | | | | | | | |
| S TOT | 40.215 | 6227.889 | 342.534 | 8.043 | 1181.058 | 68.507 | 676.894 | 5881.667 | 4727.651 | 11286.212 |
| | | | | | | | | | | |
| AFTER | 18.942 | 2933.473 | 161.341 | 3.788 | 556.304 | 32.268 | 318.832 | 2770.396 | 2226.828 | 5316.057 |
| | | | | | | | | | | |
| TOTAL | 59.157 | 9161.362 | 503.875 | 11.831 | 1737.362 | 100.775 | 995.726 | 8652.063 | 6954.480 | 16602.268 |
--END--
MO-YEAR
------- | NET OIL
PRICE
---M$--- | NET GASP
RICE
---M$--- | NET NGL
---M$--- | SEVERANCE
TAXES
-----M$---- | AD VALOREM
TAXES
-----M$---- | NET OPER
EXPENSES
----M$---- | OPERATINGCASH FLOW
----M$---- | EQUITY
INVESTMENT
----M$---- | UNDISC NET
CASH FLOW
-----M$---- | DISC NET
CASH FLOW
-----M$---- |
| | | | | | | | | | | |
| 12-2015 | 84.16 | 4.98 | 69.01 | 31.002 | 96.022 | 321.106 | 2449.210 | 1500.000 | 949.209 | 816.755 |
| 12-2016 | 84.16 | 4.98 | 69.01 | 16.848 | 52.185 | 209.911 | 1295.660 | 0.000 | 1295.660 | 1123.057 |
| 12-2017 | 84.16 | 4.98 | 69.01 | 11.507 | 35.642 | 164.826 | 863.471 | 0.000 | 863.471 | 680.403 |
| 12-2018 | 84.16 | 4.98 | 69.01 | 9.009 | 27.903 | 144.437 | 660.574 | 0.000 | 660.574 | 473.202 |
| 12-2019 | 84.16 | 4.98 | 69.01 | 7.514 | 23.274 | 132.791 | 538.685 | 0.000 | 538.685 | 350.806 |
| | | | | | | | | | | |
| 12-2020 | 84.16 | 4.98 | 69.01 | 6.505 | 20.147 | 125.379 | 455.869 | 0.000 | 455.869 | 269.886 |
| 12-2021 | 84.16 | 4.98 | 69.01 | 5.770 | 17.870 | 120.378 | 395.197 | 0.000 | 395.197 | 212.697 |
| 12-2022 | 84.16 | 4.98 | 69.01 | 5.207 | 16.128 | 116.902 | 348.408 | 0.000 | 348.408 | 170.468 |
| 12-2023 | 84.16 | 4.98 | 69.01 | 4.761 | 14.745 | 114.460 | 310.949 | 0.000 | 310.949 | 138.309 |
| 12-2024 | 84.16 | 4.98 | 69.01 | 4.396 | 13.617 | 112.761 | 280.089 | 0.000 | 280.089 | 113.257 |
| | | | | | | | | | | |
| 12-2025 | 84.16 | 4.98 | 69.01 | 4.092 | 12.675 | 111.615 | 254.081 | 0.000 | 254.081 | 93.401 |
| 12-2026 | 84.16 | 4.98 | 69.01 | 3.835 | 11.877 | 109.377 | 233.277 | 0.000 | 233.277 | 77.957 |
| 12-2027 | 84.16 | 4.98 | 69.01 | 3.613 | 11.189 | 107.450 | 215.366 | 0.000 | 215.366 | 65.429 |
| 12-2028 | 84.16 | 4.98 | 69.01 | 3.419 | 10.591 | 105.773 | 199.778 | 0.000 | 199.778 | 55.175 |
| 12-2029 | 84.16 | 4.98 | 69.01 | 3.286 | 10.178 | 104.615 | 189.014 | 0.000 | 189.014 | 47.457 |
| | | | | | | | | | | |
| S TOT | 84.16 | 4.98 | 69.01 | 120.762 | 374.043 | 2101.782 | 8689.627 | 1500.000 | 7189.627 | 4688.261 |
| | | | | | | | | | | |
| AFTER | 84.16 | 4.98 | 69.01 | 56.882 | 176.182 | 2408.765 | 2674.228 | 30.000 | 2644.228 | 301.339 |
| | | | | | | | | | | |
| TOTAL | 84.16 | 4.98 | 69.01 | 177.644 | 550.225 | 4510.547 | 11363.855 | 1530.000 | 9833.855 | 4989.600 |
| | OIL | GAS | | | | P.W. % | P.W., M$ |
| | --------- | --------- | | | | ------ | -------- |
| GROSS WELLS | 0.0 | 8.0 | | LIFE, YRS. | 40.17 | 5.00 | 6531.031 |
| GROSS ULT., MB& MMF | 59.157 | 9161.361 | | DISCOUNT % | 10.00 | 9.00 | 5228.272 |
| GROSS CUM., MB& MMF | 0.000 | 0.000 | | UNDISCOUNTED PAYOUT, YRS. | 0.61 | 10.00 | 4989.601 |
| GROSS RES., MB& MMF | 59.157 | 9161.361 | | DISCOUNTED PAYOUT, YRS. | 0.65 | 15.00 | 4089.732 |
| NET RES., MB& MMF | 11.831 | 1737.362 | | UNDISCOUNTED NET/INVEST. | 7.43 | 20.00 | 3484.615 |
| NET REVENUE, M$ | 995.726 | 8652.065 | | DISCOUNTED NET/INVEST. | 4.32 | 25.00 | 3040.378 |
| INITIAL PRICE,$ | 84.160 | 4.980 | | RATE-OF-RETURN, PCT. | 90.00 | 35.00 | 2416.311 |
| INITIAL N.I., PCT. | 20.000 | 20.000 | | INITIAL W.I., PCT. | 25.000 | 50.00 | 1817.933 |
| | | | | | | | 70.00 | 1314.538 |
| | | | | | | | 90.00 | 977.226 |
Table 4 Summary Cash Flow Forecast, Proved Undeveloped Reserves
| TOTAL PROVED UNDEVELOPED | DATE | : 01/13/2015 |
| KOKOPELLI FIELD | TIME | : 17:25:21 |
| GARFIELD COUNTY, COLORADO | DBS | : Dejour1-12 |
| TO THE INTERESTS OF DEJOUR ENERGY | SETTINGS | : SETDATA |
| | SCENARIO | : Dejour flat |
R E S E R V E S A N D E C O N O M I C S
EFF DATE: 01/2015
PW DATE : 01/2015
| --END-- MO-YEAR | GROSS OIL
PRODUCTION
---MBBLS--- | GROSS GAS
PRODUCTION
----MMCF--- | GROSS NGL
PRODUCTION
---MBBLS--- | NET OIL
PRODUCTION
---MBBLS-- | NET GAS
PRODUCTION
----MMCF---- | NET NGL
PRODUCTION
---MBBLS--- | NET OIL
REVENUE
---M$--- | NET GAS
REVENUE
---M$--- | NET NGL
REVENUE
---M$--- | TOTAL
REVENUE
----M$--- |
|
| | | | | | | | | | | |
| 12-2015 | 7.107 | 1100.595 | 60.533 | 1.421 | 208.717 | 12.107 | 119.621 | 1039.411 | 835.472 | 1994.504 |
| 12-2016 | 50.897 | 7882.173 | 433.520 | 10.179 | 1494.777 | 86.704 | 856.694 | 7443.986 | 5983.433 | 14284.113 |
| 12-2017 | 93.482 | 14477.158 | 796.243 | 18.696 | 2745.452 | 159.249 | 1573.487 | 13672.347 | 10989.758 | 26235.586 |
| 12-2018 | 103.700 | 16059.593 | 883.278 | 20.740 | 3045.545 | 176.656 | 1745.478 | 15166.811 | 12190.998 | 29103.293 |
| 12-2019 | 66.600 | 10314.058 | 567.273 | 13.320 | 1955.959 | 113.455 | 1121.009 | 9740.679 | 7829.499 | 18691.197 |
| | | | | | | | | | | |
| 12-2020 | 50.354 | 7798.125 | 428.897 | 10.071 | 1478.838 | 85.779 | 847.559 | 7364.614 | 5919.633 | 14131.805 |
| 12-2021 | 41.508 | 6428.142 | 353.548 | 8.302 | 1219.034 | 70.709 | 698.659 | 6070.786 | 4879.663 | 11649.107 |
| 12-2022 | 35.736 | 5534.318 | 304.388 | 7.147 | 1049.529 | 60.878 | 601.512 | 5226.656 | 4201.158 | 10029.321 |
| 12-2023 | 31.607 | 4894.853 | 269.217 | 6.321 | 928.261 | 53.843 | 532.010 | 4622.738 | 3715.732 | 8870.479 |
| 12-2024 | 28.477 | 4410.133 | 242.557 | 5.695 | 836.338 | 48.511 | 479.326 | 4164.967 | 3347.774 | 7992.063 |
| | | | | | | | | | | |
| 12-2025 | 26.007 | 4027.657 | 221.521 | 5.201 | 763.806 | 44.304 | 437.757 | 3803.754 | 3057.435 | 7298.943 |
| 12-2026 | 24.000 | 3716.773 | 204.423 | 4.800 | 704.849 | 40.885 | 403.967 | 3510.154 | 2821.440 | 6735.560 |
| 12-2027 | 22.330 | 3458.222 | 190.202 | 4.466 | 655.818 | 38.040 | 375.866 | 3265.974 | 2625.171 | 6267.008 |
| 12-2028 | 20.916 | 3239.228 | 178.158 | 4.183 | 614.288 | 35.632 | 352.064 | 3059.155 | 2458.932 | 5870.149 |
| 12-2029 | 19.707 | 3051.928 | 167.856 | 3.941 | 578.768 | 33.571 | 331.707 | 2882.267 | 2316.750 | 5530.725 |
| | | | | | | | | | | |
| S TOT | 622.428 | 96392.969 | 5301.611 | 124.486 | 18279.979 | 1060.323 | 10476.715 | 91034.289 | 73172.844 | 174683.844 |
| | | | | | | | | | | |
| AFTER | 346.263 | 53624.324 | 2949.338 | 69.253 | 10169.327 | 589.868 | 5828.298 | 50643.254 | 40706.770 | 97178.320 |
| | | | | | | | | | | |
| TOTAL | 968.691 | 150017.297 | 8250.949 | 193.738 | 28449.305 | 1650.190 | 16305.014 | 141677.531 | 113879.609 | 271862.156 |
--END--
MO-YEAR | NET OILPRICE | NET GASPRICE | NET NGLPRICE | SEVERANCE
TAXES
-----M$---- | AD VALOREM
TAXES
-----M$---- | NET OPER
EXPENSES
----M$---- | OPERATING
CASH FLOW
----M$---- | EQUITY
INVESTMENT
----M$---- | UNDISC NET
CASH FLOW
-----M$---- | DISC NET
CASH FLOW
-----M$---- |
| | | | | | | | | | | |
| 12-2015 | 84.16 | 4.98 | 69.01 | 21.341 | 66.101 | 214.498 | 1692.564 | 5355.000 | -3662.436 | -3450.662 |
| 12-2016 | 84.16 | 4.98 | 69.01 | 152.840 | 473.398 | 1589.927 | 12067.955 | 19125.000 | -7057.045 | -6199.698 |
| 12-2017 | 84.16 | 4.98 | 69.01 | 280.721 | 869.489 | 3111.077 | 21974.305 | 19125.000 | 2849.305 | 2169.974 |
| 12-2018 | 84.16 | 4.98 | 69.01 | 311.405 | 964.528 | 3744.206 | 24083.162 | 6502.500 | 17580.662 | 12423.097 |
| 12-2019 | 84.16 | 4.98 | 69.01 | 199.996 | 619.455 | 2842.368 | 15029.364 | 0.000 | 15029.364 | 9787.539 |
| | | | | | | | | | | |
| 12-2020 | 84.16 | 4.98 | 69.01 | 151.210 | 468.350 | 2441.051 | 11071.193 | 0.000 | 11071.193 | 6554.428 |
| 12-2021 | 84.16 | 4.98 | 69.01 | 124.645 | 386.069 | 2233.048 | 8905.350 | 0.000 | 8905.350 | 4792.901 |
| 12-2022 | 84.16 | 4.98 | 69.01 | 107.314 | 332.387 | 2105.636 | 7483.988 | 0.000 | 7483.988 | 3661.743 |
| 12-2023 | 84.16 | 4.98 | 69.01 | 94.914 | 293.982 | 2021.494 | 6460.093 | 0.000 | 6460.093 | 2873.430 |
| 12-2024 | 84.16 | 4.98 | 69.01 | 85.515 | 264.869 | 1963.865 | 5677.820 | 0.000 | 5677.820 | 2295.889 |
| | | | | | | | | | | |
| 12-2025 | 84.16 | 4.98 | 69.01 | 78.099 | 241.898 | 1923.925 | 5055.027 | 0.000 | 5055.027 | 1858.232 |
| 12-2026 | 84.16 | 4.98 | 69.01 | 72.070 | 223.227 | 1871.601 | 4568.658 | 0.000 | 4568.658 | 1526.768 |
| 12-2027 | 84.16 | 4.98 | 69.01 | 67.057 | 207.698 | 1828.086 | 4164.168 | 0.000 | 4164.168 | 1265.085 |
| 12-2028 | 84.16 | 4.98 | 69.01 | 62.811 | 194.546 | 1791.227 | 3821.566 | 0.000 | 3821.566 | 1055.455 |
| 12-2029 | 84.16 | 4.98 | 69.01 | 59.179 | 183.297 | 1759.704 | 3528.543 | 0.000 | 3528.543 | 885.935 |
| | | | | | | | | | | |
| S TOT | 84.16 | 4.98 | 69.01 | 1869.118 | 5789.294 | 31441.715 | 135583.750 | 50107.500 | 85476.258 | 41500.121 |
| | | | | | | | | | | |
| AFTER | 84.16 | 4.98 | 69.01 | 1039.808 | 3220.640 | 42823.906 | 50093.957 | 491.250 | 49602.703 | 5464.974 |
| | | | | | | | | | | |
| TOTAL | 84.16 | 4.98 | 69.01 | 2908.926 | 9009.934 | 74265.625 | 185677.703 | 50598.754 | 135078.953 | 46965.094 |
| | OIL | GAS | | | | P.W. % | P.W., M$ |
| | --------- | --------- | | | | ------ | -------- |
| GROSS WELLS | 0.0 | 131.0 | | LIFE, YRS. | 43.42 | 5.00 | 74002.109 |
| GROSS ULT., MB& MMF | 968.692 | 150017.297 | | DISCOUNT % | 10.00 | 9.00 | 51044.828 |
| GROSS CUM., MB& MMF | 0.000 | 0.000 | | UNDISCOUNTED PAYOUT, YRS. | 3.45 | 10.00 | 46965.062 |
| GROSS RES., MB& MMF | 968.692 | 150017.297 | | DISCOUNTED PAYOUT, YRS. | 3.60 | 15.00 | 32135.258 |
| NET RES., MB& MMF | 193.738 | 28449.275 | | UNDISCOUNTED NET/INVEST. | 3.67 | 20.00 | 22871.256 |
| NET REVENUE, M$ | 16305.020 | 141677.781 | | DISCOUNTED NET/INVEST. | 2.13 | 25.00 | 16607.828 |
| INITIAL PRICE,$ | 84.160 | 4.980 | | RATE-OF-RETURN, PCT. | 66.07 | 35.00 | 8868.545 |
| INITIAL N.I., PCT. | 20.000 | 20.000 | | INITIAL W.I., PCT. | 25.000 | 50.00 | 2977.239 |
| | | | | | | | 70.00 | -544.630 |
| | | | | | | | 90.00 | -2093.737 |