
February 25, 2016
Mr. David Matheson
Chief Financial Officer, CFO
Dejour Energy (USA) Corp.
598, 999 Canada Place
Vancouver, BC
V6C 3E1
Canada
| Subject: | Reserve Estimate and Financial Forecast as to Dejour’s Interests in the Kokopelli Field Area, Garfield County, Colorado. |
Dear David:
As you requested, Gustavson Associates has completed reserves and economics as to Dejour Energy’s interests in future oil and gas production associated with the Kokopelli Field Area located in Garfield County. Reserves have been estimated based on analysis of analogous well production data. Estimates and projections have been made as of January 1, 2016. Reserves have been estimated in accordance with the US Securities and Exchange Commission’s (SEC) definitions and guidelines, and the report was prepared for the purpose of inclusion as an exhibit in a filing made with the SEC. This report was completed on February 25, 2016.
In general, Proved Developed Producing (PDP) reserves and Proved Developed Non-Producing reserves were assigned to the 12 producing wells (shown in Table 2), and Proved Undeveloped (PUD) reserves have been assigned to 131 well locations. Gustavson is of the opinion that no current regulations, and no anticipated changes to regulations, would inhibit the ability of Dejour to recover the estimated reserves in the manner projected herein. It is our understanding that the reserves estimated herein represent all of Dejour’s US reserves.
The estimated net reserves volumes and associated net cash flow estimates are summarized in Table 1 below.
Mr. David Matheson
February 25, 2016
Page 2
Table 1 Summary of Net Reserves and Projected Before Tax Cash Flow
| Reserves Category | Net Gas
Reserves,
MMcf | Net Condensate
Reserves (MBO) | Net NGL
Reserves
(MBO) | Before Tax Net Present Value,
thousands of US$ Discounted at |
| 0% | 10% | 15% |
Proved Developed
Producing | 1,197.1 | 3.9 | 34.6 | $1,596 | $1,228 | $1,113 |
Proved Developed
Non-Producing | 284.4 | 1.7 | 14.7 | $515 | $388 | $346 |
Proved
Undeveloped | - | - | - | $0 | $0 | $0 |
| Total Proved | 1,481.6 | 5.6 | 49.3 | $2,111 | $1,616 | $1,459 |
The portion of the Company’s total reserves represented by the reserves included in this report is shown below.
| Location of Reserves | | | | | | |
| | | | | | Oil | Proportion of |
| | | Gas | Condensate | NGL | Equivalent | Oil Equiv. |
| Country | Area | (MMCF) | (MBBL) | (MBBL) | (MBOE) | Reserves |
| United States | Colorado | 1,482 | 6 | 49 | 302 | 60% |
| Total Company | | | | | 503 | 100% |
Gustavson Associates has performed an evaluation of the reserves associated with both developed and undeveloped locations located in the Kokopelli Field Project Area, Garfield County, Colorado. Proved Developed Producing (PDP) Reserves have been assigned to 12 wells (shown in Table 2). The first four wells began producing in July and August of 2013 and next eight wells began producing in September 2015. All these wells are completed in the Williams Fork member of the Mesaverde formation except for one of the new wells, the Federal 14/15-7-21, which is completed in the Mancos shale. Logs over the Williams Fork interval in these well were reviewed and found to indicate similar response in the target formations to the response in analogous producing wells. Incremental Proved Developed Non-Producing (PDNP) reserves have been assigned to Federal 14/15-1-21, Federal 14/15-2-21, Federal 14/15-3-21 and Federal 14/15-8-21, which have been producing under capacity due to limited water disposal capacity during cleanup of the hydraulic fracturing treatments, but are estimated to produce at the type curve rate in three months. Note that the total expected performance of these wells was forecast as Total Proved Developed, and the PDNP reserves and economics were determined by taking the difference between Total Proved Developed and PDP.
Mr. David Matheson
February 25, 2016
Page 3
The PDNP and PDP locations are displayed in Figure 1 and Figure 2. The property has additional upside which has not been included in this report. Under current economic conditions, drilling of offset locations in the Williams Fork or Mancos formation does not generate positive economics; therefore, no PUD reserves have been assigned.
Table 2 Summary of PDP Wells
| Well Name | Working Interest | Revenue Interest | Producing Formation |
| 1. Federal 6/7-16-21 | 5.5573% | 4.4458% | Williams Fork |
| 2. Federal 6/7-15-21 | 7.7780% | 6.6624% | Williams Fork |
| 3. Federal 6/7-14-21 | 7.7780% | 6.6624% | Williams Fork |
| 4. Federal 6/7-13-21 | 7.7780% | 6.6624% | Williams Fork |
| 5. Federal 14/15-1-21 | 25.00% | 20.00% | Williams Fork |
| 6. Federal 14/15-2-21 | 25.00% | 20.00% | Williams Fork |
| 7. Federal 14/15-3-21 | 25.00% | 20.00% | Williams Fork |
| 8. Federal 14/15-4-21 | 25.00% | 20.00% | Williams Fork |
| 9. Federal 14/15-5-21 | 25.00% | 20.00% | Williams Fork |
| 10. Federal 14/15-6-21 | 25.00% | 20.00% | Williams Fork |
| 11. Federal 14/15-7-21 | 25.00% | 20.00% | Mancos |
| 12. Federal 14/15-8-21 | 25.00% | 20.00% | Williams Fork |
Mr. David Matheson
February 25, 2016
Page 4
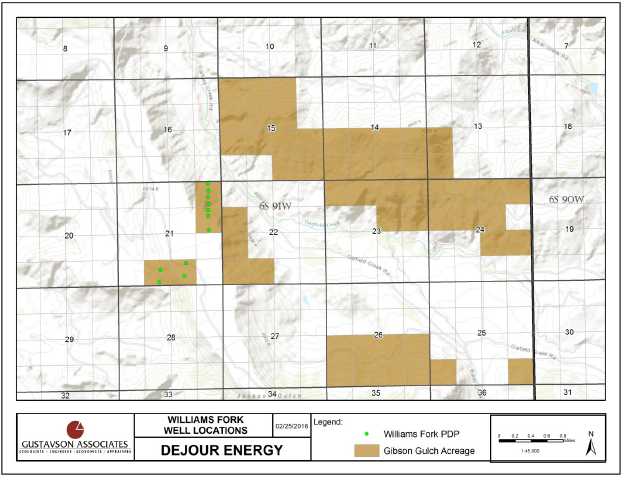
Figure 1 Map of Dejour Williams Fork Wells
Mr. David Matheson
February 25, 2016
Page 5
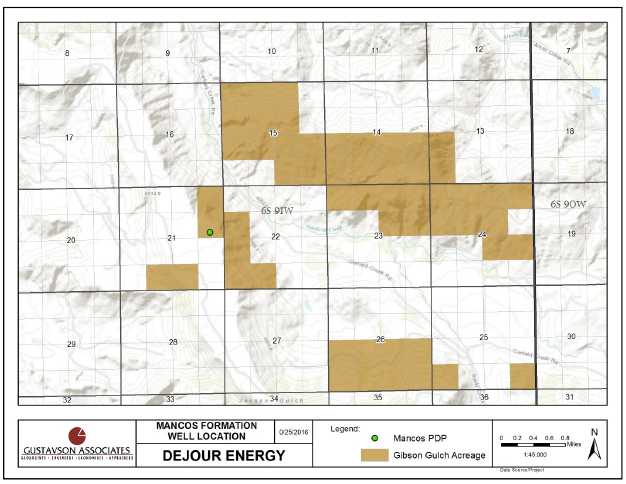
Figure 2 Map of Dejour Mancos PDP Location
Oil and Gas Pricing
In order to determine the flat pricing in accordance with SEC guidelines, the Dejour’s revenue statements were analyzed. For Williams Fork wells, a differential was calculated based on the price that Dejour was paid versus the West Texas Intermediate (WTI) and Henry Hub (HH) spot prices averaged for that given month. While no revenue statement was available for the Mancos well, the Mancos wellhead price differential was estimated by comparing the BTU content to the Williams Fork gas’s BTU content obtained from gas composition analysis. These differentials were then applied to the WTI and HH spot prices for the first day of each month in 2015 in order to estimate prices for Dejour’s products on the first day of the month, per SEC guidelines. These values were averaged and applied in the cash flows presented herein.
For Williams Fork wells, the wellhead gas price was estimated at 103% of NYMEX Henry Hub gas and the NGL price was found to be a factor of 8.373 times the wellhead gas price. The Williams Fork wellhead condensate prices were determined to be 20% lower than WTI prices. For the Mancos wells, the wellhead gas price was estimated at 98% of NYMEX Henry Hub gas.
Mr. David Matheson
February 25, 2016
Page 6
The utilized flat hydrocarbon pricings for Williams Fork and Mancos can be found in Table 3 and Table 4, respectively.
Table 3 Flat Pricing for Williams Fork Wells
| Flat Pricing For Effective date of January 1, 2016 |
| Oil, Gas & NGL Pricing Includes Differentials |
2015 Avg
WTI
| 2015
Avg. HH
| Williams
Fork Oil,
$/B
| Williams
Fork
Gas,
$/MCF | Williams
Fork
NGL, $/B |
|
|
|
|
|
| 50.00 | 2.62 | 39.84 | 2.71 | 21.91 |
Table 4 Flat Pricing for Mancos Wells
| Flat Pricing For Effective date of January 1, 2016 |
| Oil, Gas & NGL Pricing Includes Differentials |
2015 Avg
WTI
| 2015
Avg. HH
| Mancos
Oil, $/B
| Mancos
Gas,
$/MCF | Mancos
NGL, $/B
|
|
|
|
|
| 50.00 | 2.62 | - | 2.57 | - |
Expenses
Operating costs are expected to be $2,800 per well per month for Williams Fork wells and $5,000 per well per month for the Mancos well. This is based on information provided by the Dejour and is consistent with our experience with similar wells in the area. The drilling and completion costs reflects economies of scale and contractual advantages expected to be gained when a large drilling program is executed. Severance tax is deducted at the rate of 1.04% of revenue. County ad valorem tax was estimated at approximately 3.91% of revenue after discussion with Garfield County personnel. Conservation tax was estimated at 0.072% and the annual property tax was estimated as 0.557% of net revenue. Note that Conservation tax rate and property tax are lumped together with Severance tax and Ad Valorem tax in the economics evaluation, respectively. For Williams Fork Wells only, NGL yield of 48 Bbl/MMCF and condensate/gas ratio of 5.0 Bbl/MMCF were based on actual 2015 sales. No condensate or NGL production is expected for the Mancos well. Contractual gas transportation, gathering, and processing fees of $0.71/MCF were deducted as operating costs for both Williams Fork and Mancos wells. Condensate trucking fee of $1.50/Bbl was also applied to the Williams Fork wells. Abandonment costs of $15,000 per well were estimated. All costs were held flat.
Detailed cash flow projections by category are shown in Table 5 and Table 6 below. Note that the NGL volumes shown in these tables represent total NGL sales as expected based on the revenue statements provided by the Client.1
________________________________________
1In some previous reports, ethane and heavier NGLs were reported separately. Here they are reported together.
Mr. David Matheson
February 25, 2016
Page 7
Limiting Conditions and Disclaimers
The accuracy of any reserve report or resource evaluation is a function of available data and of engineering and geologic interpretation and judgment. While the evaluation presented herein is believed to be reasonable, it should be viewed with the understanding that subsequent reservoir performance or changes in pricing structure, market demand, or other economic parameters may justify its revision. The assumptions, data, methods, and procedures used are appropriate for the purpose served by the report. Gustavson has used all methods and procedures as we considered necessary under the circumstances to prepare the report.
Gustavson Associates, LLC, holds neither direct nor indirect financial interest in the subject property, the company operating the subject acreage, or in any other affiliated companies.
All data and work files utilized in the preparation of this report are available for examination in our offices. Please contact us if we can be of assistance. We appreciate the opportunity to be of service and look forward to further serving Dejour Energy (USA) Corp.
Sincerely,
 |  |
| Letha C. Lencioni, P.E. |
| GUSTAVSON ASSOCIATES, LLC |
| Vice-President, Petroleum Engineering |
| Registered Professional Engineer, State of Colorado, # 29506 |
Table 5 Summary Cash Flow Forecast, Proved Developed Producing Reserves
| TOTAL PROVED DEVELOPED PRODUCING | DATE | : 02/17/2016 |
| KOKOPELLI FIELD | TIME | : 14:05:31 |
| GARFIELD COUNTY, COLORADO | DBS | : Dejour_YE2015 |
| TO THE INTERESTS OF DEJOUR ENERGY | SETTINGS | : Dejour |
| | SCENARIO | : Dejour flat |
R E S E R V E S A N D E C O N O M I C S
EFF DATE: 01/2016
PW DATE: 01/2016
| --END-- | GROSS OIL | GROSS GAS | GROSS NGL | NET OIL | NET GAS | NET NGL | NET OIL | NET GAS | NET NGL | TOTAL |
| MO-YEAR | PRODUCTION | PRODUCTION | PRODUCTION | PRODUCTION | PRODUCTION | PRODUCTION | REVENUE | REVENUE | REVENUE | REVENUE |
| ------- | ---MBBLS--- | ----MMCF--- | ---MBBLS--- | ---MBBLS-- | ----MMCF-- | ---MBBLS-- | ---M$--- | ---M$--- | ---M$--- | ----M$--- |
| | | | | | | | | | | |
| 12-2016 | 5.590 | 1584.245 | 49.521 | 0.950 | 253.802 | 8.414 | 37.842 | 675.752 | 194.287 | 907.881 |
| 12-2017 | 3.376 | 951.019 | 29.905 | 0.541 | 146.523 | 4.789 | 21.539 | 389.944 | 110.583 | 522.066 |
| 12-2018 | 2.544 | 718.883 | 22.534 | 0.395 | 108.740 | 3.500 | 15.741 | 289.253 | 80.820 | 385.814 |
| 12-2019 | 2.108 | 595.872 | 18.677 | 0.322 | 89.277 | 2.857 | 12.848 | 237.438 | 65.962 | 316.248 |
| 12-2020 | 1.821 | 515.135 | 16.131 | 0.276 | 76.716 | 2.442 | 10.984 | 203.998 | 56.394 | 271.376 |
| | | | | | | | | | | |
| 12-2021 | 1.614 | 457.208 | 14.299 | 0.243 | 67.810 | 2.149 | 9.666 | 180.292 | 49.625 | 239.583 |
| 12-2022 | 1.364 | 394.861 | 12.086 | 0.199 | 57.938 | 1.765 | 7.940 | 153.863 | 40.764 | 202.567 |
| 12-2023 | 1.248 | 361.773 | 11.058 | 0.182 | 52.967 | 1.608 | 7.232 | 140.646 | 37.129 | 185.007 |
| 12-2024 | 1.028 | 309.768 | 9.103 | 0.146 | 45.315 | 1.294 | 5.817 | 120.116 | 29.868 | 155.802 |
| 12-2025 | 0.688 | 235.568 | 6.097 | 0.116 | 38.951 | 1.032 | 4.641 | 103.043 | 23.830 | 131.514 |
| | | | | | | | | | | |
| 12-2026 | 0.562 | 204.793 | 4.981 | 0.093 | 33.900 | 0.828 | 3.724 | 89.500 | 19.121 | 112.344 |
| 12-2027 | 0.529 | 193.314 | 4.690 | 0.088 | 31.991 | 0.779 | 3.501 | 84.451 | 17.976 | 105.929 |
| 12-2028 | 0.501 | 183.154 | 4.434 | 0.083 | 30.305 | 0.735 | 3.307 | 79.997 | 16.980 | 100.285 |
| 12-2029 | 0.475 | 173.960 | 4.211 | 0.079 | 28.784 | 0.698 | 3.141 | 75.980 | 16.124 | 95.245 |
| 12-2030 | 0.455 | 166.010 | 4.034 | 0.076 | 27.474 | 0.670 | 3.014 | 72.532 | 15.472 | 91.017 |
| | | | | | | | | | | |
| S TOT | 23.905 | 7045.562 | 211.761 | 3.789 | 1090.494 | 33.561 | 150.936 | 2896.805 | 774.934 | 3822.675 |
| | | | | | | | | | | |
| AFTER | 0.826 | 613.964 | 7.316 | 0.118 | 106.617 | 1.046 | 4.703 | 277.479 | 24.147 | 306.329 |
| | | | | | | | | | | |
| TOTAL | 24.730 | 7659.527 | 219.077 | 3.907 | 1197.111 | 34.607 | 155.640 | 3174.284 | 799.080 | 4129.004 |
| --END-- | NET OIL | NET GAS | NET NGL | SEVERANCE | AD VALOREM | NET OPER | OPERATING | EQUITY | UNDISC NET | DISC NET |
| MO-YEAR | PRICE | PRICE | PRICE | TAXES | TAXES | EXPENSES | CASH FLOW | INVESTMENT | CASH FLOW | CASH FLOW |
| ------- | ---M$--- | ---M$--- | ---M$--- | -----M$---- | -----M$---- | ----M$---- | ----M$---- | ----M$---- | -----M$---- | -----M$---- |
| | | | | | | | | | | |
| 12-2016 | 39.84 | 2.66 | 23.09 | 10.068 | 40.123 | 314.124 | 543.565 | 0.000 | 543.565 | 518.269 |
| 12-2017 | 39.84 | 2.66 | 23.09 | 5.790 | 23.072 | 215.926 | 277.278 | 3.750 | 273.528 | 237.102 |
| 12-2018 | 39.84 | 2.66 | 23.09 | 4.279 | 17.051 | 178.191 | 186.294 | 0.000 | 186.294 | 146.797 |
| 12-2019 | 39.84 | 2.66 | 23.09 | 3.507 | 13.976 | 162.161 | 136.603 | 0.000 | 136.603 | 97.856 |
| 12-2020 | 39.84 | 2.66 | 23.09 | 3.010 | 11.993 | 152.317 | 104.056 | 0.000 | 104.056 | 67.764 |
| | | | | | | | | | | |
| 12-2021 | 39.84 | 2.66 | 23.09 | 2.657 | 10.588 | 145.762 | 80.576 | 3.750 | 76.826 | 45.569 |
| 12-2022 | 39.84 | 2.66 | 23.09 | 2.246 | 8.952 | 128.314 | 63.054 | 0.000 | 63.054 | 33.936 |
| 12-2023 | 39.84 | 2.66 | 23.09 | 2.052 | 8.176 | 125.124 | 49.655 | 3.750 | 45.905 | 22.531 |
| 12-2024 | 39.84 | 2.65 | 23.09 | 1.728 | 6.886 | 108.037 | 39.151 | 2.000 | 37.151 | 16.543 |
| 12-2025 | 39.84 | 2.65 | 23.09 | 1.458 | 5.812 | 93.220 | 31.023 | 4.917 | 26.106 | 10.558 |
| | | | | | | | | | | |
| 12-2026 | 39.84 | 2.64 | 23.09 | 1.246 | 4.965 | 80.439 | 25.694 | 0.000 | 25.694 | 9.445 |
| 12-2027 | 39.84 | 2.64 | 23.09 | 1.175 | 4.681 | 78.739 | 21.334 | 0.000 | 21.334 | 7.129 |
| 12-2028 | 39.84 | 2.64 | 23.09 | 1.112 | 4.432 | 77.239 | 17.502 | 0.000 | 17.502 | 5.317 |
| 12-2029 | 39.84 | 2.64 | 23.09 | 1.056 | 4.209 | 75.885 | 14.094 | 0.000 | 14.094 | 3.893 |
| 12-2030 | 39.84 | 2.64 | 23.09 | 1.009 | 4.022 | 74.721 | 11.265 | 0.000 | 11.265 | 2.828 |
| | | | | | | | | | | |
| S TOT | 39.84 | 2.66 | 23.09 | 42.393 | 168.941 | 2010.197 | 1601.143 | 18.167 | 1582.976 | 1225.540 |
| | | | | | | | | | | |
| AFTER | 39.84 | 2.60 | 23.09 | 3.397 | 13.538 | 260.317 | 29.077 | 16.167 | 12.910 | 2.655 |
| | | | | | | | | | | |
| TOTAL | 39.84 | 2.65 | 23.09 | 45.791 | 182.479 | 2270.514 | 1630.220 | 34.334 | 1595.887 | 1228.195 |
| | OIL | GAS | | | | P.W. % | P.W., M$ |
| | --------- | --------- | | | | ------ | -------- |
| GROSS WELLS | 0.0 | 12.0 | | LIFE, YRS. | 22.33 | 5.00 | 1381.586 |
| GROSS ULT., MB & MMF | 33.775 | 9622.346 | | DISCOUNT % | 10.00 | 9.00 | 1255.275 |
| GROSS CUM., MB & MMF | 9.044 | 1962.820 | | UNDISCOUNTED PAYOUT, YRS. | 0.00 | 10.00 | 1228.195 |
| GROSS RES., MB & MMF | 24.730 | 7659.526 | | DISCOUNTED PAYOUT, YRS. | 0.00 | 15.00 | 1112.979 |
| NET RES., MB & MMF | 3.907 | 1197.111 | | UNDISCOUNTED NET/INVEST. | 47.48 | 20.00 | 1023.046 |
| NET REVENUE, M$ | 155.640 | 3174.284 | | DISCOUNTED NET/INVEST. | 94.98 | 25.00 | 950.664 |
| INITIAL PRICE, $ | 39.840 | 2.673 | | RATE-OF-RETURN, PCT. | 90.00 | 35.00 | 840.715 |
| INITIAL N.I., PCT. | 14.279 | 15.241 | | INITIAL W.I., PCT. | 22.883 | 50.00 | 727.765 |
| | | | | | | 70.00 | 628.489 |
| | | | | | | 90.00 | 560.404 |
Table 6 Summary Cash Flow Forecast, Total Proved Developed Reserves
| TOTAL PROVED DEVELOPED | DATE | : 02/17/2016 |
| KOKOPELLI FIELD | TIME | : 14:36:23 |
| GARFIELD COUNTY, COLORADO | DBS | : Dejour_YE2015 |
| TO THE INTERESTS OF DEJOUR ENERGY | SETTINGS | : Dejour |
| | SCENARIO | : Dejour flat |
R E S E R V E S A N D E C O N O M I C S
EFF DATE: 01/2016
PW DATE: 01/2016
| --END-- | GROSS OIL | GROSS GAS | GROSS NGL | NET OIL | NET GAS | NET NGL | NET OIL | NET GAS | NET NGL | TOTAL |
| MO-YEAR | PRODUCTION | PRODUCTION | PRODUCTION | PRODUCTION | PRODUCTION | PRODUCTION | REVENUE | REVENUE | REVENUE | REVENUE |
-------
| ---MBBLS--- | ----MMCF--- | ---MBBLS--- | ---MBBLS-- | ----MMCF-- | ---MBBLS-- | ---M$--- | ---M$--- | ---M$--- | ----M$--- |
| | | | | | | | | | | |
| 12-2016 | 6.901 | 1844.667 | 61.130 | 1.212 | 298.757 | 10.736 | 48.284 | 797.581 | 247.896 | 1093.761 |
| 12-2017 | 4.263 | 1127.301 | 37.763 | 0.718 | 176.953 | 6.361 | 28.607 | 472.410 | 146.872 | 647.889 |
| 12-2018 | 3.238 | 856.880 | 28.686 | 0.534 | 132.562 | 4.731 | 21.275 | 353.810 | 109.227 | 484.312 |
| 12-2019 | 2.669 | 707.331 | 23.645 | 0.435 | 108.518 | 3.850 | 17.317 | 289.580 | 88.907 | 395.804 |
| 12-2020 | 2.297 | 609.753 | 20.349 | 0.371 | 93.049 | 3.286 | 14.778 | 248.262 | 75.872 | 338.911 |
| | | | | | | | | | | |
| 12-2021 | 2.031 | 540.042 | 17.991 | 0.326 | 82.109 | 2.888 | 12.987 | 219.043 | 66.677 | 298.707 |
| 12-2022 | 1.829 | 487.265 | 16.206 | 0.292 | 73.890 | 2.589 | 11.645 | 197.091 | 59.786 | 268.521 |
| 12-2023 | 1.670 | 445.654 | 14.797 | 0.266 | 67.447 | 2.356 | 10.595 | 179.887 | 54.397 | 244.878 |
| 12-2024 | 1.511 | 405.774 | 13.382 | 0.243 | 61.888 | 2.149 | 9.667 | 165.029 | 49.631 | 224.327 |
| 12-2025 | 1.162 | 329.640 | 10.290 | 0.211 | 55.190 | 1.871 | 8.413 | 147.051 | 43.195 | 198.659 |
| | | | | | | | | | | |
| 12-2026 | 1.079 | 307.420 | 9.556 | 0.197 | 51.616 | 1.743 | 7.839 | 137.510 | 40.247 | 185.596 |
| 12-2027 | 1.014 | 289.704 | 8.987 | 0.185 | 48.630 | 1.638 | 7.366 | 129.544 | 37.819 | 174.729 |
| 12-2028 | 0.958 | 274.146 | 8.491 | 0.175 | 46.013 | 1.547 | 6.956 | 122.565 | 35.712 | 165.232 |
| 12-2029 | 0.909 | 260.227 | 8.057 | 0.166 | 43.676 | 1.467 | 6.599 | 116.337 | 33.883 | 156.819 |
| 12-2030 | 0.664 | 207.548 | 5.885 | 0.117 | 34.644 | 1.040 | 4.679 | 91.963 | 24.023 | 120.665 |
| | | | | | | | | | | |
| S TOT | 32.196 | 8693.354 | 285.215 | 5.447 | 1374.943 | 48.252 | 217.005 | 3667.662 | 1114.143 | 4998.809 |
| | | | | | | | | | | |
| AFTER | 0.826 | 613.964 | 7.316 | 0.118 | 106.617 | 1.046 | 4.703 | 277.479 | 24.147 | 306.329 |
| | | | | | | | | | | |
| TOTAL | 33.022 | 9307.318 | 292.531 | 5.565 | 1481.559 | 49.298 | 221.708 | 3945.141 | 1138.290 | 5305.138 |
| --END-- | NET OIL | NET GAS | NET NGL | SEVERANCE | AD VALOREM | NET OPER | OPERATING | EQUITY | UNDISC NET | DISC NET |
| MO-YEAR | PRICE | PRICE | PRICE | TAXES | TAXES | EXPENSES | CASH FLOW | INVESTMENT | CASH FLOW | CASH FLOW |
| ------- | ---M$--- | ---M$--- | ---M$--- | -----M$---- | -----M$---- | ----M$---- | ----M$---- | ----M$---- | -----M$---- | -----M$---- |
| | | | | | | | | | | |
| 12-2016 | 39.84 | 2.67 | 23.09 | 12.130 | 48.338 | 354.513 | 678.780 | 0.000 | 678.780 | 647.192 |
| 12-2017 | 39.84 | 2.67 | 23.09 | 7.185 | 28.633 | 247.054 | 365.017 | 0.000 | 365.017 | 316.391 |
| 12-2018 | 39.84 | 2.67 | 23.09 | 5.371 | 21.404 | 208.867 | 248.669 | 0.000 | 248.669 | 195.948 |
| 12-2019 | 39.84 | 2.67 | 23.09 | 4.389 | 17.492 | 188.907 | 185.015 | 0.000 | 185.015 | 132.536 |
| 12-2020 | 39.84 | 2.67 | 23.09 | 3.759 | 14.978 | 176.640 | 143.534 | 0.000 | 143.534 | 93.473 |
| | | | | | | | | | | |
| 12-2021 | 39.84 | 2.67 | 23.09 | 3.313 | 13.201 | 168.451 | 113.742 | 0.000 | 113.742 | 67.338 |
| 12-2022 | 39.84 | 2.67 | 23.09 | 2.978 | 11.867 | 162.722 | 90.954 | 0.000 | 90.954 | 48.952 |
| 12-2023 | 39.84 | 2.67 | 23.09 | 2.716 | 10.822 | 158.612 | 72.728 | 0.000 | 72.728 | 35.584 |
| 12-2024 | 39.84 | 2.67 | 23.09 | 2.488 | 9.914 | 154.260 | 57.665 | 2.000 | 55.665 | 24.779 |
| 12-2025 | 39.84 | 2.66 | 23.09 | 2.203 | 8.780 | 142.433 | 45.243 | 1.167 | 44.076 | 17.800 |
| | | | | | | | | | | |
| 12-2026 | 39.84 | 2.66 | 23.09 | 2.058 | 8.202 | 138.968 | 36.367 | 0.000 | 36.367 | 13.368 |
| 12-2027 | 39.84 | 2.66 | 23.09 | 1.938 | 7.722 | 136.301 | 28.768 | 0.000 | 28.768 | 9.614 |
| 12-2028 | 39.84 | 2.66 | 23.09 | 1.832 | 7.302 | 133.964 | 22.133 | 0.000 | 22.133 | 6.724 |
| 12-2029 | 39.84 | 2.66 | 23.09 | 1.739 | 6.931 | 131.877 | 16.272 | 0.000 | 16.272 | 4.494 |
| 12-2030 | 39.84 | 2.65 | 23.09 | 1.338 | 5.333 | 102.469 | 11.525 | 15.000 | -3.475 | -0.901 |
| | | | | | | | | | | |
| S TOT | 39.84 | 2.67 | 23.09 | 55.437 | 220.919 | 2606.040 | 2116.414 | 18.167 | 2098.247 | 1613.292 |
| | | | | | | | | | | |
| AFTER | 39.84 | 2.60 | 23.09 | 3.397 | 13.538 | 260.317 | 29.077 | 16.167 | 12.910 | 2.655 |
| | | | | | | | | | | |
| TOTAL | 39.84 | 2.66 | 23.09 | 58.834 | 234.457 | 2866.356 | 2145.490 | 34.334 | 2111.157 | 1615.947 |
| | OIL | GAS | | | | P.W. % | P.W., M$ |
| | --------- | --------- | | | | ------ | -------- |
| GROSS WELLS | 0.0 | 12.0 | | LIFE, YRS. | 22.33 | 5.00 | 1823.828 |
| GROSS ULT., MB & MMF | 41.107 | 11361.201 | | DISCOUNT % | 10.00 | 9.00 | 1652.751 |
| GROSS CUM., MB & MMF | 8.085 | 2053.882 | | UNDISCOUNTED PAYOUT, YRS. | 0.00 | 10.00 | 1615.947 |
| GROSS RES., MB & MMF | 33.022 | 9307.319 | | DISCOUNTED PAYOUT, YRS. | 0.00 | 15.00 | 1459.049 |
| NET RES., MB & MMF | 5.565 | 1481.559 | | UNDISCOUNTED NET/INVEST. | 62.49 | 20.00 | 1336.462 |
| NET REVENUE, M$ | 221.708 | 3945.140 | | DISCOUNTED NET/INVEST. | 197.48 | 25.00 | 1237.931 |
| INITIAL PRICE, $ | 39.840 | 2.670 | | RATE-OF-RETURN, PCT. | 90.00 | 35.00 | 1088.870 |
| INITIAL N.I., PCT. | 12.539 | 14.096 | | INITIAL W.I., PCT. | 22.659 | 50.00 | 936.991 |
| | | | | | | 70.00 | 804.872 |
| | | | | | | 90.00 | 715.079 |