March 31, 2017
Mr. David Matheson
Chief Financial Officer, CFO
Dejour Energy (USA) Corp.
598, 999 Canada Place
Vancouver, BC
V6C 3E1
Canada
Subject: | Reserve Estimate and Financial Forecast as to Dejour’s Interests in the Kokopelli Field Area, Garfield County, Colorado. |
Dear David:
As you requested, Gustavson Associates has completed reserves and economics as to Dejour Energy’s interests in future oil and gas production associated with the Kokopelli Field Area located in Garfield County. Reserves have been estimated based on analysis of analogous well production data. Estimates and projections have been made as of January 1, 2017. Reserves have been estimated in accordance with the US Securities and Exchange Commission’s (SEC) definitions and guidelines, and the report was prepared for the purpose of inclusion as an exhibit in a filing made with the SEC.
In general, Proved Developed Producing (PDP) reserves were assigned to 11 producing wells (shown in Table 2). Proved Developed Non-Producing (PDNP) reserves have been assigned to the Federal 14/15-7-21 well. There are plans to recomplete this well, which is currently producing out of the Mancos shale, in the Williams Fork member of the Mesaverde formation in July 2017. No Proved Undeveloped (PUD) reserves have been assigned. Gustavson is of the opinion that no current regulations, and no anticipated changes to regulations, would inhibit the ability of Dejour to recover the estimated reserves in the manner projected herein. It is our understanding that the reserves estimated herein represent all of Dejour’s US reserves.
The estimated net reserves volumes and associated net cash flow estimates are summarized in Table 1 below.
5757 Central Ave. Suite D Boulder, Co. 80301 USA 1-303-443-2209 FAX 1-303-443-3156 http://www.gustavson.com
Mr. David Matheson
March 31, 2017
Page 2
Table 1 Summary of Net Reserves and Projected Before Tax Cash Flow
| Reserves Category | Net Gas
Reserves,
MMcf | Net
Condensate
Reserves
(MBO) | Net NGL
Reserves
(MBO) | Before Tax Net Present Value,
thousands of US$ Discounted at |
| 0% | 10% | 15% |
| Proved Developed Producing | 730.8 | 5.3 | 30.7 | $969 | $704 | $623 |
| Proved Developed Non-Producing | 186.9 | 1.2 | 9.5 | $210 | $118 | $92 |
| Proved Undeveloped | - | - | - | $0 | $0 | $0 |
| Total Proved | 917.6 | 6.5 | 40.2 | $1,179 | $822 | $715 |
The portion of the Company’s total reserves represented by the reserves included in this report is shown below.
| Location of Reserves | | | | | | Proportion of |
| | | Gas | Condensate | NGL | Oil Equivalent | Oil Equiv. |
| Country | Area | (MMCF) | (MBBL) | (MBBL) | (MBOE) | Reserves |
| United States | Colorado | 917.6 | 6.5 | 40.2 | 199.7 | 60% |
| Total Company | | | | | 330.7 | 100% |
Gustavson Associates has performed an evaluation of the reserves associated with both developed and undeveloped locations located in the Kokopelli Field Project Area, Garfield County, Colorado. Proved Developed Producing (PDP) Reserves have been assigned to 11 wells (shown in Table 2). The first four wells began producing in July and August of 2013 and next eight wells began producing in September 2015. All these wells are completed in the Williams Fork member of the Mesaverde formation except for one of the new wells, the Federal 14/15-7-21, which is completed in the Mancos shale.
Proved Developed Non-Producing (PDNP) reserves were assigned to the Federal 14-15-7-21 well. There are plans to recomplete this well, which is currently producing out of the Mancos shale, in the Williams Fork member of the Mesaverde formation in July 2017.
The PDP locations are displayed in Figure 1 and Figure 2. The property has additional upside which has not been included in this report. Under current economic conditions, drilling of offset locations in the Williams Fork or Mancos formation does not generate positive economics; therefore, no PUD reserves have been assigned.
Mr. David Matheson
March 31, 2017
Page 3
Table 2 Summary of PDP Wells
| Well Name | Working Interest | Revenue Interest | Producing Formation |
| 1. Federal 6/7-16-21 | 5.5573% | 4.4458% | Williams Fork |
| 2. Federal 6/7-15-21 | 7.778% | 6.6624% | Williams Fork |
| 3. Federal 6/7-14-21 | 7.778% | 6.6624% | Williams Fork |
| 4. Federal 6/7-13-21 | 7.778% | 6.6624% | Williams Fork |
| 5. Federal 14/15-1-21 | 25.00% | 20.00% | Williams Fork |
| 6. Federal 14/15-2-21 | 25.00% | 20.00% | Williams Fork |
| 7. Federal 14/15-3-21 | 25.00% | 20.00% | Williams Fork |
| 8. Federal 14/15-4-21 | 25.00% | 20.00% | Williams Fork |
| 9. Federal 14/15-5-21 | 25.00% | 20.00% | Williams Fork |
| 10. Federal 14/15-6-21 | 25.00% | 20.00% | Williams Fork |
| 11. Federal 14/15-7-21 | 25.00% | 20.00% | Mancos |

Figure 1 Map of Dejour Williams Fork Wells
Mr. David Matheson
March 31, 2017
Page 4
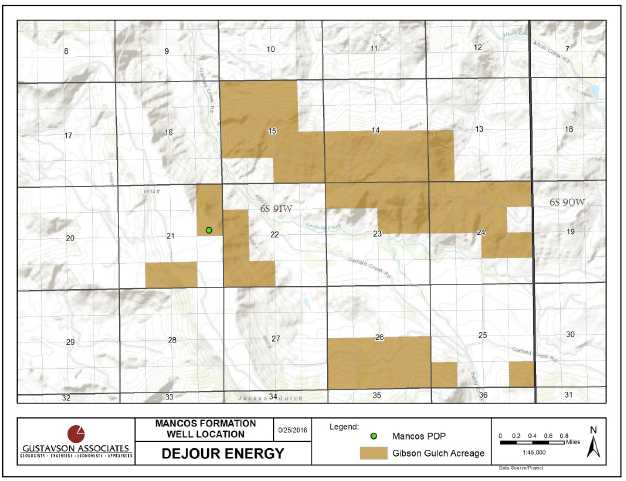
Figure 2 Map of Dejour Mancos PDP Location
Oil and Gas Pricing
In order to determine the flat pricing in accordance with SEC guidelines, the Dejour’s revenue statements were analyzed. For all wells, a differential was calculated based on the price that Dejour was paid versus the West Texas Intermediate (WTI) and Henry Hub (HH) spot prices averaged for that given month. These differentials were then applied to the WTI and HH spot prices for the first day of each month in 2016 in order to estimate prices for Dejour’s products on the first day of the month, per SEC guidelines. These values were averaged and applied in the cash flows presented herein.
For Williams Fork wells, the wellhead gas price was estimated at 101% of NYMEX Henry Hub gas and the NGL price was found to be a factor of 11.29 times the Henry Hub gas price. The Williams Fork wellhead condensate prices were determined to be 24% lower than WTI prices. The utilized flat hydrocarbon pricings for Williams Fork can be found in Table 3.
Mr. David Matheson
March 31, 2017
Page 5
Table 3 Flat Pricing for Williams Fork Wells
| Flat pricing for Effective Date of January 1, 2017 |
| Local Price Differentials Included |
| 2016 Avg WTI | 2016 Avg HH | Adjusted WTI | Adjusted HH | NGL |
| $/B | $/mcf | $/B | $/mcf | $/B |
| 42.600 | 2.470 | 32.497 | 2.486 | 27.89 |
Expenses
Operating costs are expected to be $2,800 per well per month. This is based on information provided by the Dejour and is consistent with our experience with similar wells in the area. The drilling and completion costs reflects economies of scale and contractual advantages expected to be gained when a large drilling program is executed. Severance tax is deducted at the rate of 1.04% of revenue. County ad valorem tax was estimated at approximately 3.91% of revenue after discussion with Garfield County personnel. Conservation tax was estimated at 0.072% and the annual property tax was estimated as 0.557% of net revenue. Note that Conservation tax rate and property tax are lumped together with Severance tax and Ad Valorem tax in the economics evaluation, respectively For Williams Fork Wells only, an NGL yield of approximately 25 Bbl/mmcf was applied until July 2017 and then increased to 48 Bbl/MMCF thereafter. Per a new gas transportation and processing contract between Coachman and a major midstream company, the gas will be processed at a plant with enhanced cryogenic refining capabilities, starting July 2017, thus returning the NGL yield to previous levels. A condensate/gas ratio of 8.5 Bbl/MMCF was applied based on actual 2016 sales. Contractual gas transportation, gathering, and processing fees of $0.71/MCF were deducted as operating costs for both Williams Fork and Mancos wells. Condensate trucking fee of $1.50/Bbl was also applied to the Williams Fork wells. Abandonment costs of $15,000 per well were estimated. All costs were held flat.
Dejour expects the Federal 14-15-7-21 well, currently producing out of the Mancos shale, to be recompleted in the Williams Fork in July 2017. This operation will cost $500,000 US, which Gustavson finds to be reasonable based on estimates from the client and experience in the area.
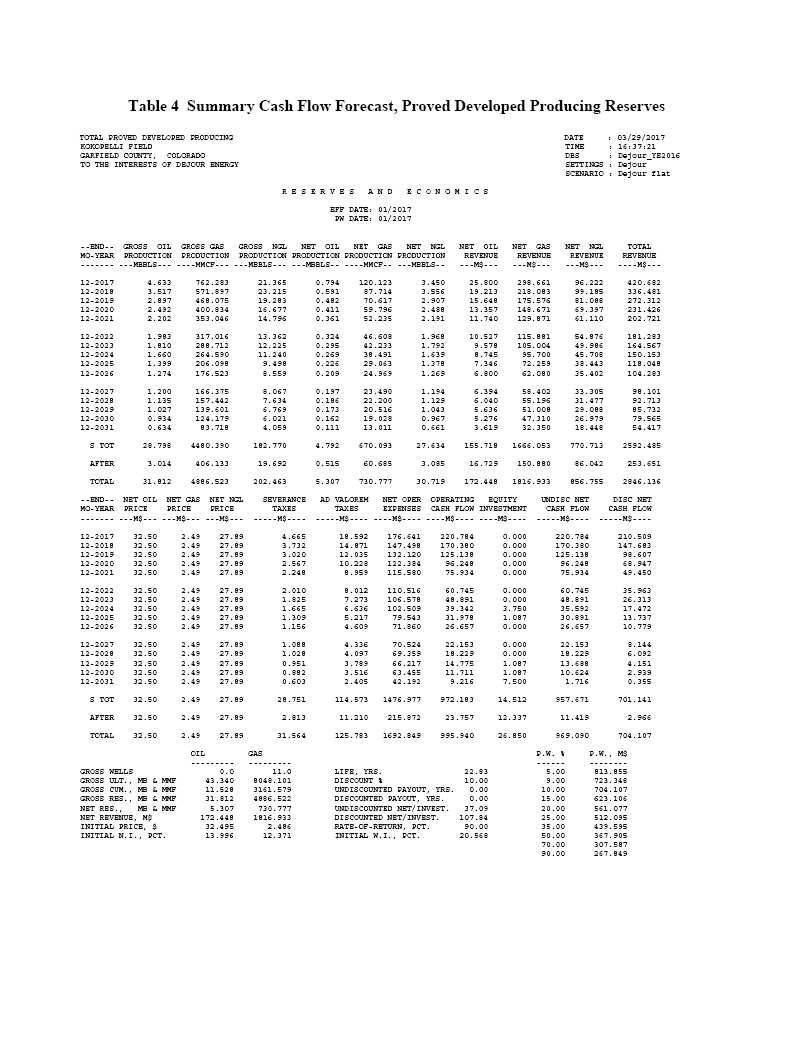
Detailed cash flow projections are shown in Tables 4 and 5 below. Note that the NGL volumes shown in these tables represent total NGL sales as expected based on the revenue statements provided by the Client.1
Limiting Conditions and Disclaimers
The accuracy of any reserve report or resource evaluation is a function of available data and of engineering and geologic interpretation and judgment. While the evaluation presented herein is believed to be reasonable, it should be viewed with the understanding that subsequent reservoir performance or changes in pricing structure, market demand, or other economic parameters may justify its revision. The assumptions, data, methods, and procedures used are appropriate for the purpose served by the report. Gustavson has used all methods and procedures as we considered necessary under the circumstances to prepare the report.
______________________________
1 In some previous reports, ethane and heavier NGLs were reported separately. Here they are reported together.
Mr. David Matheson
March 31, 2017
Page 6
Gustavson Associates, LLC, holds neither direct nor indirect financial interest in the subject property, the company operating the subject acreage, or in any other affiliated companies.
All data and work files utilized in the preparation of this report are available for examination in our offices. Please contact us if we can be of assistance. We appreciate the opportunity to be of service and look forward to further serving Dejour Energy (USA) Corp.
Sincerely,