QuickLinks -- Click here to rapidly navigate through this document
As filed with the Securities and Exchange Commission on May 7, 2004
Registration No. 333-
SECURITIES AND EXCHANGE COMMISSION
WASHINGTON, D.C. 20549
Form S-1
REGISTRATION STATEMENT
UNDER THE SECURITIES ACT OF 1933
BORDEN CHEMICAL, INC.
(Exact name of registrant as specified in its charter)
| New Jersey | 2821 | 13-0511250 | ||
| (Jurisdiction of incorporation | (Primary Standard Industrial | (I.R.S. Employer | ||
| or organization) | Classification Code Number) | Identification Number) | ||
180 East Broad Street Columbus, Ohio 43215 (614) 225-4000 | ||||
| (Address, including zip code, and telephone number, including area code, of Registrant's principal executive offices) | ||||
Nancy G. Brown, Esq.
180 East Broad Street
Columbus, Ohio 43215
(614) 225-4000
(Name, address, including zip code, and telephone number, including area code, of agent for service)
Copies to:
| John B. Tehan, Esq. Simpson Thacher & Bartlett LLP 425 Lexington Avenue New York, New York 10017 (212) 455-2000 | Kris F. Heinzelman, Esq. Cravath, Swaine & Moore LLP Worldwide Plaza 825 Eighth Avenue New York, New York 10019 (212) 474-1000 |
Approximate date of commencement of proposed sale to the public: As soon as practicable after the registration statement becomes effective.
If any of the securities being registered on this Form are to be offered on a delayed or continuous basis pursuant to Rule 415 under the Securities Act of 1933, check the following box. o
If this Form is filed to register additional securities for an offering pursuant to Rule 462(b) under the Securities Act, please check the following box and the list Securities Act registration statement number of the earlier effective registration statement for the same offering. o
If this Form is a post-effective amendment filed pursuant to Rule 462(c) under the Securities Act, check the following box and list the Securities Act registration statement number of the earlier effective registration statement for the same offering. o
If this Form is a post-effective amendment filed pursuant to Rule 462(d) under the Securities Act, check the following box and list the Securities Act registration statement number of the earlier effective registration statement for the same offering. o
CALCULATION OF REGISTRATION FEE
| Title of Each Class of Securities to be registered | Amount To Be Registered | Proposed Maximum Offering Price Per Unit | Proposed Maximum Aggregate Offering Price(1) | Amount of Registration Fee | ||||
|---|---|---|---|---|---|---|---|---|
| Common Stock, par value $0.01 per share | — | — | $200,000,000 | $25,340 | ||||
- (1)
- Estimated solely for the purpose of calculating the amount of the registration fee pursuant to Rule 457(o) under the Securities Act.
The Registrant hereby amends this registration statement on such date or dates as may be necessary to delay its effective date until the Registrant shall file a further amendment which specifically states that this registration statement shall thereafter become effective in accordance with Section 8(a) of the Securities Act of 1933, or until this registration statement shall become effective on such date as the Commission, acting pursuant to said Section 8(a), may determine.
The information in this prospectus is not complete and may be changed. We may not sell these securities until the registration statement filed with the Securities and Exchange Commission is effective. This prospectus is not an offer to sell these securities, and we are not soliciting offers to buy these securities, in any state where the offer or sale is not permitted.
SUBJECT TO COMPLETION, DATED MAY 7, 2004
Shares

Borden Chemical, Inc.
Common Stock
The shares of common stock are being sold by the selling shareholder described in this prospectus. We will not receive any of the proceeds from the shares of common stock sold in this offering.
Prior to this offering, there has been no public market for our common stock. The initial public offering price of our common stock is expected to be between $ and $ per share. We will apply to list our common stock on The New York Stock Exchange under the symbol "BCI."
The underwriters have an option to purchase a maximum of additional shares from the selling shareholder to cover over-allotments of shares.
Investing in our common stock involves risks. See "Risk Factors" beginning on page 10.
| | Price to Public | Underwriting Discounts and Commissions | Proceeds to Selling Shareholder | ||||||
|---|---|---|---|---|---|---|---|---|---|
| Per Share | $ | $ | $ | ||||||
| Total | $ | $ | $ | ||||||
Delivery of the shares of common stock will be made on or about , 2004.
Neither the Securities and Exchange Commission nor any state securities commission has approved or disapproved of these securities or determined if this prospectus is truthful or complete. Any representation to the contrary is a criminal offense.
| Credit Suisse First Boston | Morgan Stanley | |
| Lehman Brothers | UBS Investment Bank | |
The date of this prospectus is , 2004.
| Prospectus Summary | 1 | |
| Risk Factors | 10 | |
| Cautionary Statement Concerning Forward-Looking Statements | 25 | |
| Use of Proceeds | 26 | |
| Dividend Policy | 26 | |
| Capitalization | 27 | |
| Dilution | 28 | |
| Selected Historical Financial Data | 29 | |
| Management's Discussion and Analysis of Financial Condition and Results of Operations | 32 | |
| Business | 53 | |
| Management | 69 | |
| Principal and Selling Shareholder | 78 | |
| Certain Relationships and Related Party Transactions | 79 | |
| Description of Capital Stock | 82 | |
| Common Stock Eligible for Future Sale | 83 | |
| Description of Indebtedness | 84 | |
| Certain U.S. Federal Tax Consequences for Non-U.S. Holders | 88 | |
| Underwriting | 90 | |
| Notice to Canadian Residents | 93 | |
| Legal Matters | 94 | |
| Experts | 94 | |
| Where You Can Find More Information | 94 | |
| Glossary | G-1 | |
| Index to Consolidated Financial Statements | F-1 |
You should rely only on the information contained in this document or to which we have referred you. We have not authorized anyone to provide you with information that is different. This document may only be used where it is legal to sell these securities. The information in this document may only be accurate on the date of this document.
This prospectus includes industry data and forecasts that we obtained from industry publications and surveys and internal company surveys. Industry publications and surveys and forecasts generally state that the information contained therein has been obtained from sources believed to be reliable, but we cannot assure you as to the accuracy or completeness of included information. We have not independently verified any of the data from third-party sources nor have we ascertained the underlying economic assumptions relied upon therein. Similarly, internal company surveys, industry forecasts and market research, which we believe to be reliable, based upon management's knowledge of the industry, have not been verified by any independent sources.
Dealer Prospectus Delivery Obligation
Until , 2004 (25 days after commencement of the offering), all dealers that effect transactions in these securities, whether or not participating in this offering, may be required to deliver a prospectus. This is in addition to the dealers' obligation to deliver a prospectus when acting as underwriters and with respect to unsold allotments or subscriptions.
i
This summary highlights information about Borden Chemical, Inc. and the offering contained elsewhere in this prospectus. It is not complete and may not contain all the information that may be important to you. You should carefully read the entire prospectus before making an investment decision, especially the information presented under the heading "Risk Factors." In this prospectus, all references to "Borden Chemical," "the Company," "we," "us" and "our" refer to Borden Chemical, Inc., its subsidiaries and HA International, LLC, unless the context otherwise requires or where otherwise indicated. You should also see the "Glossary" for definitions of some of the terms used to describe our business and industry.
Overview
We are one of the world's leading integrated producers of thermoset resins, adhesives and binders for the global forest products and industrial markets. In addition, we are the world's largest producer by volume of formaldehyde, an important and versatile building block chemical used in a wide variety of applications. We are the largest North American producer by volume of thermoset resins used in the production of engineered wood products, including structural wood panels, beams and non-structural panels, furniture, door and window assemblies and wallboards. We are also the largest North American producer by volume of resin-coated proppant systems, which are used in oilfield and natural gas production, and of foundry resins, which are used in the production of cores and molds for metal castings. We have a strong presence in the production of both specialty resins used in industrial markets and UV coatings for the production of fiber-optic cables, DVDs and CDs. Our materials are designed to deliver superior binding and bonding performance to manufacturers of thousands of common, everyday products that enhance modern living. Our strong position in North America is complemented by our significant operations in Latin America and Europe and expansion opportunities in Asia Pacific and Latin America.
Through our worldwide network of 48 strategically located production facilities, we serve more than 3,000 customers, with our largest customer representing 5% of net sales in 2003. Our customers operate in many diverse end-markets, such as construction, furniture, automotive, oil and gas, chemicals, electronics, communications and agriculture. In 2003, we generated net sales of $1,435 million, Adjusted EBITDA (as defined) of $127.7 million, operating income of $66.5 million and net income of $23.0 million. In 2003, 63% of our net sales were derived from sales in the United States, 15% from Canada and 22% from Latin America, Europe and Asia Pacific.
Our Business
Our three reporting segments are (i) Forest Products, which includes the forest products resins and formaldehyde product lines produced in North America, (ii) Performance Resins, which includes the specialty resins, foundry resins, oilfield products and UV coatings product lines produced in North
1
America, and (iii) International, which includes all products produced outside of North America. The following is an illustration of our net sales and Adjusted EBITDA by reporting segment in 2003:
Net Sales and Adjusted EBITDA by Reporting Segment
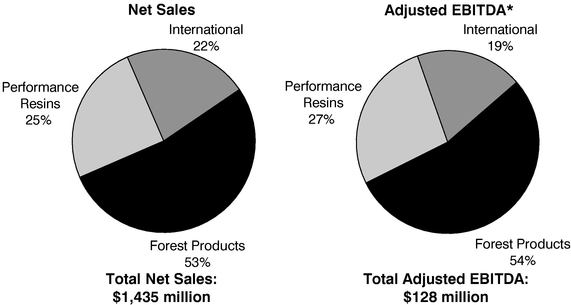
* Percentages are calculated prior to allocation of corporate expenses.
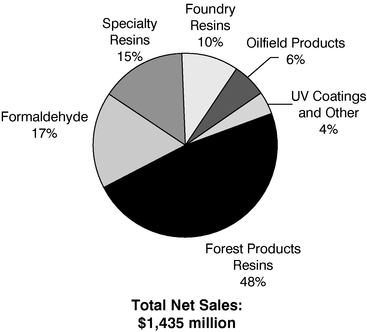
Our primary product lines include forest products resins, formaldehyde, specialty resins, foundry resins, oilfield products and UV coatings and other. Our net sales by product line for 2003 are illustrated below:
Forest Products Resins. We are the leading producer of forest products thermoset resins in North America with an approximate 46% market share by volume in urea formaldehyde resins, or UF resins, and an approximate 40% market share by volume in phenol formaldehyde resins, or PF resins. Our thermoset resin systems are used by our customers to bind wood particles and bond wood segments to provide strength and durability to oriented strand board, or OSB; particleboard; medium density fiberboard, or MDF; and plywood.
Formaldehyde. We are the world's largest producer of formaldehyde by volume and the largest provider of formaldehyde to end-users in North America with an approximate 59% share of the merchant market. We manufacture more than five billion pounds of formaldehyde solution each year, of which approximately half is consumed internally for resin production and the other half is sold to external customers. Formaldehyde is a versatile building block chemical used in thousands of diverse end-use applications such as resin systems for forest products and industrial bonding, household
2
products, including shampoo, cosmetics, disinfectants and fabric softeners, and specialty fabrics, paper products, fertilizers and animal feeds.
Specialty Resins. We are a major supplier of high performance specialty resins used in the binding and bonding of a diverse range of materials, primarily in the construction, automotive, electronics and steel industries. Typical end-use product applications include electronics for circuit boards, adhesives for brake linings and other friction products, flame-resistant composites for trains and planes, acoustical insulation for automobiles and glass matting for roofing shingles and thermal insulation.
Foundry Resins. Through our 75% economic interest in our joint venture HA International, LLC, which we refer to as HAI, we are the leading producer by volume of foundry resins in North America with an approximate 42% market share. We pioneered the development of thermoset resins as binders for sand cores and molds used in metal castings over 40 years ago and continue to serve the North American market with a broad distribution network and significant production capability. Our foundry resin manufacturing capabilities include the largest foundry resin plant in the United States, which is located in Louisville, Kentucky. Our foundry resin systems are used by major automotive and industrial companies in the production of engine blocks, transmissions, brake and drive train components and various other casting products.
Oilfield Products. We are the leading producer of oilfield resin systems and proppants in North America with an approximate 51% market share by volume. Our innovative flow back control technology allows oil and gas service providers to improve yields and extract oil and gas from deeper and more complex geological formations.
UV Coatings. We make coating and adhesive systems that utilize ultraviolet light-curing technology and have an approximate 21% global market share by volume. Our UV light-curable products are used in fiber optic cable, CDs, CD-ROMs, DVDs, electronics and other specialty applications. These materials play an important role in modern communications technology by enhancing durability and performance.
Industry
According to SRI Consulting, an independent industry consulting firm, the global chemicals industry is a $1.9 trillion market, divided into two primary markets: commodity chemicals and specialty chemicals. We are an important participant in both markets. We participate in the commodity chemicals market through our presence in the merchant formaldehyde market. We participate in the specialty chemicals market through our presence in thermoset resins, including our forest products resins, our resins serving the electronics and oil field services markets and our UV coatings products. The portion of the specialty chemicals market in which we participate is estimated at $6.4 billion globally. These products are principally sold on the basis of performance, technical support and service levels to customers and product innovation.
The principal factors contributing to success in the chemicals market vary between the specialty and commodity chemicals markets. Success in the specialty chemicals market is largely driven by (i) consistent delivery of high-quality products, (ii) advantageous production technologies, (iii) the ability to provide value to customers through both product attributes and strong technical support and service and (iv) a presence in large and growing markets. Success in the commodity chemicals market is largely driven by (i) large scale and high plant productivity, (ii) a low cost structure including cost-effective raw material procurement and (iii) strong customer relationships.
Competitive Strengths
- •
- Leading Market Positions. We are one of the world's leading producers of thermoset resins for the forest products and industrial markets. We believe that we have the number one or number
3
two market position in North America by volume in products accounting for virtually all our net sales. The following table illustrates our market position by volume in our key product areas:
| Product | Market | 2003 Market Position | Approximate Market Share | ||||
|---|---|---|---|---|---|---|---|
| Forest Products Resins | |||||||
| UF Resins | North America | 1 | 46% | ||||
| PF Resins | North America | 1 | 40% | ||||
| Merchant Formaldehyde | North America | 1 | 59% | ||||
| Industrial Resins | North America | 1 | 28% | ||||
| Foundry Resins | North America | 1 | 42% | ||||
| Oilfield Resins | North America | 1 | 51% | ||||
| UV Fiber-Optic Coatings | Global | 2 | 21% | ||||
- •
- Competitive Advantage in Thermoset Resins Business. We believe we enjoy a cost advantage in our thermoset resins business as a result of our manufacturing scale and vertical integration with our formaldehyde business. Formaldehyde accounts for an average of approximately 30% of the raw material costs of formaldehyde-based resins.
- •
- Strong Relationships with Our Customers. As a result of our focus on developing innovative, high-quality products with a high level of technical service, we have developed stable, long-term relationships with our customers on a global basis. Most of our resin customers require products that are tailored to their individual production needs and require a high degree of technical service and product reformulation. We have a total systems approach to meeting customer needs. This approach involves using our global technology and experience in order to deliver the appropriate resin for the customer's application and production process and subsequently providing ongoing in-plant technical support and service. We believe that this represents a competitive advantage and contributes to our reputation as the world's leading supplier of thermoset resins.
- •
- Low Cost Position Through Scale and Strategically Located Plants. We believe that we are North America's lowest cost producer of formaldehyde and formaldehyde-based resins. Our cost advantage in formaldehyde is a result of our manufacturing technology and leading global market position, which allow us to utilize our plants more efficiently and source raw materials at lower prices. Most of our manufacturing plants are strategically located close to, or linked with, our customers' manufacturing facilities. This allows us a significant logistical advantage since formaldehyde cannot be cost-effectively transported long distances.
- •
- Diversified Revenue Base. We have a diversified revenue and customer base in a variety of end-markets and geographies, which reduces our exposure to economic, industry and commodity chemical cycles. In 2003, our largest customer accounted for 5% of our net sales and our top ten customers accounted for 27% of our net sales. We sell our products into numerous end-markets including construction, furniture, automotive, oilfield services, chemicals, electronics, communications and steel production. Our largest end-market is construction, which accounted for approximately 35% of our net sales in 2003. Because demand for our products is driven by both new housing starts and the home remodeling and repair market, we have been able to maintain our net sales volumes of forest products resins during periods of declining housing starts.
- •
- Well Positioned for Improving Raw Material Pricing Environment. We have recently experienced dramatically higher raw material costs. For example, in 2003, the prices of methanol, phenol and urea increased by 42%, 22% and 50%, respectively. However, we are typically able to pass along raw material price increases, albeit with a "lag," which leads to lower margins during periods of rapidly increasing raw material prices and higher margins during periods of rapidly decreasing raw material prices. We believe that our recent operating performance in a
4
- •
- Favorable Trends in Forest Products Resin Demand. As a result of the scarcity of "mature growth" forests in North America and Europe, there is a continuing shift away from plywood to OSB, a plywood substitute that uses less wood. This trend has been driving demand for our products because manufacturing of OSB uses approximately 50% more of our resins than plywood.
- •
- Strong Management Team. We have a new management team led by Craig O. Morrison, who was appointed President and Chief Executive Officer on March 25, 2002. Subsequently, nine of the eleven members of our senior management team joined the Company. This has significantly expanded the capability and capacity of the management team. Initiatives introduced by this management team, such as Six Sigma, new product development, assessment processes and global product line management, are beginning to have a positive impact on our financial results.
difficult raw material environment positions us to capitalize on what we believe generally will be an improving raw material pricing environment.
Strategy
We are focused on increasing shareholder value, our return on investment, cash flows and profitability. We believe we can achieve these goals through the following strategies:
- •
- Expand Our Global Reach. We will continue to grow internationally by expanding our product sales to our multi-national customers outside of North America and by entering new markets. In particular, we believe that our leading formaldehyde and formaldehyde-based resin technology and our relationships with large multi-national customers as a "supplier of choice" of formaldehyde offers us a significant competitive advantage as we enter new markets. We are particularly focused on growing our business in the Asian-Pacific and Latin American markets, where the usage of our products is increasing. For example, having recently targeted Brazil as a growth market, our volumes in that country have grown by 35% from 2001 to 2003 and Adjusted EBITDA has grown to $15 million. In China, we have initiated three joint ventures and have two plants under construction in order to expand our operations for forest products, formaldehyde and UV coating.
- •
- Develop and Market New Products. We will continue to expand our product offerings through internal product innovation, joint research and development initiatives with our customers and research partnership formations. In 2003, approximately 15% of our net sales were derived from products developed or re-engineered within the last three years. We have implemented a new, systematic approach to new product development and have identified promising new technologies that have begun to yield significant results. In 2003, we introduced new materials in all of our product lines. For example, last year we developed and began marketing XRT™, a resin for the oilfield products end-market, which generated $10 million in net sales in 2003. We also have increased our investments in UV light-curable products for the display, CD and ink jet markets and electronics products for the photolithography market.
- •
- Focus on Operational Excellence. We will continue to focus on opportunities to optimize our resources, improve our cost position and drive new product innovation. In 2002, we implemented a major Six Sigma process initiative, which is adding discipline and focus to the way we approach productivity. Since the beginning of 2002, our average productivity per employee has increased by approximately 25%.
- •
- Pursue Targeted Add-On Acquisitions and Joint Ventures. We intend to continue pursuing add-on acquisitions and joint ventures in areas that allow us to build upon our core strengths, expand our product portfolio and better serve our customers. For example, during 2003 we spent a total of $14.7 million for the acquisition of an international manufacturer of specialty chemical products and for the acquisition of the assets of a domestic producer of specialty adhesives.
5
Recent Developments
On May 6, 2004, we reported net income of $4.9 million for the first quarter ended March 31, 2004, compared with a first quarter 2003 loss of $3.4 million. Operating income for the quarter rose to $20.8 million, up 189% from $7.2 million recorded in the prior year period. Results for the quarter were driven by strong sales volumes, reduced expenses due to productivity initiatives and favorable product mix.
Net sales for the period totaled $385.4 million, up 10% from first quarter 2003 sales of $349.3 million as a result of increased sales volumes, higher selling prices, favorable product mix and the positive impact of foreign currency translation.
Sales volumes for the quarter increased 4% as compared to the prior year period, with growth across most major segments. A recovering domestic economy, continued strength in construction markets and improved results from international operations all contributed to the sales volume increase.
Our efforts to reduce costs and improve productivity were reflected in a reduction in general and administrative expenses for the quarter of more than $6.0 million compared to last year's period. Gross margins improved to 19.7% from 18.8% in the previous year period as we were able to recover higher costs for the key raw materials of methanol, phenol and urea, and benefited from growth in higher margin business segments. Adjusted EBITDA was $34.8 million, a 71% improvement over the first quarter of 2003.
Forest Products net sales increased $15.9 million or 8.9% in the first quarter of 2004 compared to the first quarter of 2003, while Adjusted EBITDA was up $5.6 million, or 31%. The sales increase resulted from improved volumes driven by the strong construction market, improved pricing reflecting strong demand for PF resins and favorable foreign currency translation due to the stronger Canadian dollar as compared to the U.S. dollar. The Adjusted EBITDA increase reflects improved volumes and the positive impact of a realignment program announced in June 2003, which we refer to as the 2003 Realignment. Higher selling prices and improved margins also contributed to the Adjusted EBITDA increase.
Performance Resins net sales increased $6.4 million, or 6.7%, in the first quarter of 2004 compared to 2003. Increased drilling activity and improved conditions in the non-automotive castings sector drove improved volumes in the oilfield and foundry businesses, respectively. Adjusted EBITDA increased $0.2 million, or 2.1%, as increased processing costs and investments supporting geographic expansion and new product development substantially offset the positive earnings impact of the increased volume.
International net sales increased $13.7 million, or 18.4%, in the first quarter of 2004 compared to the first quarter of 2003. The positive impact of foreign currency translation, the 2003 acquisition of Fentak Pty. Ltd., or Fentak, and improved volumes in the Latin American forest products sector were the key drivers. Adjusted EBITDA increased $0.5 million, or 6.4%, reflecting improved volumes and favorable product mix.
Our History
We were incorporated in 1899. In 1995, when certain affiliates of Kohlberg Kravis Roberts & Co. L.P., or KKR, acquired control of the Company (then known as Borden, Inc.), our businesses consisted of the following business segments: Chemical, Foods, Other Consumer Products (including Consumer Adhesives), Decorative Products, Dairy and businesses held for sale. We sold all of these business segments, except for the Chemical segment, by the end of 2001.
Our principal executive offices are located at 180 East Broad Street, Columbus, Ohio 43215. Our telephone number is (614) 225-4000. We maintain a website at www.bordenchem.com where general information about our business is available. The information contained on our website is not a part of this prospectus.
6
| Common stock offered by the Selling Shareholder(1)(2) | shares | |
Common stock to be outstanding after this offering(3) | shares | |
Use of proceeds | We will not receive any of the proceeds from the sale of shares of our common stock sold in this offering. The Selling Shareholder will receive all net proceeds from the sale of shares of our common stock in this offering. | |
Dividend policy | We currently intend to pay quarterly dividends on our common stock. See "Dividend Policy." | |
Proposed New York Stock Exchange trading symbol | "BCI" | |
Risk factors | You should carefully read and consider the information set forth under the caption "Risk Factors" and all other information set forth in this prospectus before investing in our common stock. |
- (1)
- The Selling Shareholder is Borden Holdings, LLC, an affiliate of KKR. See "Principal and Selling Shareholder."
- (2)
- Except as otherwise indicated, all information in this prospectus assumes:
- •
- no exercise of the underwriters' over-allotment option and
- •
- a for share exchange, which will occur prior to the closing of this offering.
- (3)
- Assuming that the underwriters' over-allotment option is not exercised, the aggregate number of shares of common stock that will be outstanding after this offering is comprised of shares held by the Selling Shareholder, shares sold in this offering and shares held by our directors, officers and employees. This number excludes:
- •
- shares of our common stock with a weighted average exercise price of $ per share, issuable upon exercise of outstanding stock options; and
- •
- shares of our common stock reserved for future issuances under our existing employee and director compensation plans.
7
Summary Historical Financial Data
The following tables summarize certain of our historical financial data. The summary historical consolidated financial information as of December 31, 2003 and 2002 and for each of the three years in the period ended December 31, 2003 has been derived from, and should be read in conjunction with, our audited Consolidated Financial Statements and the related notes included elsewhere in this prospectus as well as "Management Discussion and Analysis of Financial Condition and Results of Operations." The consolidated financial information as of December 31, 2001 is not included in this prospectus.
| | Year ended December 31, | |||||||||||
|---|---|---|---|---|---|---|---|---|---|---|---|---|
| | 2003 | 2002 | 2001 | |||||||||
| | (in thousands, except per share data) | |||||||||||
| Consolidated Statement of Operations:(1) | ||||||||||||
| Net sales | $ | 1,434,813 | $ | 1,247,885 | $ | 1,372,141 | ||||||
| Gross margin(2) | 286,294 | 279,228 | 311,499 | |||||||||
| Operating income (loss) | 66,542 | 33,708 | (75,495 | ) | ||||||||
| Net income (loss) | 22,976 | (36,583 | ) | (124,800 | ) | |||||||
| Preferred stock dividends | — | — | (61,846 | ) | ||||||||
| Net income (loss) applicable to common stock | 22,976 | (36,583 | ) | (186,646 | ) | |||||||
Common and Preferred Share Data: | ||||||||||||
| Earnings (loss) per share:(3) | ||||||||||||
| Basic and diluted from continuing operations | $ | 0.11 | $ | (0.03 | ) | $ | (0.69 | ) | ||||
| Basic and diluted | 0.11 | (0.18 | ) | (0.94 | ) | |||||||
| Dividends per: | ||||||||||||
| Common share | $ | — | $ | — | $ | 0.18 | ||||||
| Series A Preferred share | — | — | 2.52 | |||||||||
| Weighted average common shares outstanding: | ||||||||||||
| Basic | 200,898 | 200,458 | 198,997 | |||||||||
| Diluted | 200,924 | 200,458 | 198,997 | |||||||||
Other Data: | ||||||||||||
| Adjusted EBITDA(4) | $ | 127,746 | $ | 121,726 | $ | 139,215 | ||||||
| Cash flows from operating activities | 34,026 | 10,360 | 95,120 | |||||||||
| Capital expenditures | 41,820 | 38,773 | 47,408 | |||||||||
Consolidated Balance Sheet Data (at period end):(1) | ||||||||||||
| Total assets | $ | 993,866 | $ | 1,011,780 | $ | 1,123,278 | ||||||
| Total long-term debt | 529,966 | 523,287 | 532,497 | |||||||||
| Total liabilities | 1,090,059 | 1,172,673 | 1,220,583 | |||||||||
| Total shareholders' equity (deficit) | (96,193 | ) | (160,893 | ) | (97,305 | ) | ||||||
- (1)
- Operating results in 2003 include $4,748 in business realignment and impairment expense. Operating results in 2002 include $19,699 in business realignment and impairment expense consisting principally of $12,584 in plant closure costs, $3,265 in severance and $6,315 in non-cash impairment expense offset by a gain of $2,465 on the sale of a closed facility. Operating results in 2001 include $126,408 in business realignment and impairment expense consisting principally of $98,163 in impairment charges for our melamine crystal business that was shut down in early 2002, $23,285 in plant closure costs and $12,582 in severance offset by a gain of $10,507 on the sale of a closed facility. Also in 2001, we discontinued construction of a new plant and recorded a charge of $2,885. Our 2001 results also include $27,000 in impairment expense related to investments in and receivables from affiliates. See "Management's Discussion and Analysis of Financial Condition and Results of Operations—Adjustments to EBITDA."
- (2)
- Gross margin is calculated by deducting the cost of raw materials and processing from the amount of net sales. Costs of distributing the product to the final customer are separately reported as a distribution expense. Because not all companies use identical calculations, this presentation of gross margin may not be comparable to other similarly titled measures presented by other companies.
8
- (3)
- Basic and diluted net income (loss) attributable to common stock is computed by dividing net income by the weighted average number of common shares outstanding during the period including the effect of dilutive options, when applicable. See Note 2 to the Consolidated Financial Statements included elsewhere in this prospectus for additional information.
- (4)
- Adjusted EBITDA is defined as net income (loss) before depreciation and amortization, interest expense, other non-operating (expense) income, investment impairment, income taxes, income from discontinued operations, cumulative effect of change in accounting principle and other adjustments (including costs associated with business realignment activities, dispositions and pension settlement charges). See "Management's Discussion and Analysis of Financial Condition and Results of Operations—Adjustments to EBITDA." We use Adjusted EBITDA as the primary measure of segment performance because we believe it gives us a more complete understanding of our financial condition and operating results. We use Adjusted EBITDA to calculate various financial ratios and to measure our performance, and we believe some debt and equity investors also utilize this metric for similar purposes. Adjusted EBITDA is intended to show unleveraged, pre-tax operating results. This is the profitability measure we use to set management and executive incentive compensation. Adjusted EBITDA is not intended to represent any measure of performance in accordance with generally accepted accounting principles, or GAAP. Because not all companies use identical calculations, this presentation of Adjusted EBITDA may not be comparable to other similarly titled measures presented by other companies. This non-GAAP measure should not be used in isolation or as a substitute for a measure of performance or liquidity prepared in accordance with GAAP or as indicative of whether cash flows will be sufficient to fund our future cash requirements. The table below reconciles Adjusted EBITDA to net income (loss), which we believe to be the most directly comparable GAAP financial measure.
Reconciliation of Adjusted EBITDA to Net Income (Loss)
| | Year ended December 31, | |||||||||
|---|---|---|---|---|---|---|---|---|---|---|
| | 2003 | 2002 | 2001 | |||||||
| | (in thousands) | |||||||||
| Adjusted EBITDA | $ | 127,746 | $ | 121,726 | $ | 139,215 | ||||
| Depreciation and amortization | (47,319 | ) | (47,947 | ) | (59,361 | ) | ||||
| Adjustments to EBITDA(a) | (13,885 | ) | (40,071 | ) | (155,349 | ) | ||||
| Interest expense | (46,138 | ) | (47,315 | ) | (51,613 | ) | ||||
| Affiliated interest expense | (558 | ) | (1,402 | ) | (11,488 | ) | ||||
| Other non-operating (expense) income(b) | (1,529 | ) | 5,989 | (1,841 | ) | |||||
| Investment impairment(c) | — | — | (27,000 | ) | ||||||
| Income tax benefit | 4,659 | 2,262 | 30,833 | |||||||
| Income from discontinued operations, net of tax(d) | — | — | 11,804 | |||||||
| Cumulative effect of change in accounting principle | — | (29,825 | ) | — | ||||||
| Net income (loss) | $ | 22,976 | $ | (36,583 | ) | $ | (124,800 | ) | ||
- (a)
- For the year ended December 31, 2003, Adjustments to EBITDA consisted of $6,988 related to plant closure costs, $6,837 related principally to administrative workforce reduction programs, $3,183 in impairment charges and $3,123 in other income. For the year ended December 31, 2002, Adjustments to EBITDA consisted of $12,584 related to plant closure costs, $3,265 related primarily to administrative workforce reduction programs, $6,315 in impairment charges, a pension settlement charge of $13,600 and $4,307 in other expenses. For the year ended December 31, 2001, Adjustments to EBITDA consisted of $23,285 related to plant closure costs, $12,582 in severance costs, $101,048 in impairment charges, a pension settlement charge of $15,813 and $2,621 in other expenses. For more information about Adjustments to EBITDA see "Management's Discussion and Analysis of Financial Condition and Results of Operations—Adjustments to EBITDA".
- (b)
- For the year ended December 31, 2003, other non-operating (expense) income consisted primarily of a loss on the settlement of an intercompany loan resulting from foreign currency translation. For the year ended December 31, 2002, other non-operating (expense) income consisted of $2,741 of gain on the repurchase of debt in the open market and $1,722 of gain on an interest swap. For the year ended December 31, 2001, other non-operating (expense) income consisted principally of a loss on an interest rate swap.
- (c)
- For the year ended December 31, 2001, investment impairment consisted of $17,000 related to the write-down of a receivable from, and preferred stock investments in, WKI Holding Company, Inc. ("WKI"), one of our former affiliates, and $10,000 related to our write-off of our remaining investment in BCPM.
- (d)
- For the year ended December 31, 2001, income from discontinued operations, net of tax, consisted of earnings from our consumer adhesives business prior to its sale. See Note 7 to the Consolidated Financial Statements included elsewhere in this prospectus.
9
An investment in our common stock involves a high degree of risk. You should carefully consider the following information, together with other information in this prospectus, before buying shares of our common stock. If any of the following risks or uncertainties occurs, our business, financial condition and results of operations could be materially and adversely affected. The trading price of our common stock could decline and you may lose all or a part of the money you paid to buy our common stock. The risks described below are not the only ones facing our company. Additional risks not currently known to us or that we currently deem immaterial also may impair our business, financial condition and results of operations.
Risks Relating to Our Business
Demand for our products is cyclical and we may experience prolonged depressed market conditions for our products, which may adversely affect our results of operations.
Our products are used in industries that are cyclical in nature, such as the construction, furniture, automotive, oilfield services, chemicals, electronics, communications and steel production industries. We sell our products to manufacturers in those industries who incorporate them into their own products. Our largest end-market is the construction industry, which accounted for approximately 35% of our net sales in 2003. Sales to the construction industry are driven by trends in commercial and residential construction, housing starts and trends in residential repair and remodeling. Consumer confidence, mortgage rates and income levels play a significant role in driving demand in the residential construction, repair and remodeling sector. A drop in consumer confidence or an increase in mortgage rates or unemployment could cause a slowdown in the construction industry, and in particular the residential construction, repair and remodeling industry. We cannot assure you that such adverse developments will not occur and, if they do occur, that they will not have a material adverse effect on our results of operations.
Downturns in one or more of the other businesses that use our products can adversely affect our net sales and operating profit. Many of our customers are in businesses that are cyclical in nature and sensitive to changes in general economic conditions. In 2003, our North American forest products thermoset resins business was adversely affected by a decline in the furniture sector in the United States. In 2002, sales of our oilfield services products declined 29% as a result of reduced drilling activity. We also experienced a decline in the demand for our UV coating products as a result of significantly lower demand for fiber-optic cable in 2002. Demand for our products depends, in part, on general economic conditions, and a decline in economic conditions in the industries served by our customers has, and may continue to have, a material adverse effect on our business. We cannot assure you that an economic downturn in one or more of the businesses or geographic regions in which we sell our products would not have a material adverse effect on our results of operations.
We rely significantly on raw materials in the production of our products and fluctuations in costs could adversely effect our financial condition and profitability.
The three primary feedstock raw materials that we use in our manufacturing processes are methanol, phenol and urea. Our manufacturing operations depend upon obtaining adequate supplies of these raw materials on a timely basis. These raw materials are generally available from numerous independent suppliers. During the past three years, the price of these materials has been volatile. In 2003, for example, the average prices of methanol, phenol and urea increased by 42%, 22% and 50%, respectively. We are exposed to price risks associated with these raw material purchases. The availability and prices of raw materials may be subject to curtailment or change due to, among other things, new laws or regulations, suppliers' allocations to other purchasers, interruptions in production
10
by suppliers, changes in exchange rates, cost components of raw materials and worldwide price levels. Our results of operations could be adversely affected if we were unable to obtain adequate supplies of raw materials in a timely manner or if the costs of raw materials increased significantly. From time to time, suppliers may extend lead times, limit supplies or increase prices due to capacity constraints or other factors. Although certain of our contracts include competitive price clauses that allow us to buy outside the contract if market pricing falls below contract pricing and other contracts have minimum-maximum monthly volume commitments that allow us to take advantage of spot pricing, we cannot assure you that we will be able to purchase raw materials at market price. In addition, some of our customer contracts include selling price provisions that are indexed to publicly available indices for these commodity raw materials; however, we may not be able to immediately pass on raw material price increases to our customers, if at all. Due to differences in timing of the pricing mechanism trigger points between our sales and purchase contracts there is often a "lead-lag" impact during which margins are negatively impacted for the short term in periods of rising raw material prices and positively impacted in periods of falling raw material prices. We cannot assure you that raw material prices will decrease from currently high levels or that we will be able to capitalize on any such reductions in a timely manner, if at all. In addition, we cannot assure you that the fluctuation in price of our primary raw materials will not have an adverse effect on our financial condition and profitability.
Rising energy costs may result in increased operating expenses and reduced net income.
Natural gas is essential in our manufacturing processes, and its cost can vary widely and unpredictably. Energy costs have risen significantly over the past several years due to the increase in the cost of oil and natural gas and the recent shortages of energy in various states. Our operating expenses increased in 2003 and will continue to increase if these costs continue to rise or do not return to historical levels. Rising energy costs may also increase our raw material costs. If we cannot pass these costs through to our customers, our business, financial condition or results of operations may be adversely affected. In addition, rising energy costs also negatively impact our customers and the demand for our products. These risks will be exacerbated if our customers or production facilities are in locations experiencing severe energy shortages.
Environmental matters could have a substantial negative impact on our results of operations.
Our operations involve the use, handling, processing, storage, transportation and disposal of hazardous materials and are subject to extensive environmental laws and regulations at the national, state, local and international level. Such environmental laws and regulations include those governing the discharge of pollutants into the air and water, the management and disposal of hazardous materials and wastes, the cleanup of contaminated sites and occupational health and safety. We have incurred, and will continue to incur, significant costs and capital expenditures in complying with these laws and regulations. In 2003, we incurred $5.2 million in capital expenditures to comply with environmental laws and regulations. In addition, violations of environmental laws or permits may result in restrictions being imposed on our operating activities or in our being subjected to substantial fines, penalties, criminal proceedings, third party property damage or personal injury claims or other costs. In addition, future developments or increasingly stringent regulation could require us to make additional unforeseen environmental expenditures.
Even if we fully comply with environmental laws, we are subject to liability associated with hazardous substances in soil, groundwater and elsewhere at a number of sites. These include sites that we formerly owned or operated, and sites where hazardous wastes and other substances from our current and former facilities and operations have been treated, stored or disposed of, as well as sites that we currently own or operate. Depending upon the circumstances, our liability may be joint and several, meaning that we may be held responsible for more than our proportionate share, or even all, of the liability involved. Environmental conditions at such sites can lead to claims against us for
11
personal injury or wrongful death, property damages, and natural resource damages, as well as to claims and obligations for the investigation and cleanup of environmental conditions. The extent of any such liabilities can be difficult to predict.
We have been notified that we are or may be responsible for environmental remediation at a number of sites in the United States, and we are also undertaking a number of voluntary cleanups. We believe the most significant of these and the site that makes up over half of our remediation accrual is the site formerly owned by us in Geismar, Louisiana. We cannot assure you that, as a result of former, current or future operations, there will not be additional environmental remediation or restoration liabilities or claims of personal injury by employees or members of the public due to exposure or alleged exposure to hazardous materials in connection with our operations, properties or products. We are aware of several sites, sold by us over 20 years ago, that may have significant site closure or remediation costs. It has been reported in the local press that closure or remediation costs associated with one of these sites will exceed $100 million. Actual costs at these sites, as well as our share, if any, are unknown to us at this time. In addition, we have been named in two tort actions relating to one of these sites.
We cannot assure you that these environmental liabilities or obligations, or any that may arise or become known to us in the future, will not have a material adverse effect on our business, financial condition, results of operations or cash flows.
We are subject to government regulation.
We are subject to regulation by many U.S. and non-U.S. supranational, national, federal, state and local governmental authorities. In some circumstances, before we may sell some of our products these authorities must approve these products, our manufacturing processes and facilities. As our facilities grow, we may become subject to additional regulation or higher compliance standards. We are also subject to ongoing reviews of our products and manufacturing processes. In order to obtain regulatory approval of certain new products, we must, among other things, demonstrate to the relevant authority that the product is safe for its intended uses and that we are capable of manufacturing the product in accordance with current regulations. The process of seeking approvals can be costly, time consuming and subject to unanticipated and significant delays. We cannot assure you that approvals will be granted to us on a timely basis, or at all. Any delay in obtaining, or any failure to obtain or maintain, these approvals would adversely affect our ability to introduce new products and to generate revenue from those products. New laws and regulations may be introduced in the future that could result in additional compliance costs, seizures, confiscation, recall or monetary fines, any of which could prevent or inhibit the development, distribution or sale of our products. If we fail to comply with applicable laws and regulations, we may be subject to civil remedies, including fines, injunctions, recalls or seizures, which could have an adverse effect on our business, financial condition or results of operations.
We produce hazardous chemicals that require appropriate procedures and care to be used in handling them or using them to manufacture other products. For example, formaldehyde is an extensively regulated chemical, which various government agencies continue to evaluate to determine whether to promulgate additional regulations. In the past year, several updates of epidemiology reports were published, two of which suggest a potential relationship between formaldehyde and leukemia for workers exposed to formaldehyde. Today scientists are analyzing these newest reports to determine their validity and significance before any health conclusions are drawn from the reports' findings. However, certain government-related health assessment reviews are proceeding very rapidly based, at least in part, on these new reports, without detailed scientific evaluations and analyses of these newest reports. As a result, the International Agency for Research on Cancer, or IARC, is expected to make a determination whether formaldehyde should be reclassified as a "known human carcinogen" from a "probable human carcinogen." Such a reclassification could lead to further federal and state
12
governmental review of existing regulations on formaldehyde, which could result in additional requirements and capital expenditures to achieve and maintain compliance. In addition, the European Commission recently published a proposal, known as Registration, Evaluation and Authorisation of Chemicals, or REACH, which would require manufacturers, importers and consumers of certain chemicals to register such chemicals and evaluate their potential impacts on human health and the environment. Based on the results of the evaluation, a newly created regulatory body would then determine if the chemical should be further regulated, restricted or banned from use. If REACH is enacted in its current form, it is possible that significant market restrictions could be imposed on the current and future uses of formaldehyde-based materials in the European Union. Because the timing and ultimate form of the potential REACH regulation is not yet known, we cannot accurately predict future compliance costs. Such costs could, however, be significant.
We also produce resin-coated sand, and because sand consists primarily of crystalline silica, the potential for silica exposure exists, which is a well known and recognized health hazard. The Occupational Safety and Health Administration, or OSHA, has indicated that a comprehensive standard for crystalline silica is likely needed to provide for exposure monitoring, medical surveillance and worker training. In order to achieve compliance with these possible future OSHA regulations, we may incur incremental costs over time, including increased capital expenditures in order to implement engineering controls to meet any new requirements. We cannot assure you that additional regulation of hazardous substances, including formaldehyde and silica, unfavorable publicity or increased litigation relating to such chemicals will not have a material adverse effect on our business, financial condition or results of operations.
We are subject to numerous legal actions that could have an impact on our profitability and our ability to operate certain businesses.
In 1998, pursuant to a merger and recapitalization transaction sponsored by The Blackstone Group, which we refer to as Blackstone, and financed by The Chase Manhattan Bank, which we refer to as Chase, Borden Decorative Products Holdings, Inc., or BDPH, one of our wholly owned subsidiaries, was acquired by Blackstone and subsequently merged with Imperial Wallcoverings to create Imperial Home Décor Group, or IHDG. Blackstone provided $84.5 million in equity, a syndicate of banks funded $198.0 million of senior secured financing and $125.0 million of senior subordinated notes were privately placed. We received approximately $314.4 million in cash and 11% of IHDG common stock for our interest in BDPH. On January 5, 2000, IHDG filed for reorganization under Chapter 11 of the U. S. Bankruptcy Code. The IHDG Litigation Trust, which we refer to as the Trust, was created pursuant to the plan of reorganization in the IHDG bankruptcy to pursue preference and other avoidance claims on behalf of the unsecured creditors of IHDG. In November 2001, the Trust filed a lawsuit against us and certain of our affiliates seeking to have the IHDG recapitalization transaction voided as a fraudulent conveyance and asking for a judgment to be entered against us for $314.4 million plus interest, costs and attorney fees. Discovery is proceeding in the case with a cut-off currently scheduled for November 2004. We have not recorded a liability for any potential losses because a loss is not considered probable based on current information. We believe that we have strong defenses to the Trust's allegations and we intend to defend the case vigorously. At this time, we are unable to estimate the amount of any reasonably possible losses and we cannot assure you that those losses will not be material.
In addition, we have historically faced a substantial number of lawsuits, including class action lawsuits, claiming liability for death, injury or property damage caused by products manufactured by us or with our components. These lawsuits, and any future lawsuits, could result in substantial damage awards against us, which in turn could encourage additional lawsuits. If formaldehyde is re-classified as a "known human carcinogen" by IARC, then it is possible that we will face product liability litigation, in addition to the cases we currently face, alleging injury from formaldehyde exposure. In addition,
13
there has been increased publicity about asbestos liabilities faced by manufacturing companies and, as a result of the bankruptcies of many producers of asbestos-containing products, plaintiff attorneys are increasing their focus on peripheral defendants, including us, and on other products, including silica and vinyl chloride monomer, or VCM. While we do not currently believe that we face any material liabilities as a result of product liability litigation and believe we have adequate insurance and reserves, we cannot assure you that these lawsuits will not result in material awards against us or other material costs to us.
In 1992, the State of Sao Paolo Tax Bureau issued an assessment against our primary Brazilian subsidiary claiming that excise taxes were owed on certain intercompany loans made for centralized cash management purposes, characterized by the Tax Bureau as intercompany sales. Since that time, the subsidiary and the Tax Bureau have held discussions, and our subsidiary has filed an administrative appeal seeking cancellation of the assessment. In December 2001, the Administrative Court upheld the assessment in the amount of 52.0 million Brazilian Real, an amount which includes tax, penalties, monetary correction and interest, or approximately $18.0 million. In September 2002, our subsidiary filed a second appeal with the highest level administrative court, again seeking cancellation of the assessment. We believe we have a strong defense against the assessment and we will pursue the appeal vigorously, including appealing to the judicial level. At this time we do not believe a loss is probable; therefore, only related legal fees have been accrued. Nonetheless, we cannot assure you that the assessment will not be upheld.
While it is not feasible to predict the outcome of pending suits and claims, the ultimate resolution of these matters could have an adverse effect upon our business, financial condition, results of operations or reputation. For more information about these and other legal proceedings see "Business—Legal Proceedings."
We are subject to liabilities arising out of the sale of several of our previously owned businesses.
We have sold various businesses and business lines and, in some instances, retained liability for those businesses pursuant to the sale contract or pursuant to applicable law. Although the majority of the contractual liabilities have expired, some remain in effect and could result in claims against us. For example, recently we reached tentative agreements with the successors in interest to two of our former subsidiaries that filed for protection under Chapter 11 of the United States Bankruptcy Code. The agreements provide for the settlement of all claims for an aggregate payment by us of approximately $7.1 million. We anticipate that the settlement agreements will be finalized and submitted to the bankruptcy court for approval in June 2004. However, we cannot assure you that these settlements will be approved or that additional claims will not be brought. See "Business—Legal Proceedings."
Our production facilities are subject to operating hazards.
We are dependent on the continued operation of our 48 production facilities, in particular our most significant plant in Louisville, Kentucky. These production facilities are subject to hazards associated with the manufacture, handling, storage and transportation of chemical materials and products, including pipeline leaks and ruptures, explosions, fires, inclement weather and natural disasters, mechanical failure, unscheduled downtime, labor difficulties, transportation interruptions, and environmental hazards, such as spills, discharges or releases of toxic or hazardous substances and gases, storage tank leaks and remediation complications. These hazards can cause personal injury and loss of life, severe damage to, or destruction of, property and equipment and environmental contamination and other environmental damage and could have a material adverse effect on our business, financial condition or results of operations. In addition, due to the nature of our business operations we have been and may continue to be subject to environmental movements. For example, currently there is an environmental movement at our Louisville facility led by residents of the "Rubbertown" area, in which there are many chemical facilities, including our plant. As is typical with these movements, residents
14
are claiming that the chemical facilities have caused health and property damage. We are also aware of two lawsuits involving one of our predecessor entities that allege residents living near one of our plants suffered health issues as a result of exposure to chemicals used at that plant. We cannot assure you that these movements will not result in litigation or damage to our reputation. See Note 22 to the Consolidated Financial Statements included elsewhere in this prospectus.
We are subject to adverse claims from our customers and their employees as a result of the hazardous nature of our products.
We produce hazardous chemicals that require appropriate procedures and care to be used in handling them or using them to manufacture other products. As a result of the nature of our products, we may face exposure relating to incidents involving our customers' handling, storage and use of our products. On February 20, 2003, an explosion occurred at the facility of one of our customers, CTA Acoustics, Inc., which we refer to as CTA. Seven plant workers were killed in the explosion and more than 40 workers were injured. There are six lawsuits in Laurel County, Kentucky, arising out of this incident, primarily seeking recovery for wrongful death personal injury, emotional distress, loss of consortium, property damage and indemnity. Because injured workers pursue claims against their employer in workers' compensation proceedings, they frequently pursue claims under various theories against product suppliers. We faced a similar lawsuit in the past. Although we believe that we have adequate insurance coverage to address any payments and/or legal fees in excess of $5 million involved in any single incident, we cannot assure you that we will not be subject to significant judgments given the nature of this litigation. We are also subject to suits involving asbestos, silica and VCM. Although (i) we typically obtain dismissals from asbestos product litigation because of plaintiffs' failure to identify a product containing asbestos that we manufactured; (ii) our only silica product is resin-coated sand, as contrasted with the sand used in sandblasting and other applications most commonly associated with silicosis; and (iii) many years ago we discontinued manufacturing VCM, which was manufactured primarily for our own use rather than for customer sale, we have been joined in such litigation as one of numerous defendants. We do not believe that we have a material asbestos, silica or VCM exposure and believe we have adequate reserves for such litigation. In addition, we have special arrangements providing limited insurance coverage for asbestos and VCM exposure. However, we cannot assure you that we will not be subject to significant judgments given the nature of the claims against us. We could have difficulty maintaining insurance coverage at reasonable rates if the number of claims involving products of a hazardous nature significantly increases. In addition, if formaldehyde is reclassified as a "known human carcinogen," we may face increased regulation and litigation.
Due to the nature of our business, we may not be able to provide complete insurance against all potential accidents.
Our operations are subject to the usual hazards associated with chemical manufacturing and the related storage and transportation of feedstocks, products and wastes, including explosions, fires, inclement weather and natural disasters, mechanical failure, unscheduled downtime, transportation interruptions, remediation, chemical spills, discharges or releases of toxic or hazardous substances or gases and other environmental risks. The hazards can cause personal injury and loss of life, severe damage to or destruction of property and equipment and environmental damage, and may result in suspension of operations and the imposition of civil or criminal penalties. Although we maintain property, business interruption and casualty insurance that we believe is in accordance with customary industry practices, we cannot assure you that we will not incur losses beyond the limits of, or outside the coverage of, our insurance policies. In addition, our insurance provides very limited, if any, coverage for liabilities associated with environmental matters or that may arise out of such accidents. From time to time, various types of insurance for companies in the chemical industry have not been available on commercially acceptable terms or, in some cases, have been unavailable, including
15
coverage for silica claims. We cannot assure you that in the future we will be able to maintain existing coverage or that premiums will not increase significantly.
We are exposed to political, economic and other risks that are inherent in operating an international business. Our substantial international operations subject us to risks not faced by domestic competitors, which include unfavorable political, regulatory, labor and tax conditions in other countries.
We have significant manufacturing operations outside the United States. In 2003, our net sales outside the United States represented 37% of our total sales. We have 21 production facilities located outside the United States, primarily concentrated in Canada, Brazil, the U.K., Australia and Malaysia. Accordingly, our business is subject to the differing legal, political, social and regulatory requirements and economic conditions of many jurisdictions. Risks are inherent in international operations, including, but not limited to, the following:
- •
- difficulty in enforcing agreements through foreign legal systems;
- •
- foreign customers may have longer payment cycles;
- •
- foreign countries may impose additional withholding taxes or otherwise tax our foreign income, impose tariffs or adopt other restrictions on foreign trade and investment, including currency exchange controls;
- •
- fluctuations in exchange rates may affect product demand and may adversely affect the profitability in U.S. dollars of products and services provided by us in foreign markets where payment for our products and services is made in the local currency;
- •
- increased costs of transportation or shipping;
- •
- risk of nationalization of private enterprises;
- •
- changes in general economic and political conditions in the countries in which we operate;
- •
- unexpected adverse changes in foreign laws or regulatory requirements, including with respect to environmental protection, export duties and quotas;
- •
- difficulty with staffing and managing widespread operations; and
- •
- required compliance with a variety of foreign laws and regulations.
In addition, intellectual property rights may be more difficult to enforce in foreign countries. We currently have joint ventures in China, where we will be licensing technology to our joint venture partners. We cannot assure you that we will be able to adequately protect our intellectual property in China or elsewhere. Our business in emerging markets requires us to respond to rapid changes in market conditions in these countries. Our overall success as a global business depends, in part, upon our ability to succeed in differing legal, regulatory, economic, social and political conditions. We cannot assure you that we will continue to succeed in developing and implementing policies and strategies which will be effective in each location where we do business. Furthermore, we cannot assure you that any of the foregoing factors will not have a material adverse effect on our business, financial condition and results of operations.
Currency translation risk and currency transaction risk may adversely affect our results of operations.
We conduct our business and incur costs in the local currency of most countries in which we operate. Accordingly, our results of operations are reported in the relevant local currency and then translated to U.S. dollars at the applicable currency exchange rate for inclusion in our financial statements. Changes in exchange rates between those foreign currencies and the U.S. dollar will affect
16
our net sales, cost of goods sold and operating margins and could result in exchange losses. In addition to currency translation risks, we incur currency transaction risk whenever one of our operating subsidiaries enters in either a purchase or a sales transaction using a different currency from the currency in which it receives revenues. In an effort to mitigate the impact of exchange rate fluctuations we engage in exchange rate hedging activities. However, we cannot assure you that the hedging transactions we enter into will be effective or will not result in foreign exchange hedging loss. The impact of future exchange rate fluctuations on our results of operations cannot be accurately predicted. Given the volatility of exchange rates, we cannot assure you that we will be able to effectively manage our currency transaction and/or translation risks, and any volatility in currency exchange rates may have an adverse effect on our financial condition or results or operations.
Terrorist attacks may negatively affect our operations, financial condition and results of operations.
The attacks of September 11, 2001 and subsequent events, including the continuing military action in Iraq and Afghanistan, have caused instability throughout the world. Terrorist attacks, including even modest individual incidents, may adversely affect our operations, financial condition and results of operations and may impact any or all of our physical facilities and operations, which are located in North America, Latin America, Europe and Asia Pacific, or those of our customers. Chemical-related assets may be at greater risk of future terrorist attacks than other possible targets in the United States and throughout the world. The resulting damage from a direct attack on our assets or assets used by us would be difficult to assess, may be severe and could include loss of life and property damage. In addition, available insurance coverage may not be sufficient to cover all of the damage incurred or may be prohibitively expensive.
Our cost reduction programs may not achieve the cost savings and operations improvements and efficiencies we expect, and we may have to implement further cost reduction programs and incur additional related charges.
In 2002, we implemented a major Six Sigma process initiative and in June 2003, we initiated the 2003 Realignment, which was designed to reduce operating expenses and increase organizational efficiency. To achieve the goals of these cost reduction and efficiency programs, we are reducing our workforce, streamlining processes, consolidating manufacturing processes and reducing general and administrative expenses. We will continue to implement cost reduction and efficiency programs intended to achieve cost savings and improve our operational results. These programs are subject to significant risks and uncertainties and, in certain circumstances, may require third party or governmental approval. Our ability to achieve the goals relating to our cost reduction programs and business realignments, including any anticipated expense reductions or operations improvements, will depend on a number of factors, some of which are outside of our control. Even if we complete our Six Sigma process initiative and our 2003 Realignment, we cannot assure you that we will achieve any of the cost reductions we anticipate or on the timetable we contemplate.
We may not be able to develop the new products that we need to remain competitive.
Our results of operations depend to a significant extent on our ability to expand our product offerings, and to continue to develop our production processes to be a competitive producer. We are committed to remaining a competitive producer and believe that our portfolio of new or re-engineered products is strong. We believe that approximately 15% of our net sales in 2003 were derived from products developed or re-engineered within the last three years. However, we may not be able to continue to develop new products, re-engineer our existing products successfully or bring them to market in a timely manner. For example, our historical research and development efforts generally have focused on customer service, and we may be unsuccessful in shifting our focus to the type of research that will lead to significant new product development. In addition, our research and development
17
scientists are generally located at our individual plants rather than at a research facility, which may impede their ability to share ideas and create new products. While we believe that the products, pricing, and services we offer customers are competitive, we cannot assure you that we will be able to continue to attract and retain customers to which to sell our products.
We face competition from other chemical companies, which could force us to lower our prices thereby adversely affecting our operating margins, financial condition and results of operations.
The markets in which we operate are highly competitive, and this competition could harm our business, results of operations, cash flow and financial condition. Our competitors include major international producers as well as smaller regional competitors. We believe that the most significant competitive factor for our products is selling price. We could be subject to adverse results caused by our competitors' pricing decisions. In addition, current and anticipated future consolidation among our competitors and customers may cause us to lose market share as well as put downward pressure on pricing. In addition, some of our competitors are larger, have greater financial resources and have less debt than we do. As a result, those competitors may be better able to withstand a change in conditions within our industry and throughout the economy as a whole. If we do not compete successfully, our business, financial condition and results of operations could be adversely affected.
Competition from producers of materials that are substitutes for formaldehyde-based resins could lead to declines in our net sales attributable to these products.
We face competition from a number of products that are potential substitutes for formaldehyde-based resins. Currently, we estimate that formaldehyde-based resins make up most of the resins used as panelboard resins, wood and specialty adhesives and industrial resins. Decreases in the average selling price of formaldehyde may have a material adverse effect on our profitability. For example, competition among producers of foundry and specialty resins has led to erosion in certain product prices in the past. Our ability to maintain or increase our profitability will continue to be dependent, in large part, upon our ability to offset decreases in average selling prices by improving production efficiency or by shifting to higher margin chemical products. If we are unable to do so, our business, financial condition and results of operations could be materially and adversely affected. In addition, in some markets, non-formaldehyde based resins may be an alternative to our formaldehyde-based resins. Considerable growth in these substitutes for formaldehyde-based resins could adversely affect our market share, net sales and profit margins. Furthermore, the movement toward substitute products could be exacerbated if the IARC, which is reviewing the carcinogenic classification of formaldehyde in June 2004, reclassifies formaldehyde from a "probable human carcinogen" to a "known human carcinogen." For more information, see the risk described above under the heading "—We are subject to government regulation."
Our strategy of supplementing our products through selective acquisitions and joint ventures presents risks.
We have made acquisitions of related businesses and entered into joint ventures in the recent past and intend to selectively pursue acquisitions of, and joint ventures with, related businesses as one element of our growth strategy. Our ability to implement this growth strategy will be limited by our ability to identify appropriate acquisition and joint venture candidates and our financial resources, including available cash and borrowing capacity. The expense incurred in consummating acquisitions of related businesses, or our failure to integrate such businesses successfully into our existing businesses, could result in our incurring unanticipated expenses and losses. Furthermore, we may not be able to realize any anticipated benefits from acquisitions or joint ventures. The process of integrating acquired operations into our existing operations may result in unforeseen operating difficulties and may require significant financial resources that would otherwise be available for the ongoing development or
18
expansion of existing operations. Some of the risks associated with our acquisition and joint venture strategy include:
- •
- potential disruption of our ongoing business and distraction of management;
- •
- unexpected loss of key employees or customers of the acquired company;
- •
- conforming the acquired company's standards, processes, procedures and controls with our operations;
- •
- coordinating new product and process development;
- •
- hiring additional management and other critical personnel; and
- •
- increasing the scope, geographic diversity and complexity of our operations.
In addition, we may encounter unforeseen obstacles or costs in the integration of acquired businesses. Also, the presence of one or more material liabilities of an acquired company that are unknown to us at the time of acquisition may have a material adverse effect on our business. We cannot assure you that our acquisition and joint venture strategy will be successfully received by customers or that we will realize any anticipated benefits from acquisitions or joint ventures.
Changes in our customers' products or location can reduce the demand for our products.
Our products are used for a broad range of applications by our customers. Changes, including technological changes, in our customers' products or processes may make our products unnecessary, which would reduce the demand for those products. Other customers may find alternative materials or processes that no longer require our products.
In addition, many of our customers are moving off shore. Given the nature of our products, in particular, formaldehyde, which is not easily or cost-efficiently transportable over distances in excess of 150 miles, in order to maintain demand for our products, we need to remain in close proximity to our customers. We may face significant loss of business if we are not successful in establishing production facilities in regions to which our customers relocate. As our customers relocate outside the United States, our business will necessarily become more international exacerbating the risks described above under "—We are exposed to political, economic and other risks that are inherent in operating an international business. Our substantial international operations subject us to risks not faced by domestic competitors, which include unfavorable political, regulatory, labor and tax conditions in other countries." Our foreign currency exposure will also increase as a result of this trend. We cannot assure you that we will be able to establish production facilities near our customers or that such facilities will be successful.
Our substantial indebtedness could adversely affect our financial health, limit our ability to raise additional capital to implement our strategic initiatives and prevent us from fulfilling our obligations under our existing indebtedness.
We will continue to be highly leveraged after this offering. As of December 31, 2003, we had total indebtedness of $556.4 million and shareholders' deficit of $96.2 million. Our ability to generate sufficient cash flow from operations to make scheduled payments on our debt depends on a range of economic, competitive and business factors, many of which are outside our control. We cannot assure you that our business will generate sufficient cash flow from operations or that currently anticipated cost savings and operating improvements will be realized on schedule or at all. If we are unable to meet our expenses and debt obligations, we may need to refinance all or a portion of our indebtedness on or before maturity, sell assets or raise equity. We cannot assure you that we would be able to refinance any of our indebtedness, sell assets or raise equity on commercially reasonable terms or at all, which could cause us to default on our obligations and impair our liquidity. Our inability to generate
19
sufficient cash flow to satisfy our debt obligations, or to refinance our obligations on commercially reasonable terms, would have an adverse effect on our business, financial condition and results of operations.
In addition, as of December 31, 2003, we had $98.0 million of availability under our senior secured revolving credit facility, which we refer to as our Credit Facility. The agreement governing our Credit Facility contains restrictive covenants. Failing to comply with the covenants in the agreement governing our Credit Facility and the agreements governing our other indebtedness could result in an event of default which, if not cured or waived, could have a material adverse effect on our business, financial condition and results of operations.
Our substantial indebtedness could have important consequences to you. For example, it could:
- •
- require us to dedicate a substantial portion of our cash flow from operations to payments on our indebtedness, thereby reducing the availability of our cash flow to fund working capital, capital expenditures, research and development efforts and other general corporate purposes;
- •
- limit our ability to secure additional financing to implement our strategic initiatives;
- •
- increase the amount of our interest expense, because certain of our borrowings are at variable rates of interest, which, if interest rates increase, could result in higher interest expense;
- •
- increase our vulnerability to general adverse economic and industry conditions;
- •
- limit our flexibility in planning for, or reacting to, changes in our business and the industry in which we operate;
- •
- restrict us from making strategic acquisitions, introducing new technologies or exploiting business opportunities;
- •
- make it more difficult for us to satisfy our obligations with respect to our existing indebtedness; and
- •
- limit, along with the financial and other restrictive covenants in our indebtedness, among other things, our ability to borrow additional funds, dispose of assets or pay cash dividends.
Our future success depends on our ability to retain our key employees.
We are dependent on the services of Craig O. Morrison, our President and Chief Executive Officer, and other members of our senior management team to remain competitive in our industry. The loss of Mr. Morrison or any other member of our senior management team could have an adverse effect on us. There is a risk that we will not be able to retain or replace these key employees. Most of our current key employees are subject to employment conditions or arrangements that contain post employment non-competition provisions. However, these agreements permit the employees to terminate their employment on relatively short notice.
Some of our employees are unionized, represented by workers' councils or are employed subject to local laws that are less favorable to employers than the laws of the United States.
Less than 10% of our employees are unionized. Some of our employees are employed in countries in which employment laws provide greater bargaining or other rights to employees than the laws of the United States. Such favorable employment rights require us to expend greater time and expense in making changes to employees' terms of employment or making staff reductions. For example, certain of our employees in Europe are represented by workers' councils which must approve any changes in conditions of employment, including salaries and benefits. While we believe that our relations with our employees are satisfactory, a significant dispute with our employees could have an adverse effect on our business, financial position, results of operations and cash flows.
20
We may not be able to utilize all of our tax assets before they expire.
We had net tax assets of $136.5 million at December 31, 2003. Included in this amount are net tax attributes, including net operating loss carry-forwards, of approximately $89.0 million, which we believe can be used to satisfy future tax payments. We have certain business strategies that we believe will allow us to utilize our tax assets before they expire; however, we cannot assure you that we will be able to utilize our tax assets or successfully execute such strategies. Further, if KKR ceases to own a majority of our common stock, then additional limitations on the utilization of the tax attributes will apply. We cannot assure you that we will be able to utilize our tax assets in the manner or in the timeframe we anticipate.
We rely on patents and confidentiality agreements to protect our intellectual property. Our failure to protect our intellectual property rights could adversely affect our future performance and growth.
Protection of our proprietary processes, methods and compounds and other technology is important to our business. Failure to protect our existing intellectual property rights may result in the loss of valuable technologies or having to pay other companies for infringing on their intellectual property rights. We rely on patent, trade secret, trademark and copyright law as well as judicial enforcement to protect such technologies. A majority of our patents relate to the development of new products and processes for manufacturing and use thereof and expire at various times between 2004 and 2023. Some of our technologies are not covered by any patent or patent application. In addition, we cannot assure you that any of our patents will not be challenged, invalidated, circumvented or rendered unenforceable. Furthermore, we cannot assure you that any pending patent application filed by us will result in an issued patent, or if patents are issued to us, that those patents will provide meaningful protection against competitors or against competitive technologies.
Our production processes and products are specialized. We cannot assure you that we will not face patent infringement claims from our competitors or others alleging that our processes or products infringe on their proprietary technology. If we were subject to a infringement suit, we may be required to change our processes or products or stop using certain technologies or producing the infringing product entirely. Even if we ultimately prevail in an infringement suit, the existence of the suit could cause our customers to seek other products that are not subject to infringement suits. Any infringement suit could result in significant legal costs and damages and impede our ability to produce key products, which could have a material adverse effect on our business, financial condition and results of operations.
In addition, effective patent, trademark, copyright and trade secret protection may be unavailable or limited in some foreign countries. In some countries we do not apply for patent, trademark, or copyright protection. We also rely upon unpatented proprietary manufacturing expertise, continuing technological innovation and other trade secrets to develop and maintain our competitive position. While we generally enter into confidentiality agreements with our employees and third parties to protect our intellectual property, we cannot assure you that our confidentiality agreements will not be breached, that they will provide meaningful protection for our trade secrets or proprietary manufacturing expertise or that adequate remedies will be available in the event of an unauthorized use or disclosure of our trade secrets and manufacturing expertise. In addition, others may obtain knowledge of our trade secrets through independent development or other access by legal means. The failure of our patents or confidentiality agreements to protect our processes, apparatuses, technology, trade secrets and proprietary manufacturing expertise, methods and compounds could have an adverse effect on our business, financial condition or results of operations.
21
Risks Relating to Our Common Stock and This Offering
There is no existing market for our common stock, and we do not know if one will develop to provide you with adequate liquidity. If our stock price fluctuates after this offering, you could lose a significant part of your investment.
Prior to this offering, there has not been a public market for our common stock. We cannot predict the extent to which investor interest in our company will lead to the development of an active trading market on The New York Stock Exchange or otherwise or how liquid that market might become. If an active trading market does not develop, you may have difficulty selling any of our common stock that you buy. The initial public offering price for the shares will be determined by negotiations between the Selling Shareholder and the representatives of the underwriters and may not be indicative of prices that will prevail in the open market following this offering. Consequently, you may not be able to sell shares of our common stock at prices equal to or greater than the price paid by you in this offering. The market price of our common stock may be influenced by many factors, some of which are beyond our control, including
- •
- the failure of securities analysts to cover our common stock after this offering or changes in financial estimates by analysts;
- •
- announcements by us or our competitors of significant contracts or acquisitions;
- •
- variations in quarterly operating results;
- •
- loss of a large customer or supplier;
- •
- general economic conditions;
- •
- terrorist acts;
- •
- future sales of our common stock; and
- •
- investor perceptions of us and the industries in which our products are used.
As a result of these factors, investors in our common stock may not be able to resell their shares at or above the initial offering price. In addition, the stock market in general has experienced extreme price and volume fluctuations that have often been unrelated or disproportionate to the operating performance of companies like us. These broad market and industry factors may materially reduce the market price of our common stock, regardless of our operating performance.
KKR controls us and may have conflicts of interest with other shareholders in the future.
After this offering, the Selling Shareholder will own % of our common stock, or % if the underwriters exercise their over-allotment option in full. As a result, KKR will continue to be able to control the election of our directors, determine our corporate and management policies and determine, without the consent of our other shareholders, the outcome of any corporate transaction or other matter submitted to our shareholders for approval, including potential mergers or acquisitions, asset sales and other significant corporate transactions. KKR will also have sufficient voting power to amend our organization documents. KKR is in the business of making investments in companies and may, from time to time, acquire and hold interests in businesses that compete directly or indirectly with us. KKR may also pursue acquisition opportunities that may be complementary to our business, and as a result, those acquisitions opportunities may not be available to us. So long as an affiliate of KKR continues to own a significant amount of the outstanding shares of our common stock, KKR will continue to be able to strongly influence or effectively control our decisions, including potential mergers or acquisitions, asset sales and other significant corporate transactions. In addition, because we are a controlled company within the meaning of The New York Stock Exchange rules, we will be exempt from most corporate governance requirements. We cannot assure you that the interests of KKR will coincide with the interests of other holders of our common stock.
22
Future sales of our common stock in the public market could lower our stock price.
We, the Selling Shareholder and our other shareholders may sell shares of common stock in subsequent public offerings. We may also issue additional shares of common stock to finance future acquisitions. Upon completion of this offering, assuming that the underwriters do not exercise their over-allotment option, shares of our common stock will be owned by an affiliate of KKR. We are party to a registration rights agreement with an affiliate of KKR that will provide such affiliate with the right to require us to effect the registration of its shares. In addition, if we propose to register any of our shares of common stock under the Securities Act, whether for our own account or otherwise, KKR's affiliate will be entitled to include its shares of common stock in that registration. Prior to this offering, we and our shareholders will have agreed with the underwriters to a "lock-up" period, meaning that such parties may not, other than with respect to shares that they may sell in this offering and subject to certain other exceptions, sell any of their existing shares of our common stock or exercise any registration rights without the prior written consent of Credit Suisse First Boston LLC and Morgan Stanley & Co. Incorporated until 180 days after the date of this prospectus. However, in the event that either (1) during the last 17 days of the "lock-up" period, we release earnings results or material news or a material event relating to us occurs or (2) prior to the expiration of the "lock-up" period, we announce that we will release earnings results during the 16-day period beginning on the last day of the "lock-up" period, then in either case the expiration of the "lock-up" period will be extended until the expiration of the 18-day period beginning on the date of release of the earnings results or the occurrence of the material news or material event, as applicable, unless Credit Suisse First Boston LLC and Morgan Stanley & Co. Incorporated waive such an extension. We cannot predict the size of future issuances of our common stock or the effect, if any, that future issuances and sales of shares of our common stock will have on the market price of our common stock. Sales of substantial amounts of our common stock (including shares issued in connection with an acquisition), or the perception that such sales could occur, may adversely affect prevailing market prices for our common stock.
The proceeds from this offering will not be available to us.
We will not receive any of the proceeds from the sale of shares by the Selling Shareholder. The Selling Shareholder will receive all net proceeds from the sale of the shares of our common stock in this offering. Accordingly, the proceeds from this offering will not be available to us to finance our operations, capital expenditures or investment activities.
The price of our common stock may fluctuate significantly, and you could lose all or part of your investment.
Volatility in the market price of our common stock may prevent you from being able to sell your shares at or above the price you paid for your shares. The market price of our common stock could fluctuate significantly for various reasons which include the following:
- •
- our quarterly or annual earnings or those of other companies in our industry;
- •
- the public's reaction to our press releases, our other public announcements and our filings with the Securities and Exchange Commission, or SEC;
- •
- changes in earnings estimates or recommendations by research analysts who track our common stock, the stock of other chemical companies or the stock of companies in our primary end-markets;
- •
- changes in general conditions in the U.S. and global economy, financial markets or chemical industry, including those resulting from war, incidents of terrorism or responses to such events;
- •
- sales of common stock by the Selling Shareholder and our directors and executive officers; and
- •
- the other factors described in these "Risk Factors."
23
In addition, in recent years, the stock market has experienced extreme price and volume fluctuations. This volatility has had a significant impact on the market price of securities issued by many companies, including companies in our industry. The changes frequently appear to occur without regard to the operating performance of these companies. The price of our common stock could fluctuate based upon factors that have little or nothing to do with us, and these fluctuations could materially reduce our stock price.
You will incur immediate and substantial dilution.
The initial public offering price is substantially higher than the adjusted net tangible book value per share of our outstanding common stock. As a result, if you purchase shares in this offering, you will incur immediate and substantial dilution in the amount of $ per share. As of , there were shares of our common stock reserved for issuance upon exercise of outstanding options at a weighted average exercise price of $ per share. To the extent these securities are exercised, you will incur further dilution. See "Dilution" for a more complete description of the dilution you will incur.
We may not be able to pay dividends in the future.
Our Board of Directors currently intends to declare and pay quarterly dividends on our common stock. The declaration and payment of dividends is subject to the discretion of our Board of Directors and depends on various factors, including our net income, financial condition, cash requirements, future prospects and other factors deemed relevant by our Board of Directors. Our Credit Facility imposes restrictions on our ability to pay dividends, and thus our ability to pay dividends on our common stock will depend upon, among other things, our level of indebtedness at the time of the proposed dividend and whether we are in default under any of our debt instruments. See "Description of Indebtedness." Our future dividend policy will also depend on the requirements of any future financing agreements to which we may be a party and other factors considered relevant by our Board of Directors. For a discussion of our cash resources and needs, see "Management's Discussion and Analysis of Financial Condition and Results of Operations—Liquidity and Capital Resources."
24
CAUTIONARY STATEMENT CONCERNING FORWARD-LOOKING STATEMENTS
Some of the statements under "Prospectus Summary," "Risk Factors," "Management's Discussion and Analysis of Financial Condition and Results of Operations," "Business" and elsewhere in this prospectus may include forward-looking statements that reflect our current views with respect to future events and financial performance. These statements include forward-looking statements both with respect to us and the chemicals industry. Statements that include the words "believes," "expects," "may," "will," "should," "seeks," "intends," "plans," "estimates," "anticipates" or the negative version of those words or other comparable terminology and similar statements of a future or forward-looking nature identify forward-looking statements.
All forward-looking statements address matters that involve risks and uncertainties. Accordingly, there are or will be important factors that could cause actual results to differ materially from those indicated in these statements. We believe that these factors include but are not limited to those discussed in "Risk Factors." We undertake no obligation to publicly update or review any forward-looking statement, whether as a result of new information, future developments or otherwise, except as otherwise required by law.
25
We will not receive any proceeds from the sale of shares of our common stock offered in this offering. The Selling Shareholder will receive all net proceeds from the sale of shares of our common stock in this offering.
We currently intend to declare and pay quarterly dividends on our common stock. The declaration and payment of dividends is subject to the discretion of our Board of Directors and depends on various factors, including our net income, financial condition, cash requirements, future prospects and other factors deemed relevant by our Board of Directors. We have not paid any dividends on our common stock in the two most recent fiscal years. Our Credit Facility imposes restrictions on our ability to pay dividends, and thus our ability to pay dividends on our common stock will depend upon, among other things, our level of indebtedness at the time of the proposed dividend and whether we are in default under any of our debt instruments. See "Description of Indebtedness." Our future dividend policy will also depend on the requirements of any future financing agreements to which we may be a party and other factors considered relevant by our Board of Directors. For a discussion of our cash resources and needs, see "Management's Discussion and Analysis of Financial Condition and Results of Operations—Liquidity and Capital Resources."
26
The following table sets forth our cash and cash equivalents and capitalization as of December 31, 2003. You should read this table in conjunction with our audited Consolidated Financial Statements and the related notes included elsewhere in this prospectus and "Selected Historical Financial Data," "Use of Proceeds" and "Management's Discussion and Analysis of Financial Condition and Results of Operations."
| | As of December 31, 2003 | |||||
|---|---|---|---|---|---|---|
| | (in thousands) | |||||
| Cash and cash equivalents | $ | 28,162 | ||||
Debt: | ||||||
| Credit Facility(1) | $ | 220 | ||||
| 9.200% debentures due 2021 | 114,800 | |||||
| 7.875% debentures due 2023 | 246,782 | |||||
| 8.375% debentures due 2016 | 78,000 | |||||
| 9.250% debentures due 2019 | 47,295 | |||||
| Industrial revenue bonds | 34,000 | |||||
| Loan payable to affiliates(2) | 18,260 | |||||
| Other debt(3) | 17,036 | |||||
| Total debt | 556,393 | |||||
Shareholders' Equity (Deficit): | ||||||
| Common stock, par value $0.01 per share (300,000,000 shares authorized; 200,895,628 shares issued and outstanding)(4) | 2,009 | |||||
| Paid-in capital | 1,224,011 | |||||
Receivable from parent(5) | (512,094 | ) | ||||
| Deferred compensation | (1,488 | ) | ||||
| Accumulated other comprehensive income (loss) | (128,193 | ) | ||||
| Accumulated (deficit) | (680,438 | ) | ||||
| Total shareholders' equity (deficit) | (96,193 | ) | ||||
| Total Capitalization | $ | 460,200 | ||||
- (1)
- At December 31, 2003, our $175.0 million Credit Facility had $98.0 million of availability and $46.0 million in letters of credit outstanding.
- (2)
- Consists of borrowings by us, along with HAI, from Foods. See "Certain Relationships and Related Party Transactions."
- (3)
- Consists primarily of borrowings in Australia related to the financing of the Fentak Pty. Ltd acquisition in 2003, borrowings in Brazil related to miscellaneous capital expansion projects and financing of our general insurance premiums.
- (4)
- Common stock as adjusted for the 2004 Reorganization (as defined) is as follows: shares authorized; and shares issued and outstanding.
- (5)
- The receivable from parent will be assumed and effectively cancelled as a result of the completion of the 2004 Reorganization which will have no net impact of shareholders' equity (deficit). See "Certain Relationships and Related Party Transactions."
27
Dilution is the amount by which the offering price paid by the purchasers of the common stock to be sold in this offering will exceed the net tangible book value per share of common stock after the offering. The net tangible book value per share is equal to the amount of our total tangible assets (total assets less intangible assets) less total liabilities, divided by the number of shares of our common stock outstanding as of December 31, 2003. After giving effect to the sale of shares of common stock in this offering at an assumed initial public offering price of $ per share (the midpoint of the range set forth on the cover page of this prospectus) and after deducting estimated underwriting discounts and commissions and our estimated offering expenses totaling approximately $ million, our adjusted net tangible book value as of December 31, 2003 would have been $ , or $ per share of common stock. This represents an immediate dilution in net tangible book value of $ per share to new investors.
The following table illustrates this per share dilution:
| Initial public offering price per share | $ | ||||||
| Net tangible book value per share before this offering | $ | ||||||
| Increase per share attributable to this offering | |||||||
| Adjusted net tangible book value per share after this offering | |||||||
| Dilution per share to new investors | $ | ||||||
The following table summarizes the total number of shares of common stock purchased from the Selling Shareholder, the total consideration paid to the Selling Shareholder and the average price per share paid by existing shareholders and by new investors purchasing shares in this offering:
| | Shares Purchased | Total Consideration | | ||||||||||
|---|---|---|---|---|---|---|---|---|---|---|---|---|---|
| | Average Price Per Share | ||||||||||||
| | Number | Percent | Amount | Percent | |||||||||
| Existing shareholders | % | $ | % | $ | |||||||||
| New Investors | $ | ||||||||||||
| Total | 100.0 | % | $ | 100.0 | % | $ | |||||||
The tables and calculations above assume no exercise of outstanding options. As of , there were shares of our common stock reserved for issuance upon exercise of outstanding options at a weighted average exercise price of $ per share. To the extent that these options are exercised, there will be further dilution to new investors. See "Management—Executive Compensation," "Management—Option Grants" and "Description of Capital Stock."
28
SELECTED HISTORICAL FINANCIAL DATA
Set forth below is certain of our historical financial data. We derived the data as of and for each of the five years ended December 31, 2003, 2002, 2001, 2000 and 1999, from audited financial statements. The consolidated statement of operations, common and preferred share data and other data for the years ended December 31, 2003, 2002 and 2001, and the consolidated balance sheet data as of December 31, 2003 and 2002 were derived from our Consolidated Financial Statements audited by Deloitte & Touche LLP, which are included elsewhere in this prospectus. The consolidated statement of operations, common and preferred share data and other data for the year ended December 31, 2000 and 1999 and the consolidated balance sheet data as of December 31, 2001, 2000 and 1999 were derived from our audited consolidated financial statements that are not included in this prospectus. You should read this data in conjunction with "Management's Discussion and Analysis of Financial Condition and Results of Operations" and our audited Consolidated Financial Statements and the related notes included elsewhere in this prospectus.
| | Year ended December 31, | |||||||||||||||||
|---|---|---|---|---|---|---|---|---|---|---|---|---|---|---|---|---|---|---|
| | 2003 | 2002 | 2001 | 2000 | 1999 | |||||||||||||
| | (in thousands, except per share data) | |||||||||||||||||
| Consolidated Statement of Operations:(1)(2) | ||||||||||||||||||
| Net sales | $ | 1,434,813 | $ | 1,247,885 | $ | 1,372,141 | $ | 1,377,845 | $ | 1,274,740 | ||||||||
| Gross margin(3) | 286,294 | 279,228 | 311,499 | 321,041 | 381,958 | |||||||||||||
| Operating income (loss) | 66,542 | 33,708 | (75,495 | ) | 38,739 | 106,451 | ||||||||||||
| Net income (loss) | 22,976 | (36,583 | ) | (124,800 | ) | 33,974 | 52,946 | |||||||||||
| Preferred stock dividends | — | — | (61,846 | ) | (73,724 | ) | (73,724 | ) | ||||||||||
| Net income (loss) applicable to common stock | 22,976 | (36,583 | ) | (186,646 | ) | (39,750 | ) | (20,778 | ) | |||||||||
Common and Preferred Share Data: | ||||||||||||||||||
| Earnings (loss) per share:(4) | ||||||||||||||||||
| Basic and diluted from continuing operations | $ | 0.11 | $ | (0.03 | ) | $ | (0.69 | ) | $ | (0.36 | ) | $ | 0.22 | |||||
| Basic and diluted | 0.11 | (0.18 | ) | (0.94 | ) | (0.20 | ) | (0.10 | ) | |||||||||
| Dividends per: | ||||||||||||||||||
| Common share | $ | — | $ | — | $ | 0.18 | $ | 0.31 | $ | 0.32 | ||||||||
| Series A Preferred share | — | — | 2.52 | 3.00 | 3.00 | |||||||||||||
| Weighted average common shares outstanding: | ||||||||||||||||||
| Basic | 200,898 | 200,458 | 198,997 | 198,975 | 198,975 | |||||||||||||
| Diluted | 200,924 | 200,458 | 198,997 | 198,975 | 198,975 | |||||||||||||
Other Data: | ||||||||||||||||||
| Capital expenditures | $ | 41,820 | $ | 38,773 | $ | 47,408 | $ | 104,549 | $ | 74,796 | ||||||||
| Adjusted EBITDA(5) | 127,746 | 121,726 | 139,215 | 168,100 | 192,929 | |||||||||||||
| Cash flows from operating activities | 34,026 | 10,360 | 95,120 | 22,900 | 71,800 | |||||||||||||
Consolidated Balance Sheet Data (at period end):(1)(2) | ||||||||||||||||||
| Total assets | $ | 993,866 | $ | 1,011,780 | $ | 1,123,278 | $ | 1,520,597 | $ | 1,737,906 | ||||||||
| Total long-term debt | 529,966 | 523,287 | 532,497 | 530,530 | 541,074 | |||||||||||||
| Total liabilities | 1,090,059 | 1,172,673 | 1,220,583 | 1,506,328 | 1,673,695 | |||||||||||||
| Total shareholders' equity (deficit) | (96,193 | ) | (160,893 | ) | (97,305 | ) | 14,269 | 64,211 | ||||||||||
- (1)
- Certain amounts have been reclassified for consistency with subsequent years' presentations. In 2001, we sold our consumer adhesives business and recorded an impairment charge on the melamine crystal business assets and sold a common stock equity investment. Additionally, in 2001, our prepaid pension asset was reclassified to equity as a minimum pension adjustment. In 2000, we acquired a formaldehyde operation from BCPOLP and Central Wax, a wax emulsions producer. In 1999, we acquired Blagden Chemical, Ltd. in the U.K. and Spurlock Industries, Inc. in the U.S.
29
- (2)
- Operating results in 2003 include $4,748 in business realignment and impairment expense. Operating results in 2002 include $19,699 in business realignment and impairment expense consisting principally of $12,584 in plant closure costs, $3,265 in severance and $6,315 in non-cash impairment expense offset by a gain of $2,465 on the sale of a closed facility. Operating results in 2001 include $126,408 in business realignment and impairment expense consisting principally of $98,163 in impairment charges for our melamine crystal business that was shut down in early 2002, $23,285 in plant closure costs and $12,582 in severance offset by a gain of $10,507 on the sale of a closed facility. Also in 2001, we discontinued construction of a new plant and recorded a charge of $2,885. Our 2001 results also include $27,000 in impairment expense related to investments in and receivables from affiliates. See "Management's Discussion and Analysis of Financial Condition and Results of Operations—Adjustments to EBITDA."
- (3)
- Gross margin is calculated by deducting the cost of raw materials and processing from the amount of net sales. Costs of distributing the product to the final customer are separately reported as a distribution expense. Because not all companies use identical calculations, this presentation of gross margin may not be comparable to other similarly titled measures presented by other companies.
- (4)
- Basic and diluted net income (loss) attributable to common stock is computed by dividing net income by the weighted average number of common shares outstanding during the period including the effect of dilutive options, when applicable. See Note 2 to the Consolidated Financial Statements included elsewhere in this prospectus for additional information.
- (5)
- Adjusted EBITDA is defined as net income (loss) before depreciation and amortization, interest expense, other non-operating (expense) income, investment impairment, income taxes, income from discontinued operations, cumulative effect of change in accounting principle and other adjustments (including costs associated with business realignment activities, dispositions and pension settlement charges). See "Management's Discussion and Analysis of Financial Condition and Results of Operations—Adjustments to EBITDA." We use Adjusted EBITDA as the primary measure of segment performance because we believe it gives us a more complete understanding of our financial condition and operating results. We use Adjusted EBITDA to calculate various financial ratios and to measure our performance, and we believe some debt and equity investors also utilize this metric for similar purposes. Adjusted EBITDA is intended to show unleveraged, pre-tax operating results. This is the profitability measure we use to set management and executive incentive compensation. Adjusted EBITDA is not intended to represent any measure of performance in accordance with GAAP. Because not all companies use identical calculations, this presentation of Adjusted EBITDA may not be comparable to other similarly titled measures presented by other companies. This non-GAAP measure should not be used in isolation or as a substitute for a measure of performance or liquidity prepared in accordance with GAAP or as indicative of whether cash flows will be sufficient to fund our future cash requirements. The table below reconciles Adjusted EBITDA to net income (loss), which we believe to be the most directly comparable GAAP financial measure.
Reconciliation of Adjusted EBITDA to Net Income (Loss)
| | Year ended December 31, | |||||||||||||||
|---|---|---|---|---|---|---|---|---|---|---|---|---|---|---|---|---|
| | 2003 | 2002 | 2001 | 2000 | 1999 | |||||||||||
| | (in thousands) | |||||||||||||||
| Adjusted EBITDA | $ | 127,746 | $ | 121,726 | $ | 139,215 | $ | 168,100 | $ | 192,929 | ||||||
| Depreciation and amortization | (47,319 | ) | (47,947 | ) | (59,361 | ) | (55,691 | ) | (52,246 | ) | ||||||
| Adjustments to EBITDA(a) | (13,885 | ) | (40,071 | ) | (155,349 | ) | (73,670 | ) | (34,232 | ) | ||||||
| Interest expense | (46,138 | ) | (47,315 | ) | (51,613 | ) | (62,654 | ) | (63,059 | ) | ||||||
| Affiliated interest expense | (558 | ) | (1,402 | ) | (11,488 | ) | (19,146 | ) | (22,240 | ) | ||||||
| Other non-operating (expense) income(b) | (1,529 | ) | 5,989 | (1,841 | ) | 26,370 | 40,513 | |||||||||
| Investment impairment(c) | — | — | (27,000 | ) | (67,969 | ) | (3,000 | ) | ||||||||
| Income tax benefit (expense) | 4,659 | 2,262 | 30,833 | 12,401 | (14,118 | ) | ||||||||||
| Income from discontinued operations, net of tax(d) | — | — | 11,804 | 106,233 | 8,399 | |||||||||||
| Cumulative effect of change in accounting principle | — | (29,825 | ) | — | — | — | ||||||||||
| Net income (loss) | $ | 22,976 | $ | (36,583 | ) | $ | (124,800 | ) | $ | 33,974 | $ | 52,946 | ||||
- (a)
- For the year ended December 31, 2003, Adjustments to EBITDA consisted of $6,988 related to plant closure costs, $6,837 related principally to administrative workforce reduction programs, $3,183 in impairment charges and $3,123
30
in other income. For the year ended December 31, 2002, Adjustments to EBITDA consisted of $12,584 related to plant closure costs, $3,265 related primarily to administrative workforce reduction programs, $6,315 in impairment charges, a pension settlement charge of $13,600 and $4,307 in other expenses. For the year ended December 31, 2001, Adjustments to EBITDA consisted of $23,285 related to plant closure costs, $12,582 in severance costs, $101,048 in impairment charges, a pension settlement charge of $15,813 and $2,621 in other expenses. For the year ended December 31, 2000, Adjustments to EBITDA consisted of $38,100 related to plant closure costs, a $25,330 loss on the termination of a supply agreement and other charges of $10,240. For the year ended December 31, 1999, Adjustments to EBITDA consisted of $13,000 related to plant closure costs in the Philippines and $25,000 of asset impairment expense related to discontinuing a plant expansion project. For more information about Adjustments to EBITDA see "Management's Discussion and Analysis of Financial Condition and Results of Operations—Adjustments to EBITDA".
- (b)
- For the year ended December 31, 2003, other non-operating (expense) income consisted primarily of a loss on the settlement of an intercompany loan resulting from foreign currency translation. For the year ended December 31, 2002, other non-operating (expense) income consisted of $2,741 of gain on the repurchase of debt in the open market and $1,722 of gain on an interest swap. For the year ended December 31, 2001, other non-operating (expense) income consisted of a loss on an interest rate swap. For the years ended December 31, 2000 and 1999, non-operating income primarily related to interest income earned on investments.
- (c)
- For the years ended December 31, 2001, investment impairment consisted of $17,000 related to the write-down of a receivable from, and preferred stock investments in, WKI and $10,000 related to our write-off of our remaining investment in BCPM. For the year ended December 31, 2000, investment impairment consists of a $47,969 impairment of an investment in preferred stock and a $20,000 impairment of an investment in BCPM.
- (d)
- For the years ended December 31, 2001, 2000 and 1999, income from discontinued operations, net of tax, consisted of earnings of our consumer adhesives business prior to its sale. In addition, a $93,000 gain related to a previously sold business was recorded in 2000. See Note 7 to the Consolidated Financial Statements included elsewhere in this prospectus.
31
MANAGEMENT'S DISCUSSION AND ANALYSIS OF FINANCIAL
CONDITION AND RESULTS OF OPERATIONS
The following is a discussion and analysis of our historical consolidated financial statements. This discussion should be read in conjunction with "Selected Historical Financial Data" and our audited Consolidated Financial Statements and the related notes included elsewhere in this prospectus. All dollar amounts are in thousands, except where otherwise indicated.
Overview
We are one of the world's leading integrated producers of thermoset resins, adhesives and binders for the global forest products and industrial markets. In addition, we are the world's largest producer by volume of formaldehyde, an important and versatile building block chemical used in a wide variety of applications. We are the largest North American producer by volume of thermoset resins used in the production of engineered wood products, including structural wood panels, beams and non-structural panels, furniture, door and window assemblies and wallboards. We are also the largest North American producer by volume of resin-coated proppant systems, which are used in oilfield and natural gas production, and of foundry resins, which are used in the production of cores and molds for metal castings. We have a strong presence in the production of both specialty resins used in industrial markets and UV coatings for the production of fiber-optic cables, DVDs and CDs. Our materials are designed to deliver superior binding and bonding performance to manufacturers of thousands of common, everyday products that enhance modern living. Our strong position in North America is complemented by our significant operations in Latin America and Europe and expansion opportunities in Asia Pacific and Latin America.
Through our worldwide network of 48 strategically located production facilities, we serve more than 3,000 customers, with our largest customer representing 5% of net sales in 2003. Our customers operate in many diverse end-markets, such as construction, furniture, automotive, oil and gas, chemicals, electronics, communications and agriculture. In 2003, we generated net sales of $1,435 million, Adjusted EBITDA (as defined) of $127.7 million, operating income of $66.5 million and net income of $23.0 million. In 2003, 63% of our net sales were derived from sales in the United States, 15% from Canada and 22% from Latin America, Europe and Asia Pacific.
Our three reporting segments are the following: Forest Products, Performance Resins and International. Our results also include general corporate and administrative expenses disclosed as "Corporate and other" and activities related to our melamine crystal business, which we refer to as Melamine, which was shut down in 2002 and is disclosed as "Divested business." These are also presented to provide a complete picture of our results.
Forest Products' product lines include formaldehyde and forest products resins. The key business drivers for Forest Products are housing starts, furniture demand, panel production capacity and consumption, and general chemical sector operating conditions.
Performance Resins' product lines include oilfield products, foundry and specialty resins. Performance Resins' key business drivers are housing starts, auto builds, active gas drilling rigs and the general industrial sector performance.
International includes our production operations in Latin America, Europe and Asia Pacific, primarily concentrated in Brazil, the U.K., Australia and Malaysia. International product lines include formaldehyde, forest products and performance resins and consumer products. The key business drivers for International are export levels, panel production capacity, housing starts, furniture demand and the local political and general economic environments.
Corporate and other represents ongoing general and administrative expenses, and income and expenses related to liabilities retained from businesses sold in previous years.
32
Industry Conditions
Our results are impacted by the effect on our customers of economic upturns or downturns, as well as the impact on our own costs to produce, sell and deliver our products. Most of our products are used by our customers in their production processes and, therefore, factors impacting their industries could significantly affect our results.
In 2003, we were positively impacted by the strong U.S. housing market. According to Resource Information Systems, Inc., housing starts were up 8% in 2003 compared to 2002, driving a 3.5% increase in structural panel consumption. The mix in the structural panel consumption increase also benefited us, as OSB consumption, which on a per square foot basis uses more of our resins, was up 6.2%, while plywood consumption was essentially flat.
Higher natural gas prices, while hurting us from a processing cost perspective, increased the demand for our oilfield proppants used in the gas drilling industry. North American gas drilling rigs in active production increased 25% in 2003 driving a 43% increase in sales in our oilfield products.
The U.S. furniture production sector was down 3.3% in 2003, according to Resource Information Systems, Inc., negatively impacting the demand for our resins used in particleboard and MDF. Particleboard consumption in the United States was down 2.2% in 2003 due to increased imports and the decrease in furniture production. Current forecasts for 2004 by Resource Information Systems, Inc. are predicting that particleboard and MDF consumption will increase in 2004, as the weakened U.S. dollar will decrease the amount of imported products and the continued stable housing market and low interest rates will increase the demand for furniture.
Raw Material Costs. Raw material costs make up approximately 75% of our product costs. The primary raw materials that we use are methanol, phenol and urea. During the past three years, the price of these materials has been volatile. In 2003, for example, the average prices of methanol, phenol and urea increased by 42%, 22% and 50%, respectively. To help mitigate this volatility, we have purchase and sale contracts with our vendors and customers with periodic price adjustment mechanisms. Due to differences in timing of the pricing mechanism trigger points between our sales and purchase contracts there is often a "lead-lag" impact during which margins are negatively impacted for the short term in periods of rising raw material prices and positively impacted in periods of falling raw material prices. In addition, the pass through of raw material price changes can result in significant variances in sales comparisons from year to year. In 2003, we had a favorable impact as raw material price increases late in 2002 and 2003 were passed through to customers, having a significant impact on 2003 net sales compared to 2002.
Regulatory Environment. Various government agencies are conducting formaldehyde health research and evaluating the need for additional regulations. We understand that IARC has scheduled an update review of its cancer classification of formaldehyde in June 2004. The recently formed Formaldehyde Council, Inc., of which we are a member, believes that any adverse findings would not be supported by the weight of most scientific evidence and epidemiology studies. Nonetheless, although formaldehyde has been heavily regulated for several years, further regulation of formaldehyde could follow over time, especially if IARC reclassifies formaldehyde as a "known human carcinogen." We believe that we will be able to comply with any likely regulatory impact. See "Risk Factors—Risks Relating to Our Business."
We support appropriate scientific research and risk-based policy decision-making, and we are working with industry groups, including the Formaldehyde Council, Inc., to ensure that governmental assessments and regulations are based on sound scientific information. We believe that we have credible stewardship programs and processes in place to provide compliant and cost-effective resin systems to our customers. However, as the world's largest producer of formaldehyde, and due to the significance of formaldehyde as a raw material in our manufacturing processes, we cannot assure you
33
that future regulatory changes relating to formaldehyde would not have a material impact on our business.
In addition, the European Union recently published a proposal known as REACH, which would require manufacturers, importers and consumers of certain chemicals to register such chemicals and evaluate their potential impacts on human health and the environment. Based on the results of the evaluation, a newly created regulatory body would then determine if the chemical should be further regulated, restricted or banned from use. If REACH is enacted in its current form, it is possible that significant market restrictions could be imposed on the current and future uses of formaldehyde-based materials in the European Union.
Competitive Environment. The chemical industry has been historically competitive, and we expect this competitive environment to continue in the foreseeable future. We compete with companies of varying size, financial strength and availability of resources. Price, customer service and product performance are the primary areas in which we compete.
Other Factors Impacting Our Results. Other pressures on our profit margins include rising utility costs and increasing benefit, general insurance and legal costs. We are taking a number of steps to control these costs, including modifying our Total Family Protection Plan in 2003. In addition, we are continuing to analyze our business structure, consolidating plants and functions where we can realize significant cost savings and productivity gains. These consolidations have resulted in asset impairment charges and severance costs, which are more specifically discussed in the following sections. See Note 6 to our Consolidated Financial Statements included elsewhere in this prospectus. Future consolidations or productivity initiatives may include additional asset impairment charges and severance costs.
We believe that the foregoing will continue in the foreseeable future. These market dynamics will require us to continue to focus on productivity improvements and risk mitigation strategies to enhance and protect our margins. As described below under "—Liquidity and Capital Resources—Risk Management," we have begun taking steps to manage factors impacting our margins through hedges of natural gas and foreign exchange exposures.
Overview of Results
Twelve Months Ended December 31, 2003 compared to Twelve Months Ended December 31, 2002
Our consolidated net sales increased $186,928, or 15.0%, in 2003 compared to 2002. This increase was primarily a result of the pass through of raw material cost increases. In addition, sales benefited from favorable currency translation in Canada, Latin America and Australia and increased demand for Performance Resins' oilfield products and Forest Products' formaldehyde. Slightly offsetting these increases were declines in Forest Products resins volumes in products servicing the furniture markets due to continued production declines in the North American furniture market and customer inventory reductions.
We reported net income of $22,976 for 2003 compared to a net loss of $36,583 for 2002. Of the $59,559 improvement, income from operations increased $32,834 reflecting decreased general and administrative, business realignment, impairment and management fee expenses. In addition, in 2002, we recognized a $29,825 charge taken for goodwill impairments upon the adoption of new accounting rules, which is reflected in the Cumulative effect of change in accounting principle in our 2002 Consolidated Statement of Operations. See Note 4 to our Consolidated Financial Statements included elsewhere in this prospectus.
Twelve Months Ended December 31, 2002 compared to Twelve Months Ended December 31, 2001
Our consolidated net sales decreased $124,256, or 9.1%, in 2002 compared to 2001. The primary driver of this decrease was a reduction in selling prices due to the pass through of lower raw material
34
costs and competitive pricing pressures. In addition, unfavorable foreign currency transaction in Canada and Latin America led to a decrease in overall net sales. Also contributing to the decrease was the reduction in Melamine sales of $15,803 due to its closure in early 2002 and the absence of sales from our business in Ecuador of $5,614 due to its sale in 2001.
We reported a net loss of $36,583 in 2002 compared to a net loss of $186,646 in 2001. The $150,063 improvement is due to increased income from operations of $109,203 primarily reflecting the absence in 2002 of the 2001 Melamine impairment charge of $98,163. In addition, non-operating expenses decreased by $49,214 reflecting the absence in 2002 of 2001 investment write-downs of $27,000 and reduced affiliate and third party interest expense. These improvements were partially offset by a $29,825 charge taken for goodwill impairments upon the 2002 adoption of new accounting rules, a reduced income tax benefit in 2002 of $28,571 reflecting a lower loss in 2002 than in 2001 and the absence of income from discontinued operations of $11,804 in 2002.
Critical Accounting Policies
In preparing our financial statements in conformity with U.S. GAAP, we have to make estimates and assumptions about future events that affect the amounts of reported assets, liabilities, net sales and expenses, as well as the disclosure of contingent assets and liabilities in the financial statements and accompanying notes. Some of these accounting policies require the application of significant judgment by management in the selection of appropriate assumptions for determining these estimates. By their nature, these judgments are subject to an inherent degree of uncertainty; therefore, we cannot assure you that actual results will not differ significantly from estimated results. We base these judgments on our historical experience, advice from experienced consultants, forecasts and other available information, as appropriate. Our significant accounting policies are more fully described in Note 2 to our Consolidated Financial Statements included elsewhere in this prospectus.
Our most critical accounting policies, which reflect significant management estimates and judgment in determining reported amounts in our Consolidated Financial Statements included elsewhere in this prospectus, are as follows:
Environmental remediation and restoration liabilities. Accruals for environmental matters are recorded in accordance with the guidelines of the AICPA Statement of Position 96-1, "Environmental Remediation Liabilities," when it is probable that a liability has been incurred and the amount of the liability can be estimated. We have accrued approximately $38,600 and $44,000 at December 31, 2003 and 2002, respectively, for all probable environmental remediation and restoration liabilities that can be estimated in accordance with the guidelines; our accrual is our best estimate of these liabilities. We believe that it is reasonably possible that the costs associated with such liabilities may fall within a range of $24,200 to $73,600. This estimate of the range of reasonably possible costs is less certain than the estimates upon which reserves are based, and in order to establish the upper limit of this range, we used assumptions that are less favorable to us among the range of reasonably possible outcomes, but we did not assume we would bear full responsibility for all sites, to the exclusion of other PRPs.
Factors influencing the possible range of costs for environmental remediation include the following:
- •
- the success of the selected method of remediation/closure procedures;
- •
- the development of new technology and improved procedures;
- •
- the possibility of discovering additional contamination during monitoring/remediation process;
- •
- the financial viability of other PRPs, if any, and their potential contributions;
- •
- the time period required to complete the work, including variations in anticipated monitoring periods; and
35
- •
- for projects in their early stages, the outcome of negotiations or litigation with governing regulatory agencies regarding plans for remediation.
Income tax assets and liabilities. Deferred income taxes represent the tax effect of temporary differences between amounts of assets and liabilities recognized for financial reporting purposes and the amounts recognized for tax purposes. Deferred tax assets are reduced by a valuation allowance when, in our opinion, it is more likely than not that some portion or all of the deferred tax assets will not be realized. We have business strategies that we would attempt to execute before any material deferred tax assets would go unused. We review income tax reserves on a quarterly basis. Management believes the reserves established for probable tax liabilities are appropriate at December 31, 2003.
In estimating accruals necessary for tax exposures, including estimating the outcome of audits by governing tax authorities, we apply the guidance of Statement of Financial Accounting Standards ("SFAS") No. 5, "Accounting for Contingencies," as well as SFAS No. 109, "Accounting for Income Taxes." These estimates require significant judgment and, in the case of audits by tax authorities, may often involve negotiated settlements.
Factors influencing the final determination of tax liabilities include the following:
- •
- future taxable income;
- •
- execution of business strategies; and
- •
- negotiations of tax settlements with taxing authorities.
Pension and postretirement assets and liabilities. The amounts recognized in our financial statements related to pension and postretirement benefit obligations are determined from actuarial valuations. Inherent in these valuations are certain assumptions, including the following:
- •
- rate to use for discounting the liability (average weighted rates were 5.8% for 2003 and 6.5% for 2002);
- •
- expected long-term rate of return on pension plan assets (average weighted rates were 8.2% for 2003 and 8.3% for 2002);
- •
- health care cost trend rates (used for pension and postretirement benefit obligations, due to our 2003 plan amendment, this assumption is no longer material to the determination of our liability);
- •
- rate of salary increases (average weighted rates were 4.2% for 2003 and 4.5% for 2002); and
- •
- mortality rate table (based on the 1983 GAM Table).
The most significant of these estimates is the expected long-term rate of return on pension plan assets. The actual return of our domestic pension plan assets in 2003 was 22%. Future returns on plan assets are subject to the strength of the financial markets, which we cannot predict with any accuracy.
These assumptions are updated annually. Actual results that differ from our assumptions are accumulated and amortized over future periods; therefore, these variances affect our expenses and obligations recorded in future periods. Future pension expense will also depend on future investment performance, changes in future discount rates and various other factors related to the population of participants in our pension plans.
In 2003, we amended the Total Family Protection Plan, which provides postretirement medical benefits such that, effective September 1, 2003, medical benefits are no longer provided to our retirees and their dependents who are over age 65. We estimate that our liability related to providing pension and postretirement medical benefits will be reduced by a total of approximately $88,000 and annual cash outlays anticipated under the pre-amended retiree medical benefit plan will be decreased by
36
approximately $10,000 on an ongoing basis. This amendment has reduced the potential for changes in health care cost trends to materially impact our financial statements.
Results of Operations by Segment
The following is a comparison of net sales and net income (loss) before depreciation and amortization, interest expense (loss), other non-operating income, investment impairment, income taxes, income from discontinued operations, cumulative effect of change in accounting principle and other adjustments (including costs associated with business realignment activities, dispositions and pension settlement costs). We refer to this as "Adjusted EBITDA." Adjusted EBITDA is presented by segment and for Corporate and other and Divested business. Adjusted EBITDA is the measure used by our management team in the evaluation of our operating results and in determining allocations of capital resources among the business segments.
| | 2003 | 2002 | 2001 | ||||||
|---|---|---|---|---|---|---|---|---|---|
| Net Sales to Unaffiliated Customers: | |||||||||
| Forest Products | $ | 755,767 | $ | 634,619 | $ | 656,694 | |||
| Performance Resins | 364,347 | 340,791 | 409,081 | ||||||
| International | 314,693 | 264,541 | 282,629 | ||||||
| Divested business | 6 | 7,934 | 23,737 | ||||||
| $ | 1,434,813 | $ | 1,247,885 | $ | 1,372,141 | ||||
| | 2003 | 2002 | 2001 | |||||||
|---|---|---|---|---|---|---|---|---|---|---|
| Adjusted EBITDA: | ||||||||||
| Forest Products | $ | 92,548 | $ | 92,918 | $ | 101,655 | ||||
| Performance Resins | 46,661 | 45,127 | 74,321 | |||||||
| International | 32,250 | 28,630 | 17,595 | |||||||
| Corporate and other | (43,713 | ) | (44,949 | ) | (54,356 | ) | ||||
| $ | 127,746 | $ | 121,726 | $ | 139,215 | |||||
Reconciliation of Adjusted EBITDA to Net Income (Loss)
| | Year ended December 31, | |||||||||
|---|---|---|---|---|---|---|---|---|---|---|
| | 2003 | 2002 | 2001 | |||||||
| | (in thousands) | |||||||||
| Adjusted EBITDA | $ | 127,746 | $ | 121,726 | $ | 139,215 | ||||
| Depreciation and amortization | (47,319 | ) | (47,947 | ) | (59,361 | ) | ||||
| Adjustments to EBITDA(a) | (13,885 | ) | (40,071 | ) | (155,349 | ) | ||||
| Interest expense | (46,138 | ) | (47,315 | ) | (51,613 | ) | ||||
| Affiliated interest expense | (558 | ) | (1,402 | ) | (11,488 | ) | ||||
| Other non-operating (expense) income | (1,529 | ) | 5,989 | (1,841 | ) | |||||
| Investment impairment | — | — | (27,000 | ) | ||||||
| Income tax benefit | 4,659 | 2,262 | 30,833 | |||||||
| Income from discontinued operations, net of tax | — | — | 11,804 | |||||||
| Cumulative effect of change in accounting principle | — | (29,825 | ) | — | ||||||
| Net income (loss) | $ | 22,976 | $ | (36,583 | ) | $ | (124,800 | ) | ||
- (a)
- See "Management's Discussion and Analysis of Financial Condition and Results of Operations—Adjustments to EBITDA."
37
Twelve Months Ended December 31, 2003 compared to Twelve Months Ended December 31, 2002
The following table presents the net sales variance for the year ended December 31, 2003 as a percentage increase (decrease) from the year ended December 31, 2002.
| | Volume | Price/Mix | Currency Translation | Other | Total | ||||||
|---|---|---|---|---|---|---|---|---|---|---|---|
| Forest Products | (1.0 | )% | 16.3 | % | 3.6 | % | 0.2 | % | 19.1 | % | |
| Performance Resins | 3.2 | % | 3.6 | % | — | 0.1 | % | 6.9 | % | ||
| International | (0.9 | )% | 14.2 | % | 5.4 | % | 0.3 | % | 19.0 | % |
Forest Products. Our Forest Products net sales increased $121,148, or 19.1%, in 2003 compared to 2002. Higher selling prices resulting from the pass through of raw material price increases was the primary reason for the increase. Favorable currency translation also contributed to the net sales improvement as the Canadian dollar strengthened compared to the U.S. dollar throughout 2003. These improvements were partially offset by a slight decline in volumes. Softer market conditions in the North American furniture sector during the year led to a decrease in demand for MDF and particleboard which are made with our UF resins. Increased competitive pressures also impacted volume for UF resins. This decline in UF resin volumes was largely offset by improved formaldehyde volumes due to demand from the general chemical sector and increased volumes in the PF resins driven by the strong housing market and demand for plywood and OSB, which are made with PF resins.
Adjusted EBITDA for Forest Products decreased $370, or 0.4%, in 2003 compared to 2002, primarily due to increased processing and freight costs and the volume decline. Our processing costs increased because of higher energy and insurance costs in 2003. The mix of our formaldehyde product sales changed during 2003, resulting in increased freight costs. Freight costs per pound vary depending on whether product is shipped via pipeline, rail or tanker. These negative factors were largely offset by margin improvements, driven primarily by resins product formulation initiatives and purchasing productivity.
Performance Resins. Our Performance Resins net sales increased $23,556, or 6.9%, in 2003 compared to 2002, primarily due to overall higher selling prices and increased volumes. Higher selling prices, primarily in specialty resins and oilfield products, were a result of the pass through of raw material price increases and an improved mix of oilfield products. Improvements in volumes, primarily for oilfield products, also contributed to the increase in sales. The improvement in our oilfield products' volumes resulted from increased demand due to an expansion in natural gas exploration and drilling activity in 2003, as previously discussed. Volume declines in our foundry and specialty resins products reflected continuing weak market conditions in the automotive, felt bonding, laminated flooring and furniture markets, as well as competitive pressures.
Adjusted EBITDA for Performance Resins increased $1,534, or 3.4%, in 2003 compared to 2002. This improvement is primarily due to improved volumes and reduced selling, general and administrative expenses. Improved oilfield volumes, although partially offset by volume declines in foundry and specialty resins, positively impacted Adjusted EBITDA. Reduced general and administrative expenses were a result of workforce reductions, open positions and a reduction in bad debt expense in 2003 compared to 2002, when we experienced several customer bankruptcies. These improvements were partially offset by higher distribution and processing costs. Distribution costs increased because of fuel surcharges and higher freight costs due to shipping oilfield products over a wider geographic area. Higher processing costs were a result of increased energy, equipment repair and insurance costs and the cost of operating a second oilfield products plant to meet customer demand.
International. Our International net sales for 2003 increased by $50,152, or 19.0%, compared to 2002, with our Latin American, Asian-Pacific and European businesses all contributing to the sales increase. Latin American sales increased by $15,802 due to favorable currency translation and strong
38
price improvements, slightly offset by a decline in volumes due to adverse market conditions, competitive pressures and market share losses in the consumer products market. Asia Pacific's $17,000 increase in sales reflected favorable currency translation and improvements in pricing and volumes. Europe's sales increase of $17,350 was due to strong price improvements, partially offset by unfavorable currency translation and a reduction in volumes due to the difficult market environment. For all three markets, the pricing improvements were a result of the pass through of raw material price increases.
International Adjusted EBITDA increased $3,620, or 12.6%, in 2003 compared to 2002. This improvement was essentially related to a $2,345 gain from the favorable settlement of a Brazilian foreign exchange claim and a $1,100 reserve reduction due to a revised estimate of a potential liability related to an excess duty imposed on the importation of inventory in Brazil. Also contributing to the improvement were productivity improvements in Europe and favorable currency translation in Asia Pacific and Latin America. These improvements were substantially offset by unfavorable product mix and reduced volumes in Latin America and Europe and increased processing costs in Latin America and Asia Pacific due to increased energy and equipment repair costs.
Corporate and other. Our Corporate and other expenses decreased $1,236 in 2003 compared to 2002. Contributing to this net decline in expenses were the following factors: we amended our Total Family Protection Plan during 2003, resulting in a reduction in plan expenses of approximately $11,500; we settled a Brazilian foreign exchange claim relating to a sold business for a gain of $2,826 and we recognized a $2,355 gain on the sale of our airplane. In addition, salary and benefit costs were lower in 2003 due to a reduction in workforce. Offsetting these reductions in expense were increased insurance and legal costs of approximately $13,100, and the absence of a 2002 adjustment that reduced our allowance for doubtful accounts.
Divested business. Amounts reported as Divested business in both years represents the disposition of remaining inventory and other assets of Melamine, which was closed in early 2002. We sold this business to a third party in the second quarter of 2003.
Twelve Months Ended December 31, 2002 compared to Twelve Months Ended December 31, 2001
The following table presents the net sales variance for the year ended December 31, 2002 as a percentage increase (decrease) from the year ended December 31, 2001.
| | Volume | Price/Mix | Translation | Other | Total | ||||||
|---|---|---|---|---|---|---|---|---|---|---|---|
| Forest Products | 6.9 | % | (8.8 | %) | (1.5 | %) | — | (3.4 | %) | ||
| Performance Resins | (13.9 | %) | (2.8 | %) | — | — | (16.7 | %) | |||
| International | 0.9 | % | (0.2 | %) | (4.5 | %) | (2.6 | %) | (6.4 | %) |
Forest Products. Net sales for our Forest Products business declined by $22,075, or 3.4%, in 2002, as decreasing prices due to the pass through of lower raw material prices more than offset volume increases. In addition, competitive pricing pressures negatively impacted the renewal of two large long-term customer contracts in 2002. Forest Products' 2002 sales were also negatively impacted by foreign currency translation due to the weaker Canadian dollar. Increased volumes were driven by gains in market share and strong demand due to a healthy housing sector.
39
Forest Products' Adjusted EBITDA decreased by $8,737, or 8.6%, from prior year. Competitive pressures, a negative lead-lag impact in the second half of the year and increased insurance and benefit costs were the principal causes of the decline.
Performance Resins Group. Our Performance Resins net sales decreased by $68,290, or 16.7%, in 2002, due to volume, mix and lower selling prices. While absolute volumes increased, a decrease in specialty oilfield and coatings volumes led to a decline in sales. The volume decline in oilfield products is due to reduced drilling activity in 2002. The coatings products volume decline is a result of significantly lower demand for fiber-optic cable in 2002. Lower selling prices in other specialty resins were the result of competitive pressures and the pass through of raw material price decreases.
Adjusted EBITDA for Performance Resins declined by $29,194, or 39.3%, in 2002, relating to the decrease in coatings and oilfield volumes discussed above. This decrease was partially offset by improved processing costs related to decreased energy costs and synergies realized as a result of the 2001 formation of HAI.
International. Our International net sales decreased $18,088, or 6.4%, in 2002, due chiefly to lower selling prices and volumes in Europe and Asia Pacific, the 2001 sale of our business in Ecuador and unfavorable foreign currency translation in Latin America. The lower selling prices resulted from the pass through of raw material price decreases in 2002 and competitive pressures in Europe.
Adjusted EBITDA from our International businesses increased $11,035, or 62.7%, in 2002 due to improved operational results in all regions. We attribute these improvements to improved margins relating to a positive lead-lag for the first half of the year and improved processing costs in Europe due to plant consolidations.
Corporate and other. Our Corporate and other expenses decreased by $9,407 compared to 2001. The improvement was driven by the benefits realized from our corporate reorganization in 2001, which we refer to as the 2001 Corporate Reorganization, and other workforce and cost reduction measures we made in 2002 and 2001.
Divested business. The divested business activity in 2002 and 2001 represents Melamine. Results for 2002 primarily related to the disposition of remaining inventory and other assets following its closure early in the year.
Adjustments To EBITDA
Our management team relies primarily on Adjusted EBITDA in the evaluation of operating results and the allocation of capital resources. This table details (expense) income not included in Adjusted EBITDA for purposes of this evaluation of our reporting segments. We monitor these activities separately from our operating results. These (expenses) income primarily relate to our realignment programs, pension and certain legal settlement charges and impairment charges:
| | Year Ended December 31, 2003 | ||||||||||||||||
|---|---|---|---|---|---|---|---|---|---|---|---|---|---|---|---|---|---|
| | Plant Closure | Severance | Impairment | Other | Total | ||||||||||||
| Forest Products | $ | (932 | ) | $ | (1,125 | ) | $ | — | $ | (90 | ) | $ | (2,147 | ) | |||
| Performance Resins | 94 | (397 | ) | (1,000 | ) | — | (1,303 | ) | |||||||||
| International | (7,720 | ) | (643 | ) | (2,183 | ) | 11,692 | 1,146 | |||||||||
| Corporate and other | (146 | ) | (4,672 | ) | — | (8,732 | ) | (13,550 | ) | ||||||||
| Divested business | 1,716 | — | — | 253 | 1,969 | ||||||||||||
| Total | $ | (6,988 | ) | $ | (6,837 | ) | $ | (3,183 | ) | $ | 3,123 | $ | (13,885 | ) | |||
As part of our 2003 Realignment designed to improve productivity and reduce our costs, we recorded 2003 plant closure costs of $6,988 consisting of plant employee severance of approximately $3,900, asset impairment expense related to the closure and consolidation of plants of approximately $3,200, environmental remediation costs relating to plant closures in Brazil of approximately $800 and
40
other costs of approximately $700. These costs were partially offset by a net reduction of reserves of approximately $1,600 no longer required for Melamine due to its sale in the second quarter of 2003.
We also recorded severance costs of $6,837 in 2003 related principally to administrative workforce reduction programs, primarily for the 2003 Realignment.
The impairment charges we recorded in 2003 relate to a reduction in our estimate of net realizable value for a facility held for sale, the impairment of goodwill related to our Malaysian operations resulting from our year-end analysis of goodwill and the recognition of fixed asset impairments at several international manufacturing facilities.
Other income not reflected in 2003 Adjusted EBITDA primarily represent gains of $12,260 on the sale of a former plant site in the U.K. and on the sale of Melamine, both of which were closed as part of our realignment programs. These gains were offset by a $5,929 charge related to tentative legal settlements reached with BCPM Liquidating LLC, or BCPM Liquidating, and BCP Liquidating LLC, or BCP Liquidity, (see Note 22 to our Consolidated Financial Statements included elsewhere in this prospectus) and severance expense included in general and administrative expense relating to positions to be replaced as part of the 2003 Realignment.
| | Year Ended December 31, 2002 | ||||||||||||||||
|---|---|---|---|---|---|---|---|---|---|---|---|---|---|---|---|---|---|
| | Plant Closure | Severance | Impairment | Other | Total | ||||||||||||
| Forest Products | $ | (1,107 | ) | $ | (250 | ) | $ | — | $ | — | $ | (1,357 | ) | ||||
| Performance Resins | (1,950 | ) | (102 | ) | (1,040 | ) | — | (3,092 | ) | ||||||||
| International | (2,844 | ) | (795 | ) | (5,275 | ) | 2,465 | (6,449 | ) | ||||||||
| Corporate and other | — | (2,118 | ) | — | (19,850 | ) | (21,968 | ) | |||||||||
| Divested business | (6,683 | ) | — | — | (522 | ) | (7,205 | ) | |||||||||
| Total | $ | (12,584 | ) | $ | (3,265 | ) | $ | (6,315 | ) | $ | (17,907 | ) | $ | (40,071 | ) | ||
Plant closure costs recorded in 2002 as part of our 2003 Realignment totaled $12,584 and consisted of plant employee severance of $2,721 and demolition, environmental and other costs relating to plant closure and consolidations of $9,863, including the closure of Melamine.
Our 2002 severance costs of $3,265 related primarily to administrative workforce reduction programs.
The impairment charges we recorded in 2002 pertain to a reduction in net realizable value for a facility held for sale and to fixed assets at several international manufacturing facilities.
Other expenses not reflected in 2002 Adjusted EBITDA primarily represent a pension settlement charge of $13,600 triggered by lump sum settlements paid to participants. In addition, we recorded additional management fees of $5,500 related to the wind-down of Capital. These expenses were partially offset by a $2,465 gain recognized on the sale of land associated with a closed plant in Spain.
| | Year Ended December 31, 2001 | ||||||||||||||||
|---|---|---|---|---|---|---|---|---|---|---|---|---|---|---|---|---|---|
| | Plant Closure | Severance | Impairment | Other | Total | ||||||||||||
| Forest Products | $ | (6,573 | ) | $ | (2,080 | ) | $ | — | $ | 10,507 | $ | 1,854 | |||||
| Performance Resins | 2,433 | (2,632 | ) | (2,885 | ) | — | (3,084 | ) | |||||||||
| International | (20,020 | ) | (179 | ) | — | (2,303 | ) | (22,502 | ) | ||||||||
| Corporate and other | 875 | (7,691 | ) | — | (37,202 | ) | (44,018 | ) | |||||||||
| Divested business | — | — | (98,163 | ) | 10,564 | (87,599 | ) | ||||||||||
| Total | $ | (23,285 | ) | $ | (12,582 | ) | $ | (101,048 | ) | $ | (18,434 | ) | $ | (155,349 | ) | ||
In 2001, we recorded plant closure costs totaling $23,285 relating to our 2001 Corporate Reorganization. These costs consisted of fixed asset write-offs of $11,863, plant employee severance of $1,862 and demolition, environmental and other costs for plant closure and consolidations of $9,560.
In addition, we recorded severance costs of $12,582 related to consolidation of general administrative functions including $3,265 related to the 2001 Corporate Reorganization.
41
We recorded significant impairment charges in 2001, primarily related to our decision to close Melamine. Of the $101,048 impairment charge, $98,163 related to this shut-down. This charge included the impairment of fixed assets, goodwill and spare parts of $62,527, $32,701 and $2,935, respectively. The remaining $2,885 of the impairment charge was for a domestic plant facility for which construction was discontinued in 2001.
Other expenses not reflected in 2001 Adjusted EBITDA primarily include a charge for environmental remediation of $19,028 relating to a former business. In addition, we recorded a pension settlement charge of $15,813 and a loss of $2,303 on the divestiture of our operations in Ecuador. These other expenses were partially offset by a $10,507 gain we recorded on the sale of land associated with a closed plant and earnings of $10,564 from Melamine, which was closed in early 2002.
Non-Operating Expenses and Income Tax Expense
Non-operating expense.
| | 2003 | 2002 | 2001 | |||||||
|---|---|---|---|---|---|---|---|---|---|---|
| Interest expense | $ | 46,138 | $ | 47,315 | $ | 51,613 | ||||
| Affiliated interest expense, net | 558 | 1,402 | 11,488 | |||||||
| Other non-operating expense (income) | 1,529 | (5,989 | ) | 1,841 | ||||||
| Investment write-downs and other charges | — | — | 27,000 | |||||||
| Total | $ | 48,225 | $ | 42,728 | $ | 91,942 | ||||
In 2003, our interest and net affiliated interest expense decreased $2,021 compared to 2002 due to lower debt balances and lower interest rates. Other non-operating expenses increased $7,518. We incurred a $1,367 loss on the settlement of an intercompany loan resulting from foreign currency translation. In addition, interest income declined by $1,409 in 2003 due to lower interest rates and lower average cash balances. The remainder of the variance is primarily related to gains realized in 2002 on interest rate swaps and debt buybacks described below.
In 2002, our affiliated interest expense declined by $10,086 compared to 2001 due to lower affiliate borrowings after repayments of debt made with cash received from Borden Holdings, Inc, or BHI, in connection with the 2001 Corporate Reorganization. In addition, our non-affiliated interest expense declined by $4,298 due to lower average borrowings. We also recognized a gain of $2,741 on the repurchase of debt in the open market and recorded a gain on an interest rate swap of $1,722.
In 2001, we recorded $27,000 of investment write-downs. Of this amount $17,000 related to the write-down of a receivable from and preferred stock investments in WKI. In addition, we wrote-off our remaining investment in BCP Management, Inc., or BCPM, of $10,000. Our 2001 other non-operating of $1,841 expense consisted primarily of a loss on an interest rate swap.
Income tax benefit.
| | 2003 | 2002 | 2001 | |||||||
|---|---|---|---|---|---|---|---|---|---|---|
| Income tax benefit | $ | (4,659 | ) | $ | (2,262 | ) | $ | (30,833 | ) | |
| Effective tax rate | — | 25 | % | 18 | % | |||||
Our 2003 consolidated rate reflects a benefit of $19,936 from the sale of the stock of Melamine in 2003. The tax basis of the stock exceeded the tax basis of the assets and we could not recognize this additional basis until the stock sale was completed in 2003. This benefit is a capital loss carryforward that can only be used against capital gains; therefore, we established a valuation reserve for the full amount of this benefit. Other 2003 activities reflected in the 2003 consolidated rate include a reduction of a valuation reserve in the amount of $14,534 related to tax assets we believe we are more likely than not to realize. Our 2003 tax rate also reflects the elimination of $1,624 of deferred tax liabilities associated with the BCPM bankruptcy. In addition, we reduced reserves for prior years' Canadian and U.S. tax audits by $3,997 as a result of preliminary settlements of certain matters in the fourth quarter
42
of 2003. The effective rate also reflects additional income tax expense of $9,324 on foreign dividend income and on deemed dividend income related to loans and guarantees from foreign subsidiaries.
Our 2002 consolidated tax rate reflects a valuation allowance recorded against the deferred benefit of interest expense deductions in the amount of $16,672 that are no longer more likely than not to be used due to limitations imposed by the Internal Revenue Service ("IRS"). During 2002, we reached preliminary settlement with the IRS regarding tax years 1998 and 1999. The outcome of this settlement was favorable to us, and as a result, we were able to reduce our accruals related to these years by $20,000.
Our 2001 consolidated tax rate reflects the non-deductible impairment of $31,692 on the fixed assets and goodwill related to the shut-down of Melamine. This rate also reflects $12,397 for the impact of foreign earnings that we expect to repatriate due to the anticipated sale of a foreign business, as well as our inability to use foreign tax credits associated with these earnings due to usage limitations. In early 2001, the IRS completed its final computation of the tax due for tax matters dating back to 1996. This computation was complex and involved multiple years and multiple adjustments. The final resolution resulted in an additional benefit included in our 2001 income tax benefit totaling $14,388.
Cash Flows
| | 2003 | 2002 | 2001 | ||||||||
|---|---|---|---|---|---|---|---|---|---|---|---|
| Cash provided by (used in): | |||||||||||
| Operating activities | $ | 34,026 | $ | 10,360 | $ | 95,120 | |||||
| Investing activities | (42,314 | ) | 81,464 | 210,981 | |||||||
| Financing activities | 21,710 | (101,716 | ) | (308,403 | ) | ||||||
| Net change in cash and cash equivalents | $ | 13,422 | $ | (9,892 | ) | $ | (2,302 | ) | |||
Operating Activities. Our 2003 operating activities provided cash of $34,026. This included the generation of $10,006 for net trading capital, an increase of $28,353 compared to 2002, and reductions in realignment expenditures of $13,253 and in interest payments of $1,462. This improvement in net trading capital, which consists of accounts receivable, inventory and accounts payable, resulted from our continued focus on working capital management during 2003. We focused on reducing days outstanding for accounts receivable, increasing inventory turns and improving the timing of payments of our accounts payable. Realignment expenditures of $11,801 declined from 2002 due to reduced levels of activity. Our cash interest payments were lower than the prior year as a result of lower interest rates. These favorable events were partially offset by higher tax payments of $18,390 in 2003 due primarily to international taxes.
Our 2002 operating activities provided cash of $10,360 in 2002. Cash generated from earnings after adjusting for non-cash items was substantially offset by interest payments of $46,928, net trading capital outflows of $18,347 and taxes paid of $978. Cash generated by net trading capital decreased by $44,494 compared to the prior year. This decline essentially related to higher accounts receivable at year-end 2000, which were collected in 2001, resulting in inflated inflows for 2001. Favorable timing of payments on accounts payable compared to 2001 was offset by unfavorable variances on inventory. Realignment expenditures in 2002 totaled $25,054, which was in line with 2001 spending levels. Our interest payments in 2002 were $46,928, a decrease of $23,330 from the prior year, due to debt repayments made late in 2001 and reduced interest rates in 2002.
Our 2001 operating activities provided cash of $95,120. In addition to cash generated by net income, our net trading capital generated $26,147 of cash related to decreases in accounts receivable and lower inventory levels, partially offset by unfavorable timing of accounts payable payments. We also received net tax refunds totaling $36,186, primarily due to favorable settlements of income tax audits. These cash inflows were partially offset by interest payments of $70,258.
43
Investing Activities. Our 2003 net investing activities used cash of $42,314. We spent $41,820 for capital expenditures, primarily for plant expansions and improvements. We also made two acquisitions in 2003: Fentak, and the business and technology assets of Southeastern Adhesives Company, or SEACO, for cash of $14,691 plus deferred payments totaling about $4,550 over the next five years. We realized proceeds of $14,197 from the sale of land associated with a closed plant in the U.K. and other miscellaneous assets.
Our 2002 cash inflow for investing activities of $81,464 primarily related to the sale of a note receivable from our consumer adhesives business, which we refer to as Consumer Adhesives, of $110,000 to BHI and to other assets sales to unrelated parties for $10,237. Our 2002 capital expenditures totaled $38,773 and related were primarily to plant expansions and improvements.
Our 2001 investing activities generated cash of $210,981. During 2001, we sold certain non-operating assets to BHI for cash of $160,888 as a part of the 2001 Corporate Reorganization. In addition, we received $96,977 from business divestitures, primarily from the Consumer Adhesives sale, with the remainder generated from the sale of our business in Ecuador. These 2001 inflows were partially offset by capital expenditures of $47,408, primarily for plant improvements and expansion.
Financing Activities. Our 2003 financing activities provided cash of $21,710. Capital contributions from affiliates of $9,300 and net external borrowings primarily related to the Fentak acquisition accounted for the cash inflow. Early in the third quarter of 2003, we completed the process of converting letters of credit from our uncommitted letter of credit facility to our Credit Facility (see "—Liquidity and Capital Resources") resulting in the release of restricted cash of $67,049, most of which was used to repay borrowings from affiliates; thus these net transactions had little impact on total financing cash generated.
Our 2002 financing activities used cash of $101,716. The 2002 activities included an increase in restricted cash of $66,165 relating to our establishment of a temporary uncommitted letter of credit facility (as described above), a repayment of a $31,581 note due to a former subsidiary and net repayments of borrowings of $3,379.
In 2001, we used cash of $308,403 for financing activities. These expenditures are primarily related to the repayment of affiliated loans of $212,432 and preferred dividend payments of $73,724 using the cash we generated from investing activities previously discussed. We cancelled our preferred stock in 2001 and have not paid common stock dividends since 2001.
Liquidity and Capital Resources
We have significant available borrowing capacity to augment cash generated by our operations. We expect to have adequate cash available from these sources throughout their duration to fund our cash requirements for operating our business and meeting our cash obligations. We believe we will be able to obtain new financing arrangements as needed to replace our existing facilities upon their expiration in future years.
We entered into a three-year senior secured revolving credit facility in the third quarter of 2002, which we refer to as our Credit Facility, under which we can borrow up to $175,000. This Credit Facility replaced a temporary uncommitted letter of credit facility established in 2002 described below and our previous $250,000 credit facility that expired in the third quarter of 2002.
Our Credit Facility is secured with inventory and accounts receivable in the U.S., Canada and the U.K., a portion of property and equipment in Canada and the U.K. and the stock of certain subsidiaries. Our maximum borrowing allowable under the Credit Facility is calculated monthly and is based upon specific percentages of eligible accounts receivable, inventory and fixed assets. This Credit Facility contains restrictions on dividends, limitations on borrowings from our affiliates ($30,000), capital expenditures ($68,000 in 2004) and on the payment of management fees ($5,000 per year). It
44
also includes a minimum trailing twelve-month fixed charge coverage ratio of 1.5 to 1.0 if aggregate availability is less than $25,000, 1.25 to 1.0 if aggregate availability is between $25,000 and $50,000 and 1.1 to 1.0 if aggregate availability is between $50,000 and $75,000. However, these requirements do not apply when aggregate availability exceeds $75,000. As of December 31, 2003, our maximum borrowing allowable under the Credit Facility was $144,000, of which $98,000, after outstanding letters of credit, was unused and available. As a result, we had no fixed charge coverage ratio requirements at December 31, 2003.
We established an uncommitted letter of credit facility in 2002 to transition our letter of credit requirements during the last year of operation of our previous credit facility. Under this letter of credit facility, we were required to provide cash collateral equivalent to 101% of letters of credit outstanding. This amount was classified as Restricted cash on our 2002 Consolidated Balance Sheet. In early July 2003, we completed the process of transferring all the letters of credit under this facility to our Credit Facility, resulting in the removal of the restrictions on the cash collateral.
We, along with HAI, had separate borrowing arrangements with our affiliate, Borden Foods Holdings Corporation, or Foods, evidenced by demand promissory notes bearing interest at variable rates. We reported these loans, which totaled $18,260 at December 31, 2003 and $84,680 at December 31, 2002, as Loans payable to affiliates on our Consolidated Balance Sheets contained elsewhere in this prospectus. The $30,000 limit on borrowings from affiliates under our Credit Facility became effective following the termination of our uncommitted letter of credit facility in 2003. Of the total loans outstanding, HAI owed $6,000 at December 31, 2003 and had $4,000 available for additional borrowings. The remainder of the loans related to us. Interest rates on these loans ranged from 1.0% to 4.75%, and interest expense totaled $558, $1,857 and $14,538 for the years ended December 31, 2003, 2002 and 2001, respectively. In early 2004, we entered into a similar affiliated borrowing agreement with another affiliate, BW Holdings, LLC, and cancelled its arrangement with Foods.
HAI replaced its loan agreement with Foods on January 28, 2004, when it entered into a three-year asset-backed revolving credit facility, which provides for a maximum borrowing of $20,000, which we refer to as the HAI facility. The HAI facility is secured with the assets of HAI. The maximum available under this facility is based upon specific percentages of eligible accounts receivable and inventory. The HAI facility restricts HAI's ability to pay dividends, engage in affiliate transactions, incur additional debt and make capital expenditures ($2,000 in 2004). In addition, HAI must maintain a minimum trailing twelve-month debt coverage ratio of 1.5 to 1.0.
Our Australian subsidiary entered into a five-year asset-backed credit facility in the fourth quarter of 2003, or the Australian facility, which provides for a maximum borrowing of $19,900 Australian Dollars, or approximately $15,000 based on exchange rates as of December 31, 2003. The Australian facility provided the funding for our Fentak acquisition (see Note 5 to our Consolidated Financial Statements included elsewhere in this prospectus for additional information on the acquisition), and it is secured by mortgages on the fixed assets of the Australian business and the stock of Australian subsidiaries. This facility includes a fixed rate component used for the acquisition, as well as a revolver and letter of credit facility. This facility restricts the Australian subsidiaries on the payment of dividends, the sale of assets and additional borrowings by the Australian businesses outside of this facility. This facility also contains financial covenants applying to the Australian subsidiaries including current ratio, interest coverage, debt service coverage and leverage. The fixed portion of the Australian facility requires minimum quarterly principal reductions totaling $450 Australian Dollars (approximately $330). The revolving facility component requires semi-annual principal reductions based on a portion of excess cash as defined in the agreement. At year-end 2003, our Australian subsidiary had $3,178 Australian dollars available under this facility, or approximately $2,400 based on exchange rates as of December 31, 2003.
45
We have additional international credit facilities that provide liquidity to these businesses in local currencies, totaling approximately $29,900 based on exchange rates as of December 31, 2003. Of this amount, approximately $15,900 (net of letters of credit and other guarantees of $7,700 and $2,300 of other draws) was available to fund working capital needs and capital expenditures of these businesses. There is an additional $4,000 available for which usage is restricted to capital investments and for foreign currency hedging. While these facilities are primarily unsecured, portions of the lines are secured by equipment and with $1,442 of cash. We guarantee up to $6,700 of the debt of one of our Brazilian subsidiaries, included in these facilities.
In the fourth quarter of 2003, we exercised our option to redeem, at par, the remaining $885 of County of Maricopa Industrial Revenue Bonds, or IRBs. Also in the fourth quarter of 2003, we converted our remaining IRB issue, the $34,000 Parish of Ascension IRB, to a fixed interest rate, and, by doing so, we were able to eliminate the requirement to maintain a backup letter of credit for approximately $34,500. This increased our availability under the Credit Facility and provided us with additional borrowing capacity.
Effective December 1, 2003, we entered into a $34,000 interest rate swap agreement structured for the Parish of Ascension IRBs. Under this agreement, we receive a fixed rate of 10% and pay a variable rate equal to the 6-month LIBOR plus 630 basis points. At December 31, 2003, this equates to a rate of 7.6%.
Previous buybacks of our senior unsecured notes will allow us to fulfill our sinking fund requirements through 2013 for our 83/8% debentures and our 91/4% debentures. In the future, we, or our affiliates, including entities controlled by KKR, may purchase our senior unsecured notes in the open market or by other means, depending on market conditions.
We plan to spend about $40,000 in 2004 for capital expenditures, including plans to continue increasing plant production capacity as necessary to meet demand. We plan to fund capital expenditures through operations and, if necessary, through available lines of credit or borrowings from affiliates.
The following table summarizes our contractual cash obligations at December 31, 2003 and the effect we expect these obligations to have on our future cash requirements. Our contractual cash obligations consist of legal commitments at December 31, 2003, requiring us to make fixed or determinable cash payments, regardless of the contractual requirements of the vendor to provide future goods or services. This table does not include information on our recurring purchases of materials for use in production, as our raw materials purchase contracts do not meet this definition because they do not require fixed or minimum quantities. Contracts with cancellation clauses are not included, unless such cancellation would result in major disruption to our business. For example, we have contracts for
46
information technology support that are cancelable, but this support is essential to the operation of our business and administrative functions; therefore, amounts payable under these contracts are included.
| | Payments Due By Year | |||||||||||||||||||||
|---|---|---|---|---|---|---|---|---|---|---|---|---|---|---|---|---|---|---|---|---|---|---|
| Contractual Obligations | 2004 | 2005 | 2006 | 2007 | 2008 | 2009 and beyond | Total | |||||||||||||||
| Long-term debt, including current maturities | $ | 8,167 | $ | 2,219 | $ | 1,841 | $ | 1,420 | $ | 3,609 | $ | 520,877 | $ | 538,133 | ||||||||
| Operating leases | 12,120 | 10,205 | 7,882 | 5,961 | 4,302 | 3,789 | 44,259 | |||||||||||||||
| Unconditional purchase obligations(1) | 16,815 | 5,992 | 4,523 | 2,625 | 300 | — | 30,255 | |||||||||||||||
| Total | $ | 37,102 | $ | 18,416 | $ | 14,246 | $ | 10,006 | $ | 8,211 | $ | 524,666 | $ | 612,647 | ||||||||
- (1)
- This table excludes payments relating to income tax, pension and postretirement benefits and environmental obligations due to the fact that, at this time, we cannot determine either the timing or the amounts of payments for all periods beyond 2004 for certain of these liabilities. In addition, loans payable to affiliates are not included in this table because they are demand instruments, and repayments are not predictable, as we use this to fund our daily cash requirements. See Notes 11, 12, 13 and 22 to our Consolidated Financial Statements included elsewhere in this prospectus and the following discussions on minimum pension funding requirements, environmental, taxes and pension and postretirement benefits for more information on these obligations. Our capital lease obligations are not material.
Based on our current projections of the minimum annual funding requirements imposed by federal laws and regulations with regard to our U.S. pension plan, our projected minimum annual funding requirements range from $0 in 2004 to approximately $20,900 and $25,800 in 2005 and 2006, with a total funding requirement for the five years ended in 2008 of approximately $73,200. The assumptions used by our actuaries in calculating these projections included an 8.0% annual rate of return on assets for the years 2003 through 2008 and the continuation of current law and plan provisions.
We expect to spend approximately $5,400 for capital expenditures in 2004 related to capital improvements and compliance under environmental laws. Of this amount, approximately $2,300 is included in the above table as unconditional purchase obligations, with the remainder being voluntary capital improvement projects. We expect other environmental expenditures for 2004 - 2008 to total approximately $17,700, with approximately $32,700 paid over the next 25 years beginning in 2009.
We have net operating loss carryforwards, future tax deductions and alternative minimum tax credits that can offset approximately $75,000 of future taxes for U.S. federal income tax purposes. We estimate we will pay cash taxes totaling approximately $22,000 in 2004 for state, local and international liabilities.
Effective September 1, 2003, we amended our Total Family Protection Plan to eliminate medical benefits for our retirees and their dependents who are over age 65. We have arranged with a major benefits provider to offer affected retirees and their dependents continued access to medical and prescription drug coverage, including coverage for pre-existing conditions. We are currently subsidizing a portion of the cost of coverage for affected retirees and their dependents through December 2004 to assist our retirees' transition to alternative medical coverage and reserve the right to continue, terminate or reduce the subsidy provided to our affected retirees and their dependents for periods after December 2004. As a result of these actions, we estimate that our liability related to providing postretirement medical benefits will be reduced by approximately $88,000. Our primary benefit from this amendment was a reduction of future annual cash outlays related to postretirement benefits by approximately $10,000 annually, as compared to the cash outlays we anticipated under the pre-amended retiree medical benefit plan.
47
We expect to have adequate liquidity to fund working capital requirements, contractual obligations and capital expenditures over the remainder of the three year term of our Credit Facility with cash received from operations, amounts available under the Credit Facility and amounts available under our subsidiaries' separate credit facilities. In addition, we have the affiliate borrowing facility, which gives us further flexibility and capacity. However, we cannot assure you that borrowings from affiliates will be available in future periods.
Quantitative and Qualitative Disclosures about Market Risk
Risk Management. We use various financial instruments, including some derivatives to help us hedge our foreign currency exchange risk and interest rate risk. We also use raw material purchasing contracts and pricing contracts with customers to mitigate commodity price risks. These contracts generally do not contain minimum purchase requirements.
Foreign Exchange Risk. Our international operations accounted for approximately 37% of our net sales in 2003 and 35% in 2002. As a result, we have exposure to foreign exchange risk on transactions potentially denominated in many foreign currencies. These transactions include foreign currency denominated imports and exports of raw materials and finished goods (both intercompany and third party) and loan repayments. In all cases, the functional currency is the business unit's local currency.
It is our policy to reduce foreign currency cash flow exposure due to exchange rate fluctuations by hedging our firmly committed foreign currency transactions wherever economically feasible. Our use of forward and option contracts is designed to protect our cash flows against unfavorable movements in exchange rates, to the extent of the amount under contract. We do not attempt to hedge foreign currency exposure in a manner that would entirely eliminate the effect of changes in foreign currency exchange rates on net income (loss) and cash flow. We do not speculate in foreign currency nor do we hedge the foreign currency translation of our international businesses to the U.S. dollar for purposes of consolidating our financial results or other foreign currency net asset or liability positions. The counter-parties to our forward contracts are financial institutions with investment grade credit ratings.
Our foreign exchange risk is also mitigated because we operate in many foreign countries, reducing the concentration of risk in any one currency. In addition, our foreign operations have limited imports and exports, reducing the potential impact of foreign currency exchange rate fluctuations. With other factors being equal, such as the performance of individual foreign economies, an average 10% foreign exchange increase or decrease in any one country would not materially impact our operating results or cash flow. However, an average 10% foreign exchange increase or decrease in all countries may materially impact our operating results.
As required by current accounting standards, our Consolidated Statements of Operations includes any gains and losses arising from forward and option contracts.
48
The following table summarizes forward currency and option contracts outstanding as of December 31, 2003 and 2002. Fair values are determined from quoted market prices at these dates.
| | 2003 | 2002 | ||||||||||||||||||||
|---|---|---|---|---|---|---|---|---|---|---|---|---|---|---|---|---|---|---|---|---|---|---|
| | Average Days To Maturity | Average Contract Rate | Forward Position | Fair Value Gain (Loss) | Average Days to Maturity | Average Contract Rate | Forward Position | Fair Value (Loss) | ||||||||||||||
| Currency to sell for U.S. Dollars | ||||||||||||||||||||||
| British Pound(1) | 7 | 1.7710 | $ | 44,300 | $ | (323 | ) | 31 | 1.60 | $ | 36,916 | $ | (231 | ) | ||||||||
| Canadian Dollars(2) | 16 | 1.3040 | 4,000 | (38 | ) | — | — | — | — | |||||||||||||
| Canadian Dollars(2) | 49 | 1.3069 | 4,000 | (64 | ) | — | — | — | — | |||||||||||||
| Canadian Dollars(2) | 76 | 1.3095 | 4,000 | (79 | ) | — | — | — | — | |||||||||||||
| Currency to sell For Canadian Dollars | ||||||||||||||||||||||
| British Pound(1) | — | — | — | — | 31 | 2.51 | $ | 23,163 | $ | (171 | ) | |||||||||||
| Currency to buy with U.S. Dollars | ||||||||||||||||||||||
| Canadian Dollars(3) | 16 | 1.3600 | 4,000 | — | — | — | — | — | ||||||||||||||
| Canadian Dollars(3) | 49 | 1.3600 | 4,000 | 5 | — | — | — | — | ||||||||||||||
| Canadian Dollars(3) | 76 | 1.3600 | 4,000 | 13 | — | — | — | — | ||||||||||||||
- (1)
- Forward contracts
- (2)
- Calls sold
- (3)
- Puts purchased
Interest Rate Risk. We use interest rate swaps to minimize our interest rate exposures between fixed and floating rates on long-term debt. We do not enter into speculative financial contracts of any type. The fair values of the swaps are determined using estimated market levels. Under interest rate swaps, we agree with other parties to exchange at specified intervals the difference between the fixed rate and floating rate interest amounts calculated by reference to the agreed notional principal amount.
As of December 31, 2003, we had one interest rate swap outstanding with a notional value of $34,000 and a fair value of $(483). Under this arrangement, we paid 7.6% and received 10.0% in 2003. We had a $24,286 swap outstanding during 2002 that matured on December 1, 2002. In 2002, we paid 13.7% and received 1.9% on this swap.
The interest rates on most of our debt agreements are fixed. A 10% increase or decrease in the interest rates of the variable debt agreements would be immaterial to our net income. The fair value of our publicly held debt is based on the price at which the bonds are traded or quoted at December 31, 2003 and 2002. All other debt fair values are determined from quoted market interest rates at December 31, 2003 and 2002.
49
Following is a summary of our debt obligations as of December 31, 2003 and 2002 (see Note 10 to our Consolidated Financial Statements included elsewhere in this prospectus for additional information on our debt):
| | 2003 | 2002 | |||||||||||||||
|---|---|---|---|---|---|---|---|---|---|---|---|---|---|---|---|---|---|
| Year | Debt | Weighed Average Interest Rate | Fair Value | Debt | Weighted Average Interest Rate | Fair Value | |||||||||||
| 2003 | $ | 2,779 | 10.7 | % | $ | 2,779 | |||||||||||
| 2004 | $ | 8,167 | 6.2% | $ | 8,167 | 607 | 13.8 | % | 602 | ||||||||
| 2005 | 2,219 | 9.7% | 2,219 | 607 | 13.8 | % | 602 | ||||||||||
| 2006 | 1,841 | 8.6% | 1,841 | 300 | 13.8 | % | 298 | ||||||||||
| 2007 | 1,420 | 6.8% | 1,420 | 11 | 14.3 | % | 11 | ||||||||||
| 2008 | 3,609 | 6.4% | 3,609 | — | — | % | — | ||||||||||
| 2009 and beyond | 520,877 | 8.5% | 486,374 | 521,762 | 8.5 | % | 340,756 | ||||||||||
| Total | $ | 538,133 | $ | 503,630 | $ | 526,066 | $ | 345,048 | |||||||||
We do not use derivative financial instruments in our investment portfolios. We place any cash equivalent investments in instruments that meet the credit quality standards established within our investment policies, which also limit the exposure to any one issue. At December 31, 2003, we had no material investments in cash equivalent instruments. At December 31, 2002, we had $70,133 invested primarily in time deposits with average maturity periods of seven days and average rates at 1.2%. Due to the short maturity of our cash equivalents and restricted cash investments, the carrying value on these investments approximates fair value and our interest rate risk is not significant. A 10% increase or decrease in interest returns on invested cash would not have a material effect on our net income and cash flows at December 31, 2003 and 2002.
Commodity Risk. We are exposed to price risks associated with raw material purchases, most significantly with methanol, phenol and urea. For our commodity raw materials, we have purchase contracts, with periodic price adjustment provisions. In 2003, our suppliers were committed under these contracts to provide 100% of our estimated methanol requirements. Commitments with our phenol and urea suppliers provide up to 100% of our estimated requirements and also provide the flexibility to purchase a certain percentage of our needs in the spot market, when favorable to us. We expect these arrangements for raw materials to continue throughout 2004. Our commodity risk also is moderated through our use of customer contracts with selling price provisions that are indexed to publicly available indices for these commodity raw materials. All commodity futures that we enter into are approved by our Board of Directors.
We have a long-term contractual arrangement with the leading global melamine crystal producer to supply a minimum of 70% of our worldwide melamine crystal requirements. The melamine crystal we purchase under this agreement will be sourced from numerous supplier production sites and the temporary or permanent loss of any individual site would not likely have a material adverse impact on our ability to satisfy our melamine crystal requirements. We have no minimum purchase requirements under this contract.
Natural Gas Futures—Natural gas is essential in our manufacturing processes, and its cost can vary widely and unpredictably. In order to control our costs for natural gas, we hedge a portion of our natural gas purchases for all of North America. In 2003, we hedged approximately 69% of our actual natural gas usage. During 2003, we entered into futures contracts for natural gas usage through June 2004. The contracts are settled for cash each month based on the closing market price on the last day the contract trades on the New York Mercantile Exchange. Our commitments settled under these
50
contracts totaled $4,866 and our related losses were $224 in 2003. At December 31, 2003, we had future commitments under these contracts of $1,359.
We were in previous natural gas futures contracts with varying settlement dates during 2001 and 2002. Commitments settled under these contracts totaled $1,210 and our related losses were $264 in 2002. These contracts terminated prior to December 31, 2002.
We recognize gains and losses on commodity futures contracts each month as gas is used. Our future commitments are marked to market on a quarterly basis. We recorded a gain of $11 at December 31, 2003 related to our natural gas futures contracts.
Natural Gas Commitments—In 2000, we entered into fixed rate, fixed quantity contracts to secure a portion of future natural gas usage for certain facilities. We entered into these contracts to partially hedge our risk of natural gas price fluctuations in peak usage months. Our gas purchases under these contracts totaled $402 and $671 in 2003 and 2002, respectively. We recorded a gain of $16 at December 31, 2002 and a loss of $545 at December 31, 2001 for the difference between the fair value and the carrying value of our future natural gas commitments. These contracts expired early in 2003, and we have no natural gas purchase commitments at year-end 2003.
Other Matters. Our operations are subject to the usual hazards associated with chemical manufacturing and the related storage and transportation of feedstocks, products and wastes, including, but not limited to, combustion, inclement weather and natural disasters, mechanical failure, unscheduled downtime, transportation interruptions, remediation, chemical spills, discharges or releases of toxic or hazardous substances or gases and other environmental risks. These potential hazards could cause personal injury or loss of life, severe damage to or destruction of property and equipment and environmental damage and could result in suspension of our operations and the imposition of civil or criminal penalties. We have significant operational management systems, preventive procedures and protective safeguards to minimize the risk of an incident and to ensure the safe continuous operation of our facilities. In addition, we maintain property, business interruption and casualty insurance that we believe is in accordance with customary industry practices, but we are not fully insured against all potential hazards incidental to our business.
Due to the nature of our business and the current litigious climate, product liability litigation, including class action lawsuits claiming liability for death, injury or property damage caused by our products, or by other manufacturers' products that include our components, is inherent to our business but historically has been immaterial. However, our current product liability claims and any future lawsuits, could result in damage awards against us, which in turn could encourage additional litigation. See "Risk Factors—Risks Relating to Our Business."
Recently Issued Accounting Standards
In November 2002, the FASB issued Interpretation No. 45, "Guarantor's Accounting and Disclosure Requirements for Guarantees, Including Indirect Guarantees of Indebtedness of Others" ("FIN 45"). FIN 45 requires a guarantor to recognize a liability, at the inception of the guarantee, for the fair value of obligations it has undertaken in issuing the guarantee and also include more detailed disclosures with respect to guarantees. FIN 45 is effective for guarantees issued or modified after December 31, 2002. The disclosure requirements of FIN 45 are effective for financial statements for interim or annual periods ending after December 15, 2002. We have adopted FIN 45 and included the additional requirements with respect to guarantees in Note 21 to our Consolidated Financial Statements included elsewhere in this prospectus.
In January 2003, the FASB issued Interpretation No. 46, "Consolidation of Variable Interest Entities" as amended in December 2003 ("FIN 46R") to expand upon and strengthen existing accounting guidance that addresses when a company should include in its financial statements, the
51
assets, liabilities and activities of another entity. FIN No. 46R requires existing unconsolidated variable interest entities to be consolidated by their primary beneficiaries if the entities do not effectively disperse risks among parties involved. We have no variable interest entities; therefore, the implementation of FIN 46R will not have an impact on our results of operations and financial condition.
In April 2003, the FASB issued SFAS No. 149, "Amendment of Statement 133 on Derivative Instruments and Hedging Activities." This statement amends and clarifies financial accounting and reporting for derivative instruments, including certain derivative instruments embedded in other contracts and for hedging activities under SFAS No. 133, "Accounting for Derivative Instruments and Hedging Activities." The clarification provisions of this statement require that contracts with comparable characteristics be accounted for similarly. This statement is effective for any new derivative instruments entered into after June 30, 2003. We adopted SFAS No. 149 on July 1, 2003, and the adoption did not have an impact on our financial statements.
In May 2003, the FASB issued SFAS No. 150, "Accounting for Certain Financial Instruments with Characteristics of both Liabilities and Equity." This statement addresses the accounting for certain financial instruments that, under previous guidance, could be accounted for as equity. SFAS No. 150 requires that those instruments be classified as liabilities in the statement of financial position. This statement is effective for financial instruments entered into or modified after May 31, 2003, and is otherwise effective at the beginning of the first interim period beginning after June 15, 2003. Our adoption of SFAS No. 150 on July 1, 2003 did not have a material impact on our financial statements.
In December 2003, the FASB issued SFAS No. 132 (as revised 2003), "Employers' Disclosures about Pensions and Other Postretirement Benefits, an amendment of FASB Statements No. 87, 88 and 106, and a revision of FASB Statement No. 132." The new rules require additional disclosures about the assets, obligations, cash flows and net periodic benefit cost of defined benefit pension plans and other postretirement benefit plans. This Statement is effective for our fiscal years ending after December 15, 2003, except for certain disclosures on foreign plans, which are effective for fiscal years ending after June 15, 2004. We have adopted SFAS No. 132 (as revised 2003) and included the additional disclosures in Notes 12 and 13 to our Consolidated Financial Statements included elsewhere in this prospectus. We elected to include the disclosures for our foreign plans in 2003.
52
Overview
We are one of the world's leading integrated producers of thermoset resins, adhesives and binders for the global forest products and industrial markets. In addition, we are the world's largest producer by volume of formaldehyde, an important and versatile building block chemical used in a wide variety of applications. We are the largest North American producer by volume of thermoset resins used in the production of engineered wood products, including structural wood panels, beams and non-structural panels, furniture, door and window assemblies and wallboards. We are also the largest North American producer by volume of resin-coated proppant systems, which are used in oilfield and natural gas production, and of foundry resins, which are used in the production of cores and molds for metal castings. We have a strong presence in the production of both specialty resins used in industrial markets and UV coatings for the production of fiber-optic cables, DVDs and CDs. Our materials are designed to deliver superior binding and bonding performance to manufacturers of thousands of common, everyday products that enhance modern living. Our strong position in North America is complemented by our significant operations in Latin America and Europe and expansion opportunities in Asia Pacific and Latin America.
Through our worldwide network of 48 strategically located production facilities, we serve more than 3,000 customers, with our largest customer representing 5% of net sales in 2003. Our customers operate in many diverse end-markets, such as construction, furniture, automotive, oil and gas, chemicals, electronics, communications and agriculture. In 2003, we generated net sales of $1,435 million, Adjusted EBITDA (as defined) of $127.7 million, operating income of $66.5 million and net income of $23.0 million. In 2003, 63% of our net sales were derived from sales in the United States, 15% from Canada and 22% from Latin America, Europe and Asia Pacific.
Our three reporting segments are (i) Forest Products, which includes the forest products resins and formaldehyde product lines produced in North America, (ii) Performance Resins, which includes the specialty resins, foundry resins, oilfield products and UV coatings product lines produced in North America, and (iii) International, which includes all products produced outside of North America. The following is an illustration of our net sales and Adjusted EBITDA by reporting segment in 2003:
Net Sales and Adjusted EBITDA by Reporting Segment
* Percentages are calculated prior to allocation of corporate expenses.
53
Industry
According to SRI Consulting, an independent industry consulting firm, the global chemicals industry is a $1.9 trillion market, divided into two primary markets: commodity chemicals and specialty chemicals. We are an important participant in both markets. We participate in the commodity chemicals market through our presence in the merchant formaldehyde market. We participate in the specialty chemicals market through our presence in thermoset resins, including our forest products resins, our resins servicing the electronics and oil field services markets and our UV coatings products. The portion of the specialty chemicals market in which we participate is estimated at $6.4 billion globally. These products are principally sold on the basis of performance, technical support and service levels to customers and product innovation.
The principal factors contributing to success in the chemicals market vary between the specialty and commodity chemicals markets. Success in the specialty chemicals market is largely driven by (i) consistent delivery of high-quality products, (ii) advantageous production technologies, (iii) the ability to provide value to customers through both product attributes and strong technical support and service and (iv) a presence in large and growing markets. Success in the commodity chemicals market is largely driven by (i) large scale and high plant productivity, (ii) a low cost structure including cost-effective raw material procurement and (iii) strong customer relationships.
Competitive Strengths
- •
- Leading Market Positions. We are one of the world's leading producers of thermoset resins for the forest products and industrial markets. We believe that we have the number one or number two market position in North America by volume in products accounting for virtually all our net sales. The following table illustrates our market position by volume in our key product areas:
| Product | Market | 2003 Market Position | Approximate Market Share | ||||
|---|---|---|---|---|---|---|---|
| Forest Products Resins | |||||||
| UF Resins | North America | 1 | 46% | ||||
| PF Resins | North America | 1 | 40% | ||||
| Merchant Formaldehyde | North America | 1 | 59% | ||||
| Industrial Resins | North America | 1 | 28% | ||||
| Foundry Resins | North America | 1 | 42% | ||||
| Oilfield Resins | North America | 1 | 51% | ||||
| UV Fiber-Optic Coatings | Global | 2 | 21% | ||||
- •
- Competitive Advantage in Thermoset Resins Business. We believe we enjoy a cost advantage in our thermoset resins business as a result of our manufacturing scale and vertical integration with our formaldehyde business. Formaldehyde accounts for an average of approximately 30% of the raw material costs of formaldehyde-based resins.
- •
- Strong Relationships with Our Customers. As a result of our focus on developing innovative, high-quality products with a high level of technical service, we have developed stable, long-term relationships with our customers on a global basis. Most of our resin customers require products that are tailored to their individual production needs and require a high degree of technical service and product reformulation. We have a total systems approach to meeting customer needs. This approach involves using our global technology and experience in order to deliver the appropriate resin for the customer's application and production process and subsequently providing ongoing in-plant technical support and service. We believe that this represents a competitive advantage and contributes to our reputation as the world's leading supplier of thermoset resins.
54
- •
- Low Cost Position Through Scale and Strategically Located Plants. We believe that we are North America's lowest cost producer of formaldehyde and formaldehyde-based resins. Our cost advantage in formaldehyde is a result of our manufacturing technology and leading global market position, which allow us to utilize our plants more efficiently and source raw materials at lower prices. Most of our manufacturing plants are strategically located close to, or linked with, our customers' manufacturing facilities. This allows us a significant logistical advantage since formaldehyde cannot be cost-effectively transported long distances.
- •
- Diversified Revenue Base. We have a diversified revenue and customer base in a variety of end-markets and geographies, which reduces our exposure to economic, industry and commodity chemical cycles. In 2003, our largest customer accounted for 5% of our net sales and our top ten customers accounted for 27% of our net sales. We sell our products into numerous end-markets including construction, furniture, automotive, oilfield services, chemicals, electronics, communications and steel production. Our largest end-market is construction, which accounted for approximately 35% of our net sales in 2003. Because demand for our products is driven by both new housing starts and the home remodeling and repair market, we have been able to maintain our net sales volumes of forest products resins during periods of declining housing starts.
- •
- Well Positioned for Improving Raw Material Pricing Environment. We have recently experienced dramatically higher raw material costs. For example, in 2003, the prices of methanol, phenol and urea increased by 42%, 22% and 50%, respectively. However, we are typically able to pass along raw material price increases, albeit with a "lag," which leads to lower margins during periods of rapidly increasing raw material prices and higher margins during periods of rapidly decreasing raw material prices. We believe that our recent operating performance in a difficult raw material environment positions us to capitalize on what we believe generally will be an improving raw material pricing environment.
- •
- Favorable Trends in Forest Products Resin Demand. As a result of the scarcity of "mature growth" forests in North America and Europe, there is a continuing shift away from plywood to OSB, a plywood substitute that uses less wood. This trend has been driving demand for our products because manufacturing of OSB uses approximately 50% more of our resins than plywood.
- •
- Strong Management Team. We have a new management team led by Craig O. Morrison, who was appointed President and Chief Executive Officer on March 25, 2002. Subsequently, nine of the eleven members of our senior management team joined the Company. This has significantly expanded the capability and capacity of the management team. Initiatives introduced by this management team, such as Six Sigma, new product development, assessment processes and global product line management, are beginning to have a positive impact on our financial results.
Strategy
We are focused on increasing shareholder value, our return on investment, cash flows and profitability. We believe we can achieve these goals through the following strategies:
- •
- Expand Our Global Reach. We will continue to grow internationally by expanding our product sales to our multi-national customers outside of North America and by entering new markets. In particular, we believe that our leading formaldehyde and formaldehyde-based resin technology and our relationships with large multi-national customers as a "supplier of choice" of formaldehyde offers us a significant competitive advantage as we enter new markets. We are particularly focused on growing our business in the Asian-Pacific and Latin American markets, where the usage of our products is increasing. For example, having recently targeted Brazil as a growth market, our volumes in that country have grown by 35% from 2001 to 2003 and Adjusted
55
- •
- Develop and Market New Products. We will continue to expand our product offerings through internal product innovation, joint research and development initiatives with our customers and research partnership formations. In 2003, approximately 15% of our net sales were derived from products developed or re-engineered within the last three years. We have implemented a new, systematic approach to new product development and have identified promising new technologies that have begun to yield significant results. In 2003, we introduced new materials in all of our product lines. For example, last year we developed and began marketing XRT™, a resin for the oilfield products end-market, which generated $10 million in net sales in 2003. We also have increased our investments in UV light-curable products for the display, CD and ink jet markets and electronics products for the photolithography market.
- •
- Focus on Operational Excellence. We will continue to focus on opportunities to optimize our resources, improve our cost position and drive new product innovation. In 2002, we implemented a major Six Sigma process initiative, which is adding discipline and focus to the way we approach productivity. Since the beginning of 2002, our average productivity per employee has increased by approximately 25%.
- •
- Pursue Targeted Add-On Acquisitions and Joint Ventures. We intend to continue pursuing add-on acquisitions and joint ventures in areas that allow us to build upon our core strengths, expand our product portfolio and better serve our customers. For example, during 2003 we spent a total of $14.7 million for the acquisition of an international manufacturer of specialty chemical products and for the acquisition of the assets of a domestic producer of specialty adhesives.
EBITDA has grown to $15 million. In China, we have initiated three joint ventures and have two plants under construction in order to expand our operations for forest products, formaldehyde and UV coatings.
Our History
Business Realignment and Corporate Reorganization. We have undertaken numerous plant consolidations and other business realignment initiatives. These initiatives are designed to improve efficiency and to focus resources on our core strengths. The associated business realignment charges consist primarily of employee severance, plant consolidation and related environmental remediation costs and asset impairment expense. Following is a brief overview of our significant business realignment activities since 2001.
As part of the 2001 Corporate Reorganization, we completed a significant capital restructuring, which consisted primarily of a capital contribution by BHI of $614.4 million of preferred stock. The significant impact of this transaction was to eliminate future required annual preferred dividend payments of $73.7 million. Also as part of the 2001 Corporate Reorganization, BHI made a capital contribution of cash and purchased certain financial assets from us at their estimated fair values. The cash contribution and the cash received from the sale of assets allowed us to substantially repay our affiliated debt as of December 31, 2001. See Note 3 to our Consolidated Financial Statements included elsewhere in this prospectus.
In 2001, we recorded $126.4 million of business realignment and impairment charges related primarily to the closures of Melamine and two forest products plants in the U.S., realignment of our North American workforce organization, reorganization of our corporate headquarters and the discontinuation of a plant construction project. The largest component of the 2001 charge is a $98.1 million impairment of Melamine fixed assets, goodwill and spare parts. This impairment was the result of our strategic decision late in 2001 to sell or close Melamine and to enter into a long-term contractual arrangement with a supplier for our future melamine crystal needs.
56
In June 2003, we initiated the 2003 Realignment designed to reduce operating expenses and increase organizational efficiency. To achieve these goals, we are reducing our workforce, streamlining processes, consolidating manufacturing processes and reducing general and administrative expenses. We anticipate the program will be completed in 2004.
Immediately prior to the completion of this offering, pursuant to a plan of reorganization, which we refer to as the 2004 Reorganization, BHI, our parent company, will transfer substantially all of its assets (consisting of all of our common stock owned by BHI) to us in exchange for (a) new common stock issued by us, at the ratio of share of new common stock for every shares of old common stock, and (b) our assumption and subsequent cancellation of a certain note issued to us by BHI, including accrued interest thereupon. All of our other shareholders will also participate in the -for- share exchange. After such exchange, BHI will convert into a Delaware limited liability company and change its name to Borden Holdings, LLC. The 2004 Reorganization will not have any impact on the beneficial ownership of, or control over, us.
Acquisitions and Divestitures. Following is a summary of acquisitions and divestitures we made in the past five years.
In 1999, we acquired Blagden Chemicals, Ltd., or Blagden, in the U.K. and Spurlock Industries, Inc., or Spurlock, in the U.S. Blagden produces formaldehyde, forest products and industrial resins. Spurlock produces formaldehyde and forest products resins.
In 2000, we acquired the formaldehyde and certain other assets from Borden Chemicals and Plastics Operating Limited Partnership, or BCPOLP, which was one of our affiliates, and acquired East Central Wax, a wax emulsions producer for the forest products business.
Also in 2001, we merged our North American foundry resins and coatings businesses with similar businesses of Delta-HA, Inc., or Delta, to form HAI, in which we have a 75% economic interest. The Limited Liability Agreement of HAI provides Delta the right to purchase between 3% and 5% of additional interest in HAI each year beginning in 2004. Pursuant to this provision, in the first quarter of 2004, Delta provided us with written notice of their intention to exercise their option to purchase an additional 5% interest in 2004. Delta's purchase price of the interest is based on the enterprise value of HAI determined by applying a contractually agreed upon multiple to EBITDA, as defined in the agreement. Delta is limited to acquiring a maximum of 25% of additional interest in HAI under this arrangement.
In 2001, through a series of transactions with affiliates, we sold Consumer Adhesives for total proceeds of $94.1 million, which we refer to as the Consumer Adhesives sale. Consequently, Consumer Adhesives is reported as a discontinued operation in our financial statements in 2001. We retained continuing investments in Consumer Adhesives in the form of preferred stock and notes receivable. We sold the notes receivable to BHI in the fourth quarter of 2001 for their carrying value of $57.7 million. The preferred stock, with a carrying value of $110.0 million, was redeemed during the first quarter of 2002 for a $110.0 million note receivable from Consumer Adhesives, which we subsequently sold to BHI for face value plus accrued interest and used the proceeds to repay affiliated debt.
In the fourth quarter of 2003, we acquired Fentak in Australia and Malaysia, a producer of specialty chemical products for engineered wood, laminating and paper impregnation markets. We also acquired the business and technology assets of SEACO, a domestic producer of specialty adhesives.
57
Products
Our primary product lines include forest products resins, formaldehyde, specialty resins, foundry resins, oilfield products and UV coatings and other. Our net sales by product line for 2003 are illustrated below:
Forest Products Resins. We are the leading producer of forest products thermoset resins in North America with an approximate 46% market share by volume in urea formaldehyde resins, or UF resins, and an approximate 40% market share by volume in phenol formaldehyde resins, or PF resins. Our thermoset resin systems are used by our customers to bind wood particles and bond wood segments to provide strength and durability to oriented strand board, or OSB; particleboard; medium density fiberboard, or MDF; and plywood.
| Products | Key Applications | |
|---|---|---|
| Engineered Wood Resins | Softwood and hardwood plywood, OSB, laminated veneer lumber and strand lumber | |
Special Wood Adhesives | Laminated beams, structural and nonstructural fingerjoints, wood composite I-beams, cabinets, doors, windows, furniture, mold and millwork and paper laminations | |
Wax Emulsions | Sizing agent for composite products | |
Wood Fiber Resins | Particleboard, MDF and hardboard | |
We provide a comprehensive range of resin systems to the world's leading producers of engineered wood products. Our resins and adhesives, together with our wax sizing agents and other complementary products, are used to produce the following products: OSB, plywood and other construction panel systems; laminated beams, joists and trusses for structural applications; millwork, cabinetry and window and door assemblies; and particleboard and MDF for furniture, flooring and other applications. Used in combination with wood from plantation-grown trees, our resins help provide economical alternatives to traditional solid wood products that consume old-growth timber, while delivering products that achieve superior performance. Depending on the application and customer requirements, our resins are
58
produced by mixing formaldehyde with other chemicals, including urea, phenol, melamine and resorcinol. The result is a completed thermoset resin system.
A key component of our success in the engineered wood market is our total systems approach to meeting customer needs. This approach involves first using our global technology and experience in order to deliver the right resin for the customer's application and production process and then providing in-plant technical support and service.
Formaldehyde. We are the world's largest producer of formaldehyde by volume and the largest provider of formaldehyde to end-users in North America with an approximate 59% share of the merchant market. We manufacture more than five billion pounds of formaldehyde solution each year, of which approximately half is consumed internally for resin production and the other half is sold to external customers. Formaldehyde is a versatile building block chemical used in thousands of diverse end-use applications such as resin systems for forest products and industrial bonding, household products, including shampoo, cosmetics, disinfectants and fabric softeners, and specialty fabrics, paper products, fertilizers and animal feeds.
| Products | Key Applications | |
|---|---|---|
| Formaldehyde | Herbicides and fungicides, fabric softeners, oil and gas applications, urea formaldehyde, melamine formaldehyde, phenol formaldehyde and MDI | |
Hexamine | Explosives, accelerator for rubber curing, propellant to solid rocket booster engines and phenolic-based resins for brake shoes | |
Methaform | Clear automotive topcoats and other coating applications | |
Urea Formaldehyde Concentrates | Precursor for UF resins used in particleboard, plywood, shingles and slow release fertilizers |
We manufacture synthetic formaldehyde by reacting methanol with a silver or metal oxide catalyst. Formaldehyde is sold in a water-based solution and also is blended with other materials for specific customer applications.
59
Specialty Resins. We are a major supplier of high performance specialty resins used in the binding and bonding of a diverse range of materials, primarily in the construction, automotive, electronics and steel industries. Typical end-use product applications include electronics for circuit boards, adhesives for brake linings and other friction products, flame-resistant composites for trains and planes, acoustical insulation for automobiles and glass matting for roofing shingles and thermal insulation.
| Products | Key Applications | |
|---|---|---|
| Automotive PF Resins | Acoustical insulation, filters, friction materials, grinding wheels, interior components, molded electrical parts and assemblies | |
Composites PF Resins | Aircraft interiors, air ducts, brakes, ballistic applications, industrial grating, pipe and space shuttle engine nozzles | |
Construction PF Resins, Urea Resins, Ketone Formaldehyde and Melamine Colloid | Decorative laminates, fiberglass insulation, floral foam, lamp cement for light bulbs, molded appliance and electrical parts, molding compounds, sandpaper, fiberglass mat, laminates, coatings, crosslinker for thermoplastic emulsions and specialty wet strength paper | |
Electronics PF Resins | Electrical laminates, computer chip encasement, molding compounds and photolithography | |
Refractory PF Resins | Steel mill refractory bricks, monolithic shapes, tap hole mix, tundish liners and nozzle visios |
Our manufacturing complex in Louisville, Kentucky is one of the world's largest sites producing specialty resins. We have additional manufacturing capacity for these materials dispersed throughout our international network of plants.
Foundry Resins. Through our 75% economic interest in our joint venture HA International, LLC, which we refer to as HAI, we are the leading producer by volume of foundry resins in North America with an approximate 42% market share. We pioneered the development of thermoset resins as binders for sand cores and molds used in metal castings over 40 years ago and continue to serve the North American market with a broad distribution network and significant production capability. Our foundry resin manufacturing capabilities include the largest foundry resin plant in the United States, which is located in Louisville, Kentucky. Our foundry resin systems are used by major automotive and industrial
60
companies in the production of engine blocks, transmissions, brake and drive train components and various other casting products.
| Products | Key Applications | |
|---|---|---|
| Lost Foam Coatings | Specialty refractory coatings for lost foam casting operations featuring high permeability and pattern coverage properties | |
Refractory Coatings | General purpose products for ferrous and nonferrous applications | |
Resin-Coated Sand (RCS)—Super F®, FII®, and FT® | General purpose high-curing speed RCS for most applications | |
Resins—SigmaCure®, SigmaSet®, Super Set®, ALpHASET®, BETASET® and Plastiflake® | A comprehensive selection of synthetic resins for bonding sand cores and molds in a variety of applications including phenolic urethane cold box resins, phenolic urethane nobake resins, furan and phenolic acid curing resins, ester cured phenolic nobake resins, methyl formate cured phenolic cold box resins and phenolic resins for shell process | |
Shake-Free® Coated Sand | Specialty RCS for aluminum, and light alloy applications | |
Sigma Sand® Coated Sand | Specialty RCS formulated for reduced emissions and nitrogen levels |
Our foundry resins business provides PF resin systems, specialty coatings and ancillary products used to produce finished metal castings.
Oilfield Products. We are the leading producer of oilfield resin systems and proppants in North America with an approximate 51% market share by volume. Our innovative flow back control technology allows oil and gas service providers to improve yields and extract oil and gas from deeper and more complex geological formations.
| Products | Key Applications | |
|---|---|---|
| AcFrac®, Ceramax™ and XRT™ Resin Systems | Control flowback and increase well yields using various substrates | |
Curable Resin-Coated Sand | Bonds down hole to prevent proppant flowback | |
Curable Resin-Coated Ceramics | Flowback control and increased conductivity | |
Precured Resin-Coated Sand | Excellent crush resistance and high flow capacities |
Maximizing flow capacity is critical for oil and gas production around the world, both on land and off-shore. We supply the leading service providers in the oil and gas field industry with products that increase the yields of working wells. Our extensive line of PF resin systems, resin-coated sand and resin-coated ceramic proppants are used in the hydraulic fracturing process to create and maintain pathways from the well bore to the oil or gas-bearing formation. This process enhances the recovery of hydrocarbons and can extend the well's life.
61
Hydraulic fracturing and improved proppants have become increasingly important as the industry works to extract gas and oil from deeper and more complex geological formations. As a technology leader, our team of researchers and field technicians continues to find new ways to meet the industry's needs. For example, our new XRT™ resin system, introduced in 2003, is quickly gaining marketplace acceptance as the industry's new standard for performance.
UV Coatings. We make coating and adhesive systems that utilize ultraviolet light-curing technology and have an approximate 21% global market share by volume. Our UV light-curable products are used in fiber-optic cable, CDs, CD-ROMs, DVDs, electronics and other specialty applications. These materials play an important role in modern communications technology by enhancing durability and performance.
| Products | Key Applications | |
|---|---|---|
| BondShield™ Matrix Adhesives | Bonding ribbon matrix fiber-optic bundles | |
DataShield™ Coatings and Adhesives | Protective coatings and adhesives for CDs and DVDs | |
KlearShield™ Primary and Secondary Coatings | Long-haul underground fiber-optic lines, U.S.-Europe submarine lines and feeder lines into buildings | |
SpectraShield™ Inks | Color-coding for fiber-optic strands |
Our major market for coatings is in the fiber-optics industry, where our primary "cushion" coatings protect the light-bearing glass strands in fiber-optic cable from dust, water and other contaminants, and our secondary coatings form a hard, protective outer shell. Our line of UV light-curable inks is used to color-code individual fibers for easy identification and our matrix coatings are used to bond fiber bundles.
We also produce UV light-curing coatings for the CD and DVD markets to protect the discs. A new line of UV light-curable adhesives for DVDs is being introduced to capitalize on the significant growth in demand for these data storage devices. In addition, there is a growing market for highly specialized applications. For example, our UV coatings provide protection for the fiber-optic gyros used to calculate precise positioning in the GPS-assisted navigation systems that are being embedded in a number of devices and equipment. We will continue to collaborate with our customers to find new ways to leverage our 20 years of UV coatings experience into developing innovative products.
Marketing and Distribution
Products are sold to industrial users in the U.S. primarily through our sales force of 80 employees. To the extent practicable, our international distribution techniques parallel those used in the U.S. We employ 25 people in our European sales force. However, raw materials, production considerations, pricing competition, government policy toward industry and foreign investment and other factors may vary substantially from country to country.
62
Competition
We compete with a variety of companies in each of our product lines. However, we believe that no single company competes with us across all of our existing product lines. The following chart sets forth our principal competitors by segment:
| Segment | Product Line | Principal Competitors | ||
|---|---|---|---|---|
Forest Products | Forest Products Resins | Dynea International Oy and Georgia-Pacific Corporation | ||
Formaldehyde | Dynea International Oy and Georgia-Pacific Corporation | |||
Performance Resins | Specialty Resins | Bakelite AG, Dynea International Oy and Occidental Petroleum Corporation and Sumitomo Bakelite Co., Ltd. | ||
Foundry Resins | Ashland Inc. and Technisand Inc. | |||
Oilfield Products | Carbo Ceramics Inc. and Santrol | |||
UV Coatings | DSM, JSR Corporation | |||
International | Product lines produced and sold outside of North America | Ashland Inc., Bakelite AG and Dynea International Oy |
Manufacturing and Raw Materials
The primary raw materials used in our manufacturing processes, for all of our reporting segments, are methanol, phenol and urea. Raw materials are available from numerous sources in sufficient quantities but are subject to price fluctuations that cannot always be passed on to customers. We use long-term purchase agreements for our primary and certain other raw materials in certain circumstances to assure availability of adequate supplies at specified prices. These agreements generally do not have minimum annual purchase requirements.
The following table illustrates the average annual price from 1995 to 2003, and the average quarterly price for the first quarter of 2004, for methanol, phenol and urea:
| | | | | | | | | | | First Quarter | ||||||||||
|---|---|---|---|---|---|---|---|---|---|---|---|---|---|---|---|---|---|---|---|---|
| | Year | |||||||||||||||||||
| Raw Material | ||||||||||||||||||||
| 1995 | 1996 | 1997 | 1998 | 1999 | 2000 | 2001 | 2002 | 2003 | 2004 | |||||||||||
| Methanol(1) | 65.77 | 44.03 | 58.43 | 36.08 | 34.59 | 54.48 | 58.98 | 52.30 | 74.58 | 73.50 | ||||||||||
| Phenol(2) | 37.17 | 37.50 | 41.00 | 38.67 | 28.38 | 34.92 | 36.04 | 36.38 | 42.33 | 43.67 | ||||||||||
| Urea(3) | 200.16 | 182.65 | 137.96 | 113.05 | 91.63 | 140.38 | 133.85 | 115.08 | 172.17 | 184.61 | ||||||||||
- (1)
- Prices based on U.S. cents per gallon (Source: Chemical Market Associates, Inc.).
- (2)
- Prices based on U.S. cents per pound (Source: Chemical Distribution Institute).
- (3)
- Prices based on U.S. dollars per short ton (Source: Blue, Johnson & Associates).
Customers
Our business does not depend on any single customer nor are any of our reporting segments limited to a particular group of customers, the loss of which would have a material adverse effect on the reporting segment. In 2003, our largest customer accounted for 5% of our net sales and our top ten
63
customers accounted for 27% of our net sales. Our primary customers consist of manufacturers, and the demand for our products is generally not seasonal.
Patents and Trademarks
We own various patents, trademark registrations, patent and trademark applications and technology licenses in our reporting segments around the world which are held for use or currently used in our operations. We own two material trademarks, Borden® and Elsie®. We use Borden® in our operations and license both trademarks to third parties for use on non-chemical products. A majority of our patents relate to the development of new products and processes for manufacturing and use thereof and will expire at various times between 2004 and 2023. Other than the Borden® and Elsie® trademarks, no individual patent or trademark is considered to be material; however, our overall portfolios of patents and trademarks are valuable assets.
Environmental Regulations
Our operations involve the use, handling, processing, storage, transportation and disposal of hazardous materials and are subject to extensive environmental regulation at the Federal, state and international level and are exposed to the risk of claims for environmental remediation or restoration. In addition, our production facilities require operating permits that are subject to renewal or modification. Violations of environmental laws or permits may result in restrictions being imposed on operating activities, substantial fines, penalties, damages or other costs, any of which could have a material adverse effect on our business, financial condition, results of operations or cash flows.
Accruals for environmental matters are recorded in accordance with the guidelines of the AICPA Statement of Position 96-1, "Environmental Remediation Liabilities," when it is probable that a liability has been incurred and the amount of the liability can be estimated. Although environmental policies and practices are designed to ensure compliance with international, supra- national, federal and state laws and environmental regulations, future developments and increasingly stringent regulation could require us to make additional unforeseen environmental expenditures. In addition, our former operations, including our ink, wallcoverings, film, phosphate mining and processing, thermoplastics, food and dairy operations, pose additional uncertainties for claims relating to our period of ownership. We cannot assure you that, as a result of former, current or future operations, there will not be some future impact on us relating to new regulations or additional environmental remediation or restoration liabilities.
We are actively engaged in complying with environmental protection laws, including various federal, state and foreign statutes and regulations relating to manufacturing, processing and distributing its many products. We anticipate incurring future costs for capital improvements and general compliance under environmental laws, including costs to acquire, maintain and repair pollution control equipment. We incurred related capital expenditures of $5.2 million in 2003, $3.6 million in 2002 and $1.2 million in 2001. We estimate that $5.4 million will be spent for capital expenditures in 2004 for environmental controls at our facilities. This estimate is based on current regulations and other requirements, but it is possible that material capital expenditures in addition to those currently anticipated could be required if regulations or other requirements change.
Research and Development
Our research and development and technical services expenditures were $18.0 million, $19.9 million and $21.2 million in 2003, 2002 and 2001, respectively. Development and marketing of new products are carried out by our reporting segments and are integrated with quality control for
64
existing product lines. In addition, we have an agreement with a not-for-profit research center to assist in certain research projects and new product development initiatives.
Legal Proceedings
Environmental Proceedings. We have been notified that we are or may be responsible for environmental remediation at approximately 30 sites. We are actively investigating or remediating conditions at five of these sites as a result of proceedings brought under state or federal environmental laws: Geismar, Louisiana; Fairlawn, New Jersey; Fremont, California; Lakeland, Florida and Newark, California. The most significant of these sites is the site formerly owned by us in Geismar, Louisiana. While we cannot predict with certainty the total cost of such cleanups, we have recorded liabilities of approximately $23.2 million and $23.4 million at March 31, 2004 and December 31, 2003 respectively, for environmental remediation costs related to these five sites.
For the remaining 25 sites, we have been notified that we are or may be a PRP under CERCLA or similar state "superfund" laws. While we cannot predict with certainty the total cost of such cleanup, we have recorded liabilities of approximately $7.6 million and $7.0 million at December 31, 2003 and 2002, respectively, for environmental remediation costs related to these 25 sites. We generally do not bear a significant level of responsibility for these sites and have little control over the costs and timing of cash flows. At 16 of the 25 sites, our share is less than 1%. At the remaining nine sites, we have a share of up to 8.8% of the total liability. Our ultimate liability will depend on many factors including: our volumetric share of waste, the financial viability of other PRPs, the remediation methods and technology used, the amount of time necessary to accomplish remediation and the availability of insurance coverage. Our insurance provides very limited, if any, coverage for these environmental matters.
In addition to the 30 sites referenced above, we are conducting voluntary remediation at 25 other locations. We have recorded liabilities of approximately $7.6 million and $9.9 million at December 31, 2003 and 2002, respectively, for remediation and restoration liabilities at these locations. See Note 22 to our Consolidated Financial Statements included elsewhere in this prospectus.
We are one of over 200 defendants in a private toxic tort action pending in U.S. District Court in Baton Rouge, Louisiana, alleging personal injuries and property damage in connection with two Iberville Parish waste disposal sites in Louisiana. No personal injuries have been specified. Settlement negotiations are near completion, and we have tendered $0.08 million into an escrow account reflecting our share of the settlement. As with any litigation, the ultimate outcome is uncertain until a final settlement is consummated.
Subsidiary Bankruptcy Proceedings. Our former subsidiary, BCPM, filed for protection under Chapter 11 of the United States Bankruptcy Code in the United States Bankruptcy Court for the District of Delaware on March 22, 2002. BCPM served as the general partner and held a 1% interest in BCPOLP, which was created in November 1987 and operated as a commodity chemicals producer. On April 3, 2001, BCPOLP filed for protection under Chapter 11 of the United States Bankruptcy Code, in the United States Bankruptcy Court for the District of Delaware. On February 5, 2003, the U.S. Bankruptcy Court approved a Joint Plan of Liquidation of BCPOLP and BCPM which provided for the transfer of the remaining assets of both entities, including preference, avoidance and other claims against third parties (including us) to separate liquidating entities for liquidation and distribution to their creditors. The transfer of the remaining assets of both entities to the liquidating agents was effective March 13, 2003. Our ownership interest in BCPM was extinguished, and we do not anticipate any distributions from BCPM.
65
On March 19, 2004, we reached a tentative agreement with BCPM Liquidating, the successor in interest to BCPM, providing for the settlement of all claims for a payment by us of $6.0 million. It is anticipated that the settlement agreement will be finalized and submitted to the bankruptcy court for approval by June 15, 2004.
In addition, on March 19, 2004, we reached a tentative agreement with BCP Liquidating, the successor in interest to BCPOLP, providing for the settlement of all claims for a payment by us of $1.1 million. It is anticipated that the settlement agreement will be finalized and submitted to the bankruptcy court for approval by June 15, 2004.
We recorded an expense of $5.9 million at December 31, 2003 relating to these settlements. We cannot assure you that these settlements will be finalized and approved, and absent such approval, these and other claims could be filed against us.
Imperial Home Décor Group. In 1998, pursuant to a merger and recapitalization transaction sponsored by Blackstone and financed by Chase, BDPH, one of our wholly owned subsidiaries, was acquired by Blackstone and subsequently merged with Imperial Wallcoverings to create IHDG. Blackstone provided $84.5 million in equity, a syndicate of banks funded $198.0 million of senior secured financing and $125.0 million of senior subordinated notes were privately placed. We received approximately $314.4 million in cash and 11% of IHDG common stock for our interest in BDPH. On January 5, 2000, IHDG filed for reorganization under Chapter 11 of the U.S. Bankruptcy Code. The IHDG Litigation Trust was created pursuant to the plan of reorganization in the IHDG bankruptcy to pursue preference and other avoidance claims on behalf of the unsecured creditors of IHDG. In November 2001, the Trust filed a lawsuit against us and certain of our affiliates seeking to have the IHDG recapitalization transaction voided as a fraudulent conveyance and asking for a judgment to be entered against us for $314.4 million plus interest, costs and attorney fees. Discovery is proceeding in the case with a cut-off currently scheduled for November 2004.
We have accrued legal expenses for scheduled depositions related to this matter and alternative dispute resolution. We have not recorded a liability for any potential losses because a loss is not considered probable based on current information. We believe that we have strong defenses to the Trust's allegations and we intend to defend the case vigorously if a satisfactory alternative to litigation is not reached. While it is reasonably possible the resolution of this matter may result in a loss due to the many variables involved, management is not able to estimate the range of possible outcomes at this time.
Brazilian Excise Tax Administrative Appeal. In 1992, the State of Sao Paolo Tax Bureau issued an assessment against our primary Brazilian subsidiary claiming that excise taxes were owed on certain intercompany loans made for centralized cash management purposes, characterized by the Tax Bureau as intercompany sales. Since that time, management and the Tax Bureau have held discussions, and our subsidiary has filed an administrative appeal seeking cancellation of the assessment. In December 2001, the Administrative Court upheld the assessment in the amount of 52.0 million Brazilian Real, an amount which includes tax, penalties, monetary correction and interest, or approximately $18.0 million. In September 2002, our subsidiary filed a second appeal with the highest level administrative court, again seeking cancellation of the assessment. We believe that we have a strong defense against the assessment and we will pursue the appeal vigorously, including appealing to the judicial level; however, we cannot assure you that the assessment will not be upheld. At this time we do not believe a loss is probable; therefore, only related legal fees have been accrued. Reasonably possible losses resulting from the resolution of this matter range from zero to $18 million.
HAI Grand Jury Investigation. HAI, a joint venture in which we have a 75% interest, received a grand jury subpoena dated November 5, 2003 from the U.S. Department of Justice Antitrust Division relating to a Foundry Resins Grand Jury investigation. HAI has provided documentation in response to
66
the subpoenas. As is frequently the case when such investigations are in progress, a class action antitrust lawsuit has been brought against us. This action was filed on April 28, 2004 in Federal District Court in Chicago alleging that we and HAI, along with various other entities, had engaged in a price fixing conspiracy.
CTA Acoustics. From the third quarter, 2003 to first quarter 2004, six lawsuits have been filed against us in the 27th Judicial District, Laurel County Circuit Court, in Kentucky, arising from an explosion at a customer's plant where seven plant workers were killed and over 40 other workers were injured. The lawsuits primarily seek recovery for wrongful death, emotional and personal injury, loss of consortium, property damage and indemnity. We expect that a number of these suits will be consolidated. The litigation also includes claims by our customer against its insurer and us. We are pursuing a claim for indemnity against our customer, based on language in our contract with them. We have insurance coverage which will address any payments and legal fees in excess of the $5.0 million which has been accrued for as of December 31, 2003.
Other Legal Proceedings. We are involved in various product liability, commercial and employment litigation, personal injury, property damage and other legal proceedings which are considered to be in the ordinary course of our business. There has been increased publicity about asbestos liabilities faced by manufacturing companies. As a result of the bankruptcies of many asbestos producers, plaintiff's attorneys are increasing their focus on peripheral defendants, including us. We do not believe that we have a material asbestos exposure and believe we have adequate reserves and insurance.
We have reserved approximately $23 million and $24 million at March 31, 2004 and December 31, 2003, respectively, relating to all non-environmental legal matters for legal defense and settlement costs that we believe are probable and estimable at this time.
Properties
As of December 31, 2003, we operated 27 domestic production, manufacturing and distribution facilities in 16 states, the most significant of which is a plant in Louisville, Kentucky. In addition, we operated 21 foreign production and manufacturing facilities primarily in Canada, Brazil, the United Kingdom, South America, Australia and Malaysia. Our production and manufacturing facilities are generally well maintained and effectively utilized. We believe our production and manufacturing facilities are adequate to operate our business.
Our executive and administrative offices, production, manufacturing and distribution facilities at December 31, 2003 are shown in the following table:
| Location | Function | Nature of ownership | ||
|---|---|---|---|---|
| Domestic | ||||
Alexandria, LA | Manufacturing | Owned | ||
| Baytown, TX | Manufacturing | Owned | ||
| Columbus, GA | Manufacturing | Owned | ||
| Demopolis, AL | Manufacturing | Owned | ||
| Diboll, TX | Manufacturing | Owned | ||
| Dutchtown, LA | Storage Terminal | Owned | ||
| Fayetteville, NC | Manufacturing | Owned | ||
| Fremont, CA | Manufacturing | Owned | ||
| Geismar, LA | Manufacturing | Owned | ||
| Gonzales, LA | Manufacturing | Owned | ||
| High Point, NC | Manufacturing | Owned | ||
| Hope, AR | Manufacturing | Owned | ||
| LaGrande, OR | Manufacturing | Owned | ||
| Missoula, MT | Manufacturing | Owned | ||
| Moreau, NY | Manufacturing | Owned | ||
67
| Mt. Jewett, PA | Manufacturing | Owned | ||
| Portland, OR | Manufacturing | Owned | ||
| Sheboygan, WI | Manufacturing | Owned | ||
| Springfield, OR | Manufacturing | Owned | ||
| Virginia, MN | Manufacturing | Owned | ||
| Aurora, IL | Manufacturing | Owned | ||
| Oregon, IL | Manufacturing | Owned | ||
| Toledo, OH | Manufacturing | Owned | ||
| Brady, TX | Manufacturing | Owned | ||
| Louisville, KY | Manufacturing | Owned | ||
| Morganton, NC | Manufacturing | Owned | ||
| Cincinnati, OH | Manufacturing | Owned | ||
| Columbus, OH | Executive and Administration | Leased | ||
| Bellevue, WA | Executive and Administration | Leased | ||
International | ||||
Laverton North, Victoria, Australia | Manufacturing | Owned | ||
| Brisbane, Queensland, Australia | Manufacturing | Owned | ||
| Somersby, New South Wales, Australia | Manufacturing | Owned | ||
| Boituva, Brazil | Manufacturing | Owned | ||
| Cotia, Brazil | Manufacturing | Owned | ||
| Curitiba, Brazil | Manufacturing | Owned | ||
| Laval, PQ, Canada | Manufacturing | Owned | ||
| St. Romuald, PQ, Canada | Manufacturing | Owned | ||
| Vancouver, BC, Canada | Manufacturing | Owned | ||
| Edmonton, AB, Canada | Manufacturing | Owned | ||
| Yumbo, Colombia | Manufacturing | Owned | ||
| Rouen, France | Distribution | Owned | ||
| Prai, Malaysia | Manufacturing | Owned | ||
| Kuantan, Malaysia | Manufacturing | Owned | ||
| Kedah, Malaysia | Manufacturing | Owned | ||
| Barry, South Wales, United Kingdom | Manufacturing | Owned | ||
| Peterlee, England, United Kingdom | Manufacturing | Owned | ||
| Bury, England, United Kingdom | Manufacturing | Owned | ||
| Cowie, Scotland, United Kingdom | Manufacturing | Owned | ||
| Chandlers Ford, England, United Kingdom | Manufacturing | Owned | ||
| Rotterdam, The Netherlands | Manufacturing | Owned |
Employees
At December 31, 2003, we had approximately 2,400 employees. Less than 10% of our employees are members of a labor union. Certain of our European employees are represented by workers' councils. Relationships with our union and non-union employees are generally satisfactory.
68
Directors and Executive Officers
Set forth below are the names, ages and current positions of our executive officers and current directors.
| Name | Position & Office | Age | Served in Present Position Since | |||
|---|---|---|---|---|---|---|
| Craig O. Morrison | Director, President and Chief Executive Officer | 48 | 2002 | |||
| William H. Carter | Director, Executive Vice President and Chief Financial Officer | 50 | 1995 | |||
| Joseph P. Bevilaqua | Executive Vice President—Forest Products and Performance Resins | 49 | 2004 | |||
| Nancy G. Brown | Vice President and General Counsel | 62 | 2003 | |||
| Raymond H. Glaser | Vice President—Strategy and Development | 43 | 2002 | |||
| Richard L. Monty | Vice President—Environmental Health and Safety | 56 | 2004 | |||
| C. Hugh Morton | Vice President—Global Operations | 52 | 2004 | |||
| Judith A. Sonnett | Vice President—Human Resources | 47 | 2001 | |||
| C. Robert Kidder | Chairman of the Board and Director | 59 | 1995 | |||
| Brian F. Carroll | Director | 32 | 2001 | |||
| Paul J. Norris | Director | 57 | 2001 | |||
| John K. Saer | Director | 47 | 2001 | |||
| Scott M. Stuart | Director | 44 | 1995 |
Craig O. Morrison was elected President and Chief Executive Officer effective March 25, 2002. Prior to joining our Company he served as President and General Manager of Alcan Packaging's Pharmaceutical and Cosmetic Packaging business from 1999 to 2002. From 1993 to 1998, he was President and General Manager for Van Leer Containers, Inc. Prior to joining Van Leer Containers, Mr. Morrison served in a number of management positions within General Electric's Plastics division from March 1990 to November 1993, and as a consultant with Bain and Company from 1987 to 1990.
William H. Carter was elected Executive Vice President and Chief Financial Officer effective April 3, 1995 and a director effective November 20, 2001. Throughout his tenure with us, Mr. Carter has been instrumental in the restructuring our holdings, including serving as a director and interim President and Chief Executive Officer of one of our subsidiaries, BCP Management, from January to June 2000. Prior to joining our Company in 1995, Mr. Carter was a partner with PriceWaterhouse LLP, which he joined in 1975. In addition, Mr. Carter was a director of BCP Management, Inc., one of our subsidiaries, and WKI, both of which filed a voluntary petition for reorganization under Chapter 11 of the Bankruptcy Code in 2002.
Joseph P. Bevilaqua is Executive Vice President—Forest Products and Performance Resins, a position he has held since January 2004. Mr. Bevilaqua joined our Company in early 2002 as Vice President, Corporate Strategy and Development. From June 2000 to February 2002, he was the General Manager of Alcan's global plastic packaging business. Prior to Alcan, Mr. Bevilaqua served in leadership positions with companies such as General Electric, Dartco Manufacturing, Monsanto and Russell-Stanley Corporation.
Nancy G. Brown was elected a Vice President and General Counsel effective June 11, 2003. She served as Vice President, General Counsel and Secretary of Borden Foods Corporation from January 1996 to December 2001.
Raymond H. Glaser was elected Vice President—Corporate Strategy & Development in August 2002. Prior to joining our Company he served as Director of Business Development for W.R.
69
Grace & Co. from October 1999 to August 2002. Prior to that, he worked in several capacities from May 1996 to October 1999 for Allied Signal's Performance Polymers division, including as Director of New Ventures.
Richard L. Monty was elected Vice President—Environmental Health & Safety effective January 26, 2004. Prior to joining our Company, he was employed by Huntsman Corporation from July 1992 to January 2004 in various Environmental Health and Safety positions, ultimately serving as Director of Global Environmental Health & Safety from 2001 to January 2004.
C. Hugh Morton was elected Vice President—Global Operations effective January 19, 2004. Prior to joining our Company he served as Vice President of Operations for Thomson Consumer Electronics from January 2001 to December 2002. From July 1998 to September 2000 he was Executive Vice President of Great Lakes Chemical and President of the Polymer Additives Division.
Judith A. Sonnett was elected Vice President—Human Resources on November 24, 2001. She was Vice President of Human Resources of Borden Chemical, Inc., one of our subsidiaries, from November 1998 to November 2001. From 1995 to November 1998, she worked in Human Resources for W.L. Gore and Associates.
C. Robert Kidder was elected a Director, Chairman of the Board and Chief Executive Officer of Borden, Inc. in January 1995, when KKR acquired us. In 1996 he founded Borden Capital Management Partners, which provided private equity investments, corporate governance functions, mergers and acquisitions expertise and strategic partnering across the Borden Family of Companies. Mr. Kidder continued to serve as our Chief Executive Officer through March 2002. In 2003, Mr. Kidder liquidated Borden Capital. In April 2004, he became a partner in Stonehenge Partners, a private equity firm. He is also a director of WKI, Electronic Data Systems Corporation and Morgan Stanley. He is a member of our Executive, Nominating, and Compensation Committees.
Brian F. Carroll was elected a Director on November 20, 2001. He has been an executive with KKR since July 1999. From September 1997 to June 1999 he attended the Stanford University Graduate School of Business. Before attending graduate school, from March 1995 to July 1997, he worked for KKR. He is also a director of AEP Industries, Inc., The Boyds Collection, Ltd., Sealy, Inc. and Rockwood Specialties, Inc. He is Chairman of our Compensation Committee and a member of the Audit Committee.
Paul J. Norris was elected a Director on November 20, 2001. He is Chairman and Chief Executive Officer of W.R. Grace & Co. He served as President and Chief Executive Officer of W.R. Grace & Co. from November 1998 to November 2003 and has served as Chairman since January 1999. On April 2, 2001, W.R. Grace & Co. and sixty-one of its U.S. subsidiaries filed a voluntary petition under Chapter 11 of the U.S. Bankruptcy Code. Prior to joining W.R. Grace & Co., he was Senior Vice President of Allied Signal Incorporated and served as President of its specialty chemicals business from January 1997 to November 1998. In addition to serving as our Director, he is a senior advisor to KKR. A significant portion of his advisory services relate to KKR's investment in us. Mr. Norris is a member of our Audit and Executive Committees.
John K. Saer was elected a Director on November 20, 2001. He has been a director of KKR since January 2001. Prior to that, from 1993 to December 2000 he was with KSL Recreation Corporation, serving as Chief Financial Officer beginning in December 1996. He is also a director of Sealy, Inc. He is a member of our Executive and Compensation Committees and is Chairman of our Audit and Nominating Committees.
Scott M. Stuart has been a Director since 1996 and a general partner of KKR since 1995. He has been a member of KKR & Co., LLC since 1996. He began his employment with KKR as an executive in 1986. He is also a director of The Boyds Collection, Ltd. He is a member of our Executive Committee.
70
Board of Directors
Our Board of Directors is currently comprised of seven directors. We are currently in the process of selecting independent directors, and we expect to add two independent directors to our Board of Directors shortly after consummation of this offering. As long as we are a controlled company, we do not intend to have a majority of independent directors.
Committees of the Board of Directors
Audit Committee. Our Board of Directors has an Audit Committee consisting of three non-management Directors: Messrs. Saer, Carroll and Norris. The Board of Directors has determined that the Chairman of its Audit Committee, Mr. Saer, qualifies as an Audit Committee financial expert as defined in the SEC's rules. The members of our Audit Committee are not independent, as independence for Audit Committee members is defined in Exchange Act Rule 10A-3 or in The New York Stock Exchange listing standards.
We plan to nominate two independent members to our audit committee shortly after consummation of this offering so that all but one of our audit committee members will be independent, in accordance with Rule 10A-3(b)(1)(iv) under the Securities Exchange Act of 1934, as amended. In addition, one of our independent directors will be determined to be an "audit committee financial expert" as such term is defined in Item 401(h) of Regulation S-K.
Compensation Committee. Our Compensation Committee consists of three non-management directors: Messrs Saer, Carroll and Kidder. As a controlled company, under the listing requirements for The New York Stock Exchange, we are exempt from the requirements that compensation of the Chief Executive Officer and other executive officers be determined or recommended to the Board of Directors by a majority of the independent directors or an independent compensation committee.
Nominating Committee. Our Nominating Committee consists of three directors: Messrs Saer, Kidder and Morrison. As a Controlled Company, under the listing requirements for The New York Stock Exchange, we are exempt from the requirement that director nominees be selected or recommended to the Board of Directors by a majority of the independent directors or an independent nominations committee.
Compensation Committee Interlocks and Insider Participation. Messrs. Carroll and Saer are members of the Compensation Committee of the Board of Directors and both are employees of Kohlberg Kravis Roberts & Co. See "Certain Relationships and Related Party Transactions." Mr. Kidder, our Chairman and former Chief Executive Officer, is also a member of the Compensation Committee.
Director Compensation
In 2003, Henry Kravis, a former member of our Board of Directors, and Mr. Stuart received Board fees totaling $15,000. Messrs. Saer, Norris, Carroll and former director George Roberts received Board fees totaling $30,000 and Mr. Kidder received Board fees totaling $22,500. No additional compensation was paid for committee participation or special assignments. Directors who were also our employees received no remuneration for serving as directors.
Kohlberg Kravis Roberts & Co. received an annual fee of $3 million from us in 2003. Effective May 1, 2004, the annual fee payable to KRR was reduced to $1 million. Messrs. Carroll, Saer and Stuart are, and Messrs. Kravis and Roberts were, our directors and are affiliated with Kohlberg Kravis Roberts & Co. Paul Norris is also an adviser to KKR.
71
Directors who served prior to March 15, 1995 and who were not our employees are provided, upon attaining age 70, annual benefits through a funded grantor trust equal to their final annual retainer if they served in at least three plan years. Such benefits can continue for up to 15 years.
Code of Ethics
We have a Code of Business Ethics that applies to all associates, including our Chief Executive Officer and senior financial officers. These standards are designed to deter wrongdoing and to promote the honest and ethical conduct of all employees. Excerpts from the Code of Business Ethics, which address the subject areas covered by the SEC's rules, are posted on our website: www.bordenchem.com under "About Us". Any substantive amendment to, or waiver from, any provision of the Code of Business Ethics with respect to any senior executive or financial officer shall be posted on this website. The information contained on our website is not part of this prospectus.
Executive Compensation
The following table sets forth information with respect to compensation earned by our Chief Executive Officer, our four next most highly compensated executive officers and one former executive officer for the fiscal year ended December 31, 2003.
| | | Annual Compensation | Long-Term Compensation | | ||||||||||||
|---|---|---|---|---|---|---|---|---|---|---|---|---|---|---|---|---|
| | | | | | Awards | Payouts | | |||||||||
| Name and Principal Position | Year | Salary ($) | Bonus ($) | All Other Annual Compensation ($) | Restricted Stock Award(s) ($) | Securities Underlying Options (#) | LTIP Payouts ($) | All Other Compensation(1) ($) | ||||||||
| Craig O. Morrison President and Chief Executive Officer | 2003 2002 | 524,230 375,000 | 320,000 300,000 | — — | — 2,380,952 | (2) | — 1,386,667 | — — | 39,173 54,076 | |||||||
| William H. Carter Executive Vice President and Chief Financial Officer | 2003 2002 2001 | 525,300 506,154 486,250 | (3) | 627,100 670,363 215,890 | (4) (4) | — — — | — — — | 480,000 — — | — — — | 56,584 825,449 34,907 | ||||||
| Joseph P. Bevilaqua Executive Vice President | 2003 2002 | 266,456 182,692 | 126,717 56,250 | — 50,085 | — 1,190,475 | (2) | — 105,333 | — — | 15,719 61,016 | |||||||
| Judith A. Sonnett Vice President Human Resources | 2003 2002 | 240,056 225,698 | 73,819 69,924 | 43,907 — | (5) | — — | 131,250 — | — — | 10,000 14,590 | |||||||
| Raymond H. Glaser Vice President Strategy & Dvlp. | 2003 2002 | 184,361 62,307 | 47,396 20,000 | — 9,071 | — — | 157,000 — | — — | 21,000 24,938 | ||||||||
| William F. Stoll, Jr.(6) Former Executive Vice President and General Counsel | 2003 2002 2001 | 242,446 417,599 409,000 | 419,000 414,913 180,068 | (4) (4) | — — — | — — — | — — — | — — — | 195,687 449,205 19,571 | |||||||
- (1)
- Except as stated herein, amounts shown in this column for 2003 consist of matching Company contributions to the Retirement Savings Plan and the executive supplemental benefit plans. The amount for Mr. Stoll also includes severance pay of $174,307. The amount shown for Mr. Glaser includes $11,000 for reimbursed moving expenses.
- (2)
- Mr. Morrison's restricted stock consists of 1,058,201 shares and Mr. Bevilaqua's restricted stock consists of 529,100 shares. There is no published market value for Borden's common shares at December 31, 2003. Dividends are not payable on the restricted shares. See description in "—Employment Arrangements" for other terms of Mr. Morrison's and Mr. Bevilaqua's restricted stock, which vests after three years of employment, unless the executive is terminated without cause, in which event vesting is accelerated.
- (3)
- 100% of Mr. Carter's 2002 salary was paid by Borden Capital, which is funded by fees paid by us.
- (4)
- A portion of the bonus payments made in 2002 to Messrs. Carter ($417,263) and Stoll ($225,000) relate to installments paid for a one-time retention bonus and were paid by Borden Capital, Inc., funded by fees paid by us. A portion of the bonus payment made in 2003 to Mr. Carter ($380,000) and all of Mr. Stoll's 2003 bonus were funded by BHI and also relate to this retention bonus.
72
- (5)
- Tax gross-up.
- (6)
- Mr. Stoll was Executive Vice President and General Counsel through July 18, 2003.
Option Grants
The following table sets forth options for shares of our common stock granted to each of our executive officers included in the Summary Compensation Table during fiscal year 2003.
| Individual Grants | | |||||||||||
|---|---|---|---|---|---|---|---|---|---|---|---|---|
| Name | Number of Securities Underlying Options Granted | Percent of Total Options Granted To Employees In Fiscal Year | Exercise Or Base Price ($/per share) | Expiration Date | Grant Date Present Value $ | |||||||
| Craig O. Morrison | — | — | — | — | — | |||||||
| William H. Carter | 480,000 | 13.88 | % | $ | 2.00 | 10/1/2013 | $ | 129,123 | ||||
| Joseph P. Bevilaqua | — | — | — | — | — | |||||||
| Judith A. Sonnett | 131,250 | 3.80 | % | $ | 2.00 | 10/1/2013 | $ | 35,307 | ||||
| Raymond H. Glaser | 157,500 | 4.56 | % | $ | 2.00 | 10/1/2013 | $ | 42,369 | ||||
| William F. Stoll, Jr. | — | — | — | — | — | |||||||
- (1)
- The fair value of each option grant is estimated on the date of the option grant using the Black-Scholes option pricing model with risk free interest rates of 2.910%, dividend rates of 0.0%, expected volatility of 0.01% and expected life of five years.
In 1999, 2003 and 2004, members of our management team were granted options to purchase shares of our common stock under our Amended and Restated 1996 Stock Purchase and Option Plan for Key Employees, which we refer to as the Equity Plan. As of March 31, 2004, options to purchase 644,680 shares granted in 1999 were outstanding with an exercise price of $5.00 per share. As of March 31, 2004, options to purchase 3,521,250 shares that were granted in 2003 and 2004 remain outstanding with an exercise price of $2.00 per share.
In addition, options have been granted to Messrs. Morrison and Bevilaqua as described below under "—Employment Arrangements."
The following table sets forth the number and value of securities underlying unexercised options held by each of our executive officers listed on the Summary Compensation Table as of December 31, 2003. None of our executive officers exercised any options in fiscal year 2003, and we do not have any stock appreciation rights.
| | | | Number of Securities Underlying Unexercised Options at Fiscal Year-End (#) | Value of Unexercised In-The-Money Options At Fiscal Year-End ($) | ||||||||||
|---|---|---|---|---|---|---|---|---|---|---|---|---|---|---|
| Name | Shares Acquired On Exercise (#) | Value Realized ($) | ||||||||||||
| Exercisable | Unexercisable | Exercisable | Unexercisable | |||||||||||
| Craig O. Morrison | — | — | 42,133 | 1,344,534 | $ | 99,434 | $ | 3,173,100 | ||||||
| William H. Carter | — | — | — | 480,000 | — | $ | 964,800 | |||||||
| Joseph P. Bevilaqua | — | — | 21,066 | 84,267 | $ | 49,718 | $ | 198,868 | ||||||
| Judith A. Sonnett | — | — | — | 131,250 | — | $ | 263,813 | |||||||
| Raymond H. Glaser | — | — | — | 157,500 | — | $ | 316,575 | |||||||
| William F. Stoll, Jr. | — | — | — | — | — | — | ||||||||
Employment Arrangements
We have an arrangement with Mr. Morrison that provides for his services as President and Chief Executive Officer beginning March 2002. Under the terms of the arrangement, Mr. Morrison was provided with relocation assistance, a bonus opportunity, an equity investment opportunity, and a 2001 incentive payment guarantee. Pursuant to his employment arrangement, Mr. Morrison purchased 222,222 shares of our common stock at $2.25 per share and received options to purchase 210,667 shares granted with an exercise price of $2.25 per share, each of which vest ratably over five years. Mr. Morrison also received
73
performance options to purchase 1,176,000 shares with an exercise price of $2.25 per share, which vest at the earlier of five years, or in 33% increments when we meet Adjusted EBITDA targets of $170 million, $190 million and $210 million. The vesting of Mr. Morrison's options will be accelerated in the event KKR beneficially owns less than a majority of our common stock. In addition Mr. Morrison was granted 1,058,201 shares of restricted stock that vest after three years of employment, at which time one-half of the shares may be sold to us. The remaining shares may be sold to us after his fourth year of employment. The value of the shares is to be determined based upon a formula and is capped under certain circumstances at $2 million. In the event Mr. Morrison's employment is terminated by us without cause, the vesting of the restricted shares is accelerated based on his length of employment. Dividends are not payable on the restricted shares. In the event that the return on Mr. Morrison's equity investment in us is negative, due solely to certain specified circumstances, the arrangement requires us to purchase his investment at a price equal to his initial investment. The arrangement also entitles Mr. Morrison to receive a perquisite payment in the amount of $40,000 annually, usual and customary health and pension benefits and provides for eighteen months severance based on his monthly base salary in the event of termination of employment by us for reasons other than for cause.
We have an arrangement with Mr. Bevilaqua that became effective in March 2002. Under the terms of his employment arrangement, Mr. Bevilaqua was provided with relocation assistance, a bonus opportunity an equity investment opportunity, and a 2001 incentive payment guarantee. Pursuant to his employment agreement Mr. Bevilaqua purchased 111,111 shares of our common stock at $2.25 per share and received options to purchase 105,333 shares, which were granted at $2.25 per share, each of which vest ratably over five years. The vesting of Mr. Bevilaqua's options will be accelerated if KKR beneficially owns less than a majority of our common stock. Mr. Bevilaqua was also granted 529,100 shares of restricted stock that vest after three years of employment, at which time one-half of the shares may be sold to us. The remaining shares may be sold to us after his fourth year of employment. The value of the shares is to be determined based upon a formula and is capped, under certain circumstances, at $1 million. In the event Mr. Bevilaqua's employment is terminated by us without cause, the vesting of the restricted shares is accelerated based on his length of employment. Dividends are not payable on the restricted shares. In the event that the return on Mr. Bevilaqua's equity investment in Borden is negative, due solely to certain specified circumstances, the arrangement requires us to purchase his investment at a price equal to his initial investment. The arrangement also entitles Mr. Bevilaqua to receive a perquisite payment in the amount of $25,000 annually, usual and customary health and pension benefits, and provides for twelve months severance based on his monthly base salary in the event of termination of employment by us for reasons other than for cause.
Mr. Stoll, our former Executive Vice President and General Counsel, has an arrangement that provides him with certain benefits. Under the terms of the agreement, Mr. Stoll is entitled to receive 104 weeks of base-salary severance, which will end on July 16, 2005. A retention bonus payable to him in installments from 2002 to 2005 was paid in full upon Mr. Stoll's termination in 2003. The 2003 retention bonus payments, which totaled $419,000 and were paid in two installments, were funded by our parent, BHI. The arrangement further provides for the payment of a special pension benefit at age 58, which is described under "—Retirement Benefits" below.
We have an agreement with Mr. Carter relating to his employment as Executive Vice President and Chief Financial Officer. Under the terms of the agreement, Mr. Carter is entitled to a retention bonus to be funded by our parent equal to $1,200,000 payable in installments from 2002 to 2005 or upon termination for reasons other than for cause. The agreement also provides for annual incentive plan and management equity plan participation, an annual perquisites payment of $30,000, and twenty-four months of base salary severance, in the event of termination of employment for reasons other than for cause.
We have customary offer of employment letters with Messrs. Glaser, Monty, Morton and Mesdames Brown and Sonnett that set forth, among other things, compensation, benefits and other standard terms of employment, which are consistent with our existing policies.
74
1996 Stock Purchase and Option Plan
General. We have adopted the Amended and Restated 1996 Stock Purchase and Option Plan for Key Employees of Borden Chemical, Inc. and its subsidiaries, which we refer to as the Equity Plan, which provides for the grant of incentive stock options, other stock options, stock appreciation rights, restricted stock, purchase stock, dividend equivalent rights, performance units, performance shares and other stock-based grants. Pursuant to the Equity Plan, we have granted options (including performance options), restricted stock and rights to purchase stock to members of management and key employees. Under the Equity Plan, there are shares available for grants. As of March 31, 2004, 7,578,564 grants were outstanding under the Equity Plan.
Exercise Price. The Equity Plan permits us to grant options and other stock-based grants having exercise prices that are less than the fair market value of the underlying stock on the date of grant. However, to date, we have only granted options that, as of the date of grant, have exercise prices equal to the fair market value of the underlying stock on the date of the grant.
Vesting of Awards. Options that have been granted under the Equity Plan generally become exercisable by the holder in installments of 20% per year over a five-year period. However, performance options and restricted stock have been granted to two senior executives containing shorter vesting periods.
Effect of Change of Control. Upon the occurrence of a change of control of the Company, which is defined as (i) a sale of all or substantially all of our assets to a person who is not an affiliate of KKR, (ii) a sale by KKR or any of its affiliates resulting in more than 50% of our voting stock being held by a person or group that does not include KKR or any of its affiliates or (iii) a merger or consolidation of the Company into another entity that is not an affiliate of KKR, if and only if any such event in clause (i), (ii) or (iii) above results in the inability of KKR or its affiliate to elect a majority of our Board of Directors (or the resulting entity) in the applicable option agreements, the exercisability of the options generally accelerates. This will not be the case with options to be granted to management in connection with this offering.
Effect of Corporate Change. Under the Equity Plan, our Compensation Committee may adjust the number of shares subject to the Equity Plan and available for grant and various terms of outstanding grants in the event of any change in our outstanding common stock by reason of a stock split, spin-off, stock dividend, stock combination or reclassification, recapitalization or merger, change of control or similar event. For example, the Compensation Committee may change the exercise price and terms of the options if it deems that such changes are equitably required.
Amendment and Termination of the Equity Plan. Our Compensation Committee has the power to amend any outstanding option grants without the consent of participants, so long as the amendment does not modify the outstanding grants in a manner that is adverse to the participants. The Board may amend, suspend or terminate the Equity Plan, except that, in general, without shareholder approval, the Board may not increase the aggregate number of shares available for grants, change the requirements relating to the Compensation Committee, decrease the price of outstanding options or stock appreciation rights, or extend the term of the Equity Plan. The Equity Plan is scheduled to terminate on December 31, 2016, unless it is terminated earlier by the Board. Termination of the Equity Plan will not affect the validity of any grant outstanding on the date of the termination of the Equity Plan.
Grants to Management in Connection with the Offering.
To strengthen management's commitment to our financial success, we intend to offer the opportunity to approximately 70 members of management to purchase common stock in connection with this offering. We expect the total number of shares to be offered for purchase to be . Shares will be offered at the offering price. Based upon the number of shares purchased by a manager,
75
such manager will be granted restricted stock and options, also at the offering price. Options and restricted stock will vest and become unrestricted, as the case may be, 20% per year over a five-year period. Vesting of options and restricted stock will not accelerate upon a change of control. If management purchases the total number of shares offered for purchase, we anticipate granting shares of restricted stock and options.
Retirement Benefits
Our Employees Retirement Income Plan, or ERIP, for salaried employees was amended as of January 1, 1987 to provide benefit credits equal to 3% of earnings to the extent that such credit does not exceed the Social Security wage base for the year plus 6% of earnings in excess of the wage base. Earnings include annual incentive awards paid currently, but exclude any long-term incentive awards. Benefits for service through December 31, 1986 are based on the plan formula then in effect and have been converted to opening balances under the plan. Both opening balances and benefit credits receive interest credits at one-year Treasury bill rates until the participant commences receiving benefit payments. For the year 2003, the interest rate as determined in accordance with the plan language was 1.495%. Benefits vest after completion of five years of employment for employees hired on or after July 1, 1990.
The total projected annual benefits payable under the formulas of the ERIP at age 65 without regard to the Section 415 or 401(a)(17) limits and recognizing supplemental pensions, as described above, are as follows for the Named Executive Officers in 2003: Craig O. Morrison, $82,142; William H. Carter, $120,266; Joseph P. Bevilaqua, $43,865; Judith A. Sonnett, $45,222; Raymond H. Glaser, $32,976 and William F. Stoll Jr., $57,263 (not including the special arrangement described below which is projected to be a one-time payment of $641,757).
Our retirement savings plan, which we refer to as the Retirement Savings Plan; is a multiple employer defined contribution plan in which the majority of our full-time employees may participate. Participants may make "basic savings contributions," as defined by the Retirement Savings Plan, from 1% to 5% of their annual compensation. Salaried participants who were hired prior to January 1, 1987 who have at least 120 months of service, however, are eligible to make basic savings contributions of up to 7% of their annual compensation. We contribute an amount ranging from 50% to 100% of the participants' basic savings contributions to the Retirement Savings Plan on a monthly basis. Our contributions that exceed the minimum basic savings contributions are dependent upon our achievement of financial measurements.
The executive supplemental pension plan, which we refer to as the Supplemental Plan, provides an opportunity for employees whose compensation exceeds the limits under Section 401(a)(17) of the Internal Revenue Code, or the Code, whereby benefits are not permitted to be paid through a qualified plan and its related trust, to voluntarily elect to defer compensation. The Supplemental Plan provides for supplemental pension on eligible compensation above the defined Code limits and any deferred compensation using the same formula as ERIP. The Supplemental Plan also provides other employees with an opportunity to elect a "make-up benefit" for the benefits under Section 415 of the Code as it relates to defined contribution plans using the same formula as the Retirement Savings Plan.
We have a special retirement arrangement with Mr. Stoll, former Executive Vice President and General Counsel. Under this arrangement, we will calculate the benefit Mr. Stoll would have received from his former employer, using predetermined assumptions, and deduct from this amount the retirement benefits accrued under certain Borden retirement programs. Any shortfall in benefits will be paid by us as a non-qualified benefit. Special provisions also apply in the event of death or disability. The pension payment will be paid to Mr. Stoll when he reaches age 58 in 2006.
76
Equity Plan Information
The following table contains certain information regarding our Equity Plan, which is administered by the Compensation Committee of our Board of Directors and provides for the purchase or grant of stock and stock-based awards to employees or other persons having a unique relationship with us or our subsidiaries.
| Plan Category | Number of securities to be issued upon exercise of outstanding options, warrants and rights(a) | Weighted-average exercise price of outstanding options, warrants and rights(b) | Number of securities remaining available for future issuance under equity compensation plans (excluding securities reflected in column(a))(c) | |||||
|---|---|---|---|---|---|---|---|---|
| Equity compensation plans approved by security holders | 5,532,360 | $ | 2.42 | 4,017,639 | ||||
Equity compensation plans not approved by security holders | — | — | — | |||||
Total | 5,532,360 | $ | 2.42 | 4,017,639 | ||||
77
PRINCIPAL AND SELLING SHAREHOLDER
The following table sets forth certain information regarding the beneficial ownership of our common stock by
- •
- each person that beneficially owns more than 5% of the outstanding shares of our common stock,
- •
- each director and executive officer,
- •
- all of our directors and executive officers as a group,
- •
- other employees and
- •
- the Selling Shareholder.
Except as stated below, each holder listed below has sole investment and voting power with respect to the shares of common stock beneficially owned by the holder.
| | Beneficial Ownership of Shareholders Prior to this Offering | | Beneficial Ownership of Shareholders After this Offering | |||||||
|---|---|---|---|---|---|---|---|---|---|---|
| Name and Address of Beneficial Owner | Shares to be Sold in this Offering | |||||||||
| Number | Percentage | Number | Percentage | |||||||
| KKR Associates(1) 9 West 57th Street, New York 10019 | 198,974,994 | 99.0 | ||||||||
| C. Robert Kidder | — | |||||||||
| Scott M. Stuart(1) | — | |||||||||
| Brian F. Carroll | — | |||||||||
| John K. Saer | — | |||||||||
| Paul J. Norris | — | |||||||||
| Craig O. Morrison | 1,364,690 | (2) | * | |||||||
| William H. Carter | — | |||||||||
| Joseph P. Bevilaqua | 682,344 | (2) | * | |||||||
| Nancy G. Brown | — | |||||||||
| Raymond H. Glaser | — | |||||||||
| Richard L. Monty | — | |||||||||
| C. Hugh Morton | — | |||||||||
| Judy A. Sonnett | — | |||||||||
| William F. Stoll, Jr. | — | |||||||||
| All Directors and Executive Officers as a group | 2,047,034 | (3) | 1.0 | |||||||
- *
- Less than 1%.
- (1)
- The Common Stock shown as beneficially owned by KKR Associates is directly held by Borden Holdings, LLC, a Delaware limited liability company which is wholly owned by BW Holdings, LLC, a Delaware limited liability company, the managing member of which is a limited partnership, of which KKR Associates is the sole general partner and as to which it possesses sole voting and investment power. KKR Associates is also the beneficial owner of 632,000,000 units of BW Holdings, LLC. KKR Associates is a limited partnership of which Messrs. Edward A. Gilhuly, Perry Golkin, James H. Greene, Jr., Henry R. Kravis, Michael W. Michelson, Alexander Navab, Paul E. Raether, George R. Roberts, and Scott M. Stuart are the general partners. Such persons may be deemed to share beneficial ownership of the shares shown as owned by KKR Associates. The foregoing persons disclaim beneficial ownership of any such shares.
- (2)
- As of March 1, 2004, Mr. Morrison and Mr. Bevilaqua beneficially owned 1,280,423 and 640,211 shares of common stock, respectively, and had the right to acquire beneficial ownership within 60 days to an additional 84,267 and 42,133 shares of common stock, respectively, pursuant to the exercise of stock options.
- (3)
- Equity securities beneficially owned by all Directors and Executive Officers as a group consist of 1,920,634 common shares and 126,400 shares subject to currently exercisable options.
78
CERTAIN RELATIONSHIPS AND RELATED PARTY TRANSACTIONS
Financing and Investing Arrangements
We, along with HAI, had separate borrowing arrangements with Foods, which was evidenced by demand promissory notes bearing interest at variable rates. These loans are reported as "Loans payable to affiliates" on the Consolidated Balance Sheets and totaled $18.3 million at December 31, 2003. Following the termination of our uncommitted letter of credit facility in 2003 (see Note 10 to our Consolidated Financial Statements included elsewhere in this prospectus), we are limited to borrowing up to $30.0 million from our affiliates, excluding HAI. Of the total loans outstanding, we owed $12.3 million at December 31, 2003. HAI owed $6.0 million at December 31, 2003 and had $4.0 million available for additional borrowings. Interest rates ranged from 1% to 4.75% and interest expense totaled $0.6 million for the year ended December 31, 2003. In early 2004, we entered into a similar borrowing agreement with BW Holdings, LLC and cancelled our arrangement with Foods. In early 2004, HAI obtained a $20.0 million credit facility with an external bank and terminated its affiliated borrowing arrangement (see Note 20 to our Consolidated Financial Statements included elsewhere in this prospectus).
We hold a $404.8 million note receivable for $512.1 million including accrued interest from BHI, which has been accounted for as a reduction of equity. We accrued interest quarterly on the note receivable in "Paid-in capital." Historically, BHI funded the interest due on the note through common stock dividends that we paid to them; however, we have neither received quarterly interest nor declared an associated dividend since October 15, 2001 (see Note 14 to our Consolidated Financial Statements included elsewhere in this prospectus). Immediately prior to the completion of this offering, pursuant to the 2004 Reorganization, BHI, our parent company, will transfer substantially all of its assets (consisting of all of our common stock owned by BHI) to us in exchange for (a) new common stock issued by us, at the ratio of share of new common stock for every shares of old common stock, and (b) our assumption and subsequent cancellation of the above-mentioned affiliate note receivable, including accrued interest thereupon. All of our other shareholders will also participate in the -for- share exchange. After such exchange, BHI will convert into a Delaware limited liability company and change its name to Borden Holdings, LLC. The 2004 Reorganization will not have any impact on the beneficial ownership of, or control over, us.
We also had net affiliate interest income relating to other affiliates of $500,000 for the year ended December 31, 2001.
Administrative Service, Management and Consulting Arrangements
Commencing in 2003, we assumed certain management, consulting and board services previously provided to us by Borden Capital, Inc., or Capital, as described below, while other such services were assumed by KKR. During the year ended December 31, 2003, we recorded $3.0 million for the fixed fee due to KKR under this arrangement. During 2002, Capital provided us management, consulting and board services, and we provided certain administrative services to Capital. Capital charged us an annual fee of $9.0 million, payable quarterly in arrears, which represented the net amount of Capital's services less our fee for providing administrative services to Capital. During 2002, BHI made a decision to cease the operations of Capital by the end of the first quarter of 2003.
We provide administrative services to Foods. Fees received for these services totaled $0.05 million for the year ended December 31, 2003. In addition, we pay certain costs on behalf of Foods and are reimbursed by Foods for 100% of these costs.
We provide certain administrative services to BW Holdings, LLC and other affiliates under a service agreement, which commenced on January 1, 2003. During the year ended December 31, 2003, we charged BW Holdings, LLC $0.5 million for such services.
79
We have entered into a consultancy agreement with an affiliate of KKR in which we have agreed to pay KKR, effective May 1, 2004, a $1.0 million annual fee for management, consulting and financial services. We have agreed to indemnify KKR and its affiliates for all liabilities, losses and other damages and expenses arising out of that agreement.
Registration Rights Agreement
On January 1, 2002, we entered into a registration rights agreement with the Selling Shareholder and BDS Two, Inc., one of our subsidiaries. Under the registration rights agreement, the Selling Shareholder, BDS Two, Inc. and certain of their transferees, subject to a number of conditions and limitations, may require us to file a registration statement under the Securities Act to register the sale of shares of our common stock, preferred stock and warrants held by them. We are responsible for expenses for the first six registrations required by the Selling Shareholder, BDS Two, Inc. or their transferees. The registration rights agreement also provides, subject to a number of conditions and limitations, that the Selling Shareholder, BDS Two, Inc. and certain of their transferees have "piggyback" registration rights in connection with registered offerings of our common stock that we initiate, including this offering. In those circumstances, we will be required to pay all registration expenses. If we at any time grant to any other holders of our common stock, preferred stock or warrants any rights to request us to effect the registration under the Securities Act on terms more favorable than the terms under the registration rights agreement, the Selling Shareholder, BDS Two Inc., and their transferees will be granted the same rights. If any registration is in connection with an underwritten public offering, the Selling Shareholder, BDS Two, Inc. and their transferees agree not to effect a public sale or distribution of any equity securities or any security convertible into one of our equity securities within seven days before, or up to 180 days after, the effective date of such registration.
Shareholder Agreements and Sale Participation Agreements
Two of our executive officers have purchased shares and were granted restricted shares of our common stock and members of our management and a number of our employees have been granted options to purchase our common stock under our Equity Plan.
In connection with these purchases and grants, we have entered into shareholder agreements with these two executive officers which impose restrictions on their ability to transfer shares of our common stock prior to the fifth anniversary of the date on which the shares were originally acquired. These transfer restrictions will be waived with respect to each shareholder following a change of control of us. Upon a public offering resulting in an active trading market in 19% or more of our common shares, these employees are entitled to "piggyback" registration rights under the registration rights agreement described above. They are permitted to participate in a registered offering on pro rata basis relative to the percentage of shares that are registered. However, the managing underwriter participating in an offering has the right to limit the number of shares included in such registration.
In addition, these two executive officers have entered into sale participation agreements with the Selling Shareholder and its affiliates, which provide that if the Selling Shareholder sells shares of our common stock other than in a qualified public offering, they have a right to participate in that sale.
Other Transactions and Arrangements
KKR owns approximately 5.5% on a fully diluted basis of Willis Group Holdings Limited, or Willis, which is a public company traded on The New York Stock Exchange. Willis acts as our broker in placing all our insurance coverage. Our arrangement with Willis is in the ordinary course of business and is on an arm's length basis. As of December 31, 2003, we had paid $0.4 million to Willis for their services.
80
Capital contributions to us from BHI and Foods totaled $26.3 million for the year ended December 31, 2003. See Note 14 to our Consolidated Financial Statements included elsewhere in this prospectus.
Immediately prior to the completion of this offering, pursuant to the 2004 Reorganization, BHI, our parent company, will transfer to us substantially all of its properties, consisting of all of our common stock owned by BHI, in exchange for (a) new common stock issued by us, at the ratio of shares of old common stock for every share of new common stock, and (b) the assumption by us of a certain note (described above in "—Financing and Investment Arrangements") issued by BHI to us and accrued interest thereupon. All of our other shareholders will also participate in the -for- share exchange. After such exchange, BHI will convert from a corporation into a limited liability company under Delaware law and will change its name to Borden Holdings, LLC. The 2004 Reorganization will not have an impact on the beneficial ownership of, or control over, us. See Note 3 to our Consolidated Financial Statements included elsewhere in this prospectus.
In 2001, we merged our North American foundry resins and coatings businesses with similar businesses of Delta to form HAI, in which we have a 75% economic interest. The Limited Liability Agreement of HAI provides Delta the right to purchase between 3% and 5% of additional interest in HAI each year beginning in 2004. Pursuant to this provision, in the first quarter of 2004, Delta provided us with written notice of their intention to exercise their option to purchase an additional 5% interest in 2004. Delta's purchase price of the interest is based on the enterprise value of HAI determined by applying a contractually agreed upon multiple to EBITDA, as defined in the agreement. Delta is limited to acquiring a maximum of 25% of additional interest in HAI under this arrangement.
In the past we have entered into agreements under which we are required to indemnify affiliates of KKR against liabilities, losses and other damages in connection with certain transactions.
81
Common Stock
We have 300,000,000 shares of authorized common stock, $0.01 par value. At March 31, 2004, 200,895,628 shares of our common stock were issued and outstanding. The holders of our common stock have one vote per share in all proceedings in which action shall be taken by our shareholders. All shares of our common stock rank equally as to dividends, voting powers and participation in assets. There are no preemptive or conversion rights and no provisions for redemption, purchase for cancellation, surrender or sinking funds.
Preferred Stock
We also have 100,000,000 shares of authorized preferred stock, no par value. Our Certificate of Incorporation provides that our Board of Directors may, without the approval of our shareholders, authorize and issue preferred stock in one or more classes with such designations, powers, preferences, and relative, participating, optional and other rights, qualifications, limitations, and restrictions as the directors may determine, including, but not limited to, the dividend rate, conversion rights, voting rights, redemption rights, and liquidation preference. Any class of preferred stock may rank senior to our common stock with respect to the payment of dividends or amounts distributed, whether upon liquidation, dissolution, winding-up, or otherwise. In addition, any amendment to the Articles to delete or vary any preference, right, condition, restriction, limitation or prohibition attached to the preferred stock, or to create any special shares that would have equal priority to the preferred stock, requires the affirmative vote of at least three-fourths of the votes cast at a shareholders' meeting.
We do not have any shares of preferred stock outstanding. Issuances of preferred stock, while providing us with flexibility in connection with general corporate purposes, may, among other things, have an adverse effect on the rights of holders of our common stock. For example, the issuance of any preferred stock with voting or conversion rights may adversely affect the voting power of the holders of our common stock, and, in certain circumstances, such issuances could have the effect of decreasing the market price of our common stock. We have no current plan to issue any shares of preferred stock.
Rights to Dividends
Subject to any prior rights of holders of preferred stock then outstanding, the holders of our common stock will be entitled to dividends when, as, and if declared by our Board of Directors out of funds legally available for dividends.
Rights Upon Liquidation
In the event of our voluntary or involuntary liquidation or dissolution, or the winding-up of our affairs, our assets will be applied first to the payment, satisfaction and discharge of our existing debts and obligations, including the necessary expenses of dissolution or liquidation, then to satisfy any senior rights of holders of our preference securities, if any, and then pro rata to the holders of our common stock.
Transfer Agent and Registrar
The transfer agent and registrar for our common stock is .
Listing
We propose to list our common stock on The New York Stock Exchange, subject to official notice of issuance, under the symbol "BCI."
82
COMMON STOCK ELIGIBLE FOR FUTURE SALE
Upon completion of this offering, we will have a total of million shares of common stock outstanding. All of the shares sold in the offering will be freely tradable without restriction or further registration under the Securities Act by persons other than our "affiliates." Under the Securities Act, an "affiliate" of a company is a person that directly or indirectly controls, is controlled by, or is in common control with that company.
The remaining million shares of our outstanding common stock will be "restricted securities" within the meaning of Rule 144 under the Securities Act and may not be sold in the absence of registration under the Securities Act unless an exemption from registration is available, including the exemptions contained in Rule 144. We have the obligation to file registration statements covering the shares owned by the Selling Shareholder, BDS Two, Inc. and certain of their transferees under certain circumstances. In addition, certain members of our management will have "piggyback" registration rights upon the occurrence of certain public offerings of our common stock. See "Certain Relationships and Related Party Transactions—Registration Rights Agreements". In addition, sales of our common stock are restricted by lock-up agreements that our directors, executive officers and all of our existing shareholders will enter into with the underwriters and with us, as more fully described in "Underwriting."
In general, under Rule 144, a person (or persons whose shares are aggregated), including any person who may be deemed our affiliate, is entitled to sell within any three-month period, a number of restricted securities that does not exceed the greater of 1% of the then-outstanding shares of common stock and the average weekly trading volume during the four calendar weeks preceding each such sale, provided that at least one year has elapsed since such shares were acquired from us or any affiliate of ours and certain manner of sale and notice requirements and requirements as to availability of current public information about us are satisfied. Any person who is deemed to be our affiliate must comply with the provisions of Rule 144 (other than the one-year holding period requirement) in order to sell shares of our common stock that are not restricted securities (such as shares acquired by affiliates either in this offering or through purchases in the open market following this offering). In addition, under Rule 144(k), a person who is not our affiliate, and who has not been our affiliate at any time during the 90 days preceding any sale, is entitled to sell such shares without regard to the foregoing limitations, provided that at least two years have elapsed since the shares were acquired from us or any affiliate of ours.
No prediction can be made as to the effect, if any, future sales of our shares, or the availability of shares for future sales, will have on the market price of our common stock prevailing from time to time. The sale of substantial amounts of our common stock in the public market, or the perception that such sales could occur, could harm the prevailing market price of our common stock. See "Risk Factors—Risks Relating to Our Common Stock and This Offering."
83
Revolving Credit Facility
On September 23, 2002, we entered into a $175.0 million senior secured revolving credit facility, which we refer to as the Credit Facility, with a syndicate of banks and other lenders for whom Fleet Capital Corporation, or Fleet, acts as administrative agent and Fleet Securities, Inc., acts as lead arranger, advisor and syndication manager. Fleet Capital Canada Corporation and Fleet National Bank, London U.K. branch, also acted as syndication agents.
We and certain of our subsidiaries are borrowers under the Credit Facility. Available funds under the Credit Facility may be used for working capital, capital expenditures and other general corporate purposes. Our Credit Facility is secured with inventory and accounts receivable in the U.S., Canada and the U.K., a portion of property and equipment in Canada and the U.K. and the stock of certain subsidiaries.
Availability
Our maximum borrowing allowable under the Credit Facility is calculated monthly and is based upon specific percentages of eligible accounts receivable (85%), inventory (60%) and fixed assets (100% of cash held as collateral). As of December 31, 2003, our maximum borrowing allowable under the Credit Facility was $144,000, of which $98,000, after outstanding letters of credit, was unused and available.
Interest Rates and Fees
Amounts outstanding under our Credit Facility bear interest, at our option, at either a floating LIBOR rate or Fleet National Bank's base rate plus the applicable interest margin. The applicable interest margin is determined based on our ratio of consolidated indebtedness to consolidated EBITDA, as defined in the agreement governing the Credit Facility. For amounts outstanding under the Credit Facility, the applicable interest margin ranges from 2.25% to 3.0% over the LIBOR rate and 0.75% to 1.5% over the base rate. In addition, we pay a commitment fee of 0.5% per year on undrawn amounts.
We are required to pay a letter of credit fee equal to the applicable margin for LIBOR loans on the face amount of all standby letters of credit as well as a fronting fee equal to 0.125% per year of the aggregate available amount of such letter. We are also required to pay certain other fees and expenses.
Guaranty
Our obligations under the Credit Facility are unconditionally guaranteed by our domestic subsidiaries. Additionally, our U.K. and Canadian subsidiaries unconditionally guarantee the obligations of each U.K. and Canadian borrowers. Our obligations are secured by a first priority, perfected security interest in all accounts receivable, inventory and certain assets belonging to us and our subsidiary borrowers.
Maturity
The Credit Facility will mature on September 23, 2005.
Mandatory and Optional Prepayments
We are required to make mandatory prepayments with respect to certain proceeds of equity offerings and asset sales to repay amounts outstanding under the Credit Facility and correspondingly reduce commitments thereunder.
84
We can make voluntary reductions of commitments under the Credit Facility, in whole or in part without penalty, at any time, subject to minimum prepayment amounts and payment of certain other costs.
Covenants
Under the terms of the Credit Facility, we are subject to customary affirmative, negative and financial covenants, including restrictions on capital expenditures, additional indebtedness, liens, guarantees, mergers and acquisitions, dividends and distributions.
Our Credit Facility contains restrictions on dividends, limitations on borrowings from our affiliates ($30,000), capital expenditures ($68,000 in 2004) and on the payment of management fees ($5,000 per year).
It also includes a minimum trailing twelve-month fixed charge coverage ratio of 1.5 to 1.0 if aggregate availability is less than $25,000, 1.25 to 1.0 if aggregate availability is between $25,000 and $50,000 and 1.1 to 1.0 if aggregate availability is between $50,000 and $75,000. However, these requirements do not apply when aggregate availability exceeds $75,000. Availability at December 31, 2003 was $98.0 million, and as a result, there was no fixed charge coverage ratio requirement.
Events of Default
The agreement governing the Credit Facility contains customary events of default including, without limitation, nonpayment, misrepresentation, breach of conduct, insolvency, bankruptcy, certain judgments, change of control (as defined in the agreement governing the Credit Facility) and cross defaults.
International Credit Facilities
We also have international credit facilities that provide liquidity to our local businesses in local currencies, including Australia and Brazil. As of December 31, 2003, our international facilities provided for a maximum borrowing of approximately $45.0 million, based on exchange rates as of such date. See "Management's Discussion and Analysis of Financial Condition and Results of Operations—Liquidity and Capital Resources."
Senior Unsecured Notes
General
We have sold, on four occasions, senior unsecured notes, which we refer to collectively as the Notes, each with separate maturity dates and interest rates. The following table sets forth certain information about the Notes:
| Rate | Maturity Date | Original Face Value | Outstanding | Sinking Fund Requirements | ||||||
|---|---|---|---|---|---|---|---|---|---|---|
7.875 | % | February 15, 2023 | $ | 250,000,000 | $ | 246,782,000 | None | |||
8.375 | % | April 15, 2016 | 200,000,000 | 78,000,000 | 2007 to 2015 $20 million per year(1) | |||||
9.2 | % | March 15, 2021 | 200,000,000 | 114,800,000 | None | |||||
9.25 | % | June 15, 2019 | 150,000,000 | 47,295,000 | 2000 to 2018 $7.5 million per year(1) | |||||
- (1)
- Previous buybacks of our Notes will allow us to fulfill our sinking fund requirements through 2013 for our 8.375% Notes and our 9.25% Notes.
85
Rankings
The Notes rank equally in right of payment with all of our existing and future senior indebtedness and rank senior in right of payment to all of our existing and future subordinated indebtedness. These notes are not secured and, as such, have no underlying assets to secure the payment of principal or interest.
Optional Redemption
The 8.375% Notes may not be redeemed prior to April 15, 2006. Thereafter the 8.375% Notes may be redeemed at par, plus accrued and unpaid interest. The 9.25% notes may be redeemed in whole, upon not less than 30 nor more than 60 days' notice, at the redemption prices (expressed in percentages of principal amount) set forth below plus accrued and unpaid interest to the redemption date if redeemed during the twelve month period beginning on June 15 of the years indicated below:
| 2004 | 101.87 | % | |
| 2005 | 101.50 | % | |
| 2006 | 101.12 | % | |
| 2007 | 100.75 | % | |
| 2008 | 100.37 | % | |
| 2009 | 100.00 | % |
The 9.2% Notes and the 7.875% Notes are not redeemable prior to their respective maturity dates.
Mandatory Redemption
Except as described above in "—General", we are not required to make mandatory redemption or sinking fund payments with respect to the Notes.
Change of Control
In the event of a Change in Control (as defined below), a holder has the right to require us to buy such holder's 8.375% Notes at 100% of their principal amount, plus accrued and unpaid interest.
"Change in Control" means any person becomes the beneficial owner of the total voting power of all classes of our stock entitled to vote in elections of directors; provided, however, that a Change in Control shall not be deemed to have occurred if such event is approved by a majority of the continuing directors (as defined in the prospectus related to the 8.375% Notes).
Designated Event
With respect to the 9.25% Notes, in the event of both (a) a Designated Event (as defined below) and (b) a Rating Decline (as defined below), each holder has the right to require us to purchase such holder's 9.25% Notes at 100% of the principal amount thereof, plus accrued interest to the Repurchase Date (as defined in the 9.25% Notes).
"Designated Event" means (i) a person becomes the beneficial owner of more than 30% of our voting stock, (ii) during any period of two consecutive years, continuing directors (as defined in the 9.25% Notes) cease to constitute a majority, (iii) consolidation, merger or transfer or lease of all or substantially all our assets and our voting stock is changed into or exchanged for cash securities or other property, except for transaction with subsidiaries or involving exchange of our voting stock as consideration in the acquisition of another business without change of our outstanding voting stock into or for cash, securities or other property, (iv) we acquire 30% or more of our voting stock within any 12-month period, or (v) any distribution and the sum of the fair market value of such distribution, plus the fair market value of all other such distributions occurring during the preceding 12-month period, is at least 30% of the fair market value of our voting stock.
86
"Rating Decline" shall be deemed to have occurred if on any date within the 90-day period following public notice of the occurrence of a Designated Event, in the event the 9.25% Notes are (i) Investment Grade (as defined with respect to the 9.25% Notes), the rating falls below Investment Grade, or (ii) below Investment Grade, falls below the rating of the 9.25% Notes themselves at such date.
The 9.2% Notes and the 7.875% Notes do not contain provisions relating to a Change in Control or a Designated Event.
Covenants
Under the terms of the indentures governing the Notes, we are subject to certain customary covenants that, among other things, restrict our ability to create liens on our assets, incur debt at our subsidiaries or enter into sale leaseback transactions. These limitations are subject to a number of important qualifications and exceptions, as set forth in the prospectus used to sell the Notes and indentures.
Events of Default
The Notes specify certain events of default including failure to pay principal and interest on the Notes, a failure to comply with covenants, subject to a 90 day grace period in certain instances, and certain bankruptcy, insolvency or reorganization events with respect to us.
Industrial Revenue Bonds
General
The Industrial Revenue Bonds, or IRBs, consist of a $34 million Parish of Louisiana Pollution Control Revenue Refunding Bond Issue issued in connection with the funding of certain environmental compliance equipment at one of our former facilities. The IRBs are due on December 1, 2009 and are tax exempt for as long as the equipment can be used for its original environmental compliance purpose.
Guaranty
Our obligations under the IRBs are unconditionally guaranteed by us and our U.K. and Canadian subsidiaries. The guarantee of the U.K. subsidiaries is limited to $30.0 million.
Rankings
The IRBs rank equally in right of payment with all of our existing and future senior indebtedness and rank senior in right of payment to all of our existing and future subordinated indebtedness. The IRBs have no underlying assets to secure the payment of principal or interest related thereto.
Interest Rates
The IRBs bear interest at an annual rate of 10% and are intended to be tax exempt to the holder.
Optional Redemption
None.
Mandatory Redemption
The IRBs are subject to mandatory redemption at face amount plus accrued interest through the date of redemption, 180 days after a determination by a court as to a loss in tax exemption of the IRBs.
Change of Control
The change of control provisions with respect to the IRBs are the same as the Notes, except certain provisions also apply to the guarantors of the IRBs.
Covenants
The IRBs are subject to the same covenants described above with respect to the Notes. In addition, there are certain restrictions on the guarantors of the IRBs on incurring additional debt.
Events of Default
The IRBs specify certain events of default including failure to pay principal and interest on the IRBs, a failure to comply with covenants, subject to a 30-day grace period in certain instances, certain bankruptcy events, loss of tax exempt status and certain cross defaults.
87
CERTAIN U.S. FEDERAL TAX CONSEQUENCES FOR NON-U.S. HOLDERS
The following summary describes the material United States federal income and estate tax consequences of the ownership of common stock by a Non-U.S. Holder (as defined below) as of the date hereof. This discussion does not address all aspects of United States federal income and estate taxes and does not deal with foreign, state and local consequences that may be relevant to such Non-U.S. Holders in light of their personal circumstances. Special rules may apply to certain Non-U.S. Holders, such as United States expatriates, "controlled foreign corporations," "passive foreign investment companies," "foreign personal holding companies," corporations that accumulate earnings to avoid United States federal income tax, and investors in pass-through entities that are subject to special treatment under the Internal Revenue Code of 1986, as amended, or the Code. Such Non-U.S. Holders are urged to consult their own tax advisors to determine the United States federal, state, local and other tax consequences that may be relevant to them. Furthermore, the discussion below is based upon the provisions of the Code, and regulations, rulings and judicial decisions thereunder as of the date hereof, and such authorities may be repealed, revoked or modified, perhaps retroactively, so as to result in United States federal income tax consequences different from those discussed below. Persons considering the purchase, ownership or disposition of common stock are urged to consult their own tax advisors concerning the United States federal income tax consequences in light of their particular situations as well as any consequences arising under the laws of any other taxing jurisdiction.
If a partnership holds the common stock, the tax treatment of a partner will generally depend upon the status of the partner and the activities of the partnership. Persons who are partners of partnerships holding the common stock are urged to consult their tax advisors.
As used herein, a "U.S. Holder" of common stock means a holder that is for United States federal income tax purposes (i) a citizen or resident of the United States, (ii) a corporation or partnership created or organized in or under the laws of the United States or any political subdivision thereof, (iii) an estate the income of which is subject to United States federal income taxation regardless of its source or (iv) a trust if it (X) is subject to the primary supervision of a court within the United States and one or more United States persons have the authority to control all substantial decisions of the trust or (Y) has a valid election in effect under applicable United States Treasury regulations to be treated as a United States person. A "Non-U.S. Holder" is a holder that is not a U.S. Holder.
Dividends
Dividends paid to a Non-U.S. Holder of common stock generally will be subject to withholding of United States federal income tax at a 30% rate or such lower rate as may be specified by an applicable income tax treaty. However, dividends that are effectively connected with the conduct of a trade or business by the Non-U.S. Holder within the United States and, where a tax treaty applies, are attributable to a United States permanent establishment of the Non-U.S. Holder, are not subject to the withholding tax, but instead are subject to United States federal income tax on a net income basis at applicable graduated individual or corporate rates. Certain certification and disclosure requirements must be satisfied for effectively connected income to be exempt from withholding. Any such effectively connected dividends received by a foreign corporation may be subject to an additional "branch profits tax" at a 30% rate or such lower rate as may be specified by an applicable income tax treaty.
A Non-U.S. Holder of common stock who wishes to claim the benefit of an applicable treaty rate (and avoid backup withholding as discussed below) for dividends, will be required to (a) complete Internal Revenue Service, or IRS, Form W-8BEN (or other applicable form) and certify under penalties of perjury, that such holder is not a United States person or (b) if the common stock is held through certain foreign intermediaries, satisfy the relevant certification requirements of applicable United States Treasury regulations. Special certification and other requirements apply to certain Non-U.S. Holders that are entities rather than individuals.
88
A Non-U.S. Holder of common stock eligible for a reduced rate of United States withholding tax pursuant to an income tax treaty may obtain a refund of any excess amounts withheld by filing an appropriate claim for refund with the IRS.
Gain on Disposition of Common Stock
A Non-U.S. Holder generally will not be subject to United States federal income tax with respect to gain recognized on a sale or other disposition of common stock unless (i) the gain is effectively connected with a trade or business of the Non-U.S. Holder in the United States, and, where a tax treaty applies, is attributable to a United States permanent establishment of the Non-U.S. Holder (ii) in the case of a Non-U.S. Holder who is an individual and holds the common stock as a capital asset, such holder is present in the United States for 183 or more days in the taxable year of the sale or other disposition and certain other conditions are met, or (iii) the company is or has been a "United States real property holding corporation" for United States federal income tax purposes. The Company believes it is not, has not been and does not anticipate becoming a "United States real property holding corporation" for United States federal income tax purposes.
An individual Non-U.S. Holder described in clause (i) above will be subject to tax on the net gain derived from the sale under regular graduated United States federal income tax rates. An individual Non-U.S. Holder described in clause (ii) above will be subject to a flat 30% tax on the gain derived from the sale, which may be offset by United States source capital losses (even though the individual is not considered a resident of the United States). If a Non-U.S. Holder that is a foreign corporation falls under clause (i) above, it will be subject to tax on its gain under regular graduated United States federal income tax rates and, in addition, may be subject to the branch profits tax equal to 30% of its effectively connected earnings and profits or at such lower rate as may be specified by an applicable income tax treaty.
Federal Estate Tax
Common stock held by an individual Non-U.S. Holder at the time of death will be included in such holder's gross estate for United States federal estate tax purposes, unless an applicable estate tax treaty provides otherwise.
Information Reporting and Backup Withholding
The Company must report annually to the IRS and to each Non-U.S. Holder the amount of dividends paid to such holder and the tax withheld with respect to such dividends, regardless of whether withholding was required. Copies of the information returns reporting such dividends and withholding may also be made available to the tax authorities in the country in which the Non-U.S. Holder resides under the provisions of an applicable income tax treaty.
A Non-U.S. Holder will be subject to backup withholding unless applicable certification requirements are met.
Information reporting and, depending on the circumstances, backup withholding, will apply to the proceeds of a sale of common stock within the United States or conducted through United States related financial intermediaries unless the beneficial owner certifies under penalties of perjury that it is a Non-U.S. Holder (and the payor does not have actual knowledge or reason to know that the beneficial owner is a United States person) or the holder otherwise establishes an exemption.
Any amounts withheld under the backup withholding rules may be allowed as a refund or a credit against such holder's United States federal income tax liability provided the required information is furnished to the IRS.
89
Under the terms and subject to the conditions contained in an underwriting agreement dated , 2004, the Selling Shareholder has agreed to sell to the underwriters named below, for whom Credit Suisse First Boston LLC and Morgan Stanley & Co. Incorporated are acting as representatives and joint bookrunners, the following respective numbers of shares of common stock:
| Underwriter | Number of Shares | ||
|---|---|---|---|
| Credit Suisse First Boston LLC | |||
| Morgan Stanley & Co. Incorporated | |||
| Lehman Brothers Inc. | |||
| UBS Securities LLC | |||
| Total | |||
The underwriting agreement provides that the underwriters are obligated to purchase all the shares of common stock in the offering if any are purchased, other than those shares covered by the over-allotment option described below. The underwriting agreement also provides that if an underwriter defaults, the purchase commitments of non-defaulting underwriters may be increased or the offering may be terminated.
The Selling Shareholder has granted to the underwriters a 30-day option to purchase up to additional shares from it at the initial public offering price less the underwriting discounts and commissions. The option may be exercised only to cover any over-allotments of common stock.
The underwriters propose to offer the shares of common stock initially at the public offering price on the cover page of this prospectus and to selling group members at that price less a selling concession of $ per share. The underwriters and selling group members may allow a discount of $ per share on sales to other broker/dealers. After the initial public offering the underwriters may change the public offering price and concession and discount to broker/dealers.
The underwriting discounts and commissions and other expenses of this offering will be paid by the Company. The following table summarizes the compensation and estimated expenses the Selling Shareholder will pay:
| | Per Share | Total | ||||||||||
|---|---|---|---|---|---|---|---|---|---|---|---|---|
| | Without Over-allotment | With Over-allotment | Without Over-allotment | With Over-allotment | ||||||||
| Underwriting Discounts and Commissions paid by Selling Shareholder | $ | $ | $ | $ | ||||||||
| Expenses payable by us | $ | $ | $ | $ | ||||||||
The representatives have informed us that the underwriters do not expect discretionary sales to exceed 5% of the shares of common stock being offered.
Prior to this offering, we, the Selling Shareholder and Messrs. Morrison and Bevilaqua will have agreed that we each will not, other than with respect to the shares to be sold in this offering and subject to certain other exceptions, sell any existing shares of our common stock or exercise any registration rights without the prior written consent of Credit Suisse First Boston LLC and Morgan Stanley & Co. Incorporated until 180 days after the date of this prospectus. However, in the event that either (1) during the last 17 days of the "lock-up" period, we release earnings results or material news or a material event relating to us occurs or (2) prior to the expiration of the "lock-up" period, we announce that we will release earnings results during the 16-day period beginning on the last day of the
90
"lock-up" period, then in either case the expiration of the "lock-up" period will be extended until the expiration of the 18-day period beginning on the date of release of the earnings results or the occurrence of the material news or material event, as applicable, unless Credit Suisse First Boston LLC and Morgan Stanley & Co. Incorporated waive such an extension.
The underwriters have reserved for sale at the initial public offering price up to shares of the common stock for employees, directors and other persons associated with us who have expressed an interest in purchasing common stock in the offering. The number of shares available for sale to the general public in the offering will be reduced to the extent these persons purchase the reserved shares. Any reserved shares not so purchased will be offered by the underwriters to the general public on the same terms as the other shares.
We and the Selling Shareholder have agreed to indemnify the underwriters against liabilities under the Securities Act, or contribute to payments that the underwriters may be required to make in that respect.
We intend to apply to list the shares of common stock on The New York Stock Exchange under the symbol "BCI".
Prior to this offering, there has been no public market for our common stock. The initial public offering price will be determined by a negotiation between the Selling Shareholder and the underwriters and will not necessarily reflect the market price of the common stock following this offering. The principal factors that will be considered in determining the public offering price will include:
- •
- the information in this prospectus and otherwise available to the underwriters;
- •
- market conditions for initial public offerings;
- •
- the history and the prospects for the industry in which we will compete;
- •
- the ability of our management;
- •
- the prospects for our future earnings;
- •
- the present state of our development and our current financial condition;
- •
- the recent market prices of, and the demand for, publicly traded common stock of generally comparable companies; and
- •
- the general condition of the securities markets at the time of this offering.
We cannot assure you that the initial public offering price will correspond to the price at which the common stock will trade in the public market subsequent to this offering or that an active trading market for the common stock will develop and continue after this offering.
Some of the underwriters and their affiliates have provided, and may provide in the future, investment banking and other financial services for us, the Selling Shareholder and its affiliates in the ordinary course of business for which they have received and would receive customary compensation. In addition, Mr. Kidder, the Chairman of our Board of Directors, is a director of Morgan Stanley & Co. Incorporated, which is acting as an underwriter. Mr. Kidder received Board fees from us in 2003.
In connection with this offering, the underwriters may engage in stabilizing transactions, over-allotment transactions, syndicate covering transactions and penalty bids in accordance with Regulation M under the Exchange Act.
- •
- Stabilizing transactions permit bids to purchase the underlying security so long as the stabilizing bids do not exceed a specified maximum.
91
- •
- Over-allotment involves sales by the underwriters of shares in excess of the number of shares the underwriters are obligated to purchase, which creates a syndicate short position. The short position may be either a covered short position or a naked short position. In a covered short position, the number of shares over-allotted by the underwriters is not greater than the number of shares that they may purchase in the over-allotment option. In a naked short position, the number of shares involved is greater than the number of shares in the over-allotment option. The underwriters may close out any covered short position by either exercising their over-allotment option and/or purchasing shares in the open market.
- •
- Syndicate covering transactions involve purchases of the common stock in the open market after the distribution has been completed in order to cover syndicate short positions. In determining the source of shares to close out the short position, the underwriters will consider, among other things, the price of shares available for purchase in the open market as compared to the price at which they may purchase shares through the over-allotment option. If the underwriters sell more shares than could be covered by the over-allotment option, a naked short position, the position can only be closed out by buying shares in the open market. A naked short position is more likely to be created if the underwriters are concerned that there could be downward pressure on the price of the shares in the open market after pricing that could adversely affect investors who purchase in this offering.
- •
- Penalty bids permit the representatives to reclaim a selling concession from a syndicate member when the common stock originally sold by the syndicate member is purchased in a stabilizing or syndicate covering transaction to cover syndicate short positions.
These stabilizing transactions, syndicate covering transactions and penalty bids may have the effect of raising or maintaining the market price of our common stock or preventing or retarding a decline in the market price of the common stock. As a result the price of our common stock may be higher than the price that might otherwise exist in the open market. These transactions may be effected on The New York Stock Exchange or otherwise and, if commenced, may be discontinued at any time.
A prospectus in electronic format may be made available on the web sites maintained by one or more of the underwriters, or selling group members, if any, participating in this offering and one or more of the underwriters participating in this offering may distribute prospectuses electronically. The representatives may agree to allocate a number of shares to underwriters and selling group members for sale to their online brokerage account holders. Internet distributions will be allocated by the underwriters and selling group members that will make internet distributions on the same basis as other allocations.
92
Resale Restrictions
The distribution of the common stock in Canada is being made only on a private placement basis exempt from the requirement that we and the Selling Shareholder prepare and file a prospectus with the securities regulatory authorities in each province where trades of the common stock are made. Any resale of the common stock in Canada must be made under applicable securities laws which will vary depending on the relevant jurisdiction, and which may require resales to be made under available statutory exemptions or under a discretionary exemption granted by the applicable Canadian securities regulatory authority. Purchasers are advised to seek legal advice prior to any resale of the common stock.
Representations of Purchasers
By purchasing common stock in Canada and accepting a purchase confirmation a purchaser is representing to us, the Selling Shareholder and the dealer from whom the purchase confirmation is received that:
- •
- the purchaser is entitled under applicable provincial securities laws to purchase the common stock without the benefit of a prospectus qualified under those securities laws,
- •
- where required by law, that the purchaser is purchasing as principal and not as agent, and
- •
- the purchaser has reviewed the text above under "—Resale Restrictions".
Rights of Action—Ontario Purchasers Only
Under Ontario securities legislation, a purchaser who purchases a security offered by this prospectus during the period of distribution will have a statutory right of action for damages, or while still the owner of the shares, for rescission against us and the Selling Shareholder in the event that this prospectus contains a misrepresentation. A purchaser will be deemed to have relied on the misrepresentation. The right of action for damages is exercisable not later than the earlier of 180 days from the date the purchaser first had knowledge of the facts giving rise to the cause of action and three years from the date on which payment is made for the shares. The right of action for rescission is exercisable not later than 180 days from the date on which payment is made for the shares. If a purchaser elects to exercise the right of action for rescission, the purchaser will have no right of action for damages against us or the Selling Shareholder. In no case will the amount recoverable in any action exceed the price at which the shares were offered to the purchaser and if the purchaser is shown to have purchased the securities with knowledge of the misrepresentation, we and the Selling Shareholder, will have no liability. In the case of an action for damages, we and the Selling Shareholder, will not be liable for all or any portion of the damages that are proven to not represent the depreciation in value of the shares as a result of the misrepresentation relied upon. These rights are in addition to, and without derogation from, any other rights or remedies available at law to an Ontario purchaser. The foregoing is a summary of the rights available to an Ontario purchaser. Ontario purchasers should refer to the complete text of the relevant statutory provisions.
Enforcement of Legal Rights
All of our directors and officers as well as the experts named herein and the Selling Shareholder may be located outside of Canada and, as a result, it may not be possible for Canadian purchasers to effect service of process within Canada upon us or those persons. All or a substantial portion of our assets and the assets of those persons may be located outside of Canada and, as a result, it may not be possible to satisfy a judgment against us or those persons in Canada or to enforce a judgment obtained in Canadian courts against us or those persons outside of Canada.
Taxation and Eligibility for Investment
Canadian purchasers of common stock should consult their own legal and tax advisors with respect to the tax consequences of an investment in the common stock in their particular circumstances and about the eligibility of the common stock for investment by the purchaser under relevant Canadian legislation.
93
The validity of the issuance of the shares of common stock to be sold in the offering will be passed upon for us by our special New Jersey counsel, Connell Foley LLP. Certain legal matters in connection with the issuance of the common stock to be sold in this offering will be passed upon by our counsel, Simpson Thacher & Bartlett LLP, New York, New York. The underwriters have been represented by Cravath, Swaine & Moore LLP, New York, New York.
The consolidated financial statements as of December 31, 2003 and 2002, and for each of the three years in the period ended December 31, 2003, included in this prospectus and the related consolidated financial statement schedule included elsewhere in the registration statement have been audited by Deloitte & Touche LLP, independent auditors, as stated in their reports appearing herein and elsewhere in the registration statement (which report on the consolidated financial statements expresses an unqualified opinion and includes an explanatory paragraph referring to the our adoption in 2002 of Statement of Financial Accounting Standard No. 142), and have been so included in reliance upon the reports of such firm given upon their authority as experts in accounting and auditing.
WHERE YOU CAN FIND MORE INFORMATION
We have filed a registration statement on Form S-1 with the SEC with respect to this offering. This prospectus, which is part of the registration statement, does not include all of the information contained in the registration statement. You should refer to the registration statement and its exhibits and schedules for additional information. Whenever we make reference in this prospectus to any of our contracts, agreements or other documents, the references are not necessarily complete and you should refer to the exhibits and schedules attached to the registration statement for copies of the actual contract, agreement or other document.
You may read and copy the registration statement, the related exhibits and schedules without charge at the SEC's Public Reference Room at 450 Fifth Street, N.W., Washington, D.C. 20549. You may call the SEC at 1-800-SEC-0330 for further information on the operation of the Public Reference Room. You may obtain copies of the documents at prescribed rates by writing to the Public Reference Section of the SEC at 450 Fifth Street, N.W., Washington, D.C. 20549. The SEC also maintains an Internet site, http://www.sec.gov, which contains reports, proxy and information statements and other information regarding issuers that file electronically with the SEC. The other information we file with the SEC is not part of the registration statement of which this prospectus forms a part.
94
| Engineered wood products | Includes a range of derivative wood products which are manufactured by binding together wood strands, fibers, or veneers with adhesives to form composite materials. These products are engineered to precise design specifications which are tested to meet national or international standards. Engineered wood products include plywood, MDF, OSB, particleboard, laminated veneer lumber, and structural I-beams. | |
Feedstocks | Raw material required for any industrial process. | |
Foundry resins | Heat activated resins used as binders for sand in foundry operations. | |
MDF | Medium density fiberboard is an engineered wood product formed by breaking down softwood into wood fibers, combining it with wax and resin and forming panels by applying high temperatures and pressure. | |
OSB | Oriented strand board is an engineered wood product formed by layering strands or flakes of wood in specific orientations, combining it with wax and resin and placing it in a thermal press. | |
PF resins | Phenol formaldehyde resins are waterproof resins that tend to be more flexible and expensive than UF resins. Primarily used in OSB, plywood and other wood-based products intended for exterior use. | |
Proppant | Particles used in the oilfield hydraulic fracturing process to improve the efficiency of the flow of the well by maintaining the fracture. | |
Resins | A polymer used as an adhesive in reinforcement materials. | |
Thermoset resins | A resin that polymerizes to a permanently solid and infusible state upon the application of heat. | |
UF resins | Urea formaldehyde resins are rigid resins that provide products with superior hardness and are less expensive than PF resins. Primarily used in MDF, particleboard and other wood-based products intended for indoor use. | |
VCM | Vinyl chloride monomer is a liquid substance primarily used to make PVC. |
G-1
INDEX TO CONSOLIDATED FINANCIAL STATEMENTS
Report of Independent Auditors | F-2 | |
Consolidated Statements of Operations: For the years ended December 31, 2003, 2002 and 2001 | F-3 | |
Consolidated Balance Sheets: As of December 31, 2003 and 2002 | F-4 | |
Consolidated Statements of Cash Flows: For the years ended December 31, 2003, 2002 and 2001 | F-6 | |
Consolidated Statements of Shareholders' Deficit: For the years ended December 31, 2003, 2002 and 2001 | F-7 | |
Notes to Consolidated Financial Statements | F-9 |
F-1
To the Board of Directors
and Shareholders of Borden Chemical, Inc.
We have audited the accompanying consolidated balance sheets of Borden Chemical, Inc. (a subsidiary of Borden Holdings, Inc.) and subsidiaries as of December 31, 2003 and 2002, and the related consolidated statements of operations, shareholders' deficit and cash flows for each of the three years in the period ended December 31, 2003. These financial statements are the responsibility of the Company's management. Our responsibility is to express an opinion on these financial statements based on our audits.
We conducted our audits in accordance with auditing standards generally accepted in the United States of America. Those standards require that we plan and perform the audit to obtain reasonable assurance about whether the financial statements are free of material misstatement. An audit includes examining, on a test basis, evidence supporting the amounts and disclosures in the financial statements. An audit also includes assessing the accounting principles used and significant estimates made by management, as well as evaluating the overall financial statement presentation. We believe that our audits provide a reasonable basis for our opinion.
In our opinion, such consolidated financial statements present fairly, in all material respects, the financial position of Borden Chemical, Inc. and subsidiaries at December 31, 2003 and 2002, and the results of their operations and their cash flows for each of the three years in the period ended December 31, 2003 in conformity with accounting principles generally accepted in the United States of America.
As discussed in Note 4 to the consolidated financial statements, the Company changed its method of accounting for goodwill and other intangible assets in 2002 to conform to Statement of Financial Accounting Standard No. 142.
DELOITTE & TOUCHE LLP
Columbus, Ohio
March 19, 2004
F-2
CONSOLIDATED STATEMENTS OF OPERATIONS
BORDEN CHEMICAL, INC.
| | Year Ended December 31, | |||||||||
|---|---|---|---|---|---|---|---|---|---|---|
| | 2003 | 2002 | 2001 | |||||||
| | (In thousands, except per share data) | |||||||||
| Net sales | $ | 1,434,813 | $ | 1,247,885 | $ | 1,372,141 | ||||
| Cost of goods sold | 1,148,519 | 968,657 | 1,060,642 | |||||||
| Gross margin | 286,294 | 279,228 | 311,499 | |||||||
| Distribution expense | 66,383 | 61,927 | 63,929 | |||||||
| Marketing expense | 42,398 | 42,503 | 42,046 | |||||||
| General & administrative expense | 100,021 | 109,237 | 127,967 | |||||||
| (Gain) loss on sale of assets | (746 | ) | 282 | (3,772 | ) | |||||
| Loss on divestiture of business | — | — | 2,303 | |||||||
| Business realignment expense and impairments | 4,748 | 19,699 | 126,408 | |||||||
| Other operating expense | 6,948 | 11,872 | 28,113 | |||||||
| Operating income (loss) | 66,542 | 33,708 | (75,495 | ) | ||||||
| Interest expense | 46,138 | 47,315 | 51,613 | |||||||
| Affiliated interest expense, net | 558 | 1,402 | 11,488 | |||||||
| Other non-operating expense (income) | 1,529 | (5,989 | ) | 1,841 | ||||||
| Investment write-downs | — | — | 27,000 | |||||||
| Income (loss) from continuing operations before income tax | 18,317 | (9,020 | ) | (167,437 | ) | |||||
| Income tax benefit | (4,659 | ) | (2,262 | ) | (30,833 | ) | ||||
| Income (loss) from continuing operations | 22,976 | (6,758 | ) | (136,604 | ) | |||||
| Income from discontinued operations, net of tax | — | — | 11,804 | |||||||
| Income (loss) before cumulative effect of change in accounting principle | 22,976 | (6,758 | ) | (124,800 | ) | |||||
| Cumulative effect of change in accounting principle | — | (29,825 | ) | — | ||||||
| Net income (loss) | 22,976 | (36,583 | ) | (124,800 | ) | |||||
| Preferred stock dividends | — | — | (61,846 | ) | ||||||
| Net income (loss) applicable to common stock | $ | 22,976 | $ | (36,583 | ) | $ | (186,646 | ) | ||
| Comprehensive income | $ | 60,420 | $ | (67,784 | ) | $ | (198,959 | ) | ||
| Basic and Diluted Per Share Data | ||||||||||
| Income (loss) from continuing operations | $ | 0.11 | $ | (0.03 | ) | $ | (0.69 | ) | ||
| Income from discontinued operations, net of tax | — | — | 0.06 | |||||||
| Income (loss) before cumulative effect of change in accounting principle | 0.11 | (0.03 | ) | (0.63 | ) | |||||
| Cumulative effect of change in accounting principle | — | (0.15 | ) | — | ||||||
| Net income (loss) | 0.11 | (0.18 | ) | (0.63 | ) | |||||
| Preferred stock dividends | — | — | (0.31 | ) | ||||||
| Net income (loss) applicable to common stock—basic | $ | 0.11 | $ | (0.18 | ) | $ | (0.94 | ) | ||
| Net income (loss) applicable to common stock—dilutive | $ | 0.11 | $ | (0.18 | ) | $ | (0.94 | ) | ||
| Average number of common shares outstanding during the period—basic | 200,898 | 200,458 | 198,997 | |||||||
| Average number of common shares outstanding during the period—dilutive | 200,924 | 200,458 | 198,997 | |||||||
See Notes to Consolidated Financial Statements
F-3
CONSOLIDATED BALANCE SHEETS
BORDEN CHEMICAL, INC.
| | December 31, 2003 | December 31, 2002 | |||||||
|---|---|---|---|---|---|---|---|---|---|
| | (In thousands) | ||||||||
| ASSETS | |||||||||
| Current Assets | |||||||||
| Cash and equivalents | $ | 28,162 | $ | 14,740 | |||||
| Restricted cash | — | 67,049 | |||||||
| Accounts receivable (less allowance for doubtful accounts of $14,459 in 2003 and $12,219 in 2002) | 196,093 | 170,822 | |||||||
| Accounts receivable from affiliates | 354 | 5,840 | |||||||
| Inventories: | |||||||||
| Finished and in-process goods | 42,292 | 45,178 | |||||||
| Raw materials and supplies | 38,819 | 41,079 | |||||||
| Deferred income taxes | 27,085 | 28,869 | |||||||
| Other current assets | 13,551 | 13,232 | |||||||
| 346,356 | 386,809 | ||||||||
| Investments and Other Assets | |||||||||
| Deferred income taxes | 113,434 | 118,368 | |||||||
| Other assets | 21,725 | 19,615 | |||||||
| 135,159 | 137,983 | ||||||||
| Property and Equipment | |||||||||
| Land | 32,585 | 31,964 | |||||||
| Buildings | 103,774 | 98,313 | |||||||
| Machinery and equipment | 691,249 | 649,782 | |||||||
| 827,608 | 780,059 | ||||||||
| Less accumulated depreciation | (378,724 | ) | (340,321 | ) | |||||
| 448,884 | 439,738 | ||||||||
Goodwill | 57,516 | 39,640 | |||||||
| Other Intangible Assets | 5,951 | 7,610 | |||||||
| Total Assets | $ | 993,866 | $ | 1,011,780 | |||||
F-4
| | December 31, 2003 | December 31, 2002 | ||||||
|---|---|---|---|---|---|---|---|---|
| | (In thousands except share data) | |||||||
| LIABILITIES AND SHAREHOLDERS' DEFICIT | ||||||||
| Current Liabilities | ||||||||
| Accounts and drafts payable | $ | 127,174 | $ | 113,549 | ||||
| Accounts payable to affiliates | 16 | 2,580 | ||||||
| Debt payable within one year | 8,167 | 2,779 | ||||||
| Loans payable to affiliates | 18,260 | 84,680 | ||||||
| Other current liabilities | 103,231 | 97,932 | ||||||
| 256,848 | 301,520 | |||||||
| Other Liabilities | ||||||||
| Long-term debt | 529,966 | 523,287 | ||||||
| Non-pension postemployment benefit obligations | 128,723 | 145,384 | ||||||
| Other long-term liabilities | 174,522 | 202,482 | ||||||
| 833,211 | 871,153 | |||||||
| Commitments and Contingencies (See Note 22) | ||||||||
Shareholders' Deficit | ||||||||
| Common stock—$0.01 par value: authorized 300,000,000 shares, Issued 201,754,598, treasury 858,970, outstanding 200,895,628 in 2003 and Issued 201,782,598, treasury 858,970, outstanding 200,923,628 shares in 2002. | 2,009 | 2,009 | ||||||
| Paid-in capital | 1,224,011 | 1,172,344 | ||||||
| Receivable from parent | (512,094 | ) | (463,516 | ) | ||||
| Deferred compensation | (1,488 | ) | (2,679 | ) | ||||
| Accumulated other comprehensive income | (128,193 | ) | (165,637 | ) | ||||
| Accumulated deficit | (680,438 | ) | (703,414 | ) | ||||
| (96,193 | ) | (160,893 | ) | |||||
| Total Liabilities and Shareholders' Deficit | $ | 993,866 | $ | 1,011,780 | ||||
See Notes to Consolidated Financial Statements
F-5
CONSOLIDATED STATEMENTS OF CASH FLOWS
BORDEN CHEMICAL, INC.
| | Year ended December 31, | |||||||||||
|---|---|---|---|---|---|---|---|---|---|---|---|---|
| | 2003 | 2002 | 2001 | |||||||||
| | (In thousands) | |||||||||||
| Cash Flows from (used in) Operating Activities | ||||||||||||
| Net income (loss) | $ | 22,976 | $ | (36,583 | ) | $ | (124,800 | ) | ||||
| Adjustments to reconcile net income (loss) to net cash from (used in) operating activities: | ||||||||||||
| Loss on divestiture of businesses | — | — | 2,303 | |||||||||
| (Gain) loss on the sale of assets | (746 | ) | 282 | (3,772 | ) | |||||||
| Deferred tax provision (benefit) | 6,223 | 16,023 | (25,883 | ) | ||||||||
| Depreciation and amortization | 47,319 | 47,947 | 59,361 | |||||||||
| Deferred compensation expense | 1,191 | 892 | — | |||||||||
| Business realignment expense and impairments | 4,748 | 19,699 | 126,408 | |||||||||
| Cumulative effect of change in accounting principle | — | 29,825 | — | |||||||||
| Investment write-downs and other charges | — | — | 27,000 | |||||||||
| Other non-cash adjustments | 1,070 | (822 | ) | 3,063 | ||||||||
| Net change in assets and liabilities: | ||||||||||||
| Accounts receivable | (3,217 | ) | (12,596 | ) | 31,698 | |||||||
| Inventories | 10,731 | 2,552 | 14,679 | |||||||||
| Accounts and drafts payable | 2,492 | (8,303 | ) | (20,230 | ) | |||||||
| Income taxes | (30,291 | ) | (21,780 | ) | 44,130 | |||||||
| Other assets | 3,581 | (2,571 | ) | (72,388 | ) | |||||||
| Other liabilities | (32,051 | ) | (24,205 | ) | 33,551 | |||||||
| 34,026 | 10,360 | 95,120 | ||||||||||
| Cash Flows (used in) from Investing Activities | ||||||||||||
| Capital expenditures | (41,820 | ) | (38,773 | ) | (47,408 | ) | ||||||
| (Purchase) proceeds from sale of businesses | (14,691 | ) | — | 96,977 | ||||||||
| Proceeds from the sale of assets | 14,197 | 10,237 | 160,888 | |||||||||
| Proceeds from sale of note receivable to an affiliate | — | 110,000 | — | |||||||||
| Other, net | — | — | 524 | |||||||||
| (42,314 | ) | 81,464 | 210,981 | |||||||||
| Cash Flows from (used in) Financing Activities | ||||||||||||
| Net short-term debt borrowings (repayments) | 5,388 | 1,255 | (41,763 | ) | ||||||||
| Borrowings of long-term debt | 7,925 | — | 57,400 | |||||||||
| Repayments of long-term debt | (1,246 | ) | (10,764 | ) | (54,000 | ) | ||||||
| Affiliated (repayments) borrowings | (66,420 | ) | 6,130 | (212,432 | ) | |||||||
| Payment of note payable to unconsolidated subsidiary | — | (31,581 | ) | — | ||||||||
| Decrease (increase) in restricted cash | 67,049 | (66,165 | ) | (884 | ) | |||||||
| Interest received from parent | — | — | 48,578 | |||||||||
| Common stock dividends paid | — | — | (48,578 | ) | ||||||||
| Preferred stock dividends paid | — | — | (73,724 | ) | ||||||||
| Repurchases, net of sale, of common stock from / to management | (286 | ) | (591 | ) | — | |||||||
| Capital contribution from affiliates | 9,300 | — | 17,000 | |||||||||
| 21,710 | (101,716 | ) | (308,403 | ) | ||||||||
| Increase (decrease) in cash and equivalents | $ | 13,422 | $ | (9,892 | ) | $ | (2,302 | ) | ||||
| Cash and equivalents at beginning of year | 14,740 | 24,632 | 26,934 | |||||||||
| Cash and equivalents at end of year | $ | 28,162 | $ | 14,740 | $ | 24,632 | ||||||
| Supplemental Disclosures of Cash Flow Information | ||||||||||||
| Cash paid (received): | ||||||||||||
| Interest, net | $ | 45,466 | $ | 46,928 | $ | 70,258 | ||||||
| Income taxes, net | 19,368 | 978 | (36,186 | ) | ||||||||
| Non-cash activity: | ||||||||||||
| Capital contribution by parent | 17,002 | 24,440 | 21,038 | |||||||||
| Contribution of preferred stock and accrued dividend by parent | — | — | 620,922 | |||||||||
| Reclassification of minimum pension liability adjustment from (to) shareholders' equity | 5,830 | (17,075 | ) | (66,580 | ) | |||||||
See Notes to Consolidated Financial Statements
F-6
CONSOLIDATED STATEMENTS OF SHAREHOLDERS' DEFICIT
BORDEN CHEMICAL, INC.
(In thousands)
| | Preferred Stock | Common Stock | Paid-in Capital | Receivable from Parent | Deferred Compensation | Accumulated Other Comprehensive Income | Accumulated Deficit | Total | |||||||||||||||||
|---|---|---|---|---|---|---|---|---|---|---|---|---|---|---|---|---|---|---|---|---|---|---|---|---|---|
| Balance, December 31, 2000 | $ | 614,369 | $ | 1,990 | $ | 353,309 | $ | (414,937 | ) | $ | — | $ | (60,277 | ) | $ | (480,185 | ) | $ | 14,269 | ||||||
| Net income | (124,800 | ) | (124,800 | ) | |||||||||||||||||||||
| Translation adjustments and other | (6,849 | ) | (6,849 | ) | |||||||||||||||||||||
| Cumulative effect of change in accounting principle (net of $1,900 tax) | (3,300 | ) | (3,300 | ) | |||||||||||||||||||||
| Derivative activity (net of $1,300 tax) | 2,570 | 2,570 | |||||||||||||||||||||||
| Minimum pension liability (net of $36,090 tax) | (66,580 | ) | (66,580 | ) | |||||||||||||||||||||
| Comprehensive income | (198,959 | ) | |||||||||||||||||||||||
| Preferred stock dividends | (61,846 | ) | (61,846 | ) | |||||||||||||||||||||
| Common stock dividends | (36,434 | ) | (36,434 | ) | |||||||||||||||||||||
| Interest accrued on notes from parent (net of $13,784 tax) | 24,674 | 10,120 | 34,794 | ||||||||||||||||||||||
| Gain on Consumer Adhesives Sale to affiliate (net of $37,428 tax) | 94,847 | 94,847 | |||||||||||||||||||||||
| Gain on sale of common stock equity investment to affiliate (net of $5,600 tax) | 10,197 | 10,197 | |||||||||||||||||||||||
| Common stock and warrants issued to management | 1,236 | 1,236 | |||||||||||||||||||||||
| Capital contribution from parent of preferred stock and accrued dividend | (614,369 | ) | 620,922 | 6,553 | |||||||||||||||||||||
| Capital contribution from parent | 38,038 | 38,038 | |||||||||||||||||||||||
| Balance, December 31, 2001 | $ | — | $ | 1,990 | $ | 1,106,789 | $ | (404,817 | ) | $ | — | $ | (134,436 | ) | $ | (666,831 | ) | $ | (97,305 | ) | |||||
F-7
| | Common Stock | Paid-in Capital | Receivable from Parent | Deferred Compensation | Accumulated Other Comprehensive Income | Accumulated Deficit | Total | |||||||||||||||
|---|---|---|---|---|---|---|---|---|---|---|---|---|---|---|---|---|---|---|---|---|---|---|
| Balance, December 31, 2001 | $ | 1,990 | $ | 1,106,789 | $ | (404,817 | ) | $ | — | $ | (134,436 | ) | $ | (666,831 | ) | $ | (97,305 | ) | ||||
| Net income | (36,583 | ) | (36,583 | ) | ||||||||||||||||||
| Translation adjustments | (14,856 | ) | (14,856 | ) | ||||||||||||||||||
| Derivative activity (net of $401 tax) | 730 | 730 | ||||||||||||||||||||
| Minimum pension liability (net of $9,194 tax) | (17,075 | ) | (17,075 | ) | ||||||||||||||||||
| Comprehensive income | (67,784 | ) | ||||||||||||||||||||
| Repurchases of common stock from management | (1 | ) | (1,341 | ) | (1,342 | ) | ||||||||||||||||
| Restricted stock issued to management | 16 | 3,555 | (3,571 | ) | — | |||||||||||||||||
| Interest accrued on notes from parent (net of $20,545 tax) | 38,154 | (58,699 | ) | (20,545 | ) | |||||||||||||||||
| Compensation expense on restricted stock | 892 | 892 | ||||||||||||||||||||
| Common stock issued management | 4 | 747 | 751 | |||||||||||||||||||
| Capital contribution from parent | 24,440 | 24,440 | ||||||||||||||||||||
| Balance, December 31, 2002 | $ | 2,009 | $ | 1,172,344 | $ | (463,516 | ) | $ | (2,679 | ) | $ | (165,637 | ) | $ | (703,414 | ) | $ | (160,893 | ) | |||
| Net income | 22,976 | 22,976 | ||||||||||||||||||||
| Translation adjustments | 31,614 | 31,614 | ||||||||||||||||||||
| Minimum pension liability (net of $3,139 tax) | 5,830 | 5,830 | ||||||||||||||||||||
| Comprehensive income | 60,420 | |||||||||||||||||||||
| Repurchases of common stock from management | (286 | ) | (286 | ) | ||||||||||||||||||
| Income tax on sale to affiliate of Consumer Adhesives note receivable | (5,925 | ) | (5,925 | ) | ||||||||||||||||||
| Interest accrued on notes from parent (net of tax of $17,002) | 31,576 | (48,578 | ) | �� | (17,002 | ) | ||||||||||||||||
| Capital contribution from parent | 26,302 | 26,302 | ||||||||||||||||||||
| Compensation expense on restricted stock | 1,191 | 1,191 | ||||||||||||||||||||
| Balance, December 31, 2003 | $ | 2,009 | $ | 1,224,011 | $ | (512,094 | ) | $ | (1,488 | ) | $ | (128,193 | ) | $ | (680,438 | ) | $ | (96,193 | ) | |||
See Notes to Consolidated Financial Statements
F-8
Notes to Consolidated Financial Statements
(Dollars in thousands except per share data)
1. Background and Nature of Operations
Borden Chemical, Inc. (the "Company") was incorporated on April 24, 1899. The Company is engaged primarily in manufacturing, processing, purchasing and distributing forest products and industrial resins, formaldehyde, oilfield products and other specialty and industrial chemicals worldwide. In 2001, the Company sold its Consumer Adhesives business. The Company's executive and administrative offices are located in Columbus, Ohio. Production facilities are located throughout the U.S. and in many foreign countries.
Domestic products are sold by the Company's sales force throughout the U.S. to industrial users. To the extent practicable, international distribution techniques parallel those used in the U.S. and are concentrated in Canada, Western Europe, Latin America, Australia and Malaysia.
At December 31, 2003, 27 of a total 48 manufacturing and processing facilities are located in the U.S., and in 2003, approximately 63% of the Company's sales were generated in the U.S.
The Company has three reportable segments: North American Forest Products, North American Performance Resins Group and International. See Note 19.
The Company has been controlled by affiliates of Kohlberg Kravis Roberts & Co. ("KKR") since 1995. The Company's immediate parent is Borden Holdings, Inc. ("BHI"), a wholly owned subsidiary of BW Holdings, LLC ("BWHLLC"), an entity controlled by KKR.
In the fourth quarter of 2001, the Company (then known as Borden, Inc.) merged with its subsidiaries Borden Chemical, Inc. ("BCI") and Borden Chemical Holdings, Inc. ("BCHI"), executed certain financial transactions with its parent and changed its name to Borden Chemical, Inc. (the "Corporate Reorganization"). See Note 3.
In 2001, through a series of transactions with affiliates, the Company sold Consumer Adhesives (the "Consumer Adhesives Sale") for total proceeds of $94,120. As a result of the Consumer Adhesives Sale, this segment is reflected as a discontinued operation in the Consolidated Financial Statements in 2001. The Company retained continuing investments in Consumer Adhesives in the form of preferred stock and notes receivable. The notes receivable were sold to BHI in the fourth quarter of 2001 for their carrying value of $57,691. The preferred stock, with a carrying value of $110,000, was redeemed during the first quarter of 2002 for a $110,000 note receivable from Consumer Adhesives, which was subsequently sold to BHI in 2002 for face value plus accrued interest. In 2001, a pre-tax gain of $132,275 was recognized in Paid-in capital due to the affiliated nature of the transaction. In 2003, the Company recorded an adjustment of $5,925 in Paid-in capital to reflect additional tax expense associated with the sale of the $110,000 note receivable.
2. Summary of Significant Accounting Policies
Significant accounting policies followed by the Company, as summarized below, are in conformity with generally accepted accounting principles.
Principles of Consolidation—The Consolidated Financial Statements include the accounts of the Company and its subsidiaries, after elimination of intercompany accounts and transactions. The Company's share of the net earnings of 20% to 50% owned companies is included in income on an equity basis.
Use of Estimates—The preparation of financial statements in conformity with generally accepted accounting principles requires management to make estimates and assumptions that affect the reported
F-9
amounts of assets and liabilities and disclosure of contingent assets and liabilities at the date of the financial statements, as well as the reported amounts of revenues and expenses during the reporting period. The most significant estimates reflected in the financial statements include environmental remediation, legal liabilities, deferred tax assets and liabilities and related valuation allowances, income tax accruals, pension and postretirement assets and liabilities, valuation allowances for accounts receivable and inventories, general insurance liabilities, asset impairments and related party transactions. Actual results could differ from estimated amounts.
Cash and Cash Equivalents—The Company considers all highly liquid investments purchased with an original maturity of three months or less to be cash equivalents. Included in the Company's cash equivalents and restricted cash are interest bearing time deposits of $70,133 in 2002. At December 31, 2003, the Company had no material investments in cash equivalent instruments. The effect of exchange rate changes on cash is not material.
Inventories—Inventories are stated at lower of cost or market. Cost is determined using the first-in, first-out method.
Property and Equipment—Land, buildings, and machinery and equipment are carried at cost. Depreciation is recorded on the straight-line basis by charges to expense at rates based on estimated useful lives of properties (average rates for buildings 3%; machinery and equipment 7%). Major renewals and betterments are capitalized. Maintenance, repairs and minor renewals are expensed as incurred.
Goodwill and Intangibles—The excess of purchase price over net tangible and identifiable intangible assets of businesses acquired is carried as Goodwill on the Consolidated Balance Sheet. As of January 1, 2002, the Company no longer amortizes goodwill. Prior to January 1, 2002, goodwill was amortized on a straight-line basis over not more than 40 years.
Certain trademarks, patents and other intangible assets used in the operations of the business are carried as Other Intangible Assets on the Consolidated Balance Sheet. These intangible assets are amortized on a straight-line basis over the shorter of the legal or useful life of the asset. See Note 4.
Impairment—As events warrant but at least annually, the Company evaluates the recoverability of long-lived assets by assessing whether the carrying value can be recovered over their remaining useful lives through the expected future undiscounted operating cash flows of the underlying business. Any impairment loss required is determined by comparing the carrying value of the assets to operating cash flows on a discounted basis.
The Company performs an annual impairment test for goodwill and other intangibles. See Note 4.
General Insurance—The Company is generally self-insured for losses and liabilities relating to workers' compensation, health and welfare claims, physical damage to property, business interruption and comprehensive general, product and vehicle liability. The Company maintains insurance policies for certain items exceeding deductible limits. Losses are accrued for the estimated aggregate liability for claims using certain actuarial assumptions followed in the insurance industry and the Company's experience.
F-10
Legal Costs—The Company accrues for legal costs in the period in which a claim is made or an event becomes known, if the amounts are probable and reasonably estimable. Each claim is assigned a range of potential liability, with the most likely amount being accrued. The amount accrued includes all costs associated with a claim, including settlements, assessments, judgments, fines and legal fees.
Revenue Recognition—Revenue for product sales is recognized as risk and title to the product transfer to the customer, which usually occurs at the time shipment is made. Substantially all of the Company's products are sold FOB ("free on board") shipping point. The Company's standard terms of delivery are included in its contracts of sales and invoices.
Shipping and Handling—The Company records freight billed to customers in net sales. Shipping costs are incurred to move the Company's products from production and storage facilities to the customers. Handling costs are incurred from the point the product is removed from inventory until it is provided to the shipper and generally include costs to store, move and prepare the products for shipment. The Company incurred shipping costs of $66,383 in 2003, $61,927 in 2002 and $63,929 in 2001. These costs are classified as Distribution expense in the Consolidated Statements of Operations. Due to the nature of the Company's business, handling costs incurred prior to shipment are not significant.
Foreign Currency Translations—Assets and liabilities of foreign affiliates are translated at the exchange rates in effect at the balance sheet date, and income and expenses are translated at average exchange rates prevailing during the year. The effect of translation is accounted for as an adjustment to shareholders' equity and is included in other comprehensive income.
In addition, the Company incurred realized and unrealized net foreign transaction gains (losses) aggregating $438 in 2003, $1,307 in 2002 and $(912) in 2001.
Income Taxes—The Company files a consolidated U.S. Federal Income Tax return with BHI. Income tax expense is based on reported results of operations before income taxes. Deferred income taxes represent the tax effect of temporary differences between amounts of assets and liabilities recognized for financial reporting purposes and such amounts recognized for tax purposes. Deferred tax balances are adjusted to reflect tax rates, based on current tax laws, that will be in effect in the years in which temporary differences are expected to reverse. Deferred tax assets are reduced by a valuation allowance when, in the opinion of management, it is more likely than not that some portion or all of the deferred tax assets will not be realized.
Derivative Financial Instruments—The Company primarily uses three types of derivatives: interest rate swaps to effectively convert a portion of the Company's fixed rate obligations to variable, forward exchange contracts and options to reduce the Company's cash flow exposure to changes in foreign exchange rates and natural gas futures to reduce the Company's cash flow exposure to changes in natural gas prices. The Company does not hold or issue derivative financial instruments for trading purposes. The Company's $34,000 interest rate swap agreement is accounted for as a hedge. All other derivatives are not accounted for using hedge accounting but are measured at fair value and recorded on the balance sheet as an asset or liability, depending upon the Company's underlying rights or obligations. See Notes 16 and 17.
Stock-Based Compensation—The Company accounts for stock-based compensation under Accounting Principles Board Opinion No. 25, "Accounting for Stock Issued to Employees" ("APB
F-11
No. 25") and has adopted the disclosure-only provisions of Statement of Financial Accounting Standards ("SFAS") No. 123, "Accounting for Stock-Based Compensation" and SFAS No. 148, "Accounting for Stock-Based Compensation—Transition and Disclosure, an amendment of SFAS No. 123."
The following table sets forth the required annual reconciliation of reported and pro-forma net income and earnings per share ("EPS") under SFAS No. 148:
| | 2003 | 2002 | 2001 | ||||||||
|---|---|---|---|---|---|---|---|---|---|---|---|
| Net income (loss) applicable to common stock | $ | 22,976 | $ | (36,583 | ) | $ | (186,646 | ) | |||
| Add: Stock-based employee compensation expense included in reported net income, net of related tax benefit | 147 | 9 | — | ||||||||
| Deduct: Total stock-based employee compensation expense determined under fair value based method for all awards granted since January 1, 1996, net of related tax effects | (211 | ) | (94 | ) | (382 | ) | |||||
| Pro-forma net income | $ | 22,912 | $ | (36,668 | ) | $ | (187,028 | ) | |||
| Average shares (in thousands) outstanding—basic | 200,898 | 200,458 | 198,997 | ||||||||
| Average share (in thousands) outstanding—diluted | 200,924 | 200,458 | 198,997 | ||||||||
| Per share as reported (basic and diluted) | $ | 0.11 | $ | (0.18 | ) | $ | (0.94 | ) | |||
| Per share pro forma (basic and diluted) | $ | 0.11 | $ | (0.18 | ) | $ | (0.94 | ) | |||
Earnings Per Share—Basic and diluted net income attributable to common stock is computed by dividing net income by the weighted average number of common shares outstanding during the period including the effect of dilutive options, when applicable. At December 31, 2003, 5,532,360 options to purchase common shares of the Company were outstanding, of which 4,882,000 are considered dilutive. At December 31, 2002, 198,400 warrants and 3,426,040 options to purchase common shares of the Company were outstanding and not considered dilutive. At December 31, 2001, 1,039,864 warrants and 6,871,380 options to purchase common shares of the Company were outstanding and not considered dilutive. See Note 15.
The Company's diluted EPS is calculated as follows:
| | 2003 | 2002 | 2001 | |||||||
|---|---|---|---|---|---|---|---|---|---|---|
| Net income (loss) applicable to common stock | $ | 22,976 | $ | (36,583 | ) | $ | (186,646 | ) | ||
| Effect of dilutive options | — | — | — | |||||||
| Diluted EPS—Numerator | 22,976 | (36,583 | ) | (186,646 | ) | |||||
| Average share outstanding (in thousands)—basic | 200,898 | 200,458 | 198,997 | |||||||
| Effect of dilutive options (in thousands) | 26 | — | — | |||||||
| Diluted EPS—Denominator (in thousands) | 200,924 | 200,458 | 198,997 | |||||||
| Diluted EPS | $ | 0.11 | $ | (0.18 | ) | $ | (0.94 | ) | ||
Concentrations of Credit Risk—Financial instruments that potentially subject the Company to concentrations of credit risk consist principally of temporary cash investments and accounts receivable. The Company places its temporary cash investments with high quality institutions and, by policy, limits
F-12
the amount of credit exposure to any one institution. Concentrations of credit risk with respect to accounts receivable are limited, due to the large number of customers comprising the Company's customer base and their dispersion across many different industries and geographies. The Company generally does not require collateral or other security to support customer receivables.
Recently Issued Accounting Standards
In November 2002, the Financial Accounting Standards Board ("FASB") issued Interpretation No. 45, "Guarantor's Accounting and Disclosure Requirements for Guarantees, Including Indirect Guarantees of Indebtedness of Others" ("FIN 45"). FIN 45 requires a guarantor to recognize a liability, at the inception of the guarantee, for the fair value of obligations it has undertaken in issuing the guarantee and also include more detailed disclosures with respect to guarantees. FIN 45 is effective for guarantees issued or modified after December 31, 2002. The disclosure requirements of FIN 45 are effective for financial statements for interim or annual periods ending after December 15, 2002. The Company has adopted FIN 45 and included the additional requirements with respect to guarantees in Note 21 to the Consolidated Financial Statements.
In January 2003, the FASB issued Interpretation No. 46, "Consolidation of Variable Interest Entities" ("FIN 46") to expand upon and strengthen existing accounting guidance that addresses when a company should include in its financial statements, the assets, liabilities and activities of another entity. FIN 46 requires existing unconsolidated variable interest entities to be consolidated by their primary beneficiaries if the entities do not effectively disperse risks among parties involved. In December 2003, the FASB issued a revision of FIN 46 deferring the effective date for implementation. The Company has no variable interest entities; therefore, the implementation of FIN 46 will not have an impact on its results of operations and financial condition.
In April 2003, the FASB issued SFAS No. 149, "Amendment of Statement 133 on Derivative Instruments and Hedging Activities." This statement amends and clarifies financial accounting and reporting for derivative instruments, including certain derivative instruments embedded in other contracts and for hedging activities under SFAS No. 133, "Accounting for Derivative Instruments and Hedging Activities." The clarification provisions of this statement require that contracts with comparable characteristics be accounted for similarly. This statement is effective for any new derivative instruments entered into after June 30, 2003. The Company adopted SFAS No. 149 on July 1, 2003, and the adoption did not have an impact on the Company's financial statements.
In May 2003, the FASB issued SFAS No. 150, "Accounting for Certain Financial Instruments with Characteristics of both Liabilities and Equity." This statement addresses the accounting for certain financial instruments that, under previous guidance, could be accounted for as equity. SFAS No. 150 requires that those instruments be classified as liabilities in the statement of financial position. This statement is effective for financial instruments entered into or modified after May 31, 2003, and is otherwise effective at the beginning of the first interim period beginning after June 15, 2003. Adoption of SFAS No. 150 on July 1, 2003 did not have a material impact on the Company's financial statements.
In December 2003, the FASB issued SFAS No. 132 (as revised 2003), "Employers' Disclosures about Pensions and Other Postretirement Benefits, an amendment of FASB Statements No. 87, 88 and 106, and a revision of FASB Statement No. 132." The new rules require additional disclosures about the assets, obligations, cash flows and net periodic benefit cost of defined benefit pension plans and other postretirement benefit plans. This Statement is effective for the Company for fiscal years ending
F-13
after December 15, 2003, except for certain disclosures on foreign plans, which are effective for fiscal years ending after June 15, 2004. The Company has adopted SFAS No. 132 (as revised 2003) and included the additional disclosures in Notes 12 and 13 to the Consolidated Financial Statements. The Company elected to include the disclosures for its foreign plans in 2003.
3. Corporate Reorganization
In the fourth quarter of 2001, the Company merged with its subsidiaries BCHI and BCI, executed certain financial transactions with BHI and changed its name to Borden Chemical, Inc., from Borden, Inc., reflecting the fact that the only remaining segment of the Company was the chemical business. The Corporate Reorganization was undertaken to simplify the legal structure and strengthen the capital structure of the Company, and to reduce costs. As part of the Corporate Reorganization, certain functions were downsized, eliminated or transferred to a separate legal entity, Borden Capital, Inc. ("Capital"), also owned by BHI.
Subsequent to the Corporate Reorganization, Capital provided certain management, consulting and board services to the Company, as well as other entities owned by KKR, and charged fees to the Company and other affiliates for these services. The Company provided certain administrative services to Capital. The Company was charged a management fee of $9,000 in 2002, payable quarterly in arrears, for the net cost of Capital's services.
The following transactions occurred as part of the Corporate Reorganization and are included in the 2001 results:
- •
- BHI contributed all of the outstanding Series A Cumulative Preferred Stock plus accumulated dividends of $6,553 to the Company as a capital contribution. The significant impact of this transaction was to eliminate required annual future preferred dividend payments of $73,724.
- •
- The Company recorded severance costs of $1,501 for workforce reductions and additional costs of $2,044 related to the Corporate Reorganization. These amounts are classified as Business realignment expense and impairments in the 2001 Consolidated Statement of Operations.
- •
- The Company sold certain assets to BHI for cash. The Company sold a common stock equity investment for its estimated fair value of $55,187 resulting in a pre-tax gain of $15,797 that is recorded as an increase to Paid-in capital due to the affiliated nature of the transaction. Notes receivable from Consumer Adhesives were sold for their carrying amount of $57,691, and a loan receivable from WKI Holding Company, Inc. ("WKI"), an affiliate of the Company, of $25,056 was sold for its fair value of $18,056. Prior to the sale in 2001, the Company recorded a $7,000 charge that is included in investment write-downs and other charges to reflect the decline in fair value of the WKI loan receivable.
- •
- The Company paid Capital $8,741 to assume certain liabilities, the estimated fair value at the date of sale, net of certain assets transferred, including accounts receivable from WKI of $3,594. These liabilities were for accrued compensation, certain employee benefit obligations and accrued liabilities associated with the transferred employees and functions.
- •
- Outstanding stock options on the stock of BCHI held by its management became options of the Company (see Note 15).
F-14
- •
- In addition, the Company settled the minority interest liability related to managements' ownership of shares in BCHI by exchanging shares of the Company's stock and common stock warrants for the BCHI shares held by management. This resulted in an increase to Paid-in capital for 2001 of $1,236, the approximate fair value of the liability.
In 2002, BHI decided to cease Capital's operations during the first half of 2003. Certain management, consulting and board services previously provided to the Company by Capital were assumed by the Company, while other such services were provided to the Company by KKR for an annual fee of $3,000. The Company recorded a charge, funded by BHI, of $5,500 in 2002 related to costs allocable to the Company in connection with the cessation of Capital's operations.
4. Goodwill and Intangible Assets
At December 31, 2003, the Company's management performed the annual goodwill impairment test. As required by SFAS No. 142, "Goodwill and Other Intangible Assets," the Company identified the appropriate reporting units and identified the assets and liabilities (including goodwill) of the reporting units. The Company determined estimated fair values of the reporting units and assessed whether the estimated fair value of each reporting unit was more or less than the carrying amount of the assets and liabilities assigned to the units.
Valuations were performed using a standard methodology based largely on comparable company analysis. Comparable company analysis ascribes a value to an entity by comparing certain operating metrics of the entity to those of a set of comparable companies in the same industry. Using this method, market multiples and ratios based on operating, financial and stock market performance are compared across different companies and to the entity being valued. The Company employed a comparable analysis technique commonly used in the investment banking and private equity industries to estimate the values of its reporting units—the EBITDA (earnings before interest, taxes, depreciation and amortization) multiple technique. Under this technique, estimated values are the result of an EBITDA multiple derived from this process applied to an appropriate historical EBITDA amount.
As a result of this test at December 31, 2003, the fair value of each reporting unit exceeded the carrying amount of assets and liabilities, except for the Company's Malaysian reporting unit. Based on the excess of the carrying value over the estimated fair value of its Malaysian reporting unit, the Company recorded a goodwill impairment charge of $762 that represented 100% of the carrying amount. This impairment charge is reflected in the 2003 Consolidated Statement of Operations as Business realignment expense and impairments.
At December 31, 2002, the Company's management performed the goodwill impairment test using the same methodology described above. No impairment charge was necessary as of December 31, 2002, as the fair values of all reporting units exceeded the carrying amount of the assets and liabilities assigned to the units.
Upon the adoption of SFAS No. 142, on January 1, 2002, the Company engaged Capital to determine estimated fair values of the Company's reporting units as of December 31, 2001. Capital employed the same methodology used by the Company, as described above, to estimate the fair value of the reporting units. As a result of the initial test, the fair value of each reporting unit exceeded the carrying amount of assets and liabilities assigned, except for the Company's European reporting unit. Based on the excess of the carrying value over the estimated fair value of its European reporting unit,
F-15
the Company recorded a goodwill impairment charge of $29,825 that represented 100% of the December 31, 2001 carrying amount. This impairment charge is reported as Cumulative effect of change in accounting principle in the 2002 Consolidated Statement of Operations.
The following table provides a comparison of 2003, 2002 and 2001 as if the new accounting principle were applied in 2001:
| | Year Ended December 31, | |||||||||
|---|---|---|---|---|---|---|---|---|---|---|
| | 2003 | 2002 | 2001 | |||||||
| Reported net income (loss) | $ | 22,976 | $ | (36,583 | ) | $ | (124,800 | ) | ||
| Add back goodwill amortization | — | — | 3,712 | |||||||
| Adjusted net income (loss) | 22,976 | (36,583 | ) | (121,088 | ) | |||||
| Add back cumulative effect of change in accounting principle | — | 29,825 | — | |||||||
| Adjusted net income (loss) before cumulative effect of change in accounting principle | $ | 22,976 | $ | (6,758 | ) | $ | (121,088 | ) | ||
| Basic and diluted per share data: | ||||||||||
| Reported net income (loss) | $ | 0.11 | $ | (0.18 | ) | $ | (0.63 | ) | ||
| Add back goodwill amortization | — | — | 0.02 | |||||||
| Adjusted net income (loss) | 0.11 | (0.18 | ) | (0.61 | ) | |||||
| Add back cumulative effect of change in accounting principle | — | 0.15 | — | |||||||
| Adjusted net income (loss) before cumulative effect of change in accounting principle | $ | 0.11 | $ | (0.03 | ) | $ | (0.61 | ) | ||
The changes in the carrying amount of goodwill for the year ended December 31, 2003 and 2002 are as follows:
| | N.A. Forest Products | N.A. Performance Resins | International | Total | ||||||||||
|---|---|---|---|---|---|---|---|---|---|---|---|---|---|---|
| Goodwill balance at December 31, 2001 | $ | 20,713 | $ | 19,487 | $ | 31,199 | $ | 71,399 | ||||||
| Less goodwill impairment recognized upon adoption of SFAS No. 142 | — | — | (29,825 | ) | (29,825 | ) | ||||||||
| Acquisitions/divestitures | — | (1,343 | ) | — | (1,343 | ) | ||||||||
| Foreign currency translation | 6 | — | (597 | ) | (591 | ) | ||||||||
| Goodwill balance at December 31, 2002 | $ | 20,719 | $ | 18,144 | $ | 777 | $ | 39,640 | ||||||
| Acquisitions/divestitures | 4,068 | — | 14,387 | 18,455 | ||||||||||
| Impairment | — | — | (762 | ) | (762 | ) | ||||||||
| Foreign currency translation | 167 | — | 16 | 183 | ||||||||||
| Goodwill balance at December 31, 2003 | $ | 24,954 | $ | 18,144 | $ | 14,418 | $ | 57,516 | ||||||
F-16
Intangible assets with identifiable useful lives, which continue to be amortized, consist of the following:
| | At December 31, 2003 | At December 31, 2002 | |||||||||||
|---|---|---|---|---|---|---|---|---|---|---|---|---|---|
| | Gross Carrying Amount | Accumulated Amortization | Gross Carrying Amount | Accumulated Amortization | |||||||||
| Intangible assets: | |||||||||||||
| Customer list and contracts | $ | 7,559 | $ | 4,619 | $ | 6,559 | $ | 3,736 | |||||
| Formulas and technology | 6,524 | 4,925 | 6,524 | 4,331 | |||||||||
| Unrecognized prior service cost | 2,657 | 1,309 | 2,657 | 153 | |||||||||
| Other | 744 | 680 | 744 | 654 | |||||||||
| $ | 17,484 | $ | 11,533 | $ | 16,484 | $ | 8,874 | ||||||
The impact of foreign currency translation adjustments is included in accumulated amortization.
Total intangible amortization expense for the year ended December 31, 2003, 2002 and 2001 was $1,508, $1,555 and $1,653, respectively.
Estimated annual intangible amortization expense for 2004 through 2008 is as follows:
| 2004 | $ | 1,700 | |
| 2005 | 970 | ||
| 2006 | 350 | ||
| 2007 | 180 | ||
| 2008 | 150 |
5. Business Acquisitions and Divestitures
Acquisitions
All of the Company's acquisitions described below have been accounted for using the purchase method of accounting. Accordingly, results of operations of the acquired entities have been included from the date of acquisition, and any excess of purchase price over the sum of amounts assigned to identified assets and liabilities has been recorded as goodwill. The pro forma effects of the acquisitions are not material.
During 2003, the Company acquired Fentak Pty. Ltd. ("Fentak"), an international manufacturer of specialty chemical products for engineered wood, laminating and paper impregnation markets, and the business and technology assets of Southeastern Adhesives Company ("SEACO"), a domestic producer of specialty adhesives, for total cash of $14,691. Fentak was acquired in November, 2003 and SEACO was acquired on December 31, 2003. The Company is required to make additional deferred payments for these acquisitions of approximately $3,050 and contingent future payments of $1,500. The Company recorded goodwill totaling $18,455 for these acquisitions.
In the second quarter of 2001, the Company and Delta-HA, Inc. ("Delta") merged their North American foundry resins and coatings businesses forming HA-International, LLC ("HAI"). In conjunction with the merger, the Company recorded an accrual of approximately $7,000 to restructure
F-17
operations of the acquired entity, a minority interest liability of $4,500 to recognize the 25% minority interest and goodwill of approximately $9,000.
The Limited Liability Agreement of HAI provides Delta the right to purchase between 3-5% of additional interest in HAI each year, beginning in 2004. Delta is limited to acquiring a maximum of 25% of additional interest in HAI under this arrangement. Pursuant to this provision, in the first quarter of 2004, Delta provided the Company with written notice of their intention to exercise their option to purchase an additional 5% interest in 2004. Delta's purchase price of the interest is based on the enterprise value of HAI determined by applying a contractually agreed upon multiple to EBITDA, as defined in the agreement.
Divestitures
In 2003, the Company sold its idled melamine crystal business ("Melamine"). The gain from the sale was recorded as business realignment income. See Note 6.
In 2001, the Company divested its chemical operation in Ecuador. Proceeds from the sale of the Ecuador chemical business were $5,275, which resulted in a pre-tax loss of $2,303.
6. Business Realignment and Asset Impairments
In June 2003, the Company initiated a realignment program designed to reduce operating expenses and increase organizational efficiency. To achieve these goals, the Company is reducing headcount, streamlining processes, consolidating manufacturing processes and reducing general and administrative expenses. The Company is combining jobs where practical and has eliminated over 200 positions as of the end of 2003 related to this program. To further reduce future general and administrative expenses, the Company has reduced contract work, consolidated and eliminated positions and streamlined the administration of medical and other postretirement benefits. The Company anticipates this program will be completed in 2004. The Company expects to incur additional costs in 2004 related to this program.
In addition to the June 2003 realignment program, the Company has realignment activities from programs initiated in previous years, primarily related to plant consolidations and reorganization of certain administrative functions. Following is a discussion of realignment activities and impairments recognized during the past three years.
Year Ended December 31, 2003
During 2003, the Company recorded net business realignment expense and impairments of $4,748, consisting of plant closure costs (which include plant employee severance and plant asset impairments) and other severance and employee costs of $13,825, gains on the sale of assets of $12,260 and other non-cash asset impairment charges of $3,183.
F-18
Provided below is a rollforward of the business realignment reserves for 2003:
| | Reserves 12/31/02 | 2003 Expense | 2003 Settlements/ Payments | Reserves 12/31/03 | |||||||||
|---|---|---|---|---|---|---|---|---|---|---|---|---|---|
| Plant closure costs | |||||||||||||
| Prior years' programs | $ | 9,568 | $ | 144 | $ | (4,971 | ) | $ | 4,741 | ||||
| June 2003 program | — | 6,844 | (3,356 | ) | 3,488 | ||||||||
| Other severance costs | |||||||||||||
| Prior years' programs | 3,996 | 3,670 | (6,515 | ) | 1,151 | ||||||||
| June 2003 program | — | 3,167 | (2,020 | ) | 1,147 | ||||||||
| Total reserve activity | $ | 13,564 | $ | 13,825 | $ | (16,862 | ) | $ | 10,527 | ||||
Plant Closure Costs
Plant closure costs in 2003 include $144 for prior years' programs and $6,844 for 2003 programs.
Costs relating to prior years' programs include environmental remediation of approximately $800 for closed plants in Brazil and other plant closure costs of approximately $900. Partially offsetting these costs was a reduction of reserves of approximately $1,600 for Melamine, which was sold in the second quarter of 2003.
The $6,844 of charges relating to the 2003 realignment program included costs associated with two plant consolidation programs. As a result of consolidating manufacturing processes, the Company's facility in France has been converted into a distribution center, and the manufacturing has transitioned to the U.K., resulting in plant closure costs of $5,414, including plant employee severance of approximately $3,600, asset impairment charges of $1,427 and other costs of approximately $400. Additionally, manufacturing was transitioned from the Company's North Bay, Ontario plant to another facility, and the North Bay site was idled as of the end of 2003, resulting in asset impairment charges of $1,430.
Other Severance Costs
Other severance costs for 2003 include $3,167 relating to the 2003 program and $3,670 relating to prior years' programs. The 2003 severance related to the elimination of 200 positions under the June 2003 realignment program, as discussed above.
Gain on the Sale of Assets
In 2003, the Company sold Melamine and land associated with a closed plant in the U.K. for gains of $12,260. The gains related to these sales were recorded as business realignment income because the facilities were closed in conjunction with prior years' realignment programs.
Asset Impairment
The Company recorded other asset impairment charges of $3,183 in 2003. Of the total, $1,421 was for the write-down of assets at various international manufacturing facilities, $1,000 was for a facility held for sale and the remaining $762 related to the write-down of goodwill carried by the Company's Malaysian operations.
F-19
Year Ended December 31, 2002
During 2002, the Company recorded net business realignment expense and impairments of $19,699, consisting of plant closure costs of $12,584, other severance and employee costs of $3,265, a gain on the sale of assets of $2,465 and non-cash impairment charges of $6,315.
Plant Closure and Other Severance and Employee Costs
Provided below is a roll forward of the business realignment reserve activity for 2002:
| | Reserves 12/31/01 | 2002 Expense | 2002 Settlements/ Payments | Reserves 12/31/02 | ||||||||
|---|---|---|---|---|---|---|---|---|---|---|---|---|
| Plant closure costs | $ | 14,067 | $ | 12,584 | $ | (17,083 | ) | $ | 9,568 | |||
| Other severance costs | 8,360 | 3,265 | (7,629 | ) | 3,996 | |||||||
| Total reserve activity | $ | 22,427 | $ | 15,849 | $ | (24,712 | ) | $ | 13,564 | |||
Plant closure costs in 2002 of $12,584 consist of plant employee severance of $2,721, demolition, environmental and other costs of $8,764 and a $1,099 increase to the reserve related to revised estimates of environmental clean-up and demolition for several locations closed in previous years.
Gain on the Sale of Assets
In 2002, the Company sold land associated with a closed plant in Spain and recorded a gain of $2,465. The gain related to this sale was recorded as business realignment income because the facility was closed in conjunction with prior years' realignment programs.
Asset Impairment
The Company recorded asset impairment charges of $6,315 in 2002. Of the total, $5,275 related to the write-down of fixed assets at various international manufacturing facilities and $1,040 was for a facility held for sale.
Year Ended December 31, 2001
During 2001, the Company recorded net business realignment expense and impairments of $126,408, consisting of plant closure costs of $23,285, other severance and employee costs of $12,582, a gain on the sale of assets of $10,507 and non-cash impairment charges of $101,048.
Plant Closure and Other Severance and Employee Costs
Plant closure costs in 2001 of $23,285 consist of fixed asset write-offs of $11,863, plant employee severance of $1,862 and demolition, environmental and other costs of $9,560.
Gain on the Sale of Assets
In 2001, the Company sold land associated with a closed domestic plant and recorded a gain of $10,507. The gain related to this sale was recorded as business realignment income because the facility was closed in conjunction with prior years' realignment programs.
F-20
Asset Impairment
In the fourth quarter of 2001, the Company decided to cease operations at Melamine and to offer it for sale. As of the end of 2001, no sale had been negotiated, and in January 2002, the plant was shut-down. Under SFAS No. 121, "Accounting for the Impairment of Long-Lived Assets and for Long-Lived Assets to be Disposed Of," the Company recorded a 2001 impairment charge of $98,163 for the fixed assets ($62,527), goodwill ($32,701) and spare parts ($2,935) of Melamine.
Also, in the fourth quarter of 2001, the Company discontinued construction of a new plant facility and recorded an impairment charge of $2,885 to write-down the engineering, construction and other costs incurred to the estimated net realizable value of the land and building.
7. Discontinued Operations
The summary of discontinued operations below includes Consumer Adhesives' results through August 2001, the date of the Consumer Adhesives Sale:
| | 2001 | ||
|---|---|---|---|
| Net sales | $ | 106,307 | |
| Income before income taxes | 17,404 | ||
| Income tax expense | 5,600 | ||
| Income from discontinued operations | $ | 11,804 | |
Proceeds from the Consumer Adhesives sale were $94,120, net of cash sold with the business, resulting in a pre-tax gain of $132,275, which was recorded in Paid-in capital due to the affiliated nature of the transaction. See Note 1.
8. Comprehensive Income
Comprehensive income includes the following items:
| | 2003 | 2002 | 2001 | |||||||
|---|---|---|---|---|---|---|---|---|---|---|
| Net income (loss) | $ | 22,976 | $ | (36,583 | ) | $ | (124,800 | ) | ||
| Foreign currency translation adjustments | 31,614 | (14,856 | ) | (12,649 | ) | |||||
| Reclassification adjustments | — | — | 5,800 | |||||||
| Cumulative effect of change in accounting principle | — | — | (3,300 | ) | ||||||
| Derivative activity | — | 730 | 2,570 | |||||||
| Minimum pension liability (see Note 12) | 5,830 | (17,075 | ) | (66,580 | ) | |||||
| $ | 60,420 | $ | (67,784 | ) | $ | (198,959 | ) | |||
The foreign currency translation adjustments in 2003 primarily relate to favorable exchange rates in Canada, Latin America and Australia. In 2002, the foreign currency translation adjustments primarily relate to unfavorable exchange rates in Latin America. The 2001 foreign currency translation adjustments primarily relate to unfavorable exchange rates in Latin America and Canada.
F-21
The 2001 reclassification adjustment reflects the accumulated translation adjustment recognized on the sale of the Company's operations in Ecuador.
The cumulative effect of change in accounting principle and derivative activity represents the impact of the adoption of SFAS No. 133, "Accounting for Derivative Instruments and Hedging Activities," on January 1, 2001. The Company recorded a pre-tax initial transition adjustment to Accumulated other comprehensive income of $5,200 of which $1,330 and $3,870 was reclassified into earnings for the year ended December 31, 2002 and 2001, respectively.
The components of Accumulated other comprehensive income as of December 31, 2003 and 2002 are as follows:
| | 2003 | 2002 | |||||
|---|---|---|---|---|---|---|---|
| Cumulative foreign currency translation adjustments | $ | (49,923 | ) | $ | (81,537 | ) | |
| Minimum pension liability, net of tax | (78,270 | ) | (84,100 | ) | |||
| $ | (128,193 | ) | $ | (165,637 | ) | ||
9. Investments in Affiliates
The Company had no continuing investments in affiliates at December 31, 2003 and 2002.
The Company sold a common stock equity investment in 2001 for $64,141. Of the total proceeds, $55,187 was received from BHI as part of the Corporate Reorganization (see Note 3), and the related pre-tax gain of $15,797 was recorded in Paid-in capital due to the affiliated nature of the transaction. The remaining $8,954 was received from sales to third parties, and a related gain of $4,400 was reflected in the 2001 Consolidated Statement of Operations as Gain on the sale of assets.
In 2001, the Company wrote-off its $10,000 investment in WKI preferred stock, $7,000 of a loan receivable from WKI and its remaining $10,000 investment in BCP Management, Inc. ("BCPM"), a former subsidiary of the Company. The write-offs are reflected in Investment write-downs and other charges in the 2001 Consolidated Statement of Operations.
BCPM filed for protection under Chapter 11 of the United States Bankruptcy Code, in the United States Bankruptcy Court for the District of Delaware on March 22, 2002. As a result of the bankruptcy of BCPM, the Company no longer consolidated BCPM in its Consolidated Financial Statements. There was no impact on previously reported amounts of net (loss) income as a result of the deconsolidation. The Company's investment in BCPM was written-off in 2001, as described above. In the first quarter of 2003, the assets of BCPM were transferred to a liquidating agent, and the Company's ownership interest was extinguished.
F-22
10. Debt and Lease Obligations
Debt outstanding at December 31, 2003 and 2002 is as follows:
| | 2003 | 2002 | |||||||||||
|---|---|---|---|---|---|---|---|---|---|---|---|---|---|
| | Long-Term | Due Within One Year | Long-Term | Due Within One Year | |||||||||
| 9.2% debentures due 2021 | $ | 114,800 | $ | 114,800 | |||||||||
| 7.875% debentures 2023 | 246,782 | 246,782 | |||||||||||
| Sinking fund debentures: | |||||||||||||
| 83/8% due 2016 | 78,000 | 78,000 | |||||||||||
| 91/4% due 2019 | 47,295 | 47,295 | |||||||||||
| Industrial Revenue Bonds (at an average rate of 3.1% in 2003 and 1.6% in 2002) | 34,000 | 34,885 | |||||||||||
| Other (at an average rate of 8.1% in 2003 and 13.8% in 2002) | 9,089 | $ | 2,221 | 1,525 | |||||||||
| Total current maturities of long-term debt | 2,221 | ||||||||||||
Short-term debt (primarily foreign bank loans at an average rate of 4.8% in 2003 and 10.7% in 2002) | — | 5,946 | — | $ | 2,779 | ||||||||
| Total debt | $ | 529,966 | $ | 8,167 | $ | 523,287 | $ | 2,779 | |||||
The Company entered into a three-year asset based revolving credit facility dated September 23, 2002 (the "Credit Facility") which provides for a maximum borrowing of $175,000, including letters of credit ("LOC"). The Credit Facility replaced an uncommitted LOC facility (discussed below) and the prior $250,000 credit facility that expired on July 13, 2002.
The Credit Facility is secured with inventory and accounts receivable in the United States, Canada and the U.K., a portion of property and equipment in Canada and the U.K. and the stock of certain subsidiaries. Maximum borrowing allowable under the Credit Facility is determined monthly and is based upon specified percentages of eligible accounts receivable, inventory and fixed assets. The Credit Facility contains restrictions on dividends, limitations on borrowings from affiliates ($30,000), capital expenditures ($68,000 in 2004) and payment of management fees ($5,000 per year). It also has a minimum trailing EBITDA twelve-month fixed charge coverage ratio requirement (as defined) of 1.5 to 1.0 if aggregate availability is less than $25,000, 1.25 to 1.0 if aggregate availability is between $25,000 and $50,000 and 1.1 to 1.0 if aggregate availability is between $50,000 and $75,000. There are no fixed coverage ratio requirements when aggregate availability exceeds $75,000. As of December 31, 2003, the maximum borrowing allowable under the Credit Facility was approximately $144,000, of which approximately $98,000, net of LOCs, was unused and available; therefore, the Company had no fixed charge coverage ratio requirements.
Under the terms of the Credit Facility the Company has the ability to borrow funds at either the prime rate plus an applicable margin ("the prime rate option") or at LIBOR plus an applicable margin. The Company must designate which option it chooses at the time of the borrowing. Currently the applicable margin for any prime rate borrowing is 75 basis points and for any LIBOR borrowing is 225 basis points. As of December 31, 2003 there were borrowings of $220 outstanding under the prime rate option, equivalent to 6.0%. For LOCs issued under the Credit Facility, the Company pays a per annum fee equal to the LIBOR applicable margin, or 2.25%, plus a fronting fee of .125%. In addition, the
F-23
Company pays a .50% per annum fee on the amount of the revolving loan commitment less any borrowings or outstanding LOCs. The Company incurred commitment fees of $557 in 2003 related to the Credit Facility.
Under an uncommitted LOC facility, the Company provided cash collateral equivalent to 101% of LOCs outstanding which was classified as Restricted cash on the Consolidated Balance Sheet as of December 31, 2002. In early July 2003, the Company completed the process of transferring all the LOCs under this facility to the Credit Facility.
The Company's Australian subsidiary entered into a five-year asset-backed credit facility in the fourth quarter of 2003 (the "Australian facility"), which provides for a maximum borrowing of AUD$19,900, or approximately $15,000. At December 31, 2003, outstanding debt under this facility was $12,178, of which $7,670 is classified as long-term. In addition, there were approximately $400 of outstanding LOCs under the facility. The Australian facility provided the funding for the Fentak acquisition made in the fourth quarter of 2003 (see Note 5) and is secured by mortgages on the fixed assets of the Australian business and the stock of Australian subsidiaries. This facility includes a fixed rate facility used for the acquisition, as well as a revolver. The Australian facility contains restrictions relative to the Australian businesses on dividends, the sale of assets and additional borrowings. The Australian facility also contains financial covenants applying to the Australian subsidiaries including current ratio, interest coverage, debt service coverage and leverage. The fixed portion of the Australian facility requires minimum quarterly principal reductions totaling AUD$450 (approximately $330). The Australian facility requires semi-annual principal reductions based on a portion of excess cash as defined in the agreement. As of December 31, 2003, of the maximum borrowing allowable under the Australian Facility, AUD$3,178 (approximately $2,400) was unused and available.
Additional international credit facilities provide availability totaling approximately $29,900. Of this amount, approximately $15,900 (net of LOCs and other guarantees of approximately $7,700 and $2,300 of other draws) was available to fund working capital needs and capital expenditures at December 31, 2003. Of the total $2,310 of outstanding debt, $1,419 was classified as long-term. There is an additional $4,000 available for which usage is restricted to capital investments and for foreign currency hedging. While these facilities are primarily unsecured, portions of the lines are secured by equipment and with $1,442 of cash. The Company guarantees up to $6,700 of the debt of one of its Brazilian subsidiaries, included in these facilities.
The Company and HAI had affiliated borrowing arrangements with Borden Foods Holding Corporation ("Foods") during 2003. See Note 20.
HAI entered into a three-year asset based revolving credit facility on January 28, 2004, which provides for a maximum borrowing of $20,000 (the "HAI facility"). The HAI facility replaced the affiliated loan agreement with Foods. The HAI facility is secured with inventory, accounts receivable and property and equipment of HAI. Maximum borrowing allowable under the HAI facility is based upon specific percentages of eligible accounts receivable and inventory. The HAI facility provides up to $2,000 for LOCs. The HAI facility contains restrictions relative to HAI on dividends, affiliate transactions, minimum availability ($2,000), additional debt and capital expenditures ($2,000 in 2004). In addition, HAI is required to maintain a minimum trailing twelve-month debt coverage ratio of 1.5 to 1.0.
F-24
The Company finances certain insurance premiums outside of the Credit Facility. Short-term borrowings include $2,548 and $975 related to this arrangement at December 31, 2003 and 2002, respectively.
On October 1, 2003, the Company exercised its option to redeem, at par, the remaining $885 of County of Maricopa Industrial Revenue Bonds ("IRBs"). In October 2003, the Company converted the $34,000 Parish of Ascension IRBs to a fixed interest rate and, by doing so, eliminated the requirement to maintain a backup letter of credit of approximately $34,500. The elimination of this LOC increased availability under the Credit Facility.
During the fourth quarter of 2002, the Company repurchased $7,368 of the outstanding publicly held bonds for $4,510 plus fees. A $2,741 gain on the extinguishment of the bonds was recognized in 2002 and is included in Other non-operating income.
Aggregate maturities of total debt and minimum annual rentals under operating leases at December 31, 2003, for the Company are as follows:
| Year | Debt | Minimum Rentals Under Operating Leases | ||||
|---|---|---|---|---|---|---|
| 2004 | $ | 8,167 | $ | 12,120 | ||
| 2005 | 2,219 | 10,205 | ||||
| 2006 | 1,841 | 7,882 | ||||
| 2007 | 1,420 | 5,961 | ||||
| 2008 | 3,609 | 4,302 | ||||
| 2009 and beyond | 520,877 | 3,789 | ||||
| $ | 538,133 | $ | 44,259 | |||
Rental expense amounted to $14,595, $14,399 and $19,566 in 2003, 2002 and 2001, respectively.
11. Income Taxes
Comparative analysis of the Company's income tax benefit related to continuing operations follows:
| | Current | Deferred | |||||||||||||||||
|---|---|---|---|---|---|---|---|---|---|---|---|---|---|---|---|---|---|---|---|
| | 2003 | 2002 | 2001 | 2003 | 2002 | 2001 | |||||||||||||
| Federal | $ | (9,899 | ) | $ | (29,479 | ) | $ | (363 | ) | $ | 4,662 | $ | 12,040 | $ | (25,800 | ) | |||
| State & Local | (737 | ) | (380 | ) | (4,365 | ) | 566 | 187 | (805 | ) | |||||||||
| Foreign | (246 | ) | 11,574 | (222 | ) | 995 | 3,796 | 722 | |||||||||||
| $ | (10,882 | ) | $ | (18,285 | ) | $ | (4,950 | ) | $ | 6,223 | $ | 16,023 | $ | (25,883 | ) | ||||
In 2001, the Company's income tax expense related to discontinued operations was $5,600 (see Note 7). The Company's income tax expense from the gain on disposal of discontinued operations was $37,428 in 2001, which is reflected as a reduction to shareholders' equity due to the affiliated nature of the transaction (see Note 1).
F-25
A reconciliation of the Company's difference between income taxes related to continuing operations computed at Federal statutory tax rates and provisions for income taxes is as follows:
| | 2003 | 2002 | 2001 | |||||||
|---|---|---|---|---|---|---|---|---|---|---|
| Income taxes computed at Federal statutory tax rate | $ | 6,411 | $ | (3,157 | ) | $ | (58,602 | ) | ||
| State tax provision, net of Federal benefits | (111 | ) | (193 | ) | (5,842 | ) | ||||
| Foreign tax differentials | (813 | ) | 3,502 | 1,187 | ||||||
| Foreign source income also subject to U.S. taxation | 9,324 | 1,777 | 12,397 | |||||||
| Losses and other expenses not deductible for tax | 373 | (863 | ) | 2,723 | ||||||
| Impairment of non-deductible goodwill | — | — | 31,692 | |||||||
| Valuation allowance | 5,401 | 16,672 | — | |||||||
| Elimination of deferred tax liabilities of BCPM | (1,624 | ) | — | — | ||||||
| Capital loss on sale of Melamine | (19,936 | ) | — | — | ||||||
| Adjustment of prior estimates and other | (3,684 | ) | (20,000 | ) | (14,388 | ) | ||||
| Income tax benefit | $ | (4,659 | ) | $ | (2,262 | ) | $ | (30,833 | ) | |
The 2003 consolidated rate reflects a benefit of $19,936 from the sale of the stock of Melamine in 2003. The tax basis of the stock exceeded the tax basis of the assets and this additional basis was not recognized until the stock sale was completed in 2003. This benefit is a capital loss carryforward that can only be used against capital gains; therefore, a valuation reserve was established for the full amount of this benefit. The 2003 consolidated rate also reflects a reduction of the valuation reserve in the amount of $14,534 related to benefits which the Company now believes are more likely than not to be realized. The 2003 tax rate also reflects the elimination of $1,624 of deferred tax liabilities associated with the BCPM bankruptcy. In addition, reserves for prior years' Canadian and U.S. tax audits were reduced by $3,997 as a result of preliminary settlements of certain matters in the fourth quarter of 2003. The effective rate also reflects additional income tax expense of $9,324 on foreign dividend income and on deemed dividend income related to loans and guarantees from foreign subsidiaries.
The 2002 consolidated tax rate reflects a valuation allowance in the amount of $16,672 recorded against the benefit of certain deferred interest expense deductions, which are subject to usage limitations by the Internal Revenue Service ("IRS"), that are no longer more likely than not to be used. This expense is offset by the reduction of a $20,000 reserve for U.S. Federal income tax audits reflecting preliminary settlement of certain matters for the years 1998 and 1999 that were resolved in 2002.
The 2001 consolidated tax rate includes a $31,692 effect of the non-deductible impairment of the fixed assets and goodwill related to the 2001 shutdown of Melamine. Additionally, tax expense of $12,397 is reflected in the tax rate for the impact of earnings related to the expected sale of foreign businesses that are no longer expected to be permanently reinvested in foreign locations, as well as the inability to use foreign tax credits associated with those earnings due to usage limitations. Offsetting this charge was a tax benefit of $14,388 relating to the settlement of U.S. Federal income tax audits for the years 1987 to 1991 that were finalized in 2001.
F-26
The domestic and foreign components of the Company's Income (loss) from continuing operations before income taxes are as follows:
| | 2003 | 2002 | 2001 | |||||||
|---|---|---|---|---|---|---|---|---|---|---|
| Domestic | $ | (30,706 | ) | $ | (42,929 | ) | $ | (165,478 | ) | |
| Foreign | 49,023 | 33,909 | (1,959 | ) | ||||||
| $ | 18,317 | $ | (9,020 | ) | $ | (167,437 | ) | |||
The tax effects of the Company's significant temporary differences, and loss and credit carryforwards, which comprise the deferred tax assets and liabilities at December 31, 2003 and 2002, are as follows:
| | 2003 | 2002 | ||||||
|---|---|---|---|---|---|---|---|---|
| Assets | ||||||||
| Non-pension postemployment benefit obligations | $ | 46,261 | $ | 52,411 | ||||
| Accrued and other expenses | 75,493 | 91,332 | ||||||
| Loss and credit carryforwards | 162,308 | 169,302 | ||||||
| Pension liability | 23,448 | 23,071 | ||||||
| Gross deferred tax assets | 307,510 | 336,116 | ||||||
| Valuation allowance | (81,992 | ) | (89,321 | ) | ||||
| 225,518 | 246,795 | |||||||
| Liabilities | ||||||||
| Property, plant, equipment and intangibles | 77,558 | 76,107 | ||||||
| Foreign property, plant, equipment and other | 9,338 | 5,975 | ||||||
| Prepaid pension | 2,404 | 293 | ||||||
| Deferred gain on sale of a partnership interest | — | 17,264 | ||||||
| Other prepaids and intangibles | (277 | ) | 1,300 | |||||
| Gross deferred tax liabilities | 89,023 | 100,939 | ||||||
| Net deferred tax asset | $ | 136,495 | $ | 145,856 | ||||
The Company's net deferred tax asset at December 31, 2003 was $136,495, which is the net of $140,519 of deferred tax assets and a $4,024 current deferred tax liability. Of this amount, $139,336 represents net domestic deferred tax assets related to future tax benefits. The Company's deferred tax asset related to loss and credit carryforwards, net of valuation allowance is $80,316. The deferred tax assets are reduced by a valuation allowance when it is determined that it is more likely than not that these assets will not be fully utilized in the future. This $80,316 includes net operating loss carryforwards and future deductions of $43,369 for U.S. federal tax purposes, which will begin expiring in 2021. This amount also includes minimum tax credits of $33,132, which do not expire, and other available carryforwards of $3,815, with various expiration dates.
Realization of the $139,336 net domestic deferred tax asset is dependent on generation of approximately $400,000 of future taxable income. The Company has certain business strategies that it would execute before any material deferred tax assets would go unused.
F-27
Credit carryforwards and valuation allowances both decreased from 2002 principally due to the expiration of foreign tax credits and the valuation allowances previously established against those credits. Loss carryforwards increased from 2002 due to the generation of additional net operating loss carryforwards in 2003.
At December 31, 2003, the Company has approximately $66,000 accrued for probable tax liabilities, of which $19,800 is recorded in other current liabilities and $46,200 is recorded in other long-term liabilities. Of the $66,000, approximately $35,000 relates to the provision for taxes on foreign unrepatriated earnings, and the balance of $31,000 relates to U.S. Federal, state and local and Canadian taxes.
The IRS has substantially completed audits of all years through 1999, and unresolved issues for the years 1994-1999 are currently under discussion with the Appeals Office of the IRS and the Competent Authority group of the U.S. Treasury Department. These unresolved issues generally include appropriateness of: expense allocations and royalty charges between U.S. and foreign jurisdictions, compensation excise tax assessments, certain carryback claims filed by the Company and the treatment of various business sale transactions undertaken by the Company during the period. The IRS has substantially completed the audit of tax years 2000-2001, and the results have been discussed and agreed upon by the Company. The years 2002 and 2003 remain open for examination.
The 2003 consolidated tax rate reflects the reversal of $3,997 of the aforementioned tax reserves. This reversal reflects the settlement of potential U.S. Federal, state and local tax matters, an adjustment of foreign tax credits available for future use, Canadian audit issues related to the divestiture of operating businesses in prior years and the settlement of other audit related tax issues offset by the utilization of available tax assets.
The Canada Revenue Agency is currently auditing the Company's Canadian subsidiary for the period 1993-1994. The years 1995-2003 remain open for inspection and examination by various Canadian taxing authorities. Deposits have been made to offset any probable additional taxes related to the divestiture of Canadian operating businesses. Since 1995, the Company has divested its Foods, Consumer Adhesives, and wallcoverings businesses, all of which had operations in Canada.
The Company and some of its affiliates have historically operated in over forty states across the U.S. Since 1995, the Company has divested a significant number of its businesses and generated significant taxable gains from these sales and divestitures. The Company has also utilized certain affiliated legal entities for the purposes of licensing its intellectual properties to related and unrelated parties and for providing loans and other financing for operations. Reserves have been established to provide for probable additional tax liabilities related to these transactions. As the various state and city taxing jurisdictions continue with their audit/examination programs, and as the corresponding audit years are finalized at the U.S. federal audit level, the Company will adjust its reserves to reflect these settlements.
The Company has not recorded income taxes applicable to undistributed earnings of foreign subsidiaries that are permanently reinvested in foreign operations. Undistributed earnings permanently reinvested amounted to approximately $173,400 at December 31, 2003.
F-28
12. Pension and Retirement Savings Plans
Most U.S. employees of the Company are covered under a non-contributory defined benefit plan (the "U.S. Plan"). The U.S. Plan provides benefits for salaried employees based on eligible compensation and years of credited service and for hourly employees based on years of credited service. Certain employees in other countries are covered under other contributory and non-contributory foreign defined benefit plans that, in the aggregate, are insignificant and are included in the data presented herein.
Following is a rollforward of the assets and benefit obligations of the Company's defined benefit plans. The Company uses a September 30 measurement date for its plans.
| | 2003 | 2002 | |||||
|---|---|---|---|---|---|---|---|
| Change in Benefit Obligation | |||||||
| Benefit obligation at beginning of year | $ | 263,364 | $ | 288,107 | |||
Service cost | 2,316 | 3,844 | |||||
| Interest cost | 15,228 | 19,148 | |||||
| Actuarial losses | 12,038 | 4,693 | |||||
| Foreign currency exchange rate changes | 1,165 | 84 | |||||
| Benefits paid | (34,403 | ) | (28,942 | ) | |||
| Plan amendments | — | 330 | |||||
| Acquisitions/divestitures | (325 | ) | — | ||||
| Settlements/curtailments | (304 | ) | (23,900 | ) | |||
| 259,079 | 263,364 | ||||||
| Change in Plan Assets | |||||||
| Fair value of plan assets at beginning of year | 190,831 | 260,540 | |||||
| Actual return on plan assets | 30,683 | (18,000 | ) | ||||
| Foreign currency exchange rate changes | 805 | 34 | |||||
| Employer contribution | 1,770 | 1,099 | |||||
| Benefits paid | (34,403 | ) | (28,942 | ) | |||
| Settlements/curtailments | — | (23,900 | ) | ||||
| Fair value of plan assets at end of year | 189,686 | 190,831 | |||||
| Plan assets less than benefit obligation | (69,393 | ) | (72,533 | ) | |||
| Unrecognized net actuarial loss | 122,261 | 131,658 | |||||
| Unrecognized initial transition gain | 21 | 13 | |||||
| Unrecognized prior service cost | 1,348 | 2,534 | |||||
| Net amount recognized | $ | 54,237 | $ | 61,672 | |||
F-29
Amounts recognized in the balance sheets, after reclassification of the prepaid pension asset to reflect a minimum pension liability adjustment, consist of:
| | 2003 | 2002 | |||||
|---|---|---|---|---|---|---|---|
| Accrued benefit liability | $ | (67,526 | ) | $ | (70,216 | ) | |
| Intangible asset | 1,348 | 2,504 | |||||
| Accumulated other comprehensive income | 120,415 | 129,384 | |||||
| Net amount recognized | $ | 54,237 | $ | 61,672 | |||
The weighted average rates used to determine benefit obligations for the Company were as follows:
| | 2003 | 2002 | |||
|---|---|---|---|---|---|
| Discount rate | 5.8 | % | 6.5 | % | |
| Rate of increase in future compensation levels | 4.0 | % | 4.2 | % |
The following summarizes defined benefit pension plans with an accumulated benefit obligation in excess of plan assets:
| | 2003 | 2002 | ||||
|---|---|---|---|---|---|---|
| Projected benefit obligation | $ | 259,079 | $ | 263,364 | ||
| Accumulated benefit obligation | 256,972 | 259,655 | ||||
| Fair value of plan assets | 189,686 | 190,831 | ||||
While the Company reports the entire liability for the U.S. Plan, which is sponsored by the Company, its participants also include certain Foods' former associates and Consumer Adhesives' associates. Foods and Consumer Adhesives reimbursed the Company for the expense associated with their respective participants in the U.S. plan. Therefore, the tables summarizing the pension activities for the Company's defined benefit pension plans include the liabilities and assets relating to these businesses. However, the expense table excludes the expense relating to Foods and Consumer Adhesives. Expense reimbursements received by the Company from Foods and Consumer Adhesives totaled $1,061, $1,012 and $952 for 2003, 2002 and 2001, respectively. The Company does not anticipate any future reimbursements from either Foods or Consumer Adhesives.
F-30
Following are the components of net pension expense recognized by the Company for the years ended December 31:
| | 2003 | 2002 | 2001 | |||||||
|---|---|---|---|---|---|---|---|---|---|---|
| Service cost | $ | 2,101 | $ | 3,602 | $ | 3,352 | ||||
| Interest cost on projected benefit obligation | 14,803 | 16,727 | 18,701 | |||||||
| Expected return on assets | (15,481 | ) | (19,386 | ) | (22,925 | ) | ||||
| Amortization of prior service cost | 386 | 395 | 436 | |||||||
| Amortization of initial transition asset | 10 | 12 | (122 | ) | ||||||
| Recognized actuarial loss | 7,116 | 4,102 | 3,706 | |||||||
| Settlement/curtailment loss | 411 | 13,600 | 16,300 | |||||||
| Net pension expense | $ | 9,346 | $ | 19,052 | $ | 19,448 | ||||
The weighted average rates used to determine net pension expense for the Company were as follows:
| | 2003 | 2002 | 2001 | ||||
|---|---|---|---|---|---|---|---|
| Discount rate | 6.5 | % | 7.2 | % | 7.7 | % | |
| Rate of increase in future compensation levels | 4.2 | % | 4.5 | % | 4.7 | % | |
| Expected long-term rate of return on plan assets | 8.2 | % | 8.3 | % | 8.7 | % |
The 2003 curtailment loss includes a $710 charge for the U.S. Plan, partially offset by a curtailment gain of $299 on an international plan. During 2002, the Company recognized a settlement charge of $13,600 related to lump sum payments made by the U.S. Plan. During 2001, the Company recorded settlement and curtailment charges of $10,700 relating to the partial settlement of U.S. Plan liabilities for Foods and an additional $5,600 settlement for other lump sum payments made by the U.S. Plan.
In determining the expected overall long-term rate of return on assets, the Company takes into account the rates on long-term debt investments held within the portfolio, as well as expected trends in the equity markets. Peer data and historical returns are reviewed, and the Company consults with actuarial experts to confirm that the Company's assumptions are reasonable.
The Company's investment strategy for defined benefit pension plan assets is to maximize the long-term return on plan assets using a mix of equities and fixed income investments and accepting a prudent level of risk. Risk tolerance is established through careful consideration of plan liabilities, plan funded status and expected timing of future cash flow requirements. The investment portfolio contains a diversified blend of equity and fixed-income investments. Furthermore, equity investments are diversified across U.S. and non-U.S. stocks, as well as growth, value and small and large capital investments. Investment risk and performance is measured and monitored on an ongoing basis through quarterly investment portfolio reviews, annual liability measurements and periodic asset/liability studies.
F-31
Following is a summary of actual 2003 and 2002, at the measurement date, and target 2004 allocations of Plan assets by investment type:
| | Actual | Target | |||||
|---|---|---|---|---|---|---|---|
| | 2003 | 2002 | 2004 | ||||
| Fixed income securities | 49 | % | 43 | % | 40 | % | |
| Equity securities | 31 | % | 32 | % | 60 | % | |
| Cash and short-term investments | 20 | % | 25 | % | — | ||
| 100 | % | 100 | % | 100 | % | ||
The Company recently reviewed its target allocation of plan assets based on projections and expected timing of future benefit payments. Based on this review the Company has set a new allocation target in 2004 of 60% equities and 40% debt. The re-allocation process is expected to be completed by the end of the second quarter of 2004. The Company's pension portfolio does not include any significant holdings in real estate.
The Company expects to make contributions totaling $870 to its defined benefit plans in 2004.
The Company has been informed by the IRS that cash balance plans may be required to be amended because of recent ERISA rulings that found some cash balance plans to be discriminatory. The IRS indicated that the U.S. Plan should continue to operate as currently designed until new guidance is available. There is insufficient information to assess any potential impact to the Company of the ERISA ruling at this time.
Most employees not covered by the Company's U.S. and foreign defined benefit pension plans are covered by collective bargaining agreements, which are generally effective for five years. Under Federal pension law, there would be continuing liability to these pension trusts if the Company ceased all or most participation in any such trust, and under certain other specified conditions. The Consolidated Statements of Operations include charges of $472, $504 and $367 in 2003, 2002 and 2001, respectively, for payments to pension trusts on behalf of employees not covered by the Company's plans.
The Company also provides a defined contribution plan to its U.S. employees (the "Retirement Savings Plan"). Eligible salaried and hourly employees may contribute up to 5% of their pay (7% for certain longer service salaried employees), as basic contributions to the plan. The Company contributes monthly to the plan an amount equal to at least 50% and up to 100% of basic contributions. The Company has the option to make additional contributions based upon financial performance. Charges to operations for matching contributions under the Retirement Savings Plan in 2003, 2002 and 2001 totaled $6,560, $5,647 and $5,289 respectively.
13. Non-Pension Postretirement Benefit
The Company provides certain health and life insurance benefits for eligible domestic and Canadian retirees and their dependents. The cost of postretirement benefits is accrued during employees' working careers. Domestic participants who are not eligible for Medicare are generally provided with the same medical benefits as active employees. Until September 2003, participants who were eligible for Medicare were provided with supplemental benefits. In September 2003, the plan was amended, as is discussed below. Canadian participants are provided with supplemental benefits to the
F-32
national healthcare plan in Canada. The domestic postretirement medical benefits are contributory; the Canadian medical benefits are non-contributory. The domestic and Canadian postretirement life insurance benefits are non-contributory. Benefits are funded on a pay-as-you-go basis.
In 2003, the Company amended its medical benefit plan such that, effective September 1, 2003, medical benefits are no longer provided to the Company's retirees and their dependents who are over age 65. The Company has made an arrangement with a major benefits provider to offer affected retirees and their dependents continued access to medical and prescription drug coverage, including coverage for pre-existing conditions. The Company is subsidizing a portion of the cost of coverage for affected retirees and dependents through December 2004 to assist retirees' transition to alternative medical coverage. The Company has reserved the right to continue, terminate or reduce the subsidy provided to affected retirees and dependents in the future. This subsidy will be reviewed for periods after December 2004. As a result of these actions, based on current actuarial estimates and assumptions, the Company's liability related to providing post-retirement medical benefits has been reduced by approximately $88,000. The Company's unrecognized prior service cost has been adjusted for the impact of the amendment, and the adjustment is being amortized over the estimated remaining years of service of approximately nine years.
On December 8, 2003, the Medicare Prescription Drug, Improvement and Modernization Act of 2003 (the "Act") was signed into law. The Act introduces a prescription drug benefit under Medicare (Medicare Part D) that provides several options for Medicare eligible participants and employers, including a federal subsidy to companies that elect to provide a retiree prescription drug benefit which is at least actuarially equivalent to Medicare Part D. The Act provides for a two-year transitional period to allow for, among other items, the possibility that companies may amend existing plans. There are significant uncertainties regarding the eventual regulations required to implement the Act, as well as the Act's overall affect on plan participant's coverage choices and the related impact on their health care costs. As such, the effects of the Act are not reflected in the accumulated postretirement benefit obligation as of December 31, 2003 or in the 2003 net periodic postretirement benefit cost. Once the regulations regarding the implementation of the Act and FASB's authoritative guidance on the accounting for the federal subsidy is issued, the Company may be required to change its previously reported information. The Company is currently evaluating the provisions of the Act and its potential impact to the Company's postretirement medical plans.
F-33
Following is a rollforward of the changes in the non-pension postretirement benefit obligations of the Company for the years ended December 31. The Company uses a measurement date of September 30.
| | 2003 | 2002 | |||||
|---|---|---|---|---|---|---|---|
| Change in Benefit Obligation | |||||||
Benefit obligation at beginning of year | $ | 131,609 | $ | 128,499 | |||
| Service cost | 72 | 64 | |||||
| Interest cost | 3,938 | 8,822 | |||||
| Contributions by plan participants | 2,176 | 2,797 | |||||
| Actuarial (gains) losses | (4,683 | ) | 5,240 | ||||
| Plan amendments | (88,168 | ) | — | ||||
| Benefits paid | (12,889 | ) | (13,818 | ) | |||
| Foreign Exchange | 150 | 5 | |||||
| Benefits obligation at end of year | 32,205 | 131,609 | |||||
Unrecognized net actuarial gain | 3,809 | 496 | |||||
| Unrecognized prior service benefit | 86,830 | 7,214 | |||||
| Accrued postretirement obligation at end of year | $ | 122,844 | $ | 139,319 | |||
The weighted average rates used to determine benefit obligations for the Company were as follows:
| | 2003 | 2002 | |||
|---|---|---|---|---|---|
| Discount rate | 5.8 | % | 6.5 | % |
The net postretirement (benefit) expense table excludes the expense related to Foods for 2002, as Foods reimbursed the Company $509 for the expense related to Foods' participants in that year. Foods reimbursed the Company in 2001 to assume their remaining postretirement liability following the sale of its businesses.
Following are the components of net postretirement (benefit) expense recognized by the Company for 2003, 2002 and 2001:
| | 2003 | 2002 | 2001 | |||||||
|---|---|---|---|---|---|---|---|---|---|---|
| Service cost | $ | 72 | $ | 64 | $ | 44 | ||||
| Interest cost on projected benefit obligation | 3,938 | 8,249 | 7,884 | |||||||
| Amortization of prior service cost | (8,552 | ) | (3,294 | ) | (8,923 | ) | ||||
| Recognized actuarial gain | (122 | ) | (1 | ) | (523 | ) | ||||
| Settlement/curtailment gain | — | — | (487 | ) | ||||||
| Net postretirement (benefit) expense | $ | (4,664 | ) | $ | 5,018 | $ | (2,005 | ) | ||
F-34
The weighted average rates used to determine net postretirement (benefit) expense for the Company were as follows:
| | 2003 | 2002 | 2001 | ||||
|---|---|---|---|---|---|---|---|
| Discount rate | 6.5 | % | 7.3 | % | 7.7 | % |
Following are the assumed health care cost trend rates at December 31, which are no longer significant due to the 2003 plan amendment.
| | 2003 | 2002 | |||
|---|---|---|---|---|---|
| Health care cost trend rate assumed for next year—pre-age 65 | 5.25 | % | 5.25 | % | |
| Health care cost trend rate assumed for next year—post-age 65 | 7.75 | % | 8.25 | % | |
| Rate to which the cost trend rate is assumed to decline (the ultimate trend rate) | 5.25 | % | 5.25 | % | |
| Year that the rate reaches the ultimate trend rate | 2008 | 2008 |
A one-percentage-point change in the assumed health care cost trend rates would not have a material impact on the Company.
| | 1% increase | 1% decrease | |||||
|---|---|---|---|---|---|---|---|
| Effect on total service cost and interest cost components | $ | 9 | $ | (10 | ) | ||
| Effect on postretirement benefit obligation | 145 | (150 | ) | ||||
Also included in the Consolidated Balance Sheets at December 31, 2003 and 2002 are other postemployment benefit obligations of $5,879 and $6,065, respectively.
14. Shareholders' Deficit
Common Stock and Warrants
The Company has 200,895,628 shares of $0.01 par value common stock issued and outstanding and 300,000,000 shares authorized. At December 31, 2003, management held a total of 1,920,634 common shares of the Company, including 1,587,301 shares of restricted stock granted during 2002, which become unrestricted on the third anniversary of the grant date. During 2002, the Company sold 333,333 shares to management at the estimated fair value of $2.25 per share. In 2002, the Company repurchased shares and retired warrants at amounts greater than fair market value and recognized compensation expense of $487.
Preferred Stock
The Company is authorized to issue up to 100,000,000 shares of Series A Preferred Stock. There were no shares outstanding in 2003 or 2002, and the Company currently has no plans to issue Preferred shares. In 2001, the Company had 24,574,751 shares of Preferred Stock issued to BHI. Each share had a liquidation preference of $25.00 and was entitled to cumulative dividends at an annual rate of 12% payable quarterly in arrears. BHI contributed all of the outstanding Preferred Stock of $620,922, including accumulated dividends of $6,553 to the Company as a capital contribution in 2001 (see Note 3). During 2001, the Company declared preferred stock cash dividends of $61,846.
F-35
Other Shareholders' Equity
There were no common stock dividends declared in 2003 and 2002. The Company declared common stock cash dividends of $36,434 in 2001. The dividends were recorded as a charge to Paid-in capital to reflect a return of capital to BHI.
At December 31, 2003, the Company held $404,817 of notes receivable from BHI, which accrue interest at 12% per year, payable quarterly, and mature on September 29, 2005. The notes were received from affiliates as proceeds from the 1996 sales of businesses and options to purchase businesses formerly owned by the Company. The Receivable from parent, reflected as a reduction in the Consolidated Statements of Shareholders' Deficit, includes accrued interest of $107,277, $58,699 and $0 related to these notes receivable at December 31, 2003, 2002 and 2001. Paid-in capital includes the related net of tax interest income of $31,576, $38,154 and $24,674 for the years ended December 31, 2003, 2002 and 2001. In the Company's 2001 Annual Report on Form 10-K, the Company expressed its intention to cancel this note receivable; therefore; a valuation allowance was placed on the accrued interest at that date. During 2002, the Company decided to defer canceling the note, reversed this valuation allowance and resumed accruing the related interest. Historically, BHI funded the payment of the interest on the note through common dividends received from the Company. BHI has not made a payment on the accrued interest, nor has the Company paid an associated dividend, since October 15, 2001.
Deferred compensation expense of $3,571, related to the restricted shares granted in 2002, is being amortized over the three-year vesting period. At December 31, 2003, the unamortized deferred compensation was $1,488.
Capital Contributions
Following is a summary of capital contributions received by the Company during 2003, 2002 and 2001:
| | 2003 | 2002 | 2001 | ||||||
|---|---|---|---|---|---|---|---|---|---|
| Income tax benefits | $ | 17,002 | $ | 20,890 | $ | 21,038 | |||
| Non-compete agreement | 5,000 | — | — | ||||||
| Foods pension liability payment | 4,300 | — | — | ||||||
| Capital wind-down costs | — | 3,550 | — | ||||||
| Preferred stock and accumulated dividends | — | — | 620,922 | ||||||
| Cash contributions | — | — | 17,000 | ||||||
| $ | 26,302 | $ | 24,440 | $ | 658,960 | ||||
BHI contributed tax benefits to the Company of $17,002, $20,890 and $21,038 during 2003, 2002 and 2001, respectively. The Company is included in BHI's tax return, and the deductible interest expense on BHI's notes payable reduces the Company's tax liability.
BHI also made a $5,000 payment to the Company in 2003, relating to a non-compete agreement entered into by BHI with the third party purchaser of Consumer Adhesives, which was sold by BWHLLC in the fourth quarter of 2003. The Company does not currently market the product line disallowed under the agreement and has no plans to market such a product; therefore, there is no
F-36
impact on the Company's operations resulting from the non-compete agreement. This amount is reflected in Paid-in capital because BHI is a related party.
In the fourth quarter of 2003, Foods made a $4,300 payment to the Company related to the U.S. pension obligation retained upon the sale of Foods' operations. This payment is reflected as a credit to Paid-in capital because it is a related party transaction.
During 2002, the Company also recorded a capital contribution from BHI of $3,550 (net of tax) related to the allocation of Capital wind-down costs to the Company, which the Company had no responsibility to fund. See Note 3.
Other Equity Transactions
In 2001, the Company recorded a pre-tax gain on the Consumer Adhesives Sale of $132,275, which was recorded in Paid-in capital. In 2002, the Company sold its remaining investment of a $110,000 note receivable from Consumer Adhesives for face value plus accrued interest. In 2003, the Company recorded an adjustment of $5,925 in Paid-in capital to reflect additional tax expense associated with the sale of the $110,000 note receivable. See Note 1.
The Corporate Reorganization resulted in the issuance of shares of common stock of the Company and warrants to purchase common stock to certain management members, in exchange for the shares they held in BCHI. This resulted in an increase to Paid-in capital of $1,236 in 2001, the value of the minority interest liability that represented their previous interest in BCHI.
The Company recorded net of tax minimum pension liability adjustments of $5,830, $(17,075) and $(66,580) for 2003, 2002 and 2001, respectively, relating to underfunded pension plans, which is included in accumulated other comprehensive income.
15. Stock Option Plans and Other Stock Based Compensation
Stock Options
The Company accounts for stock-based compensation under APB No. 25 and has adopted the disclosure-only provisions of SFAS No. 123 "Accounting for Stock-Based Compensation." The Company has granted options under its Amended and Restated 1996 Stock Purchase and Option Plan for Key Employees (the "Option Plan").
F-37
Following is a summary of option activity for the three years ended December 31, 2003:
| | 2003 | 2002 | 2001 | |||||||||||||
|---|---|---|---|---|---|---|---|---|---|---|---|---|---|---|---|---|
| | Shares | Weighted Average Exercise Price | Shares | Weighted Average Exercise Price | Shares | Weighted Average Exercise Price | ||||||||||
| Options outstanding beginning of year | 3,426,040 | $ | 3.59 | 6,871,380 | $ | 4.38 | 4,382,500 | $ | 5.43 | |||||||
| Options exercised | — | — | — | — | — | — | ||||||||||
| Options granted | 3,457,500 | 2.00 | 1,492,000 | 2.25 | — | — | ||||||||||
| Option conversion | — | — | — | — | 4,451,880 | 4.38 | ||||||||||
| Options forfeited | (1,351,180 | ) | 4.30 | (4,937,340 | ) | 4.28 | (1,963,000 | ) | 5.09 | |||||||
| Options outstanding end of year | 5,532,360 | $ | 2.42 | 3,426,040 | $ | 3.59 | 6,871,380 | $ | 4.38 | |||||||
During the fourth quarter of 2003, 3,457,500 options were granted to key employees. The options ratably vest over five years, have an exercise price of $2.00 and were granted at their estimated fair value.
During 2002, 1,492,000 options were granted to key employees, including 1,176,000 performance options. The 2002 grant has an exercise price of $2.25 per share, based on estimated fair value. The performance options vest after the fifth anniversary of the grant date; however, vesting is accelerated upon the achievement of certain financial targets. As of December 31, 2003, none of these targets were achieved. The remaining options vest ratably over five years.
From 1996 through 1999, BCHI issued stock options and sold equity to key management under the Option Plan ("the BCHI option grants"). The BCHI option grants had exercise prices between $5.00 and $7.50, the estimated fair values at the grant dates, and vested over five years. The outstanding BCHI option grants became options of the Company effective with the Corporate Reorganization in 2001 (see Note 3). The conversion of the BCHI option grant provided BCHI management with equivalent intrinsic value in the Company at the new measurement date; therefore no compensation expense was recorded. The strike prices of the converted options ranged from $4.13 to $5.00, which exceeds estimated fair market value. During 2003, all of the $4.13 options were cancelled upon the repurchase of the related shares from management. There are 650,360 options outstanding from the converted BCHI option grant, all with a $5.00 strike price.
In accordance with FASB Interpretation No. 44, "Accounting for Certain Transactions involving Stock Compensation," options granted under the Option Plan after July 1, 2001 require variable accounting. The expense relating to these options for 2003 and 2002 was $230 and $14, respectively.
To determine proforma compensation cost for the Option Plan according to SFAS No. 123 (see Note 2), the fair value of each option grant is estimated on the date of grant using the Black-Scholes options pricing model with a risk-free weighted average interest rate of 2.91% for 2003 grants and 5.0% for 2002 grants and expected lives of five years for all grants. To determine compensation cost according to SFAS No. 123, the fair value of each option was estimated as of the measurement date using the Black-Scholes option-pricing model with a risk free weighted average interest rate of 4.37% and expected lives of five years.
F-38
As of December 31, 2003, there were 4,017,639 shares available for future grants.
At December 31, 2003, there were 583,488 options exercisable, with a range of exercise prices of $2.25 to $5.00, a weighted average exercise price of $4.70 and a weighted average remaining life of 3 years. At December 31, 2002, there were 1,472,824 options exercisable, with a range of exercise prices of $4.13 to $5.00, a weighted average exercise price of $4.51 and a weighted average remaining life of 4 years.
Unit Appreciation Rights
Certain current and former employees of the Company hold unit appreciation rights ("UARs") in BWHLLC granted by the Company during the years 1996 - 2000. The UARs have a ten-year life, and all outstanding UARs are fully vested. The UARs are accounted for under the liability method as prescribed by APB No. 25, and any compensation expense incurred in conjunction with the UARs will be reflected in the Statements of Operations for the Company. In 2003, 2002 and 2001, the Company did not record any compensation expense attributable to the UARs. There were 1,157,732 UARs outstanding at December 31, 2003 and no UARs available for future grants.
16. Derivative Financial Instruments
At December 31, 2003, the Company had derivative liabilities of $664 classified as other current liabilities and derivative gains of $341 classified as other assets. As of December 31, 2002, the Company had derivative liabilities of $402 classified as other current liabilities and derivative gains of $16 classified as other assets. On January 1, 2001, the Company adopted SFAS No. 133 resulting in a pre-tax charge of $5,200 to accumulated other comprehensive income, as discussed in Note 8.
Interest Rate Swaps
The Company uses interest rate swaps to alter interest rate exposures between fixed and floating rates on certain long-term debt. Under interest rate swaps, the Company agrees with other parties to exchange, at specified intervals, the difference between fixed rate and floating rate interest amounts calculated by reference to an agreed notional principal amount.
Effective December 1, 2003, the Company entered into a $34,000 interest rate swap agreement structured for the Parish of Ascension IRBs (see Note 10). Under this agreement, the Company receives a fixed rate of 10% and pays a variable rate equal to the 6-month LIBOR plus 630 basis points. This was the Company's only outstanding interest rate swap at December 31, 2003. The $24,286 swap outstanding at December 31, 2001 matured on December 1, 2002, and the Company realized a gain on the settlement of $1,722. The net impact of interest rate swaps was a decrease in the Company's interest expense of $62 in 2003 and an increase in interest expense of $2,566 and $2,215 in 2002 and 2001, respectively. The 2003 year-end fair value of the $34,000 interest rate swap was a loss of $483.
F-39
The following table summarizes the weighted average interest rates for the swaps used by the Company. Variable rates change with market conditions and may vary significantly in the future.
| | 2003 | 2002 | 2001 | ||||
|---|---|---|---|---|---|---|---|
| Average rate paid | 7.6 | % | 13.7 | % | 13.7 | % | |
| Average rate received | 10.0 | % | 1.9 | % | 4.5 | % |
Foreign Exchange
International operations account for a significant portion of the Company's revenue and operating income. It is the policy of the Company to reduce foreign currency cash flow exposure due to exchange rate fluctuations by hedging anticipated and firmly committed transactions wherever economically feasible. The Company enters into forward and option contracts to buy and sell foreign currencies only to reduce foreign exchange exposure and protect the U.S. dollar value of such transactions to the extent of the amount under contract. These contracts are designed to minimize the impact from foreign currency exchange on operating income and on certain balance sheet exposures.
Gains and losses arising from contracts are recognized on a quarterly basis through the Consolidated Statement of Operations (see Note 2). The Company does not hold or issue derivative financial instruments for trading purposes.
At December 31, 2003 and 2002, the Company had $44,300 and $60,079, respectively, of notional value of foreign currency exchange forward contracts outstanding. At December 31, 2003, the Company recorded a loss of $323 related to its foreign currency exchange forward contract outstanding. At December 31, 2002, the Company recorded a loss of $402 related to its foreign currency exchange forward contracts outstanding.
At December 31, 2003, the Company's forward position of $44,300 was to sell British Pounds for U.S. Dollars at a rate of 1.7710. At December 31, 2002, the Company had forward positions to sell British Pounds for U.S. Dollars ($36,916) and Canadian Dollars ($23,163). The unsecured contracts mature within three months and are placed with financial institutions with investment grade credit ratings. The Company is exposed to credit loss in the event of non-performance by the other parties to the contracts. The Company evaluates the credit worthiness of the counterparties' financial condition and does not expect default by the counterparties.
At December 31, 2003, the Company had put options totaling $12,000 to buy Canadian Dollars with U.S. Dollars. The options expire within three months at varying dates and have a contract rate of 1.3600. The Company also is a party to call options held by financial institutions totaling $12,000 to sell Canadian Dollars for U.S. Dollars. The options expire within three months at varying dates and have contract rates that vary from 1.3040 to 1.3095. At December 31, 2003, the Company recorded a loss of $163 related to these options.
Option and Commodity Future Contracts
The Company is exposed to price fluctuations associated with raw materials purchases, most significantly with methanol, phenol and urea. For these commodity raw materials, the Company has purchase contracts, with periodic price adjustment provisions. The Company also adds to customer
F-40
contracts selling price provisions that are indexed to publicly available indices for these commodity raw materials. The Board of Directors approves all commodity futures and commodity commitments.
Natural Gas Futures—The Company hedges a portion of natural gas purchases for North America. In March 2003, the Company entered into futures contracts with varying settlement dates through June 2004. The Company used futures contracts to hedge 69% of its 2003 North American natural gas usage. The contracts are settled for cash each month based on the closing market price on the last day the contract trades on the New York Mercantile Exchange. Obligations settled under these contracts totaled $4,866 and related losses were $224 in 2003. Remaining obligations outstanding under these contracts were $1,359 as of December 31, 2003.
The Company entered into similar futures contracts to hedge portions of its natural gas purchases in June 2001 with varying settlement dates through November 2002. Commitments settled under these contracts totaled $1,210 and $1,716 in 2002 and 2001, respectively, and related losses were $264 and $610 in 2002 and 2001, respectively. There were no remaining obligations under these contracts at December 31, 2002.
Gains and losses on commodity futures contracts are recognized each month as gas is used. Remaining obligations are marked to market on a quarterly basis. The Company recorded a gain of $11 at December 31, 2003 related to its natural gas futures contracts.
Natural Gas Commitments—In 2000, the Company entered into fixed rate, fixed quantity contracts to secure a portion of anticipated natural gas usage at certain of the Company's facilities. The contracts were entered into to partially hedge the Company's risk associated with natural gas price fluctuations in peak usage months through March 2003. Gas purchases under these contracts totaled $402, $671 and $853 in 2003, 2002 and 2001, respectively. These contracts covered approximately 75% of 2003 and 86% of 2002 natural gas usage during the periods of the contracts at those facilities. The Company had no natural gas commitments outstanding at December 31, 2003. The Company recorded a gain of $16 at December 31, 2002 for the difference between the fair value and carrying value of its remaining natural gas commitments.
17. Fair Value of Financial Instruments
The following table presents the carrying or notional amounts and fair values of the Company's financial instruments at December 31, 2003 and 2002. The fair value of a financial instrument is the estimated amount at which the instrument could be exchanged in a current transaction between willing parties, other than in a forced or liquidation sale. Fair values are determined from quoted market prices where available or based on other similar financial instruments.
The carrying amounts of cash and cash equivalents, accounts receivable, accounts payable and other accruals are considered reasonable estimates of their fair values. The carrying value of the loans payable to affiliates approximates fair values, as management believes the loans bear interest at market interest rates.
F-41
The following table includes the carrying and fair values of the Company's financial instruments.
| | 2003 | 2002 | |||||||||||
|---|---|---|---|---|---|---|---|---|---|---|---|---|---|
| | Carrying Amount | Fair Value | Carrying Amount | Fair Value | |||||||||
| Nonderivatives | |||||||||||||
| Liabilities | |||||||||||||
| Debt | $ | 538,133 | $ | 503,630 | $ | 526,066 | $ | 345,048 | |||||
| | Notional Amount | Fair Value Gain (Loss) | Notional Amount | Fair Value (Loss) Gain | ||||||||||
|---|---|---|---|---|---|---|---|---|---|---|---|---|---|---|
| Derivatives relating to: | ||||||||||||||
| Foreign currency contracts | $ | 44,300 | $ | (323 | ) | $ | 60,079 | $ | (402 | ) | ||||
| Interest rate swaps | 34,000 | (483 | ) | — | — | |||||||||
| Call options | 12,000 | (181 | ) | — | — | |||||||||
| Put options | 12,000 | 18 | — | — | ||||||||||
| Natural gas futures | 1,359 | 11 | — | — | ||||||||||
| Natural gas commitments | — | — | 402 | 16 | ||||||||||
18. Supplemental Information
| | 2003 | 2002 | 2001 | ||||||
|---|---|---|---|---|---|---|---|---|---|
| Depreciation | $ | 45,811 | $ | 46,392 | $ | 53,996 | |||
| Amortization | 1,508 | 1,555 | 5,365 | ||||||
| Research and Development | 17,998 | 19,879 | 21,210 | ||||||
19. Segment and Geographic Data
The Company consists of three reportable segments: North American Forest Products, North American Performance Resins Group and International. Consolidated results also include Corporate and other and Divested business, which are reported separately. The product lines included in the North American Forest Products segment are formaldehyde and forest product resins. The key business drivers in the North American Forest Products segment are housing starts, furniture demand, panel production capacity and chemical sector operating conditions. The North American Performance Resins Group includes oilfield, foundry and specialty resins. In the North American Performance Resins Group segment, the key business drivers are housing starts, auto builds, active gas drilling rigs and the general industrial sector. The International segment consists of operations in Europe, Latin America and Asia Pacific. Principal countries of operation are the U.K., Brazil, Australia and Malaysia. Product lines include formaldehyde, forest product and performance resins and consumer products. In the International segment, the key business drivers are export levels, panel production capacity, housing starts, furniture demand and the local political environment. Corporate and other represents general and administrative expenses and income and expenses related to liabilities retained from businesses sold in previous years. Divested business includes Melamine, which was impaired in 2001, closed in early 2002 and subsequently sold in 2003. Operating results subsequent to the closure date represent revenue from the sale of inventory.
F-42
Operating Segments:
Following is a comparison of net sales; sales by product line; depreciation and amortization; earnings before interest, taxes, depreciation and amortization adjusted for business realignment, impairments, non-operating income (expense) and certain other operating income (expense) items ("Adjusted EBITDA"); total assets and capital expenditures for the reportable business segments, Corporate and other and Divested business of the Company for the years ended December 31, 2003, 2002 and 2001. Adjusted EBITDA information is presented with the Company's segment disclosures because it is the measure used by the Company's chief operating decision maker to evaluate operating results and allocate capital resources:
Sales to Unaffiliated Customers:
| | 2003 | 2002 | 2001 | |||||||
|---|---|---|---|---|---|---|---|---|---|---|
| North American Forest Products | $ | 755,767 | $ | 634,619 | $ | 656,694 | ||||
| North American Performance Resins | 364,347 | 340,791 | 409,081 | |||||||
| International | 314,693 | 264,541 | 282,629 | |||||||
| Divested business | 6 | 7,934 | 23,737 | |||||||
| Total | $ | 1,434,813 | $ | 1,247,885 | $ | 1,372,141 | ||||
Sales by Product Line:
| | 2003 | 2002 | 2001 | |||||||
|---|---|---|---|---|---|---|---|---|---|---|
| Forest products resins | $ | 692,463 | $ | 586,852 | $ | 612,638 | ||||
| Formaldehyde | 242,774 | 185,102 | 189,111 | |||||||
| Specialty resins | 229,773 | 213,972 | 268,087 | |||||||
| Foundry resins | 137,481 | 143,419 | 140,088 | |||||||
| Oilfield products | 86,487 | 60,598 | 85,224 | |||||||
| International consumer products | 39,905 | 44,201 | 46,252 | |||||||
| Melamine | 6 | 7,934 | 23,737 | |||||||
| Other | 5,924 | 5,807 | 7,004 | |||||||
| Total | $ | 1,434,813 | $ | 1,247,885 | $ | 1,372,141 | ||||
Depreciation and Amortization Expense:
| | 2003 | 2002 | 2001 | |||||||
|---|---|---|---|---|---|---|---|---|---|---|
| North American Forest Products | $ | 19,953 | $ | 19,259 | $ | 19,950 | ||||
| North American Performance Resins | 10,209 | 9,929 | 11,314 | |||||||
| International | 11,089 | 10,305 | 11,766 | |||||||
| Corporate and other | 6,068 | 8,454 | 9,021 | |||||||
| Divested business | — | — | 7,310 | |||||||
| Total | $ | 47,319 | $ | 47,947 | $ | 59,361 | ||||
F-43
Adjusted EBITDA:
| | 2003 | 2002 | 2001 | ||||||||
|---|---|---|---|---|---|---|---|---|---|---|---|
| North American Forest Products | $ | 92,548 | $ | 92,918 | $ | 101,655 | |||||
| North American Performance Resins | 46,661 | 45,127 | 74,321 | ||||||||
| International | 32,250 | 28,630 | 17,595 | ||||||||
| Corporate and other | (43,713 | ) | (44,949 | ) | (54,356 | ) | |||||
| Total | $ | 127,746 | $ | 121,726 | $ | 139,215 | |||||
Total Assets at Year End:
| | 2003 | 2002 | 2001 | |||||||
|---|---|---|---|---|---|---|---|---|---|---|
| North American Forest Products | $ | 401,254 | $ | 329,574 | $ | 319,846 | ||||
| North American Performance Resins | 202,482 | 205,385 | 211,477 | |||||||
| International | 259,331 | 205,612 | 247,380 | |||||||
| Corporate and other | 130,799 | 270,976 | 329,280 | |||||||
| Divested business | — | 233 | 15,295 | |||||||
| Total | $ | 993,866 | $ | 1,011,780 | $ | 1,123,278 | ||||
Capital Expenditures:
| | 2003 | 2002 | 2001 | |||||||
|---|---|---|---|---|---|---|---|---|---|---|
| North American Forest Products | $ | 21,726 | $ | 17,322 | $ | 9,791 | ||||
| North American Performance Resins | 9,830 | 13,744 | 11,577 | |||||||
| International | 8,708 | 5,691 | 15,660 | |||||||
| Corporate and other | 1,556 | 2,016 | 5,016 | |||||||
| Divested business | — | — | 604 | |||||||
| Discontinued operations | — | — | 4,760 | |||||||
| Total | $ | 41,820 | $ | 38,773 | $ | 47,408 | ||||
F-44
The Company reports and manages its business through three operating segments which do cross geographic boundaries. The following tables reflect sales and long-lived assets by major geographic area:
Sales to Unaffiliated Customers:(1)
| | 2003 | 2002 | 2001 | |||||||
|---|---|---|---|---|---|---|---|---|---|---|
| United States | $ | 901,018 | $ | 812,667 | $ | 908,427 | ||||
| Canada | 219,460 | 170,967 | 252,047 | |||||||
| United Kingdom | 121,893 | 105,595 | 114,641 | |||||||
| Other International | 192,442 | 158,656 | 97,026 | |||||||
| Total | $ | 1,434,813 | $ | 1,247,885 | $ | 1,372,141 | ||||
- (1)
- For purposes of geographic disclosures, sales are attributed to the country in which individual business locations reside.
Long-Lived Assets:(2)
| | 2003 | 2002 | 2001 | |||||||
|---|---|---|---|---|---|---|---|---|---|---|
| United States | $ | 258,555 | $ | 276,514 | $ | 283,423 | ||||
| Canada | 63,109 | 51,042 | 60,744 | |||||||
| United Kingdom | 79,040 | 76,377 | 73,460 | |||||||
| Other International | 48,180 | 35,805 | 39,930 | |||||||
| Total | $ | 448,884 | $ | 439,738 | $ | 457,557 | ||||
- (2)
- Long-lived assets include property, plant and equipment, net of accumulated depreciation.
Reconciliation of Adjusted EBITDA to Income (Loss) from Continuing Operations Before Income Tax:
| | 2003 | 2002 | 2001 | |||||||
|---|---|---|---|---|---|---|---|---|---|---|
| Adjusted EBITDA | $ | 127,746 | $ | 121,726 | $ | 139,215 | ||||
| Depreciation and Amortization | (47,319 | ) | (47,947 | ) | (59,361 | ) | ||||
| Adjustments to EBITDA (described below) | (13,885 | ) | (40,071 | ) | (155,349 | ) | ||||
| Interest expense | (46,138 | ) | (47,315 | ) | (51,613 | ) | ||||
| Affiliated interest expense, net | (558 | ) | (1,402 | ) | (11,488 | ) | ||||
| Other non-operating (expense) income | (1,529 | ) | 5,989 | (1,841 | ) | |||||
| Investment write-down and other charges | — | — | (27,000 | ) | ||||||
| Income (loss) from continuing operations before income tax | $ | 18,317 | $ | (9,020 | ) | $ | (167,437 | ) | ||
F-45
Adjustments To EBITDA
The following items are not included in segment Adjusted EBITDA reviewed by the Company's chief operating decision maker to evaluate operating results and allocate capital resources:
| Year Ended December 31, 2003 | Plant Closure(1) | Severance | Impairment | Other | Total | ||||||||||||
|---|---|---|---|---|---|---|---|---|---|---|---|---|---|---|---|---|---|
| North American Forest Products | $ | (932 | ) | $ | (1,125 | ) | $ | — | $ | (90 | )(2) | $ | (2,147 | ) | |||
| North American Performance Resins | 94 | (397 | ) | (1,000 | )(3) | — | (1,303 | ) | |||||||||
| International | (7,720 | ) | (643 | ) | (2,183 | )(4) | 11,692 | (5) | 1,146 | ||||||||
| Corporate and other | (146 | ) | (4,672 | ) | — | (8,732 | )(2) | (13,550 | ) | ||||||||
| Divested business(6) | 1,716 | — | — | 253 | 1,969 | ||||||||||||
| Total | $ | (6,988 | ) | $ | (6,837 | ) | $ | (3,183 | ) | $ | 3,123 | $ | (13,885 | ) | |||
- (1)
- Plant closure costs include fixed asset write-offs, plant employee severance and demolition, environmental and other related costs.
- (2)
- Primarily represents a charge of $5,929 related to tentative legal settlements with BCPM Liquidating and BCP Liquidating (see Note 22) and severance expense included in general and administrative expense, incurred by the Company for positions to be replaced.
- (3)
- Represents a reduction in estimated net realizable value of a facility held for sale.
- (4)
- Represents fixed asset and goodwill impairments related to various international locations.
- (5)
- Represents a gain on the sale of land associated with a closed plant in the U.K.
- (6)
- Represents gains recognized related to the closure and subsequent sale of Melamine.
| Year Ended December 31, 2002 | Plant Closure(1) | Severance | Impairment | Other | Total | ||||||||||||
|---|---|---|---|---|---|---|---|---|---|---|---|---|---|---|---|---|---|
| North American Forest Products | $ | (1,107 | ) | $ | (250 | ) | $ | — | $ | — | $ | (1,357 | ) | ||||
| North American Performance Resins | (1,950 | ) | (102 | ) | (1,040 | )(2) | — | (3,092 | ) | ||||||||
| International | (2,844 | ) | (795 | ) | (5,275 | )(3) | 2,465 | (4) | (6,449 | ) | |||||||
| Corporate and other | — | (2,118 | ) | — | (19,850 | )(5) | (21,968 | ) | |||||||||
| Divested business(6) | (6,683 | ) | — | — | (522 | ) | (7,205 | ) | |||||||||
| Total | $ | (12,584 | ) | $ | (3,265 | ) | $ | (6,315 | ) | $ | (17,907 | ) | $ | (40,071 | ) | ||
- (1)
- Plant closure costs include fixed asset write-offs, plant employee severance and demolition, environmental and other related costs.
- (2)
- Represents a reduction in estimated net realizable value of a facility held for sale.
- (3)
- Represents fixed asset impairments at various international manufacturing facilities.
- (4)
- Represents a gain on the sale of land associated with a closed plant in Spain.
- (5)
- Primarily represents a pension settlement charge of $13,600, included in general and administrative expense, and an additional management fee of $5,500 related to the wind down of Capital, included in other operating expense.
F-46
- (6)
- Represents expenses incurred related to the closure of Melamine.
| Year Ended December 31, 2001 | Plant Closure(1) | Severance | Impairment | Other | Total | ||||||||||||
|---|---|---|---|---|---|---|---|---|---|---|---|---|---|---|---|---|---|
| North American Forest Products | $ | (6,573 | ) | $ | (2,080 | ) | $ | — | $ | 10,507 | (2) | $ | 1,854 | ||||
| North American Performance Resins | 2,433 | (2,632 | ) | (2,885 | )(3) | — | (3,084 | ) | |||||||||
| International | (20,020 | ) | (179 | ) | — | (2,303 | )(4) | (22,502 | ) | ||||||||
| Corporate and other | 875 | (7,691 | ) | — | (37,202 | )(5) | (44,018 | ) | |||||||||
| Divested business | — | — | (98,163 | )(6) | 10,564 | (7) | (87,599 | ) | |||||||||
| Total | $ | (23,285 | ) | $ | (12,582 | ) | $ | (101,048 | ) | $ | (18,434 | ) | $ | (155,349 | ) | ||
- (1)
- Plant closure costs include fixed asset write-offs, plant employee severance and demolition, environmental, and other related costs.
- (2)
- Represents a gain on the sale of land associated with a closed domestic plant.
- (3)
- Represents a charge related to a plant facility for which construction was discontinued in 2001.
- (4)
- Represents a loss incurred on the divestiture of the Company's operations in Ecuador.
- (5)
- Primarily represents a charge for environmental remediation of $19,028 related to a formerly owned business and a pension settlement charge of $15,813.
- (6)
- Represents a charge related to the shut-down of Melamine including the write-down of fixed assets ($62,527), spare parts ($2,935) and goodwill ($32,701).
- (7)
- Represents earnings generated by Melamine, which was closed in 2002.
20. Related Party Transactions
Financing and Investing Arrangements
The Company and HAI had separate borrowing arrangements with Foods, evidenced by demand promissory notes bearing interest at variable rates. These loans are reported as Loans payable to affiliates on the Consolidated Balance Sheets and totaled $18,260 and $84,680 at December 31, 2003 and 2002, respectively. Following the termination of the Company's uncommitted LOC facility in 2003 (see Note 10), the Company (excluding HAI) is limited to borrowing up to $30,000 from affiliates. Of the total loans outstanding, $12,260 and $84,680 was owed by the Company at each respective year-end. HAI owed $6,000 at December 31, 2003 and had $4,000 available for additional borrowings. Interest rates ranged from 1.0% to 4.75%, and interest expense totaled $558, $1,857 and $9,460 for the years ended December 31, 2003, 2002 and 2001, respectively. In early 2004, the Company entered into a similar borrowing agreement with BWHLLC and cancelled its arrangement with Foods. In early 2004, HAI obtained a $20,000 credit facility with an external bank and terminated its affiliated borrowing arrangement (see Note 10).
The Company holds a $404,817 note receivable ($512,094 including accrued interest) from BHI, which is accounted for as a reduction of equity. The Company accrues interest quarterly on the note receivable in Paid-in capital. Historically, BHI funded the interest due on the note through common dividends received from the Company. However, quarterly interest has not been paid, nor an associated dividend declared, since October 15, 2001. See Note 14.
F-47
The Company had a note payable to BCPM for $34,181 that was settled in the first quarter of 2002. The Company accrued $151 and $2,502 of interest expense for the years ended December 31, 2002 and 2001, respectively, related to this note. The Company settled in full this note payable by making cash payments of $31,581 and $2,600 of certain set-offs asserted by the Company against amounts due under this note. BCPM acknowledged the validity and enforceability of the set-offs. The Company waived the right to assert other set-offs, and BCPM and the Company exchanged mutual releases with respect to this note. A committee comprised solely of independent directors of BCPM, represented and advised by separate and independent counsel, reviewed and agreed to the above provisions.
At December 31, 2001, the Company had a $110,000 preferred stock investment in Consumer Adhesives. The preferred stock was redeemed in 2002 for a $110,000 note receivable from Consumer Adhesives which was subsequently sold to BHI for cash proceeds of $110,000 plus accrued interest of $455. In 2003, the Company recognized an income tax charge of $5,925 related to the sale of the note receivable to BHI. Consistent with the gain on the Consumer Adhesives Sale, this income tax charge was recorded in Paid-in capital due to the affiliated nature of the transaction.
As a guarantor of the Company's debt, Foods received an annual fee from the Company of $1,050 in 2001. Under the terms of the guarantee agreement between Foods and the Company, Foods was automatically released from its obligation to guarantee the payment of the Company's outstanding publicly-held debt upon Foods being released from its obligation to guarantee the payment of amounts due under the Company's $250,000 Credit Agreement that expired in 2002.
The Company also had net affiliate interest income relating to other affiliates of $474 for the year ended December 31, 2001.
Administrative Service, Management and Consulting Arrangements
Commencing in 2003, certain management, consulting and board services previously provided to the Company by Capital (see below) were assumed by the Company, while other such services were assumed by KKR. During the year ended December 31, 2003, the Company recorded $3,000 for the fixed fee due to KKR under this arrangement. During the year ended December 31, 2002, the Company recorded $9,000 for the management fee to Capital.
During 2002, Capital provided management, consulting and board services to the Company, and the Company provided certain administrative services to Capital. Capital charged the Company an annual fee of $9,000, payable quarterly in arrears, which represented the net amount of Capital's services less the Company's fee for providing administrative services to Capital. During 2002, BHI made a decision to cease the operations of Capital by the end of the first quarter of 2003. This decision resulted in the immediate recognition by Capital of incremental expenses and liabilities related primarily to severance and rent obligations. These incremental expenses are the legal obligation of Capital and will be funded by Capital. The Company's share of Capital's incremental costs was $5,500 and was recognized by the Company as an additional management fee in 2002. Since the Company was not responsible for settling these liabilities, the offset to the charge was recorded as a capital contribution of $3,550 (the liability net of tax) to the Company from BHI.
Prior to the Corporate Reorganization in 2001, KKR rendered management, consulting and board services to the Company for an annual fee of $10,000, payable quarterly in arrears. The 2001 fee
F-48
through the date of the Corporate Reorganization was $9,167. Effective with the Corporate Reorganization, Capital began providing services to the Company, as described above. Charges incurred for these services in 2001, subsequent to the Corporate Reorganization, were $750.
The Company incurred certain costs on Capital's behalf and was reimbursed by Capital for 100% of these costs. Included in accounts receivable from affiliates at December 31, 2002 was $2,298 for these expenses.
The Company provides administrative services to Foods. Fees received for these services totaled $50, $120 and $1,000 for the years ended December 31, 2003, 2002 and 2001, respectively. In addition, the Company pays certain costs on behalf of Foods and is reimbursed by Foods for 100% of these costs. Included in accounts receivable from affiliates at December 31, 2002 was $1,375 related to these costs.
The Company provides certain administrative services to BWHLLC and other affiliates under a service agreement commencing on January 1, 2003. During the year ended December 31, 2003, the Company charged BWHLLC $540 for such services.
In 2001, the Company rendered management, consulting and financial services to WKI for an annual fee of $2,500 based on WKI reaching certain operating criteria. In addition, WKI also reimbursed the Company for certain expenses paid on its behalf. In November 2001, Capital purchased the management fee receivable of $1,667 from the Company plus receivables for expenses paid on WKI's behalf in the amount of $1,927. Total fees received under this arrangement were $0 for 2001.
Other Transactions and Arrangements
The Company utilizes Willis Group Holdings, Ltd. ("Willis"), an entity controlled by KKR, as its insurance broker. As of December 31, 2003, and 2002, the Company had paid $429 and $241, respectively, to Willis for their services.
Capital contributions to the Company totaled $26,302, $24,440 and $658,960 for the years ended December 31, 2003, 2002 and 2001, respectively (see Note 14).
The Company and Consumer Adhesives were parties to a tax sharing agreement for periods prior to the Consumer Adhesives Sale. Under this agreement, Consumer Adhesives paid income taxes to the Company as if Consumer Adhesives filed stand-alone Federal and state income tax returns. At December 31, 2002, Consumer Adhesives had no remaining liability to the Company for any unpaid Federal or state income tax.
During 2001, the Company received payment of $11,802 from Foods for its calculated portion of the Company's net pension liability. In the fourth quarter of 2001, the Company received $12,302 from Foods to assume the liability for payment of claims made under essentially all of Foods' employee benefit plans.
The Corporate Reorganization included certain financial transactions between the Company and BHI (see Note 3).
F-49
21. Guarantees and Indemnifications
Standard Guarantees / Indemnifications
In the ordinary course of business, the Company enters into numerous agreements that contain standard guarantees and indemnities whereby the Company indemnifies another party for, among other things, breaches of representations and warranties. Such guarantees or indemnifications are granted under various agreements, including those governing (i) purchases and sales of assets or businesses, (ii) leases of real property, (iii) licenses of intellectual property and (iv) long-term supply agreements. The guarantees or indemnifications issued are for the benefit of the (i) buyers in sale agreements and sellers in purchase agreements, (ii) landlords or lessors in lease contracts, (iii) licensors or licensees in license agreements and (iv) vendors or customers in long-term supply agreements.
These parties may also be indemnified against any third party claim resulting from the transaction that is contemplated in the underlying agreement. Additionally, in connection with the sale of assets and the divestiture of businesses, the Company may agree to indemnify the buyer with respect to liabilities related to the pre-closing operations of the assets or businesses sold. Indemnities related to pre-closing operations generally include tax liabilities, environmental liabilities and employee benefit liabilities not assumed by the buyer in the transaction.
Indemnities related to the pre-closing operations of sold assets normally do not represent additional liabilities to the Company, but simply serve to protect the buyer from potential liability associated with the Company's existing obligations at the time of sale. As with any liability, the Company has accrued for those pre-closing obligations that are considered probable and reasonably estimable. Amounts recorded are not significant at December 31, 2003.
While some of these guarantees extend only for the duration of the underlying agreement, many survive the expiration of the term of the agreement or extend into perpetuity (unless subject to a legal statute of limitations). With respect to certain of the aforementioned guarantees, the Company has limited reimbursement agreements from affiliates or maintains limited insurance coverage that mitigates potential payments to be made. There are no specific limitations on the maximum potential amount of future payments that the Company could be required to make under these guarantees nor is the Company able to develop an estimate of the maximum potential amount of future payments to be made under these guarantees as the triggering events are not predictable.
In addition the Company has agreed to indemnify KKR for any claims resulting from its services to the Company and its affiliates. The indemnification does not expire and the Company is not able to determine a maximum exposure under the agreement. However, the Company does have an indemnification agreement from BHI for any amounts that it must pay under the KKR indemnity relating to WKI.
The Company has not entered into any significant agreement subsequent to January 1, 2003 that would require it, as a guarantor, to recognize a liability for the fair value of obligations it has undertaken in issuing the guarantee.
Subsidiary Guarantees
The Company guarantees the bank debt of one of its Brazilian subsidiaries at Banco Itau S.A. up to a maximum U.S. equivalent of $6,700. In addition, the Company guarantees the open payables of certain subsidiaries related to the purchase of raw materials.
F-50
In connection with the conversion of the $34,000 Parish of Ascension IRBs to a fixed rate, the Company's Canadian and U.K. subsidiaries have guaranteed the Company's IRBs.
Contingent Purchase Consideration
The Fentak acquisition agreement includes a contingent purchase consideration provision based on achievement of certain targeted earnings before interest and taxes. Maximum annual payments are AU$600 for the period 2004-2006.
In connection with the acquisition of assets from SEACO, the Company agreed to pay a royalty fee to the seller based on sales levels to existing regular customers of the business as of the closing date. To the extent that annual sales exceed targeted levels, the Company is obligated to pay up to $300 per year, for a five-year period.
Warranties
The Company does not make express warranties on its products, other than that they comply with the Company's specifications; therefore, the Company does not record a warranty liability. Adjustments for product quality claims are not material and are charged against sales revenues.
22. Commitments and Contingencies
Environmental Matters
Because the Company's operations involve the use, handling, processing, storage, transportation and disposal of hazardous materials, the Company is subject to extensive environmental regulation at the Federal and state level and is exposed to the risk of claims for environmental remediation or restoration. In addition, violations of environmental laws or permits may result in restrictions being imposed on operating activities, substantial fines, penalties, damages or other costs, any of which could have a material adverse effect on the Company's business, financial condition, results of operations or cash flows.
Accruals for environmental matters are recorded following the guidelines of Statement of Position 96-1, "Environmental Remediation Liabilities," when it is probable that a liability has been incurred and the amount of the liability can be estimated. Environmental accruals are reviewed on an interim basis and as events and developments warrant. Based on management's estimates, which are determined through historical experience and consultation with outside experts, the Company has recorded liabilities, relating to 55 locations, of approximately $38,600 and $44,000 at December 31, 2003 and 2002, respectively, for all probable environmental remediation, indemnification and restoration liabilities. These amounts include estimates of unasserted claims the Company believes are probable of loss and reasonably estimable. Based on the factors discussed below and currently available information and analysis, the Company believes that it is reasonably possible that costs associated with such sites may fall within a range of $24,200 to $73,600, in the aggregate, at December 31, 2003. This estimate of the range of reasonably possible costs is less certain than the estimates upon which the liabilities are based, and in order to establish the upper end of such range, assumptions less favorable to the Company among the range of reasonably possible outcomes were used. As with any estimate, if facts or circumstances change, the final outcome could differ materially from these estimates. The Company has not taken into consideration insurance coverage or any anticipated recoveries from other
F-51
third parties in determining the liability or range of possible outcomes. The Company's current insurance coverage provides very limited, if any, coverage for environmental matters.
Following is a more detailed discussion of the Company's environmental liabilities and related assumptions:
BCP Geismar Site—The Company formerly owned a basic chemicals and polyvinyl chloride business which was taken public as Borden Chemicals and Plastics Operating Limited Partnership ("BCPOLP") in 1987. The Company retained a 1% interest and the general partner interest, which were held by its subsidiary, BCPM. The Company also retained the liability for certain environmental matters after BCPOLP's formation. Under a Settlement Agreement approved by the United States Bankruptcy Court for the District of Delaware among the Company, BCPOLP, BCPM, the United States Environmental Protection Agency and the Louisiana Department of Environmental Quality, the Company agreed to perform certain of BCPOLP's obligations with respect to environmental conditions at BCPOLP's Geismar, Louisiana site. These obligations are related to soil and groundwater contamination at the Geismar site. The Company bears the sole responsibility for these obligations, as there are no other potentially responsible parties ("PRPs") or third parties from which the Company can seek reimbursement, and no additional insurance recoveries are expected.
A groundwater pump and treat system for the removal of contaminants is operational, and preliminary natural attenuation studies are proceeding. The Company has performed extensive soil and groundwater testing. Regulatory agencies are reviewing the current findings and remediation efforts. If closure procedures and remediation systems prove inadequate, or if additional contamination is discovered, this could result in the costs approaching the higher end of the range of possible outcomes discussed below.
The Company has recorded a liability of approximately $21,600 and $25,300 at December 31, 2003 and 2002, respectively, related to the BCP Geismar site. Based on currently available information and analysis, the Company believes that it is reasonably possible that costs associated with this site may fall within a range of $13,500 to $33,100, depending upon the factors discussed above. Due to the long-term nature of the project, the reliability of timing and estimability of remediation payments, this liability was recorded at its net present value, assuming a 3% discount rate and a time period of thirty years and the range of possible outcomes is discounted similarly. The undiscounted liability is approximately $33,400 over thirty years.
F-52
Following are expected payments for each of the next five years, and a reconciliation of the expected aggregate payments to the liability reflected at December 31, 2003:
| 2004 | $ | 2,500 | ||
| 2005 | 1,100 | |||
| 2006 | 1,700 | |||
| 2007 | 1,500 | |||
| 2008 | 700 | |||
| Remaining aggregate payments | 25,900 | |||
| Total undiscounted liability | 33,400 | |||
| Less: discount to net present value | (11,800 | ) | ||
| Liability per Consolidated Balance Sheet | $ | 21,600 | ||
Superfund Sites / Offsite Landfills—The Company is currently involved in environmental remediation activities at 25 sites in which it has been notified that it is, or may be, a PRP under the United States Comprehensive Environmental Response, Compensation and Liability Act ("CERCLA") or similar state "superfund" laws. The Company has recorded liabilities of approximately $7,600 and $7,000 at December 31, 2003 and 2002, respectively, related to these sites. The Company anticipates approximately half of this liability will be paid within the next five years, with the remaining payments occurring over the next twenty-five years. The Company generally does not bear a significant level of responsibility for these sites, and therefore, has little control over the costs and timing of cash flows. At 16 sites, the Company's share is less than 1%. At the remaining 9 sites, the Company has a share of up to 8.8% of the total liability which accounts for $6,400 and $5,700 of the total amount reserved for superfund / offsite landfill sites at December 31, 2003 and 2002, respectively. Based on currently available information and analysis, the Company believes that it is reasonably possible that costs associated with such sites may be as low as $4,700 or as high as $15,600, in the aggregate. In estimating both its current reserves for environmental remediation at these sites and the possible range of additional costs, the Company has not assumed that it will bear the entire cost of remediation of every site to the exclusion of other known PRPs who may be jointly and severally liable. The Company has limited information to assess the viability of other PRPs and their probable contribution on a per site basis. The range of possible outcomes also takes into account the maturity of each project, which results in a more narrow range as the project progresses. The Company's ultimate liability will depend on many factors including its volumetric share of waste, the financial viability of other PRPs, the remediation methods and technology used and the amount of time necessary to accomplish remediation.
Sites Under Current Ownership—The Company is conducting environmental remediation at 7 locations currently owned by the Company, of which 4 sites are no longer operating. There are no other parties responsible for remediation at these sites. Much of the remediation is being performed by the Company on a voluntary basis; therefore, the Company has greater control over the costs to be incurred and the timing of cash flows. The Company has accrued approximately $5,200 and $4,700 at December 31, 2003 and 2002, respectively, for remediation and restoration liabilities at these locations. The Company anticipates approximately $3,100 of these liabilities will be paid within the next three years, with the remaining amounts being paid over the next ten years.
F-53
Approximately $3,500 of these reserves is included in the Company's business realignment reserve, as the environmental clean up is being handled in conjunction with planned closure of the location (see Note 6). Based on currently available information and analysis, the Company believes that it is reasonably possible that costs associated with such sites may fall within a range of $3,500 to $13,500, in the aggregate. The factors influencing the ultimate outcome include the methods of remediation to be elected, the conclusions and assessment of site studies remaining to be completed and the time period required to complete the work.
Other Sites—The Company is conducting environmental remediation at 10 locations formerly owned by the Company. The Company has accrued approximately $2,400 and $5,300 at December 31, 2003 and 2002, respectively, for remediation and restoration liabilities at these locations. The Company anticipates cash outflows of approximately $2,000 within the next three years, with the remainder occurring over the next ten years. Based on currently available information and analysis, the Company believes that it is reasonably possible that costs associated with such sites may fall within a range of $1,700 to $9,100, in the aggregate. The primary drivers in determining the final costs to the Company on these matters are the method of remediation selected and the level of participation of third parties.
In addition, the Company is responsible for 11 sites that require monitoring where no additional remediation is expected and has also established accruals for other related costs, such as fines and penalties. The Company has accrued approximately $1,800 and $1,700 at December 31, 2003 and 2002, respectively, related to these sites. Payment of these liabilities is anticipated to occur over the next ten years. Based on currently available information and analysis, the Company believes that it is reasonably possible that costs associated with such sites may fall within a range of $800 and $2,300, in the aggregate. The ultimate cost to the Company will be influenced by any variations in projected monitoring periods or by findings that are better or worse than anticipated findings.
From the late 1960's until 1980, the Company operated a phosphate processing site on leased property in Manatee County, Florida. In 1980, the Company sold these operations. The Company and another former owner have each received a demand for $112 from the U.S. Environmental Protection Agency relating to oversight costs incurred when the site was abandoned by its current owner, and the Company is disputing the charge. The Company is aware that state and Federal environmental agencies have taken measures to prevent the off-site release of water from rainfall that accumulated in the drainage ditches and lagoons surrounding the gypsum piles located on the site. At this time, although it is reasonably possible some costs could be incurred related to this site, the Company has inadequate information to enable it to estimate a potential range of liability relating to this site.
Non-Environmental Legal Matters
Following is a discussion of non-environmental legal proceedings that are not in the ordinary course of business:
Imperial Home Décor Group—In 1998, pursuant to a merger and recapitalization transaction sponsored by The Blackstone Group ("Blackstone") and financed by Chase Manhattan Bank ("Chase"), Borden Decorative Products Holdings, Inc. ("BDPH"), a wholly owned subsidiary of the Company, was acquired by Blackstone and subsequently merged with Imperial Wallcoverings to create Imperial Home Décor Group ("IHDG"). Blackstone provided $84,500 in equity, and Chase
F-54
provided $295,000 in senior financing. The Company received approximately $314,400 in cash and 11% of IHDG common stock for its interest in BDPH. On January 5, 2000, IHDG filed for reorganization under Chapter 11 of the U. S. Bankruptcy Code. The IHDG Litigation Trust (the "Trust") was created pursuant to the plan of reorganization in the IHDG bankruptcy to pursue preference and other avoidance claims on behalf of the unsecured creditors of IHDG. In November 2001, the Trust filed a lawsuit against the Company and certain of its affiliates seeking to have the IHDG recapitalization transaction voided as a fraudulent conveyance and asking for a judgment to be entered against the Company for $314,400 plus interest, costs and attorney fees. Discovery is proceeding in the case with a cut-off currently scheduled for November 2004. The parties are discussing alternatives to litigation.
The Company has accrued legal expenses for scheduled depositions related to this matter. To the extent that additional depositions or legal work is required, legal defense costs will increase. The Company has not recorded a liability for any potential losses because a loss is not considered probable based on current information. The Company believes it has strong defenses to the Trust's allegations and intends to defend the case vigorously if a satisfactory alternative to litigation is not reached. While it is reasonably possible the resolution of this matter may result in a loss to the Company, due to the many variables involved, management is not able to estimate the range of possible outcomes at this time.
Subsidiary Bankruptcy—The Company's former subsidiary, BCPM, filed for protection under Chapter 11 of the United States Bankruptcy Code, in the United States Bankruptcy Court for the District of Delaware on March 22, 2002. BCPM served as the general partner and held a 1% interest in BCPOLP, which was created in November 1987 and operated as a commodity chemicals producer. On April 3, 2001, BCPOLP filed for protection under Chapter 11 of the United States Bankruptcy Code, in the United States Bankruptcy Court for the District of Delaware. On February 5, 2003, the U.S. Bankruptcy Court approved a Joint Plan of Liquidation for BCPOLP and BCPM which provided for the transfer of the remaining assets of both entities, including preference, avoidance and other claims against third parties (including the Company) to separate liquidating entities for liquidation and distribution to their creditors. The transfer of the remaining assets of both entities to the liquidating agents was effective March 13, 2003. The Company's ownership interest in BCPM was extinguished, and no distributions from BCPM to the Company are anticipated.
On March 19, 2004, BCPM Liquidating LLC ("BCPM Liquidating"), the successor in interest to BCPM, and the Company reached a tentative agreement providing for the settlement of all claims for a payment by the Company of $6,000. The Company has entered into an Agreement with BCPM Liquidating extending the period within which either party may file claims against the other until May 14, 2004, during which period the terms of the settlement agreement will be finalized and submitted to the bankruptcy court for approval.
In addition, on March 19, 2004, the Company and BCP Liquidating LLC ("BCP Liquidating"), the successor in interest to BCP, also reached a tentative agreement providing for the settlement of all claims for a payment by the Company of $1,050. The Company has entered into an Agreement with BCP Liquidating extending the period within which either party may file claims against the other until June 15, 2004, during which period the terms of the settlement agreement will be finalized and submitted to the bankruptcy court for approval.
F-55
The Company recorded expense of $5,929 in other operating expense at December 31, 2003 relating to these settlements. No assurance can be given that these settlements will be finalized and approved, and absent such approval, these and other claims could be filed against the Company.
Brazil Tax Claim—In 1992, the State of Sao Paolo Tax Bureau issued an assessment against the Company's primary Brazilian subsidiary claiming that excise taxes were owed on certain intercompany loans made for centralized cash management purposes, characterized by the Tax Bureau as intercompany sales. Since that time, management and the Tax Bureau have held discussions, and the subsidiary has filed an administrative appeal seeking cancellation of the assessment. In December 2001, the Administrative Court upheld the assessment in the amount of R$52,000, or approximately US$18,000, including tax, penalties, monetary correction and interest. In September 2002, the subsidiary filed a second appeal with the highest level administrative court, again seeking cancellation of the assessment. The Company believes it has a strong defense against the assessment and will pursue the appeal vigorously; however, no assurance can be given that the assessment will not be upheld. At this time the Company does not believe a loss is probable; therefore, only related legal fees have been accrued. Reasonably possible losses to the Company on the resolution of this matter range from zero to $18,000.
HAI Grand Jury Investigation—HAI, a joint venture in which the Company has a 75% interest, received a grand jury subpoena dated November 5, 2003 from the U.S. Department of Justice Antitrust Division relating to a Foundry Resins Grand Jury investigation. HAI has provided documentation in response to the subpoena, is cooperating with the Department of Justice and has heard nothing further.
In addition to this discussion of specific non-environmental legal matters, the Company is involved in various product liability, commercial and employment litigation and other legal proceedings which are considered to be in the ordinary course of the Company's business. There has been increased publicity about asbestos liabilities faced by manufacturing companies. As a result of the bankruptcies of many asbestos producers, plaintiff's attorneys are increasing their focus on peripheral defendants, including the Company. The Company does not believe it has a material asbestos exposure and believes it has adequate reserves and insurance. The Company has reserved approximately $24,000 and $10,800 at December 31, 2003 and 2002, respectively, relating to all non-environmental legal matters for legal defense and settlement costs that it believes are probable and estimable at this time.
F-56
23. Quarterly Financial Data (Unaudited)
The following represents Quarterly Financial Data for the Company:
| 2003 Quarters | First | Second | Third | Fourth | |||||||||
|---|---|---|---|---|---|---|---|---|---|---|---|---|---|
| Net sales | $ | 349,288 | $ | 370,763 | $ | 358,281 | $ | 356,481 | |||||
| Gross margin | 65,834 | 72,749 | 74,390 | 73,321 | |||||||||
| Business realignment expense (income) & impairments | 1,296 | 125 | (8,806 | ) | 12,133 | ||||||||
| (Loss) income from continuing operations | (3,405 | ) | 20,150 | 11,053 | (4,822 | ) | |||||||
| Net (loss) income | (3,405 | ) | 20,150 | 11,053 | (4,822 | ) | |||||||
| Net (loss) income applicable to common stock | (3,405 | ) | 20,150 | 11,053 | (4,822 | ) | |||||||
Basic and diluted, per share of common stock: | |||||||||||||
| (Loss) income from continuing operations | $ | (0.02 | ) | $ | 0.10 | $ | 0.06 | $ | (0.02 | ) | |||
| Net (loss) income applicable to common stock—basic and dilutive | $ | (0.02 | ) | $ | 0.10 | $ | 0.06 | $ | (0.02 | ) | |||
| Average number of common shares outstanding—basic | 200,903 | 200,896 | 200,896 | 200,896 | |||||||||
| Average number of common shares outstanding—dilutive | 200,903 | 200,896 | 200,947 | 200,973 | |||||||||
| 2002 Quarters | First(1) | Second | Third | Fourth | |||||||||
|---|---|---|---|---|---|---|---|---|---|---|---|---|---|
| Net sales | $ | 296,091 | $ | 309,567 | $ | 327,187 | $ | 315,040 | |||||
| Gross margin | 73,620 | 73,177 | 69,854 | 62,577 | |||||||||
| Business realignment expense and impairments | 4,659 | 5,401 | 2,082 | 7,557 | |||||||||
| (Loss) income from continuing operations | (1,887 | ) | 2,698 | 3,234 | (10,803 | ) | |||||||
| Net (loss) income | (31,712 | ) | 2,698 | 3,234 | (10,803 | ) | |||||||
| Net (loss) income applicable to common stock | (31,712 | ) | 2,698 | 3,234 | (10,803 | ) | |||||||
Basic and diluted, per share of common stock: | |||||||||||||
| (Loss) income from continuing operations | $ | (0.01 | ) | $ | 0.01 | $ | 0.02 | $ | (0.05 | ) | |||
| Net (loss) income applicable to common stock—basic and dilutive | $ | (0.16 | ) | $ | 0.01 | $ | 0.02 | $ | (0.05 | ) | |||
| Average number of common shares outstanding—basic | 199,422 | 200,684 | 201,004 | 200,973 | |||||||||
| Average number of common shares outstanding—dilutive | 199,422 | 200,687 | 201,017 | 200,973 | |||||||||
- (1)
- As described in Note 6, the Company recorded an impairment charge of $29,825 in the first quarter to write-off the carrying amount of its European business unit's goodwill as of January 1, 2002. There was no tax benefit recognized in conjunction with the impairment charge.
F-57
PART II
INFORMATION NOT REQUIRED IN PROSPECTUS
ITEM 13. OTHER EXPENSES OF ISSUANCE AND DISTRIBUTION
The following table sets forth the expenses payable by the Registrant in connection with the issuance and distribution of the ordinary shares being registered hereby. All of such expenses are estimates, other than the filing and quotation fees payable to the Securities and Exchange Commission, the National Association of Securities Dealers, Inc. and The New York Stock Exchange.
| SEC Registration Fee | $ | ||
| Printing and Engraving Expenses | |||
| Legal Fees | |||
| Accounting Fees | |||
| New York Stock Exchange Listing Fees | |||
| NASD Filing Fee | |||
| Miscellaneous | |||
| Total | $ | ||
ITEM 14. INDEMNIFICATION OF DIRECTORS AND OFFICERS
The New Jersey Business Corporation Act provides that a New Jersey corporation has the power to indemnify a director or officer against his or her expenses and liabilities in connection with any proceeding involving the director or officer by reason of his or her being or having been such a director or officer, other than a proceeding by or in the right of the corporation, if such a director or officer acted in good faith and in a manner he or she reasonably believed to be in or not opposed to the best interests of the corporation; and with respect to any criminal proceeding, such director or officer had no reasonable cause to believe his or her conduct was unlawful.
The indemnification and advancement of expenses shall not exclude any other rights, including the right to be indemnified against liabilities and expenses incurred in proceedings by or in the right of the corporation, to which a director or officer may be entitled under a certificate of incorporation, by-law, agreement, vote of shareholders, or otherwise; provided that no indemnification shall be made to or on behalf of a director or officer if a judgment or other final adjudication adverse to the director or officer establishes that his or her acts or omissions (a) were in breach of his or her duty of loyalty to the corporation or its shareholders, (b) were not in good faith or involved a knowing violation of law, or (c) resulted in receipt by the director or officer of an improper personal benefit.
The registrant's Restated Certificate of Incorporation (filed as Exhibit 3.1) provides that every person who is or was a director or an officer of the corporation shall be indemnified by the corporation to the fullest extent allowed by law, including the indemnification permitted by New Jersey Business Corporation Act §14A:3-5(8), against all liabilities and expenses imposed upon or incurred by that person in connection with any proceeding in which that person may be made, or threatened to be made, a party, or in which that person may become involved by reason of that person being or having been a director or an officer of or of serving or having served in any capacity with any other enterprise at the request of the corporation, whether or not that person is a director or an officer or continues to serve the other enterprise at the time the liabilities or expenses are imposed or incurred. During the pendency of any such proceeding, the corporation shall, to the fullest extent permitted by law, promptly advance expenses that are incurred, from time to time, by a director or an officer in connection with the proceeding, subject to the receipt by the corporation of an undertaking as required by law.
II-1
In addition, the registrant has obtained liability insurance coverage for its directors and officers, which insures against liabilities that directors and officers may incur while acting in such capacities. These policies contain standard exclusions and endorsements.
ITEM 15. RECENT SALES OF UNREGISTERED SECURITIES
During the three years preceding the filing of this registration statement, we sold shares of and issued options for our common stock in the amounts, at the times, and for the amounts of consideration listed below, without registration under the Securities Act of 1933. Exemption from registration under the Securities Act for each of the following sales is claimed under Section 4(2) of the Securities Act, because each of the transactions was by the issuer and did not involve a public offering:
On March 25, 2002 the registrant sold 222,222 shares of common stock to President and Chief Executive Officer Craig O. Morrison at a price of $2.25 per share, and granted him options to purchase 210,667 shares of common stock at $2.25 per share, performance options to purchase 1,176,000 shares of common stock at $2.25 per share, and 1,058,201 shares of restricted common stock.
On June 9, 2002 the registrant sold 111,111 shares of common stock to Executive Vice President Joseph P. Bevilaqua at a price of $2.25 per share, and granted him options to purchase 105,333 shares of common stock at $2.25 per share, and 529,100 shares of restricted common stock.
II-2
ITEM 16. EXHIBITS AND FINANCIAL STATEMENT SCHEDULES
(a) Exhibits
| Exhibit Number | Description of Document | |
|---|---|---|
1.1 | * | Form of Underwriting Agreement |
3.1 | * | Restated Certificate of Incorporation of the registrant |
3.2 | * | Bylaws of the registrant |
4.1 | * | Form of Certificate of Common Stock |
4.2 | ** | Amended and Restated 1996 Stock Purchase and Option Plan for Key Employees of the registrant and Subsidiaries, dated September 2003 (incorporated by reference to Exhibit 4.3 to the Form S-8 filed on October 3, 2003, File No. 333-109490) |
4.3 | ** | Form of Management Stockholder's Agreement (incorporated by reference to Exhibit 4.4 to the Form S-8 filed on October 3, 2003, File No. 333-109490) |
4.4 | ** | Form of Non-Qualified Stock Option Agreement (incorporated by reference to Exhibit 4.5 to the Form S-8 filed on October 3, 2003, File No. 333-109490) |
4.5 | ** | Form of Sale Participation Agreement (incorporated by reference to Exhibit 4.6 to the Form S-8 filed on October 3, 2003, File No. 333-109490) |
4.6 | * | Registration Rights Agreement, dated January 1, 2002, among the registrant, Borden Holdings, Inc. and BDS Two, Inc. |
5.1 | * | Opinion of Connell Foley LLP |
10.1 | ** | Loan and Security Agreement, dated September 23, 2002, among the registrant, Borden Chemical Canada, Inc., Borden Chemical UK Limited, Borden Chemical GB Limited and Fleet Capital Corporation, as Lender and Agent for the other lenders thereto (incorporated by reference to Exhibit (10)(i) to the Form 10-Q filed on November 14, 2002, File No. 001-00071) |
10.2 | ** | Amended and Restated 1996 Unit Incentive Plan for Key Employees of the registrant and Associated Persons, dated as of December 31, 2000 (incorporated by reference to Exhibit (10)(vi) to the Form 10-K filed on April 2, 2001, File No. 001-00071) |
10.3 | ** | Amended and Restated Executive Supplemental Pension Plan, dated as of January, 1996 (incorporated by reference to Exhibit (10)(xiii) to the Form 10-K filed on March 31, 1999, File No. 001-00071) |
10.4 | * | Advisory Directors Plan |
10.5 | ** | Employment Agreement with William F. Stoll, Jr., dated June 6, 1996 (incorporated by reference to Exhibit (10)(vi) to the Form 10-Q filed on August 14, 1996, File No. 001-00071) |
10.6 | ** | Summary of Terms of Employment for Craig O. Morrison, revised January 4, 2002 (incorporated by reference to Exhibit (10)(i) to the Form 10-Q filed on May 14, File No. 001-00071) |
10.7 | ** | Summary Terms of Employment for Joseph P. Bevilaqua, dated January 7, 2002 (incorporated by reference to Exhibit (x)(d) to the Form 10-K filed on March 28, 2003, File No. 001-00071) |
II-3
10.8 | ** | Summary Terms of Employment for C. Robert Kidder, dated March 2003 (incorporated by reference to Exhibit (x)(e) to the Form 10-K filed on March 28, 2003, File No. 001-00071) |
10.9 | * | Summary Terms of Employment for W. H. Carter, dated November 2001 |
10.10 | ** | Perquisite Benefits Policy (incorporated by reference to Exhibit 10(xviii) to the Form 10-K filed on March 29, 2002, File No. 001-00071) |
10.11 | ** | Consulting Agreement between the registrant and Kohlberg Kravis Roberts & Co., LP, dated August 21, 1995, as amended on May 30, 2002 (incorporated by reference to Exhibit 10 to the Form 10-Q filed on August 13, 2002, File No. 001-00071) |
10.12 | ** | Master Asset Conveyance and Facility Support Agreement, dated as of December 20, 2002, between the registrant and Borden Chemicals and Plastics Operating Limited Partnership (incorporated by reference to Exhibit (10)(xxvi) to the Form 10-K filed on March 28, 2003, File No. 001-00071) |
10.13 | ** | Environmental Servitude Agreement, dated as of December 20, 2002, between the registrant and Borden Chemicals and Plastics Operating Limited Partnership (incorporated by reference to Exhibit (10)(xxvii) to the Form 10-K filed on March 28, 2003, File No. 001-00071) |
10.14 | ** | Settlement Agreement, dated September 13, 2002, among the registrant, Borden Chemicals and Plastics Operating Limited Partnership, BCP Management, Inc., the U.S. E.P.A. and the Louisiana Department of Environmental Quality (incorporated by reference to Exhibit (10)(xxviii) to the Form 10-K filed on March 28, 2003, File No. 001-00071) |
21.1 | List of Subsidiaries of the registrant | |
23.1 | * | Consent of Connell Foley LLP (included as part of its opinion filed as Exhibit 5.1 hereto) |
23.2 | Consent of Deloitte & Touche LLP | |
24.1 | Powers of Attorney of the directors and officers of the registrant (included in the signature page to the registration statement) |
- *
- To be filed by amendment.
- **
- Incorporated by reference
II-4
(b) Financial Statement Schedules
To the Board of Directors
and Shareholders of Borden Chemical, Inc.
We have audited the consolidated financial statements of Borden Chemical, Inc. (a subsidiary of Borden Holdings, Inc.) and subsidiaries as of December 31, 2003 and 2002, and for each of the three years in the period ended December 31, 2003, and have issued our report thereon dated March 19, 2004 (which report expresses an unqualified opinion and includes an explanatory paragraph regarding the Company's adoption in 2002 of Statement of Financial Accounting Standard No. 142); such financial statements and report are included elsewhere in this Registration Statement on Form S-1. Our audits also included the financial statement schedule of Borden Chemical, Inc. and subsidiaries, listed in Item 16. This consolidated financial statement schedule is the responsibility of the Company's management. Our responsibility is to express an opinion based on our audits. In our opinion, such consolidated financial statement schedule, when considered in relation to the basic financial statements taken as a whole, presents fairly in all material respects the information set forth therein.
DELOITTE & TOUCHE LLP
Columbus, Ohio
March 19, 2004
II-5
Schedule II—Valuation and Qualifying Accounts (in thousands)
| | Balance 12/31/00 | Charged to Expense | Write-offs | Balance 12/31/01 | ||||||||
|---|---|---|---|---|---|---|---|---|---|---|---|---|
| Allowance for doubtful accounts | $ | 12,654 | $ | 5,175 | $ | (1,170 | ) | $ | 16,659 | |||
| | Balance 12/31/01 | Charged to Expense | Write-offs | Balance 12/31/02 | ||||||||
|---|---|---|---|---|---|---|---|---|---|---|---|---|
| Allowance for doubtful accounts | $ | 16,659 | $ | (690 | ) | $ | (3,750 | ) | $ | 12,219 | ||
| | Balance 12/31/02 | Charged to Expense | Write-offs | Balance 12/31/03 | ||||||||
|---|---|---|---|---|---|---|---|---|---|---|---|---|
| Allowance for doubtful accounts | $ | 12,219 | $ | 2,526 | $ | (286 | ) | $ | 14,459 | |||
II-6
ITEM 17. UNDERTAKINGS
Insofar as indemnification for liabilities arising under the Securities Act may be permitted to directors, officers and controlling persons of the Registrant pursuant to the foregoing provisions, or otherwise, the Registrant has been advised that in the opinion of the Securities and Exchange Commission, such indemnification is against public policy as expressed in the Securities Act and is, therefore, unenforceable. In the event that a claim for indemnification against such liabilities (other than the payment by the Registrant of expenses incurred or paid by a director, officer or controlling person of the Registrant in the successful defense of any action, suit or proceeding) is asserted by such director, officer or controlling person in connection with the securities being registered, the Registrant will, unless in the opinion of its counsel the matter has been settled by controlling precedent, submit to a court of appropriate jurisdiction the question whether such indemnification by it is against public policy as expressed in the Securities Act and will be governed by the final adjudication of such issue.
The undersigned Registrant hereby undertakes the following:
(1) for purposes of determining any liability under the Securities Act, the information omitted from the form of prospectus filed as part of this Registration Statement in reliance upon Rule 430A and contained in the form of prospectus filed by the Registrant pursuant to Rule 424(b)(1) or (4) or 497(h) under the Securities Act shall be deemed to be part of this Registration Statement as of the time it was declared effective;
(2) for the purpose of determining any liability under the Securities Act, each post-effective amendment that contains a form of prospectus shall be deemed to be a new registration statement relating to the securities offered therein, and the offering of such securities at that time shall be deemed to be the initial bona fide offering thereof; and
(3) to provide to the underwriters at the closing specified in the underwriting agreements, certificates in such denominations and registered in such names as required by the underwriters to permit prompt delivery to each purchaser.
II-7
Pursuant to the requirements of the Securities Act of 1933, as amended, the Registrant has duly caused this Registration Statement to be signed on its behalf by the undersigned, thereunto duly authorized, in Columbus, Ohio, on May 6, 2004.
| Borden Chemical, Inc. | |||||
By: | /s/ WILLIAM H. CARTER | ||||
| Name: | William H. Carter | ||||
| Title: | Executive Vice President and Chief Financial Officer | ||||
KNOW ALL MEN BY THESE PRESENTS, that each person whose signature appears below hereby constitutes and appoints Craig O. Morrison and William H. Carter, or any one of them, his true and lawful attorneys-in-fact and agents, with full power of substitution and resubstitution, for him and in his name, place, and stead, in any and all capacities, to sign any and all amendments to the Registration Statement, including post-effective amendments thereto and any registration statements filed pursuant to Rule 462 under the Securities Act of 1933, and to file the same, with all exhibits hereto, and other documents in connection therewith, with the Securities and Exchange Commission, and does hereby grant unto said attorneys-in-fact and agents, and each of them, full power and authority to do and perform each and every act and thing requisite and necessary to be done in and about the premises, as fully to all intents and purposes as he might or could do in person, hereby ratifying and confirming all that said attorneys-in-fact and agents, or any of them, or their or his substitutes, may lawfully do or cause to be done by virtue hereof.
Pursuant to the requirements of the Securities Act of 1933, as amended, this Registration Statement has been signed by the following persons in the capacities indicated on the 5th day of May, 2004.
| Signature | Title | |
|---|---|---|
| /s/ CRAIG O. MORRISON Craig O. Morrison | Director, President and Chief Executive Officer (Principal Executive Officer) | |
/s/ WILLIAM H. CARTER William H. Carter | Director, Executive Vice President and Chief Financial Officer (Principal Financial Officer And Principal Accounting Officer) | |
/s/ C. ROBERT KIDDER C. Robert Kidder | Director and Chairman | |
/s/ BRIAN F. CARROLL Brian F. Carroll | Director | |
/s/ PAUL J. NORRIS Paul J. Norris | Director | |
/s/ JOHN K. SAER John K. Saer | Director | |
/s/ SCOTT M. STUART Scott M. Stuart | Director |
II-8
| Exhibit Number | Description of Document | |
|---|---|---|
1.1 | * | Form of Underwriting Agreement |
3.1 | * | Restated Certificate of Incorporation of the registrant |
3.2 | * | Bylaws of the registrant |
4.1 | * | Form of Certificate of Common Stock |
4.2 | ** | Amended and Restated 1996 Stock Purchase and Option Plan for Key Employees of the registrant and Subsidiaries, dated September 2003 (incorporated by reference to Exhibit 4.3 to the Form S-8 filed on October 3, 2003, File No. 333-109490) |
4.3 | ** | Form of Management Stockholder's Agreement (incorporated by reference to Exhibit 4.4 to the Form S-8 filed on October 3, 2003, File No. 333-109490) |
4.4 | ** | Form of Non-Qualified Stock Option Agreement (incorporated by reference to Exhibit 4.5 to the Form S-8 filed on October 3, 2003, File No. 333-109490) |
4.5 | ** | Form of Sale Participation Agreement (incorporated by reference to Exhibit 4.6 to the Form S-8 filed on October 3, 2003, File No. 333-109490) |
4.6 | * | Registration Rights Agreement, dated January 1, 2002, among the registrant, Borden Holdings, Inc. and BDS Two, Inc. |
5.1 | * | Opinion of Connell Foley LLP |
10.1 | ** | Loan and Security Agreement, dated September 23, 2002, among the registrant, Borden Chemical Canada, Inc., Borden Chemical UK Limited, Borden Chemical GB Limited and Fleet Capital Corporation, as Lender and Agent for the other lenders thereto (incorporated by reference to Exhibit (10)(i) to the Form 10-Q filed on November 14, 2002, File No. 001-00071) |
10.2 | ** | Amended and Restated 1996 Unit Incentive Plan for Key Employees of the registrant and Associated Persons, dated as of December 31, 2000 (incorporated by reference to Exhibit (10)(vi) to the Form 10-K filed on April 2, 2001, File No. 001-00071) |
10.3 | ** | Amended and Restated Executive Supplemental Pension Plan, dated as of January, 1996 (incorporated by reference to Exhibit (10)(xiii) to the Form 10-K filed on March 31, 1999, File No. 001-00071) |
10.4 | * | Advisory Directors Plan |
10.5 | ** | Employment Agreement with William F. Stoll, Jr., dated June 6, 1996 (incorporated by reference to Exhibit (10)(vi) to the Form 10-Q filed on August 14, 1996, File No. 001-00071) |
10.6 | ** | Summary of Terms of Employment for Craig O. Morrison, revised January 4, 2002 (incorporated by reference to Exhibit (10)(i) to the Form 10-Q filed on May 14, File No. 001-00071) |
10.7 | ** | Summary Terms of Employment for Joseph P. Bevilaqua, dated January 7, 2002 (incorporated by reference to Exhibit (x)(d) to the Form 10-K filed on March 28, 2003, File No. 001-00071) |
10.8 | ** | Summary Terms of Employment for C. Robert Kidder, dated March 2003 (incorporated by reference to Exhibit (x)(e) to the Form 10-K filed on March 28, 2003, File No. 001-00071) |
10.9 | * | Summary Terms of Employment for W. H. Carter, dated November 2001 |
10.10 | ** | Perquisite Benefits Policy (incorporated by reference to Exhibit 10(xviii) to the Form 10-K filed on March 29, 2002, File No. 001-00071) |
10.11 | ** | Consulting Agreement between the registrant and Kohlberg Kravis Roberts & Co., LP, dated August 21, 1995, as amended on May 30, 2002 (incorporated by reference to Exhibit 10 to the Form 10-Q filed on August 13, 2002, File No. 001-00071) |
10.12 | ** | Master Asset Conveyance and Facility Support Agreement, dated as of December 20, 2002, between the registrant and Borden Chemicals and Plastics Operating Limited Partnership (incorporated by reference to Exhibit (10)(xxvi) to the Form 10-K filed on March 28, 2003, File No. 001-00071) |
10.13 | ** | Environmental Servitude Agreement, dated as of December 20, 2002, between the registrant and Borden Chemicals and Plastics Operating Limited Partnership (incorporated by reference to Exhibit (10)(xxvii) to the Form 10-K filed on March 28, 2003, File No. 001-00071) |
10.14 | ** | Settlement Agreement, dated September 13, 2002, among the registrant, Borden Chemicals and Plastics Operating Limited Partnership, BCP Management, Inc., the U.S. E.P.A. and the Louisiana Department of Environmental Quality (incorporated by reference to Exhibit (10)(xxviii) to the Form 10-K filed on March 28, 2003, File No. 001-00071) |
21.1 | List of Subsidiaries of the registrant | |
23.1 | * | Consent of Connell Foley LLP (included as part of its opinion filed as Exhibit 5.1 hereto) |
23.2 | Consent of Deloitte & Touche LLP | |
24.1 | Powers of Attorney of the directors and officers of the registrant (included in the signature page to the registration statement) |
- *
- To be filed by amendment.
- **
- Incorporated by reference
TABLE OF CONTENTS
Dealer Prospectus Delivery Obligation
PROSPECTUS SUMMARY
Borden Chemical, Inc.
Net Sales and Adjusted EBITDA by Reporting Segment
Net Sales by Product Line
The Offering
Summary Historical Financial Data
RISK FACTORS
Risks Relating to Our Business
Risks Relating to Our Common Stock and This Offering
CAUTIONARY STATEMENT CONCERNING FORWARD-LOOKING STATEMENTS
USE OF PROCEEDS
DIVIDEND POLICY
CAPITALIZATION
DILUTION
SELECTED HISTORICAL FINANCIAL DATA
MANAGEMENT'S DISCUSSION AND ANALYSIS OF FINANCIAL CONDITION AND RESULTS OF OPERATIONS
BUSINESS
Net Sales and Adjusted EBITDA by Reporting Segment
Net Sales by Product Line
MANAGEMENT
Summary Compensation Table
PRINCIPAL AND SELLING SHAREHOLDER
CERTAIN RELATIONSHIPS AND RELATED PARTY TRANSACTIONS
DESCRIPTION OF CAPITAL STOCK
COMMON STOCK ELIGIBLE FOR FUTURE SALE
DESCRIPTION OF INDEBTEDNESS
CERTAIN U.S. FEDERAL TAX CONSEQUENCES FOR NON-U.S. HOLDERS
UNDERWRITING
NOTICE TO CANADIAN RESIDENTS
LEGAL MATTERS
EXPERTS
WHERE YOU CAN FIND MORE INFORMATION
GLOSSARY
INDEX TO CONSOLIDATED FINANCIAL STATEMENTS
INDEPENDENT AUDITORS' REPORT
CONSOLIDATED STATEMENTS OF OPERATIONS BORDEN CHEMICAL, INC.
CONSOLIDATED STATEMENTS OF CASH FLOWS BORDEN CHEMICAL, INC.
Notes to Consolidated Financial Statements (Dollars in thousands except per share data)
PART II INFORMATION NOT REQUIRED IN PROSPECTUS
INDEPENDENT AUDITORS' REPORT
SIGNATURES
POWER OF ATTORNEY
EXHIBIT INDEX